FACTORS AFFECTING THE USE OF ORAL REHYDRATION ...
104
1 FACTORS AFFECTING THE USE OF ORAL REHYDRATION THERAPY IN THE HOME MANAGEMENT OF DIARRHOEAL DISEASE BY DR JOHNSON OKECHUKWU AMAIZU PLATEAU STATE SPECIALIST HOSPITAL, JOS. A DISSERTATION SUBMITTED TO THE NATIONAL POSTGRADUATE MEDICAL COLLEGE OF NIGERIA, IN PARTIAL FULFILMENT OF THE REQUIREMENTS FOR THE FMCGP PART II (FINAL) EXAMINATION IN GENERAL MEDICAL PRACTICE. NOVEMBER, 2005
-
Upload
khangminh22 -
Category
Documents
-
view
2 -
download
0
Transcript of FACTORS AFFECTING THE USE OF ORAL REHYDRATION ...

1
FACTORS AFFECTING THE USE OF ORAL REHYDRATION
THERAPY IN THE HOME MANAGEMENT OF DIARRHOEAL
DISEASE
BY
DR JOHNSON OKECHUKWU AMAIZU
PLATEAU STATE SPECIALIST HOSPITAL, JOS.
A DISSERTATION SUBMITTED TO THE NATIONAL
POSTGRADUATE MEDICAL COLLEGE OF NIGERIA, IN
PARTIAL FULFILMENT OF THE REQUIREMENTS FOR THE
FMCGP PART II (FINAL) EXAMINATION IN GENERAL
MEDICAL PRACTICE.
NOVEMBER, 2005

2
DECLARATION
It is hereby declared that this work is original unless otherwise acknowledged. It
has never been submitted in part or in whole to any other examining body.
Signature:……………………….
Date:…………………………….
Name: Dr Johnson O. Amaizu
B. Med. Sc (Anatomy), MBBS (PH).

3
CERTIFICATION
This is to certify that this research was carried out by Dr. Johnson Okechukwu
Amaizu at Plateau State Specialist Hospital, Jos, under our supervision, between
June and November 2003.
1. Signature:_________________________
Date:_____________________________
Name: Dr Lar-Ndam N. (MBBS, FMCGP)
Address: Department of Family Medicine
Plateau State Specialist Hospital, Jos.
2. Signature:_________________________
Date:_____________________________
Name: Dr Tom Thacher (MD, FWACP)
Address: Department of Family Medicine
Jos University Teaching Hospital, Jos.

4
DEDICATION
This work is dedicated to the memory of my late senior brother, Jesse, who saw
me through the University, and to all the subjects who participated in this study.
5
ACKNOWLEDGEMENT I am grateful to the authorities of Plateau State Specialist Hospital Jos, for giving
me the opportunity to do this training programme.
My sincere appreciation goes to all my colleagues who through their advice,
criticisms and corrections, contributed in no small measure to the success of this
work. They include Dr. J.A. Madaki, Dr. S. Pam, Dr. P.R. Datong, and Dr. S. L.
Pitmang. I am grateful to my supervisors for their contributions.
My foremost gratitude goes to Prof. A.M. Yakubu and Dr. Tom Thacher who
provided the literature materials used in this study.
I am most grateful to almighty God who makes every thing beautiful in his time.
6
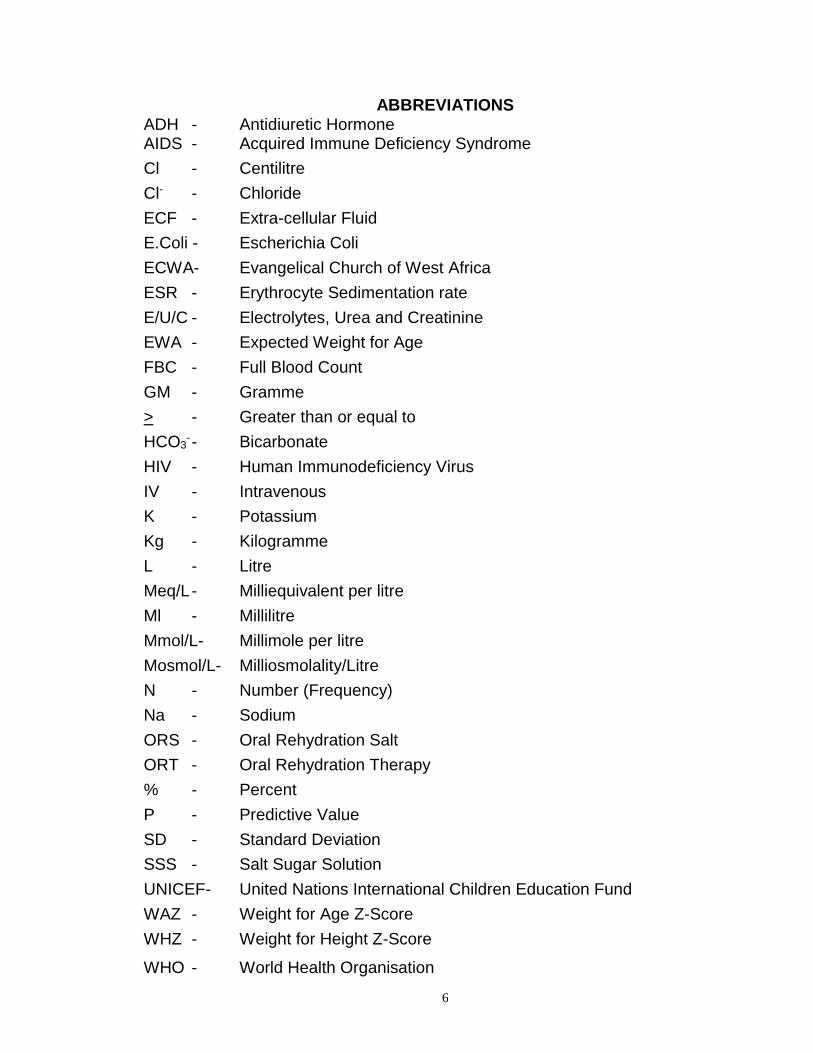
ABBREVIATIONS ADH - Antidiuretic Hormone AIDS - Acquired Immune Deficiency Syndrome
Cl - Centilitre
Cl- - Chloride
ECF - Extra-cellular Fluid
E.Coli - Escherichia Coli
ECWA- Evangelical Church of West Africa
ESR - Erythrocyte Sedimentation rate
E/U/C - Electrolytes, Urea and Creatinine
EWA - Expected Weight for Age
FBC - Full Blood Count
GM - Gramme
> - Greater than or equal to
HCO3- - Bicarbonate
HIV - Human Immunodeficiency Virus
IV - Intravenous
K - Potassium
Kg - Kilogramme
L - Litre
Meq/L - Milliequivalent per litre
Ml - Millilitre
Mmol/L- Millimole per litre
Mosmol/L- Milliosmolality/Litre
N - Number (Frequency)
Na - Sodium
ORS - Oral Rehydration Salt
ORT - Oral Rehydration Therapy
% - Percent
P - Predictive Value
SD - Standard Deviation
SSS - Salt Sugar Solution
UNICEF- United Nations International Children Education Fund
WAZ - Weight for Age Z-Score
WHZ - Weight for Height Z-Score
WHO - World Health Organisation

7
TABLE OF CONTENTS
Title - - - - - - - - - - i
Declaration - - - - - - - - - ii
Certification - - - - - - - - - iii
Dedication - - - - - - - - - iv
Acknowledgement - - - - - - - - v
Abbreviations - - - - - - - - vi
Table of contents - - - - - - - - vii
List of tables and figures - - - - - - - x
Summary - - - - - - - - - xii
CHAPTER ONE
1.1. Introduction - - - - - - - - 1
1.2. Statement of the problem - - - - - - 4
1.3. Aim and specific objectives - - - - - - 5
1.4. Rationale for the study - - - - - - 5
1.5. Assumptions - - - - - - - - 6
CHAPTER TWO: LITERATURE REVIEW
2.1. Definition and clinical types of diarrhoea - - - - 7
2.2. Aetiology - - - - - - - - 8
2.3. Epidemiology - - - - - - - - 9
2.4. Pathogenesis of infectious diarrhoeas - - - - 10
2.5. Degree of dehydration - - - - - - 12
2.6. Types of dehydration - - - - - - - 14
2.7. Electrolyte disturbances in diarrhoeal disease - - - 16
8
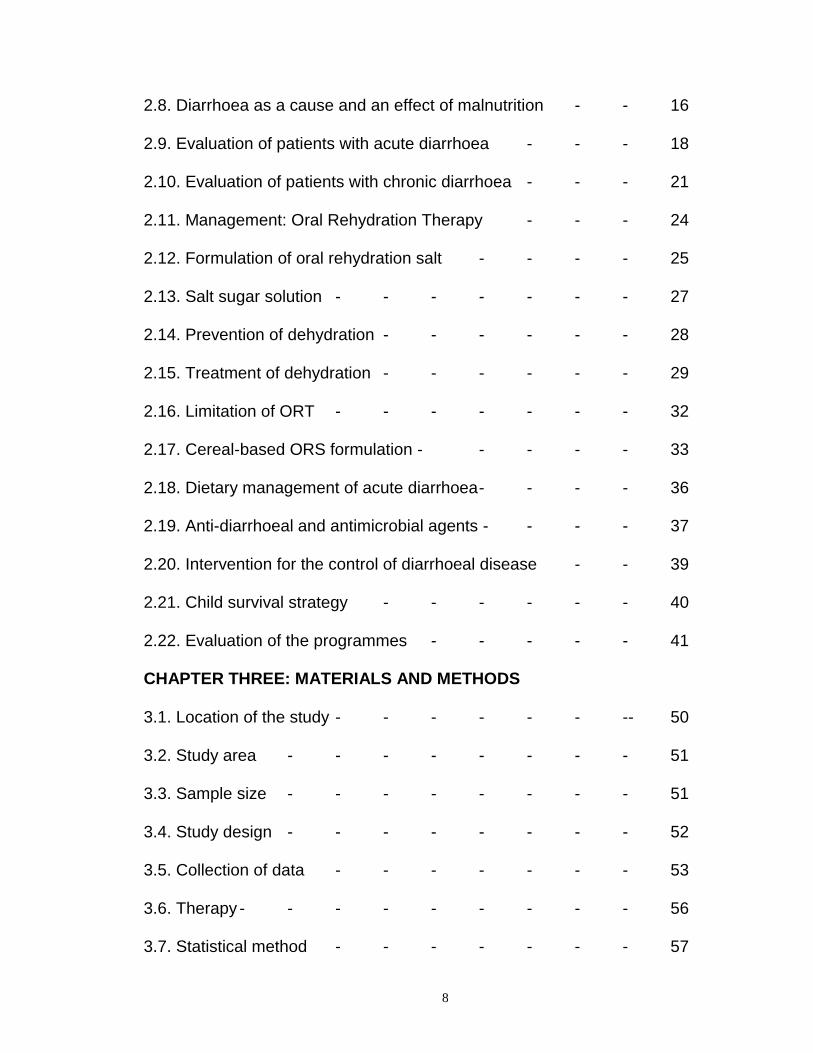
2.8. Diarrhoea as a cause and an effect of malnutrition - - 16
2.9. Evaluation of patients with acute diarrhoea - - - 18
2.10. Evaluation of patients with chronic diarrhoea - - - 21
2.11. Management: Oral Rehydration Therapy - - - 24
2.12. Formulation of oral rehydration salt - - - - 25
2.13. Salt sugar solution - - - - - - - 27
2.14. Prevention of dehydration - - - - - - 28
2.15. Treatment of dehydration - - - - - - 29
2.16. Limitation of ORT - - - - - - - 32
2.17. Cereal-based ORS formulation - - - - - 33
2.18. Dietary management of acute diarrhoea - - - - 36
2.19. Anti-diarrhoeal and antimicrobial agents - - - - 37
2.20. Intervention for the control of diarrhoeal disease - - 39
2.21. Child survival strategy - - - - - - 40
2.22. Evaluation of the programmes - - - - - 41
CHAPTER THREE: MATERIALS AND METHODS
3.1. Location of the study - - - - - - -- 50
3.2. Study area - - - - - - - - 51
3.3. Sample size - - - - - - - - 51
3.4. Study design - - - - - - - - 52
3.5. Collection of data - - - - - - - 53
3.6. Therapy - - - - - - - - - 56
3.7. Statistical method - - - - - - - 57

9
CHAPTER FOUR: RESULTS
4.1. Characteristics of the subjects in the study - - - 58
4.2. Characteristics of the children with diarrhoea. - - - 60
4.3. Degree of dehydration - - - - - - 61
4.4. Level of malnutrition - - - - - - - - 62
4.5. Usage of oral rehydration therapy- - - - - - 64
4.6. Preparation of Oral rehydration therapy - - - - 67
4.7. Acceptance of ORT- - - - - - - - 68
4.8. Administrative skill of the mothers - - - -- - 70
4.9 Knowledge of salt sugar solution - - - - - 73
CHAPTER FIVE:
5.1. Discussion - - - - - - - - 76
5.2. Conclusions - - - - - - - - 84
5.3. Recommendations - - - - - - - 85
REFERENCES- - - - - - - - - 87
APPENDICES
i. Approval of synopsis of the dissertation - - - - 96
ii. Ethical Clearance - - - - - - - 97
iii. Consent form- - - - - - - - 98
iv. Data collection form- - - - - - - 99
10
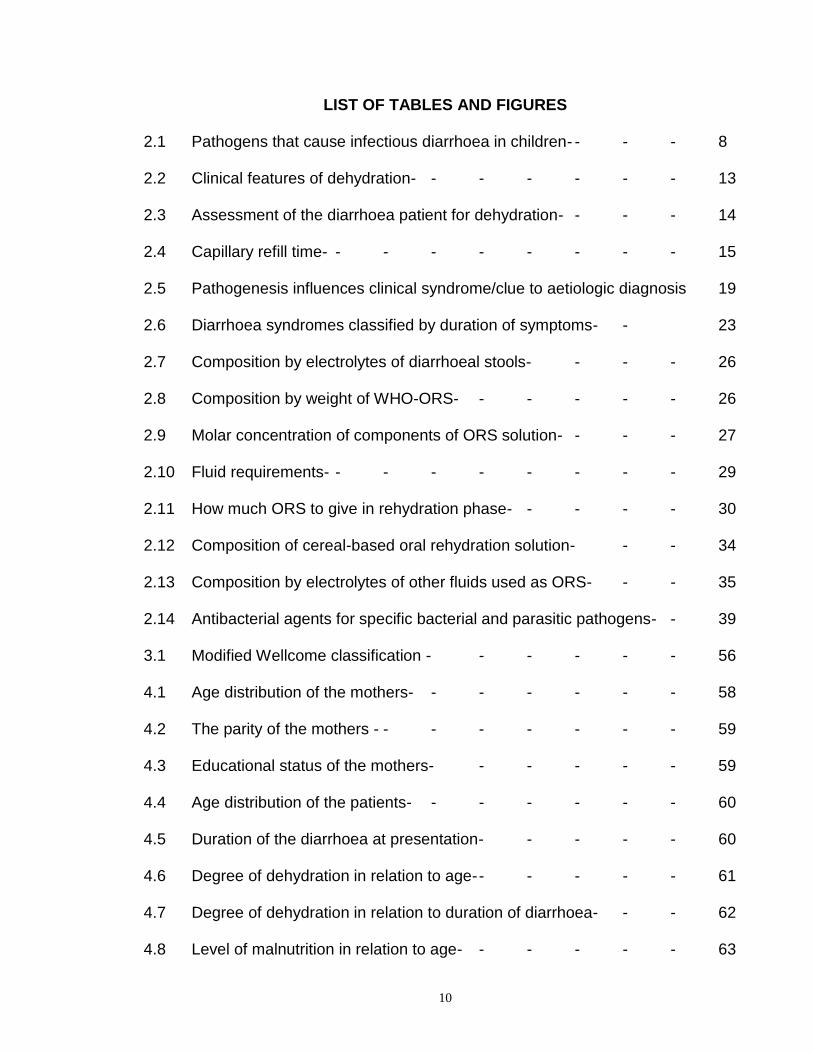
LIST OF TABLES AND FIGURES
2.1 Pathogens that cause infectious diarrhoea in children- - - - 8
2.2 Clinical features of dehydration- - - - - - - 13
2.3 Assessment of the diarrhoea patient for dehydration- - - - 14
2.4 Capillary refill time- - - - - - - - - 15
2.5 Pathogenesis influences clinical syndrome/clue to aetiologic diagnosis 19
2.6 Diarrhoea syndromes classified by duration of symptoms- - 23
2.7 Composition by electrolytes of diarrhoeal stools- - - - 26
2.8 Composition by weight of WHO-ORS- - - - - - 26
2.9 Molar concentration of components of ORS solution- - - - 27
2.10 Fluid requirements- - - - - - - - - 29
2.11 How much ORS to give in rehydration phase- - - - - 30
2.12 Composition of cereal-based oral rehydration solution- - - 34
2.13 Composition by electrolytes of other fluids used as ORS- - - 35
2.14 Antibacterial agents for specific bacterial and parasitic pathogens- - 39
3.1 Modified Wellcome classification - - - - - - 56
4.1 Age distribution of the mothers- - - - - - - 58
4.2 The parity of the mothers - - - - - - - - 59
4.3 Educational status of the mothers- - - - - - 59
4.4 Age distribution of the patients- - - - - - - 60
4.5 Duration of the diarrhoea at presentation- - - - - 60
4.6 Degree of dehydration in relation to age- - - - - - 61
4.7 Degree of dehydration in relation to duration of diarrhoea- - - 62
4.8 Level of malnutrition in relation to age- - - - - - 63

11
4.9 Malnutrition in relation to duration of diarrhoea- - - - - 63
4.10 Malnutrition in relation to degree of dehydration- - - - 64
4.11 Use of ORT in relation to age of the child - - - - - 65
4.12 Degree of dehydration- - - - - - - - 65
4.13 Use of ORT in relation to mothers’ educational status- - - - 66
4.14 Reasons for preferring ORS to SSS- - - - - - 67
4.15 Correct preparation of ORT in relation to mothers’ educational status- 68
4.16 Acceptance rate of ORT in relation to age- - - - - 69
4.17 Acceptance rate of ORT in relation to the degree of dehydration- - 69
4.18 Amount of fluid administered in 24 hours- - - - - 70
4.19 Mean volume of ORT in relation to mothers’ educational status- - 70
4.20 Mean volume of ORT in relation to age of the child- - - - 71
4.21 Mean volume of ORT in relation to degree of dehydration- - - 71
4.22 Frequency of administration of ORT- - - - - - 72
4.23 Quantity of ORT given at a time- - - - - - - 72
4.24 Correct preparation of SSS in relation to mothers’ educational status- 73
4.25 Sources of error in relation to mothers’ educational status- - - 74
4.26 Level of knowledge of the work of ORT- - - - - - 75
Figure
2.1 Diarrhoea-malnutrition cycle- - - - - - - 18
3.1 Some of the materials used in the study - - - - 55
3.2 The 3ml and 5ml metal teaspoons - - - - - 55
12
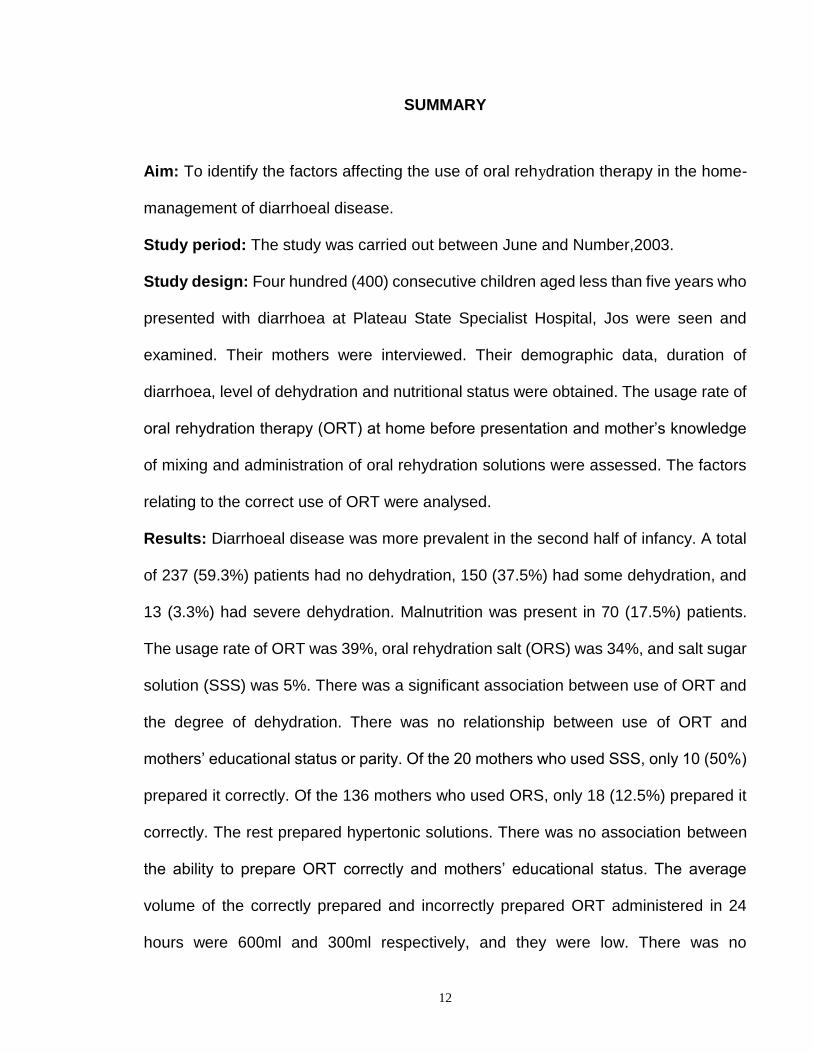
SUMMARY
Aim: To identify the factors affecting the use of oral rehydration therapy in the home-
management of diarrhoeal disease.
Study period: The study was carried out between June and Number,2003.
Study design: Four hundred (400) consecutive children aged less than five years who
presented with diarrhoea at Plateau State Specialist Hospital, Jos were seen and
examined. Their mothers were interviewed. Their demographic data, duration of
diarrhoea, level of dehydration and nutritional status were obtained. The usage rate of
oral rehydration therapy (ORT) at home before presentation and mother’s knowledge
of mixing and administration of oral rehydration solutions were assessed. The factors
relating to the correct use of ORT were analysed.
Results: Diarrhoeal disease was more prevalent in the second half of infancy. A total
of 237 (59.3%) patients had no dehydration, 150 (37.5%) had some dehydration, and
13 (3.3%) had severe dehydration. Malnutrition was present in 70 (17.5%) patients.
The usage rate of ORT was 39%, oral rehydration salt (ORS) was 34%, and salt sugar
solution (SSS) was 5%. There was a significant association between use of ORT and
the degree of dehydration. There was no relationship between use of ORT and
mothers’ educational status or parity. Of the 20 mothers who used SSS, only 10 (50%)
prepared it correctly. Of the 136 mothers who used ORS, only 18 (12.5%) prepared it
correctly. The rest prepared hypertonic solutions. There was no association between
the ability to prepare ORT correctly and mothers’ educational status. The average
volume of the correctly prepared and incorrectly prepared ORT administered in 24
hours were 600ml and 300ml respectively, and they were low. There was no

13
relationship between the administrative skill of the mothers and their parity or
educational status.
Conclusion: These findings showed that mothers were lacking in their knowledge of
the work, the reconstitution and administration of oral rehydration solutions. The value
of ORT in the home-management of diarrhoeal disease is therefore limited. There is a
need to intensify effort at teaching mothers the correct way to prepare and administer
ORT at home so that its full impact and benefits will be realized.

14
INTRODUCTION
Diarrhoeal disease is a major health problem and one of the leading causes
of childhood morbidity and mortality particularly in the developing countries1. It is
estimated that 1.4 billion episodes of diarrhoea occur annually in children under the
age of five years resulting in about four to five million deaths1,2. Currently in Nigeria,
diarrhoeal disease ranks among the first three causes of hospital admission and
deaths among children under five years of age, accounting for about 25% of deaths
in these children 3. A National household survey on control of diarrhoeal disease
conducted in the country in 1993, showed an incidence rate of acute watery
diarrhoea of 4.9 episodes per child per year. Annually in Nigeria, there are
approximately 200,000 deaths from acute watery diarrhoea. This translates to
approximately 500 deaths daily or no less than one death every three minutes3.
Diarrhoeal infections inhibit the body’s ability to absorb salts and water. Fluid
is lost faster than it can be replaced thus leading to dehydration - the major
contributor to mortality. Fortunately, dehydration can be prevented by the use of
oral rehydration therapy (ORT), which simply means increased fluid intake and
continued feeding instituted at the onset of diarrhoea3. Oral rehydration therapy is
a simple, inexpensive and effective therapy based on the discovery that glucose
greatly increases the capacity to absorb salt and water4. The benefits of ORT are
clear. It is cheap. The materials are readily available in most homes. It does not
require expert knowledge or manpower. It avoids most of the complications
associated with the intravenous therapy. The mother is involved in the medical
management of her child.
15
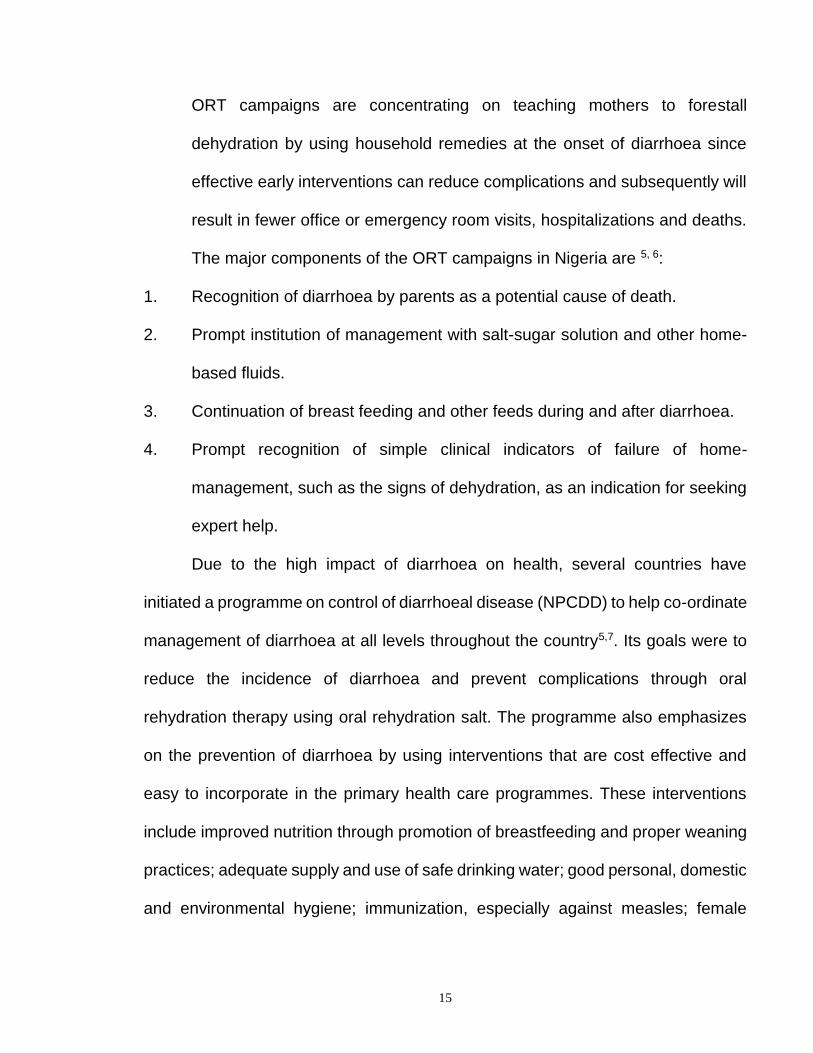
ORT campaigns are concentrating on teaching mothers to forestall
dehydration by using household remedies at the onset of diarrhoea since
effective early interventions can reduce complications and subsequently will
result in fewer office or emergency room visits, hospitalizations and deaths.
The major components of the ORT campaigns in Nigeria are 5, 6:
1. Recognition of diarrhoea by parents as a potential cause of death.
2. Prompt institution of management with salt-sugar solution and other home-
based fluids.
3. Continuation of breast feeding and other feeds during and after diarrhoea.
4. Prompt recognition of simple clinical indicators of failure of home-
management, such as the signs of dehydration, as an indication for seeking
expert help.
Due to the high impact of diarrhoea on health, several countries have
initiated a programme on control of diarrhoeal disease (NPCDD) to help co-ordinate
management of diarrhoea at all levels throughout the country5,7. Its goals were to
reduce the incidence of diarrhoea and prevent complications through oral
rehydration therapy using oral rehydration salt. The programme also emphasizes
on the prevention of diarrhoea by using interventions that are cost effective and
easy to incorporate in the primary health care programmes. These interventions
include improved nutrition through promotion of breastfeeding and proper weaning
practices; adequate supply and use of safe drinking water; good personal, domestic
and environmental hygiene; immunization, especially against measles; female

16
education; improvement in socioeconomic status; safe faeces disposal and the
provision of vitamin A.
Similarly, oral rehydration therapy has been recognized and inco-orporated
as a strategy for child survival and development revolution (CSDR) in any country
with a high incidence of diarrhoeal disease7. These are programmes aimed at
curtailing the high rate of infant morbidity and mortality in these countries. At the
world summit for children in 1990, over 150 countries under-took to attain 80%
access to and usage of oral rehydration therapy by 1995 with a view to achieving a
reduction of 50% in mortality attributable to diarrhoea by 20005,7. This was to be
achieved through health education of the public and establishment of health care
facilities especially for oral rehydration salts.
The programme since its establishment, has shown both success and failure
in its efforts to achieve its objectives. Case studies all over the world show positive
trends in diarrhoea management8. ORT is now given to the majority of children with
diarrhoea resulting in a significant reduction in the mortality rate due to diarrhoea.
Nonetheless, several workers have found that less than half of women who knew
about ORT actually use it when their children have diarrhoea8,9. It is estimated that
world wide, oral rehydration is currently used by 23% of those who can benefit from
the treatment, usually being given only for maintenance or to correct mild
dehydration9.
There is a need for continuing education for healthcare providers and
caretakers to become familiar with the benefits and applicability of ORT, so that in
the long term, oral rehydration solutions would become more widely used both in

17
the clinic and at home, and this would greatly reduce cost, and the rate of
hospitalization and mortality attributable to diarrhoeal disease9.
Statement of the problem
Diarrhoeal disease is one of the leading causes of childhood morbidity and
mortality, particularly in the developing countries. It has been shown that oral
rehydration therapy is a very important and efficient tool in combating this scourge
9. Though, the level of awareness of ORT has been increasing, studies carried out
both within and outside the country indicate a low usage rate of ORT (SSS and
ORS) in the management of diarrhoeal disease, both at home and in the clinic9,10.
Similarly, serious harmful errors in mixing the ingredients and administration of the
solution have commonly been reported10,11. These have limited the potential
benefits derivable from this innovation. There is a need to find out the factors
affecting the knowledge, use rate and correct use of salt-sugar solution in the home-
management of diarrhoeal disease. These were the motivation for this study.
Aim of the study
To identify the factors affecting the use of oral rehydration therapy in the home-
management of diarrhoeal disease in children.

18
Specific objectives
To determine
1. The clinical presentation (Level of dehydration and Nutritional status) of
diarrhoeal diseases in children presenting at Plateau State Specialist
Hospital, Jos.
2. The use rate of oral rehydration solutions (salt sugar solution and oral
rehydration salt solution) at home before presentation.
3. Errors regarding their use.
4. The level of mother’s awareness and knowledge of salt sugar solution.
Rationale for the study
Most of the studies on the knowledge and use of ORT so far reported were
done in rural areas among the illiterates. It is pertinent to carry out a study in a
relatively urban and literate environment to identify the factors affecting the use of
oral rehydration therapy in the home-management of diarrhoeal disease. This will
help to know the level of impact the ORT campaigns has achieved so far, and assist
in redesigning the programme to a more efficient and effective intervention strategy.
Assumptions
For the purpose of this study, the following assumptions were made.
1. Mothers should be aware that diarrhoeal disease is a great killer disease of
childhood, and that it chiefly does so by causing electrolyte and fluid loss.

19
2. Oral rehydration therapy (SSS and other recommended home fluids) is
adequate and effective to be used in the home-management of diarrhoeal
disease.
3. They should initiate the use of salt-sugar solution as a first line remedy to
prevent dehydration at the onset of diarrhoeal disease.
4. They should be able to prepare and administer this solution correctly at
home.
5. When signs of dehydration develops, the mother should be able to
recognize this, and the child should be taken to a health care facility for
management which may include the use of oral rehydration salt (ORS)
solution.

20
CHAPTER TWO
LITERATURE REVIEW
Definition: Diarrhoea is the passage of three or more loose or watery stools in 24
hours 12. It is the passage of watery stools more frequently than normal for the age
of the child 12,13. The newborn may have frequent stools about five times a day; this
is not diarrhoea.
Clinical types of diarrhoea 13
a) Acute watery diarrhoea (AWD): It lasts for less than two weeks. The stools do
not contain blood. It is associated with vomiting, anorexia and sometimes
fever. It has a risk of dehydration and circulatory collapse, and it occurs
frequently in infants.
b) Acute dysentery (Bloody diarrhoea) (5 to 10% of all acute episodes): The
stools are small quantities and contain mucus and blood and/or pus. It is
associated with tenesmus, anorexia and weight loss. It occurs more frequently
in older children. Common organisms are Shigella, Campylobacter jejuni and
Entameba histolytica.
c) Persistent diarrhoea: It lasts for two weeks or more. Weight loss and
malnutrition are common. Dehydration may occur when stools are bulky.
Other forms of classification of diarrhoea 12:
i. Secretory or Osmotic (malabsorptive) diarrhoea. These are used when
the stool output continues or ceases respectively in the fasting patient.

21
ii. Organic or functional diarrhoea. These are used when there is an
identifiable cause or not.
Aetiology:- Several studies have shown that in many parts of the world, 30 to 40
percent of episodes of acute diarrhoeal diseases in children are caused by viruses,
20 to 30 percent are caused by bacteria or parasites, but no aetiologic agent can
be identified in about 20 to 40 percent of cases 14,15. The table below shows the
different causative agents.
Table 2.1 Pathogens that cause infectious diarrhoea in children 14,15
Viruses Bacteria Parasites
Rotavirus Toxigenic: Cytotoxic: Invasive:
Norwalk virus Vibrio cholerae Clostridium
deficile
Shigella species Giardia lamblia
Enteric
adenovirus
(Enteroviruses)
Enterotoxigenic
E. coli
Shigella species Salmonella
species
Entamoeba
histolytica
Astrovirus
(Coronaviruses)
Shigella species Enteropathogenic
E.coli
Yersinia
enterocolitica
Cryptosporidium
species
Calcivirus Yersinia
enterocolitica
Staphylococci Campylobacter
jejuni
Strongyloides
stercoralis
Cocksackie virus
Klebsiella
Vibrio
Parahaemolytic-
us
Pseudomonas
aeruginosa
Baccilus cereus
22
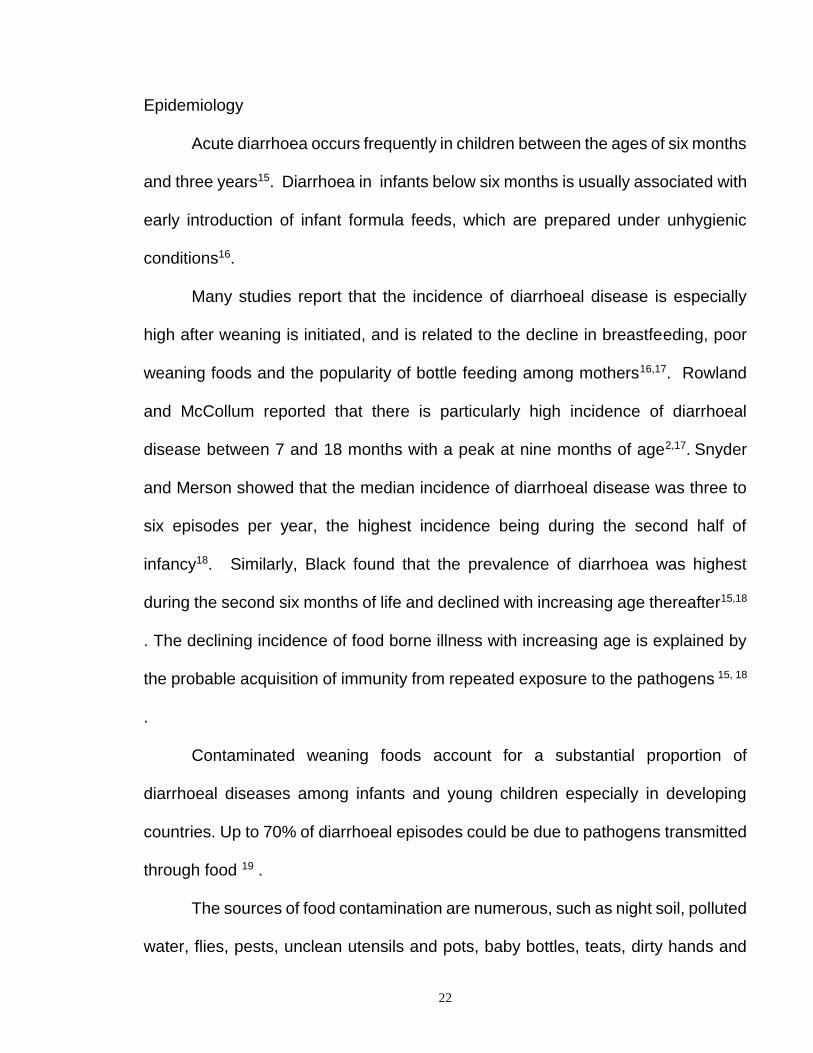
Epidemiology
Acute diarrhoea occurs frequently in children between the ages of six months
and three years15. Diarrhoea in infants below six months is usually associated with
early introduction of infant formula feeds, which are prepared under unhygienic
conditions16.
Many studies report that the incidence of diarrhoeal disease is especially
high after weaning is initiated, and is related to the decline in breastfeeding, poor
weaning foods and the popularity of bottle feeding among mothers16,17. Rowland
and McCollum reported that there is particularly high incidence of diarrhoeal
disease between 7 and 18 months with a peak at nine months of age2,17. Snyder
and Merson showed that the median incidence of diarrhoeal disease was three to
six episodes per year, the highest incidence being during the second half of
infancy18. Similarly, Black found that the prevalence of diarrhoea was highest
during the second six months of life and declined with increasing age thereafter15,18
. The declining incidence of food borne illness with increasing age is explained by
the probable acquisition of immunity from repeated exposure to the pathogens 15, 18
.
Contaminated weaning foods account for a substantial proportion of
diarrhoeal diseases among infants and young children especially in developing
countries. Up to 70% of diarrhoeal episodes could be due to pathogens transmitted
through food 19 .
The sources of food contamination are numerous, such as night soil, polluted
water, flies, pests, unclean utensils and pots, baby bottles, teats, dirty hands and

23
polluted environment caused by lack of sanitation, animal droppings, dust and dirt.
The washing of hands after defecation or changing infants’ napkins and prior to the
preparation of food is frequently neglected or ignored. Contamination of weaning
food with faecal matter has been reported15,19. Water used for the preparation of
food itself is a source of pathogenic agents especially in rural areas where the water
is very often contaminated.
Known environmental predisposing factors include poor sanitation, lack of
pipe borne water, overcrowding especially in the urban slums, and malnutrition. In
some parts of the world, there is a seasonal variation in the prevalence of
diarrhoea20. Epidemic diarrhoea in children usually occurs in Nigeria during the dry
season20. This is probably due to easy contamination of food and water by dust
containing viral particles. In temperate climates however, the incidence of rotavirus
diarrhoea is highest in the winter20.
Pathogenesis of infectious diarrhoea
Most diarrhoeal diseases is non inflammatory and primarily affect the small
intestine 20. Over ten litres of fluid per day are secreted and absorbed by the normal
adult gut. In the small intestine, fluid secretion occurs by the extrusion of chloride
ion from the cells of the villous crypts. This extrusion is mediated by cyclic
adenosine monophosphate (cAMP). Absorption of fluid occurs at the cells of the
villous tip20.
A. Bacteria: Bacterial agents may cause diarrhoea by several mechanisms with
some pathogens acting by more than one mechanism.

24
Secretory diarrhoea: - The mechanisms include:
(i) Toxigenic bacteria elaborate enterotoxins that bind to specific receptors
on the small bowel mucosa and induce the production of excess cyclic
adenosine monophosphate (cAMP) by stimulating the action of
adenosine cyclase. This inhibits influx of sodium chloride and water into
villous cells and gives rise to the active secretion of sodium and water
by the crypt cells. The damaged cells are shed after a few days. This
partly explains the self limiting actions of the toxins. The glucose-
stimulated sodium absorption of the gut is however not affected.
Characteristically, the stool is watery, with no blood or mucus.
(ii) Cytotoxic pathogens produce the cytotoxins that generate inflammatory
reactions and cause cell damage (ulceration), primarily in the colon21.
(iii) Other bacteria may invade the cell (mucosa), elicit an acute inflammation
and damage the mucosal lining of the small and large intestine which
results in the clinical picture of dysentery.21.
B. The Viruses invade and lyse the absorptive villous tip mucosal cells of the
small intestinal epithelium, causing decreased absorption, outpouring of fluid
and depletion of brush border disaccharidases with consequent carbohydrate
malabsorption21.
C. Protozoa. Method of disease production: (i) Giardia lamblia: It attaches to the
mucosa leading to malabsorption (ii) Entamoeba histolytica: It invades the
mucosal cells of the colon causing inflammation and ulceration.
25
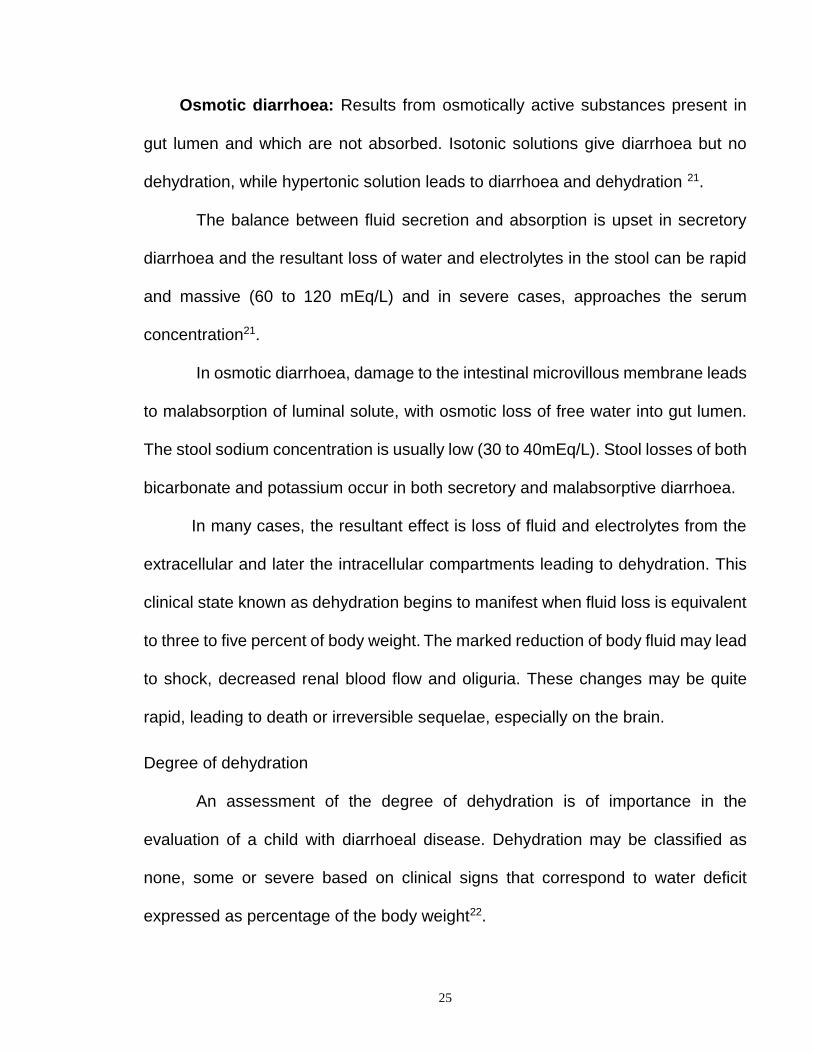
Osmotic diarrhoea: Results from osmotically active substances present in
gut lumen and which are not absorbed. Isotonic solutions give diarrhoea but no
dehydration, while hypertonic solution leads to diarrhoea and dehydration 21.
The balance between fluid secretion and absorption is upset in secretory
diarrhoea and the resultant loss of water and electrolytes in the stool can be rapid
and massive (60 to 120 mEq/L) and in severe cases, approaches the serum
concentration21.
In osmotic diarrhoea, damage to the intestinal microvillous membrane leads
to malabsorption of luminal solute, with osmotic loss of free water into gut lumen.
The stool sodium concentration is usually low (30 to 40mEq/L). Stool losses of both
bicarbonate and potassium occur in both secretory and malabsorptive diarrhoea.
In many cases, the resultant effect is loss of fluid and electrolytes from the
extracellular and later the intracellular compartments leading to dehydration. This
clinical state known as dehydration begins to manifest when fluid loss is equivalent
to three to five percent of body weight. The marked reduction of body fluid may lead
to shock, decreased renal blood flow and oliguria. These changes may be quite
rapid, leading to death or irreversible sequelae, especially on the brain.
Degree of dehydration
An assessment of the degree of dehydration is of importance in the
evaluation of a child with diarrhoeal disease. Dehydration may be classified as
none, some or severe based on clinical signs that correspond to water deficit
expressed as percentage of the body weight22.
26
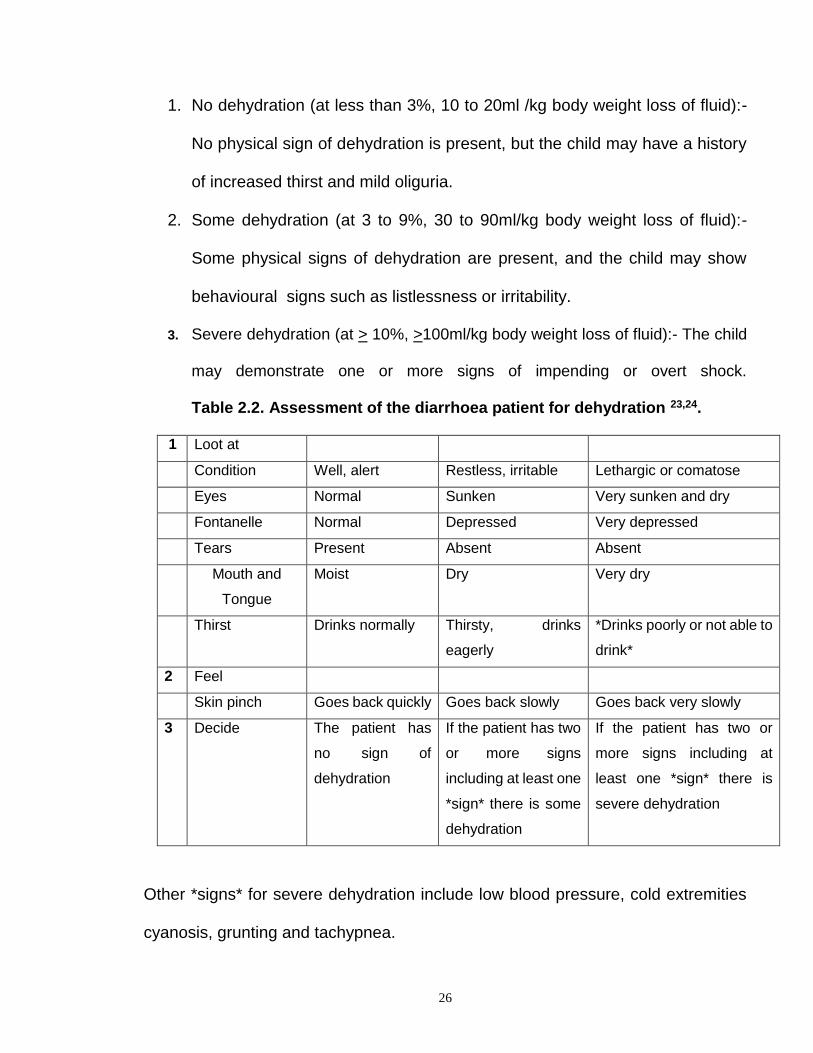
1. No dehydration (at less than 3%, 10 to 20ml /kg body weight loss of fluid):-
No physical sign of dehydration is present, but the child may have a history
of increased thirst and mild oliguria.
2. Some dehydration (at 3 to 9%, 30 to 90ml/kg body weight loss of fluid):-
Some physical signs of dehydration are present, and the child may show
behavioural signs such as listlessness or irritability.
3. Severe dehydration (at > 10%, >100ml/kg body weight loss of fluid):- The child
may demonstrate one or more signs of impending or overt shock.
Table 2.2. Assessment of the diarrhoea patient for dehydration 23,24.
1 Loot at
Condition Well, alert Restless, irritable Lethargic or comatose
Eyes Normal Sunken Very sunken and dry
Fontanelle Normal Depressed Very depressed
Tears Present Absent Absent
Mouth and
Tongue
Moist Dry Very dry
Thirst Drinks normally Thirsty, drinks
eagerly
*Drinks poorly or not able to
drink*
2 Feel
Skin pinch Goes back quickly Goes back slowly Goes back very slowly
3 Decide The patient has
no sign of
dehydration
If the patient has two
or more signs
including at least one
*sign* there is some
dehydration
If the patient has two or
more signs including at
least one *sign* there is
severe dehydration
Other *signs* for severe dehydration include low blood pressure, cold extremities
cyanosis, grunting and tachypnea.
27
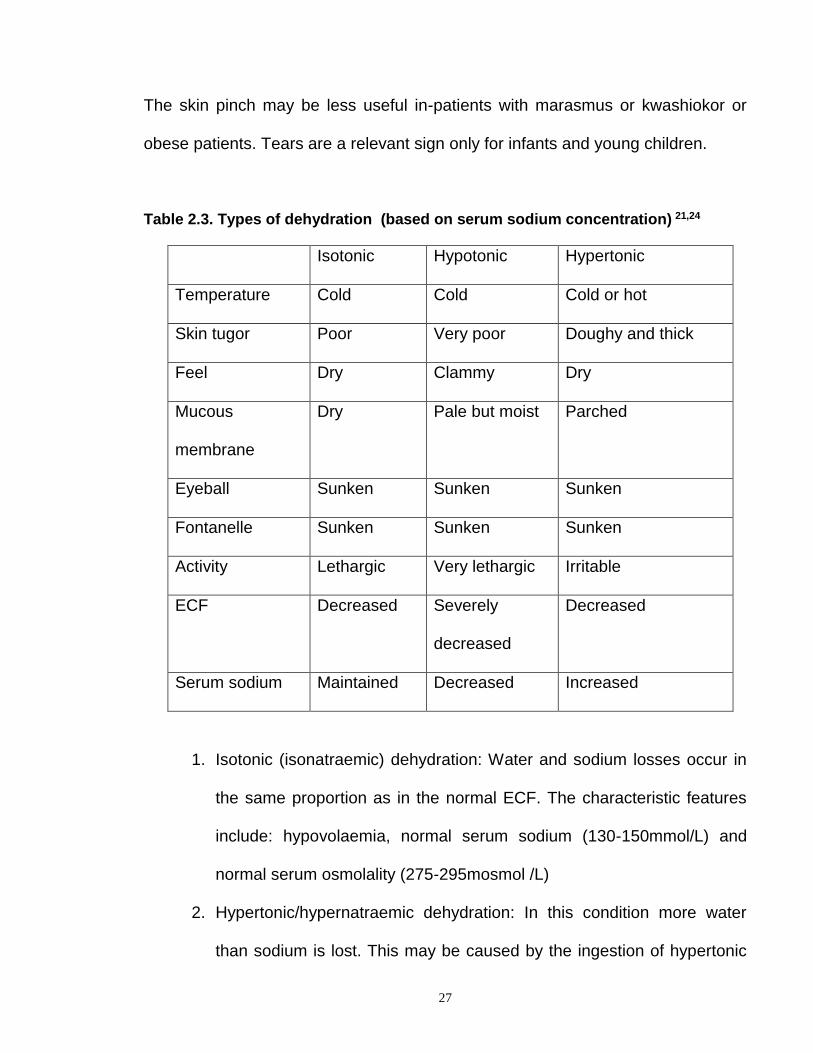
The skin pinch may be less useful in-patients with marasmus or kwashiokor or
obese patients. Tears are a relevant sign only for infants and young children.
Table 2.3. Types of dehydration (based on serum sodium concentration) 21,24
Isotonic Hypotonic Hypertonic
Temperature Cold Cold Cold or hot
Skin tugor Poor Very poor Doughy and thick
Feel Dry Clammy Dry
Mucous
membrane
Dry Pale but moist Parched
Eyeball Sunken Sunken Sunken
Fontanelle Sunken Sunken Sunken
Activity Lethargic Very lethargic Irritable
ECF Decreased Severely
decreased
Decreased
Serum sodium Maintained Decreased Increased
1. Isotonic (isonatraemic) dehydration: Water and sodium losses occur in
the same proportion as in the normal ECF. The characteristic features
include: hypovolaemia, normal serum sodium (130-150mmol/L) and
normal serum osmolality (275-295mosmol /L)
2. Hypertonic/hypernatraemic dehydration: In this condition more water
than sodium is lost. This may be caused by the ingestion of hypertonic
28
fluids such as sodium and glucose. The characteristic features include
hypovolaemia, high sodium concentration (>150mmol /L), high serum
osmolity (>295mosmol /L) and intense thirst.
3. Hypotonic dehydration: This results when sodium losses are higher than
water loss or water is re-absorbed but sodium loss continues. This may
be caused by intake of large quantities of water (water intoxication,
syndrome of inappropriate ADH secretion) or infusion of plain dextrose in
water (electrolyte free).
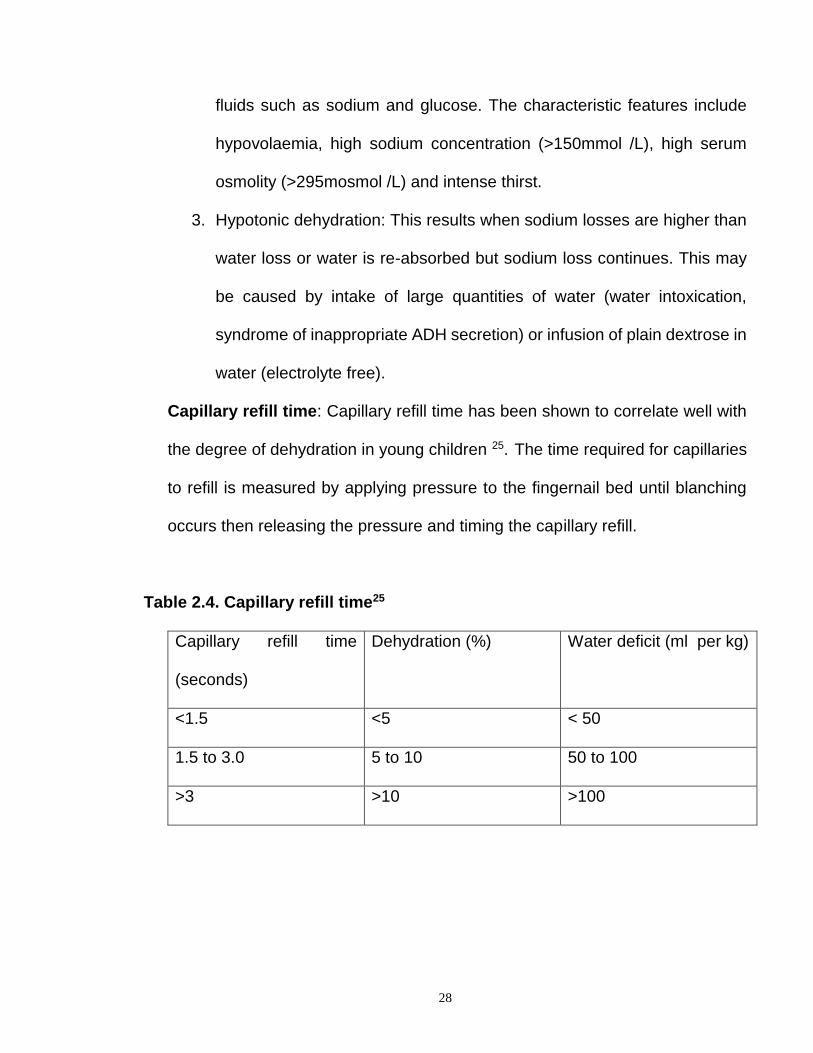
Capillary refill time: Capillary refill time has been shown to correlate well with
the degree of dehydration in young children 25. The time required for capillaries
to refill is measured by applying pressure to the fingernail bed until blanching
occurs then releasing the pressure and timing the capillary refill.
Table 2.4. Capillary refill time25
Capillary refill time
(seconds)
Dehydration (%) Water deficit (ml per kg)
<1.5 <5 < 50
1.5 to 3.0 5 to 10 50 to 100
>3 >10 >100
29
Electrolytes disturbances in diarrhoeal disease24,26
These include:
(i) Metabolic (Base-deficit) acidosis: Large amount of bicarbonate may be
lost in the stools. Kidneys compensate but if its function is impaired
usually with increasing hypovolaemia, base deficit and acidosis develop
rapidly. Characteristic features are serum bicarbonate less than
10mmol/L, deep rapid breathing, increased arterial pH resulting from
compensatory respiratory alkalosis and increased vomiting.
(ii) Hypokalaemia: The characteristics include general muscle weakness
and paralytic ileus
(iii) Hypoglycaemia: In some cases, life threatening hypoglycaemia may
accompany diarrhoea26.
Diarrhoea as a cause and effect of malnutrition 26, 27
Several studies have shown that diarrhoeal illness impair weight as well as
height gains with the greatest effect being seen with recurrent or prolonged
illness27.
The pathophysiology of how diarrhoea leads to malnutrition includes 27
(a) Decreased food intake: Local beliefs and tradition may lead to intentional
restriction of food for hours or days. Anorexia may lead to partial or total
rejection of food, or fluids including breast milk.
(b) Metabolic and nutritional responses: There is increased catabolism which
results in significant loss of bodily nutrients, muscle and fat.
30
(c) Mucosal alterations causes anatomic and functional alterations leading to
malabsorption.
(d) Reduced digestion and absorption of nutrients (protein, fat and
carbohydrate).
(e) Increased secretion with loss of bodily fluids. These mechanisms lead to loss
of nutrients, nitrogen, vitamins, electrolytes, albumin leading to oedema,
anaemia, reduced immune status and consequently recurrent infections.
(f) Altered immune response as with HIV infection.
(g) Impaired growth and development.
The summation of metabolic and nutritional alterations lead to progressive
deterioration of nutritional status and severe malnutrition. Malnutrition in turn
impairs resistance. In addition, enteric infection itself is suggested to be a cause
of decreased resistance, and impaired resistance aggravates malnutrition by
interfering with the amplification phenomenon. This contributes to persistence
of the agent, concurrent infection, and chronicity of disease.

31
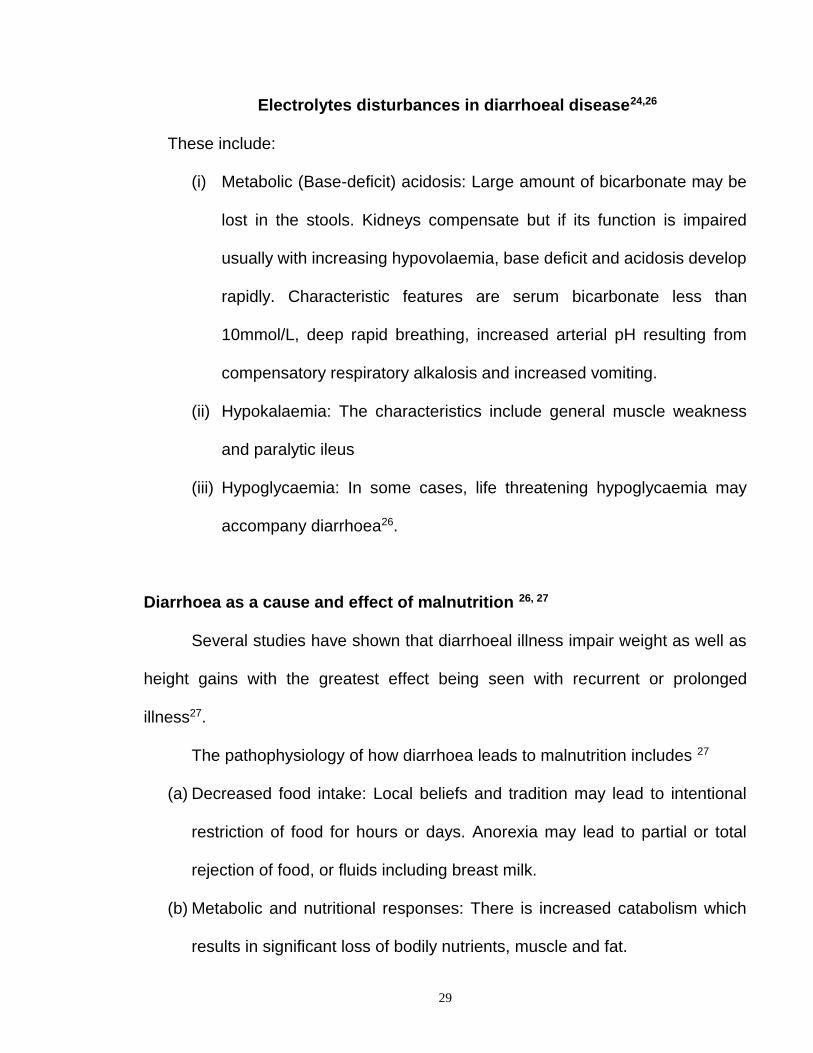
Figure 2.1
En te ric In fe c tio n
Re sista n c e
M a ln u trit io n
Ac u te , c h ro n ic
d ia rrh o e a
Diarrhoea -Malnutrition cycle. The width of the arrows indicate the strength of the
association 27.
The evaluation of patients with acute diarrhoea
Clinical presentation: The differential diagnosis of acute diarrhoea can be divided
into the clinical (or diarrhoea) syndromes of non-inflammatory and inflammatory
types of diarrhoea 29. Non-inflammatory secretory diarrhoea is associated with
cramping, bloating, periumbilical pain and large volume watery stool. Fever and
other constitutional symptoms are minimal or absent. In contrast, inflammatory
diarrhoea or dysentery is associated with mucosal invasion and commonly
accompanied by fever, other constitutional symptoms, lower abdominal pain,
faecal urgency and tenesmus. Stools are usually numerous, small volume and
often bloody or mucoid. Causes of non-inflammatory diarrhoea include the viruses
and toxigenic bacteria. These organisms do not invade the mucosa but induce a
secretory watery diarrhoea, thus haematochezia and faecal leucocytes are typically

32
absent 29. Approximately half of patients with enteric diseases will present with non-
specific symptoms that are not helpful in determining the diagnostic possibilities.
Table 2.5. Pathogenesis influences clinical syndrome
Clues to aetiologic diagnosis 29,30.
Characteristic
pathogenesis
Predominant
feature
Clinical
syndrome
Characteristic
aetiologies
Vomiting Gastroenteritis
(Stomach)
Staphylococcal food
poisoning, Rotavirus,
Norwalk virus
Enterotoxin
production. Adhere
to mucosal
surface fluid into
the gut.
Watery
diarrhoea. Large
volume stools,
few in number, no
faecal
leucocytes.
Enteritis (small
bowel)
Viruses. Tox. E. coli.
Shigella,
Staphylococcus aureus,
Clostridium welchi,
Vibrio cholera
Mucosal invasion
Mucosal
inflammation,
ulceration and death
of cells.
Numerous small
volume stools
containing blood
and/or mucus
and many
leucoytes
Dysentery
(colon)
Shigella, invasive E.
coli, Salmonella,
Campylobacter,
Staphylococcus aureus,
Entamoeba histolytica,
Giardia.
Submucosal
invasion
Inflammation
Constitutional,
vomiting, watery
diarrhoea +
blood, few faecal
leucocytes
Systemic
diarrhoea
Salmonella, Viruses
Travel history, recent food and drug ingestion and sexual practices are
important when considering causes of diarrhoea. Foodborne diarrhoea can be

33
noninflammatory due to bacterial toxins, or inflammatory following the ingestion of
invasive pathogens. Food poisoning should be suspected when outbreaks of
diarrhoea occur in companions. A specific bacterial toxin may be suggested by the
clinical setting. Staphylococcal toxin causes the abrupt onset of nausea and
vomiting two to seven hours following the consumption of contaminated meat,
poultry, or mixed salads. Abdominal cramps and diarrhoea also occur. In toxicity
with clostridium perfringes, onset of symptoms is delayed for 8 to 14 hours after
consumption of contaminated meats. Vomiting is frequent, and the main features
include abdominal cramps and watery diarrhoea that persist for 24 hours.
Medications may precipitate diarrhoeas. Diarrhoea associated with recent
antibiotic use suggests the possibility of antibiotic-associated
(Pseudomembranous) colitis. Symptoms usually include noninflammatory watery
diarrhoea that appears at any time up to six weeks following antibiotic therapy.
Antibiotic use facilitates the overgrowth of clostridium deficile, which produces a
toxin damaging the mucosa 29,30.
Laboratory evaluation: The presence of faecal leucocytes suggests colonic
mucosal invasion 30. Because most acute diarrhoeal illnesses are self-limited and
caused by viruses, stool bacterial cultures should be used judiciously. Cultures are
reserved for the following cases: patients who have occult blood or are positive for
faecal leucocytes, febrile patients, those requiring admission to hospital, and those
who have diarrhoea for more than one week.
Proctoscopy/sigmoidoscopy is useful in the diagnosis of antibiotic associated
colitis, amoebic colitis and ulcerative colitis.

34
Evaluation of patients with chronic diarrhoea
Patients who report having diarrhoea for more than four weeks should be
evaluated for chronic diarrhoeal diseases, since most infectious enteritides and
other causes of acute diarrhoea generally resolve spontaneously within this period
31. The keys to making the proper diagnosis include an accurate history and
appropriate laboratory studies.
Some chronic diarrhoeal diseases have specific characteristics. Certain
criteria suggest the presence of an organic disorder, and these include: a shorter
duration (usually less than three months), predorminantly nocturnal diarrhoea,
continual rather than intermittent diarrhoea, a sudden onset, weight loss, a high
erthrocyte sedimentation rate, anaemia and a low albumin level 32. In the absence
of these, a diagnosis of functional diarrhoea is sometimes made 32.
In giardiasis, the diarrhoea is often associated with upper abdominal cramps
and “frothy” stool. Amoebic diarrhoea can be either watery or bloody and can last
many years. Suggestive of steatorrhea is a history of weight loss, greasy or bulky
stools that are difficult to flush and a bad odour. The presence of steatorrhea is
determined by a 72- hour collection of stool fat 32. The diarrhoea of carbohydrate
malabsorption (disaccharidase deficiency) can be intermittent and is usually
accompanied by symptoms of bloating, flatus, and cramping. This type of diarrhoea
can be primary or secondary to viral enteritis, which damages the small intestinal
mucosa, or to antibiotic therapy, which alters colonic bacteria.
35
Before the evaluation, the patient should follow a lactose-free diet for several
days, since diarrhoea that continues after an acute episode is often due to
secondary lactase deficiency 32. Lactase deficiency is the likely diagnosis when
symptoms relate to milk ingestion.
A step-wise approach to the laboratory tests is advocated, beginning with
stool examination for ova and parasite, and progressing to radiological
investigations.
36
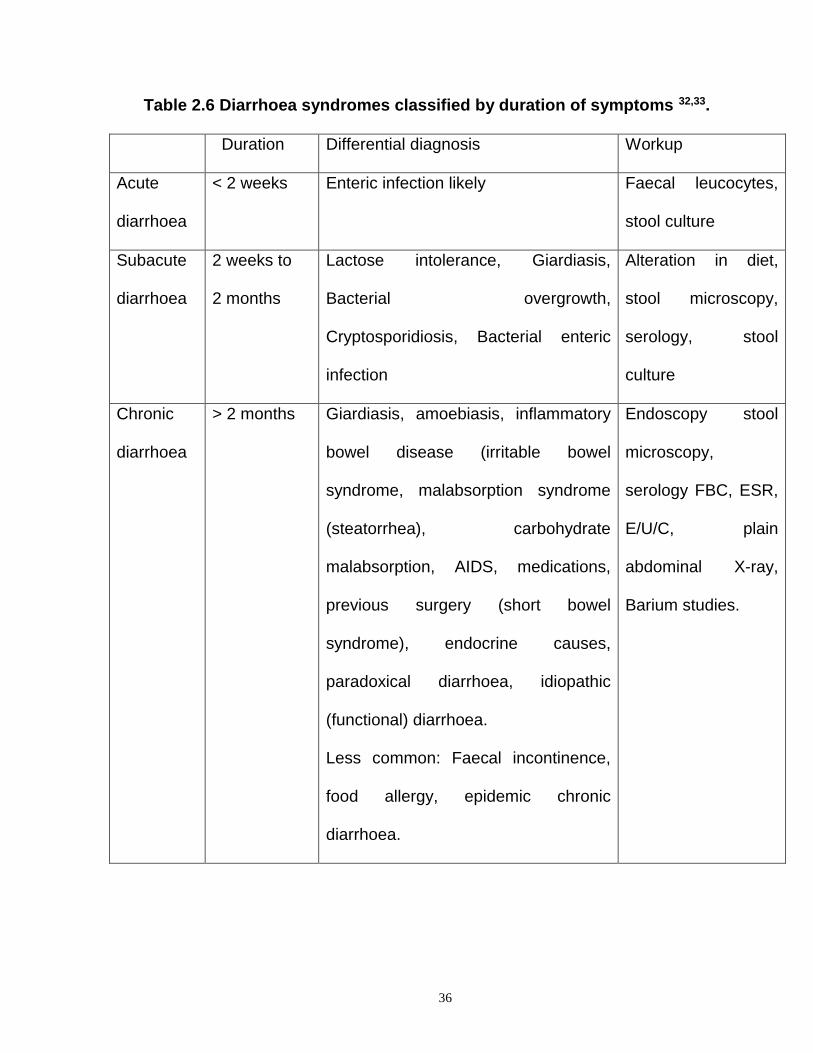
Table 2.6 Diarrhoea syndromes classified by duration of symptoms 32,33.
Duration Differential diagnosis Workup
Acute
diarrhoea
< 2 weeks Enteric infection likely Faecal leucocytes,
stool culture
Subacute
diarrhoea
2 weeks to
2 months
Lactose intolerance, Giardiasis,
Bacterial overgrowth,
Cryptosporidiosis, Bacterial enteric
infection
Alteration in diet,
stool microscopy,
serology, stool
culture
Chronic
diarrhoea
> 2 months Giardiasis, amoebiasis, inflammatory
bowel disease (irritable bowel
syndrome, malabsorption syndrome
(steatorrhea), carbohydrate
malabsorption, AIDS, medications,
previous surgery (short bowel
syndrome), endocrine causes,
paradoxical diarrhoea, idiopathic
(functional) diarrhoea.
Less common: Faecal incontinence,
food allergy, epidemic chronic
diarrhoea.
Endoscopy stool
microscopy,
serology FBC, ESR,
E/U/C, plain
abdominal X-ray,
Barium studies.
37
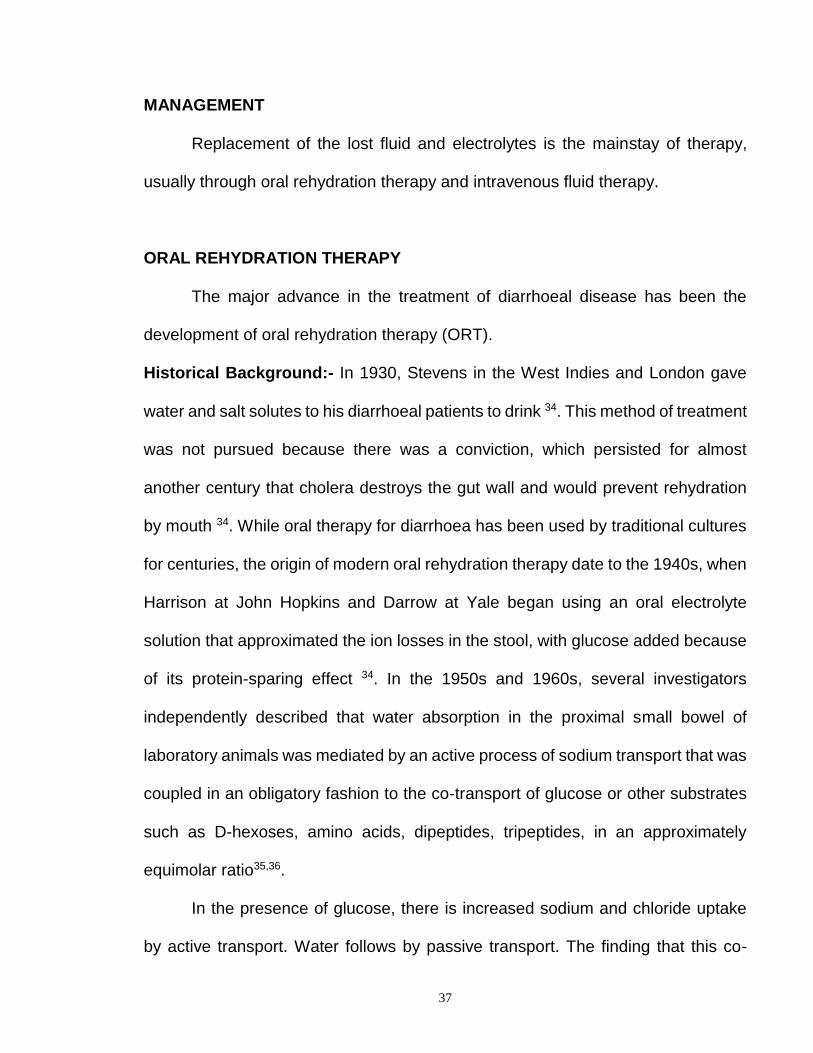
MANAGEMENT
Replacement of the lost fluid and electrolytes is the mainstay of therapy,
usually through oral rehydration therapy and intravenous fluid therapy.
ORAL REHYDRATION THERAPY
The major advance in the treatment of diarrhoeal disease has been the
development of oral rehydration therapy (ORT).
Historical Background:- In 1930, Stevens in the West Indies and London gave
water and salt solutes to his diarrhoeal patients to drink 34. This method of treatment
was not pursued because there was a conviction, which persisted for almost
another century that cholera destroys the gut wall and would prevent rehydration
by mouth 34. While oral therapy for diarrhoea has been used by traditional cultures
for centuries, the origin of modern oral rehydration therapy date to the 1940s, when
Harrison at John Hopkins and Darrow at Yale began using an oral electrolyte
solution that approximated the ion losses in the stool, with glucose added because
of its protein-sparing effect 34. In the 1950s and 1960s, several investigators
independently described that water absorption in the proximal small bowel of
laboratory animals was mediated by an active process of sodium transport that was
coupled in an obligatory fashion to the co-transport of glucose or other substrates
such as D-hexoses, amino acids, dipeptides, tripeptides, in an approximately
equimolar ratio35,36.
In the presence of glucose, there is increased sodium and chloride uptake
by active transport. Water follows by passive transport. The finding that this co-

38
transport mechanism also mediates water absorption in the human gut and is
preserved in patients with diarrhoea of all aetiology led to the formulation of a
sodium and glucose-based oral rehydration solution 35-37. Field testing of these
solutions was performed initially in rural Bangladesh, and was later first used on a
large scale during an epidemic of cholera affecting refugees fleeing into India during
the Bangladesh war of independence in 1971 36. When supplies and personnel for
administering intravenous therapy were scanty, the use of ORT reduced the
mortality from 30% to 3%3,38. It was shown that over 80% of moderately and
severely dehydrated patients who would normally receive intravenous therapy,
were sufficiently rehydrated by ORT.
Subsequently, in 1975, the WHO and UNICEF agreed to promote a single
oral rehydration solution (WHO-ORS) to treat dehydrating diarrhoea in children and
adults of all ages33,38.
Formulation of oral rehydration salt (ORS): The formulation of oral rehydration
solution should be nearly isotonic, contain an appropriate amount and mixture of
electrolytes to replace what is lost and the balance between sodium and glucose
should be appropriate to enhance the absorption mechanism 39. A complete ORS
should also provide some potassium and some alkali to correct any metabolic
acidosis that may be coexisting.
The composition of the diarrhoeal stool depends on the infecting organism 39.

39
Table 2.7 Composition by electrolytes of diarrhoeal stools.
Na K Cl HCO3 (mmol /L)
Cholera 88 30 86 32
Rotavirus 37 38 22 6
ETEC 53 37 24 18
The WHO-ORS was formulated along the line of the choleraeic stool
Table 2.8: Composition by weight of WHO Oral Rehydration Salt (ORS) 20,39
(Quantities shown for the preparation of one litre of ORS solution)
Ingredient grams
Sodium chloride 3.5
Trisoduim citrate dehydrate, 2.9
OR Sodium citrate dehydrate 2.5
Potassium chloride 1.5
Glucose anhydrous 20, or sugar (sucrose) 40gms
The dry ingredients are distributed in packets for reconstitution with water.
More recently trisoduim citrate has replaced bicarbonate as the base to prolong the
packet shelf life. When dissolved in the recommended amount of water it gives a
solution which is effective for the treatment of dehydrated children .

40
Table 2.9: Molar concentration of components of ORS solution 20,39
Component Mmol/Litre of water
Sodium 90
Potassium 20
Chloride 80
Citrate 10 (or Bicarbonate –30)
Glucose 111(2%)
The salt-sugar solution (SSS): In developing countries, where the majority of the
people are poor and live in rural areas, the value of ORS is limited. The mothers
are not familiar with the litre measure and the use of WHO-ORS would mean
dependence on commercially produced sachets with the attendant problem of
scarcity, cost and delay in therapy. Therefore, a regime can be developed that is
available to the mother in the home; she can then give guided help to the child. This
led to the development of salt-sugar solution, the sucrose in it being broken down
to glucose in the gut.
In the 1980s, health workers had taught mothers various methods of
preparing this simple solution. One well known formula is “ a one three-finger pinch
of salt (exactly up to the first crease of index finger) or a quarter teaspoon of salt
and two four -finger scoops of sugar or four cubes of sugar, dissolved in one beer
bottle of water 10,40. Due to the inherent errors, a group of Nigerian paediatricians
and the UNICEF has produced a standard formula for home made salt-sugar
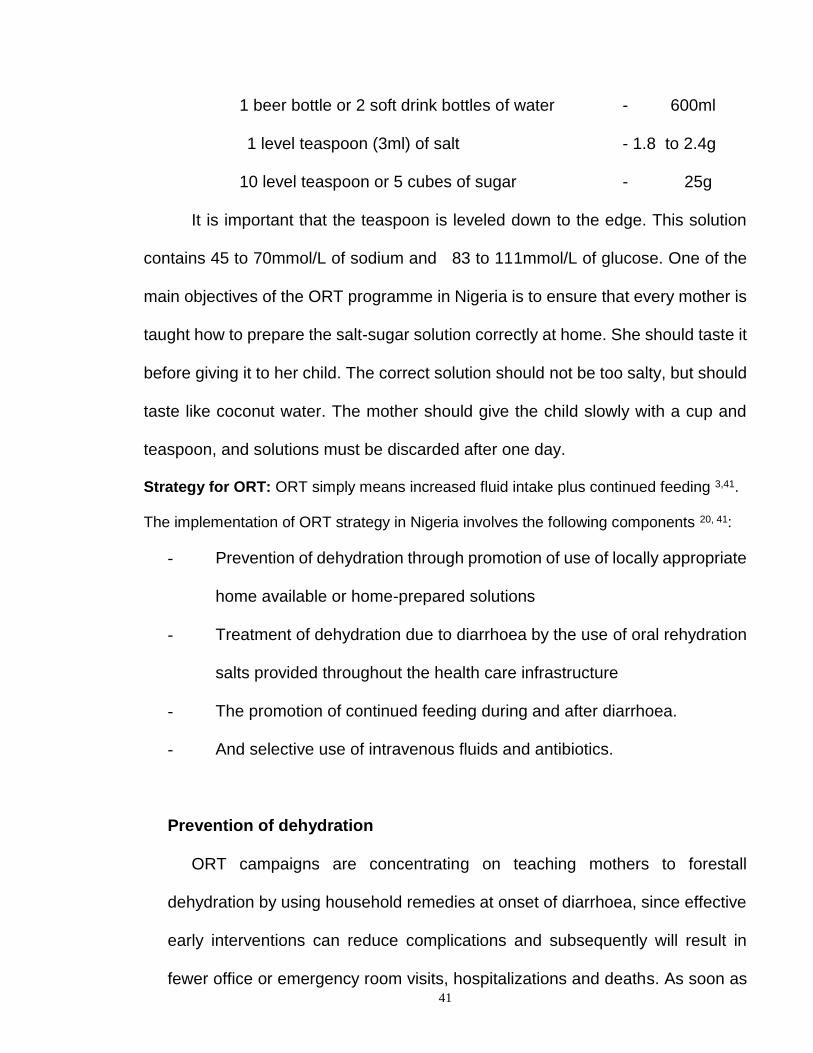
solution, which can easily be prepared, and it consist of 10,40.
41
1 beer bottle or 2 soft drink bottles of water - 600ml
1 level teaspoon (3ml) of salt - 1.8 to 2.4g
10 level teaspoon or 5 cubes of sugar - 25g
It is important that the teaspoon is leveled down to the edge. This solution
contains 45 to 70mmol/L of sodium and 83 to 111mmol/L of glucose. One of the
main objectives of the ORT programme in Nigeria is to ensure that every mother is
taught how to prepare the salt-sugar solution correctly at home. She should taste it
before giving it to her child. The correct solution should not be too salty, but should
taste like coconut water. The mother should give the child slowly with a cup and
teaspoon, and solutions must be discarded after one day.
Strategy for ORT: ORT simply means increased fluid intake plus continued feeding 3,41.
The implementation of ORT strategy in Nigeria involves the following components 20, 41:
- Prevention of dehydration through promotion of use of locally appropriate
home available or home-prepared solutions
- Treatment of dehydration due to diarrhoea by the use of oral rehydration
salts provided throughout the health care infrastructure
- The promotion of continued feeding during and after diarrhoea.
- And selective use of intravenous fluids and antibiotics.
Prevention of dehydration
ORT campaigns are concentrating on teaching mothers to forestall
dehydration by using household remedies at onset of diarrhoea, since effective
early interventions can reduce complications and subsequently will result in
fewer office or emergency room visits, hospitalizations and deaths. As soon as

42
the diarrhoea starts the child should be given extra fluids in the form of breast
milk, ordinary water or other recommended home fluids such as light pap, fruit
juice, salted rice water, salt-sugar solution, cereal-based solutions and
traditional soups. The mother should make a standard salt-sugar solution and
give the child slowly with a cup and a teaspoon.
Fluid requirement 23, 41: Drink should be given every time a watery stool is
passed. One-quarter to a half of a large cup for a child under the age of two
years, and a half to one large cup for older children.
Table 2.10: Fluid requirements
Age Amount of solution after each loose stool
Less than 2 years 50 to 100ml
1 to 9 years 100 to 200ml
10 years or more As much as wanted
Treatment of dehydration
Oral rehydration salt solution can be used in the hospital or clinic for the
treatment of most children with dehydration due to acute diarrhoea. Ideally an
oral rehydration therapy unit should be established in every health institution.
On admission, the degree of dehydration is assessed and the amount of ORS
solution required for rehydration is determined (50 to 100ml/kg body weight).

43
Table 2.11 shows how much ORS (in milliliter) to give. This is a guideline only
for rehydration within 4 to 6 hours 20, 41.
Age / weight
Degree of
dehydration
2-4 months
3 to 5kg
5-9months
6to 8kg
10-12months
12 to 14kg
13-14months
12 to 14kg
Above 2 years
Above 15kg
Mild 200 400 800 800 1000
Moderate 400 600 1000 1000 1200
Severe and
conscious
600 800 1200 1400 1600
Severe and
unconscious
IV therapy 70ml/ kg within hours, followed by ORS (maintenance)
For maintenance ORS (to prevent dehydration recurring) give after each watery
stool 100ml.
The mother is given a measured amount of the solution in the cup and she is asked
to give it to the child slowly by spoon. The solution may be given by nasogastric
tube, if the child is unable to take sufficient amount by mouth. Most children are
rehydrated within four to six hours 41.
For patients in shock, give intravenous fluid immediately to replace fluid
deficit. Use Ringer’s lactate or, if not available, normal saline. For patients aged
one year and older give 100ml/kg body weight of the fluid intravenously in three
hours, as follows 23, 41:
- 30ml/kg as rapidly as possible (within 30 minutes): then
- 70ml/kg in the next 2½ hours
For patients less than one year, give 100ml/ kg intravenously in six hours as follows:
44
- 30ml/kg in the first hour; then
- 70ml/kg in the next five hours
Monitor the patient very frequently. After the initial 30ml/kg have been given, if
still in shock continue to give the intravenous fluid rapidly.
Reassess the patient after three hours (infants after six hours):
- If there are signs of severe dehydration, repeat the intravenous therapy
given.
- If there are signs of some dehydration, continue as indicated with ORS.
- If there are no sign of dehydration, go on to the maintenance phase of
rehydration.
Other fluids that can be used in place of Ringer’s lacate include:
- Half-strength Darrow’s solutions or Half strength saline diluted with 5%
dextrose in water.
- One-fifth normal saline is used in cases of hypernatraemic/hypertonic
dehydration.
- Potassium replacement can commence when the patient starts making
adequate (0.5 to 1ml/kg) urine.
ORS can be started to supplement intravenous fluids as soon as the child starts
taking fluids orally.
Maintenance phase: This begins following rehydration in the child with clinical
signs of dehydration or begins immediately in the child without clinically apparent
dehydration. An oral rehydration solution with a lower sodium concentration (40 to
60mEq/L) should be used during this phase. If a solution with a high sodium

45
concentration (75 to 90mEq/L) is used, it should be alternated with liquids that are
low in solutes (i.e. breast milk, formula or water). Additional oral rehydration solution
should be given to replace stool losses approximately 10ml/kg body weight or one-
half to one cup of solution for each diarrhoeal stool23, 41.
WHO-ORS has been studied extensively and it has been found to be safe
and effective in children of all ages (including neonates) with diarrhoea of all
aetiology, dehydration of all degrees of severity up to the point of shock and
electrolyte disturbances, including both hyponatraemia and hypernatraemia 39, 41.
In controlled clinical trials, oral rehydration therapy was found to be more rapid than
intravenous therapy in correcting dehydration and acidosis42. ORT was also safer
with none of the complication associated with intravenous therapy42.
Limitations of ORT
1. Patients with bloody diarrhoea may have a bacteria or parasite infection
requiring treatment with an antimicrobial agent.
2. Patients in shock or near shock should be treated initially with intravenous
solutions. Also, patients with intestinal ileus should not be given oral fluids
until bowel sounds are audible.
3. Intractable vomiting: Greater than 90% of patients with vomiting can be
successfully rehydrated or maintained with oral fluids when small volumes of
ORS (5 to10ml) are administered every one to two minutes with a gradual
increase in the amount consumed.
4. High stool output: Stool output greater than 10ml /kg/hour is associated with
a lower rate of success of oral rehydration. However, no patient should be
46
denied ORT simply because of a high purging rate, since most patients will
respond well when administered adequate replacement fluid.
5. Monosaccharide malabsorption: The presence of glucose or reducing substances
in the stools, accompanied by a dramatic increase in stool output with the
administration of ORS, is an indication of glucose malabsorption. The incidence is one
to eight percent among some populations 39,43. Malabsorption of lactose, sucrose and
maltose can also occur because of deficiencies of their respective enzymes or
starvation associated with the lack of enzyme induction.
Nonetheless, ORT is often the optimal method for the treatment of acute
diarrhoea. Its ability to be administered at home promotes earlier treatment and
prevention of dehydration, as well as active involvement of the parents in the
medical care of their children. The use of ORS with early feeding is not only safer,
but also more efficacious than intravenous therapy in the treatment of acute
diarrhoea.
Cereal-based ORS formulations
A perceived weakness of the glucose-based ORS is its inability to reduce
the duration of illness or volume of stool output and may slightly increase the stool
volume 43. The continued diarrhoea compromises the value of oral rehydration in
the mind of the user, who expects treatment to decrease liquid stools and vomiting.
Several studies have shown that cereal-based solutions are equally effective
in restoring volume losses, can substantially reduce losses of intestinal fluids
(diarrhoea and vomiting), and may also shorten the duration of illness 44,45. The
table below shows the composition of an effective cereal based ORS, as well as
that of glucose-based solution recommended by the WHO 45,46.
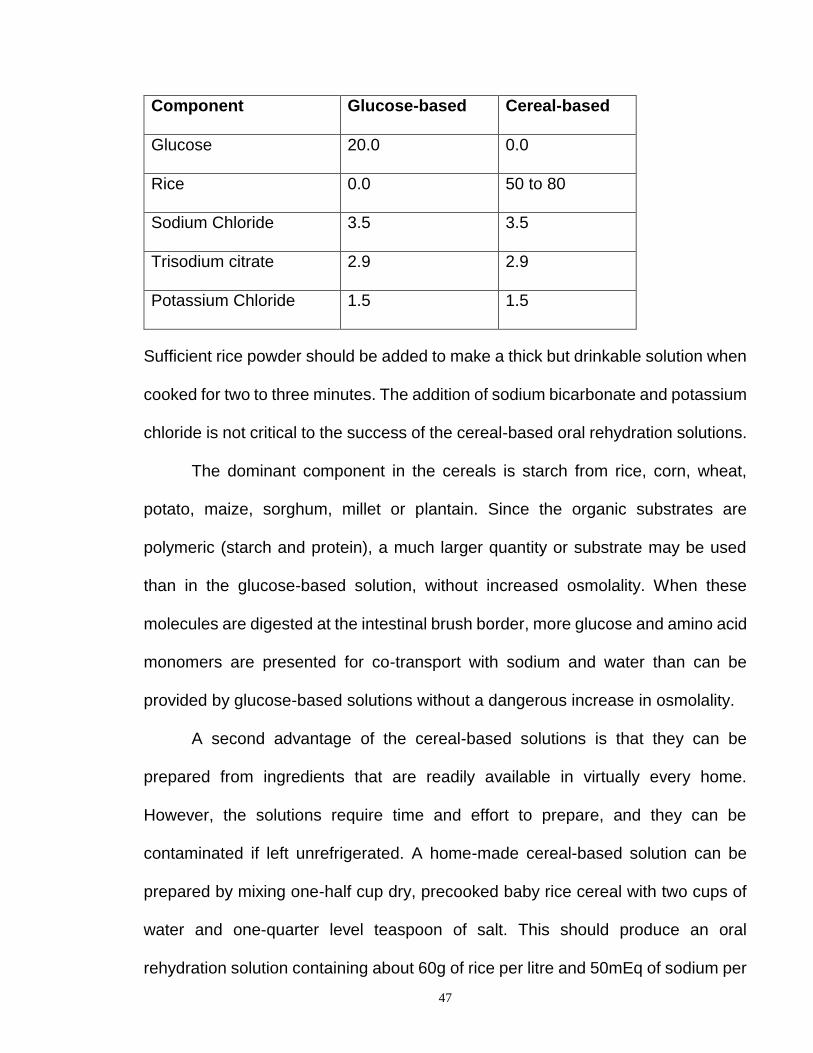
TABLE 2.12: Composition of Oral-Rehydration Solution (g/L)
47
Component Glucose-based Cereal-based
Glucose 20.0 0.0
Rice 0.0 50 to 80
Sodium Chloride 3.5 3.5
Trisodium citrate 2.9 2.9
Potassium Chloride 1.5 1.5
Sufficient rice powder should be added to make a thick but drinkable solution when
cooked for two to three minutes. The addition of sodium bicarbonate and potassium
chloride is not critical to the success of the cereal-based oral rehydration solutions.
The dominant component in the cereals is starch from rice, corn, wheat,
potato, maize, sorghum, millet or plantain. Since the organic substrates are
polymeric (starch and protein), a much larger quantity or substrate may be used
than in the glucose-based solution, without increased osmolality. When these
molecules are digested at the intestinal brush border, more glucose and amino acid
monomers are presented for co-transport with sodium and water than can be
provided by glucose-based solutions without a dangerous increase in osmolality.
A second advantage of the cereal-based solutions is that they can be
prepared from ingredients that are readily available in virtually every home.
However, the solutions require time and effort to prepare, and they can be
contaminated if left unrefrigerated. A home-made cereal-based solution can be
prepared by mixing one-half cup dry, precooked baby rice cereal with two cups of
water and one-quarter level teaspoon of salt. This should produce an oral
rehydration solution containing about 60g of rice per litre and 50mEq of sodium per
48
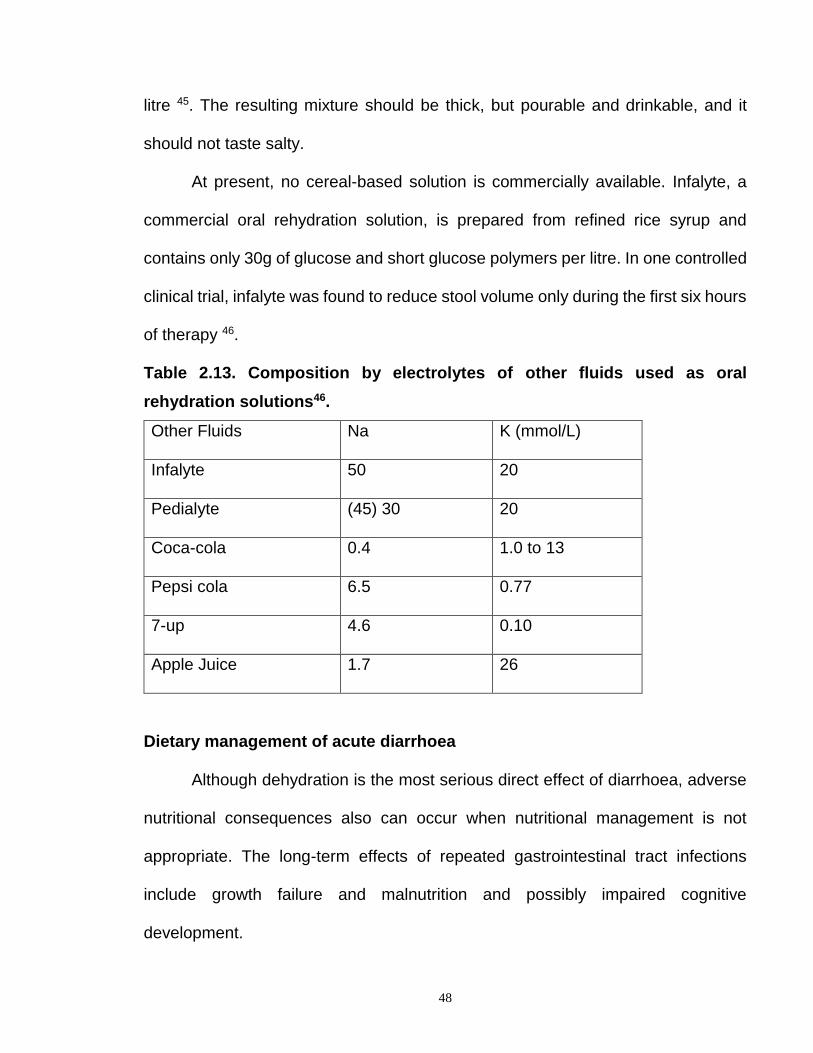
litre 45. The resulting mixture should be thick, but pourable and drinkable, and it
should not taste salty.
At present, no cereal-based solution is commercially available. Infalyte, a
commercial oral rehydration solution, is prepared from refined rice syrup and
contains only 30g of glucose and short glucose polymers per litre. In one controlled
clinical trial, infalyte was found to reduce stool volume only during the first six hours
of therapy 46.
Table 2.13. Composition by electrolytes of other fluids used as oral
rehydration solutions46.
Other Fluids Na K (mmol/L)
Infalyte 50 20
Pedialyte (45) 30 20
Coca-cola 0.4 1.0 to 13
Pepsi cola 6.5 0.77
7-up 4.6 0.10
Apple Juice 1.7 26
Dietary management of acute diarrhoea
Although dehydration is the most serious direct effect of diarrhoea, adverse
nutritional consequences also can occur when nutritional management is not
appropriate. The long-term effects of repeated gastrointestinal tract infections
include growth failure and malnutrition and possibly impaired cognitive
development.

49
Reduced oral intake versus continued feeding: Two opposing
approaches to the nutritional management of acute diarrhoea have been
recommended 47. One approach favours reducing oral intake during illness to avoid
diarrhoea that occurs because of intestinal malabsorption, while the other approach
favours continued feeding to avoid the nutritional consequences of fasting. The first
approach, the tradition of “gut-rest”, still in wide practice, probably evolved from the
observation that stool output was reduced in patients who fasted. However, no
controlled clinical trial have demonstrated the efficacy of this approach. Rather,
studies have shown that fasting in children not only has a negative impact on
nutritional status but also actually prolongs the course of diarrhoea 45,47. The fasting
child loses approximately one percent of lean body mass per day. Fasting can
reduce enterocyte renewal. The gut mucosa may suffer atrophy. Furthermore, the
injured gut requires luminal foodstuff for rapid repair.
There has been no adverse effect of early or continuous feeding. Several
studies have provided strong evidence for the recommendation that full-strength,
lactose free formulae can be safely introduced immediately after rehydration
therapy and that such therapy can improve nutritional outcome as well as reduce
stool output and the duration of diarrhoea 39, 47.
Because diarrhoeal disease can cause transient lactase deficiency, the use of
milk is of special concern. Continued breastfeeding should be encouraged, because
human milk appears to diminish the duration and severity of diarrhoea. Non-human
milk may be given in a dilute form initially 47. Older children receiving semisolid or
solid foods should continue to receive their usual diet during diarrhoea.
50
Recommended foods include starches (e.g. Irish potatoes, noodles, crackers and
banana), cereals (e.g. rice, wheat and oat), and soup, yoghurt, vegetables and fresh
fruits. Foods high in simple sugars (e.g. soft drinks, undiluted apple juice and pre-
sweetened cereals) and fats should be avoided because of their tendency to
exacerbate diarrhoea by osmotic effects and to delay gastric emptying respectively 47.
Antidiarrhoeal and antimicrobial agents
Since viral agents are the predominant cause of acute diarrhoea,
antimicrobial agents play only a limited role in case management. Neither
antibiotics nor non-specific antidiarrhoeal agents are usually indicated for acute
diarrhoea. Antibiotics should be considered when dysentery or a high fever is
present, when watery diarrhoea lasts for greater than five days, or when stool
cultures, microscopy or epidemic setting indicate an agent for which specific
treatment is required 48.
Antimotility agents and adsorbents generally are not recommended for use
in young children. The use of opiates, kaolin and other antidiarrhoeal mixture, which
either inhibit peristalsis or solidify the stool, gives false impression of recovery. The
copious secretion of water by enterocytes and the production of diarrhoeal stool is
a physiological response of the body in an attempt to eliminate the causative
organism and toxins from the gut. The drugs inhibit this process and the course of
the disease may be prolonged. Metoclopromide (plasil) and chlorpromazine are
usually given as antiemetic. These drugs can produce abnormal extrapyramidal
signs (abnormal movements of the limbs and oculogyric crises) in some children.

51
Promethazine causes drowsiness and prevents the child from taking enough fluids
by mouth. Loperamide is only indicated in cases of chronic diarrhoea of all aetiology
48. Unacceptable side effects such as opiate-induced ileus (abdominal distension),
nausea and drowsiness can occur. In addition, reliance on antidiarrhoeal agents
shifts the therapeutic focus away from appropriate fluid, electrolyte, and nutritional
therapy. This can interfere with oral therapy and unnecessarily add to the economic
of the illness 39,48.
52
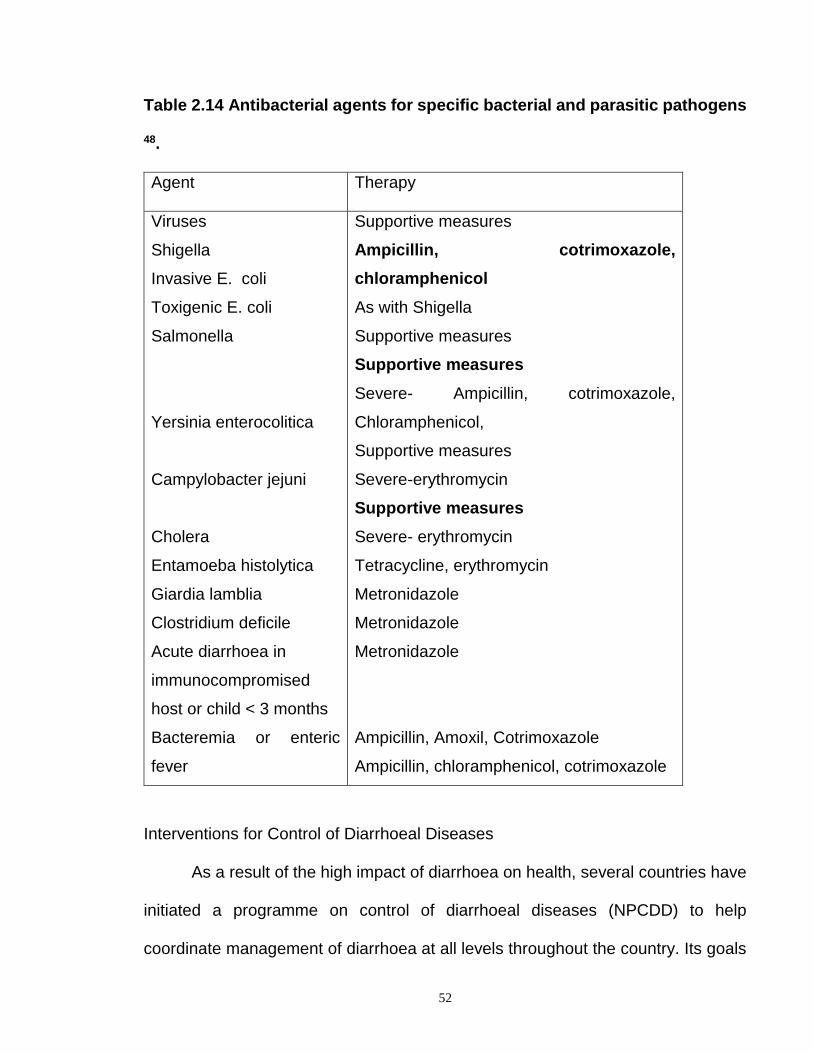
Table 2.14 Antibacterial agents for specific bacterial and parasitic pathogens
48.
Agent Therapy
Viruses
Shigella
Invasive E. coli
Toxigenic E. coli
Salmonella
Yersinia enterocolitica
Campylobacter jejuni
Cholera
Entamoeba histolytica
Giardia lamblia
Clostridium deficile
Acute diarrhoea in
immunocompromised
host or child < 3 months
Bacteremia or enteric
fever
Supportive measures
Ampicillin, cotrimoxazole,
chloramphenicol
As with Shigella
Supportive measures
Supportive measures
Severe- Ampicillin, cotrimoxazole,
Chloramphenicol,
Supportive measures
Severe-erythromycin
Supportive measures
Severe- erythromycin
Tetracycline, erythromycin
Metronidazole
Metronidazole
Metronidazole
Ampicillin, Amoxil, Cotrimoxazole
Ampicillin, chloramphenicol, cotrimoxazole
Interventions for Control of Diarrhoeal Diseases
As a result of the high impact of diarrhoea on health, several countries have
initiated a programme on control of diarrhoeal diseases (NPCDD) to help
coordinate management of diarrhoea at all levels throughout the country. Its goals
53
were to reduce the incidence of diarrhoea and prevent complications through oral
rehydration therapy. The programme also emphasizes on the prevention of
diarrhoea by using interventions that are cost-effective and easy to incorporate in
the primary health care programmes. These interventions are implemented more
or less simultaneously, with ORT being the cornerstone of the programme. The
important measures include; improved nutrition through promotion of breastfeeding
and proper weaning practices, adequate supply of safe drinking water, safe faeces
disposal, good personal, domestic and environmental hygiene, immunization
especially against measles, female education, improvement in socioeconomic
status and provision of vitamin A. Efforts are being made to complement these
preventive measures with the development of enteric vaccines that could confer
long lasting prevention 20,48.
Child survival strategy
Similarly, oral rehydration therapy has been recognized and incorporated as
a strategy for child survival and development revolution (CSDR) in any country with
a high incidence of diarrhoeal disease. These are measures aimed at curtailing the
high rate of infant morbidity and mortality in these countries. Other components of
the child survival strategy include growth monitoring, breast-feeding, immunization,
food supplementation, female education, family planning, improvement in
socioeconomic status, prompt and adequate treatment of common diseases and
ailments and health education.
54
At the world summit for children in 1990, over 150 countries under-took to
attain 80% access to and usage of oral rehydration therapy by 1995 with a view to
achieving a reduction of 50% in mortality attributable to diarrhoea by 2000 5,49. This
was to be achieved through health education of the public and establishment of
health care facilities especially for oral redydration salts. It is essential that health
workers and caretakers are acquainted with the common causes of diarrhoea in
children and the applicability of ORT. Every mother in Nigeria should know how to
prepare and give the standard salt-sugar solution at home. She should also be able
to recognize the simple signs of dehydration, and take the child to a health facility
when home remedies fail.
Evaluation of the programmes
Efforts are continually being made by the WHO/UNICEF to evaluate the
success rate of these programmes (NPCDD and CSDR) with a view to improving
upon them. The reasons for these studies which are mostly based on ORT are 10:
1. To measure the full impact of the National control of diarrhoeal disease
programme.
2. Experience with ORT can provide useful guidance for child survival
programmes.
3. To evaluate the ORT formula and assess the impact of the promotional effort
on the people.
55
4. To assess the reproducibility of the recommended methods and determine
the accuracy and variability of the compositions of solutions prepared by
mothers.
5. In monitoring progress towards the goals established by the world summit
for children.
In studies focusing on ORT use, three aspects of knowledge have been most
often examined: knowledge of the use per se, knowledge of mixing and
administration instructions for salt-sugar solution (SSS) or ORS packets, and
knowledge of dehydration and the benefits of using ORT 49. There are many factors
besides knowledge that influence a mother’s choice of treatment for diarrhoea in a
child 49. These include the relative availability and cost of various treatments, access
to medical services of all kinds, the difficulty in making use of specific treatment and
beliefs concerning their relative efficacy.
Population-based data show positive trends in the management of diarrhoea
in most parts of the world. ORT is now given to the majority of children with
diarrhoea resulting in a significant reduction in the mortality rate due to diarrhoea.
More children continue to be fed when suffering from diarrhoea. Nonetheless,
several workers have found that less than half of women who know about ORT
actually use it when their children have diarrhoea 5,50. Antidiarrhoeal drugs have
continued to be used inappropriately in children.
The few reports in Nigeria show that the use of SSS is low, ranging between
11% and 18% 50. In a survey carried out by Yakubu et al in a rural area near Zaria,
they found that 82% of the mothers interviewed were aware of SSS, only 14% could
56
actually prepare the mixture correctly 50. The common sources of error were too
much water (61%), salt (10%), sugar (10%) and too little water (38%), salt (8%) and
sugar (41%). Further findings include the use rate of SSS (23%), ORS (14%).
Maternal education did not influence the use rates of ORT nor the preference for
home treatment.
Their findings corroborated those of Ekanem et al who reported a low use
rate of ORT, and a small proportion of women who could prepare the SSS correctly
51. Just like Yakubu et al, Ekanem et al were not able to identify the determinants
of the low ORT usage at home, nor the equally low prescription rate of ORT by
health care providers.
Babaniyi et al in their study in Suleja, Nigeria found that 44% of mothers gave
SSS to their children with diarrhoea at home52. Only half of the mothers prepared
the solution correctly. Among the mothers who prepared SSS incorrectly, 72%
added the incorrect amount of sugar and 63% added the incorrect amount of salt,
water was added incorrectly by 35% of mothers. Too much salt/sugar resulted from
using 5ml teaspoon instead of the recommended 3ml teaspoon. Too little water
could have resulted from ignorance on the proper amount of water. The implications
of these mistakes are that a substantial number of the prepared solutions were too
concentrated in either sugar, salt, or both. Similar evaluations of home-made salt-
sugar solution have indicated that the finding in Suleja is within normal for
Nigeria10,53. Salt type, sugar and moisture content, spoon size and leveling
technique were all possible causes of their error. A previous study indicated that

57
there are over 12 types of teaspoons in Nigerian homes and that they vary in
volume from 1.8 to 5ml10.
Other findings from Babaniyi’s study included: The drug use rate at home
was 53.5%. Mothers treated at home significantly more often when the diarrhoea
was perceived as severe. Children with “severe” diarrhoea were given SSS at
home, and were referred for treatment to a health facility or traditional healer, more
often than those with non-severe diarrhoea. Most children received SSS six to nine
times daily and were given one to nine teaspoons of it each time. Among all children
with diarrhoea, 24% received correctly prepared SSS. Twelve percent received
correctly prepared SSS in adequate quantity. This observed low success rate of
SSS use may have contributed to the poor SSS acceptability, and of its limited role
in home-management of diarrhoea in Nigeria. Twenty-two percent of children with
diarrhoea were given increased amounts of fluid while 56% received the same
amount of fluids and 22% received less fluid than they received before the onset of
the illness. Mothers seem to have accepted the simple message that children need
to drink more during episodes of diarrhoea.
Nwoye et al, in a study in Nsukka, near Enugu, evaluated the homemade
solutions prepared by 40 illiterate mothers, after training them on how to
reconstitute SSS 53. They found that 60% of them made accurately composed
solutions. All the rest made hypertonic solutions. Salt type, spoon size, the number
of spoonfuls and leveling technique were all possible causes of their error. Nwoye
et al were able to identify nine different makes of metal teaspoons of varying
weights, sizes, and volumes commonly available in the local markets. The plastic

58
spoons were extremely variable, and were not used in the study. Mothers could
probably confuse the 5ml teaspoon for the recommended 3ml teaspoon. Quite
remarkably, not a single mother prepared a solution hypotonic or hyponatraemic.
The tendency to err only on the side of greater rather than lower salt concentration
may be culture based or simply due to maternal instinct.
In a survey carried out by the Federal Ministry of Health in 1989, it was
estimated that each child had 4.3 episodes of diarrhoea a year 54. Of those children
who had diarrhoea in the previous two weeks (16.7% of children surveyed), 35%
received SSS, 47% of caretakers interviewed did nothing for the treatment of
diarrhoea, and 18% sought non-SSS treatment. Twenty-seven percent of the cases
received an increased amount of fluid during the episode, while 64.5% got at least
the same amount of fluid as before the diarrhoea started. The review found that
progress had been made in implementing effective case management at health
facilities, but that there was a high degree of inappropriate use of drugs.
In a household survey done in Plateau state, in 1992, to find out how mothers
managed their children at home, the incidence of diarrhoea was 4.8 episodes per
child per year 54. Among the children who had diarrhoea in the preceding 24hours,
nearly all children had been given fluids while they had diarrhoea – Kunu was the
most common, followed by water, SSS and ORS. Salt sugar solution (SSS) was
given to 11.4% of the children with diarrhoea in the preceding 24hours. Almost half
of the mothers who said they had given their child SSS were able to prepare SSS
correctly in front of the interviewer. The most common mistakes were the use of too
little water or too much salt or both. The implication of these mistakes may be that
59
many mothers prepare SSS that is too concentrated in either sugar, or salt, or both.
ORS use rate was 1.5%, mainly on the advise of a doctor, health worker or drug
seller. Two-thirds of the caretakers who had used ORS solution in the previous
24hours were able to prepare it correctly. Four caretakers prepared it incorrectly;
two mothers used 600ml of water for 1 litre ORS sachets. Another mistake was not
using the whole packet of ORS and not making sure the powder was completely
dissolved. The average amount of SSS that had been given to children in the
previous 24hours was quite low, ranging from 50ml to 1200ml (average of 353ml in
24hours – a little more than 1½ tea cup). Only 21.9% of the children with diarrhoea
were given more fluids than they received before the diarrhoea began; 50.2% got
the same amount and 27.9% got less. Nearly all breast-fed children (98.1%)
continued to be breast-fed, and nearly all children (72.3%) being fed semi-solid or
solid foods continued to be given foods while they had diarrhoea. Drugs were given
to 75.1% of the children who had diarrhoea.
In a study in Enugu, 97% of mothers were aware of oral rehydration therapy
(ORT) and 80% had ever used salt sugar solution55. About 23% of the mothers
could not describe the correct reconstitution of SSS and only 28.4% would give
sufficient quantities of SSS to avert dehydration. Over a third of mothers practiced
withdrawal of certain foods and fluid restriction during diarrhoea. Among the
mothers who could not prepare SSS correctly, the common errors include low
quantities of sugar (34.9%), smaller measures of water (14.8%) and abnormally
high quantities of salt (50.3%). Awareness and use of ORT increased with age,
social class and level of education. Women in the lower social classes tended to

60
give inadequate quantities of SSS (perceiving it as a drug) compared to their
counterparts in the upper social classes. Educated mothers had a better
understanding of the management of childhood diarrhoea than their less educated
counterparts. Another revelation was that most of the mothers did not appreciate
the role of SSS in replacement of fluid lost during diarrhoea. SSS was perceived as
a drug and hence used sparingly. The implication of this practice are that firstly,
mothers get easily discouraged from using SSS and secondly, a lot more children
get severely dehydrated. It was believed by mothers that a lot of fluids in the diet
further increased the volume of diarrhoea and minimal food intake was believed to
help in reducing the burden of intestinal work, which in turn, reduced the frequency
of bowel motions.
In a study done at Odukpani, near Calabar, Nigeria, Edet found that the fluid
intake of under-five children with diarrhoea was low 56. The SSS use rate was
35.4%. The average amount of SSS given within the previous 24hours was 368ml
with a range between 40ml and 840ml. The ORS use rate was 49.2%. The average
amount of ORS given to children within the previous 24hours was 274ml with a
range between 59ml and 900ml. Less than half of the children continued
breastfeeding.
Community studies in other developing countries reflect a similar pattern.
Ahmed et al in their study in a Sudanese rural community found that ORS use rate
was very low (2.1 to 4.3%) 57. Although awareness about ORS was high (100%),
only 25% prepared and used it correctly. Also, they did not know how to administer
it. Forty-five percent of illiterate mothers stopped breastfeeding and other feeds

61
during diarrhoea compared to 30% of literate mothers. Educated mothers had a
better home-management of diarrhoea than their illiterate counterparts.
Household surveys in 35 developing countries in 1990-92 showed a low
ORS use rate ranging from 0.8% to 56%, while correct ORS preparation was less
than 30% in 7 countries (range 5.9 to 30%)57.
Barros et al in their study in North-East Brazil found that ORT was
administered to 25.8% of the 57 children (ORS-11.1%, SSS-14.7%)58. Although
95% of the caretakers knew about rehydration solutions, only 18% prepared them
correctly, the most common error being the use of insufficient water. Among ORS
users, 44% used less than 800ml of water for a packet that should have been
diluted in 1 litre of water. On average, the intake of ORS was 354ml in 24hours.
Children who were given a rehydration solution whose sodium concentration was
less than 120mmol/L ingested a significantly greater amount (average intake
301ml) than those who were offered solutions whose sodium concentration were
too high (average 218ml).
In India, 42.7% of mothers knew about ORS packets and 25.9% had ever
used them 59. ORS use rates in children who suffered from diarrhoea during
previous two weeks varied from 8.3% in Rajasthan to 50.1% in West Bengal.
Exposure to electronic mass media had a significant impact on mothers’ awareness
of ORS packets.
In another survey, 69% of the mothers interviewed were aware of oral
rehydration therapy, but only 66% among them had ever used it 60. Sixty percent of
doctors advised and prescribed ORS preparation not conforming to WHO
62
formulation, 44% of medical practitioners were not sure of the exact method of
dilution and preparation of the commercially available preparations. The study
recommended that ORS preparations not conforming to WHO formulation be
withdrawn from the market. The study revealed that there is more to be done
towards realizing the total success of oral rehydration therapy.
Overall, these studies have indicated that the programme (NPCDD and
CSDR) since its establishment has shown both success and failure in its efforts to
achieve its objective. More work still need to be done by all stakeholders and health
care providers towards realising the total success of the programmes.

63
CHAPTER THREE
MATERIALS AND METHODS
Location of the study
Jos is the capital of Plateau State. It is situated in the middle belt of Nigeria, which
occupies the geographical centre of the country. Jos is an urban town undergoing rapid
expansion and industrialization with an influx of people from all over the country in
search of jobs. The original inhabitants are Biroms and Jarawa, but with influx of more
people into the state, Jos now consists of all tribes in the country 61. The population of Jos
according to the 1991 population census was 622,87362.
The main occupation of the indigenous population is farming and mining of tin.
However, with urbanization and influx of people into the state, it has witnessed an
explosion of job opportunities, both professional, semi-skilled and unskilled. The town
is mostly unplanned and slums are found in some parts especially Angwar Rogo,
Nasarawa, Kabong and Tudun wada.
Jos town has the Jos university Teaching Hospital, the Plateau State
Specialist Hospital, ECWA (Evangel) Hospital, Our Lady of Apostles (OLA)
Hospital, and many private clinics and hospitals. It also has many functioning
primary health care centres located close to the reach of the people that serve their
health care needs.
The source of drinking water is mainly pipe borne water and well. The toilet
systems are water system, pit-latrine and surface.
Study area The study was carried out at the paediatric unit of the Plateau State Specialist Hospital,
Jos. The hospital is a state -owned General Hospital and was established in 1918 as a
hospital for European miners. It was later expanded to take care of senior government
officials before being turned into a General Hospital. It is still undergoing
modification, and has a bed capacity of 135 beds. It attends to patients in the low and
middle socio-economic class. It also serves as a referral centre for many primary and
secondary health institutions in and around Plateau State. In addition, it serves as a
centre for training of resident doctors in family medicine of the National Postgraduate
Medical College of Nigeria.
The paediatric unit has a diarrhoea treatment unit, a special care baby unit,
an emergency paediatric unit, a lying-in ward and a paediatric out-patient clinic.

64
Approval for the study was obtained from both the faculty of General Medical
Practice, National Postgraduate Medical College of Nigeria and the ethical
committee of the hospital (appendices I and II).
Study period: The study took place between June and November, 2003
Sample size: This was calculated from the prevalence rate of use of oral
Rehydration Therapy obtained from studies done within the Country63. The sample
size was calculated from the formula63:
N = P (1-P)z2
E2
Where P= Best estimate of use rate of ORT from previous studies (ie 44%).
Z= Constant from z table at 95% confidence level (ie 1.96)
E= Range of sampling error tolerated (5%)
Thus N= 0.44 X 0.56 X (1.96)2 = 378
(0.05)2
The minimum sample size needed was 378. A sample size of 400 was chosen to
compensate for possible missing data.
Study design
This is a descriptive prospective study, and involved all consecutive patients aged less
than five years who presented with diarrhoea at the time of the study. Diarrhoea was
defined as the passage of three or more loose or watery stools in 24 hours. Information
was obtained from both the mothers of the children and by physical examination of the
patients. The mothers were interviewed to know whether they were the suitable
candidates for inclusion in the study.
All patients who satisfied the inclusion criteria were recruited consecutively
over the period of study. This method was simple, cheap and avoided any bias. A

65
random selection of patients was not possible since the size of the population was
not large enough, the patients were relatively few in number and their list was not
available before the study.
Inclusion criteria: Mothers of children aged less than five years presenting
with diarrhoea at Plateau State Specialist Hospital, Jos during the period of study.
Exclusion criteria: (i) Mothers with children who had visited or consulted
another health care facility or health care professional on the index episode of
diarrhoea and had ORS or salt sugar solution (SSS) prescribed for them.
(ii) Mothers with children who were coming for a second or more consultation on
diarrhoeal disease at this hospital during the period of the study. Subjects were
recruited and interviewed only once on their first visit.
(iii) Children accompanied or brought by their fathers, house-helps or temporary
caretakers like grandmothers, neighbours, family friends or relations.
After due explanation of the purpose of the study, a written consent
(appendix III) was obtained from the mother of the child to be included in the study.
Each patient was seen and examined by the author at presentation. Most patients
were seen either at the out-patient clinic or the emergency paediatric unit.
Collection of data.
Data for this study was collected using a standardized format containing the
relevant information needed (appendix IV). The data included basic demography
of the child and mother, duration and nature of the diarrhoea, associated
symptoms, nutritional history during the illness and treatment history which included
drugs and special fluids like ORT given to the child. Physical examination was

66
conducted on the children to assess the state of dehydration and the nutritional
status.
Knowledge and use of ORT: In order to assess the mother’s knowledge of ORT
usage, each mother was asked to specify whether she used any form of ORT at
home during the index episode of diarrhoea before coming to the hospital. If she
had used any, she was asked to describe and demonstrate before the examiner
how she prepared it. She was also asked whether the child accepted the fluid when
she offered it, and if accepted, she was asked to estimate how much quantity of the
fluid she gave the child in 24 hours. This was estimated by calculating how many
teaspoonful (3ml, 5ml), tablespoonful (10ml), teacupful (200ml), soft drink bottle
(25cl, 29cl, 35cl, 50cl) or beer bottle (60cl) of the fluid and the frequency of
administration in a day. Each of the mothers, whether she had used ORT or not,
was asked whether she knew how to prepare salt-sugar solution (SSS). If she
answered yes, she was asked to describe and demonstrate it before the examiner.
Several sizes of the metal teaspoons (3ml, 5ml), tablespoon, Fanta and Coca-cola
bottles (25cl, 35cl, 50cl, 1litre), Pepsi and 7up bottles 30cl each and beer bottle
(60cl) were made available. Also a bowl, salt and sugar (granulated and cubes),
plain water and funnel were made available.
The original Fanta and Coca-cola bottles (29cl) which were in use at the
inception of the ORT programme have been withdrawn from circulation, and in it’s
place, 25cl and 35cl bottles are being produced. As a result of this confusion,
correct preparation of SSS was recorded if the mother mixed one level teaspoon

67
(3ml) salt plus 10 level teaspoon (30ml) of sugar (or five cubes) with any two of
these soft drink bottles (25cl, 29cl 30cl, 35cl) or one beer bottle (60cl) of water. The
range of the volume of water allowed was 500 to 700ml. Correct preparation of the
ORS was recorded if the mother mixed the standard ORS with one liter of water.
The mothers were further asked if they knew the work of the ORT in the child’s
body.
Figure 3.1
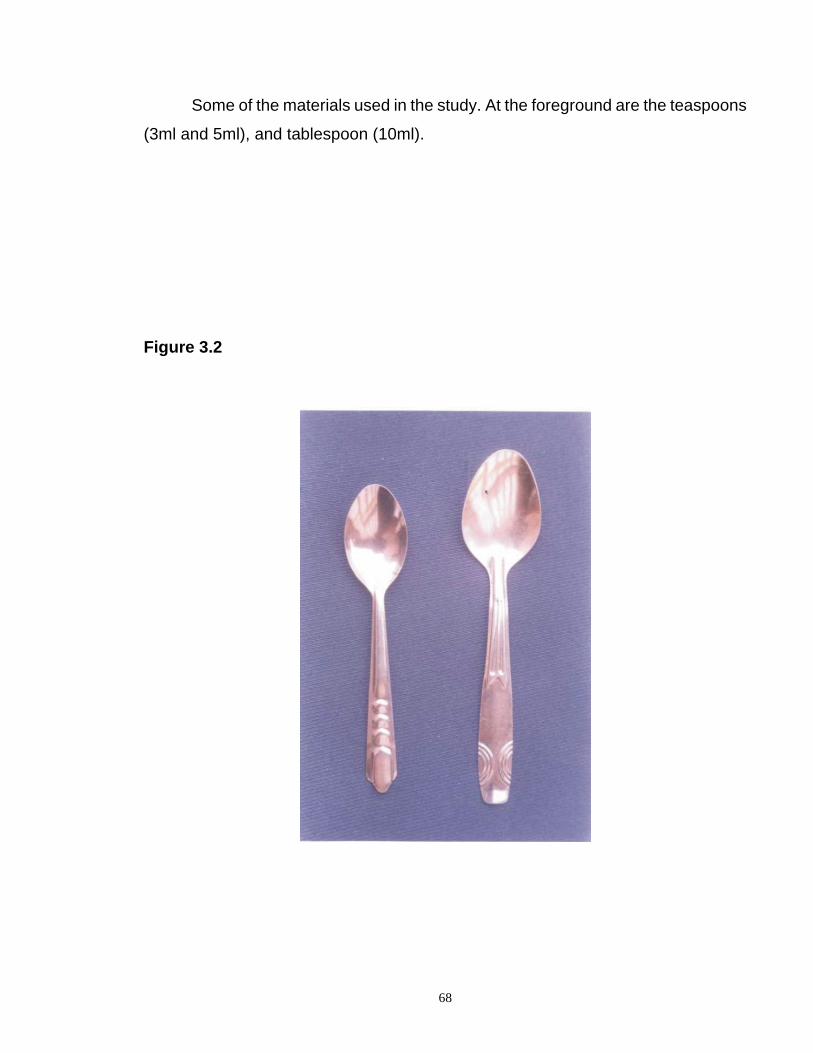
68
Some of the materials used in the study. At the foreground are the teaspoons
(3ml and 5ml), and tablespoon (10ml).
Figure 3.2

69
The 3ml and 5ml metal teaspoons available in most Nigeria homes. The 3ml
teaspoon is the recommended one for use in e reconstitution of salt sugar solution.
Physical examination was conducted on the child to determine the level of
dehydration. This was assessed using the information contained on table 2.3.
Nutritional status of the child was determined from the height and weight
measurements.
The height was taken with a stadiometre positioned against a wall on a flat
surface. The patient stood erect with the back against it, looking straight, with both
feet brought close together and to the wall, without any cap, head tie, shoes or
slippers. The height was measured to the nearest centimeter. For the infant who
could not stand, the length was measured with a measuring stick positioned on a
table, the child lay supine against it, looking straight, the legs brought close together
and straightened.
Patients were weighed in kilogrammes using the infant weighing scale (RGZ-
20) which had a capacity for 20kg. Patients were weighed wearing light clothing
without shoes or slippers.
Nutritional status
Nutritional status was determined using the modified Wellcome classification64.
This was based on the ratio of the weight of the patient to the expected weight for
age expressed as percentages. The expected weight for age was determined from
the formula 65:
(1) N + 9, where N = age of the child in months 2

70
(2) 2n + 8, where n = age of the child in years.
The modified Wellcome classification is classified as wellnourished, under
nutrition, Kwashiokor, Marasmus and Marasmic Kwashiokor depending on the ratio
of the real weight to the expected weight for age (EWA) expressed as percentages,
and the presence of oedema.
Table 3.1: The modified Wellcome classification64.
Well-nourished Under nourished Kwashiokor Marasmus Marasmic Kwashiokor
> 80% EWA 60-80% 60-80% <60% <60%
No pedal oedema
No pedal oedema Pedal oedema present
No pedal oedema
Pedal oedema
present
Nutritional status was also assessed using the WHO weight for age Z score and
weight for height Z score. Z-score of less than – 2SD was regarded as malnutrition, while
Z-score less than -3SD was regarded as severe malnutrition.
Therapy
At the end of the interview, each mother was instructed on the role or value of ORT
in the management of diarrhoea, the correct preparation of both SSS and ORS,
and the proper way of administration of the fluid. Salt-sugar solution was
encouraged to be used at home by the mothers at the onset of diarrhoea, because
the materials are readily available in any home (including rural areas), at any time
of the day or night, and it is not costly. In contrast, ORS could only be obtained at
a cost from the chemist shop or health care facility mainly in urban areas. According
to the National Programme on Control of Diarrhoeal Disease, ORS is designed to
be used in the health care facilities for the treatment of some dehydration due to
diarrhoea, and also for maintenance of hydration (after rehydration).

71
Statistical method: Data were analysed using the computer EPI-INFO version 6.0 statistical
programme65. Chi-square (x2) test was used to determine the significance of difference
between the means.

72
CHAPTER FOUR RESULTS
4.1 Characteristic of the subjects in the study
A total of 400 children with diarrhoea were seen, examined, and their
mothers were interviewed.
Table 4.1: Age distribution of the mothers
Age (years) Frequency (N=400) Percentage
< 20 4 1.00
20-24 88 22.00
25-29 146 36.50
30-34 100 25.00
35-39 40 10.00
40-44 19 4.75
45-49 3 0.75
Mothers in the age range of 20 to 35 years constituted the majority of the respondents.
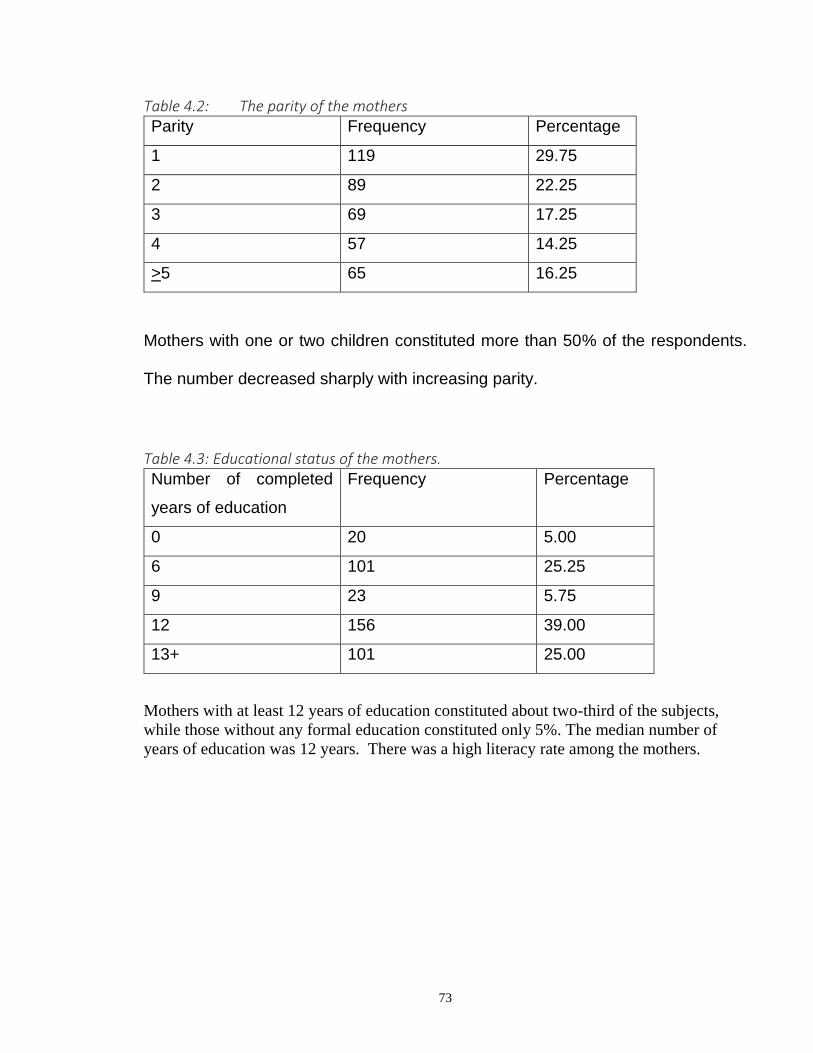
73
Table 4.2: The parity of the mothers Parity Frequency Percentage
1 119 29.75
2 89 22.25
3 69 17.25
4 57 14.25
>5 65 16.25
Mothers with one or two children constituted more than 50% of the respondents.
The number decreased sharply with increasing parity.
Table 4.3: Educational status of the mothers. Number of completed
years of education
Frequency Percentage
0 20 5.00
6 101 25.25
9 23 5.75
12 156 39.00
13+ 101 25.00
Mothers with at least 12 years of education constituted about two-third of the subjects,
while those without any formal education constituted only 5%. The median number of
years of education was 12 years. There was a high literacy rate among the mothers.

74
4.2 Characteristics of the children with diarrhoeal disease
Table 4.4: Age distribution of the patients.
Age group (months) Male
(N=230)
Female
(N=170)
Total Percentage
<12 130 93 233 55.75
12-23 74 58 132 33.00
24-35 14 13 27 6.75
36-47 8 5 13 3.25
48-59 4 1 5 1.25
The children who were less than 2 years old constituted about 90% of the patients.
The incidence of diarrhoea decreased sharply after this age. Males constituted
57.5% while females were 42.5%, giving a male to female ratio of 1.4:1. The mean
ages of the males and females were both 12.5 months. There was no significant
difference between the two sexes (Chi-square=0.7; P=0.3).
Table 4.5: Duration of the diarrhoea at presentation Duration (days) Frequency Percentage
≤1 14 3.50
2 119 29.75
3 104 26.00
4 60 15.00
5-7 69 17.00
8-13 8 2.00
>14 26 6.50

75
About 50% of the patients presented by the 3rd day of the illness. The number
decreased after this day. The mean and median duration at presentation were 4
days and 3 days respectively. About 93% presented with acute diarrhoea (duration
< 14 days), while 6.5% presented with persistent diarrhoea (duration > 14 days).
A total of 375 (93.8%) of the patients presented with non-bloody diarrhoea, while 25
(6.2%) presented with bloody diarrhoea. There was no association between age and
development of persistent diarrhoea (Chi-square=3.4; P=0.9). There was also no
association between age and development of bloody diarrhoea (Chi-square=11.6;
P=0.2).
A total of 84(21%) of the patients presented with diarrhoea alone, 76 (19%)
had associated vomiting, 88 (22%) had associated fever, while 152 (38%) had both
vomiting and fever.
4.3 Degree of dehydration
A total of 150 (37.5%) of the patients presented with some dehydration, 13
(3.3%) had severe dehydration and 237 (59.3%) had no dehydration.
Table 4.6: Degree of dehydration in relation to age
Age group (months) None (%)
N=237
Some (%)
N=150
Severe (%)
N=13
Total
<12 128 (57.0) 86 (39.0) 9 (4.0) 228
12-23 81 (61.4) 48 (36.4) 3 (2.3) 132
24-35 16 (59.3) 11 (40.7) 0 (0) 27
36-47 8 (61.5) 4 (30.8) 1 (7.7) 13
48-59 4 (80.0) 1 (20.0) 0 (0) 5
Just like the incidence of diarrhoea, most of the cases of some and severe
dehydration were seen in the age group 6 to 23 months. The mean ages of the
patients with none, some and severe dehydration were 12 months, 12 months and
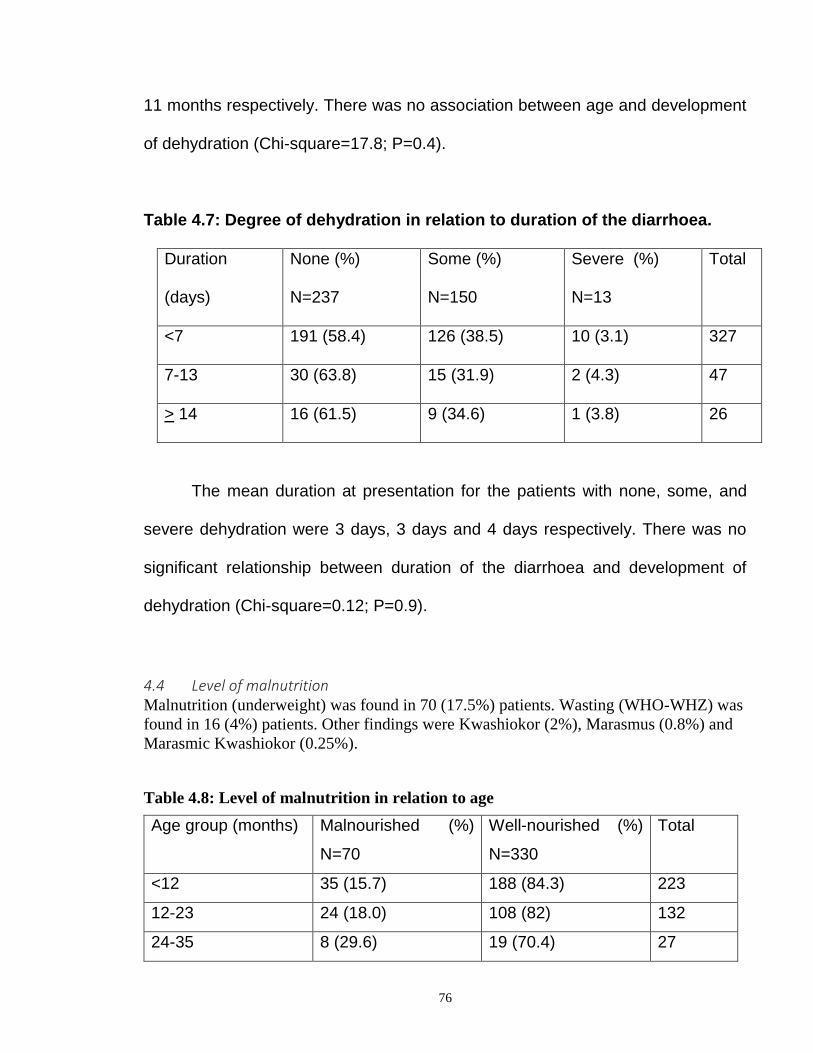
76
11 months respectively. There was no association between age and development
of dehydration (Chi-square=17.8; P=0.4).
Table 4.7: Degree of dehydration in relation to duration of the diarrhoea.
Duration
(days)
None (%)
N=237
Some (%)
N=150
Severe (%)
N=13
Total
<7 191 (58.4) 126 (38.5) 10 (3.1) 327
7-13 30 (63.8) 15 (31.9) 2 (4.3) 47
> 14 16 (61.5) 9 (34.6) 1 (3.8) 26
The mean duration at presentation for the patients with none, some, and
severe dehydration were 3 days, 3 days and 4 days respectively. There was no
significant relationship between duration of the diarrhoea and development of
dehydration (Chi-square=0.12; P=0.9).
4.4 Level of malnutrition Malnutrition (underweight) was found in 70 (17.5%) patients. Wasting (WHO-WHZ) was
found in 16 (4%) patients. Other findings were Kwashiokor (2%), Marasmus (0.8%) and
Marasmic Kwashiokor (0.25%).
Table 4.8: Level of malnutrition in relation to age
Age group (months) Malnourished (%)
N=70
Well-nourished (%)
N=330
Total
<12 35 (15.7) 188 (84.3) 223
12-23 24 (18.0) 108 (82) 132
24-35 8 (29.6) 19 (70.4) 27

77
36-47 2 (15.4) 11 (84.6) 13
48-59 1(20.0) 4 (80.0) 5
Most of the malnourished patients (84%) were below two years of age. Their mean
age was 12 months. There was no significant association between age and malnutrition
(Chi-square=12.4; P=0.2)
Table 4.9: Malnutrition in relation to duration of the diarrhoea.
Duration (days) Malnourished (%)
N=70
Well-nourished (%)
N=330
Total (400)
<7 57 (17.4) 270 (82.6) 327
7-13 8(17.0) 39 (8.3) 47
> 14 5(19.2) 21(80.8) 26
The median duration at presentation of the malnourished patients was 4 days.
There was no significant association between the duration of the diarrhoea and
development of malnutrition (Chi-square=0.08; P=0.9).
Table 4.10: Malnutrition in relation to the degree of dehydration
Dehydration Malnourished (%)
N=70
Well-nourished (%)
N=330
Total
N=400
None 38 (16) 199 (84) 237
Some 29 (29) 121 (71) 150
Severe 3 (23) 10 (77) 13

78
There was no significant association between malnutrition and development of
dehydration (Chi-square=10; P=0.8).
Feeding during diarrhoea: All the mothers (400) continued giving the child’s
normal feeds during the period of the diarrhoea.
4.5 Usage of oral rehydration therapy
A total of 156 (39%) mothers gave oral rehydration therapy (ORT) to their children
that had diarrhoea, before coming to the hospital. Of these, 136 (34%) gave oral
rehydration salt (ORS) solution, while 20 (5%) gave salt sugar solution (SSS).
Mothers used ORS more often than salt sugar solution (Chi-square=5.9; P = 0.01).

79
Table 4.11: Usage of ORT in relation to age of the child.
Age group Used ORT (ORS + SSS)
N=156 (%)
Non-use (%)
N=244
Total
<12 87 (39.0) 136 (61.0) 223
12-23 52 (39.4) 80 (60.6) 132
24-35 13 (48.0) 14 (30.8) 27
36-47 3 (30.8) 10 (69.2) 13
48-59 1 (20.0) 4 (80.0) 5
The mean ages of those that were given ORT and those not given were both 12
months. There was no significant relationship between use of ORT and age of the
child (Chi-square=1.7; P=0.4).
Table 4.12: Usage of ORT in relation to degree of dehydration Dehydration Used ORT (ORS, SSS)
N=150
Percent Non-use
N=244
Percent Total
400
None 81 34.2 15.6 65.8 237
Some 65 43.3 85 56.7 150
Severe 10 76.9 3 23.1 13
There was a significant association between the use of ORT and dehydration
(Chi-square=24.8; P< 0.01). Oral rehydration therapy was given more

80
frequently to those with some and severe dehydration than those with no
dehydration.
Table 4.13: Usage of ORT in relation to mothers’ educational status Education
(years)
Used ORT Percent Non-use Percent Total
0 5 25.0 15 75.0 20
6 42 41.6 59 58.4 101
9 4 18.2 18 81.8 22
12 58 37.2 98 62.8 156
13+ 47 46.5 54 53.5 101
The median years of education of those that used ORT and those that did
not use were both 12 years. There was no significant association between use of
ORT and mothers’ educational status (Chi-square=15.8; P=0.1).
Mothers used ORS (34%) significantly more than SSS (5%) (Chi-
square=5.9; P=0.01). The reasons they gave for preferring ORS to SSS were:
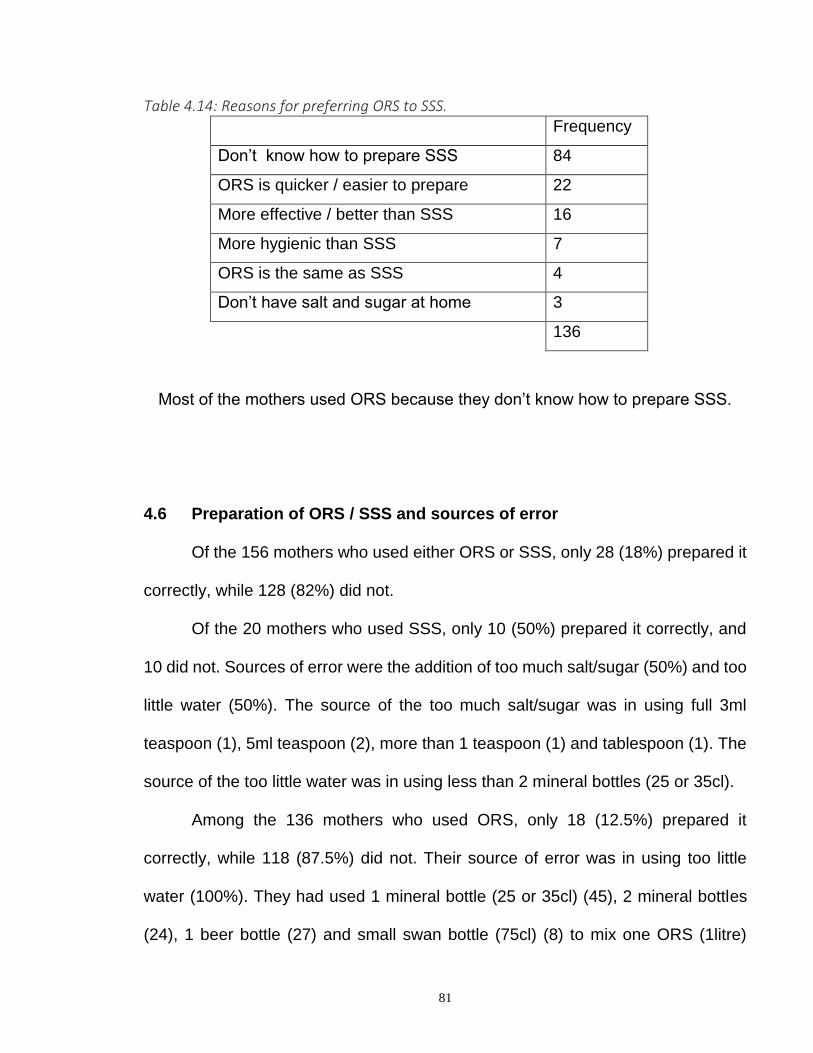
81
Table 4.14: Reasons for preferring ORS to SSS. Frequency
Don’t know how to prepare SSS 84
ORS is quicker / easier to prepare 22
More effective / better than SSS 16
More hygienic than SSS 7
ORS is the same as SSS 4
Don’t have salt and sugar at home 3
136
Most of the mothers used ORS because they don’t know how to prepare SSS.
4.6 Preparation of ORS / SSS and sources of error
Of the 156 mothers who used either ORS or SSS, only 28 (18%) prepared it
correctly, while 128 (82%) did not.
Of the 20 mothers who used SSS, only 10 (50%) prepared it correctly, and
10 did not. Sources of error were the addition of too much salt/sugar (50%) and too
little water (50%). The source of the too much salt/sugar was in using full 3ml
teaspoon (1), 5ml teaspoon (2), more than 1 teaspoon (1) and tablespoon (1). The
source of the too little water was in using less than 2 mineral bottles (25 or 35cl).
Among the 136 mothers who used ORS, only 18 (12.5%) prepared it
correctly, while 118 (87.5%) did not. Their source of error was in using too little
water (100%). They had used 1 mineral bottle (25 or 35cl) (45), 2 mineral bottles
(24), 1 beer bottle (27) and small swan bottle (75cl) (8) to mix one ORS (1litre)

82
sachet. Other sources of error was in using ½ ORS to mix 1 mineral bottle, 2 mineral
bottles, 1 beer bottle or ¾ small swan bottle. No mother used too much water.
Table 4.15: Correct preparation of ORT in relation to mothers’ educational
status.
Education (years) Correctly prepared
(N=28)
Incorrectly prepared
(N=128)
Total
(156)
0 2 3 5
6 3 36 39
9 0 4 4
12 10 46 56
13+ 13 39 52
The median years of education of the mothers who prepared ORT correctly and
those that did not were both 12 years. There was no significant relationship
between the ability to prepare ORS/SSS correctly and mothers’ educational status
(Chi-square=10.7; P=0.1).
4.7 Acceptance rate of ORT Of all the ORT (156) prepared and given, 73% (114) were accepted by the
children, while 27% (42) were not accepted.
Among the correctly prepared ORT, 100% (10) of the SSS were accepted,
while 66.7% (12) of the ORS were accepted by the children, giving an average rate
of 78%.
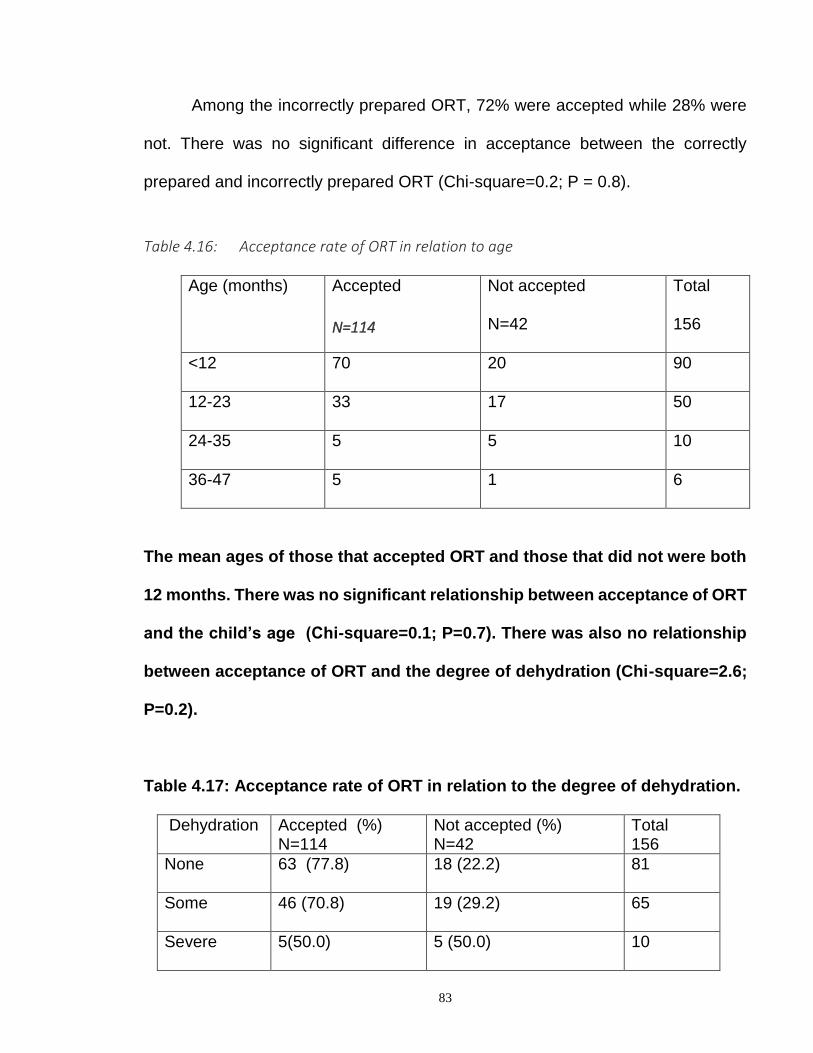
83
Among the incorrectly prepared ORT, 72% were accepted while 28% were
not. There was no significant difference in acceptance between the correctly
prepared and incorrectly prepared ORT (Chi-square=0.2; P = 0.8).
Table 4.16: Acceptance rate of ORT in relation to age
Age (months) Accepted
N=114
Not accepted
N=42
Total
156
<12 70 20 90
12-23 33 17 50
24-35 5 5 10
36-47 5 1 6
The mean ages of those that accepted ORT and those that did not were both
12 months. There was no significant relationship between acceptance of ORT
and the child’s age (Chi-square=0.1; P=0.7). There was also no relationship
between acceptance of ORT and the degree of dehydration (Chi-square=2.6;
P=0.2).
Table 4.17: Acceptance rate of ORT in relation to the degree of dehydration.
Dehydration Accepted (%) N=114
Not accepted (%) N=42
Total 156
None 63 (77.8) 18 (22.2) 81
Some 46 (70.8) 19 (29.2) 65
Severe 5(50.0) 5 (50.0) 10

84
4.8 Administrative skill of the mothers who used ORT
Table 4.18: Amount of fluid administered in 24 hours Quantity in ml Correctly prepared
N=28
Incorrectly prepared
N=97
Total
125
< 100 6 21 27
100-150 12 38 50
251-500 1 15 16
501-1000 7 21 28
> 1000 2 2 4
The range of the volume of fluid administered was 20ml to 4.5litres. The average
volume was 324ml. Among the correctly prepared ORT, the range of the volume of
fluid was 45ml to 4.5 litres. The average amount was 600ml. Among the incorrectly
prepared ORT, the range was 20ml to 2 litres. The average amount given in 24
hours was 300ml. The children received the correctly prepared ORT more than the
incorrectly prepared one (Chi-square=8.6; P<0.01).
Table 4.19: Mean volume of ORT in relation to mothers’ education.
Education (years) Frequency Mean volume of fluid (ml)
0 4 105
6 33 450
9 4 267
12 46 229
13+ 38 359
There was no significant association between the mean volume of ORT given in 24 hours
and mothers’ educational status (Chi-square=7.6; P = 0.1)

85
Table 4.20: Mean volume of ORT in relation to age of the child Age group Frequency Mean volume (ml)
<12 76 262
11-23 38 350
24-35 8 320
36-37 3 470
There was no significant association between the age of the child and mean volume
of ORT given in 24hours (Chi-square=4.6; P=0.2).
Table 4.21: Mean volume of ORT in relation to degree of dehydration
Dehydration Frequency Mean volume (ml)
None 67 271
Some 50 298
Severe 8 927
There was no significant relationship between the degree of dehydration and the mean volume of ORT (Chi-square=4.5; P=0.1).
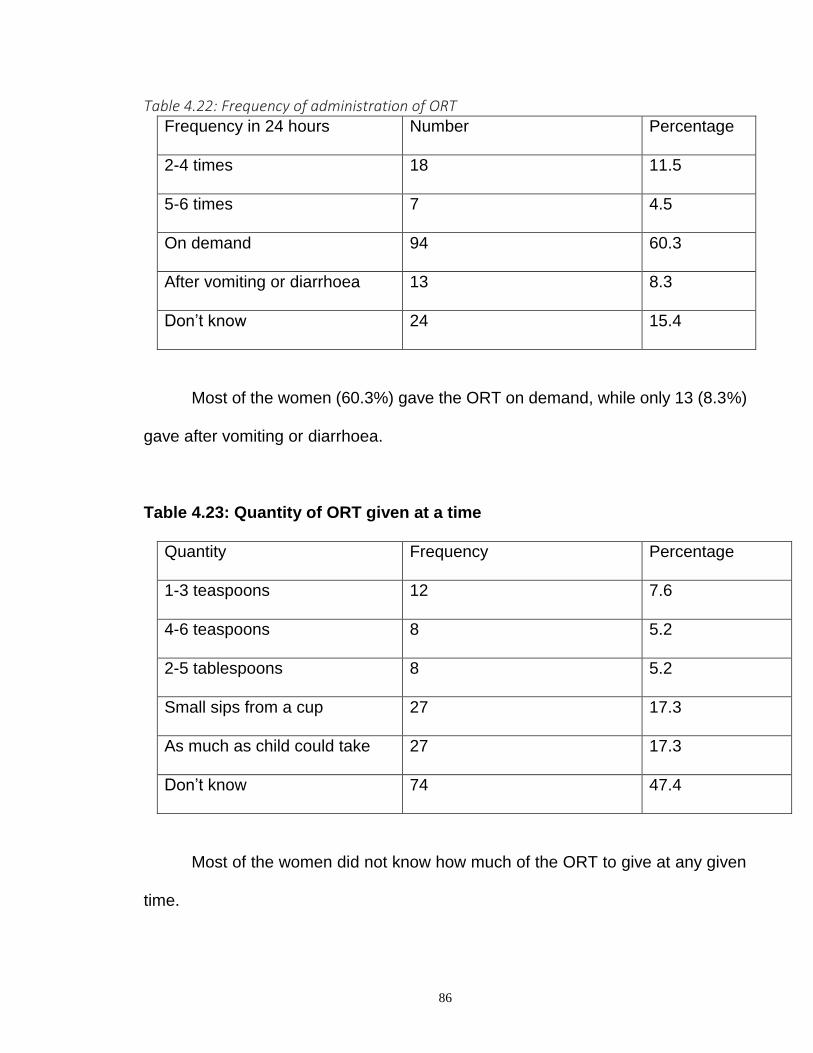
86
Table 4.22: Frequency of administration of ORT Frequency in 24 hours Number Percentage
2-4 times 18 11.5
5-6 times 7 4.5
On demand 94 60.3
After vomiting or diarrhoea 13 8.3
Don’t know 24 15.4
Most of the women (60.3%) gave the ORT on demand, while only 13 (8.3%)
gave after vomiting or diarrhoea.
Table 4.23: Quantity of ORT given at a time
Quantity Frequency Percentage
1-3 teaspoons 12 7.6
4-6 teaspoons 8 5.2
2-5 tablespoons 8 5.2
Small sips from a cup 27 17.3
As much as child could take 27 17.3
Don’t know 74 47.4
Most of the women did not know how much of the ORT to give at any given
time.
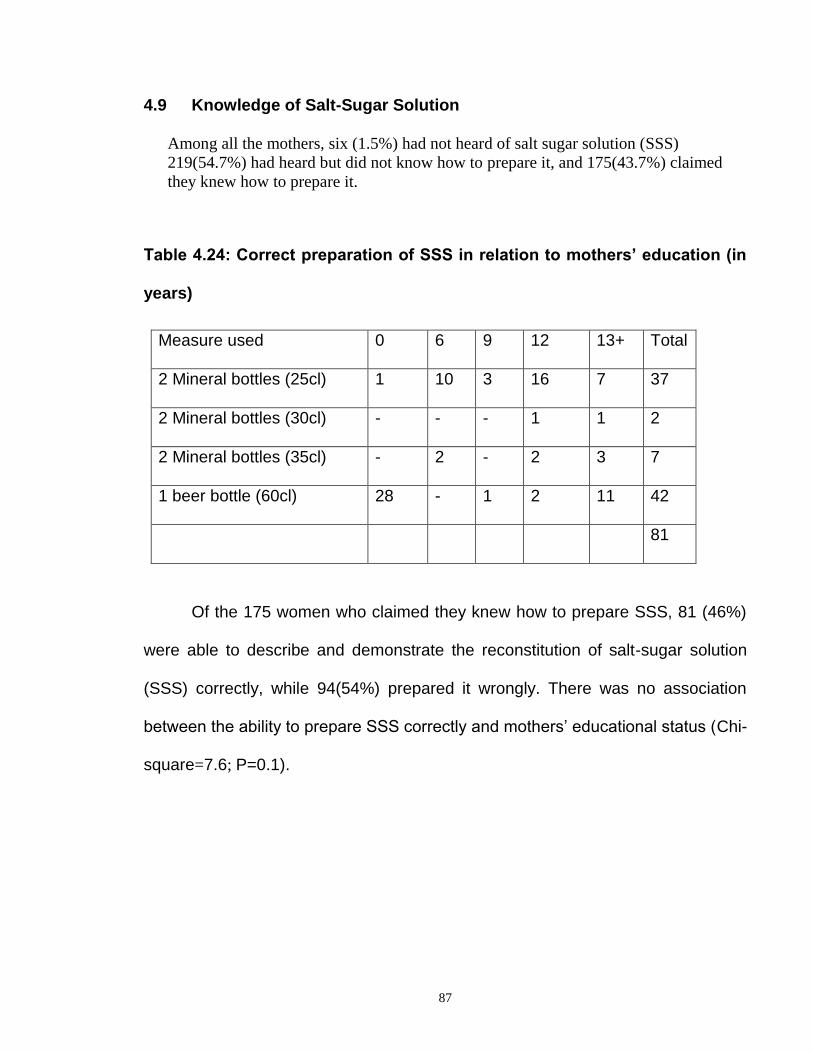
87
4.9 Knowledge of Salt-Sugar Solution
Among all the mothers, six (1.5%) had not heard of salt sugar solution (SSS)
219(54.7%) had heard but did not know how to prepare it, and 175(43.7%) claimed
they knew how to prepare it.
Table 4.24: Correct preparation of SSS in relation to mothers’ education (in
years)
Measure used 0 6 9 12 13+ Total
2 Mineral bottles (25cl) 1 10 3 16 7 37
2 Mineral bottles (30cl) - - - 1 1 2
2 Mineral bottles (35cl) - 2 - 2 3 7
1 beer bottle (60cl) 28 - 1 2 11 42
81
Of the 175 women who claimed they knew how to prepare SSS, 81 (46%)
were able to describe and demonstrate the reconstitution of salt-sugar solution
(SSS) correctly, while 94(54%) prepared it wrongly. There was no association
between the ability to prepare SSS correctly and mothers’ educational status (Chi-
square=7.6; P=0.1).
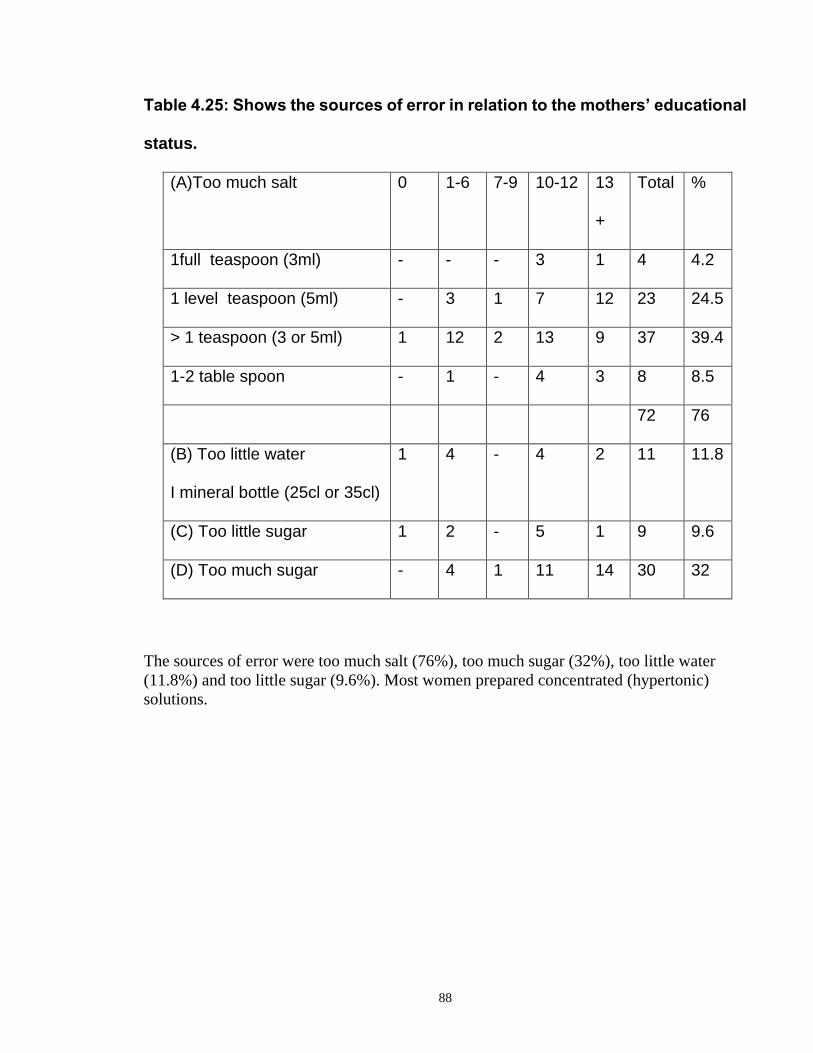
88
Table 4.25: Shows the sources of error in relation to the mothers’ educational
status.
(A)Too much salt 0 1-6 7-9 10-12 13
+
Total %
1full teaspoon (3ml) - - - 3 1 4 4.2
1 level teaspoon (5ml) - 3 1 7 12 23 24.5
> 1 teaspoon (3 or 5ml) 1 12 2 13 9 37 39.4
1-2 table spoon - 1 - 4 3 8 8.5
72 76
(B) Too little water
I mineral bottle (25cl or 35cl)
1 4 - 4 2 11 11.8
(C) Too little sugar 1 2 - 5 1 9 9.6
(D) Too much sugar - 4 1 11 14 30 32
The sources of error were too much salt (76%), too much sugar (32%), too little water
(11.8%) and too little sugar (9.6%). Most women prepared concentrated (hypertonic)
solutions.

89
Table 4.26: Knowledge of the work of ORT Frequency Percentage
Replaces lost fluid/salt 112 28
Gives strength 112 28
Cures diarrhoea 60 15
Don’t know 116 29
Only 28% knew that ORT replaces lost fluid and salt. There was no association
between the knowledge of the work of ORT and mothers’ educational status (Chi-
square=8.1; P=0.08).

90
CHAPTER FIVE
DISCUSSION
In this study mothers with at least 12 years of education constituted about 64% of
the respondents while those without any formal education constituted only 5%. There
was a high literacy rate among the mothers. The implication is that it reflects the general
trend in the whole Jos Town or that only the literate group sought orthodox medical care
for their children that had diarrhoea. This is in keeping with the observation of Barros et
al in their study which found that children under one year of age and those whose
mothers were more literate were frequently taken for health care for their diarrhoea 58.
However, in a study at Ilorin, it was found that children of mothers with secondary
education had a significantly higher risk of diarrhoea when compared with children of
illiterates66. This may be related to the fact that bottle feeding and infant formula feeding
were significantly more common in children of mothers with secondary education than
children of mothers with no education.
Mothers who were less than 20 years old constituted only 1% of the respondents,
while those in the age group 20 to 29 years constituted about 59%. Most of the mothers
had to wait until they were 20 years old and above before having their first issue. This
may be related to the fact that most of them had 12 or more years of education.
The highest number of children with diarrhoeal disease was seen in the age group
6 to 12 months accounting for 41% of all cases. Together with those in the age group of
12 to 18 months they made up about two third of all the patients. This is in keeping with
the findings from previous studies, where the highest prevalence of diarrhoea was found
in the second six months of life18,20. Snyder and Merson showed that the highest
incidence of diarrhoeal disease was during the second half of infancy. Similarly, Black
found that the prevalence of diarrhoea was highest during the second six months of life
and declined with increasing age thereafter18,20. This high incidence of diarrhoea after
weaning is initiated, is related to the decline in breast-feeding, poor weaning foods, and
the popularity of bottle-feeding among mothers.
About 7% of the patients presented with persistent diarrhoea. Sixty five percent
(65%) of these were below the age of 18 months. The peak age of persistent diarrhoea in
this study was nine months. This is consistent with the findings from other developing
countries, where the proportion of episodes lasting longer than 14days ranged from 3% to
23%, with a median value of about 10% 67. In Nairobi, Kenya, 5.4% children presented
with diarrhoea of more than 14 days duration67. About 63% of these were less than 12
months old. The peak age for persistent diarrhoea was nine months with no sex
difference.
Malnutrition was found in 17.5% of the patients that presented with diarrhoea in
this study. Seventy five percent of the cases of malnutrition were found in those aged
6months to 2 years. This is similar to the result from other studies 41. In Nairobi, 18.5%
of the children with diarrhoea had malnutrition67. Most of these were less than 2 years
old. In this study, malnutrition was not significantly associated with persistent diarrhoea
compared with the observations from other studies which found malnutrition as a risk
factor for persistent diarrhoea and vice versa 67-69. Manunebo et al in a study in rural
91
Zaire demonstrated a higher incidence of diarrhoea among malnourished children68.
Mahalanabis et al in their study in Bangladesh showed that protein-energy malnutrition
was a risk factor for increased duration of acute diarrhoea and persistent diarrhoea69. The
duration and severity of diarrhoeal illness were greatest among infants and young
children with malnutrition and impaired immune status.
About 60% of the patients presented with no dehydration, 37% had some
dehydration, while 3.3% had severe dehydration with signs of shock requiring an initial
intravenous fluid therapy. In the study at Enugu, severe dehydration was found in 5.2%,
while in Nairobi, Kenya, severe dehydration was present in 12.5% 20,67. In Gondar,
Ethiopia, 38.1% of the children presented with no dehydration, 61.3% had some
dehydration, while 0.6% had severe dehydration41. The majority of the children in this
study presented with no dehydration. This suggests that (1) the disease was not severe,
(2) the mothers being literate tended to seek early treatment for their children with
diarrhoea and (3) most of the mothers had continued breast feeding and other feeds, and
had given their children increased fluids during the diarrhoea. Data reported from health
facilities in 14 countries have shown a median decrease in admission rate and a three-fold
reduction in the percentage of diarrhoea cases receiving intravenous fluids when ORT
was introduced 1,4.
In this study, there was no association between the duration of diarrhoea,
malnutrition and development of dehydration. In Gondar, Ethiopia, malnourished
children had a 4 fold higher risk of developing dehydration than well-nourished children 41. Children who were malnourished had more episodes of dehydration particularly
moderate and severe forms. The presence of antecedent malnutrition was a predictor of
moderate to severe dehydration in acute diarrhoeal disease in Ethiopia 41,70. Also, in this
study, one hundred percent (100%) of the mothers continued breast feeding and other
feeds during the period of diarrhoea. Similarly, in a previous study in Plateau State and
Suleja, nearly all the mothers continued breast-feeding and other feeds during the
diarrhoea 52,54. However, in a Sudanese rural community, 45% of illiterate mothers
stopped breast feeding and other feeds during diarrhoea compared to 30% of literate
mothers 57. Educated mothers had a better attitude and understanding of the management
of diarrhoeal disease at home.
The use rate of oral rehydration therapy in this study was 39%, those who used
ORS was 34%, and SSS was 5%. The majority of the mothers used ORS instead of the
traditional SSS. This is in contrast to the result obtained from rural communities where
the majority of the mothers used SSS. In Suleja, Nigeria, the use rate of SSS was 43.5% 52. In a rural community near Zaria, the use rate of ORT was 37%, SSS was 23%, while
ORS was 14%50. In a household survey in Plateau State, the use rate of SSS was 11.4%,
while ORS was 1.5% 54. The reasons given by the mothers for preferring ORS to SSS in
this study were (i) they were not sure how to prepare SSS (ii) ORS was quicker to get
and prepare (iii) ORS was more hygienic and effective than SSS. However, the
underlying reason could be that since these mothers were mostly literate and resided in
the city, they could easily afford to procure ORS from the so many chemist shops located
close to their reach, unlike in rural areas where the mothers are mostly illiterate and poor
and the ORS are not easily accessible. Although the present study was selective in that it
focused on those who made use of the health care facility for their children that had

92
diarrhoea. There were probably more mothers who did not come to the hospital, and did
not do anything for the diarrhoea or treated with native medications. In a study in Suleja,
52% of the mothers had used health facilities, while 32% did nothing for their diarrhoea 52. In Plateau State, 47% of the caretakers did nothing for the treatment of diarrhoea, and
18% sought non-SSS treatment 54.
Among mothers (20) who used SSS, 10 (50%) prepared it correctly, 5 (25%)
added too much salt/sugar, while 5 (25%) added too little water. This is similar to the
findings obtained from Plateau State and Suleja where about half and 45.3% respectively
of the mothers who had used SSS at home prepared it wrongly 52,54. Their main source of
error was the addition of too much salt or too little water. This resulted from the use of
5ml teaspoon and tablespoon instead of the recommended 3ml teaspoon. There was a
confusion among the mothers on the exact size of spoon to use as there are several sizes
of teaspoons available in the market. Among the mothers who used ORS, only 18 (14%)
prepared it correctly, the rest added too little water. Most of them mistook the standard
ORS as being the same as SSS in preparation and had used between 250mls and 750mls
of water for its preparation. In a Sudanese rural community, only 25% prepared and used
ORS correctly 57. In North-east Brazil, among ORS users, 44% used less than 800ml for a
sachet that should have been diluted in one litre of water 58. Clearly, confusion had arisen
among the public because the initial ORS of 600ml had been withdrawn, and in its place
the standard ORS requiring one litre of water for its preparation has been introduced to
the market.
The average volume of the correctly prepared ORT and incorrectly prepared ORT
given in 24hours were 600ml and 300ml respectively. The average volume of all the
prepared ORT administered to the children in 24 hours was 324ml. The volume given
was inadequate compared to the WHO recommendation of ORS 110ml/kg body
weight/day 41. This is generally true for most developing countries. The volume of ORT
given is too little to have any effect on the dehydration caused by diarrhoea. The children
in this study received more of the correctly prepared ORT than the incorrectly prepared
ORT. This is also true in most studies52,58. In Odukpani, southeastern Nigeria, the average
amount of fluid given to children was 368ml for SSS and 274ml for ORS 56. In a
previous study in Plateau State, the average amount of SSS fluid given in 24hours was
quite low, ranging from 50ml to 1200ml (the average intake of SSS was 353ml in
24hours) 54. In Northeast Brazil, on average the intake of ORS was 354ml over 24hours 58. Children who were given a hydration solution whose sodium concentration was less
than 120mmol/L ingested a significantly greater amount (average intake 301ml) than
those who were offered solutions whose sodium concentration were too high (average
218ml). Children who were offered over concentrated solutions drank significantly less
volume than children who were given mixtures with the correct sodium content. This
diminishes the risk of hypernatraemia among children taking rehydrating solutions with
too high sodium content, and could be one explanation as to why there have been few
report of an increased incidence of hypernatraemia in countries where ORT programmes
have been established, despite the documented evidence of problems in making up the
solution 58.
In this study, most of the mothers did not know when to give or how much of the
fluid to give at any given time. Only few gave the fluid after vomiting or diarrhoea. The
93
implications were that (i) too little of the fluid are bound to be given, and this will not
have any effect on the dehydration caused by the diarrhoea (ii) Too much of the fluid can
be given to the child who accepted, and since most of the solution prepared are
hypertonic, there is real danger of both circulatory overload and electrolyte imbalance.
One of the mothers gave a child 4.5litres of correctly prepared solution in 24hours. Two
mothers gave 1.5litre and 2litres respectively of a hypertonic solution to their children in
24hours. These findings are similar to those obtained from other developing countries 52,58. In Suleja, 43.5% women gave SSS at home, 18.5% gave correctly prepared SSS,
while 11.7% gave the correctly prepared SSS in adequate quantity. Most children (48%)
received SSS 6 to 9 times in 24hours and were given 1 to 9 teaspoons of it each time.
Among the 175 mothers who claimed they knew how to prepare salt-sugar
solution, only 81 (46%) could actually prepare it, while 94 (54%) could not. Sources of
error were the addition of too much salt (76%), too much sugar (32%), too little sugar
(9%) and too little water (11%). These findings are similar to those obtained from other
studies. In Northeast Brazil, 95% of the caretakers knew about rehydrating solutions,
only 18% prepared them correctly, the most common error being the use of insufficient
water 58. In Suleja, Nigeria, among the mothers who prepared SSS incorrectly, 73%
added the incorrect amount of sugar, 63% added the incorrect amount of salt, water was
added incorrectly by 35% of the mothers 52. As in all studies in the developing countries
there is a tendency by mothers to prepare a hypertonic solution, and not a hypotonic one 53.
The main source of error in the reconstitution of salt sugar solution by the mothers
in this study was the addition of too much salt/sugar. The mothers used 5ml teaspoon
(24.5%) and tablespoon (8.5%) instead of the recommended 3ml teaspoon in preparing
the mixture. Others added more than one teaspoon (3ml, 5ml) of salt. There was a
confusion among the mothers on the exact type of spoon to use as there are several sizes
or types of teaspoon (both metal and plastic) available in the market 53.
In this study, only 28% of the mothers knew that ORT replaces lost fluid and salt.
The majority did not know the actual work of the ORT in the child’s body. This could
explain why the mothers gave very small amount of the ORT to their children who had
diarrhoea. They were cautious not to give too much (or overdose) of the fluid, believing
it to be a drug, and so an overdose could be dangerous. Many others gave I to 6
teaspoons of the fluid 3 to 4 times daily as they would other medications.
5.2 CONCLUSIONS
1. There is lack of sufficient knowledge among the mothers on the correct preparation
and administration of ORT (ORS and SSS) in the home-management of diarrhoeal
disease. The mothers had confused the standard ORS with SSS as being the same, and had
used the same volume of water in its preparation. The implication could be that health
care providers are not doing enough in transmitting this message of ORT to the mothers.
Most of the messages they receive on ORT are deficient. They are silent on a number of
issues such as the exact size of the soft drink bottle, teaspoon, the quantity of fluid the
94
mother can administer at any given time and what she can use in the home to measure this
amount of fluid. The initial Coca-cola and Fanta bottles (29cl) that were in use at the
inception of the ORT programme has been withdrawn and in its place we now have so
many sizes (25cl, 35cl, 50cl and 1litre). The mothers are confused on which of these sizes
of bottle to be used.
2. There is also confusion among both caregivers and caretakers on the appropriate
volume of water to use in preparing the standard ORS. The initial ORS (600ml) which
was in use at the inception of the programme has been withdrawn and in its place the
standard WHO-ORS requiring 1 litre of water for its preparation is being produced and
marketed. However, many people are not fully aware of this, and so continue to use the
same amount of water for SSS in preparing the WHO-ORS.

95
5.3 RECOMMENDATIONS
1. There is a need for the government to re-define the National strategy on control of
diarrhoeal disease, and make it clearer to all. (i) Such a message should be specific on the
correct size of teaspoon (3ml or 5ml), the exact size of soft drink bottle (25cl, 30cl or
35cl) to be used in the preparation of ORT at home. The message should also be clear-cut
on the amount of fluid the mother could administer at any given time, the frequency of
administration and the volume in 24 hours, using a measure that is available in the home.
(ii) Since mothers in the urban areas find it more convenient to use ORS rather than SSS
at home, every mother should be taught on how to reconstitute and administer the
standard WHO-ORS at home.
(iii) Every health worker or caretaker should know the type of ORT (ORS or SSS) to use
at any point in time whether at home or in the clinics when there is none, some or severe
dehydration
2. Health care providers and family physicians should learn to use more of ORT
(ORS) in the treatment of some and severe dehydration in the health care facilities
instead of the current practice of widespread use of intravenous fluid for every case of
dehydration from diarrhoea. By so doing, the mothers will be taught the appropriate way
to reconstitute and use the fluid, and when they see the effectiveness of ORT in
correcting dehydration, they will be encouraged to try it at home when next their children
had diarrhoea.
3. Every family physician and care provider should use every contact with the
mothers to help and teach them the correct use of oral rehydration therapy in the home-
management of diarrhoeal disease. These teachings should always be accompanied with
practical demonstrations showing the recommended teaspoon (3ml) to be used in the
reconstitution of salt-sugar solution.
There is more to be done by the governments and health care providers in helping
to rectify the pitfalls in the use of WHO-ORS and salt sugar solution at home so that ORT
will become more useful in the fight against the dreaded consequences of diarrhoeal
disease which is still a leading cause of morbidity and mortality in children in developing
countries.
Further research is needed:
(1) To identify the determinants to a correct use of ORT at home and in the clinics.
(2) To confirm the value of cereal-based ORS in the management of diarrhoea. Cereal-
based ORS, in view of its potentials of not only correcting dehydration, reducing the
volume of the diarrhoea, and providing nutrition to the patient, could be the all-important
‘medicine’ or breakthrough needed for the effective management of diarrhoeal diseases.

96
REFERENCES
1. Bern C, Martins J, deZoysa I, Glass RI. The magnitude of the global
problem of acute diarrhoeal disease: a ten-year update. Geneva. Bull
WHO.1992; 70: 705.
2. Motarjemi Y, Kaferstein F, Moy G, Quevedo F. Contaminated
weaning food: a major risk factor for diarrhoea and associated
malnutrition. Bull WHO: 1993; 7: 79-92.
3. Oruamabo RS. Under-five mortality rate in Nigeria and the entrapment
phenomenon. The Nig. Health J. 2000; 1: 31-37.
4. Santosham M, Greenough WB. Oral rehydration therapy: a global
perspective. J Paediatr, 1991, 118:44-51
5. Editorial. Control of Diarrhoeal Diseases Programme. The Kenyan
situation. East Afri. Med. J. 1996; 28:1-2.
6. Doubeni CA. Oral rehydration solution in diarrhoeal diseases. Orient
Med. J. 1998; 2: 30-32.
7. Okeahialam TC. Expanded programme on immunization (EPI) and
oral rehydration therapy (ORT): strategies for child survival and
development in Nigeria. Orient J. Med. 2000; 1:16-20.
8. Victoria CG, Bryce J, Fontaine O, Monasch R. Reducing deaths from
diarrhoea through oral rehydration therapy. Bull WHO. 2000; 78: 1246
– 55.
9. Avery ME, Snyder JD. Oral therapy for acute diarrhoea: the under-
used simple solution. The New Engl. J. Med. 1990; 323: 891-4.
97
10. Babaniyi OA. Oral rehydration in children with diarrhoeal disease in
Nigeria: a 12-year review of impact on morbidity and mortality from
diarrhoeal disease and treatment practices. J Trop Paediatr, 1991;
37:57.
11. Reis EC, Geopp JG, Katz S, Santosham M. Barriers to use of oral
rehydration therapy. Paediatrics 1994; 93:709-711.
12. Smith T. The British Medical Association A-Z Family Health
Encyclopedia. 3rd edition. London, Dorling Kindersley, Ltd. 1999: 353.
13. Fricker J. Putting an end to diarrhoeal diseases in children in the
tropics. Bull. WHO 1993; 80:204.
14. Blacklow NR, Greenberg HB. Viral gastroenteritis. The New Engl. J.
Med. 1991; 325:252-64.
15. Guerrant RL, Bobak DA. Bacterial and protozoal gastroenteritis. N
Engl. J. Med 1991; 325:252-264
16. Ekanem EE. Food hygiene and childhood diarrhoea in Lagos, Nigeria:
a case-control study. Journal of diarhoeal diseases research, 1991;
9:219-226.
17. Huilan S. Aetiology of acute diarrhoea among children in developing
countries: a multicentre study in five countries. Bull. WHO, 1991;
69:549-555.
18. Snyder JD, Merson MH. Use and misuse of oral therapy for diarrhoea:
comparison of United States practices with American Academy of
Paediatrics recommendations. Paediatrics 1991;87:28-33
98
19. Esrey SA. Food contamination and diarrhoea. World Health. Bull.
WHO. 1993; 71: 79.
20. Okeahialam TC, Grange AO. Oral rehydration therapy: an overview.
Cecta Press, Enugu. 1992: 9-10.
21. Fordtran JS. Diarrhoea, In: Wyngaarden JB, Smith LH, editors, Cecil
Textbook of medicine 14th edition Philadelphia, WB Saunders Co.
1997: 712-719.
22. Meyers A. Modern management of acute diarrhoea and dehydration
in children. Am Fam Physician. 1995; 51: 1111-13.
23. Inem V. Assessment of the diarrhoea patient for dehydration
(Cholera). The Nig. J. Gen. Pract. 1998; 2: 7-9.
24. Santosham M, Greenough WB. Degrees of dehydration and
corresponding clinical signs, In: Meyers Alan, editor, Am Fam
Physician. 1995; 51: 1105.
25. Saavedra JM. Harris GD, Finberg L. Capillary refilling in the
assessment of dehydration. Am J Dis Child. 1991; 145:296-8
26. Bennish ML, Azad AK, Rahman O, Philips RE. Hypoglycaemia during
diarrrhoea in childhood. Prevalence, pathophysiology, and outcome.
N Engl J Med, 1990; 322:1357-1363
27. Guerrant RL, Schorling JB, Mcauliffe JF, Desouza MA. Diarrhoea as
a cause and an effect of malnutrition: diarrhoea prevents catch-up
growth and malnutrition increases diarrhoea frequency and duration.
Am. J. Trop. Med. & Hyg. 1992; 47: 28-35.

99
28. Mata L. Diarrhoeal disease as a cause of malnutrition. Am. J. Trop.
Med. & Hyg. 1992; 47: 16-27.
29. Tolle SW, Elliot DL. The evaluation and management of acute
diarrhoea (Topics in primary care medicine). WAJM. 1984; 140: 293-
97.
30. Overall JC. Paediatric infectious diarrhoeas (Primary Health Care).
Current medicine SCAN. Christian Medical and Dental Society. 1995;
XI: 18-19.
31. Mark Donowitz MD, Freddy T, Kokke MD, Roxan Saidi MD. Current
concepts: evaluation of patients with chronic diarrhoea. The New
Engl. J. Med. 1995; 332: 725-7.
32. Wilson JS. Subacute diarrhoea – to treat or to wait? Current medicine
SCAN. Christian Medical and Dental Society 1992;VIII:2-5.
33. Wilson JS. Infectious diarrhoeas: to treat or not to treat. Current
Medicine SCAN. 1994; X: 11-14.
34. Cleason M, Merson M. Global progress in control of diarrhoeal
diseases. Paediatric Infectious Disease Journal, 1990; 9:345-355
35. Sladen GE, Dawson AM. Interrelationships between absorption of
glucose, sodium and water by the normal human jejunum. Am Fam
Physician. 1995; 51: 1111-13.
36. Sack DA, Islam S, Brown KH. Oral therapy in children with cholera: a
comparison of sucrose and glucose electrolyte solution. Centre for
Diarrhoeal Disease Control and Prevention. 1992; 41:11.
100
37. Cohen MB. Aetiology and mechanisms of acute infectious diarrhoea
in infants in the United States. J Paediatr 1991; 118:34-39
38. Hircshhorn N, Greenough WB. Progress in oral rehydration therapy.
Am Fam Physician, 1991; 264:50-56
39. Duggan C, Santosham M, Glass RI. The management of acute
diarrhoea in children: oral rehydration, maintenance, and nutritional
therapy. MMWR 1992;41:1-20.
40. Federal Ministry of Health, Document: Nig. Bull. Epidemiol. 1991;
1:22-24
41. Teka T. Analysis of the use of oral rehydration therapy corner in a
Teaching Hospital in Gondar, Ethiopia. East Afr Med. J. 1995; 72: 669-
71.
42. Mackenzie A. Randomised controlled clinical trial comparing oral and
intravenous rehydration therapy in children with diarrhoea, In: Roach
RR, editor, Current Medicine SCAN. 1993; IX: 1-3.
43. Pizarro D, Posada G, Saudi L, Moran JR. Rice-based oral electrolyte
solution for the management of infantile diarrhoea. N Engl J Med,
1991; 324:517-521.
44. Gore SM, Fontaine O, Pierce NF. Impact of rice-based oral
rehydration solutions on stool output and duration of diarrhoea: meta-
analysis of 13 clinical trials. BMJ 1992; 304:287-291.
101
45. Bhan MK, Mahalanabis D, Fontaine O, Pierce NF. Clinical trials of
improved oral rehydration salt formulations: a review. Bull. WHO
1994; 72:945-955
46. Herbst J. Primary Health Care: oral rehydration fluids. Current
medicine SCAN. Christian Medical and Dental Society 1990; VI: 9-10
47. Santosham M, Brown KH, Sack RB. Oral rehydration therapy and
dietary therapy for acute childhood diarrhoea. Am Fam Physician.
1995; 51: 1112-13.
48. Pickering LK. Antimicrobial therapy for gastroenteritis caused by
bacterial and parasitic pathogens. Current medicine SCAN. 1994; X:
13-15.
49. Yoder PS, Hornik RC. Perception of severity of diarrhoea and
treatment choice: a comparative study of health sites. J. Trop. Med. &
Hyg.1994; 97: 1-2.
50. Yakubu AM, Ifere OS, Ogala WN. Mothers’ awareness, knowledge
and use of salt-sugar solution in the management of diarrhoeal
diseases in a rural community. The Nig. Med. Pract. 1995; 30:11-14.
51. Ekanem EE, Akintoye CO, Adedeji OT, Salako OA. A quantitative
assessment of Nigerian mothers’ ability to prepare salt-sugar solution
for home management of diarrhoea. Journ of the Royal Society of
Health.1993; 113: 243-6.

102
52. Babaniyi OA, Maciak BJ, Wambai Z. Management of diarrhoea at the
household level: a population-based survey in Suleja, Nigeria. East
Afr. Med. J. 1994; 70: 531-5.
53. Nwoye LO, Uwagboe PE, Madubuko GU. Evaluation of home-made
salt-sugar oral rehydration solution in rural Nigerian population. J.
Trop. Med. & Hyg. 1988; 91: 23.
54. EPI/CDD programme. Federal Ministry of Health, Lagos. Diarrhoea
survey in Plateau State. Nig. Bull. Epidemiol. 1992; 2: 2-9.
55. Ugochukwu EF. Treatment of childhood diarrhoea: what mothers do.
Nig. J. Clin. Practice. 2002; 5:64-8
56. Edet EE. Fluid intake, feeding practices during diarrhoea in Odukpani,
Nigeria. East Afr. Med. J. 1996; 73: 289-291.
57. Ahmed IS, Eltom AR, Karrar ZA, Gibril AR. Knowledge, attitudes and
practices of mothers regarding diarrhoea among children in a
Sudanese rural community. East Afr. Med. J. 1994; 7: 716-19.
58. Barros FC , Victoria CG, Forberg B, Maranhao AG. Management of
childhood diarrhoea at the household level: a population based survey
in North-east Brazil. Bull. WHO 1991;69:59-65.
59. Dua T, Bahl R, Bham MK. Lessons learnt from diarrhoeal diseases
control programme and implications for the future. Indian J. Paed.
1999; 66: 55-61.
103
60. Raghu MB, Balasubramanian S, Balasubrahmanyam G. Awareness
of and attitude towards oral rehydration therapy. Indian J. Paed. 1995;
62: 439-43.
61. Bingel AD. Jos origins and growth of the town 1900 to 1972. University
of Jos Department of Geography Publication No. 1, Nigeria 1998.
62. Federal office of statistics (FOS). National Population Census 1991
Publication, Jos, 1992.
63. Daniels WW. Biostatistics: a foundation for analysis in Health
Sciences, 6th edition. London, John Wiley and sons. 1995:177-81.
64. Maclaren DS. Protein energy malnutrition: classification,
pathogenesis, prevalence and prevention, In: Textbook of Paediatric
nutrition. 2nd edition. Churchill living stone, London, 1992:868-92.
65. Center for Disease Control: Epi-Info Version 6.0. Centre for Disease
Control epidemiology programme office, Atlanta Georgia, 1990.
66. Oni GA. Infant feeding practices, socio-economic conditions and
diarrhoeal disease in a traditional area of urban Ilorin, Nigeria. East
Afri Med J. 1996;73 : 283-8.
67. Mbori-ngacha DA, Otieno JA, Njeru EK, Onyango FE. Prevalence of
persistent diarrhoea in children aged 3 to 36 months at the Kenyatta
National Hospital, Nairobi, Kenya. East Afri Med J. 1995; 72 : 711-3.
68. Manunebo MN, Kirkwood BR. Influence of demographic,
socioeconomic and environmental variables on childhood diarrhoea in
a rural area of Zaire, J Trop Med and Hyg. 1994;97:31-38
104
69. Mahalanabis D, Alam AN, Rahman N, Hasnat A. Prognostic indicators
and risk factors for increased duration of acute diarrhoea and for
persistent diarrhoea in children. Int. J. Epidemiol. 1991;20:1064.
70. Lulseged S. Predictors of moderate to severe dehydration in acute
diarrhoeal disease: a case control study. Ethiopia Med J. 1992; 30:69-
72.