Oral presentations
617
BOOK OF EXTENDED SYNOPSES IAEA-CN-118 International Conference on Isotopes in Environmental Studies – Aquatic Forum 2004 Monte-Carlo, Monaco 25–29 October 2004
-
Upload
khangminh22 -
Category
Documents
-
view
0 -
download
0
Transcript of Oral presentations

BOOK OF EXTENDED SYNOPSES
IAEA-CN-118
International Conference on Isotopes in Environmental Studies –
Aquatic Forum 2004
Monte-Carlo, Monaco25–29 October 2004
04-42629_CN-118_ExtendedSynopses_4c.qxd 2004-09-20 09:13 Page 1

Organized by the
Hosted by the
Government of the Principality of MonacoSous Le Haut Patronage de S.A.S. Le Prince Souverain
Co-sponsored by the
(ICTP)
International Hydrological Programme (IHP) of UNESCO
Intergovernmental Oceanographic Commission (IOC) of UNESCO
Commission Internationale pour l'Exploration Scientifique de la Mer Méditerranée (CIESM)
The material in this book has been supplied by the authors and has not been edited.The views remain the responsibility of the named authors and do not necessarilyreflect those of the government of the designating Member State(s). The IAEAcannot be held responsible for any material reproduced in this book.
04-42629_CN-118_ExtendedSynopses_4c.qxd 2004-09-20 09:15 Page 2

ORAL PRESENTATIONS


EXTENDED SYNOPSIS IAEA-CN-118/1
TOPIC: ISOTOPES IN THE ENVIRONMENT
1
Reading the Isotope Language
W. Kutschera
Institute for Isotope Research and Nuclear Physics, University of Vienna, Vienna, Austria
E-mail address of main author: [email protected]
“Reading the isotope language” means that we are following the various changes that affect isotope ratios. We know that in essentially all physical and chemical processes the relative abundance of isotopes within an element are subject to small changes. Most of these subtle changes are mass dependent (called mass fractionation), but mass- independent fractionations also occur occasionally.
In the current presentation we will walk through the seven large domains of our environment (atmosphere, biosphere, hydrosphere, cryosphere, lithosphere, cosmosphere, technosphere), “listening” to the isotope language and interpreting our world through this special window. An attempt will be made to point out the usefulness of this approach to gain a deeper understanding of the unique history of our physical world, and to get a glimpse at the human influence on its future.
Changes of stable isotope ratios through natural processes are quite small. For light elements (e.g. carbon, nitrogen, oxygen), where the relative mass differences between isotopes are large, mass fractionations are in the order of permil (‰). For heavier isotopes, the mass fractionations may even be one to two orders of magnitude smaller. Great progress has been achieved in measuring these minute changes of isotope ratios with various techniques, such as GMS (Gas Mass Spectrometry), TIMS (Thermal Ionisation Mass Spectrometry), SIMS (Secondary Ion Mass Spectrometry), and in recent years particularly with ICPMS (Inductively Coupled Plasma Mass Spectrometry). As a result, stable isotope ratios can now be measured with high precision and accuracy for essentially all elements.
In addition to mass fractionation which affects all isotopes, radioisotopes introduce an additional dimension. Their abundance may change considerably in the course of time (10 half- lives decrease a radioisotope-to-stable- isotope ratio by a factor of 1000). However, these isotope ratios are difficult to measure because of their extremely low values in natural settings (e.g. 10-12 to 10-15 for 14C/12C ratios). They require special methods such as AMS (Accelerator Mass Spectrometry), which currently dominates this field. Recently, also laser-based mass-spectrometric techniques (Resonance Ionisation Mass Spectrometry and Magneto-Optical Trap methods) are gaining ground in this field.
Taken together, we now have a multitude of versatile methods available to measure isotopic changes in essentially all sections of the environment. The continuing advances in reading the subtleties of the isotope language promises to help us to get a better view of our home planet and beyond.
1

EXTENDED SYNOPSIS IAEA-CN-118/2
TOPIC: STABLE ISOTOPES
1
The Use of 15N in Unravelling the Marine Nitrogen Cycle
N. J. P. Owens
Plymouth Marine Laboratory, Plymouth, Devon, United Kingdom
E-mail address of main author: [email protected]
The stable isotope 15N has been used for many decades as a tool to investigate the highly complex marine nitrogen cycle. In this presentation, the historical origins of 15N will be briefly surveyed and some examples of its early use in natural sciences in general, with both the deliberate use of 15N as a tracer and studies that employ the discriminating power of the naturally occurring variations in the natural abundance of 15N. The presentation will conclude with speculations about possible future development of 15N in the marine sciences.
2

EXTENDED SYNOPSIS IAEA-CN-118/3
TOPIC: CLIMATE CHANGE
1
Interannual to Decadal Climate Variability in the Pacific and Indian Oceans Revealed by Isotopic Studies of Corals
R. Dunbara, D. Fleitmanna, D. Mucciarone a
a Geological and Environmental Sciences, Stanford University, Stanford CA 94305-2115, USA
E-mail address of main author: [email protected]
Instrumental records of past variability in climatically important regions of the tropical Indian and Pacific Oceans are relatively scarce and short. Multi-century reconstructions of past climate change in these areas are now being made available through the isotopic and chemical analysis of coral skeletons collected from both the surface ocean and deep sea. Here we present a brief synthesis of multi-century trends in ocean climate as revealed by coral archives. In general, these records are consistent with century-scale trends towards a warmer tropical ocean with greater near-equatorial rainfall and greater ENSO variability in more recent decades. Very limited deep sea coral data reveal larger than expected variability in thermocline conditions during the past several centuries. Sufficient data is now available to allow comparisons of Pacific ENSO variability with records of the Monsoon from the Pacific Basin over timescales extending back at least 150 years. The last half of this talk is used to describe a new synthesis derived from East Africa coral records.
We present a monthly resolution stable isotopic record acquired from several large living coral heads (Porites) from the Malindi and Watamu Marine Reserves, Kenya (3°S, 40°E). The annual chronology is precise and is based on exceptionally clear high and low density growth band couplets. The record extends from 1696 to 1996 A.D., making it the longest coral climate record from the Indian Ocean and one of the longest available worldwide. We have analyzed the uppermost portion of 8 separate coral cores. This upper section, used for calibration purposes, provides estimates of signal fidelity and noise in the climate recording system internal to the colony. Coral d18O at this site primarily records SST; regression of monthly coral d18O vs. SST yields a slope of -0.26‰ d18O per °C, and d18O explains well over 50% of the variance in SST. Additional isotopic variability may result from changes in seawater d18O due to local runoff or regional evaporation/precipitation balance, but these changes are likely to be small because local rainfall d18O is not strongly depleted relative to seawater and salinity gradients are small. The coral record indicates a clear warming trend of about 1.5°C that accelerates in the latest 20th century, superimposed on strong decadal variability that persists throughout the record. In fact, d18O values in the 1990s exceed the 300 year envelope (they are lower) and correspond with apparently unprecedented coral bleaching in coastal East Africa. The decadal component of the Malindi coral record reflects a regional climate signal spanning much of the western equatorial Indian Ocean. In general, East Afr ican SST and rainfall are better correlated with Pacific ENSO indicators than with the Indian Monsoon at all periods (inter-annual through multi-decadal) but the correlation weakens after 1975. One dramatic new result we report here is a strong indication of a major cool and dry period from 1750-1820 A.D. This is the single largest multi-decadal anomaly of the past 300 years and correlates perfectly in time with the historically and anecdotally defined Lapanarat
3

R. Dunbar et al.
2
Drought. Our results indicate a strong link between multi-decadal tropical cold SST anomalies and far-reaching continental droughts in East Africa.
Interannual-decadal SST variations are strongly coherent with ENSO indices and other ENSO-sensitive coral records on decadal and interannual time scales. The decadal component of the Malindi coral record reflects a regional climate signal spanning much of the western equatorial Indian Ocean. Previous work has argued that this component likely reflects a monsoonal influence. However, decadal variance in both Malindi and Seychelles coral records is more strongly coherent with ENSO indices than with the India or East Africa rain indices. The coherency of both coral records with Pacific indicators suggests instead that Indian Ocean variability reflects decadal ENSO-like variability originating in the Pacific. These records don't correlate significantly with the Pacific Decadal Oscillation implying a dominant role for the tropical Pacific (as opposed to extra-tropical regions) as a source of regional decadal variability in the western Indian Ocean. This work confirms that the tropical Pacific can act as an agent forcing decadal climate variability over a very large spatial scale on Earth. We conclude by examining the time-varying relationship between ENSO and the monsoons using available coral records from the Pacific and Indian basins.
4

EXTENDED SYNOPSIS IAEA-CN-118/4
TOPIC: THE MEDITERRANEAN
1
Carbon Export Assessed by Sediment Traps and 234Th:238U Disequilibrium during the Spring Summer Transition in the Open NW Mediterranean
J. C. Miquela, B. Gassera, A. Rodriguez y Baenaa, S. W. Fowlera, J. K. Cochranb
a IAEA Marine Environment Laboratory, Monaco
bMarine Sciences Research Center, SUNY, New York, USA
E-mail address of main author: [email protected]
Particle fluxes were measured at 200 m depth from January to July 2003 as part of the Dyfamed time-series observatory activities using moored Technicap PPS5 sediment traps. Water column was sampled for particulate and dissolved material at the same site (43°25’N; 7°51’E) with Challenger in situ pumps during four cruises of the Barmed and MedFlux projects (March, April, May and June 2003). Particulate matter was collected on a 70 µm polyamide prefilter followed by a precombusted GF/F filter (Ø 293 mm). The dissolved phase of 234Th was extracted from the filtered water with MnO2-impregnated wound fiber cartridges [1]. Particulate 234Th was quantified on both fractions (>70 and 1-70 um) by non-destructive beta counting (Risø beta detector). The 234Th activity of the dissolved fraction was measured in the ashed cartridges using a well-type high purity germanium detector (Canberra). Physical and fluorescence seawater data were obtained with a SeaBird SBE 911plus, and particulate organic carbon was analysed with a VarioEl elemental analyser.
Temperature profiles showed a mixed water column in March and April, and stratified in June. These profiles were contrasted by the fluorescence profiles which showed marked surface maxima in the first two months and a deep maximum typical for stratified waters in June. Particulate total and organic carbon profiles showed subsurface maxima at the beginning of the study (March) and, later on in May and June, a deep maxima at 50 m confirming the presence of a mixed surface layer in the upper 30 m which was well separated from the rest of the water column.
Total mass flux displayed a pronounced peak in mid-February and mid-March of approximately 400 mg m-2d-1. In January and from April to the end of June mass fluxes were always around 50 mg m-2d-1. Thorium-234 fluxes followed the same temporal trend, reaching 600 to 800 dpm m-2d-1 in February and March and less than 200 dpm m-2d-1 during the other periods. Thorium-234 activities in the water column mostly agreed with the particle distribution reflected in the POC profiles. In the upper waters, the 234Th/238U disequilibria became more pronounced from March through June. Both radionuclides reached equilibrium at around 150 m in March while it was above 100 m depth in June and slightly below in May.
In order to compare trap thorium fluxes with those predicted by the 234Th activity in the water column the thorium deficit was integrated over the upper 200 m water depths. This yielded values from 800 dpm m-2d-1 to over 1000 dpm m-2d-1. Although the estimated flux in March corresponded to that measured in the sediment traps, overall, the water column derived 234Th fluxes tended to be higher than those registered by the traps during the same time periods. POC export flux was calculated from the thorium flux by applying the POC/234Th ratio
5

J-C. Miquel et al.
2
measured in large sinking particles [2]. This ratio (0.019 mg dpm-1 or 1.58 µmol dpm-1) was measured in the particles >70 µm at 200 m depth, and yielded a POC flux in the range of 15 to 20 mg m-2d-1.
Our data show that 234Th distribution traces fairly well the dynamics of particle distribution in the water column, and they confirm the applicability of this tracer in flux studies carried out over relatively short periods of time (weeks). The Th-derived data will be compared to POC sediment trap fluxes (data in process) and the variability of POC/234Th ratio in our pumps and trap samples assessed.
[1] BUESSELER, K.O., COCHRAN, J.K., BACON, M.P., LIVINGSTON, H.D., CASSO, S.A., HIRSCHBERG, D., HARTMAN, M.C., FLEER, A.P., Determination of thorium isotopes in seawater by non-destructive and radiochemical procedures, Deep-Sea Res. 39 (1992) 1103-1114.
[2] COCHRAN, J.K., BARNES, C., ACHMAN, D., HIRSCHBERG, D.J., Thorium-234/Uranium-238 disequilibrium as an indicator of scavenging rate and particulate organic carbon fluxes in the Northeast Water Polynya Greenland, J. Geophys. Res. 100 C3 (1995) 4399-4410.
6

EXTENDED SYNOPSIS IAEA-CN-118/5
TOPIC: THE MEDITERRANEAN
1
Re-distribution of 137Cs Chernobyl Signal in the Aegean Sea
R. Delfantia, C. Tsabarisb, C. Papuccia, H. Kaberi b, R. Lorenzellic, V. Zervakisb, M. Tangherlinia, D. Georgopoulosb
a ENEA-Marine Environment Research Centre, La Spezia, Italy
bHellenic Centre for Marine Research (HCMR), Anavyssos, Greece
c ENEA-Brasimone Research Centre, Camugnano, Italy
E-mail address of main author: [email protected]
The Chernobyl accident produced a patchy deposition of radionuclides over the Eastern and Northern basins of the Mediterranean Sea, that was superimposed ove r the previous fallout from atmospheric nuclear weapon tests. The deposition of Chernobyl-derived 137Cs was particularly heavy onto the Black Sea (1.7 – 2.4 PBq) and the Aegean - Ionian Seas along the Greek coasts (800 TBq) [1]. Moreover, the inflow of surface Black Sea water through the Dardanelles Straits still constitutes a point source of the conservative 137Cs into the North Aegean Sea [2].
The objective of this study is to discuss the relationship between the re-distribution of 137Cs Chernobyl signa l in the Aegean Sea and water circulation in the area, with focus on the evolution in space and time on the events of deep water formation.
Selected sampling was carried out in 1999, 2001, 2002 and 2003 by the Hellenic Centre for Marine Research and the Italian ENEA Marine Environment research Centre during oceanographic campaigns designed for other purposes. Due to the limited shiptime available, particular attention was dedicated to gather information on the 137Cs vertical profiles in the water column of selected sites (deep North-Aegean Basins and Cretan Sea), where the signal of past events involving deep water formation is expected to be registered.
The water exiting the Dardanelles undergoes mixing with North Aegean surface water. In the surface water, there is a clear trend of decreasing 137Cs concentration with increasing salinity, suggesting that mixing/dilution of Black Sea Water (BSW) with highly saline Aegean waters is the dominant process determining the 137Cs levels. Due to its low salinity, BSW acts as an insulation layer and, consequently, deep-water formation is rather infrequent in the North Aegean, taking place only at periods of reduced Black Sea outflow and/or exceptionally cold and dry winters. In the last 20 years there have been two major deep-water formation events in the North Aegean: in winter 1987 (just after the Chernobyl accident), and in winter 1993 [3]. Actually, these two episodes have deeply modified the vertical profiles of 137Cs with respect to 1984, before the Chernobyl accident. In fact in 1999 – 2002, in the Lemnos and N-Skyros Basins, the 137Cs concentration increased from the surface to the bottom; in the deep waters it was about 5 Bq m-3, five times higher than in 1984.
7

R. Delfanti et al.
2
Historical observations and analyses suggest that the Cretan Sea is characterised by the formation of dense waters with variable characteristics, depending on the meteorological conditions and on the pre-conditioning of the water column. In the early nineties exceptionally dense, salty water started to fill the deep Cretan Basin and overflow the sills of the Cretan Arc straits [4]. Since 1995 the outflow of very dense Cretan water to the Levantine and Ionian basins has diminished, corresponding to a long stagnation period regarding dense water production in the North (and possibly the South) Aegean. In the North Aegean, the evolution of 137Cs concentration in the deep basins is clearly controlled by vertical diffusion since 1994. In the South Aegean, the situation is not so clear: one of the main questions is whether the deep Cretan water is formed locally or if it is also partially originated in the Northern Basins. The high concentration of 137Cs (4.5 Bq.m-3) found in 2003 in the deep water of the South Aegean suggests a significant contribution of dense water from N-Aegean basins, having comparable 137Cs concentrations.
[1] KRITIDIS, P., FLOROU, H., Estimation of the 137Cs deposited in Aegean, Cretan and
Ionian Seas after the Chernobyl accident, Rapp. Comm. Int. Mer Medit. 32 (1990), p. 318.
[2] EGOROV, V.N., POVINEC, P.P., POLIKARPOV, G.G., STOKOZOV, N.A., GULIN, S.B., KULEBAKINA, L.G., OSVATH, I., 90Sr and 137Cs in the Black Sea after the Chernobyl NPP accident: inventories, balance and tracer applications, J. .Environ. Radioact. 43 (1999), 137-155.
[3] ZERVAKIS, V., GEORGOPOULOS, D., DRAKOPOULOS, P.G., The role of the North Aegean in triggering the recent Eastern Mediterranean climatic changes, J. Geophys. Res. 105 C11 (2000) 26, 103-26, 116.
[4] THEOCHARIS, A., NITTIS, K., KONTOYIANNIS, H., PAPAGEORGIOU, E., BALOPOULOS, E., Climatic changes in the Aegean Sea influence the Eastern Mediterranean thermohaline circulation (1986-1997), Geophys. Res. Lett. 26 11 (1999) 1617-1620.
[5] FLOROU, H., Distribution and behaviour of long- lived radionuclides in marine ecosystems (Greece), PhD thesis, Department of Zoology, University of Athens (1992) 253 pp.
0
200
400
600
800
1000
1200
0 2 4 6
N. Aegean, 1984 , N. Aegean, 2001
Cretan Sea, 1984, Cretan Sea, 2003
Cs-137 (Bq m-3)
Dep
th (
m)
FIG. 1. Vertical profiles of 137Cs in the water column of the North and South Aegean Sea. The original 1984 data are reported in [5] and have been decay corrected to 2001 (N. Aegean) and to 2003 (Cretan Sea) for comparison with recent profiles.
8

EXTENDED SYNOPSIS IAEA-CN-118/6
TOPIC: THE MEDITERRANEAN
1
Natural Radionuclides in Metallic and Thermometallic Springs in the Ikaria Island - Eastern Aegean Sea - Greece
H. Floroua, C. Kehagiab, A. Savidoua, G. Trabidoua
a NCSR ”Demokritos”, INT-RP, Athens, Greece
bGAEG, Environmental Radioactivity Monitoring Dept., Athens, Greece
E-mail address of main author: [email protected]
Ikaria Island (37º 59'N, 22º 58'E - an area of 267 km2 in the eastern Aegean Sea) has been shown in several research studies in the marine environment of Greece to have some areas with elevated na tural background radiation due to geological origin [1]. These areas, mainly cited in the neighborhood of several metallic and/or thermo-metallic springs spread in the Island, present elevated concentrations of natural alpha and gamma-emitters in the abiotic components of the environment. The measured dose rate in the inland and coastal areas in the vicinity of the springs range as 1.3 × 10⁻³ – 1.8 × 10⁻³ Gy y-1 and in the control area 0.5 × 10⁻³ – 0.8. × 10-3 Gy y-1, whereas the mean value for the total measured area is 1.2 × 10⁻³ Gy y-1 [2, 3]. The mean value for Greece (terrestrial and coastal sediment surface) is 0.7 × 10⁻⁴ Gy y-1 (reported value 0.08 µGy.h-1 [4] ). The reported concentrations in abiotic material (soil, ores, mud etc) are: for 238U up to 1050 Bq kg-1, 226 Ra up to 760 Bq kg-1, 228Ra up to 260 Bq kg-1, 228 Th up to 70 Bq kg-1, 232Th up to 300 Bq kg-1, 40K up to 2700 Bq kg-1 with a wide range of levels observed [1-3]. Besides, elevated concentrations of 222Rn (110–970 Bq L-1 for spring water) have been reported in the above cited studies.
In the present study, the concentrations of 238U and 226Ra were measured in water samples from four metallic springs (Ik1, Ik2, Ik3, Ik4) using gamma spectroscopy, alpha spectroscopy after appropriate radioanalytical treatment and liquid scintillation counting. The findings are being interpreted with regards to the respective concentrations in the ambient soils and 222Rn in spring water.
As concluding, the concentrations of 238U and 226Ra in spring water are characterized in general as reasonable (Table I). Elevated concentrations of 226Ra have been measured in one spring (7.0 ± 0.3 Bq L-1), whereas evaporation of spring water during the treatment procedure in spa installation have resulted in 238U enrichment up to 500 times. The concentrations in spring water are not statistically related to the respective ones in ambient material in spring outflows (sources of springs the main parameter of influence). Besides, unlike to other geothermal springs in Greece [5], the concentrations of 222Rn in spring water have not found to be supported by the parent 226Ra, as water seem to be enriched by the diluted gas in the sources of the springs, too.
9

H. Florou et al.
2
TABLE I. CONCENTRATIONS OF 238U AND 226Ra (Bq l-1) IN SPRING WATER AND SOIL (Bq kg-1) FROM IKARIA ISLAND – EASTERN AEGEAN SEA
Metallic Spring
Spring water 238U Bq L-1 x 10⁻³
Soil [1, 2] 238U Bq kg-1
Spring water 226Ra Bq L-1
Soil [1, 2] 226Ra Bq kg-1
Remarks
Ik1a 5.34 ± 0.94 36 ± 13 0.7 ± 0.2 59 ± 2 Spring outflow (field)
Ik1b 1092 ± 302 ------ 0.9 ± 0.2 ------ Fountain inside spa installation
Ik1c 25.75 ± 2.44 ------ 0.7 ± 0.2 ------ Outflow repository
Ik2 1.30 ± 0.23 138 ± 16 7.0 ± 0.3 122 ± 2 Spring outflow (field)
Ik3 161.9 ± 9.1 54 ± 12 < 0.4* 83 ± 9 Spring outflow (field) - potable
Ik4 30.09 ± 2.05 141 ± 12 < 0.4* 118 ± 5 Spring outflow (field)
* Low Limit of Detection
Unlike in other geothermal springs in Greece, the concentrations of 222Rn in spring water are not supported by the parent 226Ra (as water seems to be enriched in the sources of the spring).
[1] TRABIDOU, G., FLOROU, H., ANGELOPOULOS, A., SAKELIOU, L., Environmental Study of the radioactivity of the spas in the island of Ikaria, Rad. Prot. Dosimetry 63 1 (1996) 63–67.
[2] TRABIDOU, G., Radiological study in the areas of radioactive springs (Ikaria island). Ph. D. Thesis, University of Athens and NCSR ”Demokritos”, Athens (2004) 350 pp.
[3] FLOROU, H., TSYTSUGINA, V., POLIKARPOV, G.G., TRABIDOU, G, GORBENKO, V.V., CHALOULOU, CH., Field observations of the effects of protracted low levels of ionizing radiation on natural aquatic population by using a cytogenetic tool, J. Environ. Radioact. (in press).
[4] KRITIDIS, P., FLOROU, H., Natural radioactivity in the environment and radioactive pollution, (Proc. Nat. Conf. Environ. Sci. and Techn., Aegean University, Mytilini, September) B (1989) 24-34.
[5] KRITIDIS, P., A radiological study of the Greek radon spa, (Proc. Int. Sympos. Radon and Radon Reduction, Philadelphia (USA) 2–5/04/1991) Vol. 3 (1991) Session VI 8.
10

EXTENDED SYNOPSIS IAEA-CN-118/7
TOPIC: THE MEDITERRANEAN
1
The Benthic Boundary Layer: Radioactivity and Oceanographic Data from the GEOSTAR-2 Observatory
W. Plastinoa,b, M. Laubensteinc, G. Etiopeb, P. Favalib
a Department of Physics, University of Roma Tre, Rome, Italy
bNational Institute for Geophysics and Volcanology, Rome, Italy
c National Institute for Nuclear Physics, Gran Sasso National Laboratory, Assergi, Italy
E-mail address of main author: [email protected]
GEOSTAR-2 (GEophysical and Oceanographic STation for Abyssal Research) is the first European deep-sea observatory for geophysical and environmental monitoring at seabed becoming operative in 2000. It was deployed in September 2000 from the Italian R/V Urania, in the southern Tyrrhenian Sea, between the Sicilian coast and the island of Ustica, at a depth of about 1900 m. After 206 days, in April 2001, the observatory was recovered. More than 4100 hours of data were recorded continuously. This mission represented the longest lasting experiment using a complex module, with an intelligent unit, deployed at great depth.
The sensors used for this mission (two magnetometers, a gravity meter, a hydrophone, a Doppler currentmeter, a single-point currentmeter, an automatic water sampler for laboratory geochemical analysis, a CTD and a transmissometer) were continuously controlled and managed by a data acquisition and control system able to transmit the data via surface buoy and radio or satellite link to on-shore operators.
The seawater samples have been analysed for the following parameters:
- gas concentration: CO2, CH4, He, Ne
- helium isotopic composition: R/Ra (3He/4He sample / 3He/4He atm )
CO2 and CH4 were analyzed by gas chromatography with micro-TCD. Helium analysis was carried out with a Perkin Elmer 8500 gas-chromatograph (Flame Ionization Detector and Hot Wire Detector; 5ppmv as detection limit; analytical errors of ± 5%). The 3He/4He isotopic ratio, was determined by a static mass spectrometer (VG5400TFT, VG Isotopes; typical uncertainties are about ±1% for 3He/4He ratios in the range of atmospheric values; below ±0.1% for high-3He samples and below ±3% for low-3He (radiogenic) samples).
The environmental radioactivity analyses of seawater samples, obtained by the automatic water sampler, has been performed in the framework of ERMES research project (Environmental Radioactivity Monitoring for Earth Sciences) to trace environmental changes in the Benthic Boundary Layer (BBL) seawater [1, 2].
The analysis of radionuclides was carried out by means of gamma spectrometry with coaxial high purity Germanium (HPGe) detectors having volumes ranging from 200 to 500 cm3 and a total background rate in the energy range [(60÷2700) keV] varying from (221±2) to (980±10)
11

W. Plastino et al.
2
counts/days depending on the detector [3]. Each seawater sample has been measured for about ten days using a polystyrene box of 70 mm diameter and 30 mm height [1, 2].
Oceanographic data evidenced ocean-lithosphere interactions in the 1900 m deep BBL, distinguishing two water masses with different origin and, possibly, benthic residence time. Environmental radioactivity analyses shown a BBL characterised by a colder Western Water (WW), which is episodically displaced by the cascading of the warmer Eastern Overflow Water (EOW) [4].
[1] PLASTINO, W., LAUBENSTEIN, M., ETIOPE, G., FAVALI, P., Environmental radioactivity analysis in sea-water samples collected by GEOSTAR deep-sea observatory, Istituto Nazionale di Fisica Nucleare, Laboratori Nazionali del Gran Sasso, Annual Report (2002) 201-206.
[2] PLASTINO, W., LAUBENSTEIN, M., ETIOPE, G., FAVALI, P., GEOSTAR-2 observatory: the Benthic Boundary Layer dynamics by environmental radioactivity analyses, Istituto Nazionale di Fisica Nucleare, Laboratori Nazionali del Gran Sasso, Annual Report (2003) 203-208.
[3] ARPESELLA, C., A low background counting facility at Laboratori Nazionali del Gran Sasso, Appl. Rad. Isot. 47 (1996) 991-996.
[4] ETIOPE, G., FAVALI, P., FUDA, J.L., ITALIANO, F., LAUBENSTEIN, M., MILLOT, C., PLASTINO, W., The Benthic Boundary Layer: geochemical and oceanographic data from the GEOSTAR-2 observatory, Annals Geophys. (in press).
12

EXTENDED SYNOPSIS IAEA-CN-118/8
TOPIC: THE MEDITERRANEAN
1
13C/12C Isotope Ratios in the Organic Matter forming the Mucilaginous Aggregates in the Northern Adriatic Sea
M. Giani, V. Zangrando, D. Berto
Istituto Centrale per la Ricerca scientifica e tecnologica Applicata al Mare (ICRAM), Chioggia, Italy
E-mail address of main author: [email protected]
The occurrence of large mucilaginous aggregates is frequent during summer periods in the Northern Adriatic Sea. Their formation is not recurrent every summer but there are cluster of events as in 1988, 1989, 1991 and 1997, 1998, 2000, 2001 and 2002. Different aggregate size and morphologies have been described ranging from cm size marine snow to meters long clouds [1]. Kilometers long layers may form at pycnoclines or at surface as a consequence of the accumulation of the aggregates.
Riverine inputs produce 13C depleted organic matter in contrast to 13C enriched autochthonous marine organic matter [2]. The d13C is an indicator of the terrestrial (d13C from -30 to –25%0
versus VPDB) or marine (d13C -23 to -15%0 versus VPDB) origin of particulate organic matter [3]. Humic substances may form as a consequence of the degradation of terrestrial organic matter or of phytoplankton. The d13C values of humic substances range from –21.8%0 to –22.8 %0 for open ocean humic substances and –22.8%0 to 23.7%0 for coastal humic substances [4].
In order to establish the origin of the aggregates sampled during summer 2000, 2001 and 2002, the chemical characterization and the isotopic composition of organic carbon in different aggregates, plankton and humic substances were performed. The composition of the aggregates depends on the nature of the ma tter involved in the aggregation, therefore the d13C of mucilage and humic fraction can explain the origin of the phenomenon.
The mucilaginous aggregates were dialyzed on a CelluSep3500 membrane with a 3500 nominal weight cut off and freeze dried. The d13C were analyzed by Isotope Ratio Mass Spectrometer (Delta Plus, Thermo Finnigan).
Elemental analysis indicated in the aggregates: 11.1 ÷ 29.4% of organic carbon, 2.8 ÷ 5.0% of inorganic carbon and 0.7 ÷ 3.7% of nitrogen. In order to characterize the nature of organic fraction of the aggregate, humic substance were extracted according to the method of International Humic Substance Society [5]. Humic acid made up 2.3% to 6.3% of the aggregate’s organic carbon.
The d13C average value of the aggregates was -19.7%0 ± 2.2 inside the range of natural plankton (from –19.7 to –24.1%0). Sedimented clouds showed low d13C values (up to -10.11%0) determined by elevated content of carbonates that had a mean d13C value near 0%0 [2]; as a matter of fact these samples contained higher inorganic carbon that could derive by an incomplete removal by HCl treatment of resuspended bottom sediments entrapped in the aggregates.
13

M. Giani et al.
2
The -20.8%0 d13C value of humic acid fraction extracted from sedimented cloud pointed out the marine origin probably by plankton degradation [4] (Fig.1). Differently, the humic acid fractions extracted from coastal surface aggregates showed lower d13C values (–23.3 %0), due to a contribution of riverine organic matter. Further confirmations derived from the d13C values of standard terrestrial humic acid (-26%0) (Fig. 1).
Vibrational FTIR analyses confirm the result obtained with carbon isotope techniques. The FTIR spectra of most aggregates and humic extracts ana lysed showed the absence of aromatic groups, characteristic of terrestrial humic acids, and the presence of strong aliphatic components in the mucilages [6].
Our results showed that mucilaginous aggregates sampled in areas out of the riverine influence had a marine origin, confirming previous results in mucilages sampled in a restricted Adriatic area (Gulf of Trieste) in summer 1988, 1989 and 1991 [7].
FIG. 1. d13C values on different types of mucilaginous aggregates, plankton and humic acids.
[1] STACHOWITSCH, M., FANUKO, N., RICHTER, M., Mucus aggregates in the
Adriatic sea: an overview of stages and occurrences, Mar. Ecol. P.S.Z.N.I. 11 (1990) 327-350.
[2] BOUTTON, T.W., Stable carbon isotope ratio of natural materials atmospheric, terrestrial, marine and freshwater environments : Carbon isotope techniques (COLEMAN, C., FRY, B. Eds) Academic Press 173-186.
[3] DRUFFEL, E.R.M., WILLIAMS, P.M., Importance of isotope measurements in marine organic geochemistry, Mar. Chem. 39 (1992) 209-215.
[4] ISHIWATARI, R., Macromolecular material (humic substance) in the water column and sediments, Mar. Chem. 39 (1992) 151-166.
[5] THURMAN, E.M., MALCOM, R.L., Preparative isolation of aquatic humic substances, Environ. Sci. Technol. 15 (1981) 463-466.
[6] BERTO, D., GIANI, M., TADDEI, P., BOTTURA, G., Spectroscopic evidence of marine origin of mucilages in the Northern Adriatic Sea, Sci. Tot. Environ. (submitted).
[7] FAGANELI, J., KOVAC, N., LESKOVŠEK, H., PEZDIC, A., Sources and fluxes of particulate organic matter in shallow coastal waters characterized by summer macroaggregate formation, Biogeochem. 29 (1995) 71-88.
Hum
ic s
ubst
ance
M
ucila
gino
us a
ggre
gate
s
Pla
nkto
n
-28-24-20-16-12-8-40
Terrestrial humic acids
Humic acid extracted from sedimented clouds
Humic acid extracted from surface aggregates
Sedimented clouds
Clouds
False bottom
Cob web
Ribbon
Stringers
Surface aggregates
Phytoplankton
Zooplankton
δ 13C
14

EXTENDED SYNOPSIS IAEA-CN-118/9
TOPIC: THE MEDITERRANEAN
1
Bioaccumulation and Retention of 210Pb in the Mediterranean Mussel Mytilus galloprovincialis
R. Boudjenouna, J.-L. Teyssié b, O. Cotretb, J. Paganellib, S. W. Fowlerb, M. Warnaub
a Commissariat à l'Energie Atomique/CRNA, Algiers, Algeria
bIAEA-Marine Environment Laboratory, Monaco
E-mail address of main author: [email protected]
Pb is commonly reported as a pollutant of concern in the marine environment. Although severely regulated in the industrialised countries, global emissions are not showing a significant downward trend [1]. Therefore Pb will still cause problems because of its conservative nature and its increasing use in some industrial applications [2]. It is therefore important to develop tools to monitor it’s the occurrence and abundance of Pb in coastal waters, particularly those in less-developed regions of the world where its use is not yet, or only poorly, regulated. Thus, the purpose of this study was to quantify Pb bioaccumulation in a widely distributed and abundant species along the Mediterranean coasts of North Africa, viz. the mussel Mytilus galloprovincialis, in order to assess the relevance of its use as a bioindicator species of Pb contamination [3, 4].
The experimental approach used highly sensitive nuclear detection techniques to investigate uptake and loss kinetics of the radiotracer 210Pb in the mussels. Individuals were exposed experimentally to the radiotracer for 14 d via seawater (uptake phase). At the end of the exposure period, non-contaminated conditions were restored (clean flowing sea water) for 22 d and loss kinetics of 210Pb from mussel tissues were determined (depuration phase) during that time. 210Pb was found to be readily taken up according to linear uptake kinetics. At the end of the exposure period (14 d of exposure), calculated concentration factors reached values as high as 300 (Fig. 1). When mussels were exposed to increasing 210Pb activities (0.25 to 2.5 Bq ml-1), it was found that Pb bioaccumulation in the mussel tissues was directly proportional to ambient Pb concentrations in sea water.
Retention of the metal in mussel tissues was high with ca. 50% of incorporated Pb remaining in the tissues after 3 weeks of depuration (Fig. 2). Mussels displayed similar loss kinetics regardless the 210Pb activity (0.25 to 2.5 Bq ml-1) to which they were previously exposed. Estimated biological half- life (Tb½) of 210Pb ranged between 23 and 28 days.
Overall, our results indicate that M. galloprovincialis could be a useful monitoring tool to assess Pb contamination of North African coastal waters and, thus, could be considered as a suitable bioindicator species for heavy metal monitoring programmes in this region.
15

R. Boudjenoun et al.
2
y = 21.06 x + 20.84R2 = 0.98
0
50
100
150
200
250
300
350
0 2 4 6 8 10 12 14Time (d)
Co
nce
ntr
atio
n F
acto
r
FIG. 1. Uptake kinetics of 210Pb in Mytilus galloprovincialis exposed via sea water (whole -body Concentration Factors; mean SD; n = 5).
y = 99.56 e-0.0261 t
R2 = 0.93
0
10
20
30
40
50
60
70
80
90
100
0 4 8 12 16 20 24
Time (d)
Rem
ain
ing
Act
ivit
y (%
)
FIG. 2. Loss kinetics of 210Pb in Mytilus galloprovincialis previously exposed for 14 d via sea water (% of whole-body Remaining Activity).
[1] SMITH, D.R., FLEGAL, A.R., AMBIO 24 (1995) 21. [2] NSTF - North Sea Quality Status Report. Oslo and Paris Commissions, London (1993). [3] STURESSON, U., Lead enrichment in shells of Mytilus edulis, AMBIO 5 (1976) 253-
256. [4] TRIPP, B.W., FARRINGTON, J.W., GOLDBERG, E.D., SERICANO, J., International
Mussel Watch: the initial implementation phase, Mar. Poll. Bull. 24 (1992) 371-373.
16

EXTENDED SYNOPSIS IAEA-CN-118/10
TOPIC: THE MEDITERRANEAN
1
Contamination Studies in the South Mediterranean Sea - IAEA Regional Technical Co-operation Project RAF/7/004
S-H. Leea, R. F. C. Mantouraa, P. P. Povineca, A. Mahjoubb, M. Benmansourc, A. Noureddine d, N. Reguiguie
a Marine Environment Laboratory, International Atomic Energy Agency, MC 98000 Monaco
bDepartment of Technical Cooperation, International Atomic Energy Agency, Vienna, Austria
c Centre National de l’Energie, des Sciences et des Techniques Nucleaires, Rabat, Morocco
dLaboratoire de l’Environnement, Commissariat à l'Energie Atomique, Algiers, Algeria
e Centre National des Sciences et Technologies Nucléaires, Tunis, Tunisia
E-mail address of main author: [email protected]
Radionuclides can be effectively applied in marine studies and thus contribute to better understanding of water and sediment dynamics and the behaviour of contaminants in oceans and seas. There are only very limited data available on the distribution of radionuclides in the South Mediterranean Sea. Only a few data are available on non-radioactive pollutants as well, and oceanographic investigations have been mostly carried out in strait areas [1, 2]. Little is known about the sources of pollutants (e.g., the phosphate and oil industries, marine traffic, etc.) and their release rates. Because of the Sea’s special geographical setting and potential sensitivity to human activity, much more effort is required in studying its oceanographic and bio-geochemical structure. The socio-economic importance of the Mediterranean Sea and its vulnerability to anthropogenic contamination has prompted the North African countries to develop a joint regional approach to solve marine environmental problems.
International Atomic Energy Agency carried out from 2000 a regional technical cooperation project “Contamination Assessment of the South Mediterranean Sea” with the aim to contribute to better understanding of contamination processes, and to assist North African Member States (Algeria, Egypt, Libya, Morocco and Tunisia) in developing of isotopic tools for investigation of marine processes through capacity building and training in sampling and analytical techniques.
The objectives of the project are to develop a regional capability in North African countries to assess radioactive and non-radioactive contaminants using nuclear and isotopic techniques; to investigate marine processes in order to better understand water and sediment dynamics and the behaviour of contaminants; to synthesize data on levels of radioactive and non-radioactive contaminants (heavy metals, organic compounds) in water, sediment and biota; to investigate processes in the water column affecting primary productivity in the Sea and its potential impact on fisheries; to estimate spatial and temporal trends in contamination of the Sea and to develop computer models to investigate dispersion of contaminants.
17

S-H. Lee et al.
2
Results obtained after 3 sampling/training cruises carried out in the framework of the project (with IAEA support), covering EEZ of Algeria, Morocco and Tunisia will be presented.
The recent expedition carried out from 14 to 29 June 2004 using a research vessel ‘Mohammed Seddik Benyahia’ comprised lectures and demonstrations on sampling protocols for sampling and analyses of radioactive and non-radioactive contaminants at sea. The sampling work was carried out at 4 stations in the EEZ of Tunisia and Eastern Algeria (Fig. 1). To determine physical and chemical characteristics of the studied sites, CTD and general chemistry analyses including nutrients were performed on board. Seawater samples were collected at several layers using large volume water samplers. Sequential pre-concentration of radionuclides (238Pu, 239,240Pu, 241Am 137Cs and 90Sr ) was done on board. Sediment samples were collected at 4 stations as well using a multi-corer. Biota samples (zooplankton) were collected during the night using plankton nets and will be analysed for naturally occurring 210Po, as well as for anthropogenic radionuclides (plutonium isotopes, 241Am, and 137Cs).
FIG. 1 Sampling stations during the 2004 cruise.
[1] SAMMARI, C., MILLOT, C., TAUPIER-LETAGE, I., STEFANI, A., BRAHIM, M., Hydrological characteristics in the Tunisia-Sardinia-Sicily area during spring 1995, Deep-Sea Res. I 46 (1999) 1671-1703.
[2] STANSFIELD, K., GASPARINI, G.P., SMEED, D.A., High-resolution observations of the path of the overflow from the Sicily Strait, Deep-Sea Res. I 50 (2003) 1129-1149.
•Algiers
Algeria Tunisia
•• • St. 2
•
•
St. 1 St. 3
St. 4
Tunis
Sicily
Sardinia West Mediterranean
Mediterranean
18

EXTENDED SYNOPSIS IAEA-CN-118/11
TOPIC: THE MEDITERRANEAN
1
Distribution of Anthropogenic Radionuclides in the Moroccan Marine Environment
M. Benmansoura, A. Laissaouia, M. Ibn Majaha, S. Mulsowb, P. Povinecb,S. Benbrahimc, A. Chafikc
a Centre National de l'Energie, des Sciences et des Techniques Nucléaires (CNESTEN), Rabat, Morocco
bInternational Atomic Energy Agency - Marine Environment Laboratory (IAEA-MEL), Monaco
c Institut National de Recherche Halieutique (INRH), Casablanca, Morocco
E-mail address of main author: [email protected]
Morocco has a long coast of 3500 km of which 500 km are on the south Mediterranean sea where little information on artificial radionuclides concentrations is available. There is no existing data in the Atlantic Ocean coast. The aim of this study carried out within the regional Project RAF7 held in co-operation with IAEA is the exploration of levels of radionuclides concentrations in the Moroccan marine environment with special emphasis on the anthropogenic radioactive contaminants; 137Cs, 239,240Pu and 241Am. In addition, concentration profiles of natural radionuclides as 210Pb and 226Ra in sediment were also determined allowing to estimate, through the excess Lead (210Pbex), the sedimentation rate and to reconstruct the history of contaminants.
Samples were collected along 4 stations of which 3 are in the Mediterranean sea during a cruise aboard the oceanographic vessel Charif Al Idrissi of INRH. One station near "Mdiq" (St.2) was extensively explored by collecting four samples of water at different depths until 900m and a bottom sediment core collected at a depth of 800 m using an Ocean Instrument Box corer. Sequential concentrations of radionuclides have been carried out on board by co-precipitating 239,240Pu and 241Am with MnO2 and the adsorption of 137Cs onto AMP. The sediment cores were sectioned into series of horizontal slices of 0.5 to 1 cm thickness to be analysed.
137Cs, 210Pb, 226Ra activities were measured by γ spectrometry using a CANBERRA HPGe detector with resolution of 2 keV and efficiency of 50%. For the α emitters as Pu and Am isotopes, a suitable radiochemical method was applied based on the separation of Pu from Am by anion -exchange resin AG1x8. Am was co-precipitated with calcium oxalate and extracted into DDCP and finally separated from rare earths by anion exchange in mineral acids-methanol media. Both Pu and Am fraction are electrodeposited and the resulting alpha-sources are counted by ORTEC EG&G alpha spectrometry. The determination of 210Pb in sediment samples is carried out also through the measure of 210Po by alpha spectrometry after total digestion of the samples and spontaneous deposition of Po.
The preliminary results obtained showed that the average activities in surface water were 2.82 mBq/L for 137Cs, 8.69 µBq/L for 239,240Pu and 1.53 µBq/L for 241Am respectively while the
19

M. Benmansour et al.
2
mean 239,240Pu/137Cs and 241Am/239,240Pu activity ratios were 0.0032 and 0.18. The activities values found all agree in magnitude with those reported in recent studies [1, 2] carried out in the Western Mediterranean Sea and are within the range of concentration originating from the global weapons tests fallout. For the water column, 137Cs and 239,240Pu vertical distribut ions at St.2 show a sub-surface maximum found at depth close to 500m. Mitchell et al. [3] reported a maximum in Pu concentration (29 µBq/L) at a depth around 500m in the Alboran Sea. On the other hand, the 239,240Pu/137Cs activity ratio increases with depth suggesting the progressive separation of Pu from Cs due to the association of the transuranic elements with suspended matter.
Regarding to the sediment core, the concentration profiles of 137Cs and 239,240Pu are plotted in Fig.1 and revealed the presence of sub-surface maximum located around 5 cm corresponding certainly to the maximum deposition of fallout occurred in 1963. The activities ranged between 1.9-6.3 Bq/kg for 137Cs and between 0.3-0.8 Bq/kg for 239,240Pu. The mean 239,240Pu/137Cs activity ratio was about 0.11.
Furthermore, an average sedimentation rate of 0.124 cm/y was obtained by applying the CRC model to 210Pb in excess profile. The origin of maximum concentrations for 137Cs and 239,240Pu was confirmed.
FIG. 1. 137Cs and 239,240Pu profiles in the sediment core collected from the St. 2 (Mdiq).
[1] LEÓN VINTRÓ, L., MITCHELL, P.I, CONDREN, O.M., DOWNES, A.B., PAPUCCI, C., DELFANTI, R., Vertical and horizontal fluxes of plutonium and americium in the western Mediterranean and the strait of Gibraltar, Sci. Total Environ. 237/238 (1999) 77-91.
[2] FOWLER, S.W, NOSHKIN, V.E., LA ROSA, J., GASTAUD, J., Temporal variations in plutonium and americium inventories and their relation to vertical transport in the northwestern Mediterranean Sea, Limno. Oceanogr. 45 2 (2000) 446-458.
[3] MITCHELL, P.I., VIVES I BATLLE, I., DOWNES, A.B., CONDREN, O.M., LEÓN VINTRÓ, L., SÁNCHEZ-CABEZA, J.A., Recent observations on the physico-chemical speciation of plutonium in the Irish Sea and the Western Mediterranean, Appl. Radiat. Isotop. 46 11 (1995) 1175-1190.
12
10
8
6
4
2
00,0 0,2 0,4 0,6 0,8 1 2 3 4 5 6 7 8
Pu-239;240 Cs-137
Activities (Bq/kg)
Dep
th in
sed
imen
t (cm
)
12
10
8
6
4
2
00,0 0,2 0,4 0,6 0,8 1 2 3 4 5 6 7 8
Pu-239;240 Cs-137
Activities (Bq/kg)
Dep
th in
sed
imen
t (cm
)
20

EXTENDED SYNOPSIS IAEA-CN-118/12
TOPIC: THE MEDITERRANEAN
1
Concentration of 137CS in Surface and Deep Water along the Algerian Coast
A. Noureddine , M. Menacer, R. Boudjenoun, A. Hammadi, M. Benkrid
Laboratoire d’Etudes d’Impact Radiologique, Centre de Recherche Nucléaire d’Alger (LEIR/CRNA), 2 Bd F. Fnon, BP 399 Alger-Gare, 16000 Algiers, Algeria
E-mail address of main author: [email protected]
Despite the availability of extensive information about the levels of artificial radioactive contamination of the Mediterranean Sea, the problem of assessment of this radioactive contamination to the south part of the Mediterranean Sea is of current interest. The main sources of contamination are fallout from nuclear tests and Tchernobyl accident in 1986. 137Cs which is an anthropogenic radionuclide, conservative in the open sea, remains the potential contributor of contamination in the Mediterranean Sea, although used as radioactive tracer.
A total number of 25, between surface and deep seawater samples (40-70 L), were collected in different water masses during Oct.-Nov. 1999, along the Algerian coast, from Ghazaouet (N35°10’90, W02°05’000) to Skikda (N36°56’107, E06°55’857), covering a distance of around 1000 km, by the " Laboratoire d’Etudes d’Impact Radiologique" (LEIR/CRNA), on board the M.S. Benyahia, Research Vessel of (ISMAL), to determine 137Cs concentration. Sampling of surface seawater was performed using a pump system, however, for water column, a 50 L Niskin PVC water – bottle sampler was used. Multiparameter probe was also used to determine vertical profiles of temperature, salinity and pH in water column samples at different stations.
137Cs was pre-concentrated on board for some samples and in the laboratory for others, by co-precipitation on ammonium molybdo-phosphate (AMP) technique [1, 2,] at pH (1-2). The chemical yield was determined using the injected 134Cs isotope tracer activity.
After pretreated and dried the AMP precipitates, they were analysed by direct counting gamma spectrometry, using a high purity germanium detector of relative efficiency of 20.6% and resolution (FWHM) of 1.8 keV at 1332 keV gamma-energy of 60Co.
The accuracy of the results is checked by participation to the IAEA-385 intercomparison exercise. Detection efficiency is determined by preparation of two standard samples of same geometries, in which 13 Bq activity of caesium isotope tracers was injected. Concentration of surface seawater ranges from 1.69 to 2.26 Bq/m3 with a mean value of 1.87 Bq/m3 and from 1.72 to 3.31 Bq/m3 for water column samples with an average value of 1.78, 1.93, 2.28 and 2.5 Bq/m3 for Ghazaouet, Mostaganem, Alger and Annaba stations, respectively.
After comparison with the literature [3], we found that our values are close to the mean value of the Mediterranean Sea in coastal regions. According to the results of concentration, and although they were obtained by using simple means of sampling, we observe an increase of activity from western to eastern coast of Algeria, and an activity peak at a depth of about 100 m. Obtained profiles are shown in Fig. 1 and seem to be similar to those already obtained in the region [4-7].
21

A. Noureddine et al.
2
Stat. Alger 4
0
50
100
150
200
2 2,2 2,4 2,6
Conc. (Bq/m3)
Dep
th (
m)
Série1
Stat. Annaba 2
0
10
20
30
40
0 2 4Conc. (Bq/m3)
Dep
th (m
)
Série1
FIG. 1. 137Cs profiles in seawater at 4 different stations along the Algerian coast.
[1] ROOS, P., HOLM, E., PERSSON, R.B.R., Comparison of AMP precipitate method and impregnated Cu2[Fe(CN)6] filters for the determination of radiocesium concentrations in natural waters, Nucl. Instr. Meth. A 39 (1994) 282-286.
[2] FOLSOM, T.R., SARUHASHI, K., A comparison of analytical techniques used for determination of fallout caesium in seawater for oceanographic purpose, J. Radiat. Res. 4 (1963) 39-53.
[3] DELFANTI, R., et al., The new distribution of the tracer 137Cs in the eastern Mediterranean relationship to the deepwater transient, CIESM Rapport du 36e Congrés de la CIESM, Monte-Carlo (Monaco) 36 (2001).
[4] BUFFONI, G., CAPPELLETTI, A., On the accumulation-dispersion processes of the tracer 137Cs in the Italian Seas, J. Environ. Radioact. 37 2 (1997) 155-173.
[5] GHEDDOU, A., et al., Distribution of 137Cs in surface and deep water in the central part of Algerian littoral, IAEA-TECDOC-1094, Vienna (1999) 540-542.
[6] INTERNATIONAL ATOMIC ENERGY AGENCY, Inventories of selected radionuclides in the oceans, IAEA-TECDOC-481, Vienna (1998).
[7] GUEGUENIAT, P., Données nouvelles sur la dispersion des radionucléides dans la Manche, In: Impact of radionuclides into the marine environment, Proceedings Series, IAEA, Vienna (1981) 481-499.
Stat. Ghaz. 4
0
50
100
150
200
0 1 2 3Conc. (Bq/m3)
Dep
th (m
)
Série1
Stat. Mosta. 2
0
10
20
30
40
50
60
0 1 2 3Conc. (Bq/m3)
Dep
th(m
)
Série1
22

EXTENDED SYNOPSIS IAEA-CN-118/13
TOPIC: THE MEDITERRANEAN
1
210Po in Mussels (Mytilus Galloprovincialis L.1758) and Sediments at Aegean Sea Turkish Coast using Alpha Spectroscopy
A. Ugura, G. Yenera, S. Topçuoglub, S. Aközcana, U. Sunluc
Ege University, Institute of Nuclear Sciences, Bornova, Izmir, Turkey
Çekmece Nuclear Research and Training Center, Atatürk Airport, 34831 Istanbul, Turkey
Ege University, Faculty of Fisheries, Department of Hydrobiology, Bornova, Izmir, Turkey
E-mail address of main author: [email protected]
In the marine environment 210Po is largely produced from the decay of 210Pb deposited from the atmosphere. Although they exist everywhere in the environment at the same time, the concentration of these radionuclides in river-estuarine systems may vary widely due to geology of the watershed and chemical weathering conditions. Moreover, natural levels of these radionuclides in aquatic ecosystems increased from phosphate, fossil fuel, oil industries and use of artificial fertilizers [1].
Several studies have demonstrated that the natural alpha emitting radionuclide 210Po is accumulated to exceptionally high levels in tissues of a variety of marine organisms, well above levels of the parent radionuclide 210Pb. The behaviour of 210Po in the ocean differs that of 210Pb, especially because of the higher affinity of 210Po for organic matter [2].
The Turkish coastal zone of the Aegean Sea has been heavily industrialized in the last 25 years resulting in a considerable input of wastes to the coastal marine ecosystem. Fish and other edible marine organisms consumption is relatively higher at the region than at other parts of Turkey, therefore it is important to determine the additional dietary radiation dose received by population originating seafood.
The information on levels and distribution of natural radionuclides is however very rare because there exists limited number of investigations conducted on this coast line [3, 4]. For this reason, an IAEA Research Contract Project (B5-TUR-31834) has been started by the Institute for the Turkish coast of the Aegean Sea. In this work 210Po and 210Pb measurements are realised using alpha spectrometry after radiochemical deposition techniques for which the details are given elsewhere [3]. The sampling stations are selected at the sites where there exist intense industrial activities nearby. Çanakkale (Dardanel), Ayvalik, Foça, Izmir Bay and Gökova Bay were chosen as study areas (Fig. 1). Gökova Bay is attributed special importance because it has been polluted by three major uraniferous coal fired power plants since 1982.
A work conducted 2 years ago at Foça located at the north of Izmir Bay where there exists petroleum refineries exhibited elevated levels 210Po concentrations, 1205±100 Bq kg-1dry weight in Mytilus galloprovincialis. These results are significantly higher than those measured in Black sea mussels (100-162 Bq kg-1 dry weight.) studied in a previous work realised [5]. So Foça region is being studied for further investigations. For Izmir Bay, preliminary 210Po
23

A. Ugur et al.
2
measurements at some stations give 180±10 and 119±12 Bq kg-1dry weight in mussels and sediments respectively for average concentrations. These values are in agreement with the range observed along the Turkish Black Sea shore [5].
FIG. 1. Location of sampling sites in the Aegean Sea.
[1] MCDONALD, P., BAXTER, M.S., SCOTT, E.M., Technological Enhancement of Natural Radionuclides in the Marine Environment, J. Environ. Radioact. 32 (1996) 67-90.
[2] CARVALHO, F.P., Polonium-210 in marine organisms: a wide range of natural radiation dose domains. Radiat. Prot. Dosimetry 24 (1988) 113-117.
[3] UGUR, A., YENER, G., BASSARI, A., Trace metals and 210Po(210Pb) concentrations in mussels (Mytilus galloprovincialis) consumed at western Anatolia, App. Radiat. Isot. 57 (2002) 565-571.
[4] UGUR-TANBAY, A., YENER, G., Accumulation rates and sediment deposition in the Gökova Bay in Aegean Sea Turkish Coast, App. Radiat. Isot. 55 (2001) 581-588.
[5] TOPCUOGLU, S., Black Sea Ecology, Pollution Research in Turkey of the Marine Environment, IAEA Bulletin 42 4 (2000) 12-14.
24

EXTENDED SYNOPSIS IAEA-CN-118/14
TOPIC: THE MEDITERRANEAN
1
Black Sea Radioactivity Assessment and Tracer Studies: A Regional Technical Co-operation
I. Osvatha, M. Samieib, A. Chupovb, V. Egorovc, G. Goktepe d, A. Nikitine, S. Pagavaf, N. Paning, Gy. Ruzsah, K. Shimkus i, B. Veleva1j, O. Voitsekhovitchk
a Marine Environment Laboratory, International Atomic Energy Agency, Monaco
bTechnical Co-operation Department, IAEA, Vienna, Austria
c Institute of Biology of Southern Seas, Sevastopol, Ukraine
dCekmece Nuclear Training and Research Centre, Istanbul, Turkey
e SPA “Typhoon”, Obninsk, Russia
f Tbilisi State University, Tbilisi, Georgia
gNational Institute of Geology and Geo-Ecology - GeoEcoMar, Bucharest, Romania
h National Institute for Environmental Research and Engineering, Bucharest, Romania
i P.P. Shirshov” Institute of Oceanology – Southern Branch, Gelendzhik, Russia
j National Institute of Meteorology and Hydrology, Sofia, Bulgaria
k Ukrainian Hydrometeorological Institute, Kiev, Ukraine
E-mail address of main author: I. [email protected]
This paper summarises highlights of a recently finalised IAEA Regional Technical Co-operation Project, called “Marine Environmental Assessment of the Black Sea Region”. This project aimed to complement other on-going regional programmes by addressing those gaps in regional capabilities, co-ordination and scientific investigations, which fall within the Agency’s technical competence. The main objectives of the project were (i) to develop capabilities in the region to reliably assess Black Sea radioactive and non-radioactive pollution by using nuclear techniques; (ii) to implement a regionally co-ordinated monitoring programme for radionuclides in coastal waters; and (iii) to assess key processes controlling the fate of pollutants in the Black Sea by using radionuclides as tracers. The project was designed based on requests and proposals received from IAEA Member States and involved a nucleus of nine main counterpart institutes and twelve collaborating institutes/laboratories in the six riparian countries: Bulgaria, Georgia, Romania, the Russian Federation, Turkey and Ukraine. The IAEA contribution to the project amounted to $1.8 million over a period of 6 years (1995-2001), including the supply and commissioning of sampling and radiometric equipment and laboratory materials, expert visits, training courses, workshops, a seminar, fellowships, scientific visits, research vessel services and organisation of two Black Sea international scientific cruises, technical meetings, planning and co-ordination meetings and Ministerial meetings. The project thus had a strong capacity building component in support of
25

I. Osvath et al.
2
national programmes and benefited in turn from commitment and considerable human resources, infrastructure and networking contributed by the national counterparts. Besides upgraded radioanalytical and assessment capabilities in the region, the project resulted in a large amount of new data, published so far in over 140 papers.
A programme for co-ordinated monitoring of coastal marine radioactivity was initiated at 15 stations around the Black Sea. Seawater, beach deposits (sand) and selected species of seaweed, mollusks and fish were collected once a year (twice yearly in the case of water) and analysed for 137Cs by all laboratories and for additional radionuclides (90Sr, 239,240Pu, 210Po) by a few laboratories.
Two international scientific cruises organized in 1998 and 2000 (Fig. 1) aimed to provide on-board training and to foster collaborative studies. Their main objectives were to assess contaminants in the marine environment, with a focus on anthropogenic radionuclides; to study particle fluxes, sedimentation, water mass mixing and eutrophication using radionuclides as tracers; and to perform trend monitoring at reference stations.
FIG. 1. Location of stations occupied during the IAEA Black Sea scientific cruises in 1998 (full circles, italics) and year 2000 (open circles, bold). The field and laboratory work was carried out according to harmonized methodologies and supported through proficiency tests and intercomparison exercises.
Selected results will be presented in this paper and several other posters and oral presentations at this conference present details on subjects like 210Po and associated doses, sedimentation and sediment inventories of radionuclides in the abyssal Black Sea and radiotracer chronology of metal pollution in the Eastern Black Sea.
Acknowledgement: This work was carried out in the framework of the International Technical IAEA Project RER/2003 'Marine Environmental Assessment in the Black Sea Region”.
26

EXTENDED SYNOPSIS IAEA-CN-118/15
TOPIC: THE MEDITERRANEAN
1
210Po Concentration in Fish, Algae, Mussel and Beach Sand Samples in Turkish Coast of the Black Sea
N. Güngör, E. Güngör, B. G. Göktepe, G. Köksal
Çekmece Nuclear Research Center, P.O. Box 1, 34149 Atatürk Airport , Istanbul, Turkey
E-mail address of main author: [email protected]
The natural radionuclide 210Po is the major contributor to the radiation dose received by humans from the sea food consumption. The main source of 210Po in the environment is the exhalation of 222Rn gas from the ground into the atmosphere. The radionuclides fall to the sea water and oceans together with aerosol particles by washout and sedimentation. The other source include burning of fossil fuel, uranium, phosphate and lead ore processing industries and tetraethyl lead used for car engines. The entrance of the radionuclides to the human body are via inhalation or ingestion. The major contribution for 210Po received via food consumption especially is originated from fish and shell fish by which it is strongly accumulated in relatively high concentration [1, 2]. This can lead to increase the radiation dose delivered to man by significant factor.
In this study the concentration of 210Po were determined in algae, fish, mussel and beach sand samples collected from four different coastal zones of the Black Sea in Turkey from selected stations namely Sile, Trabzon, Sinop and Zonguldak during the period of 1998-2001. The sampling and analysis were carried out as a part of the “Marine Environmental Assessment of the Black Sea Region” Technical Cooperation Project, RER/2/003 undertaken by the six Black Sea countries which is supported by IAEA.
For the determination of 210Po in samples the standard techniques was used [3]. Known activity of 209Po were added as an isotopic tracer. Samples were completely dissolved with mineral acids (HNO3, H2O2). When the solution was clear, concentrated HCl was added and the solution was gently evaporated to near dryness. After evaporation, polonium was plated onto silver disc in 0.5 M HCl in presence of ascorbic acid. Alpha counting of sample was performed using a silicon surface barrier detectors connected to a PC.
The mean 210Po concentrations measured in mussel, algae, fish and beach sand samples from the four different locations on Turkish coast of Black Sea namely Sile, Sinop, Trabzon and Zonguldak are presented in Table I. The mean 210Po concentrations over the study period in the beach sand and algae was observed to vary between 8.3-18.5 Bq.kg-1 dry and 15.4-29.9 Bq.kg-1 dry, respectively while those in fish samples for T. trachurus, M. Barbatus and M. euxinus were found to vary between 1.9-7.4 Bq.kg-1 wet, 5.8-6.7 Bq.kg-1 wet and 1.3-1.6 Bq.kg-1 wet respectively. The mean 210Po concentration of the mussels used for human consumption having shell length ≥ 5 cm averages is found to be changing between 18.4-32.1 Bq.kg-1 wet.
27

N. Güngor et al.
2
Reliable systematic data is accumulated as a result of joint monitoring work of the Marine Environmental Assessment of the Black Sea Region Technical Cooperation Project. A preliminary comparison of the values obtained by the project group are in good agreement [4].
However further study on the sea food consumption habits of the Turkish Black Sea population and intake dose assessment for 210Po must be undertaken in order to cover public health concern due to radioactivity in the Black Sea marine environment.
TABLE I. MEAN 210Po CONCENTRATION VALUES OF MONITORING SAMPLES COLLECTED THE FOUR DIFFERENT LOCATIONS ON TURKISH COAST OF BLACK SEA
Station Algae T. trachurus M. barbatus M. euxinus M. galloprovincialis Sand
Bq.kg-1 dry Bq.kg-1 wet Bq.kg-1 wet Bq.kg-1 wet Bq.kg-1 wet Bq.kg-1 dry
Sile 15,4±8,4 2,5±0,7 5,8±1,3 1,3±0,1 21,9±8,4 11,9±7,3
Sinop 18,9±4,5 6,3±0,7 1,6±0,8 32,1±12,9 8,3±1,5
Trabzon 16,0±2,9 7,4±0,9 6,7±1,3 1,4±0,5 18,4±3,9 18,5±2,1
Zonguldak 29,9±5,0 1,9±0,3 22,8±8,1 10,8±2,9
[1] CHERRY, R.D., SHANNON, L.V., The alpha radioactivity of marine organisms, Atomic Energy Rev. 12 (1974) 3-45.
[2] CARVALHO, F.P., 210Po and 210Pb intake by the Portuguese population : the contribution of seafood in the dietary intake of 210Po and 210Pb, Health Phys. 69 (1995) 469-480.
[3] FLYNN, W.W., The determination of low levels of Polonium-210 in environmental materials, Anal. Chim. Acta 43 (1968) 221-227.
[4] INTERNATIONAL ATOMIC ENERGY AGENCY, Regional Technical Cooperation Project RER/2/003, Marine Environmental Assessment of the Black Sea, Working Material, IAEA, Vienna (2004) 168-175.
28

EXTENDED SYNOPSIS IAEA-CN-118/16
TOPIC: CLIMATE CHANGE
1
Decadal and Centennial Variability of Climate Change in the Pacific Ocean
E. R. M. Druffel
University of California, Irvine, California, U.S.A
E-mail address of main author: [email protected]
The following questions will be addressed:
1) What do 14C records in surface corals tell us about changes in circulation and climate?
and
2) Do changes in climate during the pre-anthropogenic period (< A.D. 1850) resemble those during the twentieth century?
29

EXTENED SYNOPSIS IAEA-CN-118/17
TOPIC: CLIMATE CHANGE
1
Holocene Climate Variability along the Antarctic Peninsula and Linkage with a Terrestrial Paleoclimate Record from South America
R. Dunbara, A. Ravelob, A. Leventerc, E. Domackd
a Geological and Environmental Sciences, Stanford University, Stanford CA 94305, USA
bMarine Science ProgramUniversity of California, Santa Cruz, CA 95064, USA
c Geology Department, Colgate University, Hamilton, NY 13346, USA
d Geology Department, Hamilton College, Clinton, NY 13323, USA
E-mail address of main author: [email protected]
The Antarctic Peninsula is highly sensitive to climate change and is currently experiencing rapid and unusual warming. Here we examine Holocene variability as seen in a multi-tracer stable isotopic study using a 50 m sedimentary section spanning the past 12,000 years from the wqest coast of the Antarctic Peninsula. In our synthesis, we make use of the Palmer Deep ODP site 1098 drill core. These sediments comprise the first high resolution, continuous, Late Pleistocene through Holocene sediment record from the Antarctic continental margin. We analyzed biogenic opal, organic C and N concentrations, and 13C/12C and 15N/14N isotopic ratios of sedimentary organic matter every 2.5 cm downcore (1600 samp les, sample interval of about 7 years). We interpret the main changes in these downcore parameters as indicating substantial variability in productivity. We note that 1) that the lowest productivity of the Holocene occurred during the past 1.5 kyrs BP, 2) Holocene variability in productivity is large, about a factor of 3, 3) A mid-Holocene productivity maximum is coeval with many mid- and low-latitude Holocene paleoclimate records, and 4) evidence is strong for solar forcing via both total irradiance and precessional effects. Given the modern link between sea ice and net annual primary production along the Antarctic margin, it seems likely that episodes of enhanced productivity, both during the middle Holocene and during centennial productivity peaks were associated with reduced ice cover. We explore several mechanisms by which sea ice cover might respond in an fashion consistent with our observations: 1) reduced westerly winds (less evaporative cooling), 2) South Pacific gyre spin-up (less pole-equator T contrast), 3) more local warm deep water upwelling. It is possible that the basic ENSO dynamic we know from studies of interannual variability in the tropical and North Pacific also regulates climate change at decadal to millennial timescales in the South Pacific. In this regard, we note that the strongest Southern Oscillation atmospheric pressure anomaly in the Southern Ocean is in the Bellingshausen/Amundsen seas, upwind from our Antarctic Peninsula study site. We see temporal coherence between a rapid mid-Holocene excursion at site 1098 and a similarly rapid 85 m lowering of the level of Lake Titicaca, at 14°S in the South American Altiplano, again suggestive of a Pacific Ocean control. Comparison with other Antarctic margin paleoclimate records from East Antarctica and the Ross Sea as well as with terrestrial records from Australia and New Zealand generally shows heterogeneity across longitudes and coherence across latitudes. However, convincing conclusions along these lines are still difficult because of problems in comparing chronologies at sub-millennial timescales between marine records, ice cores, and terrestrial records.
30

EXTENDED SYNOPSIS IAEA-CN-118/18
TOPIC: CLIMATE CHANGE
1
High-Resolution Bomb Pulse Radiocarbon Records from Corals, Spanning the Central and Southeastern Pacific Ocean
J. Warren Becka, T. Corregeb, G. Burra
a NSF-Arizona AMS Facility, University of Arizona, Tucson, Arizona 85721 U. S. A.
bInstitut de Recherche pour le Developpement, (IRD, ex ORSTOM), BPA5, Nouméa, New Caledonia
E-mail address of main author: [email protected]
Pacific ocean radiocarbon levels have significantly increased during the last half century as a result of atmospheric nuclear testing, mainly in the 1950s and 1960s. Ambient oceanic radiocarbon levels are recorded in corals living in the surface mixed layer. Several high resolution coral radiocarbon records are presented from the central and eastern south Pacific Ocean, spanning Christmas Island (2°N, 157°W), the Marquesas (8°S, 140°W), and Easter Island (27°S, 109°W). These three records span the bomb-pulse period, at a typical resolution of approximately 3-6 samples per year.
The Record from Christmas Island shows large inter-annual variability whose variations strongly correlate with ENSO. This correlation is due in part to horizontal advection of surface waters in the equatorial Pacific, but is also controlled by variable vertical fluxes of radiocarbon depleted waters entering the mixed layer from the thermocline. Thus, this radiocarbon record may be used as a proxy for ENSO timing and intensity. The Marquisas record shows less interannual variability, though this record is at lower resolution. The Easter Island record shows the least amount of interannual variability. The total amplitude of the bomb pulse is largest at Easter Island (~225 ‰), intermediate at Christmas Island (~175‰), and lowest at the Marquesas (~155‰). As expected, Pre-bomb pulse radiocarbon levels were lowest near the equator (Christmas at ~-65‰) due to the influence of radiocarbon–depleted waters upwelled from the thermocline, and highest at Easter Island (~-43‰), which is close to the center of surface convergence in the southern hemisphere sub-tropical gyre. Radiocarbon levels reached nearly +200‰ at the peak of the bomb pulse at Easter Island, but only achieved levels of ~90‰ at the Marquesas, and ~110‰ at Christmas Island.
31

EXTENDED SYNOPSIS IAEA-CN-118/19
TOPIC: CLIMATE CHANGE
1
Glacial Climate Transitions in the Southern Hemisphere - New Insights from Cosmogenic 10Be in Rocks and 14C in Tree-Rings
D. Fink
ANSTO Environment, ANSTO, PMB 1, Menai, NSW 2234, Australia
E-mail address of main author: [email protected]
The study of global climate change recorded and archived in corals, tree-rings, glacial deposits, ocean sediments and ice cores reveals a complex scale of variations ranging from major glacial cycles (100,000 years), millennial (1,000 years) timescales and even decadal changes (i.e. ENSO). ‘Global patterns’ of climate cycles are inferred principally from Northern Hemisphere records and modelling approaches. For the major glacial- interglacial cycles this seems to be reliable – however data is now emerging that on the millennial scale of climate change particularly over the Last Glacial-Interglacial Transition (20,000 to 10,000 years ago) and through the Holocene, things are not so simple, let alone ‘global’. Critical questions are now being asked as to the synchronicity, intensity and mode of abrupt climate patterns across Earth’s hemispheres. However, with a paucity of Southern Hemisphere studies, answers are not readily available.
Long- lived cosmogenic radioisotopes, such as 10Be, 14C, 26Al and 36Cl, are produced by cosmic ray bombardment of Earth’s atmosphere and lithosphere. The measurement by Accelerator Mass Spectrometry of concentration profiles of these radioactive ‘clocks’ and ‘tracers‘ in climate archives is emerging as key parameters to provide the essential chronological frameworks and rates of climate processes to address these vexing questions.
This talk will present 2 examples of cosmogenic isotopes in the study of Southern Hemisphere climate change records. The first relates to application of in-situ produced 10Be and 26Al in glacially transported surface rocks to determine the chronology of glacial cycles in Tasmania and New Zealand during the last deglaciation. The Younger Dryas (YD) is a major short term and intense climatic reversal towards colder temperatures occurring between 11,500-12,800 cal year BP superimposed on the last deglaciation. Its presence has now been identified in most, if not all, of the northern hemisphere archives of late Quaternary climate change. Recently, investigations have centered on searching for a cooling reversal coeval with the YD chronozone in Southern Hemisphere archives. The implications of such an appraisal are significant as a positive outcome directly supports the presence of a global triggering mechanism coupled with climate change synchronicity across the equator.
The second deals with a detailed comparison in the variations of atmospheric radiocarbon recorded in tropical tree rings from Thailand to that in mid- latitude Huon Pine tree-rings from Tasmania during the Little Ice Age (LIA) from ~1600-1800 AD. Such a study allows a better understanding of the mechanisms that control regional 14C atmospheric concentration offsets in terms of atmospheric mixing and the role of the Asian monsoon during periods of known Northern Hemisphere climate cooling such as occurred in the LIA.
32

EXTENDED SYNOPSIS IAEA-CN-118/20
TOPIC: CLIMATE CHANGE
1
Century-to-Decade Scale Modulation of ENSO Recorded by Postglacial Laminated Sediments from the Peru Continental Margin
G. Skilbecka, M. Gaganb, I. Goodwinc, M. Watsona, D. Finkd
a Department of Environmental Sciences, University of Technology, Sydney, P.O. Box 123 Broadway, Sydney NSW 2007, Australia
bResearch School of Earth Sciences, Australian National University, Canberra A.C.T. 0200, Australia
c School of Environmental and Life Sciences, University of Newcastle, Callaghan NSW 2308, Australia
dANSTO-Environment, PMB 1, Menai NSW 2234, Australia
E-mail address of main author: [email protected]
Cores collected from three sites on the continental margin of Peru during ODP Leg 201 recovered >5 m of LGM-recent sediment. At Site 1227 Holocene sediments are absent, but a well preserved early last glacial- interglacial transition (LGIT) section spanning ~17,200-15,900 cal yrBP is present. The sediments are predominantly diatomaceous oozes with subtle dark and light laminations which may be annual in origin. The chronology of drill-core at this site is well-constrained by five bulk sediment 14C dates that define a linear sedimentation rate of ~270 cm/ka [1].
In contrast, Holocene sediments are well-represented at Sites 1228 and 1229. Sedimentation rates over this period suggest the Holocene can be subdivided into two regimes. The older period spans the early and middle Holocene (~10,000 yrBP to ~2,800 yrBP) during which time the sedimentation rate was relatively slow at 4-6 cm/ka. However, we cannot exclude the possibility of unconformities in this part of the stratigraphic section, and this rate should therefore be considered a minimum. From ~2,800 yrBP to the present day, the chronology at both sites is well defined by multiple 14C ages that allow us to confidently define linear sedimentation rates of 70-100 cm/ka [1]. At both sites, the late Holocene appears to be stratigraphically complete.
In order to investigate an El Nino origin for the laminae on this part of the Peru shelf, we have undertaken two independent lines of study. First, high-resolution (0.1 mm per pixel) scanned colour images were analysed for all of the cores. For the early LGIT and the late Holocene, the chronological model indicates that sub-annual layers can be resolved, where present. Accordingly, we have used the red colour intensity band from the scanned images to carry out time series analysis of ENSO-band (2-8 year) variability. Analysis of Hole 1228B shows two cyclicity peaks in the ENSO band over the past 10 ka. One of these, at a peak period of 5.3 yr, dominates over the last 3 ka, with the overall Holocene pattern very similar to that shown by Rodbell et al. [2], Moy et al. [3], and Riedinger et al. [4]. In contrast, spectral analysis of ENSO band data from Hole 1227B, shows a strong decadal variance peaking at 16.5 and 22.5 yr and only weak variance in the ENSO band (4.7 yr). In addition, there is a well-developed
33

G. Skilbeck et al.
2
oscillation in the variance of these data with cyclicity of about 110 yr which we believe is similar to that proposed by [5].
We have sought to test that the laminations do indeed contain a climate signal by undertaking several geochemical and mineralogical studies. The sediments are dominantly diatomaceous oozes, but contain other minor components, including terrigenous sediment and organic matter. We analysed δ13C of bulk organic matter, δ18O of planktonic foraminifer tests, organic carbon content, carbonate content, and terrigenous sediment (quartz/feldspar) percentages of representative dark and light laminae in upper part of Hole 1227B. Our hypothesis is that El Nino events will produce warmer and wetter conditions (lower foraminiferal δ18O) and increased terrestrial sediment input (increased quartz and feldspar and lower δ13C of organic matter). At the same time, the bulk organic carbon and carbonate data will reflect a decline in water-column productivity driven by the suppression of upwelled nutrients during El Niño events. Taken together, our preliminary analyses indicate that the dark laminae represent periods of warmer sea surface temperatures and increased terrestrial runoff associated with El Nino events.
Independent time series and geochemical analysis of LGM-Holocene sediments from the Peru continental margin indicate the presence of an El Nino/La Nina climate signal preserved in alternating dark and light laminae. Time-series analysis of long (>1000 yr), stratigraphically continuous sequences from the late Holocene and the early LGIT reveal decadal (~15-20 yr) and century (~110 yr) scale modulation of ENSO climate variability.
We would like to thank Dennis Mather and the staff at The Australian Institute of Nuclear Science and Engineering (AINSE) for grants supporting radiocarbon dating in this project (Nos 02/169 & 04/139), and the Australian ODP Office for their assistance in providing funds for collection and analysis of material.
[1] SKILBECK, C.G., FINK, D., "Radiocarbon dating and sedimentation rates for Holocene-Late Pleistocene sediments, eastern equatorial Pacific and Peru continental margin", Controls on microbial communities in deeply buried sediments, eastern equatorial Pacific and Peru margin (D’HONDT, S.L., JØRGENSEN, B.B., MILLER, D.J., et al., Eds), Proc. ODP, Scientific Results [CD-ROM] 201: College Station TX (Ocean Drilling Program) (submitted).
[2] RODBELL, D.T., SELTZER, G.O., ANDERSON, D.M., ABBOTT, M.B., ENFIELD, D.B., NEWMAN, J.H., An ~15,000-year record of El Niño-driven alluviation in southwestern Ecuador, Science 283 (1999) 516-520.
[3] MOY, C.M., SELTZER, G.O., RODBELL, D.T., ANDERSON, D.M., Variability of El Niño/Southern Oscillation activity at millennial timescales during the Holocene epoch, Nature 420 (2002) 162-165.
[4] RIEDINGER, M.A., STEINITZ-KANNAN, M., LAST, W.M., BRENNER, M., A ~6100 14C yr record of El Niño activity from the Galapagos Islands, J. Paleolimnology 27 (2002) 1-7.
[5] TUDHOPE, A.W., CHILCOTT, C.P., MCCULLOCH, M.T., COOK, E.R., CHAPPELL, J., ELLAM, R.M., LEA, D.W., LOUGH, J.M., SHIMMIELD, G.B., Variability in the El Nino-Southern Oscillation through a glacial interglacial cycle. Science 291 5508 (2001) 1511-1517.
34

EXTENDED SYNOPSIS IAEA-CN-118/21
TOPIC: CLIMATE CHANGE
1
Invasion of Anthropogenic CO2 Recorded in Stable Isotopes of Planktonic Foraminifera from the Northern Gulf of Aqaba, Red Sea
S. Al-Rousana,b, J. Pätzoldb, S. Al-Moghrabia,c, G. Weferb
a Marine Science Station, P.O. Box 195, Aqaba 77110, Jordan
bFachbereich Geowissenschaften, Universität Bremen, D-28359 Bremen, Germany
c Aqaba Special Economic Zone Authority, P.O. Box 2565, Aqaba 77110, Jordan
E-mail address of the main author: [email protected]
The stable carbon isotopic composition of the planktonic foraminifera Globigerinoides sacculifer and Globigerinoides rubber (white) and sedimentary organic matter from the northern Gulf of Aqaba have been investigated to estimate changes in del 13CDIC in surface waters during the last 1000 years. The high sedimentation rates at the core sites (about 50 cm/k.y.) provide high temporal resolution (10 years). Recent sediments at the top of the cores reflect conditions younger than 1950s.
The del13C records of the planktonic foraminifera from three multicores display similar trends, showing a uniform and consistent pattern before the 1750s, and a gradual decrease of approximately 0.63‰ over the last two centuries (Fig. 1). This decrease seems to track the decrease of del13CDIC in surface waters, which is mainly caused by the increase of anthropogenic input of 13C-depleted CO2 into the atmosphere [1].
Similarly, a trend toward lighter values of the carbon isotopic composition of sedimentary organic matter (delδ13Corg) during the last 200 years supports the interpretation obtained from the planktonic foraminiferal del13C. Furthermore, direct measurements of seawater show that δ13C of the dissolved inorganic carbon (DIC) in the northern Gulf of Aqaba has decreased by about 0.44‰ during the period 1979-2000. The average annual decrease is 0.021‰, which is similar to that recorded globally [2, 3].
The δ13C values of planktonic foraminifera combined with organic matter δ13C from marine sediments are good indicators for reconstructing past changes in atmospheric CO2
concentrations from the northern Gulf of Aqaba.
35

S. Al-Rousan et al.
2
FIG. 1. Stable carbon isotope composition (del13C) of the planktonic foraminifera G. sacculifer and G. ruber, over the last 1000 years from three multicores (GeoB 5810-3, GeoB 5807-2 and GeoB 58013) collected in the northern Gulf of Aqaba, Red Sea. The arrows represent the calibrated 14C radiocarbon age positions. The grey bar indicates the transition zone between the pre-industrial and industrial periods.
[1] BEVERIDGE, N.A.S., SHACKLETON, N.J., Carbon isotopes in recent foraminifera: A record of anthropogenic CO2 invasion of the surface ocean, Earth Planet. Sci. Lett. 126 (1994) 259-273.
[2] QUAY, P.D., TILBROOK, B., WONG, C.S., Oceanic uptake of fossil fuel CO2: Carbon-13 evidence, Science 256 (1992) 74-79.
[3] SONNERUP, R.E., QUAY, P.D., McNICHOL, A.P., The Indian Ocean 13C Suess effect, Global Biogeochem. Cycles 14 (2000) 903-916.
0.51.01.52.0
1000
1100
1200
1300
1400
1500
1600
1700
1800
1900
2000
Cal
ende
r ye
ar (A
.D.)
0.51.01.52.0
δ13C (‰ VPDB)
0.51.01.52.0
GeoB 5810-3 GeoB 5807-2 GeoB 5801-3
0.00.51.01.5
0.00.51.01.5 δ13C (‰ VPDB)
0.00.51.01.5
G. ruber
G. sacculifer
G. sacculiferG. ruber
36

EXTENDED SYNOPSIS IAEA-CN-118/22
TOPIC: CLIMATE CHANGE
1
Amazonian Climatic Change: Water Isotope Detection of Deforestation and Greenhouse Impacts
A. Henderson-Sellers a, K. McGuffieb
a Environment, Australian Nuclear Science and Technology Organisation, Lucas Heights, NSW, Australia
bDepartment of Applied Physics, University of Technology, Sydney, Broadway, NSW, Australia
E-mail address of main author: [email protected]
Land use change in the Amazon basin, the largest and most biologically diverse river system in the world, has the potential to cause significant disruption to hydrological, biogeochemical and human systems. The naturally occurring isotopologues of water, commonly, but incorrectly, termed ‘isotopes’, of interest as possible tracing and validation tools in hydrological simulations are 1H2
18O and 1H2H16O. Large catchment simulations of water resources where isotopes could be applicable include water re-cycling as a function of precipitation type and variability [1, 2]; evaporation sourcing (i.e. whether water vapour comes from transpiration or from evaporation from rivers, lakes, soil water or the vegetation canopy) [3]; ice and snow temperature deposition determination; and aquifer and soil processes including those dependent upon precipitation intensity and melt-water contributions [4]. oupled with measurement of isotopes in water sources, SWI characteristics in river discharge now provide insight into basin- integrated hydro-climates [3, 5].
New data from the Global Network for Isotopes in Precipitation (GNIP) database, and previously published data now fully analysed, reveal significant changes in seasonal isotopic characteristics in the upper reaches of the Amazon basin underlining the use of stable water isotopes as a means of validating and improving numerical models. Despite observational limitations, which make determination of correctness difficult, some global models are shown here to be too poor to be of value in the Amazon. For example, isotopic depletions, a strong function of rainfall amount, are incorrect when precipitation is inadequately predicted seasonally or following ENSO circulation shifts. Isotopic enrichments of δ18O and δD exhibit systematic variations in the Amazonian water cycle as a result of forest and flooding changes. We find signatures of both circulation and land-use change impacts in the isotopic record: ENSO events cause decreased depletion in the dry season, due to a decreased emphasis on convective precipitation, while increases in upper basin isotope depletions in the wet season result from relatively less non-fractionating recycling (i.e. less transpiration and full canopy evaporation) because there are fewer trees. Prediction of δ18O and δD depletions by an isotope AGCM, while being adequate when averaged over the whole 17-year AMIP II period, are found to be less plausible for shorter periods. An isotope LSS is shown to be very sensitive to the prescription of boundary layer atmospheric water vapour isotopic depletion.
We conclude that efforts to evaluate model simulations of the Amazon against isotopic data are currently seriously hampered by: (i) poor simulation of the gross water budget (e.g. lack of surface water conservation in models); (ii) considerable model differences in surface water
37

A. Henderson-Sellers and K. McGuffie
2
distribution (i.e. between evaporation and runoff); (iii) wide ranging characterization of other possible causes of water isotopic fluctuations, such as El Niño and La Niña events; and (iv) significantly different characterization by current land-surface schemes of the partition of evaporation between fractionating and non-fractionating processes. While our results show great promise for isotopic evaluation of near-surface continental water cycle impacts in the Amazon, they also underline the need to address existing shortcomings in both atmospheric and land-surface models before isotopic finger-printing can be fully achieved.
[1] SALATI, E., OLIO, A.D., MATSUI, E., GAT, J.R., Recycling of water in the Amazon Basin: An isotopic study, Wat. Res. 15 5 (1979) 1250-1258.
[2] HENDERSON-SELLERS, A., GORNITZ, V., Possible climatic impacts of land cover transformations, with particular emphasis on tropical deforestation, Clim. Change 6 (1984) 231-258.
[3] HENDERSON-SELLERS, A., MCGUFFIE, K., ZHANG, H., Stable isotopes as validation tools for global climate model predictions of the impact of Amazonian deforestation, J. Clim. 15 (2002) 2664-2677.
[4] GAT, J.R., Oxygen and hydrogen isotopes in the hydrological cycle, Ann. Rev. Earth Planet. Sci. 24 (1996) 225-262.
[5] GIBSON, J.J., EDWARDS, T.W.D., Regional water balance trends and evaporation-transpiration partitioning from a stable isotope survey of lakes in northern Canada, Global Biogeochemical Cycles 16 (2002) 10.1029/2001GB001839.
38

EXTENDED SYNOPSIS IAEA-CN-118/23
TOPIC: CLIMATE CHANGE
1
Effect of pCO2 and Temperature on the Boron Isotopic Composition of the Zooxanthellate Coral Acropora sp.
S. Reynauda, N. Hemmingb, A. Juillet-Leclercc, P. Gattusod
a Centre Scientifique de Monaco, Av. saint Martin, MC 98000 Monaco
bQueens College, School of Earth and Environmental Sciences, Flushing NY 11367, U.S.A.
c Laboratoire d’Océanographie, UMR 7093, CNRS-Univ. Paris VI., BP 28, F-06234 Villefranche-sur-Mer cedex, France
dLaboratoire d’Océanographie, UMR 7093, CNRS-Univ. Paris VI., BP 28, F-06234 Villefranche-sur-Mer cedex, France
E-mail address of main author: [email protected]
We have used a unique coral culture procedure, which allows the manipulation of seawater temperature and pCO2, in order to assess the effects of these variables on the uptake and fractionation of boron isotopes in corals. Corals are important archives for geochemical proxies such as oxygen (O) and carbon (C) isotopes, trace elements, and more recently, boron isotopes. Boron isotope uptake in carbonates is controlled primarily by pH. Since a decrease in ocean pH can be interpreted as an increase in pCO2, several studies sought to apply the boron isotope paleo-pH proxy to determinations of past atmospheric CO2. Corals should provide an ideal material for recording the paleo-pH of surface water. As with any promising new proxy, it is necessary to understand the controls on boron uptake.
We cultured nubbins of a branching scleractinian coral Acropora sp, using a single mother-colony. 4 conditions have been simulated: 430 µatm-25.3°C (referred as “normal pCO2, normal temperature”), 446 µatm-28.2°C (“normal pCO2, high temperature”), 712 µatm-25.1°C (“high pCO2, normal temperature”) and 738 µatm-28.3°C (“high pCO2, high temperature”). The light level used in our experiment corresponds to in situ light levels measured at 5-6 meters depth with a 12:12 photoperiod. The pH in seawater is a function of total alkalinity (TA) and CO2 concentration. Since the seawater used in this experiment had a known and constant TA (2.604 ± 0.004 meq kg-1), we only changed the seawater pH to get a fixed value of pCO2. The regulation obtained during this experiment mimicked the shift in pCO2 that would occur within one century.
Multiple analyses of the boron isotopic composition (2-7 replicates per sample) were performed in order to ensure accurate results. External reproducibility is typically better than ± 0.5 per mil (2 SD). In this experiment we did not measure the boron isotopic composition of the Mediterranean seawater since it has been shown that it is constant, and equal to 40.26‰. The external precision carbon isotopes from aragonite, estimated using an internal standard, is 0.22‰ (2 SD). The internal reproducibility of the mass spectrometer was 0.1‰. The reproducibility of carbon isotope measurements from seawater was ± 0.14‰ (2SD).
39

S. Reynaud et al.
2
Our results indicate that d11B in corals is primarily driven by changes in seawater pH and is not affected by temperature. For corals cultured at “normal pCO2”, the δ11B of the skeleton is 24.0 ± 0.2‰ at 25°C and 23.9 ± 0.3‰ at 28°C. The values of δ11B measured for corals cultured at higher pCO2 were lower: 22.5 ± 0.1‰ and 22.8 ± 0.1‰ at 25 and 28°C, respectively. The δ13C values of the skeleton are also a function of the pCO2 treatment. Corals exposed to normal pCO2 exhibit higher δ13C values (–2.81 ± 0.13 and –2.75 ± 0.16‰, respectively for normal and high temperature) than corals exposed to high pCO2 (-4.21 ± 0.17 and -4.14 ± 0.14‰, respectively for normal and high temperature). We observed a positive δ13C -δ11B correla tion in the samples.
Interpretations presented here and in other studies using boron isotopes depend on knowing the pK value for the distribution of the aqueous boron species, and the d value for the isotopic offset between the two aqueous boron species. These issues do not affect our interpretation of the data. Our major conclusion indicates a lack of buffering by the coral. Although competing effects of respiration, photosynthesis, and carbonate ion effect could make the interpretation of the δ13C-δ11B co-variation difficult, this experiment should allow the use of corals for studying past changes in ocean chemistry. Changes in pH of surface ocean water that result from changes in atmospheric pCO2 can be recorded in corals.
Our data on the boron isotope composition of cultured coral samples are consistent with the interpretation that corals do not significantly alter ambient seawater. It is remarkable that the measured values are close to theoretical predictions. Further, we have found that the boron isotopic composition of corals is not temperature dependent over the temperature range corals typically grow.
40

EXTENDED SYNOPSIS IAEA-CN-118/24
TOPIC: CLIMATE CHANGE
1
Global Climate Change Linkage with Episodic Methane Release Event in the Western North Pacific in the Last Glacial Period
M. Uchidaa, Y. Shibatab, K. Ohkushic, N. Ahagona, M. Hoshibaa,d
a Japan Agency for Marine-Earth Science and Technology (JAMSTEC), Yokosuka, Japan
bNational Institute for Environmental Studies (NIES), Tsukuba, Japan c Ibaraki University, Mito, Japan dUniversity of Tsukuba, Tsukuba, Japan
E-mail address of main author: [email protected]
The remarkable similarity of late Quaternary atmospheric methane and temperature variations recorded in ice cores suggests that methane has played a significant role in millennial-scale climatic oscillations [1], especially Dansgaard-Oeschger (D–O) interstadial. Variations in the size and distribution of marine-sedimentary reservoirs of methane on the continental margins throughout the world’s oceans are thought to be one of the important factors controlling the global methane cycle. Marine sediments can act as hosts to gas hydrates under appropriate conditions of high pressure and/or low temperature, and sufficient organic carbon; on the other hand, they show a significant sensitivity to small perturbations in the physical and chemical conditions within the reservoir. During the Last Glacial, direct and indirect evidence accumulated from geochemical data suggests that methane episodically released from hydrate trapped in the seafloor sediments [2].
Recently, Kennett and coworkers interpreted δ13C variations of planktonic and benthic foraminifera found in Last Glacial sediments in the Santa Barbara Basin (SBB) as evidence for periodic releases of methane, arising from the dissociation of methane hydrate, and its subsequent oxidation in bottom- and/or surface-water environments [3]. This result provided the basis for the “Clathrate Gun Hypothesis” [4], which highlights the potential role of methane hydrate in Quaternary variations in atmospheric methane concentrations. According to recent observations of anomalous bottom-simulating reflections(BSR), the northwest Pacific marginal sediments around Japan main islands bear large abundances of methane hydrate. In this study, the piston cores from the continental slope sediments in the Oyashio current region, which recently is found to bear immense amounts of methane hydrate, have been investigated about planktonic and benthic foraminiferal carbon isotope records during the past 34 cal. kyr BP. Moreover, in order to investigate relation with foraminifera carbon isotopic signal and methane release from the seafloor, biomarker compositions and their carbon isotope have been analyzed in the light of the past activity of methanotrophic bacteria in the oxic-anoxic interface in the overlying water column and/or surface sediment. Analyzed piston cores (MR01-K03 PC4 and PC5, 41° 07.10' N, 142° 24.20' E; Fig. 1) at a water depth 1366-m was retrieved from a single site in the eastern margin of the Japanese main island Honshu in the northwest Pacific during MR01-K03 cruise of R/V Mirai.
41

M. Uchida et al.
2
Here we show that marginal sediments from the Northwest Pacific contain a hopanoid compound, 17α(H),21β(H)-hop-22(29)-ene (diploptene), derived from the activity of methanotrophic bacteria in water column and/or surface sediment during a warming period (Interstadial 3) in the Last Glacial. The carbon isotopic compositions of diploptene range between -41.0‰ and –27.9‰ (relative to VPDB). In the horizon indicative of a contribution of methanotrophic bacteria, foraminiferal isotope signals were also found with highly depleted 13C compositions of planktonic foraminifera (~-1.9‰, VPDB) and benthic foraminifera (~-0.8 ‰, VPDB), suggesting indirect records of enhanced incorporation of 13C-depleted CO2 formed by methanotrophic process that use 12C-enriched methane as their main source of carbon. From combined isotopic data of diploptene and foraminifera, the most prominent signal of methane release was detected in the sediments deposited around 25.4 cal. kyr BP (ca. 100 years time span), corresponding to the Interstadial 3. This is the first evidence of methane hydrate instability in the open western North Pacific during the Last Glacial. Considering the glacial- interglacial hydrographic conditions in this region, the instability of methane hydrate may be modulated by intermediate water warming and/or the lowering of sea level. Our results suggest that the Northwest Pacific marginal regions may be a profound effect on rapid global warming climate changes during the Last Glacial. A more detailed description of this study will be published in [4].
FIG. 1. Location of cored sites (MR01-K03 PC4/5) in the marginal sea off Honshu, Japanese main islands in the Northwest Pacific. The cores were collected at a depth of 1366 m.
[1] BROOK, E.J., SOWERS, T., ORCHARDO, J., Rapid variations in atmospheric methane concentration during the past 110,000 years, Science 273 5278 (1996) 1087-1091.
[2] DICKENS, G.R., O'NEIL, J.R., REA, D.K., OWEN, R.M., Dissociation of oceanic methane hydrate as a cause of the carbon isotope excursion at the end of the Paleocene, Paleoceanography 10 (1995) 965-971.
[3] KENNETT, J.P., CANNARIATO, K.G., HENDY, I.L., BEHL, R.J., Carbon isotopic evidence for methane hydrate instability during quaternary interstadials, Science 288 5463 (2000) 128-133.
[4] UCHIDA, M., SHIBATA, Y., OHKUSHI, K., AHAGON, N., HOSHIBA, M., Episodic methane release event from Last Glacial marginal sediments in the western North Pacific, Geochem. Geophys. Geosystems (in revision).
42

EXTENDED SYNOPSIS IAEA-CN-118/25
TOPIC: CLIMATE CHANGE
1
Predictability of Paleogene Climate and Primary Productivity of the Eastern Central Atlantic
A. B. Arkaaha, M. Kaminskib, N. Oglec, L. Apaalsed, D. Atta-Petters a, G. Wiafea, A. K. Armaha
a University of Ghana, Legon, Ghana
bUniversity College, London
c Queen’s University of Belfast, Northern Ireland
dGhana National Petroleum Cooperation, Ghana
E-mail address of main author: [email protected]
Benthic foraminiferal samples were obtained from 1620 ft to 3270 ft from unwashed cuttings obtained from the South Tano field, offshore Ghana, and were used to predict Paleogene climate and primary productivity of the Eastern Central Atlantic using the Analytical Precision 2003 mass spectrometer.
Samples of epifaunal benthic foraminifera of and Lenticulina spp and Eponides spp for the Upper Paleocene and Lower to Middle Eocene respectively, served as principal sources of biogenic carbonate for the determination of d18O and d13C of their host water. Average d18O values of -1.55‰, -3.01‰ and -1.77‰, were recorded for the Late Paleocene, Early Eocene and Middle Eocene, respectively, while average paleoprimary productivity levels inferred from d13C values of -2.30‰, -8.71‰ and -6.42‰, were recorded for the Late Paleocene, Early Eocene and Middle Eocene, respectively. Average paleotemperatures inferred from d18O of 23.20°C, 29.17°C and 24.10°C were obtained for the Late Paleocene, Early Eocene and Middle Eocene, respectively
The highest paleotemperature of 36.69°C was recorded at 2310 ft in the Early Eocene while the lowest paleotemperature of 15.64°C at 1860 ft was recorded in the Middle Eocene. The highest paleoprimary productivity level of -1.13‰ was recorded at 3270 ft in the Late Paleocene and the lowest paleoprimary productivity level of -11.83‰ was recorded at 1830 ft in the Middle Eocene .
The studies indicate that the Early Eocene was the warmest, least productive and least oxygenated while the Late Paleocene showed optimum oxygen and climate conditions with the highest primary productivity levels. Low circulation system in the Early Eocene could account for low primary productivity levels from the highest temperature range and least oxygenation.
The Early and Middle Eocene were generally warmer than the Late Paleocene, however, two bioevents which occurred in both the Early and Middle Eocene indicate glacial conditions within this interglacial interval. These two “Ice ages” were marked by the highest oxygen levels (between 0.4‰ and -0.5‰) corresponding with the lowest primary productivity levels (between -11.40‰ to -11.90‰) and associated least temperatures below 20°C to 15°C.
43
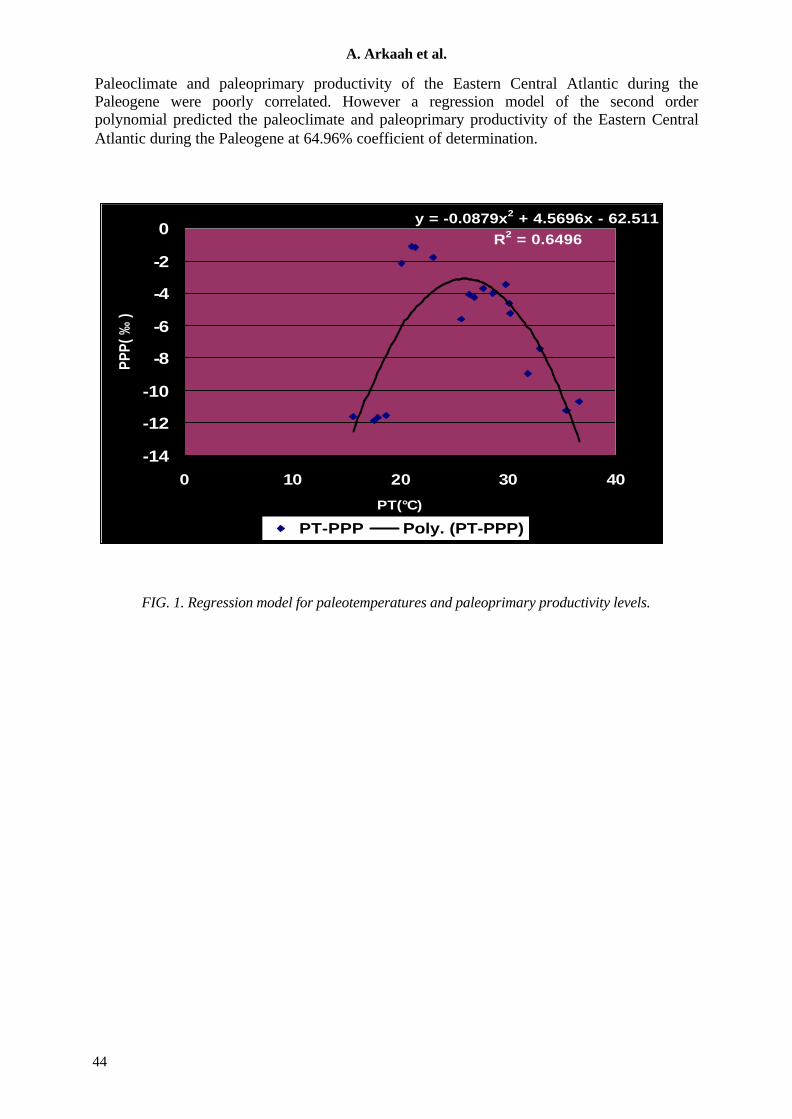
A. Arkaah et al.
2
Paleoclimate and paleoprimary productivity of the Eastern Central Atlantic during the Paleogene were poorly correlated. However a regression model of the second order polynomial predicted the paleoclimate and paleoprimary productivity of the Eastern Central Atlantic during the Paleogene at 64.96% coefficient of determination.
y = -0.0879x2 + 4.5696x - 62.511R2 = 0.6496
-14
-12
-10
-8
-6
-4
-2
0
0 10 20 30 40
PT(°C)
PPP(
‰ )
PT-PPP Poly. (PT-PPP)
FIG. 1. Regression model for paleotemperatures and paleoprimary productivity levels.
44

EXTENDED SYNOPSIS IAEA-CN-118/27
TOPIC: CLIMATE CHANGE
1
Isotopic Composition of Perennial Cave Ice as a Proxy for Palaeoclimate: the Focul Viu Ice Cave, Bihor Mts., Romania
I. Fórizs a, Z. Kernb, B. Nagyb, Zs. Szántóc, L. Palcsuc
a Laboratory for Geochemical Research, Research Centre for Earth Sciences, Hungarian Academy of Sciences, Budapest, Hungary
bDepartment of Physical Geography, Eötvös University, Budapest, Hungary
c Institute of Nuclear Research, Hungarian Academy of Sciences, Debrecen, Hungary
E-mail address of main author: [email protected]
For predicting the climate change in the near future we have to understand the climate change happened in the past. Several methods and tools have been developed or are under development for palaeoclimate reconstruction – among them environmental isotopes play an outstanding part –, but none of them can reveal perfectly the past changes in the climate.
One of the most classical method is the utilization of the isotopic composition of ice sheets where the ice formation is continuous, e.g. on Greenland [1] or Antarctica [2]. Ice formation takes place in rock caves as well, where usually not the whole year precipitation is represented in the ice, and in this way the ice formation and its isotope composition is very sensitive for the climate change. So far little research has been devoted to the role of cave ice in palaeoclimatology. Yonge and MacDonald [3] found that ice caves in permafrost and non-permafrost zones behave quite differently, so the relation between the stable isotope composition of cave ice layers and climate parameters should be studied in different climate zones.
Perennial ice block of about 14 meter vertical thickness and estimated volume of 12 000 m3, including subfossil wood, can be found in the Focul Viu Ice Cave, Bihor Mountains, Romania at 1120 m elevation a.s.l. on a karstic highland under temperate climate. The annual mean temperature of the highland area is about 7°C. The cave ice forms mainly from drip water in springtime, when the temperature of the ice and the rock wall is below freezing point in the cave and over freezing point on surface.
Using a manual corer cca. 7 m long ice core was taken from the ice block situated in the main hall of the cave, from which more than 150 d18O measurements were made representing different increments. Near-surface samples were taken from the upper surface and the side wall of the ice block for tritium, d18O and dD measurements. The tritium content indicates 1.9 cm/year short-term growth rate for the ice, while the long-term growth rate based on radiocarbon ages of two wood samples from the ice block at 6.7 m and 11.1 m depth is 0.85 cm/year. Long-term growth rate include periods when the ice “growth-melt” balance was zero or negative.
The d18O values along the vertical section varies between -8.19‰ and -12.3‰ vs. VSMOW. If we accept the observation made by Yonge et al. [4] that the d18O value of seepage water in caves is usually the same as the annual mean d18O value of the local precipitation and does
45

I. Fórizs et al.
2
not show seasonal variation to be right for the Focul Viu Ice Cave, then the above d18O variation indicates about 9 °C difference between the minimum and maximum annual mean surface air temperatures during the period represented (about 850 years) by the ice core studied.
The average d-excess of the cave ice is 15.7‰, which indicates that either the Mediterranean or the continental component of the local precipitation is considerable. This is well demonstrated by the relative position of the water line of the cave ice in comparison to the groundwater line of the Carpathian Basin and the global meteoric water line on Fig. 1.
FIG. 1. The dD-d18O diagram showing the “ice water line of the Focul Viu Ice Cave” (FVIC), the “ground water line of the Carpathian Basin” (CGWL), and the “global meteoric water line” (GMWL).
[1] GROOTES, P.M., STUIVER, M., Oxygen 18/16 variability in Greenland snow and ice with 103 to 105-year time resolution, J. Geophys. Res. 102 (1997) 26455-26470.
[2] PETIT, J.R., JOUZEL, J., RAYNAUD, D., BARKOV, N.I., BARNOLA, J.M., BASILE, I., BENDER, M., CHAPPELLAZ, J., DAVIS, M., DELAYGUE, G., DELMOTTE, M., KOTLYAKOV, V.M., LEGRAND, M., LIPENKOV, V.Y., LORIUS, C., PEPIN, L., RITZ, C., SALTZMAN, E., STIEVENARD, M., Climate and atmospheric history of the past 420,000 years from the Vostok ice core, Antarctica. Nature 399 (1999) 429-436.
[3] YONGE, C.J., MACDONALD, W.D., The potential of perennial cave ice in isotope palaeoclimatology, Boreas 28 (1999) 357-362.
[4] YONGE, C.J., FORD, D.C., GRAY, J., SCHWARCZ, H.P., Stable isotope studies of cave seepage water, Chem. Geol. (Isotope Geoscience Section) 58 (1985) 97-105.
Focul Viu Ice Cave
-70
-65
-60
-55
-50
-45
-40
-10.0 -9.5 -9.0 -8.5 -8.0 -7.5 -7.0
δ18O [‰]VSMOW
δD [‰
] VSM
OW
FVIC
CGWL
GMWL
46

EXTENDED SYNOPSIS IAEA-CN-118/28
TOPIC: RADIOECOLOGY
1
Comparison of MARINA II with CSERAM for estimating Concentrations of Radionuclides in UK Waters
K. Sihraa, A. Bexona, J. Aldridgeb
a National Radiological Protection Board, Didcot, UK
bThe Centre for Environment, Fisheries & Aquaculture Science, Lowestoft, UK
E-mail address of mainauthor: [email protected]
A strategy was agreed in 1998 by the OSPAR Commission [1] to achieve, by 2020, near zero concentrations of anthropogenic pollutants and near to background levels for pollutants that also occur naturally. The MARINA II model was developed to test the feasibility of this strategy, given inherited activity concentrations. The model has been validated extensively using spatial measurements within the OSPAR region of nine radionuclides, including 99Tc, 137Cs and 239/240Pu, over the period 1990-2000 [2]. Typically the model is found to agree with measurements to within a factor of three, with a marginal spatial bias towards underestimating activity concentrations. The purpose of this paper is to show that these differences are comparable to higher-resolution, physically-based models.
Estimates of activity concentrations in the Irish Sea from both unit and historical discharges are compared between the MARINA II model and the CSERAM model [3]. Both models are significantly different in modelling philosophy and should therefore provide a useful insight in both the effectiveness and the limitations of the MARINA II model. MARINA II is a 72-compartment marine model of North European waters. Dispersion is represented by annual exchange rates between compartments. Vertical partitioning of radionuclides between liquid and sediment phases is included and parameterised using distribution coefficients (Kds). Interactions of water columns with multi-sediment layers include processes such as molecular diffusion, porewater mixing, particle mixing and sediment turnover. Activity concentrations are calculated annually, therefore seasonal effects are not resolved. However, the model is computationally efficient, a requirement necessary for radiation protection calculations. CSERAM is a physical, process-based high-resolution model of the Irish Sea. This is based on the use of detailed two-dimensional tide and wind- induced flow fields to model the transport of radionuclides in the Irish Sea. The wind-wave component estimates the wave-induced seabed stresses that characterise the behaviour of the suspended and settled sediments, while the transport component simulates the flow of both the dissolved and particulate radionuclides. This approach, with a fixed resolution of 4 km, is clearly preferable to model the effects of discharges over short timescales where physical effects, such as tides, need to be resolved. However, for radiation protection calculations, the computational cost for routine multi-decadal estimates of activity concentrations would be prohibitively expensive. Two scenarios were established to perform the comparison. The first was a unit tera bequerel annual release of 137Cs over five years from the Sellafield site. The scenario was modelled from the time of release to 50 years. The second was actual historical discharges of 239/240Pu and 137Cs from Sellafield until the end of 1999, modelled until 2020. The two scenarios represent a simple situation to allow differences to be readily identified and a more-complex situation allowing the models to be compared under realistic conditions.
47

K Sihra et al.
2
Comparison of the results for filtered seawater, given a unit release, show good agreement between the two models. Both predict similar activity concentrations for the first ten years but then activity concentrations generally decrease more rapidly in the MARINA II model. The greatest difference between the models is one order of magnitude at 50 years, although most compartments show a difference to within a factor of three. There is a larger difference in predictions of sediment activity concentrations between the two models than for seawater (up to a factor of 50). The CSERAM model reaches equilibrium between liquid and sediment phases more quickly during discharges and shows more rapid remobilization after the source is switched off. However, filtered seawater activity concentrations, which are important for consumption pathways in calculating doses, appear consistent. Using historical discharges, the differences in activity concentrations of 137Cs in both filtered seawater and sediment mirror those seen for unit discharges. The predictions of 239/240Pu activity concentrations in filtered water generally show closer agreement between models than those for 137Cs. The predictions of the two models are within a factor of two between all of the Irish Sea compartments that were compared with the exception of the Cumbrian Waters and Liverpool and Morecambe Bay compartments. Here the predicted activity concentrations for the CSERAM model are up to a factor of 20 greater at 2020. The general differences however, could be due to the way that site-specific details are modelled (for example, differences in the sedimentation rate would affect significantly the activity removal, and hence dispersion, of high Kd radionuclides from the water column to the sediment layer). The model predictions of activity concentrations of 239/240Pu in sediment also generally show closer agreement than for 137Cs, with estimates within a factor of two to five between all Irish Sea compartments.
The two models show reasonably good agreement in general, especially considering that the models have been developed using very different modelling approaches. In particular, CSERAM is designed to provide activity concentrations in the Irish Sea on a high-resolution grid, compared to the seven compartments representing the Irish Sea in the MARINA II model. Spatial and temporal averaging of predicted activity concentrations therefore, is also likely to contribute to these observed differences. The MARINA II model also considers the transport of radionuclides throughout the whole northern European waters and is optimised therefore to give the best overall fit to all measurements in this region. Considering these diversities in resolution and modelling approaches, the differences shown here are considered acceptable for radiation protection predictive modelling.
[1] OSPAR, SINTRA Statement, Summary Record OSPAR 98/14/1 Annex 45, OSPAR, London (1998).
[2] SIMMONDS, J.R., BEXON, A.P., LEPICARD, S., JONES, A.L., HARVEY, M.P., SIHRA, K., NIELSON, S.P., MARINA II, Report of Working Group D - Radiological impact on EU member states of radioactivity in northern European waters, RP 132, European Commission (2002).
[3] ALDRIDGE, J.N., CSERAM: A model for prediction of marine radionuclide transport in both particulate and dissolved phases, Rad Prot Dosim 75 (1998) 99-103.
48

EXTENDED SYNOPSIS IAEA-CN-118/29
TOPIC: RADIOECOLOGY
1
Post Depositional Reactivity of the Plutonium in Marine Sediments: New Evidence from Solid Partitioning
A. Gouzya, D. Bousta, O. Connana, G. Billonb, M. Agarande c, L. Leon-Vintrod, P. J. Kershawe
a Laboratoire de Radioécologie de Cherbourg-Octeville, IRSN, Cherbourg-Octeville, France
bLaboratoire de Chimie Analytique et Marine, Univ. Lille I, Villeneuve d'Ascq, France
cLaboratoire de Mesure de la Radioactivité de l'Environnement, IRSN, Orsay, France
dDepartment of Experimental Physics, University College Dublin, Ireland
e The Centre for Environment, Fisheries & Aquaculture Science (CEFAS), Lowestoft, United Kingdom
E-mail address of main author: [email protected]
Plutonium remobilisation from bottom sediments of the Eastern Irish Sea has been evidenced and extensively documented [1]. Nevertheless, the processes by which the plutonium is released to the water column are still poorly understood. Data on the behaviour of this element during the diagenesis of marine sediments (e.g. [2]) are rather scarce. Previous works on the solid partition of plutonium have been proved to be unreliable [3].
To fill this gap, a thoroughly validated extraction protocol was designed and validated to study the solid partition of plutonium in anoxic sediments [3]; no significant dissolution of non-targeted geochemical phase was observed. Special care was brought to preserve the anoxic character of the sediments from sampling to the ultimate plutonium extraction from its carrier-phases and to prevent any resorption of plutonium by using a complexing agent. This protocol was used on different sediment cores recovered during the DIAPLU expedition (July 2002) in the Eastern Irish Sea. We report here the results obtained on a sediment core (25 cm long) collected at the depocentre of the so-called Eastern Mud-Patch, in the vicinity of the Sellafield plant outfall.
Sediment description and pH-Eh profiling were performed on board upon arrival on the deck then two subcores were prepared for further sedimentological and diagenetic studies, 10 cm and 16 cm inner diameter, respectively. They were carefully handled and stored to prevent any perturbation of the sediment column or water circulation. Back to the lab, the sediment core dedicated to geochemical analyses was sliced into 2 cm thick sections under a nitrogen atmosphere. Each of them was squeezed; pore water samples were acidified (except for alkalinity measurements which were carried out just after recovery) and squeezed sediment cakes were deep-frozen then stored for further analyses. Unsqueeezed sediment subsamples were prepared for water content and particulate sulfide determination.
A number of parameters were determined on water samples (major and trace elements, sulfides, sulfates and dissolved organic carbon) as well as on sediments (some major and trace elements, particulate organic carbon, carbonate content, grain-size distribution, gamma-
49

A. Gouzy et al.
2
emitting radionuclides). Special attention was drawn to sulfide determination (acid volatile and chromium reducible sulfides: AVS and CRS) and to the solid partition of plutonium. The sequential extraction procedure dedicated to plutonium was applied to squeezed sediment sections. Five fractions were distinguished: exchangeable/readily oxidisable (pH8, including reactive sulfide - AVS), acid-soluble (pH5, including carbonates), reducible, oxidisable (organics and CRS sulfides), and residual fractions. Plutonium isotopes (239Pu, 240Pu, 241Pu, 242Pu) were measured in each fraction by ICPMS, using 244Pu as yield tracer [4] together with a number of trace elements representative of the targeted phases (Ca, Sr, Mg, K, Fe, Mn, P, Al).
The sediments undergo active bioturbation and suboxic diagenesis (almost no oxygen penetration, subsurface peak concentrations of dissolved Fe and Mn, and negative Eh values). Peak values of both AVS and particulate organic carbon suggest that AVS could be produced by the anaerobic decaying of autochthonous organisms [5].
Plutonium is found to be mainly associated with the exchangeable/readily oxidisable (37±5%) and acid-soluble (40±4%) fractions. These results contradict many previous sequential extraction studies, e.g. [6], which took less care of preservation of the anoxic character of the sediment and of resorption of plutonium during the extraction. Consequently, a large proportion of the plutonium is liable to be actively recycled within the sediment column. It is actively concentrated into readily oxidisable sulfides (AVS; up to 100 000Bq.kg-1 in sulfide particles), potentially focusing its impact on biota, especially microorganisms. The inferred reactivity of plutonium during sediment resuspension should be reconsidered as well.
[1] HUNT, G.J., KERSHAW, P.J., Remobilisation of artificial radionuclides from the
sediment of the Irish Sea, J. Radiol. Prot. 10 (1990) 147-151. [2] MALCOLM, S.J., KERSHAW, P.J., LOVETT, M.B., HARVEY, B.R., The interstitial
water chemistry of 239, 240Pu and 241Am in the sediments of the northeast Irish Sea, Geochim. Cosmochim. Acta 54 (1989) 29-35.
[3] LUCEY, J.A., GOUZY, A., BOUST, D., LEÓN VINTRÓ, L., BOWDEN, L., FINEGAN, P.P., KERSHAW, P.J., MITCHELL, P.I., Geochemical fractionation of plutonium in anoxic Irish Sea sediments using an optimised sequential extraction protocol, Appl. Rad. Isot. 60 (2004) 379-385.
[4] AGARANDE, M., BENZOUBIR, S., NEIVA-MARQUES, A.M., BOUISSET, P., Sector field inductively coupled plasma mass spectrometry, another tool for plutonium isotopes and plutonium isotope ratios determination in environmental matrices, J. Environ. Radioact. 72 (2004)169-176.
[5] ALLEN, R.E., Role of diffusion-precipitation reactions in authigenic pyritization, Chem. Geol. 182 (2002) 461-472.
[6] McDONALD, P., VIVES I BATTLE, J., BOUSCHER, A., WHITTALL, A., CHAMBERS, N., The availability of plutonium and americium in Irish Sea sediments for re-dissolution, Sci. Total Environ. 267 (2001) 109-123.
50

EXTENDED SYNOPSIS IAEA-CN-118/30
TOPIC: RADIOECOLOGY
1
Assessment of the Discharge of NORM to the North Sea from Produced Water by the Norwegian Oil and Gas Industry
T. Gäfvert, I. Færevik, A. L. Rudjord
The Norwegian Radiation Protection Authority, Postboks 55, N-1332 Østerås, Norway
E-mail address of main author: [email protected]
The discharge of naturally occurring radioactivity from non nuclear industries, such as the oil and gas industry, has recently become a subject of much discussion. In connection with oil and gas exploitation in the North Sea, large volumes of produced water are co-produced with the oil and gas of which most is discharged into the marine environment. Due to the solubility of the radium isotopes, of which 226Ra and 228Ra are the most long-lived, the produced water normally contains enhanced levels of these naturally occurring radionuclides. Previously observed levels in produced waters from Norwegian production platforms, shows activity levels of about three orders of magnitude larger than normally encountered in sea water.
A study recently published by the EU (MARINA II) have concluded that liquid discharges to the marine environment from NORM industries (mainly phosphoric acid production and oil and gas exploitation) gives a larger contribution to the collective dose to the EU population than liquid discharges from the nuclear industry. Due to lack of published data on the radionuclide concentration in the produced water, it has however been large uncertainties on the discharge of 226Ra and 228Ra from the Norwegian oil and gas industry into the North Sea. In order to improve the estimated discharge of NORM, the Norwegian Radiation Protection Authority have asked the oil and gas producers on the Norwegian continental shelf to sample and analyse produced water from each production platform with respect to 226Ra, 228Ra and 210Pb monthly, for a period of six months during 2003 and early 2004. The purpose of this investigation has been to obtain more precise and reliable estimates of the NORM discharge in the Norwegian sector of the North Sea. The study is also considered important for work in the OSPAR radioactivity group, where relevant NORM industries will be identified, and discharge data collected the next few years.
The paper includes a review of previously reported data on the activity concentration of 226Ra and 228Ra in produced water from Norwegian oil and gas production platforms. The results from the analyses of 226Ra, 228Ra and 210Pb in produced water from 40 production platforms in the North Sea, sampled in 2003 and 2004, will be presented and discussed together with platform specific discharge data. The activity concentration in the analysed samples ranged from below detection limit to up to 13 Bq/L for 226Ra and up to 21 Bq/L for 228Ra. All results for 210Pb were below the detection limit (0.4 to 1.1 Bq/L). From these results the total discharged activity of 226Ra, 228Ra and 210Pb from Norwegian production platforms in the North Sea in 2003 have been estimated to 440 GBq, 375 GBq and < 90 GBq, respectively. The study also reveals that large short term variations in the activity concentration can occur, which must be taken in consideration when designing a monitoring program for this type of industrial activity.
51

SAMPLE EXTENDED SYNOPSIS IAEA-CN-118/31
TOPIC: RADIOECOLOGY
1
Physical and Chemical Characteristics of 137Cs in the Baltic Sea
G. Lujaniene a, K. Jokšas b, R. B. Šilobritiene a, Morkuniene c
a Institute of Physics, Savanoriu ave 231, LT-02300 Vilnius, Lithuania
bInstitute of Geology and Geography, T. Ševcenkos 13, LT-03223 Vilnius, Lithuania
c Vilnius Gedimino Technical University, Sauletekio al. 11, LT-10223 Vilnius, Lithuania
E-mail address of main author: [email protected]
Water and bottom sediment samples were collected during the expeditions in the Lithuanian economical zone of the Baltic Sea, the Curronian Lagoon and at the seashore of the Baltic Sea and the Curronian Lagoon in 1999–2001. In addition, caesium aqueous and suspended matter speciation in the near-shore and open sea waters was determined in 1995-1997. The separation of the suspended matter was achieved using 0.22 µm membrane filtration and 1 µm polypropylene Sediment Filter Cartridges (US Filter Plymouth Products, 1 micron nominal). The specific activity of 137Cs in suspended matter in water samples of 50–100 L was measured using the proportional Emberline FHT 770 T MULTI–LOW–LEVEL–COUNTER after radiochemical separation in the form of Cs3Sb2I9. From filtered water 137Cs was precipitated using the Fe ferrocyanide method and measured with the HPGe detector. Bottom sediments were sectioned on board the ship, and the upper 0-2 cm layer of sediments was used for radionuclide speciation analyses. 137Cs activities were measured with an intrinsic germanium detector (resolution 1.9 keV/1.33 Mev and efficiency 42%). The fractions of > 50 µm, 50 – 4 µm and < 4 µm were separated using wet sieving and column settling techniques and characterized as sand, silt and clay particles. The separation of 1 – 0.2 µm fraction was achieved using membrane filtration. The modified Tesser sequential extraction method was used for the determination of Cs geochemical fractionation [1]. Total carbon (TC) and total organic carbon (TOC) were determined using a LECO CS–125. The grain size distribution was determined by the gravimetric pipette method. Cs concentration in sea water was determined using ICP–MS, and clay minerals were identified by X–ray diffraction.
The studies of aqueous speciation indicated that in the Baltic Sea water–soluble caesium constituted 70–99% of the total 137Cs and it was mainly (from 62 to 92%) present in the ionic Cs+ state both in the near–shore and open waters. The amount of particulate caesium varied between 1 and 30% and specific activities of particulate cesium ranged from 20 to 965 Bq/kg. It was determined that up to 30% Cs cannot participate in the exchange process since it is possibly associated with particles < 0.2 µm in size. From 7 to 23% of particulate caesium can be released into sea water.
Some examples could illustrate the solid phase associations and sorption–desorption ability of Cs. An increase in the specific activities of 137Cs (up to 1000 Bq/kg) associated with the fine fraction of < 4 µm and 0.2–1 µm was determined and attributed to the large specific surface area and/or to the variation in the mineralogical composition of bottom sediment particles participating in sorption processes. Despite the strong correlation of 137Cs specific activities with the total organic carbon (R = 0.75) and with the content of clay (R = 0.95), the geochemical fractionation indicated its strong association with the residual fraction (about 70%), whereas the organic fraction comprised a small part of the total activity of 137Cs in bottom sediments.
52

G. Lujaniene et al.
2
The geochemical partitioning of 137Cs determined in the fine < 4 µm size fraction was attributed to the binding pattern of 137Cs to clay minerals with specific sorption on the interlayer sites (Fig. 1). The increase in percentage of exchangeable 137Cs in the 4-50 µm size fraction of sediments can be explained by an increase in a specific surface area and in the number of sites available for exchange reactions on particles of this size range. The comparatively high content of 137Cs in the residue of coarse fractions (> 50 µm and 4-50 µm) is due to the fine clay particle sticking to the coarse sand and silt ones as was confirmed by X-ray diffraction analyses.
The strong correlation of caesium activity excess on the suspended particles with the sampling depth was observed (Fig. 2). The increase in the specific activity with salinity and sampling depth is a result of sorption process during particle transport and settling in the sea water. In samples collected using the sediment filter cartridges with the nominal pore size of 1 µm, the comparatively lower specific activities of 137Cs (from 20 to 61 Bq/kg) were determined and tendency of 137Cs desorption from particles was observed. Data analyses obtained by three groups participating in the experiments indicated the losses of large portion of fine particles up to 30% in the near–shore zone using the filters of 1 µm as compared with filters of the 0.2 µm pore size. Moreover, this portion increased in open waters where fine particles are predominant. It seems that particles of various sizes and mineralogical composition can display different sorption ability. From particles of the > 1 µm size 137Cs can be released into sea water, on contrary, the fine fraction of suspended particles of 0.2–1 µm and possibly smaller, is responsible for sorption and removal of 137Cs from the water column. Kinetic tracer experiments carried out on the Curronian Lagoon sediments show that particles can display intensive and selective sorption towards the Cs ions in marine water and that rather long time is required to reach equilibrium. Data obtained indicated the importance of physical and chemical parameters of radionuclide carriers for the understanding its migration in the marine environment and possible uncertainties in the assessment of the long–term consequences of radioactive contamination using existing models.
Acknowledgment : This work was performed under the auspices of IAEA project LIT/7/002.
1 2 3 4 50
10
20
30
40
50
60
70
80%
Fraction
> 50 µm 4-50 µm < 4 µm
10 20 30 40 50 60 70
0
50
100
150
200
250
300
350
Exc
ess
of 13
7 Cs
spec
ific
activ
ity, B
q/kg
Depth, m FIG. 2. Operator declared BU compared with the calculated BU values based on the 137Cs activity measurements.
FIG. 2. Excess of 137Cs specific activity on near bottom suspended matter as compared to that of surface suspended particles versus sampling depth .
FIG. 1. Operator declared BU compared with the calculated BU values based on the 137Cs activity measurements.
[1] TESSIER, A., CAMPHELL, P.G.C., BISSON, M., Anal. Chem. 51 (1979) 844-851.
53

EXTENDED SYNOPSIS IAEA-CN-118/32
TOPIC: RADIOECOLOGY
1
Long-term Behaviour of 137Cs in Finnish Lakes
R. Saxén
Finnish Centre for Radiation and Nuclear Safety (STUK), Helsinki, Finland
E-mail address of main author: [email protected]
Deposition of 137Cs from Chernobyl accident was unevenly distributed in Finland. This caused large variation to contents of 137Cs in freshwater fishes in Finnish lakes. In the course of time environmental processes like runoff, water flow, hydrological cycling, sedimentation etc and chemical parameters as e.g., K of lake water, topography of the catchment etc affect the transfer of 137Cs in water sheds. Most of the Finnish lakes are deficient in nutrients and hence the accumulation of 137Cs into fishes is high. High amount of humic substances is also typical of Finnish lakes.
About 6000 freshwater fish samples from 350 Finnish lakes have been analysed for 137Cs in 1986-2003. Sampling was focused on the central parts of Finland with highest deposition of 137Cs, but samples from other areas were also analysed. Large lakes, most important for freshwater fishing in Finland, and small oligotrophic lakes, in which the highest contents of 137 Cs were expected to be found, were included in the study. Variation range of 137Cs in fishes was still in 2003 large, from 5 Bq/kg to 5000 Bq/kg (fresh weight).
Water samples from about 30 lakes were taken in 1998 and 2002 and analysed for 137Cs.
Contents of 137Cs in lake waters varied then from 4 to 330 Bq/m3.
During the first years after the deposition in 1986, the amount of the deposited 137Cs in the lake was the dominant factor on the distribution of 137Cs in fishes and surface water [1]. Later study on regional behaviour of 137Cs in fishes revealed differences in decrease rates in the large drainage areas [2]. Temporal changes of 137Cs in water and especially in fishes in individual lakes of various types, even in those located close to each other, differ still much.
Transfer coefficients of 137Cs from the deposition to water, TF w (Bq/m3 in water / kBq/m2 deposited) of the lakes included in this study varied from 0,40 to 8,7 in 1998. Transfer factors from the deposition to various species of fish from various lakes, TFf (Bq/kg in fish / Bq/m2), varied from 0,00007 to 0,7 in 2002. Non-predatory fishes had the lowest and predatory fishes the highest TFf values. Large variation in the transfer factors in 2002 reflect the joint effect of several environmental processes and factors on radionuclide distribution in lake environment during long-term after the deposition.
Concentration factors, CF, (Bq/kg in fish/ Bq/kg in water) of predatory fishes varied from about 2800 to about 20000 in various lakes in 1998. CFs of nonpredatory fishes were somewhat lower, varying from 1000 to about 5000. An example on the correlation of 137Cs concentrations in fishes with those in lake water is given in Fig. 1. The average CF for pike (Esox lucius), a predatory fish, was 6500 and that for perch (Perca fluviatilis), which is as young non-predator and as older predator, was 4400 in the lakes studied (Fig. 1).
54

R. Saxén
2
FIG. 1. Correlation of 137Cs in water with that in pikes and perches in the lakes sampled in 1998. The kslope of the line gives average concentration factors, CF, for these fish species.
FIG. 1. Correlation of 137Cs in water with that in pike (Esox lucius) and perch (Perca fluviatilis) in lakes sampled in 1998. The slope of the line gives the average CF for these two fish species.
[1] SAXÉN, R., "Transport of 137Cs in large Finnish drainage basins", (DAHLGAARD, H., Ed.), Nordic Radioecology. The transfer of radionuclides through Nordic Ecosystems to man, Studies in Environmental Science 62, Elsevier, Netherlands (1994) 63-78.
[2] SAXÉN, R., KOSKELAINEN, U., Regional variation of 137Cs in freshwater fishes in Finland. (Proc. Volume II Int. Congress The Radioecology-Ecotoxicology of Continental and Estuarine Environments ECORAD 2001, Aix-en-Provence, 3-7-September, 2001), Radioprotection - colloques 37 C1 617- 620.
y = 4362,56x + 92,91R2 = 0,78
0
500
1000
1500
2000
2500
0,00 0,10 0,20 0,30 0,40
Lake water, Bq/kg
Per
ch,
Bq
/kg
y = 6459,95x + 33,83R2 = 0,86
0
500
1000
1500
2000
2500
0,00 0,10 0,20 0,30 0,40
Lake water, Bq/kg
Pik
e, B
q/k
g
55

EXTENDED SYNOPSIS IAEA-CN-118/33
TOPIC: RADIOECOLOGY
1
Transfer of Chernobyl Radionuclides in the Aquatic Systems
O. Zhukovaa, M. Germenchuka, N. Shiryaevab, V. Drozdovichb
a The Republican Centre of Radiation Control and Environment Monitoring (RCREM), Minsk, Belarus
bThe Institute of Radioecological Problems, Minsk, Belarus
E-mail address of main author: [email protected]
The data on radioecology of the rivers of Belarus, which catchments area is completely or partly situated in Russia and the Ukraine (the Sozh, the Iput, the Besed, the Braginka) are given. The radioactive contamination of lakes are represent [1].
The article demonstrates, that nowadays Chernobyl radionuclides content in surface water depends on wash-off from contaminated territories, groundwater leakage, and composition of bottom sediments. Wash out by rain and melted water is considered to be the most permanent and hazardous. The accumulation of radioactive sediments before dams, in stagnant zones of rivers and reservoirs creates moving local cites of increased concentration. Today and for forthcoming decades the main input into water contamination will be 137Cs 90Sr and for the nearest Chernobyl PP zone – isotopes of plutonium as well as 241Am.
The migration of radionuclides on the experimental watershed of the Iput river was investigated.
With the example of the Iput river, studies are performed and based on them an analysis is made of the formation of contamination of elements of a river system by radionuclides 137Cs and 90Sr after the accident at the Chernobyl Nuclear Power Plant. It has been revealed that before the years 1990 - 1994 the contamination of the river system was mainly formed by the primary fallout of radionuclides on the water surface of the river but after the year 2000 it will be determined only by the ingress of radioactive contaminants with surface flow from a water catchment. The studies have shown that the contamination of the Iput river in the territory of Belarus was influenced by the transboundary transfer of radionuclides from the territory of Russia during first years after Chernobyl accident. According to our estimates, at the end of 1986, this contribution amounted to 30% for 137Cs and 96% for 90Sr; as of-now, it is 86% and 65% for 137Cs and 90Sr, respectively [2].
The analysis of formation and migration of radioactive contamination in the Iput river makes it possible to refine and improve the system of monitoring of the condition of water bodies of Belarus and to develop additional recommendations on protection and optimization of nature- and water management and of re-creation of water objects contaminated by radionuclides.
The concentration of Cs-137 in bottom sediments on some sites in the Braginka river (12940 – 49760 Bq/kg), the Revuchee lake (10345 - 18260 Bq/kg) and the Svyatskoe lake (11618 - 16430 Bq/kg) are so great, that they can be attributed to lowlevel waste storage facilities
56

O. Zhukova et al.
2
(9630 Bq/kg). Such high levels of radioactive contamination of bottom sediments are secondary sources of pollution of surface water [3].
Contribution of aquatic pathways to exposure doses the some settlements have been considered [4].
For reduction effective dose to population living near to "critical" water bodies, the following recommendations for realization of rehabilitation actions are offered:
§ restriction of use of water for drinking needs from open reservoirs;
§ restriction of a fish catching;
§ boarding wood (use of long-term tree species and bushes for regulation of water balance);
§ crop of long-term grasses on the river banks and lake catchments;
§ restriction of a watering and pasture place of cattle in flood plains of the rivers and lakes;
§ use of mineral and organic fertilizers;
§ clearing of water bodies beds in places with the high levels of radionuclides;
[1] KONOPLEV, A.V., DEVILLE-CAVELIN, Q., VOITSEKHOVICH, O.V., M.ZHUKOVA, O.M., Transfer of Chernobyl Cs-137 and Sr-90 by surface run-off, The Radioecology-Ecotoxicology of Continental and Estuarine Environments (Proc. Volume I International Congr., Aix-en-Provence (France) 3-7 Sept. 2001) EDP Sciences I (2002) C1-315 - C1-323.
[2] ZHUKOVA, O., SHIRYAEVA, N., SHAGALOVA, E., Water migration of Chernobyl radionuclides in rivers of Belarus, The Radioecology-Ecotoxicology of Continental and Estuarine Environments (Proc. Volume I Int. Congr., Aix-en-Provence (France) 3-7 Sept. 2001) EDP Sciences II (2002) C1-723 - C1-728.
[3] OSTAPENYA, A.P., "Behavior of cesium-137 in the lakes of different types", Lake Ecosystems: biological processes, anthropogenic transformation, water quality (Materials Int. Scientific Conf., September 20-25, 1999), Minsk-Naroch (2000) 293-302.
[4] MINENKO, V.F., DROZDOVITCH, V.V., TRETYAKEVITCH, S.S., Methodological approaches to calculation of annual effective dose for the population of Belarus, Radiat. Risk 7 (1996) 246-252.
57

EXTENDED SYNOPSIS IAEA-CN-118/34
TOPIC: RADIOECOLOGY
1
Uranium Mining and Ore Processing in Ukraine and its Radioecological Effects on to the Dnieper River Water Ecosystem and Human Health
O. Voitsekhovycha, Y. Sorokab, T. Lavrovaa
a Ukrainian Institute for Hydrometeorology (UHMI), Kiev, Ukraine
bCentre for Radioecological Monitoring (CRM), Zheltie Wody, Ukraine
E-mail address of main author: [email protected]
The potential contamination of surface and underground waters in the basin of the Dnieper river is due to uranium mining and ore processing in the Ukraine. From the early 1950s to the early 1990s, the processing of uranium ores was carried out in Dneprodzerzhinsk town located in the upper part of Zaporozhie reservoirs. During that period a number of uranium tailings were created at the Industrial site and in the vicinity of Dnieprodzerzhinsk and Zheltie Wody towns.
The main part of tailing is located at the drainage basins of the Dnieper River and its influence due to seepage waters spreads to the Dnieper's reservoirs forming their secondary contamination and present radioecological status.
Uranium mining and milling have a number of potential impacts on human health and the environment. They include:
• contamination of mine water with uranium and other radionuclides • release of mill waste waters to surface waters (usually after treatment) • run-off of water from contaminated areas of the mine or mill • radon release from mines, waste rock dumps and mill tailings piles • leaching of radionuclides from tailings and their subsequent transport in water • erosion of tailings storage systems leading to dispersal of tailings by wind and water • contamination of underground and surface waters by toxic non-radioactive substances
such as heavy metals and chemicals used in the processing
The most important waste from the milling of uranium is the finely divided solid residue, known as tailings. It typically contains 70% of the radioactivity in the original ore including the long- lived radionuclides, 230Th (half- life = 80,000 years) and 226Ra (half- life 1600 years). Radium is a continual source of 222Rn (half- life = 3.8 days) which, being a gas, is readily dispersed. Radon daughters are a source of radiation exposure and a known cause of lung cancer in uranium miners.
The town Zheltie Wody in Dniepropetrovsk region is the Industrial Center of Uranium Industry of Ukraine. The mining and processing of uranium ores at the Zheltye Wody has negatively affected the environment as well as the sanitary and hygienic state of the town since the start of the operations in the 1950s.
The monitoring data and simulation of some worst scenarios of radionuclide releases at the routine and accidental practice are considering. In particular the run off forming and seepage
58

O. Voitsekhovych et al.
2
from the tailings dumps, Uranium mining sites and other contaminated areas leads to elevated levels of radionuclides in the local rivers. The actual levels of its radioactive pollution are below of maximum permissible levels established by Radiation Safety Standards of Ukraine for drinking water. However, the influence of these sources of radioactive contamination on the aquatic ecosystem, are exist and this problem can not be ignored. The other significant center of Uranium industry is Dnieprodzerzhinsk town.The former Uranium re-processing “Pridneprovskiy Chemical Plant” (PCP) with number of uranium tailing dumps on its territory is located alongside one of the reservoirs of the River Dnieper cascade and consisted just as a part of a large Dnieprodzerzhinsk industrial complex in the area, which includes some other chemical, coke and metallurgical plants. During operation of the PCP nine tailings dumps were created containing about 42 million tones of RAW with a total activity of about 4 x 10¹⁵
Bq (≈100,000 Ci).
The ecological state of the water bodies in the areas and aquatic ecosystem of the Dnieper River Reservoir influenced by the seepage of the contaminated waters from this Industrial Site of Ukraine were studied in frame IAEA RER 9/072 projects during 2002-2003. The following recommendations were made. An ongoing system for radioecological monitoring of the
environment (water, soil vegetation, air, food products) in the affected regions (Zheltye Wody, mining areas and Dneprodzerzhinsk) needs to be established. This should involve provision of appropriate equipment and co-ordination of the efforts of the external monitoring organizations.
2. The pollution resulting from past and present operations in the Dneprodzerzhinsk industrial complex needs to be considered holistically in order to understand their respective contribution to pollution of the Dnieper basin and the effects of interactions between the major waste storage areas. Essentially, there needs to be an overall plan for the site, which will include rehabilitation of sites along with possible further industrial development.
3. Rehabilitation of non-operational uranium tailing impoundments at Zheltye Wody and Dneprodzerzhinsk needs to be completed to ensure they provide long-term containment. In any rehabilitation plan, particular attention should be given to Tailings “D” and the Konoplyanka River, which is acting as a conduit for transfer of pollutants from the tailing impoundment into the Dnieper River.
4. Current and future operations need to be carried out in accordance with an environmental plan that includes funding provisions to ensure progressive rehabilitation of closed mines, dumps and other facilities.
Data presents results of radioecological monitoring of the water ecosystem (water, bottom sediment, accumulation of Uranium products in algae, fish and benthic organisms.
Preliminary results estimates the potential, actual and expecting human expose doses via aquatic pathways (due to complex water use) for individuals living along the rivers and reservoirs affected buy releases from the uranium tailings.
Radiological Risks were estimated in this studies and Strategy on the rehabilitation of the contaminated environment are discussed in the paper.
Some practical measures to minimize the radionuclide fluxes from the uranium tailing in to the Dnieper River based on post-Chernobyl and other world experience are discussed in the report.
59

EXTENDED SYNOPSIS IAEA-CN-118/35
TOPIC: RADIOECOLOGY
1
Concentration and Characteristics of Uranium Isotopes in Water Collected in Central Italy and Balkan Regions
G. Jia, G. Torri, P. Innocenzi, A. Di Lullo
Italian Environmental Protection Agency and Technical Services, Via V. Brancati 48, 00144 Roma, Italy
E-mail address of main author: [email protected]
Uranium is a naturally occurring, ubiquitous heavy metal found in the environment in various chemical forms in all soils, rocks, seas and oceans. It is also present in air, food and drinking water. Due to its widespread existence in nature, uranium isotopes (238U, 234U and 235U) have become one of the most important source of natural radioactivity and make a significant contribution to external and internal dose to population.
Uranium isotopes enter the human body mainly through ingestion, and by inhalation to a considerably smaller degree [1, 2]. Hence the internal radiation exposure for members of the public can be evaluated through the intake of the radionuclides from both food and water. Pietrzak-Flis et al., [3] have investigated the uranium intake fractions of the different pathways, and concluded that the uranium intake from water by man is the most important pathway which contributes the largest fraction (75.1% - 76.9%) of uranium intake.
For the purpose of estimating the radiological impact of uranium isotopes in water to the residents, some natural water samples were collected in central Italy and Balkan Regions and analysed in the laboratory of Italian Environmental Protection Agency and Technical Services (APAT). The activity concentrations of 238U, 234U and 235U were obtained.
The radioanalytical procedure used for determination of uranium isotopes in water mainly includes steps of uranium pre-concentration, mineralization, separation by a Microthene-TOPO column, electrodeposition and measurement by alpha-spectrometry.
Based on the obtained activity concentrations of uranium isotopes in drinking water, annual consumption rate of the water, and the dose conversion factor per unit intake given by the International Commission on Radiological Protection [4], the annual effective dose resulting from 1-year ingestion for the adult population was calculated.
[1] UNITED NATIONS SCIENTIFIC COMMITTEE ON THE EFFECTS OF ATOMIC RADIATION, Sources and Effects of Ionizing Radiation, United Nations, New York 1993 Report to the General Assembly, with scientific annexes.
[2] FISENNE, I.M., PERRY, P.M., DECKER, K.M., KELLER, H.W., The daily intake of 234,235,238U, 228,230,232Th, and 226,228Ra by New York City residents, Health Phys. 53 (1987) 357-363.
60

G. Jia et al.
2
[3] PIETRZAK-FLIS, Z., ROSIAK,L., SUPLINSSKA, M.M., CHRZANOWSKI, E., DEMBINSKA, S., Daily intake of 238U,234U 232Th, 230Th, 228Th and 226Ra in the adult population of central Poland, Sci. Tot. Environ. 273 (2001) 163-169.
[4] INTERNATIONAL COMMISSION ON RADIOLOGICAL PROTECTION, Age-dependent doses to members of the public from intake of radionuclides: part 5, Compilation of ingestion and inhalation dose coefficient, Ann ICRP 26 1 (1996), ICRP Publication 72, Pergamon Press, Oxford.
61

EXTENDED SYNOPSIS IAEA-CN-118/36
TOPIC: RADIOECOLOGY
1
The "EPIC" Exposure Assessment Methodology - a Case Study for Arctic Marine Systems
H. Thørring, J. E. Brown, M. Iosjpe, A. Hosseini
Norwegian Radiation Protection Authority (NRPA), Østerås, Norway
E-mail address of main author: [email protected]
A framework for assessing the impacts of ionising radiation in Arctic areas has been developed in the project EPIC [1]. The initial stage of the assessment requires the selection of a set of reference organisms that could act as representatives of the larger ecosystem. This is achieved through an analysis of transfer pathways and the application of selection criteria. Following this step, the exposure assessment is conducted. Methods for deriving the transfer and fate of radionuclides in Arctic ecosystems are necessary during this procedure as are methods for deriving (weighted or unweighted) dose-rates. Once exposures for reference biota have been derived, they need to be interpreted in terms of biological effects.
A case study was performed, in order to demonstrate the exposure assessment part of the EPIC framework for marine systems: A “worst case” release scenario at the Kola Nuclear Power Plant as described by [2] was selected for the study. The activities of 137Cs, 134Cs, and 90Sr released to the atmosphere were 14.0, 18.7, and 1.7 PBq, respectively. It was assumed that all of the released radioactivity was deposited in the Barents Sea. The NRPA marine box- model [3] was employed to simulate sea water and sediment activity concentrations in the study area during the first 20 years after the hypothetical accident.
Based on time-dependent sea water activity concentrations derived from the box-model, activity concentrations in marine reference organisms were calculated using equilibrium concentration factors (CFs) given in [1]. Nuclide specific internal Dose Conversion Factors (DCFint) were used to convert activity concentrations in reference organisms to internal dose-rates. External dose-rates were calculated from water and (when applicable) sediment activity concentrations using external Dose Conversion Factors (DCFext) and occupancy factors. The latter defines the time spent by biota in various surroundings (e.g. water surface, water column, sediment-water interface). Relevant internal and external dose conversion factors (DCFs) for reference organisms are given in [1].
Simplifying assumptions were made with respect to occupancy factors for the considered case study. For example, bivalve molluscs were assumed to be present at the sediment-water interface at all times, whereas pelagic fish were assumed to be totally immersed in water at all times. Sea birds were assumed to spend 1/3 of their time on the water surface, 1/3 of their time in the inter-tidal zone, and the rest of their time in non-contaminated areas (e.g. in the air or on the ground).
Predicted total dose-rates to 5 marine reference organisms – taken from the suite of organisms included in [1] – are plotted in Fig. 1. These are: pelagic carnivorous fish (e.g. Atlantic cod), benthic fish (e.g. plaice), bivalve mollusc (e.g. blue mussel), sea bird (e.g. herring gull), and
62

H. Thørring et al.
2
carnivorous mammal (e.g. harp seal). The total dose-rate represents the sum of external and internal dose contributions from the three specified radionuclides.
In general, the predicted dose-rates to reference biota following the hypothetical “worst case” accident at Kola NPP are low. Sea birds receive the highest committed dose (20 years), followed by benthic organisms, while pelagic organisms receive the lowest doses. The large CF of caesium for sea birds seems to be of most importance for the relatively high predicted dose for this reference organism.
1,00E-08
1,00E-07
1,00E-06
1,00E-05
1,00E-04
1,00E-03
0 5 10 15 20
Years after contamination
Wei
gh
ted
ab
sorb
ed d
ose
rat
e (G
y yr
-1)
Pelagic carnivorous fishBenthic fishBivalve molluscSea birdCarnivorous mammal
FIG. 1. Predicted weighted total dose-rates (137Cs, 134Cs, and 90Sr) to reference organisms from the Barents Sea (Gy yr-1).
[1] BROWN, J., THØRRING, H., HOSSEINI, A., (Eds.), The “EPIC” impact assessment framework: Towards the protection of the Arctic environment from the effects of ionising radiation, a Deliverable report for EPIC, Contract No: ICA2-CT-2000-10032, NRPA, Østerås, Norway (2003) 175 pp.
[2] SKUTERUD, L., BERGAN, T., HOWARD, B., WRIGHT, S., (Eds.) Long-term consequences of potential radioactive contamination in the Northern areas: Northern Norway and Murmansk Region Summary Report, Joint Norwegian-Russian Expert Group (2002) (ISBN 82-995962-1-1) 120 pp.
[3] IOSJPE, M., BROWN, J., STRAND, P., Modified approach for box modelling of radiological consequences from releases into marine environment, J. Environ. Radioact. 60 1-2 (2002) 91-103.
63

EXTENDED SYNOPSIS IAEA-CN-118/37
TOPIC: RADIOECOLOGY
1
Theoretical Dose Reconstruction along Life-Cycle for Plaices (Pleuronectes platessa) living in the Northern Cotentin Waters after 1966
K. Beaugelin-Seiller, B. Fiévet, J. Garnier-Laplace
Institute of Radioprotection and Nuclear Safety (IRSN), St Paul les Durance, France
E-mail address of main author: karine.beaugelin@irsn. fr
The French marine ecosystem located in the littoral area of the Northern Cotentin (Fig. 1) has been exposed to ionising radiations since the launching of a number of nuclear industrial facilities. These waters have been receiving since 1966 low-level radioactive liquid releases produced mainly by the normal operation of the COGEMA reprocessing plant, combined later with those of the nuclear power plant of Flamanville.
This situation led to a chronic exposure of wildlife to radionuclides present in this ecosystem. Among the species living in these waters, one presents an important halieutic interest: the European plaice (Pleuronectes platessa). Considering its trade value in the local fishery, the potential detriment of its radiological exposure along its whole life-cycle was estimated applying a classical four-step environmental risk assessment (ERA) approach. However some prerequisite, like a good knowledge about fish features (e.g. life span), constrained the duration of the reconstruction exercise and the corresponding period investigated for the ERA.
The first step of the ERA was the hazard identification, through the inventory of released radionuclides. This had already been done (Table I) in a former reconstruction exercise conducted by the Nord-Cotentin Radioecology Group (GRNC), gathering all needed data [1].
In the second stage, effects data were searched to investigate dose-effects relationships devoted to this species. This part of the study was initiated with the consultation of the FASSET Radiation Effects Database (FRED, [2]). Data related to the European plaice were found, relative to morbidity, mortality and reproduction success aspects.
The third step was the exposure analysis, which involved two successive phases. At first the radionuclide concentrations in water, sediment and fish required by the ERA were extracted from those calculated by the GRNC [3]. Then a dosimetric assessment was carried out with EDEN (Elementary Dose Evaluation for Natural environment), a tool developed at IRSN [4], which estimates dose rates to the biota per unit of radionuclide concentration (DPUC). These calculations were performed for each radionuclide from each exposure source, internal as well as external, taking account the plaice morphology and lifestyle for each of its development stage. On the basis of these two data sets, average annual doses were calculated and then combined to evaluate the whole life-cycle dose.
The fourth and last step of the ERA, that is the risk determination, was realised through the comparison between the reconstructed dose and the effects data.
64

K. Beaugelin-Seiller et al.
2
This study, conducted for a key-stone fish species in the “local” marine ecosystem, is a way to estimate the order of magnitude of the risk associated to radionuclide releases during several decades of nuclear facilities operation.
FIG. 1. Situation map of the nuclear facilities of concern.
TABLE I. QUALITATIVE LIST OF RADIONUCLIDES TAKEN INTO ACCOUNT IN THE DOSE RECONSTRUCTION EXERCISE FOR THE PLAICE
[1] NORD-COTENTIN RADIOECOLOGY GROUP (GRNC), Inventory of radioactive
waste from nuclear installations, Work Group N°1 report (http://www.irsn.org/nord-cotentin).
[2] FASSET, FASSET Radiation Effects Database (FRED), EC 5th Framework Programme. Contract FIGE-CT-2000-00102 (http://www.fasset.org)
[3] NORD-COTENTIN RADIOECOLOGY GROUP (GRNC), Models for the transfer of radionuclides in the environment, Work Group N°3 report (http://www.irsn.org/nord-cotentin).
[4] BEAUGELIN-SEILLER, K., GARNIER-LAPLACE, J., GARIEL, J.C., E.D.E.N., A tool for the estimation of dose coefficient equivalents for non-human biota, ECORAD 2004, 6-10 September 2004, Aix en Provence, France.
Jersey
Guernsey
Alderney
Sark
Cape of la Hague
Cape of Flamanville
Nuclear facilities
ANDRA
COGEMA
EDF power plant
Cherbourg arsenal
France
The Channel
Jersey
Guernsey
Alderney
Sark
Cape of la Hague
Cape of Flamanville
Nuclear facilities
ANDRA
COGEMA
EDF power plant
Cherbourg arsenal
France
The Channel
3H 59Ni 95Zr+Nb 121mSn 134Cs 233U 242Pu10Be 63Ni 94Nb 126Sn 135Cs 234U 241Am14C 65Zn 93Mo 124Sb 137Cs 235U 242Am36Cl 75Se 99Tc 125Sb 144Ce+Pr 236U 242mAm41Ca 79Se 103Ru+Rh 126Sb 147Pm 238U 243Am54Mn 87Rb 106Ru+Rh 127Te 151Sm 237Np 242Cm55Fe 89Sr 107Pd 127mTe 152Eu 236Pu 243Cm57Co 90Sr+Y 110mAg 129I 154Eu 238Pu 244Cm58Co 91Y 113mCd 131I 155Eu 239,240Pu 245Cm60Co 93Zr 121Sn 133I 232U 241Pu 246Cm
65

EXTENDED SYNOPSIS IAEA-CN-118/38
TOPIC: RADIOECOLOGY
1
Transuranic Elements and Fission Products Analyses on Soils from an Alpine Wetland, Boreon (France)
M. Schertz, H. Michel, G. Barci-Funel, V. Barci
Laboratoire de Radiochimie, Sciences Analytiques et Environnement, Université de Nice - Sophia Antipolis, 28 avenue Valrose, 06108 Nice, France
E-mail address of main author: [email protected]
The nuclear test of the sixties and the Chernobyl nuclear power plant accident in April 1986 have implied deposition of radioactive particles on the earth surface and in particular in our study zone. In this study, we are interested our by some transuranic elements, like plutonium 238 and 239/240, americium 241, and some fission products, like cesium 137 and strontium 90.
Soil and sediment cores have been collected in the south east of France, region known for her great contamination by Chernobyl fallout. The sampling site is an alpine wetland and his environment located in the national park of Mercantour, at about a height of 1800 m (43°43'N, 07°15'E). It includes a clearing, a strong slope catchment and a small mountain lake. We will comment here on soil core analyses, lake sediment cores analyses were presented on a previous publication in submission*.
Six soil cores have been taken in the clearing, in the catchment slope and in the catchment summit. Each core is analysed by centimeter for obtain a contamination profile with layer depth (Bq.kg-1). The core positions are strategic for a future establishing of the studied element mass balance. Indeed, summit soil core represent atmospheric fallout contribution only, clearing and catchment slope soil cores represent atmospheric fallout and catchment runoff waters.
This work will succeed on a contamination cartography (Bq.m2) in 90Sr, 137Cs, 238Pu, 239/240Pu and 241Am of our study zone, and as well on a better knowledge of element accumulation mode and element behavior. Origin determination of radioelements is deduced from isotopic ratios.
The 137Cs, γ emitter, is directly detected by gamma spectrometry. The detection of α.radiations of 238Pu, 239/240Pu and 241Am and of β radiations of 90Sr are made after series of chemical separations.
These separations include coprecipitation steps and chromatographic separations on resins (ionics or specific resins). This protocol was validated with some International Atomic Energy Agency samples (soils and sediments) : calculated activities were in keeping with the recommended values and recoveries were in good agreement.
66

EXTENDED SYNOPSIS IAEA-CN-118/39
TOPIC: RADIOECOLOGY
1
Data Synthesis for Terrestrial Gamma Radiation Level Measured on the Japanese Islands and its Adjacent Ocean Floor
M. Furukawa
National Institute of Radiological Sciences (NIRS), Chiba, Japan
E-mail address of author: [email protected]
In planning the construction of suitable radiation protection system for not only the public but also non-human species and ecosystem, it is specially important to know the realistic radiation levels in various environments. In this study, surveyed data for the terrestrial gamma radiation level from mountain area to ocean floor in and around Japan, mainly obtained for the past 25 years, have been collected as the basic information to design the suitable system. Based on the database, a contour map has been also compiled to take an overview of the regional variation for the terrestrial gamma radiation level in the research area.
To assess the sea-bottom gamma radiation level and to establish its database as one of fundamental measurement information of the oceanography, the in situ gamma radiation measurements on the sea-bottom have been conducted since 1995 with the deep-sea gamma radiation measurement systems which are installed on a manned submersible “Shinkai 2000” and a remotely operated submarine vehicle “Dolphin 3K” of Japan Marine Science and Technology Center (JAMSTEC) [1]. Until 2002, the measurements have been operated at more than 100 places on the ocean floor in the Pacific Ocean, Japan Sea, East China Sea and Philippine Sea. The portion of the data has been analyzed by cooperation of National Institute of Radiological Sciences (NIRS) [2]. In this presentation, details of the measurement system and the method of data analysis will be illustrated.
For the land surface in Japan, an extensive field survey of the terrestrial gamma radiation level has been conducted at more than 2,000 points by NIRS [3], and the outline of geographical distribution for the gamma radiation level has been estimated [4]. In this study, part of the reported data for the gamma radiation level in China [5] and Korea [6] were also used to make a more accurate contour map.
A contour map of the terrestrial gamma radiation dose rate was made by simple interpolation from the data obtained at about 1,000 sites on the Japanese Islands and its adjacent ocean floor. The mean dose rate due to the gamma ray was estimated to be about 50 nGy/h. In general, the southwestern part of the research area has higher dose rate compare with the northeastern one. This regional variation of the dose rate is mainly controlled by the geo-tectonic settings. The terrestrial gamma radiation dose rates on the ocean floor are almost same as the dose rates of neighboring on shore. For the land area, the maximum value of about 500 nGy/h was found around Tamagawa hot spring of Akita prefecture in the northeastern part of Japan. For the ocean floor, relatively high dose rate of about 1,000 nGy/h was estimated at a hydro-thermal vent field off Okinawa island situated in the southern part of Japan.
67

M. Furukawa
2
Although it is limited number of data, the above investigations supply us with valuable information to design the suitable radiation protection system for the wide variety of species and environments in Japan as well as in many Asian countries. The data of natural radiation level for the ocean floor are also precious information to study the strange oceanic environment, such as submarine groundwater discharge which may be an integral part of the oceanic chemical budget, etc.
[1] HATTORI, M., OKANO, M., In situ sea bottom gamma ray sur veys by manned submersibles and ROV, JAMSTEC, Deep-Sea Res. 14 (1997) 639-660.
[2] FURUKAWA, M., Radiation environment of the Earth, Ionizing Radiation 29 (2003) 51-62.
[3] ABE, S., et al., Extensive field survey of natural radiation in Japan, J. Nucl. Sci. Techn. 18 (1981) 21-45.
[4] FURUKAWA, M., Natural radiation level in Japan Islands, J. Geography 102 (1993) 865-877.
[5] LABORATORY OF INDUSTRIAL HYGIENE, CHINA, (Ed.) Chinese J. Radiol. Med. and Protection 5, Suppl. (1989).
[6] FURUKAWA, M., et al., Preliminary survey on the environmental radiation level in Korea: results for radon, thoron and terrestrial gamma radiation, (Proc. First Asian and Oceanic Congress for Radiation Protection (AOCRP-1)), CD-ROM (2002).
68

EXTENDED SYNOPSIS IAEA-CN-118/40
TOPIC: CLIMATE CHANGE
1
Use of Coral Skeleton as Environmental Archives: The Biological Basis
D. Allemanda, C. Ferrier-Pagèsa, P. Furlab, S. Puverela, S. Reynauda, É. Tambuttéa, S. Tambuttéa, D. Zoccolaa
a Centre Scientifique de Monaco, Avenue Saint-Martin, MC 98000 Monaco, Principality of Monaco
bPresent address: UMR 1112 INRA – UNSA, University of Nice Sophia Antipolis, Parc Valrose, F-06108 Nice Cedex 08, France
E-mail address of main author : [email protected]
"There has never been any doubt that corals write valuable information into their skeletons it is their language that has remained blurry and ambiguous" [1].
Paleoceanographers derive information about past environmental conditions from stable isotopes and other tracer records held with geological structures. The skeletons of hermatypic corals are particularly useful for high-resolution studies of tropical paleoceanic environments as they provide an unaltered record of the chemical and physical conditions that existed in the seawater when they were formed. However, these structures do not result from pure chemical CaCO3 precipitation but from highly-regulated biological activities of living organisms. Indeed, trace elements and isotopes were shown to vary widely between and within species [2] or to correlate well with coral growth or extension rates [3]. It was therefore suggested that environmental factors are not completely controlling isotope and trace element signatures in coral skeletons but that biological factors were also important [4]. Furthermore, most of reef-building corals harbor photosynthetic symbionts which stimulate by an unknown mechanism coral calcification, a process called light-enhanced calcification. Consequently, one must consider the effects of these biological activities on the distribution and fractionation of tracers to make correct inferences on climate at the time of skeleton formation. It is, therefore, necessary to understand the physiological mechanisms which control both biomineral formation and carbon supply to the photosynthetic symbiont, called “vital effects”. This paper will present an up-to-date review of the biological control of the biomineralization process in corals which will allow an optimization for the use of coral skeletons as environmental archives.
By using the branched scleractinian coral, Stylophora pistillata as a model organism, we have shown that coral skeleton formation results from two biological processes: regulation of the ion concentrations at the site of biomineralization and secretion of macromo lecules, called organic matrix, regulating crystallization. Both processes are very rapid and need carrier proteins and various enzymes mainly located within a thin cell layer surrounding the skeleton, called the calicoblastic epithelium. Two major enzymes achieving transepithelial calcium transport have already been characterized as well as some aspects of the sources for carbon supply. Organo-mineral interactions and role of organic matrix will be also presented.
69

D. Allemand et al.
2
[1] BARNES, D.J., LOUGH, J.M., Coral skeletons: storage and recovery of environmental information, Global Change Biology 2 (1996) 569-582.
[2] ROSENTHAL, Y., BOYLE, E.A., SLOWERY, N., Temperature control on the incorporation of magnesium, strontium, fluorine and cadmium into benthic foraminiferal shells from Little Bahama Bank: prospects for thermocline paleoceanography, Geochim. Cosmochim. Acta 61 (1997) 3633-3643.
[3] DE VILLIER, S., NELSON, B.K., CHIVAS, A.R., Biological controls on coral Sr/Ca and ?18O reconstructions of sea surface temperatures, Science 269 (1995) 1247-1249.
[4] COHEN, A.L., LAYNE, G.D., HART, S.R., LOBEL, P.S., Kinetic control of skeletal Sr/Ca in a symbiotic coral: implications for the paleotemperature proxy, Paleoceanography 16 1 (2001) 20-26.
70

SAMPLE EXTENDED SYNOPSIS IAEA-CN-118/41
TOPIC: CLIMATE CHANGE
1
Applications of Accelerator Mass Spectrometry to Environmental and Paleoclimate Studies
A. J. T. Jull, G. S. Burr, J. W. Beck, G. Hodgins, D. Biddulph, A. L. Hatheway, T. E. Lange, N. A. Lifton
NSF Arizona AMS Laboratory, The University of Arizona, P O Box 21008, Tucson, Arizona 85721, USA
E-mail address of main author: [email protected]
A wide range of climatic, geologic and archeological records can be characterized by measuring their 14C and 10Be concentrations, using the accelerator mass spectrometry (AMS). These records are found not only in the traditional sampling sites such as lake sediments and ice cores, but also in diverse natural records such as: loess/paleosol deposits, corals, speleothems and forest-fire horizons [1]. The in-situ production of cosmogenic radionuclides in terrestrial materials is a new methodology which provides several possibilities of determining their chronology [2]. The purpose of this paper is to highlight selected applications of AMS, which have bearing to our understanding of both chronology of archival materials, and learning about climatic changes in the past.
The development of a good chronology is very important to the understanding of past climatic changes and their relationship to other events. To correlate distinct climatic features requires that we are able to correlate phenomena, which can be dated independently. The improvement in the radiocarbon calibration curve over the last 26,000 yr has allowed us to cross-correlate fluctuations in the 14C curve directly with those in the ice-core record. This capability has improved attempts to cross-correlate different climatic events observed in one record with other proxy records. This extension of the calibration curve used tree rings to about 11,500 calibrated years and beyond that used corals and varved marine sediments [3]. Other newer but perhaps less-reliable records can take us back to the limits of radiocarbon dating, using lake sediments and speleothem records.
An important consideration in the geochronology of past climate change is that the same event might be manifest in different ways in different parts of the world. For example, the uniformly cold younger Dryas in northern Europe and eastern North America might not have the same expression elsewhere. To give one example, although the Younger Dryas is usually considered a cold event, Chinese loess deposits indicate an oscillatory pattern during the younger Dryas period, the deserts of the American southwest show a drought followed by a period of increased precipitation and the tropical regions show a warming trend. Hence, one must exercise care in extending such interpretations beyond the regional level.
During the Holocene, we also observe appreciable climatic fluctuations. These may be associated with forcing due to solar variations, observed as small effects in the 14C record. Other periodicities in the Holocene climatic record can often be related to solar fluctuations, the most obvious being in the medieval warm period and the Maunder minimum, periods also associated with colder weather in Europe.
71

A. Jull et al.
2
In recent years, millennial-scale periodicities [4] have become recognized in a number of records, including varved lake sediments, loess deposits, marine records and forest- fire records. In this paper, we will highlight some climatic signals, which can be well dated using the small-sample capabilities of accelerator mass spectrometry (AMS). These signals manifest themselves not only in the climate record but affect the extinction of mega fauna as well as archeological events.
There are also climatic effects in such varied reservoirs as Chinese loess deposits, forest fire recurrence, meteorite weathering rates and other phenomena, as well as the more familiar ice cores and oceanic sediments. We will also focus on hiatuses in the radiocarbon calibration curve, which appear to be related to major climatic changes.
[1] JULL, A.J.T., BURR, G.S., McHARGUE, L.R., LANGE, T.E., LIFTON, N.A., BECK, J.W., DONAHUE, D.J., New Frontiers in Dating of Geological, Paleoclimatic and Anthropological applications using accelerator mass spectrometric measurements of 14C and 10Be in diverse samples, Global Planet. Change (in press).
[2] GOSSE, J., PHILLIPS, F.M., Terrestrial in-situ cosmogenic nuclides: theory and application, Quarter. Sci. Rev. 20 (2001) 1475-1560.
[3] HUGHEN, K., BAILLIE, M.G.L., BARD, E., BECK, W., BUCK, C., CUTLER, K., DAMON, P., FAIRBANKS, R., FRIEDRICH, M., GUILDERSON, T., HERRING, C., KROMER, B., McCORMAC, G., BRONK RAMSEY, C., REIMER, P., REIMER, R.W., REMMELE, S., SOUTHON, J., STUIVER, M., VAN DER PLICHT, J., WEYHENMEYER, C.E., BURR, G., EDWARDS, R.L. TAYLOR, F., BLACKWELL, P., Radiocarbon 46 (in press).
[4] BOND, G., SHOWERS, W., CHESEBY, M., LOTTI, R., ALMASI, P., DE MENOCAL, P., PRIORE, P., CULLERI, H., HAJDAS, I., BONANI, G., A pervasive millennial-scale cycle in North Atlantic Holocene and glacial climates, Science 278 (1997) 1257-1266.
72

EXTENDED SYNOPSIS IAEA-CN-118/42
TOPIC: CLIMATE CHANGE
1
Radiocarbon in Corals: A Tracer of Past Changes in the Carbon Cycle and Climate
E. R. M. Druffel
University of California, Irvine, California, U.S.A.
E-mail address of main author: [email protected]
Radiocarbon in annual and monthly bands of coralline aragonite reflects the 14C/12C ratio of the dissolved inorganic carbon (DIC) in surface ocean water that surrounds the coral. The growth rates of massive corals vary from 0.4 to 2.5 cm/yr, and many species grow to several meters in diameter. Therefore, time histories of radiocarbon can be reconstructed for periods of several centuries from corals that grew in tropical and subtropical locations (30N to 30S). Radiocarbon in the surface ocean is controlled mainly by physical processes such as upwelling and lateral transport, which are in turn controlled by climatic variables such as wind speed. Thus, past records of climate are obtained from high precision radiocarbon measurements of banded corals. Radiocarbon time histories for the Pacific and Atlantic Oceans reveal interannual, decadal and centennial variability of past climate.
The exchange rate of CO2 between the atmosphere and surface ocean (90 Gt C/yr) is large compared to the net transport of anthropogenic CO2 into the ocean (~2 Gt C/yr [1]). About one-third of this net CO2 emission is centered in the mid- and eastern tropical Pacific due to enhanced upwelling of subsurface waters that contain high pCO2 values. Thus, variability of the upwelling rate in this region of the world ocean could significantly change the net transport of anthropogenic CO2 into the ocean.
Changes observed in surface ocean radiocarbon during the past few centuries will be evaluated in term of their implications for past changes in the carbon cycle.
[1] SABINE, C., et al, The oceanic sink for anthropogenic CO2, Science 305 (2004) 367-371.
73

EXTENDED SYNOPSIS IAEA-CN-118/43
TOPIC: MASS SPECTROMETRY
1
From Bulk to Particle Analysis – A New Challenge for Radioecology
M. Betti, L. Aldave de las Heras, G. Tamborini
European Commission, JRC, Institute for Transuranium Elements, P. O. Box 2340, 76125, Karlsruhe, Germany
E-mail address of main author: [email protected]
Radioactivity may be introduced in the environment through a variety of systems and processes. Human activities involving nuclear weapons and nuclear fuel cycle (including mining, milling, fuel enrichment, fabrication, reactor operation, spent fuel stores, reprocessing facilities, medical applications and waste storage) are important, leading to a significant creation and release of radioactivity. Human technology also releases pre-existing natural radionuclides, which would otherwise remain trapped in the earth’s crust. For instance, burning of fossil fuel (oil and coal) dominates direct atmospheric release at pre-existing natural radioactivity.
The distribution pattern of radioactive fallout depends on weather conditions (i.e. wet or dry) and on the nature of the surface and the physical-chemical form of the radionuclides, which may vary according to release and transport conditions as well as element properties. A general distinction can be made between gases, aerosols and particulate material. Particles with higher activity concentration, known as “hot particles”, may result from atmospheric nuclear weapon tests or nuclear reactor accidents. Their activity is diluted as material is transferred to soil and water directly or via vegetation and movement through other biota. Therefore, for monitoring radioactivity in the environment it is necessary to analyse bulk samples from all biosphere compartments as well as single microparticles.
Analytical chemistry plays a determinant role for routine verifications as well as in case of radiological alarm to take decision for restoration of the environment and protection of the citizens.
The reference laboratory for the measurement of radioactivity in the environment (MaRE lab) at the Institute for Transuranium Element (European Commission, Joint Research Centre) provides scientific and technical support to the policy of the Directorate General for Transport and Energy (DG TREN) of the European Commission, both for the implementation of the requirements of environmental radioactivity surveillance (Art. 35-36 of the Euratom Treaty) and in the framework of the OSPAR (Oslo-Paris Convention) strategy with regards to radioactive substances for the protection of marine environment of the North-East Atlantic. MaRE lab provides also support to IAEA and Euratom for the detection of clandestine nuclear activities in the framework of nuclear safeguards and non-proliferation of nuclear materials.
In this lecture the role of the analytical techniques based, above all, on mass spectrometry and radiometry, is highlighted as applied to samples of different origin, for the determination of radionuclides (U, Np, Pu, Am, fission products) in bulk as well as in radioactive microparticles. The necessity to have complementary techniques in order to have independent results (in terms of Quality assurance/quality control) as well as to attain a complete inventory of the radioisotopes is shown.
74

EXTENDED SYNOPSIS IAEA-CN-118/44
TOPIC: MODELLING
1
Tracer Studies with Arctic and Subarctic Coupled Ice-ocean Models: Dispersion of Radionuclides and Oxygen Isotopes
M. J. Karchera,b, I. H. Harms c, F. Kaukera,b
a Alfred Wegener Institute for Polar and Marine Research, Bremerhaven, Germany
bO.A.Sys - Ocean Atmosphere Systems GbR, Hamburg, Germany
c Institute for Marine Research, ZMAW, University of Hamburg, Germany
E-mail address of main author: [email protected]
Natural and man-made soluble isotopes which enter the oceanic environment are advected by the ocean-currents or the ice-drift and are distributed over large areas far from their sources. By this they trace the dominant flow patterns and exchanges processes on timescales from years to decades.
By introducing such isotopes as tracers into coupled ice-ocean models used to study the climate system of the Arctic and Subarctic we receive progress in two areas: The intercomparison of model derived tracer distributions with observations offers the opportunity to validate the model experiments. If consistent with observations, the model experiments in turn may serve as an interpretative tool to understand the evolution of the observed distributions. The latter is especially valuable in areas like the Arctic Ocean, where the observations are sparse in time and space. We present examples from two projects introducing the natural isotope d18O as a tracer for river water in the Arctic and the man-made radionuclide Technetium-99, which has been emitted from west-European nuclear reprocessing facilities in increased amounts in the 1990s.
The natural isotope d18O enters the Arctic Ocean via the rivers carrying runoff from the Siberian and North American catchment areas. Since the signature of d18O for the rivers is markedly different from oceanic values it can serve as a tracer for the riverine component of freshwater. The investigation of the dynamics of freshwater in form of ice, ice-melt and river water in the Arctic Ocean is closely linked to a better understanding of the variability of the global thermohaline circulation. The latter is apparently influenced by the amount of freshwater released from the Arctic Ocean into the convective areas of the Nordic Seas and the Labrador Sea. The intercomparison of the modelled and observed patterns of d18O leads to better insight of the state of the large circulation systems which store and advect freshwater in the interior Arctic, namely the Beaufort Gyre and the Transpolar Drift, which have undergone significant changes in the last decade.
The man-made radionuclide Technetium-99 is emitted from the west-European reprocessing facilities in Sellafield and La Hague. Since 1994 the release has increased significantly and introduced an intense signal into the current system of the North Sea, the Nordic Seas and the Arctic Ocean. We simulate the dispersion of this radionuclide for the last decades. The results of this experiment feed into a Norwegian research project which aims an improvement of box-models used for assessment studies and monitoring strategies. At the same time an intercomparison of the simulated technetium signal with observations in the Nordic Seas and
75

M. Karcher et al.
2
the central Arctic Ocean allows a better insight into the ventilation processes of those areas with respect to the inflowing water masses.
We will present recent advances in the described applications of isotopes in climate studies for the Arctic and Subarctic domains and want to demonstrate the large potential of such combined model-observation studies with isotopes for the investigation of the climate system in the north, as well as for applied purposes like the dispersion of dissolved pollutants in the ocean.
76

SAMPLE EXTENDED SYNOPSIS IAEA-CN-118/45
TOPIC: MODELLING
Modelling the Oceanic Nd Isotopic Composition on a Global Scale
T Arsouze a, C. Jeandela, F. Lacanb, N. Ayouba, J-C. Dutayc
a LEGOS (CNRS/CNES/IRD/UPS), Observatoire Midi-Pyrénées, 31400, Toulouse, France
bWoods Hole Oceanographic Institution, Woods Hole, MA 02543, USA
c LSCE (CNRS/CEA) CE L'Orme des Merisiers 91191, Gif sur Yvette, France
E-mail address of main author: [email protected]
Since the end of the eighties, it is recognized that the Nd isotopic composition (expressed as εNd) varies from ca –13 in the North Atlantic to ca –5 in the Pacific. It has been clearly established that far from any source of lithogenic material, εNd is a conservative tracer of water mass mixing [1-5]. Since the range of εNd values of the deep waters are imprinted in the metalliferous sediments, they are used by paleoceanographers to trace the past variations of the thermohaline circulation. However, many studies conducted in the present day ocean highlight that the Nd budgets based only on dust/riverine inputs were not able to reconcile the Nd content and εNd variations between the 3 oceanic basins (the “Nd paradox”). The “missing source” was often suspected to be the oceanic margins but was quantified only recently [6-8].
This talk proposes modelling results of the Nd oceanic distribution (concentration and isotopic composition) on a global scale. For doing that, we first established an extensive compilation of the εNd signatures of the world continental margins (deduced from more than 50 references, figure below). Then, we applied the rate of exchange of Nd between the continental margins and the oceans, deduced from Lacan and Jeandel (in rev.). This allowed to simulate lithogenic Nd inputs into a large scale circulation model (ORCA/OPA). Simulated vertical profiles are compared to those measured in the different oceanic basins.
77

T. Arsouze et al.
2
[1] PIEPGRAS, D.J., WASSERBURG, G.J., Isotopic composition of neodymium in waters from the Drake Passage, Science 217 (1982) 207-217.
[2] PIEPGRAS, D.J., WASSERBURG, G.J., Rare earth element transport in the western North Atlantic inferred from isotopic observations, Geochim. Cosmochim. Acta 51 (1987) 1257-1271.
[3] JEANDEL, C., Concentration and isotopic composition of Nd in the South Atlantic Ocean, Earth Planet. Sci. Lett. 117 (1993) 581-591.
[4] JEANDEL, C., THOURON, D., FIEUX, M., Concentrations and isotopic compositions of neodymium in the eastern Indian Ocean and Indonesian straits, Geochim. Cosmochim. Acta 62 15 (1998) 2597-2607.
[5] LACAN, F., JEANDEL, C., Subpolar Mode Water formation traced by neodymium isotopic composition, Geophys. Res. Lett. (in press).
[6] LACAN, F., JEANDEL, C., Tracing Papua New Guinea imprint on the central Equatorial Pacific Ocean using neodymium isotopic compositions and Rare Earth Element patterns, Earth Planet. Sci. Lett. 186 3-4 (2001) 497-512.
[7] LACAN, F., JEANDEL, C., Neodymium isotopes as a new tool for quantifying exchange fluxes at the continent - ocean interface, Earth Planet. Sci. Lett. (under revision).
[8] TACHIKAWA, K., ATHIAS, V., JEANDEL, C., Neodymium budget in the modern ocean and paleoceanographic implications, J. Geophys. Res. 108 C8 (2003) 3254.
78

EXTENDED SYNOPSIS IAEA-CN-118/46
TOPIC: MODELLING
1
Simulation of the Advection-Diffusion-Scavenging Processes for Cs-137 and Pu-239,240 in Japan Sea
M. Nakano
Japan Nuclear Cycle Development Institute, Tokai, Japan
E-mail address of main author: [email protected]
The author has carried out the worldwide simulation of advection-diffusion-scavenging processes of caesium-137 (Cs-137) and plutonium-239,240 (Pu-239,240) using the oceanic general circulation model (OGCM) and validated the result with the experimental values due to the past atmospheric nuclear tests between 1945 and 1980. As a result, it seems good agreement between the calculated results and the observed ones if the appropriate horizontal and vertical diffusion coefficients were used [1, 2].
Using this technique, the simulation of the advection-diffusion-scavenging processes for Cs-137 and Pu-239,240 in Japan Sea originated from the past atmospheric nuclear tests was carried out and examined the possibility to apply this model to the Japan Sea.
In this study, a modified version of the robust diagnostic OGCM described by Fujio [3] has been applied. The model covers the Japan Sea with real topography and divides it horizontally into 0.5º × 0.5º grids and vertically into 17 levels. Based on the annual average hydrographic data of Levitus 94 and the wind stress data of ECMWF, the annually averaged velocity fields were determined diagnostically.
The procedure of tracking particles was described by the equations (1) and (2).
)()(
xux
=dt
td (1)
0at t 0 == xx (2)
x(t) is the position vector of a particle at time t, and u(x) is the velocity vector at position x(t) calculated by the above OGCM.
The random walk method was applied for the description of the diffusion of radionuclides in water. The distance (dL) of the movement caused by diffusion can be expressed by the equation (3).
24KdtdL R= (3)
K is the horizontal or vertical turbulence coefficient. R is one of uniform random numbers [-0.5, 0.5]. The time step (dt) of the calculation was 2 days.
The one-dimensional, two-phase Pu scavenging model, developed by Perianez[4], has been adopted in the present OGCM. Transfer between the dissolved phase and the particulate phase is subject to the kinetic transfer coefficients, k1(z) (adsorption) and k2 (desorption). The
79

M. Nakano
2
particulate phase sinks at the sedimentation velocity Wz. The detailed description was published elsewhere [2].
Using the horizontal and vertical diffusion coefficient as 3×10⁷, 0.3(cm2/s) respectively, the calculated values of Cs-137 and Pu-239,240 in seawater were compared with the experimental valued obtained by other scientists and institutes. As shown in Fig. 1, the each measured Cs-137 value over 1 Bq/m3 was compared with the calculated one. About 80% of all measured 374 data were included within factor 2. As for Pu-239,240, the value over 10 mBq/m3 was compared with the calculated one. About 60% of all measured 352 data were included within factor 2.
From this result, it seems that this model could be applied to the simulation of the advection-diffusion-scavenging processes for Cs-137 and Pu-239,240 in Japan Sea.
Cs-137 in seawater (K H=3E7, K V=0.3)
1
10
100
1 10 100
Observation(Bq/m 3)
Calculation(Bq/m
3 )
Cal/Obs=0.5
Cal/Obs=2
Pu-239,240 in seawater (K H=3E7, K V=0.3)
10
100
1000
10 100 1000
Observation(mBq/m 3)
Calculation(mBq/m
3 )
Cal/Obs=0.5
Cal/Obs=2
FIG. 1. Comparison figures between the observed values of Cs-137 (left) and Pu-239,240 (right) in seawater samples collected in Japan Sea from 1960s to 2000 and the calculated values in this study.
[1] NAKANO, M., POVINEC, P.P., Oceanic general circulation model for the assessment of the distribution of 137Cs in the world ocean, Deep-Sea Res. II 50 (2003) 2803-2816.
[2] NAKANO, M., POVINEC, P.P., Modelling the distribution of plutonium in the Pacific Ocean, J. Environ. Radioact. 69 (2003) 85-106.
[3] FUJIO, S., IMASATO, N., Diagnostic Calculation for Circulation and Water Mass Movement in the Deep Pacific, J. Geophys. Res. 96 (1991) 759-774.
[4] PERIANEZ, R., Modelling the Distribution of Radionuclides in Deep Ocean Water Columns, Application to 3H, 137Cs and 239,240Pu, J. Environ. Radioact. 38 (1998) 173-194.
80

EXTENDED SYNOPSIS IAEA-CN-118/47
TOPIC: MODELLING
1
Study of the Impact of Geothermal Heating on Ocean General Circulation Model deduced from Natural Helium-3 and Natural 14C Simulations
J-C. Dutaya, P. Jeanbaptistea, G. Madecb, D. Iudicone b, K. Rodgers b
a Laboratoire des Sciences du Climat et de l’Environnement, CEA Saclay, France
bLaboratoire d’Oceanologie et de Dynamique du Climat, Paris, France
E-mail address of main author: [email protected]
We used natural helium-3 and natural 14C simulations to study the effect of the geothermal heating on modeled deep ocean circulation. Helium-3 is injected in the deep ocean through hydrothermal activity, is particularly adapted for testing the effect of the geothermal heating on models’ deep ocean circulation. Its mode of injection in the ocean is related to the heat released to the ocean along ridges axis, with high isotopic values that provides an oceanic distribution with salient horizontal gradients that are particularly adapted for testing the modeled deep oceanic transport. Natural 14C is injected in the ocean at the air-sea interface. Its source in the ocean are well known and provide a severe constraint on the modeled deep circulation. We investigate the effect of geothermal heating with a model sensitivity tests where three simulations were performed with the same version of the ORCA model developed at LODyC (France). In a first simulation the geothermal heating is not included in the forcing of the model, while in a second simulation a uniform geothermal heating is applied on the seafloor, and in a third simulation a spatially varying geothermal heating is imposed. For these simulation, natural helium-3 is injected along axes of mid-ocean ridge, with a flux linearly proportional to the geothermal heating rate. We compare the models results with measurements collected during major global scale ocean observation programs (GEOSECS, WOCEA), and show how natural helium-3 and natural 14C can provide useful information for testing the models' deep ocean circulation. The analysis will particularly focus on the AABW ventilation
81

EXTENDED SYNOPSIS IAEA-CN-118/48
TOPIC: MODELLING
1
Development of an Atmosphere-Land Surface Coupled Isotope Circulation Model
K. Yoshimura, T. Oki
Institute of Industrial Science, The University of Tokyo, 153-8505 Tokyo, Japan
E-mail address of main author: [email protected]
Precipitation isotopes variability is dominantly controlled by large-scale atmospheric moisture transport processes. It was argued by Yoshimura et al. [1] with the Rayleigh-type isotope circulation model with the model reproduction of daily H2
18O variability over the sub-tropics, particularly Thailand, and monthly averages at global scales with GNIP (Global Network of Isotopes in Precipitation). However, there remain some discrepancies between the observation and the simulations. It probably implies that we cannot neglect some effect of land surface processes on the variability of precipitation isotopes; in particular, the effect on diurnal variations on precipitation seems quite large. To take a deeper insight on short-term variability of precipitation isotopes, including diurnal variability, the authors developed an isotope- incorporated land surface model coupled with the existed atmospheric isotope circulation model.
The original land surface model is MATSIRO (Minimal Advanced Treatments of Surface Interaction and Runoff) by Takata et al. [2]. In MATSIRO, evapotranspiration consists of three components; evaporation from bare soil, transpiration from vegetations, and evaporation of canopy- intercepted water. In the MATSIRO-iso, isotopic behavior of those components are individually estimated. For example, evaporation from bare soil (Es) and its isotopic composition (REs) is calculated by using following equation
( )aTssoilaEs qqhVCEs
−= )(ρ (1)
( )aaTsoilTssoilaEs RqRqhVCEs
−= )()(** αρ (2)
−
−==
aTssoil
aaTsoilTssoil
E
E
s
sE qqh
RqRqh
C
C
EE
Rs
s
s)(
)()(** α
(3)
where ? is concentration of water; CEs and CEs* denote bulk coefficients of water and the
isotopes against water vapor, respectively, where the roughness that considers surface resistances is taken into account; the ratio of the bulk coefficients is known as the kinetic fractionation coefficient, and this study regards it as a function of wind speed [3]; hsoil is relative humidity of soil, qs and qa indicate saturated specific humidity and that of air vapor, respectively; Rsoil and Ra denote isotopic composition of water in soil and air, respectively; T is temperature. For running the model, surface boundary conditions are required; specific humidity, wind speed, temperature, pressure, downward radiation, precipitation (convective and large scale), and isotope ratio of precipitation (convective and large scale) and vapor.
82

K. Yoshimura and T. Oki
2
This study used surface variables from GAME reanalysis [4] and isotopic variables from the control run of Yoshimura et al. [1], as the boundary conditions. A vertical one-dimensional experiment in Chiangmai (18.8N, 99.0E), Thailand, for 1 April to 31 October in 1998 was carried out. Figures 1-4 show time series of following: (Fig. 1) states of water storages in each of five soil layers, (Fig. 2) precipitation and runoff, (Fig. 3) isotopic compositions of soil water storages, precipitation, and runoff, (Fig. 4) isotopic compositions of evaporation from bare soil, transpiration from vegetation, and evaporation from canopy- interception. The results indicate isotopes in surface soil layer are largely influenced by precipitation isotopes, but it is hardly affected below 25cm. Moreover, isotopic values in evapotranspiration flux widely fluctuate with a little relation with that in precipitation. It should be noted that the common assumption in many isotopic models, evaporative isotopes is equal to precipitation isotopes, should be reconsidered.
FIG. 1. Soil water storages in five layers. FIG. 2. Precipitation and Runoff.
FIG. 3. Isotopic compositions of Figs. 1 & 2. FIG. 4. Isotopic composition of three evap. fluxes.
[1] YOSHIMURA, K., OKI, T., OHTE, N., KANAE, S., A quantitative analysis of short-term 18O variability with a Rayleigh-type isotope circulation model, J. Geophys. Res. 108 doi:10.1029/2003JD003477 (2003).
[2] TAKATA, K., EMORI, S., WATANABE, T., Development of minimal advanced treatments of surface interaction and runoff, Glob. Planet. Change 38 (2003) 209-222.
[3] JOUZEL, et al., Simulation of the HDO and H218O atmospheric cycles using the NASA
GISS general circulation model: The seasonal cycle for present-day conditions, J. Geophys. Res. 92 (1987) 14,739-14,760.
[4] YAMAZAKI, N., KAMAHORI, H., TAKAHASHI, K., YATAGAI, A., On the GAME reanalysis, UCLA Trop. Meteorol. Newsl. 44, Univ. of Calif., Los Angeles (2001).
83

EXTENDED SYNOPSIS IAEA-CN-118/49
TOPIC: MODELLING
Environmental Modelling: Modified Approach for Compartmental Models
M. Iosjpe
Norwegian Radiation Protection Authority (NRPA), Oesteraas, Norway
E-mail address of main author: [email protected]
The developed in NRPA box model uses the modified approach for compartmental modelling [1], which includes dispersion of radionuclides during time (noninstantaneous mixing in oceanic space). The equations describing transfer of radionuclides between the boxes are of the form dAdt
k A k A t T k A Q t Tiji
j
n
j ijj
n
i j i i i i= − ≥ − + ≥= =
∑ ∑1 1
γ ( ) ,
Ai = 0, t < Ti where kii=0 for all i, Ai and Aj are activities (Bq) at time t in boxes i and j; kij and kji are transfer rates (y-1) between boxes i and j; ki is an effective activity transfer rate (y-1) from box i taking into account loss of material from the compartment without transfer to another, for example radioactive decay; Qi is a source of input into box i (Bq y-1); n is the number of boxes in the system. Ti is the time of availability for box i (the first times when box i is open for dispersion of radionuclides) and γ is an unit function:
γ ( ),,
t TTTi
i
i
≥ =≥<
10
t t
The availability times ∑
∈=
kjjk
Mvvi wT
iim ,),( 0
minµ
are calculated as a minimized sum of the weights for all paths µ0(v0,...,vi) from the initial box (v0) with discharge of radionuclides to the box i on the oriented graph G=(V, E) with a set V of nodes vj correspondent to boxes and a set E of arcs ejk correspondent to the transfer possibility between the boxes j and k. Every arc ejk has a weight wjk which is defined as the time required before the transfer of radionuclides from box j to box k can begin (without any way through other boxes). Mi is a set of feasible paths from the initial box (v0) to the box i (vi). Times of availability are in a good agreement with experimental data for transit and resident times in marine environment. The boxes structure for surface, mid-depth and deep waters is developed with regards to improved description of Polar, Atlantic and Deep waters in the Arctic Ocean and the Northern Seas and site-specific information for description of the boxes. The volume of the water layers in each box has been calculated by using a detailed bathymetry in geographical information system.
84

M. Iosjpe
The model includes the processes of advection of radioactivity between compartments, sedimentation, diffusivity of radioactivity through the pore water, resuspension, mixing due to bioturbation and particle mixing and a burial process of activity in deep sediment. Radioactive decay is included in all compartments. The contamination of biota is further calculated from the radionuclide concentrations in filtered seawater in the different water regions. Doses to man are calculated on the basis of data for the catch of seafood and assumptions about human diet. Doses to biota are calculated on the basis of radionuclide concentrations in water and sediment phases and radionuclides dose conversion factors [2]. In simulations using the ice transport module, based on the present approach with noninstantaneous mixing in marine environment, shows that the effect of radionuclide ice transport to the distribution of radioactivity differs widely and can significantly increase the concentration of radionuclides in sea water, as well as, doses distribution for the radionuclides with high Kd, with this, the dose impact from some sea areas can increase up to one order of magnitude. Examples of model applications are shown in Figure 1, which demonstrates a good agreement between predicted concentration of 239Pu in the Irish Sea and experimental data as well as different time trends for ice and water transport that is possible due to noninstantaneous mixing in oceanic space for dispersion of 241Am from the Kara Sea to the Fram Strait.
Years
1940 1950 1960 1970 1980 1990 2000 2010
Co
nce
ntr
atio
n in
sed
imen
t, B
q/k
g, d
.w.
0
200
400
600
800
1000
1200
1400
1600
1800
EstimatedMeasured (Average)
. Years
0 2 4 6 8 10
241A
m c
on
cen
trat
ion
in lo
bst
er
(Gre
enla
nd
Sea
), B
q/k
g w
.w.
0
1e-6
2e-6
3e-6
4e-6Transport of 241Am without regards to ice transportTransport of 241Am with regards to ice transport
Begining of ice melting
Begining of water transport
FIG. 1. Applications of the model.
[1] IOSJPE, M., et al., Modified approach for box modelling of radiological consequences from releases into marine environment, J. Environ. Radioact. 60 (2002) 91-103.
[2] IOSJPE, M., et al., Modelling approach for environmental impact assessment from radioactive contamination of marine environment (Int. Conf. on the Protection of the Environment from the Effects of Ionising Radiation, 6-10 October 2003, Stockholm, Sweden) IAEA-CN-109, 212-215.
[3] IOSJPE, M., et al., Potential influence of ice transport of radionuclides for doses to man: sensitivity analysis of the ice module parameters (Proc. 5th Int. Conf. environmental radioactivity in the Arctic and Antarctic, St. Petersburg, Russia, 16-20 June, 2002) (STRAND, P., JØLLE, T., SAND, Å., Eds) 231-233.
85

SAMPLE EXTENDED SYNOPSIS IAEA-CN-118/50
TOPIC: MODELLING
1
Validation of Hydrodynamic Model of the Lithuanian Part of the Baltic Sea for 137Cs Modelling
L. Davuliene , N. Tarasiuk, N. Špirkauskaite
Institute of Physics, Vilnius, Lithuania
E-mail address of main author: [email protected]
Measurements of 137Cs activity concentration at the Lithuanian coast revealed inhomogenic distribution and remarkable fluctuations of the concentration depending on the meteorological conditions [1]. The use of one of the known circulation models, BSHcmod, developed for the assessment of passive substance distribution in the Lithuanian marine waters was considered [2]. The area selected for modelling covers the Lithuanian part of the Baltic Sea including the Curonian Lagoon (Fig. 2). Grid of 1’×1’40” was chosen and the vertical water column was divided into five layers. According to the chosen model configuration and the available meteorological data, the model validation results show that the adapted hydrodynamic model is suitable for the Lithuanian marine waters [3].
The main problem raised whether this model intended to passive admixture could be used to describe the distribution of radiocesium activity concentration. The study was carried out in order to validate the capability of the circulation model of Lithuanian marine waters to simulate the distribution of the technogenic radionuclide 137Cs in the Baltic Sea at the Lithuanian coast. The validation of the model was based on the measurements data collected during the expeditions. After validation the developed model was used to study the distribution of radionuclide concentration in the marine environment in relation to input sources and the key oceanographic processes specific to that area of the Baltic Sea.
Investigations of the distribution of 137Cs activity concentrations in the Lithuanian part of the Baltic Sea were carried out in 1999-2001: at the national and HELCOM monitoring stations in the Baltic Sea and Curonian Lagoon; during expedition in the year 2001 - at a 9 stations located on the 20’× 10’ grid in the Baltic Sea. The water samples in Preila and Juodkrante were taken from the beach.
Field data on 137Cs activity concentration measured in the open sea surface waters are almost uniform (73-79 Bq/m3) with some increase in the near shore waters of the Preila background station (75-98 Bq/m3) in May and October 1999, while in June 2000 the 137Cs activity concentration in this region decreased to 53-69 Bq/m3. Generally the 137Cs activity concentration in the open sea surface waters in 2001 decreased on average by about 20% (60-67 Bq/m3). The lowest 137Cs activity concentration found in the samples collected at stations situated near the Klaipeda Strait was 39-53 Bq/m3. This could be evidently due to flow out of fresh water Klaipeda Strait, which contains a small amount of radiocesium.
The measurement data show relation of the salinity and 137Cs activity concentration (Fig. 1). In order to assess the applicability of the circulation model for the Lithuanian marine waters to simulate the 137Cs distribution in the Baltic Sea at the Lithuanian coast the salinity for the periods of expeditions was simulated. The errors (standard deviation) between simulated and
86

L. Davuliene et al.
2
measured salinity for the two periods in 1999 and 2001 are 0.34 and 0.19 psu, respectively. The correlation coefficients between measured and radionuclide activity concentration and salinity are 0.94 and 0.97, standard deviation – 5.8 and 1.7 Bq/m3, respectively. Thus the salinity could be related to the 137Cs activity concentration with the reliability error less than 15%. As there are more measured and also simulated (important for the open boundaries) salinity data available the results of salinity simulations could be applied to estimate 137Cs activity concentration within this error gap.
The simulations of the salinity distribution for the period of 1999-2001 have shown that the fresh water flow from the Curonian Lagoon modifies the salinity in the Baltic Sea at the Lithuanian coast mostly in the area of 15 km from the seashore (Fig. 1). The calculated variance of salinity was found negligible in the area approximately 30 km further from the coast. Therefore, the parameters measured at this distance could be used for the model calibration as the background values typical of the south-eastern Baltic Sea.
3.5 4.0 4.5 5.0 5.5 6.0 6.5 7.0 7.5 8.0
40
50
60
70
80
90
Measurements: October 2001 May 1999
137 C
s ac
tivity
con
cent
ratio
n, B
q/m
3
salinity, ‰
FIG. 1. Relation between the measured salinity and 137Cs activity concentrations.
FIG. 2. Average salinity distribution and the wind rose ( ) for the period of May-September 1999.
[1] STYRO, D., BUMELIENE, Ž., LUKINSKIENE, M., MORKUNIENE, R., 137Cs and 90Sr behavioural regularities in the southeastern part of the Baltic Sea, J. Environ. Radioact. 53 (2001) 27–39.
[2] DICK, S., KLEINE, E., MÜLLER-NAVARRA, S., KLEIN, H., KOMO, H., The Operational Circulation Model of BSH (BSHcmod), Berichte des BSH 29 (2001) 48.
[3] DAVULIENE, L., DAILIDIENE, I., DICK, S., TRINKUNAS, G., VALKUNAS, L., Validation of Circulation Model for Lithuanian coastal waters, Environmental and Chemical Physics, Vilnius 24 4 (2002) 226–231.
S
N
87

EXTENDED SYNOPSIS IAEA-CN-118/51
TOPIC: MODELLING
1
Modelling of the Transport of 3H and 137Cs Released with the Liquid Effluents of Angra dos Reis Nuclear Power Plants into Ilha Grande Bay – Rio de Janeiro – Brazil
M. R. Franklina, P. C. C. Rosmanb, H. M. Fernandesa
a
b
Institute of Radiation Protection and Dosimetry (IRD), Rio de Janeiro, Brazil
Rio de Janeiro Federal University (COPPE/UFRJ), Rio de Janeiro, Brazil
E-mail address of main author: [email protected]
The Almirante Alvaro Alberto Nuclear Center (CNAAA), is integrated by two PWR nuclear power reactors known as Angra I and Angra II. The center is located in Rio de Janeiro State about 150 km away from Rio de Janeiro city. Both reactors release their liquid effluents into the Ilha Grande Bay (BIG). The radionuclide releases are not continuous (each release cycle takes about 1 h) and are done into the reactors cooling waters which are released into a small inlet inside the bay in a rate of 120 m3 /h. Table I shows the annual releases of 137Cs and 3H with the liquid effluents.
TABLE I. ANNUAL RELEASES OF 3H AND 137CS WITH THE LIQUID EFFLUENTS OF THE NUCLEAR POWER PLANTS OF ANGRA DOS REIS
Annual Release in Bq Radionuclide Angra I Angra II
3H 4.03 x 10¹² 3.12 x 10¹³ 137Cs 5.07 x 10⁸ 1.11 x 10¹¹
Until now, most of the attention, regarding environmental impacts, was directed to gaseous emissions, especially in case of accidents. No consistent simulation of the fate and transport of radionuclides in the coastal system was available. As a result of this, the objective of this work was to simulate the dispersion of 3H and 137Cs present in the liquid effluents that are routinely released into the environment, and in this way contribute to the improvement of the radiological impact assessment associated to these releases.
For the purpose of assessing the dispersion of radionuclide in the BIG, the present modeling study was divided into two stages. It was assumed that radionuclide concentration is a passive scalar. The first stage concerned the hydrodynamic modeling of the bay (hydrodynamic module). The second focused on modeling the transport of cooling water plumes containing the radionuclides (transport module). Both modules are integrated in a computational system called SisBAHIA [1, 2].
The current patterns, generated by tides and winds, for different scenarios were characterized by means of a bi-dimensional model (2DH). This module has been calibrated in order to reproduce field data. The velocity fields, as well as the advection/diffusion terms, generated by the hydrodynamic model, were used as input data in the modeling of the radionuclide
88

M. Franklin et al.
2
dispersion. The radionuclides dispersion was assessed in the transport module by means of an 2DH advective-diffusive Eulerian transport model.
The results of the first module indicate that the pattern of circulation in the Ilha Grande Bay is strongly driven by the energy of the tides. Winds – prevailing and extreme – do not cause significant changes in the circulation pattern of the study area. The currents are characterized by low velocities, where prevailing situations for neap and spring tides, are characterized by velocities of about 0,05 m/s and 0,10 m/s, respectively. These results are consistent with the results obtained from field works. Local hydrodynamics is markedly altered by means of the formation of huge vortices close to the release area.
According to the annual predicted releases rates, as reported in the Final Safety Analysis Report, and providing for an adaptation to a continuous release, it could be predicted that the radionuclide plume would present a low mobility, with most of the significant radionuclide activity concentrations being restricted close to the source. The activity concentration distribution reach the transportation steady state by the end of the 51st day of simulation. As it is shown in Fig. 1.
Based on the obtained results (very low concentrations), it can be seen that no significant dose increases are to be expected as a result of the long term operation of both reactors. The model, now available, constitutes a very useful tool in the decision making regarding non-expected (accidental) releases.
Fig. 1. Dispersion pattern of the contaminants plume 51 days after the release.
[1] ROSMAN, P.C.C., Modeling shallow water bodies via filtering techniques, Ph.D. Thesis, Dept. of Civil Engineering, Massachusetts Institute of Technology, USA (1987).
[2] ROSMAN, P.C.C., Modelos de circulação em corpos de água rasos, Em Métodos numéricos aplicados a recursos hídricos, v.1, capítulo 3, Associação Brasileira de Recursos Hídricos (ABRH), Rio de Janeiro, Brasil (1989).
This work was partially supported by the International Atomic Energy Agency – IAEA – under the research contract No. BRA – 9002.
89

EXTENDED SYNOPSIS IAEA-CN-118/52
TOPIC: MODELLING
1
3D Modeling Technique of Time-series 137Cs Concentration in Coastal Organisms in Case of Short Term Introduction
Y. Tatedaa, A. Wadab
a Environmental Science Research Laboratory (CRIEPI), Abiko, Japan
bNihon University, Tokyo, Japan
E-mail address of main author: [email protected]
Short term estimation of released radionuclides behavior is necessary for decision-making in emergent action. To predict radionuclide concentrations in marine organisms under short term radionuclide introduction to coastal water, the simple time series 137Cs transfer both from seawater and food chain to marine organisms were studied [1, 2]. The model was developed for typical Japanese coastal water including benthic food chain and planktonic food chain, with transfer parameter data set, such as uptake rate constant, excretion rate constants, gut transfer rates, food ingestion rates of 137Cs, those collected by many tracer experiment studies [3].
For the development of the modeling technique in prediction of the temporal 137Cs concentrations in marine biota, the time and space distributions of 137Cs concentrations in marine organisms are important especially in case of short term introduction to coastal area. We developed a 3-dimension model being composed of nuclide transfer both from seawater and food chain in imaginary coastal area, expressing the temporal 137Cs concentrations in marine organisms accompanied with the habitat location.
The result of 3D modeling in case of short term introduction to exhibit the following information; 1) The introduced 137Cs in seawater is diluted and disappeared quickly under normal current conditions, while 137Cs in organisms slowly increased even after the seawater is cleared, mainly from the contribution from 137Cs transfer through food chain. 2) The 137Cs concentration in fish of higher trophic level appears approximately 100 days later, and the concentration ratio (137Cs in organism / 137Cs in seawater) reaches only 1 - 10 even using the maximum 137Cs concentrations in organism and seawater.
90

Y. Tateda and A. Wada
2
FIG. 1. Simulation of temporal elevation of 137Cs concentrations in seawater (St.1-3:coastal sites) and coastal benthic fish respond to 137Cs introduction to surface water under different current conditions (Case2-1: north, 2-2:south).
[1] TATEDA, Y., Development of Basic Model for Dynamic Prediction of 137Cs Concentration in Marine Organism, Abiko Research Laboratory CRIEPI Rep. U94056 (1997) (in Japanese) 57.
[2] TATEDA, Y., Basic Model for the prediction of 137Cs Concentration in the Organisms of detritus Food Chain, Abiko Research Laboratory CRIEPI Rep. U97022 (1997) (in Japanese) (1997) 28.
[3] TATEDA, Y. et al., Modeling of 137Cs concentration change in organisms of the Japanese coastal food chains, IAEA-TECDOC-1094, IAEA, Vienna (1998) 323-325.
91

EXTENDED SYNOPSIS IAEA-CN-118/53 TOPIC: MODELLING
1
A Biokinetic Model for the Uptake and Release of Radioiodine by the Edible Periwinkle Littorina littorea
J. Vives i Batllea, R. C. Wilsona, P. McDonalda, T. G. Parkerb
a Westlakes Scientific Consulting, Cumbria, UK
bBritish Nuclear Fuels plc (BNFL), Sellafield, UK
E-mail address of main author: [email protected]
A dynamic model for the prediction of radioiodine concentrations in the edible periwinkle Littorina littorea following uptake from both seawater and seaweed (Chondrus crispus) has been developed and successfully tested. This relatively simple biokinetic model is capable of reproducing the uptake and release concentration profiles, uptake half times, biological half-lives, concentration factors and the basic differences in organ distribution observed experimentally by Vives i Batlle et al. [1] and Wilson et al. [2], using a unique set of calibration parameters. The model thus calibrated has also been found to provide a reasonable approximation to the available monitoring data for 129I in winkles from the Sellafield area in the UK, spanning the years between 1950 and 2003.
The model as a whole can be described as a first order linear differential equation system containing 12 compartments and pertaining to it is a set of 34 parameters encapsulating the calibration information generated from the laboratory experiments and knowledge of the local ecosystem. The model comprises sub-modules for the calculation of 129I concentrations in the coastal ecosystem near Sellafield, food and the winkles themselves. Central to the design is a biokinetic sub-model for winkles containing compartments for the shell, gastro- intestinal tract, soft tissue and storage organs. The model is found to reproduce the uptake and release patterns observed for radioiodine in winkles. Specifically, the model returns uptake profiles compatible with an uptake half time of 11 days, as observed for winkles exposed to either (a) radioiodine in seawater or (b) radioiodine ingested from radio- labelled Chondrus crispus. Additionally, the model returns release patterns compatible with the triphasic depuration sequence with biological half- lives of 4 days, 23 days and 56 days following uptake of radioiodine from seawater, and the biphasic depuration sequence with biological half- lives of 1 and 24 days following uptake from Chondrus crispus. A good degree of correlation between experimentally measured and modelled activities in winkles has been found.
The model predicts correctly that, following ingestion from seaweed radioiodine partitions towards the soft parts in favour of shell whereas the opposite occurs following uptake from seawater. To represent the field situation a combined input from both seawater and seaweed was modelled. Under these conditions the model successfully predicts that the activity associated with the edible fraction of the winkles is only ~20%, and that the majority (some 90%) of the activity retained by winkles will originate from seawater.
Turning to comparisons with the available monitoring data for 129I in winkles from the Sellafield coastal zone, we found that modelled edible winkle concentrations follow the general profile of the discharge as expected. The limited monitoring data available is approached by the model prediction which is given with a range of variation of typically ±
92

J. Vives i Batlle et al.
2
13%, as derived from confidence interval calculations. The model calculation is that for the period 1970 - 1974 activity concentrations of 129I in winkles were low (< 0.1 Bq kg-1), then an increase occurred and a second plateau would be reached in 2003, with activity concentrations typically in the order of 1 Bq kg-1. Beyond this, model runs with projected 129I discharge scenarios for 2004-2030 predict that winkle concentrations will continue at about 1 Bq kg-1 until about 2022, followed by a sharp decrease of more than one order of magnitude in the ensuing 2 years. By 2030 129I concentrations would be stabilised at about 0.05 Bq kg-1.
Predicted committed effective doses to the West Cumbrian critical group of fish and shellfish consumers arising from the consumption of winkles as predicted by the model are low and have no radiological significance. The single 2002 annual dose reported by BNFL [3] specifically for winkles at 0.36 µSv a-1 is close to the model prediction of 0.57 µSv a-1. Predicted annual doses due to 129I in the winkles themselves, calculated using up-to-date doses to biota methodology [4, 5], are also very low, peak doses being only in the order of 0.3 µGy a-1. Clearly, in terms of the present model prediction, winkles are not at risk from exposure to 129I under the current discharge regime [6].
[1] VIVES I BATLLE, J., WILSON, R.C., MCDONALD, P., PARKER, T.G., Uptake and depuration of 131I by the edible winkle Littorina littorea: Uptake from seawater, J. Environ. Radioact. (in press).
[2] WILSON, R.C., VIVES I BATLLE, J., MCDONALD, P., PARKER, T.G., Uptake and depuration of 131I by the edible periwinkle Littorina littorea: uptake from labelled seaweed (Chondrus crispus), J. Environ. Radioact. (submitted).
[3] BRITISH NUCLEAR FUELS plc, Discharges and Monitoring of the Environment in the UK Annual Report 1986 to 2003, BNFL Risley (1975-2003).
[4] BROWN, J., GOMEZ-ROS, J.-M., JONES, S.R., PRÖHL, G., TARANENKO, V., THØRRING, H., VIVES I BATLLE, J., WOODHEAD, D., Dosimetric models and data for assessing radiation exposures to biota, (PROHL, G., Ed.) FASSET (Framework for Assessment of Environmental Impact) Deliverable 3 Report under Contract No FIGE-CT-2000-00102 (2003).
[5] E.A., Impact Assessment of Ionising Radiation on Wildlife, R&D Publication 128, July 2001, ISBN 1 85705 590 X (2001).
[6] ROSE, K.S.B., Lower limits of radiosensitivity in organisms, excluding man, J. Environ. Radioact. 15 2 (1992) 113-134.
93

EXTENDED SYNOPSIS IAEA-CN-118/54
TOPIC: MODELLING
1
Performance Evaluation of the Recently Commissioned Worli Submarine Outfall, Mumbai, India Using Radiotracer Studies and Mathematical Modelling
J. Noblea, U. S. Kumara, U. P. Kulkarnia, S. V. Navadaa, I. Guptab, R. Kumarb
a Isotope Applications Division, Bhabha Atomic Research Centre (BARC), Trombay, Mumbai – 400 085, India
bNational Environmental Engineering Research Institute (NEERI), Mumbai – 400 018, India
E-mail address of main author: [email protected]
Coastal cities have the unique advantage of disposing the generated municipal and industrial effluents by discharging them into the adjacent coastal waters through long offshore outfalls to reduce any environmental concerns. The island city of Mumbai with a population of about 12 million currently experiences severe coastal pollution problems associated with the disposal of about 2225 million litres of untreated or partially treated sewage into the coastal waters every day. In order to improve the coastal water quality standards by dilution, dispersion and flushing, a few offshore sewage outfalls have been constructed at various locations and a few are underway. One such recently commissioned submarine outfall is located at Worli. Here the collected wastewater is screened, degritted and then discharges into the tidal waters by gravity through a 3.4 km long offshore submarine outfall equipped with multi-port diffuser assembly for additional entrainment. The multiport diffuser system is composed of 10 risers, spread over 240 m and is aligned normal to the direction of tidal currents. Under normal operating conditions, the flow rate of sewage is about 7.2 m3/s. To assess the functioning of the Worli outfall by studying the sewage dilution and dispersion processes, three radiotracer injections were carried out under various tidal conditions in the post commissioned regime.
Initial dilution being an outfall design parameter, is normally computed using various mathematical models. Other dispersion characteristics such as plume geometry, dilution factors, dispersion coefficients etc. can also be predicted using empirical models. These models generally developed for highly idealised flow conditions are rarely validated for complex field conditions. In the present study, the data obtained from radiotracer experiments was also used for the validation of various empirical and numerical near- & far- field models.
Radioactive 82Br (t1/2 = 36 hrs) in the form of aqueous ammonium bromide was used as the tracer for all the injections in view of its excellent property for tracing the sewage discharge. The first two injections were intended to understand the plume behaviour, whereas the data obtained from the third injection was used for the validation of mathematical models. Rhodamine WT was also simultaneously injected for visual appearance of the plume. Temporal and spatial distribution of ambient current velocities were measured by deploying current meters. The first tracer injection was conducted at the onset of (spring) ebb tide. About 110 GBq of 82Br was diluted in 15 litres of water and continuously injected along with the sewage for 1 hour at the rate of 250 ml/min. As the radioactive plume was established, the area downstream of the diffuser was tracked using submersible water proof γ-scintillation
94

J. Noble et al.
2
detector coupled to scaler/ratemeter. Dye concentrations were analysed in the laboratory using spectro-fluorophotometer. Integration of data from the plume monitoring program helped to construct 3D picture of the sewage field in the form of iso-activity contours. It was observed that the sewage movement is predominantly tide drifted and follows the current direction. At the near- field, the sewage comes out from the risers in the form of non-merging and surfacing plume. In the far- field, the plume was found to be confined to the top 1-2 m without mixing over the entire depth. The two observed surficial plumes suggests that advection processes dominates over lateral mixing. Dilution factors and dispersion co-efficients were also estimated from the radiotracer data.
About 64 GBq of 82Br was used in the second injection which was conducted during an (neap) ebb slack period. Counter clockwise movement of sewage plume was observed during flow reversals and the dispersion during slack periods are ma inly controlled by the onshore winds. Effect of wind induced currents on floatable materials were also studied by drogue tracking.
In the third injection conducted during a flood tide, about 74 GBq of 82Br was used. The obtained radiotracer and dye tracer data was utilized for the validation of commonly used near-field models such as Cornel Mixing Zone Expert System (CORMIX), 3D Lagrangian Jet Model (JETLAG) & the empirical model of Roberts and others [1]. The validated far- field models include the empirical models proposed by Brooks [2] & Gardanov [3] and a depth integrated 2D hydrodynamic and solute transport finite difference model, DIVAST. The numerical model with three open boundaries (two flow and one elevation boundary) was initially calibrated with observed tidal elevations and velocity data. The mathematical model predicted dilution factors and other hydraulic parameters were found to match fairly well with radiotracer and dye tracer data. The slight variation in near field model prediction is because of the limitation of those models in representing the complex design of Worli outfall.
From the study, it is concluded that, even though the outfall operational parameters have not yet been optimised by the operating agency, the performance of the Worli outfall is found to be satisfactory in terms of reducing the impact of sewage discharges on coastal waters and thereby improving the water quality.
[1] ROBERTS, P.J.W., SNYDER, W.H., BAUMGARTNER D.J., Ocean Outfalls II: Spatial Evolution of Submerged Wastefield, J. Hydr. Eng. ASCE, 115 1 (1989) 26-48.
[2] BROOKS, N.H., Diffusion of Sewage Effluent in an Ocean Current (Proc. 1st Int. Conf. on Waste Disposal in the Marine Env.), Pergamon, N.Y. (1960).
[3] GARDANOC, T.V., Determination of the Pollutant Far-fields Dilution Using Variable Turbulent Diffusion Coefficients, Wat. Sci. Tech. 32 7 (1995) 41-46.
95

EXTENDED SYNOPSIS IAEA-CN-118/55
TOPIC: STABLE ISOTOPES IN WATER
1
Stable Water Isotopes: Revolutionary Tools for Global Water Cycle Disturbance Diagnosis
A. Henderson-Sellers a, P. Aireya, D. Stone a, K. McGuffieb, A. Williamsa
a ANSTO Environment, Sydney, Australia
bApplied Physics, University of Technology, Sydney, Australia
E-mail address of main author: [email protected]
Two rare but naturally occurring isotopes of water, 1H218O and 1H2H16O, are coming to be of
practical use in diagnosis of climate and earth system model performance. Their value as tracers and validation tools in hydrological sub-systems derives from the systematic and different (from each other and from the most abundant water isotope: 1H1H16O) paths and residence times they exhibit as a result of phase change, chemical exchange and diffusive differentiation. Applications of the simulation of stable isotopic behaviour simulated by global climate or earth system models, including river isotopic characterization of basin changes and plant-respired oxygen isotope ‘tagging’, to resolving uncertainty are limited until more basic criteria such as conservation, current mean climate and capture of observed variability are demonstrated. Here we assess the simulation of isotopic fluxes in basin-scale hydrology, focusing on the ‘big leaf’ representation of land surfaces in numerical models as the current mechanism for incorporating water isotopes. We find that surface water budgets are still rather poorly simulated and inadequately constrained at the scale of large basins; yet surface energy partition can be apparently well captured by models with inadequate land-surface parameterization [1].
We conclude that surface water budgets are still rather poorly simulated and badly constrained at the scale of large basins and surface energy partition can be apparently well captured by models with inadequate land-surface parameterization and fluxes. As such, budgets of the isotopes H2
18O and 1H2H16O are not yet able to be simulated adequately, which provides both renewed motivation and additional constraints for improving surface exchange schemes. While HDO and H2
18O simulations are substantially influenced by current inadequacies in basin scale hydrological simulation, their strength is in elucidating aspects of these shortcomings in the underlying models. We are, however, able here to deduce information from isotopes that would otherwise have been undetectable. In particular, for the two models examined in detail, isotopic interpretations have shown the energy balance is correct for the wrong reasons (i.e., isotopes show water budgets are incorrect) and that the net convergence and recycling of water in the atmosphere can be deduced from stable isotopes of water and leads to additional information about the gross water fluxes.
Fluxes and reservoirs of the isotopes H218O and 1H2H16O are demonstrated here to have
diagnostic utility in eva luating surface energy and water budgets, and stable isotopic interpretation of basin water budgets is shown to add information about the gross water fluxes. However, a much more comprehensive set of observations is needed to make conclusive statements on the accuracy of hydrologic simulations from climate system models on global and even basin scales.
96

A. Henderson-Sellers et al.
2
[1] HENDERSON-SELLERS, A., MCGUFFIE, K., NOONE, D., IRANNEJAD, P., Using
stable water isotopes to evaluate basin-scale simulations of surface water budgets, J. Hydrometeorology (in press).
97

EXTENDED SYNOPSIS IAEA-CN-118/56
TOPIC: STABLE ISOTOPES IN WATER
1
Line-Conditioned Excess: A New Method for Characterizing Stable Hydrogen and Oxygen Isotope Ratios in Hydrologic Systems
J. M. Landwehr, T. B. Coplen
U.S. Geological Survey (USGS), MS 431, Reston, Virginia, 20192, USA
E-mail address of main author: [email protected]
Our recent work characterizing the co-variation of stable isotope ratios in the large river systems of the United States [1] has led us to develop a new method to express the relationship between stable hydrogen and oxygen isotope ratios in these systems and which has proved very useful in screening water samples with respect to meteoric conditions. The relationship between the relative stable hydrogen and oxygen isotope ratios of water systems was identified by Craig [2] as
δ2H = 8 * δ18O + 10
who characterized this relationship as indicative of "waters which have not undergone excessive evapotranspiration." Rozanski and others [3] refined Craig's formula to express the global meteoric water line (GMWL) by replacing 8‰ with 8.13‰ and 10‰ with 10.8‰. Dansgaard [4] defined the concept of deuterium-excess, or d-excess, as
d-excess = δ2H - 8*δ18O.
which can be interpreted as an index of non-equilibrium in the simple condensation - evaporation of global precipitation. This formulation has been useful for screening isotopic results from water samples: values of d-excess between 10 and 11 are effectively the intercept in Craig’s proposed relationship and indicate quasi-stable conditions at a relative humidity of ~85%. We propose here a more general concept called line-conditioned excess, which is defined to be the difference between the δ 2H and a linear transform of the δ18O of a water sample; that is,
line-conditioned excess = δ2H - a*δ18O - b
where a and b are the coefficients of the local meteoric water line. For the precipitation samples for which a local meteoric water line is defined, the line-conditioned excess values are the regression residuals; for samples from water systems within a region, line-conditioned excess indicates process differences from their presumed source, namely local precipitation. Because the local meteoric water line is not always known, we define a specific line condition excess form, LC-excess, with respect to the GMWL as defined by Rozanski and others [4], namely
LC-excess = δ 2H - 8.13 *δ 18O - 10.8
This formulation diminishes bias due to extreme δ18O values and is useful in screening water samples: negative (positive) values of LC-excess indicate values that would plot below (above) the GMWL, with y-axis being stable hydrogen isotope ratios and x-axis being stable
98

J. Landwehr and T. Coplen
2
oxygen isotope ratios. If the coefficients of the local meteoric water line are comparable with the global meteoric water line, negative LC-excess values are indicative of evaporative isotopic fractionation and positive values of LC-excess suggest moisture source differences. Using the known analytical errors of δ 2H and δ18O, we can derive the standard deviation S for the line-conditioned excess statistic and rescale it to assess significant departures from meteoric conditions. That is,
line-conditioned excess * = [δ 2H - a*δ18O - b ] / S
or
LC-excess* = δ 2H - 8.13 *δ18O - 10.8 /S
= (1/S)*δ 2H - (8.13/S) *δ 18O - (10.8 /S)
We have found these formulations to be very useful in screening water samples for any handling errors due to evaporative conditions after the sample was taken as well as providing a comparison of the water source relative to global precipitation. LC-excess has also proved valuable in studying the influence of unique events on surface systems. Illustrations are taken from ongoing work with large rivers of the United States.
[1] LANDWEHR, J.M., COPLEN, T.B., The Oxygen and Hydrogen Ratios in Waters from the Largest River Systems of the United States (Proc. International Symp. on Isotope Hydrology and Integrated Water Resources Management, Vienna, 2003) IAEA-CN-104 (2003) 98.
[2] CRAIG, H., Isotopic Variations in Meteoric Waters, Science 133 (1961) 1702-1703. [3] ROZANSKI, K., ARAGUAS-ARAGUAS, L., GONFIANTINI, R., Isotopic Patterns in
Modern Global Precipitation (Climate Change in Continental Isotopic Records, Geophysical Monograph 78, (SWART, P.K. LOHMANN, K.C., MCKENZIE, J,M SAVIN, S. Eds), American Geophysical Union, Washington D.C. (1993) 1-36.
[4] DANSGAARD, W., Stable isotopes in precipitation, Tellus XVI 4 (1964) 436-468.
99

EXTENDED SYNOPSIS IAEA-CN-118/57
TOPIC: STABLE ISOTOPES IN WATER
1
Delineating Sources of Sulfate and Nitrate in Rivers and Streams by combining Hydrological, Chemical and Isotopic Techniques
B. Mayera, L. Rocka, L. Hogbergb, L. Jacksonb, M. Varnerc, J. B. Shanleyd, S. W. Baileye, M. J. Mitchellf
a Department of Geology & Geophysics, University of Calgary, Alberta T2N 1N4, Canada
bDepartment of Biological Sciences, University of Calgary, Alberta T2N 1N4, Canada
c Department of Physics & Astronomy, University of Calgary, Alberta T2N 1N4, Canada
dU.S. Geological Survey, P.O. Box 628, Montpelier, Vermont, 05602 USA
e USDA Forest Service, Northeastern Research Station, Hubbard Brook Experimental Forest, RR1 Box 779, New Hampshire 03223, USA
f State University of New York, College of Environmental Science & Forestry, Syracuse, New York 13210, USA
E-mail address of main author: [email protected]
There are an increasing number of studies published in the literature, which report on the isotopic compositions of sulfate (δ34S and δ18O) and nitrate (δ15N and δ18O) in headwater creeks, rivers, and streams. Many of these studies are, however, characterized by infrequent sampling and by a scarcity of accompanying hydrological or chemical data. This severely hampers the ability to relate the obtained isotope data to potential sources of sulfate and nitrate, or to processes which these solutes may have undergone in aquatic systems. We present a number of case studies, in which sulfate and nitrate from surface water systems were sampled repeatedly and the obtained δ34S, δ15N and δ18O values were interpreted in conjunction with hydrological and chemical data.
Using this approach in selected forested headwater catchments in New Hampshire and Vermont (USA), we were able to show that a significant portion of stream water sulfate during base flow may be derived from weathering of bedrock, particularly in catchments with sulfur-rich lithology. During storm events at the Archer Creek sub-catchments in the Arbutus Lake Watershed in the central Adirondack Mountains of New York State (USA) in the fall of 2002, sulfate concentrations in stream water increased significantly and δ34Ssulfate decreased to minimum values. This suggested that sulfate derived from oxidation of sulfide minerals, possibly in wetland areas or the hyporheic zone, contributed to the increased sulfate load in the streams following the storm events. Monitoring of stream water during spring snowmelt events in the Sleepers River Research Watershed (Vermont, USA) revealed elevated contributions of sulfate from pedospheric sources, but little direct contribution of sulfate from the melting snowpack. Also, nitrate was not derived from atmospheric inputs but primarily from nitrification processes in the soils.
100

B. Mayer et al.
2
In agriculturally used portions of a large watershed in southern Alberta (Canada), oxidation of pyrite in tills was identified as an additional source of riverine sulfate, indicated by increasing sulfate concentrations and decreasing δ34S values. Furthermore, chemical and isotopic data showed that manure-derived nitrogen was responsible for increasing nitrate concentrations in the Oldman River and its tributaries, which drain agricultural land. Particularly in parts of the watershed with intensive irrigation, manure-derived nitrate appeared preferentially during the winter months in the irrigation canals, tributaries, and the Oldman River. This suggests that hydrological conditions control agricultural return flows to the surface water bodies in southern Alberta and impart significant seasonal variations on concentrations and isotopic compositions of riverine nitrate.
Using a combination of hydrological, chemical and isotopic techniques, we were also able to show that urban centers, such as Calgary in southern Alberta (Canada), have a significant impact on riverine nitrate and sulfate loads. Elevated nitrate concentrations were observed 30 to 50 km downstream of a large municipal sewage treatment plant, whereas δ15N values indicated the presence of sewage-derived nitrate more than 60 km downstream of the point source. Sulfate concentrations also increased significantly in the Bow River downstream of the city of Calgary. Initially, it was speculated that this might be caused by the use of alum (aluminum sulfate) during drinking water treatment, but the changes in the isotopic composition of sulfate in river water below the city were inconsistent with this hypothesis. Therefore, we analyzed the sulfur isotope ratios of soluble sulfate released from a number of widely used detergents, soaps, and shampoos obtained from local supermarkets and determined an average δ34S value of +1 ± 4‰ (n = 18). Since sulfate released from the large municipal sewage treatment plant had similar δ34S values, we concluded that the use of detergents and soaps in households is a major contributor to the increased sulfate load in the Bow River downstream of the city of Calgary.
In watersheds with forested, agricultural and/or urban land use, there are a number of different natural and anthropogenic sources of riverine sulfate and nitrate. Their relative contributions to sulfate and nitrate loads in rivers and streams can vary significantly depending on hydrological conditions and hence season. To identify these different sources and to asses their relative contributions, it is essential to repeatedly determine the isotopic composition of sulfate and nitrate obtained from several sampling sites along headwater creeks, rivers or streams. Interpretation of the trends of the obtained isotope data in conjunction with hydrological and chemical parameters will result in a significantly improved understanding of the sources of riverine sulfate and nitrate.
101

EXTENDED SYNOPSIS IAEA-CN-118/58
TOPIC: STABLE ISOTOPES IN WATER
1
Carbon Cycling and Mineral Weathering in the Sava River Catchment in Slovenia
N. Ogrinca, K. Szramekb, E. Williams b, T. Kanduca, J. McIntoshb, L. M. Walterb
a J. Stefan Institute, Dept. of Environ. Sci., Ljubljana, Slovenia
bUniversity of Michigan, Dept. of Geological Sci., Ann Arbor, Michigan, USA
E-mail address of main author: [email protected]
Global environmental change has been identified as one of the most urgent issues of earth science research. Much research effort has addressed the role of the terrestrial reservoir in modulating carbon storage, and in turn, how the rapid cycling of carbon at the earth's surface over the next few hundreds of years will affect earth's surface environment. The chemical interactions among carbonate minerals (calcite and dolomite), organic carbon and the natural hydrologic cycle link the atmospheric and terrestrial carbon reservoirs on short time scales. Among the minerals comprising surface rocks and soils, only carbonate minerals appear capable of maintaining equilibrium in the face of rising atmospheric CO2 injections from fossil fuel burning. Rapid carbonate mineral weathering reactions also largely regulate the pH and ionic strength of terrestrial aquatic systems and so have ecologic and environmental impacts.
We are investigating the geochemical dynamics using major elemental, stable isotope, and hydrogeochemical parameters to better understand carbon mass transport of the Sava river drainages in Slovenia. Importantly, the Sava catchment is the largest catchment in Slovenia and at the same time one of the tributary streams of the Danube river, the second largest river in Europe. The weathering of the Danube river represents one of the largest carbon fluxes in the world. Rock weathering contributes a significant portion of HCO3
- to most rivers and thus has a strong influence on their carbon cycle. First results in the Sava River catchment indicate that the watershed exhibit typical 1:2 ratio of divalent cations to bicarbonate ion consistent with simple carbonate mineral dissolution in pure water. The Mg/Ca mole ratios are higher than 0.5 with 1 mol Ca for 0.5 mol Mg, the ratio predicted for equilibration in systems where calcite and dolomite dissolution proceed together. The concentration of DIC is high in the Sava River and lies well above the average concentration in European Rivers of 1.5 mM [1] and the average world river concentration of 0.9 mM [2]. The lowest DIC concentrations were observed in water collecting near the river source draining Alpine watersheds while the highest concentrations were reached in lowland tributaries. The calculated pressure of CO2 (pCO2) is close to the expected equilibrium with atmospheric CO2 at the upstream stations of both watersheds. In tributaries and downstream stations of the Sava River the situation is different and pCO2 values are well above atmospheric equilibrium pressure. The calcite saturation index is generally well above 0, implying oversaturation with respect to calcite, except for the headwaters. δ13C values of DIC of the Sava River vary between –5.6 and –11.8‰ near the border. Lower δ13C values were observed in August 2003 compared to October data in both catchments, when the stream water was extremely low, probably indicating the influence of higher DOC concentrations, which is more pronounced at the densely populated areas. There is an inverse trend between the DIC concentration and the
102

N. Ogrinc et al.
2
δ13C DIC values, which is shown in Figure 1. Waters originating from Alpine catchments are 13C-enriched, while 13C-depleted waters originate from lowland tributaries.
The initial results obtained on the Sava River systems show that there are large differences in the carbon “carrying capacity” and carbon fluxes. The controls on carbonate precipitation require more study on a spatial and temporal basis to determine how important the following factors are: focused groundwater discharge, seasonal temperature changes, acquisition of dissolved organic carbon compounds, and differences in landscape and underlying hydrogeological framework. This collaborative international study will give us a better understanding of natural processes and anthropogenic impact in relationship to global and local environmental and climate change.
Acknowledgements
This research was conducted in the framework of the programme activity P-0143 and of the project L2-6458-792 funded by the Ministry of Education, Science and Sport of the Republic of Slovenia. Part of the project was financially supported by IAEA under Contract No. 12642 and National Science Foundation, USA. The authors are grateful to the staff of the Environmental Agency of Slovenia for their help.
0 2 4 6 8 10 12
-16
-14
-12
-10
-8
-6
-4
-2
0
δ13C
DIC
(‰)
HCO3
- (meq/L)
Sava R, Aug 2003 Sava R, Oct 2003
Lowland
Alpine
Source
FIG. 1. Scatter diagram of δ13C values of DIC versus HCO3- concentration. Fields for Alpine and
Lowland tributaries are shown.
[1] KEMPE, S., PETTINE, M., CAUWET, G., Biogeochemistry of European rivers (KEMPE, S., DEGENS, E.T., RICHEY, J.E., Eds) Biogeochemistry of Major World Rivers, John Wiley & Sons, New York, SCOPE/UNEP 42 (1991) 169-211.
[2] LIVINGSTONE, D.A., Chemical composition of rivers and lakes, U.S. Geol. Survey Prof. Paper (1963) 44-G.
103

EXTENDED SYNOPSIS IAEA-CN-118/59
TOPIC: THE ATMOSPHERE
1
210Pb, 210Po and 7Be in Oceanic Air from the North Pole to the Antarctic
E. Holma,b,c, M. Leisvika
a Department of Medical Radiation Physics, Lund University, Sweden
bRisoe National Laboratory, Roskilde, Denmark
c UNIS, Longyearbyen, Svalbard, Norway
E-mail address of main author: [email protected]
During the Swedish expedition SWEDARP, 1988-89 air filter samples were collected by a Andersen sampler with membrane filter from Sweden to the Antarctic. In as similar way air filters were colleted at the SWEDARCTIC expedition 1991, from Sweden to the North Pole. During this expedition the sampler was calibrated for 7Be (T1/2 = 76.9 d) against a FOA sampler with Microsorban filters. The samples were analysed for 7Be by gamma spectrometry and for 210Po (T1/2 = 163 d) by alpha spectrometry after radio chemical separation. 210Pb (T1/2 = 21 a) was determined by studying the build-up of 210Po from 210Pb. The advantage of using a ship as sampling platform is that resuspension from soil of previously deposited radionuclides is avoided.
7Be is produced by spallation of nitrogen and oxygen in the stratosphere by energetic cosmic rays. Due to the relatively short physical half- life of 7Be and the relatively long residence time in the stratosphere, most of the 7Be does not reach the troposphere except during spring, when there is an exchange between the stratosphere and troposphere at 45oN an S. Since 7Be is of cosmogenic origin, its flux to the earth has a latitudinal dependence. Our data show maximal concentrations between 45oN and 45oS, (2600–5100 µBq m-3), and minima in the Arctic and Antarctic regions, 300–1100 µBq m-3 and 500–1400 µBq m-3 respectively. There are no distinct maxima at 45oN or S, which is explained by that our samples were not collected during springtime but early to late summer. The data show the strong convection of air close to the Equator bringing 7Be to surface-level from the upper troposphere or even stratosphere.
210Pb and 210Po being the daughter products of 222Rn depend on the sources of aerosols from the continents. The activity ratio 210Po/210Pb reflects the residence time in the troposphere. Our data (Fig. 1.) show maximal concentrations in the equatorial regions, 60–150 µBq m-3 for 210Po and 350–600 µBq m-3 for 210Pb. The corresponding values for 210Po in the polar regions, Arctic and Antarctic, are, 5–80 µBq m-3 and 3–15 µBq m-3 respectively and for 210Pb, 6–100 and 4–45 µBq m-3. The activity ratio, 210Po/210Pb, between 45oN and S are about 0.2–0.3 while they are as high as 0.7–1.1 in the Arctic and Antarctic regions (Fig. 2.). This shows that only small particles with long residence time reach the polar regions. This long residence time in the polar regions is due to low precipitation and low particle load. 210Pb shows a higher deposition velocity than 210Po and the data can be used for general information on the residence time and sources of arctic haze.
104

E. Holm and M. Leisvik
2
210-Pb
-90
-45
0
45
90
0 200 400 600 800 1000
A c t i v i t y c o n c . [ µ B q / m 3 ]
Montevideo
N
FIG. 1. 210Pb concentration (µBq m-3) in Atlantic surface air as a function of latitude.
210Po/210Pb
-90
-45
0
45
90
0,0000 0,4000 0,8000 1,2000 1,6000 2,0000
Montevideo
FIG. 2. The activity ratio 210Po/210Pb in Atlantic surface air as a function of latitude.
105

EXTENDED SYNOPSIS IAEA-CN-118/60
TOPIC: THE ATMOSPHERE
1
Observations of Airborne Lead-210 and Beryllium-7 during the Arctic Ocean 2001 Expedition
J. Paateroa, J. Hatakkaa, C. Leckb, V. Aaltonena, Y. Viisanena
a Finnish Meteorological Institute, Sahaajankatu 20E, FIN-00880 Helsinki, Finland
bDepartment of Meteorology, Stockholm University, S-106 91 Stockholm, Sweden
E-mail address of main author: [email protected]
Swedish Polar Research Secretariat arranged a multidisciplinary scientific expedition to the Arctic Ocean in 2001 with the Swedish icebreaker Oden. The aim of the atmospheric research programme was to study the chemical, biological, physical and meteorological processes that control the formation of nanometre-size aerosol particles and their influence on climate change especially in the Arctic region [1]. As a part of this programme airborne 222Rn, 210Pb and 7Be and external radiation were measured for two purposes. These natural radionuclides can be used as tracers for air mass origin, and ionising radiation has been suggested to be the reason for the formation of aerosol particles in the air [2]. The preliminary observations of airborne 210Pb and 7Be are reported in the following.
The expedition started from Gothenburg, Sweden, on 26 June 2001 and ended at Svalbard on 29 August. The expedition sailed first to Svalbard area, then NE to the Lomonosov ridge, the Makarov basin and to the North Pole. Most of the atmospheric programme was conducted during the ice drift experiment at the 88th latitude, while the icebreaker was moored to an ice floe and drifted for three weeks in August 2001. Aerosol samples were collected onto glass-fibre or quartz- fibre filters. After the return of the expedition the samples were assayed for 7Be with semiconductor gamma spectrometry. Owing to the long delay between the sampling and the measurement most of the 7Be had already decayed, thus in most cases only an estimate of the 7Be concentration could be obtained. The 210Pb contents of the samples were measured six months later by counting the alpha particles of the in-grown daughter nuclide 210Po [3]. The detection limit for 210Pb is about 10 µBq/m3. According to air mass trajectories the 210Pb activity concentrations above the detection limit during the ice drift were encountered with air masses coming from continental regions. The highest 7Be activity concentration was also observed in a similar meteorological situation, in agreement with an earlier study in northern Finland [4].
[1] LECK, C., TJERNSTRÖM, M., MATRAI, P., SWIETLICKI, E., BIGG, E.K., Can Marine Micro-organisms Influence Melting of the Arctic Pack Ice? Eos 85 (2004) 25-36.
[2] YU, F., TURCO, R.P., Ultrafine aerosol formation via ion-mediated nucleation, Geophys. Res. Lett. 27 (2000) 883-886.
[3] MATTSSON, R., PAATERO, J., HATAKKA, J., Automatic Alpha/Beta Analyser for Air Filter Samples - Absolute Determination of Radon Progeny by Pseudo-coincidence Techniques, Rad. Prot. Dosimetry 63 (1996) 133-139.
106

J. Paatero et al.
2
[4] PAATERO, J., HATAKKA, J., Source Areas of Airborne 7Be and 210Pb Measured in Northern Finland, Health Phys. 79 (2000) 691-696.
TABLE I. SAMPLING DATA AND RESULTS (n.d. = not detected).
Start of samplingLatitude longitude End of samplingLatitude longitudeDate Time (UTC)degreesminutesdegreesminutesE/WDate Time degreesminutesdegreesminutesE/WBe-7 Pb-21030/06 9.22 58 7 6 23 E 01/07 9.10 62 13 4 59 E 2000 5401/07 9.28 62 16 5 3 E 02/07 9.04 66 46 10 34 E ~200 n.d.02/07 9.20 66 49 10 38 E 03/07 8.54 71 30 18 10 E ~200 n.d.03/07 9.06 71 32 18 14 E 05/07 11.43 77 52 29 45 E 1100 3205/07 12.02 77 52 29 44 E 05/07 23.30 77 54 29 42 E ~300 n.d.05/07 23.50 77 54 29 42 E 07/07 8.58 78 37 33 11 E 480 n.d.07/07 9.11 78 37 33 11 E 08/07 8.54 79 19 32 6 E 1000 n.d.08/07 9.12 79 22 32 1 E 09/07 5.51 82 3 25 58 E ~10 n.d.09/07 6.06 82 3 25 58 E 10/07 15.55 82 0 25 58 E 560 3211/07 6.18 81 20 24 22 E 12/07 11.31 81 12 25 20 E ~100 n.d.15/07 13.58 79 9 8 0 E 16/07 13.59 80 33 13 19 E ~300 2017/07 13.52 81 40 26 54 E 19/07 10.30 84 53 36 46 E ~1000 1220/07 19.30 86 34 50 19 E 22/07 12.52 88 23 90 26 E ~100 2322/07 12.59 88 24 91 1 E 23/07 12.58 88 20 127 0 E 370 2723/07 13.07 88 20 127 0 E 24/07 14.09 87 42 134 36 E 220 n.d.24/07 14.20 87 42 134 36 E 26/07 21.55 87 55 154 15 E 330 n.d.26/07 22.03 87 55 154 16 E 27/07 22.37 87 52 154 44 E ~300 n.d.27/07 22.47 87 52 154 44 E 29/07 19.37 88 28 152 21 E 400 n.d.29/07 19.44 88 28 152 22 E 31/07 14.12 89 59 139 10 W ~300 1731/07 14.23 89 59 139 9 W 02/08 13.10 88 56 1 48 W ~200 1702/08 13.25 88 56 1 51 W 03/08 18.50 88 46 4 35 W ~500 n.d.03/08 19.50 88 46 4 37 W 05/08 8.34 88 45 1 41 W ~100 n.d.05/08 8.47 88 45 1 41 W 06/08 17.22 88 40 0 19 E ~300 2206/08 17.36 88 40 0 20 E 07/08 19.12 88 37 3 16 E ~500 1907/08 19.20 88 37 3 17 E 08/08 18.55 88 33 4 18 E ~100 n.d.08/08 19.07 88 33 4 18 E 09/08 19.30 88 35 3 51 E ~200 n.d.09/08 19.40 88 35 3 51 E 10/08 18.50 88 35 2 38 E ~200 n.d.10/08 18.58 88 35 2 37 E 12/08 12.53 88 29 0 30 W 1800 2912/08 13.02 88 29 0 30 W 13/08 17.25 88 24 1 45 W ~200 n.d.13/08 17.36 88 24 1 46 W 15/08 12.40 88 21 2 14 W ~100 n.d.15/08 13.48 88 21 2 14 W 16/08 17.05 88 16 5 32 W ~200 n.d.16/08 17.17 88 16 5 33 W 17/08 17.16 88 15 7 26 W ~200 3017/08 17.27 88 15 7 27 W 18/08 18.45 88 14 8 13 W ~400 n.d.18/08 18.58 88 14 8 13 W 19/08 20.05 88 9 7 51 W ~100 n.d.19/08 20.17 88 9 7 52 W 20/08 19.45 88 10 8 30 W ~1000 n.d.20/08 20.00 88 10 8 31 W 21/08 16.58 87 49 2 59 W ~300 n.d.21/08 17.08 87 48 2 57 W 22/08 16.43 86 3 11 1 E ~300 n.d.22/08 16.51 86 3 11 17 E 23/08 17.45 85 33 15 20 E ~200 2623/08 17.54 85 33 15 29 E 24/08 16.58 83 37 15 29 E ~600 n.d.24/08 17.11 83 36 15 25 E 25/08 20.47 81 46 15 32 E ~200 n.d.
107

EXTENDED SYNOPSIS IAEA-CN-118/61
TOPIC: THE ATMOSPHERE
1
FORSGC Network for Isotopes in Precipitation over the Monsoon Asia
K. Ichiyanagia, K. Yoshimurab, M. D. Yamanakaa,c
a Frontier Observational Research System for Global Change (FORSGC), Japan Agency for Marine-Earth Science and Technology (JAMSTEC), Yokohama, Japan
bInstitute for Industrial Sciences, The University of Tokyo, Tokyo, Japan
c Graduate School of Science and Technology, Kobe University, Kobe, Japan
E-mail address of main author: [email protected]
The GNIP project provides the monthly data of stable isotopes in precipitation all over the world. For the validation of atmospheric water cycle by reanalysis datasets or GCM simulations, however, there are a few stations in Asia. Also, spatial and temporal variability of the stable isotope composition of precipitation in the Asia Pacific region was discussed based on the GNIP monthly dataset. However, the relationship between isotope signature of precipitation and climate in Tropics is not well understood, because the daily isotopic data in precipitation is limited.
Since 2000, the isotope group of the Frontier Observational Research System for Global Change (FORSGC) had been collecting the daily precipitation samples for stable isotopes over the Monsoon Asia, such as Siberia (3 stations), Tibetan Plateau (10 stations), Nepal (5 stations), Thailand (3 stations), Indonesia (5 stations), and Palau Island (1 station). In this study, we will introduce the FORSGC network for stable isotopes in precipitation database and show the short-term (monthly and daily) variability of precipitation isotopes observed in Thailand and Indonesia and so on.
The daily rainfall samples were collected during August to December 2001 at ChiangMai, Bangkok and Phuket stations in Thailand. These stations showed similar monthly variability in Oxygen-18, and most ranged from -15 permil to 0 permil. There were increasing trends in August and November, while decreasing trend in September. Daily variability, however, showed a different trend. A depletion of early-August at ChiangMai and a sudden enrichment around 10 October at Phuket were appeared. Considering relationships between Oxygen-18 and precipitation amount, there were positive correlations in three stations by the monthly basis. In general, isotopic compositions are heavy in low precipitation and light in high precipitation caused by the amount effect. The precipitation was small from August to early September and large from late September to early November. There was some correlations between d 18O and precipitation if daily precipitation was less than 30mm, however, there was not significant if that was more than 30mm.
Also, the daily rainfall samples were collected during April to December in 2001 at Bukittinggi and Jambi stations which located western and eastern part of Sumatra Island, Indonesia. Most Oxygen-18 ranged from -15 permil to 0 permil in both stations. Only Jambi station showed seasonal variability trend, that is, enrichment and depletion trends from April
108

K. Ichiyanagi et al.
2
to August and from August to October, respectively. From November to December, there was depletion trend in both stations. The d-excess was ranged 10 to 15 permil in Bukittinggi, whereas sometimes ranged below 5 in Jumbi. This fact indicates the origin of rain water was much different between these two places. The daily rainfall variability was much different between them.
Furthermore, the time series in d 18O and the origin of rain water was simulated using Isotope Circulation Model (ICM). The temporal and spatial resolution is daily time-scale and 2.5 degrees in latitude and longitude, respectively. Notice that this model devises to integrate all vertical atmospheric- and isotopic-physics in each grid. When water transit its phase among solid, liquid and gas, the evaluation of the isotopic composition is described by the Rayleigh distillation process. The atmospheric water budgets were calculated by using the variables from NCEP/NCAR renalysis. From the preliminary result of the ICM simulation, the time series of d 18O in two places were almost same pattern during May to December in 2001. However, the origin of rain water was much difference between these two places. Most of rain water in Bukittinggi was originated from the Indian Ocean through whole year. From a half to two third of rain water in Jumbi was originated from the Indian Ocean, and the remain was from Java Island and Java Sea. The mixing ratio of different original water was changed weekly or smaller time-scale. This results coincides with the observed d-excess variations.
109

EXTENDED SYNOPSIS IAEA-CN-118/62
TOPIC: THE ATMOSPHERE
1
Deposition Rates of Radionuclides in Monaco in 2002 and 2003
M. K. Pham, J. Gastaud, S.-H. Lee, P. P. Povinec
Marine Environment Laboratory, International Atomic Energy Agency, MC 98000 Monaco
E-mail address of main author: [email protected]
IAEA-MEL has been carrying out monitoring of radionuclides in the Monaco air over many years. Some radionuclides of natural (cosmogenic, radiogenic and primordial), as well as of anthropogenic origin have been analysed monthly (or daily in the case of an accident) [1-3]. We report here concentrations of selected radionuclides in Monaco precipitation during 2002 and 2003 (Fig. 1 and Fig. 2). Radionuclide concentrations in two phases (dissolved and particulate) were studied in 2003. As expected, the percentage of 239+240Pu concentration in the particulate phase (46-91%) have been higher than that of 137Cs (23-57%) due to its higher particle affinity.
Higher concentrations and deposition rates of 137Cs, 210Pb, 239+240Pu, 241Am, as well as of 7Be in rain have appeared in November 2002 (Fig. 1, left). This is due to special meteorological conditions - a Saharan dust deposition resulting from atmospheric transport of particles from North Africa to Monaco during cyclones (2200 and 110 mBq m-2 year-1 for Cs and Pu, respectively). This phenomena is less evident in 2003 (740 and 14.3 mBq m-2 year-1 for Cs and Pu, respectively) when a smaller cyclone with dust transport from Sahara was observed (Fig.1, on the right). Higher annual deposition fluxes of Cs and Pu were observed in this study in comparison with previous observations [1], confirming the importance of the Saharan dust deposition. Saharan dust events in the western Mediterranean have been recognized as important pathways for particle deliveries into surface seawater [4]. Radionuclide and elemental composition studies of dust particles were carried out for better understanding of temporal variations of radionuclides in the atmosphere and their transport into the northwest Mediterranean Sea [5].
FIG.1. Monthly deposition rates (dry and wet deposition) of 137Cs, 239+240Pu and 241Am in Monaco in 2002 (left) and 2003 (right).
1
10
100
1000
10000
0 1 2 3 4 5 6 7 8 9 10 11 12 13
Month in 2002
Mon
thly
pre
cipi
tatio
n ra
tes
(mm
)
-10
0
10
20
30
40
50
60
Mon
thly
dep
ositi
on ra
tes
of ra
dion
uclid
es
Rainfall (mm) Cs-7 (20xmBq/m2/month)
Pu-239+240 (mBq/m2/month) Am-241 (mBq/m2/month)
1
10
100
1000
0 1 2 3 4 5 6 7 8 9 10 11 12 13
Month in 2003
Mon
thly
pre
cipi
tatio
n ra
tes
(mm
)
-0.5
0.0
0.5
1.0
1.5
2.0
2.5
3.0
3.5
4.0
Mon
thly
dep
ositi
on r
ates
of
radi
onuc
lides
Rainfall (mm) Cs-137 (40xmBq/m2/month)
Pu-239+240 (mBq/m2/month) Am-241 (mBq/m2/month)
110

M.K. Pham et al.
2
Monthly deposition rates of 7Be and 210Pb vary throughout the year in a similar way as a precipitation rate (Fig.2). The temporal variations of both radionuclides are similar, although they have different origins (7Be is of cosmogenic and 210Pb is of radiogenic origin).
FIG. 2. Monthly deposition rates (dry and wet deposition) of 7Be and 210Pb in Monaco in 2002 (left) and 2003 (right).
[1] THEINS, M., BALLESTRA, S., YAMATO, A., FUKAI, R., Delivery of transuranic elements by rain to the Mediterranean Sea, Geochim. Cosmochim. Acta 44 (1980) 1091-1098.
[2] LEE, S-H., PHAM, M.K., POVINEC, P.P., Radionuclide variations in the air over Monaco. J. Radioanal. Nucl. Chem. 254 3 (2002) 445-453.
[3] PHAM, M.K., POVINEC, P.P., LEE, S-H., OREGIONI, B., Atmospheric transport of particles from North Africa to Monaco, Bulletin du Bureau National de Metrologie 2003-2 123 (2003) 143-149.
[4] LEE, S-H., LA ROSA, J.J., LEVY-PALOMO, I., OREGIONI, B., PHAM, M.K., POVINEC, P.P., WYSE, E., Recent inputs and bugets of 90Sr, 137Cs, 239+240Pu and 241Am in the northwest Mediterranean Sea, Deep-Sea Res. II 50 (2003) 2817-2834.
[5] PHAM, M.K., LA ROSA, J.J., LEE, S-H., OREGIONI, B., POVINEC, P.P., Deposition of Saharan Dust in Monaco Rain 2001-2002: Radionuclides and Elemental Composition Physica Scripta (submitted).
1
10
100
1000
0 1 2 3 4 5 6 7 8 9 10 11 12 13
Month in 2003
Mo
nth
ly p
reci
pita
tion
rat
es (
mm
)
- 5
0
5
1 0
1 5
2 0
2 5
3 0
3 5
Mo
nth
ly d
epo
siti
on
rat
es o
f ra
dio
nu
clid
es
(Bq.
m-2
.mo
nth
-1)
Rainfall (mm) Be-7 (Bq/m2/month) Pb-210 (Bq/m2/month)
1
10
100
1000
0 1 2 3 4 5 6 7 8 9 10 11 12 13
Month in 2002
Mon
thly
pre
cipi
tatio
n ra
tes
(mm
)
0
20
40
60
80
100
120
140
160
180
Mon
thly
dep
ositi
on r
ates
of r
adio
nucl
ides
(mB
q.m
-2m
onth
-1)
Rainfall (mm) Be-7 (Bq/m2/month) Pb-210 (Bq/m2/month)
111

EXTENDED SYNOPSIS IAEA-CN-118/63
TOPIC: THE ATMOSPHERE
1
Temporal and Seasonal Variations of Stable Isotopes (δ2H and δ18O) and Tritium in Precipitation over Portugal
P. M. Carreira, P. Valério, D. Nunes, M. F. Araújo
Instituto Tecnológico e Nuclear (ITN), Environmental Analytical Chemistry Group, Sacavém, Portugal
E-mail address of main author: [email protected]
The Portuguese Network for Isotopes in Precipitation was initiated in 1988 by INETI (now ITN) in collaboration with the I.A.E.A. and the Portuguese Meteorological Institute (I.M.). The network is composed by seven meteorological stations located in different regions of mainland Portugal, considered as representative of the precipitation over this country (monthly bases). Since 1988 up to 2004 precipitation samples have been collected monthly in these stations and the isotopic composition (deuterium, oxygen-18 and tritium) has been determined at the Chemistry Department of the ITN. Relevant meteorological and isotopic data obtained for the period from 1988 to 2003 is available and part of it has been submitted to the I.A.E.A. to incorporate GNIP database.
From the climatic point of view, mainland Portugal is under north circulation regime and the water vapour moisture is mostly representing the Atlantic influence, being the autumn and winter the seasons with the highest precipitation amount. In the National Network for Isotopes in Precipitation two groups of meteorological stations with different characteristics can be defined. Five of them: Vila Real, Braganca, Penhas Douradas, Portalegre and Beja are located in the interior of the country and can be classified as continental stations; while Porto and Faro stations are located in the Atlantic coastline. The meteorological stations are located at different altitudes ranging from 9 m near the coastline, up to 1380 m in the interior. This geographic situation leads to different climatic features that induce diverse isotopic compositions either in stable or in radioactive isotopic contents.
The stable isotopic composition of precipitation is correlated with various environmental parameters, which characterize the sampling point (e.g. the altitude above sea level, distance to the coast, air temperature, rain amount) [1, 2]. The distribution of δ18O and δ2H in precipitation mimics the topography of the regions, presenting depleted values at high altitudes, lower temperatures and with the increasing distance from the coast. In the Portuguese Network for Isotopes in Precipitation, part of this isotopic evolution observed in the precipitation water samples allows the identification of a gradual depletion of the Atlantic air masses from the coast through inland. This evolution is represented by the δ2H and δ18O values, which vary, respectively from –26.9o/oo and –4.54o/oo at Porto coastal station to –50.0o/oo and –7.73o/oo at Bragança inland station. Seasonal variations in the stable isotopic composition of the precipitation water samples were also identified, characterized by the relation between the isotopic content, the mean monthly temperature and the precipitation amount. These relations are described by the following equations:
112

P. Carreira et al.
2
δ18O = (-0.21 ± 0.02) T + (-8.59 ± 1.07) r2=0.74 δ2H = (-1.23 ± 0.16) T + (-51.56 ± 7.91) r2=0.65 and δ18O = (-0.01 ± 0.003) Pp + (-4.46 ± 1.36) r2=0.50 δ2H = (-0.08 ± 0.02) Pp + (-27.28 ± 9.34) r2=0.45
The isotopic gradient with the altitude is often used in Hydrological studies to estimate the recharge areas of the aquifers. In the studied meteorological stations the obtained gradients are ?δ2H = -1o/oo / 100 m and ?δ18O = -0.2o/oo / 100 m. A positive correlation was found between the altitude and the deuterium excess. Penhas Douradas station located at 1380 m presents the higher deuterium excess values observed in the network stations. The deuterium excess distribution within the hydrological year presents a similar pattern in all stations, which points out to the same origin of the air masses (Atlantic moisture), and to an identical isotopic evolution. However, an exception to this pattern is observed in Faro, possibly originated by a mixture of different air masses, since this station is situated at a coastal area at the southern Portugal. This was revealed by a shift in the δ2H and δ18O values and consequently also in the deuterium excess values along the year (long term mean). This differentiation is probably due to a mixture of Atlantic air masses with, the Mediterranean air moisture (which presents δ2H and δ18O enriched values and higher deuterium excess at low altitude).
The regional meteoric water line (RMWL) for mainland Portugal was drawn up using weighted monthly averages of δ2H and δ18O values: δ2H = (6.78 ± 0.10) δ18O + (4.45 ± 4.64), n= 405 and r= 0.95.
The tritium content determinations carried out in the monthly precipitation samples collected in the National Network for Isotopes in Precipitation, illustrate the seasonal variations: highest concentrations during June and July and the lowest values during autumn and winter time. This trend can be related to the so-called “spring leak effect” – caused by the temporary mixing between the stratosphere and troposphere at high latitudes in early spring [3].
Also, a similar issue to the “continental effect” for stable isotopes (δ18O and δ2H) was found comparing the 3H content of precipitation at different stations. The higher concentrations were found in the inland stations while the low 3H contents were determined near the ocean, due to the tritium dilution by the oceanic masses. This dilution effect is evident in the arithmetic means of the weight annual mean from each station: [3H]Porto = 4.5 TU; [3H]Penhas Douradas = 5.1 TU and [3H]Portalegre = 5.3 TU.
[1] ROZANSKI, K., SONNTAG, C., MUNNICH, K.O., Factors controlling stable isotope composition of European precipitation, Tellus (1982), 34, 142-150.
[2] ROZANSKI, K., ARAGUÁS-ARAGUÁS, L., GONFIANTINI, R., Isotopic patterns in modern global precipitation, Geophysical Monograph 78, Climate Change in Continental Isotopic Records, American Geophysical Union (1993), 1-36.
[3] GAT, J.R., MOOK, W.G., MEIJER, H.A.J., "Atmospheric water", Environmental isotopes in the hydrological cycle: Principles and applications, UNESCO, IHP-V/Technical Documents in Hydrology 39 II, 113 pp.
113

EXTENDED SYNOPSIS IAEA-CN-118/64
TOPIC: THE ATMOSPHERE
1
Explanation of Temporal Changes of Isotopic Composition in Precipitation in Hungary by Meteorological Data and Satellite Images
L. Palcsua, E. Svingora, Z. Szántóa, I. Futóa, M. Molnára, L. Rinyua, R. Rozinaia, Z. Dezsob
Institute of Nuclear Research of the Hungarian Academy of Sciences, Laboratory of Environmental Studies, Debrecen, Hungary
University of Debrecen, Department of Environmental Physics, Debrecen, Hungary
E-mail address of main author: [email protected]
The aim of this work is to get a time series of the tritium content and delta values of oxygen and deuterium of precipitation characteristic for Hungary and to identify those factors, which have essential influence on the temporal changes. There are three main moisture sources, which determine the weather and the raining above Hungary. One of them is the Atlantic Moisture Source, which comes from the West bringing moisture from the mid-latitude Atlantic water vapour. The second main source of water is the Baltic Mositure Source. It brings moisture from the Arctic region over the Baltic Sea. The third source is the Mediterranean Moisture Source, which carries water from the South-West.
0
5
10
15
20
25
01/01/2001 01/01/2002 01/01/2003 01/01/2004
Tri
tiu
m in
pre
cip
itat
ion
(TU
)
RainSnow
FIG. 1. Fast changes of tritium concentration in precipitation water (rain and snow) in East Hungary during the last three years
114

L. Palcsu et al.
2
The rainfall events are continuously sampled in Debrecen, East-Hungary from December 2000. Tritium, deuterium, and oxygen-18 content of the precipitation samples are measured. We have found that the tritium content of the precipitation changed between 4.8 and 18.0 TU in 2001, between 4.4 and 20.3 TU in 2002, and between 3.5 and 19.8 TU in 2003 (see Fig. 1.), with an average of 10.4 ± 0.3 TU, 10.7 ± 0.3 TU and 8.7± 0.3 TU, respectively. The decreasing in the average tritium concentration of precipitation in 2003 was due to the very wet winter, while the year 2001 and 2002 were quite similar from the point of view of raining.
On the basis of satellite images ( EUMETSAT 2001-2004) and meteorological data we determine trajectories in order to decide which moisture source brings the water vapour. On the one hand the isotopic composition of precipitation depends on the moisture source, which provides the rainfall. On the other hand, the seasonal, continental and latitude effects have to be taken into account to explain the temporal changes. Sharp peaks (see Fig. 1.) in the tritium concentration of rain appear in early summer (“spring leak”) as a consequence of the exchange between the troposphere and the stratosphere. We would like to understand better how this exchange mechanism works.
115

EXTENDED SYNOPSIS IAEA-CN-118/65
TOPIC: THE ATMOSPHERE
1
Cosmogenic 22Na and 7Be in Ground Level Air in Kraków (Poland)
S. Grabowska, J. W. Mietelski
The Henryk Niewodniczanski Institute of Nuclear Physics Polish Academy of Sciences, Kraków, Poland
E-mail address of main author: [email protected]
The cosmogenic radionuclides are produced in whole atmosphere, although the most intense processes goes in the stratosphere. One of such radionuclide is 22Na, which decays by beta plus decay with half- life-time of 2.6 year, end emits gamma radiation of 1275 keV. Another one is 7Be, which is also gamma-emitter (478 keV) and which half- life time is 54 days. Sooner or later all not gaseous matter attaches to the aerosols. From stratosphere cosmogenic radionuclides migrate to ground level air by means of different processes like diffusion, sedimentation, convection. Usually on ground level air the activity of 22Na is on the level of a fraction of single µBq/m3 may be studied by filtration of high volumes of the air and application of low-level gamma spectrometry. 7Be is much more active, on the level of few mBq/m3.
The Petryanov air filters from two ASS-500 aerosol sampling stations in weekly achieved sets exposed in Krakow during 2003 are analyzed for the presence of all gamma-emitters using a gamma-rays spectrometer with HPGe detector shielded with complex active and passive shields. Each sample contains aerosols from more than 0.1 Mm3 of air.
During our previous study which covered years 1996-2002 (for half a year sets of filters) the cosmogenic 22Na shows a strong seasonal variation with significant different mean values activity concentration between 0.333±0.095 µBq m-3 and 0.137±0.045 µBq m-3, for summer and winter, respectively [1]. Moreover, the activity ratio for two cosmogenic radionuclides: 22Na and 7Be showed also changes with statistically significant seasonal differences. The lower values were found during winters. The conclusion was that transport of 22Na from stratosphere to ground level air during summer seems to be so much effective, that result in kind of relative depletion of stratosphere of this nuclide. The aim of present investigation is to see the changes of 22Na activity and of 22Na to 7Be activity ratio in more detailed way within a year period.
The measurements are not finished yet. However, obtained till now preliminary results for one week sets from 2003 for both: 22Na activity (Fig. 1 ) and 22Na to 7Be activity ratio (Fig. 2) seems to confirm observations did for a half of a year sets of filters. The final results are expected to be presented during the Conference.
116

S. Grabowska and J. Mietelski
2
FIG. 1. The activity of 22Na in ground level air in Kraków (southern Poland) during 2003. The “summer” or “winter” covers periods of time as during previous work [1] with half of a year sets of filters. Temporary results for ¾ of year.
FIG. 2. The activity ratio of 22Na to 7Be in ground level air in Kraków (southern Poland) during 2003. The “summer” or “winter” covers periods of time as during previous work [1] with half of a year sets of filters. Temporary results for ¾ of year.
[1] GRABOWSKA, S., MIETELSKI, J.W., KOZAK, K., GACA, P., Gamma emitters on micro-becquerel activity level in air at Kraków (Poland), J. Atmos. Chem. 46 (2003) 103-116.
0 10 20 30 40 50 600.00
0.25
0.50
0.75
number of week
summerwinter
A [
µB
q/m
3 ]
0 10 20 30 40 50 600.0000
0.0001
0.0002
summer
winter
number of week
activ
ity r
atio
:22N
a/7 B
e
117

EXTENDED SYNOPSIS IAEA-CN-118/66
TOPIC: HYDROLOGY
1
Advances in Isotope Hydrology at the IAEA
P. Aggarwal
Isotope Hydrology Section, International Atomic Energy Agency, Vienna, Austria
E-mail address of main author: [email protected]
More than one billion people do not have access to clean water. Three years after world leaders pledge in the UN Millennium Declaration to reduce this number in half by 2015, increasing access to safe water remains a great challenge. In our quest to increase water availability, it is likely in many cases that water resources are used before fully understanding their hydrology. Such “solutions” sometimes result in creating greater problems, such as in Bangladesh where the use of groundwater reduced the incidence of water-borne disease, but has led to a more difficult issue of arsenic poisoning. The fact that water on earth moves in a cycle has been known since ancient civilizations existed on different parts of the earth. However, appropriate water assessments at regional and national scale require quantitative understandings of space and time distribution of water and fluxes in different parts of the cycle. Isotope techniques have provided unmatched insights into the functioning of the water cycle. New areas of research at the IAEA include identification and assessment of moisture sources in precipitation, interactions between the water and carbon cycles, fossil groundwater assessment, and submarine groundwater discharge. This presentation will review recent advances in these fields.
118

EXTENDED SYNOPSIS IAEA-CN-118/67
TOPIC: HYDROLOGY
1
Opportunities and Challenges in Research on Ground-Water Modeling
F. W. Schwartz
Department of Geological Sciences, The Ohio State University, Columbus OH 43210, U. S. A.
E-mail address of main author: [email protected]
Since the inception of computer-based, ground-water modeling almost 40 years ago, there have tremendous scientific and technological advances. Virtually all problems of significance to the practice of ground water (contaminant transport, regional ground-water flow, and well-field development) have been solved. On the research side, new codes are pushing the frontiers to complex multiphase problems, coupled phenomena, and stochastic processes. Nevertheless, our recent bibliometric studies of papers in Water Resources Research suggest that many research strands are simply worn out. Researchers often remain content to tinker with twenty-year old codes, embellishing them with odd new subroutines, or new user interfaces. Others continue to be satisfied with incremental advancements in historically important strands of research related to modeling. Perhaps the greatest challenge facing the community of ground-water modelers is finding relevance in a scientific world that has changed and in many respects has left them behind. The realities are that modeling now is needed more than ever to help solve the most vexing of societal problems, for example the impact of global climate change on water resources systems. The opportunities open to those willing to work in this arena are as enormous as the new challenges stemming from needs to integration new tools (satellites, information technology) and new unconventional research teams (economists, social scientists). To an unprecedented degree, governments want more out of science than just ideas and new modeling techniques. Those researchers able to adapt to this paradigm shift will help lead modeling to the next logical step of solving important global and regional problems.
119

EXTENDED SYNOPSIS IAEA-CN-118/68
TOPIC: HYDROLOGY
1
Tracing Sources of Organic Matter and Nitrate in the San Francisco Bay-Delta-River Ecosystem using Isotopic Techniques
C. Kendall, S. R. Silva, B. E. Bemis, D. H. Doctor, S. D. Wankel
U.S. Geological Survey, Menlo Park, CA, U.S.A.
E-mail address of main author: [email protected]
Hypoxic conditions in rivers, wetlands, and coastal ecosystems can cause significant problems for fish and bird migrations, the local fishing industry, and for the usefulness of the water body for drinking water and recreational purposes. While it is usually obvious that the problem is excess nutrients, it is usually less obvious exactly what should be done to remediate the problem. This is because there are usually many different land uses that contribute nitrate and organic matter to the ecosystem, and it is often difficult to determine the dominant source of the nutrients and organic matter causing local problems -- such as low dissolved oxygen levels or the production of disinfection byproduct during water treatment -- with standard chemical and hydrologic mass balance methods. Isotopes often provide new insights into sources, and are a useful adjunct to conventional methods.
Therefore, we have analyzed the isotopic compositions of dissolved and particulate organic matter (DOM, POM), nitrate, and water samples from selected sites in the San Franc isco Bay-Delta-River ecosystem since 2000. Organic matter and/or nitrate samples were collected at various times in 2000-2003 from ~20 sites on or near the San Joaquin River (SJR) and ~10 sites in the Delta. POM samples from Delta and SJR sites had similar ranges of d15N and d13C values. Main-stem SJR sites have nitrate-d15N ranging from +9 to +14‰ (avg. +11‰) whereas samples from drains, creeks, and tributaries that drain into the SJR range from 0 to +12‰ (avg. +6‰). POM samples from main-stem SJR sites have d15N values ~ 4‰ lower than the co-existing nitrate. Depending on season, the nitrate-d15N may increase or decrease up to 3‰ downstream, due to changing mixtures of sources, while nitrate-d18O almost always decreases downstream as the proportion of water in the SJR derived from the Sierra Mountains (which has water-d18O values of ~ -15‰) increases. C:N values of POM at main-stem SJR sites were usually <8, whereas C:N values from drains and creeks were usually >15.
The main conclusions from our preliminary investigations are: (1) POM at main SJR sites is mainly algal in origin except during major storms, whereas POM from the creeks and drains contains appreciable terrestrial detritus, (2) most of the algae in the SJR appears to be produced in situ, (3) groundwater is a significant source of nitrate to the river, (4) much of the nitrate in the SJR appears to be derived from animal or human waste, and (5) algae in the Bay in October 2002 (during a whole-system transect) seems to be N-limited. Interestingly, these isotope data often contradicted the conclusions from previous studies that used simple mass balance approaches to determine and quantify sources, resulting in the re-evaluation of some of the earlier interpretations. The value of isotopic techniques is that it uses the natural isotopic “labels” of different sources of organic matter and nitrate to quantify the contributions from different sources. Hence, isotope data are an extremely useful adjunct to traditional methods for assessing and monitoring sources of organics and nutrients during ecosystem restoration programs.
120

EXTENDED SYNOPSIS IAEA-CN-118/69
TOPIC: HYDROLOGY
1
Use of Tritium Time Series to Estimate Physical Parameters of Hydrologic Systems
R. L. Michel
US Geological Survey, 345 Middlefield Rd, MS 434, Menlo Park, CA 94025, U.S.A.
E-mail address of main author: [email protected]
Tritium has been used as a tracer for the physical movement of water for the last five decades. After the major increases in the tritium world inventory produced by atmospheric nuclear weapons testing, its value as a tracer was quickly recognized [1]. The tritium transient has been applied to a large variety of environmental studies in hydrology, oceanography and atmospheric circulation. Tritium data frequently yield information on physical processes which can be difficult or impossible to obtain by other methods. As the tritium transient enters its sixth decade and the tritium concentrations are declining, the interpretation of tritium measurements has become more ambiguous. The tritium/3He methodology has been developed and is of use in groundwater studies, but is of limited values for surface waters studies. One method, which is frequently overlooked, is the use of measurements made over long periods of time, either on a routine basis, or sporadically. With the use of a proper input function, the physical meaning of these data can often be unraveled.
A monthly tritium input function has been developed fo r a 2o latitude by 5o longitude grid for the continental United States for the period 1953-2001. The tritium concentrations for the grid are derived from a series of precipitation collection stations that have operated during the tritium transient [2]. For coordinates where no station was available, the data is interpolated between the nearest stations. No station operated prior to 1959 and many stations were discontinued during the 1970s and 1980s. To overcome these gaps in the data, correlations were carried out with the Ottawa, Canada station to f ill in gaps in the data for 1953 to 1987. Due to possible influences from local nuclear sources in Ottawa after 1987, correlations were carried out with the Vienna, Austria station for the period 1987-2001. Correlation coefficients relative to the Vienna station are given for each section on the grid for each month so that when more data becomes available on the IAEA website (http://isohis.IAEA.org) researchers can use it to extend the input function in time. This input function can then be used in modeling tritium time series.
An historical surface water data set has been compiled in cooperation with the IAEA consisting of surface water tritium concentrations measured since the 1940s. This data set consists of over 6000 surface tritium measurements made world-wide from prior to the beginning of atmospheric nuclear testing to 2004. There are many long-term data sets available in this group which furnish valuable data bases for understanding physical processes within the river basins. These data show the response of the surface water systems to the tritium transient over the past several decades. For many hydrologic systems, tritium concentrations in river water will be more important than concentrations in precipitation. This is frequently the case in studies involving irrigation and urban studies.
121

R. Michel
2
Figure 1 shows the response of the typical surface water system (Missouri River at Nebraska City, Iowa) to the tritium transient compared to that of the precipitation within the basin. The rise of tritium concentrations in surface waters is less than that found in precipitation, but the drop in concentrations is much slower. This is due to the residence times of the various reservoirs that contribute to the base flow of the river system. Mean residence times calculated for a series of different systems have shown variations from 1-2 years to approximately 20 years. These differences will have important implications for the response of different basins to pollution, and changes in land use and climate. The seasonal signal from release of spring melt and rains is also evident in the tritium concentrations for rivers for three to four years after the peak of the transient in 1963. These increases in concentration indicate the fraction of young water that makes up the flow during that period. As tritium concentrations in precipitation decreased this seasonal signal disappeared and cannot be used to determine the fraction of young water at the present time. These results indicate the importance of obtaining previous data for proper assessment of current data.
0
500
1000
1500
2000
2500
3000
3500
Trit
ium
Uni
ts
1950 1955 1960 1965 1970 1975 1980 1985 1990
Missouri River
precipitation
FIG. 1. Response of the Missouri River at Nebraska City Iowa to the tritium transient compared to tritium concentrations in precipitation within the basin.
[1] SUESS, H., Tritium geophysics as an international research project, Science 163 (1969) 1405-1410. [2] MICHEL, R.L., Tritium deposition in the continental United States, 1953-1983, US Geological Survey Water Resources Investigations 89-4072 (1989) 45 pp.
122

EXTENDED SYNOPSIS IAEA-CN-118/70
TOPIC: HYDROLOGY
1
Scale-dependent Isotope Tracing of the Continental Water Balance under Wet and Dry Climate Conditions
J. R. Gat
Dept. of Environmental Sciences and Energy Research, The Weizmann Institute of Science, Rehovot, Israel
E-mail address of main author: [email protected]
Under a simple and ideal Rayleigh-rainout scenario the atmospheric moisture is depleted in the heavy isotope content commensurate with the loss of moisture by precipitation during a continental passage, following more-or- less a “Meteoric Water Line” with a constant d-excess. The surface and sub-surface runoff on a basin or continental scale then obviously carries the integrated precipitation isotope signal, alas at times with a considerable time delay.
Due to the eco-hydrological interactions at the land surface part of the incoming precipitation is re-evaporated, either directly from open water bodies and canopy intercepted precipitation pools, from the topsoil layer or through the intermediary of plants as transpiration. The latter, i.e. the transpiration flux, returns the water essentially unfractionated to the atmosphere with the result that there is an apparent reduction in the degree of the Rayleigh rainout effect, which can be measured by comparison of the isotopic buildup in the atmospheric waters and of the runoff compared to the expected buildup based on the precipitation amounts. This has been exemplified for the conditions of the tropical rain forest in the Amazon [1, 2].
As is well known [3], evaporation from open water surfaces returns a fractionated flux, where the residual surface waters are enriched and the evaporated moisture depleted in the heavy isotopes of Hydrogen and Oxygen, following an “Evaporation Line” rather than the “Meteoric Water Line”. Under such circumstances the degree of recycling of the moisture due to this mechanism can be quantified by recording the change in the d-excess parameter between the precipitation and the runoff [4], on the one hand, and the downwind atmospheric waters [5], on the other hand. All these examples are taken from rather humid climates where the evaporative buildup is not the dominant balance factor and where, moreover, as the geographic scale increases the effect of the evaporative signature of the watershed processes is diluted in the continual runoff by the precipitation in excess of the infiltration capacity of the soils but is preserved in the isotope signature of the atmospheric moisture. In the more arid environment with its endorheic runoff regime more and more of the runoff is lost by evaporation as the scale of the basin increases [6], often terminating in highly saline lakes or sabkhas. In contrast to the situation described above, the evaporative signature of a decreasing d-excess is accentuated in the runoff with increasing scale of the system whereas the effect on the atmospheric moisture diminishes as a higher and higher fraction of the surface water is evaporated. The distinction between the evaporation and transpiration fluxes based on the water and isotope balances, which is a very valuable diagnostic tool under humid and semi-arid conditions, cannot then be indiscriminately applied in the more arid environment. Examples will be given.
123

J. Gat
2
[1] SALATI, E., DALL’OLLIO, A., MATSUI, E., GAT, J.R., Recycling of water in the Amazon basin – an isotopic study, Water Res. Res. 15 (1979) 1250-1258.
[2] GAT, J.R., Atmospheric water balance – the isotopic perspective, Hydrol. Proc. 14 (2000) 1357-1369.
[3] CRAIG, H., GORDON, L.I., Deuterium and oxygen-18 variations in the ocean and marine atmosphere, In: Stable Isotopes in Oceanographic Studies and Palaeo-temperatures, (Laboratoria di Geologia Nucleare, Pisa, TONGIORNI, E, Ed.) (1965).
[4] MARTINELLI, L.A., GAT, J.R., DECAMARGO, P.B., LUCIENNE, L.L., OMETTO, J.P.H.B., The Piracicaba River Basin: - Isotope Hydrology of a tropical River Basin under anthropogenic stress, Isotopes in Environ. Health Studies 40/1 (2004) 45-56.
[5] GAT, J.R., BOWSER, C., KENDALL, C., The contribution of evaporation from the Great Lakes to the continental atmosphere: estimate based on stable isotope data, Geophys. Res. Lett. 21 (1994) 557-560.
[6] GAT, J.R., The relationship between surface and subsurface waters: water quality aspects in areas of low precipitation, Hydrol. Sci. Bull. 25 (1980) 257-267.
124

EXTENDED SYNOPSIS IAEA-CN-118/71
TOPIC: HYDROLOGY
1
Isotope Tracing of Throughflow, Residency and Runoff to Lakes for Regional Assessment of Critical Acid Loadings to Aquatic Ecosystems
J. J. Gibson, K. Bennett
National Water Research Institute, University of Victoria, P.O. Box 1700, STN CSC, Victoria BC V8W 2Y2, Canada Department of Geography, University of Victoria, P.O. Box 3050, STN CSC, Victoria BC, V8W 3P5, Canada
E-mail address of main author: [email protected]
Mining, forestry and hydroelectric development are placing increasing stress on aquatic ecosystems of the Boreal Forest of Canada, particularly within the Athabasca Oil Sands Region of northeastern Alberta (near Ft. McMurray). Evaluation of the sensitivity of various aquatic ecosystems to such disturbances requires an improved understanding of the basic processes that control ecosystem health including water balance, biogeochemical interactions between lakes and their watersheds, acid sensitivity, and potential future modifications to these conditions under changing climate. One of the more pressing issues in Oil Sands development is the capacity of soils and water to buffer acidic emissions and deposition associated with mining and upgrading of bitumen. Current operations emit up to one tonne of SOX and NOx per thousand barrels of oil produced. Many new projects are improving on these emission rates, however, improvements are at considerable cost and future projections are still as much as 600 tonnes of SOX and NOx per day from operations near Ft. McMurray [1]. Sulfur and nitrogen emissions are oxidized in the atmosphere producing sulfate and nitrate anions, reducing the pH of atmospheric moisture and producing acid rain that is deposited on soils and vegetation. Positively charged cations are subsequently mobilized from the soil matrix and leach to surface waters with the deposited nitrate and sulfate reducing the buffering capacity of soils. While most of Alberta’s soils have a large cation reserve and capacity to buffer acid deposition, a significant proportion of the landscape in the Ft. McMurray area contains soils with poor buffering capacity, which is expected to enhance the sensitivity of surface waters to acid deposition. The ability of surface waters to buffer acidic deposition is currently being evaluated using a steady state acid- loading model, the Henriksen model, although future efforts also include dynamic modelling.
The Henriksen model for predicting critical acidifying loads requires only two data inputs. One input, the base cation concentration, is currently obtained directly through routine sampling of lakes and is a relatively accurate measure of the buffering capacity in a lake. The second input, basin water yield, is estimated and is subject to significant errors, especially in complex, ungauged, low-relief drainage basins associated with the Boreal Plain of Alberta. The basin water yield is required to estimate the amount of buffering capacity delivered on an annual basis from the watershed. Error in water yield estimates limits the ability to determine the annually sustainable buffering capacity of both lakes and their watersheds.
125

J. Gibson and K. Bennett
2
This study demonstrates application of an isotope mass balance method for estimating basin water yield and other key hydrological parameters (throughflow, water residency) for acid sensitivity modelling in a network of 50 lakes in the region. Stable isotopes of water (oxygen-18 and deuterium) have been analysed from water samples collected during routine water quality surveys of the lakes. Isotope composition of lakes in the region is controlled by isotope composition of precipitation input with predictable modifications by evaporation, so that the degree of isotopic enrichment can be used as a reliable indicator of lake flushing rates (throughflow), and water replacement rates. Basin water yield can subsequently be calculated from the replacement rate and volume of water in each lake. The isotope mass balance approach for estimating water balance parameters has been demonstrated in previous studies of open water bodies [2-8] and has been previously applied with success to characterize water balance of lakes in northern Alberta [9-11]. Required variables, practical limitations and successes of the approach in evaluating critical acid loadings are discussed.
[1] GOLDER ASSOCIATES, Acid Deposition Sensitivity Mapping and Critical Load Exceedences in the Athabasca Oil Sands Region, Consultants Report to Alberta Environment (2002).
[2] INÇER, T., The use of oxygen-18 and deuterium concentrations in the water balance of lakes, Water Resour. Res. 4 (1986) 1289-1305.
[3] GAT, J.R., "Environmental isotope balance of Lake Tiberias", Isotopes in Hydrology, 1970, IAEA, Vienna (1970) 151-162.
[4] GAT, J.R., Lakes, in Stable Isotope Hydrology- Deuterium and Oxygen-18 in the Water Cycle, IAEA Techn. Rep. Ser. 210, IAEA, Vienna (1981) 203-221.
[5] GONFIANTINI, R., "Environmental isotopes in lake studies", Handbook of Environmental Isotope Geochemistry, Vol. 3 (FRITZ, P., FONTES, J. CH., Eds), Elsevier, New York (1986) 113-168.
[6] ZUBER, A., On the environmental isotope method for determining the water balance of some lakes, J. Hydrol. 61 (1983) 409-427.
[7] KRABBENHOFT, D.P., BOWSER, C.J., ANDERSON, M.P., VALLEY, J.W., Estimating groundwater exchange with lakes 1: The stable isotope mass balance method, Water Resour. Res. 26 (1990) 2445-2453.
[8] GAT, J.R., "Stable Isotopes of Fresh and Saline Lakes", Physics and Chemistry of Lakes (LERMAN, A., IMBODEN, D., GAT, J., Eds) Springer-Verlag, Berlin (1995) 139-165.
[9] GIBSON, J.J., PREPAS, E.E., MCEACHERN, P., Quantitative comparison of lake throughflow, residency, and catchment runoff using stable isotopes: modelling and results from a survey of Boreal lakes, J. Hydrol. 262 (2002) 128-144.
[10] MCEACHERN, P.M., PREPAS, E.E., GIBSON, J.J., DINSMORE, P., The forest fire induced impacts on phosphorus, nitrogen and chlorophyll-a concentrations in boreal sub-arctic lakes of northern Alberta, Can. J. Fish. Aquat. Sci. 57 2 (2000) 73-81.
[11] PREPAS, E.E., PLANAS, D., GIBSON, J.J., VITT, D.H., PROWSE, T.D., DINSMORE, W.P., HALSEY, L.A., MCEACHERN, P.M., PAQUET, S., SCRIMGEOUR, G.J., TONN, W.M., PASZKOWSKI, C.A., WOLFSTEIN, K., Landscape variables influencing nutrients and phytoplankton communities in Boreal Plain lakes of northern Alberta: a comparison of wetland- and upland-dominated catchments, Can. J. Fish. Aquat. Sci. 58 (2001) 1286-1299.
126

EXTENDED SYNOPSIS IAEA-CN-118/72 TOPIC: HYDROLOGY
1
14CDIC Gradient in the Unsaturated Region of the Judea Group Aquifer, Israel
I. Carmia, M. Stillera, J. Kronfelda, Y. Yechielib, M. Bar-Matthews b, A. Ayalonb, E. Boarettoc
a Tel-Aviv University, Tel-Aviv, Israel
bGeological Survey of Israel, Jerusalem, Israel
c Weizmann Institute of Science, Rehovot, Israel
E-mail address of main author: [email protected]
The Judea Group carbonate aquifer is a major source of water supply in Israel. Determination of the age of the water is important for understanding the properties of the aquifer and for its optimal exploitation. The 14C activity of dissolved inorganic carbon, 14CDIC, is a natural choice for this age dating. The initial activity of groundwater is needed for the age calculation but until very recently [1], have not been directly measured for groundwater systems. The initial 14C activity is affected by processes occurring in the unsaturated zone, and this is the subject of the present study.
The Soreq cave situated above the Judea Group aquifer is a natural laboratory for understanding processes in the unsaturated zone of this aquifer. In a previous study we have utilised tritium to estimate the time-delay between rain falling on top of the cave and its appearance in stalactite-drippings and pools within the cave [2]. In the winters of 2002 and 2003 we collected drip and pool water in the cave, at sites of known depth from the surface. In a study completed recently [1] we determined the 14C activity of several water sources in the Soreq cave that represents the 14C activity of water entering the Judea Aquifer. We estimated a correction factor of, Qeq=0.61, for the initial radiocarbon activity in groundwater that enters the aquifer, relative to the atmospheric14C activity at the time of the rainfall.
The isotopic composition of DIC (dissolved inorganic carbon) in the drippings is the result of dissolution of soil CO2 in rainwater, and of interaction with the Cenomanian dolomitic host rock. In this study we examine the isotopic composition (14C and 13C) of DIC occurrences in the cave - drippings and pools - as a function of the rock (i.e. roof) thickness above the cave (~10 m to more than 40 m). To estimate the 14C values of soil CO2, derived from decayed organic matter, we measured the 14C activity of the organic fraction in topsoil above the cave. The isotopic analysis (13C and 14C ) revealed that the source of the organic fraction are C3 plants having modern 14C values. The examination of the 13CDIC and DIC data in the two types of water, drippings and pools, clearly shows that they are different. Because the DIC of the pools’ water undergoes additional CO2 exchange with the ambient atmosphere in the cave, it becomes heavier in 13C than the drippings by at least 4‰. Therefore, only the drip waters provide appropriate samples for the study of the 14CDIC depth gradient caused by processes in the unsaturated zone. Assuming a uniform percolation rate, the 14CDIC-depth gradient is, in fact, a 14CDIC-time gradient, or reaction rate, in the unsaturated zone. In Figure 1 we show the gradient of 14CDIC-time in the unsaturated zone of the cave. Using a first order reaction model
127

I. Carmi et al.
2
in a logarithmic representation, we estimated the decrease in 14C activity with time to be about 3% year-1.
FIG. 1. Time gradient of 14CDIC in drippings of the Soreq Cave. On the Y axis are the natural logarithms of the difference Q? - Qeq, vs. the time period of precolation, ?. Q? are measured 14C values normalized to the atmospheric 14C levels at the beginning of the percolation process, i.e. the year when the rain fell on the top of the cave.
[1] CARMI, I., KRONFELD, J., YECHIELI, Y., BOARETTO, E., BAR-MATTHEWS, M., AYALON, A., A direct estimate of the initial concentration of 14C in the Mountin Aquifer of Israel, Radiocarbon (in press).
[2] KAUFMAN, A., BAR-MATTHEWS, M., AYALON, A., CARMI, I., The vadose flow above Soreq Cave, Israel: a tritium study of the cave water, J. Hydrology 273 (2002) 155.
0 5 10 15 20 25 30
-1.8
-1.6
-1.4
-1.2
-1.0
-0.8
ln(Q
θ-Qeq
)
θ (years)
128

EXTENDED SYNOPSIS IAEA-CN-118/73
TOPIC: HYDROLOGY
1
Environmental Tracers in Groundwater of the North China Plain
A. M. Kreuzera, W. Aeschbach-Hertiga, C. Zongyub
a Institute of Environmental Physics, University of Heidelberg, Heidelberg, Germany
bInstitute of Hydrogeology and Environmental Geology, Chinese Academy of Geological Sciences, Zhengding, Hebei, China
E-mail address of main author: [email protected]
Environmental tracers such as stable isotopes or noble gases in groundwaters are important tools to study issues of water resources and to obtain palaeoclimate records. Applications of these methods to semi-arid regions are of particular interest. On the one hand, noble gas studies in such regions have shown that, in addition to recharge temperatures, the “excess air” phenomenon may be useful as a climate proxy for the important parameter humidity, and that changes in humidity may influence the relationship between air and soil temperature [1, 2]. On the other hand, in dry areas groundwater is a unique and scarce resource. Old groundwaters in such places are not only climate archives, but in the first place water resources of high quality but finite quantity.
The investigated area of this study is the North China Plain, which consists of the deposits of the Yellow River and is the largest alluvial plain of eastern Asia. The plain is bordered on the west by the Taihang Mountains and fronts the Bohai Gulf in the east. It reaches up to the Yen Mountains in the north and to the Yangtze River in the south. The North China Plain is one of the most densely populated areas of the world. The plain has a temperate continental monsoon climate, with clear-cut seasons, dry winters and humid summers. The aquifer studied here has its recharge area near the mountains in the west and becomes deeper and confined to the east near the coast.
In March 2004 twenty-six wells along a transect from the recharge area near Shijiazhuang to the coastal area near Tianjin were sampled (see map Fig. 1, left panel). Each well was sampled for 14C, 3H, stable isotopes (2H and 18O) and noble gases. The wells in the recharge area were additionally sampled for SF6. The SF6-analyses show that the groundwater in the area near the mountains (west of Shijiazhuang), which was taken from comparatively shallow wells, is quite young. Further analyses of 3H and 3He shall give us information about groundwater residence times and recharge rates in this area.
Groundwater in the confined part of the aquifer will be used to derive a palaeoclimate record from noble gas concentrations and stable isotope ratios, dated by 14C. Previous measurements by Zongyu et al. [3] indicate that the age of the water east of Shijiazhuang increases steadily to a maximum of more than 20 kyr in the coastal region near Tianjin. The samples from this part of the aquifer, which were taken from depths between 100 m and 500 m below the surface, should therefore cover the whole period from present time back to the last glacial maximum. Zongyu et al. [3] observed a clear decrease of stable isotope values with age, which they interpreted as indicating a 6 - 9 °C warming at the end of the last glacial period.
129

A. Kreuzer et al.
2
The stable isotope results of the present study confirm the previous findings by exhibiting a systematic variation of the isotope ratios of the groundwater along the transect (Fig. 1, right panel). The data show a strong decrease of the δD-values in the first section of the confined part of the aquifer, reaching a minimum of ~20‰ lower values than in or near the recharge area, and a gradual increase thereafter.
FIG. 1. Left: Map of the northern part of the North China Plain (from Nelles Maps “Northern China”). The solid line represents the transect along which samples were taken, from the outcrop area west of Shijiazhuang towards the coast near Tianjin. Right: δ2H values as a function of approximate flow distance along the transect, reflecting climatic changes during the past ~ 25 kyr.
Noble gas data will be used to derive an independent and quantitative estimate of the glacial-interglacial temperature change in this region. This will constitute the first noble gas palaeotemperature record from East Asia. Furthermore, it will be of interest to see whether the excess air component in the groundwater from the North China Plain reflects the known changes of humidity in this presently semi-arid region. Noble gas analyses are presently performed and results will be presented at the conference.
[1] BEYERLE, U., RÜEDI, J., LEUENBERGER, M., AESCHBACH-HERTIG, W., PEETERS, F., KIPFER, R., DODO, A., Evidence for periods of wetter and cooler climate in the Sahel between 6 and 40 kyr BP derived from groundwater, Geophys. Res. Lett. 30 (2003) 1173, doi:10.1029/2002GL016310.
[2] KULONGOSKI, J. T., HILTON, D. R., SELAOLO, E.T., Climate variability in the Botswana Kalahari from the late Pleistocene to the present day, Geophys. Res. Lett. 31 (2004), L10204, doi:10.1029/2003GL019238.
[3] ZONGYU, C., JIXIANG, Q., JIANMING, X., JIAMING, X., HAO, Y., YUNJU, N., Paleoclimatic interpretation of the past 30 ka from isotopic studies of the deep confined aquifer of the North China plain, Appl. Geochem. 18 (2003) 997-1009.
130

EXTENDED SYNOPSIS IAEA-CN-118/74
TOPIC: HYDROLOGY
1
Isotopic Studies of Environmental Changes in the Caspian and Aral Sea Basins
V. I. Ferronskya, V. A. Polyakovb, V. S. Brezgunova, Yu. A. Karpycheva, P. N. Kuprinc, K. Froehlichd
a Water Problems Institute of the Russian Academy of Sciences, Moscow, Russian Federation
bAll-Russian Institute of Hydrogeology and Engineering Geology, Zeleny, Moscow Region, Russian Federation
c Moscow State University, Moscow, Russian Federation
dIAEA, Vienna, Austria
E-mail address of main author: [email protected]
During the last thirty years environmental change studies in the Caspian and Aral Seas, lakes Issyk Kul, Balkhash, Yakhsan and a number of rivers of the Central Asian region were carried out. Isotopes in water masses and natural archives in bottom sediments, granulometry, mineralogy, X-ray and difractometry, magnetic susceptibility, organic capbon, pollen, diatoms, fossil remains of organisms and coarse grained minerals, salinity of pore water, CaCO3 and MgCO3 contents, and C-14 dating were used for the study. The results of investigation of the past and present-day hydrologic regime, water dynamics, sea level variation and sedimentation process as impact of climate variation are presented in the paper. The time interval covering the study is Late Pleistocene-Holocene. The main findings and conclusions of the work are as follows:
(1) Sedimentation rate in the southern and central basins of the Caspian Sea had in time a mirror reverse character. Within the interval of 24,000 to 11,000 years the average rate of sedimentation in the central basin was about 0.12 mm/year, whereas since 11,000 to 6,000 years it grew by en order of magnitude and amounted 1.2 mm/year. On the contrary, in the southern basin intensive sedimentation up to 0.9 mm/year took place from 23,000 to 17,000 years and decreasing within 17,000 to 6,000 years to 0.19 mm/year.
(2) It was found from isotopic composition of oxygen and carbon in the carbonate fraction, that in the period of increased sedimentation the isotopically light river waters were discharged, alternatively, from the south and north.
(3) The chemical composition of the pore water demonstrate that simultaneous salinization of the both basins began approximately 22,000 years ago due to intensive water discharge from the south. During that period, the sea level was higher then today up to 70 m, and the sea had hydraulic link with the Black Sea basin.
131

V. Ferronsky et al.
2
(4) The analysis of transport and accumulation of the clastic particles with a size of 1 to 0.63 mm made possible to distinguish 8 transgressive/regressive sea cycles during the last 20,000 years.
(5) Modern water dynamics study by means of hydrogen and oxygen isotopes during the IAEA 1995-1996 cruises shows that the 2,5 m sea level rise in 1978-1995 years has not touched upon the water structure below 300 m depth. But in1996 year changes in the structure started to develop and was fixed by tritium content increase in the most southern sampling stations. That tracer appears to be the most sensitive to such effect.
(6) The present-day hydrologic regime of the Caspian Sea based on the Volga-Ural runoff started its development since Holocene. In the Late Pleistocene, the basic contribution to the sea recharge was from the southern catchment basin. Thus, the hydrological regime of the Caspian Sea has the form of "Caspian pendulum" when the water resupply occurs by turns from the south and north due to changing climatic epochs. More detailed picture of environmental changes in the Caspian-Aral region is drawing by isotopic study of bottom sediments in the Aral Sea, Kara-Bogaz-Gol Bay, lakes Issyk Kul, Balkhash, Yaskhan and rivers.
(7) The results on isotopic and chemical composition and C-14 dating of bottom sediments from Kara-Bogaz-Gol Bay show that approximately 9,000 years ago the bay was desalted and had a common water area with the Caspian Sea. Shallowing of the bay due to the Caspian Sea level lowering and stoppage of river water recharge happened 2,200 years ago. Since that time, the water of Caspian Sea began discharging to the bay. By time, this coincides with the sharp aridization of the Caspian-Aral region.
(8) The cores of the Aral Sea bottom sediments show at depths 230 and 130 cm peat beds with vegetative remains. According to the radiocarbon data, the ages of those beds are 3,500 and 1,600 years, respectively. During these periods, the Aral sea decreased considerably in size due to decrease of river discharge and was divided into a number of separated lakes and swamps.
(9) It was established by the study of bottom sediments in the Issyk Kul Lake located at a height of 1600 m in Tian-Shan that the last intensive water recharge to the lake occurred between 7,800 t0 6,000 years ago. Beginning since 6,000 years, one can observe a gradual increase of sult concentration in the lake water. The highest sedimentation is seen in the period since 7,800 to 7,000 years. This is due to the climate warming and intensive thawing of mountain glaciers in the region. At the same time, the global climate warming was accompanied by aridization of the Caspian-Aral region, which is confirmed by the above-discussed results on the isotopic and chemical composition, radiocarbon dating of the bottom sediments in the Caspian and Aral Seas.
132

EXTENDED SYNOPSIS IAEA-CN-118/75
TOPIC: HYDROLOGY
1
A Geochemical and Isotope Hydrological Study of Eutrophication Processes in the Plitvice Lakes, Croatia
N. Horvatincica, B. Obelica, J. Barešica, R. Calicb, S. Babinkac, A. Suckowd, I. Krajcar Bronica
a Rudjer Boškovic Institute, Zagreb, Croatia bWatersupply Company, Zagreb, Croatia c Leibniz Institute for Applied Geosciences (GGA), Hannover, Germany dInternational Atomic Energy Agency (IAEA), Vienna, Austria
E-mail address of main author: [email protected]
The Plitvice Lakes are a series of lakes, tufa barriers and waterfalls located in the Dinaric Karst in Central Croatia, where calcium carbonate precipitates very intensively forming tufa barriers in presence of macrophites and microphites. Therefore, the aquatic system of the whole area is very complex. Additionally, in the last decades an increase in the eutrophication process has been observed in some parts of the lakes and also in some tufa barriers. In our study, which is a part of the EU-Project ICA2-CT-2002-10009, we try to ident ify the source of the eutrophication process to see whether it is a consequence of anthropogenic pollution or process of naturally produced organic matter/humus in the lakes.
This ongoing study includes physico-chemical investigations of lake water, isotope hydrology studies in lake waters and karst springs (δ2H and δ18O, Tritium/3He, CFC/SF6, δ13C of dissolved inorganic carbon - DIC) and geochronology and geochemistry of lake sediments. Seasonal aquatic chemistry samples are complemented by monthly sampling for stable isotopes in water (δD, δ18O) at 15 sampling points including 4 springs, 5 lakes, waterfalls and streams between lakes. The 14C and 3H activity of monthly samples of atmospheric CO2 and of precipitation, respectively, in this area is also recorded.
Parameters like temperature, pH, conductivity and dissolved oxygen are measured in situ. The isotope hydrological as well as the following chemical analyses of water are performed in the laboratory: dissolved organic carbon (DOC) and inorganic carbon (IC), nutrients as NO2
—, NO3
—, HPO4—, NH4
+, additional anions F—, Cl—,SO42—, HCO3
—, cations Ca2+, Mg2+, Na+, K+, as well as trace elements (B, Al, Cr, Sr, Mn, Fe, Ni, Cu, Zn, As, Cd, Ba, Pb).
The results of physico-chemical measurements of water at 15 sampling points along a flow distance of about 12 km, including sites with very intense CaCO3 precipitation, show the following:
1. Temperature, pH, concentration of calcium and bicarbonates (alkalinity), and hence the saturation index of CaCO3 (Isat), show significant change in downstream flow and also some seasonal variations. These results are compared with previous measurements (1). The results show that the carbon exchange process along CO2
—HCO3—CaCO3 plays an
important role for tufa precipitation.
133

N. Horvatincic et al.
2
2. Concentration of DOC is higher in lake waters where eutrophication process is significant (1-2 mg/L) then in non-eutrophicated water, e.g. in spring waters (0.3-0.5 mg/L). Additionally, DOC values are also higher in some “clean” stream waters, where tufa does not precipitate in spite of otherwise favorable physico-chemical conditions for calcite precipitation, such as the high degree of supersaturation. In this case probably DOC inhibits tufa deposition.
3. The concentration of dissolved nutrient salts, as well as of trace elements in water, is very low for most of sampling points. No systematic difference in concentration of these species between “clear” and eutrophicated waters was observed.
δ13C values of DIC in water of the Plitvice Lakes area steadily increase downstream from the karst springs (δ13C is -12.5‰) to the river mouth (δ13C is -10.0‰). Simultaneously, increase of 14C activity of DIC in downstream flow in the same area was observed [2]. This is the consequence of the exchange process between the atmospheric CO2 and DIC in water at rapids and waterfalls.
The first results for stable isotopes δ2H and δ18O in lake and stream waters plot above the global meteoric water line (GMWL) with a deuterium excess between 10 and 16. So most samples seem to have some influence from the Mediterranean area, where deuterium excess higher than 10 prevails. For the winter samples measured up to now evaporation from the lakes is not detectable from δD and δ18O values. Earlier tritium samples of the karst springs have shown short residence times of several years. New results from tritium, 3He and CFC/SF6 measurements confirm these results. Sediment dating of the first core from Lake Kozjak shows that the topmost 40 cm of sediment are younger than 40 years since 137Cs is present in all samples. The resulting sedimentation rate of more than 1 cm/year contrasts with earlier findings using 14C. A possible reason could be the significant amount of organic matter mixed in carbonate sediment at this specific point.
According to the chemical and isotopic measurements of water there is indication that the concentration of DOC is higher in the areas where the process of eutrophication is pronounced and that higher DOC concentration in water can inhibit the tufa/calcite precipitation. The preliminary chemical measurements of water do not indicate anthropogenic pollution of lake waters, and higher concentration of DOC in some sampling points can be a consequence of input of natural organic matter/humus to the lake water. Further investigations of geochemical and isotopic sediment-water interaction in the surface sediment at a total of 5 sampling points in the Plitvice Lakes area are in progress.
[1] SRDOC, D., HORVATINCIC, N., OBELIC, B., KRAJCAR, I., SLIEPCEVIC, A., Procesi taloženja kalcita u krškim vodama s posebnim osvrtom na Plitvicka jezera (Calcite Deposition Processes in Karstwaters with Special Emphasis on the Plitvice Lakes, Yugoslavia) (English Abstract) Krš Jugoslavije (Carsus Iugoslaviae) 11 4-6 (1985) 101-204.
[2] SRDOC, D., KRAJCAR BRONIC, I., HORVATINCIC, N., OBELIC, B. The Increase of 14C Activity of Dissolved Inorganic Carbon Along the River Course, Radiocarbon 28 (1986) 515-521.
134

EXTENDED SYNOPSIS IAEA-CN-118/76
TOPIC: HYDROLOGY
1
The Relationship between the Isotopic Composition of Lake and Inflow Waters and the Limnology of a Small Carbonate Lake in NW England
E. H. Fishera, S. F. Crowleya, S. Barnesb, J. D. Marshalla
a Department of Earth and Ocean Science, University of Liverpool, U. K.
bGolder Associates (UK) Ltd., Nottinghamshire, U. K.
E-mail address of main author: [email protected]
The isotopic composition of lake waters is a complex issue. The interpretation of isotopic data requires a knowledge of the local processes which may modify the signal [1]. This study has attempted to show how a detailed knowledge of the limnology of a lake can be used to interpret isotopic records.
Hawes Water is a small (8 ha), oligotrophic, carbonate lake located in NW England. Detailed modern limnological monitoring took place over a two-year period (April 1998-April 2000). Water temperature was monitored every two hours using dataloggers deployed on the marl shelf and in the open water. Water samples were analysed in the field on a monthly basis, for temperature, pH, total alkalinity and dissolved oxygen. Monthly water samples were taken for laboratory measurements of oxygen, hydrogen and DIC isotopes, nitrates, phosphates, major and trace cations and anions and algal content. The samples were taken from the lake margin, various deep-water sites and three inflow sites.
Temperature data shows that Hawes Water is a monomictic lake. Thermal stratification begins in April and continues until October/November when the lake overturns. A thermocline develops at approximately 6 m depth and persists throughout the summer.
Dissolved oxygen saturation measurements from surface samples range from 70% in the winter months to ~140 % in the summer. At the thermocline, levels are >140% from May until August. The hypolimnion becomes sub-oxic during the summer. pCO2 levels in the epilimnion are low throughout the summer period and only begin to rise in November, after the autumn turnover has taken place. Bacterial activity associated with the decomposition of organic matter consumes oxygen and produces CO2 in the hypolimnion. These processes and the relative hydraulic isolation of this part of the lake produces low O2 and high pCO2 values in the summer months.
The δ13C of dissolved inorganic carbon reflects the primary productivity of the lake and the isotopic composition of inflow waters. From April until November there is a marked positive shift (4‰) in δ13C (DIC) values in the epilimnion, due to the preferential assimilation of 12C-enriched CO2 by algae during photosynthesis. At the same time, there is a negative shift (-3‰) in δ13C (DIC) values in the hypolimnion, probably due to the production of 12C-enriched CO2 during the decay of organic matter in the water column and sediments. From November to March the lake waters become well mixed and δ13C (DIC) values are similar throughout the water column. However, the δ13C (DIC) values of inflow waters are lighter than the upper lake
135

E. Fisher et al.
2
waters throughout the annual cycle and there is some evidence of seasonal variability. This may reflect seasonal changes in the biological activity of the soils, organic contribution from peat or the dissolution of carbonates in the catchment.
In the summer months, oxygen isotope values in the epilimnion become more positive. This was more pronounced during the second year of collection (Fig. 1). This could be due to evaporative effects or the input of isotopically heavier summer rainfall. Lake levels were monitored over the two-year period and compared with daily precipitation records from a local meteorological site. These datasets highlight differences between the amounts of rainfall during the two summer seasons. Rainfall during summer 1999 is less than in 1998 (387.6 mm cf. 538.8 mm) and the lake level drops more in 1999 than in the previous year. This suggests that the variation in the oxygen isotope record is more likely to be due to evaporative effects than the input of summer rainfall.
Coupled δD and δ18O data show that the surface water samples define a slope of 3.9, whilst the groundwater data has a slope of ~10. This suggests that there has been considerable evaporation from the lake surface water samples. The hydrogen isotope data also shows progressive stratification throughout the summer season. The values from July 1999 are much higher at the surface than the rest of the epilimnion. This shows that evaporative effects are mainly confined to the surface waters. Hawes Water data falls within the meteoric water lines from Valentia Island (South West Ireland) and Wallingford (Oxfordshire, England) suggesting that the lake waters broadly reflect the isotopic composition of incoming precipitation.
FIG. 1. Oxygen isotope profile from Hawes Water lake, site A.
[1] LENG, M., MARSHALL, J. D., Paleoclimate interpretation of stable isotope data from lake sediment archives, Quaternary Sci. Rev. 23 (2004) 811-831.
-7
-6
-5
-4
A M J J A S O N D J F M A M J J A S O N D J F M A1998-2000
Surface1 m2 m4 m6 m8 m10 m
δ18O
‰
-7
-6
-5
-4
A M J J A S O N D J F M A M J J A S O N D J F M A1998-2000
-7
-6
-5
-4
A M J J A S O N D J F M A M J J A S O N D J F M A1998-2000
Surface1 m2 m4 m6 m8 m10 m
Surface1 m2 m4 m6 m8 m10 m
δ18O
‰
136

EXTENDED SYNOPSIS IAEA-CN-118/77
TOPIC: HYDROLOGY
1
Determination of Old and Fresh Water Mixing in a Hungarian Karstic Aquifer using Isotope Methods
M. Molnár, L. Palcsu, É. Svingor, Z. Szántó, I. Futó, L. Rinyu
Institute of Nuclear Research of the Hungarian Academy of Sciences, Laboratory of Environmental Studies, Debrecen, Hungary
E-mail address of main author: [email protected]
The studied area is the part of the Aggtelek karst system, Hungary. The Pasnyag spring and the Lótusz spring are located one after the other nearby the Alsó-hill. The water of the Pasnyag spring applied as drinking water. From the local hydrogeological conditions it is possible that fresh and old ground water components are mixed in the springs (Figure 1). This fact is also confirmed by the water quality data.
FIG. 1. Presumed hydrogeological scheme of the area.
The objective of this work was to determine the mixing ratio of the water of different origin in the springs. Repeated water sampling has been carried out around the site from the springs and two monitoring wells (F1 and F4) for two years. The F1 monitoring well is near at hand the Pasnyag spring, and the F4 well is between the two springs. The water quality of the Pasnyag spring and the nearby F1 well is significantly different.
137

M. Molnar et al.
2
Helium content and isotope ratio, tritium concentration (by 3He ingrowth method), radiocarbon content of dissolved inorganic carbon (DIC), and δD, δ13C, δ18O isotope ratios were measured from the water samples.
On the basis of isotope measurements the water of the springs and the observed monitoring wells are composed of fresh and old components in different ratios. The fresh component is dominant in the Pasnyag spring. The tritium and radiocarbon concentration of this water show that it is fresh, young water directly from the karstic system, with only small amount of DIC from the limestone. The helium concentration and isotope ratio in the water of this spring also shows that the subthermal water component is not significant. Higher ratio of the fresh karstic water also detectable in the far F4 monitoring well, but it has slightly lower tritium and 14C content. In the Lótusz spring and the F1 well (nearby the Pasnyag spring) higher ratio of the subthermal water was observed. The low tritium and radiocarbon content show together that these waters contain high amount of old water. The higher helium content and the higher radiogenic 4He ratio of the water also indicate subthermal origin in these cases.
138

EXTENDED SYNOPSIS IAEA-CN-118/78
TOPIC: HYDROLOGY
1
Estimation of Groundwater Recharge and Vulnerability by Tritium Data in Hungary
J. Deák
Water Resources Research Centre (VITUKI Plc), Budapest, Hungary
E-mail address of amin author: [email protected]
Tritium is an excellent tool for proving of the protected groundwater (containing no component younger than 50 years) and for estimation of infiltration and recharge rate.
Annual mean tritium record of precipitation revealing for Hungary shows that the present tritium content of the precipitation fallen before 1952, is not detectable (<1 TU) whereas all groundwaters infiltrated after 1952 are contaminated by tritium, originating from the nuclear weapon tests. The tritium less (“pre-bomb”) groundwaters are protected against the pollutions originated from the surface in the last 50 years. This date corresponds well to the beginning of the intensive environment pollution of the agriculture and industry in Hungary. It means that micro-pollutants (including pesticides) originating from these pollutions should be found in the groundwaters containing detectable tritium and the tritium less groundwaters presumably do not contain them.
This very simple “to be or not to be” method allows developing a cost-effective groundwater quality monitoring network where the very expensive micro-pollutant analyses can be saved in the tritium less groundwaters. Furthermore routine chemical parameters should be analyzed less frequently (every 5 to 10 years) in the tritium less groundwaters. Appearance of tritium means the vulnerability, so tritium can be considered as an “early warning” of the pollutions from the last 50 years in the groundwaters. Case studies from Hungary proving this method will be presented.
The first use in practice: Hungarian Ministerial Decree of 21/2002 ordains for the public water supply companies to analyze periodically micro-pollutants in the raw water of the wells, excepting if the tritium content is less than 0,2 Bq/L (1,6 TU) because these groundwaters are protected against the pollutions of the last 50 years.
The effective infiltration rate of groundwater was estimated using the “tritium peak” method. Fundamental principle of this method is that the tritium content of precipitation was extremely high in 1963-64 years, in consequence of the nuclear weapon tests. Measuring the vertical tritium profile of groundwater or soil moisture, vertical flow velocity (vz), infiltration rate (I) and the vertical hydraulic conductivity (kz) were estimated by the present depth of tritium peak (h63) and of zero tritium content (h52).
According to our field studies in a recharge area of the regional groundwater flow regime of the Great Hungarian Plain the vertical flow velocity (Fig. 2.) was calculated as vz = 200-250 mm/a. The infiltration rate was estimated as I = 40 to 50 mm/a, assuming no = 0.2 porosity. Vertical hydraulic conductivity looks be very low as kz = (5 to 13) * 10-8 m/s.
139

J. Deák
2
Same method was used for estimation of the vertical flow velocity and infiltration rate through the unsaturated zone in loess soil at the prospective nuclear waste disposal [1]. Tritium samples were extracted from the soil samples taken from dug-wells at the construction. Infiltration rates of 5 to 10 mm/a (1 to 2% of the total precipitation) and n0 = 0,07 effective porosity were estimated by the method of tritium peak combined with tritium balance calculations.
Horizontal groundwater flow originating from the Danube with velocity arriving 500 m/a, was detected by the tritium peak method in 1992 in NW Hungary (Szigetköz area) in the more hundred meters thick gravel aquifer. Longitudinal dispersion coefficient of the gravel aquifer was estimated as 300 m by tritium and 3He data [2, 3]. Repeating the tritium sampling five and ten years later the shift of the tritium peak provided useful information about the changes of the groundwater regime.
Groundwater flow velocities, infiltration rates and hydraulic conductivities can be estimated directly from tritium data but the main consume is the verification of hydraulic modeling [4].
[1] HORVÁTH, I., DEÁK, J., HERTELENDI, E., SZOCS, T., Hydrogeochemical investigations in the Tolna hills area, Ann. Report Geological Institute Hungary II (1996) 271-284.
[2] DEÁK, J., DESEO, É., BÖHLKE, J.K., REVESZ, K., Isotope Hydrology studies in the Szigetköz region, Northwest Hungary"", Isotopes in Water Resources Management, IAEA, Vienna (1996) 419-432
[3] STUTE, M., DEÁK, J., RÉVÉSZ, K., BÖHLKE, J.K., DESEO, É., WEPPERNING, R., SCHLOSSER, P., Tritium/3He Dating of River Infiltration: An Example from the Danube in the Szigetköz Area, Hungary, Ground Water 35 5 (1997) 905-911.
[4] FEHÉR, J., VAN GENUCHTEN, M.TH., DEÁK, J., Estimating long-term flow rates in the vadose zone using tritium measurements, (Proc. Sci. Colloquium “Porous or fractured unsaturated media: transports and behaviour” Monte Verita, Ascona, Switzerland October 5-9 1992).
140

EXTENDED SYNOPSIS IAEA-CN-118/79
TOPIC: HYDROLOGY
1
Evolution of Groundwater in a Carbonate-Bearing Glacigenic Aquifer, SW Finland: Hydrochemical and Isotopic Evidence
N. K. Kortelainena, J. A. Karhub, H. Lallukkaa, K. Lindqvista
a Geological Survey of Finland, Helsinki, Finland
bUniversity of Helsinki, Department of Geology, Helsinki, Finland
E-mail address of main author: [email protected]
Unusually high pH values, up to 9.5, are encountered in the glacigenic Virttaankangas aquifer, southwest Finland. This is in strong contrast to the pH values normally recorded in Finnish shallow groundwaters, averaging 6.4 [1, 2]. Chemical and isotopic (18O, D, 13C, T, 14C) compositional parameters were determined in order to evaluate the origin of the unusual chemical composition of the groundwater at Virttaankangas. In addition, the mineralogical composition of the aquifer material was examined. The Virttaankangas groundwater formation has been studied extensively, because it has been selected as the site of an artificial recharge plant, intended to start operation in 2007. The project is the largest artificial groundwater scheme in northern Europe. The high pH values have been suggested to be related to the presence of carbonate minerals in glaciogenic sediments. However, only erratic carbonate boulders have been observed, and no outcrops containing carbonate rock have been discovered at the site.
The Virttaankangas aquifer is located in a NW-SE esker chain composed of Quartenary deposits. In the studied area of 54 km2 the total thickness of sediments above the bedrock varies from 30 to 90 m. The formation of the stratigraphical succession occurred in three stages [3]. The core of the esker with coarse sand and gravel was deposited in the first stage. The second stage consists of an interlobate glaciofluvial ridge and fine-grained glaciolacustrine deposits. Locally the glaciolacustrine deposits form a confining interlayer holding a perched water table. The uppermost, third stage, is composed of sorted littoral sands formed during the regression of the former Baltic Sea. Accordingly, three distinct hydrogeological units can be identified: 1) an unconfined, highly conductive aquifer in the core of the esker, 2) a semi-confined aquifer, with fairly low hydraulic conductivity underlying the confining interlayer, and 3) an unconfined perched aquifer in the littoral deposit overlying the confining sediments.
The different hydrogeological units have distinct hydrochemical and isotope geochemical characteristics. The shortest residence time of groundwater is encountered in the perched aquifer of Unit 3, where seasonal δ18O and δD variations are evident, and the tritium (ca. 10 TU) and radiocarbon (ca. 100 pmC) contents reflect those of recent precipitation. The perched water is highly unsaturated with respect to calcite (log SIcalcite << 0). Chemically this water type is a typical shallow groundwater with a low pH value of < 7, low electric conductivity (EC) and low d13C of dissolved inorganic carbon (DIC) of < -20 ‰ (unpublished data). Oldest groundwaters are present in Unit 2, where some bomb tritium (ca. 21 TU) is still observed. None or minor seasonal variations are present in δ18O and δD of Unit 1 and Unit 2. Groundwater in Unit 2 is saturated for calcite (log SIcalcite ˜ 0) and pH values are high, 9.2 –
141

N. Kortelainen et al.
2
9.5, exceeding values observed elsewhere in the aquifer. There is a small increase in the concentration of DIC from 0.2 mmol/L in Unit 3 to 0.4 mmol/L in Unit 2, suggesting dissolution of calcite. Existence of calcite as a source of DIC is confirmed by higher δ13C (DIC) values in Unit 2, ranging from –17 ‰ to –12 ‰. Concomitantly, the 14C content of DIC has been lowered due to dissolution of old 14C-free carbonate minerals. The δ13C value of about –4.66 ‰ was measured from calcite in glacigenic sediments. In the unconfined aquifer (Unit 1), groundwater is slightly unsaturated for calcite (log SIcalsite = 0), however, the DIC content is approximately 0.5 mmol/L, which suggests slightly different evolution of DIC compared to Unit 2. Also pH is somewhat lower, 8.5 – 9.2. Both tritium (12-16 TU) and 14C (80-90 pmC) concentrations are variable depending on the proportion of recent precipitation and the groundwater flow from Unit 2.
Mineralogical studies of the sediments in the Virttaankangas formation confirmed that very small quantities (0.5 % at most) of clastic, fine-grained (ca. 0.1 mm in diameter) calcite is present in the glacigenic units 1 and 2. However, the littoral sands of Unit 3 are nearly devoid of calcite. Calcite dissolution appears to be sufficient to explain the hydrochemical and isotope geochemical characteristics of the Virttaankangas aquifer. The reaction between groundwater and calcite in the Virttaankangas groundwater system was modelled using the PHREEQC program. A modelled evolution of DIC and pH in groundwater as calcite is dissolved to the point of saturation is in harmony with the chemistry of groundwaters collected from units 2 and 3 in the northeast side of the esker. The model represents closed system dissolution under conditions of a relatively low PCO2 of 10-2.65. In a closed system, pH increases significantly as calcite dissolves. It seems that dissolution of calcite under closed or partially closed system and relatively low CO2 conditions explains the exceptionally high pH values in the Virttaankangas aquifer. Also the δ13C values of DIC in groundwater are consistent with the origin of carbon from soil calcite and soil CO2.
[1] LAHERMO, P., ILMASTI, M., JUNTUNEN, R., TAKA, M., The Geochemical Atlas of Finland, Part 1, Espoo, Geological Survey of Finland (1990) 66 pp.
[2] TARVAINEN, T., LAHERMO, P., HATAKKA, T., HUIKURI, P., ILMASTI, M., JUNTUNEN, R., KARHU, J., KORTELAINEN, N., NIKKARINEN, M., VÄISÄNEN, U., Chemical composition of well water in Finland - main results of the "one thousand wells" project, (AUTIO, S., Ed.) Current Research 1999-2000, Geological Survey of Finland, Special Paper 31 (2001) 57-76.
[3] MÄKINEN, J., RÄSÄNEN, M., Early Holocene regressive spit-platform and nearshore deposition on a glaciofluvial ridge during the Yoldia Sea and the Ancylus Lake Phases of the Baltic Basin, SW Finland, Sed. Geol. 158 (2003) 25-56.
142

EXTENDED SYNOPSIS IAEA-CN-118/80
TOPIC: HYDROLOGY
1
Tracing Water-Rock Interactions: Application to CO2-Rich and Thermal Mineral Waters of the Forez Graben, Eastern French Massif Central
F. Gal, C. Y. J. Renac, D. Tisserand
Universite Jean Monnet, Laboratoire Transferts Lithospheriques, Saint Etienne, France
E-mail address of main author: [email protected]
The Forez graben, part of the French Hercynian Massif Central, is one of the Oligocene – Miocene graben surrounding the European Alpine belt. It’s contoured by hercynian metamorphic rocks, ranging from schists – micaschists units to gneisses, and by numerous granites (Monts du Forez and Monts du Lyonnais). This graben is filled by clastic rocks (clay, sandy clay and sandstone) and few carbonate beds. Internal geometry tends to deepening eastward, reaching at least 500m deep. Some volcanic rocks are also present within the basin. As for lots of tertiary European grabens, numerous mineral water springs occur in or near the basin’s limits. A majority is CO2-rich and bicarbonate- sodium- rich, whereas other present a thermal bearing. Seven of those springs (both thermal and non-thermal) were studied during two years (monthly step sampling), using stable isotope (O, H and C), radiogenic isotopes (3H and 14C) and ions contents.
All waters are bicarbonate rich, from 500 to 3500 mg/l as HCO3–. Major cations are Na (150
to 1000 mg/L), Ca (10 to 200 mg/L), K (5 to 150 mg/L) and Mg (10 to 100 mg/L). Major anions [after HCO3
–] are Cl (5 to 120 mg/L) and sulphate (7 to 50 mg/L). If assuming that contamination by surface water is of second importance, two events are highlighted by cations geothermometers calculations: first an interaction with surrounding rocks at moderate to high temperature, between 150 to 250°C and at low temperature c.a. 50 to 70°C. Nevertheless, all the waters appear to be immature regarding the fields defined by [1]. Inverse modelling (PhreeQC software, [2]) based on mass balance and isotopic compositions predicts dissolution of mineral species such as clays (illite, montmorillonite, kaolinite), oxides (hematite, goethite) and sulphates (gypse, anhydrite).
Based on oxygen and hydrogen isotope ratios (maximum δ18O change: 1‰ ; δD change: 13‰ vs SMOW) of those mineral springs are preserved from actual atmospheric variations. Comparison with the local meteoric water line show a plot above the LMWL (taken at 400m asl; δD=7.4δ18O+3.8 (r²=0.96)) for five springs, leading to a recharge area c.a. 100 to 200m above the actual basin level when assuming no changes in paleogeography. Moreover, episodic Tritium measurements were made. They show always values under 3 Tritium Units, except for one with a discharge in a river bed (5 TU), whereas present surface waters range from 6 to 9 TU.
Two springs plot far above the meteoric line, indicating a recharge upper in the surrounding topography. δ13CDIC measurements are different than surface waters (–16 to –22‰ PDB) and range from –3 to –5‰ PDB, except for a thermal spring (Tmean=29°C, δ13CDIC = –12‰ vs PDB).
143

F. Gal et al.
2
Comparing 14C and Tritium activities indicates that all the waters are between the “old” and “fossil” poles. Maximum ages calculated [3] are 8000 years BP for the thermal spring mentioned above and range between 19000 and 26000 years BP for the others. By taking into account 13C ratios, alkalinity and water temperature, ages shift drastically to younger values: the thermal spring is then 2500 years BP.
So the studied waters fall within the surrounding “Monts du Forez” or “Monts du Lyonnais” between 2000 to 20000 years BP, infiltrate deep guided by inherited hercynian faults and experience two steps of interaction with rocks. Contamination or interaction with recent aquifers occurs during the rising up, as shown by Tritium content.
[1] GIGGENBACH, W.F., Geothermal solute equilibria, Derivation of Na-K-Mg-Ca
geoindicators, Geochim. Cosmochim. Acta 52 (1988) 2749-2765. [2] PARKHURST, D.L., APPELO, C.A.J., User's guide to PHREEQC (Version 2) - a
computer program for speciation, batch-reaction, one-dimensional transport, and inverse geochemical calculations: U.S. Geological Survey Water-Resources Investigations Report 99-4259 (1999) 312 pp.
[3] FONTES, J.C., GARNIER, J.M., Determination of the initial 14C activity of the total dissolved carbon; a review of the existing models and a new approach, Water Resour. Res. 15 (1979) 399-413.
[4] KHARAKA, Y.K., LICO, M.S., LAW, L.M., Chemical geothermometers applied to formation waters, Gulf of Mexico and California basins, Am. Assoc. Petrol. Geol. Bull. 66 (1982) 588.
[5] KHARAKA, Y.K., MARINER, R.H., Chemical geothermometers and their application to formation waters from sedimentary basins : Thermal History of Sedimentary Basins, (NAESER, N.D., MCLOLLON, T.H., Eds) Springer Verlag, New York (1989) 99-117.
[6] FOURNIER, R.O., POTTER, R.W., An equation correlating the solubility of quartz in water from 25°C to 900°C at pressures up to 10 000 bars, Geochim. Cosmochim. Acta 46 (1982) 1969-1973.
144

EXTENDED SYNOPSIS IAEA-CN-118/81
TOPIC: HYDROLOGY
1
Are Oxygen Isotopes of Sulfate a Useful Tool for the Quantification of Sulfate Reduction in a BTEX Contaminated Aquifer?
K. Knoellera, C. Vogtb, S. Weisea
a UFZ Centre for Environmental Research Leipzig-Halle, Dept. of Isotope Hydrology, Halle/Saale, Germany
bUFZ Centre for Environmental Research Leipzig-Halle, Dept. of Environmental Microbiology, Halle/Saale, Germany
E-mail address of main author: [email protected]
The mineralization of organic contaminants to carbon dioxide and water by naturally occurring in-situ biodegradation is the basic concept of the natural attenuation of polluted aquifers. Sulfate reducing bacteria can contribute extensively to the biodegradation of organic contaminants. During the dissimilatory reduction of sulfate, the microorganisms produce sulfide to obtain energy for the oxidation of organic carbon provided by the contaminants. The preferential utilization of the lighter isotopes by bacteria usually results in the enrichment of the lighter isotope in the produced sulfide and of the heavier isotope in the remaining sulfate. For sulfur, the isotopic enrichment in the remaining sulfate has been used quite successfully for the identification and quantification of bacterial sulfate reduction (BSR). However, only little is known about the behavior of oxygen isotopes in sulfate during sulfate reduction under the specific conditions of an organic contamination. Therefore one goal of this study was to specify the fractionation mechanisms of sulfate oxygen closely related to biodegradation. The contamination of the investigated Quaternary aquifer is related to the operation of an industrial site that was originally set up in 1938 for the production of gasoline and upgraded for the production of benzene in 1960. During the operation from 1938 to 1990, numerous production accidents and leaks contributed to BTEX-contamination of the groundwater.
To obtain the basic fractionation parameters for sulfur and oxygen, experimental and field data were used. Microcosm experiments were inoculated with an enrichment culture from the study area. All experiments were conducted with toluene as the solely source of organic carbon. Groundwater samples were collected from multi- level sampling wells in a ca. 500 m2 area within the contaminant plume. The sampling area was selected in order to avoid a mixing of sulfate from different sources. Groundwater and laboratory samples were analyzed for the content of dissolved sulfate and sulfide as well as for the isotopic composition of sulfate (δ34S, δ18O) and sulfide (δ34S).
The isotopic composition of sulfur in sulfate and sulfide from laboratory and groundwater samples are shown in Figs. 1 and 2, respectively. In both cases, the typical correlation between the fraction of the residual sulfate and the δ34S-SO4 proves the occurrence of BSR. The average enrichment factors for 34S were calculated from logarithmic fits of the respective data sets using a Rayleigh equation. While the experimental enrichment factor between SO4 and S2- was -23.4 ‰, a slightly smaller value of -17.5 ‰ was observed for field samples. Both values are consistent with previously reported data. δ34S-S2- values obtained during the
145

K. Knoeller et al.
2
laboratory experiments are in accordance with the expected values for the given enrichment factor in a system that is characterized by the accumulation of a product reservoir (Fig. 1). For groundwater samples the measured δ34S-S2- values do neither match the expected values for an accumulating product reservoir nor the values expected for an open system with H2S-loss (Fig. 2).
As shown in Fig. 1, no correlation exists between the fraction of the residual sulfate and the δ18O-SO4. The absence of the typical 18O-enrichment can be caused either by the interference of the kinetic isotope effect with an approaching isotopic equilibrium between oxygen in sulfate and water or by the superimposition of BSR by the bacterial disproportionation of S0 to SO4 and H2S (BDS). A general lack of an oxygen isotope effect, e.g. due to the high load of organic contaminants, can be ruled out, since a significant oxygen isotope shift of more than 5 ‰ between the initial sulfate and the sulfate in the microcosm experiments was observed.
The oxygen isotopes of sulfate in groundwater samples show a much different behavior (Fig. 2). A strong correlation exists between the fraction of the residual sulfate and the measured δ18O-SO4. However, this correlation is rather of a linear type than of the logarithmic type that would be expected for BSR. Again, an interference of different processes, most likely BSR and BDS, seems obvious. Hydrochemical analyses showed that most groundwater samples contain a significant amount of elemental sulfur which supports the assumption of BDS occurrence.
In general, sulfur isotopes provide a very useful tool for the identification of BSR in BTEX contaminated aquifers. However, for the quantification of the process caution has to be used since a possible BDS can also affect the δ34S of the remaining sulfate. Oxygen isotope data can also be quite useful as long as there is no interference with processes such as BDS or with an approaching equilibrium with water oxygen. But even in those cases, the unusual behavior of δ18O-SO4 helps recognize processes that have to be considered for the quantification of BSR using sulfur isotopes.
FIG. 1. Correlation between the remaining SO4-fraction and the isotopic composition of SO4 and S2- in microcosm toluene degradation experiments.
FIG. 2. Correlation between the remaining SO4-fraction and the isotopic composition of SO4 and S2- in groundwater samples from the study area.
146

EXTENDED SYNOPSIS IAEA-CN-118/82
TOPIC: HYDROLOGY
1
Stable Isotope Compositions of Sedimentary Organic Carbon and Nitrogen Recovered from East African Crater Lake
A. N. N. Muzuka
Institute of Marine Sciences, University of Dar Es Salaam, P.O. Box 668, Zanzibar, Tanzania
E-mail address of main author: [email protected]
Variation in the contents of organic carbon and nitrogen and stable isotopes composition of organic carbon for two cores (EMP LIV 2b and EMP LIV 4) recovered from the Empakai crater lake are used to deduce variability in sources of organic matter in the lake in relation to climatic changes. Also the stable isotopes of sedimentary nitrogen are used to assess effect of acid treatment on nitrogen stable isotopes. Cores EMP LIV 2b and EMP LIV 4 are 1 and 2 m long, and were recovered from water depths of 11 and 20 m respectively.
The Empakai Crater Lake (2o54'S; 35o50'E), which is a closed lake, is located in a semi arid environment about 10 kilometres south of the Oldonyo Lengai within the northeastern corner of the Ngorongoro Conservation Area Authority in northern Tanzania. Eight-accelerator mass spectrometer dates determined on total organic matter for core EMP LIV 4 indicate that the sedimentation rate in this lake is about 30 cm/ka for the late Pleistocene to early Holocene period.
Both d13C (average –24.0∀2.7λ) and d15N (8.2∀3.0λ) values for core EMP LIV 4 show a sharp change to lower values of about 4λ and 7λ respectively at around 8.7 ka uncorrected 14C ages. Abrupt change in the stable isotopes compositions of organic carbon and nitrogen show major climatic changes to have taken place during the Pleistocene-Holocene period most probably changing from humid to drier conditions. The d13C values between 0 and 8.7 ka show small amplitude of downcore decrease, whereas that d15N values shows a general downcore increase an indication in changes in relative proportion of C4 and C3 material as well as climatic conditions. Between 8.7 and 11 ka, the d13C values depict slight downcore enrichment reaching peak during the Young Dryas. The lowermost part of the core shows depletion in 13C centred at about 12 ka. Similarly, the d15N values show a downcore decrease between 8.7 and 12 ka. This may be an indication of increase in supply of phytoplanktonic material to the lake owing to increase in precipitation during the Pleistocene-Holocene transition.
Both cores have high contents of organic carbon and nitrogen an indication of preferential preservation. The contents of nitrogen (averaging 0.35∀0.25%) and organic carbon (averaging 6.9∀5.2%) for core EMP LIV 4 co-vary and are highly variable. Highest contents of organic carbon and nitrogen are confined between 10 and 12 ka. Furthermore, the C/N ratios, which average 21.4∀3.9, show a general downcore increase to the base of the core. The contents of organic carbon (averaging 4.8∀5.4%) and nitrogen (averaging 0.43∀0.47%) for core EMP LIV 2b shows a general downcore decrease to the base of the core with a sharp shift towards lower values at 35 cm. The C/N ratios values for core EMP LIV 2b that averages 12.7∀2.1 display 2 steps downcore increase.
147

A. Muzuka
2
Core EMP LIV 2b is chronologically poorly constrained with two available 14C dates being reversed. The d13C values for core EMP LIV 2b, which averages -19.2∀2.2λ, shows a general downcore decrease with d-values changing from -17λ to -21λ in the upper 30 cm. This trend is followed by a shift to higher values of about 5λ within 10 cm followed by a systematic downcore decrease to the base of the core. The d15N values for core EMP LIV 2b are highly variable and averages 1.0∀3.6λ.
Generally, the stable isotope results indicate that climatic conditions have deteriorated since the middle Holocene. Furthermore, the results indicate that sources of organic matter in the Empakai crater lake has varied over time with more humid periods being characterized by material derived from phytoplankton and C3 land plants. Also a difference in mean isotope values between shallower site (enriched) and deeper (depleted) site shows how heterogeneous the records can be even from the same area.
This study also assessed impact of sample treatment on the stable isotope compositions of nitrogen. Generally acidification processes cause isotope fractionation where treated particulate materials are depleted in 15N relative to untreated fraction (Fig. 1). The difference in the stable isotope composition between treated and untreated samples is as high as 7‰. This could be attributed to hydrolysis effect where nitrogen rich compounds are removed. Thus, for the determination on nitrogen stable isotopes, untreated sedimentary materials are preferred over treated sediments.
DEPTH (cm)
0 50
100
150
200
δ15N
VA
LUE
S
-50
510
1520
Tre
ated
U
ntre
ated
FIG. 1. A figure showing differences in stable isotopes composition of nitrogen between acidified (treated) and unacidified sediment samples.
148

EXTENDED SYNOPSIS IAEA-CN-118/83
TOPIC: HYDROLOGY
1
Radon-222 as Natural Tracer for the Estimation of Groundwater Infiltration at the Sediment/Water Interface of Rivers
M. Schuberta, H-C. Treutlera, H. Weissb, J. Dehnertc
a UFZ Centre for Environmental Research, Department of Analytical Chemistry, Leipzig, Germany
bUFZ Centre for Environmental Research, Department of Groundwater Remediation, Leipzig, Germany
c Sächsisches Landesamt für Umwelt und Geologie, Dresden, Germany
E-mail address of main author: [email protected]
The careful estimation of the infiltration of waters from rivers or lakes into aquifers is vital for the assessment of the capacity of drinking water wells that are mainly discharged by surface waters. The paper discusses results of a research, which investigated the potential of using Radon-222 as a natural tracer of such water migration processes.
Radon is a naturally occurring component of the groundwater. Its concentration is determined by four individual terms: radon production in the mineral matrix of the aquifer, radon decay, diffusion, and transfer with the groundwater flow. The production rate depends on the mineral matrix parameters radium concentration, emanation coefficient, pore space, and density. The decay rate depends on the radon decay constant. Since the diffusion length of radon in water is only 2 cm, radon migration is in fact only determined by the groundwater flow velocity.
Since open surface waters are lacking considerable contact to radon emanating minerals they show, in contrast to groundwaters, only negligible radon concentrations. Only if surface water enters an aquifer its radon concentration rises due to the decay of radium present in the aquifer mineral matrix, until it reaches background concentration. Due to the half- life of radon-222 (3.8 d) surface water that enters the aquifer reaches that background concentration after about 20 days (five half- lives). However, before that equilibrium concentration is reached ground- and infiltrating surface waters can be distinguished by their respective radon concentrations.
Hoehn and von Gunten [1] used the increase of radon concentrations to estimate groundwater residence times. Burnett et al. [2] used radon to estimate the dynamics of submarine groundwater discharge into coastal zones. The purpose of the study described here was to estimate changing intensities of river water infiltration into an adjacent aquifer.
For a pilot study a set of observation wells was installed in the Elbe River Valley near Torgau/Saxony. Ten wells were installed in a 90 degree angle to the river on one of its banks. It was assumed that the monitoring of the infiltration of river water into the aquifer is possible by measuring the radon concentrations in the observation wells. Changing radon concentrations in the wells were expected to indicate corresponding changes of the infiltration rate. The observation period was characterized by considerable variations in the river water level as displayed in Fig. 1.
149

M Schubert et al.
2
Four of the seven sampling campaigns (A to G) are discussed. The first sampling campaign (marked with A in Fig. 1) was carried out during a period of low river water levels and low infiltration rates. The radon distribution in the aquifer, as it was determined from groundwater samples taken in the monitoring wells at several depths. The normal radon background concentration of the groundwater is about 16 Bq/l. The much lower radon concentrations in the groundwater adjacent to the riverbed indicate a moderate infiltration of river water into the sandy aquifer. The second sampling campaign (B in Fig. 1) was carried out during a short but intense period of high river water levels. The radon distribution in the aquifer indicates a much higher infiltration rate, caused by the high river water level. The infiltrating river water is characterized by low radon concentrations. A third sampling campaign (C in Fig. 1) was characterized by a falling river water level and thus by declining infiltration rates. This gave rise to a beginning recovery of the radon concentrations in the aquifer close to the riverbed. However, a front of infiltrated river water, still characterized by depleted radon concentrations, moves through the aquifer away from the river. The final sampling campaign (E in Fig. 1) is characterized by a return to normal river water levels. The radon distribution in the aquifer shows a pattern comparable to that found at the first sampling campaign; the infiltration rate returns back to normal values.
The results show that radon can be used as a naturally occurring tracer to assess and estimate infiltration from surface waters into aquifers.
FIG. 1. Elbe water level (meters above sea level, mSL) with sampling campaigns A to G.
[1] HOEHN, E, VON GUNTEN, H.R., Radon in Groundwater, Water Resour Res 25 (1989) 1795-1803.
[2] BURNETT, W.C., DULAIOVA, H., Estimating the dynamics of groundwater input into the coastal zone via continuous radon-222 measurements, J Environ Radioact. 69 (2003) 21-35.
150

EXTENDED SYNOPSIS IAEA-CN-118/84
TOPIC: HYDROLOGY
1
Radium Isotope Ratio as Indicator of Natural Contamination Input in Groundwaters
D. C. Lauriaa, R. R. de Almeidab
a Instituto de Radioproteção e Dosimetria (IRD), Rio de Janeiro, RJ, Brazil
bUniversidade Federal Fluminense, Niteroi, RJ, Brazil
E-mail address of main author: [email protected]
An investigation of abnormal high radium concentration in surface water of a Brazilian coastal region pointed out waters from springs feeding the lagoon system as responsible for the input of radium isotopes to the lagoon. The enhanced level of radium isotopes in the springs was associated to a natural process: the leaching of monazite sand by water containing high level of hydrogen ions [1]. This finding pointed out the necessity to survey the ground water of the region in order to investigate the existence of radionuclides contamination input main points as well as the extension of the natural contamination in ground water of the region.
The surveyed area comprises app. 100 km2, it is located between N 286 km, S 7630 km and N 296 km, S 7640 km UTM geographic coordinates. The aquifers are non confinated, shallow, and low productive. The water is used for drinking purposes, with the maximum yields of the wells of around 2 m3/h.
Sixty-nine private wells were geographically located by a satellite navigation system, GPS (Garmin, model 45 XL). The physical-chemical parameters (pH, Eh, temperature and conductivity) showed a wide range of data. The conductivity varied from 98 e 11000 µS/cm and pH values varied from 3.65 to 7.79. The spatial distribution map of pH values showed wide area of pH values lower than 4.5, and some localized points of pH values higher than 5 (Fig. 1). Based on these results, forty-four samples were chosen for being analyzed for Ra-228, Ra-226, Pb-210 by radiochemical methods. From this twenty-eight samples were analysed by ICPMS for determination of uranium and thorium.
The ranging of concentrations were from <3.0 10-3 to 1.61 Bq/L for 226Ra, from <0.30 to 5.2 Bq/L for 228Ra and from <0.01 to 1.72 Bq/L for 210 Pb. The thorium concentration were lower than the minimum detectable activity concentration (3.3 10-5 Bq/L, 8.0 10-3 µg/L), while the uranium concentration varied from 3.4 10-4 to 2.9 10-2 Bq/L (0.03 to 2.39 µg/L).
Monazite contains variable levels of Th and U; a typical Brazilian monazite around 0.03% of U3O8 and 6% of ThO2, its Th/ U activity ratio is around 18. Monazite has a high chemical stability. Leaching laboratory experiments showed that only app 0.02% of radium would be released from the ore in low pH value (3.7). Thus, assuming the equilibrium in the radioactive series the Ra-228/Ra-226 activity of monazite will be around 18.
Isotope ratio would be not influenced by sorption and dilution process and therefore it could serve as inert tracer of input sources and preferential flow. If the source of radionuclides is localized, up the source the ratio value of radioactive isotopes would be changed only by the
151

D. Lauria and R. de Almeida
2
radionuclides decay. In that case, the isotope ratio can be a good tracer to indicate the residence time of groundwater on a timescale from months to years.
The radium isotope activity concentrations in the water samples varied from 1.1 to 23. By mapping the spatial distribution of the radium activity ratio, two areas with Ra-228/Ra-226 ratio higher than 10 are clearly delimitate (A and B, Fig. 2), showing the localization of the main source of contamination to the groundwater. From the input sources the ratio values are attenuated.
Considering that monazite sand are scattered in the region soil, weathering/dissolution of the sand by groundwater can be a spread secondary source of radium for the water, influencing the isotope ratio. Thus, the isotope ratio attenuation reflect combined effects of radioactive decay, mixing and water/rock interaction and reflect modification of groundwater chemistry at a regional scale. Further studies aiming to identify preferential flow of water and to assess the residence time are being performed and will be discuss in this paper.
FIGS. 1 and 2. Spatial distribution of pH and Ra-228/Ra-226 values in groundwaters of a coastal region.
[1] LAURIA, D.C., GODOY, J.M., Abnormal High Concentration of Radium in a Coastal Lagoon, J. Environ. Radioact. 61 2 (2002) 27-37.
286000 288000 290000 292000 294000 296000
7630000
7632000
7634000
7636000
7638000
7640000
22.94
3.53
3.46
3.693.696.54
7.15
8.027.41
7.45
9.35
4.915.44
1.076.73
4.73
6.107.374.57
4.20
13.83
10.34
5.57
0.15
3.384.132.882.887.953.223.22
4.77
4.63
6.756.65
9.442.97
6.95
4.02
10.96
18.15
4.88
4.376.67
4.183.28
4.90
5.215.21
A
B
152

EXTENDED SYNOPSIS IAEA-CN-118/85
TOPIC: HYDROLOGY
1
Environmental Isotopes and Hydrochemistry Approach to evaluate the Source of Recharge and Pollution Load in Manzala and Bardawil Lakes, Egypt
A. I. M. Alya, M. A. Hameda, S. G. Abd El- Samiea, E. A. Eweidab
a Egyptian Atomic Energy Authority, Cairo, Egypt
bFaculty of Science, Cairo University, Cairo, Egypt
E-mail address of main author: [email protected]
The present study has been conducted to evaluate the pollution load that has been exerted on two of the major lakes in Egypt; Bardawil and Manzala lakes. Bardawil lake is mainly sea water subjected to evaporation while Manzala lake is a mixture of saline water and fresh water and receives drainage water and effluents of different wastes. The study involves both environmental isotopes (18O and D), major ions, nitrate and phosphate analysis of about 75 water samples collected through horizontal and vertical profiles in the two lakes.
Bardawil lake water (the average of TDS equals to 46521 ppm) is dominated by Cl, Na and Mg salts. The distribution of the ions is controlled by the inflow from sea water, the concentration by evaporation, the precipitation due to supersaturation and the specific gravity variations. The hydrochemical composition of Manzala lake water (average of TDS equals to 2554 ppm) is less homogenous than that of Bardawil lake water and reflects the effects of several factors and recharge sources; irrigation water / drainage water discharge, waste water load, sea water or groundwater inflow, bathometry and evaporation intensity. The concentrations of nitrate and phosphate acquire considerably high values in Manzala lake which indicate a high degree of pollution and eutrophication.
The isotopic content of Bardawil lake water has average values of 3.69‰ and 28.59‰ for δ 18O and δ D, respectively. It has a relatively wide range of variation reflecting the effect of the different recharge sources (seawater, precipitation and seepage of groundwater) and the influence of the different hydrogeochemical conditions. The distribution of Bardawil lake water on δ 18O vs δ D conventional diagram, (Fig. 1) follows a linear pattern.
δ D = 4.70 δ 18O +10.31 of lower slope (4.70) than the meteoric line (slope = 8), [1]. This reflects the effect of evaporation on the occurring surface water in the lake. The starting points of the samples line (evaporation line) lie very close to Mediterranean Sea water which represent the original sources of lake water. The relative position of the water samples on the evaporation line and their deviation from the original points is a function of evaporation intensity.
The effect of evaporation on the isotopic composition of Bardawil lake water is also shown by the direct relationship between 18O and TDS, (Fig. 2). This figure shows that the correlation coefficient is low particularly in the deeper zones (bottom water) than that of surface zones (surface water). This can be related to salt precipitation after stages of supersaturation in the surface water due to excessive evaporation processes which reaches about 1.6 m/y [2].
153

A. Aly et al.
2
The isotopic content of Manzala lake water is characterized by average values of 5.07‰ and 29.79‰ for δ 18O and δ D, respectively. The frequency distribution of the isotopic values reflects the multiplicity of the recharge sources (precipitation, seawater, drainage, irrigation and groundwater). The relationship between 18O and deuterium for Manzala lake water is direct and follows a linear pattern of evaporation trend δ D = 4.76 δ 18O +7, (fig. 3). The isotopic contents of Nile water, seawater and drainage water (the recharging sources of the lake) lie close to the starting points of the evaporation line. The scatter of the points around the regression line is relatively high due to the variant proportion of the recharge sources and the different evaporation intensity. The relationship between 18O and TDS, (Fig. 4), is very weak and the pattern is not easily defined. This can highlight on the great difference of salinity between the recharging sources (due to leaching, evaporation, dissolution etc.), while the isotopic content is not so variant.
0.00 2.00 4.00 6.00
0.00
20.00
40.00
60.00
80.00
G.M.W. L.
Med. Sea rain L.Ind. Ocean rain L.
Med. Sea water at Bardawil
Suez Gulf water
Regression lineY = 4.70 X + 10.31
Delta D
Delta O-18 ‰
FIG. 1. δ 18O and δ D relationship for Bardawil surface water.
FIG. 2. TDS and delta O-18 relationship in Bardawil lake water.
0.00 2.00 4.00 6.00 8.00
0.00
20.00
40.00
60.00
80.00
Med. water line
Nile water
Drainage water
GMW L.
Paleometeoric water line
Regression lineY = 4.76 X + 7.00
Delta D
Delta O-18 ‰
FIG. 3. δ 18O and δ D relationship for Manzala surface water.
FIG. 4. TDS and delta O-18 relationship in Manzala lake water.
[1] CRAIG, H., GORDON, L., Deuterium and oxygen-18 variation in the ocean and the marine atmosphere, (TONGIORGI, E., Ed.), Stable Isotopes in Oceanographic Studies and Paleotemperature, Spoleto 9 (1965).
[2] FOSTER WHEELER, Italiana-Fosweco Div., Gebel El Maghara Rural Development Project, Final report submitted to the Governorate of North Sinai, Five volumes (1998).
154

EXTENDED SYNOPSIS IAEA-CN-118/86
TOPIC: HYDROLOGY
1
Myall Lakes – Isotope Dating of Short Term Environmental Changes in a Coastal Lake System - Anthropogenic Pressures causing Blue-Green Algae Outbreaks in a National Park
I. Fletta, H. Heijnisb, K. Harlec, G. Skilbecka
a Department of Environmental Science, University of Technology, Sydney, NSW, Australia
bANSTO – Environment, Sydney, NSW, Australia
c CSIRO Sustainable Ecosystems, Canberra, ACT, Australia
E-mail address of main author: [email protected]
The Myall Lakes system, 50 km North of Newcastle, Australia, is a barrier lake system covering 10000ha, and is brackish (ranging from Oligohaline to Mesohaline under the Venice System classification). The Myall Lakes system is far less disturbed than similar coastal lakes, and as an important migratory bird habitat, they are protected under the RAMSAR agreement. They are also fully encompassed by the Myall Lakes National Park, declared in 1972, and are important to the local tourism and fisheries industries. Only two small streams provide freshwater input therefore water-retention time is of concern, because any changes to nutrient regimes, or pollution in the catchment affecting the Lakes, may take a long time to be corrected. In recent summers a series of cyanobacteria blooms have occurred which may indicate that human activities such as agriculture and recreational boating and fishing are affecting the Myall Lakes.
Four sediment cores, up to 95cm long, were collected and sub-sampled for trace elements, palynological assemblages, sediment grain size and organic/carbonate content. Lead-210 (210Pb) was used to determine sedimentation rates and construct a chronology. Fossilised algal remains, specifically the akinetes of cyanobacteria, were used to estimate previous algal populations in the lake system. This technique has the potential to be an important tool in not only historical environmental reconstruction but also in catchment management.
Results indicate that there have been cyclical fluctuations in the populations of aquatic plants and algae throughout recent history.
155

EXTENDED SYNOPSIS IAEA-CN-118/87
TOPIC: AMS
1
VERA, a Versatile Facility for Accelerator Mass Spectrometry
A. Priller, M. Auer, R. Golser, W. Kutschera, P. Steier, C. Vockenhuber, A. Wallner, E. M. Wild, S. Winkler
VERA Laboratory, Institute for Isotope Research and Nuclear Physics, University of Vienna, Vienna, Austria
E-mail address of main author: [email protected]
The Vienna Environmental Research Accelerator (VERA) is a center for accelerator mass spectrometry (AMS) at the University of Vienna based on a 3-MV tandem accelerator of the pelletron type. Since its opening in 1996 [1, 2], VERA has undergone a number of changes converting it to an AMS facility which can now measure almost all isotopes [3, 4]. A schematic layout of the facility in its present form is shown in figure 1. Although primarily built for AMS experiments, VERA will have in future also a PIXE setup (Proton Induced X-Ray Emission), both for internal and external proton-beam experiments.
FIG. 1. Schematic layout of the VERA facility in its present form. The locations for the measurement of the three carbon isotopes for a 14C AMS measurement is indicated. Other light radioisotopes (10Be, 26Al) are measured at the respective detector positions. Heavy radioisotopes (129I, 182Hf, 210Pb, 236U, and 244Pu) are measured at the beamline including a TOF (time-of-flight) setup. The future PIXE position is also indicated.
156

A. Priller et al.
2
VERA is operated in essentially three different modes: (1) AMS 14C measurements are performed on a truly commercial basis for a company in the USA, and a full service including sample preparation, AMS measurement and 14C calibration is offered for other customers (mostly for archaeological studies). (2) Cross disciplinary research programs employing 10Be, 14C, 26Al, and 129I are pursued in collaboration with experts from many different fields (e.g. archaeology [5], art, atmospheric transport and chemistry, botany, climatology, forensic medicine [6], geomorphology, high-mountain research, hydrology, ice core research). (3) Research programs involving both instrumental and new-isotope developments are also pursued. This includes the heavy isotope extension of VERA [3] to measure 182Hf, 210Pb, 236U, and 244Pu. Novel detector developments involve low-temperature calorimetric detectors [7] and natural diamond detectors [8].
VERA can be operated fully automated for “routine” measurements of 14C, as well as manually for more exploratory experiments at the frontier of AMS. This presentation will concentrate on a few examples to demonstrate the large breadth of application with such a facility. One of these examples utilizes ocean sediments, where AMS measurements are under way to search for a possible signal from supernova-produced isotopes such as 182Hf [9] and 244Pu [10].
[1] KUTSCHERA, W., COLLON, P., FRIEDMANN, H., GOLSER, R., HILLE, P., ROM, W., STEIER, P., TAGESEN, S., WALLNER, A., WILD, E., WINKLER, G., VERA: A New AMS Facility in Vienna, Nucl. Instr. Meth. Phys. Res. B 123 (1997) 47.
[2] PRILLER, A., GOLSER, R., HILLE, P., KUTSCHERA, W., ROM, W., STEIER, P., WALLNER, A., WILD, E., First Performance Tests of VERA, Nucl. Instr. Meth. Phys. Res. B 123 (1997) 193.
[3] VOCKENHUBER, C., AHMAD, I., GOLSER, R., KUTSCHERA, W., LIECHTEN-STEIN, V., PRILLER, A., STEIER, P., WINKLER, S., Accelerator Mass Spectrometry of Heavy Long- lived Radionuclides, Int. Jour. Mass. Spec. 223-224 (2003) 713.
[4] STEIER, P., GOLSER, R., KUTSCHERA, W., PRILLER, A., VOCKENHUBER, C., WINKLER, S., VERA, An AMS Facility for “All“ Isotopes, Nucl. Instr. Meth. Phys. Res. B (in press).
[5] KUTSCHERA, W., MUELLER, W., “Isotope Language” of the Alpine Iceman Investigated with AMS and MS, Nucl. Instr. Meth. Phys. Res. B 204 (2003) 705.
[6] WILD, E.M., ARLAMOVSKY, K.A., GOLSER, R., KUTSCHERA, W., PRILLER, A., PUCHEGGER, S., ROM, W., STEIER, P., VYCUDILIK, W., 14C Dating with the Bomb Peak: An Application to Forensic Medicine, Nucl. Instr. Meth. Phys. Res. B 172 (2000) 944.
[7] KRAFT, S., ANDRIANOV, V., BLEILE, A., EGELHOF, P., GOLSER, R., KISELEVA, A., KISELEV, O., KUTSCHERA, W., MEIER, J.P., PRILLER, A., SHRISVASTAVA, A., STEIER, P., VOCKENHUBER, C., First Application of Calorimetric Low-Temperature Detectors in Accelerator Mass Spectrometry, Nucl. Instr. Meth. Phys. Res. A 520 (2004) 63.
[8] LIECHTENSTEIN, V.K., EREMIN, N.V., GOLSER, R., KUTSCHERA, W., PASKHALOV, A.A., PRILLER, A., STEIER, P., VOCKENHUBER, C., WINKLER, S., Nucl. Instr. Meth. Phys. Res. A 521 (2004) 203.
[9] VOCKENHUBER, C., FELDSTEIN, C., PAUL, M., TRUBNIKOV, N., BICHLER, M., GOLSER, R., KUTSCHERA, W., PRILLER, A., STEIER, P., WINKLER, S., Search for Live 182Hf in Deep-Sea Sediments, New Astron. Rev. 48 (2004) 161.
[10] WINKLER, S., AHMAD, I., GOLSER, R., KUTSCHERA, W., ORLANDINI, K.A., PAUL, M., PRILLER, A., STEIER, P., VOCKENHUBER, C., Anthropogenic 244Pu in the Environment, New Astron. Rev. 48 (2004) 151.
157

SAMPLE EXTENDED SYNOPSIS IAEA-CN-118/88
TOPIC: AMS
1
An 84-Year Record of 129I from Coral Skeletons in the South Pacific
D. L. Biddulph, G. S. Burr
Department of Physics and NSF-Arizona AMS Facility, University of Arizona, Tucson, AZ 85721, USA
E-mail address of main author: [email protected]
An important radionuclide tracer of nuclear processes is 129I, which has a half- life of 15.7 Myr. This nuclide can be measured by accelerator mass spectrometry (AMS). AMS measurements were made in the +5 charge state with a NEC 3MV Pelletron accelerator at the University of Arizona.
We selected a living coral from the Solomon Islands for this study, to monitor increases in anthropogenic 129I in the surface waters of the Pacific Ocean. 129I/127I ratios were measured in a core of Porites. Typical sample weights used for this study were 10g, with total iodine contents of 3ppm and a temporal resolution of one year. Iodine was extracted from the corals and AMS targets were prepared without the use of carrier iodine.
Results of our study produce an annual record from 1910-1994. 129I/127I values have increased by a factor of 20 since 1950 and are still on the rise. The implications of these measurements will be discussed.
158

EXTENDED SYNOPSIS IAEA-CN-118/89
TOPIC: MASS SPECTROMETRY
1
Isotope Selective Ultratrace Analysis of Plutonium for Environmental Studies by Laser Mass Spectrometry
S. Bürgera, R. Budaa, H. Geckeisb, G. Huberc, J. V. Kratza, P. Kunzc, Ch. Lierse von Gostomskid, G. Passlerc, A. Remmertd, N. Trautmanna
a Institut für Kernchemie, Johannes Gutenberg - Universität, D-55099 Mainz, Germany
bInstitut für Nukleare Entsorgung, FZK, D-76021 Karlsruhe, Germany
c Institut für Physik, Johannes Gutenberg - Universität, D-55099 Mainz, Germany
dInstitut für Radiochemie, TU München, D-85748 Garching, Germany
E-mail address of main author:[email protected]
Plutonium is released into the environment from various sources, like nuclear weapons tests, emissions from nuclear facilities or by accidents. The isotope ratios of a plutonium contamination reveal important information on its origin. Thus, reactor grade, weapons grade, or fallout plutonium can be distinguished. The concentration of plutonium in the environment is very low, therefore, extremely sensitive detection methods are necessary. In the last years, resonance ionisation mass spectrometry (RIMS) has been developed and applied for ultra trace detection of plutonium (106 - 107 atoms i.e. 10-16 - 10-15 g) [1]. Examples for isotope selective plutonium determination in nuclear forensic and nuclear waste repository studies will be presented.
RIMS for nuclear forensic studies: The discussion on the health risks of depleted uranium (DU) ammunition caused a series of analytical investigations, e.g., by the United Nation Environmental Programme [2]. DU ammunition was used for example in the Kosovo conflict (about 10 t DU) [3]. In collaboration with the Institut für Radiochemie, TU München, samples of DU ammunition of the Kosovo type were chemically treated and investigated with respect to their isotopic signature and content of plutonium. The 239Pu concentration in the penetrator determined by RIMS was 3.8⋅1010 atoms/g (1.5 pg/g) in good agreement with α-spectroscopic measurements. The isotope ratios correspond very well with those published by Fetter et al. [4] for weapons-grade plutonium (Table I).
TABLE I. ISOTOPE RATIOS OF PLUTONIUM IN URANIUM AMMUNITION AS MEASURED BY RIMS
Fraction of Pu as measured by RIMS [%] (3 σ error)
Fraction in weapon-grade plutonium [%] according to Fetter et al. [4]
Pu-239 93.6(5,9) 93.5 Pu-240 6.2(0,7) 6.0 Pu-241 0.09(0,03) 0.44 Pu-242 0.06(0,01) 0.015
159

S. Bürger et al.
2
Form the 241Pu fraction (T1/2 = 14.35 y) it can be concluded that the plutonium was produced ~ 33 years ago (dated 2002).
RIMS for nuclear waste repository studies: It is expected that plutonium introduced into the environment exists mainly in the 4+-state and thus is immobile. But mobile colloids can enhance the transport of plutonium in groundwater [5]. Bentonite, which is used to seal nuclear repositories, can produce colloids in contact with water. If fractures would occur in the bentonite shielding, plutonium sorbed onto bentonite colloids could enter the far field, i.e., granite, and furthermore the groundwater system. In collaboration with the Forschungszentrum Karlsruhe (FZK), migration studies of plutonium in a granitic matrix (Grimsel field laboratory, Swiss) have been performed. Figure 1 shows the tracer breakthrough curves for Pu-242 (without bentonite colloids) and Pu-244 (with bentonite colloids). The normalised concentration of plutonium in the samples is plotted versus the retention time.
FIG. 1. Tracer breakthrough curves of Pu in a granitic matrix without and with bentonite colloids.
The maximum of the tracer breakthrough curve with bentonite colloids is higher than the one without, indicating that more plutonium is transported in this granitic matrix with colloids than without. A plateau at later retention times is observed without colloids, indicating the release of retarded plutonium previously absorbed on the surface of the rock whereas with bentonite colloids, a permanent decrease of the plutonium concentration has been found.
[1] GRÜNING, C., et al., Resonance Ionization Mass Spectrometry for Ultratrace Analysis of Plutonium with a New Solid State Laser System, Int. J. Mass Spectr. (in press).
[2] UNITED NATIONS ENVIRONMENT PROGRAMME, Depleted Uranium in Kosovo - Post-conflict Environmental Assessment, UNEP (2001).
[3] BLEISE, A., et al., Properties, Use and Health Effects of Depleted Uranium (DU): a General Overview (2003).
[4] FETTER, S., et al., Fissile Materials and Weapon Design, Science & Global Security (1990).
[5] KERSTING, A. B., et al., Migration of Plutonium in Ground Water at the Nevada Test Site, Nature 397 (1999) 56-9.
160

EXTENDED SYNOPSIS IAEA-CN-118/90
TOPIC: MASS SPECTROMETRY
1
Measurement of Radioisotopes in Marine Samples by Sector Field ICP-MS
E. Wyse, S.-H. Lee, A. Rodriguez y Baena, S. Azemard, J.-C. Miquel, J. Gastaud, M. K. Pham, P. P. Povinec, S. de Mora
Marine Environment Laboratory, International Atomic Energy Agency, Monaco
E-mail address of main author: [email protected]
Inductively coupled plasma mass spectrometry (ICP-MS) is renowned for its ultra-low limits of detection for measuring trace elements. Unlike other methods of elemental analysis, mass spectrometry separates and analyzes isotopes individually. With additional sensitivity for high-mass isotopes and virtually no spectral interferences in this mass range, ICP-MS is ideally suited for actinide analysis, and has been widely used in this capacity almost since its commercial inception in the mid-1980s.
The introduction of sector field ICP-MS has further increased its advantage and thus its application in radioecological studies. Improved ion transmission has dramatically enhanced both sensitivity and instrumental precision; limits of detection in the low pg L-1 range and isotope ratio precision of 0.1% RSD are routinely achievable, making the technique more sensitive than radiometrics counting methods for many of the longer-lived actinides.
The IAEA-MEL uses sector field (SF) ICP-MS for a variety of radioecological applications. Specific examples of these applications will be highlighted.
SF-ICP-MS has been used for measuring plutonium isotopes in seawater and sediments. Samples are spiked with 242Pu as an internal quantitation standard before sample preconcentration. Special considerations include potential polyatomic interferences, which can be diagnosed via a decreased-mass peak shift. A desolvating nebulizer is used to minimize this effect. Higher resolution settings are also a possibility, however the sacrifice in sensitivity generally makes this option impractical. Table I lists as a typical example the analysis of 239Pu and 242Pu in IAEA reference materials for radionuclides in the marine environment.
SF-ICP-MS is also widely used for several projects requiring uranium information. Total uranium is typically measured in all kinds of environmental samples. A recent project investigating the transport of 234Th in seawater to assess carbon export also attempted to confirm the correlation of total uranium with salinity, as has been proposed in other studies [1]. Optimal precision and accuracy was ultimately obtained by using isotope dilution with 236U. On other projects, the 235U/238U ratio is often measured for determining possible inputs from either enriched (e.g., via the nuclear fuel cycle) or depleted (e.g., armor-piercing ballistics) sources. A special consideration for uranium isotopic analysis is the dead time of the detector, which must be accurately measured before beginning an analysis.
161

E. Wyse et al.
2
TABLE I. PU ISOTOPIC RATIOS IN IAEA REFERENCE MATERIALS (RM) FOR RADIONUCLIDES IN THE MARINE ENVIRONMENT
RM 239Pu Bq kg-1
240Pu Bq kg-1
240Pu/239Pu mass ratio
Recommended 239+240Pu* Bq kg-1
IAEA-134 9.8 ± 0.8 7.7 ± 0.6 0.212 ± 0.008 15 (13.8-16.2)
IAEA-135 127 ± 4 95 ± 4 0.196 ± 0.002 213 (205 -226)
IAEA-381 8.2 ± 0.3 7.1 ± 0.5 0.242 ± 0.022 14.2 (13.2 -15.2)
IAEA-384 103 ± 3 16 ± 1 0.049 ± 0.001 108 (105-110)
IAEA-385 1.9 ± 0.3 1.2 ± 0.1 0.178 ± 0.005 Data not yet available
IAEA-414 0.081 ± 0.008 0.049 ± 0.007 0.185 ± 0.005 0.120 (0.114-0.130)
* The recommended value (median) of the reference material represents the combined activities of 239Pu and 240Pu, measured by alpha-ray spectrometry. The 95% confidence interval is shown in parentheses.
[1] CHEN, J.H., LAWRENCE, E.R., WASSERBURG, G.J., 238U, 234U and 232Th in seawater, Earth Planet Sci. Lett. 80 (1986) 241-251.
162

EXTENDED SYNOPSIS IAEA-CN-118/91
TOPIC: MASS SPECTROMETRY
1
Pu-isotope Measurements at Femtogram Levels using Sector Field ICP-MS
P. Roos
Risoe National Laboratory, Department of Radiation Research NUK-204, DK-4000, Roskilde, Denmark
E-mail address of main author: [email protected]
A sector field ICP-MS (PlasmaTrace2) with different sample inlet systems was evaluated for its ability to measure Pu- isotopes at ultra low levels. Advantages and disadvantages in using different gas flows, sample uptake rate, sweep frequency and dwell times were evaluated both with respect to absolute sensitivity and to the precision in determining 239Pu/240Pu ratios. Also optical instrument settings were adjusted to optimise abundance sensitivity. At maximum transmission a sensitivity of 5-10 cps/ppq was achieved for 238U using a ultrasonic nebuliser.
At low and ultralow levels of Pu-analysis it is quickly realised that the main limiting factor is incomplete uranium removal from the final sample. Typical contribution of uranium to the 239Pu mass window is in the order of some tens of ppm which means that in order to be able to measure ultra low levels of 239Pu and Pu- isotopic ratios without too much interfering uranium contribution the levels of uranium in the final sample should preferably be less than a few pikogram.
Therefore, in order to be able to reliable measure femtogram levels of plutonium a robust radiochemical procedure was designed. Based upon using small volumes and a final micro ion-exchange column of ethanol-HCl, sufficient uranium removal was achieved. This procedure has the advantage of producing a final volume which is almost completely fr ee of uranium. See figure 1a and b.
The risk of interferences at masses 239, 240 and 242 and potential mass bias was investigated using a standard with a certified Pu- isotopic composition and applying it to the same chemical treatment as the samples. The whole analysis procedure was applied to the Pu- isotopic composition of a Danish soil representative for nuclear bomb test fallout which resulted in an obtained 240Pu/239Pu ratio of 0.187 ± 0.006.
The somewhat different problems arising when analysing for 234U/235U/236U/238U and 230Th/232Th is exemplified by analysis on depleted uranium and natural soils.
163

P. Roos
2
FIG. 1. Mass spectra of 233U and 242Pu before and after passing the micro ion-exchange column.
Separation of trace amount U from Pu. After column.
1
10
100
1000
10000
100000
0 10 20 30 40 50 60 70
Channel No.
Cou
nts
233U
242Pu
Separation of trace amount U from Pu. Before column.
1
10
100
1000
10000
100000
0 10 20 30 40 50 60 70
Channel No
Cou
nts
233U
242Pu
164

EXTENDED SYNOPSIS IAEA-CN-118/92
TOPIC: MASS SPECTROMETRY
1
Environmental Monitoring of Long-lived Radionuclides using Multi-Collector ICPMS
A. Gerdes, S. Weyer, G. Brey
Department of Mineralogy, JW Goethe-University, Frankfurt, Germany
E-mail address of main author: [email protected] frankfurt.de
Multi-collector Inductive Coupled Plasma Mass Spectrometry (MC-ICPMS) becomes increasingly important in monitoring environmental contamination, because it allows detection of long- lived radionuclides at ultra trace levels. High sample throughout combined with high precision and accuracy, low detection limits for most elements and simultaneous detection of up to 9 isotopes makes it prior to most other techniques. For homogeneous samples concentration and isotope composition can be determined with a precision and uncertainty of usually better than 0.5% using the isotope dilution method, e.g. isotope measurements relative to a well characterised 233U tracer.
Exposure to low-level radioactive dust released into the environment accidentally or by the use of Depleted Uranium (DU) munitions in the military theatre demands precise screening of humans and local environment. Sensitive methods are also needed for monitoring and understanding the pathway of radionuclides in the biosphere and the human body. Using a method recently developed at our department it is for instance possible to detect urinary excretion of DU in the low fg/ml range or at fractions below 0.2% of the total urinary uranium concentration. This allows to monitor the inhalation of up to a few microgram of insoluble non-natural uranium particles in the lung several months or even years later.
As example we will show and discuss results from our study of the uranium isotope composition and concentration of surface water, topsoil and dust from different sites of Baghdad, Basra, and the Suweirah farming area. We also analysed urine from people living in these areas or stayed their for a relative short time. The samples, also including highly contaminated ones, such as wipes of tank top debris and penetrator channels, were collected from the Uranium Medical Research Centre field team after coalition operation Iraqi Freedom in early October 2003. Total soil samples, separated soil fine-fractions (< 100 micrometers), dust and evaporated water samples were spiked with an 233U tracer of well-known composition and leached in hot aqua regia over more than 12 hours at about 100°C.
For the uranium-in-urine method about 500 ml were weighted, acidified with nitric acid to a pH < 2, and stirred at about 80°C on a hotplate. Uranium was co-precipitated with Ca3(PO4)2 and the precipitate rinsed several time with ultra pure water, centrifuged and redissolved in 3:1 HNO3:H2O2 mixture and heated to about 120°C for more than 12 hours in Teflon vessels in order to destroy remaining organic material. A 233U tracer were added either during weighing of the total urine volume or to a 2 g aliquot, precisely weight to ± 0.5 mg. To minimize sample contamination we used only double-distilled acids, 18 Ohm MQ H2O and reagents and beakers, which were thoroughly pre-cleaned before use. A beaker containing MQ H2O instead of urine and an in-house urine standard were always processed alongside with the samples as procedural blank and reference monitor, respectively.
165

A. Gerdes et al.
2
Uranium fractions of all samples were purified by ion-exchange chromatography using UTEVA resin before analysing with a double-focusing MC-ICPMS Neptune equipped with a retarding potential quadrupole lens and a secondary electron multiplier for ion counting. A Cetac autosampler and Aridus desolvating nebuliser were used for sample introduction. Reproducibility of the 235U/238U, 234U/238U and 236U/238U (= 4.5 x 10⁻⁸) for a 8ppb NBS950a solution (n=14) over two days were about 0.1, 0.4 and 5%, respectively. The recovery of U after chemical purification was usually better than 80% and analytical blanks for the entire soil and the urine method were below 1 and 6 picogram 238U, respectively. Signal sensitivity of 0.3-0.4 V ng-1ml, negligible 235U1H+ formation and 238U tailing below 3 x 10⁻⁸ at m/z 236 enables precise detection of 236U below 1 fg/g at 236U/238U ratios of below 3 x 10⁻⁸. Using an enrichment factor of about 500 for urine the limit of detection for 236U is about 2 x10-19 g/mL (0.2 ag/mL) and for 238U about 1 x10-14g/ml urine. Accuracy and precision were monitored using NIST SRM NBL112a and SRM 950a as well as internal urine standards of natural and depleted uranium composition. The latter were prepared from natural urine very precisely mixed with uranium solutions made of pure metals. Errors were calculated by propagating the main error sources, such as uncertainties of all applied corrections and the reproducibility of the NBL112a.
166

EXTENDED SYNOPSIS IAEA-CN-118/93
TOPIC: MASS SPECTROMETRY
1
Uranium and Plutonium Atom Ratios and Concentration Factors in Reservoir 11 and Asanov Swamp, Mayak PA
W. J. F. Standringa, P. Børretzena, D. H. Oughtona, L. K. Fifield
a Norwegian Radiation Protection Authority, P.O. Box 55, 1332 Østerås, Norway
bDepartment of Plant and Environmental Science, Agricultural University of Norway, 1432 Ås, Norway
c Department of Nuclear Physics, RSPhysSE, Australian National University, Canberra, ACT 0200, Australia
E-mail address of main author: [email protected]
Mayak Production Association, East Ural, Russia was established in the late 1940s to produce weapons-grade plutonium. Routine discharges and accidents at Mayak PA contaminated large areas with radionuclides, including the Techa River. When the scale of contamination became apparent a cascade of artificial reservoirs was constructed to store liquid wastes, hold back contamination and significantly reduce the amounts of radionuclides entering the Techa River. Reservoirs 10 and 11 (dams constructed in 1956 and 1963, respectively) are the largest: Russian total inventory estimates in 1993-1995 were 6.6 PBq and 1.2 PBq for Reservoirs 10 and 11, respectively [1]. These reservoirs are expected to have been influenced by more recent discharges from civil reprocessing. However, Techa sediments and riverbank soils, notably in the boggy Asanov Swamp downstream from Reservoir 11, are expected to contain artificial radionuclides from previous direct discharges associated with the production of weapons-grade plutonium.
The present work was designed to study atom ratios for U and Pu isotopes in water, soil, grass and aquatic biota samples collected in 1994 and 1996 from Reservoir 11 and the Asanov Swamp area. The study had three objectives: to generate new data in the form of 236U/235U atom ratios to help clarify the nuclide source characteristics in the studied areas; to confirm sediment and water 240Pu/239Pu atom ratios found in the literature for Mayak PA and supplement them with new ratios for biota samples; and lastly, to estimate concentration factors (CF) for the different biota in the studied area.
Atom ratios (236U/235U, 235U/238U and 240Pu/239Pu) were determined using Accelerator Mass Spectrometry (AMS) to confirm radionuclide source characteristics and calculate activities and concentration factors for the studied samples. 236U/235U ratios give information about nuclear fuel burn-up time; 236U/235U ratios increase from weapons to civil sources. Plutonium isotope ratios vary with reactor type, nuclear fuel burn-up time, neutron flux and energy; and from weapon type and yield after nuclear detonations. 240Pu/239Pu atom ratios enable weapons grade Pu (ratio of 0.01-0.05) to be distinguished from civil reprocessing (ratio of 0.2-0.8) and global fallout (ratio of 0.17-0.19).
Our new data shows that Asanov samples had lower 236U/235U ratios than Reservoir 11 samples: 0.0005 - 0.0045 for Asanov compared with 0.0074 - 0.0153 for Reservoir 11 indicating that Asanov samples are affected by early discharges from weapons-grade Pu
167

W. Standring et al.
2
production. Results for Pu support this: The lowest 240Pu/239Pu atom ratios were consistently found in Asanov Swamp samples (about 0.019) while 240Pu/239Pu atom ratios in Reservoir 11 were higher, indicating influence from more recent civil reprocessing. Uranium and plutonium concentration factors calculated for vegetation and biota samples at Mayak were comparable with corresponding values found in the literature.
236U/235U atom ratios
0
0.002
0.004
0.006
0.008
0.01
0.012
0.014
0.016
0.018
Water,Asanov
Apiaceae,Asanov
Juncaceae,Asanov
Soil (A),Asanov
Soil (B),Asanov
Grass (A),Asanov
Grass (B),Asanov
Water, Res. 11
Mussel,Res. 11
Pike bone,Res. 11
5 Roach,Res. 11
FIG. 1. Atom ratios for 236U/235U. Error bars show 10 % uncertainty.
240Pu/239Pu atom ratios
0
0.04
0.08
0.12
0.16
0.2
0.24
0.28
0.32
0.36
0.4
0.44
0.48
Water,
Asanov
Apiaceae,
Asanov
Juncaceae,
Asanov
Soil (A),
Asanov
Soil (B),
Asanov
Grass (A),
Asanov
Grass (B),
Asanov
Water Res.
11
Mussel Res.
11
Pike bone
Res. 11
5 Roach Res.
11
Civil
Fallout
Weapon
FIG. 2. Atom ratios for 240Pu/239Pu: expected Pu ratio-ranges for weapon grade derived, fallout derived and civil reprocessing derived Pu are also indicated. Error bars based on ± 1 s counting errors.
[1] JOINT NORWEGIAN-RUSSIAN EXPERT GROUP (JNREG), Sources contributing to radioactive contamination of the Techa River and areas surrounding the ‘Mayak’ production association, Urals, Russia. Programme of the Joint Norwegian-Russian Investigations of possible impacts of the Mayak PA activities on radioactive contamination of the Barents and Kara Seas, JNREG, Østerås (1997).
168

EXTENDED SYNOPSIS IAEA-CN-118/94
TOPIC: MASS SPECTROMETRY
1
Distribution of the Pu and Am Isotopes in the BOMARC Missile Site Soil
M. H. Lee, Y. J. Park, W. H. Kim
Nuclear Chemistry Research Division, Korea Atomic Energy Research Institute, Daejon, Republic of Korea
E-mail address of main author: [email protected]
The activity concentrations as well as the activity and atomic ratios of the Pu and Am isotopes in different sizes of the soil sampled around BOMARC Missile Site were obtained by radiochemical analysis. The association pattern between the actinides and soil particles was investigated using a spherical model of a particle size with a variable radius. From the activity and atomic ratios of Pu and Am, the origin of the Pu and Am isotopes was identified in the BOMARC Missile Site soil.
Plutonium is one of the transuranic elements which is primarily present in the environment as a result of human activity, namely as the fallout from nuclear weapon testings during the late 1940s through to the early 1960s, and accidental releases due to military mishaps. One particular mishap occurred in 1960 at McGuire Air Force Base in New Jersey, when a Boeing Michigan Aeronautical Research Center (BOMARC) missile caught fire and the warhead was partially melted by the fire. Although the missile did not explode, subsequent fire fighting activities contributed to the dispersion of weapons grade plutonium into the local environment.
Soil samples around BOMARC site were taken to a depth of 2 inches by the U.S. Air Force Institute for Environment. The soil samples were blended and homogenized in a soil tumbler, and subdivided into approximately 20-gram samples. Grain size fractions were determined with sieves. Determination of 239,240Pu, 238Pu, 241Pu, 241Am and 238U was performed using a radiochemical method. After adding 242Pu, 243Am and 232U tracers, a total of a 2 g ashed soil sample was dissolved with concentrated HNO3 and HF and evaporated to dryness. Dissolution in HNO3/HF was repeated and again evaporated to dryness. The residue was dissolved in 9 M HCl. After filtration, the solution was passed over an anion exchange column (chloride form) to which the Pu was sorbed. The columns were washed with 9 M HCl followed by 8 M HNO3. This effluent was evaporated to dryness and reserved for subsequent separation of the Am and U isotopes. Pu was eluted with 0.36 M HCl / 0.01 M HF. The Am and U residue was dissolved in 2 M HNO3. Samples were loaded onto TRU Spec columns, after the TRU columns were conditioned with 2 M HNO3. The columns were washed with 2 M HNO3 and 9 M HCl. The Am fraction was eluted with 4 M HCl. U was eluted with 0.1 M ammonium oxalate solution. The Am fraction was purified with anion exchange resin that had been previously conditioned with 1 M HNO3 – 93% CH3OH. The purified Pu, Am and U isotopes were electroplated on stainless steel platelets and measured by an alpha spectrometer. For measuring the
241Pu, Pu isotopes electrodeposited onto the stainless steel planchet were
dissolved in 8 M HNO3 and purified with an anion exchange column. The purified Pu
isotopes were subjected to the 241
Pu measurement by a low background liquid scintillation
169

M. Lee et al.
2
counter. Also, the atomic ratios of 240
Pu/239
Pu were measured by a high resolution inductively coupled plasma mass spectrometry.
The activities of 239,240Pu and 241Am were apparently increased with a decreasing particle size of soil due to an increasing surface area, and the fitted values for these isotopes were correlated well with actual measured values (239,240Pu; 0.994, 241Am; 0.992). This result suggests that most of the Pu and Am isotopes are fixed to the soil as a surface coating. The fitted values of 238U did not correlated well with the measured activities of 238U (R2 ; 0.588), which implies that a significant fraction of the U may be partitioned into the soil matrix rather than sorbed onto the particle surfaces.
The activity ratios of 238
Pu/239,240
Pu in different particle sizes of the BOMARC soil were found to be in the range of 0.018 to 0.033 with a mean value of 0.024, which is lower than the reported value (0.04) influenced by the SNAP-9A satellite accident in 1964. The activity ratios of
241Pu/
239,240Pu and
241Am/
239,240Pu were measured in the range of 2.87 to 3.52 and
0.15 to 0.24, respectively. These values are a little lower than the recently reported activity ratios influenced by the fallout from the nuclear weapons test. Also, the atomic ratios of 240
Pu/239
Pu in the BOMARC soil were found to be in the narrow range of 0.0559 to 0.0594 with a mean value of 0.0576, which is close to the value (0.05) of the weapon grades plutonium rather than the fallout value (0.18) influenced by the nuclear weapons test. Therefore, as a result of the activity ratios of
238Pu/
239,240Pu,
241Pu/
239,240Pu and
241Am/
239,240Pu
as well as the atomic ratios of 240
Pu/239
Pu, the Pu and Am isotopes detected in the BOMARC soil originated from the weapons grade plutonium rather than the nuclear weapon testings.
170

EXTENDED SYNOPSIS IAEA-CN-118/95
TOPIC: MASS SPECTROMETRY
1
Detection of Reprocessing Activities through Stable Isotope Measurements of Atmospheric Xenon by Mass Spectrometry
F. Pointurier, J.P. Fontaine, S. Baude, R. Chiappini
Commissariat à l’Energie Atomique (CEA), DIF/DASE/SRCE, Bruyères-le-Châtel, France
E-mail address of main author: [email protected]
It has been proved that noble gases stable isotope abundance measurements provide a tool for detecting reprocessing activities of nuclear fuels [1-3]. Gas releases will significantly modify the natural isotopic ratio of xenon in the air surrounding the nuclear material. Moreover, it has been shown that specific parameters such as burn-up and reactor type can be determined thanks to high precision mass spectrometry [4, 5]. Nevertheless, these high cost instruments require skilful staff and tedious analytical procedures. On top of that, concentration of xenon from the air is needed as initial xenon concentration in the sample is below 100 ppb. The aim of the work presented here is to carry out simple, fast and accurate xenon isotopic abundance measurements on air sampled at atmospheric pressure in the vicinity or inside a nuclear facility. Moreover, these measurements must be performed without purification and pre-concentration by gas chromatography, with a mass spectrometer available in our laboratory, easy to handle for us and at a reasonable cost.
Until now, attempts for xenon isotopic measurements by quadrupole mass spectrometers with electron impact source have not been successful [6, 7] because of a lack of accuracy, a lack of sensitivity or elevated background noise of those instruments. As a matter of fact, we had disappointing results with our first trials in our laboratory with a quadrupole mass spectrometer Hiden HPR-20 (Warrington, England) dedicated to gas analysis and equipped with an electron impact ion source. The xenon isotopic abundance measurement is hindered due to a lack of sensitivity and interferences arising from organics. Therefore, we tested other types of mass spectrometers with various ion sources available in the laboratory, especially ICP-MS (Inductively Coupled Plasma - Mass Spectrometer), which is largely used in the laboratory for low-level actinide measurements. As the induction plasma is a powerful ionization source, ICP-MS has a great potential for noble gases isotopic measurements [8]. Furthermore, introduction of gaseous samples can be performed easily through a simple modification of the sample introduction system.
The authors will discuss performances, advantages and limitations of these various types of mass spectrometers for isotopic abundance measurements for xenon, and, in the special case of ICP-MS, will give estimations of the ionization efficiency of xenon depending on plasma physical parameters. Besides, measurement of accurate xenon isotopic ratios requires correction from polyatomic and isobaric interferences, especially hydrides of xenon, and correction for the mass discrimination phenomenon. Therefore, the authors will present a method for interferences and mass discrimination correction. Moreover, the authors will also evaluate the extent of the memory effect and give details of calculation with uncertainty budget.
171

S. Baude et al.
2
[1] OHKUBO, M., Gaseous isotope correlation technique for safeguards at reprocessing
facilities, IAERA-STR-240, International Atomic Energy Agency (1988). [2] CHAPMAN, T.C., Noble gas, a potential nuclear proliferation indicator, Trans. Am.
Nucl. Soc. 68 (1993) 70-71. [3] NAKHLEH, C.W., PERRY, R.T., POTHS, J., STANBRO, W.D., WILSON, W.B.,
FEAREY, B.L., Noble gas atmospheric monitoring at reprocessing facilities, LA-UR-97-705, Los Alamos National Laboratory (1997).
[4] AREGBE, Y., MAYER, K., VALKIERS, S., DE BIEVRE, P., Detection of reprocessing activities through stable isotope measurements of atmospheric noble gases, Fresnius J. Anal. Chem. 358 (1997) 533-535.
[5] AREGBE, Y., MAYER, K., VALKIERS, S., DE BIEVRE, P., Release of anthropogenic xenon to the atmosphere: a large-scale isotope dilution, Int. J. Mass Spectr. Ion Proc. 154 (1996) 89-97.
[6] AREGBE, Y., MAYER, K., VALKIERS, S., DE BIEVRE, P., Comparative isotopic measurements on xenon and krypton, Int. J. Mass Spectr. Ion Proc. 163 (1996) L1-L5.
[7] LEBRUN, A., BIGNAN, G., MITTERAND, B., LEMIERE, B., Faisabilité de la determination du taux de combustion des assemblages au cours du cisaillage en tête d’usine de retraitement par la mesure des rapports isotopiques des gaz rares de fission, Note Technique CEA/DRN/DER/SSAE 97/0042 (1997).
[8] POTHS, J., CHAMBERLAIN, E.P., A high efficiency ion source for Kr and Xe isotopic measurements, Int. J. Mass Spectr. Ion Proc. 146/147 (1995) 47-54.
172

EXTENDED SYNOPSIS IAEA-CN-118/96
TOPIC: MASS SPECTROMETRY
1
Matrix Effects during Magnetic Sector-field Inductively Coupled Plasma Mass Spectrometry Uranium Isotope Ratio Measurements in Complex Environmental/Biological Samples
C. R. Quétel, E. Ponzevera, I. Tresl, E. Vassileva
European Commission Joint Research Centre, Institute for Reference Materials and Measurements, Retieseweg 111, B-2440 Geel, Belgium
E-mail address of main author : [email protected]
Sample matrix effects on mass discrimination during inductively coupled plasma mass spectrometry (ICP-MS) isotope ratio measurements are rarely reported. However, they can lead to errors larger than the uncertainty claimed on the ratio results when not properly taken into account or corrected for. For instance, up to 1% matrix specific effects were experienced during an isotope dilution mass spectrometry campaign we carried out for the certification of the Cd amount content in some food digest samples (7% acidity and salt content around 450µg g-1) [1].
Specific nuclear safeguards programs were designed for the monitoring of declared and non-declared nuclear activities and important efforts are currently deployed to better understand the consequences on human health of the dispersion of depleted uranium in the environment. The interest in developing and/or improving measurement capabilities for uranium isotope ratios and uranium content in environmental and biological samples has therefore considerably increased in the last decade [2]. However, procedure validation is rarely addressed with these developments even though, for instance, non-disputable uncertainty statements are absolutely crucial to underpin correctly the important decisions of political, economical, military or medical nature that can arise from these results. This is why we produced simulated urine samples (complex matrix made of organic and inorganic components) with certified n(234U)/n(238U), n(235U)/n(238U) and n(236U)/n(238U) ratios. These, which will eventually be commercially available for validation purposes, will first be used as test materials for an international interlaboratory comparison organised by IRMM and this exercise, named NUSIMEP-4 and open for participation to anyone [3].
This presentation will introduce magnetic sector- field inductively coupled plasma mass spectrometry (ICP-MS) uranium isotope ratio measurements on real human urine samples and in the NUSIMEP-4 test materials. These were carried out respectively with two different types of instruments, a single detector (SD) “high resolution” ICP-MS and a multiple collector (MC) ICP-MS. Our results illustrate the importance of carefully adapting the sample preparation and measurement calibration strategies to meet the uncertainties targeted for the end results. The analytical protocol originally developed included a microwave assisted acid digestion step, a matrix separation step by extraction chromatography on U-TEVA resin and an acquisition step by SD-ICP-MS using the IRMM-184 isotopic certified reference material to correct externally for mass discrimination effects. This combination proved to be fit for the purpose of getting ~ 2.5% combined uncertainty (U, k = 2) on n(235U)/n(238U) ratio determination in real human urine samples at ultra low uranium levels (~ 5 – 20 pg g-1) [2]. The same protocol was investigated for MC-ICP-MS measurements and simulated urine
173

C. Quetel et al.
2
samples containing ~ 250 to 1000 times more uranium. Repeatability on MC-ICP-MS measurements can be as good as 0.02% (simultaneity of the signal acquisition) and thus the expectation was that this would result into an important reduction of the overall measurement uncertainty. However, our results show that it is not possible to get even 0.2% U. As described in the Figure below, this is mostly due to uncorrected small size matrix effects becoming “visible” thanks to the performance achievable with the MC-ICP-MS. Hence, the strategy of sample preparation and/or of instrument calibration must be reviewed to account for these effects, correct for them and quantify the uncertainty arising from these corrections.
FIG. 1. Comparison of results obtained for different types of sample matrices, and corrected for mass discrimination in 2 different ways: first, with IRMM184 in matrix -matching conditions (black diamonds), second with IRMM184 in 3% HNO3 matrix (blue squares). The two results obtained for Mixt-X1 are superposed.
[1] Spectrochim. Acta Part B 58 (2003) 1553-1565. [2] Environ. Sci. Techn. 38 (2004) 581-586. [3] WELLUM, R., et al., NUSIMEP: an external QC programme for measuring nuclear
isotopes in environmental samples (these proceedings).
0.993
0.995
0.997
0.999
1.001
1.003
1.005
No
rmal
ized
n(23
5 U)/
n(23
8 U)
Mixt X-0Measured byGSMS
Mixt X-13% HNO3
Mixt X-2MW digest+ UTEVA
Mixt X-3MW digest+ Evaporation
Mixt X-4Diluted urine
Typical Uc = 0.05% (k=2)
Reference value
174

EXTENDED SYNOPSIS IAEA-CN-118/97
TOPIC: MASS SPECTROMETRY
1
Uranium and Thorium Isotopic Determination in Environmental Samples by ID-FI-ICP-MS
M. L. Godoya, J. M. Godoya, b, L. A. Roldãoa
a Instituto de Radioproteção e Dosimetria, Comissão Nacional de Energia Nuclear, Caixa Postal 37750, 22780-160, Rio de Janeiro RJ, Brazil
bDepartamento de Química, Pontifícia Universidade do Rio de Janeiro, 22453-900, Rio de Janeiro RJ, Brazil
E-mail address of main author: [email protected]
Direct uranium isotopic determination by ICP-MS on sweeps samples have been successfully tested on interlaboratory exercises carried out by the US-DOE. However, to determine uranium (238U, 235U and 234U) and thorium (232Th and 230Th) isotopic composition in environmental samples it is necessary to include analytical steps aiming the matrix separation and the pre-concentration of these radionuclides. On the other hand, there is a need to reduce the manpower involved on our laboratories. Therefore, the use of the flow injection technique coupled to a quadrupole ICP-MS was investigated due its potential further automation. 229Th and 236U were used as isotopic tracers and UTEVA (Eichrom Technologies Inc.) cartridges were applied as a tool for uranium and thorium concentration and matrix separation. About 10 mL sample solution (3M HNO3) is pumped through the cartridge, follows a washing step, also with 3M HNO3, and uranium and thorium are eluted together using a 0.05 M ammonium oxalate solution.
Due to its short half- life, the method was tested for 234U and 230Th determination. It was used a standard reference soil sample (IAEA-327), with 31.9 Bq kg-1 234U and 34.1 Bq kg-1 230Th. Four one gram aliquot samples were taken and completely dissolved by HNO3/HF/HClO 4 and tetraborate fusion of the remaining residue. The observed mean concentrations were 34.6 Bq kg-1 and 31.5 Bq kg-1for 234U and 230Th, respectively, with a bias of 8.6% and –7.6% and a relative standard deviation of 2% for both radionuclides.
Six blank samples, including the 229Th and 236U spikes, were analyzed and, based on the observed results, the detection limit (LD), the quantification limit (LQ) and the background equivalent concentration (BEC) were calculated. The results, for one gram sample, are shown below (Table I).
175

M. Godoy et al.
2
TABLE I. ACHIEVED DETECTION LIMIT (LD), QUANTIFICATION LIMIT (LQ) AND BACKGROUND EQUIVALENT CONCENTRATION (BEC), BASED ON ONE GRAM SAMPLE
Radionuclide LD LQ BEC
230Th 0.45 pg g-1; 0.35 mBq g-1 1.5 pg g-1; 1.2 mBq g-1 1.2 pg g-1; 0.86 mBq g-1
234U 0.22 pg g-1; 0.05 mBq g-1 0.75 pg g-1; 0.17 mBq g-1 0.56 pg g-1; 0.13 mBq g-1
The developed procedure were applied to five grams aliquots of three different samples of Anadara notabilis (Roding, 1798) shells taken from the from Araruama Lagoon, Rio de Janeiro, and 230Th/234U ages of 3450, 3550 and 3900 years were obtained, what corresponds to the Holocene period and are coherent with the known origin of the lagoon [1].
[1] TURCQ, B., MARTIN, L., FLEXOR, J.M., SUGUIO, K., PIERRE, C., TASAYCO-ORTEGA, L., "Origin of the Quaternary Coastal Plain Between Guaratiba and Cabo Frio, State of Rio de Janeiro, Brazil", The Fluminense Lagoons (BIDONE, E., KNOPPERS, B., Eds), Universidade Federal Fluminense Press, Niteroi, Brazil (1999) (ISBN 8587468014).
176

EXTENDED SYNOPSIS IAEA-CN-118/98
TOPIC: MASS SPECTROMETRY
1
Determination of Bromine Stable Isotopes in Inorganic Samples using Continuous-Flow Isotope Ratio Mass Spectrometry
O. Shouakar-Stash, R. J. Drimmie, S. K. Frape
Department of Earth Sciences, University of Waterloo, Waterloo, Ontario, N2L 3G1, Canada
E-mail address of main author: [email protected]
A new methodology for bromine stable isotope determination by Continuous-Flow Isotope Ratio Mass Spectrometry (CF-IRMS) was developed. The technique was investigated on inorganic samples. The system used in this study is an IsoPrime IRMS, with capabilities of both Dual-Inlet and Continuous-Flow modes coupled with HP 6890 Gas Chromatography (GC) and equipped with a CombiPAL autosampler.
Isotopic characterization of bromine isotopes could be a powerful tool of determining sources of formation waters and determining geological and hydrogeological processes especially if it is used in conjunction with other isotopes such as chlorine stable isotopes.
There are two different techniques currently used for bromine stable isotope determination, dual- inlet IRMS [1] and Thermal Ionization Mass Spectrometry (TIMS) [2]. This study represents the first attempt to measure bromine stable isotopes by using a CF-IRMS technology.
In this technique, the bromine isotopic composition is being determined by analyzing methyl bromide (CH3Br) gas. CH3Br gas is prepared by reacting 1 mg of silver bromide (AgBr) with 100 µL of methyl iodide (CH3I) in 20 ml gas tight amber vials. CH3I is added to the vials in a glove bag flushed with helium few times and kept filled with helium during the course of vial preparation by applying a steady flow of helium to the glove bag. Once vials are prepared, they are placed in an oven at 80°C for 48 hours for the reaction to occur. Once the reaction is completed, vials are moved to the autosampler tray and analyzed for bromine stable isotope determination. 400 µL of sample is injected into the GC, where CH3Br is separated from CH3I using a DB-5MS capillary column (Length 60 m, ID 0.32, Film 1µm). Separated CH3Br gas is passed to the IRMS to be measured for bromine stable isotopes, while CH3I is directed to the FID on the GC.
Due to the toxicity of the CH3Br gas used for the analysis of bromine stable isotopes, one of the reservoirs on the dual- inlet system is used to provide the reference gas, instead of using a reference gas tank.
The precision achieved in this study using this new technique compares very well with the previous two techniques with a standard deviation better than 0.13 ‰.
177

H. Shouakar-Stash et al.
2
[1] EGGENKAMP, H.G.M., COLEMAN, M.L., Rediscovery of classical methods and their application to the measurement of stable bromine isotopes in natural samples, Chem. Geology 167 (2000) 393-402.
[2] XIAO, Y.K., LIU, W.G., QI, H.P., ZHANG, C.G., A new method for the high precision isotopic measurement of bromine by thermal ionization mass spectrometry, Int. J. Mass Spectrom. Ion Proc. 123 (1993) 117-123.
178

EXTENDED SYNOPSIS IAEA-CN-118/99
TOPIC: MASS SPECTROMETRY
1
Improving High-Resolution Analysis of Corals using LA-ICP-MS: Matrix Limitations of the 266 nm Wavelength Unit
T. Sawyer
Scottish Association for Marine Science, Dunstaffnage Marine Laboratory, Oban, Argyll, Scotland, PA37 1QA, U. K.
E-mail address of main author: [email protected]
Laser ablation inductively coupled plasma mass spectrometry (LA-ICP-MS) can be used to determine the trace elements and isotope ratios of various matrices in bulk or spatially-resolved analysis. As sample resolution is high (~10 µm) it is possible to obtain simultaneous analysis of a suite of isotopes within single growth bands of marine skeletal CaCO3 based organisms such as coral. This allows the determination of various environmental tracers within a single coral skeleton such as Sr/Ca and Mg/Ca isotopes for past temperature records, Ba/Ca ratios for oceanic upwelling events and fresh water inputs and Pb isotopes for assessing historical environmental inputs.
This poster addresses two main questions relating to the SAMS LA-ICP-MS set up. Firstly, can we obtain accurate isotope ratios of coral and secondly, is it possible to determine accurate quantitative concentrations of trace elements.
A variety of laser ablation systems exist using different wavelengths such as the Nd:YAG 266 nm, 213 nm and excimer 193 nm. Each system exhibits different ablation behaviour during analysis such as non-stoichiometric ablation (elemental fractionation) and matrix matching depending on the sample type 1,2. The Nd:YAG 266 nm has been shown to accurately determine trace elements in silicate matrices, when matrix-matched standards are applied. There has been evidence that this wavelength does not produce accurate data of CaC03 based material when silicate glass standards have been used 3, 4. To date, there are no commercial matrix matched standards available for corals.
The extent of these inaccuracies has been determined by analysing a pressed pellet of coral material with a 266 nm laser and calibrating it against silicate glass standards (NIST 612 and 610) and comparing this to the solution ICP-MS data of the same sample. The pressed pellet of coralline material was produced by The United States Geological Survey (USGS) yet is still in the testing stage; elemental concentrations and homogeneity are not yet certified. The solid state analysis has then been compared to that determined using matrix-matched calibration standards. This same format of analysis has also been applied to a thin section of coral. Both illustrate the necessity to matrix match the calibration standards with the sample to determine accurate, fully quantitative data. However, not all elements respond to the matrix matching in the same way for example, Cr, Sr, Ba, Ce, and Sm are consistently at least 2 orders of magnitude greater in concentration when calibrated with the NIST glasses, yet are in close agreement with other laboratories* concentrations when calibrated with a matrix matched standard. Other elements such as Cu, Zn and Cd appear to be less affected by the matrix (Table I.).
179

T. Sawyer
2
TABLE I. COMPARISON OF ELEMENTAL CONCENTRATIONS OF THE CORAL PELLET (MACS1) BETWEEN THE INTRALABORATORY STUDY AND THOSE DETERMINED BY THE SAMS 266 NM LASER USING MATRIX MATCHED AND SILICATE GLASS STANDARDS FOR CALIBRATION. CONCENTRATIONS IN µg g-1.
Coral Pellet ID 52Cr 65Cu 66Zn 86Sr 111Cd 138Ba 140Ce 147Sm
Intralaboratory data 130.2 164.4 104.8 164.5 114 101.9 134.3 13
Matrix matched calibration 132.9 168.7 106.7 166.2 111.6 102.4 134.6 12.78
NIST glasses calibration 349.6 155.8 134.8 370.8 168.3 424.8 297.3 414.6
The Sr/Mg ratios of coral samples have been determined by solution ICP-OES and LA-ICP-MS. The comparison of these generated isotope ratios is discussed.
*Selected laboratories are taking part in an intralaboratory study analysing a coralline pressed pellet prepared by USGS using 5 different analytical techniques.
[1] HORN, I., GUILLONG, M., GÜNTHER, D., Wavelength dependant ablation rates for metals and silicate glasses using homogenised laser beam profiles – implications for LA-ICP-MS, Appl. Surface Sci. 182 (2001) 91-102.
[2] GUILLONG, M., HORN, I., GÜNTHER, D., A comparison of 266 nm, 213 nm and 193 nm produced from a single solid state Nd : YAG laser for laser ablation ICP-MS, J. Analyt. Atomic Spectr. 18 10 (2003) 1224-2003.
[3] BELLOTTO, V.R., MIEKELEY, N., Improvements in calibration procedures for the quantitative determination of trace elements in carbonate material (mussel shells) by laser ablation ICP-MS, Fresnius J. Anal. Chem. 367 (2000) 635-640.
[4] SINCLAIR, D.J., KINSLEY, L.P., MCCULLOCH, M.T., High resolution analysis of trace elements in corals by laser ablation ICP-MS, Geochim. Cosmochim. Acta 62 11 (1998) 1889-1901
180

ABSTRACT IAEA-CN-118/100
TOPIC: MASS SPECTROMETRY
1
Critical Evaluation of an Isotope Dilution ICP-MS method for the Measurement of the Fe Content in Seawater
I. I. Petrov, C. R. Quétel, P. D. P. Taylor
European Commission Joint Research Centre, Institute for Reference Materials and Measurements, Retieseweg 111, B-2440 Geel, Belgium
E-mail address of main author: [email protected]
It is well known that direct analysis of seawater by means of inductively coupled plasma mass spectrometry (ICP-MS) is hardly possible because of the salt load in the samples. Determination of the element content at ultra-trace level in open-ocean water requires a separation from the matrix associated to significant concentration factors. For iron, an isotope dilution (ID) ICP-MS method was proposed [1] based on a multiple steps protocol, including a co-precipitation with magnesium hydroxide after ammonia loading and consecutive dissolution with hydrochloric acid. To be able to measure the iron content in the low pg g-1 range a correct assessment of the analytical procedural blank is of crucial importance. Not only this blank must be low, but also realistic (i.e. based on complete analytical sequence applied to real iron free seawater) and reproducible. This is particularly difficult considering the ubiquity of iron and the complexity of the seawater matrix and, despite years of experiments and publications, this remains a fundamental analytical challenge and a great source of complexity for the realisation of reliable profiles of dissolved iron data.
The present study considers different approaches we developed to assess, in a realistic way, the procedural blank of the IDMS method proposed by Wu and Boyle [1]. Our aim was to reproduce the full set of experimental steps involved in the determination of iron in seawater by IDMS at the nM level or below. Our results are evaluated in the light of those claimed by Wu and Boyle [1] who use ~4%-sample volume for their procedural blank determination. The results they present are rather convincing. However, downsizing by a factor of ~25 the sample volume not only minimises sample-tube contact and labware contribution to the blank, but results as well in a different set of operations and manipulations. These changes in the analytical protocol can easily lead to non-realistic procedural blank values. This is illustrated in the Figure at the end, where we reported our findings in term of relative contributions to our procedural blanks. Manipulations are by far the largest contributor as they contribute for ~ 50% of the total. Reagents, and particularly the nitric acid used to acidify the sample, and instrumental background come after with respectively nearly 25% and 20% of the contributions.
The ICP-MS measurements were performed by means of a single collector double focusing instrument ThermoFinnigan Element2 at medium mass resolution, to resolve the isobaric interferences from argon-oxide based ions on iron isotopes. ‘Mass offset’ and ‘Lock Mass’ settings of instrument software were enabled. Obtained data were filtered by means of a spreadsheet program to remove peak spikes, which were not associated to the analyte but to matrix effects. Data were then further processed as described by Tresl et al. [2] to avoid generating biases associated to the software peak integration routine.
181

I. Petrov et al.
2
Apart from the centrifugation and the ICP-MS steps all the experiments were carried out under class-10 ultra-clean room conditions. Only ultra-pure reagents and water were used for sample preparation and treatment. Multisteps-procedure, including diluted ethanol, nitric and hydrochloric acid, and ultra-pure water, was applied for labware cleaning prior to its usage for sample preparation.
FIG. 1. Breakdown of the relative contributions to the blank corresponding to analytical procedure implemented for the determination of Fe in seawater.
[1] WU, J., BOYLE, E.A., Determination of iron in seawater by high-resolution isotope dilution inductively coupled plasma mass spectrometry after Mg(OH)2 coprecipitation, Anal. Chimica Acta 367 (1998) 183-191.
[2] TRESL, I., QUÉTEL, C.R., TAYLOR, P.D.P., Solution to data integration problems during isotope ratio measurements by magnetic sector inductively coupled plasma mass spectrometer at medium mass resolution: application to the certification of an enriched 53Cr material by isotope dilution, Spectrochim. Acta B 58 (2003) 551-563.
Procedural Blank components
0
10
20
30
40
50
60
Labw
are NH3Cen
tr
2% HN
O3
manipu
lations
Instr b
ackgro
und
Component
% o
f to
tal P
roce
du
ral B
lan
k
Component % of totalLabware 9NH3 4Centr 02% HNO3 19manipulations 49Instr background 19
182

EXTENDED SYNOPSIS IAEA-CN-118/101
TOPIC: IN SITU TECHNIQUES
1
Remote Sensing of Intertidal Sediment Bound Radionuclide Storage, Remobilization and Deposition: Case Study in the Ribble Estuary
A. Tylera, R. Wakefielda, P. McDonaldb, M. Raineya, P. Atkinb a School of Biological and Environmental Sciences, University of Stirling, Stirling, FK9 4LA Scotland, UK
bWestlakes Scientific Consulting Ltd, Westlakes Science & Technology Park, Moor Row, Cumbria, CA24 3LN UK
E-mail address of main author: [email protected]
Intertidal environments of the Irish Sea are spatially complex and dynamic systems. The ability to understand and monitor these environments is fundamental to a variety of industrial, regulatory and government bodies. Intertidal estuarine environments often represent sinks and sources for industrial discharges. The ability to map the fate of these discharges through remote sensing provides a powerful tool in environmental monitoring and is critical in understanding their redistribution. This study focuses on the Ribble estuary, Lancashire, UK, which is accumulating elevated radionuclide concentrations discharged under license from BNFL Sellafield and Springfields. This paper presents the results from a series of investigations which demonstrate: i) that conventional airborne remote sensing using the Airborne Thematic Mapper (flown by the UK’s Natural Environment Research Council) combined with sophisticated image analysis and ground truthing could be used to quantitatively map intertidal specific activity concentrations of anthropogenic radionuclides derived from BNFL Sellafield (r2>0.8); and ii) that time series imagery flown over tidal sequences can be used to identify sources of radionuclide bearing sediments, characterise the hydrodynamic features of the estuary and quantify fluxes of sediment and radionuclides over tidal cycles.
183

EXTENDED SYNOPSIS IAEA-CN-118/102
TOPIC: IN SITU TECHNIQUES
The Use of Sodium Iodide Detectors to locate Buried Radioactive Particles in the Seabed off Dounreay Nuclear Facility
J. Toolea, M. Liddiarda, J. Cassidyb
a United Kingdom Atomic Energy Authority, Dounreay, UK
b Fathoms Ltd, Somerset, UK
E-mail address of main author: [email protected]
Following their accidental discharge in the 1960s, small fragments of radioactive fuel reside in the nearshore sediments off the fast breeder nuclear facility at Dounreay in the north coast of Scotland. As part of a wider programme of site decommissioning and environmental clean-up, UKAEA have invested heavily in monitoring and retrieving particles from the beach and offshore environment. Over 1000 particles have so far been safely retrieved. The majority of these have been retrieved by divers using hand-held plastic scintillator probes to locate them. In recognition of the continuing risk to divers in this difficult environment, UKAEA are now testing the effectiveness of low-resolution detectors (sodium iodide) to locate and map particles in the seabed.
Between the 1st and 16th of September 2003, Fathoms deployed a frame-mounted sodium iodide gamma detector in the offshore environment at Dounreay. In several different survey areas, nearly 1300 gamma spectra were obtained. The detector was used in static mode for this trial, although it is recognised that this is not an efficient way of locating dispersed particles.
Measurements taken in an area where towed plastic detectors had found large variation in total count rates (termed the ‘anomalous zone’) showed that there was a direct correlation between gross (total) counts and the relative contributions from KUT (40K, U-series and Th-series radionuclides). Thus, large caches of particles are not responsible for the factor of 3-4 increase in count rate in this area.
General background count rates over a wide area appear to be quite constant over open sand, ~ 50-70 cps for the counting geometry used. Count rates can be lower or higher than this in other areas e.g. near rock outcrops (100 cps) and over different sediment types (20 – 120 cps). Natural variations in KUT content can raise the count rate to at least 250 cps e.g. in the ‘anomalous zone’. When the detector was set to approach a shallow buried particle, the gross count rate climbed to hundreds of cps at around 40 cm distance and reached tens of thousands of cps immediately above the particle. A peak due to 137Cs was preserved in the spectra, acquired over 3 minutes, out to a distance of 45 cm and provided unambiguous particle identification – Figure 1. Particle detection was provided to greater offset distances, but without a 137Cs peak is not unambiguous given the natural variations in background count rates.
1 184

J Toole et al.
2
0.0 0
10^1
10^2
10^3
10^4
10^5
10^6
10^7
10^8
10^9
FIG. 1. Gammbackground spe
Using the detleast as sensitartificial radiois moved intorecorded for seabed, settingprovide an opROV to be August/Septempresentation.
Backscatter
a spectrum of a buctrum. Log scalin
ector system in ive as the diver’snuclides. In alarm the edge of the the duration of up the system
portunity to mapequipped with ber 2004 and
137Cs
1000.0
ried Particg. Counts n
an ‘alarm’ probe but mode, th
radiation fthe triggerin alarm m particle la much
some resu
Sum peak
le at various offsormalised to 180
mode demon with the addede device will trield around a b. Controlling tode and using
ocations. Fatholarger detecto
lts from this w
40K
2000.0 3000.0 (keV)
ets: 0, 15, 30, 45cm and comparison with seconds acquisition.
strated it’s high sensitivity; it was as benefit of discriminating natural and igger almost immediately the detector uried particle and a spectrum will be he movement of a detector over the a larger sodium iodide detector will ms are now building an inexpensive r. Offshore trials are planned for ork could also be available for this
185

EXTENDED SYNOPSIS IAEA-CN-118/103
TOPIC: IN SITU TECHNIQUES
Device Development for Marine Gamma Survey of Seabed on Azerbaijani Section of Caspian Sea
Z. Bayramov
Azerbaijan National Aerospace Agency, Baku, Azerbaijan Republic
E-mail address of main author: [email protected]
To explore the potential of isotope techniques for studying water balance and dynamics of the Caspian Sea two research training cruises were carried out, in late summer of 1995 and 1996, respectively, within the framework of an IAEA technical co-operation project [1]. Unfortunately during these expeditions there is a highly important aspect of the problem of maintaining of ecological balance which is covered insufficiently. This is a composition of seabed's radiational situation map. This question gains the special importance for exploitation of closed systems, which include also the Caspian Sea. The problem is that the Caspian Sea unlike to other water basins possessing rich deposits of hydrocarbon raw materials (e.g. the Mexican Gulf, the North Sea, the Persian Gulf), is a closed type bio-ecological system, where the rigid balance of hydrosphere, biosphere and especially of geological structure of seabed is existed. The violation of any of these components can lead to practically irreversible processes, and as a result, to ecological catastrophe. Realization of gamma survey of seabed makes it possible to determine initial background of seabed's gamma field at the beginning of well drilling work. Further periodical monitoring of radiational situation will be based on results of initial condition of seabed's gamma-field. By this purpose we developed an original complex for determination of percentage content of major components of gamma field, namely, of natural radio-nuclides U-238, Th-232 and K-40 in three working energetical windows: 1.65-1.85 MeV 2.5-2.8 MeV and 1.35-1.55 MeV using calibration on isotope Cs-137 (0.662 MeV) (Fig. 1). Complex will consist of two parts; underwater part and ship s part (Fig. 1).
The detection unit is standard scintillation block developed on the basis of monocristal NaJ (Tl). having sizes ∅150 x 200 mm, protected by sealed water-tight underwater housing made of sheet of steel, having width equal to 10 mm, designed for pressure up to 100 atm, i.e. for depth nearly equal to 1000 m. A cable-rope with length equal to 1000 m connects this underwater housing with ship's winch. The underwater housing is mounted on the carrying frame of transportation structure, pulled by towing cable-rope along the seabed. Gamma survey is carried out on the basis of landscape map of seabed of determined area /2/. An on-board computer carries out detailed processing of information about percentage content of U, Th and K at the given point, received from the seabed. Reliability and possibility of long time period of continuous work of proposed device allows to carry out mapping of area's radiational situation at the sea conditions along predetermined route, the coordinates of which are determined by high-precision navigational satellite system DGPS. Data received from synchronous measurements of radiational background and geodesy coordinates are brought in to on-board computer's date base. The special software of processing make it possible to develop the map of radiational situation of pre-arranged scale for determined area and to record the initial condition of environment at the moment of measurement.
1 186

Z. Bayramov
2
UNDERWATER PART
Rope-cable
SHIP’S PART
DGPS
PC
Multichannel analyzer
MCA
Accumulator +12V
FIG. 1. Structure of underwater gamma-spectrometer.
As a result, these maps make it possible to decide two problems. The first is an ecological problem. Successful introduction of oil contracts last years, on the other hand, create the conditions for sharp increase of the deep oil platform’s refuses to the Caspian Sea. But that, in its turn, become the reason of an increase of seabed’s natural radioactive background. The second is oil and gas deposits exploration. Researches have shown that natural radioactive background existing over the oil and gas deposits contours is approximately 3-5 times low than that of other areas. The reason is that speed of leakage of radionuclides to upper layers in oil, is comparatively low. This process causes the shortage of such natural radionuclides as uranium, potassium and thorium, in upper layers of seabed. The contours of oil and gas deposits situating in depth of seabed may be accurately determined using developed maps [3].
[1] FROEHLICH, K., ROZANSKI, K., POVINEC, P., OREGIONI, B., GASTAUD, J., Isotope studies in the Caspian Sea, Sci. Total Environ. 237/238 (1999) 419-427.
[2] BAYRAMOV, Z.T., "Devices Designed for Radiation Monitoring and Marine Gamma Survey in the Azerbaijan National Aerospace Agency", II Eurasian Conference on Nuclear Science and Its Application Abstracts, NATO Advanced Research Workshop: Environmental Protection Against Radioactive Pollution, Almaty, Republic of Kazakhstan, September 16-19, 2002.
[3] AGAYEV, F., BAYRAMOV, Z.T., RZAYEV, E.A., FRANTSEVA, V.V., KERIMOV, F.N., Marine Gamma Survey (Proc. ASPG/EAGE Int. Conf. Petroleum Geology and Hydrocarbon Potential of the Caspian Sea & Black Seas Region, Baku, May 2002).
187

EXTENDED SYNOPSIS IAEA-CN-118/104
TOPIC: IN SIU TECHNIQUES
1
Radon Groundwater Monitoring in the Gran Sasso Aquifer
W. Plastino
Department of Physics, University of Roma Tre, Rome, Italy
E-mail address of main author: [email protected]
Since May 1996, groundwater monitoring (222Rn, pH, electrical conductivity, pressure of dissolved gases and temperature) at the Gran Sasso National Laboratory of the National Institute for Nuclear Physics has been performed by a multiparametric equipment [1].
The automatic multiparametric equipment is made of stainless steel with pneumatic valves and it consists of a system for groundwater geochemical analysis (temperature, electrical conductivity, pH) and extraction of dissolved gases (pressure of dissolved gases) and of a detection system for alpha radioactivity due to the decay of radon and its daughters (218Po, 214Po). The groundwater analyzed flows in a tube introduced into the rock down to a depth of about three meters and a sampling period of twelve hours has been selected [1]. The measurement site is located at the Gran Sasso National Laboratory near the main overthrust fault, and, particularly, in the well drained cretacic formations
This monitoring activity is aimed to better define the geophysical and geochemical properties of the Gran Sasso aquifer, the most important of central Italy, and its radon variation source(s). The hydrological system is CaMg(CO3)2-CO2-H2O with a high dynamics behaviour due to high permeability of cretaceous limestones.
From the analysis of the raw data may be observed: a) the groundwater temperature is characterized by a mean deviation of 0.2 °C; b) the electrical conductivity had a small range of variability of the order of 0.2 mS/m but two spike- like events occurred in October-November 1996 and August-September 1998, respectively; c) during the period from September 1996 to March 1997 pH increased of 0.4 pH units [about 5% of Average Background Value (ABV)], then from April 1997 to August 1997 a pH buffering effect occurred, and then decreased to its initial value in November 1997; d) a spike-like event of radon content in groundwater in November 1996 occurred. Furthermore, the mean value of the 222Rn from January 1997 to March 1997 decreased (about 3% ABV), then from April 1997 to September 1997 decreased (15% ABV), and then increased (September 15th, 1997) till November 1997 (about 16%-14% ABV).
The occurrence probability of hydrogeochemical spike- like anomalies has been estimated with a time series approach and has been computed avoiding the influence of non tectonic factors, i.e. meteo-climatic and stratum parameters. Then, selecting an autoregressive linear model to describe the residual time series, the presumed anomalies on the white noise series obtained were identified when the modulus was greater than three times the estimated standard deviation [1].
In order to correlate the groundwater chemical-physical spike- like anomalies with seismic activity, we estimated the ε deformation parameter [2] in an area of 150 km from
188

W. Plastino
2
measurement site by the ING catalogue. We first selected seismic events and clusters assuming a lower limit for ε of 0.1·10-8.
The time series analysis shown strong anomalies in pH and radon highly correlated with the known 1997-1998 Umbria-Marche seismic sequence occurred in central Apennines (Italy). This phenomenology may be justified by the occurrence of transient compression phase changing the carbon dioxide content in groundwater and then modifying the carbonate equilibria and the radon transport properties. Also, electrical conductivity spike-like anomalies correlate with low magnitude local seismic events and probably due to variations in groundwater dynamics induced by strain processes have been emphasized.
[1] PLASTINO, W., BELLA, F., Radon groundwater monitoring at underground laboratories of Gran Sasso (Italy), Geophys. Res. Lett. 28 14 (2001) 2675-2678.
[2] DOBROVOLSKY, I. P., ZUBKOV, S. I., MIACHKIN, V. I., Estimation of the size of earthquake preparation zones, Pure Appl. Geophys. 117 (1979) 1025-1044.
189

EXTENDED SYNOPSIS IAEA-CN-118/105
TOPIC: BIOMONITORS
1
Recent Observations of 99Tc in Finnish Coastal Waters
E. Ilus , V-P. Vartti, T. K. Ikäheimonen, J. Mattila
STUK - Radiation and Nuclear Safety Authority, Helsinki, Finland
E-mail address of main author: [email protected]
In 1999, samples of bladder-wrack (Fucus vesiculosus) were collected at about 30 locations along the Finnish coast for 99Tc analyses. The aim was to establish whether 99Tc can be detected in Finnish coastal waters and to clarify the origin of the eventually detected 99Tc.
A new modification of the method for analysing 99Tc in marine samples was developed. The method is based on extraction chromatography using special reagent (TEVA resin). Dried samples of bladder-wrack (about 10g) were wet-ashed in Tecator combustion apparatus with nitric acid. After filtration the samples were evaporated to near dryness on a hot plate and dissolved in 0.1 M HNO3. Small amount of H2O2 was added to make sure that the technetium was in pertechnetate form. Technetium was removed from the sample as a pertechnetate ion with Eichrom’s TEVA resin columns and the TEVA resin containing the Tc was transferred to liquid scintillation vial with 4 ml of distilled water. 15 ml of Ultima Gold AB was added to the vials and the samples were left to wait for about 1 week to allow the 99mTc tracer completely decay away. Samples were measured typically 600 minutes with a low-background liquid scintillation counter Quantulus. The chemical yield was determined by gamma counting; the 99mTc tracer was added at the beginning of the analysis. The method was tested in an intercomparison exercise of seaweed samples arranged by the Risø National Laboratory, Denmark. Our results were in good agreement with those reported by the other participating laboratories.
Small amounts of 99Tc were observed in all the Fucus samples collected; the activity concentrations ranged from 1.6 to 11.6 Bq kg-1 dry wt. The highest concentrations were found in two samples taken from the northernmost stations in the Quarck, probably for biological reasons. Due to the low salinity of the water, Fucus vesiculosus is very slow-growing and small in this area, which is at the extreme limit of its permanent distribution range in the Baltic Sea. In seawater and in all othe r biota samples, the concentration of 99Tc was below the detection limit, which supports the use of Fucus as an indicator organism for 99Tc in the marine environment. Earlier, in 1983, the activity concentrations of 99Tc in Fucus sampled from the Åland Islands (SW Finland), as reported by [1], varied between 1.9 and 3.3 Bq kg-1 dry wt.
Global fallout from atmospheric nuclear weapons tests carried out in the 1950s and 1960s was certainly the most important source of 99Tc detected in Fucus on the Finnish coast [2]. Another potential source would be the discharges from the Sellafield nuclear fuel reprocessing plant in mid and late 1990s and their transportation to the northern parts of the Baltic Sea by sea currents [1, 3].
The collection of Fucus and some other marine samples was repeated in 2003 along the Finnish coast to monitor the progress of 99Tc concentrations in the northernmost parts of the Baltic Sea. This paper presents the recent results from 2003 and considers the origin of 99Tc.
190

E. Ilus et al.
2
FIG. 1. Detection locations of 99Tc in the 1999 survey.
[1] HOLM, E., RIOSECO, J., MATTSSON, S., Technetium-99 in the Baltic Sea, (DESMET G., MYTTENAERE C., Eds), Technetium in the environment, Elsevier Appl. Sci. Publ. (1986) 61-68.
[2] ILUS, E., VARTTI, V-P., IKÄHEIMONEN, T.K., MATTILA, J., KLEMOLA, S., Technetium-99 in biota samples collected along the Finnish coast in 1999, Boreal Env. Res. 7 (2002) 91-97.
[3] IKÄHEIMONEN, T.K., VARTTI, V-P., ILUS, E., MATTILA, J., Technetium-99 in Fucus and seawater samples in the Finnish coastal area of the Baltic Sea, 1999, J. Radioanal. Nucl. Chem. 252 2 (2002) 309-313.
191

EXTENDED SYNOPSIS IAEA-CN-118/106
TOPIC: BIOMONITORS
1
Bioaccumulation of Radiocaesium in Arctic Seals
J. Carrolla, K. Rissanenb, T. Haugc
a Akvaplan-niva AS, Polar Environmental Centre, 9296 Tromsø, Norway
bSTUK – Radiation and Nuclear Safety Authority, Louhikkotie 28, 96500 Rovaniemi, Finland
cInstitute of Marine Research, 9291 Tromsø, Norway
E-mail address of main author: [email protected]
Seals are high trophic level feeders that bioaccumulate many contaminants to a greater degree than most lower trophic level organisms. Their trophic status in the marine food web and wide-spread distribution make seals useful sentinels of arctic environmental change. The purpose of this investigation is to document the levels and bioaccumulation potential of radiocaesium in high latitude seal species for which data have not previously been available. The study was carried out on harp, ringed, and hooded seals caught along the northeast coast of Greenland (75-80° N) in 1999. The results are then compared with previous studies in order to elucidate factors responsible for bioaccumulation in Arctic seals. Concentrations of 137Cs were determined in muscle and liver samples from a total of 22 juvenile seals. The mean concentration in muscle and liver samples for all animals was 0.36±0.13 Bq/kg f.w. and 0.26±0.08 Bq/kg f.w. respectively. The results are consistent with previous studies indicating low levels of radiocaesium in Arctic seals in response to a long term trend of decreasing levels of 137Cs in the Barents Sea region. Bioconcentration factors (BCFs) estimated for seals from NE Greenland are similar to those reported earlier by [1] for the northern Barents Sea, ranging from 32-150. Comparing these values with reported BCFs from other sectors of the European Arctic, we suggest that the combination of physiological and ecological factors on radiocaesium bioaccumulation is comparable among different Arctic seal populations.
192

J. Carroll et al.
2
TABLE I. RADIOCAESIUM CONCENTRATIONS (Bq/kg f.w.) IN SEAL MUSCLE AND LIVER TISSUE. SEALS WERE COLLECTED IN 1999 FROM NORTHEAST GREENLAND
Species Weight (kg)
Muscle (Bq/kg f.w).
Liver (Bq/kg f.w).
Ringed 21 <0.2 0.18±0.03 Ringed 58 0.2±0.05 0.32±0.07 Ringed 47 <0.2 - Harp 62 0.39±0.04 0.21±0.05 Harp 58 0.29±0.06 <0.30 Harp 54 0.30±0.06 <0.13 Harp 32 0.44±0.05 0.36±0.05
Hooded 36 0.25±0.05 <0.17 Hooded 43 0.36±0.09 0.32±0.07 Hooded 205 0.44±0.08 0.20±0.04 Hooded 36 0.26±0.07 0.16±0.03 Hooded 39 0.45±0.07 0.36±0.06 Hooded 43 0.32±0.05 0.24±0.05 Hooded 56 0.72±0.13 - Hooded 35 0.18±0.04 <0.10 Hooded 45 <0.4 <0.20 Hooded 32 <0.2 - Hooded 27 <0.5 - Hooded 38 <0.3 - Hooded 41 0.37±0.05 0.20±0.04 Hooded 34 0.24±0.04 <0.24 Hooded 66 0.40±0.07 -
mean±stdev (Ringed)
0.20 (n=3)
0.25±0.07 (n=2)
mean±stdev (Harp)
0.36±0.07 (n=4)
mean±stdev (Hooded)
0.37±0.15 (n=15)
0.25±0.08 (n=10)
mean±stdev (All)
0.36±0.13 (n=22)
0.26±0.08 (n=16)
[1] CARROLL, J., WOLKERS, H., ANDERSEN, M., ANRISSANEN, K., Bioaccumulation of radiocaesium in Arctic seals, Mar. Poll. Bull. 44 (2002) 1366-1371.
193

EXTENDED SYNOPSIS IAEA-CN-118/107
TOPIC: BIOMONITORS
1
Tolerance of Fish to Contaminated Habitats: Underlying Mechanisms Probed with Isotopic Tracers
R. A. Jeffreea, S. J. Markichb, J. R. Twiningc, S. Galed
a Marine Environment Laboratory- IAEA, 4, Quai Antoine 1er, MC 98000 Monaco
bAquatic Solutions International, 5 Perry St., Dundas Valley NSW 2117, Australia
c Environment Division, ANSTO, PMB 1, Menai NSW 2234, Australia
dUniversity of Technology, Sydney, Gore Hill Campus, Westbourne Street, Gore Hill NSW 2065, Australia
E-mail address of main author: [email protected]
Future scenarios indicate agricultural and industrial expansions in major river basins and enhanced world populations focusing in coastal watersheds [1], particularly in SE Asia. Such scenarios are consistent with increasing concentrations of various contaminants, including metals and radionuclides. It is important to assess the likely impacts on fisheries, their response and possible adaptability to enhanced contaminant levels and the implications for resulting transfer factors and contaminant levels in fisheries, that can be the major sources of subsistence and livelihood for coastal communities.
The likely future responses of fisheries to projected increases in contaminant loadings over broad geographical scales can be probed through the employment of currently highly contaminated aquatic environments. Such a system with these attributes, that we have investigated periodically since the early 1970s, is the Finniss River in tropical northern Australia, that has continued to receive acid mine drainage from the Rum Jungle U/Cu mine since the 1950s. Prior to mine-site remediation in the early 1980’s measured loadings of Cu, Zn, Mn and sulfate caused severe impact to fish diversity and abundance, including fish kills observed in the main Finniss River and its East Branch. Following mine-site remediation and measured reductions in contaminant loadings, there has been recovery of fish communities in the main Finniss River and considerable recolonisation of the still highly contaminated region of the East Branch, that was virtually devoid of fish populations prior to remediation [2].
Following mine site remediation reductions in annual-cycle contaminant loads of sulfate, Cu, Zn, and Mn by factors of 3-7 were accompanied by an unexpected degree recovery in fish community structure in the contaminated region of the Finniss River, to the extent that they were not statistically (P > 0.05) distinguishable from unexposed environments [2]. However, these fish communities continue to be exposed to considerable annual tonnages of these contaminants, as well as the naturally-occurring radionuclides associated with uranium mine wastes. Hence their capacity to accumulate contaminants under these conditions of long-term exposure and their adaptive response can be critically investigated, and is of concern to local stakeholders, both Aboriginal and European, who consume some of these fish species [ 3].
A more unexpected field observation was made in 1993 when five small fish species were found living in the East Branch of the Finniss River, where individual species penetrated the
194

R. Jeffree et al.
2
pollution gradient to varying degrees, but with one species (Melanotaenia nigrans) occurring at extremely high concentrations of Cu [4]. A laboratory-based study investigated the mechanisms of copper tolerance in M. nigrans from the polluted East Branch, compared to unexposed or reference populations. The bioconcentration of cyclotron-generated 64/67Cu in fish was used to investigate the mechanism of copper tolerance in exposed fish. In this short-term experiment Cu concentrations in all tissue sections were significantly (P<0.05) less (up to 50%) in exposed fish compared with the respective tissue sections of reference fish, when exposed to both low and elevated Cu water concentrations. The mechanism of copper tolerance was concluded to be reduced copper uptake in the gills, rather than increased binding or elimination. Initial and subsequent allozyme electrophoresis showed that heterozygosity was reduced in exposed fish compared with that of reference fish. Collectively, these results suggest that genetic selection may have occurred in the exposed fish population. This was the first study on the mechanisms of copper tolerance in a wild fish population that has been exposed to elevated copper concentrations [5].
A pilot study of Cu, U, Zn, Co, Ni, Pb, Mn, Ra and Po-210 in several edible species of fish that now occur in abundance in the region of the main Finniss exposed to mine effluents has shown the following. Each contaminant water concentration was enhanced in the contaminated zone at the time of sampling. Compared to unexposed control sites, flesh samples from two species [Bony bream (Nematalosa erebi) and Eel- tailed catfish (Neosilurus ater)] were not significantly (P>0.05) enhanced in mean concentrations of any of these contaminants, with some being actually reduced (P<0.05) in the most contaminated region. This pattern of reduced accumulation in the exposed populations under field conditions is comparable to that obtained experimentally for Cu uptake in M. nigrans.
[1] GESAMP, Protecting the Oceans from Land-based Activities; Land-based sources and activities affecting the quality and uses of the marine, coastal and associated freshwater environment, Rep. Stud. GESAMP No. 71 (2001) 162 pp.
[2] JEFFREE, R.A., TWINING, J.R., THOMPSON, J., Recovery of fish communities in the Finniss River, Northern Australia, following remediation of the Rum Jungle uranium/copper mine site, Environ. Sci. Technol. 35 (2001) 2932-2941.
[3] FERRIS, J., HOLDEN, P., The Finniss River Symposium: Rapporteurs’ Report (Proc. Finniss River Symposium, August 23-24, 2001, Darwin), (MARKICH, S.J., JEFFREE, R.A., Eds) ANSTO E/748 (2002) 74-76.
[4] JEFFREE, R.A., TWINING, J.R., Contaminant Water Chemistry and Distribution of Fishes in the East Branch, Finniss River, following Remediation of the Rum Jungle Uranium/Copper Mine Site (Proc. 2000 Contaminated Site Remediation Conference, Melbourne, 4-8 December, 2000) 51-56.
[5] GALE, S.A., SMITH, S.V., LIM, R.P., JEFFREE, R.A., PETOCZ, P., Insights into the mechanisms of copper tolerance of a population of black-banded rainbowfish (Melanotaenia nigrans) (Richardson) exposed to mine leachate, using 64/67Cu, Aquatic Toxicology 62 2 (2003) 135–153.
195

EXTENDED SYNOPSIS IAEA-CN-118/109
TOPIC: BIOMONITORS
1
Concentration Factors for Tc-99 in Lobsters (Hommarus gammarus) from Norwegian Coastal Areas
A. L. Rudjorda, A. K. Kolstada, H. E. Heldalb
a Norwegian Radiation Protection Authority (NRPA), Norway
bInstitute of Marine Research (IMR), Norway
E-mail address of main author: [email protected]
In the period 1994 to 2003, elevated levels of Tc-99 was discharged to the Irish Sea from the reprocessing facilities at Sellafield. Tc-99 is transported with ocean currents to the Norwegian coast, and earlier studies have shown that lobsters have a high ability to accumulate this radionuclide [1, 2].
A few lobster samples caught in 1997 as part of the Norwegian marine monitoring programme for radioactivity suggested higher concentration factors for lobsters along the Norwegian coastline compared to results reported from the Irish Sea [3]. A large variability in the Tc-99 concentrations in Irish Sea lobsters have been observed [4], which could perhaps be due to the relatively large variability of Tc-99 sea water concentrations in the Irish Sea. It is expected that sea water concentrations would be more homogenous further away from the source, giving concentration ratios between biota concentrations and sea water concentrations that corresponds somewhat better to the theoretical equilibrium concentration factors.
A more extensive sampling programme of lobsters (Homarus gammarus) in Norwegian Coastal areas was therefore carried out in the period 2001-2003, in most cases with simultaneous sampling of sea water. The sampling areas are shown in Figure 1.
The lobsters were frozen, and their gender, wet weight, carapace length and total length were recorded. Radioanalysis was mainly performed on tail muscle tissue but results on individual organs will be reported later.
Simultaneous sea water samples were collected at Sandøya, Kvitsøy and Værlandet. Sea water concentrations were estimated based on monitoring results at Stefjord, Møre and Flekkerøy. Generally, the activity concentration of Tc-99 in the seawater varied in the range 0.95 to 2.1 Bq m-3. Short term variations of this order can be expected within a geographical area due to various coastal effects, variations in currents or weather conditions.
FIG 1. Location of lobster sampling areas.
196

A. Rudjord et al.
2
The analysis results show a large variation in the activity concentrations of the lobsters, ranging from 2.2 Bq/kg wet weight and up to 62.2 Bq/kg w. w. In Table I, mean and median concentration factors (CF) obtained for each subsample are summarized. The concentrations are higher in female lobsters compared to males, with a factor ranging from 3.4 to 7.2 for the various subsamples, confirming earlier observations from the Irish Sea [4].
TABLE I. CONCENTRATION FACTORS OF 99Tc IN LOBSTER (HOMARUS GAMMARUS), NORWEGIAN COASTAL AREAS, 2001-2003
Location (year) Gender (F/M)
n Organ Concentration Factor mean + 1 s median
F 4 Tail muscle 36,400 + 5,200 34,200 Kvitsøy (2001) M 17 Tail muscle 7, 000 + 4,100 5,800 F 1 Tail muscle 20,200 Stefjord (2001) M 1 Tail muscle 2,800 F 5 Tail muscle 17,800 +12,600 12,700 Værlandet (2002) M 5 Tail muscle 3,000 + 800 2,700 F 2 Tail muscle 11,800 + 200 11,800 Flekkerøy (2002) M 4 Tail muscle 3,500 + 3,300 2,100
Møre (2002) M 6 Tail muscle 3,700 + 2,900 2,600 F 8 Tail muscle 9,400 + 5,700 8,500 Sandøya (2003) M 9 Tail muscle 2,500 + 800 2,400
Individual concentration factors varied from 1,540 Bq kg-1/ Bq l-1 to 13,500 Bq kg-1/ Bq l-1 with a median value of 3100 Bq kg-1/ Bq l-1 in males, and from 3800 Bq kg-1/ Bq l-1 to a maximum of 44,000 Bq kg-1/ Bq l-1 with a median value of 12,500 Bq kg-1/ Bq l-1 in female lobsters.
The high accumulation of technetium-99 of lobsters compared to other crustacea is confirmed in this study, as well as the clear differences between males and females [4]. However, there is also a large variation in activity concentrations between lobsters collected at the same time in the same area and of the same gender. No clear correlation of concentration factor with carapace length or whole body fresh weight was observed. The most probable explanation for the large variations is food ingestion of Tc-99 or variations related to the molting/reproduction cycle of the lobsters.
[1] SWIFT, D.J., The accumulation of 95mTc by juvenile lobsters (Homarus gammarus L.)
J. Environ. Radioact. 2 (1985) 229-243. [2] BUSBY, R., McCARTNEY, M., McDONALD, P., Technetium-99 concentration
factors in Cumbrian seafood, Radioprotection-Colloques, 32 (1997) 311-316. [3] BROWN, J.E., KOLSTAD, A.K., BRUNGOT, A.L., LIND, B., RUDJORD, A.L.,
STRAND, P., FØYN, L., Levels of Tc-99 in biota and sea water samples from Norwegian coastal waters and adjacent Seas, Mar. Poll. Bull. 38 7 (1999) 560-571.
[4] SWIFT, D.J., NICHOLSON, M.D., Variability in the edible fraction content of Co-60, Tc-99, Ag-110m, Cs-137 and Am-241 between individual crabs and lobsters from Sellafield (North eastern Irish Sea), J. Environ. Radioact. 54 (2001) 311-326.
[5] SMITH, D.L., KNOWLES, J.F., WINPENNY, K., The accumulation, retention and distribution of 95mTc in crab (Cancer pagurus L.) and lobster (Homarus gammarus L.) A comparative study, J. Environ. Radioact. 40 2 (1998) 113-135.
197

EXTENDED SYNOPSIS IAEA-CN-118/110
TOPIC: BIOMONITORS
1
Uptake of Waterborne 109Cd(II) in the Scallop (Chlamys islandica) Studied by In Vivo Gamma Counting and Quantitative Whole-body Autoradiography
C. Rouleau, Y. Clermont, S. St-Pierre
Fisheries and Oceans Canada, Institut Maurice-Lamontagnge, Mont-Joli (Qc) Canada
E-mail address of main author: [email protected]
Scallops caught in the North coast of the Gulf of St. Lawrence (Québec, Canada) have been found to contain elevated levels of cadmium (Cd), though this area is far from any point source of pollution. Concentrations observed ranges from 2 to more than 20 mg/kg (w.w.) in the whole animal. This exceeds the European guidelines of 1 mg Cd/kg set for molluscs and have led to the refusal of scallop stocks from the area mentioned above.
Relatively little is known about the uptake of Cd by scallops, apart from the fact that they often exhibit high concentrations of this metal in their tissues, especially in the digestive gland. To better understand the fate of Cd in scallop, we have exposed Chlamys islandica (60-80 mm shell height) to waterborne 109Cd(II) (nominal concentration 37 kBq/L, closed system) for 45 hours. Accumulation of Cd was followed over time by non-destructive in vivo gamma counting (IVGC). At the termination of the exposure period, scallops were then placed in clean running seawater and radioactivity loss was monitored for 35 d. Results from IVGC were used to quantify the kinetics of uptake and elimination. Six of these scallops were sampled at t = 0, 7, and 35 d during the depuration period and used for whole-body autoradiography to precisely determined the distribution of the accumulated 109Cd.
Preliminary analysis of data from IVGC (Fig. 1) showed that scallop rapidly accumulated 109Cd(II) from the water and that elimination was bi-exponential, with 30-35% of the radioactivity being eliminated within 2 d while the remaining 65-70% was eliminated at a slower rate, with half-life values ranging from 20 to 140 d (average 73 ± 52 d). Whole-body autoradio- graphy (Fig. 2) shows that 109Cd was distributed in all tissues of the scallop, the highest concentration being found in the kidney and the lowest in the muscle. Actually, the concentration of the radiolabel in the kidney is some 10 times higher than in any other tissue. Despite of its small size (ca. 1 % of soft tissue weight), this organ contains 40 to 60 % of the 109Cd body burden.
Our results indicate that the scallop Chlamys islandica readily accumulates cadmium from seawater. However, the distribution observed by whole-body autoradiography does not correspond to the one observed for wild scallops, since in the latter the hepatopancreas was the main accumulation site, containing 80 to 90 % of the Cd body burden (C. Rouleau, unpublished data). This may indicate that the main accumulation route of cadmium in wild scallop is not direct uptake through water. Further work is planned to look at the uptake of this metal via the phytoplanctonic food of scallop. The results of this study on the accumulation of Cd via water and food will provide a better understanding of the fate of this metal in scallop. Data collected will be used to build a predictive and quantitative
198

C. Rouleau et al.
2
accumulation model that will be useful to assess Cd contamination of scallops in pristine and human-impacted areas.
FIG. 1 . 109Cd levels in the tissues a scallop Chlamys islandica during a 45-h exposure to waterborne 109Cd(II) (37kBq/L) and during depuration in clean running seawater.
FIG. 2. Distribution of 109Cd in 20µm-thick cryosection of a scallop Chlamys islandica following a 45-h exposure to waterborne 109Cd(II) (37kBq/L).
Exposure
0
100
200
300
400
0 0.5 1 1.5 2
t (d)
nC
i in
wh
ole
an
imal
Depuration
0
100
200
300
400
0 10 20 30 40
t (d)
199

EXTENDED SYNOPSIS IAEA-CN-118/111
TOPIC: BIOMONITORS
1
Delineation of Heavy Metal Uptake Pathways (Seawater, Food and Sediment) in Tropical Marine Bivalves using Metal Radiotracers
L. Hédouina,d, M. Métiana, O. Cotreta, J.-L. Teyssiéa, J. Paganellia, S. W. Fowlera, R. Fichezb, M. Warnaua
a IAEA – Marine Environment Laboratory, Monaco bIRD – Noumea Center, New-Caledonia c LBEMB, UPRES-EA 3168, La Rochelle University, France dGoro-Nickel, New-Caledonia
E-mail address of main author: L. [email protected]
The SW lagoon of New Caledonia is subjected to intense heavy metal input from land-based mining industries exploiting metals such as Ni and, secondarily, Cr and Co [1]. However, as is the case for most tropical environments, little is known about the contamination status of this lagoon [1, 2]. In order to allow a better ecotoxicological characterization of the New Caledonian lagoon through monitoring of its seawater quality status, three locally common and abundant species were selected for laboratory radiotracer experiments. The objective of the study was to characterize and possibly validate their usefulness as bioindicator species in programmes for local pollution surveys and monitoring of the coastal zone. The three species selected were the edible clam Gafrarium tumidum, and the oysters Isognomon isognomon and Malleus regula. Bioaccumulation and tissue distribution of six elements (Ni, Cd, Co, Cr, Zn, Ag) were determined following exposures via sea water, sediment and food using radiotracers (63Ni, 109Cd, 57Co, 51Cr, 65Zn, 110mAg) and highly sensitive nuclear detection techniques (beta and gamma spectrometry).
Transfer from food was shown to be quite efficient; assimilation efficiencies (AE) of metals ingested with phytoplankton (Isochrysis galbana) ranged between 34 and 77%, and these ingested fractions of metals were retained for long periods of time (biological half- lives ranged between 20 and 400 days depending upon the element). In contrast, in terms of transfer efficiency, sediments were found to be a much less important pathway than sea water; for example, concentration factors from sea water estimated at steady-state, CFSS, were three to five orders of magnitude higher that steady-state transfer factors from sediments, TF SS. Nevertheless, metal concentrations in sediment are several orders of magnitude higher than those in sea water and, in terms of quantities of transferred elements, their impact on total metal accumulation may not be negligible.
Therefore, it was necessary to use a mathematical model [3] to estimate the relative contribution of each uptake pathway to the total bioaccumulation of metals in bivalves. The kinetic parameters measured in the different experiments investigating the exposure routes have been used to run the model. Computations suggest that sediment always accounts for only a minor part of the total bioaccumulation in the 3 bivalves (< 3%; except for Cd in the
200

L. Hedouin et al.
2
oysters: 20% in I. isognomon and 30% in M. regula). In the clams, the predominant uptake route for all metals was found to be the food (95-99%). In contrast, both oysters accumulated Co and Cd mainly from food, whereas sea water was the predominant route for Zn accumulation. Interestingly, the two oysters displayed the same behaviour with respect to all the metals except Ag. The latter element was far more efficiently taken up and retained in the soft parts of I. isognomon than in M. regula. For this metal the bioaccumulation model indicated that I. isognomon took up Ag mainly from sea water (88%) whereas M. regula accumulated it principally from its food (90%). Furthermore, our results suggest that differing mechanisms (or induction threshold level) of Ag detoxification/storage occur in the two oyster species, and that the mechanism in I. isognomon is particularly sensitive and efficient.
In conclusion, food and, secondarily, sea water appear to be the predominant routes for the uptake of these metals in the three tropical bivalves investigated.
[1] LABROSSE, P., FICHEZ, R., FARMAN, R., ADAMS, T., New Caledonia (SHEPPARD, C.R.C., Ed.), Seas at the Millennium: An environmental evaluation, Pergamon Press, Amsterdam (2000) 723-736.
[2] BREAU, L., Etude de la bioaccumulation des métaux dans quelques espèces marines tropicales : recherche de bioindicateurs de contamination et application à la surveillance de l’environnement côtier dans le lagon sud-ouest de la Nouvelle-Calédonie. PhD. Thesis, La Rochelle University, France (2003) 282 pp.
[3] REINFELDER, J.R., FISHER, N.S., LUOMA, S.N., NICHOLS, J.W., WANG, W.X., Trace element trophic transfer in aquatic organisms: A critique of the kinetic model approach, Sci. Total Environ. 219 (1998) 117-135.
201

EXTENDED SYNOPSIS IAEA-CN-118/112
TOPIC: BIOMONITORS
1
Po-210 and Pb-210 Concentration Factors for Zooplankton and Faecal Pellets in the Oligotrophic South-West Pacific
R. A. Jeffreea, R. Szymczakb, G. A. Peckc
a IAEA-MEL, 4 Quai Antoine 1er, MC 98000 Monaco
bANSTO Environment, PMB 1, Menai NSW 2234, Aus tralia
c Department of Defence - Joint Logistic Command, PO Box 2288U, Melbourne VIC 3001 Australia
E-mail address of main author: [email protected]
In a previous study on zooplankton sampled from very low productivity waters of French Polynesia [1], their Po-210 concentrations were found to be unexpectedly elevated, compared to values measured in marine zooplankton from various other geographical regions of the world. For the French Polynesian samples their Po-210 concentrations also increased appreciably as their biomass declined. A simple conceptual and mathematical model, that incorporated the established role of zooplankton faecal pellets in the removal of Po-210 and particle-reactive radionuclides and stable metals from the water column, could capture the shape of this empirical relationship between Po-210 concentration and their biomass and also explained the biomass-related mechanism that increases Po-210 concentrations in zooplankton [2]. Similarly, a field investigation in the Timor Sea showed that a range of particle-reactive elements showed elevated water concentrations as particle removal rates, as inferred from Th-234: U-238 disequilibria, reduced in the euphotic zone [3]. However, in these previous studies simultaneous in situ measurements of a range of parameters valuable in assessment of the role of zooplankton in the biogeochemical cycling of particle-reactive elements like Po-210 and Pb-210 were not made.
Here we report preliminary results of a field study, that was undertaken in the oligotrophic waters of the South-West Pacific between New Caledonia and Fiji, where we simultaneously measured a) zooplankton biomass and their faecal pellet production rates, b) Po-210 and its progenitor Pb-210 in water, zooplankton and their faecal pellets and c) particle flux rates using U-238:Th-234 disequilibria, to further assess the role of zooplankton in Po-210 and Pb-210 biogeochemistry in the euphotic zone of oligotrophic systems [4].
Zooplankton sampled from the oceanic region of the South-West Pacific between Fiji and New Caledonia had biomasses ranging from 0.1 to 7.1 mgDW/m3, with a median value of 3.6 and mean of 2.65 mgDW/m3. Their faecal pellet production rates were measured on board and varied between 1.82.10-4-3.78.10-3 g dry faecal pellet. g dry zooplankton-1. hour-1, median ). Their measured Po-210 and Pb-210 concentrations were 830-2655 Bq.KgDW-1 and 44-617Bq. KgDW-1, respectively. Po-210 and Pb-210 concentrations in zooplankton varied between 565-1736 Bq.Kg dry weight-1 and 47-551 Bq.Kg dry weight-1, respectively.
Po-210 concentration factors that only varied between 1.3 –3.3. 105 were elevated compared to the IAEA recommended value of 3.104 based on previous values [5]. Similarly, Pb-210 concentration factors ranging from 0.9-9.1. 104, were considerably elevated compared to the
202

R. Jeffree et al.
2
IAEA recommended value of 1.103 [5], indicating the presence of a further concentrating mechanism.
TABLE 1. PO-210 AND PB-210 CONCENTRATIONS IN SAMPLES OF WATER, ZOOPLANKTON AND THEIR FAECAL PELLETS. Ω BASED ON WET WEIGHT: DRY WEIGHT CONVERSION RATIO OF 7.5 [4]
Zooplankton concentration
(Bq/KgDW)Ω
Water concentration
[dissolved(mBq/L)]
Zooplankton faecal pellets
(Bq/KgDW)
Concentration factors for
zooplankton
Location Date Zooplankton biomass (mgDW/m3)
Po-210 Pb-210 Po-210 Pb-210 Po-210 Pb-210 Po-210 Pb-210
Oceanic (OF1 -14-03) Mar 02 2.09 1736 266 0.70 1.67 2655 617 3.3. 105 2.1. 104
Oceanic (OF2 -16-03) Mar 02 7.12 1404 324 1.52 1.57 1389 438 1.2. 105 2.8. 104
Oceanic (OF3 -19-03) Mar 02 1.40 1039 187 0.47 1.72 2660 351 2.9. 105 1.4. 104
Oceanic (OF4 -20-03) Mar 02 2.22 998 209 0.92 3.19 2529 389 1.4. 105 0.9. 104
Oceanic (OF5 -21-03) Mar 02 4.68 1319 196 0.93 2.52 1784 419 1.9. 105 1.0. 104
Offshore 1 Nov 01 2.91 1285 302 1.23 0.81 830 115 1.4. 105 5.0. 104
Offshore 2 Nov 01 2.53 1348 551 0.68 0.81 1468 408 2.6. 105 9.1. 104
Offshore 3 Nov 01 2.66 1580 528 1.58 0.97 2578 390 1.3. 105 7.3. 104
Offshore 4a Nov 01 0.7 1239 266 0.83 2.35 1734 431 2.0. 105 1.5. 104
Our results for Po-210 and Pb-210 show a consistency with published values [5,6] in that the concentration factor for Po-210 is elevated relative to Pb-210, but contrast with previous reported values in both being elevated by about an order of magnitude. Their comparably elevated concentrations in faecal pellets suggest that enhanced concentrations in zooplankton are a reflection of the heightened concentrations in their dietary phytoplankton.
[1] POLETICO, C., TWINING, J.R., JEFFREE, R.A., Comparison of Concentrations of Natural and Artificial Radionuclides in Plankton from French Polynesian and Australian Coastal Waters (Proc. 9th Pacific Basin Conference, Sydney, Australia, 1-6 May) Trans. Am. Nucl. Soc. 70 1 (1994) 989-993.
[2] JEFFREE, R.A., CARVALHO, F., FOWLER, S.W., FARBER-LORDA, J., Mechanism for enhanced uptake of radionuclides by zooplankton in French Polynesian oligotrophic waters, Environ. Sci. Techn. 31 (1997) 2584-2588.
[3] JEFFREE R.A, SZYMCZAK, R., Enhancing Effect of Marine Oligotrophy on Environmental Concentrations of Particle-Reactive Trace Elements, Environ. Sci. Techn. 34 10 (2000) 1966-1969.
[4] JEFFREE, R.A, SZYMCZAK, R., PECK, G.A., Zooplankton concentration factors for Po-210 and Pb-210 in the Oligotrophic South-West Pacific (in prep.).
[5] INTERNATIONAL ATOMIC ENERGY AGENCY, Sediment Kds and Concentration Factors for Radionuclides in the Marine Environment, IAEA Technical Report Series TRS 247, Vienna (2003).
[6] NOZAKI, Y., THOMSON, J., TUREKIAN, K.K., The Distribution of 210Pb and 210Po in the surface waters of the Pacific Ocean, Earth Planet. Sci. Lett. 32 (1976) 304-312.
203

EXTENDED SYNOPSIS IAEA-CN-118/113
TOPIC: BIOMONITORS
1
Distribution and Interelement Correlation between Chemical Elements and Radionuclides in the Marine Mammals from the Southern Baltic Sea
T. Ciesielskia, M. Waszczuk-Jankowskaa, P. Fodorb, Zs. Bertenyib, I. Kuklikc, K. Skórac, R. Bojanowskid, J. Namiesnike, P. Szefera
a Department of Food Sciences, Medical University of Gdansk, Gdansk, Poland
bDepartment of Applied Chemistry, Faculty of Food Science, Szent Istvan University, Budapest, Hungary
c Hel Marine Station, University of Gdansk, Gdansk, Poland
dMarine Chemistry Laboratory, Institute of Oceanology, Polish Academy of Sciences, Sopot, Poland
e Department of Analytical Chemistry, Chemical Faculty, Gdansk University of Technology, Gdansk, Poland
E-mail address of main author: [email protected]
Tissues of marine mammals (Phocoena phocoena, Halichoerus grypus, Phoca hispida and Stenella coeruleoalba) from the southern Baltic Sea were analysed for concentration of 26 elements (Al, As, B, Ba, Cd, Co, Cr, Cu, Fe, Ga, Li, Mn, Mo, Ni, Pb, Se, Si, Sr, Tl, V, Zn, Ca, K, Mg, Na, P) and radionuclides (137Cs, 40K, 210Po). The trace and macroelements were determined by ICP-MS and ICP-AES while radionuclides using γ-spectrometry and α-spectrometry.
To find statistically significant relationship between hepatic concentrations of chemical elements and radionuclides, if any exist, the data obtained were processed by correlation analysis. Significant interelemental correlations (p<0.05) were found for the following assemblages: Al-Mg, Al-Mn, Ba-Ca-Sr, Ca-K-Mg-P, Cd-Fe, Fe-K, Fe-Se, K-Mn, K-Sr, Mg-Sr, Mg-Se, Mg-Zn, P-Se and P-Zn. Hepatic concentration of 137Cs were negatively correlated with those of K and Si while 210Po showed positive correlation with Mo.
The radioactivity data obtained in the present study are compared to those reported for marine mammals from the North Sea, Norwegian and Barents Sea (Fig. 1.). It is observed that levels of 137Cs in porpoises from the southern Baltic are mostly attributable to the Chernobyl accident in 1986 while major source of this radionuclide in North Sea porpoises are discharges released from processing plants at Sellafield, England. Unlike the naturally occurring isotope 40K, the 137Cs displays tendency to accumulate significantly in mammals from Polish coast of the Baltic Sea.
204

T. Ciesielski et al.
2
FIG. 1. Changes in the concentration of 137Cs and 40K in the muscle of harbor porpoises from different geographical regions.
0
10
20
30
40
50
137 C
s[B
q·kg
-1w
.w.]
0
20
40
60
80
100
120
140
40K
[Bq·
kg-1
w.
w.]
notmeasured
Atla
ntic
Cel
tic S
ea
Irish
Sea
Nor
th S
ea
Sou
ther
n B
altic
Nor
weg
ian
and
Bar
ents
Sea
Atla
ntic
Cel
tic S
ea
Irish
Sea
Nor
th S
ea
Sou
ther
n B
altic
Nor
weg
ian
and
Bar
ents
Sea
Mean Min.-Max. Mean
Mean Min.-Max. Mean
205

EXTENDED SYNOPSIS IAEA-CN-118/114
TOPIC: BIOMONITORS
1
Bioaccumulation of Selected Heavy Metals in the Brown Alga Lobophora variegata : A Radiotracer Study
M. Metiana, L. Hédouina,b,c,d, E. Girona, E. Buschiazzoa, V. Bornea, J. Paganellia, R. Boudjenoune, O. Cotreta, J.-L. Teyssiéa, S. W. Fowlera, M. Warnaua
a IAEA – Marine Environment Laboratory, Monaco
bIRD – Noumea Center, New Caledonia
cLBEMB, La Rochelle University, France
dGoro-Nickel, New Caledonia
eCOMENA/CRNA, Algiers, Algeria
E-mail address of main author: [email protected]
New Caledonia is a small South Pacific island whose main economic resources are derived from nickel exploitation. Local mining activities inevitably result in metal contamination of the surrounding environments. In particular, these long term activities are responsible for large inputs of metals into the SW lagoon and thereby constitute a threat to the local coastal marine ecosystems.
Available information on metal contamination in biota from New Caledonia is extremely scarce [1]. However, a recent study has screened metal contamination levels in a variety of local marine organisms in different locations of the SW lagoon [2]. This study showed that several species could be considered as potential bioindicators. Among these, the brown alga Lobophora variegata appeared as one of the most valuable candidates. Indeed, this species is abundant, widely distributed in the lagoon as well as in other tropical ecosystems, and displays high levels of metals within its tissues. The aim of this work was to investigate metal bioaccumulation kinetics in L. variegata in order to further assess its value as a sentinel species for identifying and monitoring environmental contamination.
Uptake and loss kinetics of six different metals (Cr, Co, Zn, Cd, Ag, and Ni) were determined using multi-element exposures with carrier-free or high specific activity radiotracers (51Cr, 57Co, 65Zn, 109Cd, 110mAg, 63Ni) in order to carry out the experiments at realistic contaminant levels. In another set of experiments, mono-element exposures were carried out with five increasing concentrations of each metal (14d of exposure followed by 21 d of depuration) in order to assess the possible influence of ambient dissolved concentration on metal bioconcentration and retention capacity in the alga. The ranges of concentrations for each metal were selected in order to cover the range of dissolved concentrations encountered in the lagoon.
Results showed that all the metals tested were readily incorporated in the tissues of L. variegata and were concentrated according to linear kinetics. After 28 d of exposure, the alga attained concentration factors (CF) ranging from 585 to 6,530 depending on the element. Previously exposed algae were then replaced in non-contaminated conditions for 2 months.
206

M. Metian et al.
2
Loss kinetics indicated that the metals were efficiently retained in the algae, and retention was characterized by biological half lives (Tb½) always longer than 33 d. Except for Zn, the CFs were independent of the ambient dissolved concentration of the metals. In the case of Zn, only the highest concentration tested had a lower CF observed. This was due most likely to a saturation of Zn binding sites at the highest ambient concentration used. Similarly, Tb½ was found to be constant over the whole range of dissolved concentrations tested.
In summary, Lobophora variegata appears to be an excellent bioindicator species that shows a rapid response time in metal uptake and therefore has a suitable potential to furnish valuable quantitative information on the contamination levels occurring in its surrounding environment.
[1] LABROSSE, P., FICHEZ, R., FARMAN, R., ADAMS, T., New Caledonia, (SHEPPARD, C.R.C., Ed.), Seas at the Millennium: An environmental evaluation, Pergamon Press, Amsterdam (2000) 723-736.
[2] BREAU, L., Etude de la bioaccumulation des métaux dans quelques espèces marines tropicales : recherche de bioindicateurs de contamination et application à la surveillance de l’environnement côtier dans le lagon sud-ouest de la Nouvelle-Calédonie, PhD Thesis, La Rochelle University, France (2003) 282 pp.
207

EXTENDED SYNOPSIS IAEA-CN-118/115
TOPIC: BIOMONITORS
1
Disutribution Coefficients (Kds) of Naturally Occurring Radionuldies in River Sediments
M. S. Al-Masri, S. Mamish, M. A. Haleem
Department of Protection and Safety, Atomic Energy Commission of Syria, Damascus, P. O. Box 6091, Syria
E-mail address of main author: [email protected]
Information on distribution coefficients (Kds) of natural and artificial radionuclides are most important for evaluation radionuclides transport pathways in marine and fresh water systems; Kd values are used in modeling radionuclides dispersion and addressing the problem of radioactive release [1-5]. It is also necessary for prediction of how efficiently sediments in suspension can remove contaminants from the water and the sorption potential of contaminants onto particulate matter. In addition, risk assessment modelers usually adopt mean Kd values reported in the IAEA Technical Report [1], which are only generic estimates and modelers has to use the values for a particularly system that is under investigation [4] and it was recommended to use Kds ranges of values for specific element rather than single mean values be incorporated into model simulations of radionuclide dispersion [3, 4].
There is a lack of information on Kds distribution coefficients of natural and artificial radionuclides in river and marine sediments of Syrian environment. Current risk assessment studies of the two main potential sources of enhanced naturally occurring radionuclides require Kd values in river sediments; viz. phosphate and oil industry. Emphasis has been placed on two areas, Orontos River near the phosphate factory and Euphrates River near the Syrian oil fields. Water, suspended particulates, and sediment samples were collected from several sites along the two rivers. Validated radioanalytical methods have been used for analysis. Laboratory Kd experiments were conducted for the following radionuclides discharged by these phosphate and oil industries: 226Ra, uranium, 210Po and 210Pb. Variations of Kds with aqueous phase composition and sediment composition have been studied using the batch sorption method. Correlations of Kds values with some elements present in sediment have been established. Kds values were found to vary between 5.8 x10³ – 2.3 x 10⁴, 4.4 x10³ – 1.1 x 10⁴, 6.8 x10² – 1.6 x 10³, 9.2 x10² – 2.8 x 10³, for 210Po, 210Pb, 234U and 238U, respectively. These values agree with some minimum values given in the IAEA Technical report for marine sediment [1]. However, the data obtained in this study can be used for the radionuclides dispersion studies in the river system to assess risks to public due to discharges of the phosphate and oil industry.
[1] INTERNATIONAL ATOMIC ENERGY AGENCY, Sediment Kds and Concentration Factors for Radionuclides in the Marine Environment, Technical Report Series No. 247 (1985) IAEA, Vienna.
[2] MOORE, W.S., DEMASTERS, D.J., SMOAK, J.M., MCKEE, B,A., SWARZENSKI, P.W., Radionuclide Tracers of Sediment Water Interactions on the Amazon Shelf. Cont. Shelf. Res. 16 (1996) 645-665.
208

M. Al-Masri et al.
2
[3] CARROLL, J., BOISSON, F., FOWLER, S.W., TEYSSIE, J.L., Radionuclides Adsorption to Sediments from Nuclear Waste Dumping Sites in the Kara Sea, Mar. Pollut. Bull. 35 (1998) 296-304.
[4] CARROLL, J., Harms, I., A Note on Partition Coefficients Distributions, J. Math. Geol. 28 (1998) 1025-1033.
[5] CONKIC, L.J., BIKIT, J., SLIVKA, J., MARINKOV, L., Concentration Factor of 137Cs in River Sediment, Water Res. 22 (1988) 241-243.
209

EXTENDED SYNOPSIS IAEA-CN-118/116
TOPIC: BIOMONITORS
1
Water to Swamp Morning Glory Transfer of Radium-226
B. Porntepkasemsan, K. Srisuksawad
Waste Assessment Section, Radioactive Waste Management Project, Office of Atoms for Peace, Bangkok 10900, Thailand
E-mail address of main author: [email protected]
A study of the uptake of 226Ra by swamp morning glory was carried out in Bangkhen canal where is the pathway releases from the Office of Atoms for Peace (OAP). This aquatic plant is an important diet of the Thai population and is grown widespread in various canals. Its consumption represents a significant pathway for the intake of radionuclides including radium and for the delivery of the internal dose to man from those radionuclides.
Water and vegetable samples were collected four times a year from 1998 to 2002 inclusive from four stations along Bangkhen canal. Samples were determined by radiochemical separation.
Data obtained by 5 year-analysis were compiled to explain the mechanism of radium-226 transfer from water to swamp morning glory (Ipomoea Aquatica Forsk). The concentration factors (CFs), relative to fresh weight of vegetable, for 226Ra uptake from water into swamp morning glory ranged from 23 to 120, mean average 44. In general, these data are comparable to the lower values found in the literatures (cited in 1). This may be due partly to the fact that the study area was an uncontaminated zone with little or no contamination by the OAP and swamp morning glory appeared to concentrate radium from the water to a lower degree than other aquatic plant.
Radium-226 uptake depends on its concentration in water as its concentration in the vegetables being a linear function of its concentration in water, r2= 0.715 as shown in Fig. 1.
The CFs or the rate constants of uptake and loss rate coefficient were found to be of first order kinetics and approximately equal to slope of the equation. Mechanism of radium-226 transfer from water to swamp morning glory grown in the study zones can be expressed as an equation Cp = a Cw
b where the parameter a and b are dependent on the aquatic plant species, in case of swamp morning glory a = 64.326 and b = 0.46.
The equation shown good agreement with values obtained from difference stations in the same canal. The equation could be applied in a number of ways as it provides reliable estimates and economy in budget and time.
210

B. Porntepkasemsan and K. Srisuksawad
2
FIG. 1. Linear regression of the 226Ra concentration in swamp morning glory versus its concentration in water.
[1] HALBERT, B.E., CHAMBERS, D.B., CASSADAY, V.J., Environmental Assessment Modeling, IAEA Technical Reports Series No. 310 Vol II (1990) p. 446.
211

EXTENDED SYNOPSIS IAEA-CN-118/117
TOPIC: BIOMONITORS
1
Anthropogenic Radionuclides in Fish, Shellfish, Algae and Sediments from the Sudanese Red Sea Coastal Environment
H. K. Rifaat Babikera, A. K. Sama, O. I. Osmanb, D. A. Sirelkhatima, J. La Rosac
a Sudan Atomic Energy Commission, P.O. Box 3001, Khartoum, Sudan
bChemistry Department, Faculty of Science, University of Khartoum, Khartoum, Sudan
cMarine Environment Laboratory, IAEA, MC 98000 Monaco
E-mail address of main author: [email protected]
The activity concentration of fallout radionuclides v.z.,238Pu ,239+240Pu, 241Am,137Cs and 90Sr has been measured in some species of multicellular marine algae, coral fishes and shellfish, and surface sediments collected from the fringing reef at different locations along the Sudanese coast of the Red Sea. The measurements were carried out using alpha-particle spectrometry, high-resolution gamma spectrometry and gas-flow proportional counter.
In the sediments analyzed, the activity concentration averaged 2.65±1.3 (238Pu), 47.96 ± 26.3 (239+240Pu), 19.1± 6.5 (241Am), 273 ± 157 (137Cs) and 140.8±73.9 (90Sr) mBq/kg dry weight. Activity concentration ratios were 0.066±0.041 (238Pu: 239+240Pu), 0.22±0.04 (239+240Pu:137Cs), and 0.43±0.1 (241Am:239+240Pu). These values are typical of those reported in the literature from the regions unaffected directly by nuclear accidents or nuclear reprocessing plant discharges and can thus be attributed to global fallout.
Average activity concentrations (mBq/gk Dry weight) in marine algae from different locations were found to be 20.1±14.1, 21.6±13.3 and 8.5±3.8 (239+240Pu), 6.2±4.0, 11.7±6.1 and 5.1±3.5 (241Am) and 688±242, 868±713 and 116±14.8 (137Cs) for brown, red and green algae, respectively. These results were found to be consistently decrease towards the south from Portsudan harbour (Fig. 1)and comparable to global fallout values. High levels of 137Cs were observed in brown algae (Cystoseria species) and red algae (Lauranthia species). This possibly suggests their suitability to be used as bioindicators since algae are known to be effective bioindicators for monitoring the anthropogenic radioactivity in the marine environment.
Plutonium isotopes were measured in some species of coral fishes and shellfish samples from the fringing reefs area at Port Sudan. Activity concentrations of both 238Pu ,239+240Pu in fish are close to detection limits, while shellfish show values an order of magnitude higher relative to coral fish species. The lowest concentration for 239+240Pu was met in the molluscs species Tridacnica and the highest value was met in the coral species Favites.
212

H. Babiker et al.
2
0
5
10
15
20
25
30
35
Brown Red Green Brown Red Green Brown Red Green
Portsudan Sawakin Toker
Algae in different locations
Con
cent
ratio
n (m
Bq/
Kg)
Pu-239+240Am-241
FIG. 1. Comparison of Pu and Am mean activity in mBq/kg in algae from different locations along the Red Sea coast.
213

EXTENDED SYNOPSIS IAEA-CN-118/118
TOPIC: BIOMONITORS
1
Phosphorus Availability to Ryegrass from Urban Sewage Sludges assessed by Isotopic Labeling and Dilution Technique: Effect of Irradiation
R. A. El-Motaiuma, C. Morelb
a Plant Research Dept., Nuclear Research Center, Atomic Energy Authority, Cairo, Egypt
bNational Institute for Agronomical Research, BP 81, F-33883, Villeneuve d'Ornon cedex, France
E-mail address of main author: [email protected]
Urban sewage sludges are widely used as alternative P input because of their high P content [1]. Irradiation of sewage sludge is developed in Egypt to make safe spreading of sludge on agricultural fields. Precise knowledge of sludge P bioavailability is required to optimize the application rate to meet plant requirement, avoid accumulation of P in soils and/or leaching to the aquifer. Five sludges were sampled from representative urban wastewater treatment plants located in Cairo (Egypt). Subsamples were irradiated to a dose of 6 kGy. The sludges were analyzed for their elemental composition. A pot experiment was conducted under plastic greenhouse using an arable sandy P-deficient Egyptian soil. The soil was homogeneously labeled with a radioactive solution of carrier-free 32PO4 (about 3 MBq kg-1 soil) to determine the contribution of the different sources of P in plant nutrition. All sludges were applied at 50 mg P kg-1 soil. In addition, 50 mg P kg-1 soil was applied as commercial monocalcium phosphate (SSP), control treatment, to compare sludge P availability to a water-soluble mineral fertilizer. A reference treatment, without any P application but with the addition of the radioactive solution was included. One gram of ryegrass seeds (Lolium multiflorium) was sown in each pot. The aerial parts of the ryegrass were harvested four times, every 3 weeks. In parallel, the contribution of ryegrass seed to plant P nutrition was estimated as the difference between P in seeds at sowing and P remaining in seeds residues after two cuts. Guivarch [2] has reported a value of 0.9 mg P kg-1 soil contributed by seed phosphorus.
For all harvests, 32P and total P content were measured. The two values were used to determine the respective contribution of soil and sludge to plant nutrition and the plant-available soil P (L value), Larsen [3], using the isotopic dilution principle after correcting for seed contribution. The ratio of radioactive P to non-radioactive P, i.e. isotopic composition, were calculated. The total P content in the different urban sewage sludge ranged from 6.2 to 13.8 g P kg-1 and were slightly affected by irradiation. In this extremely P deficient soil (L value=0.3 mg P kg-1 soil), P derived from seeds represented 99% of the P taken up when no P was applied and 87% after applying 50 mg P-SSP kg-1. After correcting for the contribution of ryegrass seeds, sludge P participated for 98% to plant nutrition and 7.2% of the applied P was recovered. The sludge type and irradiation factors did not significantly affected sludge P availability, assessed by L value, and their contribution to plant nutrition. However, contrasting conclusions on sludge P availability compared to SSP were obtained when either relative contribution of sludge P or percentage of P recovery were considered. These differences were mainly explained by amounts and forms of N added associated with sludge P addition. The correlation coefficient between N and P uptake is highly significant (r =
214

R. El Motaium and C. Morel
2
0.86**). Irradiated sludge was a safe and effective source of P for plants.
FIG. 1. Correlation between nitrogen uptake and phosphorus uptake by ryegrass aerial part.
[1] KIRKHAM, M.B., Agricultural use of phosphorus in sewage sludges, Adv. Agron. 35 (1982) 129-163.
[2] GUIVARCH, A., Plant-availability and relative fertilizing value of phosphorus in sewage sludge derived from different urban waste waters treatment plants, Ph.D. Thesis, Institut National Polytechnique de Lorraine, France (2001).
[3] LARSEN, S., The use of 32P in studies on the uptake of phosphorus by plants, Plant and Soil 4 (1952) 1-10.
Regression95% confid.
P_UPTAKE = -2.115 + .47256 * N_UPTAKECorrelation: r = .86169
N_UPTAKE
P_U
PT
AK
E
3.5
4.5
5.5
6.5
7.5
8.5
9.5
10.5
12 14 16 18 20 22 24 26
215

EXTENDED SYNOPSIS IAEA-CN-118/119
TOPIC: GROUNDWATER-SEAWATER INTERACTIONS
1
Measurement and Potential Importance of Submarine Groundwater Discharge
W. C. Burnett
Department of Oceanography, Florida State University, Tallahassee, FL 32306, U.S.A.
E-mail address of main author: [email protected]
While the major rivers of the world are reasonably well gauged and analyzed, thus allowing comparatively precise estimates of riverine inputs to the ocean, it remains very difficult to evaluate the influence of direct groundwater discharge into the ocean. In spite of the recognition that many land-sea interfaces of the world are characterized by “leaky” continental margins, it is unclear how important groundwater-derived springs and seeps are in terms of overall marine geochemical budgets.
The principal reason that groundwater estimates have not attained the precision base that is typically achieved of other oceanic inputs is that the direct discharge of groundwater into the coastal zone is inherently very difficult to measure. Concerted efforts are required to improve this situation by integrated application of hydrological and oceanographic techniques. Standard hydrological and oceanographic methodological approaches are quite different and have rarely been systematically compared by following a systematic scientific evaluation process. Hydrogeologists and oceanographers are literally approaching the same problem from different ends. In order to develop the scientific and technical knowledge that will enable these issues to be addressed with a higher degree of certainty, the IAEA together with UNESCO (IOC and IHP) is conducting a collaborative program which includes carefully designed intercomparison experiments in different coastal environments in order to provide a standardized methodology for assessment of SGD. Many of the methods being assessed are based on naturally-occurring radioisotopes that act as tracers of SGD. An important aspect of our program is to disseminate the results widely, to coastal managers and other relevant parties, in the hopes that national authorities will encourage the scientific community to investigate these phenomena properly. Thus far, we have conducted intercomparison experiments in Florida (August, 2000; karst hydrogeology); Western Australia (November, 2000; coastal plain); Sicily (volcanic and karst; March, 2002); Eastern Long Island (May; 2002; glacial till); and Ubatuba, Brazil (fractured crystalline rock). Results have generally shown good agreement between direct seepage meter measurements and estimates made via geochemical tracers. The agreement with hydrogeological models, however, has been more spotty. This may be a reflection of the models not including consideration of transient processes, such as tidal pumping, that force water through near-shore sediments. Plans for next year include an SGD assessment intercomparison experiment in the Mauritius Islands, Indian Ocean. It is becoming recognized that oceanic islands display disproportionately higher amounts of SGD compared to many continental areas.
216

EXTENDED SYNOPSIS IAEA-CN-118/120
TOPIC: PACIFIC AND SOUTHERN OCEANS
1
Bomb-Radiocarbon: Distribution, Inventory, and Change
R. M. Key
A.O.S. Program, Princeton University, Princeton NJ, U.S.A.
E-mail address of main author: [email protected]
During the 1990s an unprecedented number of oceanic radiocarbon measurements were made as part of the World Ocean Circulation Experiment (WOCE). The samples were analyzed using both large volume beta counting and small volume accelerator mass spectrometry. The number of WOCE radiocarbon samples is approximately 10 times larger than measured during the GEOSECS survey in the 1970s. A new technique was deve loped to separate the natural and bomb produced radiocarbon components. This procedure is based on the strong linear correlation between radiocarbon and potential alkalinity that is found in intermediate to abyssal waters worldwide. The primary benefit of the potential alkalinity separation method over the previously used silicate method is that it is applicable at all latitudes.
While still sparse relative to hydrographic or nutrient measurements, the new data are sufficient to produce three dimensional objective maps. These maps confirm the major GEOSECS findings, but add considerable detail. As an example, in the deep Pacific the northward abyssal flow is clearly defined as a western boundary current which flows adjacent to the island arc system while the return southward deepwater flow at approximately 2500m is broad and appears to divide into two tongues in the southern hemisphere. Global integration of the natural radiocarbon yields an inventory of 1.8x1030 atoms with an uncertainty of approximately 15%.
At the time of GEOSECS, the measured and bomb radiocarbon signals were always highest at the ocean surface. While this was generally true for WOCE, some regions of the Pacific and Indian Oceans showed highest concentrations below the surface in the upper thermocline. This change is due to a decrease in the atmospheric source combined with mixing and upper ocean circulation. In general the radiocarbon penetration depth increased, however the change is relatively subtle for most regions. In the Atlantic, a small increase was found in North Atlantic Deep Water as far south as the Lesser Antilles (15N latitude).
Global integration of the bomb radiocarbon gives an inventory of 3.1x1028 atoms. This total is only marginally higher than earlier estimates using the GEOSECS data. Modeling results imply that the earlier inventory calculations were high by approximately 25%. Since the earlier measurements were of the same quality as the WOCE data, this implies that the earlier inventory estimates were biased simply due to a lack of data. The new inventory estimate is consistent with estimates based on atmospheric models and measurements. The highest column inventories are found in the North Atlantic, but high inventories are also found near the formation regions for North Pacific Intermediate Water and in the southern hemisphere associated subduction of Antarctic Intermediate Water and Subpolar Mode Water (Figure 1). Changes in these southern water masses can be traced on isopycnal surfaces almost to the Equator.
217

R. Key
2
FIG. 1.
218

EXTENDED SYNOPSIS IAEA-CN-118/121
TOPIC: PACIFIC AND SOUTHERN OCEANS
1
Distribution of Tritium (3H) in the Southern Ocean: Implications for Formation rates, Circulation Patterns and Mean Residences of Major Water Masses
P. Schlossera,b, B. Newtona, A. Spielera
a Lamont-Doherty Earth Observatory of Columbia University, Palisades, N.Y. 10964, USA
bDepartment of Earth and Environmental Engineering, and Department of Earth and Environmental Sciences, Columbia University, New York
E-mail address of main author: [email protected]
Tritium is a well-studied tracer for processes in the hydrosphere, including the oceans, continental surface waters and groundwater. The main portion of the tritium signals observed in the modern environment is due to its production during nuclear weapons tests, most of which were conducted in the 1950s and early 1960s. Most of the so-called bomb tritium was produced in the northern hemisphere resulting in a large north/south gradient in the oceanic tritium concentrations. This asymmetric oceanic tritium distribution with very low concentrations in the Southern Ocean requires tritium measurements in the mTU range to achieve sufficient resolution for application of tritium as tracer. Such low detection limits can only be achieved through mass spectrometric measurements of tritium by the 3He ingrowth method.
Over the past two decades high-precision tritium measurements based on the 3He ingrowth method were obtained from several sections in the Southern Ocean. Most of the sections are located in the Atlantic sector (Weddell Sea). The sections show that the surface waters in the Southern Ocean near the Antarctic continents are only ca. 100 mTU (0.1 TU). The deep waters have varying concentrations reaching from the detection limit of ca. 5 mTU to ca. 80 mTU in bottom waters near the formation areas of new Antarctic Bottom Water. The surface concentrations increase towards the north to concentrations of several hundred mTU.
We present distributions of tritium in the Southern Ocean and discuss the information that can be derived from them with respect to formation, circulation and mean residence of major water masses in the Southern Ocean. The interpretation is based on analysis of the tritium sections in the context of hydrographic properties, as well as on simple time-dependent mass balances or box models.
219

EXTENDED SYNOPSIS IAEA-CN-118/122
TOPIC: PACIFIC AND SOUTHERN OCEANS
1
Southern Hemisphere Ocean Tracer Study (SHOTS)
M. Aoyamaa, M. Fukusawa b, K. Hirosea, R. F. C. Mantourac, P. P. Povinecc,C. S. Kimd, K. Komurae
a Geochemical Research Department, Meteorological Research Institute, Tsukuba 305-0052, Japan
bOcean Research Department, Japan Marine Science and Technology Center, Natsushima, Yokosuka, Kanagawa 237-0061, Japan
c Marine Environment Laboratory, International Atomic Energy Agency, MC 98000 Monaco
dDept. of Radiological Safety Research, Korea Institute of Nuclear Safety, Yusong-Ku, Taejon, 305-338, Republic of Korea
e Low Level Radioactivity Laboratory, Institute of Nature and Environmental Technology, Wake, Tatsunokuchi, Ishikawa 923-1224, Japan
E-mail address of main author: [email protected]
Seawater samples were collected in 2003-2004 in the Southern Pacific, Atlantic and Indian Oceans during the BEAGLE (Blue Earth Global Expedition) cruise on the R/V MIRAI which was conducted by Japan Marine Science and Technology Center [1] with the aim to study present distribution of anthropogenic radionuclides as part of the joint Japan – IAEA project on the Southern Hemisphere Ocean Tracer Study (SHOTS). The main target radionuclides with the most frequent analyses are 137Cs, plutonium, tritium, radiocarbon and 90Sr, however, other radionuclides will be analysed as well, supported by oceanographic and non-radioactive analyses such as nutrients and CFCs.
The ship tracks are shown in Fig. 1. Sampling of surface seawater and water column were carried out during the legs 1, 2, 4 and 5. The number of stations where surface water sampling was accomplished is 93. This corresponds to horizontal spacing of around 290 km. The number of stations where water column sampling was carried out is 57 and the total amount of the water layers is 789. The layer depths were 100, 200, 400, 600, 800 and 1000 db in shallow depths. The layer interval of 500 db was applied below 1000db water depth to near a sea bottom. The sample volume for surface water was 80 L per station. Volumes of water column samples ranged from 5 to 20 L. The samples were filtered through a 0.45 µm pore size membrane filter and stored after adjusted pH to 1.6-2.0 by adding concentrated HNO3. For tritium measurements, 778 samples were collected and stored as non-acidified samples. Measurements of oceanographic parameters, general chemical analyses, analyses of nutrients and CFCs were carried out on the shipboard.
The main global source of anthropogenic radionuclides in the marine environment is fallout from atmospheric nuclear tests carried out between 1945 and 1980. Several global studies have been carried out in the world oceans [see e.g. 2, 3, 4], however, the Southern Ocean has not been covered well and data on the distribution, inventory and behaviour of anthropogenic
220

M. Aoyama et al.
2
radionuclides have been missing. Radionuclide data stored in the IAEA’s Global Marine Radioactivity Database (GLOMARD) [4, 5], as well as in the HAM Pacific database [6], includes only a few hundred records for 137Cs concentrations in seawater of the Southern Hemisphere Ocean, compared to several ten thousands records for the Northern Hemisphere Ocean.
Preliminary data on nutrients and oceanographic parameters will be presented and discussed with the aim to contribute to better understanding of water and heat transport from the equatorial regions to the Antarctic Ocean, a programme of relevance to global climate change studies.
FIG. 1. The BEAGLE cruise sampling legs.
[1] http://www.jamstec.go.jp/mirai/2003/data_2003.html. [2] LIVINGSTON, H.D., BOWEN, V.T., CASSO, S.A., VOLCHOK, H.L., NOSHKIN.,
V.E., WONG, K.M., BEASLEY, T.M., Fallout Nuclides in Atlantic and Pacific Water Columns : GEOSECS Data, Woods Hole Oceanog. Inst. Tech. Rep. WHOI-85-19 (1985).
[3] WORLDWIDE MARINE RADIOACTIVITY STUDIES (WOMARS), (POVINEC, P.P, Ed.), Deep-Sea Res. II, SI 50 (2003) 17-21.
[4] WORLDWIDE MARINE RADIOACTIVITY STUDIES (WOMARS). Radionuclide Levels in Oceans and Seas, IAEA TECDOC, IAEA, Vienna (in print).
[5] GLOBAL MARINE RADIOACTIVITY DATABASE (GLOMARD), IAEA-TECDOC-1146, IAEA, Vienna (2000).
[6] AOYAMA, M., HIROSE, K., Artificial radionuclides database in the Pacific Ocean: HAM database, The Scientific World 4 (2004) 200-215.
221

EXTENDED SYNOPSIS IAEA-CN-118/123
TOPIC: GROUNDWATER-SEAWATER INTERACTIONS
1
Environmental Isotope Investigation of Submarine Groundwater Discharge in Sicily, Italy
P. K. Aggarwala, K. M. Kulkarnia, P. P. Povinecb, L-F. Hanc, M. Groeninga
a Isotope Hydrology Section, International Atomic Energy Agency, Vienna
bMarine Environment Laboratory, International Atomic Energy Agency, Monaco
c Isotope Hydrology Laboratory, International Atomic Energy Agency, Vienna
E-mail address of main author: [email protected]
An important part of the continental water balance involves submarine groundwater discharge (SGD) [1]. Current estimates range from less than 10% to nearly 50% of the total riverine discharge into the oceans. As a result, SGD is increasingly being recognized as an important factor in the understanding and sustainable management of coastal freshwater aquifers in many areas of the world. In addition, SGD is a significant pathway for contamination of the near-shore marine environment from land-based activities.
Estimation of groundwater fluxes into the marine environment is complicated due to the fact that direct measurement is not possible by conventional means. Measurement of a range of isotopic tracers at the aquifer-marine interface provides the possibility to produce integrated flux estimates of discharge not possible by other non-nuclear methods. Within the framework of a coordinated research project of the IAEA and in cooperation with UNESCO, research work was initiated to develop isotope techniques for characterization of SGD. Together with the University of Palermo, Italy, the Sicilian coast was chosen for a pilot study based on various factors like availability of background information on geological setting, clear manifestation of SGD, local logistical support, and the Mediterranean Sea, which is a particularly vulnerable marine environment to fluxes of fresh and/or contaminated groundwater.
A reconnaissance sampling campaign was undertaken in 2001 and a few samples were collected and analysed for environmental isotopes. Twenty-three water samples from various sources like seawater, wells and springs were drawn in 2003 from different locations on the southwestern and southeastern parts of the Sicilian coast for isotope and chemical analyses. The samples were analyzed for 2H, 18O, 3H/3He, 87Sr, CFCs, etc. to better understand the submarine groundwater discharge process.
222

P. Aggarwal et al.
2
Fig. 1. Isotope studies suggest 30-40 % of fresh groundwater resource flows to sea as submarine groundwater discharge in Sicily.
Figure 1 shows the plot of δ18O versus δ2H of Sicilian samples. Groundwater and some of the springs lie close to the Mediterranean meteoric water line with δ18O values in the range of –4.5 to –6‰ (VSMOW). Coastal springs and wells, representing submarine groundwater discharge, have a value of about –2 to –3‰ δ18O and fall on a mixing line between groundwater and seawater. These samples may consist of about 30 – 40% fresh groundwater, implying high submarine groundwater discharge in the coastal areas. Tritium content varies from 1.47 ± 0.24 to 4.08 ± 0.30. The residence time of groundwater in the limestone formations of Sicily, based on 3H/3He measurements and CFCs, is estimated to range from about 2 to 30 years.
[1] TANIGUCHI, M., et al., Investigation of submarine groundwater discharge, Hydrol. Process. 16 (2002) 2115-2129.
223

EXTENDED SYNOPSIS IAEA-CN-118/124
TOPIC: GROUNDWATER-SEAWATER INTERACTIONS
1
Salt Water Intrusion in the Aquifers in the South Oriental Coastal Zones of Sicily
A. Aureli, A. M. G. Privitera
U.O. 4.17, National Group for the Defense from the Hydrogeological Catastrophes – G.N.D.C.I - C.N.R., Department of Geology and Geodesy, Palermo University, Palermo, Italy
E-mail address of main author: [email protected]
Along the oriental south coast Sicily are present a plurality of phenomenons of interest concomitant hydrogeological, they had focused the attention both of the Authorities of the control of the water resources and those of the researchers interested to the study of the environmental problems. The progressive salting up of the aquifers coastal it is becoming, in Sicily, one of the maximum problems. The causes of such phenomenon are well notes and resume in two terms: ground water mining and irrationality of the wells use. Every control's lack in the distribution of the wells and the wrong and having opposite effect modalities with which water is extracted, are to the origin of the instant lowering phenomenons and, finally, progressive of the piezometric level of the underground aquifer coastal. By now, in different coast lines, also to different kilometers from the shore- line, depression zones are found in which the dynamic level also reaches negative values some times superior to the 150 meters under the sea level and the static level also superior to the 60 meters always under the sea level. This situation determines, within the coastal aquifers, a rapids salt water intrusion with consequent progressive salting up of the sweet aquifers. Such pollution manifests it in very persistent way and alone slow the native conditions could also be recovered after the elimination of the phenomenon causes. The salinity increase in the underground aquifer it happens with greater rapidity and with so much greater gravity when aquifer is carbonatic type, as that of the study areas, that is interested from karst phenomenons and from tectonic fractures. The thematic that, under these conditions, attracted the attent ion of the researchers were: The underground runs of the submarine springs feeding, to be able to value possibility of earth intercept. The relationships established along the coastal lines, in the coastal aquifers, among sweet water and sea water and the preferential streets followed by intrusion. The pollutants diffusion, organic and chemical, particularly hydrocarbons and heavy metals, in the round waters and their dispersion in the sea water. The induced variations to the phenomenons above-mentioned, from the antropic interventions realized in the hinterland: obstruction dams, springs intercept, wells distribution and exploitation modality. A project, on purpose compiled, financed by UNESCO and IAEA, and finalized to the phenomenons study of which above, it has as object the possibility to experiment the methodologies applicability of isotopic analysis in the wells and springs study, with particular reference to those submarine, observing and attentively valuing the complexes relationships that coexist between underground waters and sea waters along the Sicily coastal regions. To such purpose has been formulated a research program based on the samplings and analysis of the springs waters individualized to inland and to sea and some wells on purpose selected present along the coast line from North Syracuse to South-West Donnalucata. We had retained opportune to effect, in coincidence with the seasonal variations, 4 series of annual drawing of water samples to be submitted to analysis chemical-physics; the study program had beginning with the first series
224

A. Aureli and A. Privitera
2
of samplings in the individualized zones in the March’s month 2002 and they still continues in the year 2004. In Figure 1 are brought the water points of which the periodic sampling is foreseen. The sampled points are 31, it are divided in the 5 zones: Zone A. - Ciane: n. 4 inland springs and n.5 wells; Zone B - Ognina: n. 1 submarine springs n. 2 wells; Zone C - Cassibile: n. 5 wells and 2 submarine springs; Zone D - Avola: n. 2 inland springs and n. 2 submarine springs; Zone E - Donnalucata: n. 5 wells and n. 2 submarine springs and n. 1 inland springs.
FIG. 1. Location of wells and springs (inland and springs).
The analyses are conducted by different groups of search of three Italian Universities and precisely:
1. Palermo University will effect the analyses inherent: Heavy metal (Pb, Cu, Co, Zn, Cd, Ni, As, Hg); Microcontaminants (NO2
-, NO3-, Ntot, PO4
3-, Ptot, NH3).
2. Bari University will effect the analyses inherent: Chemistry major (Ca, Mg, Na, K, Sr, Ba, Cl, SO4, NO3, Br).
3. Venice University will effect the analyses inherent: 14C
The radioisotopes study (Ra, Rn, U, etc.) it is submitted to the IAEA technicals. The periodical control of the characteristics chemical-physics of the wells waters and the springs (submarine and inland), it behaves extremely precise checks, based fundamentally, on the presence of natural isotopes of different elements. Such study, will consent the characterization of the spring waters also furnishing exact indications on their runs of feeding and discharge to sea.
[1] AURELI, A., ADORNI, G., CHIAVETTA, A.F., FAZIO, F, FAZZINA, S., Caratteristiche delle linee di flusso dell'intrusione marina influenzate dalla tettonica in area costiera ove gli acquiferi sono sovrasfruttati - Mem. Soc. Geol. Ital. 37 Roma (1987) 481-488, Pubbl. n.23 del G.N.D.C.I.
[2] AURELI, A., Esperienze e programmi di intervento in materia di ricarica delle falde, per contrastare l’intrusione marina in un acquifero carbonatico sovrasfruttato – IV Congr. Di Geoingegneria, Difesa e valorizzazione del suolo e degli acquiferi – Torino, 10-11 Marzo 3 1994, Ass. Mineraria Subalpina, Torino (1994) 813-818.
225

EXTENDED SYNOPSIS IAEA-CN-118/125
TOPIC: GROUNDWATER-SEAWATER INTERACTIONS
1
Hydrochemistry and Isotopic Characteristics of the Submarine Springs of South-Eastern Sicily
A. Aurelia , G. Barrocub, G. Cusimanoa, D. Fidelibusc, L. Gattoa, S. Hauserd, M. A. Schiavod, L. Tulipanoe, G. M. Zuppif
aDipartimento di Geologia e Geodesia, Università di Palermo, Palermo, Italy
bDipartimento Ingegneria del Territorio, Facoltà di Ingegneria, Cagliari, Italy
cPolitecnico di Bari, Via Amendola 126/b, 70126 Bari, Italy
dDipartimento di Chimica Fisica della Terra (CFTA), Università di Palermo, Palermo, Italy
eFacoltà di Ingegneria, Università di Roma “La Sapienza”, Roma, Italy
fDipartimento di Scienze Ambientali, Università Ca’ Foscari di Venezia, Venezia, Italy
E-mail address of main author: [email protected]
Karstic springs on Mediterranean environments are sensitive eco tops to hydrology in arid or semiarid areas and to paleohydrological changes during Holocene [1, 2]. Often these springs discharge below sea level, thus creating problems for a correct water resources management. A spectacular submarine spring row characterises the Southern Sicily offshore consisting of a wide carbonate plateau essentially formed by limestone and dolostones. Each single vent feature provides a unique opportunity to examine the onshore–offshore hydrogeologic processes, as well as point source submarine groundwater discharge. The marine carbonate of the Sicily Canal is one of the world's most productive aquifer systems. Parts of Sicily, Malta and other central Mediterranean islands almost entirely depend on this aquifer representing a reliable resource for municipal, agricultural and industrial water supply. The aquifer system in southern Sicily consists of interspersed limestone and dolomite strata. Impermeable beds confine the water-bearing zones under artesian pressure. Near the coast, Miocene and younger confining strata were eroded away, enabling direct hydrologic communication of carbonate ground water with coastal bottom waters. Mainland and offshore geology is illustrated by several geologic sections [3]. Groundwater is often under sufficient pressure. A relatively large volume of water is discharged from the aquifer system through terrestrial and submarine springs, and this upward flow is expected to issue also along the seaward side of the land/sea margin, possibly even out to the shelf break. Groundwater, spring and seawater were analyzed for a suite of constituents that included major solutes (Cl, Na, SO4, Mg, Ca, K, Sr, F, SiO2), nutrients, select trace elements (Mn, Mo, Ba, U, V, Fe), and environmental isotopes (2H, 13C 14C, 18O). The upper gradient groundwater indicate a salinity of around 0.5 mSiemens, whereas the coastal groundwater depict a salinity higher than 1.5 mSiemens, which is a partial dilution by ambient seawater during advection/mixing.
Chemical data indicate that the meteoric waters mentioned above were at varying extents modified along the flow paths before issuing from terrestrial and submarine springs. Considering the consistency of individual water point water chemistry, the chemical
226

A. Aureli et al.
2
interactions must approach chemical equilibrium or involve mineral reactions with very stable kinetics. Such chemical continuity is typical for groundwater with relatively long subsurface residence times. Waters discharging from these springs are presently at or near saturation with calcite.
Understanding the geochemical processes which lead to an increase in the TDS concentration of groundwater along the flow path and, for nutrients, to water pollution will enable better assessment and management of these coastal aquifers. At present, only some boreholes situated near the coast present significant fingerprint of marine intrusion.
In an attempt to identify the hydraulic connections between the various outlet points, groundwater was analyzed for stable and radioactive isotopes. The upgradient boreholes and springs are a mixture of present and older water on the basis of their relative low 14C values (32.1 pmc). The older component contains an even lower amount of modern Carbon. However, the undersaturation of the mixture with respect to calcite, its high aqueous CO2 content (up to 60 mg/L), and its enriched 13C values (- 1.8 to - 3.1‰) suggest intensive water/rock interactions, which would contribute 14C-devoid bicarbonates to the solution. Downgradient springs discharging along or below the Mediterranean coast contain groundwater contributions from higher altitudes, as evidenced by their depleted 18O and D composition with respect to the local precipitation [4, 5] however, a larger portion of the recent water component could be contributed from direct precipitation on the carbonate.
The hydraulic behaviour of such a structure is obviously dominated by conduit flow conditions, i.e. fast flow and short groundwater residence time. The rapid flow conditions occurring in the infiltration zones, illustrated by tracing tests experiments, are the cause of the typically high time and space variability of their hydraulic and geochemical characteristics. Thus, these aquifers are relatively small, unconfined and characterized by groundwater residence times of years to tens of years. Consequently, these aquifers are fragile systems that respond rapidly to natural and anthropogenic processes. Groundwater quantities in these aquifers usually respond to short- and long-term climatic fluctuations influencing the amount of recharge and therefore the amount of groundwater available for use. Consequently, it is vital to understand processes influencing recharge to these aquifers more than discharge processes.
[1] ANDREO, B., LIÑÁN, C., CARRASCO, F., JIMÉNEZ DE CISNEROS, C., CABALLERO, F., MUDRY, J., "Influence of rainfall quantity on the isotopic composition (18O and 2H) of water in mountainous areas", Application for groundwater research in the Yunquera-Nieves karst aquifers (S Spain), Appl. Geochem. 19 4 (2004) 561-574.
[2] VANDENSCHRICK, G., VAN WESEMAEL, B., FROT, E., PULIDO-BOSCH, A., MOLINA, L., STIÉVENARD, M., SOUCHEZ, R., Using stable isotope analysis (D–18O) to characterise the regional hydrology of the Sierra de Gador, south east Spain, J. Hydrology 265 1-4 (2002) 43-55.
[3] CATALANO, R., DI STEFANO, P., SULLI, A., VITALE, F.P., Paleogeography and structure of the central Mediterranean: Sicily and its offshore area. Tectonophysics 260 4 (1996) 291-323.
[4] CELLE-JEANTON, H., GONFIANTINI, R., TRAVI, Y., SOL, B., Oxygen-18 variations of rainwater during precipitation: application of the Rayleigh model to selected rainfalls in Southern France, J. Hydrology 289 1-4 (2004) 165-177.
[5] LONGINELLI, A., SELMO, E., Isotopic composition of precipitation in Italy: a first overall map, J. Hydrology 270 1-2 (2003) 75-88.
227

EXTENDED SYNOPSIS IAEA-CN-118/126
TOPIC: GROUNDWATER SEAWATER INTERACTIONS
1
Investigation of Submarine Groundwater Discharge in Sicilian and Brazilian Coastal Waters Using an Underwater Gamma-Spectrometer
I. Levy-Palomo, J. F. Comanducci, P. P. Povinec
Marine Environment Laboratory, International Atomic Energy Agency, 4 Quai Antoine 1er, MC 98000 Monaco
E-mail address of main author: [email protected]
Submarine groundwater discharge (SGD) has been recognised as an important pathway for material transport to the marine environment. Groundwater discharges are important for the marine geochemical cycles of elements and can lead to environmental deterioration of coastal zones. While the major rivers inputs to the ocean are gauged and well analysed, thus allowing relatively precise estimates of fresh water and contaminants inputs to the ocean, assessing groundwater fluxes and their impacts on the near-shore marine environment is much more difficult, as there is no simple means to gauge these fluxes (and contaminants) to the sea. SGD to the world ocean may be as high as 50% of total river runoff in temperate and tropical forested regions, as well as in karstic regions.
Under an IAEA’s Co-ordinated Research Project “Nuclear and Isotopic Techniques for the Characterisation of Submarine Ground Water Discharge (SGD) in Coastal Zones” carried out together with the IAEA’s Isotope Hydrology Section, and in co-operation with UNESCO, joint investigations have been carried out offshore of south-eastern Sicily and in Ubatuba coastal areas in Brazil, using radioactive and stable isotopes. In this presentation we shall concentrate on an application of in situ gamma-ray spectrometry in SGD investigations.
In situ gamma-ray spectrometry has been recognized as a powerful tool for analysis of gamma-ray emitters in sea-bed sediments, as well as for continuous analysis of gamma-ray emitters in seawater (e.g. 137Cs). However, there were no trials to use the in situ gamma-ray spectrometry for investigations of SGD. Following successful operations of IAEA-MEL’s in situ gamma-ray spectrometers in a continuous mode, it has been possible to apply this technique for continuous monitoring of radon (as well as thoron) decay products in seawater, as possible indicators of SGD in coastal zones.
FIG. 1. In situ gamma-spectrometric measurements in Sicily (left) and 214Bi counting rate vs salinity and tide.
20-21-22 March 2002
coun
t rat
e (s
-1)
0.10
0.15
0.20
0.25
0.30
0.35
0.40
Sal
inity
(0 / 00)
34.0
34.5
35.0
35.5
36.0
36.5
37.0
37.5
38.0
g T
ide
(cm
)
182
184
186
188
190
192
194
196
198
200
17h0
0
19h0
0
21h0
0
23h0
0
1h00
3h00
5h00
7h00
9h00
11h0
0
13h0
0
15h0
0
17h0
0
19h0
0
21h0
0
23h0
0
1h00
3h00
5h00
7h00
9h00
228

I. Levy-Palomo et al.
2
The IAEA-MEL’s in situ gamma-ray spectrometer used in 2002 and 2003 expeditions in Sicilian [1] and Brazilian coastal waters [2] consisted of an NaI(Tl) detector coupled with electronics and a data acquisition system enabling to sample gamma-ray spectra in regular intervals and to calculate activities of 40K, and 238U and 232Th (or their decay products – for radon measurements usually 214Bi for 222Rn and 208Tl for 220Rn).
In situ gamma-ray measurements carried out in the Donnalucata port (Sicily) from 20 to 22 March 2002 showed clear anti-correlation between the counting rate (in the window of 214Bi, representing 222Rn) and the salinity records, indicating a pumping effect of tide on the flux of SGD in the location.
A similar effect has been found during in situ gamma-ray measurements carried out in the Flamengo bay (Brazil) from 20 to 22 November 2004.
[1] POVINEC, P.P., et al. Applications of isotopic techniques in characterisationsubmarine ground water discharge offshore of south-eastern Sicily – SGD Collaboration (in preparation).
[2] POVINEC, P., COMANDUCCI, J.F., LEVY-PALOMO, I., SILVA, N., OLIVEIRA, J, Assessment of groundwater discharge via in situ underwater gamma-spectrometry and natural radionuclides in Ubatuba coastal area (in preparation).
Cou
nt ra
te (s
-1)
0.00
0.05
0.10
0.15
0.20
0.25
0.30
0.35
0.40
Sal
inity
(0/0
0)
33.8
34.0
34.2
34.4
34.6
34.8
35.0
35.2
g T
ide
(cm
)
4.2
4.4
4.6
4.8
5.0
5.2
5.4
5.6
5.8
22 Nov 2003 23 Nov 2003 24 Nov 2003 25 Nov 2003 26 Nov 2003
Development of sal ini ty, t ide and 214Bi count rate at Base with t ime
229

EXTENDED SYNOPSIS IAEA-CN-118-127
TOPIC: GROUNDWATER-SEAWATER INTERACTIONS
1
Radium Isotopic Tracers of Submarine Groundwater Discharge into the Venice Lagoon
E. Garcia-Solsonaa, P. Masquéa, J. Rapagliab, H. Bokuniewiczb, L. Zaggiac, F. Collavinic, J. K. Cochranb, J. M. Zuppid, J. A. Sanchez-Cabezaa, A. Beckb
a Institut de Ciència i Tecnologia Ambientals, Universitat Autònoma de Barcelona (ICTA-UAB), Bellaterra, Spain
bMarine Sciences Research Center, Stony Brook University (MSRC-SBU), Stony Brook, NY, USA
cConsiglio Nazionale delle Ricerche, Istituto di Scienze Marine (CNR-ISM), Venice, Italy
dDipartimento Scienze Ambientale, Universita Ca Foscari de Venezia, Venice, Italy
E-mail address of main author : [email protected]
Radium isotopes were used in conjunction with direct measurements to assess the discharge of groundwater across the northwest section of the Venice Lagoon floor about eight kilometers from the city. This is an area of about 50 square kilometers of marshland dissected by channels. The lagoon sits atop a series of nine unconsolidated or semi-consolidated aquifers with a total thickness of about 1000 meters [1]. The surrounding land is of low relief, unlikely to support any substantial, water-table hydraulic gradient, but free-flowing artesian wells are found. Water samples for radium analysis were collected along three transects in May and June 2004. End-member samples were also collected in the Adriatic Sea, a nearby artesian well and two surface wells (near the Sile River) on the mainland. Over 250 direct measurements of submarine groundwater discharge were made over the course of nine months using benthic chambers vented to a plastic collection bag.
Up to two orders of magnitude of difference in short-lived radium (223Ra and 224Ra) activities were observed in surface waters. These values were comparable to those reported in coastal settings elsewhere where SGD has already been estimated [2]. Indeed, high activities were measured in a well sample from the marsh as well as in water collected from the benthic chambers. Enrichment was also observed in the artesian well. On the contrary, low levels of radium isotopes were determined in river, land wells and Adriatic waters. Overall, these results point to a substantial groundwater source to the lagoon. The surface water seems to be a mixture of at least four sources: the Adriatic, upward leakage from deep confined aquifers (the Artesian wells), near surface groundwater and rivers. A multiple end-member mixing model allows estimates of the contribution of each source. Direct measurements showed a high degree of variability with discharge rates ranging from five cm3/cm2/day to over 200 cm3/cm2.day. Higher discharge rates tended to be found deeper in the channels possibly where the channel cuts through a local aquitard. Nutrient analyses from the benthic chamber and ambient water samples show a concentration of ammonium in the seepage device water which is four to eight times greater than that of ambient water samples. The average seepage device ammonium concentration was 325 ppb while it was 50 ppb in the ambient water. The
230

E. Garcia-Solsona et al.
2
circulation of groundwater through the marshes seems to be augmented with groundwater driven across the sea floor from deeper artesian aquifers that may be a significant source of ammonium to the lagoon. A second site in the industrial sector of the lagoon was also examined.
[1] CARBOGNIN, L., GATTO, P., MOZZI, G., Guidebook to Studies of Land Subsidence due to Ground-Water Withdrawal, IAHS-AISH 121 (1977) 65-81.
[2] CHARETTE, M.A., BUESSELER, K.O., Submarine groundwater discharge of nutrients and copper to an urban subestuary of Chesapeake Bay (Elizabeth River), Limnol. Oceanogr. 49 2 (2004) 376-385.
231

EXTENDED SYNOPSIS IAEA-CN-118/128
TOPIC: GROUNDWATER-SEAWATER INTERACTIONS
1
Submarine Groundwater Discharge (SGD) along the Mediterranean Coast of Israel
Y. Weinsteina, B. Herutb, G. Lessaa, B. Burnettc, P. Swarzenskid, Y. Yechielie, U. Kafrie
a Department of Geography, Bar-Ilan University, Ramat-Gan 52900, Israel
bDepartment of Chemistry, Israel Oceanographic and Limnological Research, Haifa, Israel
cDepartment of Oceanography, Florida State University, Tallahassee, Florida
dDepartment of Chemical Oceanography, US Geological Survey, St. Petersburg, Florida
eThe Geological Survey of Israel, Malkei Israel 30 st., Jerusalem, Israel
E-mail address of main author: [email protected]
In the Mediterranean coast of Israel, two aquifers are draining to the sea – the Pleistocene coastal granular aquifer and the Cretaceous carbonate one. The Pleistocene aquifer consists of interlayered Nilotic sandstone, calcareous sandstone, siltstone, loam, and marine clays, which form several sub-aquifers, with total thickness of 100-200 meters. The upper sub-aquifer of about 50 m thickness is phreatic, while the lower ones are confined and there is a possibility that they drain to the sea in their submarine exposure along the continental slope, some 20-30 kms offshore. The carbonate aquifer is mainly confined, but drains to the sea at several locations along the northern coast. The northern coast is also characterized by many young, recently active, transversal faults, some of them are already known for being major pathways for seawater intrusion into the aquifers.
Recently, we started a research of SGD along the Israeli coast, focusing on the role of transverse faults in SGD and on the proportions of recycled seawater in this discharge. The project involves geochemical tracing and continuous in-situ measurements of flow rates and solute fluxes, as well as a detailed ecological study of the coastal water. The geochemical tracing includes the study of Rn and the Ra quartet, as well as salinity and nutrients. Flow rates and solute fluxes and their temporal patterns will be determined using newly developed methodology, which apply the osmotic pumping principle to the in-situ continuous sampling of seawater and pore water. Tracing the profiles of a dye tracer previously injected into the sediment, flow rates as low as few cm/yr can be determined. Together with chemistry of pore fluids, this will allow the determination of fluxes of solutes, and especially of nutrients, into the coastal seawater. In the ecological part of the project, we will focus on the variability in microbial autototrophic and heterotrophic communities in relation with SGD-induced differences in the input of nutrients (nitrate, nitrite, phosphate, ammonium, silica) and other dissolved anthropogenic constituents (e.g. radium, polonium and heavy metals).
Preliminary analyses of surface water along the Israeli coastline at 13-40 meter bottom depth (Figure 1a) show relatively high concentrations of 222Rn (40-50 dpm/100kg, excess argon - 30-40 dpm/100kg) with a peak at the Haifa bay (82 dpm/100kg ). A transect taken
232

Y. Weinstein et al.
2
perpendicular to the coastline (Figure 1b), from Haifa to the northwest, shows a peak above the continental slope at bottom depth of 600 meter (62 dpm/100kg) with very low 226Ra content (3 dpm/100kg), implying the possible existence of a local plume. The source for this anomaly should be further studied.
b a
FIG. 1. Rn activities in surface water (8-12 m depth): a. along a transect from Haifa to Tel-Aviv (March 2004), bottom depths vary between 13 and 40 m; b. along a transect from Haifa westwards (toward Cyprus, Feb. 2004).
b
233

EXTENDED SYNOPSIS IAEA-CN-118/129
TOPIC: GROUNDWATER-SEAWATER INTERACTIONS
1
Groundwater Inputs via 222Rn and Ra Isotopes off Ubatuba, Brazil
W. C. Burnett, R. Peterson, H. Dulaiova
Department of Oceanography, Florida State University, Tallahassee, FL 32306 USA
E-mail address of main author: [email protected]
The principal reason that groundwater discharge estimates have not attained the precision that is typically achieved of other oceanic inputs is that the direct discharge of groundwater into the coastal zone is inherently very difficult to measure. Concerted efforts are required to improve this situation by integrated application of hydrological and oceanographic techniques. In order to develop the scientific and technical knowledge that will enable these issues to be addressed with a higher degree of certainty, UNESCO (IOC and IHP), together with the IAEA, has developed a 5-year program which includes intercomparison experiments in different coastal environments. An important aspect of our program is to disseminate the results widely, to coastal managers and other relevant parties, in the hopes that national authorities will encourage the scientific community to investigate these phenomena properly. We present here our isotopic results from the 3rd intercomparison experiment held in Ubatuba, Brazil November 16-22, 2003.
We used a combination of radioisotopic tracers (222Rn and Ra isotopes) to estimate SGD fluxes and exchange rates during the Brazil intercomparison These tracers work because they display large concentration differences in groundwater relative to ocean water and behave conservatively (or nearly conservatively) in seawater. The short-lived radium isotopes (223Ra and 224Ra) are introduced near shore either by SGD or surface inputs and decrease away from shore as a result of radioactive decay and mixing. Since the decay terms are known precisely (the half-lives of 223Ra and 224Ra are 11 and 3.66 days, respectively), we can assess exchange rates by examination of the onshore-to-offshore distributions.
We measured the distribution of radon in the surface waters using a newly developed multi-detector radon system Three detectors were fed surface seawater from a submersible pump while being towed from a boat at an average speed of about 7 km/hr. Each detector is set to integrate counts over a 30-minute period and the detectors are run out of sequence by 10 minutes. Thus, a data point is recorded every 10 minutes. The results (Fig. 1a) show that there are definite areas of higher radon in the two embayments investigated. The highest area was along a rocky shoreline in the north central area of Flamengo Bay. We observed small springs in this area that consistently showed up as positive radon anomalies with lower salinities.
At the same time we were conducting the radon survey, we towed “Mn fibers” in a mesh bag behind the boat for periods of 30-40 minutes for determination of radium isotopes. The results for the 224Ra/223Ra activity ratio (Fig. 1b) show that there is a systematic trend from high ratios near shore and steadily decreasing ratios as one moves offshore. We consistently measured high ratios (~25) in the same area of north central Flamengo Bay where the high 222Rn activities were observed.
234

W. Burnett et al.
FIG. 1. Distribution of 222Rn (left, dpm/L) and the 224Ra/223Ra activity ratio in surface waters off Flamengo Bay.
The radium isotopic results may be used to estimate residence times of the water, assuming that the radium enters into the coastal waters with a constant isotopic composition:
t
t
iobsee
RaRa
RaRa
223
224
223
224
223
224
λ
λ
−
−
=
where [224Ra/223Ra]obs and [224Ra/223Ra]i represent the observed and initial activity ratios of the radium source water. Based on an initial activity ratio of 27 (the highest measured in Flamengo Bay) and a ratio of 5.3 near the end of our transect line at approximately 10 km offshore, we estimate a residence time of approximately 12.6 days.
We estimated SGD rates from continuous measurements of 222Rn at a fixed location within the interior portion of Flamengo Bay. Net 222Rn fluxes were determined by evaluating the change in inventories over each measurement interval after making appropriate allowances for tidal fluctuations and atmospheric evasion. Mixing with offshore waters is also accounted for and is estimated based on inspection of the calculated radon net fluxes or independently by use of short-lived Ra isotopes. The estimated SGD rates ranged from 0-15 cm/day and showed a similar pattern as seen by automated seepage meters that were also deployed in the area. It is clear from these results that the advection of pore water fluids across the seabed is not steady state but episodic with a period that suggests tidal forcing or modulation. Most of the seepage spikes we observed occurred during a transition from high tide to low tide. The highest flow events occurred on Nov. 17th, a period during which the highest rainfall was also recorded.
235

EXTENDED SYNOPSIS IAEA-CN-118/130
TOPIC: GROUNDWATER-SEAWATER INTERACTIONS
1
Coastal Water Exchange Rates at the Southeastern Brazilian Margin, using Natural Ra Isotopes as Tracers
J. de Oliveiraa, M. Charetteb, M. Allenb, V. V. Furtadoc
Instituto de Pesquisas Energéticas e Nucleares, São Paulo SP, Brazil
Woods Hole Oceanographic Institution, Woods Hole MA, USA
Instituto Oceanográfico da Universidade de São Paulo, São Paulo SP, Brazil
E-mail address of main author: [email protected]
The knowledge of the four natural Ra isotopes in aqueous systems can be used to constrain important environmental processes occurring at the land-sea margin. The high variability of the 226Ra/228Ra activity ratio in waters, as has been reported by several authors [1-3], clearly demonstrates the suitability of Ra isotope relationships do determine fluxes and mixing rates of continental waters into oceans and estuaries and exchanges between ground water and surface water.
Two main geochemical characteristics control the production and input of Ra isotopes in coastal areas: the existence of particle-reactive Th isotopes in sediments as its direct radiogenic parents and the vastly different environmental behavior of Ra in fresh water and salt water media. The short- lived Ra isotopes of the 232Th series, which are highly depleted in the ocean basins due to their rapid decay and the strong depletion in parent Th isotopes, have been used to track advection from the coasts. Because of the 5.7 year half- life of 228Ra, this isotope has been used effectively to estimate oceanic horizontal eddy diffusivities and coastal water residence times over timescales of less than 30 years. By using both 228Ra and 224Ra (t1/2= 3.7 days), timescales of less than 10 years can be investigated.
In this paper, to assess the cross-shelf Ra distributions in São Paulo Bight, four shore-perpendicular profiles were collected up to 100 km offshore from 23 to 26 February 2003 (summer), on board the R/V Prof. Besnard. The São Paulo Bight is the arc-shaped part of the southeastern Brazilian margin extending from 23°S to 28°S. All samples studied here were taken in the selected area between latitudes 23°15’S and 25°50’S and longitudes 44°W and 46°W, in order to estimate coastal mixing rates and ground water discharge fluxes (Fig. 1). This region is considered a tropical coastal area and the main geologic/geomorphologic feature is the presence of granites and migmatites of a mountain chain locally called Serra do Mar (altitudes up to 1,000 meters), which reaches the shore in almost all of the study area, and limits the extension of the drainage systems and of Quaternary coastal plains. Wave action is the most effective hydrodynamic phenomenon responsible for the bottom sedimentary processes in the coastal area as well as in the adjacent inner continental shelf. The terrestrial input of sediments is strongly dependent on the rainfall regime, leading to a higher contribution of sediments during summer season. During the summer, the advance of the South Atlantic Central Water (SACW) over the coast leads to the displacement of the Coastal Water (CW), rich in continental suspended materials, and to the transportation of these sediments to the outer portions of the continental shelf. During winter, the retreat of the
236

J. de Oliveira et al.
2
SACW and the decreasing of the rainy levels restrict the input of sediments from the continental areas.
The activity concentrations of 223Ra in surface sea water varied from 0.2 to 41 mBq 100 L-1, 224Ra in excess from 2.0 to 253 mBq 100 L-1, 226Ra from 122 to 181 mBq 100 L-1 and 228Ra from 39 to 442 mBq 100 L-1. The 223Ra/224Ra activity ratios observed in sea water samples ranged from 0.3x10⁻¹ to 13, whereas 228Ra/226Ra AR varied in the interval from 0.3 to 2.4. These results seems to indicate that Ra isotopes from 232Th series prevail in a major number of samples, when compared with Ra isotopes from 238U and 235U series.
Considering the results obtained in the summer 2003, shore-perpendicular profiles of 223Ra and 224Ra in surface waters along the coast were modeled to yield eddy diffusion coefficients. The results were also corrected by mixing, using the activities of 223Ra normalized to 228Ra.
FIG. 1. Location of the sea water sampling stations, collected on the São Paulo State continental margin, Southeastern Brazil. Ilha Grande bay horizontal profile is represented by IG, Ubatuba by UB, São Sebastião by SS and Santos by SB.
Acknowledgements – This work was supported by IAEA, Research Contract N°12151, as a part of Co-ordinated Research Project “Nuclear and Isotopic Techniques for the Characterization of Submarine Groundwater Discharge (SGD) in Coastal Zones”.
[1] MOORE, W.S., Large ground water inputs to coastal waters revealed by 226Ra enrichments, Nature 380 (1996) 612-614.
[2] RAMA, MOORE, W.S., Using the radium quartet to estimate water exchange and groundwater input in salt marshes, Geochim. Cosmochim. Acta 60 (1996) 4645-4652.
[3] CHARETTE, M.A., BUESSELER, K.O., ANDREWS, J.E., Utility of radium isotopes for evaluating the input and transport of groundwater derived nitrogen to a Cape Cod estuary, Limnol. Oceanogr. 46 (2001) 465-470.
237

SAMPLE EXTENDED SYNOPSIS IAEA-CN-118/131
TOPIC: GROUNDWATER-SEAWATER INTERACTIONS
1
Assessment of Groundwater-Seawater Interactions in the Aral Sea Basin and Pollution Control
E. Kontara, A. Salokhiddinovb, N. Takhirovb
a P.P. Shirshov Institute of Oceanology, Russian Academy of Sciences (PSIO RAS), Moscow, Russian Federation
bNational University of Uzbekistan (NUU), Tashkent, Uzbekistan
E-mail address of main author: [email protected]
The territory of the Aral Sea Region is known as an ecological disaster zone. Health specialists have identified high and increasing mineralisation of potable water, and also the abundance of highly toxic pollutants (mainly pesticides) in water, air and food, which contribute to the deterioration of the population's health. It is now obvious that, in order to provide reasonable living conditions to the population, it is first of all necessary to drastically improve the quality of the water dedicated to human needs. Due to their intensive pollution by industrial wastes and by drainage waters from irrigated fields, the Syr Darya and Amu Darya rivers can no longer be considered as a source of safe and sustainable water supply. In such a situation, a number of scientists consider that the population's water supply must be achieved through a more comprehensive use of fresh and even subsaline groundwater resources.
According to the data obtained during our work on the INTAS 1003/1014 projects in 2003-2004, the Aral Sea coastal aquifers, intruding seawater through the free connection to the sea is mixed with and measurably diluted by groundwater derived from land drainage. Hydrological changes associated with poor water management, climate change and desertification in the Aral Sea region put question marks on long-term submarine groundwater discharge (SGD) development and the possibilities for its modelling and quantification. In order to meet this objective, we used, extend, compare and combine SGD results from different site-specific numerical simulations of groundwater outflow, and associated seawater intrusion and re-circulation in coastal aquifers. We simulated the groundwater dynamics in three different aquifers of the Aral Sea region.
Our field trips/sampling and data collection have shown that the problem of public water supply in the Aral Sea Region is still extremely acute because of the absence of fresh water sources. Surface waters are polluted with salt. They have very high mineralization in the level up to 3-4 g/l and even more at rigidity 25-35 milligram/l. One of the promising approaches to solve this problem is the extended and sustainable use of groundwater, but our studies also have shown that in the Aral Sea coastal aquifers, intruding seawater through a free connection to the sea is mixed with and measurably diluted by groundwater derived from land drainage. This dynamic mixing, or salinity transition zone constitutes an estuary that may be of great importance for the Aral Sea ecosystem by supplying nutrients to the seawaters. We simulated large-scale dynamics of groundwater discharge to the Aral Sea in three different aquifers of the Aral Sea Basin. We subjected these aquifers to a wide range of boundary and management conditions and changes in net water drainage from land. The resulting groundwater discharge at steady state is quantifiable and predictable by simple linearity in the net land-determined
238
E. Kontar et al.
2
groundwater drainage, defined as total groundwater drainage minus groundwater extraction in the land aquifer system. This linearity appears to be general and independent on site-specific, variable and complex details of hydrogeology, aquifer hydraulics, streamlines and salinity transition zones in different geological systems of the Aral Sea Basin. We find analogous generality in the groundwater and seawater components of groundwater discharge, which along with the linearity in total groundwater discharge may facilitate a relatively simple, generic approach to the groundwater modelling and prediction over the Aral Sea Basin under present and potentially changed future conditions due to climate change and desertification in the Aral Sea Region.
The analyses of conditions of groundwater-seawater interactions of the Aral Sea basin has shown that the conditions, changed for the last decade, water exchange and, in particular, sea level, require more precise calculation of values of an underground flow. First of all we propose a clear formalization of geological- lithological and hydrodynamic conditions of the flow within the seawater area. At the same time the Aral-Kyzylkum (Arkhangelsk) swell should be considered as an internal bordering condition for the model.
The conclusions of studies brought opinion about increasing the SGD or groundwater inflow into the Aral Sea due to the drop of its water level comparably real hydrodynamic condition is not quite right, because more then 30% of pressured groundwater in northeastern, eastern and southeastern parts of the basin is being used for decentralized water supply purposes. Now one of the critical issues in the region is to improve water supply systems for populated and agricultural zones using groundwater resources of higher cretaceous aquifers. This aspect does not kill the hope that the increase of SGD or inflow of pressured groundwater into the Aral Sea can stabilize its level at a certain range. But the share of groundwater in the seawater balance was not significant and it will decrease year by year due to increased use of groundwater for water supply purposes. It is appeared a hydrology-hydrogeological situation in the former and current Aral Sea water area causing the change in groundwater flow turning it into opposite direction from water area to transit zone of artesian basin. Such an inversion will be observed from the moment of reaching the borders of piezometric depression in pressured layer that are being formed by the intake of groundwater within territory by Arkhangelsk swell. It obvious that the quantitative parameters of such situation could be obtained by above proposed method of simulation. The non- linear non-steady filtration model operating as the input available observational data and results of the previous model calculations, updated by experiment is proposed as an instrument for studying the flow of the multicomponent system of groundwater-seawater interactions in the Aral Sea region.
The estimations, obtained for vertical filtration as 5.1-5.3 m³/? and 6.3 m³/?, have allowed calculating specific values of a pressured groundwater inflow on the floor space of the Aral Sea. The results have shown considerable dimensional heterogeneity of values of an inflow of water. The model for groundwater filtration for a case of two aquifers was proposed assuming a horizontal filtration in aquifers and vertical in stratums with low water conductivity property. Unlike balance methods, this model has enabled to calculate allocation of groundwater discharge, running in hollow, on the floor space of a water body and to calculate dimensional filtration arguments on the basis of a solution of an inverse stationary problem. In assumption of laminated water bearing pattern of depositions with common field infiltration as uniform water bearing complex, the author proposed that the main flow of water in this stratum takes place in a horizontal direction and for sectioning water bearing stratum the preferential flow of waters is in a vertical direction. The obtained results have revealed that the main groundwater discharge takes place by overflow through low conductivity stratum on beads of hollow.
Support for the analyses was provided by grants from INTAS (Projects # 1003/1014).
239

EXTENDED SYNOPSIS IAEA-CN-118/132
TOPIC: GROUNDWATER-SEAWATER INTERACTIONS
Contribution of Environmental Isotopes in the Identification of Groundwater Salinization Mechanisms in the Lower Tagus - Lower Sado Basin – Portugal
P. M. Carreiraa, P. A. Galego Fernandesa,b, D. Nunesa, M. F. Araújoa, M. O. Silvab
a Instituto Tecnológico e Nuclear (ITN), Environmental Analytical Chemistry Group, Sacavém, Portugal
bCentro de Geologia, Faculdade de Ciências da Universidade de Lisboa (FCUL), Lisboa, Portugal
E-mail address of main author: [email protected]
The Lower Tagus – Lower Sado Basin is located in Setúbal-Lisbon region and represents an important water resource for a vast region. The highly populated urban and industrialized areas of Setúbal and Lisbon are supplied by this system, which has been extensively exploited over the last decades. In order to find out the source of salinization in the groundwater systems chemical (Cl-, HCO3
-, SO42-, Ca2+, Mg2+, Na+ and K+) and isotopic analyses (δ2H,
δ13C, δ18O, 3H and 14C) were performed on groundwater samples collected in 39 boreholes. In the region under investigation there is a growing concern that these groundwater systems maybe threatened by further exploitation (not controlled) due to mixing with the shallow aquifers (highly polluted), seawater intrusion processes in the coastal areas, or either by brine dissolution detected in depth by geophysical studies [1].
From the geological point of view the Lower Tagus – Lower Sado Basin is characterized by a synclinal structure composed by Tertiary sediments, mainly marine deposits. Three main groundwater systems can be identified in the region: a shallow quaternary aquifer constituted by alluvial deposits presenting high transmissivity values, underlied by the Pliocene and Miocene formations. Sandstones and limestones of marine origin related with different marine transgression and regression events compose the Miocene deposits. These deposits show an average thickness around 200 to 300 m, although in the central part of the basin these values increase up to 800 m. Fluvial terraces made of sands and clays represent the Pliocene layers. Geophysical studies performed in the region, reveal two important fault systems. The first located in the Lower Tagus valley with a N30ºE direction, and the other the so-called Setúbal - Pinhal Novo fault runs N-S and is responsible for a graben structure which allows the rising of a brine formation or ancient seawater trapped in the sediments [1].
The hydrochemical evolution is characterized by a progressive increase in the total dissolved solids varying from 80 mgL-1 up to 2565 mgL-1 in the Pliocene aquifer while in the Miocene the mineralization varies between 200 mgL-1 to 7800 mgL-1. In the central part of the basin, where waters are used for public and agriculture supply, an increase of the water salinization was detected. The Cl- and Na+ increase in the groundwater is most probably associated with the graben structure, responsible for the rising of the brine to minor depths. Two different evolution trends were identified in the ratio Ca/Na: the first reflecting seawater mixing and the other with higher Ca content characterizing most probably the brine dissolution (Fig. 1).
240

P. Carreira et al.
No tritium was found in Miocene water samples, however in the shallow aquifer the 3H content range from 1 to 3 TU. Radiocarbon was determined in 12 boreholes on the Total Dissolved Inorganic Carbon (TDIC). The range of values varies from 71.9 ± 0.7 pmc to 88 ± 0.8 pmc in the Pliocene, and from 2.9 ± 0.3 pmc to 45.6 ± 0.9 pmc in the Miocene. The apparent carbon-14 groundwater age was estimated using δ13C values as correction factor [2], and the apparent ages vary between modern (borehole 31 – sea water intrusion) and 25.4 ± 3.3 ka (borehole 3). It is important to notice that all analysed water samples show a Saturation Index (SI) for calcite lower than –1.69, simultaneously the δ13C measured in the TDIC of the groundwater samples is around –10o/oo. The observed relation, between the apparent carbon-14 groundwater age and the electrical conductivity or the Cl- content reveals an interesting pattern (Fig. 2). In fact, a dispersion of the samples boreholes with the increase of salinization and apparent groundwater age can be observed, pointing out to brine dissolution mechanism (southern part of the basin) as the mechanism responsible for the deterioration of the water quality.
However, a different origin of the salinization was identified in Almada region (northern part of the basin): the results are pointing to recent seawater intrusion as the main mechanism responsible for the salts increase in the groundwater (Fig. 2).
[1] ASTIER, J.L., Étude des resources en eaux souterraines de la Péninsule de Setúbal –
Portugal. Geophysique – noveaux resultats de la prospection electrique, UNDP – UNESCO, Direcção Geral dos Serviços Hidráulicos, Lisboa (1979).
[2] SALEM, O., VISSER, J.M., DRAY, M., GONFIANTINI, R., Groundwater flow patterns in the Western Libyan Arab Jamahiriya evaluated from isotopic data, arid-Zone Hydrology: Investigations with Isotope Techniques (Proc. Advisory Group Meeting), IAEA (1980) 165-179.
0
25
50
75
100
Cl (
meq
/l)
0 5 10 15 20 25 30 Apparent 14C age (ka)
3 4 31
39
38
JK1AC1
Frisado
5
21
27
32
Miocene
Pliocene
Mio-Pliocene
seawater intrusion
Brine dissolution or ancient seawater
FIG. 2. (a) – Distribution of Cl- content (meqL-1) in the groundwater samples. (b) Cl- content as a function of the apparent 14C groundwater age.
a b
0
5
10
15
20
25
30
35
0 3 6 9 12 15
Calcium (meq/l)
Sod
ium
(meq
/l)
Miocene
Pliocene
Mio-Pliocene
FIG. 1. Sodium content as a function of calcium concentration.
241

EXTENDED SYNOPSIS IAEA-CN-118/133
TOPIC: GROUNDWATER-SEAWATER INTERACTIONS
1
Biogeochemical Consequences of Submarine Groundwater Discharge in the Coastal Ocean
G. Kima, D.-W. Hwangb, Y.-W. Leea, K. S. Parkb
a School of Earth & Environmental Sciences, Seoul National University, Seoul, Korea
bDepartment of Oceanography, Pukyong National University, Busan, Korea
E-mail address of main author: [email protected]
The nutrient inputs through the submarine discharge of fresh, brackish, and marine groundwaters may be comparable to the inputs through river discharge in the coastal ocean [1]. However, the biogeochemical influences of submarine groundwater discharge (SGD) in the coastal ocean are poorly understood. We present the biogeochemical and ecosystem changes in the coastal ocean due to the submarine discharge of nutrients in the South Sea of Korea.
We estimated SGD in a eutrophic semi-enclosed bay (Yeoja Bay) in the South Sea using radium isotopes (223Ra, 224Ra, and 226Ra). The nitrogen, silicate, and radium concentrations in coastal groundwaters were in general much higher than those in seawaters offshore. Thus, the fluxes of new nutrients through SGD were higher than those through stream flow in this bay. This appears to result in the large input of excess nitrogen and silicate into the coastal ocean. In the offshore of this bay (red-tide areas), good correlations among 224Ra, Si, and DIN (dissolved inorganic nitrogen) were observed, although phosphorus was almost completely depleted. Thus, the outbreak of red tides in this region seems to be due to the limited growth of diatoms under depleted DIP conditions, and the efficient utilization of DIN and DOP (dissolved organic phosphorous) by dinoflagellates. This case study indicates that nitrogen pollution in coastal groundwater and its subsequent discharge into the ocean may cause a significant ecological change that could trigger or facilitate harmful algal blooms.
In a volcanic island, Jeju, Korea, seepage rates were in the range 50-300 m/yr, which are much higher than those reported from typical continental shores. On the eastern shore of Jeju, almost all groundwater discharge is attributed to recirculating seawater, while fresh groundwater contributes about 20% of the total SGD on the western shore of Jeju. The measured radionuclides (228Ra, 226Ra, and 222Rn) and nutrients in the groundwater suggest that the discharge of both fresh and recirculated seawater will have a significant influence on the economy of coastal nutrients and other chemical constituents in this region. This large discharge of natural chemical constituents appears to cause natural eutrophication in a semi enclosed bay of this volcanic island.
[1] MOORE, W.S., Large groundwater inputs to coastal waters revealed by 226Ra enrichments, Nature (1996) 612-614.
242

EXTENDED SYNOPSIS IAEA-CN-118/134
TOPIC: GROUNDWATER-SEAWATER INTERACTIONS
1
Submarine Groundwater Discharge into the Yellow Sea
J. W. Ryu, G. Kim
School of Earth & Environmental Sciences, Seoul National University, Seoul, Korea
E-mail address of main author: [email protected]
While there have been increased observations of the magnitude of submarine groundwater discharge (SGD) at a few limited sites, many areas of the ocean have no information on SGD. In this study, we attempted to estimate SGD into a large continental margin, the Yellow Sea, using a 226Ra mass-balance model.
The Yellow Sea is one of the largest continental shelves of the world, 4 x 10⁵ km2 in dimension, with a mean depth of 50 m. The seafloor of the Yellow Sea is deeper in the south than the north, and the gradient of the seafloor is steeper in the east than the west. It is semi-enclosed by the landmasses of China and Korean and one of the best examples of an epicontinental sea. Since the residence time of the Yellow Sea water is between 2-6 years [1], we thought that the estimate of SGD might be more accurate and environmental consequences of SGD are more important in the seawater.
The sources of Ra in this region can be divided into (1) the Changiang river water, (2) the Kuroshio surface water, and (3) the benthic (excess) inputs due to SGD and diffusion from bottom sediments. Using a mass-balance model of 226Ra and 228Ra, we calculated the excess 226Ra and 228Ra activities from benthic inputs and the residence time of seawaters. Then, the excess 226Ra activity from SGD was calculated by subtracting the diffusive input (from bottom sediments) from the total excess activities. The SGD into the Yellow Sea was calculated on the basis of the residence time of seawater, excess 226Ra inventory from SGD, and 226Ra activity in potential brackish groundwater. Our estimate exhibits that SGD into the Yellow Sea is comparable to the river input in the Yellow Sea. Therefore, there may be important effects of SGD on the biogeochemistry and ecosystems of the Yellow Sea.
[1] NOZAKI, Y., TSUBOTA, H., KASEMSUPAYA, V., YASHIMA, M., IKUTA, N., Residence times of surface water and particle-reactive 210Pb and 210Po in the East China and Yellow Seas, Geochim. Cosmochim. Acta (1991) 1265-1272.
243

EXTENDED SYNOPSIS IAEA-CN-118/135
TOPIC: GROUNDWATER-SEAWATER INTERACTIONS
1
Radium Constraints on Groundwaters and Coastal Waters Dynamics in the Rhone Delta, France
P. Ollivier, C. Claude , O. Radakovitch, B. Hamelin
CEREGE, Europôle de l’Arbois, 13545 Aix-en-Provence, France
E-mail address of main author: [email protected]
The Rhône delta is a natural protected area located nearby the largest French industrial center. This delta (Camargue) does host among the most numerous bird colonies in Western Europe. Ecological studies are undertaken to estimate the consequences of pollutant industries on the fauna and the flora. However, groundwater and coastal water dynamics are poorly documented. Geochemical tracers allow to investigate such dynamics that do control pollutant distribution within natural ecosystems. RESYST (created in 2002) is an environmental Research Observatory that offers a unique opportunity to study the response of a deltaic zone to natural and anthropogenic forcing. RESYST is leading a geochemical investigation coupling hydrological data with isotopic tracers to characterize fresh waters, groundwaters, and coastal waters [1].
Here we propose to use 226Ra and 228Ra as tracers of fresh or brackish water inputs to coastal zone by submarine processes [2]. Progressive movement of a salt front into an aquifer and discharge of the brackish water into the near shore should provide a source of radium isotopes to the coastal ocean. Once added to the nearshore waters, 226Ra and 228Ra should behave as conservative tracers. This isotopes allow both source and time constraints on coastal waters dynamics.
228Ra (half- life of 5.75 years) and 226Ra (half- life of 1602 years) isotopes are measured by TIMS at CEREGE in 1.5 l and 0.5 l of water respectively. In order to estimate the 226Ra budget in the coastal zone, water samples have been collected from (1) deep groundwaters from the main water table(> 30 m), from (2) the largest lagoon of the Camargue area, (3) the Rhone river and (4) from surface coastal waters. The first results are presented here. In the deep groundwaters, salinity ranges from 2.5 to 38.8 g/l indicating that a process of salinisation is occurring, either directly through seawater intrusion or as a result of contamination with brackish waters. In these deep groundwaters, 226Ra activities and 228Ra/226Ra activity ratios spread a large range of variations (72 – 2500 dpm/100kg and 1.5 to 26 respectively). Both 226Ra and 228Ra correlate positively with salinity in the aquifer but they are not conservative because of adsorption – desorption processes. They are not the result of mixing between the Rhone river and seawater.
These very high activities of both 226Ra and 228Ra suggest that groundwaters are a potential source of radium to coastal waters where several points are analyzed. Coastal water samples collected within to the Rhone mouth and further west generally display higher 226Ra activity (mean and maximum values of 10.5 and 12 dpm/100kg respectively) than the Rhone river (10 dpm/100kg) and than distal samples collected 50 km offshore the study area (mean value of 9.7 dpm/100kg). Coastal waters are thus characterized by a small 226Ra excess. The 226Ra budget in the coastal zone is currently being conducted in order to estimate the influence of
244

P. Ollivier et al.
2
groundwaters in the coastal zone. The 226Ra offshore record (9.7 dpm/100kg) is in very good agreement with that of waters collected offshore Nice [3] that are thought to be representative of the Ligurian current value.
The 228Ra budget is more difficult to estimate because of radioactive decay of 228Ra. 228Ra activity is determined on 1) samples characterized by a lower salinity that result from a significant influence of the Rhone river, 2) on coastal water collected further away from the Rhone plume and 3) on the Rhone river. We observe a significant negative correlation between the 228Ra/226Ra activity ratio and salinity suggesting that in the coastal zone, 228Ra behaves conservatively. This correlation reflects the mixing between coastal waters and the Rhone river. Exchange model shall be very useful to monitor pollutant transfer in the coastal environment.
[1] OLLIVIER, P., CLAUDE, C., RADAKOVITCH, O., HAMELIN, B., Femtogram level of 226Ra and 228Ra measured by TIMS in water samples from the Rhone delta, France, Geophys. Res. Abstract 5 (2003) 09416.
[2] MOORE, W.S., Large groundwater inputs to coastal waters revealed by 228Ra enrichments, Nature 380 (1996).
[3] SCHMIDT, S., REYSS, J.-L., Radium as an internal tracer of Mediterranean outflow water, J. Geophys. Res. 101 C2 (1996) 3589-3596.
245

EXTENDED SYNOPSIS IAEA-CN-118/136
TOPIC: GROUNDWATER-SEAWATER INTERACTIONS
1
Isotope Hydrochemical Investigation of Saline Intrusion in Coastal Aquifer of Karachi-Pakistan
R. M. Qureshia, A. Mashiatullaha, C. B. Gayeb, M. A. Tasneema, T. Javeda
a Pakistan Institute of Nuclear Science and Technology, Islamabad, Pakistan
bIsotope Hydrology Section, International Atomic Energy Agency, Vienna, Austria
E-mail address of main author: [email protected]
Environmental stable isotope techniques [δ18O & δ2H in water molecules, δ13
C in Total Dissolved Inorganic Carbon (TDIC)] have been used in conjunction with physiochemical tools(temperature, dissolved oxygen, pH, redox, electrical conductivity, salinity) and biological tools (Fecal Coliform bacteria) to examine extent & origin of saline intrusion and groundwater quality in the coastal aquifer system of Karachi-Pakistan. Stable Isotope analysis [δ18O & δ2H in water molecules, δ13C in Total Dissolved Inorganic Carbon (TDIC)] is measured by isotope ratio mass spectrometry. Tritium contents are determined by electrolysis enrichment based liquid scintillation counting. Chemical contents of aqueous HCO3
-1, SO4-2
and Cl- are determined by standard analytical chemical techniques. The biological quality of shallow groundwater is generally not satisfactory. Physico-chemical data shows that the shallow groundwater is moderately saline. Shallow well in close proximity of Karachi coast have much higher values of electrical conductivity, salinity, contents of aqueous chloride and sulfate as compared to all other locations relatively away from the coast. The mean stable isotope contents of 18O and 2H and population of fecal coliform indicate that the shallow aquifer system is recharged by a mixture of fresh waters of mainly Indus River and polluted waters of Layari and Malir Rivers and their tributaries both under natural infiltration conditions and artificially induced infiltration conditions. Much depleted values of δ13C (less than -6o/oo V-PDB) indicate the impact of pollution from Layari and Malir Rivers into the shallow groundwater environment.
Relatively deep groundwater is mostly saline and has high electrical conductivity and salinity as compared to shallow groundwater. Physico-chemical data of deep groundwater shows that the deep wells have relatively higher values of electrical conductivity and salinity as compared to the shallow wells. Further, the deep groundwater is quite saline. In general, the bacteriological quality of deep groundwater is good except in case of pumping wells installed either within highly populated and poorly drained areas or close to the polluted rivers.
The hydrochemical and stable isotope results indicates that the confined aquifer hosts a mixture of rainwater from hinterlands and surrounding regions around coastal Karachi as well as sea trapped water / seawater through intrusion under natural infiltration conditions or under induced recharge conditions.
The present investigations prove seawater intrusion / existence of trapped seawater salinity and build-up of salt-water up-coning in the shallow and deep confined aquifer in coastal Karachi. Similar observations have been made by Yurtsever and Payne for shallow and deep groundwater and the local seawater as well as seawater from Doha-Qatar in the Gulf area [1].
246

R. Qureshi et al.
2
The postula tion of seawater intrusion or build-up of salt-water up-coning and/or existence of trapped seawater salinity in the deep confined aquifer will be validated upon additional isotopic analysis such as δ34S (aqueous sulfate), tritium (3H) and radiocarbon (14C) content, as well as Cl-/Br- ratio of surface water and groundwater samples in coastal Karachi.
[1] YURTSEVER, Y., PAYNE, B.R., Application of Environmental Isotopes to Groundwater Investigations in Qatar, IAEA-SM-228/24 (Proc. Symp. Neuherberg, Germany, 19-23 June, 1978).
247

EXTENDED SYNOPSIS IAEA-CN-118/137
TOPIC: STABLE ISOTOPES IN ORGANIC MATTER
1
Stable Isotopes Reveal Weak Dependence of Trophic Position of Planktivorous Fishes from Individual Size: A Consequence of Omnivorism and Mobility
A. Bodea, P. Carreraa,b, C. Porteiroc
a Instituto Español de Oceanografía, Centro Oceanográfico de A Coruña, A Coruña, Spain
bPresent address: Museo do Mar de Galicia, Vigo, Spain
cInstituto Español de Oceanografía, Centro Oceanográfico de Vigo, Vigo, Spain
E-mail address of main author: [email protected]
Trophic position generally increases with individual size in aquatic and terrestrial ecosystems, reflecting approximately constant ratios between the body-mass of predators and preys. The relationships between trophic position and size allow to characterise food webs and assess the effects of external factors on the ecosystems [1, 2]. With the aim of exploring such relationships, the natural abundance of stable nitrogen isotopes (δ15N) in plankton and in various species of planktivorous consumers was determined from samples collected between 1998 and 2003 in the north-western shelf of the Iberian Peninsula. Plankton samples were fractionated in size-classes between ca. 0.7 and 2000 µm of individual length. Samples of planktivorous consumers included 7 fish species spanning a range of individual body mass between 7 and 587 g (fresh weight). In addition, δ15N of squids (as representative of pelagic-benthic feeders) and of common dolphin (as representative of a pelagic top predator) was also determined.
Despite there was a significant increase in δ15N with the logarithm of individual body mass when considering all organisms (Fig. 1), there was a large overlap in the range of δ15N values between planktivorous fish species. As a consequence, δ15N was not related to the individual size of these consumers (Fig. 2). This result contrast with those reported for demersal fishes [1], thus revealing a fundamental difference in the structure of pelagic and benthic communities. In this way, the ability to exploit different shelf regions by most planktivorous fishes would minimize the competition by plankton even when they share a common trophic position within the food web.
In the case of the sardine (Sardina pilchardus), local differences in δ15N values of plankton at the base of the food web, along with a restricted mobility of adults in certain years, may explain δ15N values of adult sardines in the western region (Galicia), higher than those found in the eastern region (Mar Cantábrico). In contrast, there was no significant difference between regions in the δ15N values of young sardines. As δ15N in adult fishes reflect time-integrated feeding, it can reveal changes in the spatial distribution of populations, even in planktivorous species characterised by a diverse diet [3] and by high mobility between regions [4].
248

A. Bode et al.
2
y = 0.227x + 7.7156
R2 = 0.393
0
2
4
6
8
10
12
14
16
-25 -15 -5 5 15 25
log2(w)
15N
plankton
planktivorous fishes
dolphins
FIG. 1. Relationship between δ15N and log2 individual body mass for the whole pelagic ecosystem.
9
10
11
12
Galicia Mar Cantábrico
15N
< 16 cm
16 - 20 cm> 20 cmA
A
A
C
B
A
FIG. 2. Mean (+se) δ15N of sardine size-classes for different shelf regions. Significant differences between means are indicated by different letters (ANOVA and Dunnett-C test, p < 0.05).
[1] JENNINGS, S., PINNEGAR, J.K., POLUNIN, N.V.C., BOON, T.W., Weak-cross species relationships between body size and trophic level belie powerful size-based trophic structuring in fish communities, J. Animal Ecol. 70 (2001) 934-944.
[2] BODE, A., CARRERA, P., LENS, S., The pelagic foodweb in the upwelling ecosystem of Galicia (NW Spain) during spring: natural abundance of stable carbon and nitrogen isotopes, ICES, J. Mar. Sci. 60 (2003) 11-22.
[3] BODE, A., ALVAREZ-OSSORIO, M.T., CARRERA, P., LORENZO, J., Reconstruction of trophic pathways between plankton and the North Iberian sardine (Sardina pilchardus) using stable isotopes, Sci. Mar. 68 (2004) 165-178.
[4] PORTEIRO, C., CARRERA, P., MIQUEL, J., Analysis of Spanish acoustic surveys for sardine, 1991-1993: abundance estimates and inter-annual variability, ICES, J. Mar. Sci. 53 (1996) 429-433.
249

EXTENDED SYNOPSIS IAEA-CN-118/138
TOPIC: STABLE ISOTOPES IN ORGANIC MATTER
1
Using Stable Isotopes (C, N) to constrain Organics in Sub-Basement Fossil Soils (Ocean Drilling Program-Leg 197; N. Pacific): a Possible Example of Isolated Atmosphere-Land-Ocean Systems
R. Bonaccorsi
University of Trieste, Dept. of Geological, Environmental, and Marine Sciences (DiSGAM), Via E. Weiss, 2, 34127 Trieste, Italy
E-mail address of main author: [email protected]
Although the discovery of deep red-brown paleosols, or fossil soils, during Deep Sea Drilling Project (DSDP) and Ocean Drilling Program (ODP) legs dates back to the mid 1970's [1-3], the potential for preservation of organic matter in these igneous-derived silty-claystone units has been overlooked, and depositional settings have been inferred from only petrologic observations.
I present here naturally occurring stable isotopes of carbon and nitrogen (δ13Corg, δ15N) data of a well-preserved paleosol unit (Fig. 1) cored at Site 1206 (Koko Seamount) during the ODP Leg 197 (Emperor Seamounts, north Pacific Transect) [4-5]. The study of the sources and variation with depth of organic matter in sub-basement Fe-oxide-rich paleosol units from Leg 197 contributes to understanding the palaeoenvironmental history of the Emperor Seamounts prior to, during and after their burial and subsidence (ca. >48 to 55 Ma). Furthermore, preserved organic traces in such an isolated deep Earth system make them a useful test bed for future deep Earth's biosphere-relevant investigations [5-6].
FIG. 1. Core 197-1206A-40R soil unit. This sequence develops for a total length of 234 cm and consists of a silty-clay red-brown material that becomes progressively light in color upward - i.e., Dusky brown (5YR 2/2) to very dusky red (10R 2/2).
This soil interval forms in the first part of Section 40R-3 (0-77 cm), it develops throughout the entire Section 40R-2, and ends as capped by a lava flow top at Section 40R-1, 104 cm. Throughout the fossil soil sequence two contacts are present: 1) the contact between the weathered lava flow top unit (white arrow), which represents the early/mid stage of soil formation; and 2) the contact between the top of the soil sequence (Unit 18A; [4]) and the overriding rock unit (black arrow) - i.e., the brecciated base of Unit 17 [4].
250

R. Bonaccorsi
2
Measurements were made throughout Core 197-1206A-40R soil unit on organic-poor samples (Corg = 0.03-0.07%; 0.049 ± 0.011, n = 7) by using an Elemental Analyzer 1110 CHN coupled with a Finnegan Delta Plus MS-Conflo II.
This fossil soil system is characterized by a) the smallest difference for C (δ13Corg =~1.5 delta ‰); b) the highest variability for N (δ15Ntot = -9.5‰ to +2.5‰); c) even wider differences that occur between the fossil and the recent soils – i.e., Hawaiian oxisols - (13Corg = ~12 delta‰; 15N =~18 delta‰) as counterparts.
More specifically, the δ13Corg (bulk) values for the paleosol beds are –25.3‰ (at 307.54 mbsf) to -26.2‰ (at 308.92 mbsf) downcore. These values contrast to those obtained from an exposed Hawaiian oxisol sample (e.g., a Horizon-B sample at 100-105 cm-depth) with δ13Corg = -23.0‰. Typical uncertainties for these measurements were ±0.1‰ to ±0.3‰.
First, δ13Corg values of ca. -26‰ support a terrestrial, rather than marine source [7-8] of organics preserved in the paleosol interbeds from Core 197-1206A-40R. Thus, providing additional evidence for red claystone units as soil horizons subaerially formed on the top of Koko Seamount and buried by erupted lava flowing in a nearshore environment [1, 3-4]. The red soils probably underwent not only environmental changes (in paleolatitude and/or in paleoclimate) during formation, but also diagenetic changes after their burial.
However, δ13C alone resulted inadequate at distinguishing among different carbon sources (i.e., microbials, algae and land plants, [e.g., 8]. Hence the need of adding 15N data to constrain the source of organics in these interesting fossil soils.
Second, the isotopic composition of carbon and nitrogen would represent a complex signal from such history since late Palaeocene to early Eocene time [5]. Specifically, the stable isotope signature of C and N (δ13Corg =~ -26‰; δ15Ntot = -9.5‰ to +2.5‰) could reflect mixed sources of organics (i.e., plant and primary/secondary bacterial) and microbial-induced processes within the Carbon cycle and the Nitrogen cycle (e.g., nitrogen fixation, nitrification, and denitrification).
Finally, the geochemical divergence of these deeply buried fossil soils from their still exposed counterparts (with δ13Corg =~-17 ‰ to ~ -23 ‰; δ15Ntot = up to +8.5‰) would indicate a possible example of isolated atmosphere-land-ocean systems and deep Earth systems where to test for potential deep subsurface biospheres.
[1] KARPOFF, A.M., Init. Repts. DSDP 55 Washington (1980) 707-711. [2] Shipboard Scientific Party, Site 871, Proc. ODP, Init. Repts. 144 (1993) 41-103. [3] HOLMES, M.A., Proc. ODP, Scientific Results, 144 (1995) 381-398 [4] Shipboard Scientific Party, Proc. ODP, Init. Repts. 197 (2002) College Station, TX [5] BONACCORSI, R., et al., Abstract, IAU 2002 Bioastronomy Symposium (2002). [6] FURNES, H., et al., Abstract, GSA 2001 Annual Meeting (2001). [7] MEYERS, P.A., Chem. Geology, 144 (1994) 289-302. [8] MEYERS, P.A., Org. Geochem. 27 5/6 (1997) 213-259.
251

EXTENDED SYNOPSIS IAEA-CN-118/139
TOPIC: STABLE ISOTOPES IN ORGANIC MATTER
1
Hydrodynamic Sorting of Washington Margin Sediments using SPLITT Fractionation
L. Coppolaa , Ö. Gustafssonb, P. Anderssona, M. Uchidac, T. I. Eglintonc
a LIG, Swedish Museum of Natural History, Stockholm, Sweden
bStockholm University, Institute of Applied Environmental Research (ITM), Stockholm, Sweden
cWoods Hole Oceanographic Institution, Department of Marine Chemistry & Geochemistry, Woods Hole MA, U.S.A.
E-mail address of main author: [email protected]
SPLITT fractionation
Sieving and SPLITT (split flow thin cell) fractionation were used to hydrodynamically sort surface sediments collected along an E-W transect from the mouth of the Columbia River, across the Washington continental margin, to the Cascadia Basin in the N.E. Pacific. Sediments were separated into various coarse (>250, 100-250, 63-100, 38-63 and <38 µm) and two fine (38->1m/d and 38-<1m/d) fractions. The sieve-SPLITT method was recently tested and validated by using a variety of natural sediments [1] and results indicated that many biogeochemical processes governed by particle dynamics could be examined using this approach.
Washington Margin results
Mass distribution of sieve fractions indicates that sediments from the Washington shelf are dominated by large particles (>250 µm) whereas fine particles (<38 µm) are predominant in slope and Cascadia Basin sediments. This is consistent with the natural grain size distribution occurring in Washington margin sediments [2]. The mass distribution is shown in Fig. 1
Total Organic Carbon (TOC) contents of the sediments generally follow the same distribution as the mass. With the exception of inner shelf stations, most TOC resides in the fine fraction and ranges around 1.5-3%. Stable carbon isotopic measurements on TOC indicate an increase in d13C values from the shelf to the Cascadia Basin (from -34 to -20‰). Consistent with this, TOC/TON ratios decrease along the same transect (from 80 to 10), suggesting a transition from terrestrial to autochthonous marine sources.
252

L. Coppola et al.
2
FIG. 1. Mass distribution of surface sediment fractions from sieve-SPLITT method in the Washington Margin area.
These results will be completed by those from the splittate fractions. Results of other analysis of the sieve-SPLITT fractions (inorganic elements, surface area, mineralogy and Sr isotopes) will also be presented.
[1] COPPOLA, L., GUSTAFSSON, Ö., ANDERSSON, P., LARSSON, J., AXELSSON, P., Water Res. (submitted).
[2] KEIL, R.G., TSAMAKIS, E., FUH, C.B., GIDDINGS, J.C., HEDGES, J.I., GCA 58 (1994) 879-893.
253

EXTENDED SYNOPSIS IAEA-CN-118/140
TOPIC: STABLE ISOTOPES IN ORGANIC MATTER
1
Isotope Fractionations and Radiocarbon Ages of Beach Rock Samples Collected from the Nansei Islands, Southwest of Japan
K. Omoto
College of Humanities and Sciences, Nihon University, Tokyo, Japan
E-mail address of main author: [email protected]
Beach rocks are observed frequently on the tropical and subtropical sandy beaches where they express thin beds dipping seaward at less than 15 degrees. They consist of beach sediments including fossil shells, fragments of corals, diatoms and other biocarbonates, and are well cemented within the inter-tidal zone with calcium carbonate originated in sea water. Therefore, they are not only good indicators which show the past sea level, but also provide good sample material for radiocarbon dating. The locations of beach rocks give us an optimum condition studying a carbon cycle between land and marine environment by analyzing their isotope fractionations.
In order to estimate the origin of calcium carbonate which worked as an adhesive when beach rocks were formed and to estimate the formative ages of beach rocks, a total of 330 fossil corals, fossil shells and calcarenite or calcirdite samples were collected from 128 sites of 16 islands consisting of the Nansei Islands, southwest of Japan [2-3]. The Nansei Islands are chains of islands located between Kyushu Island and Taiwan Island for 1,500 km in length. They are divided into three major islands groups, namely from north to south, Amami Islands, Okinawa Islands and Sakishima Islands, respectively.
Isotope corrections and reservoir corrections are indispensable for marine organisms to correct their radiocarbon ages in years BP [1].
Isotope fractionations and radiocarbon ages of beach rock samples collected from the Nansei Islands were determined at the Radiocarbon Laboratory of the Nihon University and the radiocarbon dates were corrected.
According to Geyh and Schleicher [4] isotope fractionations for marine organisms were in the range within 0±2‰. Isotope fractionation (d13C) of all beach rock samples collected from the Nansei Islands ranged between 9.4‰ and -6.0‰, with an average of 2.1‰. Although the average values of isotope fractionations over the 16 islands indicated nearly the same average value for marine organisms, however they were outside the range of 0±2‰ in the Amami Islands, Sakishima Islands and 3 islands consisting of Okinawa Islands (Figure 1). This fact suggests that when beach rock was being formed, beach sediments were under the influence of an obviously different origin of calcium carbonate occupying underground or fresh water. Another important key to solve this problem might be given to us by considering the aquatic ecosystem of marine livings and carbon cycle among atmosphere-land sea systems. The author needs further investigations.
In the Nansei Islands, beach rocks were formed within the range of the inter-tidal zone between approximately 6,900 years BP and the present day. However, several time differences in the formative period of beach rocks exist among the Nansei Islands. The
254

K. Omoto
2
elevations and radiocarbon ages of the beach rock samples indicate the past sea level change. Judging from the evidences, many islands have been uplifted by neotectonic movements caused probably by the movements of Asian plate and intermittent seismic uplifts. However the late Holocene sea level has remained similar to the present one since at least the past 5,000y BP in the stable islands.
-8
-6
-4
-2
0
2
4
6
8
10
12
0 1000 2000 3000 4000 5000 6000 7000 8000y BP
‰
FIG. 1. Isotope fractionations and radiocarbon ages of beach rock samples collected from the Okinawa islands.
[1] STUIVER, M., BRAZIUNAS, T.F., Modeling atmospheric 14C influences and 14C ages of marine samples to 10,000 BC. Radiocarbon 35 1 (1993) 137-189.
[2] OMOTO, K., Radiocarbon ages of beach rocks and Late Holocene sea-level changes in the southern part of the Nansei Islands, southwest of Japan, Radiocarbon 43 2 (2001) 887-898.
[3] OMOTO, K., Radiocarbon ages and isotope fractionations of beach rock samples collected from the Nansei Islands, southwest of Japan, Radiocarbon 46 2 (2004).
[4] GEYH, M.A., SCHLEICHER, H., Absolute Age Determination, Springer-Verlag, New York, Berlin, Heidelberg (1990) 503.
255

EXTENDED SYNOPSIS IAEA-CN-118/141
TOPIC: PACIFIC AND SOUTHERN OCEANS
1
Temporal Variation of 137Cs Distribution and Inventory along 165 deg. E in the North Pacific since 1960s to the Present
M. Aoyamaa, K. Hirosea, K. Komurac, K. Nemotob
a Meteorological Research Institute, Japan Meteorological Agency, 1-1 Nagamine, Tsukuba-shi, Ibaraki-ken 305-0052, Japan
bJapan Meteorological Agency, Climate and Marine Department, Japan Meteorological Agency,1-1 Nagamine, Tsukuba-shi, Ibaraki-ken 305-0052, Japan
cKanazawa University, Low Level Radioactivity Laboratory, 1-1, Marunouchi, Kanazawa 920, Japan
E-mail address of main author: [email protected]
An enhanced observation of 137Cs along 165 deg. E in the North Pacific Ocean was conducted in 2002. The primary objective of this enhanced observation is to develop an understanding of the present open-ocean distribution of radionuclides in the water column in this region. Relatively large numbers of 137Cs concentration data [1] are available in this interested area since 1960s, then we are able to do a study on the temporal variation of 137Cs distribution and inventory. Recent progress of 137Cs measurements in seawater at an underground laboratory at Ogoya [2] made it possible to determine the 137Cs concentration using small volume seawater samples.
The samplings in 2002 were carried out during two cruises by R/V Ryofu-maru operated by Japan Meteorological Agency. Among the stations between 49 deg. N and 6 deg. S along 165 deg. E, seawater samples shallower than 1000 m were collected at 20 stations. An average horizontal spacing was 350 km and vertical spacings were 100 m or less at each station. Sample volumes ranged from 10 liter to 20 liter. Deeper water samples were collected at 8 stations. Vertical spacings varied from 200 m to 500 m and sample volumes varied from 20 liter to 100 liter for deeper seawater samples. A preliminary result of 137Cs concentration along 165 deg. E for shallower layers is shown in Fig. 1.
137Cs rich water was seen between 40 deg. N and 15 deg. N as shown in Fig. 1. The highest 137Cs inventories were observed at latitudes between 30 deg. N and 40 deg. N in the North Pacific in the 1960s corresponding a pattern of global fallout in this region [3]. The body of global fallout of 137Cs in 2002 is, however, within the subtropical gyre where a maximum 137Cs concentration was observed around 20 deg. N, the southern edge of the subtropical gyre, and occupied a layer of 200 – 500 m. This finding supports the idea that the body of global fallout has been captured within the subtropical gyre during these four decades.
Southward transport also can be seen around 200 m depth between 20 deg. N and equator in Fig. 1. Aoyama et al. already showed that southward transport of 137Cs had been caused an increase of 137Cs inventory at the lower latitude of 10 - 20 deg. N in the 1970s and 1980s [3]. Hirose and Aoyama also reported that shorter apparent half-residence time of 137Cs concentration in surface seawater occurred at the higher latitude in the North Pacific while longer apparent half-residence time of 137Cs concentration occurred in the Equatorial Pacific
256

M. Aoyama et al.
2
[4]. These suggest that the southward transport of 137Cs is an important process to regulate the temporal variation of inventory of 137Cs and concentration of 137Cs in surface water in the Equatorial Pacific.
0 00
1
11
1
111
1
1
1
11
1
2
22
10S 0 10 20 30 40 50N0
200
400
600
800
1000
FIG. 1. Section of 137Cs concentration (Bq m-3). Dots show positions of sample. Measurements of about sixty samples at the southern part in this section did not accomplished yet.
[1] AOYAMA, M., HIROSE, K., Artificial radionuclides database in the Pacific Ocean: HAM database, The Scientific World 4 (2004) 200-215.
[2] KOMURA, K., Ogoya underground laboratory for the measurement of extremely low-level environmental radioactivity, (Int. Conf. Radioact. in the Environment, 2002, Monaco).
[3] AOYAMA, M., HIROSE, K., Temporal variation of 137Cs water column inventory in the North Pacific since the 1960s, J. Environ. Radioact. 69 (2003) 107-117.
[4] HIROSE, K., AOYAMA, M., Analysis of 137Cs and 239,240Pu concentration in surface waters of the Pacific Ocean, Deep-Sea Res. II 50 (2003) 2675–2700.
257

EXTENDED SYNOPSIS IAEA-CN-118/142
TOPIC: PACIFIC AND SOUTHERN OCEANS
1
Plutonium Isotopes in Seawater of the Western North Pacific: Effect of Close-in Fallout
K. Hirosea, M. Aoyamaa, C. S. Kimb, C. K. Kimb, P. P. Povinecc
a Geochemical Research Department, Meteorological Research Institute, Nagamine 1-1, Tsukuba, Ibaraki 305-0052, Japan
bDepartment of Radio logical Safety Research, Korea Institute of Nuclear Safety, Daejon 305-336, Republic of Korea
c Marine Environment Laboratory, International Atomic Energy Agency, Monaco
E-mail address of main author: [email protected]
Plutonium in seawater of the western North Pacific has been introduced by global fallout from atmospheric nuclear weapons tests, with major fallout recorded in the early 1960s [1]. 239,240Pu inventories observed in the water column of the North Pacific were, however, significantly greater than that of global fallout, as a meaningful amount of plutonium was injected into seawater by close-in fallout from the US nuclear explosions conducted at the Pacific Proving Ground at Marshall Islands in the 1950s [2]. In order to better understand oceanic behaviour of 239,240Pu, it is important to elucidate the effect of close- in fallout of 239,240Pu in the western North Pacific. Plutonium in the marine environment consists mainly of these isotopes: 238Pu, 239Pu, 240Pu, and 241Pu. Their isotope ratios depend on their sources - for example, the average global fallout 240Pu/239 Pu atom ratio is 0.18, whereas the elevated 240Pu/239Pu atom ratios were reported for close- in fallout from US nuclear tests in the 1950s. The plutonium isotope signature is therefore a useful tool to identify the sources of plutonium in the marine environment [3]. In this paper we present recent 239,240Pu concentrations in seawater collected in 2002, and discuss 239,240Pu inventories in the water column, including data obtained in the IAEA’97 Pacific cruise [4]. Surface water samples were collected in 2002 during cruises on board the R/V Ryofu-maru, belonging to the Japan Meteorological Agency. Surface and deep water were sampled using a submersible pump and a 100-liter GoFlo sampler, respectively. All water samples were filtered with a fine membrane filter (Millipore HA, 0.45 µm pore size) immediately after sampling. Dissolved plutonium in seawater was coprecipitated with iron hydroxides from 20 to 100 L of seawater samples. Both dissolved and particulate plutonium were assayed using alpha spectrometry and ICP-SFMS following radiochemical separations and purifications using anion exchange resins, described in detail elsewhere [5]. The chemical yield was determined by addition of a known amount of 242Pu. 239,240Pu concentrations in surface waters of the western North Pacific in 2002 ranged from 1 to 10 mBq m-3. The vertical profile of 239,240Pu concentrations at the location of 7°59’N, 165°03’E showed surface minimum and mid-depth maximum, and gradual decrease with depth. 240Pu/239Pu atom ratios in deep water (below1000 m) were around 0.25, which coincides with the results reported by Buesseler (1997) [3]. The observed elevated 240Pu/239Pu atom ratios (compared to the global fallout ratio) are due to close-in fallout from the Pacific Proving Ground nuclear weapon testing. The fallout plutonium originating from these tests (Bravo test) is characterized by a lower 238Pu/239,240Pu activity ratio (0.1%) and a higher 240Pu/239Pu atom ratio (0.33) [6]. If plutonium in the water column of the western North
258

K. Hirose et al.
2
Pacific consists of only two components, i.e., global fallout and close- in fallout, the 239,240Pu inventory derived from individual fallout is estimated based on a simple mixing model. The 239,240Pu inventory from global fallout is estimated from the following equation
IWG,1 = (IWT,2 - IWT,1 RG )/( RG - RB)
where IWT,1 and IWG,1 are the total inventories of 239,240Pu in the water column and from global fallout, respectively, and similarly IWT,2 and IWG,2 are the total inventories of 238Pu in the water column and from global fallout, respectively. RG and RB represent 238Pu/239,240Pu activity ratios in global fallout (0.029) and in close- in fallout (0.001), respectively. The results are summarized in Table 1.
TABLE 1. 239,240PU INVENTORIES IN THE WESTERN NORTH PACIFIC (Bq m-2). _____________________________________________________________________
Location Depth 239,240Pu 239,240Pu 239,240Pu 239,240Pu
(m) (close- in fallout) (global fallout) GEOSECS ___________________________________________________________________________________
34°60’N, 146°00’E 5927 101[4] 37 64 140[2]
30°34’N, 170°37’E 5472 122[4] 51 71 150[2]
11°26’N, 164°52’E 4537 115[4] 62 53 110[2]
11°30’N, 161°45’E 3690 110[4] 64 46
15°30’N, 159°31’E 5557 129[4] 79 50
7°59’N, 164°54’E 5138 67* 26** 41** 74[2]
_______________________________________________________________________ *This work. ** The values estimated from 240Pu/239Pu atom ratios.
The results suggest that a significant amount of 239,240Pu derived from close-in fallout spread out over the subtropical region of the western North Pacific. The plutonium isotope signature will be used to investigate the behavior of plutonium in the western North Pacific water.
[1] HIROSE, K., et al., (Plutonium in the Environment), Elsevier Science, Amsterdam, (2000) 251-266.
[2] BOWEN, V.T., et al., Earth Planet. Sci. Let. 49 (1981) 411-434. [3] BUESSELER, K.O., J. Environ. Radioact. 36 (1997) 69-83. [4] POVINEC, P.P. et al., Deep-Sea Res. II 50 (2003) 2607-2638. [5] KIM, C.S., et al., Anal. Chem. 74 (2002) 3824-3832. [6] KOMURA, K., et al., Health Phys. 46 (1984) 1213-1219.
259

EXTENDED SYNOPSIS IAEA-CN-118/143
TOPIC: PACIFIC AND SOUTHERN OCEANS
1
Temporal Variations and Behavior of 90Sr and 137Cs in Precipitation (Rain), River and Sea Water in Japan
Y. Ikeuchi
Japan Chemical Analysis Center, 295-3, Sanno-cho, Inage-ku, Chiba, 263-0002 Japan
E-mail address of main author: [email protected]
Almost all of the 90Sr and 137Cs found in the environment of Japan came from the atmospheric nuclear weapon tests, which took place from 1945 to 1980. A little was due to the Chernobyl accident in 1986. 90Sr and 137Cs in more than 30,000 environmental samples were determined from 1963 to 1999 by organizations belonging to the Japanese Government.
Precipitation (rain water) was collected once per month in 22-47 points in Japan, river water is collected twice per year in 29-47 points, seawater was collected once per year in 10-15 points from 1963 to 1999.
90Sr and 137Cs in 0.5m2/month of precipitation, 100l of river water and 40l of sea water were determined in mainly Japan Chemical Analysis Center.
90Sr in these samples was separated as carbonate, oxalate and nitrate. Ba and Ra impurities were removed as chromates. After scavenging of 90Y, SrCO3 was recovered and weighed to obtain the chemical yield. After 2weeks, the beta ray of 90Y separated from the 90Sr was measured using a low background gas flow GM counter.
137Cs in the supernatant solution at carbonate precipitation phase was separated as Cs3PO4·2MoO3, and 87Rb impurity was removed by the cation exchange method. Cs2PtCl6 was precipitated and weighed to obtain chemical yield and the beta ray of 137Cs was measured using a low background gas flow GM counter.
The detection limits for both 90Sr and 137Cs (3s criterion in counting statistics) were about 0.03 MBq/km2 for precipitation, about 0.2mBq/l for river water, about 0.5mBq/l for sea water.
90Sr and 137Cs in precipitation decreased by 3 orders of magnitude, showing 4 peaks after the large-scale Chinese weapon tests, and one sharp peak especially for 137Cs due to the Chernobyl accident in 1986 (Fig. 1). On the other hand, the temporal variations in river water and sea water had decreased gradually, showing levels of 137Cs 0.2 times and 1.3 times higher than 90Sr, respectively (Fig. 2). It is interesting that the concentration of 90Sr in river water, 90Sr and 137Cs in sea water is almost same (Fig. 2). Higher 90Sr than 137Cs in river water is due to soil. It is found that 51% to 76% of 90Sr and 15% to 38% of 137Cs were removed from surface soil in the 0-20cm-depth layer to accumulation of precipitation in 1980 when the Chinese atmospheric nuclear weapons tests were ended and in 1999, respectively (Figs. 3, 4) [1]. Though 137Cs is higher than 90Sr in precipitation, 90Sr and 137Cs in sea water is almost same. It is assumed some 90Sr in sea water come from river water, as the residence time of 90Sr and 137Cs is almost same [2].
260

Y. Ikeuchi
2
Fig. 1 Average 90Sr and 137Cs levels in precipitation at 22-47 sampling sites
0.1
1
10
100
1000
10000
63 64 65 66 67 68 69 70 71 72 73 74 75 76 77 78 79 80 81 82 83 84 85 86 87 88 89 90 91 92 93 94 95 96 97 98 99 Year
MB
q/(k
m2 ×
year
)137Cs
90Sr
137Cs/ 90Sr
0.01
0.1
1
10
100
63 64 65 66 67 68 69 70 71 72 73 74 75 76 77 78 79 80 81 82 83 84 85 86 87 88 89 90 91 92 93 94 95 96 97 98 99 year
mB
q/l
137Cs river water
90Sr river water
137Cs sea water
90Sr sea water
FIG. 1. Average 90Sr and 137Cs levels in precipitation at 22-47 sampling sites.
FIG. 2. Average 90Sr, 137Cs levels in river water and seawater.
y = 1.0032e-0.0374x
R2 = 0.8717y = 0.4092e-0.0343x
R2 = 0.8506
y = 2716.6e-0.0154x
R2 = 0.6761
y = 3273.2e-0.0596x
R2 = 0.9392
y = 12.407e-0.0539x
R2 = 0.9498
1
10
100
1000
10000
62 63 64 65 66 67 68 69 70 71 72 73 74 75 76 77 78 79 80 81 82 83 84 85 86 87 88 89 90 91 92 93 94 95 96 97 98 99 year
MB
q/km
2
0
0.2
0.4
0.6
0.8
1
1.2
ratio
accumulation of precipitation
soil (0-20cm) depth
soil /accumulation ofprecipitation
seawater (mBq/l)(seawater /accumulation of
Fig. 4 137Cs correlation between soil, seawater and precipitation
y = 1.1659e-0.0165x
R2 = 0.6948
y = 0.4486e-0.0423x
R2 = 0.8102
y = 3603.9e-0.0122x
R2 = 0.5643
y = 4974.3e -0.035x
R2 = 0.9023
y = 17.955e-0.0585x
R2 = 0.9061
1
10
100
1000
10000
62 63 64 65 66 67 68 69 70 71 72 73 74 75 76 77 78 79 80 81 82 83 84 85 86 87 88 89 90 91 92 93 94 95 96 97 98 99 year
MB
q/km
2
0
0.2
0.4
0.6
0.8
1
1.2
1.4
ratio
accumulation of precipitation
soil (0-20cm depth)
soil / accumulation of precipitation
seawater (mBq/l)
(seawater/accumulation of precipitation)×100
FIG. 3. 90Sr correlation between soil, seawater and precipitation.
FIG. 4. 137Cs correlation between soil, seawater and precipitation.
ACKNOWLEDGMENTS
The author wishes to thank the staff of the local government institutes and the colleagues of the Japan Chemical Analysis Center.
This research work was funded by the Ministry of Education, Culture, Sports, Science and Technology of Japan.
[1] IKEUCHI, Y., Temporal variations and behavior of 90Sr and 137Cs in the environment of Japan, International Conference on Radioactivity in the Environment (2002).
[2] IKEUCHI, Y., Temporal variations of 90Sr and 137Cs concentrations in Japanese surface seawater and sediments from 1974 to 1998, Deep-Sea Res. 50 (2003) 2713-2726.
261

EXTENDED SYNOPSIS IAEA-CN-118/144
TOPIC: PACIFIC AND SOUTHERN OCEANS
1
Artificial Radionuclides in the Yellow Sea
G. H. Honga, C. S. Chunga, S. H. Leeb, H. M. Leea, S. H. Kima, Y. I. Kima
a Korea Ocean Research and Development Institute, Ansan, Rep. of Korea
bMarine Environment Laboratory, International Atomic Energy Agency, Monaco
E-mail address of main author: [email protected]
As a part of the ongoing Radionuclides Study in the Seas (RADSEA) Program of the Korea Ocean Research and Development Institute, artificial radionuclides of 90Sr, 137Cs, and 239+240Pu concentrations were determined in the sea and bottom sediments in the Yellow Sea during 1994 to 2000 along with atmospheric and riverine input of these radionuclides. The Yellow Sea is surrounded by the contiguous land mass of China and Korea located in the Northwest Pacific Ocean. Although biogeochemistry of the Yellow Sea is mainly controlled by the ocean-derived water, salt, heat, and chemical materials with modication by the air, land, and sea floor boundary processes. In particular, influence of land and air is very significant due to the semi-enclosed nature of the sea and situated in the down-wind side of the arid continent of China. The Yellow Dust storm events are one of the salient geological feature of the region.
The geometric mean of 90Sr, 137Cs, and 239+240Pu concentrations in the unfiltered rainwater was 0.32 mBq kg-1, 0.31 mBq kg-1, and 1.29 µBq kg-1, respectively. Annual wet atmospheric deposition flux of 90Sr, 137Cs, and 239+240Pu was 11.9 mBq m-2d-1, 11.9 mBq m-2d-1 and 40.58 mBq m-2d-1, respectively. In addition to the wet deposition, the dry deposition flux of these radionuclides accounts more than 70% of total (wet + dry) deposition in a year. The concentrations of these radionuclides were the highest during the spring Yellow Dust period and lowest during the summer wet monsoon. The concentrations and fluxes varied interannually according to the intensity of Yellow Dust and precipitation. If these flux values were extrapolated to the entire Yellow Sea, the annual deposition of 90Sr, 137Cs, and 239+240Pu would be at least 137.5, 75.4 and 0.57 GBq yr-1, respectively.
Dissolved 90Sr, 137Cs, and 239+240Pu concentrations in the rivers disgorged into the Yellow Sea were approximately 3.15 mBq kg-1, 0.43 mBq kg-1, and 2.94 µBq kg-1, respectively. The total riverine fluxes of the 90Sr, 137Cs, and 239+240Pu were estimated to be 371.8, 50.4 and 0.35 GBq yr-1, respectively.
In the water column, the surface and near bottom waters were sampled for their 90Sr, 137Cs, and 239+240Pu concentrations. Dissolved 90Sr, 137Cs, and 239+240Pu were in the order of 2.3 mBq kg-1, 2.6 mBq kg-1, and 4.5 mBq kg-1, respectively. There is a subtle seasonal variation in their concentration.
The 90Sr, 137Cs, and 239+240Pu concentrations in the bottom sediments were 0.6 to 3.9, 0.1 to 11.2, 0.2 to 0.9 Bq kg-1, respectively, and they varied largely with the sediment grain size. The 210Pb-derived sediment accumulation rate in the Yellow Sea varied geographically and were 200 to 16000 g m-2 yr-1. These sediment accumulation rates were utilized to estimate the annual burial fluxes of these artificial radionuclides.
262

G. Hong et al.
2
A simple box model was constructed in order to preliminarily estimate the open ocean boundary flux between the Yellow Sea and the East China Sea, which will largely determine the distribution of these radionuclides in the Yellow Sea. We assumed the Yellow Sea as a box and first constructed water and salt budgets, and then estimated the exchange rate of dissolved radionuclides between the Yellow Sea and the East China Sea. It appears that dissolved 90Sr and 137Cs are exported from the Yellow Sea, while the dissolved 239+240Pu is imported from the East China Sea.
263

EXTENDED SYNOPSIS IAEA-CN-118/145
TOPIC: PACIFIC AND SOUTHERN OCEANS
1
Radionuclide Tracing of Water Masses in the Southern Ocean (Indian Sector) - ANTARES IV cruise
S.-H. Leea, P. P. Povineca, J. Gastauda, B. Oregionia, L. Coppolab,c, C. Jeandelb
a Marine Environment Laboratory, International Atomic Energy Agency, Monaco
bLEGOS, 14 av. E. Belin, 31400 Toulouse, France
cLIG, Swedish Museum of Natural History, 104 05 Stockholm, Sweden
E-mail address of main author: [email protected]
The study area is located in the Crozet Basin (northwest Kerguelen Plateau and east of Crozet Plateau), where it is featured by the confluence of several fronts, i.e., Agulhas Front (AF), Sub-Tropical Front (STF) and Sub-Antarctic Front (SAF) [1, 2]. The most predominant current affecting the circulation in the Crozet Basin is the Agulhas Current (AC) characterized by warm and saline water, extending eastward into the basin. The dominant physical control on biogeochemical distribution is due to the Antarctic Circumpolar Current (ACC). Extending to east of 60oE, (ACC) re-circulate to the north, probably as part of an anticyclonic subtropical gyre [1].
Water samples collected during the Antarctic Research Cruise (ANTARES) IV carried out in January-February, 1999, in the Sub-Antarctic Frontal System in the Southern Ocean, were analysed to study the vertical and horizontal distributions of 3H, 90Sr, 239,240Pu and 241Am. Biological samples (plankton and fish) were collected as well.
The latitudinal variations of 3H, 90Sr and 239,240Pu indicate that the global fallout is the main source of these radionuclides in the region. However, the main factors controlling the distribution of these radionuclides in surface seawater seemed to be related to the fronts observed in the region. Higher concentrations of 3H, 90Sr and 239,240Pu were found north of AF where warmer and saltier waters were observed, while the concentrations decreased dramatically in the STF and SAF zones, where cooler and less salty waters were observed (Fig. 1). A noticeable deeper penetration of 3H in the AF is attributable to the process of Crozet Basin Mode Water formation during wintertime and steady sinking water masses. Higher concentrations of 3H observed in bottom layers in, might be due to intrusion of North Indian Deep Water.
Differences in fronts and in radionuclide concentrations in seawater are primary factors in controlling 210Po and 239,240Pu concentrations in zooplankton.
264

S.-H. Lee et al.
2
Latitude (oS)
30 32 34 36 38 40 42 44 46 48 50
Sr (m
Bq
L-1
)
0 .0
0.2
0.4
0.6
0.8
1.0
1.2
1.4
1R
2R
3R4R
5R
St.3'
St.7
St.8
A F STF SAF
Latitude (oS)
30 32 34 36 38 40 42 44 46 48 50
TU
0.0
0.2
0.4
0.6
0.8
1.0
1.2
1.4
1.6
1R 2R
3R
4R
5R
St.3'St.7
St.8
A F STF S A F
Latitude ( oS)
30 32 34 36 38 40 42 44 46 48 50
239,
240 P
u (µ
Bq
L-1
)
0.2
0.4
0.6
0.8
1.0
1.2
1.4
1.6
1R
2R
3R
4R
5R
St.3'
St.7
St.8
A F STF S A F
Latitude ( oS)
30 32 34 36 38 40 42 44 46 48 50
241 A
m (µ
BqL
-1)
0.2
0.3
0.4
0.5
0.6
0.7
0.8
0.9
1.0
1R
2R
3R
4R
5R
St.3'St.7
St.8
A F STF S A F
FIG. 1. The distribution of radionculide concentrations in surface waters from the southern Indian Ocean (ANTARES IV, 1999).
[1] PARK, Y.H., GAMBERONI, L., CHARRIAUD, E., Frontal Structure, water masses, and Circulation in the Crozet Basin, J. Geophys. Res. 98 C7 (1993) 12361-12385.
[2] BELKIN, I.M., GORDON, A.L., Southern Ocean fronts from the Greenwich meridian to Tasmania, J. Geophys. Res. 101 C2 (1996) 3675-3696.
265

EXTENDED SYNOPSIS IAEA-CN-118/146
TOPIC: PACIFIC AND SOUTHERN OCEANS
1
Dynamics of a Late Spring Phytoplankton Bloom in the Eastern Weddell Sea: Short-Timescale Changes in 234Th/238U Disequilibrium
A. M. Rodriguez y Baenaa,b, J. C. Miquela, P. Masquéc, J. La Rosaa, E. Islad, T. Breye, J. A. Sanchez-Cabezac, S. W. Fowlera
a IAEA Marine Environment Laboratory, Principality of Monaco
bDipartimento per lo Studio del Territorio e delle sue Risorse (DIP.TE.RIS.), Universita’ di Genova, Italy
cInstitut de Ciència i Tecnologia Ambientals - Department de Física, Universitat Autònoma de Barcelona, Spain
dInstitut de Ciències del Mar (CSIC), Passeig Marítim de la Barceloneta, Spain
eAlfred Wegener Institute for Polar and Marine Research, Bremerhaven, Germany
E-mail address of main author: [email protected]
During the R/V “Polarstern” expedition ANT XXI/2 during November 2003-January 2004, short-timescale changes in 234Th/238U disequilibrium over a 25-day period were followed at a permanent station on the eastern Weddell Sea shelf (70°48.5 S, 10°44.0 W). The water column was sampled 16 times. At each sampling time, 2l-samples were collected at several (6 to 13) depths, spiked with 230Th as a yield tracer, and precipitated according to the MnO2 small volume technique [1]. Following beta counting, samples were alpha-counted for chemical recovery. Simultaneously, 234Th fluxes were measured in sediment traps deployed in an adjacent region. According to CTD-fluorescence and plankton observations, a phytoplankton bloom was developing during the sampling period.
These results have been used for modelling 234Th dynamics in the water column by a non-steady state distribution model [2]. Most measured total 234Th activities in the water column were quite high compared to classically reported oceanic values. Indeed, in some instances 234Th may have been present in excess relative to its parent 238U. One possible explanation for this imbalance could be the input of sea-ice algae, highly enriched in 234Th, which typically occurs in this region due to sea-ice melting [3].
Sediment-trap measurements showed that 234Th fluxes throughout the bloom matched well with the expected trends, with peaks coinciding with periods of high total mass fluxes.
This work will allow future assessment of POC and PON export by combining 234Th fluxes with POC(PON)/234Th ratios in sinking particles collected by in-situ pumping and sediment traps at the base of the photic layer. The radioisotope-based fluxes will be compared with organic carbon and nitrogen fluxes determined with sediment traps, as well as with the phytoplankton standing stock during the same period.
266

A. Rodriguez y Baena et al.
2
[1] BUESSELER, K.O., BENITEZ-NELSON, C., RUTGERS VAN DER LOEFF, M.M., ANDREWS, J., BALL, L., CROSSIN, G., CHARETTE, M.A., An intercomparison of small- and large-volume techniques for thorium-234 in seawater, Mar. Chem. 74 (2001) 15-28.
[2] COCHRAN, J.K., BUESSELER, K.O., BACON, M.P., WANG, H.W., HIRSCHBERG, D.J., BALL, L., ANDREWS, J., CROSSIN, G., FLEER, A., Short-lived thorium isotopes (234Th, 228Th) as indicators of POC export and particle cycling in the Ross Sea, Southern Ocean, Deep-Sea Research II 47 (2000) 3451-3490.
[3] RUTGERS VAN DER LOEFF, M.M., BUESSELER, K., BATHMANN, U., HENSE, I., ANDREWS, J., Comparison of carbon and opal export rates between summer and spring bloom periods in the region of the Antarctic Polar Front, SE Atlantic, Deep-Sea Res. II 49 (2002) 3849-3869.
267

EXTENDED SYNOPSIS IAEA-CN-118/147
TOPIC: PACIFIC AND SOUTHERN OCEANS
1
Dissolved N2O Isotopomers in Southern Ocean Fronts at 140°E; Production, Consumption and Budget
N. Boontanona,d, S. Watanabeb, N. Yoshidaa,c,d
a Frontier Collaborative Research Center, Tokyo Institute of Technology, Japan
bJapan Marine Science and Technology Center, Japan
cDepartment of Environmental Science and Technology, Tokyo Institute of Technology, Japan
dAlso with SORST project, Japan Science and Technology Agency
E-mail address of main author: [email protected]
The horizontal and vertical distributions of dissolved N2O in the Southern Ocean during austral summer show characteristic features related to the productions of phytoplankton as well as zooplankton both of which are mostly abundant during this season. Furthermore, the characteristics of the various water masses in the Southern Ocean could be also governed the productions and the removal processes of dissolved N2O as well. In the present work, the following important facts could be emphasized (Fig. 1): The concentration and isotopomers of dissolved N2O in the surface water are associated with the transfer velocity around Southern Ocean. The N2O at the surface was about 94% saturation and the calculated sea-air flux was -3.67 µmol m-2d-1 in average. This negative value means that the surface Southern Ocean could be expected to be one of the sinking sites for the atmospheric N2O. The vertical distributions of N2O displays the maximum layer around 150-300 m (∆N2O, 7.90-8.51 nM) and coincided with the oxygen minimum layer. The observed N2O maximum occurs below the chl. a maximum layer, suggesting relations between the N2O productions/consumptions and plankton dynamics in this area. The production mechanisms of those N2O could be expected under aerobic and/or semi-anaerobic conditions depending upon redox boundaries by using the isotopomers viewpoints. The isotopomers of N2O (14N15N16O, 15N14N16O and 14N14N18O) contains more clearly biogeochemical information of its sources than in a conventional bulk 15N and 18O [1]. In the deeper layer, the vertical movement of cold water from inshore followed by the geopotential anomaly of the strong steering of the current by the ridge system around Antarctic should be one of the parameters to control the isotopomers of N2O. The influence of Southern Ocean N2O on the global N2O budget could be estimated about 16.86 Gg N2O-Nyr-1 based on the assumption of upward N2O flux from the maximum layer to the Tmin layer.
268

N. Boontanon et al.
2
FIG. 1. Illustration summary of the results of dissolved N2O in Southern Ocean.
[1] YOSHIDA, N., TOYODA, S., Constraining the atmospheric N2O budget from the intramolecular site preference in N2O isotopomers, Nature 405 (2000) 330-334.
Depth
UCDW, Tmin; 50-150 m
Atmospheric N2O
Surface; 0-50 m
>150 m
Antarctic Circumpolar Current (ACC)
Wind velocity
avg. ∆N2O = -0.88 nM
avg. ∆N2Omax = 8.47 nM
Dilution and/or transportation
N2O production
269

EXTENDED SYNOPSIS IAEA-CN-118/148
TOPIC: PACIFIC AND SOUTHERN OCEANS
1
Worldwide Marine Radioactivity Studies (WOMARS)
P. P. Povineca, A. Aarkrogb, K. O. Buesselerc, R. Delfantid, K. Hirosee, G. H. Hongf, T. Itoa1, H. D. Livingstona, H. Niesg, V. E. Noshkinh, S. Shimai, O. Togawaa1
a International Atomic Energy Agency, Marine Environment Laboratory, Monaco
bRisoe National Laboratory, DK-4000 Roskilde, Denmark
cWoods Hole Oceanographic Institution, Woods Hole, MA 02543, USA
dENEA, Marine Environment Research Centre, I-19100 La Spezia, Italy
eMeteorological Research Institute, Geochemical Research Department, Tsukuba, Ibaraki-ken, Japan
fKorea Ocean Research and Development Institute, Ansan,, Seoul, Korea, Rep. of
gFederal Maritime & Hydrographic Agency, Marine Chemistry Laboratory, Hamburg, Germany
hLawrence Livermore National Laboratory, Livermore CA 94550, USA
iJapan Marine Science Foundation, Mutsu Marine Laboratory, Mutsu, Aomori-ken, Japan
E-mail address of main author: [email protected]
A Co-ordinated Research Project (CRP) on Worldwide Marine Radioactivity Studies (WOMARS) was carried out in 1995 – 2002 by the IAEA-MEL’s Radiometrics Laboratory, with the primary objective to develop an understanding of the present open ocean distribution of anthropogenic radionuclides in the water column and sediment [1]. The investigation programme was designed with the intention of reviewing and contributing to scientific knowledge of the processes which affect radionuclide distributions and the sources which have introduced anthropogenic radionuclides to the world's oceans.
The specific objectives of the project were to: identify the major sources of anthropogenic radionuclides in the world's oceans; develop present knowledge of the distributions of key radionuclides in water and sediment of the world's oceans; extrapolate the results from contemporary ocean-wide surveys such as the tracer component of the World Ocean Circulation Experiment Hydrographic Programme (WOCE); and study the evolution of radionuclide concentrations in water with time using good quality historical data (e.g. from the GEOSECS programme of the mid-1970s and new data sets). Three anthropogenic radionuclides 90Sr, 137Cs and 239,240Pu have been chosen as the most representative of anthropogenic radioactivity in the marine environment, comprising beta-, gamma- and alpha-
1Present address: Japan Atomic Energy Research Institute, Tokaimura, Japan
270

P. Povinec et al.
2
emitters which have the highest potential contribution to radiation doses to humans via seafood consumption.
The world ocean with marginal seas were divided into boxes in which radionuclide time series in surface water were investigated and effective half-lives of 90Sr, 137Cs and 239,240Pu were calculated using data stored in the Global Marine Radioactivity Database (GLOMARD) [2]. 90Sr and 137Cs show similar half-lives of 22 ± 2 and 20 ± 3 years, respectively, for the Atlantic Ocean, and 16 ± 2 and 16 ± 4 years, respectively, for the Pacific Ocean. Data for all oceans (Table 1) gave similar effective half-lives for 90Sr and 137Cs, 19 ± 3 and 20 ± 2 years, respectively, therefore one can accept a mean value of 19 ± 2 years. The 239,240Pu data are also close, giving for the Atlantic and Pacific Oceans values of 9 ± 1 and 7 ± 1 year, respectively. The 239,240Pu effective half-life in surface water of all oceans is 9 ± 1 year. The corresponding residence times of 90Sr (137Cs) and 239,240Pu in surface water are 27 ± 2 and 13 ± 1 years, respectively.
TABLE I. MEAN EFFECTIVE HALF-LIVES OF 90Sr, 137Cs AND 239,240Pu IN SURFACE WATER OF THE WORLD OCEAN
Effective half-life ± 1s * (year)
Area Boxes 90Sr 137Cs 239,240Pu
North Pacific 01-05 12.4 ± 1.1 12.7 ± 1.4 6.7 ± 0.9 Equatorial Pacific 06+07 21.1 ± 1.9 28.6 ± 3.0 10.2 ± 2.4 South Pacific 08-12 17.9 ± 1.0 22.2 ± 5.2 12.1 ± 3.6 All Pacific 01-12 15.9 ± 2.4 15.9 ± 4.3 7.4 ± 1.1
North Indian 15 20.2 ± 1.9 21.2 ± 7.6 South Indian 16+17 21.9 ± 6.3 8.8 ± 1.0 All Indian 15-17 20.3 ± 1.8 9.0 ± 1.7
North Atlantic 25+28 15.6 ± 4.3 18.6 ± 4.2 9.0 ± 0.6 Central Atlantic 29 24.2 ± 2.1 23.7 ± 5.7 9.8 ± 2.9 South Atlantic 30 17.3 ± 8.8 20.2 ± 6.3 10.7 ± 4.9 All Atlantic 25-30 22.3 ± 2.4 20.4 ± 3.0 9.1 ± 0.5
All Oceans 19.1 ± 3.2 19.8 ± 1.5 8.8 ± 1.0 * Error weighted averaged values
The results obtained in the framework of the WOMARS project provide the most complete dataset available to Member States on levels of radionuclides in the marine environment. The results will be used as the international reference source on the average levels of anthropogenic radionuclides in the marine environment so that any further contributions from nuclear reprocessing plants, radioactive waste dumping sites, nuclear bomb test sites and possible nuclear accidents can be identified.
[1] WORLDWIDE MARINE RADIOACTIVITY STUDIES (WOMARS), IAEA-TECDOC series, IAEA, Vienna (in print).
[2] GLOBAL MARINE RADIOACTIVITY DATABASE (GLOMARD), IAEA-TECDOC-1146, IAEA, Vienna (2000).
271

EXTENDED SYNOPSIS IAEA-CN-118/149
TOPIC: UNDERGROUND LABORATORIES
1
Modelling Background Characteristics of HPGe Detectors Placed Inside Anticompton Shields
P. Vojtylaa P. P. Povinecb
a European Organization for Nuclear Research (CERN), Geneva, Switzerland
bInternational Atomic Energy Agency, Marine Environment Laboratory, Monaco
E-mail address of main author: [email protected]
Computing codes in GEANT 3 [1] were developed for simulations of background characteristics of HPGe γ-spectrometers on the surface and in shallow depths for which the background component originating in interactions of cosmic muons with a massive shield is dominating the total background [2]. Two types of detectors placed in lead shields with various linings were simulated: (1) a coaxial 170% HPGe detector, and (2) a well- type 150% HPGe detector. Also codes for simulations of an anti-Compton arrangement of the coaxial detector inside a large annular NaI(Tl) crystal and a cylindrical NaI(Tl) crystal were written. The codes enabled us to carry out simulations of the anti-Compton arrangement positioned vertically and horizontally with the aim to choose a position with a lower background. A method for simulations in shallow shielding depths based on muon rejection and momentum reduction was developed and introduced into the original codes simulating the muon flux at the sea level.
Simulations with various shields showed that the background depends mostly on the shield dimensions and the shield lining. By contrast, the background almost does not depend on whether the shield is cylindrical or rectangular provided its inner dimensions are the same. Best results were obtained for the smallest shields with as little amount of low-Z materials in the lining as possible. The maximum in the background continuum can be as much as 450 cpd/keV in a shield lined with 1.0 cm of copper compared with 190 cpd/keV in a lead-only shield. We recommend shields with removable linings so that this can be removed in case the lead X-rays do not disturb. A descending-Z lining composed from, for example, 1 mm Cd and 2 mm Cu is better than thick layers of copper only. The coaxial detector, which is intended for counting of samples of larger volumes, e.g. in Marinelli vessels, should be placed in a medium-size shield to allow also some place for the sample. It is not advisable to built the shield unnecessary large. In this arrangement, the integral background count rate (0−1500 keV) is expected to reach about 85 cpm, the count rate in the annihilation peak is estimated to be about 4400 cpd, and the maximum in the background continuum should be approximately 210 cpd/keV (at the sea level). The well-type detector intended for counting of small samples inside its well should be placed into a tight shield without lining. In this case, the integral background count rate can be as small as 50 cpm, the count rate in the annihilation peak can be reduced to 1900 cpd, and the maximum in the background continuum minimised to only about 100 cpd/keV.
The simulation of the horizontal and vertical anti-Compton arrangements showed that the differences between the two set-ups were negligible in the lower energy region. Differences occurred only in the energy region above 10 MeV. This can be caused by equilibration of the
272

P. Vojtyla and P. Povinec
2
lower-energy photon flux inside the shield cavity and in the anti-Compton NaI(Tl) crystals. The differences between the two set-ups are so small, that other criteria than the background characteristics, such as the mechanical design, access to the sample space, etc., are decisive. The anti-coincidence pulse rejection is strong, at least 40 at 1500 keV and in average about 90. The maximum in the background continuum of about 200 cpd/keV is reduced to only about 1.5 cpd/keV. At this level of the anti-coincidence reduction, other background components like contamination of shielding lead and the NaI(Tl) detectors would dominate. These components, however, do not depend on the orientation of the system either. A method to calculate background due to contamination of the shielding lead with 210Pb was developed elsewhere [3].
The simulations of the detectors 20 m.w.e. underground showed that the characteristics of the background spectra remained unaffected, except that all count rates scaled down by a general factor of about 3. Such general scaling allows comparing various set-ups disregarding the shielding depth. No significant differences were found between the horizontal and vertical arrangements of the anti-Compton system also 20 m.w.e. underground where the angular distribution of muon fluxes is different from that at the sea level. Such equivalence of the arrangements has a deeper physics cause as, for example, the above-mentioned equilibration of lower-energy photon fluxes.
[1] GEANT Detector Description and Simulation Tool, CERN Program Library Office, CERN-CN, CH-1211 Geneva 23, Switzerland.
[2] VOJTYLA, P., A Computer Simulation of the Cosmic-Muon Background Induction in a Ge γ-Spectrometer Using GEANT, Nucl. Instr. Meth. Phys. Res. B100 (1995) 87-97.
[3] VOJTYLA, P., Fast Computer Simulations of Backgrounds of Low-Level Ge γ-Spectrometers Induced by 210Pb/210Bi in Shielding Lead, Nucl. Instr. Meth. Phys. Res. B117 (1996) 189-198.
273

EXTENDED SYNOPSIS IAEA-CN-118/150
TOPIC: UNDERGROUND LABORATORIES
1
Underground Anticoincidence – Coincidence Gamma-Ray Spectrometers for Analysis of Radionuclides in the Environment
J-F. Comanduccia, I. Levy-Palomoa, P .P. Povineca, F. Garauda,b
a Marine Environment Laboratory, International Atomic Energy Agency, Monaco
bE.N.S.E.A, Ecole Nationale Supérieure de L'Electronique et de ses Applications, 95000 Cergy, France
E-mail address of main author: [email protected]
In recent years, it has been recognized that more sensitive methods for analysis of radionuclides in the environment are required for the application of radionuclide tracers in the study of environmental processes. This is especially true in the case of anthropogenic radionuclides, where environmental concentrations have decreased considerably over the 40 years subsequent to their main introduction to the environment. To meet this requirement IAEA-MEL decided to build an underground Counting lAboratory for enVironmental radionuclidEs (CAVE) [1, 2].
As the CAVE laboratory is situated at a depth of 35m w.e.(water equivalent) only, the muon component is not reduced significantly, and anticosmic shielding has to be applied around the detector in order to decrease its background. This system is made up of plastic scintillators surrounding the low background lead shield [1]. Four HPGe detectors are installed inside the lead shield:
• A 100% relative efficiency coaxial detector • A 150% relative efficiency well-detector • A 170% relative efficiency coaxial detector • A 200% relative efficiency well-detector
The second spectrometric system is an anti-Compton spectrometer, consisting of an n-type HPGe detector, top NaI(Tl) detector and an NaI(Tl) annulus detector. Between the top NaI and the Ge detector a flat Si beta-detector can be installed.
TABLE I. PEAK/COMPTON RATIOS IN THE DIRECT AND THE ANTI-COINCIDENCE MODE
P/C ratio Direct mode
P/C ratio Anti Compton mode
Attenuation
60Co (1332 keV) 50 289 5.7 137Cs (661 keV) 86 674 7.8 65Zn (1165 keV) 89 962 10.8
In this paper we will concentrate on the description of the parameters of the anti-Compton spectrometer working in different modes by counting of a background sample, a 65Zn source and a mixed 137Cs and 60Co. The comparison has been carried out for:
274

J-F. Comanducci et al.
2
• A single gamma-ray spectrometer • An anti-Compton gamma-ray spectrometer
Table I shows observed Peak/Compton ratios in the direct acquisition mode and in the anti-Compton mode.
Background spectra measured in the direct and in the anti-Compton modes are shown in Figure 1. The background counting rate between 40 to 2000 keV in the direct mode and the anti-Compton mode is 0.47 s-1 and 0.15 s-1, respectively. This system decreases also the cosmic ray contribution to the background; the annihilation peak (at 511 keV) is drastically removed.
FIG. 1. Direct and anti-Compton spectra.
Further, we also investigated performance of a coincidence gamma-ray spectrometer with anti-coincidence shielding, working in different modes:
• γ−γ spespectrometer • β−γ spespectrometer • β−γ−γ spespectrometer
Figure 2 shows gamma-spectra measured with a mixed 137Cs and 60Co source in the direct acquisition mode (left) and in the β−γ−γ coincidence mode (right). As expected, the 137Cs peak has almost disappeared in the β−γ−γ coincidence mode.
FIG. 2. 137Cs and 60Co mixed source spectra in the direct acquisition mode (left) and in the β−γ−γ coincidence mode (right).
[1] POVINEC ,P.P., COMANDUCCI, J.F., LEVY, I., IAEA-MEL’s underground laboratory for the analysis of radionuclides in the environment at very low levels (Proc. Int. Conf. On Radioactivity in the Environment, 1-5 Sept 2002, Monaco).
[2] POVINEC, P.P., COMANDUCCI, J.F., LEVY-PALOMO, I., IAEA-MEL’s underground laboratory in Monaco-background characteristics of HPGe detectors with anti-cosmic shielding, Appl. Rad. Isotop. 61 (2004) 85-93.
511 keV
511 keV
137Cs 137Cs 60Co 60Co
625
125025
1875
2500
625
125025
1875
2500
275

EXTENDED SYNOPSIS IAEA-CN-118/151
TOPIC: UNDERGROUND LABORATORIES
1
Radiocarbon Measurements by Liquid Scintillation Spectrometry at the Gran Sasso National Laboratory
W. Plastinoa,b, L. Kaiholac
a Department of Physics, University of Roma Tre, Rome, Italy
bNational Institute for Nuclear Physics, Section of Roma Tre, Rome, Italy
c Perkin Elmer Life and Analytical Sciences, Wallac Oy, Turku, Finland
E-mail address of main author: [email protected]
Radiocarbon measurements by two QuantulusTM ultra low level liquid scintillation spectrometers were performed at the Gran Sasso National Laboratory (National Institute for Nuclear Physics) and the Radiocarbon Laboratory of ENEA-Bologna to study the efficiency and background variations related to measurements sites.
For the background, two sets of three Teflon vials with benzene volumes ranging form 1 ml to 5 ml filled with pure analytical benzene were used. For the modern standards two sets of three Teflon vials with the same benzene volumes filled with pure analytical benzene enriched with radiocarbon to give the same activity as the standard sucrose ANU (sucrose ANU/modern=1.0866) were used. The scintillation cocktail comprised 15 mg butyl-PBD/ml benzene [1]. For each of these standards, spectra were obtained for 40 one-hour periods [2]. Cylindrical Teflon-S vials designed by ISTA Ltd (Faenza, Italy) with Derlin cap sealed with epoxy resin have been used. The vials characteristics are: height of 50 mm, external diameter 27 mm, thickness of the bottom Teflon base 12 mm, capacity of 9 ml.
Cosmic background and its variation have been removed in Gran Sasso National Laboratory by its 1400 m rock overburden. Stable high performance liquid scintillation counting conditions are obtained, when any remaining variable components of the environmental background, such as radon, are eliminated.
Ultra low level liquid scintillation spectrometer QuantulusTM has an anti-Compton guard detector, which allows monitoring of gamma radiation in the background. Guard detector efficiency in 14C background reduction is 8% in Gran Sasso National Laboratory while 80% is observed on surface [3].
The big difference in the guard detector efficiency between surface and Gran Sasso laboratories is related to the absence of cosmic and associated lower energy Compton radiation [3].
Masked vials approach same zero volume background on surface as an unmasked vial in Gran Sasso National Laboratory, where absolute backgrounds are about a half of the surface figures [3].
276

W. Plastino and L. Kaihola
2
The cosmic noise reduction observed at the Gran Sasso National Laboratory makes it possible to perform high precision 14C measurements and to extend for these idealized samples the present maximum dating limit from 58,000 BP to 62,000 BP (5 ml, 3 days counting) [2].
However, experiments on real material have emphasized that the problems in extending the limit of detection back in time, have much more to do with benzene synthesis and contaminants introduced through lithium, surface reaction catalysts and impurities than the counter background level [4-6].
[1] GUPTA, S.K., POLACH, H.A., Radiocarbon dating practices at ANU, Canberra, Radiocarbon Laboratory, Research School of Pacific Studies, ANU, 72-75 (1985).
[2] PLASTINO, W., KAIHOLA, L., BARTOLOMEI, P., BELLA, F., Cosmic background reduction in the radiocarbon measurements by liquid scintillation spectrometry at the underground laboratory of Gran Sasso, Radiocarbon 43 2A (2001) 157-161.
[3] PLASTINO, W., KAIHOLA, L., Surface and underground ultra low level scintillation spectrometry, Radiocarbon (in press).
[4] RADNELL, C.J., MULLER, A.B., Memory effects in the production of benzene for radiocarbon dating, Radiocarbon 22 2 (1980) 479-486.
[5] LOWE, D.C., Problems associated with the use of coal as a source C-14 dating, Radiocarbon 34 3 (1992) 402-405.
[6] McCORMAC, F.G., KALIN, R.M., LONG, A., Radiocarbon dating beyond 50,000 years by liquid scintillation counting, (NOAKES J.E., SCHÖNHOFER, F., POLACH, H.A., Eds), Liquid Scintillation Spectrometry 1992, Tucson: Radiocarbon (1993) 125-133.
277

EXTENDED SYNOPSIS IAEA-CN-118/152
TOPIC: UNDERGROUND LABORATORIES
1
Depth Profile of Environmental Neutron Flux in Water
Y. Hamajima, K. Komura
LLRL, Kanazawa University, Kakuma-machi, Kanazawa, 9201192 Japan
E-mail address of main author: [email protected]
Depth profile of environmental thermal neutron flux in water was measured using activation technique. It was difficult to measure the profile in water up to the present, because of extremely low intensity of the flux. Recently, we constructed the ultra- low-level measurement system of Ge detectors in Ogoya Underground Laboratory (OUL) [1], where 5 well, 4 planer, and 1 coaxial type Ge detectors with high efficiency were set up. Integrated background counting rate between 100 to 2000 keV of these detectors was less than 2 cpm. Therefore, it is now possible to measure its profile, using these detectors. Target material was 15 to 25 g of gold foil. Ten of targets were horizontally set at 0 to 200 g/cm2 depth in seawater and fresh water. After 2 or 3 weeks exposure, gamma-ray was measured for 2 or 3 days by the ultra- low-background Ge detectors in OUL at the same time. The environmental neutron flux was estimated from the activity of Au-198. In this work, the activation cross-section of gold was assumed to 98.8 barn, taking only into account of thermal neutron. Thermal neutron shielding effect and self-absorption of 411 keV gamma-ray in the target material was neglected.
Environmental thermal neutron flux was plotted as a function of depth, as shown in Fig. 1. Maximum was found at the depth of 5 to 10 g/cm2. It was considered that most of environmental first and epi-thermal neutron was thermalized at around this depth. The flux was exponentially decreased in the depth deeper than 50 g/cm2. The characteristics of the
FIG. 1. Depth profile of thermal neutron flux in water.
278

Y. Hamajima and K. Komura
2
depth profile of this work were mostly in agreement with the calculation [2]. However, the absolute value of the flux was inconsistent between these results. This disagreement may seem that the neutron energy has the range from thermal to 0.25 eV in the calculated depth profile and/or that the targets is assumed to only activate by the thermal neutron neglected the resonance and the first neutron absorption cross-section in this work.
[1] HAMAJIMA, Y., KOMURA, K., Background Components of Ge Detectors in Ogoya Underground Laboratory, J. Appl. Rad. Isotopes (in press).
[2] KASTNER, J., OLTMAN, B.G., FEIGE, Y., GOLD, R., CONGEL, F., Nuclear Radiation Detection for the Natural Environment, IEEE, Nucl. Sci. 17 (1970) 144-150.
279

EXTENDED SYNOPSIS IAEA-CN-118/153
TOPIC: UNDERGROUND LABORATORIES
1
Low-Level Germanium Gamma Spectroscopy at the µBq Level and Future Developments towards Higher Sensitivity
G. Heussera, M. Laubensteinb
a Max-Planck-Institut für Kernphysik (MPI-K), Heidelberg, Germany
bLaboratori Nazionali del Gran Sasso (LNGS), Assergi (AQ), Italy
E-mail address of main author: [email protected]
A Ge-spectrometer (called GeMPI) designed for material screening at a few ten µBq/kg level is operated at the Gran Sasso underground laboratory LNGS in Assergi (Italy) near Rome since 1997. First results of background and sample measurements have been published in [1]. Although GeMPI is mainly used for radiopurity measurements in connection with rare event experiments (solar neutrino detection, double beta decay and dark matter search), it can also be applied to environmental studies. Some of the results obtained from material measurements might be of big interest to the scope of this conference. Its high sensitivity makes the spectrometer very well suited for investigations in the field of environmental protection and for safeguarding issues.
Special attention in the construction of the spectrometer was devoted to obtain a low background for primordial radionuclides. The complete cryostat system and combined lead/copper shield was made from thoroughly selected low radioactivity materials. Radon suppression is achieved by an air-tight steel case around the shield, which is pressurized with nitrogen gas. It is connected with an air- lock system through which the samples are inserted. The achieved background level (about 6 orders below ambient level) in combination with a large sample capacity of up to 15 l and a large Germanium crystal (with a mass of 2.2kg) allows measuring concentrations of the gamma-active natural radioactivity chain members down to 10-12 g/g of U/Th equivalent. In case of natural potassium the 10-9 g/g range is accessible.
The performance of the spectrometer will be described illustrating some recent measurements in connection with an outlook to next generation Ge-spectroscopy (nBq/kg sensitivity). Background studies with GeMPI and the detectors of the Heidelberg-Moscow Double Beta Decay Experiment [2] revealed that the residual background (see table 1) is dominated by surface contamination from primordial radionuclides of the crystal cladding materials. Cosmogenic activation from sea level exposure prior to the underground installation is the next most important background component [3].
A substantial background reduction should be possible by operating the Ge-crystal directly in liquid nitrogen with a minimum of cladding material, just the part necessary to hold it and to form the contacts, as was first proposed in [4]. Liquid nitrogen serves as cooling medium and as the innermost shielding due to its high purity (see e.g. [5]). A project along this line as the next step in double beta decay search with 76Ge has recently been proposed [6].
280

G. Heusser and M. Laubenstein
2
This technique applied to environmental studies would open many new possibilities. For example cosmogenic activation of materials exposed at surface or shallow depth could be used as a tracer for their residence time. Copper samples of 100g will be sufficient for measuring a variety of cosmogenic radionuclides with different half lives. Measuring gamma active radioisotopes produced by accidental neutron exposures could be a relevant issue in radiation protection.
The possibility to build a rather compact spectrometer applying this technique will be discussed together with the necessary prerequisites for achieving a background, which is at least one order of magnitude below the present state of the art, as e.g. realized with GeMPI.
TABLE I. BACKGROUND COUNT RATES OF GEMPI AND THE DETECTORS OF THE HEIDELBERG-MOSCOW DOUBLE BETA DECAY EXPERIMENT [3]
background peak (integral) count rate
[counts kg-1 y-1]
Energy [keV] GeMPI HD-Moscow detectors 1-5
352 (U/Ra) ≤ 24 110 – 180
609 (U/Ra) ≤ 25 96 – 140
583 (Th) ≤ 21 18 – 42
2615 (Th) 18 ± 5 11 – 22
1461 (K) 86 ± 12 74 – 290
100 – 2700 6841 ± 106 0.092
[1] NEDER, H., et al., Low level germanium-spectrometer to measure very low primordial radionuclide concentrations, Appl. Rad. Isot. 53 (2000) 181.
[2] GÜNTHER, M., et al., Heidelberg-Moscow ßß experiment with 76Ge: Full setup with five detectors, Physics Review D 55 (1997) 54.
[3] DIETZ, A., Diploma thesis, University of Heidelberg (1999). [4] HEUSSER, G., Low-radioactivity background techniques, Annu. Rev. Nucl. Part. Sci.
(1995) 543. [5] HEUSSER, G., et al., 222Rn detection at the microBq/m3 range in nitrogen gas and new
222Rn purification technique for liquid nitrogen, Appl. Rad. Isot. 52 (2000) 691. [6] ABT, I., et al., A new 76Ge double beta decay experiment at LNGS, arXiv:hep-
ex/0404039.
281

EXTENDED SYNOPSIS IAEA-CN-118/154
TOPIC: UNDERGROUND LABORATORIES
1
Low Background Germanium Detector Technology from Canberra
J. Verplanckea, M. Berstb, M. O. Lampertb, O. Tenchc
a Canberra Semiconductor N.V., Olen, Belgium
bCanberra Eurisys SA, Lingolsheim, France
cCanberra Industries Inc., Meriden, U.S.A.
E-mail address of main author: [email protected]
Since Eurisys Mesures and Canberra merged into one company under the wings of Cogema-Areva in February 2001, decades of know-how and experience in building Germanium detectors for low level gamma ray analysis have been brought together. This vast experience means that Canberra can offer a large variety of “low level detectors” depending on the application. The complexity and cost of these detectors increase with the decreasing detection limits that our customers want to obtain.
In this paper we give a short overview of the various categories of “low level HP Ge detectors” that we produce. We present some examples of detection limits that can be obtained with each of these and we show what measures are taken to come to the next lower limit of detection. The spectroscopist should be aware, however, that the detection limit that can be obtained with a particular source and isotope mix depends in the first place on the choice of the detector element geometry and size, and on the geometry of the cryostat and source. Reference [1] discusses this aspect of the optimum counting conditions. The choice of the shielding and the location of the detector-shield combination (above or below ground level) comes in second place. The precise design and choice of materials for the cryostat – the subject of this paper – are generally only the third factor of importance. ([2] and [3])
The simplest low level gamma counting system that we consider in this paper consists of a standard high purity germanium detector in a standard lead shield. The cryostat materials used for these standard detectors are selected mainly for their mechanical properties and cost. Selection of the cryostat materials for their radio-purity comes only in second place. The contribution of their activities to the background in the spectrum is negligible since the measuring times are usually limited (typically 1 hour) and the background coming from the room and the sample is generally higher. Detection limits that are aimed for in this category are in the order of 0.5 to 1 Bq per kg (for Cs-137 in a water sample and one hour counting time [4]). This is still one order of magnitude lower than when no lead shield is used [5].
When lower detection limits are aimed for, for instance by applying longer counting times, the background activity coming from the radio-isotopes present in the cryostat construction materials of standard detectors become more important. This is particularly true when radioisotopes of interest are present in these construction materials: 60Co, 40K, 137Cs, 232Th, 235,238U and their daughters. At this level, also the activity generated by (n,γ) and (n, n’γ) reactions by cosmogenic neutrons on construction materials in the system may become a nuisance. These applications constitute 90% of the low level, environmental sample analysis applications. For these, Canberra developed standardized “ultra-low-background”(ULB)
282

2
cryostats. Construction materials are replaced by materials that are practically free of radioactivity that may become visible after a few hours of counting. Materials that have large cross sections for interactions with cosmic particles are avoided. Detector parts that cannot be replaced by radio-pure alternatives (electronic components, molecular sieves, PCBs, …) are moved away from the detector element, outside the lead-shield and not in line of view with the detector element. The lead shields used with these detectors generally have the facility to flush the inside with nitrogen boil-off gas to minimize the background coming from Radon in the air.
The overall background level obtained with these detectors is not much lower than with the previous category of “low background detectors” (typically some 10%). However, most of the strongest photopeaks disappear from the blank spectrum, allowing measurement of virtually any isotope with good statistics down to a level below 1 Bq/kg (for 100 % abundance and 1 hour counting time).
Applications that require much lower detection limits and much longer counting times, are mainly hindered by artefacts that are created by the interaction of the counting system with cosmic particles. A solution that is used then is to place the shield and detector in a deep underground location or with a cosmic-veto shield on top of the lead shield. At these levels, other phenomena become visible that are otherwise obscured by the cosmic background:
- trace-amount of radio-impurities in the construction materials, such as activity in the front-end electronic components, 210Pb activity coming from the solderings used, etc…
- activation products of copper and germanium that have grown in during their stay above ground.
The measures to overcome these “contaminants” can go very far, including avoiding soldering, detector assembly in extreme clean room environments and hiding electronic components behind massive internal shielding or using very special materials like ultra-high purity endcaps and holders, very old steel and lead parts and using only fresh germanium and copper that is stored deep underground at all (practical) times. These solutions are engineering intensive, require the input and help from the user, and are obviously much more expensive that the standard ultralow-background solutions.
Other papers on this conference [6] show that using such extreme measures, detection limits as low as a few µBq per kg of material can be obtained.
[1] VERPLANCKE, J., About Shapes and Geometries of high purity germanium detectors, presented at the Nucl. Phys. Conf., Madrid, Aug. 1999.
[2] CEUPPENS, M. et al., Low Background Germanium Detectors; from environmental laboratory to underground counting facility, Proc. Workshop “Methods and Applications of Low Level Radioactivity Measurements", Rossendorf, Nov. 1996.
[3] VERPLANCKE, J., Low Level Gamma Spectroscopy; low, lower, lowest, Nucl. Instr. Meth. Phys. Res. A 312 (1992), 174-182.
[4] Canberra document: Application Note: Gamma Analyst Performance Characteristics (MDAs), 1997.
[5] TOIVONEN. H., Development of in-field monitoring techniques. Report on Task FIN A845 on the Finnish Support Programme to IAEA Safeguards, Dec. 1994.
[6] HEUSSER G., et al., presentation at this conference.
283

EXTENDED SYNOPSIS IAEA-CN-118/155
TOPIC: UNDERGROUND LABORATORIES
1
The Gran Sasso National Laboratories (L.N.G.S.): Status and Outlook
M. Laubenstein
Laboratori Nazionali del Gran Sasso, S.S. 17/bis km 18+910, I-67010 Assergi (AQ), Italy
E-mail address of main author: [email protected]
The Gran Sasso National Laboratories (L.N.G.S.) are world-wide one of the biggest underground laboratories (e.g. [1]). They are located about 100km east of Rome in Italy along the highway, in the Gran Sasso Range of the Italian Abruzzi. Their mission is strictly connected to the fields of particle and astroparticle physics, where the experiments located underground have given an enormous and very important contribution for their understanding. The underground laboratories are located at 1400m depth (equivalent to an overburden of 3800m of water). In the past years a change took place during which the first generation experiments have gradually been replaced by a new generation of experiments.
Some of the experiments which have given important results during the past 15 years are GALLEX, MACRO, and, more recently, DAMA, the Heidelberg-Moscow double beta decay experiment and the LUNA experiment. GALLEX was the first experiment measuring the pp-neutrino flux coming from the sun and confirming the solar neutrino deficit registered by the other solar neutrino experiments. MACRO gave a very valuable contribution to the understanding of the cosmic ray attenuation and induced reactions in the earth mantle, pushing at the same time the limit for the predicted flux of magnetic monopoles further down. DAMA, instead, is world-wide the first experiment, which is giving a possible signal of dark matter particles. The Heidelberg-Moscow double beta decay experiment has given the best limit on the neutrino less double beta decay for 76Ge. In the end, LUNA has measured nuclear reactions of astrophysical interest, approximately close to the energy range of the reactions in the sun.
The new generation of experiments consists above all in the very ambitious project of the CERN Gran Sasso neutrino beam. On their way through the earth mantle the neutrinos, generated in the CERN accelerators, could change their flavour. This flavour changing, commonly referred to as oscillation, is already confirmed for the neutrinos coming from the sun, but it is important to know, whether this process is taking place also on the medium range, which is important for the determination of the neutrino mass parameters. The experiments at the L.N.G.S. which will perform this detection are currently under construction. They are OPERA and ICARUS. OPERA is using an emulsion technology. It consists of thousand of photographic emulsions, which do not detect the neutrino directly, but the reaction products. ICARUS, instead, is a huge detector working with 600 t of liquid argon, working as a time projection chamber. Then there are several new initiatives of smaller experiments, aiming either at the detection of dark matter with new methods and larger detectors (CRESST, WARP), or at the confirmation/refusal of double beta decay (CUORICINO, an enhanced and enlarged 76Ge experiment).
284

M. Laubenstein
2
Apart from the primary mission in fundamental physics experiments, the unique position of the underground laboratories inside a mountain, close to an active seismic fault, gives also rise to geophysics and geology experiments (e.g. [2]). Those experiments are collecting very useful information, e.g. about the behaviour of the groundwater reservoir, and the precursor events of micro- and macro-seismic activity.
Last but not least, the almost complete absence of cosmic rays and the very low radioactivity of the surrounding environment give the possibility of refining and improving the instrumentation for low-level experiments. The L.N.G.S. are housing one of the biggest low-level research facilities underground (e.g. [3]). It is equipped with eight high purity Germanium detectors with one of them having the lowest background ever measured with such a type of detector. Recently was installed a low background liquid scintillation counter. It was found in the past years that for this kind of detectors the location deep underground is greatly enhancing their performance, increasing the signal stability and lowering the background. An enlargement of the low background facility is under way, because the request of space for new applications is high, and it is surely worthwhile to pursue this street for the sake of interdisciplinary applications. For example in the near future the L.N.G.S. underground will host also the prototype of a new gravitational wave experiment, LISA, which will be sent in a few years from now in its mission around the sun.
In conclusion, the L.N.G.S. are a unique and large underground facility giving the possibility for a wide range of researchers, physicists, geophysicists, geologists, biologists and many others to widen their knowledge, to develop new detectors and interconnect various field of research for the benefit of all.
[1] BETTINI, A., Neutrino physics at Gran Sasso Laboratory, Nucl. Phys., B. (Proc. Suppl.) 100 (2001) 332.
[2] PLASTINO, W., et al., Radon groundwater monitoring at underground laboratories of Gran Sasso (Italy), Geophys. Res. Lett. 28 14 (2001) 2675.
[3] ARPESELLA, C., A Low Background Counting Facility at Laboratori Nazionali del Gran Sasso, Appl. Rad. Isotop. 47 (1996) 991.
285

EXTENDED SYNOPSIS IAEA-CN-118/156
TOPIC: UNDERGROUND LABORATORIES
1
Neutron Fluence Measurements Using Underground HPGe-Detectors
M. Hult, J. Gasparro
EC-JRC-IRMM, Retieseweg 111, B-2440 Geel, Belgium
E-mail address of main author: [email protected]
IRMM performs gamma-ray spectrometry in the underground laboratory HADES located at a depth of about 500 m water equivalent at the premises of the Belgian nuclear centre SCK•CEN in Mol and operated by Euridice. By performing gamma-ray spectrometry with HPGe-detectors deep underground one can reduce the background counting rate with a factor of 1000 compared to a low background detector above ground [1]. Underground HPGe-detectors are being employed in an increasing number of different fields. One field in which the use of underground HPGe-detectors has proven to be particularly useful is in the field of neutron fluence measurements. It is useful at this stage to point out that according to the ISO guides [2, 3] the entities particle flux, fluence and fluence rate are used together with the units s-1, m-2 and m-2s-1, respectively. The name flux density can be used as synonym to fluence rate.
Measurement of neutrons (energy and fluence) is a delicate task in nuclear measurements. By making use of underground gamma-ray spectrometry it is possible to extend the present use of the so called foil activation technique (a common technique to measure neutron fluxes in nuclear reactors) to encompass very low neutron fluences (even environmental neutron fluences) as well. As we started working on this technique a couple of years ago, 4 interesting applications have evolved and will be briefly described below.
Application #1, ALARA principle and benchmarking: Around nuclear installations like accelerators and reactors there is generally an enhanced neutron field. The neutron dose meters used for monitoring purposes are often not reliable at very low doses. By using metal discs of various materials it is possible to measure also only slightly enhanced neutron flux levels. This can be used to better implement the ALARA principle. Such work has been carried out at the IRMM Van de Graaff accelerator as well as at the BR-1 reactor of SCK•CEN [4]. The neutron field near medical accelerator is often overlooked. We aim at studying this in the future.
Application #2, use of fast neutron induced reactions: An accurate neutron energy spectrum can be produced using unfolding techniques in combination with activation foils/discs. Although the activation technique is very sensitive to thermal neutrons it is not so sensitive to fast neutrons due to the generally low activation cross sections for high energy neutrons. The use of threshold reactions and underground gamma-ray spectrometry allows us to produce a neutron spectrum with relatively high resolution, which is useful for benchmarking of other (on- line) neutron monitors or machine (accelerator/reactor) properties.
Application #3, retrospective neutron fluence measurements: In 1999 there was a criticality accident at the JCO fuel factor in Tokai-mura. The accident was characterised by:
286

M. Hult and J. Gasparro
2
High release of neutrons (for 20 hours) to the surroundings Only negligible amounts of fission products were released Poor neutron monitoring facilities outside the plant. In order to understand the effects of the accident, activated samples (table salt, gold items, steel spoons etc.) were collected from houses in Tokai-mura by the Japanese investigation team headed by Prof. Komura [5]. Some of these items had low activities due to either too large distance from epicentre and/or long time (in relation to the half- life in question) between activation and measurement [6].
Man’s knowledge of the effect of ionising radiation on the human body is to a large extent based on follow-ups of Hiroshima/Nagasaki victims. In a project similar to the “JCO-measurements”, IRMM measured steel activated by the A-bomb in 1945 in order to better quantify the dose received by the population [7]. At present the dose is calculated using computer models and measurements are necessary to verify these models.
Application #4, environmental neutron flux inside various material: With thin discs/foils it is possible to measure the neutron flux inside various materials with high depth resolution. This is important for example in geoscience, which relies on cosmogenically induced activation in order to make e.g. age determinations and erosion histories.
[1] LAUBENSTEIN, M., et al., Underground measurements of radioactivity, Appl. Radiat. Isot. 61 (2004) 167-172.
[2] ISO, Quantities and units – Part 9: Atomic and nuclear physics, ISO 31-9:1992(E). [3] ISO, Quantities and units – Part 10: Nuclear reactions and ionizing radiation, ISO 31-10
(1992) (E). [4] MARTINEZ CANET, M.J., HULT, M., KÖHLER, M., AIT ABDERRAHIM, H.,
MARLOYE, D., Metal discs as very low thermal neutron flux monitors in reactor environment, ASTM technical Publication 1398 (2001) 761-768.
[5] KOMURA, K., et al., The JCO criticality accident at Tokai-mura, Japan: an overview of the sampling campaign and preliminary results, J. Environ. Radioact. 50 (2000) 3-14.
[6] GASPARRO, J., et al., Measurements of 60Co spoons activated by neutrons during the JCO criticality accident at Tokai-mura in 1999, J. Environ. Radioact. 73 (2004) 307-321.
[7] HULT, M., et al., Deep underground measurements of 60Co in steel exposed to the Hiroshima atomic bomb explosion, Appl. Radiat. Isot. 61 (2004) 173-177.
287

EXTENDED SYNOPSIS IAEA-CN-118/157
TOPIC: UNDERGROUND LABORATORIES
1
Low Level Gamma-Ray Spectrometry at the PTB Underground Laboratory UDO
S. Neumaier, D. Arnold
Physikalisch-Technische Bundesanstalt (PTB), Braunschweig, Germany
E-mail address of main author: [email protected]
A new ultra low level background (ULB) gamma-ray spectrometry system has been installed 925 m below ground at the underground laboratory “UDO” of the Physikalisch-Technische Bundesanstalt, Braunschweig [1]. This new system, consisting of a 95% coaxial HPGe-detector and a passive shielding (20 cm of low-activity lead, 10 cm electrolytic copper and radon suppression by N2-flushing), will be described. Most of the peak count rates are less than 1 count per day and the integral background count rate in the energy range from 40 keV to 2750 keV is about 20 h-1. Fig.1 shows the background spectrum of the system. Note that there are empty channels in the measured spectrum where no count was measured in 40 days. This system was especially used to determine very small activity concentrations of 60Co in environmental samples from Hiroshima [2] and Tokaymura [3] as well as for the determination of very small concentrations of long-lived radionuclides in meteorites [4]. Results from these applications will be reported.
FIG. 1. Background spectrum of the ULB-detector system measured for 40 days.
0,001
0,01
0,1
1
0 500 1000 1500 2000 2500 3000
Energy in keV
Co
un
trat
e in
1/h
288

S. Neumaier and D. Arnold
2
[1] NEUMAIER, S., ARNOLD, D., BÖHM, J., FUNCK, E., The PTB underground laboratory for dosimetry and spectrometry, Appl. Radiat. Isot. 53 1-2 (2000) ISSN 0969-8043, S173-178.
[2] HULT, M., GASPARRO, J., VASSELI, R., SHIZUMA, K., HOSHI, M., ARNOLD, D., NEUMAIER, S., Deep underground measurements of 60Co in steel exposed to the atomic bomb in Hiroshima, Appl. Radiat. Isot. 61 2-3 (2004) ISSN 0969-8043, S173-177.
[3] GASPARRO, J., HULT, M., KOMURA, K., ARNOLD, D., HOLMES, L., JOHNSTON, P.N., LAUBENSTEIN, M., NEUMAIER, S., REYSS, J.-L., SCHILLEBEECKX, P., TAGZIRIA, H., VAN BRITSOM, G.,VASSELLI, R., Measurements of 60Co in spoons activated by neutrons during the JCO criticality accident at Tokai-mura in 1999, J. Environ. Radioact. 73 3 (2004) S307-321.
[4] ARNOLD, D., NEUMAIER, S., SIMA, O., Deep underground gamma spectrometric measurement of Al-26 in meteorite samples, Appl. Radiat. Isot. 56 1-2 (2002) ISSN 0969-8043, S405-408.
289

EXTENDED SYNOPSIS IAEA-CN-118/158
TOPIC: UNDERGROUND LABORATORIES
1
Activity Levels of Airborne Radionuclides at Hegra Island, Japan
K. Komura, N. Manikandan, Y. Yamaguchi, M. Inoue, Y. Murata
a Low level Radioactivity Laboratory, Institute of Nature and Environmental Technology, Kanazawa University, Kanazawa, Japan
E-mail address of main author: [email protected]
Activity levels of airborne radionuclides (210Pb, 210Po, 212Pb, cosmic ray induced 7Be, 22Na and artificial 137Cs) have been measured at Hegra Island (37.8°N, 136.9°E) located 50 km from Noto Peninsula, Japan.
Airborne radionuclides were collected on a 25cm x 20cm quartz-fiber filter using high volume sampler at flow rate of 700 L min-1. Regular sampling was made at 1 week intervals with the help of school teachers living in Hegra Island. Short sampling of 1~3 hr intervals was also conducted to obtain high resolution analysis of temporal variation. 222Rn was measured 1 hr intervals at the side of sampling site. Wind direction and wind speed at Hegra Island were obtained from Marine Safety Agency of Japan.
FIG. 1. Temporal variations of 210Pb, 7Be and 137Cs at Hegra Island.
Be-7 H
Cs-137
May, 2003 June July Aug Sep Oct Nov
Pb-210
(µBq m-3)
(mBq m-3)
2.0
1.5
1.0
0.5
0
0
2.0
4.0
0.8
0.6
0.2
0.4
0
(mBq m-3)
290

K. Komura et al.
2
Activities of 210Pb, 212Pb and 7Be were measured by using ultra low-background Ge detectors at Ogoya Underground Laboratory (OUL)[1] for 1~2 days each. On the other hand, 210Po was separated and electrochemically deposited on small silver plate. The 210Po activity was measured by alpha spectrometry by Si detector. Extremely low levels of 22Na and 137Cs were determined by long time measurement of up to 1 week. When 22Na and 137Cs activities were too low, three or four samples were measured together to obtain positive data. Temporal variations of 210Pb, 7Be and preliminary 137Cs values observed at Hegra Island are shown in Fig. 1.
[1] KOMURA, K., Ogoya underground laboratory for the measurement of extremely low-level environmental radioactivity (Proc. Int. Conf. Radioactivity in the Environment, 1-5 Sep. 2002, Monaco) (2002) (on CD-ROM).
291

EXTENDED SYNOPSIS IAEA-CN-118/159
TOPIC: UNDERGROUND LABORATORIES
1
Some Background Effects Observed with a Low-Level Gamma-Spectrometer with Muon Veto Detector
J. W. Mietelski, Z. Hajduk, L. Hajduk, J. Jurkowski
The Henryk Niewodniczanski Institute of Nuclear Physics, Polish Academy of Sciences, Kraków, Poland
E-mail address of main author: [email protected]
A low background gamma spectrometer was constructed at Krakow’s Institute of Nuclear Physics.
The muon detector, designed and constructed in the Department of Leptonic Interactions of Institute is a multiwire Charpak’s chamber. It has two active layers, with volume of 70×70×2 cm3 each. The signals from 160 anode wires are collected in 8 channels, 4 sections in each layer and transferred to NIM standard. Several logical configurations of sections were tested to optimise the effectiveness of the shielding. As the result the logical sum of signals from all sections was chosen. Produced logical signal is then transformed to 20 µs lasting positive TTL pulse, which is used as a veto for spectrometer’s ADC (by Silena). Timing and duration of TTL pulse were also optimised to achieve highest possible effectiveness.
The active shield itself reduces continuous spectrometer’s background (from 80 keV to 3 MeV) by factor about 2 (from 0.88 cps to 0.46 cps), increasing dead-time by less then 0.5%. The influence of each part of a shield (passive and active) on background was studied.
Besides this active shield, the spectrometer has special passive shield (see Fig.1), which consists of (from outside-to-inside) 8-12 cm of paraffin, 10 cm of standard lead, 2 mm of cadmium, 5 cm of 2500 years old lead and 1 cm copper.
FIG. 1. A scheme of construction of low-level gamma spectrometer shield.
292

J. Mietelski et al.
2
The HPGe detector, constructed by Department of Nuclear Spectroscopy, has an aluminium-free cryostat top with a window made of a plastic foil supported by carbon fibres . The aluminium was avoided from the construction of the detector since a presence of traces of uranium in most aluminium alloys. The inner, shielded volume of spectrometer is flushed with liquid nitrogen vapours, to reduce Rn daughters contribution to the spectra.
The spectrometer is now in routine operating, it was applied for the study of 22Na in the atmosphere published recently [1] and during the study on Antarctic and Arctic contamination (not published yet).
A part of the spectrometer time is used for studying background effects caused by neutrons. The most interesting effects are perhaps (n, γ) processes which occurs in construction materials but also in matrixes of sample as well. For example, a water matrix show the 2.223 MeV hydrogen neutron capture line what means, that synthesis of deuteron occurs in water sample, therefore also in certain amount in any sea waters. Introduction of a paraffin – cadmium element to the shielded area makes the system very sensitive for neutron flux. Some of this effects will be described in details in the paper.
[1] GRABOWSKA, S., MIETELSKI, J.W., KOZAK, K., GACA, P., Gamma emitters on micro-becquerel activity level in air at Kraków (Poland), J. Atmos. Chem. 46 (2003) 103-116.
293

EXTENDED SYNOPSIS IAEA-CN-118/160
TOPIC: AMS
1
New Directions for Accelerator Mass Spectrometry Technology
W. E. Kiesera, A. E. Litherlanda, X-L Zhaoa, J. Cornettb, J. N. Smithc, L. Cousinsd, G. Javaherid, I. Tomskid
a IsoTrace Laboratory, University of Toronto, Toronto, Ontario, Canada
bRadiation Protection Bureau, Health Canada, Ottawa, Ontario, Canada
cAtlantic Environmental Radioactivity Unit, Fisheries and Oceans Canada, Dartmouth, Nova Scotia, Canada
dIonics Mass Spectrometry Group Inc., Concord, Ontario, Canada
E-mail address of main author: [email protected]
The techniques used in Accelerator Mass Spectrometry (AMS) have often been made possible by developments made in other fields. The very beginnings of this technology benefited greatly from the development of the caesium sputter ion source which could generate large beams of many different ions for nuclear physics experiments. This advance provided sufficient ion current from a sample that rare isotopes, with abundance ratios as low as 1 part in 1015, could be counted with appropriate statistics in a reasonable length of time.
As accelerators specifically for AMS were designed, the economic advantages of lower voltages resulted in equipment which was suitable for the lighter isotopes, such as 14C, but which was not capable of analyzing much heavier elements. The incorporation of a significantly larger spectrometer magnet and a matched electric analysers, with the appropriate selection of charge state, permitted smaller (~3 MV) accelerators to be used for much heavier elements. For example, a large contribution to the analysis of 129I, both in the monitoring of nuclear fuel or waste handling, and in derivative investigations such as ocean and atmospheric circulation studies has been made by laboratories using these small accelerators. Investigations of the results of North Atlantic deep water formation, carried out by measuring 129I concentrations in the Labrador Sea over the last 7 years will be presented as an example of this type of work carried out at IsoTrace.
A number of heavier elements cannot be analysed with small accelerators simply by adding larger magnetic and electric spectrometers. A typical case is 36Cl where higher energy is necessary so that range separation can be used to remove the 36S isobar. However, recent work, using chemical reaction cells following inductively coupled plasma and electro-spray ion sources, has demonstrated the means for isobar separation at extremely low energies. The adaptation of this technology to AMS systems opens up the possibility for the analysis of 36Cl and other difficult isobar pairs with smaller accelerators. In collaboration with Ionics Mass Spectrometry Group Inc, a prototype system is being designed for the IsoTrace AMS system. Details of this work will be discussed and some estimates of its capability will be provided.
AMS has typically provided analyses in well-controlled experimental systems, in which time for site characterization, careful sample preparation and detailed analysis has been available. However, the accidental or malicious distribution of long lived radioisotopes in the
294

W. Kieser et al.
2
environment presents different challenges. In particular, the potential dissemination of 14C, which is difficult to detect at low levels with conventional survey equipment, into areas where aquaculture or agriculture is practiced has caused concern for the security of the food chain. In collaboration with Health Canada and Fisheries and Oceans Canada, a system is being developed in which an elemental analyser is interfaced to a CO2 gas-fed ion source attached to the IsoTrace AMS system. Protocols will be developed for the rapid sampling of both marine and terrestrial environments, so that the initial extent of the dispersion and the effectiveness of remediation can be assessed. Details of this system and progress in its implementation will be reported.
295

EXTENDED SYNOPSIS IAEA-CN-118/161
TOPIC: AMS
1
53Mn in Ferromanganese Encrustations
G. Korschineka, M. Poutivtseva, T. Faestermanna, K. Kniea, G. Rugela, A. Wallnerb, J. Scholtenc, A. Manginid
a Technische Universität München, Garching, Germany
bUniversität Wien, Wien, Austria
c Christian-Albrechts-Universität zu Kiel, Kiel, Germany
dHeidelberger Akademie der Wissenschaften, Heidelberg, Germany
E-mail address of main author: [email protected]
Hydrogenetic deep-sea ferromanganese crusts reflect the changes of chemical composition of sea water on geological time scales. They grow extremely slowly with only a few mm/Myr and cover time spans up to 60Myr. Therefore, they are an important archive for the reconstruction of paleo-oceanographic, paleogeographic, paleoclimatic, and even "paleoastronomic" [1] events.
Usually, ferromanganese crusts are dated radiometrically. The assumption of a known input of a radionuclide and the measurement of its decrease with depth allows a determination of the crust's growth rate and hence gives an age-to-depth relation. For time spans beyond about 1 Myr the cosmogenic nuclide 10Be (T1/2 = (1.51+0.06) Myr) allows dating up to ~ 10Myr [2].
However, the production rate of 10Be depends the magnitude of solar and geomagnetic fields, which reflect the cosmic rays. Cosmic ray fluxes and thus 10Be production rates in the past are not exactly known.
In this study the feasibility of dating with 53Mn (T1/2 = (3.7 + 0.2) Myr) is being investigated, which is advantageous and/or complementary to 10Be for different reasons:
i) 53Mn has more than twice the half- life of 10Be, thus dating of longer time-spans should be possible.
ii) 53Mn is not significantly produced in the atmosphere (due to the lack of targets heavier than argon) but only in extraterrestrial dust particles. Therefore, its input is not influenced by geomagnetic field fluctuations. However, a constant flux of extraterrestrial matter has to be assumed.
We have measured several crusts originating from the pacific ocean. Near-continent crusts will be compared with fare-continent crusts. The results will be shown and compared with the 10Be measurements.
[1] KNIE, K., et al., Phys. Rev. Lett. 83 (1999) 18. [2] SEGEL, M., et al., Nature 309 (1984) 540.
296

EXTENDED SYNOPSIS IAEA-CN-118/162
TOPIC: RADIOECOLOGY
1
Recent Trends in Marine Radioecology
P. J. Kershaw, K. S. Leonard, J. N. Aldridge, G. J. Hunt
The Centre for Environment, Fisheries & Aquaculture Science (CEFAS), Pakefield Road, Lowestoft, U. K.
E-mail address of main author: [email protected]
This paper attempts to review some recent trends in the field of marine radioecology. It is focused on the NW European continental shelf and NE Atlantic and is not intended to be comprehensive but rather consider some specific issues which it is hoped will have wider interest and application. Marine radioecology in the past decade, in a European context, has been undertaken against a background of largely declining trends: direct discharges from nuclear facilities have continued to be reduced overall (OSPAR undertaking); the marine impact of Chernobyl has lessoned; inputs of natural radionuclides from the phosphate industry, and other sources, have decreased significantly; and, in general concentrations of artificial radionuclides in environmental samples have decreased. There have been exceptions: some direct discharges have increased (e.g. 99Tc and 129I from reprocessing wastes); some existing sources (e.g. oil and gas) or potential sources (e.g. accidental releases, dumped waste in the Kara Sea) have received more attention.
Changes in waste treatment at La Hague led to a very significant increase in 129I releases in the 1990s. This isotope has been promoted as an ocean tracer, particularly in combination with Accelerator Mass Spectrometry (AMS), providing low detection limits and high resolution. 129I has been used to estimate transport rates in the Norwegian Coastal Current and in an elegant submarine-based study in the Arctic Ocean which showed an increase in the inflow of Atlantic Water. Releases of 129I increased at Sellafield during the same period. In addition, there was a very significant increase in 99Tc discharges in the mid-1990s. This too has been used as an ocean tracer, with some indication of variability in transport rates, across the shelf, linked to indicators of climate variability.
Observed concentrations of most artificial radionuclides in foodstuffs and indicator species have declined in the past decade, but at a lower rate than the reduction in the discharges. This illustrates the importance of past discharges which remain bioavailable. Concentrations of 241Am have increased in some cases due to grow-in from 241Pu. Concentrations of tritium (3H) in marine species in the Severn Estuary (UK), associated with radio-pharmaceuticals manufacture, were higher than predicted. Over 90% was organic-bound with greater potential to transfer through the marine food chain from small organisms and to accumulate in fish. 99Tc is readily absorbed by brown seaweeds and other biota. Regular sampling of Fucus sp. has provided an excellent marker of the transport of the 99Tc ‘pulse’ across the NW European shelf. There is evidence that uptake by Fucus is affected by seasonal factors. In SW Sweden the relative bioavailability of 137Cs and 99Tc in Fucus illustrates the balance between the incoming Atlantic and outflowing Baltic Sea water. Predictably, higher environmental concentrations have led to higher critical group doses. The best-known example is lobster (Homarus gammarus), leading to socio-economic pressure to reduce the discharges. As a
297

P. Kershaw et al.
2
result of a new waste treatment process 99Tc discharges are expected to decrease substantially by 2006.
In the Irish Sea the seabed and intertidal sediments, heavily contaminated in the past, provide a continuing source of 137Cs and plutonium. Mixing processes have tended to dilute the radionuclide signal in the more mobile sediments, and made it harder to carry out an environmental inventory. However, in some sheltered environments, concentrations of 241Am of > 10 kBq kg-1 have been preserved. Plutonium mobility in estuarine pore-waters has been linked to the seasonal cycling of Fe and Mn. At the extreme inland limits of saltwater penetration high levels of organic complexation have been observed in organic-rich soils. In offshore sediments, a recent study has indicated a much larger proportion of plutonium is in a readily-exchangeable form than had previously been thought. The study paid great attention to sampling protocols and the careful application of selective extraction techniques. The findings have implications for estimating the bioava ilability of the seabed source. The investigation of transuranics behaviour has also benefited from the application of AMS.
Computer models of radionuclide behaviour have tended to increase in sophistication, and a whole range is now available – from simple box models using equilibrium conditions to full 3D transport models incorporating 2 stage adsorption kinetics. Some have included a more elaborate representation of the seabed. What is interesting is that models using quite different approaches may produce similar outputs, illustrating the difficulty of using a single approach to establishing a causal link and reinforcing the mantra that ‘all models are wrong but some are useful’. Model simulations have allowed the relative contribution to dose from recent and ‘historic’ discharges to be distinguished. 99Tc has been use to help validate a coupled ocean-ice model of the NE Atlantic and Arctic Oceans.
With a few exceptions, the justification for large-scale marine monitoring and associated research, on radiological grounds, has been harder to maintain in recent years. This has been matched with a decrease in the funding available for national and European programmes. This is unfortunate as it means researchers are less able to adequately address the legacy of past practices and the considerable uncertainties which remain in our understanding of the behaviour of radionuclides in the environment. It also ignores the contribution radioecology can make in describing how ecosystems function and means we are less able to participate in the ‘ecosystem approach’, being adopted by governments and regional conventions. However, against this rather subdued background there have been some significant advances, with an increasing effort to understand the mechanisms and kinetics of radionuclide transfer and behaviour.
298

EXTENDED SYNOPSIS IAEA-CN-118/163
TOPIC: RADIONUCLIDES IN SEDIMENT
1
The Extreme Rhone River Flood of December 2003 (South East France) – Consequences on the Translocation of Artificial Radioactive Contaminants onto the Flooded Areas
F. Eyrolle, C. Duffa, B. Rolland, C. Antonelli
IRSN/DEI/SESURE/LERCM, BP3, 13115 St Paul Lez Durance, France
E-mail address of main author: [email protected]
In recent years, great progress has been made in reducing the direct emission of artificial radioactivity and other contaminants into the environment from industrial sources. However the transport and fate of previously-released pollutants is still of great concern. In particular, it is now recognized that certain natural sinks, such as soils and deposits of sediment in streams, rivers and oceans, can entrain the contaminants for long periods of time, only to serve as sources of contamination at some later date. Such a phenomenon was first observed in the Irish Sea after sharp decreases in releases from the spent fuel reprocessing plant in Sellafield [1, 2, 3]. In rivers, one of the primary mechanisms for the remobilization of contaminated deposits is thought to be major flood events [4, 5]. As a result of climate change, floods have become more abundant and more destructive in many regions of the globe including Europe [6]. Then substantial changes in risk of translocation of sediments and associated contaminants onto flooded areas is expected.
At the beginning of December 2003 an exceptional meteo climatic event led to an extreme Rhône River flood that flooded almost 500 km2 of the low Rhône valley. Flooding waters entrained a large amount of sediments that have deposited on agricultural soils and urban areas. Therefore particle reactive contaminants such as radionuclides may have been partly translocated from the River onto a large terrestrial area through remobilisation of contaminated fluvial sediments [7]. The soils of the low Rhône valley are labelled with 2000 Bq m-2 for 137Cs, 50 Bq m-2 for 239+240Pu and 1.5 Bq m-2 for 238Pu as mean values [8]. Based on our previous studies [9] we estimate than radioactive inputs onto flooded areas might reach about 500 Bq m-2 for 137Cs. Nevertheless, a great spatial heterogeneity is expected depending on both the mass and nature of the sedimentary deposits. Several field cruises were performed until February 2004 to estimate the spatial spreading of sedimentary deposits. The deposit thinness were measured at almost 140 reference points within 3 main flooded areas whom one includes the Arles city. 87 samples were collected and are analysed for their sedimentary nature and organic matter content. About fifty percent of these samples are analysed regarding artificial radionuclides (gamma-emitters), organic contaminants and trace metals. Finally, a map of additional contamination of flooded areas during December 2003 is expected together with an evaluation of the consequences of such extreme flood events.
299

F. Eyrolle et al.
2
[1] VIVES I BATTLE, J., Speciation and bioavailability of plutonium and americium in the Irish Sea and other marine ecosystems. PhD thesis. National University of Ireland, (1993) 347 pp.
[2] COOK, G.T., MACKENZIE, A.B., MCDONALD, P., JONES, S.R., Remobilisation of Sellafield derived radionuclides and transport from the north-east Irish Sea, J. Environ. Radioact. 5 (1997) 227-241.
[3] REMOTRANS EU PROJECT, Processes regulating remobilisation, bioavailability and translocation of radionuclides in marine sediments, EU Fifth Framework Programme, November 2000-October 2003, FP5-EURATOM.
[4] SMITH, P.P.G., 30 years of fluvial sediment studies within the Plynlimon experimental catchments, Wales, UK, 9th International symposium on the interaction between sediments and water, IASWS, 5-10 May 2002, Banff Springs, Canada (2002).
[5] EYROLLE, F., DUFFA, C., CHARMASSON, S., Inputs of plutonium isotopes from the Rhône River to the Gulf of Lion (North Western Mediterranean Sea) over the 1945-1998 period – mass balances, fluxes and predictive trend (Proc. Int. Conf. Radioactivity in the Environment, 1-5 September 2002, Monaco) (2002) 577-581.
[6] STARDEX EU PROGRAM, Statistical and Regional Dynamic Downscaling of Extreme for European Regions.
[7] EYROLLE, F., CHARMASSON, S., LOUVAT, D., Plutonium isotopes in the lower reaches of the River Rhone over the period 1945-2000 : Fluxes towards the Mediterranean Sea and sedimentary inventories, J. Environ. Radioact. SI 74 (2004)127-138.
[8] DUFFA, C., RENAUD, PH., CALMET, D., Activités de 238Pu et 239+240Pu dans les sols cultivés de la basse vallée du Rhône, Comptes-rendus de l'Académie des Sciences, Sciences de la Terre et des Planètes 4 (2001) Fascicule a.
[9] ROLLAND, B., EYROLLE, F., BOURLÈS, D., Removal of sedimentary stocks and associated radioactivity in the lower Rhone River : preliminary results, 26-30 April 2004, EGU Nice, (2004) France.
300

EXTENDED SYNOPSIS IAEA-CN-118/164
TOPIC: RADIONUCLIDES IN SEDIMENT
1
Removal of Sedimentary Stocks and Associated Radioactivity in the Lower Rhône River (South Eastern France)
B. Rollanda, F. Eyrollea, D. Bourlèsb
a Institute for Radioprotection and Nuclear Safety (DEI/SESURE/LERCM), 13115 St Paul Lez Durance, France
bCEREGE, Europôle Méditerranéen de l'Arbois - BP 80 - 13545 Aix-en-Provence cedex 04, France
E-mail address of main author: [email protected]
The Rhône River drained for the last 40 years different sources of radioactive contamination (industrial releases, the Chernobyl accident, global fallouts due to the atmospheric nuclear tests).Since the drastic decrease of the industrial liquid releases of the Marcoule nuclear plant in the 1990s, artificial radioactivity from the global fallouts accumulated on the river catchments as well as artificial radioactivity from Marcoule releases accumulated in sediment storage may represent a non-negligible source term of radioactive contamination of the Rhône River waters, especially during flood events [1].
In order to quantify the fluxes and the origin of radioactivity during floods, a suspended matter monitoring was set up on the Rhône River and its tributaries downstream all the rhodanian nuclear plants (in Arles). The artificial radionuclide 137Cs and the natural radionuclides from atmospherically origin 7Be (T1/2=54 days) and 210Pbxs (T1/2=20.4 years) were used as tracers for the particulate matter.
The monitoring results underlined the significance of floods in the transfer of suspended material and associated radioactivity towards the Mediterranean Sea. The 2 exceptional flood events of the autumn 2002 exported about 90% of the annual flux of suspended particulate material. At the same time, while 31±10 GBq of 137Cs were carried by the Rhône River out of flood events (flow rate lower than 2500 m3.s-1), 115±10 GBq were exported during these 2 floods.
These results showed then a significant decrease of the particulate activity of 7Be and 210Pbxs during the autumn 2002 floods as the flow-rate increases. This may be explained by the strong supply of material from the watershed soil leaching and/or by the removal of aged sediment storage, which dilute the 7Be and 210Pbxs activities.
Furthermore, for flow-rates lower than 2500 m3.s-1, the particulate activity of 137Cs measured in Arles is very variable and ranges from 10 to 65 Bq.kg-1. This may be explained by the variability of the liquid releases of the Marcoule Nuclear plant. However, for flow-rates upper than 2500 m3.s-1 and increasing to 10000 m3.s-1, the particulate activity of 137Cs ranges from 10 to 20 Bq.kg-1 and is more or less constant. This range of activity is similar to the 137Cs activities measured out of flood event downstream the Marcoule nuclear plant. This would show that the particulate material removed during floods originates mainly from the
301

B. Rolland et al.
2
watershed soil leaching. The contribution of potential sediment storage with associated radioactivity originating from Marcoule would be then negligible.
Further investigations including the use of the plutonium isotopes ratios (238Pu/239,2340Pu and 240Pu/239Pu ratios) will allow us to determine more accurately the contribution and the origin of the removed radioactivity during flood events. Moreover, due to their similar chemical behaviour, the 7Be/210Pbxs ratio should correct for grain size and compositional variability of the particulate matter [2, 3]. The use of the 7Be/210Pbxs ratio as tracer of the particulate matter will have to be discussed. [1] EYROLLE, F., et al., Plutonium isotopes in the lower reaches of the River Rhône over
the period 1945-2000: fluxes towards the Mediterranean Sea and sedimentary inventories, J. Environ. Radioact. (2004).
[2] BONNIWELL, E.C., et al., Determining the times and distances of particle transit in a mountain stream using fallout radionuclides, Geomorph. 27 (1999) 75-92
[3] CAILLET, S., et al., Factors controlling 7Be and 210Pb atmospheric deposition as revealed by sampling individual rain events in the region of Geneva, Switzerland, J. Environ. Radioact. 53 (2001) 241-256
302

EXTENDED SYNOPSIS IAEA-CN-118/165
TOPIC: RADIONUCLIDES IN SEDIMENT
1
On Radioactivity of Lake Sevan Bottom Sediments
A. Nalbandyana, V. Ananyana, W. Burnettb, J. Cablec
a Center for Ecological-Noosphere Studies of the National Academy of Sciences (CENS NAS RA), Yerevan, Armenia
bFlorida State University (FSU), Tallahassee, Florida, USA
c Louisiana State University (LSU), Baton Rouge, Louisiana, USA
E-mail address of main author: [email protected]
The major environmental issue in Armenia is Lake Sevan – one of the world’s largest freshwater highland lakes. The lake’s catchment basin comprises one-sixth of the country’s total area (29,800 km2), constituting the primary water resource of the country, and giving it strategic importance, both geographically and politically. Present-day Lake Sevan comprises the Big Sevan (1032 km2 area) and the Small Sevan (384 km2 area) .
Since 2002 the Laboratory of Radioecology of CENS and the Departments of Oceanography at the Florida State and Louisiana State Universities (USA) have been involved in a cooperative CRDF/NFSAT project “Paleoecology and paleo-radioecology of Lake Sevan, Armenia”. The project task is to investigate the Sevan bottom sediments radioactivity and to better understand the regional land-use and ecological changes as they are recorded in the lake sedimentary record.
Sediment gravity cores were collected from the R/V Hetazotogh on two cruises from total 7 sampling stations in September 2002 (the Small Sevan, stations 1,2,3) and August 2003 (the Big Sevan, stations 5,6,7,8). All cores were sectioned onboard ship immediately after collection and samples were stored until returned to the CENS laboratory the next day for processing. Bottom sediments were dried at 700C until a stable dry weight was achieved, subsequently homogenized and split for analyses. 226Ra, 137Cs, 40K, 234Th, 210Pb concentrations were determined through γ-spectroscopic analysis applying a well- type HpGe detector; 210Pb dating of sediments was performed in environmental radioactivity laboratories at FSU and LSU [1]. Chemical analyses (determining specific weight, drying loss, humus, opaline Si, CaCO3, organic-C) and some radiometric analyses (determining gross β-radioactivity, 40K, 226Ra, 137Cs concentrations through a low-background γ-spectrometer with a NaI detector) were performed at the CENS.
The most important part of this project is determining each level ages in the cores. The 210Pb trend is the main data used to date each layer of the cores. 226Ra data are used to determine the excess 210Pb, which is essential to the dating. Also, data from 137Cs is useful as a marker for each layer to validate the ages derived from 210Pb. 137Cs is a product of the nuclear weapons testing and reached an atmospheric maximum around 1962. The method of 210Pb dating is used to date recent deposits, calculate sedimentation rates, and evaluate environmental changes induced by eutrophication, erosion-siltation, acid deposition, and other human disturbances of the Sevan basin.
303

A. Nalbandyan et al.
2
After all the samples were analyzed, all the activities were plotted against the depth in the core to illustrate the trend of each isotope in each core. For example, the 210Pb profiles in 3 cores (Fig. 1) show the same basic trend: on the surface level, the activities are relatively high, then they decrease due to decay as the depth becomes greater until they reach a background level.
Station 1 Station 2 Station 3
FIG. 1. 210Pb and 226Ra concentration in Small Sevan bottom sediments (FSU, LSU, 2002).
As shown in Fig. 1, 210Pb is mainly concentrated in upper sediment layers (0-30 cm); deeper, its content significantly decreases. This is consistent with 210Pb fallout mainly with atmospheric precipitation. Deeper, its contents approaches equilibrium with 226Ra. Excess 210Pb originates from atmospheric decay of 222Rn - a gaseous decay product of 226Ra, and is deposited on the earth's surface during atmospheric washout. 226Ra, a member of 238U decay series, is deposited in lake sediments as one fraction of erosional inputs. As seen, beginning from some 30 cm 210Pb concentration is changing in parallel to that of 226Ra. 137Cs accumulates in the upper sediment layer (0-50 cm); occasionally showing a double-maximum probably related to global fallout (1962-63) and the Chernobyl accident. The ages of each level in the cores were calculated via CRS and CIC models [2].
The samples collected in August 2003 are being currently analyzed and the data will have been obtained by the end of 2004.
[1] CABLE, J.E., BURNETT, W.C., MORELAND, S., WESTMORELAND, J., Empirical assessment of gamma ray self-absorption in environmental sample analysis, Radioact. Radiochem. N 12 (2001) 30-41.
[2] APPLEBY, P.G., OLDFIELD, F., Application of Lead-210 to Sedimentation Studies (IVANOVICH, M., HARMON, R.S., Eds), Uranium-Series Disequilibrium: Applications to Earth, Marine, and Environmental Problems, Second Edition, Charendon Press, Oxford, UK; Chapter 14 (1992) 487-512.
304

EXTENDED SYNOPSIS IAEA-CN-118/166
TOPIC: RADIONUCLIDES IN SEDIMENT
1
Latitudinal Distribution and Sedimentation of 90Sr, 137Cs, 241Am and 239,240Pu in Bottom Sediment of the Northwest Pacific Ocean
S-H. Leea, P. P. Povineca, E. Wysea, G-H. Hongb, C-S. Chung b, S-H. Kimb, H-J. Leeb
a Marine Environment Laboratory, Interna tional Atomic Energy Agency, Monaco
bIsotope Oceanography Laboratory, Korea Ocean Research and Development Institute, Ansan, Seoul 425-600, Republic of Korea
E-mail address of main author: [email protected]
As a part of the Worldwide Marine Radioactivity Studies (WOMARS) of the International Atomic Energy Agency's Marine Environment Laboratory (IAEA-MEL) in Monaco, bottom sediment samples were collected along with water column samples in 1997 from the Northwest Pacific Ocean, and were analysed for 90Sr, 137Cs, 239,240Pu and 241Am contents in order to identify current distribution patterns and inventories, and to elucidate sources of these radionuclides in the region where the past US nuclear weapons tests were carried out. This study complements a previous reports on bottom sediments [1] and water column [2]. All the reported sediment data including data from 1997 cruise revealed that sedimentary 239+240Pu and 241Am concentrations peaked both in the latitudinal bands between 10-20oN and 30-40oN, and 137Cs and 90Sr in the latitudinal band between 30-40oN (Fig. 1). The latitudinal bands between 10-20oN and 30-40oN correspond to the major areas affected by close-in fallout and global fallout, respectively. Sediment inventories of 239+240Pu and 241Am exceeded or nearly equalled their overlying water inventories near the Bikini Atoll, however, in mid latitudes, more than 70% of 239+240Pu still remains in the water column. Sediment inventories of 137Cs and 90Sr account for about ten and less than five percent of the water column inventories, respectively. 241Am inventories in sediments exceeded those of the water column. The activity ratios of 137Cs/90Sr and 241Am/239,240Pu in sediments were higher than of the global fallout ratios. 90Sr content in the bottom sediments also appears to be controlled by the carbonate contents of the sea floor. The relative contribution of global and close-in fallouts to the total 239,240Pu was estimated using a two end-member mixing model based on the atom ratios of 240Pu/239Pu. The contribution of close- in fallout in sediment appears to be about 56 % for the latitudinal belt 10-20oN. It is not unexpected that close- in fallout Pu dominates in the bottom sediments near Bikini Atoll. 241Am and 241Pu age determination of the sediment slices was utilized to provide time constraint on a hiatus in the sediment accumulation in the Northwest Pacific Ocean.
305

S.-H. Lee et al.
2
Water depth (m)
0 2000 4000 6000 8000 10000
239,
240 Pu
(Bq
kg-1)
02468
101214
Latitude ( oN)
0 1 0 20 30 40 5 0 60
239,
240 Pu
(Bq
kg-1)
02468
101214
Water depth (m)
0 1000 2000 3000 4000 5000 6000 7000
137 C
s (B
q kg
-1)
0
5
10
15
20
25
30
Latitude ( oN)
0 1 0 20 30 40 5 0 60
137 C
s (B
q kg
-1)
0
5
10
15
20
25
30
Water depth (m)
0 2000 4000 6000 8000 10000
241 A
m (B
q kg
-1)
0
2
4
6
8
10
12
Latitude ( oN)
0 1 0 20 30 40 5 0 60
241 A
m (B
q kg
-1)
0
2
4
6
8
10
12
Water depth (m)
0 1000 2000 3000 4000 5000 6000 7000
90Sr
(Bq
kg-1)
012345678
Latitude (oN)
0 10 20 30 40 50
90Sr
(Bq
kg-1
)
012345678
FIG. 1. Latitudinal distribution of anthropogenic radionuclides in the bottom sediment of the Northwest Pacific Ocean.
[1] MOON, D.-S., HONG, G.-H., KIM, Y-I., BASKARAN, M., CHUNG, C-S., KIM, S-H., LEE, H.-J., LEE, S-H., POVINEC, P.P, Accumulation of artificial and natural radionuclides in the bottom sediments of the Northwest Pacific Ocean, Deep-Sea Res. II 50 17-21 (2003) 2649-2673.
[2] POVINEC, P.P, et al., IAEA'97 expedition to the NW Pacific Ocean-results of oceanographic and radionuclide investigations of the water column, Deep-Sea Res. II 50 17-21 (2003) 2609-2637.
306

EXTENDED SYNOPSIS IAEA-CN-118/167
TOPIC: RADIONUCLIDES IN SEDIMENTS
1
The Use of 137Cs, 239,240Pu and 210Pb as Tracers in Characterization of Modern Sediment Accumulation in the Baltic Sea
J. Mattilaa, H. Kankaanpääb, E. Ilus a
a STUK - Radiation and Nuclear Safety Authority, Helsinki, Finland
bFinnish Institute of Marine Research (FIMR), Helsinki, Finland
E-mail address of main author: [email protected]
In this study results from more than 90 sediment cores from various parts of the Baltic Sea were combined and used in evaluation of characteristics of modern sediment accumulation and sediment accumulation rates (SAR). Radionuclide profiles (137Cs, 239,240Pu, 210Pb) provide information about both radionuclide deposition history and accumulation of modern sediments [1]. The use of these tracers enable the estimation of SAR in cases where the prerequisites of estimation methods are fulfilled.
The results showed clearly the dynamic nature of bottoms of the Baltic Sea [2]. At several sampling locations studied there were indications of lateral sediment transport at and variable accumulation rates. There seemed to be a large variation in recent sediment accumulation even in the Gotland Deep, one of the deepest and largest areas of net sedimentation in the Baltic Sea. Utilising of radionuclide profiles made it possible to compare small scale variations around the sampling positions, to compare suitability of stations for monitoring purposes and evaluate the effects of different sediment coring techniques on stratigraphy.
Large ranges occurred in the SAR-values between stations representing various sea areas of the Baltic Sea (TAB. 1). Effective accumulation basins were found in many areas, such as in the northern Bothnian Sea, in the southern Bothnian Bay and in the eastern part of the Gulf of Finland. High SAR values were affected by the protected locations, estuarine type environments and effective sources of accumulated material.
Results exhibited strong correlation between the SAR and both the total amounts of 137Cs and the estimated excess 210Pb fluxes. This can be explained by high Kd factors of these two metals in the brackish water environment. The highest concentrations of 137Cs were found at stations representing the highest deposition and a thick annually accumulating layer.
The radionuclide profiles are a valuable tool in evaluation of sediment accumulation types, quality of stations for monitoring purposes and internal variations within basins of recent sedimentation. In estimation of SAR, fulfilment of the prerequisites of dating methods should be carefully considered. In an environment such as the Baltic Sea sediment, recent sediment age determination should always be based on the use of more than one method.
307

J. Mattila et al.
2
TABLE I. MEDIAN AND AVERAGE VALUES OF SAR (IN PARENTHESIS), MEDIAN VALUES OF THICKNESS OF ANNUALLY ACCUMULATING LAYERS (SURFACE AND DEEPER LAYERS) OF THE SEDIMENT, TOTAL AMOUNTS OF 137CS (CS TOT) AND SPEARMAN RANK CORRELATION COEFFICIENTS (RS) BETWEEN SAR AND TOTAL AMOUNTS OF 137CS. THE TOTAL AMOUNTS OF 137CS AT EACH STATION WERE TIME CORRECTED TO THE YEAR 2000
SAR
[g m-2 a-1]
surface
[mm a-1]
deeper
[mm a-1]
Cs tot
[Bq m-2]
rest
Stations of Bothnian Bay 310 (490) 2,2 0,8 7900 0,50
Stations of Bothnian Sea 1200 (2430) 6,9 3,9 31600 0,76
Stations of the Baltic Proper 170 (370) 2,5 0,7 2000 0,61
Stations of the Gulf of Finland 460 (740) 4,5 1,9 9700 0,72
[1] ILUS, E., UPLINKS, M., MATTILA, J., Radionuclides in sediments, (Proc. Baltic
Marine Environment Protection Commission "Radioactivity in the Baltic Sea 1992-1998) 85 (2003) 55-75.
[2] IGNATIUS, H., AXBERG, S., NIEMISTÖ, L., WINTERHALTER, B., Quaternary geology of the Baltic Sea, (VOIPIO, A., Ed.) The Baltic Sea, Elsevier Science (1981) 54-104.
308

EXTENDED SYNOPSIS IAEA-CN-118/168
TOPIC: RADIONUCLIDES IN SEDIMENTS
1
A Model of Recent Sedimentation on the Cananeia-Iguape Estuary
R. T. Saitoa, R. C. L. Figueirab, M. G. Tesslerc, I. I. L. Cunhaa
a Radiochemistry Division, IPEN, CNEN, SP, Brazil
bCruzeiro do Sul University (UNICSUL), SP, Brazil
c Instituto Oceanográfico USP, SP, Brazil
E-mail address of main author: [email protected]
Coastal systems, in particular the estuary, is the first depositional environment to receive sediments transported from rivers to the oceans. As a consequence of the geochemical process, part of the sediment can be deposited in the estuary and the remaining sediment may flow into the ocean, being transported and deposited under influence of tides and maritime currents. Distributions of 210Pb and 137Cs in the cores may provide precise data for calculating sedimentation rates in coastal environment [1, 2].
This work was carried out at Cananeia – Iguape estuary and at continental shelf of the southern coast of São Paulo State, Brazil and presents the levels of 210Pb and 137Cs in marine sediments, the sedimentation rates obtained by using these radionuclides as well the heavy metals concentrations (lead, zinc, copper) . The purpose of this study was to elucidate the sedimentation process in the Cananeia – Iguape estuary and to elaborate a sedimentation model.
Comprida Island, a barrier island, separates the Cananeia-Iguape (25ºS - 48ºW) from the ocean and is approximately 70 kilometres long. From the transgressive Holocene maximum, when the coastal line retirement to its present level, a long barrier island was formed (Comprida Island), towards NE, by the action of seaside moving currents, causing the formation of the Cananeia-Iguape estuary, at the back of the present coastal line. In the NE of this coastal system is located the mouth of the Ribeira de Iguape river. This river communicates with Cananeia-Iguape estuary only through an artificial canal (Valo Grande), built over 150 years ago.
Today, about 60% of the Ribeira de Iguape river discharge flows in the internal canals of the Cananeia-Iguape estuary, causing an increasing silting up of the canals by the muddy sediments in suspension carried by the drainage of the Ribeira de Iguape. Thus, the continental material transfers to the maritime system in the southern seashore of Sao Paulo State, not only in the mouth of the Ribeira de Iguape river but also in the river mouths of the Cananeia-Iguape estuary.
The continental shelf, in the studied area, presents a width ranging from 73 to 231 km, inclination between 1:656 and 1:1333 with a depth of transition between the platform and the continental slope located between 120 and 180 meters depth.
Cores were collected by the Oceanographic Institute from the University of São Paulo, Brazil, at three stations of the continental shelf and at three stations of the estuary, that show
309

R. Saito et al.
2
different sediment inflows to the coastal system. Sand, mud, organic matter and humidity contents were analysed in each core. The cores were sliced into 2 cm thick layers, dried and homogenized, and transferred to plastic containers appropriate for gamma counting [3].
210Pb levels on the estuary varied from 122.5 to 14.3 Bq kg-1. In the continental shelf the values varied from 195.5 to 23.6 Bq kg-1. 210Pb levels are much higher in the upper layers of the core and decreased with the depth.137Cs levels obtained on the Cananeia-Iguape estuary ranged from 0.28 to 6.1 Bq kg-1 and at continental shelf the values from 0.62 to 2.29 Bq.kg-1. The presence of 137Cs in the Brazilian sediments is due to world-wide fallout.
The sedimentation rates obtained by 210Pb dating, in the sediment columns along the Cananeia-Iguape estuary ranged from 0.53 cm y-1 to 0.98 cm.y-1. The relative errors between the sedimentation rates for the cores analysed through the two radionuclides ranged from 2 to 9%, showing a good agreement among the values. At the continental shelf, the sedimentation rates varied from 0.18 to 0.4 cm y-1.
The heavy metals were analysed by atomic absorption spectrometry. The concentrations obtained for copper varied from 2 to 166 µg g-1, for zinc from 3 to 44 µg g-1 and for lead ranged from 8 to 133 µg g-1. Lead, represents one of the most abundant elements and intensely mined in the region near the mouth of the Ribeira de Iguape river. These high levels obtained indicate the beginning of the influence, more accentuated, of the continental drainage on the coastal system, allowing, still, to estimate the thickness of the package of sediments deposited in the last 160 years, as well as to understand the space distribution of the continental sediments that flow to the system through the Valo Grande Canal.
Based on the results obtained a model of the recent sedimentary dynamic of the Cananeia-Iguape region was elaborated.
[1] KIRCHENER, G., EHLERS, H.J., Sediment Geochronology in changing coastal environments, Coast. Res. 14 (1988) 483-492.
[2] SOMAYAJULU, B.L.K., et al., Sediment deposition rates on the continental margins of the eastern Arabia Sea using Pb-210, Cs-137 and C-14, Sci. Tot. Environ. 237 (1999) 429-439.
[3] SAITO, R.T., et al., Pb-210 and Po-210 levels in sediments, water and bioindicators in the Cananeia-Iguape estuary – São Paulo-Brazil, Czech. J. Phys., 53 (2003) A75-A81.
310

EXTENDED SYNOPSIS IAEA-CN-118/169
TOPIC: CONTAMINANTS IN SEDIMENTS
1
Natural Gamma Radionuclides in Sediments of Gulf of Mexico: An Approach to Radio-Tracers Transport and Distribution of Sediments in Marine Environments
P. F. Rodríguez-Espinosaa, V. M. V. Vidal L.b, F. V. Vidal L.b
a Centro de Investigación en Ciencia Aplicada y Tecnología Avanzada Unidad Altamira, Km 14.5 Carretera Tampico-Puerto de Altamira, Tamaulipas C.P. 89600 Mexico
bGrupo de Estudios Oceanográficos, Centro de Investigación en Ciencia Aplicada y Tecnología Avanzada, Instituto Politécnico Naciona l, Apdo. Postal 5-84, Cuernavaca, Morelos, C.P. 62051, México
E-mail address of main author: [email protected]
The following paper contains information of 23 cores collected nuclides in the Gulf of Mexico from 70 to 2,100 meters of depth. The cores were collected in Mexican Gulf of Mexico on OGMEX Oceanographic Campaigns between 1993 and 1995 (see Fig. 1).
FIG. 1. Sediment samples collected in the Gulf of Mexico.
Radiometric determinations were measured by the Silena gamma-spectrometer from 50 to 60,000 s at the Environmental Laboratory in Cienfuegos, Cuba. A database of 920 natural radio-nuclides from chains of 232Th and 238U [1], was obtained from 180 samples [2-4].
The most significant result was the geographic distribution of gamma radionuclides measured concentrations is regionally distinct. Finding a low 238U gamma radio-nuclides concentration at low depth zones and high concentration in depth waters. While the already mentioned conditions are inverted for the 232Th gamma radionuclides. As it is the case of 214Pb and 212 Pb (see Figs 2 and 3).
The discussion of results as here presented allows to assume a geographic distribution of natural gamma radionuclides under sedimentary material supplying conditions [5] by the
311

P. Rodriguez-Espinoza et al.
2
hydrological basins which drain to the Gulf of Mexico and the marine currents transport those materials through the inside of the Gulf of Mexico [6, 7].
FIGS. 2 and 3. Gamma radionuclides. As it is the case of 214Pb and 212 Pb.
Associated results are shown to the rest of Gamma Radionuclides Natural that belong to the 238U and 232Th chains in order to permit corroborating associations in different proportions of these radionuclides in geological material of hydrological basins associated to the western slope in the Gulf of Mexico.
In conclusion the work as here presented allows the understanding and elucidation of the origin, transport and, deposition of sedimentary material by means of natural radionuclides tracers using low gamma spectrometry.
[1] EISENBUD, M., Environmental radioactivity from natural, industrial and military sources, Academic Press Inc. NY. (1987) 475 pp.
[2] PAPUCCI, C., DELFANTI, R., Gamma spectrometry energy and efficient calibration, Notes of the International Training Course on Strategies and Methodologies for the applied marine radioactivity studies in Santa Teresa, Italy and Monaco, October 11–16, (1990) 6 pp.
[3] INTERNATIONAL ATOMIC ENERGY AGENCY, Reference Methods for Marine Radioactivity Studies 11, Technical Reports Series No. 169, IAEA, Vienna, (1975) p. 239.
[4] INTERNATIONAL ATOMIC ENERGY AGENCY, Measurement of Radionuclides in Food and The Environment, A Guidebook, Technical Reports Series No. 295, IAEA, Vienna, Austria (1989) 169 pp.
[5] RODRIGUEZ-ESPINOSA, P.F., VIDAL-LORANDI, F.V., VIDAL-LORANDI, V.M., Regionalization of natural and artificial radio-nuclides in sediments of the Mexican Gulf of Mexico environmental chains and radioactivity tracers conference – 6th South Pacific Environmental Radioactivity Association Conference Guidebook of Abstracts, June 19-23, 2000, Noumea, IRD Centre, New Caledonia, (2002) 66-67.
[6] RODRIGUEZ-ESPINOSA, P.F., VIDAL-LORANDI, F.V., VIDAL-LORANDI, V.M., Sources of environmental radioactivity in sediments of South of Gulf of Mexico, OIEA Proceedings (in press).
[7] VIDAL, V.M.V., VIDAL, F.V., MEZA-CONDE, E., ZAMBRANO-SALGADO, L., JAIMES DE LA CRUZ, B., Ring-slope interactions and formation of the western boundary current in the Gulf of Mexico, J. Geophys. Res. 104 C9 20 (1999) 523-20, 550.
312

EXTENDED SYNOPSIS IAEA-CN-118/170
TOPIC: CONTAMINANTS IN SEDIMENTS
1
Historical Trend in Heavy Metal Pollution in the Sediments of Cienfuegos Bay (Cuba), defined by 210Pb and 137Cs Geochronology
C. Alonso Hernandeza, S. Perez Santanaa, C. Brunorib, R. Morabitoc, R. Delfantid, C. Papuccid
a Centro de Estudios Ambientales de Cienfuegos, Cienfuegos, Cuba
bENEA-C.R.E. Casaccia, PROT-CHIM, Roma, Italy
c ENEA-C.R.E. Casaccia, PROT, Roma, Italy
dENEA- Marine Environment Research Centre, La Spezia, Italy
E-mail address of main author: [email protected]
The Bay of Cienfuegos, in the southern central part of Cuba, is an enclosed bay with a surface area of 90 km2 and an average depth of 14 m. It is connected to the Caribbean Sea by a narrow channel 3 km long. The bay is divided in two well defined hydrographic basins, due to the presence of a submerged ridge 1 m below the surface. The Northern basin receives most of the anthropic impact from the sewage outlet of the city, from the industrial area and from the outfall of Damuji and Salado rivers. The Southern basin is subject to a smaller degree of anthropic pollution, originating from the Caonao and Arimao rivers. Part of the Southern basin is a natural park. The Bay represents the most important natural resource in the Cienfuegos province, and the surrounding land has been intensively exploited, but in the last three decades some deleterious ecological signals have been observed in the area: loss of biodiversity, shift in benthic communities, reduction in size and capture levels of commercial marine species, erosion of the coastline [1].
The objective of this study is to investigate the concentration level of heavy metals in the sediments of the Bay, reconstructing their “depositional history” by using radionuclide geochronology [2], in order to highlight the major changes occurred in the last century and to draw hypotheses on their origin.
In 1999 and 2000, sampling campaigns have been carried out to collect sediment cores (about 1 m long), for investigating the depositional history, and surface sediment for evaluation of the spatial distribution of heavy metals. The samples have been analysed using high-resolution gamma spectrometry for natural and anthropogenic radionuclides, and Inductively Coupled Plasma - Mass Spectrometry (ICP-MS) for heavy metals.
The vertical profiles of 137Cs and 210Pbex show that in the last 40 years significant changes have affected sedimentation processes in the bay. Up to 1963, sediment were regularly accumulated, both in the northern and southern basins, at a rate of 0.2 g cm-2 y-1. After this date, the radionuclide vertical profiles significantly changed their characteristics. The changes are strongly correlated in the two basins and closely timed. In recent years, the sediment accumulation rate has considerably increased, particularly in the North, where it has doubled. Extreme meteorological events (hurricane Camille in 1969 and intense rain in June 1988) produced a deposition of thick sediment layers having uniform 210Pbex concentration.
313

C. Alonso Hernandez et al.
2
The concentration level of heavy metals in sediments shows an increasing trend in recent years [3], particularly starting from the seventies, as probable consequence of growing industrialization in the area. In particular, a) vanadium and nickel concentration levels increased in both cores, almost doubling in the Southern ones, probably related to the opening of the thermoelectric power plant, b) in the northern core a significant increase in arsenic concentrations -almost one order of magnitude- in late ’70-early ’80, marks the management of a fertilizer industry; c) c) in the same years copper and zinc increased significantly in the Southern core probably as a result of heavy agricultural use of chemicals (Fig. 1).
The re-distribution processes of heavy metals in the sediments are correlated both to preferential pathways in wet & dry atmospheric deposition (for vanadium, nickel and lead) and, for the elements directly discharged into the Bay, to the sedimentation regime in the area. Actually, the important changes in the “use” of the surrounding territory -mainly development of intensive agriculture and deforestation- in late fifties resulted in significant increase of the suspended load in the rivers (ex. Damuji and Salado), and thus greatly influenced the sedimentation regime in the Bay.
[1] ACADEMIA DE CIENCIAS DE CUBA, Bahia de Cienfuegos y litoral adyacente, 1988-1990, Resumen de investigaciones, Rep. Academia de ciencias de Cuba (1990) 450 pp.
[2] APPLEBY, P.G., "Application of 210Pb to sedimentation studies" Uranium-series disequilibrium (IVANOVICH, HARMON, Eds.), Claredon Press, Oxford, 731-778.
[3] ALONSO HERNANDEZ, C., DIAZ ASENCIO, M., MUNOZ CARAVACA, A., DELFANTI, R., PAPUCCI, C., BRUNORI, C., UBALDI, C., CREMISINI, C., MORABITO, M., Valutazione della distribuzione di microinquinanti organici e di elementi in traccia in carote di sedimento della baia di cienfuegos (CUBA), (XVI Congresso Nazionale di Chimica Analitica, Portonovo (Ancona)) 24-28 Settembre 2001.
FIG. 1.
a) Sediment cores location b) Cd, As and Pb in sediment, Northern core c) Cd, As and Pb in sediment, Southern core
d) 137Cs and 210Pbex vertical profiles, Northern core
e) 137Cs and 210Pbex vertical profiles, Southern core
314

EXTENDED SYNOPSIS IAEA-CN-118/171
TOPIC: CONTAMINANTS IN SEDIMENTS
1
Western Tasmania - A Reconstructed History of Wide-Spread Aerial Pollution in a Formerly "Pristine" Area - the Use of 210Pb & 226Ra in Retrospective Monitoring of the Environment
H. Heijnisa, K. J. Harleb, J. Harrisona
ANSTO – Environment, Sydney, NSW, Australia
CSIRO Sustainable Ecosystems, Canberra, ACT, Australia
E-mail address of main author: [email protected]
Using nuclear dating techniques and trace metal analysis of sediment cores an environmental history of Western Tasmania was reconstructed. Seven sites were selected to encompass a range of environments from highly human impacted to relatively pristine. They include sub-alpine tarns and coastal lowland lakes. Disturbed areas have been impacted by activities associated with logging, mining and colonial settlement while the near-pristine sites were located in areas with little disturbance, such as the Tasmanian Wilderness World Heritage Area.
Lead-210 (210Pb) and radium-226 (226Ra), both naturally occurring radioisotopes, were used to determine sediment accumulation rates and establish chronologies. Sediment cores collected from near pristine lakes were expected to reveal low and relatively constant trace metal concentrations consistent with areas subject to little to no human impact. However, evidence from these sediment cores revealed trace metal concentrations peaked in the 1960s and then began to decrease in the 1980s. This trend was also discovered, to a greater extent, in sediment cores collected from human impacted sites particularly those surrounding the Central Western mining area. Of all the metals investigated, lead (Pb), arsenic (As), tin (Sn) and copper (Cu) were found to show the most marked increases.
Temporal increases in metal concentrations were found to be a result of mining activities in Central Western Tasmania. Evidence for the most significant increase as shown by the trace metal profile coincided with the escalation of open cut mining while decreases in metal concentrations around 1980 coincided with the cessation of mining. Spatially, the dispersal was predominantly due to aerial pollution as concentrations of Pb, As, Sn and Cu were highest close to the mining areas although sites as far as 150 kilometres away showed marked metal concentration increases above background levels around 1960.
315

EXTENDED SYNOPSIS IAEA-CN-118/172
TOPIC : CONTAMINANTS IN SEDIMENTS
Application of Neutron Activatable Tracers (NATs) for Cohesive Sediment Transport Studies in Contaminated Estuaries
S. Hollins a, R. Szymczaka, P. Aireya, W. L. Peirsonb, T. Paynea
a ANSTO Environment, PMB 1, Menai NSW 2234, Australia
bWater Research Laboratory, University of NSW, Manly Vale NSW 2093, Australia
E-mail address of main author: [email protected]
ANSTO and the University of NSW Water Research Laboratory (WRL) are investigating the migration of contaminants associated with cohesive sediments in Homebush Bay, Sydney. The study area is a highly urbanised and industrialised catchment with a long history of contamination [1]. Until 1890, when an ocean outfall was commissioned, domestic and industrial waste was discharged directly into Sydney Harbour [2]. Heavy metals and other hydrophobic pollutants have a distinct tendency towards solid phase partitioning. This means that the majority of heavy metals in the estuary are linked to particulates rather than occurring in the dissolved phase. Hence, in order to assess the impacts of the pollution and develop a scientific basis for remediation it is necessary to understand processes that resuspend and disperse the contaminated sediments.
The study approach involved the evaluation of the numerical model of the processes using activatable tracer techniques [3]. An ideal tracer binds to the material of interest with high integrity and is detected with high sensitivity and selectivity. Tracers can be used to study sediment transport over extended periods and are therefore ideally suited to observing the impact of extreme weather events on sediment mobilisation by monitoring the distribution of the label before and after the event. The tracer must not only adhere to the cohesive sediment with high integrity but must be detectable with high efficiency, high sensitivity and relatively low cost. Identification of the optimum activatable tracer involved an assessment of the nuclear (Table I) and sorption properties.
TABLE I. GAMMA RAY INTENSITIES EXPRESSED AS A PERCENTAGE OF THE MAXIMUM VALUE OBSERVED FOLLOWING THE NAA ACTIVATION/COOLING CYCLE [3]
Activation time / Cooling time (seconds)
Target Element Product Nuclide 60/ 300
60/ 1200
300/ 300
300/ 1200
3600/ 82900
Samarium Sm-155 1.1 Rhenium Re-188m 1.2 5.6 Iridium Ir-194 1.1
Gold Au-198 5.9 Europium Eu-152m1 2.7 2.7 13.6 13.4 28.5
Manganese Mn-56 1.6 1.5 7.7 7.3 Niobium Nb-94m 1.1 4.5
Indium In-116m1 20.5 16.9 100 82.6 Vanadium V-52 9.6 34.5 2.2
316

S. Hollins et al.
2
The implementation of the tracer study involved (a) labelling sediment from the study area with indium-115 in the laboratory and equilibrating for 3 weeks; (b) choosing a site where bathymetric surveys indicated significant recent accretion; (c) injection of the labelled sediment into an accurately located site in Homebush Bay (Fig. 1); (d) undertaking three surveys over the subsequent months; (e) analysis of samples via irradiation in the Fast Access Neutron facility in ANSTO’s research reactor, HIFAR and gamma counting on a High Purity Germanium detector3; and (f) data processing, where the tracer concentrations were contoured using the Surfer© routine and interpreted in terms of advective and dispersive transport using a Gaussian approximation (Fig. 2). Information on vertical transport was obtained by coring.
FIG. 1. (A) Distribution of labelled sediment on 7 Nov 2002 following injection on 22 May 2002; and (B) tracer profile along the transect, [3].
These results are being used to evaluate a three-dimensional finite element model of the study area [4]. Estimates have been made of the aerial dispersion coefficients, of the surficial mixing due to bioturbation and of advective transport. This paper will focus on the optimum choice of the tracer for cohesive sediment transport studies and some early results.
[1] BIRCH, G.F., TAYLOR, S., Source of Heavy Metal Sediments of the Port Jackson, Australia, Sci. Tot. Environ. 227 (1999) 123-138.
[2] BIRCH, G.F., EYRE, B., TAYLOR, S.E., The distribution of nutrients in bottom sediments of Port Jackson (Sydney Harbour), Australia, Mar. Poll. Bull. 38 (1999) 1247-1251.
[3] HOLLINS, S., AIREY, P., SZYMCZAK, R., PAYNE, T., Optimising Activatable Tracers for Cohesive Sediment Transport Studies in Contaminated Estuaries. (Proceedings of the 14th Pacific Basin Nuclear Conference (Mar 2004), Honolulu, Hawaii (in press).
[4] SYDNEY PORTS CORPORATION - Coastal Section, Homebush Bay Hydrodynamics and Sediment Transport: preliminary model studies, Report No 96/01 (1996).
317

EXTENDED SYNOPSIS IAEA-CN-118/173
TOPIC: CONTAMINANTS IN SEDIMENTS
1
Sediment Geochemical Properties and Dinoflagellate Cyst Distribution in Manila Bay, Philippines
F. P. Siringana, R. V. Azanzab, J. P. Duyanena, E. Z. Sombritoc, N. Macalalada, P. Zamoraa, A. Yñiguezd, E. Sta. Mariac, A. D. M. Bulosc
a National Institute of Geological Sciences, UP Diliman, Q.C. 1101 Philippines
bThe Marine Science Institute, UP Diliman, Q.C. 1101 Philippines
c Philippine Nuclear Research Institute, Commonwealth Ave., Q.C. 1101 Philippines
dNational Center for Caribbean Coral Reef Research, Rosenstiel School of Marine and Atmospheric Science (RSMAS) University of Miami, 4600 Rickenbacker Causeway, Key Biscayne, FL 33149, USA
E-mail address of main author: [email protected]
One of the theories used to explain the initiation of harmful algal blooms (HAB's) is the release and germination of microalgal cysts from the sediments. Assessment of the sediment's geochemical properties and its correlation with past HAB occurrences could serve as a clue on the conditions favorable for the occurrence of HAB's. HAB's of Pyrodinium bahamense var. compressum seasonally occurred in Manila Bay, Philippines from 1988 to 1998. To help understand and manage this phenomenon, sediment cores were dated using Lead-210 and analyzed for cysts, grain size, total carbonate and organic matter, elemental concentrations and metals.
Lead-210 profiles indicated sedimentation rates of 1.2 to 2.5 cm/year while earlier periods ranged from 0.4 to 0.6 cm/yr. Such high sedimentation rates can dilute cyst counts which was apparent in this study. Shift in sedimentation rate could be attributed to the eruption of Mt. Pinatubo in 1991 which may have caused the burial of Pyrodinium cysts and subsequent non-occurrence of its blooms since 1998. Dating also showed the presence of Pyrodinium in the early 1950s and ensuing increase until 1988.
Autotrophic dinoflagellate cysts identified were: Lingulodinium polyedra, Gonyaulax spp., Pyrophacus steinii, Protoceratium reticulatum and Pyrodinium bahamense var. compressum while heterotrophs consisted of Protoperidinium and Diplopsalis species.
Cyst density fluctuated but showed overall increase through time. The increase was most significantly observed before 1991 which coincided with the Bay's first bloom in 1988. The fluctuations which implied cyclicity was found to be controlled by the overall abundance of heterotrophs. Autotrophs, however showed significant increase in abundance in younger sediments which could account for HAB's from 1988 to 1998.
Mud predominates in all of the cores which comprise of: clay (20% to 70%), silt (20% to 90%) and sand (0.6 to 3%). Major element profiles show an increase in Si/Al ratio and decrease of organic matter and total carbonates through time which is attributed to biogenic
318

F. Siringan et al.
2
processes and increased primary productivity of diatoms. Diatoms are primary prey of Protoperidinium species which were found to be highly abundant in the cores studied.
The geochemical scenarios on metal distribution and sourcing in space and time persisted, at least, during the last 10 years of the bay which show the well-defined distribution of potentially mobile metal loads in the bay’s sediment system. This pattern may be salient to the correlation of the lateral distribution of the cysts and the metals in the sediments of the bay and the identification of sources of metals.
319

EXTENDED SYNOPSIS IAEA-CN-118/174
TOPIC: CONTAMINANTS IN SEDIMENTS
1
Pollutant Lead Deposition in the Gulf of Lions over the Last Century Reconstructed from Sedimentary Records
J. Miralles, A. Véron, O. Radakovitch, P. Deschamps
CEREGE-Université Aix-Marseille III, Aix-en-Provence, France
E-mail address of main author: [email protected]
Investigation of the transient evolution of pollutant lead deposition to the Mediterranean are limited by the lack of continuous records. Indeed, most studies are restricted to limited periods (a few days to a few months) that do not allow a precise monitoring of the marine response to anthropogenic input [1-4].
We have collected 6 cores sediment cores as part of the MATER ECC program in the Gulf of Lions (NW Mediterranean) to reconstruct high resolution pollutant lead deposition over the past century. We coupled pollutant Pb inventories along with isotopic tracers (excess 210Pb and stable lead isotopes).
The mean anthropogenic lead inventory is equal to 101±17 µg/cm2, in good agreement first with lead inventories already calculated in this area [5, 6], and with the atmospheric fallout over the nearby continental area (as estimated from saltmarsh cores in Camargue [7]. Transient pollutant Pb deposition (Fig. 1) evidences significant patterns with an increase from 1900 to mid-70’s that is consistent with anthropogenic regional emissions [8]. The recent anthropogenic decrease in Pb input is also in agreement with trends in anthropogenic emissions. This decrease in sedimentary inventories is of the same order of magnitude than the atmospheric decrease evidenced by direct measurements , i.e. 31±12% in sediments and 30% in the atmosphere at the Cap Ferrat for the period 1986-1992 [9].
Marine margin sediments appear here as relevant proxies to reconstruct past environmental contaminations over the past century owing to the use of several efficient tracers.
320

J. Miralles et al.
2
1900 1920 1940 1960 1980 20000
10
20
30
40
50
year
anth
ropo
geni
c P
b (µ
g/cm
2)
FIG. 1. Anthropogenic lead accumulation (µg/cm2) over the last 100 years. In full line are the anthropogenic emissions in this area [8].
[1] ELBAZ-POULICHET, F., Apports fluviatiles et estuariens de plomb, cadmium et cuivre aux oceans: comparaison avec l’apport atmosphérique, Ph.D (1988), Université Paris VI, PARIS, 288 pp.
[2] REMOUDAKI, E., BERGAMETTI, G., BUAT-MENARD, P., Temporal variability of atmospheric lead concentrations and fluxes over the Northwestern Mediterranean sea, J. Geophys. Res. 26 D1 (1991) 1043-1055.
[3] NICOLAS, E., Evolution of Cd, Pb, Zn concentrations in the Ligurian sea since 1983, Ann. Inst. Oceanog. 69 1 (1993) 119-122
[4] NICOLAS, E., RUIZ-PINO, D., BUAT-MENARD, P., BETHOUX, P., Abrupt decrease of lead concentration in the Mediterranean sea : a response to antipollution policy, Geophys. Res. Let. 21 19(1994) 2119-2122.
[5] ARIN, B., Répartition et fractionnement géochimique des elements traces dans les sediments marins. Application à la marge continentale du Golfe du Lion (Méditerranée nord-ouest, France), Ph. D (1998), Université de Perpignan, Perpignan, 394 pp
[6] ERRAND, J-L., HAMELIN, B., MONACO, A., Isotopic tracing of anthropogenic Pb inventories and sedimentary fluxes in the Gulf of Lions (NW Mediterranean Sea), Continent. Shelf Res. 19 (1999) 23-47
[7] MIRALLES, J., RADAKOVITCH, O., COCHRAN, J. K., VÉRON, A., MASQUÉ, P., Multitracer study of anthropogenic contamination records in the Camargue, Southern France, Sci. Tot. Env. 320 (2004) 63-72
[8] FERRAND, J-L, Étude isotopique du cyle du géochimique du plomb anthropique et naturel en milieux marin et côtier, Ph. D (1996), Université Aix-Marseille III, AIX-MARSEILLE, 215 pp
[9] MIGON, C., ALLEMAN, L., LEBLOND, N., NICOLAS, E., Evolution of atmospheric lead over the northwestern Mediterranean between 1988 and 1992, Atm. Env. 27A, 14 (1993) 2161-2167
321

EXTENDED SYNOPSIS IAEA-CN-118/175
TOPIC: CONTAMINANTS IN SEDIMENTS
1
The Origin and Transport of Pollutant Lead (Pb) to the Svalbard Area of the Arctic
T. Shimmield, G. Shimmield, T. Sawyer, L. Vare
Scottish Association for Marine Science, Dunstaffnage Marine Laboratory, Oban, Argyll, Scotland, PA37 1QA, U.K.
E-mail address of main author: [email protected]
Monitoring of pollutants in the biota of the Arctic is a high priority activity of the circumpolar Arctic nations. Considerable, research has been directed at understanding the influence of pollutants on the Arctic ecosystem.
The majority of research in the Svalbard area of the Arctic has concentrated on the levels of persistent organic pollutants (POPs) such as PCBs in the biota of the area. More recently the role of heavy metal pollutants such as mercury (Hg), cadmium (Cd) and lead (Pb) in the arctic ecosystem has been highlighted.
A possible major sink/source for contaminants are sediments however very little research has been undertaken in the sediments of the Svalbard area. To fully understand the system and allow preventative or remedial steps to be taken, it is necessary to determine the magnitude of pollutant inputs and the major transport pathways. By investigating sediment cores from lakes, fjordic and shelf environments surrounding the Svalbard area it will be possible to understand these processes and assess their importance in modelling the fate of contaminants within the Arctic environment.
By utilising stable Pb isotopes (206Pb, 207Pb and 208Pb) it is possible to identify the source from which it came. For example, in the UK, Pb from petrol has a 206Pb/207Pb ratio of 1.092, industrial sources have a ratio of around 1.18, and natural sources vary but are typically around 1.20. Therefore by measuring the isotopic ratio of the Pb contained in the Svalbard sediments it is possible to determine what the predominant sources of pollutant Pb are.
Sediment cores from a north-south transect (Vøring Plateau to the Yermak Plateau) and from an east-west transect (Kongsfjorden to Fram Strait) have been analysed for trace element and heavy metal concentrations and stable Pb isotope ratios. To determine the relative importance of atmospheric transport versus marine transport sediment lake cores have been analysed and compared with the cores from Kongsfjorden and the shelf area.
Both inventories of Pb and profiles of Pb isotopes from a latitudinal transect (Vøring Plateau to the Yermak Plateau) and a longitudinal transect (Kongsfjorden to Fram Strait) and an Arctic lake will be presented.
By utilising the stable Pb isotopic signature, the source and the amount of anthropogenic Pb being delivered to the area have been realised.
From the results of this study the authors will demonstrate that the predominant source of anthropogenic Pb in Svalbard region is of European origin and extends to higher latitude than
322

T. Shimmield et al.
2
the Canadian Arctic. They also conclude that the marine sediment cores demonstrate the influence of north Atlantic circulation on the transport of Pb to the Arctic and that the highest concentrations of anthropogenic Pb are found in continental margin sediments adjacent to the Barents shelf. Finally they demonstrate that the fjordic sediments appear to have low concentrations of anthropogenic Pb which maybe due to dilution by high accumulation rates.
323

EXTENDED SYNOPSIS IAEA-CN-118/176
TOPIC: DATA MANAGEMENT
1
IAEA Reference Materials for Radionuclides in the Marine Environment
M. K Pham, J. Gastaud, J. La Rosa, S.-H. Lee, I. Levy-Palomo, B. Oregioni,P. P. Povinec
International Atomic Energy Agency, Marine Environment Laboratory, 4 Quai Antoine 1er, MC 98000 Monaco
E-mail address of main author: [email protected]
The accurate and precise determinations of radionuclide concentrations in marine samples are important aspects of marine radioactivity assessments and the use of radionuclides in studies of oceanographic processes. To address the problem of data quality, and to assist Member States in verifying the performance of their laboratories, the IAEA Marine Environment Laboratory (MEL) in Monaco has conducted intercomparison exercises on radionuclides in marine samples for many years as part of its contribution to the IAEA's programme of Analytical Quality Control Services (AQCS). The results of the recent intercomparison exercise on an Irish Sea sediment (IAEA-385), designed for the determination of anthropogenic and natural radionuclides in marine sediment, are reported. The data received from ninety seven laboratories have been evaluated. The following represent two examples of the data evaluation for 137Cs and 239+240Pu with their Z-scores (Figs 1a & b and Figs 2a & b, respectively). Eighty-five laboratories reported 137Cs results (Fig. 1a). The laboratories mainly used direct gamma spectrometry for 137Cs analysis. Twelve results were identified as outliers. The other data are homogenous within two standard deviations of the distribution mean. Z-score values are below 2.2, showing good performance of the laboratories (Fig. 1b). The median, given as the recommended value, is 33.2 Bq kg-1 dw (95% confidence interval is (32.4 – 34.2) Bq kg-1).
137Cs (IAEA-385)
Laborator ies
9 9 79 876 52 35 02 52 589 90 813 28 17 82 913 42 14 3 4 05 69 36 831 151 75 5 6 4 55 918 597 04 35 5 1 2 759 72 622 24 48 27 770 64 267 67 75 16 938 24 441 68 43 44 77 175 2 7 5 23 63 55 263 123 76 66 74 14 986 83 863 88 33 0 8 58 5 464 89 49 12 19 211 118 08 57 33 3
Bq
kg-1
15
20
25
30
35
40
45
50
55
60
65
70
Analyt ical dataMax.Conf.Int. (34.2 Bq/kg)Mean value (33.5 Bq/kg)Min.Conf.Int. (32.4 Bq/kg)
FIG. 1a. Data evaluation of 137Cs in IAEA-385. FIG. 1b. Z-score for 137Cs in IAEA-385.
Fifty results of 239+240Pu results were reported (Fig. 2a). Most of laboratories used the alpha-spectrometry method for measurement with a prior chemical separation. Seven results were identified as outliers. The data are homogeneous, within two standard deviations of the
137Cs
-2.50
-2.00
-1.50
-1.00
-0.50
0.00
0.50
1.00
1.50
2.00
2.50
9 65 50 89 32 29 14 56 68 17 45 59 55 59 22 77 26 51 24 84 71 7 35 12 67 86 38 8 46
Laboratories
Z-S
co
re
324

M. Pham et al.
2
distribution mean. Z-score values are below 2.0 showing good performance of the laboratories (Fig.2b). The median, given as a recommended value is 2.99 Bq kg-1 dw (95% confidence interval is (2.81 – 3.14) Bq kg-1).
239+240 Pu ( IAEA-385)
Laborator ies
2 16 5 89 1 42 8 6 06 0 78 6 82 9 29 5 36 3 6 36 0 86 9 35 4 8 66 1 64 6 9 3 7 7 9 1 6 0 8 11 9 37 3 2 06 6 67 9 32 4 91 6 66 6 2 47 0 91 8 46 0 8 07 0 60 6 93 6 4
Bq
kg-1
1.0
1.5
2.0
2.5
3.0
3.5
4.0
4.5
5.0
5.5
6.0
Analyt ica l dataMax .Con f . In t . (3 .14 Bq /kg )M e a n v a l u e ( 2 . 9 9 B q / k g )Min .Conf . In t . (2 .81 Bq/kg)
FIG. 2a. Data evaluation of 239+240Pu in IAEA-385. FIG. 2b. Z-score for 239+240Pu in IAEA-385.
Following many years of experience in the AQCS programme and the recent recognition of the great importance of marine environment data in economic, ecological and legal decision-making, the IAEA-MEL has been undertaking further steps to assist Member States in improving data quality [1-3]. As global activity concentrations of radionuclides in marine and terrestrial environments are decreasing, new challenges for the AQCS programme in the future need modern and improved technologies for radionuclide determinations, as well as new reference methods for very low –level radionuclide analyses. Future intercomparison exercises for different matrices of marine samples, which are at present under preparation are listed in Table I.
TABLE I. FUTURE INTERCOMPARISON EXERCISES FOR RADIONUCLIDES IN THE MARINE ENVIRONMENT
Code Matrice Origin
IAEA-437 Mussel Mediterranean Sea
IAEA-410 Sediment Bikini Atoll
IAEA-412 Sediment Pacific Ocean
IAEA-415 Fish flesh North Sea
[1] ISO GUIDE 35, Certification of reference materials – General and statistical principles, [revision of the second edition (ISO Guide 35 1989) (2003) 61 pp.
[2] POVINEC, P.P., PHAM, M.K., IAEA reference materials for quality assurance of marine radioactivity measurements, J. Radioanal. Nucl. Chem. 248 1 (2001) 211-216.
[3] PHAM, M.K., POVINEC, P.P., Matériaux de référence de l’AIEA pour les radionucléides dans le milieu marin, Bulletin de BNM, 2003-2 127 (2003) 210-214.
239+240Pu
-2.50
-2.00
-1.50
-1.00
-0.50
0.00
0.50
1.00
1.50
2.00
2.50
14 60 78 29 53 63 8 6 54 61 6 7 1 8 93A 1
2 0 6 7 2 4 66 2 4 9 1 6 0
Laboratories
Z-S
co
re
325

EXTENDED SYNOPSIS IAEA-CN-118/177
TOPIC: DATA MANAGEMENT
1
Evaluating Laboratory's Performance in Drinking Water Samples
M. L. Romeroa, R. Salasb
a Departamento de Impacto Ambiental de la Energia, CIEMAT, Avda. Complutense 22, 28040 Madrid, Spain
bConsejo de Seguridad Nuclear (CSN), Justo Dorado 11, 28040 Madrid, Spain
E-mail address of main author: [email protected]
The radiological protection of the environment and the population requires from all states to have laboratories with internationally comparable quality levels. To meet these requirements laboratories must establish quality assurance programs to ensure that can produce data of the required quality. Laboratories can provide objective evidence of their performance through participation in external quality assessment exercises.
The management of the radiological environmental monitoring programs (REM) in Spain is responsibility of the CSN (Nuclear Safety Council), and their performance is carried out with the collaboration of laboratories in autonomic regions (Fig. 1) which provide the radioanalytical results in compliance with general criteria established by the CSN.
The reliability of the assessment obtained from these programs requires that laboratories producing the analytical data be able to demonstrate the accuracy and comparability of their results, as well as their traceability to International Standards. To this end the CSN organises in collaboration with CIEMAT periodical inter- laboratory test comparisons, using samples similar in composition and activity levels to the ones routinely analysed in the programs.
Following the issue of the European Community Drinking Water Directive [1] concerning the quality of water for human consumption and its implementation by the Spanish Government [2], the last inter-comparison exercise was organised by using a water sample, in an attempt to evaluate the performance of the laboratories analysing the required radioactivity parameters (H-3, alpha and beta activity). The sample (a synthetic drinking water), was prepared at the National Laboratory for Ionising Radiation’s Standards (CIEMAT), and contained the following radionuclides H-3, Pu-(239+240), Am-241, Sr-90, Cs-137 and K-40, results from gross Alpha, gross Beta and Residual Beta activity were also requested to participants.
The organisation and the assessment of the laboratory’s performance were achieved according to the recommendations of the ISO-43 guide [3] and the ISO/IUPAC/AOAC international protocol [4]. A total of thirty-nine laboratories participated in the exercise and the evaluation of the laboratories performance is presented and discussed in this paper.
326

M. L. Romero and R. Salas
2
FIG. 1.
[1] COUNCIL DIRECTIVE 98/83/EC on the Quality of Water Intended for Human Consumption.
[2] REAL DECRETO 140/2003 por el que se establecen los criterios sanitarios de la calidad del agua de consumo humano.
[3] INTERNATIONAL ORGANIZATION FOR STANDARDIZATION (ISO) ISO/IEC 43-1, 2 ISO, Geneva, Switzerland (1997).
[4] THOMPSON, M., WOOD, R., The international harmonized protocol for the proficiency testing of (chemical) analytical laboratories, Pure Appl. Chem. 65 9 (1993) 2123-2144.
327

EXTENDED SYNOPSIS IAEA-CN-118/178
TOPIC: DATA MANAGEMENT
1
NUSIMEP: An External QC Programme for Measuring Nuclear Isotopes in Environmental Samples
R. Wellum, A. Stolarz, L. Benedik, C. Quétel, W. De Bolle, T. Altzizoglou, A. Moens, A. Alonso, H. Kühn, F. Kehoe, A. Verbruggen
Institute for Reference Materials and Measurements, EC-JRC, Retieseweg 111, B-2440 Geel, Belgium
E-mail address of main author: [email protected]
The NUSIMEP (Nuclear Signatures Inter-laboratory Measurement Evaluation Programme) external QC campaigns follow the pattern of the successful REIMEP and IMEP programmes in which certified materials in selected matrices are offered for measurement to participating laboratories. NUSIMEP is directed at the measurement of isotopic ratios in low amounts of nuclear materials in typical environmental matrices. NUSIMEP 2 -uranium isotopics in dried samples- was completed in 2001 [1] and NUSIMEP 3, uranium isotopics in a saline matrix, in 2002 [2]. The main points of the NUSIMEP programme are that the nuclear materials are certified by IRMM, the names of the laboratories are not disclosed and that each participating laboratory is sent the certified values on receipt of their measured values. The reports published at the end of each campaign demonstrate the present ‘state of the art’ for the measurements requested. From the experience gained with these campaigns the next ones are now being organised.
In NUSIMEP 4, planned to take place in 2004, participants are requested to measure uranium isotopic abundances at concentrations of around 5 ng/g (5 ppb) in a simulated complex environmental/biological matrix consisting of a saline solution with added urea. The normal uptake of uranium from food, drinks and inhalation, depending on the environmental conditions, is between 0.9 - 1.5 µg per day. A large part of this uptake is filtered by the kidneys and excreted in the urine. The normal level of uranium in the urine is in the range of several pg/g, depending on dietary intake, with isotopic abundances close to those of natural uranium. Contamination of the environment either by enriched or depleted uranium (in the case of depleted uranium from shells and other munitions) will be reflected in changed isotopic ratios of the uranium measured in the urine.
In NUSIMEP 4, the uranium will be slightly enriched or depleted in 235U and the ratios of the isotopes 234U, 235U and 236U relative to 238U are certified. The uranium is prepared by mixing uranium, certified for isotopic content, in the form of UF6 and the isotopic ratio
n(235U)/n(238U) is certified by gas-source mass-spectrometry and the ratios n(234U)/n(238U) and n(236U)/n(238U) by thermal ionisation mass-spectrometry, TIMS. The participating laboratories will be asked to measure all three isotopic ratios by whatever methods they consider adequate for such samples. By supplying samples with higher levels of uranium than are normally found, laboratories can expect to be able to measure the minor isotopes as well as the enrichment of 235U.
328

R. Wellum et al.
2
In NUSIMEP 5, which is now being planned and is expected to start later in 2004, uranium, sub-Bq levels of Pu and 134Cs and 137Cs in a 1% saline solution are requested to be measured. The matrix was chosen to provide some difficulty for the measurements: a chemical separation will normally be needed for the measurements of uranium and plutonium. The uranium concentration is again planned to be at the 5 ng/g (5 ppb) level as this has found to be a good compromise between sample preparation, i.e. avoiding cross-contamination from outside sources of uranium, and providing a test for the measurement capability of the laboratories. The enrichments of these materials, as in NUSIMEP 4, range from slightly depleted to slightly enriched (ca. 2%).
NUSIMEP 5 was designed to present similar analytical problems for the measurements of these nuclides as typical aqueous environmental samples. The opportunity was taken to add low amounts of Pu (sub-Bq) and 134Cs and 137Cs. It is understood that not all laboratories will be able to measure all these nuclides but both Pu and Cs are valuable indicators of legal or illegal nuclear activity and therefore are regularly measured in environmental samples. The chosen isotopic compositions of plutonium allow the measurement of the alpha ratio of 238Pu/(238Pu + 240Pu) although the isotopic content of the Pu will be certified by TIMS. The Cs isotopic mixture will be prepared by metrologically mixing certified solutions of the two nuclides.
The status of both campaigns will be reported. These campaigns represent an effort to demonstrate the capability of laboratories measuring nuclear materials and other radionuclides in typical environmental matrices.
[1] HELD, A. ALONSO, A., DE BOLLE, W., VERBRUGGEN, A., WELLUM, R., NUSIMEP 2 Uranium isotopic abundances, EUR 19744/EN (2001).
[2] WELLUM, R., ALONSO, A., DE BOLLE, W., HELD, A., VERBRUGGEN, A., NUSIMEP 3 an External QC Campaign for the measurement of Uranium Isotopic Ratios in Saline Solutions; Advances in Destructive and Non-destructive Analysis for Environmental Monitoring and Nuclear Forensics, ITU, Karlsruhe, Germany; 21-23 October 2002.
329

EXTENDED SYNOPSIS IAEA-CN-118/179 TOPIC: QUALITY ASSURANCE/QUALITY CONTROL
1
Quality Assurance Practices in Radiochemical Procedures of Research and Environmental Surveillance at STUK, Finland
T. K. Ikäheimonen, S. Klemola, P. Vesterbacka
STUK - Radiation and Nuclear Safety Authority, Helsinki, Finland
E-mail address of main author: [email protected]
Since 1999, the Department of Research and Environmental Surveillance of Radiation and Nuclear Safety Authority (STUK) in Finland has been an accredited testing laboratory. The accreditation was renewed in 2003 according the EN ISO/IEC 17025 standard [1]. Accredited fields of testing consist tests of radiation safety and related environmental sampling, gamma spectrometric analyses, radiochemical analyses of tritium, radioactive strontium and transuranic elements in environmental, foodstuff and biological samples, as well as natural radionuclides in water, indoor radon, direct measurement of people and chromosome analysis. In this paper, quality assurance on radiochemical and gamma spectrometric laboratories is discussed.
The quality system of STUK is based on ISO standard 9001. The development of a uniform and modern quality system for the whole STUK started in 1997, the regulation was ready in 1999, and was updated in 2003 [2]. On the top of STUK quality hierarchy is the quality policy of overall objectives, the second level is the quality manual of the whole STUK followed by the quality manuals of each department. On the base level of the hierarchy there are the laboratory manuals and guides. The standards mentioned above act as guidelines for all work on laboratory level. The principle of continuous improvement is widely applied by performing annual self-assessments and internal and external audits.
A quality assurance (QA) programme includes several steps. One of the most important steps is the proficiency of personnel. Good initiation, non-stop training during work and also knowledge of physical and chemical phenomena in analytical procedures are the requirements for first-rate and motivated working. In the QA programme of STUK, these issues are documented, including responsibilities and commitments of each organisational level and employee. The principles and the philosophy of these topics are discussed.
Since the environmental levels of radioactivity are very low, it creates special demands for analyses and measurements in the laboratory. Most methods used at STUK are non-standard methods, requiring that the validation, quality assurance and stability checking procedures, including standards and equipment used, are extremely important. Accommodations and environmental conditions of laboratories must be paid special attention, especially in order to prevent contamination when treating environmental materials of various levels of radioactivity. Nowadays, a lot of concern has also been put on standardisation of uncertainty estimations. This demands good knowledge of sources of errors in sample preparation, analysis and measurement [3]. The relative importance of various uncertainty components of different analysing methods will be discussed.
330

T. Ikäheimonen et al.
2
Participating in intercomparison exercises and proficiency tests is one way to demonstrate the usability and quality of the methods used. In this paper, examples are given on how STUK has succeeded in these exercises. However, lack of intercomparison exercises and reference material on certain natural radionuclides, such as Rn-222, Po-210 and Pb-210, occurring in waters and certain artificial radionuclides, such as C-14, Tc-99 and Pu-241, complicates the validation and proving the proficiency in these measurements.
The best available nuclear data, i.e. the most recent and critically evaluated, should be utilised throughout the laboratory by each employee and software program. All data updates should be documented.
The equipment confidence is maintained by routine performance checks and control charts. In some analysing methods there are inherent, method-specific ‘performance meters’. Examples of these will be given in the paper.
[1] EUROPEAN STANDARD EN ISO/IEC 17025, General requirements for the competence of testing and calibration laboratories (ISI/IEC 17025:1999) (2000).
[2] INTERNATIONAL ORGANISATION FOR STANDARDS, ISO 9001, Quality management systems - Requirements (2000).
[3] ELLISON, S., ROSSLEIN, M., WILLIAMS, A., Eurachem/Citac Guide CG4, Quantifying Uncertainty in Analytical Measurement, Second edition (2000).
331

EXTENDED SYNOPSIS IAEA-CN-118/180
TOPIC: QUALITY ASSURANCE/QUALITY CONTROL
1
Accreditation in University Environmental Radioactivity Laboratories
M. Llauradóa, C. Navarrob, I. Vallésc
a Laboratori de Radiologia Ambiental (LRA-UB), Departament de Química Analítica, Universitat de Barcelona, Barcelona, Spain
bUnitat de Garantia de Qualitat (UGQ-UB), Serveis Científico Tècnics, Universitat de Barcelona, Barcelona, Spain
c Laboratori d'Anàlisis de Radiaoctivitat (LARA-UPC), Institut de Tècniques Energétiques, Universitat Politècnica de Catalunya, Barcelona, Spain
E-mail address of main author: [email protected]
The experimental work performed in university laboratories comes from many different fields and it is assumed to be of high quality. In general, the results are published in national or international journals or presented at conferences. Only a few laboratories have a clear understanding of the importance of implementing Quality Assurance Systems and the accreditation of their activities according to the international standards, such as ISO 17025. Today, few universities include this issue in the ir programmes. Most laboratories associate quality assurance with the fact that referees before publication have revised their works.
Here the authors describe their experience in two university laboratories involved in environmental radioactivity control. Both laboratories have implanted a Quality Assurance System based on ISO 17025, the standard used for accreditation of the technical competence of laboratories. One of them (LARA-UPC) belongs to a research institute and the other (LRA-UB) belongs to a university department with different logistic organisation. Both laboratories provide services to public and private institutions along side their teaching and research activities.
The Quality Assurance Unit (UGQ-UB) is responsible for activities related to technical support in implementation and assessment in quality systems. In the case of these laboratories this UGQ performs internal audits.
Accreditation is particularly important in environmental radioactivity analysis, where objective evidence of the quality of the data is required. Moreover, the results of radioactivity analysis are important: e.g. quality of water for human consumption (Directive 98/83/CE), environmental surveys (PVRA, Art. 35 of the Euratom Treaty for EU members), imports of agricultural products (Directive 99/1661/EC), export certificate required for agricultural products (2001/1621/EC), measurements in support of health and safety. It is important to assure the accuracy and precision of the results to guarantee that decisions are based on reliable data.
On the basis of accreditation, laboratories can demonstrate their capabilities to customers and give assurance that their analyses will be carried out according to internationally accepted standards.
332

M. Llaurado et al.
2
According to our experience the accreditation system has the following advantages:
- Better organisation of laboratories.
- Increased confidence in the results
- Personnel qualified and trained for their specific tasks and permanent monitoring of their performance.
- Definition of performance criteria.
- Permanent monitoring for procedures that need changing.
- Permanent records of instrument performance, which provides a basis for planning repair and replacement needs.
- Continuous assessment of the quality of the data generated by the analyst.
- Traceability of results.
- Improvement of reliability of research results.
- Transmission of experience about laboratory quality assurance to students.
- Availability as reference laboratory in low-level radioactivity tests.
The accreditation system suffers from the following limitations:
- High cost for university laboratories and poor recognition by the scientific community. For university laboratories accreditation is not a competitive factor, but is rather seen as a commercial strategy.
- It is not an added value for all users.
- It increases the cost of the service.
- High degree of bureaucracy and low logistic support.
- Difficulty or retaining stable and qualified personnel.
- The fact that the methods must be applied strictly sometimes hinders the research activity.
- The scope of the analysis is normally limited, and generally does not include all the analyses the laboratory offers.
- Difficulty out of carrying out research activities together with teaching and service activities using the same technical personal, facilities and equipment.
In spite of the differences between the organisational structure of the two university laboratories, the advantages and limitations of the accreditation are similar.
The implementation of Quality Systems in university laboratories produces a high benefit not only for activities related to services but also in teaching and research.
333

EXTENDED SYNOPSIS IAEA-CN-118/181
TOPIC: MASS SPECTROMETRY
1
A New 202Hg Isotopically Enriched methylmercury Spike Material with SI-traceable Reference Values for Isotope Dilution Measurements in Biological and Environmental Samples
J. P. Snell, C. R. Quétel
Institute for Reference Materials and Measurements, Joint Research Centre - European Commission, Retieseweg 111, B-2440 Geel, Belgium.
E-mail address of main author: [email protected]
HgO enriched in 202Hg was used for the preparation of a solution of 202Hg enriched CH3Hg. The CH3HgCl was synthesised by reaction with a Grignard reagent and a subsequent comproportionation reaction between dimethylmercury, (CH3)2Hg, and HgCl2, that was optimised to give a high yield of the product, pure from other Hg species and by-products of the synthesis reaction. To prepare the CH3HgCl for use as an IDMS spike, it was dissolved in 2 % ethanol. The spike was thereby maintained in a relatively reactive form without solution preservatives that might alter its chemical behaviour compared to incipient CH3Hg in a sample. Aliquots were sealed in quartz ampoules and a 1-year stability study was undertaken by storing a series of ampoules under different temperature conditions to all be measured on the same occasion (an isochronous study) and by retaining a portion of the solution in a closable bottle under recommended storage conditions, with measurements at 3-month intervals.
The Hg amount content in the form of CH3Hg was obtained by subtraction of the inorganic Hg amount content (determined by gas chromatography inductively coupled plasma mass spectrometry, GC-ICP-MS) from the total Hg amount content (determined by blending with IRMM-639, a natural Hg isotopic certified reference material, ICRM, and isotope dilution mass spectrometry of the digested material). Only CH3Hg and inorganic Hg were detectable in the reference material with inorganic Hg in <2 % of the total amount. GC-ICP-MS was also used to confirm that the isotopic composition of Hg in the form of CH3Hg was identical to that of IRMM-640, an inorganic Hg ICRM prepared from the same 202Hg enriched HgO, within enlarged uncertainty statements. These processes allowed the SI-traceable certification of both the amount content of CH3Hg and its isotopic composition, accompanied by combined uncertainty statements estimated according to ISO/GUM.
The final uncertainty on the Hg amount content in the form of CH3Hg (3.5 % relative, k=2) included a contribution covering for potential changes over 2 years of shelf- life. No degradation of the CH3Hg content or isotopic composition was statistically observable over the storage period, so this contribution was extrapolated from the uncertainty in measurement repeatability of the isochronous study.
Ampoules are now available for distribution as an ICRM, named IRMM-670, with the certified reference values listed in the table.
334

J. Snell and C. Quetel
2
Material : CH3202HgCl in 2 % ethanol/water
amount content Certified value Uncertainty 1
mol (CH3(202Hg)Cl) · g-1 171.0 · 10-9 6.1 · 10-9
mol (CH3HgCl) · g-1 175.1 · 10-9 6.2 · 10-9
isotope amount ratios of Hg in the form of CH3HgCl Certified value Uncertainty 1
n(196Hg)/n(202Hg) 0.000 018 0.000 013
n(198Hg)/n(202Hg) 0.000 623 0.000 050
n(199Hg)/n(202Hg) 0.001 603 0.000 096
n(200Hg)/n(202Hg) 0.005 50 0.000 22
n(201Hg)/n(202Hg) 0.013 35 0.000 53
n(204Hg)/n(202Hg) 0.002 60 0.000 16
molar mass of Hg in the form of CH3HgCl Certified value Uncertainty 1
g · mol-1 201.944 66 0.000 76
1) All uncertainties are expanded uncertainties, with a coverage factor, k = 2
335

EXTENDED SYNOPSIS IAEA-CN-118/182
TOPIC: THE MEDITERRANEAN
1
Input of Pollutants from Land Based Sources (LBS) into the Mediterranean Sea
F. Abousamra
MEDPOL Programme Officer, 48 Vas. Konstantinou, 11610 Athens, Greece
E-mail address of main author: [email protected]
The introduction of pollutants, nutrients, solid waste and chemicals, generally referred as Persistent Toxic Substances (PTS) is a major environmental issue of local, regional and global concern. In order to control the further introduction of these materials MEDPOL put in place, during the last three years, a national and regional data and information generation process which enabled MEDPOL and the Mediterranean Countries to have a better understanding of the situation and consequently addressing the issue of reduction of inputs in the proper and effective way. Undoubtedly, the preparation of the assessment of transboundary pollution in the Mediterranean (TDA), the National Diagnostic Analysis( NDA) and the National Baseline Budget (NBB) have permitted to acquire further reliable picture about the inputs of Land Based Sources (LBS) and their fates in the marine environment.
The objective of the presentation will be to present the main results collected through the above-mentioned activities concerning the sources and distribution of materials and the potential management options.
336

POSTER PRESENTATIONS

SAMPLE EXTENDED SYNOPSIS IAEA-CN-118/1P
TOPIC: OCEANS AND SEAS
1
GEOTRACES : An International Program to Study the Global Marine Biogeochemistry of Trace Elements and Isotopes
C. Jeandela, R. F. Andersonb, G. Hendersonc, R. Françoisd, M. Franke
a LEGOS (CNRS/CNES/IRD/UPS), Observatoire Midi-Pyrénées, 31400, Toulouse, France
bLDEO, Columbia University, Palisades, N-Y10964, USA
c Department of Earth Sciences, Oxford, OX1 3PR, UK
dWoods Hole Oceanographic Institution, Woods Hole, MA 02543, USA
e ETH, Zurich, CH-8092, Switzerland
E-mail address of main author: [email protected]
GEOTRACES is a collaborative multi-national program to investigate the global marine biogeochemical cycles of trace elements and their isotopes. It is supported by the Scientific Committee for Oceanographic Research (SCOR).
Great advances in the analytical capabilities to measure trace elements and isotopes in the ocean have been made in the quarter century since the completion of GEOSECS, but much remains to be learned about the sources, transport, chemical speciation, biological availability, internal cycling and fate of the broad spectrum of trace elements and isotopes of interest to marine biogeochemists. Advances in chemical sensors, analytical instrumentation, and modeling make possible now research that could not have been envisioned even a decade ago. With the definition of a number of high priority research questions, and the availability of analytical techniques that permit sampling at high spatial and temporal density, the community of marine biogeochemists believes that the time is right to mount a major international research program to study the global marine biogeochemical cycles of trace elements and their isotopes.
Developing a full understanding of the distribution and biogeochemical behaviour of trace elements and their isotopes (TEIs) in seawater has the potential to provide unique insights into a wide range of oceanic processes: role of micronutrients in controlling the oceanic productivity, mechanisms controlling the fate of contaminants, quantifying key processes regulating the marine carbon cycle, insight into the mean velocity field and mixing processes in the ocean on very slow timescales, and paleo-oceanographic proxies.
The primary objectives for the GEOTRACES program are:
• To determine global distributions of selected TEIs in the ocean;
• To evaluate the oceanic sources, sinks, and internal cycling of these TEIs and thereby characterize more completely their global biogeochemical cycles;
338

C. Jeandel et al.
2
• To build and maintain a core community of marine scientists who understand the chemical, physical and biological processes regulating the distribution and properties of trace elements and isotopes well enough to exploit them reliably in future interdisciplinary studies.
The establishment of a close and synergistic relationship between observations and modelling (forward and inverse) was also viewed as essential to streamline the field programs and optimise data interpretation.
We will elaborate on the goals of the program, describe the structure of the international coordination, and discuss the present status of the science and implementation plans.
339

EXTENDED SYNOPSIS IAEA-CN-118/2P
TOPIC: OCEANS AND SEAS
1
Cadmium Isotopic Composition in the Ocean
F. Lacana, R. Francoisa, M. Bothnerb, J. Cruisius b, C. Jeandelc
a Woods hole Oceanographic Institution (WHOI), Woods Hole, U.S.A.
bUnited States Geological Survey (USGS), Woods Hole, U.S.A.
c LEGOS (CNRS/CNES/IRD/UPS), Observatoire Midi-Pyrénées, 31400, Toulouse, France
E-mail address of main author: [email protected]
Recent developments in mass spectrometric techniques are allowing the systematic study of metal isotope fractionation in the environment. Cd isotopes have, as yet, received little attention, notwithstanding the well-documented involvement of Cd in biological cycling and its wide range of isotopic masses, which make it a prime candidate for fractionation.
We will present the first data in the ocean. A seawater profile from the North Pacific Ocean shows little yet probably significant variations. The later could result from water mass advection or biological processes or both. We will also present a seawater profile from the Mediterranean (Dyfamed site) and measurements in phytoplankton cultures. In addition we will present measurements carried out in a sewage treatment plant (where high bacterial degradation occurs).
If confirmed, Cd isotopic fractionation could have wide-ranging biogeochemical and paleoceanographic applications. In particular, it could lead to the development of a paleoceanographic tracer for bottom water oxygen concentration, a parameter that would provide important new constraints on the marine carbon cycle and deep ocean circulation during glacial periods.
340

EXTENDED SYNOPSIS IAEA-CN-118/3P
TOPIC: OCEANS AND SEAS
1
Coral Skeleton as Proxy Records: Assessment of Carbon Isotopes in Laboratory Cultured Corals and Coral Heads from French Polynesia
L. Liong Wee Kwonga, P. P. Povineca, C. Ferrier-Pagesb, A. J. T. Jullc
a International Atomic Energy Agency, Marine Environment Laboratory, 4 Quai Antoine 1er, MC 98000, Monaco
bCentre Scientifique de Monaco, Musée Océanographique, avenue Saint Martin, MC 98000 Monaco
c NSF Arizona AMS Laboratory, The University of Arizona, P O Box 21008, Tucson, Arizona 85721, USA
E-mail address of main author: [email protected]
Scleractinian corals, particularly those living in warm shallow waters, continuously grow whereby generating annual density bands that can provide time markers for the development of long isotopic chronologies. Corals thus act like paleoclimate recorders and the geochemical tracers contained in their skeleton can be assessed very precisely. A very useful application concerns the determination of radiocarbon in the consecutive bands of their aragonite. As the radiocarbon activity reflects the seawater 14C content at the time of deposition, it is thus possible to reconstruct the radiocarbon concentration of the surface ocean back in time, therefore, have access to several centuries of SST and salinity data.
Figure 1 is a photo of a coral slab, cut along the vertical growth axis, collected in Fangataufa atoll in 1997, when IAEA-MEL conducted a radiological survey that took place in the atolls of Mururoa and Fangataufa [1]. The density-banding pattern can be clearly observed and may be accentuated by irradiating with UV light.
FIG. 1. A slice of a coral sample collected in Fangataufa Atoll.
341

L.Liong et al.
2
A portion of coral is carefully sampled and the density bands are separated before being grounded to a fine powder. 50mg of this material is then hydrolysed with 5 ml H3PO4 under vacuum. Finally, pure CO2 is cryogenically trapped before graphite synthesis [2]. The samples are currently being processed and the results will be available soon.
Screrochronology is based on the assumption that all the tracers, present in the seawater in which the coral is growing, be incorporated in the skeletal material. Several models put forward suggested the occurrence of isotopes kinetic fractionation during aragonite precipitation [3-5]. We propose to assess 13C and 14C in samples of corals that will be cultured under controlled laboratory conditions (temperature, light, salinity and food), at the Centre Scientifique de Monaco [6]. The main physiological parameters such as photosynthesis and growth will also be measured using PAM fluorimetry and the technique of buoyant weight respectively.
[1] POVINEC, P.P., WOODHEAD, D., BLOWERS, P., BONFIELD, R., COOPER, M., CHEN, Q., DAHLGAARD, H., DOVLETE, C., FOX, V., FROEHLICH, K., GASTAUD, J., GRONING, M., HAMILTON, T., IKEUCHI, Y., KANISCH, G., KRUGER, A., LIONG WEE KWONG, L., MATTHEWS, M., MORGENSTERN, U., MULSOW, S., PETTERSSON, H., SMEDLEY, P., YAYLOR, B., TAYLOR, C., TINKER, R., Marine radioactivity assessment of Mururoa and Fangataufa atolls, Sci. Total Environ. 237/238 (1999) 249-267.
[2] LIONG WEE KWONG, L., POVINEC, P.P., JULL, A.J.T., Preparation of graphite targets from small marine samples for AMS radiocarbon measurements, Radiocarbon (in press).
[3] McCONNAUGHEY, T., 13C and 18O isotopic disequilibrium in biological carbonates: I. Patterns, Geochim. Cosmochim. Acta 53 (1989) 151-162.
[4] ADKINS, J.F., BOYLE, E.A., CURRY, W.B., Stable isotopes in deep-sea corals and a new mechanism for ‘vital effects’, Geochim. Cosmochim. Acta 67 (2003) 1129-1143.
[5] ROLLIN-BARD, C., CHAUSSIDON, M., FRANCE-LANORD, C., PH control on oxygen isotopic composition of symbiotic corals, Earth Planet. Sci. Lett. 215 1-2 (2003) 275-288.
[6] REYNAUD-VAGANAY, S., GATTUSO, J.P., CUIF, J.P., JAUBERT, J., JUILLET-LECLERC, A., A novel culture technique for scleractinian corals: application to investigate changes in skeletal δ18O as a function of temperature, Mar. Ecol. Prog. Ser. 180 (1999) 121-130.
342

EXTENDED SYNOPSIS IAEA-CN-118/4P
TOPIC: OCEANS AND SEAS
1
137Cs Exchange Processes in the Azov Sea
D. G. Matishov, G. G. Matishov, N. E. Kasatkina
Murmansk Marine Biological Institute KSC RAS (MMBI KSC RAS), Murmansk, Russian Federation
E-mail address of main author: [email protected]
The aim of this paper is to establish current regularities of input, distribution and transformation of 137Cs flow in the Azov Sea. Materials were water and bottom sediments samples collected in June 2003 in the Azov Sea during a complex MMBI expedition.
Current level of 137Cs accumulation in the Azov Sea bottom sediments varies in the range 6-76 Bq/kg dry weight (Fig. 1). In the Taganrog bay low 137Cs (6.0 Bq/kg dry weight) concentrations are found in the coarse aleurite sands zone. The highest contents of the pointed out nuclide -50-76 Bq/kg is observed in the clayey silts of the central -the deepest part of the sea. In the Kerch strait fall-out 137Cs activity in average is 20 Bq/kg dry weight.
137Cs activity in the Azov Sea surface waters in June 2003 varies in the range 1.5-19.6 Bq/m3 (Fig. 1). The highest concentrations of 137Cs in the Azov Sea waters in 2003 were registered in the Kerch strait area (19.6 Bq/m3). In the central part of the Azov Sea 137Cs concentration is 8-11 Bq/m3, in the Taganrog bay it lowers till 3-5 Bq/m3, and in the river Don delta it is 1.5 Bq/m3.
A weak correlation of the inverse proportional character is established between cesium accumulation in the bottom sediments and its concentration in the Azov Sea water masses.
Estimation of current flows of 137Cs input and elimination in the Azov Sea is carried out. In 2003 0.03 TBq 137Cs entered the Azov Sea with the Don river waters, 0.6 TBq 137Cs entered from the Black Sea, thus, radio-nuclides deposing into the bottom sediments is a important factor of the Azov Sea waters self- purification.
General impression on the direction and transformation intensity of the 137Cs ion run-off might be gained from the analysis of the migration of the dissolved form of this element in the estuary zone.
Dependency analysis of 137Cs concentration in the Azov Sea water on salinity (Fig. 2) points out to the non- conservative behavior of 137Cs in the Azov Sea. In the Kerch strait area solution in respect to the suspended phase is enriched with 137Cs. But in the area from the Taganrog bay exit (salinity 8-10 PSU) there takes place a noticeable sorption of radio- nuclide on the suspension, as the result the suspension turned out to be enriched with 137Cs in respect to the solution.
343

D. Matishov et al.
2
344

EXTENDED SYNOPSIS IAEA-CN-118/5P
TOPIC: OCEANS AND SEAS
1
Distributions of Long-lived Anthropogenic Radionuclides (14C, 129I, and 239+240Pu) in Coastal Water Columns off Sanriku, Japan
S. Shima, S. Gasa, K. Iseda, M. Kamamoto, H. Kofuji, T. Nakayama, K. Nishizawa, S. Mori, H. Kawamura
Japan Marine Science Foundation, Mutsu, Japan
E-mail address of main author: [email protected]
The first commercial facility for reprocessing nuclear spent fuel in Japan is going to run in July 2006 and routine release of radionuc lides to marine environment off Rokkasho will begin. Off Rokkasho area is located in the boundary where subarctic (Oyashio) and subtropical (Kuroshio) gyre mixes [1]. And the Tsugaru Warm Current (TWC) flows into this region through the Tsugaru Strait and originates in the Kuroshio flowing in the Sea of Japan/the East Sea (see Fig. 1). Those three water masses of different origins and coastal water mass coexist in the surface layer of this domain. So it is important to clarify the distribution of anthropogenic radionuclides and their behaviors in the coastal seawater.
Seawater samples were collected by use of CTD/Multi-Bottle Samplers (MBS) and large volume samplers (LVS) in October 2001 and June 2002. Carbon-14 and 129I were analyzed by accelerator mass spectrometry (AMS) and 239,240Pu was determined by the method of radiochemical separation and alpha spectrometry.
Th long- lived radionuclide concentrations for all samples were in the range -233 - 75‰ for ∆14C, not detected (N.D.) - 2.5×10⁷ atoms/l for 129I, and N.D. - 0.025 mBq/l for 239,240Pu, respectively. The other anthropogenic radionuclides have the same concentration as those reported by the other organization. The vertical profiles of 14C and 129I decreased monotonically with depths as shown in Fig.2. On the other hand, 239,240Pu profile have maximum at a depth of 500 – 700 m. The plots of potential density versus the concentrations designate that 14C and 129I virtually occurred in the water column lighter than the density of 26.6 - 26.8 and slightly penetrate into dense deeper layer. The maximum of Pu concentration existed at a density of 26.8 - 27.2.
There is no difference of 129I concentration between two water masses (Oyashio and TWC) classified according to water temperature and salinity [2]. ∆14C concentrations in TWC are higher than those in Oyashio, because TWC flows in sea surface over Oyashio [3].
A part of this research had been conducted under a contract with the Government of Aomori Prefecture.
345

S. Shima et al.
2
Pacific Ocean
Japan Sea / East Sea
Tokyo
Hokkaido
Russia
Rokkasho
Kuroshio
Extension (warm, high salinity)
Oyashio (cold, low salinity )
200
1,000
36
38
40
42
44
46
138 140 142 144 146 148136 150
E
N1st Branch
Coastal OyashioTsugaru warm current (TWC)
TWC flows in summer to autumn
TWC flows in winter to spring
Kuroshio
Tsushimacurrent(warm, high salinity) 2nd Branch
? (warm, high salinity)
Surveyarea
Warm• coresepareted from Kuroshio
FIG. 1. Schematic distribution of water masses and flow pattern around the northern part of Japan.
-200 -100 0 10014C
0 5 10 15 20129I ( x 10
6atoms / l )
0 0.005 0.01 0.015 0.02 0.025
239 240Pu
200
400
600
800
1000
1200
Dept
h(m
)
129I239+240Pu
14C∆
∆
+ (mBq/l)
(‰)
FIG. 2. Vertical profiles of radionuclides at Station 01W-2 (40º55.14’ N, 142º19.89’ E; Sampling date: Oct. 2001; bottom depth:1,130 m).
[1] TOMCZAK, M., GODFERY, J.S., Regional Oceanography: An Introduction, (2001)
pdf version 1.2, 391 pp. [2] HANAWA, K., MITSUDERA, H., Variation of water system distribution in the Sanriku
Coastal Area, J. Oceanogr. 42 6 (1986) 435-446. [3] SHIMA, S., NAKAYAMA, T., ISEDA, K., NISHIZAWA, K., GASA, S., SUTO, K.,
SAKURAI, S., OGURI, K., KOUZUMA, K., Distribution and Seasonal Change of the Tsugaru Warm Current water off Rokkasho (Proc. Int. Workshop on Distribution and Speciation of Radionuclides in the Environment, Rokkasho, 2000) 289-296.
346

EXTENDED SYNOPSIS IAEA-CN-118/6P
TOPIC: OCEANS AND SEAS
1
The Marine Information System (MARIS)
P. P. Povinec, Ph. Scotto, I. Osvath, H. Ramadan
Marine Environment Laboratory, International Atomic Energy Agency, Monaco
E-mail address of main author: [email protected]
The IAEA’s Marine Information System, a relational database based on a GIS (Geographical Information System), covering the distribution of radioactive and stable isotopes (and in the near future also other tracers and contaminants, such as organic compounds and trace metals) in the marine environment, as well as supporting oceanographic parameters (such as bathymetry, seawater temperature and salinity) has been developed in the Radiometrics Laboratory of the IAEA’s Marine Environment Laboratory (IAEA-MEL) in Monaco. The first main objective of MARIS, building on the previously developed Global Marine Radioactivity Database (GLOMARD), is to provide information on radioactive contamination of the marine environment, by grouping and storing available data on the most important radionuclides in the world oceans and seas, in the open sea as well as in coastal zones, specifically in seawater, particulate matter, biota and sediment. Quantification of the sources of radionuclides in the world's oceans and seas, computer modelling of the dispersion of radionuclides and radiological assessment studies require that IAEA’s Member States be provided with information on the past and present levels of radionuclides in the marine environment. The IAEA acts as a clearing-house for information on radioactive contaminants in the marine environment and makes data on marine radionuclide levels available to Member States for future assessment studies and the evaluation of trends in the contamination of the marine environment. In this respect IAEA-MEL has been acting as a central facility for the collection, synthesis and interpretation of data on marine radioactivity in the world ocean with the aim: (i) to provide immediate and up-to-date information on radionuclide levels and inventories in the seas and oceans; (ii) to provide a snap-shot of radionuclide levels at any time in any location; (iii) to investigate changes with time in radionuclide levels and inventories; (iv) to provide data for validation of models on the dispersion of radionuclides in the marine environment, (v) to provide bases for assessments of radiation doses to local, regional and global human populations and to marine biota, and (vi) to identify gaps in available information. The data provided by MARIS will be used as the international reference source on the radionuclide contamination of the marine environment so that any further contributions from nuclear industry, radioactive waste disposal sites, nuclear weapons test sites and possible nuclear accidents can be identified. The second main objective of MARIS is to provide information on distribution of radioactive and stable isotopes, trace metals and organic compounds in the world oceans and seas, which could be used as tracers for investigation of marine processes. This part of the database will be growing substantially in the near future, so that data on all important oceanic tracers will be available to IAEA’s Members States for oceanographic investigations. The data stored in MARIS could be used for water and sediment dynamics studies, investigation of processes in the water column, seawater-sediment interactions, seawater-groundwater interactions, etc., as well as for validation of models used in climate change studies. Figure 1 illustrates the structure of MARIS. The on-line version of MARIS, containing validated datasets, is currently undergoing final tests, being available via the IAEA web site http://maris.iaea.org/.
347

P. Povinec et al.
2
LAB
The Marine Information System (MARIS)
IAEA
information about the sample (location,date...)
SAMPLESEA
SAMPLETYPE
SEDIMENTTYPE
references, authors, journals,articles
REFERENCE
specific activity, concentration,
MEASURE
UNIT
NUCLIDE
1 Bq/kg,31.8 psu...
MARISSTRUCTURE GIS
Plotter
SPECIES
BODYPART
FIG. 1. MARIS structure.
348

EXTENDED SYNOPSIS IAEA-CN-118/7P
TOPIC: RADIOECOLOGY
1
Determination of Uranium Isotopes in Water Samples
F. Abbasisiar, T. Hosseini, A. Fathivand
National Radiation Protection Department, Iranian Nuclear Regulatory Authority, P.O. Box 14155-4494, Tehran, Iran
E-mail address of main author: [email protected]
Natural alpha emitter radionuclides such as uranium (U) and thorium (Th) have potential public health effects after releasing to the environment. So determination of these radionuclides in foodstuffs and specially drinking water seems to be a vital need. Water consumed by livestock and used for irrigating purposes can also be a source of radionuclides in foods. Sea water can be a contamination source for seafoods. Water from streams, lakes and ponds should also be considered as a source of contamination [1-2].
In this investigation, a proper method is introduced to determine Uranium isotopes (234U, 235U and 238U) in water samples which have been sent by International Atomic Energy Agency (IAEA). The method was based on radiochemical separation of U by an ion exchange column, preparation of alpha source by electrodeposition or co-precipitation methods and at last, alpha spectrometry of the obtained sources. The minimum and maximum measured activities were 3.217×10⁻³ and 596.767 Bq.kg-1 respectively.
The samples are categorized in two groups: 1) Low salinity and 2) High salinity water samples. For the first one, the method is included of these stages [3]:
1- Adding 232U tracer solution in order to measure chemical recovery.
2- Converting the solution to Chloride system by heating to dryness and adding HCl conc. (3 times).
3- Dissolving the obtained residue in 50mL HCl 7M and passing this solution through the column. [A glass column (1 cm diameter and about 10 cm length) filled by Dowex 1x8 Cl-
form resin treated with 250 mL HCl 7M.].
4- Elution of uranium from the column by passing 100 mL 0.1M HCl through the column.
5- Electrodeposition of the U part (eluted from the column) [4].
6- Alpha-spectrometry of the obtained source from above section.
(Alpha-spectrometry was performed using passive implanted silicon surface barrier detector with 35 keV resolution (FWHM) connected to multichannel analyzer.)
For high salinity samples the method is the same as low salinity samples except that some stages will be added such as: after adding tracer solution, Fe+3 carrier solution is added and the pH of solution will be increased to 9-10 ( by adding ammonia solution), Fe(OH)3[U] precipitation will be separated and dissolved in HCl .After this step, stages 3 and 4 will be done and when the U part , eluted from the column, it will be extracted by Di-isobutylketone (in order to separate iron from uranium) [5-6]. The other steps are similar to low salinity samples.
349

F. Abbasisiar et al.
2
The activity of each U isotopes was measured by determination of the net area of its peak in alpha spectrometry spectrum. Alpha spectrum of Uranium isotopes is shown in Fig.1. The range of calculated activity was between 3×10⁻³ to 4×10+4 Bq.kg-1 and the uncertainty was from 4×10⁻³ to 4×10+1 Bq.kg-1 .The Minimum Detection Limit(MDL) for 95% of confidence level and 60000 second counting time, was measured 5.48×10⁻⁴ Bq.kg-1.
It was observed that for natural samples (e.g. IAEA-426) source preparation should be performed by co-precipitation method with LaF3 [7].
FIG. 1. Alpha spectrum of uranium isotopes.
[1] INTERNATIONAL ATOMIC ENERGY AGENCY, Measurement of radionuclides in food and the environment, Technical Report Series 295 (1989) IAEA, Vienna.
[2] HEALTH AND SAFETY LABORATORY (HASL), The procedure manual of the environmental measurements laboratory, U.S DOE 28th Edition 1 U-02-RC (2002).
[3] TALVITI, N.A., Electrodeposition of Actinides for alpha spectrometric determination, Anal. Chem. 44 2 (1972) 280.
[4] BISHOP, C.T., Separation of Polonium by ion exchange chromatography, Radiochem. Radioanal. Lett. 55 5-6 (YEAR) 279-288.
[5] TAKADA, J., Uranium Isotopes in Hiroshima Black- Rain soil, J. Radiat. Res. 24 (1983) 236-239.
[6] PARSA, B.J., A Sequential Radiochemical Procedure for isotopic analysis of U & Th in soil, Radioanal. Nucl. Chem. Art. 157 1 (1992) 65–73.
[7] PARSA, B., Uranium in water (Isotopic Analysis of Uranium in drinking water) Report January 1986.
0
50
100
150
200
250
3000 4000 5000 6000
Energy(keV)
Coun
ts
U-238U-234
U-232
U-235
350

EXTENDED SYNOPSIS IAEA-CN-118/8P
TOPIC: RADIOECOLOGY
1
Study of Exposure to Radiation in a Lost Wax Foundry
F. Legarda, N. Alegría, M. Herranz, R. Idoeta
Dept. of Nuclear Engineering and Fluid Mechanics, University of the Basque Country, Bilbao, Spain
E-mail address of main author: [email protected]
Lost wax casting is an old method for making metal pieces. At the beginning of the process, the required metal piece is made in wax. After that, the wax model is covered with a silicaceous shell. When the silicaceus shell is finished, the wax is melted, replacing the wax by liquid metal. In the moment when the metal is cool the silicaceus shell is broken away. Finally some finishing process is made, and the piece is just prepared for its utilization. The silicaceus shell is prepared with zircon sands containing varying concentrations of natural radionuclides: 238U, 232Th and 235U together with their progenies. For that reason it is very convenient to assess the dose to workers, considering the tasks they perform and the exposure time in these activities during a year. The first part of the study is centred in identifying the situations and areas where workers are exposed to radiation [1-3]. The exposure pathways are: inhalation of dust, ingestion of dust, inhalation of radon, skin contamination and external irradiation.
In a plant where this process is implemented the areas where workers are exposed are: the store, the shell building area, the foundry area, the shell or mould breaking area, and the waste area, including those areas close to the store too. In those sections, workers are exposed while they work in different tasks.
The second part of the study deals with dose assessment. In most of the areas, external irradiation is the dominant pathway, and in order to assess doses a Monte-Carlo simulation using MCNP-4C [4] code has been performed.
Photons fluxes so obtained are multiplied by the conversion factor of Flux to Kerma for air [5], by conversion factor to Effective Dose by kerma unit [5], and by the number of emitted photons per disintegration of parent nuclide.
The application of this methodology to given mill has obtained the following results: Individual doses by area received by workers have a mean value of 5.9 µSv/y and a standard desviation of 7.7 µSv/y with an upper limit of 20.3 µSv/y and a lower limit of 0.2 µSv/y. The corresponding collective dose is 232.8 µSv/y and being the distribution of dose by task as follows:
Maintenance: Carrying the zircon sands from lorry to store (0.039 µSv/y), putting the zircon sand pallet on the shelf (0.012 µSv/y), while the pallet is on the shelf (2.8 µSv/y), taking the pallet off the shelf (0.022 µSv/y), taking the pallet to mould preparation area (0.39 µSv/y). The total colective dose making that task is 3.263 µSv/y
Shell Making: shell preparation (58.2 µSv/y), shell cover (big trays) (76 µSv/y), shell cover (small trays) (9 µSv/y), exposures to moulds (5.6µSv/y), loading the pieces on the
351

F. Legarda et al.
2
wagon (2.1µSv/y), taking the wagon to foundry area (7.4 µSv/y), taking the residues to waste area (2.2 µSv/y), putting the pieces into the take wax removing kiln (1.4 µSv/y). The total colective dose making that task is 161.91 µSv/y
Mould preparation (35.2 µSv/y). Shell removal: waste material removal (0.4 µSv/y), and moving the cart from foundry
area (0.6 µSv/y) Finishing (28.6 µSv/y). Waste (0.00034 µSv). And here it can be seen that those workers working on the shell making are the most exposed ones, but the value of collective dose is less than 1 mSv/y.
Comparing with the levels of the graphical representation of the classification system [1, 2], it can conclude that the processes “do not need to consider regulation”.
[1] EUROPEAN COMMISSION, Reference levels for workplaces processing materials with enhanced levels of naturally occurring radionuclides, Rad. Prot. 95 E.C., Luxembourg (1999).
[2] PENFOLD, J.S.S., MOBBS, S.F., DEGRANGE, J.P., SCHNEIDER, T., Establishment of reference levels for regulatory control of workplaces where materials are processed which contain enhanced levels of naturally occurring radionuclides, Rad. Prot. 107, E.C., Luxembourg (1999).
[3] LEGARDA, F., ALEGRÍA, N., HERRANZ, M., IDOETA, R., Valoración de la Dosis recibida por el personal de Precicast Bilbao, S.A. como consecuencia de la utilización de arena de circonio, Dpto. Ingeniería Nuclear y Mecánica de Fluidos, Universidad del País Vasco, Informe INMF/07/03, Bilbao (2003).
[4] LOS ALAMOS NATIONAL LABORATORY, MCNP-4C, Monte-Carlo N-Particle Transport Code System, versión 4C, New México, USA (2001).
[5] INTERNATIONAL COMMISSION ON RADIOLOGICAL PROTECTION, ICRP Publication 74, Pergamon Press (1997).
352

EXTENDED SYNOPSIS IAEA-CN-118/9P
TOPIC: RADIOECOLOGY
1
Artificial Radionuclides in the Black Sea Sediments
R. Alieva,b, St. Kalmykova, Yu. Sapozhnikova
a Moscow State University, Chemistry Department, Radiochemical Div., Moscow, Russian Federation
bMoscow State University, Skobeltsyn Institute of Nuclear Physics, Moscow, Russian Federation
E-mail address of main author: [email protected]
Presenting work is the summarizing of the Moscow State University activities in terms of IAEA RER 2/003 Project “Marine Environment assessment of the Black Sea Region”. The Black sea is highly-contaminated water body. The atmospheric nuclear tests in 50-60s and the accident at the Chernobyl NPP (1986) are the main sources of man-made radionuclide contamination of the Black Sea. Some impact of the contemporary nuclear activities of European countries is possible as well. The aim of this work was to estimate the level and to reconstruct chronology of anthropogenic radioactive pollution of the Black Sea ecosystem.
Sediment samples (11 sediment cores) were collected by multicorer and gravity corer during the 55 Cruise of RV “Professor Vodyanitsky” (2000) and cruises of RV “Akvanavt” (1997-2000) in the Eastern part of the Black Sea and near Turkish, Russian and Ukrainian (Crimea) shores. Sediment samples were cut by 1 cm layers and analyzed for 137Cs specific activity. The vertical distribution of 137Cs in the Black Sea sediments in most cases has a sharp maximum, corresponding to the Chernobyl accident. Sometimes a second maximum caused by the atmospheric nuclear tests also occurs (corresponds to early 60s). The specific activity of 137Cs in the bottom sediments of the Black Sea reaches the level of 200 Bq/kg of dry weight. Recently 137Cs fluxes to marine sediments dramatically decreased. It means, that self-cleaning of water column takes part during the last years.
In some cases the chronology of contamination by 137Cs was proved by independent tracer – excess 210Pb. In order to study the origin of the radioactive contamination the plutonium isotope ratios were used. The 241Pu with a half- life period of 14.5 years served as sedimentation monitor together with 238Pu/239,240Pu and 241Pu/239,240Pu ratios [1]. The obtained data for Danube avandelta indicate that sediments are mixed and the radionuclides have both Chernobyl and fallout origin. The upper layers were mostly contaminated with Chernobyl plutonium whereas the relative content of fallout radionuclides increased in deeper layers. For the first time 237Np specific activity data for the Black Sea sediments are presented [2].
353

R. Aliev et al.
2
FIG.1. The vertical profiles of 137Cs and Pu isotopes in the sediment cores from the Eastern Black Sea (Station BS-11 41?59.9’ N 40?11.4’ E), sea depth 1892 m.
[1] ALIEV, R.A., KALMYKOV, ST.N., SAPOZHNIKOV, YU.A., "Man-made radionuclides in age-dated sediment cores from the Black Sea", Environmental radiochemical analysis II (WARWICK, P., Ed.), Royal Soc. Chem., Cambridge, UK, 254-262.
[2] KALMYKOV, ST.N., ALIEV, R.A., SAPOZHNIKOV, D.YU., SAPOZHNIKOV, YU.A., AFINOGENOV, A.M., Determination of Np-237 by radiochemical neutron activation analysis combined with extraction chromatography, Appl. Radiat. Isot. 2004. 60 2-4 (2004) 595-599.
0
2
4
6
0 100 200A, Bq/kg
horiz
on, c
m
137Cs
0
1
2
3
4
0 2 4 6 8
A, Bq/kg
horiz
on, c
m
238Pu239,240Pu
354

EXTENDED SYNOPSIS IAEA-CN-118/10P
TOPIC: RADIOECOLOGY
1
Environmental Study of Java Coast
K. T. Basuki, Sumining, Taftazani, A., Sukirno,
Yogyakarta Nuclear Research Center, National Atomic Energy Agency of Indonesia, Yogyakarta, Indonesia
E-mail address of main author: [email protected]
Red tide or harmful algal bloom is a recurring problem in some important fishing areas. Aside from the economic losses caused by the shellfish poisoning resulting from the seafood production contaminated by the algal toxins, is a major health concern Sampling were carried out according to the sampling technique of marine environmental materials for the analysis of radioactivity and non-radioactive contaminants. Trace elements and heavy metals determined by INAA method, using relative standard. Total radioactivity level of alpha and beta of the samples were measured by using detector ZnS and low level β counter modified CRDAT Yogyakarta.
Radionuclides identified in all sampling locations were natural radionuclides. In Cirebon coastal sediment radionuclides distribution patterns of Ra-226, Pb-212 and K-40 were according to exponential models, while Th-234, Pb-214 and Tl-208 to a polynomial model. The distribution series patterns move from 0 to 22 cm depth natural radionuclides of β emitter as it were primordial radionuclides (K-40; H-3; Rb-87), cosmogenic radionuclides.
The gross α and gross β radioactivity from sea water both Cilacap Center-Java and Indramayu West-Java areas are lower than the threshold value decided by Indonesian Government Act. No. 20/1990 and indicated that α and β radio ecological quality of seawater is still good. Bioaccumulation and distribution factor of α/β radionuclides on biota / fish and sediment samples comes from Indramayu West-Java hanging over greater than Cilacap The gross-β activity from water environment of Surabaya river and coast was lower than the threshold value decided by Environmental Minister, Act. Kep. 02/MENKLH/I/1988 (1000 mBq/L) indicated that β-radio ecological quality of water were still in good. The activity of the gross-α of water samples were higher than the threshold value decided by Environmental Minister, Act. Kep. 02/MENKLH/I/1988 (100 mBq/L). Radionuclide of Cs-137 was undetected. The highest γ radioactivity of sediment of Banjaran river was for Pb-212 of 17.35 Bq/kg, the highest of β radioactivities was 76.1 ± 4.50 Bq/kg in sediment of Balong river. Data of gross α and β activity from sea water, sediment, mussel, and fish in Kenjeran Surabaya coast were higher than the threshold value of Indonesian Government Act No. 20/1990 indicated that –the water quality has been contaminated. The gross α and gross β radioactivity of sediment, biota/fish (“scatophagus argus”) and sea water samples in the coast of Brondong, Karongsong, Singaraja, Majakerta and Limbangan area. Indramayu West-Java were lower than the threshold value of Indonesian Government Act No. 20/1990 indicated that the α and β radio ecological quality were still in good condition. Natural radionuclides of β emitter much more dissolved in sea water than α emitter.
355

K. Basuki et al.
2
Krakal coast preferred as the control area. The gross-α and β radioactivities and radionuclides of Cirebon and Losari environmental samples consist of water, bottom surface sediment and macrobenthic (Mytilus viridis L.). Were lower than of Indonesian Government Act. No. 20/1990.
Pollution. The migration studies of Caesium 137 and Pu-239 on the soil of Muria Peninsula as the area of nuclear power has been studied by simulation technique. Average of migration flow rate was: 5.91 x 10⁻⁴ – 4.48 x 10⁻² cm/second; the longitudinal dispersivity: 0.030 – 0.241 cm; the coefficient of longitudinal dispersivity: 4.96 x 10⁻⁵ – 7.69 x 10⁻³ cm2/second and retardation factor: 2.30 – 3.39. Because its concentration/radioactivity still below the maximum concentration detection value of Pu-239 fin algae and fish was 1.10 Bq/g, whereas for sea water was 0.07 Bq/mL.
Sedimentation rate. In Cirebon the slowest sedimentation was at S 04 0.11 cm/y (14-16 cm depth) to 0.39 cm/y (2-4 cm depth). and the fastest was at location S-01=0.24 cm/y (18-20 cm depth) to 10.00 cm/y (2-4cm depth), In Muria the slowest was at location B= 0,084 cm/y (20-22 cm depth) to 0.588 cm/y (2-4 cm depth and the fastest was location C= 0.080cm/y (30-32 cm depth) to 1.55 cm/y (10–12 cm depth), Location B = 06o24’ 28.5” LS, 110o50’ 11.5” BT, position 360o north, Location C = 06o24’ 31.2” LS, 110o50’ 12.7” BT, position 249o South West
Survey of heavy metals. Heavy metals. of. Hg, Cd, Fe and Co in water, sediment and macro benthos) of Semarang coast (Bandengan, Tanjung Mas and Muara Demak, sampling at August 1999) have been investigated by INAA (Instrumental Neutron Activation Analysis) technique. Irradiated was carried out for 12 hours using neutron flux of 1.05x10¹¹ n.cm-2.sec-
1. Concentration of Hg, Cd, Fe, Co, in sediment and macro benthos from Bandengan area was higher than Tanjung Mas and Muara Demak, in water samples i.e. Sm, Ce, Cr and Co from Bandarhardjo were higher than Simongan, In sediment samples of Simongan was higher than Bandarhardjo. Tanah Mas is in between In soil, grass plant and water samples taken from Banjir Kanal Barat was higher than Banjir Kanal Timur and harbour area. Heavy metals identified in water and sediment samples of Semarang were Sm, Ce, Cr and Co The highest concentration was in water sample of Bandarharjo. The lowest concentration was in Simongan, In sediment samples the highest was Simongan site, Tanah Mas is in between. In Surabaya, the content of Fe, Cu, Cr, Pb, and Zn were determined in fish, lobster, mussel, samples and river waters. The data shown Surabaya Waters River were higher than permissible limits caused by the pollutant come from the port activities.
In Muria heavy metals in seawater and coast sediment determined were. Fe, Se, Co, Ce, Sm Cr, Zr and Sc and several trace elements were Cr, As, Th, U and Sc. In sea water, brown algae and kerapu fish from Lemah Abang and Semat. The same samples were done from Krakal coast as the control. The elements concentration of Muria peninsula was relatively higher than Krakal.
Harmful algal bloom studies. Using sodium polytungstate for separating cyst from the sediment has carried out determination of harmful algal cyst in sediment samples of Muria Peninsula and Semarang coast. Contamination by algal toxins is an important factor to be known because the area is the economical gate for central Java especially on fishing, fish cultivation and marine transportation. Sampling location were Bayuran, Bondo, Beringin district of Muria Peninsula and Tambak Mangunharjo Tugu, Tambak Nyangkringan Demak and Tanjung Mas of Semarang coast.
356

EXTENDED SYNOPSIS IAEA-CN-118/11P
TOPIC: RADIOECOLOGY
1
Off-Site Environmental Monitoring for Radiological Safety
N. Çelebi, G. Karahan, C. Özüag, B. Ataksor, E. Güngör, M. Tasdelen, M. Koçak
Çekmece Nuclear Research and Training Center, P.O. Box 1, 34149 Atatürk Airport, Istanbul, Turkey
E-mail address of main author: [email protected]
Measurements of radioactivity in the environment for routine verification as well as in cases of emergency are very important for nuclear environmental safeguards. Radiological safety activities of Çekmece Nuclear Research and Training Center are provided as a part of the national program. Air samples from the environment were collected by the method of pumping air through the air filter for 1-day sampling to provide data on airborne activity concentration [1]. Measurements were done daily. Total alpha/beta radioactivity concentrations and gamma/beta dose rates at sample locations are measured. Air radioactivity concentrations are given in Table I. Water samples were taken monthly from the Küçükcekmece Lake, Marmara Sea and tap water and the radioactivity concentrations were evaluated with a Berthold gas proportional total alpha/beta counter. Annual average total alpha/beta radioactivity concentrations of environmental water samples are given in Table II. The concentrations of gamma emitters in air and water samples were determined by Canberra pure HPGe detectors with energies ranging from 50 keV to 2000 keV [2]. The software was prepared to create the data bank and the data management system. The input data in the software covers the period of 01.01.2003- 01.02.2004.
TABLE I. AIR RADIOACTIVITY CONCENTRATIONS (Bq m-3)
Radioactivity type Minimum Maximum Average
Alpha emitter 1.89x10⁻³ 1.03x10⁻¹ 1.24x10⁻² Beta emitter 1.92x10⁻³ 1.06x10⁻¹ 1.36x10⁻² Beta (after 7 days) 1.05x10⁻⁴ 1.15x10⁻³ 7.02x10⁻⁴
TABLE II. ANNUAL AVERAGE TOTAL ALPHA/BETA RADIOACTIVITY CONCENTRATIONS OF ENVIRONMENTAL WATER SAMPLES
Environmental water samples Total Alpha Conc. (BqL-1)
Total Beta Conc. (BqL-1)
Rain Water 0.022±0.011 0.107±0.008 Snow water 0.015±0.009 0.092±0.014 Tap water (ÇNAEM) 0.006±0.002 0.054±0.015 Küçükçekmece Lake (Dock) 0.032±0.012 1.462±0.124 Küçükçekmece Lake (Kurtburnu) 0.025±0.014 1.425±0.545 Lake and Sea joint point 0.218±0.110 3.684±0.214 Marmara Sea (Florya) 0.207±0.009 4.344±0.322 Marmara Sea (Aksaray) 0.018±0.005 2.985±0.125
357

N. Celebi et al.
2
[1] INTERNATIONAL ATOMIC ENERGY AGENCY, Measurement of Radionuclides in Food and the Environment, Technical Report Series 295, IAEA, Vienna (1989).
[2] INTERNATIONAL COMMISSION ON RADIATION UNITS AND MEASUREMENTS, Gamma ray Spectrometry in Environment, ICRU Report 53 Bethesda (1994).
358

EXTENDED SYNOPSIS IAEA-CN-118/12P
TOPIC: RADIOECOLOGY
1
Environmental Monitoring of γ- and α- Emitters in Areas Near Tomsk City (Siberia, Russia)
L. Chouraa, G. Ardissonb, V. Karataeva, G. Barci-Funelb, H. Michelb, V. Barcib
a University Polytechnic of Tomsk, Russian Federation
bLaboratoire de Radiochimie, Sciences Analytiques et Environnement, University of Nice Sophia-Antipolis, France
E-mail address of main author: [email protected]
Nowadays, great attention is given to inspection of territories and estimation of existing radioactive situations. It is important to investigate territories about potential sources of radioactivity injections into a given environment, for example, such as the Siberian chemical complex (Tomsk - 7), which is located in the vicinity of Tomsk in the Southwest of Siberia.
Some of this potential sources of radioactive pollution are for example: the remnants of tests of nuclear weapons in the atmosphere (which began the sixties), the emissions of radioactive nuclides as a result of the Chernobyl accident, and the influence of the Siberian chemical complex. The complex was build in the middle of fifties and was intended to manufacture plutonium for industrial and military aims. During this time, in the complex there were some failures with emission of radioactive elements into the environment, the last one took place in 1993.
Our research focused on the inspection of the surrounding territory for man-made radionuclides. Soil samples were collected near to the sanitary - protective zone of the complex and about 55 km to the South. In the analyzed samples we measured the 137Cs concentration by γ-spectrometry, 239,240Pu and 238Pu concentrations using radiochemical separation followed by α-spectrometry.
Our data on radionuclide concentrations and isotopic ratio allowed assessing the contamination sources of the area near the Tomsk city. Previous studies, performed in 1995, showed the absence of 134Cs and therefore no influence of the Chernobyl accident. The higher concentrations of 137Cs, 239,240Pu is well as the isotopic ratio values near the complex allow asserting the influence of the Siberian chemical complex to the global activity of this region. However, in the territory far from the complex, the concentrations of made-man radionuclides are mainly due to the atmospheric tests of nuclear weapons.
359

EXTENDED SYNOPSIS IAEA-CN-118/13P
TOPIC: RADIOECOLOGY
1
Use of Gamma-Ray Spectrometry for Analysis of Uranium Isotopic Composition in Soil of Iran
A. A. Fathivand Khalili, J. Amidi, A. Messineh-Asl
National Radiation Protection Department, Iranian Nuclear Regulatory Authority, P. O. Box 14155-4494, Tehran, Iran
E-mail address of main author: [email protected]
The use of depleted uranium (DU) in various weaponry and ammunition during the Iraq war in April, 2003 caused serious concern in Iran over possible uranium contamination of the Iran environment and consequently long health effect. After a shell explosion, uranium is discharged by the fire in the air in the form of oxidized particles and can be dispersed within a radius of several kilometers [1].
Gamma-ray spectrometry was used to determine uranium concentration in soil samples collected from 8 sites in Iranian sectors of Iraq border, as shown in Fig. 1. All soil samples were dried ,gently grounded and passed through a 2 mm sieve. Three hundred grams of each sample were placed in plastic container and sealed for at least 20 days to allow equilibrium in uranium, thorium and actinium series [2].
Gamma-ray intensities were measured with 40% HPGe (CANBERRA) detector. The detector was shielded by 10 cm lead on all sides with cadmium-copper in inner sides. The system is equipped with software for data acquisition and analyzing. The counting time was 6 x 10⁴ seconds and background spectra were also collected for the same period of time.
The concentrations of 238U assessed from 63.3 keV and 92.4 keV emission of its first daughter nuclide, 234Th. To assess the isotopic ratio of 238U/235 U, secular equilibrium was ensured and the concentration of 235U under the 186 keV was deduced. The 226Ra was determined through the 295 keV and 352 keV gamma-rays of 214Pb [2].
The concentrations of 238U and activity ratio of 238U/235U is given in Table I. The average of measurement activity ratio is 21,very close to the value of 21.5 for natural uranium, while the activity ratio of DU can be as high as 76.9. The 238U activity ranges within typically accepted levels from 14-33 Bq kg-1, while the typical range given by UNSCEAR (1988) for different soil samples is 10 to 50 Bq kg-1.
The analysis of eight surface soil samples of Iranian sites of Iraq border, showed that uranium isotopes are in their natural abundances.
360

A. Fathivand et al.
2
Fig.1. Sampling sites of soil collection.
FIG. 1. Sampling sites of soil collection.
TABLE I. CONCENTRATION OF URANIUM IN THE SOIL SAMPLES
Collection at Site No.
238U activity (Bqkg-1dry) 238U/235U activity ratio
1 19 ± 3* 22.3 ± 5 2 14 ± 2 20.1 ± 5 3 30 ± 4 19.2 ± 4 4 33 ± 4 24.4 ± 5 5 19 ± 3 25.6 ± 6 6 15 ± 2 19.3 ± 5 7 14 ± 2 18.1 ± 4 8 25 ± 3 24.0 ± 6
* One sigma counting error
[1] FIRYAL BOU-RABEE, Estimating the concentration of uranium in some environmental samples in Kuwait after the 1991 Gulf war, Appl. Radiat. Isot. 46 4 (1995) 217-220.
[2] PAPACHIRSTODOULOU, C.A., ASSIMA KOPOULOS, P.A., PATRONIS, N.E., IOANNIDES, K.G., Use of HPGe ?–ray spectrometry to assess the isotopic composition of uranium in soils, J. Environ. Radioact. (2003) 195-203.
361

EXTENDED SYNOPSIS IAEA-CN-118/14P
TOPIC: RADIOECOLOGY
1
Transport of Radionuclides in and to Norwegian waters – 10 Years of Monitoring the Marine Environment
I. Sværen, H. E. Heldal, P. Alvestad, L. Føyn
Institute of Marine Research, IMR, Bergen, Norway
E-mail address of main author: [email protected]
The Institute of marine research, IMR, is an advisory institute to the Norwegian government on fisheries management, the marine living resources and the marine environment. In this capacity IMR conducts an extensive monitoring of the important fish stocks, in particular, and the environmental conditions important for the various parts of marine life. Monitoring radioactivity is part of this monitoring, which comprises hydrography, contaminants, plankton, fish populations and demersal species as deep-water coral reefs. The monitoring of the various ecosystems allow us to consider a contaminant in a broader context than just the values and trend of a particular contaminant.
The history of monitoring radioactivity at IMR goes back to the late 1950s when atmospheric nuclear bomb tests took place in the eastern part of the Barents Sea and it was important for the Norwegian fisheries to have information of the possible radioactive impact on the Barents Sea fish stocks. The direct fall-out from the tests had a more or less immediate impact in fish, but mean values never exceeded 90 Bq kg-1 wet weight [1]. The radioactivity was measured as total beta minus K-40. The atmospheric nuclear bomb tests ended in 1962 and IMR ended its monitoring programme in 1968, as it was believed at that time that radioactive contamination of the marine environment was something of the past. The Chernobyl-accident changed this picture as also the accidents with nuclear submarines in the Barents Sea. Public awareness and the fact that radioactive pollution became a political issue in Norway released funding for new and more extensive monitoring in biota, sediments and water in areas of important to Norwegian fisheries. In 1999 a national monitoring programme was established with the Norwegian Radiation Protection Agency, NRPA, as the coordinating institution.
The major sources for radioactive contamination in Norwegian waters are nuclear industries in Europe, Sellafield in particular, run-off from land to the Baltic Sea from Chernobyl fall-out and run-off to Norwegian fjords from areas in Norway contaminated by fall-out from the Chernobyl-accident. The transport routes from Europe, i.e. the southern North Sea, and the Baltic Sea follows the main currents and is transported northwards along the coast mainly by the Norwegian Coastal Current into the Barents Sea and to the west of Spitsbergen and into the Greenland/Norwegians seas. The results from our monitoring of radioactivity give valuable corrections and inputs to the mathematical models used in the work for better understanding of marine ecosystems.
With some examples the poster will explain the transport routes and the dispersion of the contaminants and thereby how a conservative contaminant can be used as tracer for processes taking place in the marine environment.
362

I. Sværen et al.
2
[1] FØYN, L., Radioactive contamination in the Barents Sea, past and present status, uptake of radionuclides in fish and its impact on fisheries. ICES (1994) MEQC, E 16.
363

EXTENDED SYNOPSIS IAEA-CN-118/15P
TOPIC: RADIOECOLOGY
1
Anthropogenic Radionuclides in Biota Samples from the Caspian Sea
J. Gastauda, B. Oregionia, M. K. Phama, S. V. Pagavab, P. P. Povineca
a International Atomic Energy Agency, Marine Environment Laboratory, MC 98000 Monaco
bTbilisi State University, Department of Nuclear Physics, Tbilisi, Georgia
E-mail address of main author: [email protected]
The Caspian Sea has been recently a subject of many scientific studies mainly related to sea level changes and pollution. For this purpose, two sampling expeditions were organised by IAEA in the Caspian Sea in 1995 and 1996. The aim was to investigate oceanographic conditions, water dynamics and the distribution of anthropogenic radionuclides 90Sr, 137Cs and 239,240Pu in the water column [1, 2].
Considering the unique biodiversity of the Caspian Sea, there has also been interest to obtain information on radionuclide concentrations in biota samples, first of all in sturgeons and in caviar as their production is strongly linked to economical regional needs [3]. The radioactive contamination of Caspian Sea biota has been investigated by analyzing natural 210Po and anthropogenic 137Cs, 239,240Pu and 241Am in biota samples collected in April 1999 offshore of Astrakhan, in the north Caspian Sea [2]. More biota samples from the South West Caspian Sea (Artom Island, June 1999; Devechi District and Neftechala, November 1999) were collected and analyzed for 210Po, 137Cs, 90Sr, 239,240Pu and 241Am. The sampled species were different types of sturgeons (Sevruga, Russkyi Osyotr and Beluga) as well as fresh spawn and caviar. Other fish species (e.g. Cyprinidae) and one algae sample (Cladofila) have also been analysed. Flesh parts have only been analysed in the case of fish samples.
The samples were freeze-dried, ground sieved and canned to be counted by gamma-spectrometry for determination of 137Cs. Analytical separation and purification procedures were carried out later. 210Po, 239,240Pu as well as 241Am were measured by alpha-spectrometry whereas 90Sr was measured by beta-spectrometry.
The data are reported in Table I. In general, radionuclide activities in fish and caviar do not represent any risk for their consumption as they are very low. 239,240Pu and 241Am were close to the limit of detection. When measurable, the 238Pu/239,240Pu ratio is close to the fallout value. 90Sr activities are quite similar in all samples, while concentrations of 137Cs are higher in sturgeons than in cyprinidae fish. This affects the 137Cs/90Sr ratio which varies from 6 to 350. In the caviar and spawn samples, the 137Cs is not as concentrated as in the fish, whereas 90Sr is slightly higher. One caviar sample from the South Western region shows higher levels of plutonium and americium. The algae sample, as expected, has been concentrating these radionuclides as well.
364

J. Gastaud et al.
2
TABLE I. ANTHROPOGENIC RADIONUCLIDES AND 210Po IN BIOTA FROM THE CASPIAN SEA (WET WEIGHT)
Sampling Area
Sample Type Sampling Date
239,240 Pu (mBq/kg)
241Am (mBq/kg)
210Po (mBq/kg)
90Sr (mBq/kg)
137Cs (mBq/kg)
N Caspian Sea
Fish (Beluga) April 1999 0.23±0.01 0.60±0.02 0.43±0.19 2.11±0.03
Fish (Sturgeon) April 1999 0.12±0.03 0.50±0.13 0.60±0.19 0.56±0.03
Caviar (black-1) April 1999 0.90±0.19 4.3±1.2 0.25±0.02
Caviar (red) April 1999 1.90±0.19 1.8±0.4 0.26±0.04
Caviar (black-2) April 1999 0.18±0.05 0.6±0.2 0.13±0.02
SW Caspian Sea
Fish (Sevruga) 26-06-1999 <0.3 <0.15 0.40±0.13 1.22±0.07
Fish (Russkyi Osyotr)
26-06-1999 <0.3 <0.19 0.61±0.16 1.14±0.04
Fish (Beluga) 26-06-1999 <0.3 <0.06 0.16±0.01 5.0±2.2 1.76±0.07
Spawn (fresh) 26-06-1999 <0.4 <0.26 2.2±0.4 11.0±4.5 0.15±0.08
Fish (Cyprinus) 26-06-1999 <0.08 <0.08 2.30±0.04 12.3±2.4 0.22±0.09
Fish (Rutilus) 26-06-1999 <0.12 <0.14 2.31±0.24 9.8±2.0 0.64±0.03
Algae (Cladofila)
26-06-1999 51.0±1.7 14.2±0.8 69.5±2.4 390±20 4.35±0.17
Fish (Sevruga) 04-11-1999 0.17±0.07 <0.05 1.17±0.15 6.8±1.7 0.95±0.04
Fish (Russkyi Osyotr)
04-11-1999 <0.13 0.47±0.12 0.53±0.13 9.3±2.0 0.50±0.02
Caviar (Sevruga)
01-11-1999 48.4±2.1 6.1±0.5 1.29±0.26 16.5±3.6 0.10±0.02
Fish (Rutilus) 04-11-1999 <0.19 <0.20 3.03±0.22 0.48±0.02
[1] OREGIONI, B., GASTAUD, J., PHAM, M.K., POVINEC, P.P., Anthropogenic radionuclides in the Caspian Sea, Water Res. 30 (2003) 86-91.
[2] POVINEC, P.P., FROEHLICH, K., GASTAUD, J., OREGIONI, B., PAGAVA, S.V., PHAM, M.K., RUSETSKI, V., Distribution of 90Sr, 137Cs and 239,240Pu in Caspian Sea water and biota, Deep-Sea Res. II 50 (2003) 2835-2846.
[3] www.caspianenvironment.org.
365

EXTENDED SYNOPSIS IAEA-CN-118/16P
TOPIC: RADIOECOLOGY
1
Management of GIS Database and Multipurpose Customization of Computerized Models of the Contaminated Aquatic and Terrestrial Ecosystems
D. Gheorghiu, R. Margineanu, D. Slavnicu
National Institute for Physics and Nuclear Engineering IFIN-HH, Bucharest, Romania
E-mail address of main author: [email protected]
The experience of dealing with geographical and environmental data requests by different codes used for the assessment of radionuclide contamination and for the identifying the optimal remedial strategies for recovering the contaminated ecosystems conducted to the developing of an extended GIS database. This connects to the geographical features an Object Oriented database (OODB) comprising: population, land use, soil type and characteristics, hydrological networks (topologically defined, together with hydraulic parameters).
Two problems occurred during the process: - The Price/Quality balance of the data: was solved using data source issued by profile research Institutes and the data acquiring with variable scale having higher resolution in the nuclear risk zones; - The choice between Vector and Raster GIS data types: vector files were preferred, because these can be easily grid transformed. The figures below present parts of source Maps with attached database.
These GIS applications where used to extract, by SQL, necessary data for different environmental studies made in some projects:
þ
$
$
$
$$
$
$
$
$
$
$
$
$
$
$
Siret
Ciresu
Sarai u
Chi ciu
Harsova
Fetesti
Vladeni
Gropeni
Tandarei
PietreniCalaras i
Vadu Oii
Negureni
Cernavoda
Izvoarele
366

D. Gheorgiu et al.
2
EVANET-HYDRA Customisation of RODOS-Hydro [1] for Danube close to Romanian Cernavoda NPP:
Customization of MOIRA [2]: A model-based computerized system for management support for restoring radionuclide contaminated aquatic ecosystems and drainage areas. Using a common GIS database offers the possibility of intercomparison of simulated results of different models and codes.
[1] HELING, R., RASKOB, W., POPOV, A., ZHELEZNYAK, M., Overview of Hydrological Dispersion Module-HDM of RODOS, RODOS-WG4-TN (99) 18.
[2] MONTE, L., Analysis of models assessing the radionuclide migration from catchments to waterbodies, Health Phys. 70 (1996) 227-237.
Cs-137 bottom concentration along the Danube river. RIVTOX Module.
COASOTX module.
367

EXTENDED SYNOPSIS IAEA-CN-118/17P
TOPIC: RADIOECOLOGY
1
The Prognosis of Radioactive Contamination of an Environment of Belarus after Catastrophe on Chernobyl NPP
M. Germenchuk, O. Zhukova, E. Shagalova
The Republican Centre of Radiation Control and Environment Monitoring (RCREM), Minsk, Belarus
E-mail address of main author: [email protected]
On the 26th of April 1986 an accident at the 4th unit of the Chernobyl NPP took place. The accident became known to the whole world as a Chernobyl catastrophe. By its scale, by complexity of global problems stipulated by the accident, by long-term consequences it is the largest and the gravest catastrophe in the history of nuclear energy application.
After Chernobyl catastrophes the system of radiation monitoring of the environment in Belarus has ensured the collection and analysis of information about radioactive contamination of an atmospheric air, surface waters and territories. These results of radiation monitoring are used for an estimation of a radiation condition of an environment and prognosis in future [1].
The analysis of results of monitoring shows, that in the first period after catastrophe the maximum levels of an exposure gamma-rates in cities were fixed in Bragin (April 30, 1986). The results of monitoring show, that exposure gamma-rates decreases in a result of processes of natural radioactive decay and vertical migration of radionuclides in soil.
The results of monitoring of exposure gamma-rates allow to make the prognosis and to calculate a year, when exposure gamma-rates will be equal to levels before the catastrophe on ChNPP.
The numerical prognosis shows, that in Bragin town exposure gamma-rates will be equal to level before the catastrophe on ChNPP approximately after 65 years, in Slavgorod and Chechersk towns – after 23-24 years.
Due to use GIS the prognosis of restoring of the contaminated territories, contaminated by Cs-137 to 2016 and 2046 was obtained. The analysis of the evolution of area under contamination exceeding 37 kBq/m² for the period 1986 - 2046 shows:
• In 30 years (2016) the territory contaminated with levels in excess of 37 kBq/m² will be approximately 16%, i.e. a decrease with a factor 1,5 in comparison with 1986;
• In 60 years (2046) contaminated surface will be approximately 10 %, i.e. will decrease with a factor 2.4 [2].
The prognosis of radioactive contamination of soils by Am-241 in Belarus shows, that the high levels of contamination will be in 30-km to a zone Chernobyl NPP and on around
368

M. Germenchuk et al.
2
territories, where the population lives. Maximum volumes the activity of Am-241 will achieve to 2060 and will exceed activity of Pu-238,239,240 approximately in 2 times. Most 137Cs is located in the 0-5 cm layer of typical soils of Belarus [3, 4]. The radiological situation of the rivers in Belarus has stabilized. The average concentration of Cs-137 in the rivers for the period 1987-2001 has considerably decreased and are lower than Republican Permissible Levels for drink water. Decreasing of the radionuclide concentration is a result of radioactive decay [5].
[1] MATVEENKO, I.I., ZHUKOVA, O.M., GERMENCHUK, M.G., State and projection of the radiation on the territory of Belarus after Chernobyl accident, J. Radioanal. Nucl. Chem. 229 1-2 (1998) 19-21.
[2] SHAGALOVA, E., ZHUKOVA, O., GERMENCHUCK, M., MATVEENKO, I., BAKARIKOVA, Z.H., Dynamics of radiation situation on the territory of Belarus and migration of radionuclides in different types of soils after Chernobyl catastrophe, J. Radioanal. Nucl. Chem. 246 3 (2000) 521-525.
[3] SHAGALOVA, E.D., PAVLOTSKAYA, F.I., et al., Soil Science 10 (1986). [4] KULAKOVSKAYA, T.N. (Ed.), Soils of Belorussian, SSR, Minsk (1974). [5] ZHUKOVA, O., SHIRYAEVA, N., SHAGALOVA, E., Water migration of Chernobyl
radionuclides in rivers of Belarus, The Radioecology-Ecotoxicology of Continental and Estuarine Environments (Proc. Int. Congress, Aix-en-Provence, 3-7 Sept., 2001) EDP Sciences I (2002) C1-723-C1-728.
369

EXTENDED SYNOPSIS IAEA-CN-118/18P
TOPIC: RADIOECOLOGY
1
Concentration of 226Ra in Iranian Bottled Mineral Water
S. Hafezi, A. Attarilar
National Radiation Protection Department, Iranian Nuclear Regulatory Authority, P.O. Box 14155-4494, Tehran, Iran
E-mail address of main author: [email protected]
Naturally radioactivity in particular those emitting alpha particles, make the largest contribution to the world population exposure. The sources of these radionuclides initiated from the uranium and thorium decay series. 226Ra is one the most important radionuclides that comes through ground water to food chain [1].
In recent years the consumption of mineral water in many countries including IRAN has increased to a great extent. Therefore the 226Ra concentrations of different types of bottled mineral water were determined and the committed effective dose for adults is calculated [2].
In this work the concentration levels of 226Ra were measured in 42 samples related to 14 types of bottled natural mineral water commercially available in supermarkets.
The applied method for this measurement was emanation method with a minimum detection limit of 2 mBq L-1 [3]. For each experiment 3 bottles mineral water (each bottle contains 1.5 L) were used. After adjusting the pH below 2 by concentrated HCl, the Radium was co-precipitated with barium and lead as sulfate. The precipitation was dissolved in alkaline EDTA (C10H14N2O8.2H2O) and placed in 20 mL bubbler. The nitrogen gas with a purity of 99.99% was passed through the bubbler to remove any existing of 222Rn before the ingrowth. The bubbler was sealed and stored for 21 days at 5oC for ingrowth of 222Rn. for calculation the committed effective dose for adults from drinking 40 l a-1 of bottled mineral water the ingestion dose conversion coefficients from the IAEA publications is used [4].
Concentration of 226Ra ranged from 2.0 to 12.3 mBq L-1. In one case 12.3 mBq L-1 was measured, which provides 0.138 µSv committed effective dose for adults in the case of consumption rate of 40 L a-1. As it is shown in Fig. 1 in 61.5% of the investigated bottled water the concentration levels were between 2–10 mBq L-1, in 23% less than 2 mBq L-1 and in 15.5% more than 10 mBq L-1 was found.
370

S. Hafezi and A. Attarilar
2
FIG. 1. Distribution of different kinds of bottled mineral water with respect to their 226Ra concentration.
[1] SOHRABI, M., MIRZAEE, H., BEITOLLAHI, M., HAFEZI, S., A national program for the determination of 226Ra in public water supplies of Iran (1993).
[2] SOMLAI, J., HORVATH, G., KANYAR, B., KOVACS, T., BODROGI, E., KAVASI, N., Concentration of 226Ra in Hungarian bottled mineral water, J. Environ. Radioact. 62 (2002) 235-240.
[3] GOLDIN, A.S., Determination of dissolved radium, Anal. Chem. 331 (1961) 406-409 [4] BASIC SAFETY STANDARDS 115 (1995).
< 2 2 3 %
2 - 1 06 1 .5 %
> 1 01 5 .5 %
371

EXTENDED SYNOPSIS IAEA-CN-118/19P
TOPIC: RADIOECOLOGY
1
Oil Industry and the Problems with Radioactive Pollution on Absheron Peninsula
A. B. Huseynov
Director of the Integrated Plant with Special Assignment “IZOTOP”, Baku, Azerbaijan
E-mail address of main author: [email protected]
The concept of “Sustainable development” accepted by the international community as a basis of co-operation among countries envisages the necessity of rational national resource management that will minimize the damage to the future generations. As a fundamental guide towards this goal, a document identifying the principles of the global environmental security –“Agenda 21 century”- was approved by the majority of states at the 1992 Conference held in Rio-De-Janeiro. Based on the principles of Agenda-21 century, Azerbaijan developed its National Environmental Concept, and passed a number of laws in support of environmental protection and sustainable development. At this stage of the country’s development, the issue of national resource management is of paramount importance for the nation. The disastrous environmental situation inherited from the former Soviet Union is affecting every aspect of the country’s life and presenting a clear threat to the health and well-being of the population.
Considering the problem with the radioactive contamination and radioactive wastes we have to identify the primary reason of it existence on the territory of Azerbaijan, and particularly Apsheron Peninsula. The main contributor to intensive environment pollution is the technogenic and industrial wastes.
As the sea is highly polluted during the oil extraction process therefore starting from 1970s the government forbade the discharge of them into the sea. It was decided to transfer them to the seaside and either utilize them or bury. But due to the some difficulties, i.e. high transport costs, storms on the sea, poor reporting it was not implemented or implemented on the very low level. Therefore this continued to be the case.
Oil bearing sand, oil pool water, drilling slurry, drilling fluid, and chemicals used in the process of exploration and drilling are causing great damage to Caspian flora and fauna. High volumes of drilling slurry produced during the process of exploration and development should receive preliminary treatment before its discharged to remove chemical reagents and hydrocarbons. In affected areas, concentration of slurry in sea water range from 1.5 to 2.9 gram per liter – lethal to water organisms. The safe concentration of drilling slurry for Caspian fauna species is in the range of 0.3 to 0.4 grams per liter.
Geological researches done by the scientists from different countries, particularly the report prepared by the Ministry of Geology after radiological monitoring of Apsheron Peninsula revealed that oil extraction is in linear relationship with radiological danger which is growing as far as oil field development and oil extraction become active and long term.
372

A. Huseynov
2
Till the recent times there was no serious attention to the existence of high radiation phone in oil fields’ area. The cause of it is that together with oil the water containing radioactive radium is extracted on the surface.
As we stated before one of the main contributor to the environmental pollution in our case were the enterprises involved in oil extraction. It started from World War II when the high demand in oil extraction and poor knowledge in radiochemistry and radiology caused the wide range of pollution of the territory of Azerbaijan. Technical processes of oil refining and oil extraction have never been studied from radio ecological point of view. The serious ecological problems in conjunction with oil extraction are accumulated in Absheron peninsula. This contamination has also been supported by chemical reagents which accelerated its backing up on the pipes. The problem become severe in case of offshore exploration and production, as the water discharged during this process are full of radionuclides and other toxic substances, poured directly into the sea and its decontamination is impossible.
During gamma logging of Absheron peninsula’s oil wells on different levels scientists detected the radioactive anomalies with the activity of 100-1000 microentgen/hour. The analysis of single core samples from the anomaly territories showed the high concentration of natural radionuclides in the soil, such as uranium, thorium, etc. Actually these places become biologically “dead” zones. There is a special threshold of the radioactive saturation of the soil – this effect is well known to the specialists. Sooner or later the quantified changes will transfer into quality change and it might be irrevocable. Caspian region seems to be on the edge of that saturation and if not to take the urgent steps now, tomorrow might be too late.
Up to now there are not worked out the methodology of physiochemical basis of technological processes and equipment for carrying out the works on decontamination of polluted territories of oil fields. Tens hectares of lands polluted by natural radioactive materials of anthropogenic origin are due to recultivation and rehabilitation. About 100 th.m3 lands polluted with radioactive wastes, being formed at the result of functioning of oil extracting and oil-chemical enterprises are due to decontamination, utilization and burial.
The situation became worse because the equipment as the result of wear and tear, and obsolescence of equipments, not following the technological discipline, absence or malfunctioning of refining systems the amount of radioactive pollution is steadily growing.
Sharp discharges of the products of oil extraction, oil refinery and petrochemical industry as the result of the damages of old equipment might cause the technogenic disasters both onshore and offshore.
Finally, signing and complying with international environmental standards and conventions are important pre-requisites for Azeris international profile. Access to a clean and safe environment is an important human right in democratic societies. Azeris efforts to remedy environmental damages of the past, introduce a transparent and efficient system of environmental management and participate in key international agreements will contribute positively to the country's international reputation.
373

EXTENDED SYNOPSIS IAEA-CN-118/20P
TOPIC: RADIOECOLOGY
1
The Annual Variation of U-238 Concentration and 234U/238U, 235U/238U Ratios in Greek Rivers
K. Kehagia, S. Bratakos, V. Koukouliou, C. Potiriadis
GAEG, Environmental Radioactivity Monitoring Dept., Athens, Greece
E-mail address of main author: [email protected]
In the framework of the environmental radioactivity monitoring in the country, systematic measurements are performed in river waters. Moreover and because of Uranium mining activities performed in the past close to the northern Greek borders, measurements of the concentration of Uranium isotopes are included in the measured parameters. In addition to that, the non-existence of Depleted Uranium (DU) in these rivers is verified, since an awareness of the Greek population exists as a consequence of the Kosovo conflict.
More specifically, a set of measurements of 238U, 234U and 235U has been performed on a monthly basis, during the last three years, for the four rivers crossing the Greek northern borders (Table 1). The water samples, collected always at the same sampling points, were measured by means of a-spectroscopic analysis after appropriate radioanalytical treatment. The source preparation was done by electrodeposition. The identification of existence of DU is based on the determination of the concentration ratios 235U/238U and 234U/238U.
Since the ratio 235U/238U cannot be influenced by any physical or chemical process in nature, it is expected to be constant and independent of the origin of the sample. Any statistically significant difference from the natural ratio must be attributed to anthropogenic activities (e.g. DU). However, many measurement uncertainties exist due to the low activity concentration of the 235U in samples containing Natural Uranium, in relation to the activity concentration of the 238U. For this reason the variation of 234U/238U is used complementary as an indicator of the existence of DU.
The 238U concentration in the river waters is relatively constant for each river, lying between (15.12 - 86.04) mBq/l or (1.22-7.03) µg/l, within the range of the values found in [1-3], with the exception of slightly increased concentration at the Strymonas river for the year 2003 (Table 2). The determined 235U/238U ratio in this work was 0.048±0.020, indicating as expected the above mentioned high uncertainty. As it concerns the concentration ratio of 234U/238U, the observed values in the present study are between 1.09-1.32, lying in the range of 0.8-10 as it is reported in [4] for natural waters.
In conclusion, systematic measurements in Greek rivers indicate that the 238U concentration is in the natural range. Moreover, no DU contamination has been identified.
374

K. Kehagia et al.
2
TABLE I. GENERAL INFORMATION ABOUT THE RIVERS UNDER EXAMINATION
River Area (ha) Location Flows from
Nestos 21.930 East Macedonian and Thrace, between Xanthi and Kavala
Bulgaria
Axios 11,808 North Greece, 20km southwest of Thessaloniki
FYROM
Ardas-tributary of Evros
9.267 Trace-border with Turkey, 15km west site of Alexandroupolis
Bulgaria
Strymonas 1.500 Central Macedonian, near the city Serres Bulgaria
TABLE II. AVERAGE CONCENTRATION OF 238U MEASUREMENTS IN 4 GREEK RIVERS
Year River Average Activity 238U (mBq/l)
Range of 238U activity (mBq/l)
234U/238U (mBq/mBq) (range)
2001 Nestos 49.40 27.54-78.66 1.10-1.19 2002 Nestos 30.65 12.34-52.33 1.09-1.27 2003 Nestos 40.89 17.85-61.12 1.10-1.18 2001 Axios 17.05 7.41-25.15 1.07-1.35 2002 Axios 15.12 8.04-23.89 1.15-1.43 2003 Axios 17.08 11.51-27.11 1.16-1.55 2001 Strymonas 37.10 19.04-52.41 1.00-1.15 2002 Strymonas 27.58 17.40-46.22 1.04-1.23 2003 Strymonas 86.04 19.68-340.00 1.00-1.20 2001 Ardas 13.44 8.65-20.05 1.16-1.37 2002 Ardas 14.40 12.49-17.04 1.16-1.40 2003 Ardas 15.78 12.75-19.03 1.22-1.42
[1] HESKETH, G.E., Natural Radioactivity in water, J. Soc. Radiol. Prot. 2 3 (1982) 11-14. [2] WANG, J.J., CHU, T.C., Radioactive Disequilibrium of Uranium and Thorium Nuclide
Series in Hot Spring and River Water from Peitou Hot Spring Bain in Taipei, J. Nucl. Radiochem. Sci. 1 1 (2000) 5-10.
[3] RAY, S.B., MOHANTI, M., SOMAYAJULU, B.L.K., Uranium Isotopes in the Mahanadi River-Estuarine System, India, Est. Coast. Shelf Sci. 40 (1995) 635-645.
[4] GOLDSTEIN, S.J., RODRIGUEZ, J.M., LUJAN, N., Measurement and Application of Uranium Isotopes for Human and Environmental Monitoring, Health Phys. 72 1 (1997) 10-18.
375

EXTENDED SYNOPSIS IAEA-CN-118/21P
TOPIC: RADIOECOLOGY
1
Field Study of Sedimentation and Radionuclide Pollution of the Black Sea
N. V. Yesin, R. D. Kos’yan
The Southern Branch of the P.P. Shirshov Institute of Oceanology, Russian Academy of Sciences, Gelendzhik-7, 353467, Russian Federation
E-mail address of main author: [email protected]
The Black Sea is a unique semiclosed basin with a great surplus of fresh water, which flows, in the end, to the Marmora Sea through the Bosphorus. In Pleistocene-Holocene, when the level of the World ocean oscillated with the amplitude of 120 meters, regressive level of the Black Sea depended on the depth of the Bosphorus strait, and it was always higher than that of the World ocean. Surplus of the fresh water promoted the sea water freshening during regressions. Sea salting took place during transgressions as a result of forming of countercurrents in the strait. Periodic changes of sea water salinity and peculiarities of sedimentation in the Bosphorus strait promoted in Pleistocene the formation of alternated layers of coccolites and sapropels in a deep basin of the sea.
In view of great difficulties caused of varied conditions of sedimentation mechanism of terrigenic material transport to the sea abyssal in different stages of transgression and regression has not been completely studied till today, there are still no comprehensive data about the rate of sedimentation.
Research, fulfilled in expeditions within the project RER/2/003 by IAEA, afforded not only to study the process of the Black Sea bottom pollution by radionuclides after the nuclear weapon test in atmosphere and Chernobyl accident, but to obtain information concerning to the principal regularities of sedimentation. In this report the following questions are discussed: transport of radionuclides and their settling to the bottom: peculiarities of sedimentation within the abyssal plain, shelf and continental slope; modern rates of sedimentation according to the results of expeditions in 1998 and 2000.
The weight of solid particles in the upper sedimentary layer is 0.1 g. If we take into account density of water which fills the main volume of sample, then density of suspended matter is somewhat less (1.1 g/cm3). The upper layer of the core is not a sediment yet, but it is a suspension flowing down the sea bottom. At the depth of 5 cm the weight of dry sediment in 1 cm3 increases to 0.3 g/cm3, and density of suspension, roughly to 1.28 g/cm3, and this indicates the initial stage of the litification process.
When the depth becomes larger pressing of water from the sediment takes place under the pressure of upper layers and the decrease of sediment volume happens. As if sediment compression occurs with the simultaneous increase of its density. Thus, for instance, layer of sediment 1 cm thick, when it sinks down larger depth in the sedimentary strata, becomes thinner and the rate of sedimentation decreases. Therefore it is more expedient rate of sedimentation consider as the amount of solid sediment settling during the time unit for 1 cm2 of the sea bottom area.
376

N. Yesin and R. Kos'yan.
2
It seems to be possible to estimate a degree of compression of the upper sedimentary layer on the data of cores. As it is found, at the depth of 40 cm density of sediment increased in 1,08 times, as compared with the upper layer, 0.08 g/cm3, and this points to an inconsiderable compression.
Available to the authors core material, 4/5 m long, sampled at the depth of 1935 m within the Russian section of the Black Sea, afforded to calculate maximum possible density of dry sediment. It turned to be from 2.6 to 3.1 g/cm3 depending on mineral composition. Thus, the upper layer of sediment with density being 1.2 g/cm3 in the moment of litification will be compressed from 2.2 to 2.6 times when the depth becomes greater. To compare modern rates of sedimentation and ancient ones it is necessary to enlarge the thickness of the ancient layer for 2.6 times depending on the depth.
We can estimate a mean rate of sedimentation on the shelf of the above mentioned region in Holocene. An average velocity of the Black Sea level rise was 6 mm/year (120 meters for 20 thousand years). Therefore, at the depth of basic bottom being 60 m (modern), sea level was 10 thousand years later than the beginning of the transgression, and a process of sedimentation began here when the sea level rose for 20 m more, i.e. 3.3 thousand years later (20000 mm: 6 mm/year). Thus, the duration of sedimentation at this shelf section is 20 thousand years – 10 thousand years – 3/3 thousand years = 6.7 thousand years. During this period a sedimentary layer, 8 m thick, was formed here. Hence, a mean rate of sedimentation in Holocene was 8000 mm: 6700 years = 1.2 mm/year. But a modern rate, estimated on the data of RER/2/003 project, is from 4.5 to 5.5 mm/year (at the different sections of the shelf). If we take into consideration a coefficient of compression being 2.2. then we get the velocity of the bottom rise 7.3 years ago being 1.2 mm/year x 2.2 = 2.6 mm/year. This value of a mean rate of sedimentation is comparable with the modern rate of sedimentation. (With regard for the fact that a va lue, taken as a basis of calculation, is not quite precise one. At the same time, there are grounds to conclude that during the last century rate of sedimentation at the given section increased. It may be explained by the intensification of the economic activity on the shore, increase of the land erosion and coast abrasion, increase of solid run-off and of rivers and piped drainage systems.
In conclusion it is possible to note, that the results of research within the RER/2/003 project afforded to reveal peculiarities of sedimentation process on the shelf, continental slope and abyssal plain. They show the presence of suspension flows everywhere on the shelf and continental slope.
377

EXTENDED SYNOPSIS IAEA-CN-118/22P
TOPIC: RADIOECOLOGY
1
Plutonium in Components of the Techa - Ob River Ecosystem
I. I. Kryshev, A. I. Kryshev
Scientific and Production Association "Typhoon", Obninsk, Russian Federation
E-mail address of main author: [email protected]
Data of observations on the 239,240Pu content in components of the Techa River ecosystem were generalized, including activity concentrations of plutonium in water, bottom sediments, fish, floodplain soil and vegetation (Table I) [1-6]. Distribution of plutonium in the Techa ecosystem is not uniform. The highest activity concentrations of this radionuclide were observed at the upstream part of the Techa River. Floodplain of the upper river is major source of intake of radionuclides, as a result of wash-off of radionuclides from the floodplain soil and bottom sediments. Activity concentrations of 239,240Pu in the Techa floodplain are maximum near the river-bed and decrease close to the background levels at the bounds of overflow. Activity concentrations of 239,240Pu in floodplain soil (layer 0–20 cm) at the upstream part of the Techa River vary within the range 2–3300 Bq/kg d.w. Plutonium concentrations in floodplain soil at the middle and downstream parts of the Techa River are 10 and 30 times lower, correspondingly, than those at the upstream part; at the same time they remain higher than the regional background level. Activity concentrations of plutonium in floodplain soil and bottom sediments of the Iset and Tobol Rivers (500–700 km from the upper Techa River) are close to the background level.
TABLE I. ACTIVITY CONCENTRATIONS OF 239,240Pu IN COMPONENTS OF THE TECHA RIVER ECOSYSTEM (1990–1995), Bq/kg Component Upstream part
(0-40 km) Middle part (40-120 km)
Downstream part (120-200 km)
Water 0.03 ± 0.02 (N=17)
0.009 ± 0.006 (N=8)
0.004 ± 0.003 (N=7)
Bottom sediments 290 ± 270 (N=32)
49 ± 41 (N=10)
1.8 ± 1.3 (N=10)
Aquatic plants 15 ± 2* 3.8 ± 0.2* 0.35 ± 0.04* Fish 0.026 ± 0.003* 0.008 ± 0.002* Floodplain soil 310 (2-3300)
(N=160) 29 (2-319)
(N=56) 9 ± 8
(N=38) Grass 62 ± 57
(N=9) 5.2 ± 1.8 (N=6)
1.1 ± 0.3*
* Data of single measurement
Activity concentration in bottom sediments, floodplain soil and grass are given in Bq/kg dry weight, in fish – in Bq/kg wet weight. Plutonium content in bottom sediments, water and river biota decrease with a distance from the river head (dam of the technical water-body 11). Accumulation factor of 239,240Pu in bottom sediments at upstream part of Techa is equal to 10000, whereas at middle part it is
378

I Kryshev and A. Kryshev
2
equal to 5000. Activity concentrations of 239,240Pu in water is considerably (20–140 times) lower than the current permissible level 0.56 Bq/kg. Among the samples of river biota grass and aquatic plants have maximum content of plutonium. Two variants of estimation of the 239,240Pu conributions to dose to the river biota are presented in Table II: absorbed dose (a-particles were assumed to be totally absorbed within the organisms); and hypothetical analogue of equivalent dose evaluated with radiation weighting factor for a-particles wr=20. TABLE II. CONTRIBUTION OF 239,240Pu TO DOSE TO BIOTA OF THE TECHA RIVER (1990–1995), mGy/YEAR
Organisms Upstream part Middle part Downstream part Fish 0.00068 (0.0136)* 0.0002 (0.004) Aquatic plants 0.078 (1.56) 0.019 (0.38) 0.0018 (0.036) Grass 0.48 (9.6) 0.04 (0.8) 0.0086 (0.172)
*Assessments of exposure with wr=20 for for α-radiation are given in brackets. According to [7], internal doses to the Techa fish and aquatic plants from 90Sr and 137Cs in 1992 varied in range 1–10 mGy/year, which were considerably higher than the absorbed doses from plutonium. However, role of plutonium in exposure to vegetation in the upstream part of the Techa River become noticable if we use in calculations the radiation weighting factor wr=20 for for α-particles. This work has been performed within the framework of ISTC Project 2558. Authors are grateful to ISTC for support of this study.
[1] MARTYUSHOV, V.V., SPIRIN, D.A., BAZYLEV, V.V., et al., Radioecological aspects of behavior of long-lived radionuclides in floodplain landscapes of the upstream parts of the Techa River, Ekologia 5 (1997) 361-368 (in Russian).
[2] KRYSHEV, I.I. (Ed.), Environmental Risk Analysis for the Ural Radioactive Pattern, Moscow, Russian Nuclear Society (1997) 210 pp.
[3] NORWEGIAN RADIATION PROTECTION AUTHORITY, Sources contributing to radioactive contamination of the Techa river and areas surrounding the MAYAK Production Association, Urals, Russia (1997).
[4] TRAPEZNIKOV, A.V., POZOLOTINA, V.N., YUSHKOV, P.I., et al., Study of radioecological situation in the Techa and Iset Rivers contaminated with the discharges from PA “Mayak” (1999) 2 20-66 (in Russian).
[5] ILYIN, L.A., GUBANOV, V.A. (Eds), Major radiation accidents: their consequences and protection measures, Moscow, IzdAT (2001) 752 pp.
[6] AKLEEV, A.V., KISSELYOV, M.F., Medical-Biological and Ecological Impacts of Radioactive Contamination of the Techa River, Chelyabinsk, Urals Research Center for Radiation Medicine (2002) 88-92.
[7] KRYSHEV, I.I., ROMANOV, G.N., CHUMICHEV, V.B., et al., Radioecological Consequences of Radioactive Discharges into the Techa River on the Southern Urals, J. Environ. Radioact. 38 2 (1998) 195-209.
379

EXTENDED SYNOPSIS IAEA-CN-118/23P
TOPIC: RADIOECOLOGY
1
Mass Accumulation Rates and Fallout Radionuclides 210Pb, 137Cs and 241Am Inventories Determined in Radiometrically Dated Abyssal Sediments of the Black Sea
G. V. Laptyeva, O. V. Voitsekhovitcha, A. B. Kostezha, I. Osvathb
a Ukrainian Institute for Hydrometeorology (UHMI), Kiev, Ukraine
bIAEA Marine Environment Laboratory (MEL), Monaco
E-mail address of main author: [email protected]
Five abyssal (deep-sea) sediment cores collected during the two international cruises on R/V “Professor Vodyanitskiy” (RADEUX-1998 and RADEUX-2000) in the framework of the Regional Technical Co-operation Project RER/2/003 “Marine Environmental Assessment in the Black Sea Region” were subjected to detailed radiometric analysis. The sediments were dated using the radionuclides 210Pb, 137Cs and 241Am and the results used to calculate a number of key parameters, e.g. radionuclide inventories, fluxes and sediment accumulation rates (Table I).
The sediment cores were collected using a MARK II-400 multi-corer (Bowers & Connelly) in both Western and Eastern sub-basins of the Black Sea. The cores were sliced on board with a resolution of 0.2 – 0.4 cm for the top 5 cm and 1-5 cm downward using an extruder that was specially designed to prevent loss of the uppermost fluff-layer, possible down-smearing and interlayer cross-contamination of the sediment. Dry bulk density (DBD) and cumulative dry mass (CDM) were calculated on a salt-free basis using direct determination of the salt contribution to the dry mass of the sediment. Calculations showed that in the near surface sediments, and particularly in the top fluff-layer, the salt dissolved in pore-water contributed up to 30-60% of the mass of dried sediments. Neglecting this correction could cause an erroneous interpretation of the 210Pb activity profile, resulting in overestimation of both the average sedimentation rate and its recent temporal changes.
Sediment samples were analysed for 210Pb, 226Ra, 137Cs and 241Am by direct gamma assay in UHMI after 3 weeks equilibration in hermetically sealed plastic holders, using an EG&G Ortec (Ametek) HPGe GWL series well-type coaxial low background intrinsic germanium detector [1]. Correction was made for the effect of self-absorption of low energy γ-rays within the sample using attenuation parameters determined in [2].
Chronostratigraphical analysis of the data and sediment age calculation have been carried out by application of CRS and CIC dating models [3] to unsupported 210Pb activity profiles which were calculated by subtracting 226Ra activity from the total 210Pb.
The results obtained suggest that the recent deposition history of the deep-sea sediments (last 100-150 years) is recorded in the upper 10 cm, which corresponds to the 226Ra-210Pb equilibrium depth. There were no statistically significant changes in the mass accumulation rates (MAR) over the last century, which ranged between 35-85 g m-2 y-1 at various sites.137Cs and 241Am activity profiles showed well resolved peaks for both bomb test and Chernobyl
380

G. Laptyev at al.
2
fallout, with the two maxima in activity corroborating that these deep-sea sediments are not being affected either by bioturbation or mechanical mixing. For the first time in a post-Chernobyl study 241Am records were detected in the upper sediments, revealing a previously underestimated impact of the nuclear fuel component of the Chernobyl fallout on the Black Sea [4]. The 241Am inventory almost doubled in both the western and eastern sectors of the sea after Chernobyl, from 8-10 Bq m-2, to 16-17 Bq m-2 by the year 2000. Taking into account the ingrowth of 241Am due to the decay of its parent radionuclide 241Pu, a further double increase of the 241Am inventory in the following 60 years can be expected.
The increase of the 137Cs inventory in Black Sea sediment after Chernobyl was up to 300-600 Bq m-2. Comparing the results of 210Pb chronology, 137Cs total inventory and the relative position of peaks within the sediment cores in the present and previous studies [5, 6] yields an estimate of 3 to 6 years for the time required by particles carrying radionuclides to sink from the sea surface to the bottom (~2000 m).
TABLE I. MAR, 210Pb FLUX AND RADIONUCLIDE INVENTORIES IN THE BLACK SEA BOTTOM SEDIMENT CORES
Radionuclide inventory, Bq m-2 Core Depth,
m MAR,
g m-2 y-1
210Pb Flux, Bq m-2 y-1 210Pb 137Cs 241Am
BS98-15 1375 41 142 ± 3 4570 ± 109 192 ± 7 8.6 ± 1.0
BS2K-4 2147 35 177 ± 3 5690 ± 88 303 ± 6 10.9 ± 0.9
BS2K-11 1892 83 225 ± 3 7230 ± 106 598 ± 13 9.7 ± 1.1
BS2K-23 2168 41 173 ± 3 5543 ± 93 517 ± 12 16.1 ± 1.8
BS2K-37 2008 45 239 ± 4 7666 ± 125 610 ± 16 19.0 ± 1.1
ACKNOWLEDGEMENT
The results presented have been obtained in the framework of the IAEA Regional Technical Co-operation Project REP/2/003 “Marine Environmental Assessment in the Black Sea Region”. We are also very grateful to Prof. Peter G Appleby, Director of the University of Liverpool ERRC, for valuable discussions on 210Pb dating techniques.
[1] APPLEBY, P.G., NOLAN, P.J., GIFFORD, D.W., GODFREY, M.J., OLDFIELD, F., ANDERSON, N.J., BATTARBEE, R.W., 210Pb dating by low background gamma counting, Hydrobiologia 141 (1986) 21-27.
[2] APPLEBY, P.G., RICHARDSON, N., NOLAN, P.J., Self-absorption corrections for well-type germanium detectors, Nucl. Inst. Meth. B 71 (1992) 228-233.
[3] APPLEBY, P.G., OLDFIELD, F., The calculation of 210Pb dates assuming a constant rate of supply of unsupported 210Pb to the sediment, Catena 5 (1978) 1-8.
[4] BUESSELER, K.O., LIVINGSTON, H.D., "Natural and man-made radionuclides in the Black Sea", Radionuclides in the ocean: inputs and inventories, France, IPSN, Editions de Physique (1996) 199–217.
[5] BUESSELER, K.O., BENITEZ, C.R., Determination of mass accumulation rates and sediment radionuclide inventories in the deep Black Sea, Deep-Sea Res. I 41 11/12 (1994) 1605–1615.
[6] GULIN, S.B., Recent changes of biogenic carbonate deposition in anoxic sediments of the Black Sea: sedimentary record and climatic implication, Mar. Environ. Res. 49 (2000) 319-328.
381

EXTENDED SYNOPSIS IAEA-CN-118/24P
TOPIC: RADIOECOLOGY
1
137Cs Activity in the Persian Gulf (2000)
A. Mesineh Asl, J. Amidi, M. Esmaili Gheshlaghi
National Radiation Protection Department (NRPD), Tehran, Iran
E-mail address of main author: [email protected]
Concentration 137Cs in the water and sediments of the Persian Gulf have been determined using gamma spectrometry in cruise of ROPME (Regional Organization for the Protection of the Marine Environment) .The cruise has been conducted from 15 August-1 September, 2000.
Water samples were filtered through a membrane filter and dissolved 137 Cs in water were extracted the sorbent Anfezh procedure [1]. The sediments were dried at constant temperature of 105 ºC and sealed in 300 g. plastic container geometry.
A 20% p-type HPGe detector was used for radioactivity measurement. The detector was situated in a well containing 5-cm thick lead, to shield the measuring station against background radioactivity. Standard nuclear electronic spectrometry set were used and the spectra were stored for analysis in 4096 channels .A data collection period of 100,000 s was sufficient to provide good statistics. Background spectra were also collected for the same period of time. System calibration has been performed by IAEA reference materials [2].
Concentration 137 Cs in sediments (Bq.kg-1) and water (Bq.m-3) in 25 stations in the Persian Gulf are given in Table I. 137 Cs concentration in water samples were ranged between 1.20-3.20 Bq.m-3. The determination of 137Cs in sediment samples showed a level between minimum detectable activity (MDA)-5 Bq.kg-1 dry. MDA for gamma spectrometry system was 1.10 Bq.kg-1 dry. Maximum 137Cs concentrations were found at a depth of about 33m.
Radioactivity monitoring in the Persian Gulf can establish the concentration levels of radiocesium in marine ecosystem and their capacity to self-purification.
382

A. Mesineh Asl et al.
2
[1] VOLPE, A., Field Test of the IMEEDS Radionuclide Sampling System, UCRLID1913 (1998).
[2] AMIDI, J., Calibration of gamma spectrometer with HPGe detector, INRA-NRPD technical report, Tehran (1998).
TABLE I. 137Cs CONCENTRATIONS IN DRIED SEDIMENTS (Bq.kg-1) AND WATER (Ba.Mm3) IN THE PERSIAN GULF (AUG.-SEPT. 2000)
Station Latitude (N)
Longitude (E)
Depth (m)
Sediment (Bq.kg-1)*
Water (Bq.m-3)
station 1 26o 18' 57o 02' 14 2.57 ± 0.50 2.00± 0.38
station 2 26o 52' 56o 54' 17 2.42 ± 0.50 1.90 ± 0.36 station 3 26o 13' 56o 47' 40 <MDA+ 1.80 ± 0.36 station 4 26o 41' 56o 11' 40 - 1.30 ± 0.34
station 5 26o 51' 56o 10' 40 - 1.75 ± 0.36 station 6 26o 30' 55o 36' 30 2.32 ± 0.50 2.25 ± 0.30
station 7 25o 57' 55o 09' 78 - 2.25 ± 0.30 station 8 26o 21' 54o 59' 38 2.60 ± 0.40 2.15 ± 0.30
station 9 25o 47' 54o 36' 60 <MDA 1.32 ± 0.30 station 10 26o 20' 53o 56' 30 - 1.42 ± 0.30
station 11 26o36' 53o 24' 40 - 1.25 ± 0.35 station 12 26o04' 53o 18' 74 - 1.70 ± 0.30
station 13 26o06' 52o 34' 60 - 1.80 ± 0.30 station 14 26o47' 52o 56' 36 - 2.20 ± 0.40
station 15 27o07' 52o 34' 40 - 1.80 ± 0.34 station 16 26o47' 52o 09' 65 - 1.60 ± 0.30
station 17 27o07' 51o 31' 78 - 1.65 ± 0.30 station 18 27o30' 51o 11' 72 2.45 ± 0.60 1.20 ± 0.35 station 19 27o38' 50o 36' 40 - 1.40 ± 0.30
station 20 27o33' 50o 59' 33 4.70 ± 0.60 2.15 ± 0.40 station 21 28o21' 50o 44' 23 2.60 ± 0.40 1.70 ± 0.35
station 22 28o01' 50o 08' 57 - 1.95 ± 0.30 station 23 28o56' 49o 38' 47 - 1.15 ± 0.35
station 24 29o45' 49o 25' 20 - 2.10 ± 0.37 station 25 29o25' 48o 41' 13 - 3.20 ± 0.50 *Uncertainty at one sigma of the counting error. + Minimum Detection Activity(MDA)= 1.10 Bq.kg –1 (dry samples).
383

EXTENDED SYNOPSIS IAEA-CN-118/25P
TOPIC: RADIOECOLOGY
1
137Cs Concentrations in the Water and Sediments of the Caspian Sea (1999-2003)
A. Mesineh Asl, J. Amidi, M. Esmaili Gheshlaghi
National Radiation Protection Department (NRPD), Tehran, Iran
E-mail address of main author: [email protected]
Samples of the sediments and water have been collected from Iranian costal region of the Caspian Sea in 5 consecutive years. The samples were processed in the laboratory for determining of 137Cs concentrations which is radioecologically significant. Sampling locations are shown in Fig. 1.
The sediments were dried at constant temperature, the seawater samples were filtered through a membrane filter (Millipore HA, 0.45µm pore size). Dissolved 137Cs in seawater were extracted with two procedures including ammonium phosphomolybdate(AMP) and the sorbent Anfezh from 20-100 liters of seawater samples[1, 2].
137Cs concentrations in sediments and prepared water samples were determined directly by using a shielded coaxial high pure germanium(HPGe) detector with an energy resolution of 2 keV
At energy of 1332 keV and relative efficiency of 20% coupled to an integrated signal processor and multichannel analyzer (MCA) and PC via an interface. Energy and efficiency calibration of the gamma spectrometer were performed using IAEA reference materials [3]. The counting time for each samples as well as the background were fixed to 100,000 seconds.
Mean 137Cs activity in the water and the sediments of the Caspian Sea for the depth of 0-20, 0-50 and 0-100 m are summarized in Table I. The determination of 137Cs in seawater samples showed a level between 3-9 Bq.m-3 and recent analyses on sediment showed concentrations between 12-60 Bq.kg-1 dry.
Establishment radioactivity monitoring in the Iranian region of Caspian Sea, for measurements of the concentration levels of radionuclides in marine ecosystem is important in the environmental quality state and human health, mainly after nuclear accidents.
384

A. Mesineh Asl et al.
2
FIG. 1. Sampling site location in the Caspian Sea Stations.
[1] Organized at the CEKMECE Nuclear Research and Training Center, Turkey (1994). [2] VOLPE, A. Field Test of the IMEEDS Radionuclide Sampling System, UCRLID1913
(1998). [3] AMIDI, J., Calibration of gamma spectrometer with HPGe detector, INRA-NRPD
technical report, Tehran (1998).
TABLE I. MEAN 137Cs CONCENTRATION IN DRIED SEDIMENTS (Bq.kg-1) AND WATER (Bq.m-3) IN THE CASPIAN SEA (1999-2003)
Place Station
Latitude (N)
Longitude (E)
Depth (m)
Sediment ( Bq.kg-1)*
Water (Bq.m-3)
38o 23' 49o 01' 20 58.50 ± 11.00 7.40 ± 1.90 Astara Station 1 38o 17' 49o 10' 100 12.20 ± 3.00 7.85 ± 1.80
37o 34' 49o 32' 50 21.90 ± 4.80 6.30 ± 1.60 Anzali Station 2 37o 33' 49o 34' 100 19.40 ± 4.50 7.45 ± 1.80
Ramsar Station 3 37o 00' 50o 42' 50 28.60 ± 5.75 4.75 ± 1.25
36o 43' 51o 30' 50 32.60 ± 6.80 5.25 ± 1.30 Noshahr Station 4 36o 46' 51o 30' 100 52.60 ± 10.00 8.80 ± 1.75
Babolsar Station 5 36o 48' 52o 41' 50 34.80 ± 8.00 6.60 ± 1.60
Amir abad Station 6 37o 00' 53o 16' 50 59.20 ± 10.00 5.50 ± 1.40
BandarTorkaman Station 7 36o 38' 53o 38' 20 20.60 ± 4.80 2.70 ± 1.30
385

EXTENDED SYNOPSIS IAEA-CN-118/26P
TOPIC: RADIOECOLOGY
1
The Affectivity of Applying New Isotope Methods and Radiation Biogeocenology in Defining the Migration and Space Allocation of Radionuclides
U. M. Mirsaidov, I. Sh. Normatov
Institute of Water Problems, Hydroenergetics and Ecology, AS Republic of Tajikistan
E-mail address of main author: [email protected]
Syrdarya River is one of the two greatest rivers of Central Asia. Over 20 ml people live on its banks. Their lives and development have been depending on the river water for many hundred years already. Intensive working out of mineral deposits while extracting the uranium concentrates with imperfect schemes of their processing (refining) was accompanied by waste accumulation. The great number of those waste depositories and refuses were placed to the benefit of doubtful economic interests in the valleys, channels and riverbeds of tributaries running into Syrdarya River.
In the town of Mailu-Suu, situated in the middle flow of Maila-Suu River (Syrdarya tributary) there was extracted over 10 th tons of uranium concentrate for 22 years of uranium deposit exploitation. Total amount of accumulated in Mailuu-Suu radioactive waste is 2mln m3 with the total activity of 5·104 Ci. Approximate number of radionuclides, which are possible to get into Maila-Suu River and then into Syrdarya is 1.6·1015 Bq, including radium 9.5·1013 Bq. Three back reservoirs with the total amount of radioactive waste of around 2mln tons and total activity of 1015 Bq are potentially dangerous sources of radioactive pollution of Naryn and Syrdarya Rivers [1].
Dependence of radionuclides concentration in water on distance from the throwing down place is better described by the following equation:
K=e (a+bx) (1).
- where K is radionuclide concentration; a, b are empiric coefficients; x is the distance from throwing down place. Counting over the radionuclides contents in the water per 1 meter of river and taking into account the water volume in different sections with the help of [1], it is possible to define integral content of radionuclide in different parts of river.
For mountainous rivers of Central Asia method, based on the effect of 234U and 238U natural division and their correlation ? = 234U/238U provide wide perspectives to define the degree of pollution of river basins with technogen uranium.
The Sogdian area is located in the northern part of Republic of Tajikistan, over the territory, where the Syrdarya River is one of the largest rivers of the Aral Sea basin. In the area there are concentrated the largest ore mining and ore processing enterprises, such as production association "Vostokpredmet", ?drasman and ? nzob ore dressing combines, Isfara's hydro-metallurgic factory. These enterprises, extracting from the deposits the large quantity of rocks, use only small part (5-10%) as useful raw material. All other part is accumulated in the back reservoirs and in the dump fields. In structure of these waste products there are found out
386

U. Mirsaidov and I. Normatov
2
radioactive elements, such as uranium, radium, thorium, 90Sr, 137Cs, 40K, alongside with a set of chemical elements.
The inspections of radiating conditions carried out in 1991-1992 in the back reservoirs along a motorway in Khojend-Gafurov in Sogdian area and the settlement Kansaj have shown, that the level of J-radiation achieves 50 to 400 µR/h on the territories adjoining to them.
Realization of intensive development of uranium deposits in Republic of Kirgizstan at imperfect technological schemes was accompanied by accumulation of huge capacity of waste products. The overwhelming majority of these reservoirs and the dumps, to please the momentary economic interests, have been placed in valleys, channels and in the water meadow of the rivers, which are the inflows of the Syrdarya River.
According to on the territories of the settlement Shekaftar (Republic of Kyrghyzstan) there are 8 unrevegetated dumps of the radioactive rocks and the sub-standard ores in total amount of 7·105 m3. One of the dump with the volume of 6·104 m3 is placed directly in the water meadow of the Sumsar River and constantly washed away by its waters. Pieces of rocks with the high content of uranium (capacity of an exposition doze of γ -radiation exceeds 200-300 µR/h) are met frequently in the dumps, which are washed away from the dumps under the influence of an atmospheric precipitation and waters of the river.
In the city of ? ailu-Suu (Republic Kirgizstan), situated in the average current of the river, there has been extracted over 10,000 t of uranium concentrate for the 22 years of operation of uranium deposit. A general quantity of accumulated back reservoirs in ? ?ilu-Suu has exceeded 4·106 t with a total activity of 5·104 Ci.
The approximate quantity of radionuclides, which can get into the river of Mailu-Suu and further into Syrdarya, is 1.6·105Bq, including radium – 9.5·1013 Bq, that is equivalent to 7.7·103 t of uranium. By its chemical compound the water of the Mailu-Suu river refers to hydrocarbonate type, thus encouraging the migration of uranium along the hydrogeographical network on a distance up to 30-80 km.
Three back reservoirs and dumps in the settlement Min-Kush (Kirgizstan) belong to the number of potentially dangerous sources of radioactive pollution of Naryn-Syrdarya waters. These reservoirs with a total volume of radioactive wastes of about 2·106 t and total activity of 1015 Bq are placed in a valley of the river subject to flooding. Natural cataclysms can destroy dams of reservoirs; cause washout of radioactive wastes and infects water on large territory.
Under influence of above-named and other factors the quantity of cancer diseases in settlements located near the radioactive back reservoirs is considerably higher in comparison with average regional index. For example, the contingent of patients with the malignant tumours in the cities of Chkalovsk, Khujand, ??boshar and ??yrokum in different years exceeds in 2-4 times this parameter in comparison with average arithmetic area.
[1] NATIONAL PLAN OF ENVIRONMENT PROTECTION: priorities 1995-1997 – B (1995) 118-130.
387

EXTENDED SYNOPSIS IAEA-CN-118/27P
TOPIC: RADIOECOLOGY
1
Multivariate Statistics in the Identification of Unknown Nuclear Material
G. Nicolaou, N. F. Tsagas
Department of Electrical and Computer Engineering, School of Engineering, Demokritus University of Thrace, Xanthi, Greece
E-mail address of main author: [email protected]
The identification, and hence origin determination, of unknown nuclear material that might be found undeclared away from designated locations in the nuclear fuel cycle, is an important task in the frame of nuclear forensics. Material with forensic importance can be found at the microscopic level as particles in environmental samples indicating possible clandestine production of fissile material, and as bulky samples in the case of illicit trafficking of nuclear material.
The objective of this work is to present, at a theoretical level, an isotopic finger-printing methodology which would determine the origin of unknown nuclear material with forensic importance. This is demonstrated for the case when the unknown nuclear material is spent nuclear fuel.
The methodology is based on multivariate statistics, such as cluster and factor analysis, complemented by spent fuel isotopic composition simulations using the zero-dimensional depletion computer code ORIGEN2 [1]. A major source of error in the calculation of the evolution of the fuel in a reactor is the burnup dependence of the cross-sections used. The cross-section libraries should accurately represent a given reactor- fuel system. The procedures followed and associated limitations are discussed.
The origin is determined from the characterisation of the material in terms of its initial enrichment, reactor type and burnup. The characterisation is based on the fact that the composition of spent nuclear fuel in individual nuclides is inherently consistent. A given composition of spent nuclear fuel, being the outcome of its initial composition, reactor type and irradiation history, should characterise uniquely the fuel and hence identify its origin.
The sought characterisation of the unknown spent nuclear fuel material is obtained from the comparison of its actinides and fission products content, with isotopics calculated with ORIGEN2 for a range of commercial spent fuels from PWR (UO2 and MOX), BWR, CANDU and FBR. This comparison is performed through the cluster and factor analysis. Then, the origin of the set of calculated isotopics that closer resembles the unknown indicates the origin of the unknown.
Figure 1 shows a typical plot of factor analysis. The plot is demonstrated for a range of commercial spent fuels from PWR-UO2 (var. 1 to 9) and PWR-MOX (var. 10 to 13). The term range refers to different initial enrichments and final burnup as encountered in nuclear power stations.
388

G. Nicolaou and N. F. Tsagas
2
It is clearly seen that, on the basis of the actinide and fission product content which are calculated with ORIGEN2 for the range of fuels considered, two families of fuels are distinguished, namely those of UO2 and MOX. This demonstrates that, on the basis of composition, same type of fuels are grouped together allowing the sought identification of unknown nuclear spent fuel when these are included in the analysis.
FIG. 1. Factor analysis plot.
[1] CFOFF, A.C., ORNL/TM-7175, Oak Ridge National Laboratory (1980).
PWR-MOX
PWR- UO2
389

EXTENDED SYNOPSIS IAEA-CN-118/28P
TOPIC: RADIOECOLOGY
1
Radioactivity Control of the Danube Ecosystem
G. Pantelica, I. Tanaskovica, V. Vuletica, P. Vancsurab, A. Lengyel Vargab, J. Kövágób
a Institute of Occupational Health and Radiological Protection “Dr. Dragomir Karajovic”, Belgrade, Serbia and Montenegro
bEnvironmental Protection Inspectorate Lower Danube Valley Region, Baja, Hungary
E-mail address of main author: [email protected]
The samples from the Danube ecosystem were taken at the border profiles: Bezdan (Serbia) and Mohacs (Hungary), from 1997 to 1998 four times a year, and from 1999 six times annually [1].
The water samples were taken at three profiles of the Danube (left bank, middle, and right bank of the river), by peristaltic pump into plastic containers. The water sample is filtered through Quantitative ashes Advantec 0.45µm filter-paper (11cm in diameter) (suspended material). The filtrate is evaporated at the heating panel in crystallizer.
One by one kilogram of river sediment is taken by sampler and placed into plastic containers. The sediment is dried at 105oC to constant weight, sieved through sieve and the fraction less than 250µm is taken.
Depending upon the catch, the measurement is carried out in two kinds of fishes (catch of 3kg each). The fish is dried at 450-500oC to constant weight, fragmented and homogenized.
The algae are collected from the old boats being sunken in river water for a long time and from the docks of river ports. They are dried at 105oC to constant weight, fragmented and homogenized.
Gross beta activity and gammaspectrometry were measured in the samples of filtrated water, suspended material, sediment, algae and fish. 90Sr activity was determined in all samples but algae due to small quantity of the sample. Tritium activity was measured only in water samples.
The measurement of gross alpha and beta activity is carried out by α-β-proportional gas counter. The level of basic radiation is from 1 - 1.5 imp/min. The size of planchet is 2.3 in diameter. The performance of counter is defined by KC1 standard of the same thickness as the sample.
Tritium activity is determined in water sample which is filtered, distilled and electrolytically enriched. The water volume of 9 ml is added with 11 ml of scintillation solution. 3H activity is measured by Liquid Scintillation spectrometer in plastic bottles of 20 ml. Immediately prior to measurement, the sample stands for a while in the counter for thermostasis.
390

G. Pantelic et al.
2
Radiochemical method of 90Sr separation is based on oxalate isolation of Ca and Sr, ignition to oxides and usage of aluminum as 90Y carrier. The equilibrium is achieved in 18 days, and after that time 90Y is isolated on Al(OH)3 carrier, which is then ignited to oxide that is subsequently measured by α-β anti-coincidence counter. The size of planchet is 2.3 cm in diameter. The performance of counter is 24% and is determined by 90Sr standard.
Gammaspectrometry is carried out on pure germanium detector manufactured by EG&G “ORTEC”, which is connected with multichannel analyzer (8192 channels) produced by the same manufacturer and with adequate computer facilities. Energetic calibration, as well as calibration of detector efficiency is performed by means of Amersham radioactive standard. The time of measurement for a single sample is 60000 to 100000 s, while it is 250000 s for basic radiation.
The results of radioactivity measurements in samples of the Danube river, from 1997 to 2003, were compared to the measurements carried out for determination of the “initial state” (before the Paks Nuclear Power Plant started running). The results of measurements of gross beta activity (water, sediment, algae and fish), 3H activity (water), 90Sr activity (water, sediment and fish) and gammaspectrometry (water, sediment, algae and fish) reveal that the values are at the same level as they were before the Paks Nuclear Power Plant started running. The measurements of 137Cs activity in sediment samples, from 1997 to 2003 (FIG. 1), show some increase of activity in relation to the “initial state”, what could be assigned to contamination caused by Chernobyl Nuclear Power Plant accident in 1986.
Our results of measurements correlate well with the results of Hungarian part.
FIG. 1. 137Cs activity concentration in the sediment.
[1] PANTELIC, G., EREMIC, M., PETROVIC, I., JAVORINA, L.J., TANASKOVIC, I., VANCSURA, P., LENGYEL VARGA, A., KÖVÁGÓ, J., Radioactivity control of the Danube at Yugoslav-Hungarian border area, Environmental Recovery of Yugoslavia, Monograph, Institute Vinca, Belgrade (2002) 193-201.
0
10
20
30
40
50
60
70
80
90
?ctiv
ity (
Bq/
kg)
Initial state 1997 1998 1999 2000 2001 2002 2003Bezdan Mohacs
391

EXTENDED SYNOPSIS IAEA-CN-118/29P
TOPIC: RADIOECOLOGY
1
137Cs Fallout Impact on Forest Soils and Lake Sediments in the Boreon Area, Mercantour Massif, SE France
S. Rezzouga, H. Michela, F. Fernexb, G. Barci-Funela, V. Barcia
a Laboratoire de Radiochimie, Sciences Analytiques et Environnement, University of Nice-Sophia Antipolis, 28, av. Valrose, 06108 Nice Cedex 02, France
bDepartment des Sciences de la Terre, University of Nice-Sophia Antipolis, 28, av. Valrose, 06108 Nice Cedex 02, France
E-mail address of main author: [email protected].
The Boréon area in the Mercantour Massif (Alpes-Maritimes) was contaminated by radionuclides after the Chernobyl accident in the first days of May 1986. In order to obtain 137Cs and 210Pb profiles, sediments from a small mountain lake in this area were collected, as well as forest soils in its vicinity, i.e. in a small valley and on the slopes. The 210Pb flux was calculated from the inventory in a horizontal soil, at 1 km straight line from the lake, where the atmospheric 210Pb (unsupported) is neither swept away nor enriched with lateral input; the 210Pb flux is high in the area (0.09 Bq cm-2 y-1) probably because of the great frequency of rain and uranium ores outcropping in the massif.
The 137Cs soil profile in the valley (site A) (Fig. 1) displays a maximum activity (480 Bq kg-1) at the top layer and a decrease as a function of depth. Two profile shapes were observed on the lateral slopes, one (site B) with downward decrease from the top where the activity is 1500 Bq kg-1, the other (site D) with a maximum at 3.5 cm (455 Bq kg-1). At the lower part of the slope (site E, below site B), the activity is highest at 3 cm with more than 2750 Bq kg-1.
The comparison of the 137Cs soil inventories and the unsupported 210Pb allowed to estimate the 137Cs fallout due to the Chernobyl accident in the study site (Boréon).
The recent lake sediments still undergo rather strong contamination by 137Cs, and the sediment profiles show that the residence time of 137Cs in the catchment area is long; only a small proportion is swept out every year by erosion.
Keywords: 137Cs; 210Pb; Flux; Forest soils; Lake sediments; SE France.
392

S. Rezzoug et al.
2
Site 4
Site 2
Out flow
Site AStream mouth In flow
WEST
EAST
Drainage basin
Runoff waters
Site 1
Site C
2200 m
1750 m
Site B
Site D
Site E
FIG. 1. Sampling locations.
393

EXTENDED SYNOPSIS IAEA-CN-118/30P
TOPIC: RADIOECOLOGY
1
tbta ebeatA 2211)( −− +=
Monitoring of the Activity Concentration in the Air - A Part of Radiation Monitoring Network of the Czech Republic
P. Rulik, J. Tecl, J. Skrkal
National Radiation Protection Institute, Prague, Czech Republic
E-mail address of main author: [email protected]
The Radiation Monitoring Network (RMN) of the Czech Republic was established after the Chernobyl accident. It is co-ordinated by the State Office for Nuclear Safety (SONS, www.sujb.cz) in co-operation with the National Radiation Protection Institute (NRPI, www.suro.cz). At the present time a legal basis for RMN is given by the “Atomic Act” No. 18/1997 Coll. and especially by the Regulation of the SONS No. 319/2002 Coll. The regulation corresponds to the recommendation of the EC Commission “on the application of Article 36 of the Euratom Treaty concerning the monitoring of the levels of radioactivity in the environment…” (8.6.2000).
The RMN consists of several subnetworks: the Early Warning Network (EWN), the TLD Territorial Network, the Network of the Measuring Sites of Air Contamination (MSAC), the Network of Laboratories equipped with spectrometric and radiochemical analytical instrumentation and the Ground and Airborne Mobile Groups.
The MSAC network consists of 12 sites equipped, besides other instruments, by aerosol samplers with throughput up to 900 m3/h and usually also by equipment for fallout sampling. The aerosol samplers work continuously with one-week sampling periods in normal situation. The filters are measured by semiconductor gamma-spectrometry altogether in 8 laboratories. Besides artificial radionuclide 137Cs, natural radionuclides 7Be and 210Pb are evaluated by gamma-spectrometry routinely in order to confirm the quality of samplings and measurements in individual laboratories, too. After gamma spectrometric analysis the radiochemical separation followed by alpha spectrometry or beta measurements is used for the determination of 90Sr, 238Pu and 239,240Pu in the quarterly combined filters from the MSAC in Prague. A continuous collection of the air for the assessment of activity concentration of 3H, 85Kr and 14C in monthly samples is performed in MSAC in Prague, too. The MSAC network is able to disclose such small increases of activity concentrations of man-made radionuclides in the air as it happened with 137Cs in consequence of the incident in Algeciras (Spain) in May 1998.
The follow-up of the long-time behaviour of the radionuclides in the environment leads to interesting results including the possibility to forecast the behaviour of them in the future. For instance the solution of the differential equation for the 137Cs activity concentration in the air and also in the fallout in dependence on the time elapsed after the Chernobyl accident can be expressed as the following two component exponential function
(1)
where
394

P. Rulik et al.
2
A(t) is the activity concentration as a function of the time;
a1, a2, b1 and b2 are constants containing implicitly the combination of the initial conditions and the coefficients related to the fall out of the aerosols from the atmosphere to the soil surface, resuspension of the activity from the soil surface to the atmosphere, penetration of the activity to deeper layers of the soil and radioactive decay.
The time course of mean monthly values of the 137Cs concentration in Prague in the time period June 1986 - December 2003 together with the fit of the data by function (1) is presented in Fig. 1.
FIG. 1. The time course of the mean monthly values of the 137Cs activity concentration in the air in MSAC in Prague and the fit of the data by two component exponential function [1].
The data of RMN resulting from monitoring are transferred to the central database of RMN. Selected results of monitoring are continuously published on the web site of NRPI and summarised in the Annual Reports on Radiation Situation in the Czech Republic (in Czech), issued by the NRPI. Data are also provided for mutual exchange with international organisations. The central laboratory of RMN is connected to the “RO5 Group” - an informal group of European experts specialized in monitoring aerosols in the atmosphere who are able without any delay, through e-mails, to inform each other about current activity concentration levels.
1.E-01
1.E+00
1.E+01
1.E+02
1.E+03
1.E+04
1985 1987 1989 1991 1993 1995 1997 1999 2001 2003 2005
Year
Act
ivity
con
cent
ratio
n [
µB
q /
m3
]
395

EXTENDED SYNOPSIS IAEA-CN-118/31P
TOPIC: RADIOECOLOGY
1
Radiological Assessment of the Egyptian Mediterranean Coast
A. El-Gamala, I. H. Saleha, S. Nasra, M. Naimb
a Department of Environmental Studies, Institute of Graduate Studies and Research, Alexandria University, Alexandria, Egypt
bDepartment of Phys ics, Faculty of Science, Alexandria University, Alexandria, Egypt
E-mail address of main author: [email protected]
On the basis of extensive sampling, gamma spectrometry, laboratory analyses, data evaluation and comparison with the reference data, the following assessment has been carried out. The radiological assessment has been done for a wide scale study area (about 1100 km) from El-Salloum in the west of the Mediterranean coast of Egypt to El-Arish in the east. The environmental radiological assessment steps are based on the criteria previously mentioned [1, 2].
The sources of radioactivity possibly reach the Egyptian Mediterranean coast can be summarized as: primordial and radiogenic radionuclides (e.g. 40K, 238U and 232Th series), cosmic rays and cosmogenic radionuclides (e.g. 7Be), fertilizers (e.g. superphosphate), black sand (transported by Nile River), fallout (either from nuclear testing or Chernobyl), seawater currents (transported either natural or man-made), Suez Canal (subject to receive a radioactive releasing and effluents from either nuclear power ships or submarines passes through the canal), biological migration and sedimentary longshore movement (e.g. Anguilla anguilla), atmospheric radioactivity (e.g. 222Rn and its daughters), domestic and medical sewage (minor source, short half-life), depleted uranium dust (possibly), satellite and aircraft accident (accidentally) and rarely loss of industrial radioactive source (incidentally).
El-Salloum, Rashid and El-Gamil have been considered as concentrated basins for the majority of the radioisotopes. This suggestion was due to the special topographical features of these three stations, which make the accumulation of the radioactive isotopes possible.
Calculations of outdoor absorbed dose rate for human population at all stations under investigation from 238U, 232Th and 40K were carried out. The calculated absorbed dose rate has been distinguished the coast into normal areas and Rashid black sand area as high background area. The range of calculated dose was 8.39-38.5 nGy/h. Good agreement was observed with NCRP absorbed dose rates 26 (17-40) nGy/h [3]. Calculations of gamma absorbed dose rate in Rashid black sand area collected in July 1998 recorded as 0.72 µGy/h. This value was considered as relatively high dose rate and it is remarkable of the high background radiation area at Rashid. Comparing with the reported gamma radiation dose rates in the others high background radiation areas, it was in agreement with Ramsar in Iran (0.7-50 µGy/h) and relatively lower than 1-2 µGy/h at Guarapari, Meaipe and Cumuruxatiba in Brazil [4].
Annual intake radiation dose was achieved by estimation of the human intake of radioactivity due to fish consumption considering the Egyptian values. Using the mathematical calculation of annual dose per Bq, the total dose to a person, daily fed with 0.0136 kg fish, in one year was 10.3 µSv/y, which is mainly from 40K.
396

A. El Gamal et al.
2
FIG. 1. Gamma absorbed dose rate (nGy/h) from sediments along the Egyptian Mediterranean coast (calculated from March 2000 data).
Annual intake radiation dose was achieved by estimation of the human intake of radioactivity due to fish consumption considering the Egyptian values. Using the mathematical calculation of annual dose per Bq, the total dose to a person, daily fed with 0.0136 kg fish, in one year was 10.3 µSv/y, which is mainly from 40K.
The only man-made radionuclide detected in the Egyptian Mediterranean coast is 137Cs with average value 0.37 Bq/kg. This average value shows high agreement with the other referenced values in the world. The main source of 137Cs is atmospheric fallout either from nuclear testing or Chernobyl. The marine transport from western Mediterranean could be considered as another source.
Surface seawater salinity showed a positive correlation with the concentrations of 40K in surface seawater (r = 0.64). A mathematical model has been deduced to estimate the range of natural 40K in the surface seawater.
Assessment of radioactivity bioaccumulators was made among different biota collected from the Egyptian Mediterranean coast. It revealed that, Patella spp., Anguilla spp. and Mytilus spp were the best marine organisms for having the capability to accumulate 40K. Also, Patella spp., Anguilla spp. and the intermediate leave of Posidonia spp. were found as good accumulators of both 214Pb and 214Bi. Anguilla spp. and Mytilus were found to be good accumulators of 228Ac.
[1] KRYSHEV, I.I., SAZYKINA, T.G., Radiological assessment of the impact of nuclear
facilities on the marine environment in Russia, (Book Ext. Syn.. Int. Symp. Mar. Poll., Monaco, 5-9 October 1998) 237-238.
[2] POVINEC, P.P., Marine radioactivity assessment of Mururoa and Fangataufa Atolls, (Book Ext. Syn. Int. Symp. Mar. Poll., Monaco, 5-9 October 1998) 141-142.
[3] NATIONAL COUNCIL ON RADIATION PROTECTION AND MEASUREMENTS, Natural background radiation in the United States, NCRP Report 45 Washington (1975).
[4] GUY, S., An overview of natural background radiation sources, Part 1: external sources of radiation exposure, Natural Background Radiation, Lecture 1 of 3 (1996).
0
5
10
15
20
25
30
35
40
45
El-S
alloum
Matrouh
Rom
el
Ras E
l-Hekm
a
Sidi A
bd El-R
ahman
Nobareya
El-M
ex
Eastern H
arbour
Montaza
Abu Q
ir (open)
Abu Q
ir (bay)
Rashid
El-B
rolos
Gam
asa
Dam
ietta
El-G
amil
Port S
aid
Rom
ana
El-A
rish
Dos
e (n
Gy/
h)
397

EXTENDED SYNOPSIS IAEA-CN-118/32P
TOPIC: RADIOECOLOGY
1
Gamma -Ray Dose Rate a 1 m High Monitoring by using Very Sensitive TLD Systems near the Kozlodui - Bulgaria NPP
A. I. Stochioiua, F. S. Mihaia, I. I. Georgescub
a "Horia Hulubei" National Institute for Physics and Nuclear Engineering, IFIN-HH, Bucharest, Romania
bPolytechnic University of Bucharest, Romania
E-mail address of main author: [email protected]
Two parallel sensitive TLD systems were used to monitor the gamma - ray dose rate, in 10 measurement locations, situated at a distance of about 50 km from the Kozlodui - Bulgaria, NPP. They consist from:
• a CaSO4: Dy dosimeter and Victoreen TLD reader;
• a LiF: Mg, Cu, P dosimeter and Model 770 A TLD reader.
The dosimeter with TL detectors is part of the category of passive dosimeters and has the following advantages:
• when it is placed, it doesn't need to be attached to any electronic systems;
• the regeneration possibility of the TL detectors;
• the energetic range: 30 keV - 3 MeV.
• Bright sensitive, up to 10-6 Gy.
Their detection limit is 10-5 Gy. The measured dose rate in air values lied in the interval 239.5 nGyh-1 and 368.3 nGyh-1; these values are about 6-8 times higher those natural mean values of ≅ 50 - 80 nGyh-1.
The agreement between the measurements accomplished on each location, with the two parallel systems agree within a limit of 10 - 15 %.
Table I presents the obtained results: determined values of the absorbed dose rate in air.
398

A. Stochioiu et al.
2
TABLE I. THE RESULTS OF MEASUREMENTS FOR ABSORBED DOSE WITH TL SYSTEM 1 AND TL SYSTEM 2
No. TL Systems*
Response [Imp.]
Dmas
[nGyh-1] ε
between two TL Systems
TL System 1 1866.6 ± 208.2 (11.15 %) 330.4 1.
TL System 2 9700.0 ± 1131.3 (11.6 %) 296.8
10.2
TL System 1 1750 ± 132.28 (7.5 %) 302.0 2.
TL System 2 8650 ± 319.20 (10.6 %) 260.4
13.8
TL System 1 1460 ± 150.90 (10.34 %) 244.6 3.
TL System 2 8050 ± 353.50 (4.39 %) 239.5
2.1
TL System 1 1966 ± 202.10 (9.4 %) 345.2 4.
TL System 2 9800 ±424.30 (4.3 %) 300.27
13.1
TL System 1 2083 ± 189.30 (9.1 %) 357.0 5.
TL System 2 10350 ± 636.39 (6.1 %) 321.0
10.1
TL System 1 1900 ± 200 (10.5 %) 331.98 6.
TL System 2 9200 ± 424.3 (4.6 %) 279.4
15.9
TL System 1 1966,6 ± 251.66 (12.7 %) 345.0 7.
TL System 2 9800 ± 424.50 (4.3 %) 300.7
12.9
TL System 1 2000 ± 264.50 (13.2 %) 351.8 8.
TL System 2 10350 ± 919.20 (8.8 %) 319.4
9.3
TL System 1 1926 ± 102.10 (5.6 %) 327.2 9.
TL System 2 8950 ± 353.50 (3.9 %) 288.2
14.6
TL System 1 2083 ± 160.7 (7.7 %) 368.3 10.
TL System 2 1800 ± 565.7 (5.8 %) 310.8
15.7
*TL System 1 - Dosimeter with CaSO4 : Dy TL detector type; TL System 2 - Dosimeter with LiF: Mg, Cu, P TL detector type
399

EXTENDED SYNOPSIS IAEA-CN-118/33P
TOPIC: RADIOECOLOGY
1
Environmental Monitoring at the Australian Nuclear Science & Technology Organisation (ANSTO)
J. Ferris, J. Harrison, E. Hoffmann, T. E. Payne, R. Szymczak
ANSTO Environment, PMB 1, Menai NSW 2234, Australia
E-mail address of main author: [email protected]
The Australian Nuclear Science and Technology Organisation (ANSTO) operates several facilities, including Australia’s only research reactor, HIFAR, carrying out production of radiopharmaceuticals and research in nuclear science and technology. ANSTO is an agency of the Commonwealth of Australia. Most ANSTO facilities are at the Lucas Heights Science and Technology Centre (LHSTC), surrounded by a 1.6 km buffer zone, about 40 km southwest of Sydney. ANSTO also operates the National Medical Cyclotron (NMC), located on the grounds of Royal Prince Alfred Hospital in Camberdown, Sydney, which produces short-lived radioisotopes for medical investigations.
ANSTO is committed to undertaking its activities in a manner that protects human health and the environment and is consistent with national and international standards and our activities are regulated by the Australian Radiation Protection and Nuclear Safety Agency [1] under the Australian Radiation Protection and Nuclear Safety Act (1998).
FIG. 1. Location of monitoring sites at the Lucas Heights Science & Technology Centre [3].
ANSTO has a comprehensive monitoring programme for the main pathways for potential exposure from routine and accidental releases for radioactivity. Annually, approximately 6000
400

J. Ferris et al.
2
samples are taken and some 10,000 analyses are performed. ANSTO monitors the amounts of airborne emissions, the radioactive and non-radioactive contaminants released to the sewer and subsequently to local coastal waters, the quality of stormwater leaving the site, the quality of groundwater and soils and sediment in the general vicinity.
The principal sources of potential radiation exposure to members of the general public from routine ANSTO operations at the LHSTC and National Medical Cyclotron are from airborne emissions and low-level liquid effluent discharges. The effective dose rate to a hypothetical individual potentially exposed to radiation in routine airborne discharges from the LHSTC during the 2002-03 fiscal year was less than 0.006 mSv/year, based on stack discharge data and concurrent meteorological information. This effective dose is well below the ALARA objective of 0.02 mSv/year and less than 1% of the public dose rate limit of 1 mSv/year for long term exposure that is recommended by the Australian Occupational Health and Safety Commission. It is also less than 1% of the natural background annual dose in Australia of about 1.5 mSv/year [2]. Thermoluminescent dosimeters placed around the LHSTC and at some local residences also demonstrate that the external gamma radiation levels at residential locations in the vicinity of the LHSTC were at normal background levels and not noticeably affected by ANSTO operations.
FIG. 2. Estimated Effective Dose from LHSTC airborne discharges 2002-03 [3].
ANSTO operations at the LHSTC and the NMC make only a very small addition to the background radiation dose, even for the comparatively few members of the public identified as potentially exposed to radionuclides entering the environment from the ANSTO sites. The results of the monitoring programme are published annually in documents within the series Environmental and Effluent Monitoring at ANSTO Sites [3 and references therein], copies of which are available in the local Sutherland Shire Central Library and on request from the ANSTO Communications Manager.
The environmental and effluent monitoring programme at ANSTO is very much a team effort and acknowledgment goes to all associated staff for their valuable contributions.
[1] ARPANSA, Recommendations for limiting exposure to ionizing radiation, republished as Rad. Prot. Series 1 (2002), Aust. Rad. Prot. Nucl. Safety Agency, Sydney.
[2] WEBB, D.V., SOLOMON, S.B., Background radiation levels and medical exposure levels in Australia, Radiation Protection in Australasia 16 1 (1999) 7-14.
[3] HOFFMANN, E.L, FERRIS, J.M., MARCKICH, S.J., Environmental and Effluent Monitoring at ANSTO sites, ANSTO/E-752 (2003).
401

EXTENDED SYNOPSIS IAEA-CN-118/34P
TOPIC: RADIOECOLOGY
1
Radionuclides in the Coastal Environment of Indonesia
H. Umbara, H. Suseno
Radioecology and Marine Environment Section, Radioactive Waste Management Development Center, National Nuclear Energy Agency, Serpong, Indonesia
E-mail address of main author: [email protected]
Present potential radiation risk in the coastal environment of Indonesia may result mainly from the presence of naturally occurring radioactive materials released to the aquatic environment from land-based sources, as some of the process industry uses large amounts of raw materials like ore, marl or clay which contains natural radionuclides. Therefore, in recent years we have been conducting radionuclide monitoring in Jakarta bay with the aim to establish present levels of natural radionuclides in the coastal environment.
Further, we have also been developing methodologies for analysing fission products with the purpose of generating data on background levels of anthropogenic radionuclides in the coastal environment, important for planned construction of nuclear facilities in the region, so adequate radioecological risk assessment studies could be carried out in the future. Therefore radionuclide monitoring has been carried out at Muria peninsula as well, where the first Indonesian nuclear facility is planned to be constructed. Radionuclide monitoring results, both for natural and anthropogenic radionuclides in Muria Peninsula are presented in Table I.
We have also been developing experimental radiotracer techniques to determine bioaccumulation of key contaminants and their retention parameters for bioindicator organisms used in site-specific coastal pollution monitoring programmes, designed to furnish information on water quality. Candidates of marine mollusks as bioindicators are listed in Table II.
TABLE I. RADIONUCLIDE CONCENTRATIONS IN MURIA PENINSULA
Natural and Artificial Radionuclides Monitoring
Radionuclides Concentration (Bq/L)
Sea water
Cs-137 2.98 x 10⁻³
Sr-90 1.43 x 10⁻³ Co-60 - K-40 10.72 Rn-222 3.56
River water
Cs-137 1.96 x 10⁻³ Sr-90 2.23 x 10⁻³ Co-60 - K-40 6.34 Rn-222 2.16
402

H. Umbara and H. Suseno
2
Soil Concentration, (Bq/Kg) dried weight
Cs-137 0.42 Sr-90 0.304 Co-60 - K-40 35.36 Rn-222 3.6
Sea sediment
Cs-137 0.575 Sr-90 0.325 Co-60 - K-40 67.86 Rn-222 -
Sea animal Concentration, (Bq/g) ashed weight
1. Sea fish Cs-137 8.5 x 10⁻⁴ Sr-90 -
2. Shrimp Cs-137 - Sr-90 9.10 x 10⁻³
TABLE II. SELECTION OF MARINE MOLLUSKS AS BIO-INDICATORS
Selection of Bio-indicator for Coastal Management
Mollusk species
Common Name Scientific Name Experimental Research using 109Cd tracer
Cockle shell Anadara granosa CFss : 28.18
T1/2b : 4.24 d
Ark Anadara inequivalvis CFss : 34.13
T1/2b : 8.75 d
Reticulate Venus shell Eriqlyota reticulata On going
Hard clam Meretrix meretrix On going
Green mussel Perna viridis CFss : 65.72
T1/2b : 11.75d
Blue green cat eye Turbo petholatus On going
403

EXTENDED SYNOPSIS IAEA-CN-118/35P
TOPIC: RADIOECOLOGY
1
Determination of Natural and Artificial Radioactivity Level in Sediment in the Marmara Sea
A. Varinlioglu, R. Kucukcezzar, A. Kose
Çekmece Nuclear Research and Training Center, P.O. Box.1 Atatürk Airport, 34149 Istanbul, Turkey
E-mail address of main author: [email protected]
The present paper reports the concentration levels of the 239+240Pu, 137Cs and 40K in surficial sediment at 8 station of Marmara Sea of Turkey. The purpose of this paper is to follow up the earlier study and present result for the distributions of radionuclides in sediment of Marmara Sea [1].
A major part of pollutants transported by current systems are normally adsorbed on fine grained particles in suspension. The dissolved radionuclides in the Marmara Region rivers are finally transported along the Marmara Sea coastal area to the Marmara Sea.
The sediment sample were collected on september 1998 – 2004. Result of the measurement for each station were compared between two sampling compaign in order to see the affect of the seasonal variations.
137Cs and 40K concentration levels were determined by gamma spectrometric method. 239+240Pu concentration level were determined by alpha spectrometric technique.
239+240Pu concentration result varies between 0.45±0.04 – 0.10±0.01 Bq/kg. The 40K content varies between 296±47 – 437±60 Bq/kg. The 137Cs activity result varies between 12.6 ±2.6 – 44.1±6.2 Bq/kg.
[1] VARINLIOGLU, A., KÜÇÜKCEZZAR, R., KÖSE, A., AKYÜZ, T., BASSARI, A., Determination of Natural and Artificial Radioactivity and Trace Element Level in Sediments in The Marmara Sea, Workshop of University of Istanbul, Institute of Marine Science (9 – 13. 06. 1997).
404

EXTENDED SYNOPSIS IAEA-CN-118/36P
TOPIC: RADIOECOLOGY
1
210Po in the North-West Black Sea Ecosystem
G. E. Lazorenkoa, G. Polikarpova, I. Osvathb
a The A.O. Kovalevsky Institute of the Southern Seas, National Academy of Sciences of Ukraine, Sevastopol 99011, Ukraine
bIAEA Marine Environment Laboratory, 4 Quai Antoine 1er MC 98000 Monaco
E-mail address of main author: [email protected]
210Po is a natural radionuclide which contributes 2-3 orders of magnitude more than anthropogenic radionuclides to doses received by humans from ingestion of seafood [1]. Data on 210Po in the Black Sea were very scarce. This paper introduces an extensive set of data and related results obtained by the authors on 210Po in water, bottom sediments, algae, macro- and mesozooplankton, mollusks and fishes from the Ukrainian area in the North-West Black Sea in the period 1998-2004. 210Po concentrations in surface water of the open part of the sea in the summer season were around 1 Bq.m-3. In the bottom sediments they ranged between 10 and 500 Bq·kg-1dw, with maximum 210Po concentrations in the area of the Western cyclonic gyre. Concentration factors for this radionuclide, estimated on a wet weight basis, had values of 1.5·103 for macrophytes, 4·103 for total zooplankton, 103-104 for entire fishes, depending on their ecological groups affiliation and 6·104 for mussels (Mytilus galloprovincialis). These values are comparable to those of similar species from other areas of the World Ocean [2]. Amongst the investigated species, the highest doses from 210Po were estimated for the mussels [3]. Amongst the fishes, pelagic species (Sprattus sprattus phalericus, Engraulis enchrasicolus ponticus) are estimated to receive the highest doses from 210Po (Fig.1).
Acknowledgement
This study has been carried out in the framework of the International Technical IAEA Project RER/2003 'Marine Environmental Assessment in the Black Sea Region”.
[1] SOURCES OF RADIOACTIVITY IN THE MARINE ENVIRONMENT AND THEIR RELATIVE CONTRIBUTIONS TO OVERALL DOSE ASSESSMENT FROM MARINE RADIOACTIVITY (MARDOS), IAEA-TECDOC-838, IAEA, (1995).
[2] SEDIMENT DISTRIBUTION COEFFICIENTS AND CONCENTRATION FACTORS FOR BIOTA IN THE MARINE ENVIRONMENT, IAEA-TRS-422, IAEA (2004).
[3] LAZORENKO, G.E., POLIKARPOV, G., OSVATH I., The assessment of doses derived to Black Sea biota from 210Po in natural conditions, UDK 546.79:594.124 (262.5) (in Russian).
405

EXTENDED SYNOPSIS IAEA-CN-118/37P
TOPIC: THE ATMOSPHERE
1
Changes of Methane and Nitrous Oxide in the Atmosphere: New Constraints from Stable Isotope Analyses in Polar Firn and Ice
S. Bernarda, T. Roeckmannb, J. Kaiserc, J. Chappellaza, J-M. Barnolaa, C. M. Brenninkmeijerd
a Laboratory of Glaciology and Geophysics of the Environment, CNRS, Grenoble, France
bMax Planck Institute for Nuclear Physics, Heidelberg, Germany
c Department of Geosciences, Princeton University, Princeton, U.S.A.
dMax Planck Institute for Chemistry, Mainz, Germany
E-mail address of main author: [email protected]
Methane and nitrous oxide are two greenhouse gases playing a major role in atmospheric chemistry; methane largely affects the oxidative capacity of the atmosphere whereas nitrous oxide participates in many atmospherical chemical reactions in the stratosphere. A sharp increase in the mixing ratios of both gases has been observed since the beginning of the pre-industrial era, implying an increase of anthropogenic sources.
Although these gases are important in global climate changes, their budget remains poorly known. The evolution of their isotopic composition in the atmosphere brings additional constraints as it represents the final signature of their budgets and reflects changes in the relative contribution of sources and sinks.
We have measured isotopic composition of methane and nitrous oxide coming from polar firn air and enclosed in ice core bubbles. This is leading to mid term evolution of these gases (the last 200 years). A continuous flow technique is used at the Laboratory of Glaciology and Geophysics of Environment in Grenoble, France, to measure d13CH4, whereas a similar technique is used at Max Planck Institute for Nuclear Physics, In Heidelberg, Germany, to measure d15N2O, 1d15N2O, 2d15N2O and dN2
18O. Samples from both Antarctica (Berkner Island) and Greenland (North GRIP) were used. We will present these results and their tentative interpretation based on a diffusion model of gas isotopes in polar firn.
406

EXTENDED SYNOPSIS IAEA-CN-118/38P
TOPIC: THE ATMOSPHERE
1
Seasonal Variation of Anthropogenic Radionuclides in Atmospheric Samples from Central Radiation Monitoring Station in Korea
B. U. Chang, Y. J. Kim, C. S. Kim, H. Y. Choi, C. K. Kim, B. H. Rho, J. Y. Moon
Korea Institute of Nuclear Safety (KINS), Daejeon, Korea
E-mail address of main author: [email protected]
By the reason of the rapid economic growth and industrialization, China is facing an unexpected increase of air pollution. Asian dust transport, known as “Yellow sand” in East Asia, originated from Chinese inland affects to neighboring countries. It has been a long time since the annually occurring “uninvited-guests”, Asian dust and related air pollutants raised important environmental issue of not only it’s own country, but also neighboring countries like Korea and Japan, and faraway countries, even the North American continent.
During the last three years (2001-2003), we have monitored the monthly variations of anthropogenic radionuclides in atmospheric samples collected from the Central Radiation Monitoring Station in Korea. After finishing the γ-ray measurement by HPGe, each sample was extracted by nitric acid with Sr and Cs carriers and Pu tracers. Pu, Sr and Cs in the acid extract were purified with the sequential separation method developed by our laboratory [1]. The activities of 137Cs and 90Sr were measured by a low background gas-proportional α/β counter (Tennelec Series 5, Oxford Instruments Inc.). Measurement for Pu radioactivity was performed using a PlasmaTrace2 sector field inductively coupled plasma mass spectrometry (Micromass, Manchester, UK).
The concentrations of 137Cs, 90Sr and Pu isotopes in the spring season showed relatively high values compared with those in other seasons. The so-called spring peak of 137Cs, 90Sr and Pu isotopes was observed in March. In sampling area, the total annual deposition of 137Cs, 90Sr and 239+240Pu in 2002, were 609, 242, 25.4 mBq/m2, respectively. Especially, as the spring peak’s total deposition (March, April, and May) of each radionuclide were 70, 55, 74 % of total annual depositions of each radionuclide, respectively. These amounts were 12-15% higher than spring peak value in 2001. These increase of radioactivities caused by denser Asian dust in 2002 than 2001. In the contrary, the radioactivities of spring peak samples show relatively low in 2003. At this year, the occurrence frequency of Asian dust was very low.
These results indicate that the sources of anthropogenic radioactive elements in atmospheric samples are not the local resuspension but the transport from the source regions in Chinese inland.
407

B. Chang et al.
2
PM10(µg/m3)
Average Humidity(%) Average Wind Speed(m/sec)
Monthly Rainfall(mm)
1 117 4 2 1 7 5 2 1 1Monthly Sand Storm Frequency (Days)
0
4
8
12
0
0.1
0.2
0.3
0
0.02
0.04
0.06
0.08
1 2 3 4 5 6 7 8 9101112 1 2 3 4 5 6 7 8 91011121 2 3 4 5 6 7 8 9101112
2001 2002 2003
0
0.1
0.2
0.3
0
200
400
600
40
80
120
40
60
80
100
1
1.5
2
2.5
3
0
2
4
68
137Cs
239+240Pu
Act
ivity
(Bq/
m2.m
onth
)
90Sr
Mass Ratio(240Pu/239Pu)
Analysis Failed
137Cs/90Sr Ratio
Now analysing
FIG. 1. Monthly variation of anthropogenic radionuclides in total deposition samples.
[1] CHANG, B.U., KIM, Y.J., KIM, C.S., KIM, C.K., MOON, Y.J., Sequential Analysis of Artificial Radionuclides in Atmospheric Samples of Daejeon, Korea, IAEA-CN-98/5/15P (2002).
408

EXTENDED SYNOPSIS IAEA-CN-118/39P
TOPIC: THE ATMOSPHERE
1
Surface Mass Balance of the East-Wilkes / Victoria Region of Antarctica: An Update
O. Maganda, C. Genthona, M. Frezzottib, S. Urbinic, M. Filya, H. Galleea
a Laboratory of Glaciology and Geophysics of Environment (LGGE), UMR CNRS 5183, Grenoble, France
bEnte per le Nuove Tecnologie, l'Energia e l'Ambiente (ENEA), Roma, Italy
c Instituto Nazionale di Geofisica e Vulcanologia, Dipartimento per lo studio del Territorio e delle sue Risorse, University of Genoa, Genoa, Italy
E-mail address of main author: [email protected]
Abstract: In spite of more than 2000 reported field measurements [1], there are 3 major difficulties to building an accurate observations-based full map of the Antarctic Surface Mass Balance (SMB): 1) Depending on measurements technique and time sampling, the reliability, accuracy and representability of a given report is highly variable and may be very poor; 2) There are still huge gaps in the spatial coverage of the available measurements, and much of the Antarctic SMB estimation currently relies on interpolation; and 3) Measurements sample various time periods and are time- inconsistent, so that real temporal variability can induce spurious spatial variability. Antarctica is a huge place (12.4 106 km²) and International programs as ITASE (International Trans-Antarctic Scientific Expeditions, [2]) are essential to obtain new high quality data to fill gaps and/or supersede older less reliable estimations of the SMB.
This work is focused on the East-Wilkes and Victoria (EWV) region (Fig. 1), in Antarctica (section I), where new estimates of the Surface Mass Balance (SMB) have been recently produced thanks to Italian and French ITASE activities, in EWV in the 1998-2001 period [3-4]. Some of the most accurate dating techniques available, in particular, measurements of radioactive reference levels due to atmospheric thermonuclear tests (section II) and snow radar, have been used to obtain the new SMB data. More than 50 firn cores and/or snow pits, i.e. more than 1000 snow samples, have been dated using fifties and sixties horizons (Fig. 2). The detection of fission products (mainly 90Sr, 90Y and 137Cs) was done with a low-level β counter, constituted by a surface-barrier silicon detector (Schlumberger type BEC 200-300 A) connected in anti-coincidence with a gas flow guard counter (proportional mode-parallel wires: Intertechnique type S30 A). The nuclear detection characteristics for global β radioactivity are described by [5].
These new SMB data make it possible to check, in this region, the Antarctic SMB maps built from compilation of older data and interpolations (Sections III and IV), here the map by Vaughan et al [6], henceforth referred to as the V-map, reports using 1860 field observations of various kinds, but none of the new data above, to build a full map of the Antarctica SMB. Microwave remote sensing was used as a semi-empirical tool to interpolate between the field reports. Figure 3 compares old field data with the SMB map in the EWV sector [6]. Except
409

O. Magand et al.
2
for a few outliers, the V-map is in good agreement with the older field data. This is an unsurprising result since these data were used to build the map.
Figure 4 compares the new data (ITASE firn cores) and Vaughan-map in the EWV sector. The V-map displays a distinctive structure of relatively high SMB in a region of otherwise very low accumulation south of 75°S. This structure is not confirmed by the new observations which suggest much more spatial homogeneity in this region. More generally, the V-map tends to overestimate the Antarctic SMB. The error in V-map relative to the new data reaches as much as 900% in the dry region.
The new data show that there is currently no proven method to interpolate across the huge gaps remaining between existing data. It is crucial that more and more accurate field determinations of the Antarctic SMB are obtained, in particular as part of ITASE.
ACKNOWLEDGEMENTS
Financial support from the French Ministry of Research, Italian Ministry of Research through PNRA Consortium, ACI Climate Change and Cryosphere is acknowledged for this work.
Field work in Antarctica was possible through the logistic support of the Italian Antarctic Program from PNRA Consortium and the French Polar Institute (IPEV).
[1] GIOVINETTO, M.B., ZWALLY, H.J., Spatial distribution of net surface accumulation on the Antarctic ice sheet, Ann. Glaciol. 31 (2000) 171-178.
[2] MAYEWSKI, P.A., GOODWIN, I.D., International Trans Antarctic Scientific Expedition (ITASE): 200 years of past Antarctic Climate and Environmental Change, Science and Implementation Plan, PAGES Workshop Report Series, 97-1 (1997) 48 p.
[3] FREZZOTTI, M., POURCHET, M., FLORA, O., GANDOLFI, S., GAY, M., URBINI, S., VINCENT, C., BECAGLI, S., GRAGNANI, R., PROPOSITO, M., TRAVERSI, R., UDISTI, R., FILY, M., Spatial and temporal variability of snow accumulation in East Antarctica from traverse data, Climate Dynam. (in press).
[4] MAGAND, O., FREZZOTTI, M., POURCHET, M., STENNI, B., GENONI, L., FILY, M., Climate variability along latitudinal and longitudinal transects in East Antarctica, Ann. Glaciol. (in press).
[5] POURCHET, M., PINGLOT, F., Radioactivity measurements applied to glaciers and lake sediments, Sci. Total Environ., 173-174 (1995) 211-223.
[6] VAUGHAN, D.G., BAMBER, J.L., GIOVINETTO, M., RUSSEL, J., COOPER, A.P.R., Reassessment of net surface mass balance in Antarctica, Jour. Climate, 12 (1999) 933-946.
410

EXTENDED SYNOPSIS IAEA-CN-118/40P
TOPIC: THE ATMOSPHERE
1
Study of Radionuclides Content at ca. 11 km Altitude by Use of Cabin Filters from Airliners
J. W. Mietelski, P. Gaca, S. Grabowska
The Henryk Niewodniczanski Institute of Nuclear Physics, Polish Academy of Sciences, Kraków, Poland
E-mail address of main author: [email protected]
Radionuclides in ground- level air are often monitored at many locations all over the globe. Contrarily, the results on the high altitude concentrations of radionuclides are rather scarce. To learn more about radionuclides content at ca. 11 km altitude we decided to use cabin filters of airliner, which are a waste, when removed from the aeroplane after about 2 years exploitation. It seems to be interesting to test in what extension the results on the radionuclides content obtained using this material could be comparable with the results obtained from purposely collected samples from much more expensive high altitude air-samplers which were especially installed on the aeroplanes [1] or balloons to investigate the radionuclides in the upper troposphere or low stratosphere.
We obtained two samples from Boeing 767 airliners exploited on the north Atlantic routs by LOT Polish Airlines. We looked for natural as well as artificial nuclides, which are gamma, alpha or beta emitters, especially for 7Be, 22Na, 40K, 137Cs, 238Pu, 239, 240Pu.
Gamma spectrometric measurements were done using low-background system with veto muon detector and Etruscan lead inner shield, alpha activity determination was performed using Silena AlphaQuattro alpha spectrometer with Canberra PIPS detectors. Alpha measurements were preceded by adequate radiochemical separation processes. It should be noticed, that dust from filters contain mostly organic matter, after ashing in 600°C only about 20% of original mass remains.
One of the special interest question was the plutonium activity and especially the activity ratio for plutonium alpha emitters: 238Pu and 239,240Pu. The 239,240Pu activity was 19.4±1.3 mBq/kg or 14.1±1.8 mBq/kg for dry dust, for first and second filters, respectively. The 238Pu to 239,240Pu activity ratio was found surprisingly high from 22% to 26%. It was far more higher then the global fallout value of 0.03 or 0.04 [2]. The origin of this high ratio remains unclear at this moment, one of possible explanation is that traces of 238Pu from US crashed in 1964 satellite SNAP 9A are still present in the stratosphere.
411

J. Mietelski et al.
2
FIG. 1. Alpha spectrum of plutonium fraction dust (66.0 g) from airliner cabin filter, 10 mBq of 236Pu added as a tracer, measurement was lasting for three weeks.
[1] KOWNACKA, L., JAWOROWSKI, Z., Nuclear Weapon and Chernobyl Debris in the Troposphere and Lower Stratosphere, Sci. Total Environ. 144 (1994) 201-215.
[2] UNITED NATIONS SCIENTIFIC COMMITTEE ON THE EFFECTS OF ATOMIC RADIATION, Ionizing Radiation Sources and Biological Effects, 1982 Report to the General Assembly, with annexes, United Nations sales publication E.82.IX.8, United Nations, New York (1982).
412

EXTENDED SYNOPSIS IAEA-CN-118/41P
TOPIC: THE ATMOSPHERE
1
The Development of the Detailed Climatic Scenarios for Central Asia Region
I. Sh. Normatov
Institute of Water Problems, Hydroenergetics and Ecology, Academy of Sciences, Republic of Tajikistan
E-mail address of main author: [email protected]
In Tajikistan Republic over 10% of the territory is the zone of everlasting snow and glaciers. This territory requires strategic defence, as global anthropogenic increasing of temperature more perceptibly tells upon the regime of forming the river flow and activation of ice disintegration. Intense glaciers melting causes not only decreasing of the fresh water supply for Central Asia but also the formation of glacial lakes. Therefore there appears the danger of destructive mountain flows, which caused the human victims and land degradation not once. Under modern climatic conditions the area of the Pamirs and Alai’s glaciers is decreasing annually by 1.2 sq. km. As a whole on region the tendency of decrease of emission of polluting substances from stationary sources in air pool is observed. If in 1990 the quantity of emission has made of 6793 thousand tons, by 1995 this size has decreased on 2084 thousand tons.
The maximal contribution to total amount of emissions of polluting substances in an atmosphere has of Kazakhstan – 68%. The share of other countries of Central Asia is distributed as follows: Uzbekistan – 18%, Turkmenistan – 10%, Kyrgyzstan – 2% Tajikistan – 2%.
In structure of manufacture of the electric power by Kazakhstan on a share of hydroelectric power station is 6-7%, dusty and coil – 79%, gas and fuel – oil – 12-13%.
In structure of generating capacities of power stations of Uzbekistan the densities of thermal power stations makes 87.4%, hydroelectric power stations – 12.6%. As power resources for manufacture of energy the share of gas makes 82.6%, black oil – 13%, coil –4.4%.
The constant escalating of thermal capacities results in an aggravation of an ecological problem of region. Emissions of harmful substances by boiler of thermal power stations at development 1.0 GWt.h. is: Flying ashes and not burned down fuel – 4.6 thousand tons, oxides of sulfur – 4.4. thousand tons, oxides of nitrogen – 1.0 thousand t., thus are used about 850 thousand tons of atmospheric oxygen. It is necessary to note, that 1.0 tons oxide of nitrogen 1.0 thousand tons of a nitric layer, that results in decrease of absorbability of rigid ultra-violet space radiations. The decrease of absorption results in increase of intensity of rigid ultra-violet radiation in areas UV-AND (400-315 nm) and UV-IN (315-280 nm). The radiation has erythem, carcinogenic, antimythotic (lethal for a crate), mythogenic and other properties.
Recently published report on change of a climate prepared within the framework of the convention UNO concerning change of a climate, hydrometeoretical by a service of Uzbekistan, predicts negative consequences of influence of change of a climate on a condition
413

I. Normatov
2
of water resources. According to the given report for the period with 1957 for 1980 the glaciers in Central Asia have decreased in the sizes on 19%.
The Aral crisis is most vivid example of an ecological problem with serious socio-economic consequences, to which directly or all states of Central Asia are indirectly connected. The crisis situation caused by drying of the Aral Sea, has developed as a result of an agrarian orientation of economy on the basis of development of irrigation agriculture and growth irrevocable use of water on irrigation.
The essential river drain in deltas of Amu Darya and Syrdarya is insufficient for preservation ecological system. Since 1961 the sea level was constantly lowered with growing speed from 20 up to 90 sm. per one year. There is an intensive drainage and salting of grounds in deltas of these rivers, deep degradation of hydromorph ecological system. Former bottom of the sea became a source dusty and salty of carries on change of a temperature is observed. Moreover annually from dried up parts of bottom of the sea by a wind rises in air about 75 mln. tons of salt and sand, which are already found out at top of Pamir glaciers.
The observing network in Tajikistan Republic has a unique peculiarity, which differs it from similar networks in other countries. It is situated at the altitudes of 300 to 4,169 m, i.e. in the troposphere. All those stations were included into the world observing network.
In Tajikistan numerous scientific works require proper processing. Today it is necessary to make systematization and scientific analysis of hydrometeological data, accumulated for the last hundred years.
The foundation of the stations of the local and global monitoring of the greenhouse gases opens the wide perspective to establish the changing dynamics of green concentration according to the altitudes. It establishes the dependence of the snow and glaciers melting process and the formation of the river flows on the greenhouse gases concentration at the different heights, as well as the influence of the greenhouse gases on the flora and fauna.
The results of conducted measurements, observations of the greenhouse gases influencing the environment will generate the research and practical works in developing modern technologies, which provide the essential decrease in the greenhouse gases emission and the wide use of untraditional energy carriers instead of organic fuels.
414

EXTENDED SYNOPSIS IAEA-CN-118/42P
TOPIC: THE ATMOSPHERE
1
Determination of Mid-latitude Radon-222 Flux from the Southern Ocean using Atmospheric Radon-222 Concentration Measurements at an Island Ground Station
W. Zahorowski, S. Chambers, A. Henderson-Sellers
Australian Nuclear Science and Technology Organisation, Menai, New South Wales, 2234, Australia
E-mail address of main author: [email protected]
Terrestrial radon (radon-222) fluxes typically exceed oceanic fluxes by 2-3 orders of magnitude [1]. This sometimes leads to the oceanic flux being neglected in atmospheric models [2, 3]. However, direct comparisons between observed and simulated atmospheric radon concentration at remote sites with extended oceanic fetch would benefit from the inclusion of a realistic oceanic radon flux within models [4].
Existing estimates of oceanic radon fluxes are not well constrained, with values ranging over two orders of magnitude (0.0011 - 0.15 atoms cm-2s-1) [1, 5]. At present, the primary factors contributing to the poor characterisation of oceanic radon fluxes are the limited number of observations, and the representativeness of the published results. Previous studies have employed either the accumulation [1] or gradient methods [5]. Both methods are based on spot measurements and as such, are subject to local conditions. More importantly, it would be difficult, if not impossible, to relate such results to a wider range of environmental parameters such as wind speed and sea state, which have a significant effect on ocean-atmosphere exchange.
We present a method for the determination of regional oceanic radon fluxes. The method is applied to a subset of high sensitivity hourly atmospheric radon concentration observations from 1999 to 2003 made at Cape Grim, Tasmania (40°41’S, 144°41’E), a World Meteorological Organisation Global Atmosphere Watch (WMO GAW) station. A simple expression for an average oceanic radon flux is derived and applied using a subset of the observations considered to be representative of air parcels with an extended oceanic fetch.
We discuss the dataset using the notion of an ‘oceanic event’, which is defined here as any set of consecutive hourly observations coming from the oceanic sector. Typically, the duration of a single oceanic event will vary from a few hours to a few days. The intermittent nature of boundary layer wind fields can result in short-term transitions across the oceanic sector boundaries when the air mass has mixed origins. Since the terrestrial radon source is much stronger than the oceanic source, only oceanic events that persist on synoptic time-scales are likely to include hourly observations that are representative of a minimally perturbed oceanic fetch. The evolution of radon concentration in the composite oceanic event was examined. It was found that radon concentrations in the first 20-30 hours after change to the oceanic sector are strongly perturbed from oceanic values. After the initial 20-30 hours, mean radon concentrations in the composite oceanic event are within the 95% confidence interval. This suggests that radon concentrations from this portion of the composite oceanic event are minimally perturbed from typical oceanic values.
415

W Zahorowski et al.
2
The lowest value in the range of estimated mean radon flux from the region of the Southern Ocean within the Cape Grim radon measurement fetch is about 0.0026 atoms cm-2s-1. This value is thought to constitute a lower limit estimate since it was obtained assuming negligible loss of radon from the marine boundary layer to the free troposphere. Taking into account the entrainment of radon from the marine boundary layer to the lowest layer within the free troposphere, derived from airborne measurements of mixing of dimethyl sulphide and aerosol particles over the Southern Ocean, leads to an upper limit estimate of about 0.006 atoms cm-
2s-1. Based on the 10 and 90 percentile radon concentration and wind speed observations, and assuming a mechanically driven mixing height, the regional oceanic radon flux may vary from 0.0014 to 0.008 atoms cm-2s-1 with changes in the sea state induced by wind and other environmental parameters.
Our findings support the common assumption that oceanic radon fluxes are 2-3 orders of magnitude lower than terrestrial radon fluxes, which are typically within the range 0.5-2 atoms cm-2s-1. Our values are lower than some experimental spot estimates of oceanic radon flux rates made in the seventies [1, 5]. However, they are in close agreement with more recent estimates of the flux derived from model evaluation studies and also with radon flux values assumed in an intercomparison of the convective and synoptic processes of 20 global atmospheric transport models sponsored by the World Climate Research Program [4].
The new method of oceanic radon flux derivation can be applied to other sites around the world where ‘clean’ ocean air can be clearly identified. The method offers an alternative to experimental local/spot estimates of oceanic radon flux such as the accumulation method and gradient methods. More importantly, it is representative of a large region and allows results to be related to a wider range of environmental parameters that influence sea state (e.g. wind speed), which have a significant effect on ocean-atmosphere exchange.
[1] WILKENING, M.H., CLEMENTS, W.E., Radon 222 from the ocean surface, J. Geophys. Res. 80 27 (1975) 3828-3830.
[2] MAHOWALD, N.M., RASCH, P.J., EATON, B.E., Transport of 222 radon to the remote troposphere using the Model of Atmospheric Transport and Chemistry and assimilated winds from ECMWF and the National Center for Environmental Prediction/NCAR, J. Geophys. Res. 102 (D23) 28 (1997) 139-28, 151.
[3] DENTENER, F., FEICHTER, J., JEUKEN, A., Simulation of the transport of Rn222 using on-line and off- line global models at different horizontal resolutions: a detailed comparison with measurements, Tellus 51B (1999) 573-602.
[4] JACOB, J.J., PRATHER, M.J., RASCH, P.J., SHIA, R.-L., BALKANSKI, Y.J., BEAGLEY, S.R., BERGMANN, D.J., BLACKSHEAR, W.T., BROWN, M., CHIBA, M., CHIPPERFIELD, M.P., DE GRANDPRÉ, J., DIGNON, J.E., FEICHTER, J., GENTHON, C., GROSE, W.L., KASIBHATLA, P.S., KÖHLER, I., KRITZ, M.A., LAW, K., PENNER, J.E., RAMONET, M., REEVES, C.E., ROTMAN, D.A., STOCKWELL, D.Z., VAN VELTHOVEN, P.F.J., VERVER, G., WILD, O., YANG, H., ZIMMERMANN, P., Evaluation and intercomparison of global atmospheric transport models using 222Rn and other short lived tracers, J. Geophys. Res. 102 (D5) (1997) 5953-5970.
[5] PENG, T.-H., BROECKER, W.S., MATHIEU, G.C., LI, Y.-H., Radon evasion rates in the Atlantic and Pacific oceans as determined during the Geosecs program, J. Geophys. Res. 84 (1979) 2471-2486.
416

EXTENDED SYNOPSIS IAEA-CN-118/43P
TOPIC: STABLE ISOTOPES
1
Sources of Fine Organic Matter on the Southwestern Iberian Continental Shelf
D. Burdloffa, M. F. Araujoa, J. M. Jouanneaub
a Instituto Tecnológico e Nuclear (ITN), Environmental Analytical Chemistry Group, Sacavém, Portugal
bUMR 5805 Environnements et Paléoenvironnements Océaniques (EPOC), Talence, France
E-mail address of main author: [email protected]
Organic carbon (OC) and total nitrogen (TN) concentrations and the stable isotopic composition, d13C, of fine (<63 µm) size fractions of sediments carried by the large Iberian river basins to the Southwestern Iberian continental shelf were employed to identify changes in sources of organic matter. Surficial sediments were collected in the Gulf of Cadiz continental shelf between mouths of Guadiana and Tinto-Odiel Rivers (Fig. 1). In addition, sediment samples were recovered from vibro core 5 (water depth: 72 m; length: 3.53 m) on the Guadiana continental shelf.
Surficial sediments adjacent to the Guadiana River are characterized by values that reflect mixtures of marine and terrestrial inputs (averages ± 1σ: OC/TN = 9.4 ± 0.9; d13C = -24 ± 0.12‰). d13C, OC and TN concentrations shift to higher values in the regions far from the Guadiana River, indicating a gradual decrease of fine terrigenous supply to the deeper continental shelf. For depths higher than 70 m, d13C, OC and TN concentrations are evenly distributed along the whole of the Cadiz continental shelf (OC/TN = 8.8 ± 0.2; d13C = -21.7 ± 0.3‰) (Fig. 2A, 2B).
An average sedimentation rate of 0.13 cm.yr-1 has been estimated using the 210Pb-excess profile in the first ten centimetres of core 5. The calculated OC mass accumulation rates (1.2 ± 0.1 mgC.cm-2.yr-1) represented only a small fraction (~1%) of the total particle flux in the core top. The relatively high OC/TN and depleted d13C values (respectively 9.9 ± 0.6 and –23.3 ± 0.4‰) do not support an exclusive marine contribution for core 5 (Fig. 2C, 2D).
Based on a binary mixture in which one end-member is best represented by terrestrial organic sources (d13C ~ -27‰) [1], the second being a marine organic source enriched in 13C (d13C ~ -21‰), the d13C records suggest that sedimentary organic matter corresponds to a roughly constant mixture in which 40% of fine-sized organic matter is derived from terrestrial sources in this setting.
417

D. Burdloff et al.
2
FIG. 1. Location of core 5 and surficial sediments sampled on the Southwestern Iberian continental shelf. This map was obtained from [2].
FIG. 2. Plots of OC/TN molar ratios and d13C of fine (< 63 µm) size fractions of: (A,B) surficial sediments, and (C,D) sediments in vibro core 5 from the Southwestern Iberian continental shelf.
Acknowledgments – A part of this study is supported by the CRIDA project (PLE/8/00) “Consequences of River Discharge Modifications on Coastal Zone and Continental Shelf ” through a financial support from FCT (Fundação para a Ciência e Tecnologia). We are grateful to FCT who support D. Burdloff through a postdoctoral fellowship (SFRH/BPD/6892/2001) at the ITN (Instituto Tecnológico e Nuclear).
[1] BOUTTON, T.W., Stable carbon isotope ratios of soil organic matter and their use as
indicators of vegetation and climate change, Mass Spectrometry of soils (BOUTTON, T.W., YAMASAKI, S., Eds), Marcel Dekker Inc., (1996) 47-82.
[2] MACHADO, A., ROCHA, F., ARAÚJO, M.F., VITALI, F., DIAS, J.A., GOMES, C., Application of Chemical and Mineralogical Parameters for the Characterisation of Surficial Sediments of the Continental Shelf off Guadiana Estuary, Ciencias Marinas (in press).
δ 13 C VS PDB ( ‰ )
0
50
100
150
200
250
300
350
- 26 - 25 - 24 - 23 - 22 - 21 - 20
Guadiana Piedras Tinto/Odiel
0 20 40 60 80
100 120 140 160 180 200 220
7 9 11 13 O C / T N (mol.mol - 1 )
Dep
th (
cm)
0 20 40 60 80
100 120 140 160 180 200 220
- 26 - 25 - 24 - 23 - 22 - 21 - 20 δ 13 C VS PDB (‰)
0
50
100
150
200
250
300
350
7 9 11 13 OC / T N (mol.mol - 1 )
Guadiana Piedras Tinto/Odiel
Dep
th (
m)
A B C D
418

EXTENDED SYNOPSIS IAEA-CN-118/44P
TOPIC: STABLE ISOTOPES
1
Temporal Analysis of Stable Water Isotopic Characteristics in the Murray Darling Basin
A. Henderson-Sellers a, P. Aireya, D. Stonea, J. Bradda, K. McGuffieb
a Environment, Australian Nuclear Science and Technology Organisation, Lucas Heights, NSW, Australia
bDepartment of Applied Physics, University of Technology, Sydney, Broadway, NSW, Australia
E-mail address of main author: [email protected]
“Water shortages, especially in tropical countries, are the climate challenge for this century” [1]. The isotopic composition of water and carbon in e.g. ice cores, ground water and biomass has been recognized as relevant to hydro-climates on timescales from glacial [2] to extreme weather [3]. We present Australian stable water isotope (SWI) research capability and exploit it in novel ways in order to establish objective validation of and improvement in existing water resource models ultimately reducing uncertainty in predictions.
The use of stable water isotopes in hydro-climate modelling is refined on three timescales for the Murray Darling Basin. Isotopes demonstrate that in semi-arid regions, groundwater recharge occurs when the rainfall intensities exceed a threshold suggesting improvement of aquifer predictions over tens to thousands of years using isotopic threshold estimates. A range of atmospheric global circulation models ’ simulations of key hydrological parameters over years to decades reveals poor results for the majority (13 in 20) and underlines the value of isotopic constraints on basin hydrology. Modelling minute to monthly isotope fluxes using land surface schemes and a steady state (phenomenological) model of river hydrology allows comparison of the partitions of precipitation between transpiration, run-off and ‘lake’ evaporation with isotope observations from June 2002 to January 2003. These results will have the greatest importance if combined to improve the dynamics of simulations of regional water cycles [4].
Three timescales have been used here to explore the role of stable water isotopes in refining climate and hydrological models of the Murray Darling Basin. Firstly, over tens to thousands of years, we have examined the processes leading to the effective recharge of groundwater. The isotope data clearly indicate that in the warm arid/semi-arid regions, in contrast to the behaviour in cool temperate zones, effective recharge only occurs when the rainfall intensities exceed a threshold value. Isotopic estimates of this recharge threshold rainfall intensity could be applied to predictions of future groundwater resources. Secondly, over years to decades, we have assessed the success of a range of atmospheric global circulation models in simulating key hydrological parameters over the AMIP II period including El Niño and La Niña forcing. The results are rather poor for the majority (13 out of 20) AGCMs suggesting that further constraints on the basin’s hydrology, such as from isotopes, may be valuable. In our third approach, we have modelled minute to monthly isotope fluxes using (a) land surface schemes (LSSs) at particular grid points within the Murray Darling Basin and (b) a steady state (phenomenological) model of river hydrology.
419

A. Henderson-Sellers et al.
2
Model conservation, climatic variations and ‘plausibility’, all pre-requisites for good simulations, have been investigated here for the Murray Darling. Models’ partitions of precipitation between transpiration, run-off and ‘lake’ evaporation are compared with isotope observations from the Darling River between June 2002 and January 2003. We find that: (i) more work is needed on gross water fluxes first; (ii) simple isotopic models generate plausible values but more complex ones, as yet, do not; and (iii) isotopes have potential for evaluation of whether LSSs are (in)correctly recharging and accessing groundwater reservoirs and for evaluation of the partitioning of water into runoff cf. re-evaporation. Tests based around these concepts offer a novel addition to the traditional methods of validating climate models and their sub-components.
[1] PACHAURI, R., Chair IPCC, AGU public lecture, San Francisco, 11 Dec 2003. [2] PETIT, J.R., JOUZEL, J., RAYNAUD, D., BARKOV, N.I., BARNOLA, J.-M.,
BASILE, I., BENDER, M., CHAPPELLAZ, J., DAVISK, M., DELAYGUE, G., DELMOTTE, M., KOTLYAKOV, V.M., LEGRAND, M., LIPENKOV, V.Y., LORIUS, C., PÉPIN, L., RITZ, C., SALTZMANK E., STIEVENARD, M., Climate and atmospheric history of the past 420000 years from the Vostok ice core, Antarctica, Nature 399 (1999) 429–436.
[3] LAWRENCE, J.R., GEDZELMAN, S.D., Tropical ice core isotopes: do they reflect changes in storm activity, Geophys. Res. Lett., 30 2 (2003) 44-1 to 44-4, 10.1029/2002GL015906
[4] HENDERSON-SELLERS, A., MCGUFFIE, K., NOONE, D., IRANNEJAD, P., Using stable water isotopes to evaluate basin-scale simulations of surface water budgets, J. Hydrometeorology (in press).
420

EXTENDED SYNOPSIS IAEA-CN-118/45P
TOPIC: STABLE ISOTOPES
1
An Indigenous Visual Approach to On-Line Acquisition & Analyses of Stable Isotope Data from Mass Spectrometers
Q. M. Hussain, M. A. Tasneem, R. M. Qureshi
Radiation and Isotope Application Division, Pakistan Institute of Nuclear Science and Technology, Nilore, Islamabad, Pakistan
E-mail address of main author: [email protected]
This project was initiated to replace the existing data acquisition system in the Mass Spectrometer Laboratory being used for environmental stable isotopic ratio measurements in aquatic samples at Pakistan Institute of Nuclear Science & Technology (PINSTECH), Islamabad, Pakistan. Each ratio of aquatic samples or working standard is based on two analog voltage signals (i.e. minor & major) coming from the measuring system of the mass spectrometer being utilized for analysis. The measuring device has got a common ground for both the minor and the major signals. These two signals represent different masses of the isotope(s) being measured and are received by a digital multimeter which converts them to digital values and computes the stable isotope ratio found in the aquatic samples which are being analyzed. The operating software is written in DOS-based GWBASIC. The digital multi-meter is an expensive device and locally unavailable even up to the extent of spare parts. Therefore it was decided to replace this old setup with the new mechanism by replacing the digital multi-meter with computer based ADC card and to make the hardware comparatively shorter, precise and more easily maintainable. The project consists of two phases: The first phase includes the development of Data Acquisition Software, named SPECTROM, in Visual C++ 6.0 using a simulated work station involving 12-bit ADC for 18O measurements in aquatic samples. After development, SPECTROM was tested on simulation scale to assess the performance of both the software and hardware. NI-DAQ software and hardware of 12-bit was used by taking several test runs in order to see the accuracy of signal acquisition and AD conversion. During repeated operations, it was noted that the acceptable accuracy of measurements was best up to only two fractional digits in case of 12-bit conversions. This first phase was completed and the progress report was compiled. In the second phase, 24-bit data acquisition equipment was incorporated in SPECTROM and the system was then operated by taking several test runs in order to see the improvement in the accuracy of signal acquisition and AD conversion. The table below shows a few of comparative readings:
12-bit Acquisition 24-bit Acquisition 4.9863 4.9817 4.9861 4.9817 4.9863 4.9817 4.9862 4.9817 4.9864 4.9818 4.9860 4.9818
421

Q. Hussain et al.
2
The difference found in the last two fractional digits clearly indicates the difference in accuracy.12-bit system was, therefore, replaced by 24-bit system. The system is now fully operative for 18O measurements in aquatic samples. Figure 1 shows a typical view of 12-bit version of SPECTROM on computer screen. The computed per mil standard deviation can be IGNORED or the measurement may be REPEATED for new readings or EXIT button can be used to end the process. SPECTROM contains several such user- friendly dialogs. On the right side, we see the graphical view of the value of minor signals. By changing over the channel from o to 1, graphical view of the value of major signals can be seen. Any way, if the per mil standard deviation is acceptable, the user presses the IGNORE button and SPECTROM goes on towards further computations, so that, finally, the sample #, the value of 18O against the working standard i.e. DELTA-O18(WS) and the standard deviation are displayed/printed under the headings visible on the left side of SPECTROM area.
FIG. 1. A Typical view of 12-bit version of SPECTROM on computer screen.
[1] Computer Based Instruments, NI LAB-PC-1200/AI User’s Manual (1998). [2] Computer Based Instruments, NI 4350/4351 User’s Manual (1998).
422

EXTENDED SYNOPSIS IAEA-CN-118/46P
TOPIC: STABLE ISOTOPES
1
Application of Stable Isotope Tracers to evaluate the Hydrodynamic Mechanisms of Heavy Metal Mobilization in Copper Ore Tailings
K. Knoellera, M. Schubertb
a UFZ Centre for Environmental Research Leipzig-Halle, Dept. of Isotope Hydrology, Halle/Saale, Germany
bUFZ Centre for Environmental Research Leipzig-Halle, Dept. of Analytical Chemistry, Halle/Saale, Germany
E-mail address of main author: [email protected]
The weathering and erosion of mining and ore processing residues may have a negative impact on local surface waters, which again is likely to be detrimental to groundwater quality. Assessing the environmental response and the dimension of the impacts requires understanding the interaction between the contaminant source and the involved flow systems. The paper presents results of a research on the potential of environmental isotope signatures (d18O and d2H) to trace heavy metal emissions from a heap of processing residues via a spring situated at the foot of the heap.
The main goal of the investigation was to localize the source of contamination. The heap is considered to be a black box, with no indication given, if the heavy metals in the spring water, with concentrations of up to 2.000 mg/L, are predominantly leached from the processing residues by percolating rain water or by groundwater, entering the heap’s base and reappearing at the spring. Knowledge of these processes is essential for the remediation of the site. Thus, the aim of the investigation was to distinguish spring water, which is dominated by local precipitation, from groundwater and to correlate the waters of different origin to the heavy metal contents of the spring water. High contaminant concentrations in the spring water did not allow distinguishing the waters by their chemical composition. In consequence, isotope signatures were used for differentiation.
Figure 1 displays the monitored data of spring discharge, rain, δ18O, and δD during a selected observation period in October 2003. In the course of that period, several lighter rain events occurred that did not significantly affect the spring discharge. Also, the isotopic composition of the rain water during the smaller events resembled the average isotopic composition of the spring water so that no significant temporal variation of the isotope data of the spring was observed.
In contrast to the minor variations during the lighter rain events, the discharge showed an immediate response to a heavier rain event. At its peak the discharge was about four times higher than before the event. However, the isotopic composition of the spring water, which is also shown in Fig. 1, indicates that only a part of the additional discha rge directly results from percolating rain water. 30 minutes after the first significant increase of the discharge the additional discharge, which is about 100% above normal background values, only contains 30 % of rain water. At its peak, just 10% of the additionally discharged water is rain water.
423

K. Knoeller and M. Schubert
2
That means that only immediately after the rain event the spring discharge is directly influenced by percolating rain water.
FIG. 1. Temporal variation of spring discharge, rain, and the isotopic composition of spring and rain water at the Stadtborn spring during a 8-day period in October 2003.
During the heavier rain event the lowest metal and sulfate concentrations are reached 30 minutes after the first increase of the discharge, i.e. when the influence of percolating rainwater is most pronounced. The Zn, Cd and SO4 concentrations decrease to 45 % of the background concentration, Pb drops even down to 17 %. The decrease in concentrations can be explained by dilution. At the peak of the spring discharge, however, the concentrations begin to rise again. That indicates that as soon as the share of percolating rain water in the spring water decreases and the spring water is dominated by discharge from the aquifer, dilution becomes less relevant. This again shows that percolating rainwater only seems to cause a dilution of the contaminants, while the additional discharge of the aquifer triggers additional mobilization of the heavy metals, which occur mainly as sulfates.
The results indicate that the source of contamination seems to be located at the base of the heap. While percolating rain water does not mobilize significant amounts of contaminants, groundwater that emerges from the aquifer and migrates at the base of the heap has a strong impact on the heavy metal load of the spring water. Further studies, including those on d34S signatures along with tracer tests, are planned to verify that idea. If the additional data should confirm the present concept, it could be concluded, that covering the heap would not be an appropriate remediation measure.
424

EXTENDED SYNOPSIS IAEA-CN-118/47P
TOPIC: STABLE ISOTOPES
1
Seasonal Change of CO2 Recycling Rate by Understory Vegetation in a Cool-Temperate Forest in Japan
M. Kondoa, M. Uchidab, H. Muraokaa, H. Koizumia
a Institute for Basin Ecosystem Studies, Gifu University, Gifu, Japan
bJapan Agency for Marine-Earth Science and Technology (JAMSTEC), Yokosuka, Japan
E-mail address of main author: [email protected]
Three main factors govern dynamics of CO2 within a forest canopy: turbulent mixing with the atmosphere above canopy, photosynthesis and respiration. CO2 released by respiration is either lost from the forest through turbulent mixing or refixed by photosynthesis within the canopy (CO2 recycling). CO2 concentration ([CO2]) in a forest generally increases from canopy layer toward the soil surface due to the high [CO2] by plant and soil respiration. Therefore, the understory vegetation is capable of fixing the respired CO2 through photosynthesis, and this process would highly influence the carbon dynamics within a forest.
In a temperate deciduous forest, stand structure is seasonally changed by the seasonal change of foliage biomass distribution and changes the environment factors in the forest understory such as light attenuation and soil temperature which affect photosynthetic activity of understory plants and respirations of plants and soil microbes. In this study, we examined how [CO2] and δ13C of canopy profile change daily and seasonally in a cool-temperate deciduous forest at Takayama Experimental Site (36°8’N, 137°6’E, 1420m a.s.l.) in Japan. We also estimated the percentage of respired CO2 recycled by understory vegetation using a model developed by Sternberg (1989) [1]. At the Takayama Experimental Forest site, the understory is dominated by an evergreen dwarf bamboo grass (Sasa senanensis (Fr. Et Sav.) Rehdar).
There were showed dramatic changes in canopy foliage density and environmental conditions within the forest in only about five months of plants’ growing season. There were clear diurnal changes in [CO2] within the forest ([CO2]canopy), especially on the soil surface, in mid-summer (August). [CO2] canopy and δ13C of CO2 (δ13Ccanopy)were vertically stratified in the forest, with maximum [CO2] (ca. 478ppm) and most negative δ13C value (-12.5‰) near the soil surface (Fig. 1). The diurnal variations of [CO2]canopy and δ13Ccanopy were also clearly observed in the forest; daytime [CO2]canopy was considerably lower than that in night due to photosynthetically CO2 uptake in daytime while respiratory CO2 efflux and its accumulation occurred around the dense understory vegetation in night. The Sternberg’s model [1] using, we calculated the fraction of respired CO2 that was refixed photosynthetically by S. senanensis. The percentage of respired CO2 refixed by S. senanensis ranged from 5 to 16% in summer depending on the diurnally fluctuated [CO2]canopy in the understory. [CO2]canopy and δ13Ccanopy showed small diurnal variation and small vertical difference in spring and autumn, reflecting reduced biological activities due to tree leaves fall (Fig.1). The percentage of respired CO2 recycled by S. senanensis ranged from 22 to 26% in spring, and from 16 to 21% in autumn. These results were discussed in this study in terms of environmental and physiological factors as follows; (1) source CO2 effects ([CO2]canopy and δ13Ccanopy) due to the
425

M. Kondo et al.
2
seasonal change of soil respiration rate and turbulent mixing which depends on forest canopy closure and (2) leaf photosynthetic discrimination effects influenced by the photosynthetic and stomatal responses to diurnal light incident patterns that are different between summer and spring (or autumn).
FIG. 1. Canopy profiles of δ13Ccanopy (a) and [CO2]canopy (b) on August 2002 and May 2003.
[1] STERNBERG, L., A model to estimate carbon dioxide recycling in forests using 13C/12C ratios and concentrations of ambient carbon dioxide, Agric. Forest Meteorol. 48 (1989) 163-173.
heig
ht (m
)
heig
ht (m
)
δ13Ccanopy
(ä) [CO2]canopy
(ppm)
Aug.2002
(a) (b)
heig
ht (m
)
heig
ht (m
)
δ13Ccanopy
(ä) [CO2]canopy
(ppm)
May.2003
(a) (b)
426

EXTENDED SYNOPSIS IAEA-CN-118/48P
TOPIC: STABLE ISOTOPES
1
Photo- and Chemo-Synthetic Organic Carbon Production and its Fate in the Black Sea: Use of Isotopic Techniques and Tracing
A. Yilmaza, Y. Çoban-Yildizb
a Middle East Technical University, Institute of Marine Sciences, P.O. Box 28, 33731, Erdemli, Mersin, Turkey
bMersin University, Department of Environmental Engineering, Çiflikköy, 33343, Mersin, Turkey
E-mail address of main author: [email protected]
The Black Sea is a unique marine environment representing the largest land- locked/semi-enclosed and deep anoxic basin in the world. Its shelf region is generally narrow and it enlarges at the north western corner. It has a very large catchments area, receiving extraordinary amount of nutrients, pollutants as well as fresh water. The coastal waters of the Black Sea are principally fed by the river input and by the lateral/ vertical nutrient transport mechanisms. In the open ecosystem, which is dominated by the cyclonic eddies, primary production is mainly sustained by the influx of nutrients from the oxic/suboxic lower layers mainly by vertical mixing processes. However, the input from the anoxic layer is limited due to the presence of a permanent pycnocline in the Black Sea which coincides with the oxic-anoxic transition zone. Intense denitrification and redox-dependent processes within this zone limit nitrogen and phosphorus input to the productive layer (Fig. 1).
Multilayer systems having anoxia support multiple layers of biological production [1, 2]. In addition to photosynthetic production at the surface layer, microbial communities at the oxic-anoxic interface live on the residual chemical energy (e.i. H2S, CH4, NH4
+, H2) originate from anoxic waters. Photosynthetic and chemosynthetic production rates have been measured using 14C isotopic technique in the Black Sea for 1998-2001 period and the results are presented in this synopsis.
The thickness of the euphotic zone was in the range of 15-35 m in the Black Sea during the study period. Photosynthetic production rates in this zone were in between 141 and 639 mg C m-2 d-1. The lowest values were recorded in the central regions and the highest values were measured at the Turkish and Romanian shelf areas. Bioassay experiments showed that under optimum light conditions, the production is nitrogen limited in the Black Sea and NH4 is preferable with respect to NO3. In recent years, production in the Black Sea was more intense in autumn and less pronounced in spring.
Present data showed that, chemosynthetic production at O2-H2S interface is relatively high in the Black Sea and it is potential mid-water source of sedimentary biogenic particles for the basin related to the microbial activities and red-ox processes which are persistent features in the Black Sea ecosystem. Lateral transports of oxygenated waters from coastal areas possibly enhance the chemoautotrophic production. Indeed, the carbon produced at midwater depths may exceed the surface photosynthetic production. Arial chemosynthetic production for open region was 93.5 mg C m-2 d-1, corresponding to 54% of the surface photosynthetic production.
427

A. Yilmaz and Y. Çoban-Yildiz
2
It was much higher (1951 mg C m-2 d-1 and 722% of the surface photosynthetic production) in coastal area, not only because of higher peak values, but also due to presence of thicker chemosynthetically active layer. For comparison, the range of chemo-autotrophic production in the Cariaco basin was 312-1884 mg C m-2 d-1 and this was equivalent to between 10% and 333% of its surface primary production [3].
Planktonic nitrogen productivity and relative importance of NO3, NO2 and NH4 on productivity in the Black Sea were estimated using 15N isotopic technique. Though the main nitrogen source utilised by phytoplankton was NH4, annual ‘f-ratio’ was unexpectedly high, which could not be compensated by the estimated budget of new nitrogen input. Available estimations on new nitrogen input to the euphotic zone of the Black Sea corresponded to less than 20% of annual N-production rate estimated and the direct measurements revealed an f-ratio of 0.3-0.5. N2 fixation seems to play a role in nitrogen supply and their potential contribution in supplying new nitrogen to the euphotic zone should be clarified.
Carbon and nitrogen natural isotopic ratios (d15N and d13C) of suspended particulate organic matter (SPOM) produced in the water column of the Black Sea were also determined in the Black Sea. The results revealed important vertical and regional variations in terms of isotopic composition while the seasonality was less remarkable. SPOM of each layer possessed distinct isotopic composition associated with microbial decomposition and formation of organic matter. Isotopic signature of planktonic productivity in the euphotic zone, bacterial decomposition in the oxycline, chemo-auto- and –heterotrophic activities in the suboxic and anoxic layers were traced. C and N isotopic composition of Black Sea SPOM collected revealed that planktonic production and rapid recycling in the nutrient-poor surface layers. Dominance of ‘old’ partially decomposed fragments of SPOM dominated by lipids in the oxycline. Intense microbial activity in the suboxic/anoxic transition layer of especially coastal regions partially aerated by Mediterranean water.
FIG. 1. Black Sea multi-layer system and processes in biogeochemical cycling.
[1] JORGENSEN, B.B., FOSSING, H., WIRSEN, C.O., JANNASCH, H.W., Sulfide oxidation in the anoxic Black Sea chemocline, Deep-Sea Res. 38 (1991) S1083-S1103.
[2] SOROKIN, Y.I., The Black Sea- Ecology and Oceanography, Backhuys Publishers, UNESCO Venice Office, Leiden (2002) 875 pp.
[3] TAYLOR, G.T., IABICHELLA, M., HO, T.Y., SCRANTON, M.I., Chemoautotrophy in the redox transition zone of the Cariaco Basin: A significant midwater source of organic carbon production, Limnol. Oceanogr. 46 1 (2001) 148-163.
NO2-
NO3-
NH4+
N2
primaryproducer
zooplankton & bacteria
NH4+
NO2-
lateral transports
(river)
atmospheric inputs
uptake
grazing & consumption
remineralisation
oxidation
oxidationNO3-
fixation
DIN
DIN
DIN
DIN
vertical transports
EU
PH
OT
IC Z
ON
E
NH4+
NO3-
NO2-
NO2-
NO2-
N2
reduction
denitrification
NH 4+
organic matter
organic matter
organic matter
NH4+remin.
oxidationreduction
decomposition
production
oxidation
sinking
production
decomposition
lateral transports
(Bosphorus )
OX
YC
LIN
ESU
BO
XIC
ZO
NE
AN
OX
ICZ
ON
E
428

EXTENDED SYNOPSIS IAEA-CN-118/49P
TOPIC: STABLE ISOTOPES
1
Isotope Shift Investigations in the Even Configurations of Hafnium I
A. T. Bouzed, M. K. Tabet, A. M. Amari, A. A. Shaban
Department of Physics, Laser Unit, Tajoura Research Center, P.O. Box 30878 Tripoli, Libya
E-mail address of main author: [email protected]
The isotope-shift (IS) of 12 spectral lines of the Hafnium I (Hf I) in its natural composition were investigated in the wavelength region from 565 nm to 650 nm by means of optogalvanic laser spectroscopy (OGS) and laser saturation absorption spectroscopy (SAS) using a hollow cathode discharge and a tunable single mode cw dye laser.
TABLE I. EXPERIMENTAL LINE IS OF Hf I RELATIVE TO Hf178 AS STUDIED IN THIS WORK AND THOSE PRESENTLY KNOWN FROM LITERATURE
airλ
(nm)
180178−∆T
(MHz)
179178−∆T
(MHz)
178177−∆T
(MHz)
178176−∆T
(MHz)
178174−∆T
(MHz)
Ref.
565.08 -1 791(18) -1 543(24) This work 566.20 -1 895(22) -1 628(31) This work 567.95 -1 850(8) -644(18) -1 182(17) -1 587(17) This work 571.91 147(3)
71.9(6.0) 47(4) 96(3) 116(4)
119.9(6.0) This work
[1]
581.75 -1 821(24) -1 565(30) This work 584.59 -1 872(9)
-1 885.7(9.0) -683(11)
-1 220(12) -1 586(18) -1 609.9(9.0)
1 537.9(81)
This work [1]
588.63 -1 247(4) -450(10) -790(9) -1 064(7) This work 589.05 240(4) 86(7) 145(6) 208(6) This work 590.29 -984(4)
-987.2(4.3) -1 007.3(9.0) -854(57)
-361(5) -362.2(6.2) -379.1(4.1)
-614(6) -613.1(6.9) -614.8(8.0)
-855(7) -856.6(3.9) -860.4(9.0) -1 046.3(18.0) -908(33)
-1 723(24) -1 709 (5.3) -1 784(60)
This work [1] [2] [3] [4] [5]
593.37 217(3) 80(4) 129 (4) 190(5) This work 597.43 382(5) 130(5) 232(4) 331(6) This work
638.62 -1 020(6) -375(7) -650(9) -904(9) This work
429

2
The experimental values of the level isotope-shift between the stable isotopes of Hf-I referred to of these lines were evaluated and used in the parametric analysis for the even configurations 2265 sd and sd 65 3 . The IS parameters of Hf-I were used to look to the systematic trends in the series of the d5 -elements. Doppler-limited optogalvanic laser spectroscopy and saturation-absorption laser spectroscopy was applied to investigate the isotope-shift. This was carried out using a tunable single mode cw dye laser (Coherent Radiation 699-29) with Rohdamin 6G and DCM dyes was used for this purpose. A modified see-through hollow cathode lamp with a liquid nitrogen cooling system served to evaporate the Hafinum. The surface of the bore of cathode was covered with 0.15 mm Hf I foil in its natural isotopic composition. The hollow cathode gas discharge was run with currents between 20 mA and 100 mA in Argon gas at a about 1 mbar. We measured 12 spectral lines in the range from 565 nm to 639 nm. The evaluation IS and HFS was then performed using the average of these scans. The results are listed in Table I.
[1] CAJKO, I., Z. Phys. 234 (1970) 443-454. [2] ZIMMERMANN, D., BAUMANN, P., KUSZNER, D., WERNER, A., Phys. Rev. A 50
2 (1994). [3] GOLOVIN, A.F., KRAMER, I.F., Opt. Spectrosc. 23 105, 19967. [4] BARR, W.L., Phys. Rev. 48 (1958) 658. [5] ANASTASSOV, A., GANGRSKY, Y.P., KULL’DJANOV, B.K., MARINOVA, K.,
MARKOV, B.N., NAD JAKOV, E., ZEMLYANOI, S.G., Z. Phys. D 25 1 (1992).
430

EXTENDED SYNOPSIS IAEA-CN-118/50P
TOPIC: BIOMONITORS
1
Zinc Uptake and Behaviour in the Scleractinian Coral Stylophora Pistillata
F. Boissona, C. Richardb, C. Ferrier-Pagèsb
a Marine Environment Laboratory, International Atomic Energy Agency, 4 Quai Antoine Ier, MC 98000 Monaco
bCentre Scientifique de Monaco, Av. Saint Martin, MC-98000 Monaco
E-mail address of main author: [email protected]
Zinc (Zn) is essential for organism growth as it is a cofactor of nearly 300 enzyme systems. In phytoplankton, carbonic anhydrase, a zinc-based metalloenzyme, is involved in the inorganic carbon acquisition from seawater. The activity of this enzyme has been shown to be dependent on the level of CO2 and on the availability of zinc, thus conferring on zinc a key role in oceanic carbon cycling. Reef-building corals are autotrophic organisms, living in symbiosis with dinoflagellates called zooxanthellae. In the nutrient-poor tropical environment, concentrations of zinc might be low enough to limit photosynthesis and calcification in corals. A radiotracer technique was used to determine whether a scleractinian coral has the ability to efficient ly bioaccumulate and retain the low in situ amounts of dissolved zinc required for its enzymatic activity determining its growth, and if there is any role played in this process by the symbiotic organism, the zooxanthellae.
To assess the Zn uptake and behaviour in Stylophora pistillata, two experiments were performed with 20 microcolonies each (culture method described in [1]). The corals nubbins were kept in the dark for the first experiment while they received 300 µmol photons m-2 s-1 in the second experiment at 8 different stable Zn concentrations in the experimental medium (5 nmoles l-1 being the natural zinc concentration measured in the seawater). Colonies were incubated 12 hours in 0.22 µm filtered seawater spiked with the radiotracer 65Zn (T1/2 = 244.3 days). The gamma emission of 65Zn (506 KeV) in the skeleton, tissue and seawater was determined using a well type NaI detector. The chlorophyll fluorescence of the photosymbiotic components of the corals was measured using the underwater fluorometer Diving PAM (Walz, Germany).
The linear relationship (Fig. 1) obtained between concentrations of zinc incorporated in coral tissue and zinc concentration in the experimental medium ranging from environmental to high levels suggests that, (1) zinc diffuses through the coral tissue without any active transport process and, (2) almost the totality of zinc present in seawater is taken up by the coral tissue, the incorporation of zinc into the skeleton representing between 3 and 17% of the total zinc bioaccumulated in coral nubbins.
The uptake rates measured in coral tissues for the light/dark experiment (Fig. 2) ranged from 3.8 to 4.5 pmoles Zn (mg protein)-1 h-1. Zinc uptake rates were significantly higher for microcolonies of corals incubated under light conditions than values obtained in the dark (t-test, p < 0.05), while no significant difference was observed for Zn uptake rates in the skeleton (t-test, p > 0.05). These results indicate that zooxanthellae (located in the tissue of
431

F. Boisson et al.
2
the corals) play a significant role in the incorporation of this metabolically essential metal. This is in agreement with the results of [2], who provided some evidence to suggest that zooxanthellae may have different metals loads than the coral tissue.
The results of the chlorophyll fluorescence of the photosymbiotic components of the corals further show that zinc enrichment in the marine environment stimulates the photosynthetic capacity of the corals through an enhancement of the activity of the coral’s PSII. As a consequence, the calcification of corals should be also enhanced.
than the coral tissue.
FIG. 1. Bioaccumulation of Zn in coral tissues FIG. 2. Influence of light/dark regime on Zn as a function of [Zn] in seawater. uptake rate in coral tissues and in the skeleton.
[1] TAMBUTTÉ, E., ALLEMAND, D., BOURGE, I., GATTUSO, J.P., JAUBERT, J., An improved 45Ca protocol for investigating physiological mechanisms in coral calcification, Mar. Biol. 122 (1995) 453-459.
[2] MARSHALL, Occurrence, distribution and localisation of metals in cnidarians review, Microscopy and Technique 56 5 (2002) 341-357.
[Zn]
(nm
oles
mg
prot
ein-1
)
0
1
2
3
4
5
6
0 1000 2000 3000 4000 5000 6000
[Zn] in seawater (nmoles -l)
Y = 0.97 x + 91.62 R2 = 0.996
[Zn]
(nm
oles
mg
prot
ein-1
)
0
1
2
3
4
5
6
0 1000 2000 3000 4000 5000 6000
[Zn] in seawater (nmoles -l)
Y = 0.97 x + 91.62 R2 = 0.996
Zn
upta
ke r
ate
(pm
oles
(mg
prot
ein-
1 )h-
1 )
0
1
2
3
4
5
6
Tissue (light) Tissue (dark) Skeleton (light) Skeleton (dark)
Zn
upta
ke r
ate
(pm
oles
(mg
prot
ein-
1 )h-
1 )
0
1
2
3
4
5
6
Tissue (light) Tissue (dark) Skeleton (light) Skeleton (dark)
432

EXTENDED SYNOPSIS IAEA-CN-118/51P
TOPIC: BIOMONITORS
1
Distribution of Radioactive Caesium, Potassium and Selected Chemical Elements in the Macrophytes from the Southern Baltic Waters and Application of Factor Analysis to study Interelemental Relationships
R. Zbikowskia, R. Bojanowskib, P. Szeferc, A. Latalaa
a Institute of Oceanography, Laboratory of Marine Plant Ecophysiology, University of Gdansk Gdynia, Poland
bInstitute of Oceanology, Polish Academy of Sciences, Sopot, Poland
cDepartment of Analytical Chemistry, Medical University of Gdansk, Poland
E-mail address of main author: [email protected]
Radioactive elements are specific kind of pollutants in aqueous environment. In Poland, the problem of radiological exposure has arised since 1986 as a consequence of nuclear power station disaster in Chernobyl. Hence, a greater amount of isotope 137Cs has been introduced into the Baltic Sea. Unfortunately, information on the concentrations of 137Cs in macrophytes from the Polish economical zone waters following the Chernobyl accident are missing. The aim of the present investigations was to determine distribution and relationship of 137Cs and 40K content as well as selected macroelements (Ca, K, Na, Mg) and heavy metals (Cd, Cu, Ni, Pb, Mn, Zn) in benthic flora from the Southern Baltic waters (Gulf of Gdansk and Vistula Lagoon) to find correlations and evaluate environmental quality of this areas.
The radionuclide content were measured by gamma spectrometry. It was found in the present study that in the macrophytes from the Gulf of Gdansk the average content of 137Cs was 13.7 Bq/kg d.wt. Particularly high level of this element was noted in Ectocarpaceae, Polysiphonia sp., and Myriophyllum spicatum, from the Gulf of Gdansk and in Enteromorpha sp. from the Vistula Lagoon. Comparing concentration factors (CF) of individual species it could be stated that they are several times higher in the macrophytes from the Vistula Lagoon than in those of the Gulf of Gdansk. The content of 40K in the benthic plants from the Gulf of Gdansk (240 Bq/kg d.wt. on the average, range 82-423 Bq/kg d.wt.) was comparable to the values noted in the macrophytes from the Vistula Lagoon (322 Bq/kg d.wt. on the average, range 62-557 Bq/kg d.wt.). Ectocarpaceae and Zostera marina from the Gulf of Gdansk as well as Nuphar luteum and Ceratophyllum sp. from the Vistula Lagoon were especially rich in 40K. The values of 40K concentration factors in the vascular plants from the Gulf of Gdansk (range: 9-25) and in the Vistula Lagoon (range: 15-26) were similar. The comparison of 137Cs content in 7 species of the benthic plants from the Gulf of Gdansk to the analogous data obtained in 1973 does not reveal significant changes, with the exception of Myriophyllum spicatum where higher activities were found in the years 2000-2002.
The content of the selected metallic elements for the macrophytes was determined by flame atomic absorption spectroscopy (FAAS). The relationships and correlations between radionuclides and metallic elements contents in benthic plants from the Southern Baltic waters were determined using factor analysis with STATISTICA program.
433

EXTENDED SYNOPSIS IAEA-CN-118/52P
TOPIC: BIOMONITORS
1
High levels of Natural Radioactivity in Biota from Deep Sea Hydrothermal Vents
S. Charmassona, M. Agarande b, D. Louvata, A-M. Neiva Marquesb, P-M. Sarradinc, J. Loyenb, D. Desbruyèresc
a Institut de Radioprotection et de Sûreté Nucléaire (IRSN), DEI/SESURE BP 330 83507 La Seyne sur mer cedex, France
bIRSN/DEI/STEME, France
cIFREMER Centre de Brest, Département Environnement Profond, France
E-mail address of main author: [email protected]
Hydrothermal vent ecosystems are associated with areas of tectonic activities throughout the deep sea and are thus enriched in natural primitive radionuclides characterizing the magma source i.e. uranium-thorium series. However, the amount of data on radionuclide content in hydrothermal vent biota is very scarce. Here we present data from various archived biological samples collected on several hydrothermal vent site. Samples were collected by manned or unmanned submersibles on the East Pacific Rise (EPR) in 1996 and 2002 and on the Mid Atlantic Ridge (MAR) in 2001 (Table I).
TABLE I. CHARACTERISTICS OF THE LOCATIONS AND SPECIES SAMPLED AT VARIOUS VENT SITES
Sampling dates
Site f G Depth Species
02/20/1996 Genesis EPR 12°48N 103°56W 2640m Polychaetes Alvinella
03/11/1996 Q vent EPR 09°51N 104°17W 2530m Polychaetes Paralvinella
06/28/2001 Rainbow MAR 36°13N 33°54W 2300m Crustacean Rimicaris 07/03/2001 Lucky strike
MAR 37°17N 32°16W 1700m Mollusc Bathymodiolus
07/10/2001 Menez Gwen MAR
37°51N 31°31W 850m Mollusc Bathymodiolus
05/10/2002 Elsa EPR 12°48N 103°56W 2640m Vestimenfères Riftia
05/25/2002 Genesis EPR 12°48N 103°56W 2640m Polychaetes Paralvinella
05/25/2002 Genesis EPR 12°48N 103°56W 2640m Paralvinella Tubes + mucus
Their concentrations in uranium and thorium isotopes were determined by isotope dilution mass spectrometry. Measurements were performed with a Sector field ICP-MS, the Axiom single collector from VG Elemental (Winsford, Cheshire, UK). 210Po was determined through alpha spectrometry .
434

S. Charmasson et al.
2
TABLE II. 234U, 235U, 238U AND 210Po CONTENTS (Bq kg-1 DRY WEIGHT) IN VARIOUS ORGANISMS FROM HYDROTHERMAL VENTS AND IN ONE CRUSTACEAN SAMPLE FROM OUTSIDE HYDROTHERMAL VENT ECOSYSTEMS (IN ITALICS)
Sampling dates
Species/Location 234U
238U 235U 210Po
06/28/2001 Rimicaris (MAR) 18.8±1.1 16.9±0.4 0.79±0.05 na*
07/03/2001 Bathymodiolus (MAR) 106.7±4.02 83.7±2.4 3.8±0.1 na 07/10/2001 Bathymodiolus (MAR) 10.5±0.7 14.0±0.3 0.43±0.03 na 02/20/1996 Alvinella (EPR) 166.4±8.9 199.8±8.8 9.3±0.5 na 03/11/1996 Paralvinella (EPR) 830.4±106.3 660.3±74.6 30.5±3.8 na 05/10/2002 Riftia (EPR) 6.5±0.8 39.5±2.2 1.86±0.14 100±18 05/25/2002 Paralvinella (EPR) 1074.5±132.7 856.0±91.9 39.9±4.9 na 05/25/2002 Tubes+mucus (EPR) 3566.7±478.5 3041.8±326.7 143.2±18.7 16,000±1300 08/04/2000 Orchomenella
(Abyssal plain) 1.48 ± 0.06 5.21±0.21 0.25±0.02 na
*na: not analyzed
Results in Table II underline that high levels in uranium isotopes are found in polychaetes from the East Pacific Rise. The highest contents characterize their tubes plus mucus samples. On the contrary, the deep-sea amphipod sample (Orchomenella) collected outside hydrothermal vent areas exhibits the lowest values though direct comparison is difficult due to variability between species. 238U contents in coastal marine organisms are generally in the range 1 to 5 Bq kg-1 dry weight. Comparison between sites (Atlantic vs Pacific) is not obvious since different species have been sampled on MAR and EPR but the highest levels characterize the samples from EPR. Some samples demonstrate 234U/238U ratios very close to the mean value for seawater (1.1 – 1.2) but four present lower ratios (i.e. one sample of Bathymodiolus, Paralvinella, Riftia and Orchomenella). This is certainly to be linked to an uptake of particulate uranium. 210Po contents are very high in polychaetes tubes and mucus and are almost entirely supported by 210Pb. This in agreement with what has been reported by Cherry et al. (1992) for polychaetes (Alvinella and Paralvinella) from EPR. These authors also reported highest levels for these elements in Paralvinella (i.e. 15113 and 19038 Bq kg-1 dry weight for 210Pb and 210Po respectively).
We are aware that this work is still based on too few data. A major work has to be done on this topic but these first results appear to be promising. The determination of vent organism concentrations for key elements in the uranium-thorium families has to be carried out in order to precisely determine the radiation exposure they are subject to. This appears especially important at the time where international bodies aim at promoting the development of criteria on the protection of the environment from effects arising from exposures to ionizing radiation.
Acknowledgments : The authors are grateful to the Chief Scientists of the various cruises, i.e. F. Gail (HOPE 1996), P. M. Sarradin (ATOS 2001) and N. Le Bris (PHARE 2002). Part of this work has been funded through the Ventox project EVK3 CT1999-2003 of the European Commission.
[1] CHERRY, R., DESBRUYÈRES, D., HEYRAUD, M., NOLAN, C., High levels of natural radioactivity in hydrothermal vent polychaetes, C.R. Acad. Sci. Paris, t. 315, Série III (1992) 21-26.
435

EXTENDED SYNOPSIS IAEA-CN-118/53P
TOPIC: BIOMONITORS
1
Influence of Ambient Dissolved Metal Concentration on their Bioaccumulation in Two Tropical Oysters: A Radiotracer Study
E. Girona, E. Buschiazzoa, L. Hédouina,b, M. Gomez Batistac, M. Metiana, V. Borne a, O. Cotreta, J.-L. Teyssiéa, S. W. Fowlera, M. Warnaua
a IAEA-Marine Environment Laboratory, Monaco
bIRD-Noumea Center, Noumea, New Caledonia
c CEAC, Cienfuegos, Cuba
E-mail address of main author: [email protected]
The tropical coastal zone is presently experiencing increasing urban and industrial development. Subsequent socio-economic development results in increased production of wastes which finally reach the coastal environment where they constitute a possible threat for local marine ecosystems [1].
The SW lagoon of New Caledonia represents a tropical case study as it is subjected to large inputs of heavy metals mainly due to intense land-based mining activities. The metal contamination concerns essentially Ni (New Caledonia is the third world producer of Ni) but also other metals such as Cr, Co and Mn which occur at elevated concentrations in Ni ores. Although mining is a continuing activity in New Caledonia, available information about the contamination status of the marine environment is extremely scarce [2, 3]. Therefore, studies are needed to understand the behaviour and fate of metals in this region in order to be able to develop coastal zone monitoring programmes and improve local marine resource management.
In the framework of the “New Caledonia” Project funded by the French National PNEC Programme, the bioaccumulation of metals was investigated in two oyster species commonly found in the lagoon: Isognomon isognomon and Malleus regula. A recent field study indicated that these bivalves showed relatively high levels of metals in their soft tissues and that they were possible candidates as bioindicator species that could be used to discriminate between contamination levels in different locations.
Among the several pre-requisites that a bioindicator species should fulfill [4, 5], the one indicating that the organism should display body contaminant concentrations that reflect those occurring in the surrounding environment is rarely assessed. Nevertheless, this assumption is of prime importance. This is particularly the case for proper interpretation of monitoring data from the New Caledonia lagoon, since a wide range of dissolved concentrations of metals may be encountered in the field (e.g., Ni dissolved concentrations range from background levels off shore up to 1,340 ng l-1 in the most contaminated bays [3]).
The objective of this work was thus to investigate the bioaccumulation behaviour of the two selected oyster species under different contaminating conditions. Seven different metals (Co, Zn, Mn, Cd, Cr, As and Ni) were considered and their bioconcentration was studied using appropriate radiotracers (57Co, 65Zn, 54Mn, 109Cd, 51Cr, 73As and 63Ni).
436

E. Giron et al.
2
The selected organisms were exposed for 14 d to five increasing concentrations of one of the six selected metals and then held for 21 d under non-contaminated conditions. During these two periods, kinetics of metal uptake and loss were determined in whole-body individuals. In addition, tissue distribution of the metals was determined at the end of both exposure and depuration periods.
Uptake kinetics were expressed as the variation of the concentration factor (CF; ratio between radioactivity measured in the organism and in sea water) over time. Steady-state equilibrium was never reached during the observation period and uptake kinetics were always best described using a simple linear equation. Loss kinetics were expressed as the variation of the percentage of remaining activity (ratio between radioactivity in the organism at time t and at the beginning of the depuration period x 100) and were best described using a single-exponential equation.
In general, the results indicated that both oyster species took up and subsequently retained metals in direct proportion to the ambient dissolved concentration for all metals tested. Regressions between kinetic parameters (uptake rate constant, depuration rate constant, and assimilation efficiency of dissolved metal) and dissolved concentrations indicated that these parameters did not vary significantly with ambient metal concentrations over the entire range of concentrations that may be encountered in the waters of the lagoon.
The present study confirmed that both uptake and retention of the seven metals tested are proportional to their ambient dissolved concentrations in I. isognomon and M. regula. These findings are of prime importance, since they demonstrate that metal concentrations measured in both oysters actually reflect those occurring in their environment, and moreover validate the usefulness of these bivalves as bioindicator species for monitoring metal contamination in the New Caledonian lagoon.
[1] HATCHER, B.G., JOHANNES, R.E., ROBERTSON, A.I., Oceanogr. Mar. Biol. Annual Rev. 27 (1989) 337-414
[2] LABROSSE, P., FICHEZ, R., FARMAN, R., ADAMS, T., New Caledonia, (SHEPPARD, C.R.C., Ed.), Seas at the Millennium: An environmental evaluation. Pergamon Press, Amsterdam (2000) 723-736
[3] BREAU, L., Etude de la bioaccumulation des métaux dans quelques espèces marines tropicales : recherche de bioindicateurs de contamination et application à la surveillance de l’environnement côtier dans le lagon sud-ouest de la Nouvelle-Calédonie, PhD Thesis, La Rochelle University, France (2003) 282 pp.
[4] MOORE, N.W., A pesticide monitoring system with special reference to the selection of indicator species, J. Appl. Ecol. 3 (1966) 261-269.
[5] PHILLIPS, D.J.H., Use of macroalgae and invertebrates as monitors of metal levels in estuaries and coastal waters, Heavy Metals in the Marine Environment (FURNESS, R.W., RAINBOW, P.S., Eds) CRC Press, Boca Raton, FL (1990) 81-99.
437

EXTENDED SYNOPSIS IAEA-CN-118/54P
TOPIC: BIOMONITORS
1
Systematic Model of Metal and Radionuclide Bioaccumulation in Crocodilian and Molluscan Calcified Tissues
R. A. Jeffreea, S. J. Markichb
a IAEA - Marine Environment Laboratory, 4 Quai Antoine 1er, MC 98000 Monaco
bAquatic Solutions International, 5 Perry St., Dundas Valley NSW 2117, Australia
E-mail address of main author: [email protected]
Bioaccumulating organisms routinely concentrate a variety of contaminants from their aquatic medium. Discerning any underlying factors that explain patterns of accumulation in a systematic way improves both the theoretical basis of our understanding of bioacccumulation and our ability to correctly interpret environmental signals that are represented by a tissue concentration or set of contaminant concentrations. Operational predictors of variance between individuals in their contaminant tissue concentrations also enhance our ability to statistically demonstrate increases above background, allowing us to infer increased environmental exposure with more confidence.
Our recent investigations have focussed on concentrations of Pb in the osteoderms (dermal bones on the dorsal surface) of crocodiles in a study designed to monitor their contemporary and historical contamination status [1]. The associated environmental sampling program also provided the opportunity to more broadly investigate patterns of metal and radionuclide accumulation in this calcified vertebrate tissue. These studies on the estuarine crocodile (Crocodylus porosus) showed that both biotic and geographical factors can affect osteodermal and flesh concentrations for a variety of elements [2, 3].
A current study determined the metal concentrations and their predictors for the osteoderms of Australian freshwater crocodiles (Crocodylus johnstoni) from a single geographically restricted area, where each sampled individual was well characterised with respect to site fidelity, reproductive status and age, extending up to 63 years [4].
Crocodile size, age and osteoderm calcium concentration were highly significant (P<0.001) predictors of the osteoderm concentrations of a range of metals. Osteodermal metal concentrations were inversely related to both size and age, but positively related to osteoderm calcium concentration, that could explain up to 92% of variance between individuals. Relative to calcium concentration, the rates of metal accumulation in the osteoderms of C. johnstoni were inversely related to the solubility constant (log Ksp) of the metal as a phosphate. However, this relationship was not linear (Fig. 1 from [4]). This finding is consistent with that previously determined in the flesh of several species of freshwater bivalves [5], which like the crocodilian osteoderm, have a calcium phosphate repository viz. their extracellular granules in flesh.
The constancy of this relationship between rate of metal accumulation and the relative solubility of the calcium phosphate deposits, despite the contrasting Ca accumulation regimes and degree of taxonomic dissimilarity, strongly suggests an underlying principle that warrants further investigation in a greater range of biota [4].
438

R. Jeffree and S. Markich
2
Furthermore, the range of predictive relationships that have been demonstrated, that explain much of the variance among individuals should provide a better capability to discern differences between populations in their contaminant status, for a variety of metals.
FIG. 1. Rate of accumulation for each metal plotted against its solubility constant (log10 K) as a phosphate for osteoderms of C. johnstoni and the flesh of a freshwater bivalve.
[1] TWINING, J., MARKICH, S., PRINCE, K., JEFFREE, R., Osteoderms of estuarine crocodiles record their enhanced Pb exposure in Kakadu National Park, Environ. Sci Technol. 33 (1999) 4396-4400.
[2] JEFFREE, R., MARKICH, S., TWINING, J., Metal concentrations in the flesh and osteoderms of estuarine crocodiles (Crocodylus porosus) from the Alligator Rivers Region, Northern Australia: Biotic and geographic predictors, Arch. Environ. Toxicol. Contam. 40 (2001) 236-245.
[3] MARKICH, S., JEFFREE, R., HARCH, B., Catchment-specific metal signatures in estuarine crocodiles (Crocodylus porosus) from the Alligator Rivers Region, Northern Australia, Sci. Total Environ. 287 (2002) 83-95.
[4] JEFFREE, R., MARKICH, S., TUCKER, A., Patterns of Metal Accumulation in Osteoderms of the Australian Freshwater Crocodile, Crocodylus johnstoni, Sci. Total Environ. (in press).
[5] MARKICH, S., BROWN, P., JEFFREE, R., Divalent metal accumulation in freshwater bivalves: An inverse relationship with metal phosphate solubility, Sci. Total Environ. 275 (2001) 27-41.
-12 -11 -10 -9 -8 -7 -6 -51.0
1.2
1.4
1.6
1.8
2.0
2.2
2.4
2.6
2.8
3.0
3.2
Ca
Ca
UPb
Cd
Ba
Mn
Sr
U Pb Cd226Ra
Ba
MnSr
Zn
ZnCo
Co
Cu
Cu
Ni
Ni
Mg
Mg
Crocodile osteoderm Bivalve flesh
Rat
e of
met
al a
ccum
mul
atio
n
Log Ksp
439

EXTENDED SYNOPSIS IAEA-CN-118/55P
TOPIC: BIOMONITORS
1
137Cs Absorption Factors (Afs) Some Vegetable and Protein Samples in Cooking
M. A. Maleka, M. Nakaharab
a Bangladesh Atomic Energy Commission, Dhaka, Bangladesh.
bNational Institute of Radiological Sciences, Hitachinaka City, Japan
E-mail address of main author: [email protected]
The human race uses fresh water for cooking, drinking and washing purposes. The source of fresh water may be radioactively contaminated by various sources of contaminants [1]. With the increased use of radioisotopes, nuclear testing, possible nuclear warfare and terror activities, the apprehension of widespread contamination of the surface and ground water is increasing day by day [2-4]. In the case of widespread contamination of freshwater sources, people may be compelled to use the contaminated water. The radionuclides in fresh water may enter the human body through two major routes: drinking and cooking food with the water. During cooking, the radionuclide present in the water may be transferred to the various ingredients of the cooked dish. The degree of contamination in the ingredients during the cooking depends on the absorption power of the individual ingredients and on the level of radionuclide present in the water. The ratio of the concentration of the radionuclide absorbed in the ingredients to the concentration in the water can be designated as the “Absorption factor” (Af).
A consumer always has the choice of eating either the whole dish or a part of the dish. The Af of every consumed ingredient can be used to predict the radionuclide absorbed by the individual ingredients cooked with contaminated water, and as such to predict the dose to the consumer. The factor can also be used to assess the dispersion of radionuclide from the water used in cooking to the ingredients in the cooked dish. A better understanding of variables in the cooking that affect the Af in various ingredients is central to deriving the contamination level of the ingredients.
To the best of our knowledge, no investigation on this topic has been conducted before. In order to assess this topic and for obtaining base line data, a research project was undertaken to determine the Afs of some vegetable and protein samples, and to investigate the effects of salinity and cooling on Af.
Boiled with normal water, the Af of various vegetable samples was found to vary from 0.4374 (in radish) to 0.9947 (in broccoli). Among the protein samples, beef was found to have the minimum Af (0.1547) and fish the maximum value (0.2777). It was observed that the Af in all vegetable and protein samples was decreased slightly with increased salinity. After boiling, the weight of cauliflower, broccoli and cabbage was found to increase slightly, and weight of brinjal, squash and cucumber was somewhat decreased. However, the weight of all protein samples was found to be decreased after boiling. For beef, the weight decreased by 50% relative to the fresh weight. Since the weight before boiling (fresh weight) is considered as the weight of the ingredient, we have used the fresh weight in the calculation of Af.
440

M. Malek and N. Nakahara
2
It was observed that cooling has profound effect on Af in both protein and vegetable samples. Almost in every sample, the Af was found to increase after cooling. Relative to the immediate value after boiling, the Af in chicken was increased by 82% (maximum), in beef by 81% and in fish by 75% (minimum) due to cooling. In all vegetable samples except cauliflower and broccoli, the Af was found to increase, with the highest increase is in cauliflower leaves (44%), and the lowest is in cucumber (20%), relative to the immediate value after boiling. In cauliflower, the Af was decreased by 5% and in broccoli by 3% relative to the immediate value after boiling.
It seems that cooling and salinity has a profound effect on 137Cs absorption in protein samples. The increases in Af for all samples were maximum at a the salinity level of 1.5 gm/L. Relative to the immediate value after boiling, fish shows the maximum increase in Af (121%) at a the salinity level of 1.5 gm/L. Further increases in salinity resulted in a decreased Af. At the 3 gm/L salinity level, the Af in all the samples was found to be decreased. Therefore it is concluded that at 1.5 gm/L salinity, Af in chicken, beef and fish reaches its maximum value.
[1] UNITED NATIONS SCIENTIFIC COMMITTEE ON EFFECTS OF ATOMIC RADIATION, Sources and Effects of Ionizing Radiation, United Nations, New York (2000) 47.
[2] BLAYLOCK, B.G., FRANK, M.L., DEANGELIS, D.L., Bioaccumulation of 95mTc in fish and snails, Health Phys. 42 (1982) 257-266.
[3] CARVALHO, F.P., Comparative uptake from sea water and tissue distribution of 60Co in marine mollusks, Health Phys. 53 (1987) 73-81.
[4] HARRISON, F.L., "Accumulation and loss of cobalt and cesium by the marine clam, Mya arenaria, under laboratory and field conditions", Radioactive contamination of marine environment (Proc. IAEA Symp.) IAEA-SM-158/28, IAEA, Vienna (1972) 453-478.
441

EXTENDED SYNOPSIS IAEA-CN-118/56P
TOPIC: BIOMONITORS
1
Radiocaesium and Radiostrontium Uptake by Lentils via Leaf and Root Absorption
M. B. Oncsik
Research Institute for Fisheries, Aquaculture and Irrigation (HAKI). Szarvas, Hungary
E-mail address of main author: [email protected]
The contamination of biosphere can affect plants either by direct deposition onto leaves, or by contaminating the soil followed by absorption by the roots. Knowledge of the efficacy of the two routes of radionuclide corporation, into the food chain is fundamental understanding the mechanism by which radioactive contamination reaches man [1]. The present work forms part of a broader study of soil/plant transfer factors in characteristic representatives of semi-arid ecosystems which have the potential to have been influenced by recent radioactivity releases. In particular in the study to be described here, we evaluated comparatively the incorporation via root and leaf absorption of radionuclide into the part of the plant [2-4]. The field experiment was carried out in Szarvas, which is situated 100 km far from the Hungarian Nuclear Power Plant. For the analytical study of root and plant uptake we used 134Cs and 85Sr in the form of their chlorides, both dissolved in 0,1M HCl. These solutions were applied two different stages of growth and four different values of specific activity. The first treatment was carried out at the sowing time of lentils; the second treatment was done during the flowering of plants. The specific activity of radionuclide solutions were ranged between 83 – 2500 kBq l-1, respectively. The plants were harvested at ripening stage, and they were divided into organ parts (e.g. seeds, husk, leaves and stalk). The radioactivity of samples was measured via scintillation detector. The soil-to-plant transfer factor (TF) of a radionuclide is defined as “concentration of the radionuclide per unit dry weight of the plant organ at the time of harvest (Bq kg-1)” divided by “radioactive contamination per unit surface of soil (Bq m-2)”. The TFs of the radiocaesium summarized in this study for different organs are given in Table I. The TFs of 134Cs for seeds samples obtained from the four treatments were in the range of 0,017 – 0,031. The values for the leaves and stalk were much higher than those for seeds. Caesium is known to behave like K in plant; this may cause a high concentration of Cs in leaves.
442

M. Oncsik
2
TABLE I. TRANSFER FACTORS OF RADIOCAESIUM FROM SOIL TO DIFFERENT PART OF LENTILS
Specific activity Transfer factor (TF) m2 (kg dry matter)-1 * 10-3 Bq l-1 Seeds Husk Leaf Stalk 2500 0.0172 0.0880 0.7416 0.6444 250 0.0208 0.0520 0.7508 0.9324 125 0.0204 0.0244 0.4892 0.5656 83 0.0308 0.0440 0.7424 0.7612
The TFs of 85Sr for edible part and by-products of lentil are summarized in Table II. The value of transfer factors for seeds was in the ranges of 0.116 – 0.213. The highest TF was determined for leaves and stalk.
In addition, in this study we obtained TF values for 134Cs are lower compared to the values for 85Sr. TF values of radionuclides are thought to be influenced mainly by two factors, i.e. kind of radioisotopes and part of plants.
TABLE II. TRANSFER FACTORS OF RADIOSTRONTIUM FROM SOIL TO DIFFERENT PART OF LENTILS
Specific activity Transfer factor (TF) m2 (kg dry matter)-1 * 10-3 Bq l-1 Seeds Husk Leaf Stalk 2500 0.1852 2.6976 4.7212 3.8192 250 0.1160 1.7496 4.0688 3.8888 125 0.1208 1.1628 4.0896 3.3692 83 0.2132 0.8808 5.1664 4.1780
[1] BAN-NAI, T., MURAMATSU, Y., Transfer factors of radioactive Cs, Sr, Mn, Co and Zn from Japanese soils to root and leaf of radish, J. Environ. Radioact. 63 (2002) 251-264.
[2] ONCSIK, M.B., EGED, K., KIS, Z., KANYÁR, B., A validation study for the transport of 134Cs to strawberry, J. Environ. Radioact. 61 (2002) 319-329.
[3] BRAMBILLA, M., ONCSIK, B.M., Evaluation of a model for leaf to fruit transfer of radionuclides in processing tomato plants using an independent set of data, J. Environ. Radioact. 73 (2004) 117–126.
[4] KABAI, É., ZAGYVAI, P., LÁNG-LÁZI, M., ONCSIK, M., Radionuclide migration modelling through the soil-plant system as adopted for Hungarian environment, Sci. Tot. Environ. (in press).
443

EXTENDED SYNOPSIS IAEA-CN-118/57P
TOPIC: BIOMONITORS
1
Use Fish Biomarker Response in the Evaluation of the Black Sea Coastal Ecosystem Health
I. Rudneva, L. S. Oven, N. F. Shevchenko, E. N. Skuratuvskaya, T .B. Vahtina, O. S. Roshin
Institute of Biology of the Southern Seas, National Ukrainian Academy of Sciences, Nahimov av., 2, Sevastopol 99011, Ukraine
E-mail address of main author: [email protected]
Environmental stress in the Black Sea coastal zone resulted very negative biological events in ecosystem in various levels of its biological organization from molecular to the community [1]. The peculiarities of the polluted responses should be applied for the assessment of stress factors and their after-effects. Fish populations are the most sensitive to anthropogenic impact. Within the past 40 years the number of fish species in the Sevastopol coastal zone was declined in 2-fold and their storage in 100-fold/. Thus fish responses to stressors could be used for evaluation of the entire ecosystem health [2].
Highly distributed fish species Scorpaena porcus and Neogobius melanostomus were used as biomonitors of the coastal zones ecological status evaluation. The fish were collected from polluted and non-polluted bays in Sevastopol region and their study includes various biological indicators (biomarker) analysis.
Biochemical studies of antioxidant enzyme activities (catalase, SOD, peroxidase, glutathione reductase and glutathioone-S-transferase), transaminases and aldolase in blood serum of fish caught in polluted areas showed the increase of the activity of main antioxidant enzymes SOD and glutathione-S-transferase, while the other parameters were not differed. At the same time lipid peroxidation level was higher in fish inhabited contaminated areas as compared with the individuals from the non-contaminated bay which was connected with the oxidative stress induced by the high concentrations of the xenobiotics in environment. Significant differences between lipid concentration, lipid composition and law molecular weight antioxidants were not identified. Elelctrophoretical studies of blood serum proteins demonstrated the changes in the protein composition and their variability in fish from polluted and non-polluted areas. Thus the most polluted sensitive to biochemical indicators in fish are antioxidant enzyme activities (SOD and GST), lipid peroxidation parameters and blood serum proteins elelctrophoretic spectra.
Various anomalies were identified in fish gonads and the press of their maturation used hystochhemical analysis. The violations of gametogenesis connected with the gypertrophic oocyts lost the success of maturation and reproductive process in fish from high contaminated areas.
In spite of the fact that the population characteristics of fish (mass, size, age, liver and gonad indices) are informative biological indicators to examine population experiences stress for evidence of long-term impact we could not determine the significant changes between these parameters in both fish species from the studied bays. It could be connected with the high
444

I. Rudevna et al.
2
level of the anthropogenic impact and contamination of Sevastopol bays. Thus, the most sensitive indicators to pollution are biochemical and hystochemical parameters. They could used for evaluation of the marine coastal ecosystem health and adapted for national and international marine monitoring systems.
[1] RUDNEVA, I., Environmental and security challenges in the Black Sea region. In: Environmental conflicts: Implications for Theory and Practice, (PETZOLD-BRADLEY, E., CARRIUS, A., VINCZE, A., Eds), Kluwer Academic Publications, Netherlands (2001) 189-207.
[2] ADAMS, S.M., SHEPARD, M.S., GREELY, J., JIMENEZ, B.D., RYON, M.G., SHUGART, L.P., McCARTHY, J.F., HINTON, D., The use of bioindicators for assessing the effects of pollutant stress in fish, Mar.Environ. Res. 28 1-4 (1989) 459-464.
445

EXTENDED SYNOPSIS IAEA-CN-118/58P
TOPIC: BIOMONITORS
1
Use the Microcalorimetry Method in Pollution Response Evaluation of Marine Organisms
I. I. Rudneva, V. G. Shaida, N. S. Kuzminova
Institute of the Biology of the Southern Seas, National Ukrainian Academy of Sciences, Nahimov av. 2, Sevastopol, 99011, Ukraine
E-mail address of the main author: [email protected] net
Studies of the metabolic responses of marine animals on the pollution are determined by various analytical techniques, including respirometry, biochemical, physiological analysis and direct calorimetry, which is preferable in this case because it permits to study metabolic rate in vivo [1]. The goal of the present study was to analyze the heat production in some Black Sea organisms in different stages of their development exposed in toxicants (PCB and pesticides) and the influence of the environmental pollution on this parameter.
Heat production of microalgae, highly distributed crustacea in hypersaline coastal lakes and bays Artemia salina nauplia, larvae of fish Neogobius melanostomus and Atherina hepsetus exposed in toxicants and metabolic rate of Atherina hepsetus larvae inhabited polluted and non-polluted areas were measured in the Biological Activity Monitor BAM 2277 (Thermometric, Sweden) [2].
The obtained results showed that in all cases examined stressors led negative effects on testing marine organisms. They resulted increase mortality and decrease the heat production. The metabolic rate of the Artemia nauplia exposed in Cu-containing pesticide cuprocsat (2.5 mg per L) was decreased more than 2-fold. The phosphororganic pesticide cyfoz was more toxic and led the decline of crustacea larvae metabolic rate in 4-fold at the concentration of 1.25 mg per L.
The effect of PCB (0.001 and 0.0001 µg per L) on heat dissipation of Artemia and fish larvae is presented in Table I. In both cases the heat production in treatment larvae was significantly less as compared to the intact organisms. Additionally the increase of hatching time in during A. salina and N. melanostomus incubated in PCB was demonstrated.
The metabolic rate of the A. hepstus larvae caught in polluted area was significantly less as compared with the corresponding parameter of the larvae from non-polluted water. Thus the decrease of heat production in marine organisms exposed in different kinds of toxicants resulted the damage of their metabolism and differences between energetic rate. The heat production is very sensitive non-specific parameter for evaluation of organisms status exposed in different stressors.
446

I. Rudevna et al.
2
TABLE I. HEAT PRODUCTION OF ARTEMIA AND FISH LARVAE EXPOSED IN DIFFERENT CONCENTRATIONS OF PCB (µWt PER INDIVIDUAL, M ± m)
Species Intact PCB, 0.0001 µg per L PCB, 0.001 µg per L
A. salina 0.15 ± 0.01 - 0.09 ± 0.01, p<0.01
A. hepsetus 14.87 ± 1.82 - 5.46 ± 0.40, p<0.01
N. melanostomus 14.28 ± 1.32 8.52 ± 0.59, p<0.01 9.30 ± 1.04, p<0.01
[1] MICROCALORIMETRY IN BIOCHEMISTRY AND BIOLOGY, Science Tolls 19 1 (1972) 1.
[2] NORMAT, M., GRAF, G., SZANIWSKA, A., Heat production in Saduria entomoon (Isopoda) from Gulf of Gdansk during experimental exposure to anoxic condition, Mar. Biology 131 (1998) 2699-273.
447

EXTENDED SYNOPSIS IAEA-CN-118/59P
TOPIC: BIOMONITORS
1
A Microbiological Study on Rashid Black Sand Sediments, Egypt
A. El-Gamala, T. Zaghloulb, I. H. Saleha, S. Nasra, M. Naimc
a Department of Environmental Studies, Institute of Graduate Studies and Research (IGSR), Alexandria University, Alexandria, Egypt
bDepartment of Biotechnology, Institute of Graduate Studies and Research (IGSR), Alexandria University, Alexandria, Egypt
c Department of Physics, Faculty of Science, Alexandria University, Alexandria, Egypt
E-mail address of main author: [email protected]
A microbiological study was carried out to isolate and identify radio-tolerant bacteria present in a high radiation background area namely Rashid. Rashid is considered as one of the natural high radiation background areas in the world. It has been observed as the highest background radiation station along the Egyptian Mediterranean coast. This is due to the presence of black sand deposits in its sediments. Black sand contains monazite and zirconium minerals, which have uranium and thorium inclusions in their mineral structures. Gamma absorbed dose rate from Rashid black sand reached 0.72 µGy/h.
The microbiological examination of Rashid black sand revealed that, few bacterial strains, which are adapted and tolerant to this area were present. These strains were isolated, cultured and identified. Identification was carried out according to Bergey's manual [1]. Confirmatory identification was carried out using API-20E kits for Enterobacteriacae and Gram-negative isolates. Other Gram-positive isolates were partially identified based on the morphological features of colonies and cells. The identified strains were found to be Pseudomonas fluorescens, P. putida, P. aeruginosa, Chryseomonas luteola, Xanthomonas maltophilia, Bacillus spp., Staphylococcus spp., and Micrococcus spp (Table I).
The isolated bacteria could be used in several beneficial applications since other studies have proved that they can accumulate some radioactive materials [2-4]. Further studies are needed to construct an efficient, inexpensive and feasible method to remove uranium and other metals from aqueous environment.
448

A. El Gamal et al.
2
TABLE I. CELL MORPHOLOGY, ASSEMBLY, GRAM STAIN AND POSSIBLE IDENTIFICATION OF SOME ISOLATED BACTERIA FROM RASHID BLACK SAND
Cell morphology Assembly Gram stain Possible identification
Short rods Single Negative Pseudomonas fluorescens
P. putida
P. aeruginosa
Very short rods Single Negative Chryseomonas luteola
Rods Single Negative Xanthomonas maltophilia
Rods Single or in duplicate Positive Bacillus spp.
Cocci Clusters Positive Staphylococcus spp.
Cocci Mostly single Positive Micrococcus spp.
[1] SNEATH, P.H.A., MAIR, N.S., SHARP, M.E., Bergey's Manual of Systematic Bacteriology 2 (1984) Williams and Wilkins, London.
[2] PREMUZIC, E.T., FRANCIS, A.J., LIN, M., SCHUBERT, J., Induced formation of chelating agents by Pseudomonas aeruginosa grown in presence of thorium and uranium, Arch. Environ. Contam. Toxicol. 14 6 (1985) 759-68.
[3] LOVELY, D.R., PHILLIPS, E.J.P., GORBY, Y.A., LANDA, E.R., Microbial reduction of uranium, Nature 350 (1991) 413-416.
[4] SHAHAMAT, M., Sequestration of heavy metal by bacteria: Virture Newsletter, Science, March 2001, Virtue Science Meeting 2000, Microbiology.
449

EXTENDED SYNOPSIS IAEA-CN-118/60P
TOPIC: BIOMONITORS
1
Bioaccumulation of Artificial Radionuclides and Dose Assessment to Biota in the Yenisei River (Russia)
A. I. Kryshev, T. G. Sazykina
Scientific and Production Association "Typhoon", Obninsk, Russian Federation
E-mail address of main author: [email protected]
The subject of this paper is reconstruction of accumulation of artificial radionuclides (32P, 137Cs, 65Zn, 51Cr, 54Mn) by the Yenisei River biota during the 25-years period (1975–2000), and estimation of the internal dose rates to the river organisms. Yenisei River is located in Central Siberia (Russia); since 1958 artificial radionuclides intake to the Yenisei River with the routine releases from the Krasnoyarsk Mining and Chemical Industrial Complex (KMCIC). Among the radionuclides presented in the releases, 32P is of particular importance.
Reconstruction of the radionuclide assimilation by the Yenisei biota was performed using the ECOMOD model approach. The model considers a radionuclide as a tracer, identical in its properties to a stable (analogous) element participated in the metabolism of aquatic organism. Radionuclide assimilated by an organism goes to the production of new biomass, and to compensation of metabolic losses of the analogous bioelement. Basic equations of the general ECOMOD approach are described in paper [1]. The model was adapted to the conditions of the Yenisei River and applied to calculate the dynamics of 32P, 137Cs, 65Zn, 51Cr, 54Mn in the most typical Yenisei fish species: roach (non-predatory) and pike (predatory). Tables 1 and 2 show the reconstructed activity concentrations in roach and pike at the distances 16 – 80 km downstream the KMCIC. Activity concentrations of 32P in the Yenisei fish were considerably higher comparing with other radionuclides. Activity concentrations of 32P, 65Zn, 51Cr, 54Mn in roach are higher than in pike, whereas activity concentrations of 137Cs are higher in predatory species. Results of the model reconstruction were compared with the available data of measurements [2-3], and such comparison confirms adequacy of the model predictions.
Long-term dynamics of the internal exposure was estimated for the river organisms at the distances 16–80 km downstream the KMCIC. Average dose rates from incorporated γ-emitters were calculated taking into account geometric characteristics of organisms [4]; β-particles were assumed to be totally absorbed within the organisms. Average length of roach in the Yenisei River is 0.2 m, weight 0.17 kg; average length of pike in the Yenisei River is 0.52 m, weight 1.2 kg. Dose conversion factors for 32P, 137Cs, 65Zn, 51Cr and 54Mn are shown in Table 3. Annual average dose rates from incorporated radionuclides to the Yenisei biota are presented in Table 4. Maximum dose rates occurred in 1975–1980 and varied from 11 mGy/year (predatory fish) to 63 mGy/year (molluscs). These levels were several times higher than the background exposure to the Yenisei organisms, which was estimated as 0.7–4 mGy/year [3]. Major contributor to the internal exposure to the Yenisei biota is 32P (up to 95%).
450

A. Kryshev and T. Sazykina
2
TABLE I. ANNUAL AVERAGE ACTIVITY CONCENTRATIONS OF RADIONUCLIDES IN NON-PREDATORY FISH (ROACH) FROM THE YENISEI RIVER, MODEL RECONSTRUCTION
Activity concentration, Bq/kg Years 32P 137Cs 65Zn 51Cr 54Mn
1975–1980 5080 ± 2430 52 ± 46 76 ± 30 360 ± 150 24 ± 10 1981–1986 4240 ± 1850 26 ± 9 180 ± 60 320 ± 140 41 ± 16 1987–1992 3040 ± 1410 18 ± 7 81 ± 33 350 ± 150 33 ± 13 1993–2000 90 ± 40 6 ± 2 1.1 ± 0.5 3.5 ± 1.7 0.21 ± 0.17
TABLE II. ANNUAL AVERAGE ACTIVITY CONCENTRATIONS OF RADIONUCLIDES IN PREDATORY FISH (PIKE) FROM THE YENISEI RIVER, MODEL RECONSTRUCTION
Activity concentration, Bq/kg Years 32P 137Cs 65Zn 51Cr 54Mn
1975–1980 3050 ± 1460 68 ± 50 27 ± 11 230 ± 90 21 ± 9 1981–1986 2540 ± 1110 40 ± 13 76 ± 30 200 ± 80 36 ± 15 1987–1992 1830 ± 850 30 ± 10 39 ± 16 220 ± 90 30 ± 12 1993–2000 70 ± 30 10 ± 3 0.6 ± 0.4 2.2 ± 0.9 0.18 ± 0.15
TABLE III. INTERNAL DOSE CONVERSION FACTORS FOR THE YENISEI ORGANISMS
Dose conversion factor, Gy ⋅day/Bq/kg Organism 32P 137Cs 65Zn 51Cr 54Mn
Roach 9.6⋅10-9 3.9⋅10-9 5.8⋅10-10 5.0⋅10-11 8.8⋅10-10 Pike 9.6⋅10-9 4.3⋅10-9 8.8⋅10-10 7.5⋅10-11 1.3⋅10-9
Molluscs 9.6⋅10-9 3.5⋅10-9 1.7⋅10-10 1.5⋅10-11 2.6⋅10-10
TABLE IV. ANNUAL AVERAGE DOSE RATES FROM INCORPORATED RADIONUCLIDES TO THE YENISEI BIOTA
Internal dose rate, Gy/year Years Roach Pike Molluscs
1975 – 1980 (1.8 ± 0.9)⋅10-2 (1.1 ± 0.5)⋅10-2 (6.3 ± 3.2)⋅10-2 1981 – 1986 (1.5 ± 0.7)⋅10-2 (0.9 ± 0.4)⋅10-2 (5.1 ± 2.7)⋅10-2 1987 – 1992 (1.1 ± 0.5)⋅10-2 (0.6 ± 0.3)⋅10-2 (3.7 ± 1.9)⋅10-2 1993 – 2000 (3.2 ± 1.4)⋅10-4 (2.6 ± 1.1)⋅10-4 (1.1 ± 0.5)⋅10-3
[1] SAZYKINA, T.G., ECOMOD – An ecological approach to radioecological modelling, J. Environ. Radioact. 50 3 (2000) 207–220.
[2] NOSOV, A.V. ASHANIN, M.V., IVANOV, A.B., MARTYNOVA, A.M., Radioactive contamination of the Yenisei River caused by the discharges from the Krasnoyarsk Mining and Chemical Industrial Complex, Atomic Energy 74 2 (1993) 144–150.
[3] KRYSHEV, I.I., RYAZANTSEV, E.P., Ecological safety of the nuclear energy complex of Russia, IzdAT, Moscow (2000) 384 pp. (in Russian).
[4] KRYSHEV, A.I., SAZYKINA, T.G., STRAND, P., BROWN, J.E., Radioecological model for dose estimation to Arctic marine biota, (Proc. 5th Int. Conf. Environmental Radioactivity in the Arctic and Antarctic, St. Petersburg, 16–20 June 2002) NRPA, Norway (2002) 326-329.
451

EXTENDED SYNOPSIS IAEA-CN-118/61P
TOPIC: BIOMONITORS
1
Determination of γ Radiation Level and Elemental Composition in Water, Biota and Sediments from Cayo Punta Brava, Morrocoy National Park, Venezuela
J. Castillo, J. Bermúdez, L. Sajo-Bohus, E. Greaves, D. Palacios
Universidad Simón Bolívar. Apartado 89000, Caracas 1080A, Venezuela
E-mail address of main author: [email protected]
Natural and anthropogenic radionuclides and elemental composition in marine water, surface sediments, seagrass and macroalgae (Padina sanctae-crucis) from Cayo Punta Brava in Morrocoy National Park were analyzed.
Morrocoy National Park has an extension of 32.090 hect and it is conformed by several keys (Fig. 1). Its beautiful beaches make it a paradise for tourists. In 2004 Easter’s holidays Morrocoy received more than 572 thousands visitants [1]. Cayo Punta Brava is one of the most visited keys of the park (72000 tourist in 2004 Easter’s holidays) because it can be reached by tourists through a bridge which connect it to the mainland.
Samples were collected in 10 locations along the coast. Seagrass and Padina sanctae-crucis were chosen for this study since they are widely distributed along coast and they can be easily collected. Measurements of radiations levels and elemental composition were carried out using high resolution γ spectrometry and total reflection X-ray fluorescence (TXRF) respectively.
Concentrations activity levels of uranium and thorium isotopes, 40K and 137Cs were determined using a HpGe detector (Canberra) of approximately 2 KeV resolution for the 1,33 MeV 60Co peak and efficiency higher than 20% (supplied under the IAEA-Technical Co-operation project VEN-9-005).
TXRF spectrometer consist of a high voltage X-ray supply and fitted with a molybdenum anode X-ray tube operating at 45 KV and 20 mA, TXRF module fitted with a multilayer monochromator, 30 mm2 Si(Li) (Canberra) detector of 180 eV energy resolution at the 5.9 KeV Mn Kα line and a PC-based multichannel analyzer (Canberra S-100). Standard addition techniques were used for elemental concentration quantification. Marine water was measured directly and sediments after a suspension preparation, following the procedure suggested by [2]. A vapor phase digestion (VPD) technique was required for seagrass and algae solutions preparations. Preliminary results indicate that the environment is suffering from low level pollution. This study will supply base- line data for determining unequivocally any future contamination.
452

J. Castillo et al.
2
FIG. 1. Morrocoy National Park Map.
[1] http://parquemorrocoy.blogspot.com/. [2] CARIATI, F., FERMO, P., GILARDONI, S., GALLI, A., MILAZZO, A., A new
approach for archaeological ceramics analysis using total reflection X-ray fluorescence spectrometry, Spectrochim. Acta Part B 58 (2003) 177.
FIG. 2. Cayo Punta Brava.
453

EXTENDED SYNOPSIS IAEA-CN-118/62P
TOPIC: RADIOCHEMICAL TECHNIQUES
1
Determination of Th, U, Pu and Am Radionuclides in Soil and Marine Samples
M. Benkrida, S. de Figueiredob
a Centre de Recherche Nucléaire d'Alger, 02 Bd. F. Fanon, B.P. 399, Alger-Gare, Algeria
bTechnical University of Vienna, Vienna, Austria
E-mail address of main author: [email protected]
A combined procedure was used for the determination of actinides Th, U, Pu and Am radionuclides in Mediterranean sediments, IAEA reference samples, intercomparison material and Monaco seawater. The analysis was based on anion exchanges and UTEVA and TRU columns for separation and purification of the specific actinides.
The radiochemical procedure was based on Pu and Th separation by a strong basic ion exchange resin in 8M HNO3 and 10M HCl respectively after oxidation state adjustments to Pu(IV). Then the uranium was retained in a tributyl phosphate (TBP) phase and separated from any Th traces by extraction chromatography on an UTEVA resin. The Americium was pre-concentrated by co-precipitation with calcium oxalate. It was separated from rare earths by extraction chromatography on TRU resin. For alpha measurements, the sources were prepared by the NdF3 electrodeposition and co-precipitation method as illustrated by Figure 1 showing the flow scheme of the radiochemical-separation procedure for the actinide elements.
The actinides of interest are emitting alpha particles in the region of 3.95MeV (232Th) to 8.8MeV(212Po). It is not possible to find any significant variation of the detector efficiency in the energy interval ranging from 2.5 to 8.8 MeV, which makes the quantitative evaluation of alpha particles spectra much simpler than in the case of gamma ray ones.
The energy resolution improves with increased detector bias which is individually specified for each detector. The evaluation of the energy resolution of alpha peaks (FWHM= Full-Width at Half Maximum) is not straight forward due the fact that most alpha particles are not emitted at only one energy level.
The PIPS (Passivated Implanted Planar Silicon) detector has an extremely thin layer window which means less energy loss and better resolution. To ensure correct identification and quantification of alpha-emitting nuclides, it is necessary to calibrate the system for both energies, with mixed alpha standard (239+240Pu, 241Am and 244Cm) and efficiency by means of a highly polished stainless steel disc electrodeposited source (241Am). A relationship between the channel-energy and the determination of the effective detector efficiency for the chamber can be provided.
The background of the detectors is generally low. The detectors tend to be contaminated especially with 210Po (by evaporation) and by recoil nuclei (as 224Ra from 228Th). A very wide range of values were obtained depending on the sample. The 239+240Pu and 238Pu concentrations varied from 0.7 to 14.8 Bq kg-1 dry weight and from 0.016 to 2.74 Bq kg-1 dry weight respectively. The 238U and 234U concentrations ranged from 27.0 to 63.6 Bq kg-1 dry weight and 24.6 to 69.2 Bq kg-1 dry weight respectively. The 232Th concentration ranged from
454

M. Benkrid and S. de Figueiredo
2
1.23 to 63.50 Bq kg-1 dry weight. The concentrations ratios of 239+240Pu/238Pu and 234U/238U ranged from 1.42 to 43.75 and 0.91 to 1.09 respectively. The concentration ratio of 241Am/239+240Pu ranged from 3.13x10⁻⁴ to 2.74. The nuclear weapon tests and Chernobyl accident might be the only source that could explain such a contamination.
FIG. 1. Flow scheme of the radiochemical separation procedure for the actinide elements.
[1] LA ROSA, J.J., BURNETT, W., LEE, S.H., LEVY, I., GASTAUD, J., POVINEC, P.P., Separation of actinides, cesium and stront ium from marine samples using extraction chromatography and sorbents, J. Radioanal. Nucl. Chem. 248 3 (2001) 765-770.
[2] MORENO, J., VAJDA, N., DANESI, P.R., LA ROSA, J.J., ZEILLER, E., SINOJMERI, M., Combined procedure for the determination of 90Sr, 241Am and Pu radionuclides in soil samples, J. Radioanal. Nucl. Chem. 226 1-2 (1997) 279-284.
[3] HOLM, E., Review of alpha-particles spectrometric measurements of actinides, J. Appl. Radiat. Isot. 35 4 (1984) 285-290.
[4] STEINHÄUSLER, F., GASTBERGER, M., HUBMER, A.K., SPANO, M., RANALDI, R., STRONATI, L., TESTA, A., Assessment of the radiation dose due to nuclear tests for residents in areas adjacent to the Semipalatinsk test-site "polygon" (Kazakhstan).
455

EXTENDED SYNOPSIS IAEA-CN-118/63P
TOPIC: RADIOCHEMICAL TECHNIQUES
1
Validation of Alpha-spectrometric Methods for 226Ra Measurements using a Double Tracer Technique
R. Bojanowskia, Z. Radeckib
a Polish Academy of Sciences, Institute of Oceanology (PAS), Sopot, Poland
bInternational Atomic Energy Agency (IAEA), Vienna, Austria
E-mail address of main author: [email protected]
Determination of 226Ra by alpha-spectrometry is always associated with some loss of the analyte, because radiochemical operations are never quantitative. All radiochemical procedures must, therefore, include some steps to enable these losses to be quantified and accounted for in subsequent calculations.
133Ba and 225Ra are the most commonly used radionuclides for monitoring 226Ra recovery but both have some flaws. The barium does not follow exactly the behaviour of 226Ra in some radiochemical reactions, which makes the assumption of their equivalence as yield determinands questionable. As for 225Ra, its usefulness is limited by inconvenient nuclear properties combined with a complex decay scheme, which makes it difficult to maintain a stock calibrated solution in a radiochemically pure state for long-term use.
We have developed a simple 225Ra generator, which enables to milk it from its parent 229Th radionuclide at any time for immediate use. It is based on removal of thorium and actinium from the mother liquid by extraction with N-Benzoyl-N-phenylhydroxylamine in chloroform at pH 8 – 9. Alternatively, 5,7-dichlor-8-hydroxychinoline can be used with the same effect, but it is less stable than the former reagent.
The 225Ra tracer has been used in parallel with the 133Ba to examine the performance of selected radiochemical procedures on real samples and to elucidate sources of discrepancies in analytical results obtained on some IAEA`s reference materials.
456

EXTENDED SYNOPSIS IAEA-CN-118/64P
TOPIC: BIOMONITORS
1
Benthic Foraminiferal Response to Heavy Metal Pollution in Izmir Bay (Eastern Aegean Sea)
F. Bergina, F. Kucuksezginb, E. Uluturhanb, I. F. Barutc, E. Mericc, N. Avsard
a Bosphorus University, Cultural Heritage Museum, 34342/Bebek, Istanbul, Turkey
bDokuz Eylul University, Institute of Marine Sciences and Technology, Izmir, Turkey
cIstanbul University, Institute of Marine Sciences and Management, Istanbul, Turkey
dCukurova University, Faculty of Architecture and Engineering, Dept. of Geology Engineering, Adana, Turkey
E-mail address of main author: [email protected]
Benthic foraminifera are interestingly used as environmental bio-indicators, especially in polluted environments where their sensitivity to pollutants may be expressed by a modification of the assemblages. Sixteen sediment samples were collected in November 2002 from surficial sediments of Izmir Bay for the study of foraminiferal assemblages (Figure 1). Izmir Bay is located in Western Turkey and surrounded by a densely populated community.
Foraminifera (class Foraminifera, phylum Granuloreticulata) are among the more abundant protozoa in marine and brackish water habitats. They are unicellular protista that construct shells of one and many chambers. Studies of pollution effects on benthic foraminifera were initiated by Resig (1960) [1] and Watkins (1961) [2]. The studies have often focused on areas exposed to direct pollution sources such as industrial, agricultural wastes. Some studies also take into account thermal and various kinds of chemical pollution [3] and heavy metal pollution [4].
In our research, we identified 28 foraminifera species. A total of 16 sediment samples used for this study come from selected stations at Izmir Bay. Heavy metals and chemicals are unlikely to favor any particular species of benthic foraminifera. In practice, however, it is often difficult to separate effects caused by heavy metals from those caused by organic material because most polluted areas are subjected to some kind of organic enrichments. Of the major environmental components (water, sediment, flora and fauna), sediments have been thoroughly analyzed to study the occurrence and distribution of metals. They present the clearest indication of metal input and accumulation in aquatic environments. Izmir Bay has been contaminated by numerous heavy metals, but geochemical analyses have shown that metals are significant pollutants in the inner part of the bay (Table I).
Correlation analysis shows that there is a significant correlation between foraminifera species and heavy metals. Amphycoryna scalaris has significant correlation with Cr, Cu, Ni, Mn. The most of the foraminifera species have significant correlation with Cr (Ammonia tepida, Amphycoryna scalaris, Bulimina marginata, Noniella turgida). Factor analysis separated the species according to their relationships with the toxic heavy metals and non-toxic heavy metals. The cumulative values are 77.29 %. We can conclude that there is also a statistically significant relationships between toxic heavy metals and foraminifera species.
457

F. Bergin et al.
2
FIG. 1. Location map of sampling points at Izmir Bay.
TABLE 1. THE LEVELS OF HEAVY METALS (µg/g dry wt) AND ORGANIC MATTER (%) IN SEDIMENTS
STATION HG CR CU NI MN ORG. MATTER 1 0.051 40 2.6 25 227 2.1 2 0.269 122 21 135 616 2.8 3 0.276 48 6.5 44 449 2.4 4 0.211 108 18 117 777 2.8 6 0.186 139 31 157 758 3.4 7 0.134 149 36 154 538 3.4 9 0.116 147 32 150 596 3.5
10 0.167 137 23 150 630 3.6 11 0.201 60 11 66 326 3.8 12 0.210 59 11 70 366 3.4 13 0.181 54 10 58 368 4.0 14 0.136 145 31 118 522 3.6 15 0.122 147 27 126 556 4.2 16 0.126 117 24 119 543 4.6 17 0.127 116 24 105 452 6.7 18 0.385 165 50 136 454 8.0
[1] RESIG, J.M., "Foraminiferal ecology around ocean outfalls off southern California", Disposal in the Marine Environment, (PERSON, E., Ed.), Pergamon Press, London (1960) 104-121.
[2] WATKINS, J.G., Foraminiferal ecology around the Orange Country, California, ocean sewer outfall, Micropaleontol. 7 (1961) 199-206.
[3] SCHAFER, C.T., Distribution of Foraminifera near pollution sources in Chaleur Bay: Water, Air Soil Poll. 2 (1973) 219-233.
[4] DEBENAY, J.P., TSAKIRIDIS, E., SOULARD, R., GROSSEL, H., Factors determining the distribution of foraminiferal assemblages in Port Joinville Harbor (Ile d’Yeu, France): The influence of pollution, Marine Micropaleontol. 43 (2001) 75-118.
1 8
1 81 8
18
22° 23° 24° 25° 26° 27° 28°35°
36°
37°
38°
39°
40°
41°
42°
AEGEAN SEA
GREECE
TURKEY
1 2
3 4
6 7
9
10
11 12
13
14
1516
17 18
26.50°
26.60°
26.70°
26.80°
26.90°
27.00°
27.10°
38.40°
38.50°
38.60°
38.70°
E
N
Karaburun
Foca
MordoganStrait
GedizRiv er
Gulbahce Bay
UzunAda
InnerBay
MiddleBay
Outer BayI
Outer BayII
Outer BayIII
458

EXTENDED SYNOPSIS IAEA-CN-118/65P
TOPIC: RADIOCHEMICAL TECHNIQUES
1
Interaction of Plutonium with Humic Acid
L. Génot, H. Michel, G. Barci-Funel, V. Barci
Laboratoire de Radiochimie, Sciences Analytiques et Environnement, Université de Nice-Sophia Antipolis, France
E-mail address of main author: [email protected]
Humic substances are naturally occurring organic compounds of high molecular weight. They are capable of interacting with metals by complexation or redox process. Therefore the behavior of trace elements, especially anthropogenic radionuclides, in soils or sediments is greatly influenced by humic substances[1, 2]. We have studied complexation of plutonium by Aldrich humic acid in solution at different values of ionic strength.
Purification of humic acid
The commercial sodium salt was purified in order to eliminate mineral impurities and non-humic substances. The method used was adapted from Vermeer et al. [3]. Humic acid is treated with HF-HCl to dissolve mineral impurities. The residue is dissolved in NaOH solution and precipitated in acidic conditions (HCl) to eliminate fulvic acids and humines. Then the humic acid is dialysed against distilled water until chloride free and shaken with a cationic resin in H+ form to remove metallic impurities. After freeze-drying we obtained purified humic acid in protoned form.
Potentiometric titration of humic acid
Acid-base properties of humic acid (AH) were investigated by potentiometric titration in the pH range 4-9 for three different ionic strength. Experiments were carried at 25±1°C under argon atmosphere. The charging of the molecule was calculated for each point of the titration curve according to the charge balance of the solution [4]:
Q = CNaOH - CHNO3 + 10-pH + 10pH-pKe
CAH
Charge of the humic acid is plotted against pH in Fig. 1.
Interactions with plutonium
Complexing abilities of humic acid were studied at trace plutonium concentration (below 10-
10 mol.L-1). To evaluate the concentration of free and complexed forms or plutonium in solution, the equilibrium dialysis method [5] and the ion exchange resin method[6] were used. The performances of the two methods were compared.
Plutonium was quantified by alpha spectrometric measurement after electrodeposition on a stainless steel disc [7].
459

L. Genot et al.
2
3
5
7
9
-9 -7 -5 -3 -1
Q (meq per gramme)
pH
I=0.005
I=0.043
I=0.093
FIG.1. Potentiometric titration of humic acid. CAH : 400 mg. l-1 , CNaOH echantillon : 4x10⁻³ mol.L-1, Titrant : HNO3 0.01 mol.L-1, Temperature : 25±1°C.
[1] WOOD, S.A., The role of humic substances in the transport and fixation of metals of economic interest (Au, Pt, Pd, U, V), Ore Geol. Rev. 11 (1996) 1.
[2] JONES, M.N., BRYAN, N.D., Colloidal properties of humic substances, Adv. Coll. Interface Sci. 78 (1998) 1.
[3] VERMEER, A.W.P., VAN RIEMSDIJK, W.H., KOOPAL, L.K., Adsorption of humic acid to mineral particles 1: Specific and electrostatic interactions, Langmuir 14 (1998) 2810.
[4] FUKUSHIMA, M., TANAKA, S., HASEBE, K., TAGA, M., NAKAMURA, H., Interpretation of the acid-base equilibrium of humic acid by a continuous pK distribution and electrostatic model, Anal. Chim. Acta 302 (1995) 365.
[5] GLAUS, M.A., HUMMEL, W., VAN LOON, L.R., Trace metal-humate interactions. I. Experimental determination of conditional stability constants, Appl. Geochem. 15 (2000) 953.
[6] WENMING, D., HONGXIA, Z., MEIDE, H., ZUYI, T., Use of the ion exchange method for the determination of stability constants of trivalent metal complexes with humic and fulvic acids, Part I: Eu3+ and Am3+ complexes in weakly acidic conditions, Appl. Radiat. Isot. 56 (2002) 959.
[7] TALVITIE, N.A., Electrodeposition of actinides for alpha spectrometric determination, Anal. Chem. 44 (1972) 280.
460

EXTENDED SYNOPSIS IAEA-CN-118/66P
TOPIC: RADIOCHEMCIAL TECHNIQUES
1
Sorption of Cesium on Bentonite: The Role of Calcite
C. Hurela, A. Deliseeb, N. Marmiera, F. Fromageb, A. C. M. Bourgc
a Laboratoire de Radiochimie, Sciences Analytiques et Environnement, University of Nice Sophia Antipolis, 28 av Valrose 06100 Nice, France
bGroupe de Recherche en Chimie Inorganique University of Reims, Champagne Ardenne, BP 1039, 51687 Reims cedex 2, France
c Environmental Hydrogeochemistry Group, UMR 5034, University of Pau, Hélioparc Pau-Pyrénées, 64053 Pau cedex 9, France
E-mail address of main author: [email protected]
Since bentonite is investigated for its use in Engineered Barriers Systems as backfill material, many studies of their surfaces properties have been performed in the past years to qualify and quantify adsorption on their surfaces, which can be one of the major processes limiting migration of radionuclides away from a disposal site. Nevertheless, most of these studies concerned simplified systems, such as Na-montmorillonite in mono-electrolyte solution. As ion-exchange processes are of importance in water-clays interactions, adsorption of natural major ions has also to be taken into account for natural systems.
The aim of this work is (i) to quantify the sorption of the natural major cations on the montmorillonite surface, (ii) to compare the sorption of cesium, in two different systems, a simple one ( Na-montmorillonite in NaNO3 0.05 Mol.L-1) and a complex one (natural bentonite in a synthetic natural water) and then (iii) to assess the influence of the natural major ions on this sorption, and to identify the role of the calcite phase present in bentonite.
The methodology used consists in several batch experiments, first considering a very simple solution (NaNO3), then using mixtures of two different electrolytes, and lastly using a synthetic natural water. A surface complexation model, describing the surface of clays as a mixture of ion-exchange and complexation surface sites, is used to provide interpretations and quantifications of the sorption processes.
Observed results indicate that affinity for the montmorillonite surface is greatest for Ca, then Mg and then K. The sorption of cesium is strongly affected by the presence in solution of Ca, witch can come from the partial dissolution of calcite.
This study is one part of a work supported by ANDRA on the retention properties of bentonite materials.
461

EXTENDED SYNOPSIS IAEA-CN-118/67P
TOPIC: RADIOCHEMICAL TECHNIQUES
1
Role of Colloidal Particles in Radionuclide Migration at the “Mayak” Site (Russia)
S. N. Kalmykova,b, A. P. Novikovb, R. C. Ewingc, S. Utsunomiyac
a Lomonosov Moscow State University, Chemistry Department, Moscow, Russian Federation
bVernadsky Institute of Geochemistry and Analytical Chemistry, Russian Academy of Sciences, Moscow, Russian Federation
c University of Michigan, Ann Arbor, MI, U.S.A.
E-mail address of main author: [email protected]
It is recognised nowadays that colloidal particles can facilitate pollutants transport in aquatic environments. This paper describes results of radionuclide (137Cs, 90Sr, isotopes of U, Np, Pu, and Am) distribution between different fractions of colloidal particles collected at the territory of the PA “Mayak”.
Groundwater samples were collected from different wells located at “Mayak” site and were micro- and ultrafilterd immediately after sampling. Gamma emitting radionuclides were determined using HP-Ge spectroscopy system, 90Sr was determined using Cherenkov radiation, actinides (238Pu, 238,239,240Pu, 241Am, 237Np) were determined using alpha-spectroscopy after chemical separation.
The characterization of the samples include precise mass determination, chemical analysis (major and trace cations and anions) and high-resolution transmission electron microscopy (HR-TEM). The HR-TEM were performed using JEM2010F field emission gun (FEG) TEM. Bright- field (BF), dark-field (DF) and high resolution (HR) TEM imaging, selected area electron diffraction (SAD) as well as nano-beam energy dispersive X-ray spectroscopy (EDS) analysis were conducted for the characterization of collected colloidal samples.
It was found that the main fraction of the colloids is attributed to the amorphous phase that contain Fe, Ca and Si. Besides this clays, zeolites, routhile and other mineral phases were found. It was not possible to detect any “hot” particles containing significant amount of either U, Pu, Np or Am with HR-TEM due to low concentrations. However several artificial particles containing sufficient quantities of Cr and Sm were found. According to the obtained data Cr is bound to the surface of colloidal Fe oxides while Sm is bound to the TiO 2 colloids.
It was found that Pu isotopes and 241Am are mostly bound to nano-sized colloidal particles while about 90% of 237Np, 137Cs and 90Sr are found in ultrafiltrate. For groundwater samples the radioactivity decreased in the following sequence: 90Sr > 60Co > 234,235,238U > 137Cs >> 237Np ≥ 238,239,240Pu ≥ 241Am ≥ 244Cm.
462

G. Lujaniene et al.
2
sorption experiment, indicated that after 375 days of sorption the equilibrium was not fully reached, but distribution was found to be close to equilibrium.
The short-term desorption experiments indicated an insignificant release of Cs+ from the regular exchange complex (Fig. 1). The remobilization of “fixed” caesium was not observed, on the contrary, the redistribution of caesium towards its fixation in clay minerals was observed, and on a time scale its fixation kinetics was comparable with that of the sorption experiment. Experiments have shown the double effect of coatings on sorption of Cs on bottom sediments: at primary stage of sorption, coatings inhibit sorption of Cs, however, later they can inhibit the release of Cs to the surrounding solution.
Data obtained from these experiments were used to calculate the Kd coefficients both for total bottom sediments and different geochemical sediments phases (Fig. 2). It can be seen that residual fraction, which reflects the Cs sorption on clay minerals, is the most important in Cs incorporating to bottom sediments, while the role of other geochemical phases is relevant only during two months of the sorption experiment.
This study indicated that flooding events of sea water contaminated with caesium can cause a significant accumulation of caesium in the bottom sediments of the Curronian Lagoon and result in the redistribution of 137Cs activity concentration in the bottom sediments from one area to another.
Acknowledgment. This work was partly performed under the auspices of IAEA under the project LIT/7/002 and the Lithuanian State Science and Studies Foundation project No C-19/2003.
0
20
40
60
80
100
Samle No 5Sample No 4Sample No 1
Act
ivity
of 13
4 Cs,
%
F1 Desorption F2 F3 F4 F5 F6 F7
0 50 100 150 200 250 300 350 400
20
40
60
80
100
F2 F3 F4 F5 F6 F7
Kd, m
l/g
Contact time, days
FIG. 1. Comparison of fraction distribution before and after desorption (second experiment) (F1- contact solution, F2- exchangeable (MgCl2), F3- exchangeable (NH4Cl), F4 - carbonates, F5 - organic, F6 - oxides, F7-residue).
FIG. 2. Kd for 134Cs (first experiment) in different fractions as a function of contact time for sediments (sediment/sea water ratio 1:10), (F2- exchangeable (MgCl2), F3- exchangeable (NH4Cl), F4 - carbonates, F5 - organic, F6 - oxides, F7-residue).
[1] LUJANIENE, G., ŠILOBRITIENE, B., JOKŠAS, K., Environ. Chem. Phys. (in press).
463

SAMPLE EXTENDED SYNOPSIS IAEA-CN-118/68P
TOPIC: RADIOCHEMICAL TECHNIQUES
1
Caesium Sorption–Desorption Behaviour in Bottom Sediments
G. Lujaniene a, B. Šilobritiene a, K. Jokšas b
a Institute of Physics, Savanoriu ave 231, LT-02300 Vilnius, Lithuania
bInstitute of Geology and Geography, T. Ševcenkos 13, LT-03223 Vilnius, Lithuania
E-mail address of main author: [email protected]
The objective of this study is to focus on the sorption and desorption behavior of Cs in the complex heterogeneous system of bottom sediments in order to better understand the cesium behavior during the Baltic Sea water flooding events to the Curronian Lagoon and transport of suspended particles from the Curronian Lagoon to the Baltic Sea. Three sorption and desorption experiments were carried out.
A sample of bottom sediments collected in the Curronian Lagoon was used for sorption experiments. Total carbon (TC) and total organic carbon (TOC) were determined using a LECO CS-125 analyser. The stable Cs concentration was determined using ICP–MS, and clay minerals were identified by X–ray diffraction. Filtered sea water of 7.0 salinity labelled with 134Cs was used for the sorption experiment. The total concentration of Cs in solution was 0.04ppb. The solids were separated by centrifugation at 4000 rpm after different contact time between solution and sediments. Details of the experiment are described in publication [1].
The modified Tesser sequential extraction method was used to study association of Cs in sediments. 137Cs and 134Cs activities were measured using an intrinsic germanium detector (resolution 1.9keV/1.33MeV and efficiency - 42%). The precision of 134Cs measurements by gamma spectrometry was <3% at ± 1σ.
Results of sorption of 134Cs in sediments after different contact time indicated that more than 70% of 134Cs tracer was sorbed during the first three days. Similar results were obtained during the second experiment. The decrease in the caesium amount in the exchangeable fraction desorbed by NH4
+ possibly corresponds to the decrease in the number of frayed edge sites available for Cs sorption. The decrease in the sorption rate accompanied by an increase in association of 134Cs with carbonate fraction can be attributed to the effect of coatings that are usually present in natural heterogeneous sediments. In the sediment sample used for the sorption experiment, a high content of carbonate was determined. The carbonate coatings can inhibit the caesium uptake by clay minerals. The caesium ions need some time to diffuse through carbonate coating to the clay particles where they can be sorbed on the available sorption sites. Cs+ forms soluble carbonates as do the other alkali elements. Cs in solution is trapped in calcite insignificantly because its ionic radius greatly exceeds the radius of Ca2+. The maximum partition coefficient determined for K+ (Kd = 10–3) can be used for the upper limit estimation of Cs+ incorporation into calcite. A negligible amount of Cs usually observed in carbonate fraction after the sequential extraction can be considered as traces of Cs+ incorporated in calcite during co–precipitation and/or Cs+ sorbed on regular exchange complex sites under carbonate coatings.
The comparative analyses of 134Cs fraction distribution after 241 and 375 days of the sorption experiment with that of the 137Cs distribution, determined in the same sediment sample before the
464

G. Lujaniene et al.
2
sorption experiment, indicated that after 375 days of sorption the equilibrium was not fully reached, but distribution was found to be close to equilibrium.
The short-term desorption experiments indicated an insignificant release of Cs+ from the regular exchange complex (Fig. 1). The remobilization of “fixed” caesium was not observed, on the contrary, the redistribution of caesium towards its fixation in clay minerals was observed, and on a time scale its fixation kinetics was comparable with that of the sorption experiment. Experiments have shown the double effect of coatings on sorption of Cs on bottom sediments: at primary stage of sorption, coatings inhibit sorption of Cs, however, later they can inhibit the release of Cs to the surrounding solution.
Data obtained from these experiments were used to calculate the Kd coefficients both for total bottom sediments and different geochemical sediments phases (Fig. 2). It can be seen that residual fraction, which reflects the Cs sorption on clay minerals, is the most important in Cs incorporating to bottom sediments, while the role of other geochemical phases is relevant only during two months of the sorption experiment.
This study indicated that flooding events of sea water contaminated with caesium can cause a significant accumulation of caesium in the bottom sediments of the Curronian Lagoon and result in the redistribution of 137Cs activity concentration in the bottom sediments from one area to another.
Acknowledgment. This work was partly performed under the auspices of IAEA under the project LIT/7/002 and the Lithuanian State Science and Studies Foundation project No C-19/2003.
0
20
40
60
80
100
Samle No 5Sample No 4Sample No 1
Act
ivity
of 13
4 Cs,
%
F1 Desorption F2 F3 F4 F5 F6 F7
0 50 100 150 200 250 300 350 400
20
40
60
80
100
F2 F3 F4 F5 F6 F7
Kd, m
l/g
Contact time, days
FIG. 1. Comparison of fraction distribution before and after desorption (second experiment) (F1- contact solution, F2- exchangeable (MgCl2), F3- exchangeable (NH4Cl), F4 - carbonates, F5 - organic, F6 - oxides, F7-residue).
FIG. 2. Kd for 134Cs (first experiment) in different fractions as a function of contact time for sediments (sediment/sea water ratio 1:10), (F2- exchangeable (MgCl2), F3- exchangeable (NH4Cl), F4 - carbonates, F5 - organic, F6 - oxides, F7-residue).
[1] LUJANIENE, G., ŠILOBRITIENE, B., JOKŠAS, K., Environ. Chem. Phys. (in press).
465

EXTENDED SYNOPSIS IAEA-CN-118/69P
TOPIC: RADIOCHEMICAL TECHNIQUES
1
Pre-concentration and Determination of 210Pb in Water by Liquid Scintillation Spectrometry
J. Merešová, M. Vršková, K. Sedlácková
Water Research Institute, Bratislava, Slovakia
E-mail address of main author: [email protected]
Liquid scintillation technique is rarely used for determination of environmental 210Pb because of low environmental 210Pb activities. This problem can be solved by using of low-background liquid scintillation spectrometer and appropriate radiochemical sample preparation (pre-concentration, suitable scintillation cocktail, etc.).
210Pb is daughter product of gaseous 222Rn, which originates from 238U decay chain. 210Pb enriched in the human body through the food chain remains in the skeleton long enough to produce the highest skeletal dose of any natural radionuclide under conditions of average background exposure. On the other hand, the short life of 210Po relative to that of 210Pb, as well as its short biological half- life of 50 days, makes 210Pb in the body the most important source of high energetic 210Po under normal conditions.
The separation of Pb was carried out on 6 different types of ion-exchangers (Table I) to compare their ability to remove Pb2+ ions from the complex sample matrices. In our laboratory, the distilled water of 2 L of volume with addition of following solutions was processed:
§ 0.5 mL of standard 210Pb solution (of 210Pb activity of 6.67 Bq/0.5 mL) § 0.2 mL of carrier Pb(NO3)2 (Pb concentration 4 mg/2 L) § 40 mL of HNO3 (1:1) (to adjust the pH to 2), respectively 40 mL of acetate puffer (pH
= 5.5)
Prepared solutions were passed through an ion-exchanger loaded column. Lead was eluted after washing the column with 25 mL of 3M HNO3.
TABLE I. YIELDS REACHED FOR USED ION-EXCHANGERS
Ion-exchanger Weight/Volume pH Yield [%]
3 mL 2 51.9 Amberlit
3 mL 5.5 24.9 3 mL 2 13.3
Dowex 3 mL 5.5 98.5
Deta 1 mL 2 4.1 500 mg 2 < 1
Oxin 500 mg 5.5 100.4
Thiol 500 mg 2 < 1 Sal 250 mg 5.5 97.1
466

J. Meresova et al.
2
Table I compares the yields reached for the investigated ion-exchangers. It is evident, that the Pb2+ uptake was found to be strongly dependent on the type of ion exchanger and markedly influenced by the sample pH and exchanger volume/weight too.
The samples were counted after pre-concentration on liquid scintillation spectrometer Packard Tri-Carb 2900TR. The comparison of the three types of scintillators was performed.
Pre-concentration of 210Pb has been tested on surface waters and some bottled mineral waters. Almost in all real samples the measured activities of 210Pb were under the detection limit (<0.013 Bq/L), except the sample of rainwater from locality Visnove (0.046 Bq/L) and water from the river Danube (0.016 Bq/L). The values of 210Pb concentration in mineral waters were higher, varied from 0.021 Bq/L to 0.042 Bq/L.
467

EXTENDED SYNOPSIS IAEA-CN-118/70P
TOPIC: CLIMATE CHANGE
Reconstructing Sedimentation History from Radionuclides (210Pb, 137Cs, 241Am) and the Recognition of Geodynamic Events in Lakes Puyehue and Icalma (Chilean Lake District, Northern Patagonia)
O. Maganda, F. Arnaudb, E. Chapronc, M.-A. Mélièresa, X. Boësd
a Laboratory of Glaciology and Geophysics of Environment (LGGE), UMR CNRS 5183, Grenoble, France
bPBDS, UMR CNRS 8110, UST Lille1, France and Laboratory of Geodynamics of Alpine Ranges (LGCA), UMR CNRS 5025, University of Savoie, France
cRenard Centre of Marine Geology, University of Gent, Belgium
dClays and Paleoclimate Research Unit, University of Liege, Belgium
E-mail address of main author: [email protected]
In this paper, we present a multidisciplinary study of four sediment cores from lakes Puyehue (PU) and Icalma (ICA) aiming at 1) assessing the rhythm of sedimentation and 2) evidencing and calibrating the fingerprint of most important geodynamic events historically known in the surrounding area. This study was the very first step of a currently running multidisciplinary study of holocene-long cores taken on the studied sites during the 2002 “ENSO Chile” survey. Two short cores were taken in each lake, one directly submitted to flood input from the main tributary (PU-I and ICA-II) and one located in a more distal sedimentary environment (PU-II and ICA-I).
The establishment of age-depth relationship was made particularly hard by the intense volcanic and seismic activity affecting the studied area - one of the most tectonically active in the world - and was only made possible through the crossing of a wide panel of chronological indicators. Our approach hence couples radiometric and sedimentological investigations allowing both to wisely interpret the radiometric profiles and in turn to refine the age-depth relationship through the recognition of historically-known events. It consists first in the recognition of potential ‘instantaneous deposits’ thought to be responsible of major disturbances of the radionuclide profiles [1]. Subsequently the triggering mechanisms of these levels (i.e., earthquake, volcanic eruption or flood event) is sedimentologically determined. Following [1], and once their ‘instantaneity’ is established, the particular levels are removed from the radionuclide profiles in order to reconstruct the undisturbed evolution of 210Pb as a function of continuously deposited sediment thickness (Fig. 1). Thereafter, both CFCS and CRS 210Pb dating models were applied to the reconstructed profiles and the position of the maximum activity of artificial 137Cs and 241Am was noted, establishing thus independent radionuclide chronologies (Fig. 2). Once dated, the age of instantaneous sediment deposits were confronted to the age of main events susceptible to have triggered them. Particular attention was then paid to the main tectonic manifestations, such as the huge earthquake which hit the surrounding region of Valdivia (including Lake Puyehue) in 1960 and whose magnitude of 9.5 is the strongest ever recorded in the world. When it was possible - i.e., in
468

O. Magand et al.
core PU-II - varve-counting was performed on embedded thin sections [2], providing an annually-resolved control on radiometric chronologies.
FIG. 1. Example of radionuclide data processing in core ICA-II.
Left : Original profile coupled with lithology and instantaneous deposits (a, b, c, d and e). (8) dark brown silts; (9) sandy tephra deposits; (10) yellowish fine grained layer.
Right: Corrected profile after subtracting the thicknesses of sedimentary events (shaded area).
After crossing the whole set of chronological information in both lakes, it appears that, amongst the four studied cores, only two (ICA-II and PU-II) were accurately dateable through 210Pb method whereas three ones yield valuable information from the artificial radionuclides 137Cs and/or 241Am. This points the difficult use of 210Pb geochronology in such a disturbed geological setting and emphasizes the absolute necessity of independent control on this kind of geochronological tool.
ACKNOWLEDGEMENTS
Financial support from the French ministry of research and ACI Climate Change is acknowledged. Field work in Chile was possible through the Belgian SSTC research project EV/12/10B led by M. De Batist, N. Fagel and A. Berger.
[1] ARNAUD, F., LIGNIER, V., REVEL, M., DESMET, M., BECK, C., POURCHET, M., CHARLET, F., TRENTESAUX A., TRIBOVILLARD, N., Flood and earthquake disturbance of 210Pb geochronology (Lake Anterne, North French Alps), Terra Nova, 14-4 (2002) 225-232.
[2] BOES, X., ARNAUD, F., MAGAND, O., DE BATIST, M., FAGEL, N., Thickness variation of sediment lamination in Puyehue Lake (Lake District, Southern Chile) during the last millennium: a regional southern hemisphere record of El Niño ? Geophys. Res. Abs. 6 (2004) 04243.
469

EXTENDED SYNOPSIS IAEA-CN-118/71P
TOPIC: RADIOCHEMICAL TECHNIQUES
1
Implications of Radiochemical Purity of 99Mo/99Tc Generator Eluates for the Determination of Low Levels of 99Tc in Seawater
Ø. G. Selnæsa, M. Dowdallb, C. Davids b, J. P. Gwynnb
a Norwegian Radiation Protection Authority, Svanhovd Environmental Centre, Svanvik, Norway
bNorwegian Radiation Protection Authority, Polar Environmental Centre, Tromsø, Norway
E-mail address of main author: [email protected]
The determination of sub-Becquerel levels of the long- lived fission product 99Tc in environmental matrices in general and seawater in particular presents analytical challenges, not least with respect to the selection of an appropriate and practicable tracer for calculation of radiochemical yield. Although a number of isotopes (97Tc, 95mTc and 97mTc) have been proposed for this purpose, 99mTc, eluted from easily available 99Mo/99mTc generators, is currently a commonly used tracer due to its availability, convenient assay and practicability [1]. For the analysis of low levels (< 1Bq/m3 or kg) of 99Tc in seawater samples, attention must be focused on the radiochemical purity of the tracer solution in relation to isotopic contamination with both 99Tc and other radionuclides.
Isotopic contamination of eluates from 99Mo/99mTc generators can arise during manufacture and reported impurities include 99Mo, 131I, 132I, 106Ru, 90Sr, 90Y, 89Sr and 103Ru [2]. Of more consequence for the analysis considered here is the presence of 99Tc in such eluates. A cursory examination of the decay scheme of 99Mo indicates that there are two different routes by which 99Tc can be produced within a 99Mo/99mTc generator. Any 99Tc within the eluate will inevitably pass through the analytical sequence and contribute to the final analytical signal. Initial consideration of the problem indicates that correction for the 99Tc contribution is possible knowing the activity and history of the particular generator although the findings of [3] indicate that such procedures may be invalid.
To investigate the possible impact of 99Tc contamination on the analysis of low activity seawater samples, a series of investigations were conducted. The generators used in the study were of nominal activity of 25 GBq 99Mo at the time of original calibration and were 2-3 weeks old before use, at which point the 99Mo activity was of the order of 10-20 MBq. Before that time, the generators had been used for their intended radio-pharmaceutical purposes. Prior to use for tracer provision the generators were eluted three times with 0.9% NaCl to purge any build-up of Tc within the generators. Generators were then left for at least 12 hours to allow ingrowth of 99mTc, before tracer production. The tracer was used in the analysis of 99Tc in 50 and 100 l seawater samples from the Arctic seas by a radiochemical procedure [4]. Tracer solutions were also analysed for 99Tc content using the same radiochemical technique as well as being counted for gross beta without radiochemical separation and bulked tracers were analysed by high resolution gamma ray spectrometry to detect gamma emitting impurities.
470

O. Selnaes et al.
2
Tracer solutions that were counted without separation produced anomalous beta activity relative to purified tracer solutions due to the presence of 103Ru which was confirmed by gamma spectrometry. All tracer solutions produced a positive response for 99Tc with levels of the nuclide in the tracer solutions of the order 1-10 mBq/g, while no signal was detected in any of the distilled water samples. Typically, 0.3-0.8 grams of tracer solution is required to insure a detectable signa l at the end of the purification process. This implies that for samples containing activities in the order of 8-10 mBq, interference from 99Tc produced by the generator is significant. The extent of this interference for a series of real samples indicates that 99Tc contamination from the eluate can result in overestimation of activity in low level samples by factors of up to 30%.
[1] CASTRONOVO, F.P., Technetium-99m: basic nuclear physics and chemical properties, Am. J. Hosp. Pharm. 32 5 (1975) 480-488.
[4] CHEN, Q., AARKROG, A., NIELSEN, P., DAHLGAARD, H., LIND, B., KOLSTAD, A.K., YU, Y., Procedures for determination of 239,240Pu, 241Am, 237Np, 234,238U, 228,230,232Th, 99Tc, 210Pb and 210Po in environmental materials, Riso National Laboratory, Roskilde, Denmark, Riso-R-1263.
[3] HOLLAND, M.E., DEUTSCH, E., HEINEMAN, W.R., Studies on commercially available 99Mo/99mTc radionuclide generators – II. Operating characteristics and behaviour of 99Mo/99mTc generators, Appl. Radiat. Isot. 37 2 (1986) 173–180.
[2] VESELY, P., CIFKA, J., Some chemical and technical problems connected with technetium-99m generators, Nuclear Research Institute, Pez, Czechoslovakia, UJC 2414-Ch. (1970) 21 pp.
471

EXTENDED SYNOPSIS IAEA-CN-118/72P
TOPIC: RADIOCHEMICAL TECHNIQUES
1
Development of a Procedure for the Determination of 226Ra, 228Ra and 210Pb in Produced Water
R. Sidhu, K. Østmo, T. Bjerk, R. Nordvi, E. Strålberg
Institute for Energy Technology (IFE), Kjeller, Norway
E-mail address of main author: [email protected]
Large amount of produced water (120 Mm3 in 2002) is discharged to the sea in connection with oil and gas production on the Norwegian Continental Shelf. This water contains elevated levels of some natural radionuclides, mainly 226Ra and 228Ra. Determination of natural radionuclides in produced water from the Norwegian continental shelf has so far only concentrated on 226Ra using the emanation technique. However, in OSPAR the Radioactive Substance Committee (RSC) is working on a strategy to reduce discharges from all industries. Further work was therefore commissioned to more accurately establish the radionuclide composition and activity concentrations in the wastes arising from the extractive industry sector. In 2003, the Norwegian Radiation Protection Authority therefore asked the oil and gas companies to collect monthly samples of produced water from all discharge points for six months (a total of 260 samples). The samples were to be analysed for 228Ra and 210Pb in addition to 226Ra. To avoid the use of time-consuming radiochemical separations, it was decided to perform the determination of 226Ra, 228Ra and 210Pb using gamma spectrometry. Since the amount of uranium in produced water is quite low, interference from 235U gamma can be neglected and 226Ra can be determined using its 186 keV gamma. 228Ra can be determined via the gammas of its progeny 228Ac, and 210Pb can be determined using its 46 keV gamma. A direct determination of these radionuclides in untreated produced water is although not feasible, both due to the inhomogeneity of the sample (oil, water, particles) and due to the relatively high detection limit of germanium detectors.
A method was therefore developed based on permanganate treatment of the produced water under acidic conditions, followed by MnO2 co-precipitation of the analytes at elevated pH. The precip itated MnO2 together with oil and suspended particles is then collected by filtration, dried and mixed with Al2O3 to a fixed geometry and the gamma analysis performed using HPGe detectors. The chemical yield is checked with the addition of 133Ba. The method was checked by analysing three produced water test samples added known amount of 133Ba, 226Ra and 210Pb. The results in Table I indicate that the procedure is effective, giving high chemical yield, and that 133Ba can be used as tracer for both Ra and Pb.
TABLE I. RADIUM, LEAD AND BARIUM YIELD WHEN ANALYSING THREE PRODUCED WATER TEST SAMPLES USING MNO2 CO-PRECIPITATION
Ra–yield %(±2σ) Pb-yield % (±2σ) Ba-yield % (±2σ) Sample 1 106 ± 18 93 ± 18 108 ± 16 Sample 2 82 ± 14 85 ± 17 80 ± 13 Sample 3 91 ± 15 89 ± 17 89 ± 13 Average 93 ± 7 89 ± 2 92 ± 8
472

R. Sidhu et al.
2
The method was therefore adopted for the analysis of real samples. It proved to be successful for most of the samples, giving a chemical yield of above 80% for more than 50% of the samples (n=134). But in about 25% of the samples, the yield fell below 30% (Fig. 1).
Several tests were performed to elucidate the cause for this. One possible explanation could be the presence of complexing agents, for example production chemicals as scale inhibitors (e.g. phosphonates and polycarboxylates). These chemicals are effective in complexing Ra at elevated pH, and thereby preventing its precipitation. At low pH the chemicals are protonated and hence cannot complex metals.
FIG. 1. Fractional yield of the tracer (133Ba) when utilising MnO2 co-precipitation for Ra and Pb preconcentration from 2 litre produced water (n=134).
Some waters that gave low recovery using the MnO2 technique, were analysed once again, this time using a combined Ba/PbSO4 and MnO2 precipitation at low pH (<1). The majority of the precipitant is still MnO2, and only small amount of Ba/Pb is added, this to avoid high self-absorption of the 46 keV 210Pb gamma. The new procedure, which involves the analysis of 2 litre produced water, shows high chemical yield (above 95%) for all samples, and a detection limit of below 1 Bq/l for all the analytes.
0
5
10
15
20
25
30
35
40
45
0-10
10-2
0
20-3
0
30-4
0
40-5
0
50-6
0
60-7
0
70-8
0
80-9
0
90-1
00
Chemical yield (%)
Frac
tion
of s
ampl
es (%
)
473

EXTENDED SYNOPSIS IAEA-CN-118/73P
TOPIC: RADIOCHEMICAL TECHNIQUES
1
Measurement of Uranium Isotopes in Environmental Water of Taiyuan by Alpha Spectrometry
A. Zhang, Y. Han, Z. Wang, Z. Shi
China Institute for Radiation Protection, Taiyuan, Shanxi, China
E-mail address of main author: [email protected]
Since the 1990s, because of the nuclear verification and the use of the Depleted Uranium weapon, especially the Uranium Medical Research Centre presented that the isotopes of uranium found in the Afghan civilians’ urine is Non-Depleted Uranium [1] in 2003, the precise determination of uranium isotopes in environmental samples are of cons iderable importance so that their impact on the public heath can be assessed. This can be achieved by alpha spectrometry after chemical separation of uranium.
In the present work, to enable the reliable measurement of uranium isotopes, we studied two uranium concentration technologies, active carbon adsorption and iron hydroxide coprecipitation. The former obtained more than 70% of the whole chemical recovery and the latter less than 25%. In this paper, the procedures of the former is chiefly described. Water samples were firstly concentrated by the Model IPR-2 [2] active carbon. Then the desorption solution was extracted by methyl- isobutyl-ketone to get rid of the majority of iron. Following the extraction, uranium was purified by anionic exchange to separate the unresolvable alpha nuclides. Finally uranium was electrodeposited on stainless steel discs with the diameter of 20mm using a sulfate system. The whole chemical recovery was determined by total uranium using laser liquid fluorimetry. The procedures described in this paper are capable of handling up to 50 L of water.
The sample sources were measured by Canberra model 7404 quad alpha spectrometer with 600 mm2 Passivated Implanted Planar Silicon detectors, using Ortec model 920-8 MCA and Maestro software for alpha acquisition and analysis. The counting time was 800-1600 minutes, the counting efficiency used in this work 23% (calculated the geometry factor using Overlapping Area Method [3] to verify it), the background of the energy region of interest less than 0.2 per hour and the energy resolution (FWHM) about 35keV for 234U.
TABLE I. CONCENTRATIONS AND RATIOS OF URANIUM ISOTOPES IN WATER OF TAIYUAN
concentrations/(Bq/L) sample No.
sample matrix concentration
method 234U 235U 238U 238U/235U
chemical recovery/%
1 groundwater active carbon 22.5 2 groundwater active carbon 21.7 3 groundwater active carbon 19.6 4 groundwater active carbon 0.970 1.23×10⁻² 0.245 19.9 71.6 5 groundwater active carbon 0.950 1.18×10⁻² 0.245 20.7 73.5 6 groundwater iron hydroxide 0.991 1.13×10⁻² 0.246 21.7 20.3 7 reservoir water active carbon 1.09 2.25×10⁻² 0.487 21.6 79.1 8 reservoir water iron hydroxide 0.967 2.38×10⁻² 0.484 20.3 24.5 9 reservoir water iron hydroxide 0.965 2.20×10⁻² 0.485 22.0 18.1
474

A. Zhang et al.
2
Table I shows the concentrations and 238U/235U ratios of uranium isotopes in water of Taiyuan. The table indicates that the uranium in water is natural uranium, unequilibrium and compliance with regulatory limits. The whole chemical recovery of the active carbon adsorption is much higher than the iron hydroxide precipitation, so we recommend the former. The maximal relative uncertainty of 238U/235U is 15% because of bad energy resolution or low count. The 235U region of interest used in our works ranges from 4.33MeV to 4.44MeV with the yield of 81% to avoid the energy of 4.60MeV(0.24%) of 234U and 4.20MeV(77%) of 238U.
A typical alpha spectrum of uranium isotopes in water obtained by the procedure described in this paper is given in Figure 1. The energy resolution (FWHM) is 25keV for 238U and 234U.
0
100
200
300
400
800 900 1000 1100 1200channel
coun
ts
FIG. 1. A typical alpha spectrum of uranium isotopes.
[1] URANIUM MEDICAL RESEARCH CENTRE, Uranium Radiation Levels in Afghanistan not attributable to Depleted Uranium, www.globalresearch.ca/articles (2003) p. 6.
[2] QIU, Y., CHENG, P. et al., The Research of Uranium and Thorium Concentration Methods in Large Volume Water Using Active Carbon, Rad. Prot. Bull. 1 (1994).
[3] SHI, Z., ZHANG, A., ZHANG, L., Calculation and Experiment Verification of Geometry Factor Using Overlapping Area Method, China Nucl. Sci. Techn. Report 9 (1996).
U-238 U-234
U-235
475

EXTENDED SYNOPSIS IAEA-CN-118/74P
TOPIC: RADIOMETRICS AND MASS SPECTROMETRY TECHNIQUES
1
Design of a Low Background ZnS(Ag) Alpha Counter for Water Samples using a Plastic Veto Detector
M. Ardida, J. L. Ferrerob
a Departament de Física Aplicada, E.P.S. de Gandia, Universitat Politècnica de València, València, Spain
bInstitut de Ciència de Materials de la Universitat de València Estudi General, València, Spain
E-mail address of main author: [email protected]
Alpha counters of gas detectors or scintillation discs are widely used for the measurement of alpha radioactivity in environmental samples. However, we consider that usual commercial equipment has some drawbacks like the cost of operation and the difficulty of supervision. These aspects motivated us to develop a high-efficient alpha counter with little cost of operation and easy monitoring. Our solution consists of a 5’’ diameter, 0.1 mm thickness ZnS(Ag) scintillation disc glued to a light-guide and read out by a photomultiplier of 3’’ diameter phototube. All the electronics required for the operation and data acquisition of the equipment are easily controlled by means of a computer, and the alpha spectra and the settings are monitored in the screen, which allows the detection of a failure immediately. Since the samples are not in direct contact with the detector, it has little cost of operation because disposable discs or gas supply are not necessary. The efficiency remains high enough (larger than 35%) and there is a reasonable background considering the large sensitive area (below 0.1 cpm) [1]. These features make possible to do alpha analysis of environmental samples in relatively short time and it is very suitable for large solid residuum water samples like in the case of water from the seas or rivers. Moreover, it is being used for fast alpha analysis of water from the pools of nuclear power plants before evacuating the water to the river. In order to enhance the capabilities of this technique we have designed recently new equipment that reduces considerably the background using a plastic veto detector. It is assumed that the background in ZnS(Ag) alpha counters comes from natural sources and there is no contribution from cosmic, beta or gamma rays since the efficiency for these sources is below 0.001%. However, in a recent study we have shown that the cosmic ray contribution can be very important (up to 50%) [2]. Then, in our opinion it is worthwhile to take out this contribution. With this purpose, we have developed an alpha counter that consists basically of the detector above described and opposite to it, a plastic scintillation veto detector of the same diameter and 0.5 mm thickness. A scheme of the equipment is presented in Fig. 1. In the paper we will describe more exhaustively the equipment. The advantage of using the veto detector can be observed comparing the time needed to measure drinking water from Valencia, which has a solid residuum of approximately 1.0 mg/l. In order to achieve a limit of detection for total alpha radiation in water equal to 0.025 Bq/l, which is the value required by the Spanish authority "Consejo de Seguridad Nuclear" to the laboratories of the "Red de Estaciones de Muestreo" program, we need a nine-hour measurement with the alpha counter alone, whereas using the plastic veto detector the time is reduced to six hours. This example and other applications will be more detailed described in the communication. From our measurements we can conclude that this anti-coincidence equipment reduces significantly the
476

M. Ardid and J. Ferrero
2
background, and, therefore, less time of measurement is required to achieve the same limit of detection value, which is a crucial aspect in some cases of analysis of environmental samples.
FIG. 1. Scheme of the alpha counter using a plastic scintillation veto detector.
[1] ARDID, M., ALF-123: Contador alfa de centelleo sólido, Actas de las III Jornadas sobre Calidad en el Control de la Radioactividad Ambiental, 26-28 de Febrero de 2003, Valencia (in press, in Spanish).
[2] ARDID, M., FERRERO, J.L., Use of the anti-coincidence technique to reduce the background on a ZnS(Ag) alpha counter, Radiation Measurements (in preparation).
Electronics
Computer
ZnS(Ag)Alpha Counter
PlasticVeto Detector
Sample
477

EXTENDED SYNOPSIS IAEA-CN-118/75P
TOPIC: RADIOMETRICS AND MASS SPECTROMETRY TECHNIQUES
1
Precise Uranium Isotopic Measurements in Groundwater around the CEA’s Vaujours Site
S. Baude, F. Pointurier, R. Chiappini
CEA, Département Analyse, Surveillance, Environnement, Service Radioanalyse, Chimie, Environnement, BP12, F91680 Bruyères- le-Châtel, France
E-mail address of main author: [email protected]
In the framework of French nuclear programs, the test site of Vaujours (localized in Seine Saint-Denis, France) has undergone different types of experiments, sometimes involving materials including uranium containing devices. The measurement of uranium in the environment around this non-nuclear facility has become extremely important when CEA (the French Atomic Energy Commission) decided on the decommissioning and renunciation of the site, in order to make the demonstration that the site had not been polluted. A large number of samples were taken in 2001-2002 in and nearby the site of Vaujours. Low level ? spectrometry as well as mass spectrometric techniques (TIMS and ICPMS) was used to measure hundreds of soil, core, lichen, moss and groundwater samples to assess the impact of activities on the environment. Since natural uranium is present at ppm levels in soils and at ppb levels in water, we used high precise thermal ionization procedures to screen for any anthropogenic components. The aim of this paper is to make the demonstration of the effectiveness of the so-called resin bead technique to load (sub-)nanogram amount of uranium on TIMS filaments, under clean laboratory conditions. We could achieve a precision around 0.2% (RSD) for 235/238 ratio with a double focussing VG54-38 instrument in a laboratory built pulse-counting mode. The minor isotopes were also measured and some 234 data will be discussed in the poster. Natural and depleted standards were used to correct for mass fractionation and no double spike was used. Comparison with ICPMS is also discussed.
478

EXTENDED SYNOPSIS IAEA-CN-118/76P
TOPIC: RADIOMETRICS AND MASS SPECTROMETRY TECHNIQUES
1
Isotopes in Australian Environmental Analysis
A. Henderson-Sellers , D. Stone, S. Hollins, M. Hotchkis, D. Fink
Australian Nuclear Science and Technology Organisation, Lucas Heights, Australia
E-mail address of main author: [email protected]
ANSTO Environment is playing a pioneering role in developing new methods for monitoring adherence to the Nuclear Non-proliferation Treaty. Working with the IAEA Department of Safeguards, new analytical procedures have been developed to assist with their environmental monitoring programme. Signatures of nuclear activities, in the form of trace amounts of radioisotopes in environmental samples, can be used to identify undeclared nuclear facilities or undeclared activities at declared facilities. At ANSTO we have developed the use of Accelerator Mass Spectrometry (AMS) for analysis of 236U in environmental samples. 236U is a sensitive indicator of irradiated uranium. AMS is also used to detect the long- lived fission product 129I at extremely low levels. The presence of 129I can be a signature of reprocessing. ANSTO performs analyses of these radioisotopes as an accredited member of the IAEA Safeguards network of analytical laboratories.
Australian soldiers on duty in the Gulf risk possible exposure to depleted uranium. Depleted uranium is the uranium that is left after most of the radioactive isotopes are removed for nuclear fuel. Due to its high density, it is the ideal material for use in armour-piercing ammunition and in armour for fighting vehicles. However, like any heavy metal, it is toxic in high doses. Depleted uranium enters the body through inhalation of the dust- like particles, ingestion of contaminated food or through wounds. At ANSTO, a sensitive analytical technique based on isotope dilution and inductively coupled plasma mass spectrometry (ICP-MS) was used to detect depleted uranium in urine samples. By addition of known quantities of 236U (isotope dilution) to the urine samples and measuring the relative abundances of different isotopes (236U, 235U and 238U) of uranium by ICP-MS, we are able to quantify (quantification limit of 20 ng/L) and distinguish between natural and depleted uranium.
In Australia, there are legislative limits on the amount of surface water that can be utilised in a particular catchment, but that is not the case for groundwater, leading to tension amongst users in connected systems. Isotopes such as the stable and radioactive isotopes of water and carbon are particularly appropriate for the study of our dry landscape in its connected water systems, providing a clear method of determining the source of groundwater, and hence the extent of mixing of nearby surface water and the time frame for the mixing process. In particular, the stable isotopes 2H, 18O, and 13C provide a robust end-member analysis for the hydrographical separation of regional groundwater and any amount of river water which was replenished at a remote location; while the radioactive isotopes 3H and 14C are used to confirm the presence in groundwater of (isotopically modern) surface water, but also accurately determine the apparent rate of mixing at particular distances from the river.
Isotope tracer techniques have been applied to study the fate, pathways and risks associated with contaminants and particulates in coastal aquatic systems. Examples include: (i) sand and sediment tracing in coasts and estuaries using radiotracers such as 192Ir labelled sand
479

A. Henderson-Sellers et al.
2
(MacMasters Beach, NSW) or neutron activatable tracers such as 115In (Homebush Bay, Sydney); (ii) biokinetics of environmental contaminants in aquatic and terrestrial systems have been investigated using radionuclides such as 109Cd, 65Zn and 210Pb; (iii) tracing of sewage effluent from Australian coastal outfalls undertaken using radioisotope tracers such as 198Au and tritiated water; and (iv) groundwater dynamics under tidal forcing using a short-lived radioisotope tracer 82Br to track groundwater movement in three dimensions (Hat Head, NSW).
Accelerator Mass Spectrometry is still the only technique able to determine extremely low concentrations (<10-12) of long- lived radioisotopes in small (mg) environmental samples. In Australia, radiocarbon dating is used for the study of paleo environments, climate studies, atmospheric studies and hydrology. Atmospheric studies including the high resolution radiocarbon dating of tropical and Southern Hemisphere tree rings provide data for studying the temporal variations of atmospheric radiocarbon and its inter-hemispheric gradient; and analysis of radio-methane trapped in Antarctic ice cores, a direct method of studying past atmospheric composition. It is also a means of studying palaeo-climate change. Exposure dating has been applied to glacial studies and landscape evolution studies. Using AMS measurement of beryllium-10 and aluminium-26 we have been able to determine Southern Hemisphere glacial chronology in Tasmania and the geomorphic evolution of Australian stony deserts. We apply the in-situ method to evaluate long-term average erosion rates, sand or sediment transport, accumulation and burial stages.
480

EXTENDED SYNOPSIS IAEA-CN-118/77P
TOPIC: RADIOMETRICS AND MASS SPECTROMETRY TECHNIQUES
1
Determination of Ra-224, Ra-226 and Ra-228 by Gamma-Ray Spectrometry with Radon Retention
M. Herranz, R. Idoeta, A. Abelairas, F. Legarda
Dept. of Nuclear Engineering and Fluid Mechanics, University of the Basque Country, Bilbao, Spain
E-mail address of main author: [email protected]
The purpose of this work is to improve the determination, through gamma-ray spectrometry, of radium isotopes 228Ra, 226Ra and 224Ra in water. This improvement has been developed after the participation in the IAEA Proficiency test: “Determination of radium and Uranium radionuclides in water” of December 2002, and applied to the same samples of this proficiency test.
The aim of this new procedure is the determination of 228Ra, 226Ra and 224Ra activities by measuring the gamma-ray emissions of their decay products 228Ac, 214Pb and 212Pb, respectively.
In search of these activities, radiochemical separation of radium and lead are required. A co-precipitation method with barium and stable lead was carried out to obtain two different precipitates, both of them as sulphate [1].
However emanation of unknown quantities of 222Rn and 220Rn is produced from the fine precipitate of the radium sulphate obtained [2] which leads to wrong activities determinations of 224Ra and 226Ra. In order to avoid this radon diffusion effect the mentioned deposit, after the separation yield is calculated, is dissolved with EDTA and the resulting liquid is incorporated into charcoal, and then it is dried and introduced into a suitable container. Afterwards the container is sealed and stored in a freezer.
Different configurations of charcoal sizes and types as well as containers have been analysed. To accomplish this analysis several samples with 226Ra of the above mentioned ones have been used in order to test its equilibrium with the progeny, 214Pb and 214Bi, through gamma-ray spectrometry, achieving the conclusion that 40–50 mesh TEDA treated charcoal-coconut type and petri capsules of polystyrene are a reasonable good option.
We have considered that equilibrium of radium isotopes and their decay products starts growing in the moment of sealing. The daughters of the different radium isotopes that should have been generated until that moment have been considered as unsupported.
In accordance with the particular radioisotopes the following considerations have to be made:
• 226Ra: being its half- life of about 1600 years a measurement should be made at about 21days after sealing in order to assure its secular equilibrium with its progeny 214Pb and 214Bi;
• 228Ra: the equilibrium with its daughter 228Ac is quickly obtained (about 2 or 3 days);
481

M. Herranz et al.
2
• 224Ra: in order to obtain transient equilibrium (with a factor 1.14) between 224Ra and its product 212Pb since the sealed sample is produced about 3 days are needed. At this moment the activity of 224Ra produced from the 228Ra in the sample is negligible(less than 0.2%) and the unsupported 212Pb should have decayed until its contribution to the supported 212Pb (produced from the sealing moment) is only of 0.85%.
Therefore the following temporal scheme is proposed: from the sealing of the sample in its container 2 measurements are carried out: the first one the 3rd day to assess 228Ra and 224Ra and second one the 21st day in order to determine 226Ra.
Our measurements have been made using high-purity intrinsic Ge detectors with 24 hours of counting time. Counts from 212Pb have to be corrected taking into account the counting time and its transient equilibrium with 224Ra.
This measuring procedure has been applied firstly to standard solutions codes 023 and 097 of 228Ra and 226Ra, respectively, provided by the IAEA proficiency test of 2002. The results are in very good agreement (accuracy and precision) with those supplied by IAEA [3].
Secondly, the same procedure has been applied to samples IAEA 422 and 423 that are synthetic waters and to IAEA 428, natural water, which have very different quantities of 228Ra and 226Ra. Comparative analysis of the measured activities and the IAEA values show very close agreement (accuracy and precision) between them.
[1] SUAREZ, G., DEL REY, J.A., et al., Determinación radioquímica conjunta de Radio-224, Radio-226, Ra-228 y Plomo-210, Ministerio de Industria y Energía ITN/TR-14/R-88, Madrid (1988).
[2] JURADO VARGAS, M., A model to explain simultaneously the 222Rn and 220Rn emanation from thin electrodeposited sources, Nucl. Instr. Meth. A 447(2000) 608-613.
[3] RADECKI, Z., Preliminary evaluation of the exercise AQCS PT, Determination of Ra and U Isotopes in Water, IAEA, Vienna (2003).
482

EXTENDED SYNOPSIS IAEA-CN-118/78P
TOPIC: RADIOMETRICS AND MASS SPECTROMETRY TECHNIQUES
1
Application of Analytical Methods for Environmental Evaluation of Natural Radionuclides in the Vicinity of the Produced Water Discharges into the Sea
S. F. Jerez Vegueríaa, J. M. Godoyb
a Depto. Química, Pontifícia Universidade Católica do Rio de Janeiro, Rua Marquês de São Vicente 225 - Gávea, CEP - 22453-900, Rio de Janeiro RJ, Brazil
bInstituto de Radioproteção e Dosimetria, Comissão Nacional de Energia Nuclear, Av. Salvador Allende s/n - Jacarepaguá, CEP - 22780-160. Rio de Janeiro RJ, Brazil
E-mail address of main author: [email protected]
Elevated activities of naturally occurring radioactive materials (NORM), such as 226Ra (from uranium series) and 228Ra (from thorium series), are often found in the produced waters of oil and gas industry. The rock formations that hold the oil contain uranium and thorium in the rock matrix and which remain in the solid phase. However, radium is somewhat soluble in water and part of it is deposited, during scale formation, within the oil pipes, while the other is discharged into the sea by effluents. In this work the analytical methods for the determination of natural U, 226Ra, 228Ra and 210Pb in produced water and seawater and sediment around the effluent discharges of offshore oil industry were studied. Uranium determinations in produced water and seawater were performed by Inductively Coupled Plasma Mass Spectrometry (ICP-MS) with ultrasonic nebulizer CETAC U-6000 AT in quantitative mode (external calibration) using 205Tl as internal standard. The detection limit of the method was 0.06 µg L-1. Using one liter of produced water and twenty liter of seawater, after radiochemical separation, the 210Pb was determined by beta counting of 210Bi, and 226Ra and 228Ra were determined by gross alpha and beta counting rate using a proportional 10-channel low-level proportional counter. Another method to determine radium concentrations in seawater was implemented: A 400 L seawater sample was percolated through cellulose cartridges and then 226Ra and 228Ra activities were determined by γ-ray spectrometry of 214Bi and 228Ac, respectively. This method showed better sensibility and the detection limit for both radium isotopes was 1.5 mBq L-1. 226Ra and 228Ra were determined in surface sediments sampled around the effluent discharges, either their total content by γ-ray spectrometry either by gross alpha and beta counting after leaching with EDTA. The total 210Pb activities in sediment samples were determined by γ-ray spectrometry with auto-absorption correction. The sedimentation rate in the studied sites was determined by dating with 210Pb. In present paper the results of the measurements are reported for two offshore platforms and a Station of Treatment of Effluent.
483

EXTENDED SYNOPSIS IAEA-CN-118/79P
TOPIC: RADIOMETRICS AND MASS SPECTROMETRY TECHNIQUES
1
Evaluation of the Infinite Radius of a Radioactive Water Environment
M. Kedhi
Institute of Nuclear Physics, Tirana, Albania
E-mail address of main author: [email protected]
The uniform radioactive water environment is considered as infinite when the response of a detector inside it gives at least 99 percent of the value of a such geometrical infinite environment. In a lot of radioactive methods applications in hydrology and industry and, also, in the study of marine radioactive contamination by underwater gamma spectrometry using Monte-Carlo simulation [1], the value of the infinite radius is required. The measurements of build up factor for five radionuclides and the Monte-Carlo simulation for 2 nuclides were used for this evaluation.
The detector response dR for n quanta emitted within the unit time by environmental volume dv that strike the detector case area dS under the angle ? with the surface normal, is given by:
dR = 2^*4
cosr
ndSπ
θ eB’(r) exp(-µr -µ’d/cos?) dv, ( 1 )
where: e, the detector efficiency, µ and µ’, linear attenuation coefficients of water and of the detector case that has the thickness d, r is the distance of dv from the detector centre and B’(r) is the build up factor of these quanta in water. The total detector response is given by:
R = π4n ∫ ds ∫ df ∫ cos? sin? exp(-µ’d/cos?) d? ∫ eB’(r) exp(-µr) dr. ( 2 )
S f ? r
The counts build up factor B(r) we calculated by the equation Nw = NaB(r) exp[-µ(r)r], where Nw and Na are the number of counts in water and air, respectively, corrected for their backgrounds. For monoenergetic radiations we have µ (r) = const, while for the other ones:
µ (r) = r1
ln ∑
∑− )exp( irIi
Ii
µ, ( 3 )
where µi is the linear attenuation coefficient for the energy with the yield Ii%. We find B(r) by fitting the measured values with the function B(r) = 1 + a[µ(r)r] + ß[µ(r)r]2. This function, found experimentally, includes the efficiency e = e(E), so B(r) represents, with a constant proximity, the product eB’(r) in equations (1) and (2).
The measurements were carried out in a big tank filled with water. The point sources used were: Am-241, I-131, Au-198, Cs-137 and Co-60. The detector crystal has F = 2” and h = 1.5”. By equation (2) we calculated the detector response R8 for a real infinite radius (such was considered the distance 3 m for Co-60 and 2 m for others, in these ranges the ?-quanta
484

M. Kedhi
2
narrow beam is attenuated 108 times) and Rr for a lot of different distances. The results of the detector responses R8 /Rr (in %) are given in Fig. 1. The found values of R8 for Am-241, I-131, Au-198, Cs-137 and Co-60 are 35 cm, 70 cm, 72 cm, 80 cm and 100 cm, respectively.
FIG. 1. The detector response in water for some nuclides as a function of the source distance.
The energetic distribution of ?-quanta that strike the detector surface in an infinite radioactive aquatic environment is needed in the calculation of underwater gamma spectra by Monte- Carlo simulation. Only for the purposes of the infinite radius evaluation, the values of the calculated flux intensity (total number of ?-quanta that strike 1 m2 detector area within 1 ks time when the nuclide activity is 1 kBq/m3) for different radiuses and Am-241, Cs-137 and K-40 nuclides are given in Fig. 2. The detector we supposed as a sphere of 0.0463 m radius.
FIG. 2. Flux intensity in the centre of a seawater spherical environment for some values of R..
At higher R values the intensity rests constant. So we find the infinite radius equal to 35, 85 and 105 cm for Am-241, Cs-137 and K-40, respectively, in conformity with the previous case.
[1] ARCIBASHEV, B. A., Jaderno-geologiceskaja razvedka (Moskva, Atomizdat, 1972).
485

EXTENDED SYNOPSIS IAEA-CN-118/80P
TOPIC: RADIOMETRICS AND MASS SPECTROMETRY TECHNIQUES
1
Development of Monitor for Multiple Beta-ray Nuclides in Liquid Radioactive Waste
C. S. Kima, B. H. Rhoa, U. W, Namb, K. I. Seonb
a Div. of Regulatory Research, Dept. of Radiological Safety Research, Korea Institute of Nuclear Safety, Yusong, Taejon, Rep. of Korea
bKorea Astronomy Observatory, Seoul, Rep. of Korea
E-mail address of main author: [email protected]
Recently, the safety management of radioactive isotopes has been emphasized by the increase of radioactive isotope application in the area of medical, industrial and scientific research along with industrialization. Most radionuclides used in the medical diagnosis and scientific research are beta-ray emitting nuclides. Not only the careful handing of the radionuclides in the nuclear facilities but also the management of radioactive liquid waste from medical utility is very importance in a viewpoint of the conservation of environment. The currently used method to monitor the radioactive waste, however, is impractical in the aspect of continuous monitoring the waste matter as well as the preparation of measuring sample is very annoying. In addition, when sample is mixed with several beta-ray nuclides individual nuclide should be separated chemically and then analyzed using different analysis procedure. Accordingly, the development of a new monitoring system to overcome these disadvantages is necessary.
A new liquid scintillator system for measurement of multiple beta- labeled mixtures was developed and its characteristic was investigated. The signal processing system consisted of two photomultiplier tubes and the coincidence count circuit which showed 99% background rejection rate. An algorithm using least square method was developed for simultaneous radioassay of multiple beta-ray nuclides. The characteristic of the system was analyzed using 4 beta-labeled samples(3H, 14C, 36Cl and 90Sr). The analytical values were in good agreement with the reference values within 7% relative error. The detection limits achieved for all those nuclide exception for 90Sr was below the detection level of government regulation with a few minutes measurement. For 90Sr, the detection limits was satisfied by the elongation of measurement time rather long 20 minutes as well as binning method.
An automatic sample mixer system to mix the liquid radioactive waste with the liquid scintillator was designed and manufactured to realize continuous monitoring. The mechanical systems were consisted of the following 4 stages: automatic sample transfer, capping and uncapping the sample bottle, sample preparation system and its attachment to the detector system. This monitoring system could be on- line operated through RS-232 communication protocol and the integrated operating software installed in main control computer.
486

C. Kim et al.
2
FIG. 1. Schematic diagram of the automatic LSC monitor for multiple beta-ray nuclide in liquid radioactive waste.
LiquidScintilltor
Wastesample
Rinsing solution
Electric dispensor
Capping& mixing
Sample table
LSD
DATAACQ
CONTROLLER
MAINCONTROLLER
(PC)
Sampling & sample changer
Ethernet
RS232
RS232
Sampleholder
M
X-Y Stage
External source
Bottle stage
MMM
Tubing pump
Waste line
D
P1 (B0)
V1
V3
P2
V4
LSC
LiquidScintilltor
Wastesample
Rinsing solution
Electric dispensor
Capping& mixing
Sample table
LSD
DATAACQ
CONTROLLER
MAINCONTROLLER
(PC)
Sampling & sample changer
Ethernet
RS232
RS232
Sampleholder
M
X-Y Stage
External source
Bottle stage
MMM
Tubing pump
Waste line
D
P1 (B0)
V1
V3
P2
V4
LSC
487

EXTENDED SYNOPSIS IAEA-CN-118-81P
TOPIC: RADIOMETRICS AND MASS SPECTROMETRY TECHNIQUES
1
Development of an in-situ Fission Track Analysis for Detecting Fissile Actinides in Soils and Sediments Contaminated with Actinides
M. H. Leea, H. Y. Pyoa, Y. J. Parka, K. Y. Jeea, Sue B. Clarkb
a Nuclear Chemistry Research Division, Korea Atomic Energy Research Institute, Daejon, Republic of Korea
bWashington State University, Department of Chemistry and Nuclear Radiation Center, Pullman, USA
E-mail address of main author: [email protected]
A fission track analysis (FTA) and an alpha track analysis (ATA) were developed to identify hot particles in contaminated soil or sediment. With the FTA techniques, the track image of the grid coated with Th and fissile nuclides on the Lexan detector was so clearly recorded that the location of the fissile particles was easily identified in the soil or sediment contaminated with the actinides. With the ATA techniques, many of the hot particles contaminated with Pu were discriminated from the U on the track detector due to the different sensitivity of the 239Pu and 235U on the CR-39 detector.
Conventional analytical methods used for determining concentrations and distributions of hot particles emitting alpha radiation involve a complex chemical processing and need intensive manpower. In recent years various FTA and ATA techniques with nuclear track detectors have been applied directly to highly contaminated soil without a radiochemical analysis. FTA and ATA techniques provide direct information for detecting nuclides with high fission cross sections such as 235U and 239Pu in contaminated environmental samples.
For the FTA, thorium was electroplated onto the SEM grid with electrodeposition solution. The current was adjusted to 0.85 A and held for 1 hour. After the SEM grid electroplated with Th was put on the track detector, contaminated soil particles collected from BOMARC missile facilities (McGuire Air Force Base, New Jersey) were sprinkled on the Lexan detector and then taped together to immobilized the soil particles. The samples were irradiated with a thermal neutron flux of 2.92 x 1012 cm-2⋅s-1. After the samples were unpacked, the detectors were etched in a solution of 6 M NaOH at 70 ± 1oC for 10 minutes. For the ATA, soil particles were sprinkled on the CR-39 detector and then taped for immobilizing the soil particles. The samples were exposed for a minimum of two weeks to create detectable alpha tracks. After the samples were unpackaged, the detectors were etched in a solution of 6.25 M NaOH at 75 ± 1oC for 5 hours. Fission and alpha tracks were observed using an optical microscope.
An image of the fission tracks by the grid electrodeposited with thorium was clearly recorded on the track detector. The image generated by the fissile nuclides can be distinguished from the image of the outline of the SEM grid. The fission tracks were not distributed randomly within the detector, but rather were arranged in a distinct “star-burst” shape. The fission tracks from the highly fissile nuclides were correlated with the fission tracks from the grid coated with thorium. By using the fission track image, the fissile particles within the grid
488

M. Lee et al.
2
electroplated with thorium were easily identified and could be separated from the sample matrix for the analysis of speciation of the single particles.
Alpha tracks of the contaminated BOMARC soil particles were recorded randomly on the CR-39 track detector. Various bundles of alpha tracks were recorded on the CR-39 detector, depending on the activity concentration of the fissile nuclides. The “agglomerated drops” shape of the alpha tracks on the CR-39 is a little different from the “star-burst” shape of the fission tracks on the Lexan. Most of the alpha tracks recorded on the CR-39 detector were likely generated from 239Pu not 235U, because the alpha tracks generated by 239Pu are more active on the CR-39 detector than those by 235U due to the different half- lives. This infers that many of the hot particles in the BOMARC soil may be contaminated with plutonium isotopes. This verification was supported from the results of the radiochemical analysis that the activity concentration of 239,240Pu in the BOMARC soil, approximately 4.56 Bq/g, was determined to be about two orders of a magnitude higher than the natural level of the 235U concentration. Also, for obtaining information of the speciation of the hot particles, the fissile particles can be further studied by microscale techniques such as SIMS (secondary ion mass spectrometry) and SXMA (synchrotron x-ray microprobe analysis), after separating the hot particles from the contaminated soil with the FTA techniques.
489

EXTENDED SYNOPSIS IAEA-CN-118/82P
TOPIC: RADIOMETRICS AND MASS SPECTROMETRY TECHNIQUES
1
Radon Alpha and Gamma-Ray Spectrometry with YAP:Ce Scintillator
W. Plastinoa,b, P. De Felicec
a Department of Physics, University of Roma Tre, Rome, Italy
bNational Institute for Nuclear Physics, Section of Roma Tre, Rome, Italy
c ENEA, National Ins titute for Metrology of Ionizing Radiations, Rome, Italy
E-mail address of main author: [email protected]
The detection properties of a YAP:Ce scintillator (YAlO 3:Ce crystal) for radon and radon daughters alpha and gamma-ray spectrometry was investigated.
The crystal response has been studied under severe extreme conditions to simulate environments of geophysical interest, particularly those found in geothermal and volcanic areas. Tests in water up to a temperature of 100 °C and in acids solutions such as HCl (37%), H2SO4 (48%) and HNO3 (65%) have been performed.
The experimental array consisted of a bare cylindrical crystal of YAP:Ce optically coupled to a Hamamatsu H5784 photomultiplier with standard bialkali photocatode. The crystal size was 8 mm diameter and 30 mm height. The crystal was positioned at the geometrical center of a 6 l stainless steel light- and gas-tight vessel equipped with gas input/output and a pass-through electrical connectors.
Output signals were integrated with a charge preamplifier, shaped with a spectroscopy amplifier (ORTEC-450) and processed by a multichannel analyzer card (ORTEC-Trump). The collected pulse-height spectrum was managed by a suitable MCA emulation software (ORTEC-Maestro32).
The device was serially connected to the radon Reference Measurement System (RMS) developed at the Nationa l Institute for Metrology of Ionizing Radiations (INMRI-ENEA) [2]. The RMS is routinely used for calibration and testing of radon measuring instruments and it provided the reference radon- in-air activity concentration needed for efficiency calibration of the YAP:Ce radon spectrometer. The RMS is based on a cylindrical electrostatic cell with a Si detector. It is used for the alpha spectrometry of the electrostatically collected polonium ions produced in the decay of radon. The radioactive source section consisted in a 35 cm3 glass bulb filled with about 15 kBq radon in air. The internal volume of the whole circuit was about 10 l.
The energy calibration curves of the device were obtained irradiating the crystal by means of a set of radioactive point sources of different radionuclides (133Ba, 241Am, 57Co, 22Na, 137Cs) positioned at 5 cm source-detector distance. These provided a number of photons with well spaced gamma-ray energies up to about 700 keV.
490

W. Plastino and P. de Felice
2
The measurements with standard radon sources provided by the INMRI-ENEA have emphasized the non-hygroscopic properties of the scintillator and a small dependence of the light yield on temperature and HNO3.
The data collected have pointed out that the YAP:Ce scintillator can allow high response stability for radon alpha and gamma-ray spectrometry in environments with large temperature gradients and high acid concentrations.
[1] PLASTINO, W., DE FELICE, P., DE NOTARISTEFANI, F., Radon gamma-ray spectrometry with YAP:Ce scintillator, Nucl. Instr. Meth. A 486 1-2 (2002) 146-149.
[2] DE FELICE, P., MYTEBERI, XH., The 222Rn Reference Measurement System developed at ENEA, Nucl. Instr. Meth. A 369 2-3 (1996) 445-451.
491

EXTENDED SYNOPSIS IAEA-CN-118/83P
TOPIC: RADIOMETRICS AND MASS SPECTROMETRY TECHNIQUES
The LαTERASE: State-of-the-art New Laboratory for the Use of Radioisotopes in Marine Environmental Studies
C. Rouleaua, É. Pelletierb
a Fisheries and Oceans Canada, Institut Maurice-Lamontagne, Mont-Joli (Qc) Canada
b Institut des Sciences de la Mer de Rimouski, Rimouski (Qc) Canada
E-mail address of main author: [email protected]
Radioisotopic techniques are used in many study fields of marine environmental sciences (biology, geology, geochemistry, ecotoxicology). Though these techniques have many advantages, facilities needed are often scattered among many different research laboratories. The establishment of the Laboratory of Radioisotopic Techniques Applied to Environmental Sciences (LαTERASE), a partnership between Canada Department of Fisheries and Oceans and Institut des Sciences de la mer de Rimouski, will fill this gap. Construction of the LαTERASE will begin in 2005, and once completed, it will provide marine environment scientists with a facility in which a unique assemblage of radioisotopic techniques will be available (Fig. 1). It will include: v A 140-m2 building with: Ø A wet laboratory with small aquaria (10-100 L), equipped with two specially designed
NaI gamma spectrometers fo r in vivo gamma counting, Ø A wet laboratory with 6 mesocosms (3 m3 each), Ø A radiochromatography laboratory, equipped for radio-TLC and radio-HPLC, Ø A radiochemistry laboratory equipped with controlled-atmosphere glove box for the
synthesis of radiolabelled chemicals not available from radiochemicals suppliers, and a shielded storage space for keeping radioactive chemicals and waste,
Ø A whole-body autoradiography laboratory, equipped with a Leica CM3600 cryomicrotome and Cyclone PhosphorImager system,
Ø An instrumentation room, equipped with two germanium gamma spectrometers, a well-type NaI gamma counter, and a liquid scintillation counter,
Ø A liquid nitrogen generator Ø A class-100 clean room for the preparation of low radioactivity samples (e.g., 14C-dating,
137Cs, 210Pb), with access via an elevator to the underground laboratory. v A 20-m2 underground laboratory (approx. 40 MWE deep) with: Ø A low background germanium gamma spectrometer with automatic sample changer, Ø An ultra-low background liquid scintillation counter with active guard.
In this presentation, facilities and equipment available at LαTERASE as well as present and planned research work will be discussed in details.
492

C. Rouleau and É. Pelletier
FIG. 1. Preliminary plan of LαTERASE
493

EXTENDED SYNOPSIS IAEA-CN-118/84P
TOPIC: RADIOMETRICS AND MASS SPECTROMETRY TECHNIQUES
1
AMS Measurement of 129I and its Application as an Oceanographic Tracer
T. Suzuki, T. Kitamura, S. Kabuto, O. Togawa, H. Amano
Japan Atomic Energy Research Institute, Aomori, Japan
E-mail address of main author: [email protected]
Two nuclear fuel reprocessing plants in Europe, La Hague (France) and Sellafield (England), have released 129I [1]. It has been used as an oceanographic tracer in the north Atlantic and/or Arctic Oceans [2]. In Japan, a new nuclear fuel reprocessing plant will be operated at Rokkasho in the near future. We intend to investigate not only the migration of 129I in the marine environment, but also the potential of 129I as an oceanographic tracer in the North Pacific Ocean, using 129I released from Rokkasho facility. Therefore an iodine beam line has been set up at AMS facility of Japan Atomic Energy Research Institute (JAERI-AMS). This AMS which is manufactured by High Voltage Engineering Europa (HVEE) has a 3MV accelerator and two independent beam lines. One is optimized for 14C measurement and the other is for 129I.
We tested the precision, accuracy and detection limit of the 129I beam line. The precision test was carried out using the IsoTrace Lab. Standard (129I/127I = 1.1 x 10⁻¹⁰). This demonstrated that iodine isotopic ratio could be measured with a precision of about 1% at the level of 10-10 isotopic ratio. Standard samples having some variety of iodine isotopic ratios were diluted from the NIST 4949C and one which is provided by Dr. Imamura. The results of the standard samples measurement were shown in Fig. 1. This demonstrated that iodine beam line had a good linearity between 10-10 and 10-12 isotopic ratio. The background level of the 129I beam line was estimated to measure commercial AgI, which was measured to be 129I/127I = (3.9±0.3) x 10-13. Since our measured detector spectrum which was shown in Fig. 2 did not exhibit any counts underneath 129I peak, we concluded that the detection limit was at least one order of magnitude lower than the measured ratio. We think that our high-sensitivity 129I beam line is a powerful tool for new marine environmental research.
To measure iodine isotopic ratio in seawater samples by AMS, it is necessary to convert iodine species to silver iodide. The sample preparation for AMS target was performed by an extraction method. An iodine carrier (2-3 mg) was added to a seawater sample after filtering it. After iodate was reduced to iodide by sodium sulfite under sulfuric acid solution, iodide was oxidized for the extraction to carbon tetrachloride. And then back-extraction was performed by the addition of sodium bisulfite and sulfuric acid solution. Silver nitrate was added to the extracted iodine solution to precipitate iodine as AgI. We confirmed that the AgI which was extracted from seawater by this method had good purity which was investigated by an electron microscope equipped with Energy-Dispersive X-ray analyzer.
In this presentation, we will discuss the ability of JAERI-AMS and 129I in seawater off Rokkasho in the North Pacific.
494

T. Suzuki et al.
2
10-12
10-11
10-10
10-9
10-12 10-11 10-10 10-9
Nominal Ratio (129I/127I)
Mea
sure
d R
atio
(129 I/
127 I)
FIG. 1. Results of 129I standard measurement. The x-axis indicates nominal ratio and y-axis indicates measured ratio of each standard. All data was normalized to IsoTrace Lab. Standard which has a nominal ratio 129I/127I =1.1x10⁻¹⁰.
0
20
40
60
80
100
595 600 605 610 615Channel
Cou
nts
FIG. 2. Detector spectrum on commercial AgI. Measurement time to obtain this spectrum is about 50 min.
[1] RAISBECK, G.M., YIOU, F., ZHOU, Z.Q., KILIUS, L.R., 129I from nuclear fuel reprocessing facilities at Sellafield (U.K.) and La Hague (France); potential as an oceanographic tracer, J. Mar. Sys. 6 (1995) 561-570
[2] SMITH, J.N., EILLS, K.M., KILIUS, L.R., 129I and 137Cs tracer measurements in the Arctic Ocean, Deep-Sea Res. I 45 (1998) 959-984.
495

EXTENDED SYNOPSIS IAEA-CN-118/85P
TOPIC: RADIOMETRICS AND MASS SPECTROMETRY TECHNIQUES
1
ISO 9001 Accreditation in an R&D Environment - Is it Possible?
R. Szymczak, A. Henderson-Sellers, R. T. Lowson, R. Chisari
ANSTO Environment, PMB 1, Menai NSW 2234, Australia
E-mail address of main author: [email protected]
The Australian Nuclear Science and Technology Organisation (ANSTO) is Australia's national nuclear organisation and its centre of Australian nuclear expertise. ANSTO is in the process of replacing its 1950’s, 15 MW, high flux (up to 1015 n cm-2 s-1) reactor with a new reactor which will allow it to continue its cutting edge nuclear science and radiopharmaceutical production well into the 21st century. A ministerial requirement for licensing the facility is ISO 9001 accreditation of its quality management system. The accreditation process has been staggered at ANSTO. Individual divisions are attaining ISO 9001 accreditation separately, leading up to site-wide accreditation of an overarching ANSTO Business Management System.
FIG. 1. Structural orientation schematic for ANSTO Environment.
ANSTO Environment is the largest multidisciplinary environmental research group in Australia and the largest R & D unit at ANSTO, comprising around 150 biologists, chemists, engineers, geophysicists, meteorologists, microbiologists, oceanographers, physicists, and technicians (Fig. 1). ANSTO Environment operates and maintains a wide range of advanced nuclear and analytical facilities including three particle accelerators, a 10 MV Tandem accelerator, a 3 MV Van de Graaff accelerator and a newly acquired 2MV HVEE tandetron; a high current 50 kV Metal Vapour Vacuum Arc Ion Implantation (MEVVA) Facility; a
ANSTO key facilities& environmentalmanagement for
Australian nuclearindustry
Nuclear-based toolsfor environmental
sustainability &climate change
Cleaner technologyfor the minerals
processingindustry
496

R. Szymczak et al.
2
Secondary Ion Mass Spectrometer (SIMS); and many other laboratory and field-based facilities.
The objective of ANSTO Environment is to carry out a problem-focused, balanced program of strategic and applied research and development, using its nuclear science-based core expertise and closely-related techniques, to:
• assist the Commonwealth Government to further its national and international initiatives, and to protect and conserve the natural environment through sustainable development;
• assist industry in advancing Australia's competitive position in the world economy;
• ensure that environmental monitoring of nuclear facilities is effective in assuring operational adherence to sound environmental protection principles.
“Make everything as simple as possible, but not simpler”
Albert Einstein
In February 2000 ANSTO Environment successfully acquired ISO 9001:2000 accreditation of its quality management system and was amongst the first organisations to adopt the new 2000 revision of the international ISO 9001 standard. The new standard allows a much more flexible and less prescriptive format for quality management systems however, in the absence of examples of accreditation in the R & D area, presented a challenge in concept, definition of process, buy- in by staff and subsequent maintenance of the successful certification. The ANSTO Environment Manual of Good Management Practice [1] outlines our identity, our vision, our core values, our responsibilities, our operational processes and our commitment to continual improvement via internal and external review.
This paper is a description and discussion of the elements, concepts and process for achieving staff buy- in in the face of initial opposition. This included identifying those necessary elements of a good management system, rejection of pejorative dogma associated with ‘Quality’ and ownership of the process by all the staff.
[1] AUSTRALIAN NUCLEAR SCIENCE AND TECHNOLOGY ORGANIZATION, Environment Manual of Good Management Practice, Ver 3, ANSTO, Australia (2003) 8.
497

EXTENDED SYNOPSIS IAEA-CN-118/86P
TOPIC: RADIOMETRICS AND MASS SPECTROMETRY TECHNIQUES
1
The Quality Control System in Environmental Water Radioactivity Laboratories
A. Camacho, I. Vallés, X. Ortega
Institut de Tècniques Energètiques, Technical University of Catalonia (UPC), Barcelona, Spain
E-mail address of main author: [email protected]
This report presents the quality control system developed at the Environmental Radioactivity Analysis Laboratory located at the “Institut de Tècniques Energètiques” of the Technical University of Catalonia (UPC) in Barcelona, Spain.
The laboratory was accredited, in June of 2002 according to the ISO 17025 Standard [1] for 16 procedures associated with the determination of low-level radioactivity in water. The laboratory has quality control procedures for monitoring the validity of radioactivity measurements in water. The data are recorded, and statistical techniques are applied to analyse the results. This monitoring includes external and internal quality control.
Internal quality control [2] involves the preparation of duplicates, the use of certified reference materials, the preparation of blank samples and instrument performance charts.
A minimum of one sample for every 20 samples is analysed in duplicate to verify internal laboratory precision for each procedure. The results are evaluated by the relative percentage difference test (RPD) in samples exceeding five times the detection level and by the spooled counting error (SCE) in the other samples.
The following equations are used to calculate RPD and SCE:
10021 ⋅−
=R
RRRPD 2
22121 3 ssRR +≤− (SCE),
where:
R1, R2 and R are the activities in the primary sample, in the duplicate sample and the mean value, respectively.
s1 and s2 are the counting errors associated with laboratory measurement of the primary sample and the duplicate sample.
The results are considered acceptable when the RPD is lower than 20% or the SCE condition is verified.
Certified reference materials are evaluated by control charts (CC). The CC determines the bias between the known activity and the individual determination. Acceptability is a function of the particular procedure.
498

A. Camacho et al.
2
The external quality control is based on the participation in inter-comparison tests and proficiency testing programs of radioactivity in water. These tests have been organized by the Environmental Protection Agency (EPA), the International Atomic Energy Agency (IAEA), the Spanish Nuclear Safety Board (CSN), the World Health Organization-International Reference Center for Radioactivity (OMS-IRC), Environmental Resource Associates (ERA) and some Spanish universities.
-3.0
-2.5
-2.0
-1.5
-1.0
-0.5
0.0
0.5
1.0
1.5
2.0
2.5
3.0
En
222Rn
90Sr gr
oss
beta
3H
210Pb U
isot
opes
210Po
226Ra gr
oss
alfa
228Ra
241Am
60Co
137Cs
Proporcional counterLiquid scintillation
Alfa spectrometry
Scintillation (SZn)
Gamma spectrometry
FIG. 1. En numbers obtained in the inter-comparison tests. Points show the mean value and bar the range.
The results have been evaluated by using the En number [3]. Figure 1 shows a summary of the En numbers (mean and interval values) obtained in the inter-comparison tests. The proposed quality systems ensure the reliability of the laboratory measurements.
[1] INTERNATIONAL ORGANIZATION FOR STANDARDIZATION, General Requirements for the Competence of Testing and Calibration Laboratories, ISO-17025 (1999).
[2] ENVIRONMENTAL PROTECTION AGENCY, Handbook for analytical quality control in radioanalytical laboratories, EPA-600/7-77-088 (1977).
[3] INTERNATIONAL ORGANIZATION FOR STANDARDIZATION, Proficiency testing by interlaboratory comparisons, Part 1, ISO-43-1 (1997).
499

EXTENDED SYNOPSIS IAEA-CN-118/87P
TOPIC: RADIOMETRICS AND MASS SPECTROMETRY TECHNIQUES
1
Nuclear and Physical Methods of Monitoring of the Content of Technogeneous (Pu, Am) and Nature (Rn) Radionuclides in the Environment used in Belarus
I. V. Zhuk, O. I. Yaroshevich, V. A. Bryileva, M. K. Kievets, E. M. Lomonosova
Joint Institute of Power and Nuclear Research, National Academy of Sciences of Belarus, Acad. A.K. Krasin str. 99, Minsk 220109, Belarus
E-mail address of main author: [email protected]
The paper presents a description of some techniques developed or modified in JIPNR to measure transuranium elements and radon content. For express determination of Pu and 241Am content in the territories contaminated as a result of heavy accident on NPP’S the technique was developed that allowed determining content of all Pu-isotopes (238Pu, 239Pu, 241Pu, 241Pu) in the samples by means of measuring of 241Am activity with x-γ- modified spectrometry method and calculating of composition of fuel in the reactor by the time of the accident. The necessary algorithms and software for the calculation of Pu content are described. Here, it is supposed, that the radionuclides released from different parts of the reactor’s core mixed in the air well [1] and fell down on the surface of the ground with the average composition formed in the reactor by the moment of the accident. It is also accepted that the relative content of Pu isotopes is preserved (with the account of the radioactive decay) in the migration process in the environment after release from the reactor. The approach specified gives the possibility to exclude practically labour-consuming radiochemical analyses of soil samples on Pu content. The comparison of the results of this express calculation-experimental method with the results of traditional radiochemical analyses for territories at the distance of 8 to ~ 50 km from the Chernobyl NPP is presented in the table. TABLE I. COMPARISON OF THE RESULTS OF SPECIFIC ACTIVITY DETERMINATION (Bq/kg) OF 241Am AND Pu ISOTOPES IN SOIL SAMPLES
Isotope 241Am 239+240Pu Point of Resettlement, Distance from ChNPP/ Soil Type
Experiment (γ-χ-spectrometry
technique)
Experiment (radiochemistry
analysis, α-spectrometry)*
Calculation by the measured activity
of 241Am
v. Masany, 8 km/ turf-podzol
230 ± 40 240 ± 40 245
v. Kryuki, 20 km/sandy 110 ± 35 105 ± 30 117 v. Dernovichi, 33 km/ peat-bogged
21 ± 7 18 ± 6 22
v. Lomatchy, 48 km/ turf-podzol
22 ± 8 20 ± 6 23
*Radiochemical analyses as to 239+240Pu content in soil samples have been carried out by V.P. Kudrjashov and V.P. Mironov (Institute of Radiobiology NASB).
500

I. Zhuk et al.
2
For the measurements of Pu and 241Am in soils and sediments a modified x-γ- spectrometry technique was used, based on measurement of γ-radiation of 241Am with Eγ=59,6 keV using planar HPGe-detectors with large surface (1000-2000 cm2) and standard sources made of sand, impregnated with standard 241Am solution. Two variants of this technique were used: (i) direct measurement of x- γ- radiation from the investigated samples and (ii) the measurement after simple chemical procedures (i.e. co-precipitation Pu and Am with oxalic salts for purification of investigated samples from the interfering radionuclides Cs and Sb first of all). The minimum detectable activity Amin is 1,0 Bk/kg for 241Am and 80 Bk/kg for 238,239,240Pu. The cost and time of such analysis is less in several times than at the radiochemical analysis with the following alpha-spectrometry. Technique is described in details [2].
To carry out large-scale radon measurements in air of building the method was applied, based on using passive integral radonometers with solid state nuclear track detectors (SSNTDs) and allowed to obtaining results averaged vs. long time interval (up to 3 months) and thus taking into account temporal variation of radon exhalation from soil and real regime of ventilation of building. The nitrocellulose KODAK film LR-115 was used as the SSNTD. The equipment used allowed performing subsequent chemical treatment of large amount of SSNTDs (up to 100) after its exposition and automatic electrospark accounting of tracks.
In this paper we describe equipment and some results of indoor radon measurements carried out using this technique. The radon chamber, used as a standard radon source, is also described.
The reliability of the results obtained is verified by interlaboratory comparisons. The results of measurements of radon volumetric activity are presented, obtained in the framework of the program of interlaboratory comparisons in Belarus.
[1] ORLOV, M.YU., SNYKOV, V.P., KHVALENSKYJ, YU.A., et al., Radioactive contamination of the territory of Belarus and Russia after the Chernobyl NPP accident, Atomic Energy, 72 4 (1992) 371-376.
[2] BUSHUEV, A.V., ZUBAREV, V.N., PETROVA, E.V., et al., Development of gamma ray/x-ray spectrometric methods for monitoring the contamination of soil with 241Am and Pu, Atomic Energy 82 2 (1997) 116-123.
501

EXTENDED SYNOPSIS IAEA-CN-118/88P
TOPIC: RADIOMETRICS AND MASS SPECTROMETRY TECHNIQUES
1
Development of a Laboratory Information Management System at IAEA-MEL
J. Bartocci, H. Ramadan, I. Osvath, P.P. Povinec
International Atomic Energy Agency, Marine Environment Laboratory, Monaco
E-mail address of main author:[email protected]
In order to deal with an increasing number of incoming samples and/or to follow more closely their life cycle within an analytical laboratory, a computerized system is generally used to increase trackability and to support Good Laboratory Practice. The System for Laboratory Information Management (SLIM) which is under development at IAEA-MEL is a computerized system designed to suit the sample processing and analytical operations specific to a marine environment laboratory running a wide range of projects involving measurement of radioactive and non-radioactive contaminants and tracers and global-scale support to analytical quality. The system is custom-tailored to IAEA-MEL needs yet it is flexible enough to be adaptable for use in other environmental analytical labs.
The design of the SLIM database structure was the first step of the system development. While no changes are foreseeably needed in the developed backbone structure, the database implementation can evolve with software, hardware and communication-related options, one key area being that of analytical instrument-computer interface.
The structure of the database can be divided in three distinct parts:
i) collection of information,
ii) sample tracking,
iii) reporting results.
These different parts show the different laboratory activity areas covered by the SLIM database. The structure (tables and fields) of the database were designed, and at present the implementation is being planned as a multiple step process, starting with basic functions i) and ii), and building upon these gradually. The implementation of SLIM will support increased trackability and efficiency and will facilitate laboratory management.
Fig. 1 shows the principal structure of the SLIM database, distinguishing its three main parts: the collection of information, the sample tracking and the reporting of results.
502

2
FIG. 1. The principal structure of the SLIM database.
503

EXTENDED SYNOPSIS IAEA-CN-118/89P
TOPIC: RADIOMETRICS AND MASS SPECTROMETRY TECHNIQUES
1
In-situ Gamma-ray Spectrometry with the K-A-TE-RINA Submersible Detector
C. Tsabarisa, I. Thanosa and Th. Dakladasb
a Hellenic Centre for Marine Research, P.O. Box 712, 19013 Anavyssos, Greece
bMinistry of National Defence, 1550 Mesogion 151, Greece
E-mail address of main author: [email protected]
A new detection system, named K-A-TE-RINA (Innovative Sensor for Artificial Radioactivity), has been developed for radioactivity measurements in the marine environment. The system is based on a ? aI scintillator housed in a tube made of special plastic material capable for operation in open sea. The efficiency of the detection system is measured in the laboratory using two reference gamma-ray sources: 40K and 137Cs. The developed electronics offer proper adjustment of the maximum detection energy in order to apply the system in different key-environments, focusing on a requested radionuclide. The low power consumption and the gain stabilization of the output voltage make the developed system reliable for long term measurements. Many tests were also made in order to check the linearity of electronics in case of long term measurements.
The system was deployed in open sea in order to measure background and volumetric activity variation of 137Cs and 222Rn decay products. The field measurements in the Aegean Sea offer very promising results concerning the use of the whole system in the marine environment. In future, the system will be installed on a specific application buoy together with other sensors (such as salinity, rain gauge, temperature and wind direction), for investigations of the correlation of natural and man-made radioactivity with oceanographic and atmospheric measurements.
504

EXTENDED SYNOPSIS IAEA-CN-118/90P
TOPIC: HYDROLOGY
1
Environment of Paleowater in Sudan
M. K. Ahmeda, M. H. El Kabirb
a Labs Section, Groundwater and Wadis Directorate, Ministry of Irrigation and Water Resources, Khartoum, Sudan
bInformation Center Groundwater and Wadis Directorate, Ministry of Irrigation and Water Resources, Khartoum, Sudan
E-mail address of main author: [email protected]
Many natural and environmental developments created the conditions for paleowater occurrence in Sudan and possibly other areas. The major developments include: geological, structural and climatic.
The geological environment includes the formation of Basement Complex (BC), which are the oldest rocks emplaced during Pre-Cambrian to the early Jurassic followed by the severe erosion, magmatism and deformation during the Jurassic. The uncomfortable deposition of the sedimentary rocks started in the Paleozoic and continued in association with the tectonic activities.
Structural features resulted from the frequent tectonic activities controlled the configuration and geographical distribution of the sedimentary basins. The NW Central African Shear Zone CASZ, slip fault Wrench Strike to the West of the CASZ and the Garaf Strike Slip fault led to the establishment of depressions and deposition of the Paleozoic and Mesozoic sediments forming the sedimentary basins in Northwest (Sahara), in Southwest (Bagara) and in the east central (R Atbra)of Sudan respectively.
The paleoclimatic investigations in the region covering: Lake Chad, the Nile system, Ethiopian Plata, Libya and Egypt suggested humid conditions between 40000 and 3000 Bp. The wet period was interrupted by dry periods. The early wet periods were recorded in Lake Chad. The estimated age of Paleowater cluster between 30000 – 20000 and 10000 and 3000 BP and few ages between 10000 and 20000 PB in agreement with the defined dry period between 20000 and 13000 BP.
The recharge of the Nubian aquifer remains a debatable topic. The so far conducted studies using environmental isotopes and hydrochemistry on the basis of conventional approaches suggest. The infiltration rate of water from the rainfall is estimated at 0.4 and 1.0 mm/y in the arid zones in the north (R Atbra Basin) and increases up to 10.0mm/y in the relatively wet areas in the south (Bagara Basin). The lateral recharge from the Nile system is evident up to 35 Km or so from each side. The Strength of the Nile influence varies and controlled by structural, geological and hydraulic factors. The influence of the seasonal wadis is weak and limited. The aquifer condition is free water table to artesian (Oases and Gaabs). The Total Dissolved Solids in paleowater range is 400 – 600 Mg/L. The Paleowater type is Calcium-Magnesium with law values of HCO3/Cl+SO4 and the Cl concentration reaches 150 Mg/L in relatively old water.
505

M. Ahmed and M. El Kabir
2
Fig ( 3 )Deterium and Oxygen 18 pattern in different regions of Sudan
???D = 8 * ????O18
+ 10
-100
-80
-60
-40
-20
0
20
40
60
-15 -10 -5 0 5 10
?O 18
?D
PN
PU
MN
MU
RNR
PN = Nubian paleo wate r
PU = Um Ruwaba paleo waterM = Mixed water
RNR = Recent water of Nile Rain
506

EXTENDED SYNOPSIS IAEA-CN-118/91P
TOPIC: HYDROLOGY
1
Hydrogeochemical and Isotopic Study of Groundwater Mineralisation in the Oriental Coastal Aquifer of Cap Bon, Tunisia
M. F. Ben Hamoudaa, K. Zouarib, J. Tarhounic, C. B Gayed, M. N Oueslatie
a Hydrology and Isotope Geochemistry Unit, CNSTN, Tunisia
bLaboratoire de Radioanalyse et Environnement ENIS, Tunisia
cInstitut National Agronomique de Tunisie, INAT, Tunisia
dInternational Atomic Energy Agency, Austria
eCommisariat Régional de Développement Agricole de Nabeul, Tunisia
E-mail address of main author: [email protected]
The study area is located in the northeastern part of Tunisia about 60 km south of the Tunis city. It is bounded by the Gulf of Hammamet in the east, Djebel Sidi Aberahmane in the west, The town of Nabeul in the south and the area of the town Kelibia in the north. The landscape is a coastal plain slightly sloping (3%) towards the sea. The groundwater of the Oriental coast aquifer system occurs mainly at two levels, a shallow aquifer up to depths of about 50 m whose reservoir is consisted by sediments of the Plio quaternary and a deep aquifer between about 150 and 400 m located in the sand stone formations of Miocene of the anticline of Djebel Sidi Abderrahmene [2]. The climate of the region is semi-arid to sub-humid and of Mediterranean type. The summer season is dry and hot and rain falls mainly in the cooler winter season. The long-term mean annual rainfall varies between 400 and 450mm, and the mean annual potential evaporation is at 1100 mm. There are no perennial rivers in this region; but intense storms occasionally cause surface runoff, which is discharged by the oueds. Oued Chiba and Oued Lebna are the major oueds witch is constructed two dams for better management of the ground water for agriculture in the region. The study is related to a technical cooperation project with the International Atomic Energy Agency, Vienna, Austria, aimed at the use of isotope techniques to study the seawater intrusion into the coastal aquifers of Cap Bon in Tunisia. In this regard, a better understanding of the recharge and flow regime as well as the origin or salinity of the groundwater was required. To reach this goal, isotope and geochemical investigations were carried out. Water samples were taken from wells, boreholes from deep and shallow aquifer of the Oriental coastal aquifer located between Beni Khiar in the south and Kelibia in the north. The samples were analysed for their chemical and isotopic compositions (18O, 2H, 3H, 13C, 14C, 34S). In the following, the results of these analyses are presented and discussed in terms of the recharge and flow regime of the groundwater and the origin and evolution of its salinity.
507

M. Ben Hamouda et al.
2
The results of geochemical and isotopic studies have shown that the groundwater is very heterogeneous and suggest the aquifer is replenished by recent water coming from direct infiltration from rain. At some sites the presence of bomb-tritium indicates a modern component of recharge in the groundwater. This suggests that the aquifer is unconfined, at least in its upper layer. 14C data will be used to estimate the rate of local recharge [6]. The salinity of the groundwater appears to originate from dissolution of minerals (halite) in the aquifer system. The higher values of the dissolved anions and cations in korba area are due to higher sodium and chloride concentrations coming from mixture with sea water [5]. The changes of the latter concentration seem to be associated with changes of the proportion of local recharge. In general, the oriental coast aquifer system receives relatively a good recharge coming from water of current precipitation. This contribution of current water is shown also on the deep aquifer, in particular on the level of the piedmont. This situation seems to indicate that the reconstitution of the reserves is fast in these areas. The salinity is generally acquired by dissolution associated with a process of evaporation [1]. However for the shallow aquifer a contamination by a mixture with seawater is extremely probable, in particular in the sectors of Korba and Tefelloune, where we observe a negative piezometry and the salinity can reach the 8 g/L.
Plot of δ1 8 O versus δ2 H in the Groundwater of the Oriental Coast Aquifer
-37
-27
-17
-7
-6 - 5 -4 -3 - 2 -1
Delta O-18 (‰ vs SMOW)
Shallo w Aquifer 2001GMWLLo c a l line o f Tunis CarthageDeep Aquifer 2001Shallo w Aquifer 2002Deep Aquifer 2002
[1] BARBECOT, F., MARLIN, C., GIBERT, E., DEVER, L., Identification et caractérisation d'un biseau salin dans l'aquifère du Bajocien-Bathonien de la région de Caen (France), C. R. Acad. Sci. Paris 326 (1998) 539-544.
[2] ENNABLI, M., Etude hydrogéologique des aquifères du Nord-Est de la Tunisie pour une gestion intégrée des ressources en eau Thèse de Doctorat ès sciences naturelles (1980).
[3] FONTES, J.CH., Isotopes du milieu et cycle des eaux naturelles: Thèse Doctorat ès Sciences, Univ. Paris VI (1976) 208 pp.
508

EXTENDED SYNOPSIS IAEA-CN-118/92P
TOPIC: HYDROLOGY
1
Predictions of Sea-Level Rise for Coastal Geosystem of Togo (between Volta and Mono Rivers in the Gulf of Benin/West Africa) ; Physical and Economic Manifestations
A. Blivi
University of Lomé, Centre of Coastal Management and Environment, Lomé, Togo
E-mail address of main author: [email protected]
The coastal zone of Togo is very narrow and covers an area of 1710 square kilometers. It constitutes an essential economic potential of the country due to the concentration of more than 90% of its economic activities, more than 42% of its whole population and of that of Lomé.
The coastal landscape encompasses the delta system of the Volta river in Ghana to which are adjoined the clearly differentiated offshore bars, parallel to the coast and the uninterrupted lagoon systems which run into the alluvial plain of the Mono River. The coastline is located in the current offshore bar at a mean of 2 and 3 meters above average sea level. It is lower, at 1 meter in the barrier crossbar at the level of the lagoon and river mouths. The climatic regime of the coastal zone depends upon two air currents with two contrasted seasons during the year. The temperatures are constant throughout the year and vary between 25° and 28°C.
The coastal geosystem is fed by the Volta and Mono Rivers. The dams built on the two rivers put a limit on the sedimentary volume drift to the sea : this accentuates the sedimentary loss and erosion in the lagoon zone and around the mouths of the rivers.
The hydrodynamic regime is conditioned by local and regional meteorological elements, namely the marine winds of the Southern Ocean which generate swells and waves. These waves create on the coast a current of coastal drifting west to east, which activates the mechanism of the coastal morphosedimentary process. An examination of the sandy coasts where a current withdrawal of the seashore is noticed in West and Central Africa shows that this dynamic process is generally the result of human action. It is not linked to the sea transgression correlative to the greenhouse effect.
Scientific research as regards climate confirms the greenhouse effect linked to the increase of the CO2 content in the atmosphere which could probably be the cause of climatic change with subsequent rise in temperature from 1 to 3°5 C. This phenomenon will lead, among others to a partial fusion of glaciers of the Antarctic and Greenland which will in its turn lead to the rise in the sea level up to many centimeters even to a meter with biophysical consequences in coastal zones.
The statistical analysis of available maregraphic data on marshes and ponds, though relatively limited, of the coastal stations of Abidjan, Takoradi and Tema, enable us to prove, basing especially on the data of Takoradi, a secular trend, holding the year 1930 as a reference of sea level rise along the West African coasts that could reach 30 cm in 2030.
Working from sea level rise data (from 1930 to 1969) of the station of Takoradi, and based on the hypothesis of rhythm regularity of meteorological and oceanographic phenomena of which data are not available, we discovered that the rate of mean annual rise is 0.34 cm. We foresaw three scenarios of sea level rise : one with the current trend (annual rise of 0.34 cm) ; another one,
509

A. Blivi
2
with climatic change, assuming an acceleration rhythm of the sea level twice higher than the current trend (mean hypothesis) ; and a scenario of acceleration rhythm of the sea level four times higher than the current trend (high hypothesis).
The gradual sea level rise will be remarked in the zone of lagoon and river mouths of the Volta and the Mono. These two zones, low enough, will be rapidly submerged under the influence of the simple process of sea level and the sea waters will climb up the plains, the lagoon systems, the valleys up to the steep slopes, and the coming in waters by diffusion under the influence of the tides. Along the coast, submersion by amplified waves will be frequent with restructuring of the coastal profile and lowering of the coastline. They will provoke breaks in short segments of the barrier crossbar because of the strong lamination. The salinisation of the lands, of underground and surface waters will constitute one of the characteristics.
The other direct effect corresponding to these manifestations of coastal physical oceanography is the accentuation of the speed of the coastal erosion. The data pertaining to the coastal erosion in the current conditions indicate an annual mean of 5 meters. It is certain that this retreat value of the coastline, in the perspective of climatic changes, will progressively increase to 10 meters per year. The consequences in terms of area of lost land will be important.
0
20
40
60
80
100
120
140
160
Hei
ghts
(cm
)
Low hypothesis Mean hypothesis High hypothesis
Low hypothesis 3,74 7,14 14,28 21,42 28,56 35,7 42,84 49,98 57,12 64,26 71,4
Mean hypothesis 3,74 10,54 17,34 24,14 30,94 37,74 44,54 51,34 58,14 64,94 71,74
High hypothesis 3,74 17,34 30,94 44,54 58,14 71,74 85,34 98,94 112,5 126,1 139,7
2000 2010 2020 2030 2040 2050 2060 2070 2080 2090 2100
510

EXTENDED SYNOPSIS IAEA-CN-118/093P
TOPIC: HYDROLOGY
1
210Po in Meteoric and Surface Waters at Corumbataí River Basin, São Paulo State, Brazil
D. M. Bonotto, J. L. N. De Lima
Instituto de Geociências e Ciências Exatas – UNESP, Rio Claro, São Paulo, Brazil
E-mail address of main author: [email protected]
210Po is an intermediary member of the natural mass number (4n+2) 238U decay series that finishes at the stable 206Pb, according to the sequence: 238U (4.49 Ga, α) → 234Th (24.1 d, β -) → 234Pa (1.18 min, β - ) → 234U (0.248 Ma, α) → 230Th (75.2 ka, α) → 226Ra (1622 a, α) → 222Rn (3.83 d, α) → 218Po (3.05 min, α) → 214Pb (26.8 min, β -) → 214Bi (19.7 min, β -) → 214Po (0.16 ms, α) → 210Pb (22.26 a, β-) → 210Bi (5 d, β -) → 210Po (138 d, α) → 206Pb. Because some of the 222Rn escape from the rocks and minerals to the surrounding fluid phase, such as air, 222Rn emanating from land surfaces is responsible for 210Pb and 210Po present in the atmosphere. The average 222Rn escape rates measured and calculated in the northern high latitudes are 0.18-0.53 atom cm-2 s-1 [1]. The oceans are not considered important sources of atmospheric 222Rn, since the oceanic flux is about 1% of the continental one [2]. 210Pb produced by 222Rn is removed from the atmosphere by precipitation, being its concentration in rain of about 2 pCiL-1 [3]. The atmospheric 210Pb returning to the earth's surface has been commonly referred to as unsupported (excess) 210Pb, and neither 210Po nor 210Pb have been significantly investigated in atmospheric studies performed at South America.
The purpose of this investigation was to characterize the presence of 222Rn and 210Po in wet (rainwater) deposition occurring at a very important sedimentary basin located in São Paulo State, Brazil, i.e. the Corumbatai river basin (Fig. 1). It is a sub-basin of the giant Paraná sedimentary basin (Paleozoic - Cenozoic) that extends over an area of 1,700,000 km2. The Corumbataí river is the major river draining the area, and its water is extensively used by water supply systems in the basin. Since rainwater deposition has been recognized as a major source of dissolved species in rivers, surface waters from Corumbataí river were also collected at two sampling points, upstream and downstream from Rio Claro city, the principal municipality within the basin (Fig. 1).
Surface waters and rainwater samples for 210Po and 222Rn analyses were collected between January 1998 and January 1999. Volumes between 10 and 21 L were utilized for 210Po analysis, whereas 1 L was used for evaluating 222Rn in rainwater. A known amount (7.68 dpm/mL) of 209Po spike was added to each sample for 210Po analysis, and polonium co-precipitated with Fe(OH)3. The recovered Po was plated onto a copper disc suspended in a 20% hydroxylamine hydrochloride + 25% sodium citrate solution heated to 85-90°C, and stirred during 75-90 min [4]. Conventional alpha spectroscopy with Si(Au) surface barrier detectors coupled to EG&G Ortec multichannel buffer was used to acquire the 210Po activity concentration data. 222Rn in rainwater was extracted by circulating a stream of Rn-free air through the sample container to purge the water phase of its dissolved/accumulated 222Rn. The emanation procedure [5] consisting on its removal from the sample, its transfer to a scintillation flask, and its detection by alpha-scintillation counting was used to acquire the 222Rn activity concentration data.
511

D. Bonotto and J. De Lima
2
210Po activity concentration in rainwater ranged between 0.04 and 1.19 dpm/L (average = 0.35 dpm/L) and between 0.07 and 0.46 dpm/L (average = 0.20 dpm/L) at the two investigated sampling points, whereas the 222Rn activity concentration ranged between 40 and 479 dpm/L (average = 182 dpm/L). Thus, low 210Po/222Rn activity ratios corresponding to 0.0002-0.004 were determined, implying on the non-existence of secular radioactive equilibrium between these nuclides. This is, in fact, expected since the 210Pb half life is much higher than that of its parent 222Rn. 210Po activity concentration in surface waters collected upstream from Rio Claro city ranged between 0.06 and 0.75 dpm/L (average = 0.23 dpm/L), whereas in surface waters collected downstream from Rio Claro city ranged between 0.07 and 0.65 dpm/L (average = 0.26 dpm/L). A trend of decreasing 210Po activity concentration in accordance with increasing rainfall was identified at both sampling sites, that is compatible with dilution effects in surface drainage during the more rainy periods. Traditionally, the drainage in the Corumbataí river basin has received along the time significant in natura emissions of municipal waste products and discharge of waste water, sludge, sewage, sanitary and industrial effluents, among others. Thus, the water quality downstream from Rio Claro city is much worse than that of upstream from Rio Claro city, but, despite this, the dissolved 210Po activity concentration is practically the same at both sampling sites. This suggests that 210Po is a conservative nuclide, potentially much important to be used as a natural tracer of hydrological systems, even in polluted areas.
FIG. 1. Sketch map of the studied area and location of the sampling points for surface waters
analysis.
[1] BASKARAN, M., NAIDU, A.S., 210Pb-derived chronology and the fluxes of 210Pb and
137Cs isotopes into continental shelf sediments, East Chukchi Sea, Alaskan Artic, Geochim. Cosmochim. Acta 59 (1995) 4435-4448.
[2] WILKENING, M.H., CLEMENTS, W.E., The ocean as a source of atmospheric radon-222, J. Geophys. Res. 80 (1975) 3828-3830.
[3] EAKINS, J.D., MORRISON, R.T., A new procedure for the determination of lead-210 in lake and marine sediments, Int. J. Appl. Radiation Isot. 29 (1978) 531-536.
[4] FLYNN, W.W., The determination of low levels of polonium-210 in environmental materials, Anal. Chim. Acta 43 (1968) 221-227.
[5] LUCAS, H.F., Improved low-level alpha-scintillation counter for radon, Rev. Scient. Instrum. 28 (1957) 680-683.
512

EXTENDED SYNOPSIS IAEA-CN-118/94P
TOPIC: HYDROLOGY
1
Isotope Techniques Application in Understanding the Recharge Process of the Davao City Aquifers
S. Castañedaa, T. Garciaa, L. Fernandeza, L. Ascañoa, A. Ramosa, L. Del Castilloa, H. Maspiñasb, E. Calonzob, J. Diazb, R. Cabanagb, E. Regalaldob, L. Hanc
a Philippine Nuclear Research Institute, Commonwealth Ave. Diliman, Quezon City, Philippines
bDavao City Water District, Davao City, Philippines
c Isotope Hydrology Section, IAEA, Vienna, Austria
E-mail address of main author: [email protected]
The study area, 42 km x 33 km, is within the Talomo–Lipadas-Sibulan (TLSS) catchment basin. The groundwater aquifer is composed of reworked and redeposited overlapping flows of Quaternary pyroclastics [1]. It has an upper unconfined aquifer composed of sand, gravel and occasional boulders which is tapped by shallow domestic wells. The deeper aquifer which is being tapped by wells of the Davao City Water District at depths ranging from 46 to about 140 meters below ground level is multi- layered aquifer separated by thin, relatively less permeable layers of clay. Three river systems, Lipadas River to the west, and Talomo and Davao Rivers to the east traverse the study area. These flow through the city and empty into Davao Gulf, south of the city.
Chemical composition of the groundwater shows that most of the waters in the Talomo- Lipadas-Sibulan catchment (TLSS), are classified as Ca+Mg-HCO3 waters with the fluid with the exception of one well which is a mixture of Ca+Mg-HCO3 and Na+K-Cl waters. The composition diagrams of the water sources indicate mixing between water sources.
The mean isotopic composition of precipitation in Davao City has been established from data obtained for the period December1999 to January 2002 from four stations located at different elevations in the watershed. d18O values ranged from –13.51‰ to –3.54‰ and d2H values ranged from –85.28‰ to –16.13‰. A local meteoric line (LMWL) was established for the region with the equation d2H = 8*d 18O +12 (Fig. 1). The isotopic composition of groundwater and surface waters in Davao City showed small variations, clustered along the LMWL (Fig. 2). Groundwater from production wells with depths ranging from 90 m to 152 m, exhibited isotopic compositions ranging from -49.9‰ to 39.90‰ for δ2H and -7.64‰ to -6.38‰. This suggests a uniform and large amount of groundwater recharge. Differences in recharge altitude and mixing of different water origin could explain the slight variation in isotopic contents.
The isotopic composition of precipitation exhibited an altitude effect. A gradient of -0.22‰/10m was obtained for 18O (Fig. 3) while a gradient of -1.6‰/100 m resulted for 2H. From these altitude effect lines, the elevations of recharge for the groundwater in the study area were estimated.
513

S. Castenada et al.
2
The profile of ‰ 18O in the groundwater from the Talomo-Lipadas catchment area reveals a distinct trend. The trend goes from less negative values inland to more negative values near the coast. As seen from water chemistry, three groups of water are revealed from the isotopic composition trend of the waters. The inland groundwater has isotopic composition similar to that of low altitude rainfall or river fed by rain from low altitude. This has been estimated to be coming from elevations 200 m to 250 m. Groundwater with the most negative va lues is tapped along a 2-km wide region adjacent to the coast. This coastal water is derived from higher altitudes estimated to be at elevations between 400 m to 500 m. Isotopic values gradually decrease towards the coast. Mixing between the shallow low altitude groundwater and the deep high altitude groundwater produces this decreasing trend in isotopic composition.
The results of the study gave a better understanding of the aquifer systems in Davao City. It corroborated the results of other investigations on the recharge and vulnerability of groundwater conducted in the Talomo–Lipadas watershed [2].
d2H= 8d18O + 12
-100.00
-90.00
-80.00
-70.00
-60.00
-50.00
-40.00
-30.00
-20.00
-10.00-14.00 -13.00 -12.00 -11.00 -10.00 -9.00 -8.00 -7.00 -6.00 -5.00 -4.00 -3.00
d2H
d18O
R2 = 0.9792
precipitation
Elevation = -463.8022del18O - 2969.9R2 = 0.9194p=0.0412
0
100
200
300
400
500
600
700
-7.60 -7.40 -7.20 -7.00 -6.80 -6.60 -6.40 d18O
Ele
va
tio
n (
ma
sl)
FIG. 3. Altitude effect line for 18O in precipitation.
[1] GEODYNE CORPORATION, Asia Characterization of aquifers in Davao City, A report to DENR Regional office, MEIP and the World Bank (1998).
[2] DEPARTMENT OF SCIENCE AND TECHNOLOGY, Regional Office 11, Davao City, A report on the potential vulnerability of the Talomo-Lipadas as a groundwater recharge area, March (2004).
-55
-50
-45
-40
-35
-30
-8.0 -7.5 -7.0 -6.5 -6.0 -5.5 -5.0
d18
O
d 2H
Deep coastal wellsdeep inland wellsTugbokShallow wellsTalomo,low altTalomo,mid altTalomo,high altLipadas River
LMWL
FIG. 1. LMWL from 18O and 2H data for precipitation in Davao City (December 1999–January 2002).
FIG. 2. Relationship of δ18O and δ2H in groundwater and surface waters with the LMWL in the TLSS catchment of Davao City.
514

EXTENDED SYNOPSIS IAEA-CN-118/95P
TOPIC: HYDROLOGY
1
Residence Times for Surface Waters in Altered Granite Area : Example of the “Furan” Water Catchment, East French Massif Central
F. Gal, C. Y. J. Renac, D. Tisserand
Universite Jean Monnet, Laboratoire Transferts Lithospheriques, Saint Etienne, France
E-mail address of main author: [email protected]
The topic of this study is to understand the behaviour of surface waters in a small catchment area (c.a. 3300 ha – altitudes ranging from 550m to 1300m). Six springs located in the southern part of the French Massif Central have been studied for two years. The “Furan” watershed composed of metric arena overlays in a granitic and gneissic basement.
Oxygen and Hydrogen stable isotope ratios were determined routinely. Tritium, carbon isotopes as well as alkalinity were punctually determined. Cations and anions were quantified using ICP-AES and ion chromatography. Further more, to better understand stable isotopes catchment’s behavior, three years of daily rainwater sampling provide a well define local meteoric water line (collection at 400m asl). Moreover, two other LMWL were established, at 770m and 1100m to quantify spatial and altitudinal changes.
Cations and anions content of springs are enriched regarding precipitation compositions (few mg/L), and the chemical content refers to low temperature reactions. Total dissolved ions range between 30 mg/L and 130 mg/L. Few alkalinity values were measured, from 1 to 7 mg/L as bicarbonate alkalinity, but there is no clear evidence that they match real values, sulphate content being higher. Ionic mass balance, based on pe redox equilibrium, were made using PhreeQC [1] and appears to be good for half of the springs (< –10%). The other half gives in first approach bad values, leading to break in the ammonium ion. Such NH4
+ content might be related to agricultural impact. Inverse modelling suggests interaction with minerals such as kaolinite, chlorite, K-feldspar, underlining reactions between percolating water and altered granites.
From rainwater isotopic records, altitudinal variations are too small to modify both slope and D-excess of the LMWL. So the monthly mean of three years record is taken as representative of local rains and leads to δD=7.4δ18O+3.8 (r²=0.96). During the year 2003 occurred a 40% decrease of pluviometry / mean annual pluviometry: high isotopes values recorded for these summer months lead to a depletion of –0.4 for the slope and 3.5‰ for D-excess. This may affect stable isotopes values for very near surface aquifers, and was slightly detected regarding sampled springs.
Stable isotopes ratios measured on those springs show no clear annual cycle: winter months are not always associated with depleted ratios. Maximum variations are ± 1‰ for δ18O vs SMOW and ± 10‰ δD vs SMOW. Using isotopes ratios, these springs show an alignment along lines parallel to the LMWL, showing that they experiment little altitude and temperature gradient modifications along their flow path and that they infiltrate at heights ranging between 100 to 300m above their outlet.
515

F. Gal et al.
2
Modelling residence times in such aquifers was estimated using FlowPC [2] and O, H isotopes ratios. Two ways were examined: first taking the real precipitation input and second using elevated springs percolating downward. The first approach provides no good fit, despite an estimation of the evapotranspiration effect was taken into account (using Turc’s formula). Soil effects (PCO2) on δ18O isotopic composition seem to have first order importance (δ13CDIC from –16 to –22‰ PDB, clearly related to C3 plant composition) and are in progress to improve input parameters. The second set of calculation eliminates such hypothesis and provides better results: transit time of c.a. 2 months using dispersion model and 20% of aquifer stagnant water (efficiency > 75%), in agreement with the unique 2003 drought for 3 months.
Coupling isotopic geochemistry and major ion chemistry appears to be a good way to access surficial fluid circulation in small water catchment. Recharge areas can be located at c.a. 200 to 300m above spring discharge, and times of aquifer recharge can be estimated for each spring. The percolation of rainwater into soil and subsurface aquifers leads to poor-content waters, that experiment little chemical interactions with surrounding rocks (granitic bearing) before discharge.
[1] PARKHURST, D.L., APPELO, C.A.J., User's guide to PHREEQC (Version 2) - a computer program for speciation, batch-reaction, one-dimensional transport, and inverse geochemical calculations: U.S. Geological Survey Water-Resources Investigations Report 99-4259 (1999) 312 pp.
[2] MALOSZEWSKI, P., ZUBER, A., Lumped parameter models for interpretation of environmental tracer data. Manual on Mathematical Models in Isotope Hydrogeology, IAEA-TECDOC-910, IAEA, Vienna (1996) 9-58.
[3] FOURNIER, R.O., POTTER, R.W. II, An equation correlating the solubility of quartz in water from 25°C to 900°C at pressures up to 10 000 bars, Geochim. Cosmochim. Acta 46 (1982) 1969-1973.
516

EXTENDED SYNOPSIS IAEA-CN-118/96P
TOPIC: HYDROLOGY
1
Detection of Water Leaks in Foum-El-Gherza Dam (Algeria)
N. Hocini, A. S. Moulla
Centre de Recherche Nuclèaire d’Alger (CRNA), Algiers, Algeria
E-mail address of main author: [email protected]
Foum-El-Gherza dam is located at 18 km east of Biskra province in south-eastern part of Algeria and mainly used for irrigation purposes.
The dam model project was designed in 1946 by the Algerian Hydraulics Laboratory (Neyrpic). The completion of the construction phase was in 1952 and the exploitation showed immediately leaks at the downstream part of the dam. The maximum leak value (20.7 Mm3) was recorded from 1981 to 1982.
The main objective of this work consisted to detect water leakage combining conventional and nuclear techniques (isotopic and radiotracer). Classical methods concerned the follow up physico-chemical parameters (conductivity, temperature and chemical composition). Isotopic and radiotracer techniques concerned the determination of the isotopic composition of water (oxygen-18 and tritium) and the labelling of the reservoir (Rhodamine fluorescent tracer), respectively.
The results obtained from temperature and conductivity profiles that were drawn for the sampled piezometers have shown the presence of very complex vertical and horizontal flows [1]. Horizontal flows are also present within the piezometers. This could be due to the geological characteristics of the site.
With regard to the chemical composition, a Piper diagram (Fig. 1) showed that there is no relationship between lake water and groundwater that is occurring in the immediate vicinity of the reservoir. These results were confirmed by the isotopic method through oxygen-18 and tritium contents as summarized in Table I.
An interconnection experiment using a Rhodamine-WT fluorescent tracer was performed afterwards. It consisted of labelling the reservoir water at a distance of 2 m from the shores[3]. The tracer monitoring at the springs showed that Rhodamine was detected after two days at the right bank and one week at the left bank, respectively.
The investigation described in this paper allow us to conclude that the implementation of this pilot study and its associated preliminary results seems to be satisfactory. However, according to the complexity of the geological site, more experiments need to be performed in order to understand and assess the leakage phenomena.
517

N. Hocini and A. Moulla
2
FIG. 1. Piper diagram of obtained results.
TABLE I. MAIN COMPOSITION OF THE ISOTOPIC RESULTS
Sample Tritium (T.U.)
Oxygen-18 (‰)
Borehole F1 2.1 -7.3 Borehole F2 1.3 -7.5 Borehole F3 < 0.4 -7.5 Borehole FL3 1.4 -7.9 Borehole F4 2.0 -7.4 Borehole F4 bis 1.7 -7.5 Borehole F5 < 0.4 -7.4 Reservoir 9.7 -0.2
Acknowledgements: The authors are very grateful to the staff of the ‘Agence Nationale des Barrages’ for their co-operation and logistic assistance.
[1] PLATA BEDMAR, A., "Detection of leakage from reservoirs and lakes", Use of artificial tracers in hydrology (Proc. Advisory Group Meeting) IAEA-TECDOC-601, May 1991.
[2] REMINI, B., HOCINI, N., MOULLA, A.S., Water leaks in Foum-El-Gherza dam (Algeria), EIN International 6 (Décembre 2001) 55-59.
[3] HOCINI, N., Etude des fuites dans les barrages au moyen des techniques isotopiques. Premières Journées d’Etudes sur les Applications des Techniques Nucléaires en Ressources Hydriques et en Agriculture, COMENA/CDTN, Alger 30/11-02/12/98.
518

EXTENDED SYNOPSIS IAEA-CN-118/97P
TOPIC: HYDROLOGY
1
The Origin of the Groundwater Contamination in Botuxim site- Looking for Geochemical Signature
D. C. Lauriaa, V. Mortaguab
a Instituto de Radioproteção e Dosimetria (IRD/CNEN), Rio de Janeiro, RJ, Brazil
bIndústrias Nucleares Brasileiras, Poços de Caldas, Minas Gerais, Brazil
E-mail address of main author: [email protected]
The monitoring environmental program performed in the disposal site of a thorium concentrate cake named Cake II originated from the chemical processing of monazite sands has posed some challenges through the years of follow up. One of these challenges relates to a supposed contamination of a groundwater well inside the repository site. The site is located in a region of ranch and farms. A little creek crosses over the site and discharges in a river whose water supplies a big town 12 km away. In the site approximately 3500 tons of Cake II (average composition: 20% of thorium hydroxide and 1% of uranium oxides, typical specific activity: 1800 Bq/g) are stored in underground rectangular tanks, whose thickness of concrete walls and floor is about 30 cm. One and half meters of the tanks are buried in the soil. Since there were no radioprotection national standards for these kind industries and residues at the time the storage tanks were loaded, between 1975 and 1980, the residues were transported and stored carelessly. Besides, the storage place was chosen without environmental impact assessment study, neither a pre-operational monitoring program nor a geological survey. A figure of the site is given in Figure 1.
Since the 80s, it has been observed an anomalous radium concentration in groundwater from a well downstream the storage site (P2). Average value from monitoring program are 0.10 (0.023 – 1.46) Bq/L for 226Ra and 0.14 (0.023 – 2.45) Bq/L for 228Ra for this sampling station, while average radium concentrations at surrounding wells presented values around 0.08 for 226Ra and 0.01 Bq/L for 228Ra (P3). A spring upstream has showed values of 0.02 and 0.16 Bq/L for 226Ra and 228Ra, respectively (S2). Analysis of local soil has pointed out the contamination of the soil surrounding the storage tanks. The soil may have been contaminated during the loading of the tanks; the activity concentrations in the surface soil samples ranged from the local background of 34 Bq.kg-1 to 70000 Bq.kg-1 for 228Ra, and from 20 Bq.kg-1 to 800 Bq.kg-1 for 226Ra [1].
So, the high radium concentration in the groundwater can be associated to a possible impact from the material stored in the site. The leaching of contaminated soil could have been responsible for the contamination of the well water [2], by other side a leakage from the underground part of the storage tanks cannot be thrown away. Another approach, taking into account a geological survey performed at the region surrounding the storage site, stated the possibility that the contamination found in that water could be natural, since it was found natural anomalies of high natural radioactivity levels in soil and rocks, mainly granite rocks. Thus, leaching of such rocks should be considered and the possibility that the contamination found in that place is natural can be not dismissed [3]. So far the question is still open, and a research project was designed in order to look for the contamination source. The project
519

D. Lauria and V. Mortagua
2
involves the hydrological characterizations, soil properties identification and radionuclides migration studies. This paper aims to present the actual status of this project and to discuss the preliminary results of the Rare Earth Elements (REE) pattern in the region groundwaters.
Groundwater and spring samples from the site (P1, P2, and region surrounding the site (P3, S1, S2) (Fig. 1) were analysed for their REE contents by ICPMS.
FIG. 1. Storage area.
The highest REE contents are found in the water from P2. Typical shale normalised REE pattern of groundwater are given in Fig. 2.
FIG. 2. Condrito -normalised REE pattern of groundwater of the wells P6 and P15 and monazite sand.
The normalised REE pattern showed similar behavior among the wells P2, P3 and P1, while the springs 1 and 2 showed different pattern, suggesting the same kind of input to the three wells located in the site. Experiments of leaching of the contaminated soil and the Cake II will help to explain the found REE pattern.
[1] NOUAILHETAS, Y., LAURIA, D.C., GODOY, J.M., REIS, V.R.G., ZENARO, R., Radiological Questions Concerning the Monazite Sand Cycle Waste in Brazil, Rad. Prot. Australia 11 4 (1993) 177-181.
[2] AGUDO, E.G., GONÇALVES, S., FRANCISCO, J.T., SHINOMYIA, C.N., The use of Radium isotopic Ratio in Groundwater as a Tool for Pollution Source Identification. (Proc. Fourth Int. Conf. Low-Level Measurements of Actinides and Long-Lived Radionuclides in Biological and Environmental Samples) (1992).
[3] MAGALHÃES, M.H, ZENARO, R., LAURIA, D.C, The radium concentration in groundwater at a waste disposal site in Brazil: Is it naturally occurring or a contamination process? Radioactivity in the Environment, Elsevier (in press).
0,00001
0,0001
0,001
0,01
0,1
1
La Ce Pr Nd Sm Eu Gd Dy Er Tm Yb Lu
P1 P3
P2
0,00001
0,0001
0,001
0,01
0,1
1
La Ce Pr Nd Sm Eu Gd Dy
Spring 1
Spring 2
P2
520

EXTENDED SYNOPSIS IAEA-CN-118/98P
TOPIC: HYDROLOGY
1
Integrated Forecast System Atmospheric – Hydrologic - Hydraulic for the Urubamba River Basin
L. Metzger, M. Carrillo, A. Diaz, J. Coronado, G. Fano
Peruvian National Weather Service, Lima, Peru
E-mail address of main author: [email protected]
During the months of December to March, Perú is affected by intense precipitations which generate every year land slides and floods mainly in low and middle river basins of the western and Eastern of the Andes, places that exhibit the greatest number of population and productive activities. These extreme events are favored by the steep slopes that characterize the Peruvian topography.
For this reason at the end of year 2000, SENAMHI began the design of a monitoring, analysis and forecast system, that had the capacity to predict the occurrence of adverse events on the low and middle river basins of the main rivers such as Piura river in the north of Peru and the Rimac river in the capital of the country.
The success of this system opened the possibilities of developing similar systems throughout the country and extend to different users or sectors such as: energy, water management, river transport, etc. An example of a solution prepared for a user (the gas extraction company Pluspetrol) was the implementation of a river level forecasting system in the Urubamba river to support river navigation in this amazonic river where water level variability turns risky the navigation during the dry season. The Urubamba catchment higher altitudes are famous because of the presence of the Machupicchu ancient city, downslope this city is characterized by the Amazon rainforest with scarce observation stations for water level and rainfall. A very challenging modelling and operational hydrology enterprise was developed.
The system implemented for the Urubamba river consist on running the atmospheric part of the global climate model CCM3, this model inputs Sea Surface Temperature forecasts from NCEP-NOAA. The global model was set on a T42 (300 km) grid resolution, this information was used as initial and boundary conditions for the regional model RAMS which provided a downscaled 20 Km grid resolution having as results daily precipitation forecasts.
Besides the global climate model a statistical forecast was developed using Empirical Orthogonal Functions (EOF), this methodology uses the Long Wave Radiation as a predictor for the precipitation occurrence in the study area. This model is based on an atmospheric-ocean teleconnection El NINO 3 region in the central tropical pacific and the observed rainfall over the Andes.
The information generated by the atmospheric model was used as input for the Sacramento hydrologic model originally developed by the National Weather Service River Forecast System (NWSRFS) which considers all the historical data (precipitation, flows and evapotranspiration), the model considers a perturbation in the form of a random variable which depends on the standard deviation and the mean, this algorithm allows to have not only one precipitation time series but the double or triple.
521

L. Metzger et al.
2
This is the basis on the hydrologic ensemble forecasting where each precipitation time series generates a flow time series and then using post processing codes we find the probabilistic forecasts of non excedance for different percentage of probability.
Finally the hydraulic model used was the HEC-RAS V.3.1 developed by the U.S Army Corps of Engineering which used all the cross sections available in the zone, manning values, contraction and expansion coefficients to convert the forecasted flow data into water level of the Urubamba river in four check points requested by the user: Malvinas, Nuevo Mundo, Sepahua and Maldonadillo.
SENAMHI provided of useful information for 2 years and was the result of a multidisciplinary systemic work that joined meteorologists, hydrologists, climatologists and system engineers. The information used by the Regional numerical model RAMS was assimilated from geostationary satellite GOES 8 and automatic stations located in strategic points considering the topography, accessibility, security, extreme rainfall conditions and consequent variability in the levels of the Urubamba river.
As a conclusion the work developed in the Urubamba river involves the ocean-atmosphere-hydrosphere interaction for generating precipitations and water levels in a virgin jungle basin in which has been established a hydrologic and hydraulic modelling system to give support and information to the river navigation in Amazonia.
522

EXTENDED SYNOPSIS IAEA-CN-118/99P
TOPIC: HYDROLOGY
1
Magmatic Origin of CO2 in the Surdulica Geothermal System
N. Miljevic, D. Golobocanin, A. Zujic
Vinca Institute of Nuclear Sciences, POB 522, 11001 Belgrade, Serbia and Montenegro
E-mail address of main author: [email protected]
The Surdulica geothermal aquifer, a complex granodiorite-granite system, situated in south-eastern Serbia was hydrogeologically and geochemically studied using environmental iso-topes [1]. The wide range of carbon isotopic compositions shows a complex carbon origin [2]. Cold water recharges under closed-system conditions with initial parameters, δ13C = -27 ± 3‰ (regional organic carbon), pHi = 5-6 reaching a value of –13‰ for δ13C at the discharge. The concentrations of 13C in geothermal water are significantly higher (up to 0‰), which indi-cate processes of intensive interaction between water and rocks (carbon mineral dissolution), iso-topic exchange, and possible interior CO2 source(s) (CO2 liberated by thermal metamorphism of carbonate rocks and/or from the mantle). Since limestones have δ13C values close to zero, it would be expected that on decarbonation the limestones would give off CO2, with δ13C values of about 5.0‰. However, most of the CO2 sampled in studied geothermal area has negative δ13C values (average about –1 to –5‰). This CO2 can hardly be expected to be simply derived from the decarbonation of limestones. The aim of this paper was to estimate the contribution of deep-mantle CO2 reservoir to hydrothermal system under investigation.
The δ13C and δ18O values of collected borehole rocks (granodiorite, amphibolites schist, gran-ite, depth 104–999 m) and random surface marble samples gathered in two groups (Fig. 1). The first group is characterized with pretty uniform va lues close other carbonatites complexes (calcite, dolomite) world-wide [3] and close to most commonly observed mantle compositions (δ13C = -5.0 to –7.0‰ and δ18O = 5.0 to 8.0‰). The second one showed wide range of δ13C values with very high δ18O values.
Calculated value for dissolved CO2 in the basin of 46 g/L and δ13C between –4 and –5‰ in thermal waters cannot be explained solely by calcite and dolomite dissolution. We establish sim-ple isotope mixing model for calculation of magmatic contribution of CO2 in thermal waters ac-cording to relation
calcitemantleebicarbonat CxCxC 131313 )1( δδδ −+=
where x is the mole fraction of magmatic component. Using the average values for δ13Cbicarbonate = -3.5‰ in thermal waters and carbon isotopic concentration of calcite (δ13Ccalcite = -3‰) and mantle (δ13Cmantle = -6‰), the mantle CO2 fraction has been estimated to be 20% un-der assumption that input amount of CO2 in shallow cold water is negligible in respect to its deep source. A presented approach could be used as a preliminary investigation tool due to the more sophisticated open/closed-system models.
523

N. Miljevic et al.
2
4 6 8 10 12 14 16 18 20 22 24 26-10
-8
-6
-4
-2
0
2
4
6
104438
997
423
435447
145354
374
dissolved carbonate in water
MANTLE
δ13C
V-P
DB [
‰ ]
δ18OV-SMOW
[‰ ]
VG-2 - granodiorite VG-3 - amphibolite schist VG-1 - silicified granodiorite marble dolomite [3] calcite [3]
FIG. 1. Carbon and oxygen isotopic composition from borehole rocks (with indication of the depth) and random marble samples in the hydrothermal system Surdulica.
[1] HADZISEHOVIC, M., DANGIC, A., MILJEVIC, N., SIPKA, V., GOLOBOCANIN, D., Geothermal-Water Characteristics in the Surdulica Aquifer, Ground Water 33 (1995) 112-123.
[2] HADZISEHOVIC, M., MILJEVIC, N., SIPKA, V., GOLOBOCANIN, D., POPOVIC R., Isotopic Analysis of Groundwater and Carbonate System in the Surdulica Geother-mal Aquifer, Radiocarbon 35 (1993) 277-286.
[3] RAY, J.S., RAMESH, R., PANDE, K., Carbon Isotopes in Kerguelen Plume-Derived Carbonatites: Evidence for Recycled Inorganic Carbon, Earth Planet. Sci. Lett. 170 (1999) 205-214.
524

EXTENDED SYNOPSIS IAEA-CN-118/100P
TOPIC: HYDROLOGY
1
Long Term Survey of the Karstic System in South Dobrogea (Romania) by Environmental Isotopes
A. Tenu, F. Davidescu, R. Petres, G. Stanescu, L. Coarna
National Institute of Hydrology and Water Management, Bucharest, Romania
E-mail address of main author : [email protected]
South Dobrogea (Romania) represents, due to its natural and anthropic features, a very interesting area especially for hydrogeologists. In the region there are two superposed calcareous aquifers - the upper aquifer (Sarmatian) and lower aquifer (Barremian - Jurassic) - and form the so-called "karstic system" of strategic importance. The isotopic monitoring (3H, 14C, 13C, D, 18O) they was performed over the last 25 years by an integrated research of all natural types of waters in order to improve the knowledge of hydrogeological parameters and the regional pattern flow. The main isotopic characteristics of meteoric and surface waters are briefly described in the paper. As karstic system, the stress in on the lower aquifer for which, by a correlated interpretation of all hydrodynamic and isotopic information, was carried out an up-to-date regional conceptual model.
0.0024
0.0007
0.00036
++
++
++
++
The front
of the main
recharge
area
SOUTH DOBROGEA Scale in m
Oltina Lake
Bugeac Lake
Baciului LakeDunareni LakeSiutghiol Lake
Tasaul Lake
Techirghiol Lake
Mangalia Lake
Plopeni Lake
Danube - Black Sea Channel
B L A C K S E A
Suh
a River
B U L
G A R
I A
1
3
4
5
6
7
8
9
10
Key
2
525

A. Tenu et al.
2
FIG. 1. Hydrogeological conceptual model of the lower aquifer, up-to-dated for 1996. Key. Aquifer type: 1. Shallow groundwater (14C = 20 ÷ 50 pMC, 3H = 0,8 ÷ 14,3 TU); 2. Partial confined aquifer (local covered by the Lower Cretaceous acvitard: 14C = 5,0 ÷ 10 pMC, 3H = < 0,8 ÷1,1 TU); 3. Confined aquifer covered by the intermediate complex acvitard: 14C = 1,0 ÷ 10 pMC, 3H = < 0,8 TU); Recharge: 4. The front of the main recharge area; 5. Adventive recharge (by surface water) area; Drainage: 6. Natural drainage area (Np below + 17 m); 7. Major (natural and anthropic conditioned) discharge area (Np below + 2m); Groundwater hydraulic: 8. Flow direction of groundwater, confirmed by isotopic means and the value of hydraulic gradient; 9. Flow direction of groundwater, suggested by underground hydraulic information but non-confirmed by radiocarbon; 10. Zero line of the area having the piezometric head above (until 15 m) than the upper aquifer.
The main isotopic features can be synthesized in Fig. 1 by the following: the recharge area is located mainly in the Pre-Balkan Platform (Bulgaria); the main groundwater flow direction is east-northeast, towards the Siutghiol Lake and the flow velocities, at regional scale, vary from 100 m/year on a secondary groundwater flow and 500-1,800 m/year on the main mentioned one.
[1] TENU, A., NOTO, P., CORTECCI, G., NUTI, S., Environmental isotopic study of the Barremian-Jurassic aquifer in South Dobrogea (Romania), J. Hydrol. 26 (1975) 185-198, Int. Symp., Vienna. 439-443.
[2] TENU, A., DAVIDESCU, F., SLAVESCU, A., Recherches isotopiques sur les eaux des formations calcaires dans la Dobroudja Méridionale (Roumanie) (Proc. Isotopes Techniques in Water Resources Development) (1987).
[3] PULIDO-BOSCH, A., MACHKOVA, M., LÓPEZ-CHICANO, M., CALVACHE, M.L., DIMITROV, D., CALAFORRA, J.M., VELIKOV, V., PENTCHEV, P., Hydrogeology of the upper aquifer, Dobrich region, northeastern Bulgaria, Hydr. J. 5 (1997) 75-85.
526

EXTENDED SYNOPSIS IAEA-CN-118/101P
TOPIC: HYDROLOGY
1
An oxygen Isotope Study in a Lake-River System in Southern Finland
E. Sonninena, E. Huitub, S. Mäkeläb, L. Arvolab
a University of Helsinki, Radiocarbon Dating Laboratory, Finland
bUniversity of Helsinki, Lammi Biological Station, Finland
E-mail address of main author: [email protected]
The project “Nutrients from river basins – experimental and modelling approach” (NUTRIBA) is part of the Baltic Sea Research Programme (BIREME). The programme started in 2003 and runs for three years. The drainage basin of the River Kokemäenjoki in southern Finland running to the Baltic Sea is selected for study. The River Kokemäenjoki basin is the fourth largest water system in Finland with a total surface area of 27 000 km2 and an average discharge of 230 m3s-1.
In connection to the larger research in the Kokemäenjoki river system stable isotope studies are carried out in a selected lake-river chain in the upper part of the water system. The site selected for study comprises of five lakes forming a chain. In addition to having a different hydrological position the lakes vary in their trophic status and the size of their drainage areas varies more than one order of magnitude. The theoretical residence time ranges from 0.1 to about 3 years. The surface area of the lakes varies from 1 to about 31.5 km2, the catchment area from 116 to 1171 km2, and the water volume of the lakes from 1.6 to 247x103m3.
Water was sampled for isotope studies from the lakes at two depths and their in- and outlet river channels every second week during the ice-free period and monthly during the ice covered period.
The results from lake water samples collected during the first year show higher d18O values than those of regional mean precip itation and different degree of evaporation. Stratification formed in the deeper lakes and turn-over in spring and autumn were traced.
Variations of d18O values in lake waters during April-November ranged from c. 1 to 2‰ (Fig. 1). Mean seasonal variation found in d18O for the regional precipitation is 4-5‰.
-14-13-12-11-10-9-8-7-6
2003-03-01 2003-05-01 2003-07-01 2003-08-31 2003-10-31 2003-12-31
δ18O
o/o
o V
SMO
W
FIG. 1. Variations in d18O in surface (at 1 m depth) waters of two lakes, Lehee (?) and Iso-Roine (? ), during sampling period from April to November 2003. Lehee is a small shallow through-flow lake and Iso-Roine the largest in the studied set of lakes.
527

EXTENDED SYNOPSIS IAEA-CN-118/102P
TOPIC: RADIONUCLIDE STUDIES OF SEDIMENTS
1
Determination of Mass Accumulation Rates for Organic Carbon, Carbonate, Metal and Sediment on the Eastern Continental Margin of the Black Sea Sediments during Late Holocene
E. Güngöra, M. N. Çagatayb, N. Güngöra, Ü. Sancarb, B. G. Göktepe a
a Çekmece Nuclear Research Center, P.O. Box 1, 34149 Atatürk Airport , Istanbul, Turkey
bIstanbul Technical University, Geology Department, Ayazaga 80626 Istanbul, Turkey
E-mail address of main author: [email protected]
Mass Accumulation Rates (MAR) in Black Sea samples for carbonate, organic carbon and some metal based on 210Pb dating are determined and their interpretation are presented. The samples are recovered from the international cruise 2000 organized by the IAEA as a part of the Marine Environmental Assessment of the Black Sea Region Technical Cooperation Project RER/2/003. In this study only one core (BS-23) located on the eastern continental margin of the Black Sea in water depth of 2168 m is examined [1]. The sediment in these core consist of two units which are from top to bottom: the laminated coccolith marl and micro laminated sapropel units reach in organic carbon. These units were formed after the flooding of the lacustrine Black Sea basin by the Mediterranean waters via the Istanbul strait at 7150 yr BP [2, 3]. The total average MAR for the last 125 years for these site is found as 40.15 g.m-
2.yr-1 (26 cm.kyr-1).
Considering that the corrected AMS 14C ages, the average linear sedimentation rate for core BS-23 over 2000 yr. are found to be about 1.5 times lower than those for the last 125 yr. determined from the 210Pb data. This suggest that the sediment accumulation rate have significantly increased probably in the last few hundred years as a result of man’s impact.
The average MARTOC and MARCaCO3 in the upper three cm. of the core (Unit I) representing the last 125 yr. are 1.84 and 15.82 g.m-2.yr-1, respectively, whereas MARTOC and MARCaCO3 values in Unit II are 2.79 and 3.74 g.m-2.yr-1. The high MARCaCO3 in the unit I is caused by the coccolithophore E. huxleyi which forms the white laminae (Table I).
TABLE I. MASS ACCUMULATION RATES (MAR) FOR CARBONATE AND ORGANIC CARBON
Core
Unit
(section)
TOC
(wt %)
Carbonate
(wt %)
SR+
(cm/kyr)
MARSED
g.m-2 yr-1
MARTOC
g.m-2 yr-1
MARCaCO3
g.m-2 yr-1
BS-23
Unit I
(0-3,5 cm)
5.48
4,38-6,84
41,05
29,2-49,2 26 40.15
1,84
1,15-2,32
15,82
4,92-24,15
BS-23
Unit II
(31-37 cm)
10,71
8,14-12,21
13,83
5,77-24,59 16
2,79
2,10-3,32
3,74
1,43-7,20
528

E. Güngör et al.
2
In the upper part of the sediment, the Ba enrichment indicate a sharp increase in organic productivity that causes eutrophication process over the last 50 yr. Similarly Pb, Zn and Cu exhibit very sharp increase in the top part of the core, reaching more than twice the background values and attesting high metal inputs into the Black Sea during the last half century (Fig. 1).
FIG. 1. Variation of Ba, Zn, Cu and Pb metal values versus depth.
[1] INTERNATIONAL ATOMIC ENERGY AGENCY, Regional Technical Cooperation Project RER/2/003, Marine Environmental Assessment of the Black Sea, Working Material, IAEA, Vienna (2004) 168-175.
[2] RYAN, W.B.F., PITMAN III, W.C., MAJOR, C.O., SHIMKUS, K., MOSKALENKO, V., JONES, G.A., DINITROV, P., GÖRÜR, N., SAKINÇ, M., YÜCE, H., An abrupt drowning of the Black Sea shelf, Mar. Geology 138 (1997) 119-126.
[3] ÇAGATAY, M.N., Geochemistry of the late Pleistocene-Holocene sediments of the Black Sea basin (BESIKTEPE, et al., Eds), Environmental Degradation of the Black Sea Challenges and Remedies, NATO Advanced study series, Kluwer Academic Publishers (1999) 9-22.
529

EXTENDED SYNOPSIS IAEA-CN-118/103P
TOPIC: RADIONUCLIDE STUDIES OF SEDIMENTS
1
Distribution of Radionuclides and Trace Elements and Sedimentary Environment in Marine Sediments from Coastal Areas of Japan
T. Hondaa, E. Suzukib
a Atomic Energy Research Lab., Musashi Institute of Technology, Kawasaki, Japan
b National Research Institute of Fisheries Science, Yokohama, Japan
E-mail address of main author: [email protected]
137Cs, 210Pb and trace elements such as Sc, Mn, Sb, lanthanoids, Th and U were determined by ?-ray spectrometry and instrumental neutron activation analysis (INAA) in marine sediment core samples (13-31 layers, 2cm thickness each) collected from 11 coastal areas (15 stations, 42°19'N-31°27'N, 16-455m of water depth) of Japan mainly faced the Pacific from 1985 to 1991.
In this work, the concentrations and inventories of 137Cs, the 210Pb sedimentation rates, the origin of the sediments and the sedimentary environment are reported using the analyzed data and vertical profiles obtained in the coastal areas of Japan.
The results obtained in this study are summarized as follows:
(1) The 137Cs concentrations in the surface layer were 5.25 (1.9-10.8) Bq/kg-dry and estimated inventories at the sampling date were 697 (191-1441) Bq/m2. These inventories are somewhat larger than those obtained from nearshore around Japan [1]. It can be seen that 137Cs could be easily carried to the seabed and deposited there since the sediments analysed in this work were collected from shallow compared with others. The UNSCEAR report (1993), however, estimates the integrated deposition densities of 3.7-5.2 kBq/m2 for 137Cs for latitudes of 30°-50°N and the observed inventories are rather smaller than those deposition densities because of the lack of those data for the water columns.
(2) The 210Pb sedimentation rates were 0.361 (0.047-0.702) g/cm2/y, which were clearly larger than 0.091 (0.049-0.140) g/cm2/y (n=12) obtained from the coastal sediments (270-1860m of water depth) faced the Japan Sea [1]. It seems to be caused by the differences of the water depth and topography of the seabed.
(3) In general, the abundance of Th is apparently higher in granitic rocks than andesitic rocks. By contraries, that of Sc is higher in mafic rocks such as basalt. The Th/Sc ratio, therefore, reveals the proportion of granitic rocks to mafic rocks and gives important information of the origin of the sediments [2]. The Th/Sc ratios ranged from 0.0409 to 1.40 including six stations exceeded 1.0 in the surface layers. Those six stations are all in western Japan, which indicates that the origin of these sediments is mainly granitic detritus. Conversely, suggesting that in eastern Japan is mainly mafic since the lower Th/Sc ratios.
530

T. Honda and E. Suzuki
2
0
1
2
3
4
5
6
0 1 2 3 4C e/U ratio
Th/U
ratio
1st2nd3rd13th17th20th22nd
0
0.2
0.4
0.6
0.8
1
1.2
0 0.5 1 1.5C e/U ratio
Th/U
ratio
1st3rd
5th
10th
12th
15th
16th
FIG. 1. Th/U-Ce/U plots (expressed in relative to a surface layer) in (a) Kagoshima Bay and (b) Shimabara Bay sediment cores. The symbol shows the order from the surface in the cores.
(4) The concentrations of Mn and Sb and the inventory of excess 210Pb originating from 222Rn in the surface sediments from Kagoshima Bay (31°27'N, 130°38'E) were several to ten times as large as those from other coastal areas of Japan. This fact suggests that those elements and radionuclide have been supplied from the ejecta from a volcano (Mt. Sakurajima) and the hydrothermal venting from a submarine volcano (Wakamiko Caldera) in the Bay.
(5) In reducing conditions, the concentrations of Ce and Th would decrease in the sediment cores, whereas those of U would increase on the basis of the standard electrode potential. Both the Th/U ratios and the Ce/U ratios in the cores are expected to decrease in reducing conditions, conversely increase in oxidizing conditions. The Th/U-Ce/U plots expressed in relative to a surface layer are shown in the cores of (a) Kagoshima Bay and (b) Shimabara Bay (32°41'N, 130°30'E) as typical examples in Fig. 1. As shown in Fig. 1, in the cores of Kagoshima Bay (a), both the Th/U ratios and the Ce/U ratios except for a surface layer are fairly smaller than the unit (1.0) and decrease as going downward. Therefore, it is indicated that the cores below the surface are in reducing conditions, particularly in the lower cores. On the other hand, clearly that the second and third layers in the Shimabara Bay cores (b) are in strong oxidizing conditions since both ratios are still higher than the unit. The Th/U-Ce/U plot, Honda plot, introduced in this work is extremely useful to estimate the sedimentary environment such as redox conditions [2].
[1] SUZUKI, E., 207Bi and 137Cs in Nearshore Marine Sediments 1 : Distribution of 207Bi
and 137Cs in coastal marine sediments collected from the Japan Sea, Radioisotopes 42 9 (1993) 503-510.
[2] HONDA, T., KIMURA, K., Distribution and Behavior of Major and Trace Elements in Tokyo Bay, Mutsu Bay and Funka Bay Marine Sediments, Bull. Soc. Sea Water Sci. Japan 57 3 (2003) 166-180.
(a)
r=0.999
(b)
r=0.965
531

EXTENDED SYNOPSIS IAEA-CN-118/104P
TOPIC: RADIONUCLIDE STUDIES OF SEDIMENTS
1
Sedimentation Rates and Contaminant Chronology in a Tropical Estuary, Sepetiba Bay, Rio de Janeiro, Brazil
A. N. Marques Jr.a, F. Monnab, E. V. Silva Filhoa, F. F. Fernexc, F. F. LamegoSimões Filhod
a Federal Fluminense University, Niterói, Brazil
bUniversité de Bourgogne, Dijon, France
c Université de Nice, France
dRadiation Protection and Dosimetry Institute, Rio de Janeiro, Brazil
E-mail address of main author: [email protected]
With regard to industrial activity and urban development, the state of Rio de Janeiro, at the southeastern Brazilian coast, is the second most important in Brazil. About 15 million inhabitants are living in the region of the city of Rio de Janeiro. In the Sepetiba Bay area, about 60 km south of the city, anthropogenic pressure is high. The area has experienced fast growth of urbanization and industrialization in the last four decades. The construction of a large harbor in the early 1970s made the area attractive for industrial development. For the last three decades the population of the region increased from 600.000 to 1.2 million inhabitants.
The Sepetiba Bay is a semi-enclosed body water separated from the ocean by a beach barrier located approximately 60 km west of Rio de Janeiro City (latitude 23oS and longitude 44oW). The area has a hot and humid tropical climate with annual precipitation of 1500 mm - 2500 mm. Geology is characterized by Pre-Cambrian granitic and metamorphic rocks. Drainage basin of the bay, with 447 km2, is formed by nine rivers draining a quaternary plain in its northeastern shore [1]. Mean depth is about 6 m and annual freshwater input by rivers to the bay is 7.6 million m3. From 1950, the São Francisco channel has allowed water of the Paraiba do Sul River (at the north of the Rio de Janeiro State) to be deviated to the bay of Sepetiba , and now contributes to 87% of the fresh water supply [2].
There are around 400 industrial facilities located in Sepetiba that can be grouped into pyrometallurgic (including two large steel plants), aluminum plants and thermal power plants. The metallurgic industry contributes with 24 t Cd y-1 and 3360 t Zn y-1 [3]. This industrial park is responsible for the input of large amounts of heavy metals into the surrounding environments, reaching the coast via rivers, by industrial waste erosion and leaching, and by atmospheric deposition [4]. In particular, cadmium and zinc inputs increased by three orders of magnitude relative to pre-industrial fluxes, and these metals were directly discharged into the bay during a long period. One of the most important Cd and Zn sources is the Ilha da Madeira plant, located near the studied site. This plant started in 1960 and first produced only Zn. In the early 70s Cd extraction begun. The treated ore is constituted by Camina (Zn2SiO3(OH)2) and Willemita (SiO 4Zn2). Since 1980, after a dam was built before the metallurgic plant, less wastes have been introduced into the bay.
532

A. Marques et al.
2
A sediment core was collected in the Bay of Sepetiba on the shore at low tide, close to the Ilha da Madeira metallurgic plant. The core samples were analyzed for their Cd, Cu, Zn, Pb contents (figure 1) and lead isotopes (figure 2). On this basis, three successive events were observed : (i) at the depth of 50-52 cm, a marked change in the stable lead isotopic ratios, (ii) at 38-42 cm depth, the beginning of the Zn concentration upwards increase, and (iii) above 30 cm, relatively high Cd concentrations. Such records can easily be explained by the local metallurgic development history. However, sediment accumulation rates evaluated using these reference levels are higher than those calculated from the 210Pb profile using the Constant Initial Concentration (CIC) or Constant Rate of Supply (CRS) models. As the core was collected directly close to the beach strand, it can be assumed that the influence of the flat zone before the mangrove on the sedimentation increased when the water depth decreased at the site where the core was collected; therefore particles relatively rich in 210Pb, eroded from this zone, concentrated more and more at the surface. A model, taking into account an exponential increase of the initial 210Pb activity allows the calculated rates to fit well with those evaluated from the “historic” events.
[1] BARCELLOS, C.C., Cd and Zn geodynamics in Sepetiba Bay, PhD. Thesis, Federal Fluminense University (UFF), Niterói (1995) 250 pp.
[2] FONSECA, M.R.M., Water quality in Sepetiba Ba,. Environments, FEEMA, Rio de Janeiro (1979) 316-334.
[3] BARCELLOS, C.C., LACERDA, L.D., "Critical parameters approach applied to study heavy metals pollution in Sepetiba Bay", Metals in Coastal Environments of Latin America, Springer-Verlag, Berlin (1988) 76-89.
[4] RODRIGUES, P.P.G.W., Heavy metals flux to Sepetiba Bay and its estuarine behaviour, PhD Thesis, Federal Fluminense University (UFF), Niterói (1990) 161 pp.
Concentration
10 15 20 25 30 35 40
Dep
th (c
m)
0
10
20
30
40
50
Cu (µg g-1)Pb (µg g-1)
Concentration
0,0 0,4 0,8 1,2 1,6
0
10
20
30
40
50
Zn (mg g-1)Cd (µg g-1)
210Pb (dpm g-1)
0.1 1 10
dept
h (c
m)
-60
-50
-40
-30
-20
-10
0
FIG. 1. Heavy metal concentrations in Coroa Grande profile (values below 27 cm depth to stay quantification limit below 0,2 µg.g-1, pre-industrial levels).
FIG. 2. Unsupported 210Pb (210Pb - 230Th) profile.
533

EXTENDED SYNOPSIS IAEA-CN-118/105P
TOPIC: RADIONUCLIDE STUDIES OF SEDIMENTS
1
Sedimentation Rates in Reservoir and Gullies derived from 137Cs Depth Profile in the Moldavian Tableland - Romania
R. M. Margineanua, I. Ionitab, D. Gheorghiua
a National Institute of R&D for Physics and Nuclear Engineering, IFIN-HH Bucharest, Romania
bFaculty of Geography, University of Jassy, Romania
E-mail address of main author: [email protected]
The Moldavian Plateau located in the Eastern Romania and extending about 25,000 square kilometers is considered as the broadest and most typical plateau of the country.
The radioactive fallout that has occurred after the Chernobyl accident was characterized by complex meteorological conditions in May 1986 [1, 2]. Consequently, the contamination of the soil surface was very non-uniform. One cannot possibly assume that, even for small areas of a few square kilometers, the initial deposition was uniform and subsequently the variations observed in inventory were caused by migration with and/or within the soil. Consequently, one should work on the assumption that, generally, the initial deposition remains unknown, practically everywhere in the area of interest. In special situation like those arising in the gullyheads, floodplain and reservoirs, from the total inventory of 137Cs, the initial deposition due to the Chernobyl accident can be derived [3, 4].
In each investigated area, a pit was dug from which the samples were taken from surface up to 100-300 cm deep with an increment of 5 cm [5]. After conditioning, the samples were analyzed in the laboratory, using a Canberra MCA S100 system equipped with a Ge(Li) detector. The 137Cs present in soil comes first from the direct deposition and second from the redistribution of contaminated soils within watershed.
Fitting the profile distribution of 137Cs in reservoir sediment and gully with a sum of gaussian functions, the position of the Chernobyl peak within sediments and the contribution of eroded soil to the total 137Cs inventory in the investigated area was determined. The fitting function used is:
( )2i
2ic
w
x-x2-
i
i
i0 e
2w
A y y
πΣ+=
In the investigated gullies and reservoirs, the profile distribution of 137Cs in sedimented soil shows a complex pattern, the depth of 137Cs due to Chernobyl deposition varies from 10 cm to 140 cm. The position of the maximum activity of 137Cs in soil depends on erosion rate in the watershed.
In the area, the initial deposition from the Chernobyl accident ranges between 2 to 46 kBq/m2. The data regarding some of the investigated reservoirs and gullies are summarized in Tables I and II. The position of maximum of the 137Cs specific activity from Chernobyl deposition
534

R. Margineanu et al.
2
shows where the surface of bottom sediment was in 1986. The sedimentation rates for the investigated reservoirs are of 0.8 - 12 cm/year and for gullies from 0.8 – 3 cm/year. 137Cs demonstrates to be very suitable for the assessing of long term erosion and sedimentation processes in the environment.
TABLE I. SEDIMENTATION RATES IN MOLDAVIAN TABLELAND RESERVOIRS
Reservoir River Basin Chernobyl depth (cm)
Sedimentation rate (cm/year)
Bibiresti Racatau 69.9 5.8 Antohesti Berheci 57.3 4.8 Hutu-Gaiceana Berheci 70.5 5.9 Puscasi Racova 142.7 11.9 Pungesti-Garceni
Racova 30.9 2.6
Ras-Craesti Barlad 35.0 2.9 Solesti Vaslui 81.3 6.8 Popesti Scobalteni 9.6 0.8 Doroscani Scobalteni 23.0 1.9 Podul Iloaiei Bahluiet 38.0 3.2 Ichimeni Baseu 26.3 2.2
TABLE II. SEDIMENTATION RATES IN MOLDAVIAN TABLELAND GULLIES
Gully Gullyhead Chernobyl depth (cm)
Sedimentation rate (cm/year)
Scranghita 4 8.4 0.8 Rapa Albastra 1 34.7 2.9 Gornei 2 12.1 1.1 Valea Timbrului 10 24.6 2.1
Aknowledgements
The authors express their gratitude to IAEA-Vienna for its permanently support. The investigation was carried out during 1996 – 2000 in the frame of the IAEA Coordinated Research Program entitled “Soil Erosion and Sedimentation Assessment Studies by Environmental Radionuclides and their Application to Soil Conservation Measures”.
[1] GALERIU, D., ONCESCU, M., MOCANU, N., “Radionuclide in soil: migration and dose assessment”, Seminars in Biophysics (FRANGOPOL, P.T., MORARIU, V.V., Eds), Vol. 5, CIP-Press, Central Institute of Physics, Bucharest (1988) 79-85.
[2] PAUNESCU, N., MARGINEANU, R., IORGULESCU, A., 90Sr and 137Cs fallout from Chernobyl in the Bucharest-Magurele area during 1986-1987, J. Radioanal. Nucl. Chem. (Letters) 128/4, (1988) 263-271.
[3] WALLING, D.E., QINPING, H.E., Interpretation of caesium-137 profiles in lacustrine and other sediments: the role of catchment-derived inputs, Hydrobiologia 235/236 (1992) 219-230.
[4] IZRAEL, YU.A., et. al., Atlas of caesium deposition on Europe after Chernobyl accident, CG-NA-16733-29-C (1998).
[5] IONITA, I., MARGINEANU, R., Assessment of the Reservoir Sedimentation Rates from 137Cs Measurements in The Moldavian Plateau, Third IAEA RCM “Erosion and sedimentation processes assessment”, Barcelona 4-8 Oct. 1999, Spain.
535

EXTENDED SYNOPSIS IAEA-CN-118/106P
TOPIC: RADIONUCLIDE STUDIES OF SEDIMENTS
1
An Investigation of the Silting-up Phenomenon of the Skikda’s New Port (Algeria)
M. Mami, S. Mami, N. Hocini
Algiers Nuclear Research Centre, Algiers, Algeria
E-mail address of main author: [email protected]
The new port of Skikda is located on the eastern Mediterranean coast of Algeria, between the Cape of Bougaroun and the Cape of Iron. It is subjected since its first operation to a regular silting-up process of its main entry channel. The dredging works carried out up to now and the construction of two protection groynes on Ben-Mhidi beach located on its eastern side, did not contribute in slowing down this phenomenon.
The purpose of this study was to investigate the sediment motion directions, the deposit locations and the modes of sedimentary transport, in order to implement a radioactive tracer experiment making use of iridium-192 labelled glass particles.
The hydrodynamic studies (i.e. bathymetric and sedimentological), gave a certain number of results which have contributed much to a better understanding of the various factors intervening in the investigated harbour main entry channel silting-up. By its artificial nature, the channel constitutes a real trap for sediments.
After following up and studying the most dominant swell directions over a whole year, one could infer the existence along the shore of an east-west directed drift current. This does not exclude however the presence of return and expansion currents.
The study of the granulometric facies, as well as the modal analysis, made it possible to highlight a dynamic limit at 10 m depth and at 600 m off-shore.
The transport of the sedimentary particles is carried out primarily by rolling and saltation as well as by classified suspension (graded) without rolling.
The main conclusion which can be drawn from such an investigation is that the great quantity of sand which is trapped within the port access channel comes primarily from the great sandy beach located on the Eastern side. The combination and the association of the return and expansion currents to the vector of the east-west coastal drift greatly maintains this siltation phenomenon.
536

M. Mami et al.
2
FIG. 1. Probable diagram of sedimentary dynamics.
537

EXTENDED SYNOPSIS IAEA-CN-118/107P
TOPIC: RADIONUCLIDE STUDIES OF SEDIMENTS
1
Sedimentation Rates in the Eastern Baltic Sea Based on Lead-210 Dating
J. Mazeikaa, R. Radzevicius a, R. Dusauskiene-Duzb
a Institute of Geology and Geography, Vilnius, Lithuania
bInstitute of Botany, Vilnius, Lithuania
E-mail address of main author: [email protected]
During the past years there has been renewed focus on the Baltic Sea. Not only because the Baltic is one of the world’s largest estuarine systems but also because the area of focal importance for 15 countries as a transportation channel, recreational area and fishing ground. Study area is attributed to the Eastern Baltic Sea and comprises of the Gulfs of Finland and Riga as well as eastern part of Baltic proper.
Short Niemistö-type gravity corer (with inner diameter of 54 mm) was used to take the sediment cores (16 stations) mostly in 1989-1999. Sediment cores were usually sliced onboard into slices of different thickness (from 2 cm in recent cores to even 10-15 cm in earlier cores). Measurements of lead-210 activity in dried sediment samples were performed by two methods. The 210Pb in earlier cores (1978-1992) was measured by low level beta counting of its daughter 210Bi after classical radiochemical separation of 210Pb carriers from the sample material. The cores of 1999 were examined by direct gamma-ray spectrometry using well-type detector (GWL-series) with a sensitive volume of 170 cm3 and the well inside the germanium crystal of 16 mm. The calibration procedure of the system used in this study is described in [1]. A number of naturally occurring radioisotopes from the 238U and 232Th decay series, as well as man-made radioisotopes, e.g. 137Cs, were determined.
Using thickness of wet sediment slices from earlier cores and unsupported 210Pb activities, a constant rate of supply (CRS) model [2] was applied to calculate mean sedimentation rate and to construct a sediment chronology for the past 200 years of sedimentation. The unsupported 210Pb activity was calculated by subtracting the supported activity, which was estimated by statistical calculations of total 210Pb activity distribution in the lower slices. Using bulk sediment densities and unsupported 210Pb activities, a constant rate of supply (CRS) model with variations [3] was applied to evaluate recent sedimentation for cores of 1999.
(a) y = 383.37e -0.3279x
R2 = 0.90
1.E+00
1.E+01
1.E+02
1.E+03
0 5 10 15Depth (cm)
Pb-2
10 u
ns (
Bq/
kg)
(b)
0
100
200
300
1700180019002000
Year (AD)
Pb-2
10 to
t (B
q/kg
)
0
100
200
300
400
Cs-
137
(Bq/
kg) Pb-210
Cs-137
FIG. 1. Unsupported 210Pb plotted vs. depth of the core (a) and total 210Pb and 137Cs plotted vs. calendar years (b) for gravity core 21/01.
538

J. Mazeika et al.
2
The unsupported 210Pb activity was calculated by subtracting the supported activity, which was estimated from 226Ra or any other gamma-emitting decay product (214Pb). The 210Pb dating results were compared and adjusted according to the occurrence of known 137Cs main markers (Chernobyl, nuclear bomb testing) (Fig. 1) and are presented in Table I.
TABLE I. SEDIMENTATION RATES ESTIMATED BY LEAD-210 FOR SHORT GRAVITY CORES
Core (original number)
Latitude Longitude Sea depth (m)
Core length (cm)
Slice number in core
Prevailing lithology of mud
Mean sedi- mentation rate (mm/a)
17/1978 56°42’N 19°52’E 130 40 4 Fine aleuritic 2.7 33/1978 54°45’N 19°16’E 96 60 6 Pelitic 4.3 01/1986 59°37’N 27°05’E 70 200 14 Aleuritic-pelitic 1.5 07/1986 59°50’N 24°50’E 68 40 6 Pelitic 1.3 02/1987 59°50’N 25°38’E 77 24 6 Pelitic 1.2 05/1987 59°28’N 23°00’E 90 21 7 Pelitic 1.2 07/1987 57°31’N 20°34’E 145 20 6 Pelitic 1.2 10/1987 59°41’N 26°38’E 70 30 7 Pelitic 2.5 12/1987 59°40’N 25°24’E 93 13 7 Pelitic 0.3 14/1987 59°31’N 24°23’E 60 35 7 Fine aleuritic 2.5 13/1988 59°44’N 24°24’E 72 50 13 Aleuritic-pelitic 1.0 17/1988 59°54’N 26°37’E 64 70 9 Aleuritic-pelitic 6.5 13/1992 59°39’N 26°26’E 45 15 5 Aleuritic-pelitic 1.5 16/1992 59°28’N 23°57’E 75 17 6 Fine aleuritic 2.0 21/01-99* 55°34’520N 20°30’400E 68 41 20 Fine aleuritic 1.3 12/01-99* 55°36’970N 20°30’390E 64 33 16 Fine aleuritic 1.0
* 210Pb dating results adjusted according to 137Cs markers.
Sedimentation rates estimated vary between 0.3-2 mm/a with tendency to increase (3-7 mm/a) mainly after 1960. The similar values in adjacent areas are given in [4] (1-2 mm/a, sometimes 4-6 mm/a) and in [5] (0.2-4 mm/a, sometimes till 29 mm/a). Recent sedimentation is mainly determined by basement topography, the flux of material from rivers, coastal and submarine erosion of old sediments, plankton production, and by the hydrography (waves and currents) as the driving force of sediment transport. The spatial distribution of bed sediment types reflects the temporal integration of the various environmental influences. The fine-grained and light material (silt, clay, organic matter) is being deposited under low energy conditions, which are in the major basins. This context follows from the available sediment maps of the Baltic Sea.
[1] GUDELIS, A., REMEIKIS, V., PLUKIS, A., LUKAUSKAS, D., Efficiency calibration of HPGe detectors for measuring environmental samples, Environ. Chem. Phys. 22 3-4, Vilnius (2000) 117-125.
[2] ROBBINS, J.A., "Geochemical and geophysical applications of radioactive lead isotopes", Biogeochemistry of Lead (NRIAGU, J.O., Ed.) (1982) 285-393.
[3] BOLLHÖFER, A., MANGINI, A., LENHARD, A., WESSELS, M., GIOVANOLI, F., SCHWARZ, B., High-resolution 210Pb dating of Lake Constance sediments: stable lead in Lake Constance, Environ. Geology 24 (1997) 267-274.
[4] KUNZENDORF, H., EMEIS, K-C., CHRISTIANSEN, C., Sedimentation in the central Baltic Sea as viewed by non-destructive Pb-210 dating, Danish J. Geogr. (1998) 1-9.
[5] HELCOM, Intercomparison of sediment sampling devices using artificial radionuclides in Baltic Sea sediments, the MOSSIE Report, Baltic Sea Environ. Proc. 80 (2000) 76 pp.
539

EXTENDED SYNOPSIS IAEA-CN-118/108P
TOPIC: RADIONUCLIDE STUDIES OF SEDIMENTS
1
The Cris/Körös Rivers Content of U, Th and K in the Bottom Sediment
N. G. Mihailescu, S. C. Anastase, C. C. Costea
Geological Survey of Romania, 78344 Bucuresti 32, Romania
E-mail address of main author: [email protected]
A quantitative evaluation of uranium, thorium and potassium was made by processing of complex gamma spectra of natural radioactive series U (U-238), Ac U (U-235) and Th (Th-232) and natural radioisotope K-40. Characteristic photogaff: uranium E?=1.764 MeV, thorium E?=2.620 MeV and potassium E?=1.462 MeV. We have used a detector Ge-Li of a high resolution (ca. 3.8 KeV ) and on electronic chain: Canberra (USA), preamplifier model 970, spectrometric amplifier Tennelec TC-2 49 (Oxford). For identifying of photogaff we have used covell method (n=5). Time 80000 seconds.
The Cris/Körös drainage covers about 275300 Km2 (the most important rivers are Barcau/Berefhya, Crisul Repede/Sebes Körös, Crisul Negru, Crisul Alb, Cris/Kettös Körös, and Cris/Hármas Körös). The solid discharge of these rivers varies from 0.33 Kg/s to 11.20Kg/s. The transported matter is composed by different size of gravel in coarse sand or coarse silts matrix. The median of gravels varies between -4.50 F and -0.60 F (23.63-1.52 mm), while the median of the gravels matrix varies between -1.80 F and 7.40 F (3.45-0.051 mm). Downstream detrital matter become more fine, especially along the banks. Alogene elements modify enough the sediment composition.
As concerns mineralogy, the matrix of alluvia consists in quartz (31-74%), evenly distributed, feldspars (8-18%) and clay minerals (9-35%), more and more abundant towards the confluence with the Tisza River.
The evaluation of contents of U, Th and K of bottom sediments was made on the basins of samples obtained in 8-16 August 1994, 21-30 July 1995 and from the transported matter of Crisul Negru and Crisul Baita in 4-9 September 2003.
The share of uranium (0.78 – 9.14 ppm) and thorium (5.06 – 51.38 ppm) from the bottom sediments increases downstream, where heavy metals are trapped in the composition of clay minerals.
In the sediments of the Crisul Alb, the distribution of potassium (K) resembles the one in Crisul Negru and is relatively constant, notwithstanding the grain-size spectrum; it is worth mentioning that in the sediments of the Crisul Negru the amount of K increases towards downstream, in relation with the clay fraction.
The amount of uranium (U) in the sediments is twice lower than in those of the Crisul Negru. In the sediments of the Crisul Alb, thorium (Th) has a concentration 2/3 lower than in those of the Crisul Negru. In the Barcau, both elements increase from upstream (coarse sand) towards downstream (fine silt), as sediments become more and more fine.
540

N. Mihailescu et al.
2
In the bottom sediments of the Crisul Repede, uranium and thorium are low and relatively constant; the maximal values were found at the confluence with the Iad.
Rivers Year U ppm Th ppm K %
Crisul Alb 1994 0.98 – 5.92 5.55 – 30.05 0.88 – 4.70
Crisul Negru 1994 0.85 – 4.54 5.93 – 21.23 0.94 – 2.84
2003 0.78 – 2.63 7.67 – 10.10 1.17 – 1.75
Crisul Baita 2003 1.85 – 3.58 11.17 – 11.98 1.60 – 2.31
Crisul Repede/ Sebes Körös
1995
0.63 - 3.02
4.91 - 13.38
0.88 - 2.23
Barcau/Berefhya 1995 1.18 - 3.18 5.06 - 14.53 0.97 - 2.16
Cris/Hármas Körös 1994 5.80 - 9.14 27.02 - 51.38 3.38 - 6.54
[1] SÁRKÁNY (KISS, A., HAMAR, J., Eds), The Cris/Körös rivers valleys, Tiscia monograph series 397, Szolnok-Târgu Mures (1997).
[2] MIHAILESCU, N., COSTEA, C., ANASTASE, S., RADAN, S., Effects of human activities on the composition of sediments in the minor river bed of Romanian rivers. Impact of human activity on the composition of bottom sediments in the Cris River basin, Archives of the IGR Bucuresti (2003).
541

EXTENDED SYNOPSIS IAEA-CN-118/109P
TOPIC: RADIONUCLIDE STUDIES OF SEDIMENTS
1
Residence Time and Sedimentation Regime in Cienfuegos Bay, Cuba, with the Use of 210Pb and 137Cs Isotopes
A. Muñoz Caravaca, C. Alonso-Hernández, M. Díaz Asencio
Centro de Estudios Ambientales de Cienfuegos. AP 5. C. Nuclear, Cienfuegos, Cuba
E-mail address of main author: [email protected]
The combined atmospheric flux of 210Pb and dating techniques based on nature and anthropogenic radionuclides 210Pb and 137Cs were applied to the study of the residence times and sedimentation regime in Cienfuegos Bay, Cuba.
Measurements of monthly atmospheric flux of 210Pb in Cienfuegos, were conducted over a period of 3 years (1999 - 2004). The mean annual flux of 210Pb for this period was 0.65 ± 0.05 Bq.cm-2.yr-1. Good agreement between atmospheric flux of 210Pb and precipitations events are observed.
The accumulation rate, estimated through the 210Pb dating technique, showed an increase during the last 40 years [1]. The recent sediment accumulation rates (0.40 - 0.45 g.cm-2.y-1) are almost double those estimated before 1965 (0.15 to 0.20 g.cm-2.y-1). The 210Pb profiles contained significant deviations from a simple exponential decline and showed abrupt variations in the 210Pb activity between 1966-1970. These irregularities match closely periods of anthropogenic changes (regimentation of the Arimao and Caonao rivers in the late 60s and early 70s) and exceptional natural events (Hurricane “Camille” in 1969 and the intense rainfall of 1988) which occurred in Cienfuegos. The 137Cs and chlorite minerals profiles validate the results obtained from 210Pb dating and confirm the effect of exceptional events and changes in the natural hydrological regimen of the bay during the past.
The residence time of 210Pb in water column is near 20 days. This result could be use as a indicator of exchange processes between bay and the Caribbean Sea. Although 210Pb is a non conservative tracer, its residence time express that this hydrodynamic property for Cienfuegos bay could be greater than for 210Pb because this isotope has more losing factor, like radioactive decay and those concerning the sedimentation processes. Previous studies of this exchange processes based on tidal prims method indicated residence times of order of 90 days for a conservative pollutant [2].
The results obtained are applied for the Environmental Management Program of Cienfuegos Bay.
542

A. Munoz Caravaca et al.
2
[1] ALONSO-HERNANDEZ, C., et al., Recent changes in sedimentation regime in Cienfuegos Bay, Cuba, as inferred from 210Pb and 137Cs vertical profiles (in press).
[2] MUÑOZ CARAVACA, A., et al., Modelling transport processes in Cienfuegos Bay, Cuba (in press).
0 5 10 15 20 25 30 35
20
40
60
80
100
0
5
10
15
20
25
30
0 10 20 30 40 50 60 70 80
1901
Depth (cm)
210Pb ex
137Cs
210 P
b e
x (B
q.kg
-1)
Depth (g.cm -2)
137 C
s (B
q.kg
-1)
Date
1988 1969 1963 1945
543

EXTENDED SYNOPSIS IAEA-CN-118/110P
TOPIC: RADIONUCLIDE STUDIES OF SEDIMENTS
1
Baseline of 137Cs and Natural Radioactivity in Surface and Core Sediment along the Algerian Coast
A. Noureddine , M. Menacer, R. Boudjenoun, A. Hammadi, M. Benkrid, M. Maache
Laboratoire d’Etudes d’Impact Radiologique, Centre de Recherche Nucléaire d’Alger (LEIR/CRNA), BP 399 Alger-Gare, 16000 Algiers, Algeria
E-mail address of main author: [email protected]
The Algerian coast, part of the northern Mediterranean Sea, could be affected by different radioactive sources. Natural radionuclides can occur by weathering and recycling of terrestrial minerals and rocks to contribute to the introduction of radioactivity into the marine environment, to give rise to 40K, 87 Rb, uranium and thorium series [1].
Nuclear fallout from weapons test, Chernobyl accident, radioactive waste and industries can result in an input of anthropogenic radionuclides in the region of interest.
Therefore, within the framework of the Algerian monitoring programme and the contamination assessment, and in order to define a baseline of natural and artificial radionuclides on sediments a sampling campaign was organised during the last quarter of 1999, by our laboratory (Laboratoire d'Etudes d'Impact Radiologique/CRNA) using the research vessel of ISMAL, to collect surface and core sediments along the Algerian coast . A total number of 42 superficial sediment were collected each 25 Km along the coast from Ghazaouet (N35°10’90, W02°05’000) to Skikda (N36°56’107, E06°55’857), covering a distance of around 1000 Km, using a van veen grab type, to which was added the collection of a core sediment at Annaba station in the eastern coast using a box corer. Multiparameter probe was also used to determine vertical profiles of temperature, salinity and pH in water column.
After being preconditioned, samples were prepared to be analysed by direct counting gamma spectrometry, using a high purity germanium detector of relative efficiency of 20.6% and resolution (FWHM) of 1.8 keV at 1332 keV gamma-energy of 60Co, to determine artificial (137Cs) and natural radionuclides (40K, U and Th series) in superficial and core sediment.
Detection efficiency is determined by preparation of appropriate standard samples in which activity of 152Eu and 210Pb tracers were injected. Results of concentration ranges of natural radioactivity and 137Cs in Bq/kg dry, 137Cs and 210Pb profiles in core sediment, are presented in Figs 1 and 2.
Concentration ranges from (8.15-35.43, 6.54-32.99) and (8.06-57.04, 6.26-39.30) for daughter radionuclides (214Pb, 214Bi) and (212Pb, 228Ac), respectively. For 214Pb and 214Bi, they seem to be in equilibrium, however, 212Pb concentrations are more or less higher than those of 228Ac. Concentration of 40K ranges from 111.6 to 634.3 Bq/kg dry. These different variations could be due to several parameters, namely nature of sediment, depth at location sampling, location in the coast being eventually affected by natural or industrial sources.
544

A. Noureddine et al.
2
Regarding concentration of 137Cs, it ranges from 0.29 to 13.12 Bq/kg dry. Its variation along the coast is presented in Fig. 1.
Moreover, 137Cs and 210Pb profiles are plo tted in Fig. 2, showing similar behaviour and peaks at the first layers.
The concentrations of natural and artificial radionuclides reported in this work were also compared with published values and found to be in the same order as those reported in the literature [2-4].
FIG. 1 : Variation of 137Cs concentration in surface sediment along the Algerian coast.
FIG. 2. 137Cs - 210Pb profiles in a sediment core collected at Annaba stat. (eastern coast).
[1] NOUREDDINE, A., et al., Natural radioactivity and 137Cs in surface sediments of the Bay of Algiers, Rapport du 35e Congrés de la CIESM, ISSN 0373-434X, 35 1 (1998) 278-279.
[2] AMIARD, C., AMIARD, J.C., TRIQUET, La pollution radioactive et ses conséquences écologiques, Editions Masson (1980) 191 pp.
[3] UNITED NATIONS ENVIRONMENT PROGRAMME/INTERNATIONAL ATOMIC ENERGY AGENCY, Assessment of the state of pollution of the Mediterranean Sea by radioactive substances, Map Technical Reports Series 62 (1992) UNEP, Athens.
[4] EUROPEAN COMMISSION, The radiological exposure of the population of the European Community to radioactivity in the Mediterranean Sea Marina-Med project, (Proc. Seminar 17-19 May 1994), Radiation Protection 70 EUR 155564 EN (1994).
Cs-137 in the algerian coast
051015
1 6 11 16 21 26 31 36
Nb of stat. from W to E
Conc. of cs-
137 (Bq/kg
dry) Série2
Pb-210 profile
02468
1012
0 100 200Conc. (Bq/kg)
Dept
h (c
m)
Séri
Cs-137 profile
024681012
0 10 20Conc. (Bq/kg)
Dept
h (c
m)
Séri
545

EXTENDED SYNOPSIS IAEA-CN-118/111P
TOPIC: RADIONUCLIDE STUDIES OF SEDIMENTS
1
Siltation in Pui O Salt Marsh of Hong Kong from 137Cs Analysis of Shallow Cores
S. Pan, D. Guo, G. Chen
State Pilot Lab. of Coast and Island Exploitation, Najing University, P. R. China
E-mail address of main author: [email protected]
Three shallow cores, 40-60 cm long, extracted at three locations in Pui O Salt marsh of Hong Kong were analyzed for 137Cs content at 1-2 cm intervals. Concentrations of 137Cs were measured ? -spectrometrically. The results of the 137Cs analyses shown that there are recognizable 137Cs peak and horizon in the 137Cs profiles in the three sediment cores analyzed. However, there is only one peak in the 137Cs distribution in the two cores, while two peaks were observed in the other core. The maximums of 137Cs activity in the three cores are 2.94Bq/kg, 4.65Bq/kg and 6.15Bq/kg respectively. These values may be compared with that of sediments sampled from eastern zone of Hong Kong.
Sediment accumulation rates are traditionally calculated by relating the first occurrence of 137Cs in the sediment sequence to the year 1954 and its maximum activity to 1963. But this method does not make full use of the information stored in the 137Cs distribution in the sediment column. To obtain more sediment information, a model [2] was fitted to the vertical distribution.
0 5 1 0 15 20 25 300
1
2
3
4
5
6
7
8
9
1 0
P 2
S a m p l e M o d e l
Act
ivity
(B
q/kg
)
D e p t h ( c m ) S = 0 . 2 1 c m / a
FIG. 1. 137Cs distribution in core P2 .
The vertical distributions of 137Cs measured in sediments core P2 and calculated from model are shown as Figure 1. The difference between measured and calculated profiles of 137Cs is distinct, accounting for the simplistic model, but the rationality of the model still exists and the difference can be explained. The sediment rates of the three sites were 0.24cm/a,
546

S. Pan
2
0.21cm/a, 0.34cm/a according to the model, and some erosion may take place in the surface layer in recent year in these sites.
The sampling location shows that the site P2 is the nearest to the coast and the site P3 is the farthest to the coast of the three sites. Therefore, the sediment rate is that the place near the shore is easily denudated by tides. Moreover, the measured profiles are much milder than the calculated profiles. This is mainly because sediment mixing which is often assumed to be analogous to eddy diffusion and cause the peaks wild.
Another characteristic is the measured profiles vary mildly at deep layers and the 137Cs is appear deeper than expected. This marsh has been used as tillage in early 1950s, and given back as marsh again in later 1950s. This caused the profiles of 137Cs flat at the deep part.
[1] KIRCHNER, G., EHLERS, H., Sediment Geochronology in Changing Coastal Environments: Potentials and Limitations of the 137Cs and 210Pb Methods, J. Coast. Res. 14 2 (1998) 483-492.
547

EXTENDED SYNOPSIS IAEA-CN-118/112P
TOPIC: RADIONUCLIDE STUDIES OF SEDIMENTS
1
197Hgg as Radiotracer to study Mercury Methylation and Demethylation Processes in Sediments and Soils
S. Ribeiro Guevaraa, M. Arribére a, V. Jerebb, S. Pérez Catána, M. Horvatb
a LAAN, Centro Atómico Bariloche, Comisión Nacional de Energía Atómica, Argentina
bDepartment of Environmental Sciences, Jozef Stefan Institute, Ljubljana, Slovenia
E-mail address of main author : [email protected]
The use of radioisotopes to trace different transport and transformation processes is widespread; in the case of mercury the most frequently used radiotracer is 203Hg. However, when adequate facilities are available 197Hgg can be also employed successfully, as it was demonstrated in mercury methylation/de-methylation in soils and fresh water sediments performed at the Department of Environmental Sciences, Jozef Stefan Institute, and LAAN, Centro Atómico Bariloche. 197Hgg (T½=64.14 h) can be produced in a research nuclear reactor by irradiating non-enriched Hg targets with thermal neutrons (for the 196Hg(n,γ)197Hgg reaction σth=3080±180 b, production with epithermal neutrons is not relevant: Iγ=413±15 b [1]). 197Hgm (T½=23.8 h) is also produced, and 93 % of its decay feeds the ground state, but with 30 times less probability (σth=109±6 b and Iγ=58.9±2.4 b [1]). 197Hgg has a production rate, for short irradiation periods, about 50 times higher than that of 203Hg, and hence it is possible to produce it with high specific activity in shorter irradiations, in non-high flux reactors (1012 to 1013 n.cm-2.s-1), using non-enriched Hg. Another advantage of the use of 197Hgg to trace processes is that, because of its short half life, the cleaning of devices and tools of the 197Hgg contamination associated to their use or caused by accidents, can be done just letting the tracer to decay away, hence assuring no interference from previous experiments.
For the methylation/de-methylation experiments in soils and sediments mentioned in the last paragraph, HgCl2 was irradiated to produce the 197Hg2+ tracer, while HgCH3Cl was used to produce CH3
197Hgg. In both cases the tracer is ready to be used after a few hours of cooling time, to allow 38Cl (T½=37.24 m) to decay. HgCl2 was dissolved in 3.2% HNO3 after irradiation, and HgCH3Cl was dissolved in isopropanol. Since the HgCH3Cl decomposes during irradiation a purification has to be done immediately before each application. HgCH3
+ and Hg2+ in 6M HCl solution were separated by anion exchange chromatography (Dowex 1x8 resin, Cl- form, 100-200 mesh) using minimal light conditions. The HgCH3
+ is then collected and the solution neutralized for further tracer experiments.
The more relevant emissions associated to 197Hgg decay are X-rays 67.0 keV (21%), 68.8 keV (35%) 77.9 keV (12%) and 80.4 keV (3.3%), and γ-ray 77.3 keV (18%) [2]. Spectra obtained with HPGe detectors allow, in general, discriminating three main peaks by using usual peak fitting programs, namely 67.0 keV, 68.8 keV, and 77.3+77.9 keV. But the determination of areas manually in two regions, one including 67.0 and 68.8 keV X-rays, and the other including 77.3, 77.9, and 80.4 keV emissions, provide also accurate results since these kind of studies imply relative measurements with respect to a reference. Well, coaxial, and planar HPGe detectors were used in the experiments mentioned before.
548

S. Ribeiro Guevara et al.
2
Experiments consisted of amending triplicates sediment and soil samples, and incubating with labelled Hg for different time periods. In addition, blanks and samples in which microbial activity was inhibited by flash freezing just after inoculation (“killed control samples”) were also assayed. HgCH3
+ was extracted using toluene, which was then dried using anhydrous Na2SO4 [3]. A more extensive extraction procedure with thiosulphate was performed in some methylation experiments with lake sediments, in order to examine the possibility of Hg2+carry-over. Total Hg inoculated in methylation experiments with sediments ranged from 50 to 100 ng.g-1 wet sediment. The specific activity can be further improved with proper optimisation of the irradiation; for our experiments design an inoculation of 5-10 ng.g-1 wet sediment can be achieved. The total Hg amounts of labelled Hg inoculated for the experiments performed are comparable to the amounts amended when 203Hg and other non-radioactive tracers are used for this purpose. Methylation experiments performed on lake sediments by incubation of labelled Hg2+ showed 197HggCH3
+ recoveries as low as 0.105 ± 0.020 % to 0.133 ± 0.018 % for toluene extraction on “killed control samples”, and 0.0354 ± 0.0078 % to 0.0716 ± 0.0035 %, also on “killed control samples” using the more extensive extraction (uncertainties reported are the standard deviations of triplicates).
[1] MUGHABGHAB, S.F., DIVADEENAM, M., HOLDEN, N.E., Neutron Cross Sections, Vol. 1 and 2, Academic Press, New York, USA. (1981).
[2] BROWNE, E., FIRESTONE, R.B., (SHIRLEY, V., Ed.), Table of radioactive isotopes, John Wiley & Sons, New York, USA. (1986).
[3] MARVIN-DIPASQUALE, M.C., AGEE, J.J., BOUSE, R.M., JAFFE, B.E., Microbial cycling of mercury in contaminated pelagic and wetland sediment of San Pablo Bay, California, Environ. Geology 43 (2003) 260-267.
549

EXTENDED SYNOPSIS IAEA-CN-118/113P
TOPIC: RADIONUCLIDE STUDIES OF SEDIMENTS
1
Spatial and Temporal Variations of Uranium and Thorium Series along the Egyptian Mediterranean Coast
I. H. Saleha, A. A. El-Gamala, S. M. Nasra, M. A. Naimb
a Department of Environmental Studies, Institute of Graduate Studies and Research, Alexandria University, Egypt
bDepartment of Physics, Faculty of Science, Alexandria University, Egypt
E-mail address of main author: [email protected]
Uranium and thorium series are the two dominant radioactive decay chains in the environment. Sediment samples was collected bimonthly for two years from the area extending from El-Salloum and El-Arish. Gamma measurements have been carried out by means of high-resolution low background PC multi-channel spectrometer, using a coaxial HPGe detector. The highest U and Th series member concentrations have been recorded at Rashid as one of the high background areas in the world. Temporal variations of U and Th series have been distinguished. The highest values of uranium at surface layer of Rashid sediments have been recorded in July 1998. Except at Rashid, U and Th series concentrations were found to be at natural levels in all the other stations. The general average concentrations along the Egyptian Mediterranean coast during the monitoring period for 234Th, 226Ra, 214Pb and 214Bi as uranium series were 21.03, 19.49, 13.70 and 13.06 Bq/kg respectively and for 228Ac, 212Pb, 212Bi and 208Tl as thorium series were 13.75, 10.40, 9.38 and 5.22 Bq/kg, respectively. The activity ratio of 228Ac/208Tl was approximately equal three for all sediment samples. The concentration values of 212Pb were shown to be close to the corresponding concentration values of 212Bi and also between 214Pb and 214Bi. Moreover, the values of the Th series are looking lower than the values of the uranium series. Generally, the lowest Th series values have been detected mainly in the western sector stations except at El-Salloum. The concentration of uranium and thorium is depend on the calcium carbonate content of the sediment, grain size composition and marine biological activities [1].
Fig. 1. shows that seasonal variations can be distinguished for the uranium series member concentrations in sediments along the Egyptian Mediterranean coast. Relatively higher values of 234Th concentration have been detected specially in spring and autumn seasons. The percentages of 234Th in these seasons were 16%, 12%, 11%, 8%, 12% for spring 98, autumn 98, spring 99, autumn 99 and spring 2000, respectively. Taking into consideration the bias for summer 98 for the unusual increasing of Rashid 234Th values, it makes the percentages of both summer 98 and autumn 98 were looking higher. During winter, 1999, summer, 1999 and winter, 2000 234Th has been recorded as relatively low percentages between the mentioned seasons. 226Ra in general has been behaved as 234Th during same seasons. The spring season appeared as the relatively higher 214Pb and 214Bi either in 1999 or 2000. Autumn 1999 season has been retarded from 12% of 226Ra to 11% of 214Pb and to 10% of 214Bi.
In most of thorium chain member’s seasonal variations have been distinguished as shown in Fig. 2. Autumn has been observed as the lowest concentrations season. This may be due to the low water period, which has insignificant discharge of suspended particles that are rich in
550

I. Saleh et al.
2
thorium series [2]. This assumption could be confirmed by the presence of relatively high amounts of Th series activities at El-Gamil, which has very fine sand in its geological structure. Moreover, it may also be related to the biological activity during this season.
The behavior of 228Ac in surface layer sediments was approximately the same especially in successive autumn seasons, it has been detected as relatively lower values 11% in 1998 and 7% in 1999. Moreover, another similarity has also detected between the relatively higher values of spring in 1999 (13%) and in 2000 (15%). Taking into consideration the bias of summer and autumn during 1998 for the unusual increasing of Rashid Th series members, it makes the percentages of both seasons looking higher than expected. The lower percentage of the spring season in 1998 may be due to the missing of data of 228Ac at Nobareya, Mex, Montaza and Romana during this campaign.
A relatively higher percentage of 212Pb has been observed between spring in 1999 (15%) and in 2000 (12%). On the other hand, autumn appeared to have lower percentages, especially in 1999 (5%). In addition, the spring season in 1998 was looking relatively lower due to the missing data of the previously mentioned four stations.
Relatively higher percentages of 212Bi have been detected in spring. Some agreement has been detected between Mar., 1999 and Mar., 2000, which have higher percentages and represent spring season. On the other hand, relatively lower percentages of 212Bi have been detected in autumn season in 1998 (5%) and in 1999 (4%). Also, autumn season in 1998 has lower values despite the increase of Rashid concentration during this season. The Rashid contribution has been observed also in summer 1998 to enhance the percentage to 24%. A relative increase of 212Bi has been monitored during spring 1999 but did not appear in spring 2000.
A difference of 208Tl concentrations between the two successive years has been observed with a comparison between autumn and the other seasons. Autumn has been observed as the lowest season during 1999. Also, if the contribution of Rashid is neglected in autumn 1998, it will be even lower. Spring has been considered as the relatively high season in 1999 (13%) and in 2000 (15%) in addition to 1998 (11%).
[1] SWANSON, S.M., Food-chain transfer of U-series radionuclides in a northern Saskatchewan aquatic system, Health Phys. 49 747-753.
[2] KANIVETS, V.V., VOITSEKHOVITCH, O.V., KHRYSTYK, B.F., Riverine transport of Cs-137 and Sr-90 into the Black Sea after Chernobyl accident (data analysis and methodological aspects of monitoring) IAEA-TECDOC-1094 (1998) 44-51.
Fig. (1): Seasonal variations among uranium series members .
5
10
15
20
25
30
35
40
Spr
ing
1998
Sum
mer
1998
Aut
umn
1998
Win
ter
1999
Spr
ing
1999
Sum
mer
1999
Aut
umn
1999
Win
ter
2000
Spr
ing
2000
234 T
h a
nd
226 R
a co
nce
ntr
atio
ns
10
12
14
16
18
20
22
214 P
b a
nd
214 B
i co
nce
ntr
atio
ns
234-Th 226-Ra
214-Pb 214-Bi
Fig . (2): Seasonal variations among thorium series members .
2
4
6
8
10
12
14
Spr
ing
1998
Sum
mer
1998
Aut
umn
1998
Win
ter
1999
Spr
ing
1999
Sum
mer
1999
Aut
umn
1999
Win
ter
2000
Spr
ing
2000
228 A
c, 21
2 Pb
an
d 21
2 Bi
con
cen
trat
ion
s
0
1
2
3
4
5
6
208 T
l co
nce
ntr
atio
ns
228-Ac 212-Pb212-Bi 208-Tl
551

EXTENDED SYNOPSIS IAEA-CN-118/114P
TOPIC: RADIONUCLIDE STUDIES OF SEDIMENTS
1
Monitoring of Radionuclide and Heavy Metals in Sediments and Macrophytes from Black Sea Ecosystems
A. S. Strezov, T. P. Nonova
Bulgarian Academy of Sciences, Institute for Nuclear Research and Nuclear Energy, 72, Tzarigradsko shossee, 1784 Sofia, Bulgaria
E-mail address of main author: [email protected]
Data for natural and technogenic radionuclides content in three types of sediments (slime, silt and sandy) were obtained for 35 location at the Bulgarian Black Sea coast from the north border with Romania to the southern with Turkey. Radioecological investigations of who le Bulgarian Black sea coast were started in 1991. Contaminant behavior (nuclides and HM) was traced in the period 1991 – 2003 and tendencies for pollutant behavior and intercorrelations were evaluated and followed. It is considered that direct influence of Chernobyl accident has entered equilibrium after five years and monitoring this influence will enable modeling of ecological consequences for the marine environment.
Radionuclides were measured by low level gamma spectroscopy and γ spectrometry measurements were carried out using HPGe detector with 35 % counting efficiency and energy resolution 1.8 KeV (1332 KeV). Heavy metals (HM) in algae were measured by Atomic Absorption spectrometry (AAS) - ETAAS (Perkin – Elmer Zeeman 3030 with graphite furnace) for Pb and Cd and flame AAS Pye Unicam SP 1950 for Fe, Mn and Cu. Certified reference material NIES-CRM-3 (Chlorella) was run with each sample series.
Radionuclide and heavy metal content was determined in bottom sediments and ten macroalgae species (five green: Cladophora vagabunda, Ulva rigida, Enteromorpha intestinalis, Chaetomorpha gracilis and Bryopsis plumosa; two brown: Cystoseira crinita and Cystoseira barbata; three red: Ceramium rubrum, Callithamnion corymbosum and Corallina officinalis) from 12 reference locations. A comparative analysis of eco-toxicological state in the environment in different Bulgarian Black Sea geographic zones is made.
The intercomparison of radionuclide content in bottom sediments and algae from one and the same sampling location can give information for mechanisms of radionuclide transfer from sediments to biota and give the trend of potential hazard of anthropogenic impact on marine ecosystems. Some alga species can be used as bio-monitors for the radioactive contamination along the Black Sea shore.
Evaluation of the HM content added additional information to the data base for nuclide and HM accumulation, sorption and migration monitoring of the whole Bulgarian coastal zone that will help future assessment and modeling of contaminant transfer processes in environment and biosphere.
The content of radionuclides in sediments depends on mineral type – slime sediments accumulate the highest content of technogenic (137Cs) and natural nuclides (U and Th series). Sand and sandy sediments are in the lower limit of radionuclide content - data for 137Cs content in sand sediments is within the range 2.1 - 9.6 Bq/kg and do not depend on the geographical
552

A. Strezov and T. Nonova
2
position. Same is true for the main sea resorts and at places where sand sediments predominate at Bulgarian coast.
Clear dependence of radionuclide content on sediment type was obtained - considerably low and in a narrow range of technogenic and natural nuclides while data for silt and slime vary more. Small seasonal changes of radionuclide concentration in sandy sediments were observed while greater variations in slime and silt ones occur. Data for natural radionuclides in sediments correspond to the cited in literature natural levels, showing no additional anthropogenic contamination.
The obtained data for nuclide content in Black sea sediments show that highest content of Cs and some natural nuclides has been determined in the northern part of the Black sea coast.. The content of radionuclides in the main Black Sea resorts where sand sediments predominate, is in the lowest limit of determined values.
Data have been obtained based on the investigations for Fe, Mn, Cu, Pb and Cd content in the most widespread Black Sea green, brown and red macroalgae for the period 1996-2000. All the obtained results prove the dependence of heavy and toxic metal accumulation in green algae species on the location and sampling season.
It can be concluded that Fe, Mn, Cu, Pb and Cd concentration in Black Sea green macroalgae decrease during the studied period. Ulva rigida species accumulates the lowest concentrations of the studied metals. The highest Fe, Mn, Pb and Cd content depending on the location, is in macrophytes from Tuzlata. High Cu concentration is observed in the southern coastal area- Ahtopol and Sinemoretz.
This work establishes a database for heavy metal content in green macroalgae and their ecological impact on marine ecosystems along the Bulgarian Black Sea coast. The data obtained for the chosen locations for the six consecutive years indicate no serious artificial pollution along our shore. The obtained higher HM content (nuclides as well) can be attributed to the influence of the big rivers entering the northern part of the Black Sea – Danube, Dnyepr, Dnester.
553

EXTENDED SYNOPSIS IAEA-CN-118/115P
TOPIC: RADIONUCLIDE STUDIES OF SEDIMENTS
1
Estimation of Sediment Loading in Asian Coastal Area using 210Pb Inventory in Mangrove Sediment
Y. Tatedaa, D. D. Nhanb, N. Q. Longb, N. H. Quangb, N. H. Quy b
a Environmental Science Research Laboratory (CRIEPI), Abiko, Japan
bInstitute of Nuclear Sciences and Technology (INST), Hanoi, Viet Nam
E-mail address of main author: [email protected]
Concentrations of 210
Pb in coastal sediment are generally controlled by local atmospheric 210
Pb flux and fine sediment input to coastal area, because the 210
Pb has high affinity to inorganic fine particles and
210Pb inventory in coastal sediment is coincided with sediment
loading to the area. Thus the 210
Pb level in coastal sediment is good index of sediment loading to coastal zones. However, in subtropical/tropical coastal area, such as S-E Asian coast, sediment loading is widely variable due to seasonal difference of precipitation and coastal sediment discharge among rainy/dry season. Secondly, the S-E Asian coastal areas are mostly covered with mangroves those entrap the sediment particle supplied from river to adjacent coastal waters. Since the entrapped fine sediment particles include not only the excess 210Pb supplied from local atmosphere but also the accumulated sediment particles by terrestrial input, thus the 210Pb inventory exceeds largely compared to the atmospheric supply. Thus the 210Pb inventory balance in mangrove area is expected to reflect drastically the local sediment loading conditions in S-E Asia. We studied the 210Pb balance in subtropical mangrove coastal water in Japan and found that the 210Pb was useful natural tracer to evaluate the coastal sediment load [1]. However, limited data are reported about the mangrove coastal area [2, 3]. In this study, we collected mangrove sediment cores at the Japan and Viet Nam and analyzed the
210Pb concentrations in sections of different depth and location. By comparing with the
atmospheric flux, we estimate the balance of the 210
Pb in the area and evaluate the sediment loading to the studied mangrove area.
[1] LYNCH, C. et al., Recent accretion in mangrove ecosystems based on 137Cs and 210Pb, Estuaries 4 (1989) 284-299.
[2] SMOAK, J., PATCHINEELAM, S., Sediment mixing and accumulation in a mangrove ecosystem: evidence from 210Pb, 234Th and 7Be, Mangroves and Salt Marshes 3 (1999) 17-27.
[3] TATEDA, Y., Organic Carbon Supply and Accumulation in Mangrove Coastal Sediment, Nippon Suisan Gakkaishi 68 5 (2002) 736-737.
554

EXTENDED SYNOPSIS IAEA-CN-118/116P
TOPIC: RADIONUCLIDE STUDIES OF SEDIMENTS
1
Application of Radionuclides to study Recent Changes in Sediment Accumulation Rates in Adventfjorden, Svalbard
M. Zajaczkowskia, W. Szczucinskib, R. Bojanowskia
a Institute of Oceanology, Polish Academy of Sciences, Sopot, Poland
bCollegium Polonicum, Slubice, Poland
E-mail address of main author: [email protected]
Recent sediment accumulation rates in small subpolar fjord - Adventfjorden (Fig. 1) were determined by 210Pb and 137Cs dating. Modern rates in central basin decrease downfjord from 1.87 to 0.87 cm y-1 (2.5 to 1.14 g cm-2 y-1).
Comparison of the modern values (1986–2001) with older ones (1963-1986) reveals a marked increase in sediment accumulation rates in the last decade (Table I). It correlates well with recent climate changes (warming and increase in precipitation). Comparison with published particulate matter flux data indicate, that a portion of sediment is bypassed to Isfjorden.
78O
18’78O
18’
16’16’
14’14’
78O
12’78 O
12’
1 5 O 30’
1 5 O 30’
1 5 O40’
1 5 O 40’
1 5 O50’
1 5 O50’
1 5 O 21’
1 5 O 21’
SVALBARD
Advent-fjorden
60m
100
50
20
10
5
70m
80m
100m
Long
year
elva
Adventelva
Longyearbyen
A D V E N T F J O R D E N
Tidal Flat
Sampling Stations60m
0 1 Km
FIG. 1. Locations of coring stations in Adventfjorden.
555

M. Zajaczkowski et al.
2
TABLE I. THE SEDIMENT ACCUMULATION RATES IN RELATION TO DISTANCE FROM TIDAL FLAT. THE RATES ARE CALCULATED FROM REFERENCE LAYERS (1963 AND 1986 PEAK) IN 137CS ACTIVITY PROFILES. THE CREDITABILITY OF THE RATES FOR 100 M CORE IS DISCUSSED IN THE TEXT. (LAR – LINEAR ACCUMULATION RATE; MAR – MASS ACCUMULATION RATE; NA – NOT AVAILABLE) Station Distance
from tidal flat [km]
Depth of 1986 peak
[cm]
Depth of 1963 peak
[cm]
Accumul. rate
1986-2001
Accumul. rate
1963-1986
Accumu l. rate
1963-2001 LAR [cm y -1] 1.87 NA NA 60m 1.2 29 NA
MAR [g cm-2 y-1] 2.50 NA NA LAR [cm y -1] 1.00 = 0.58 = 0.74 70m 2.5 16 30
MAR [g cm-2 y-1] 1.29 = 0.76 = 0.96 LAR [cm y -1] 0.87 0.61 0.71 80m 3.6 14 28
MAR [g cm-2 y-1] 1.14 0.79 0.92 LAR [cm y -1] NA NA 0.07 (?) 100m 6.0 NA 7 (?)
MAR [g cm-2 y-1] NA NA 0.08 (?)
556

EXTENDED SYNOPSIS IAEA-CN-118/117P
TOPIC: CONTAMINANTS IN THE ENVIRONMENT
1
Total Arsenic in Marine Organisms from Cienfuegos Bay, Cuba
C. Alonso-Hernandeza, M. Gómez Batistaa, A. Muñoz-Caravacaa, S. Pérez-Santanaa, M. Díaz-Asencioa, J. Estévez Alvarezb, I. Pupo Gonzálezb, N. Alberro Macíasb
a Centro de Estudios Ambientales de Cienfuegos, Ciudad Nuclear, Cienfuegos, Cuba
bCentro de Aplicaciones Tecnológicas y Desarrollo Nuclear, Ciudad de la Habana, Cuba
E-mail address of main author: [email protected]
Levels of total arsenic were determined in muscle tissues of species of finnish, crustaceans and molluscs from Cienfuegos Bay, Cuba. The arsenic contents in the samples were determined using an Energy Dispersive X Ray Fluorescence (EDXRF) method. The highest values of Total arsenic were found in crustaceans. Averages found for fish, crustaceans and molluscs were 10.2, 26.5 and 22 µg g-1 dry wt, respectively. These results are considered to be characteristic for normal or naturally altered areas.
Cienfuegos Bay, situated in the Southern part of Cuba, is a semi-enclosed bay with a surface area of 90 km2 and an average depth of 14 m. It is connected to the Caribbean Sea by a narrow channel 3 km long. The bay is divided in two well defined hydrographic basins, due to the presence of a submerged ridge 1m below the surface. The Northern basin receives most of the anthropic impact from the outfall of Cienfuegos city (150,000 inhabitants), industrial pole in the country, and the freshwater input of Damuji and Salado rivers. The Southern basin is subjected to a smaller degree of anthropic pollution originating from the Caonao and Arimao rivers. Part of the Southern basin is a natural park, which represents a niche for protected migratory birds and marine species.
The bay represents the most important natural resource in the province, due to fishing activities, maritime transport, tourism industry and natural parks. During the last decade it has acquired an important economic and social development, resulting in an increase of industrial and domestic wastes which are discharged into the bay. Direct input of Arsenic to Cienfuegos bay occurs through the Nitrogen Fertilizer Factory, which was authorized to release Arsenic residuals up to 1981 and where two accidental As spills took place in 1979 and 2001.
Marine organisms represent an important component of the diet of the population of Cienfuegos. In particular, people from the coastal areas of Castillo de Jagua, Las Minas and O’bourque have an average ingestion rate of fish of 51 kg yr-1, varying from 21 to 116.
Only a few studies have investigated the total As content in marine organisms from Cuba. In particular, a survey of marine products from the Western coast, displayed concentrations of Arsenic ranging from 0.01 to 4.82 µg g-1d.w. [1]. Total Arsenic in fish and crustaceans was also measured in Cienfuegos Bay in 1974 and results showed low concentrations of this compound (1.2 µg g-1 d.w. in fish and 1.7 in crustaceans).
Sixteen species of fish, two of molluscs and three of crustaceans were caught in Cienfuegos Bay. The target species were selected among those of dietary importance for the population.
557

C. Alonso-Hernandez et al.
2
The arsenic contents in the samples were determined using an Energy Dispersive X Ray Fluorescence (EDXRF) method (Si/Li detector with 180 eV for Mn Kα and Cd-109 annular source. The elaboration of the spectra and quantitative analysis was carried out using the QSAX System [2]. Compton peak was used for the matrix effects correction. Several Biological Certified Reference Materials (NRCC DOLT-2 Dogfish Liver, NRCC TORT-2 Lobster Hepatopancreas, NIES CRM-9 Sargasso, NRCC DORM-1 Dogfish Muscle and IAEA-140/TM Seaweed Fucus sp.) were measured for calculating the As concentrations in the samples.
The highest values of Arsenic were found in crustaceans, which showed a mean value of 26.5 µg g-1 d.w. (values ranging from 6.9 to 53.9). These levels are in agreement with others found in literature for shrimps and marine crabs captured in estuaries and enclosed bays [3-5]. The higher Arsenic content in tissues of bottom dwellers such as shrimps and crabs, can be attributed to their habitat being close to the sediment. Sediments are always higher in Arsenic than water and bottom water usually contains higher As concentration than surface water [6, 7]. When comparing the obtained values from this study with those reported in 1974 for shrimps from Cienfuegos bay, we observed that the mean value of Arsenic in crustaceans was 18 times higher than at the time. This could be explained through the increase of antrophic activity in the area during the last decades, when artificial sources of As were established in the coastal zone. In particular, the routine and accidental release of Arsenic residuals from the Nitrogen Fertilizer Factory could be responsible for the observed pattern.
In the fish muscle, the mean As concentration was 10.21 µg g-1 d.w. (values ranging from 2 to 42.6). These results are considered to be characteristic for normal or naturally altered areas. The international reports consulted [8, 3, 9] indicate that marine fish can reach total As contents up to 150 µg g-1 d.w., without any risk for the population that consumes it. However, as for the crustaceans, the Arsenic levels obtained in this study are 12 times higher than those reported in fish from Cienfuegos bay in 1974, and are considerably larger that those reported by [1] in fish captured from Western Cuba.
[1] BELTRAN, G., SYMINTON, R., DOMINGUEZ, A., AMALIA, E., ROCH, R., Arsenic residues in marine products from the western zone of Cuba, Rev. Cubana Hig. Epidemiol. 26 (1988) 100-105.
[2] INTERNATIONAL ATOMIC ENERGY AGENCY, Manual for QXAS, Quantitative X-Ray Analysis System (version 3.2), IAEA, Vienna (1995).
[3] SUÑER, M.A., DEVESA, V., MUÑOZ, O., LOPEZ, F., MONTORO, R., ARIAS, A.M., BLASCO, J., Total and inorganic arsenic in the fauna of the Guadalquivir estuary: environmental and human health implications, Sci. Tot. Environ. 242 (1999) 261-270.
[4] STEPHAN, SATHY, (2000). [5] XIU-SHENG et al., (2001). [6] BYRD, J.T., The seasonal cycle of arsenic in estuaries and near shore waters of the
South Atlantic Bight, Mar. Chem. 25 (1988) 383-394. [7] TREMBLEY, G.H., GOBEIL, C., Dissolved arsenic in the St Lawrence Estuary and the
Saquenay Fjord, Canada, Mar. Poll. Bull. 21 (1990) 465-431. [8] RONAL EISLER, (1981). [9] KHUDRE, M.A., ZAMIL, M., RAWDAH, T.N., TAWABINI, B.S., Levels of Arsenic
in Fish from the Arabian Gulf, Mar. Poll. Bull. 24 (1992) 94-97.
558

EXTENDED SYNOPSIS IAEA-CN-118/118P
TOPIC: CONTAMINANTS IN THE ENVIRONMENT
1
Trace Metal Distributions in Water Column and Surface Sediments of Izmit Bay, Turkey after Marmara (Izmit) Earthquake
M. Balkis, E. Senol
Istanbul University, Institute of Marine Science and Management, Vefa, 34470 Istanbul, Turkey
E-mail address of main author: [email protected]
Izmit Bay is a semi-enclosed water body situated in the NE of Marmara Sea with a length of 50 km, width varying between 2 and 10 km and has an area of 310 km2 (Fig. 1). The Bay and its surroundings is one of the most heavily industrialized and populated region of NW Turkey with increasing the industrial activities since 1960. The earthquake with a magnitude of 7.4 occurred on 17th of August 1999, destroying the Eastern Marmara Region. The epicenter of the earthquake was found to be in a small city (Gölcük) located on the southern coast of Izmit Bay. This seismic event caused the destruction of wastewater discharge systems and also dispersal of refined petroleum products onto the sea surface from the subsequent refinery fire. The surface waters of the Bay were partly covered by the thick petroleum layers and partly by a film [1-3].
Izmit Bay is oceanographically an extension of Marmara Sea, having a permanent two-layered water system. The upper layer is originated from less saline Black Sea waters (18.0-22.0 psu), whereas the lower layer originated from the Mediterranean Sea waters is more saline (37.5-38.5 psu) [4]. The permanent stratification occurs at about 25 m in the Marmara Sea [5], however it is highly variable in Izmit Bay [6].
Dissolved trace metals (Fe, Mn, Pb, Cu, Cd and Hg) were measured at 4 stations (in western, central, eastern and out of the Bay) along the water column in Fig. 1. In addition total metal concentrations were determined in surface sediments at 21 stations. The distribution of ‘’total’’ metal (Fe, Mn, Pb, Cu, Zn, Co, Cr) concentrations in the both water column and surface sediments, together with sequential selective extraction analyses, shows that the relatively high metal concentrations are mainly due to anthropogenic inputs from the heavily industrialized regions of the Bay. The Mn enrichment in the lower layer water of the central and eastern basins is suggested occurring the anoxic conditions after the Earthquake [7].
559

M. Balkis and E. Senol
2
FIG. 1. The location (left) and bathymetry (above) of the study area. The location of sampling station in Izmit Bay (below).
[1] GÜVEN, K.C., SUR, H.I., OKUS, E., YÜKSEK, A., UYSAL, A., BALKIS, N., KIRATLI, N., ÜNLÜ, S., ALTIOK, H., TAS, S., ASLAN, A., YILMAZ, N., MÜFTÜOGLU, A. E., GAZIOGLU, C., CEBECI, M., Izmit Körfezi’nin Osinografisi. 17 Agustos 1999 Depremi sonrasi Izmit Körfezi’nde Ölçme ve Izleme Programi. Technical Report. T. C. Çevre Bakanligi. Deniz Bilimleri ve Isletmeciligi Enstitüsü, Istanbul Üniversitesi (2000) (in Turkish).
[2] ÜNLÜ, S., GÜVEN, K., OKUS, E., DOGAN, E., GEZGIN, T., Oil Spill Tüpras Refinery Following Earthquake occured in 17 Aug. 1999, Second International Conference, Oil Spills in the Mediterranean and Black Sea Regions, Istanbul, Turkey, (2000) 1-11.
[3] OKAY, S.O., TOLUN, L., TELLI-KARAKOÇ, F., TÜFEKÇI, V., TÜFEKÇI, H., MORKOÇ, E., Izmit Bay (Turkey) Ecosystem after Marmara Earthquake and Subsequent Refinery Fire: the Long-term Data, Mar. Poll. Bull. 42 (2001) 361-369.
[4] ÜNLÜATA, Ü., OGUZ, T., LATIF, M.A., ÖZSOY, E., On the Physical Oceanography of the Turkish Straits, (PRATT, L. J., Ed.) The Physical Oceanography of Sea Straits, Kluwer Academic Publishers, Netherlands (1990) 25-60.
[5] BESIKTEPE, S.T., SUR, H.I., ÖZSOY, E., LATIF, M.A., OGUZ, T., ÜNLÜATA, Ü., The circulation and hydrography of the Marmara Sea, Progr. Oceanogr. 34 (1994) 285-334.
[6] OGUZ, T., SUR, H.I., A numerical modelling study of circulation in the Bay of Izmit: Final Report, TÜBITAK-MRC, Chemistry Department Publication, Kocaeli, Turkey 187 (1986) 97 pp.
[7] BALKIS, N., The effect of Marmara (Izmit) Earthquake on the chemical oceanography of Izmit Bay, Turkey, Mar. Poll. Bull. 46 (2003) 865-878.
25.00 26.00 27.00 28.00 29.00 30.0036.00
37.00
38.00
39.00
40.00
41.00
Black Sea
Sea of Marmara
Aegean Sea
TURKEY
28 29
31 30 27 25
22
23
24 21
20
19
8C 7C
16 15
17 18
14
6C
13 12 10
5C 7
8
9
5
3C
2
4C
2C
R
1C
WESTERN MIDDLE EASTERN
Eastern B.Central B.
Western B.Gölcük
Izmit
560

EXTENDED SYNOPSIS IAEA-CN-118/119P
TOPIC: CONTAMINANTS IN THE ENVIRONMENT
1
The Use of a Cs-137 Vertical Migration Model to Study the Temporal Evolution of Heavy Metals in Coastal Sediments of the Bay of Cadiz (Spain)
M. Barreraa, R. A. Ligero b, M. Casas-Ruizb
a Departamento de Impacto Ambiental de la Energia, CIEMAT, Avda. Complutense 22, 28040 Madrid, Spain
bDepartamento de Fisica Aplicada, Universidad de Cadiz, 11510 Puerto Real, Cadiz, Spain
E-mail address of main author: [email protected]
The evolution of heavy metals (Zn, Cd, Pb, Hg) in sea bed sediments of the Bay of Cadiz (Spain) has been studied. Four sediment cores were collected from the Inner Bay zone (Fig. 1) where sediment textural composition is mainly formed by silt and clay with high organic content, showing a very high absorption capacity for the substances solved in the aquatic medium. The dating of the sediments has been performed using the fallout radionuclide 137Cs as a tracer. Due to the high vertical mobility of this radionuclide in the sediment column, as a consequence of its molecular diffusion and the bioturbation existing in the area, the observed profiles are continuous and the 1963 maximum in fallout activity could not be assigned [1, 2]. The one dimensional diffusion-advection equation has been applied, considering the residence time of the radionuclide in the marshes zone, to develop a model that permits to interpret the profiles and to estimate the sedimentation rate, in order to infer the recent chronology of the sediment layers [1, 3]. By using the 210Pb dating method with the CRS model in one station, it can be showed that the sedimentation rate could be assumed to be constant during a longer period of time. In consequence, the sediment dating has been extended up to 100 years backwards, allowing the study of the evolution of heavy metals during the last century. The sediment dating shows that the heavy metal pollution of the Inner Bay has been produced simultaneously in the whole zone, during the industrial development of the environment. The increase of heavy metals Zn and Cd started in the second half of the XX century, while the enhancement of Pb and Hg concentration started at the beginning of the XX century. Heavy metal concentrations reached maximum levels during the eighties decade, afterward a remarkable decrease in surface sediments has been observed, which could be attributed to the restrictive environmental measurements undertaken at the zone, in particular the control of industrial effluents and the decreasing use of leaded fue ls [4].
561

M. Barrera et al.
2
FIG. 1. The Bay of Cádiz and the sampling stations.
[1] BARRERA, M., Aplicaciones de técnicas de Espectrometría nuclear a columnas de sedimento en la Bahía de Cádiz, Ph. D. Thesis, Universidad de Cádiz (2002).
[2] LIGERO, R., BARRERA, M., CASAS-RUIZ, M., Levels of 137Cs in muddy sediments of the seabed of the Bay of Cádiz, Spain, Part I: Vertical and spatial distribution of activities, J. Environ. Radioact. (in press).
[3] LIGERO, R., BARRERA, M., CASAS-RUIZ, M., Levels of 137Cs in muddy sediments of the seabed of the Bay of Cádiz, Spain, Part II: Model of vertical migration of 137Cs, J. Environ. Radioact. (in press).
[4] LIGERO, R., CASAS-RUIZ, M., BARRERA, M., LOPEZ-AGUAYO, F., SALES, D., GARCÍA, D., Environmental Impact of unleaded gasolines in the Bay of Cadiz (Spain), Environ. Int. 30 (2004) 99-104.
562

EXTENDED SYNOPSIS IAEA-CN-118/120P
TOPIC: CONTAMINANTS IN THE ENVIRONMENT
1
Impact of the Pollution by Heavy Metals and Eutrophication on the Southern Lagoon of Tunis before its Ecological Rehabilitation
J. Ben Souissia, E. Orlandob, J. Zaoualia
a Institut National Agronomique de Tunisie, 43 avenue Charles Nicolle, 1082 Tunis, Tunisia
bDipartimento di Biomedicina, Università di Pisa, Via Volta 4, I-56100 Pisa, Italy
E-mail address of main author: [email protected]
The Southern lagoon of Tunis, (northern Tunisia, central Mediterranean) (Fig. 1), has been strongly affected by nutrients and heavy metals. Since the Middle Ages, at least, the lagoon collected natural and anthropic polluents and both categories of pollution considerably increased concomitant to urban industrialization [1] and, were the cause of important dystrophic crises [2].
With regard to this ecosystem, a previous article was provided by [3] who given thorough data allowing to suggest that local benthic communities were submitted to both natural and anthropic polluents pressure. These unfavorable patterns reached a high level eutrophication and ended in a collapse stage according to [4].
Before ecological rehabilitation of southern lagoon, investigations were conducted in order to assess and to delineate the environment state of pollution and its effects in the area. We conducted a comparative study on the pollution by heavy metals and nutrients in the water column, surface sediment and in various organisms such as the green algae Ulva rigida, the two mussels Ruditapes decussatus and Mytilus galloprovincialis, the three species of fish Anguilla anguilla, Chelon labrosus and Mugil cephalus .The following metals were studied (Cd, Cu, Zn, Pb, Cr, Ni, Fe, Mn, and HgTot). Samples are collected seasonally during five years 1995-1999 and treated according to international norms and analysed by Atomic Absorption Spectrophotometer (A.A.S.).
The results showed a high level of contamination by heavy metals of surface sediment. The values for mercury, cadmium and lead oscillate respectively between (0.17 and 5µg/g dry weight; 0.13 and 30µg/g dry weight; 3.97 and 698 µg/g dry weight). The sediment of the lagoon constitute before the restoration program a great reserve of toxic metallic pollutants strongly correlated with the nature and the importance of the industrial activity [5].
In the same way, ecotoxicological survey revealed that relatively high concentrations of lead, mercury and cadmium occur in Ulva rigida, although concentrations in water were generally, except during the decomposition of algae in summer, less than the detection limit. The variation of metals concentrations in the cosmopolitan green algae Ulva rigida, characteristic of many eutrophic coastal environments, seems to reflect the fluctuations of the above metals in the sediment. In fact, contents of this “bio-sensor” species cover large intervals of values according to stations considered reaching in certain cases very high concentrations.
563

J. Ben Souissi et al.
2
Concerning the animal organisms, the seasonal study has allowed us to observe the bioaccumulation complex, dependent on a multitude of factors such as abiotic parameters, the species and its metabolism, the organ analysed as well as the time of exposure to the pollutants. Facing the stress caused by this pollution, these animals, although belonging to the similar environment, develop and present different behaviours. This state of pollution is to the origin of a deplorable ecological situation in the lagoon, characterised by the relatively low specific diversity and the colonisation of the ecosystem by the indicators of pollution and extreme conditions [6].
FIG.1. Localisation of the Southern lagoon of Tunis.
[1] SEBAG, P., Tunis: Histoire d’une ville, Histoire et perspectives méditerranéennes, Edition l’Harmattan (1998) 1-685.
[2] ZAOUALI, J., Le lac de Tunis: facteurs climatiques, physico-chimiques et crises dystrophiques, Bull. Off. Natn. Pêch. Tunisie 1 1 (1977) 37-49.
[3] ZAOUALI LAIDAIN, J., Les peuplements malacologiques dans les biocoenoses lagunaires tunisiennes, Etude de la biologie de l’espèce pionnière Cerastoderma glaucum Poiret, Thèse Doctorat es Sci. Univ. de Caen (1974) 1-335.
[4] BEN SOUISSI, J., REZIG, M., ZAOUALI, J., Variabilité des facteurs abiotiques dans les eaux d’une lagune méditerranéenne, le lac sud de Tunis (Tunisie) Rapp. Comm. Int. Mer. Médit. 36 (2001) 1.
[5] BEN SOUISSI, J., ZAOUALI, J., AOUIJ, S., ORLANDO, E., MAZGHOUNI, M., REZIG, M., Teneurs en sédiments de surface du lac sud de Tunis avant sa restauration, Documents Techniques de l’AIEA, AIEA-TECDOC-1094 (1999) 13-18.
[6] BEN SOUISSI, J., REZIG, M., MAZGHOUNI, M., Bioaccumulation de quelques polluants métalliques chez des animaux comestibles du lac sud de Tunis, Bull. Soc. Zool. France 125 1 (2000) 27-35.
564

EXTENDED SYNOPSIS IAEA-CN-118/121P
TOPIC: CONTAMINANTS IN THE ENVIRONMENT
1
Some Environmental Aspects of the Çakalburnu Lagoon in Izmir Bay, Turkey
E. Can, U. Yilmaz
Dokuz Eylul University, Institute of Marine Sciences and Technology, Inciralti, 35340 Izmir, Turkey
E-mail address of main author: [email protected]
Çakalburnu lagoon is a system displaying both productivity and pollution due to environmental and anthropogenic activities. The study area, Çakalburnu lagoon, is a shallow, coastal lagoon, which spreads over 70ha area and is located on the south coast of the Izmir Bay (Fig. 1). The water body of the lagoon is, with a depth ranging between 0.5-1m. The lagoon has a connection to the sea through an inlet as wide as 6m. The lagoon is under complete protection.
FIG. 1. Location of Çakalburnu Lagoon. FIG. 2. Location of sampling stations in Çakalburnu Lagoon.
The study was carried out during 12 months, from April 2001 to April 2002. However because of the meteorological conditions sampling could not have been performed in December 2001 A total of seven sampling stations were distributed in the lagoon (Fig. 2). ‘In situ’ measurements of temperature, salinity (psu) and pH were carried out at all stations with WTW pH/Cond 340i. Water samples were stored and frozen until laboratory analysis for nutrients (Amounts of nutrients such as nitrate+nitrite, ammonium and phosphate were determined with a Skalar two-channel Autoanalyzer. Contents of dissolved oxygen in samples were measured using Winkler method. Benthic fauna was also sampled with Van-Veen grab and the species were later determined taxonomically in the laboratory. Some specific species of Polychaeta and Crustacea in the lagoon area are presented in Table I. Average values of physical, chemical variables are given in Table II. Temperature is naturally related to seasonal conditions, as the highest value was 28.5°C in August and the lowest value was 8°C in January. The pH values ranged between 8.05-9.50, and the dissolved oxygen values varied from 1.04 to 21.4mg/l. During rainy period, salinity values showed a descending trend and the lowest value was measured in January (26.2 psu), and the highest value 39.7 psu was observed in May. The highest concentrations of NO3-N, NH4-N and Reactive Silis were
565

E. Can and U. Yilmaz
2
recorded in January (250.0 µM, 219.9 µM, 192.3 µM respectively). The maximum concentrations of NO2-N was measured in October (10.60 µM) and o.phosphate–phosphorus (o.PO4-P) was observed in May (52.00 µM) The minimum values of NO3-N, NO2-N, NH4-N, o.PO4-P and Si were recorded in March.
TABLE I. BENTHIC SPECIES AS INDICATORS OF POLLUTION
Taxa SummerFall WinterSpring
Polychaeta Ind. Ind. Ind. Ind.
Schistomeringos rudolphi476 777 29 23450
Polydora ciliata 4301 1521 1064 22178
Malacoceros fuliginosus 28419 22148907 16937
Capitella capitata 991 - 887 6027
Total 34187 244452887 68593
Crustacea
Corophium insidiosum 29936 4459 936 436902
Gammarus insensibilis 11917 7409 306 44607
Carcinus aestuarii 380 70 9 250
Total 42233 119381251 481759
TABLE II. MIN-MAX AND MEAN±STANDARD ERROR VALUES OF PHYSICOCHEMICAL VARIABLES OF ÇAKALBURNU LAGOON MINIMUM(MIN), MAXIMUM (MAX), STANDARD ERROR (SE), SAMPLE SIZES (N)
Summer Fall Winter Spring
Parameters N Min Max Mean±SE Min Max Mean±SE Min Max Mean±SE Min Max Mean±SE
pH 21 8.05 8.85 8.40±0.06 8.18 9.37 8.75±0.04 8.33 8.89 8.67±0.03 8.27 9.50 8.93±0.08
Diss. Oxygen 21 2.35 14.98 6.37±0.78 3.57 21.40 8.14±0.65 1.04 9.16 4.90±0.37 1.94 21.92 10.28±0.69
Salinity 9 38.20 39.20 38.82±0.11 36.70 39.60 38.17±0.39 26.20 38.20 33.37±1.37 36.00 39.70 38.19±0.45
Temperature 21 23.00 28.50 26.36±0.13 12.00 25.50 19.86±0.12 8.00 16.70 12.13±0.19 20.00 23.60 21.86±0.14
Reactive Si 9 1.10 8.10 4.37±0.81 0.88 9.40 4.28±0.98 0.30 192.30 51.92±23.36 3.00 31.50 12.42±3.88
NH4-N 9 2.40 14.50 4.74±1.26 1.10 132.00 38.63±15.05 0.10 219.90 88.41±31.19 3.50 14.90 5.97±1.22
NO2-N 9 0.09 0.59 8.40±0.06 0.15 10.60 8.75±0.04 0.01 9.20 8.67±0.03 0.11 2.10 8.93±0.08
NO3-N 9 1.32 4.51 1.77±0.37 1.50 16.70 7.42±2.39 0.22 250.00 62.19±29.52 1.10 9.37 4.40±1.11
o-PO4-P 9 5.80 13.10 7.53±0.86 0.45 19.75 10.24±2.25 0.61 37.50 11.56±3.99 2.26 52.00 10.95±5.18
Nutrient levels were high during the whole sampling period, therefore the Çakalburnu lagoon can be classified as a eutrophicated environment, especially phosphate originating from land based is an important source for eutrophication comprised with other nutrients. Sampled benthic species also point out the eutrophication. As a result of this study, due to nutrient levels, the Çakalburnu lagoon is an eutrophic region and some biological organisms show dominancy with increasing their individuals in the lagoon.
566

EXTENDED SYNOPSIS IAEA-CN-118/122P
TOPIC: CONTAMINANTS IN THE ENVIRONMENT
1
Accumulation of Heavy Metals in Shellfish Flesh of Marine Environment along the Coast of Tunisia
L. Choubaa, N. Langar-Zamouria, M. S. Romdhane b, A. El Abeda
a
b
National Institute of the Sciences and Technologies of the Sea (INSTM), Tunisia
National Institute of Agronomy (INAT), Tunisia
E-mail address of main author: [email protected]
The Tunisian coastal area is the seat of industrial and tourist activities. These different activities often have an effect on the quality of the coastal zone and the living marine resources.
Several shellfish species are prospected but clams and mussels are the only ones that are actively exploited.
The main objectives of this study are : i) to estimate the rates value of heavy metals pollution, cadmium (Cd), lead (Pb) and mercury (Hg), ii) to identify an indicator of the chemical quality of marine ecosystem and iii) to insure the quality within the norms required by the World Organization of Health (WHO).
This work emphasize the determination of the toxic metals concentration rates in flesh of some edible Bivalves of Tunisian coasts. These species collected along the coastline are: Tapes decussatus, Mytilus galloprovincialis, Crassostrea gigas, Pinctada radiata, Solen marginatus, Mactra corallina, Donax trunculus and Venus verrucosa.
Samples have been collected from various sites selected according to degree of pollution. Each sample was measured and weighed. Then, the totality of the flesh is recovered in adequate small bottles after homogenization, lyophilization, grinding and sifting.
The Cd and Pb concentrations have been determined by atomic absorption using spectrophotometer (SAA marks Varian 220 Zeeman) with graphite oven using methods described by UNEP/IAEA/FAO, (1990). For Hg, concentration has been determined by the SAA in cold steam, recording and processing by IAEA/UNEP (1984). The results are expressed in mg/Kg Fresh Weight (FW)).
Concentrations of Cd, Pb and Hg recorded for different species are (0.003 – 0.222), (0.127–0.562) and (0.033 to 0.131), respectively. However, these concentrations remain very lower than the limiting thresholds admitted by the World Organization of Health (WHO). The highest concentration of Cd are measured in oyster and mussel collected from Bizerte lagoon , then in clams of Boughrara lagoon (south of Tunisia). In the north of Tunisia (Rades), the solen and the clam accumulate less Pb than donax and mactra coralline. These concentrations are similar to that obtained in mussel and oyster of lagoon of Bizerte. In the difference within other species, the rate of Hg in mussel and oyster flesh are not relation with metals.
567

L. Chouba et al.
2
The concentrations recorded are dependant of shellfish species and regions. The metals bioaccumulation depends on the ir availability in the ecosystem. The degree of ecosystem contamination is correlated to the amount of anthropic discharges.
This preliminary work contributed in the study of the bioaccumulation of three toxic metals such as Cd, Pb and Hg in some species of Bivalves collected along the Tunisian coasts. In the same time this study gave an exact chemical quality of the studied ecosystem.
In future work, we study other shellfish species (e.g. carnivores) coming from the same regions in order to compare and identify a new bio indicator of the ecosystem chemical quality.
568

EXTENDED SYNOPSIS IAEA-CN-118/123P
TOPIC: CONTAMINANTS IN THE ENVIRONMENT
1
Occurrence of Butyltin Compounds in Sediment and Bivalve from Three Harbour Areas (Ho Chi Minh, Da Nang and Hai Phong) in Viet Nam*
D. N. Danga, D. T. Loana, J. Bartoccib, I. Tolosab, S. J. de Morab
a Institute for Nuclear Science and Technology, Hanoi, Viet Nam
bMarine Environmental Studies Laboratory, IAEA Marine Environment Laboratory, Monaco
E-mail address of main author: [email protected]
* The Work has been carried out with financial support from IAEA (Research Contract No. 11823/RBF)
Organotin compounds (OTs) such as butyl- and phenyltin were widely used in the past as stabilizers in PVC production industry and in antifouling paints for marine vessels of all types. Ecotoxicity of these compounds was proven to cause imposex and shell malformation to bivalves and shellfish [1, 2]. The occurrence of OTs has been studied well for coastline in South Korea, Japan, China, Thailand, and Malaysia [3, 4]. In these areas, the concentration of total butyltin (ΣBTs), e.i. the sum of tributyltin (TBT) and its metabolites: monobutyltin (MBT) and dibutyltin (DBT) was shown to vary from undetected up to a level of mg/kg w.w. of sediment or biota tissue, depending upon the sampling sites. The authors of these publications have shown that the shipyard activity is the main source of OTs in the studied areas.
Viet Nam is located along the South China Sea with about 2,000 km of sea coast where shipbuilding industry was intensively developed many years ago. It is believed that a large amount of OTs was used in antifouling paints for vessel hulls in the yards and dry docks. Because of the lack of technical capacity, unfortunately, no data are available on the occurrence of OTs in the marine environment of Viet Nam. This study aims at to supplement this gap.
The study was conducted in 2002 and 2003 with sediment and bivalve (Meretrix meretix) samples. Sediment was taken from dry docks in Ho Chi Minh and Hai Phong cities and from cargo harbours in Ho Chi Minh (south), Da Nang (centre) and Hai Phong (north). The clams were bought from local fishermen cruising around the harbours as well as dry docks in Ho Chi Minh City and Hai Phong. OTs compounds: tributyltin (TBT), monobutyltin (MBT), and dibutyltin (DBT) were analysed using a previous reported procedure [5].
TBT, DBT and MBT was found in all the samples studied. The concentration of ΣBTs demonstrated to be the highest (315 ng/g w.w) in sediment from Song Cam sampling station (Hai Phong) where 7 shipbuilding and vessel repair yards are located whilst the lowest concentration of ΣBTs was found in sediment from the Da Nang cargo port (10-15 ng/g w.w).
569

D. Dang et al.
2
This implies that the main source of BTs in the marine environment in Viet Nam is from the shipbuilding activities. A good correlation (R2=0.85) between BTs in sediment and in the clams soft tissue was computed showing the BTs accumulation in the bivalve (Meretrix meretrix). The ratio of ΤBT to ΣBTs content in sediment is higher than 0.4 for all the sampling sites indicating that TBT is still being used in Viet Nam. However, it requires to further study the environmental behaviour of the chemicals in the tropical marine environment. Moreover, legislation to control the use of butyltin compounds in the country needs to be adopted to reduce the harmful impact of the chemicals.
[1] ALZIEU, C., SANJUAN, J., DELTREIL, J.P., BOREL, M., Tin contamination in Arcachon Bay: Effects on oyster shell anomalies, Mar. Poll. Bull. 17 (1986) 494-498.
[2] HALLERS-TJABBES, C.C.T., WEGENER, J-W., VAN HATTUM, B., KEMP, J.F., TEN HALLERS, E., REITSEMA, T.J., BOON, J.P., Imposex and organotin concentrations in Buccinum and Neptunea antiqua from the North Sea: relationship to shipping density and hydrographical conditions, Mar. Environ. Res. 55 (2003) 203-233.
[3] HYAE-KYUNG HONG, SHIN TAKAHASHI, BYUNG-YOON MIN, SHINSUKE TANABE, Butyltin residues in blue mussels (Mytilus edulis) and arkshells (Scapharca broughtonii) collected from Korean coastal water, Environ. Poll. 117 (2002) 475-486.
[4] BECH, M., Imposex and tributyltin contamination as a consequence of the establishment of a marina, and increasing yachting activities at Phuket Island, Thailand, Environ. Poll. 117 (2002) 421-429.
[5] CASSI, R., TOLOSA, I., BARTOCCI, J., DE MORA, S.J., Organotin speciation analyses in marine biota usng sodium tetraethylborate ethylation and gas chromatography with flame photometric detection, Appl. Organometallic Chem. 16 (2002) 355-359.
570

EXTENDED SYNOPSIS IAEA-CN-118/124P
TOPIC: CONTAMINANTS IN THE ENVIRONMENT
1
Basic Experimental Research for the Reconstruction of Water Purification System Using Soil - Sorption of Refractory DOM and Phosphate Ion to Soil Beads Under Static and Dynamic Water Flow Conditions
Y. Fujikawaa, T. Hamasakib, G. Prasaib, R. Imadab, E. Ikedab, H. Ozakib, M. Sugaharab
a Kyoto University Research Reactor Institute (KURRI), Kumatori, Osaka, Japan
bOsaka Sangyo University (OSU), Daito-shi, Osaka, Japan
E-mail address of main author: [email protected]
High flow-rate soil percolation system was developed using soil beads processed out of loam. In the present report, removal of refractory dissolved organic matter (DOM) and phosphate ion by sorption to soil under static and dynamic water flow condition was compared.
The soil tested was Akadama soil (loam from Kanuma, Japan, parent material: tephra) and Kuroboku soil (Andosol from Hiroshima, Japan, parent material: tephra). Sorption isotherm of phosphate ion, fulvic acid (FA hereafter), and high molecular weight DOM (>1000 Daltons) at 25 ? was obtained for the soil samples. Potassium hydrogen phosphate solution was used to test the sorption of phosphate ion. The FA, originally the impurity in Aldrich humic acid, was extracted from the humic acid and was desalinated by gel filtration with Sephadex G-25 before usage. The high molecular weight DOM was recovered from wastewater from a stock farm by tangential flow ultrafiltration (Pellicon-2 Mini, Millipore). The FA and the DOM from wastewater was not biodegradable in the 28 day biodegradability test.
Prior to the column test and pilot scale test, Akadama soil (purchased as powder) was processed into beads using the turbulent granulating machine and was later baked at 600 ? to make it water-resistive. Kuroboku soil was granulated using bentonite as a binder but without baking. Column experiment was vertical upflow system at a flow rate of 2 mL/min (1.5 m/day), with the soil beads packed in the 5 cm diameter column made of acrylic resin to the height of ca. 15 cm. Approximately 50 mL of concentrated FA (20 mg weight as organic carbon) was instantaneously injected to the column with artificial river water. The effluent was periodically collected using a fraction collector, and DOC (dissolved organic carbon) concentration, pH and EC of the effluent were monitored. Pilot scale test was done at the site in Hiroshima adjoining a stock farm. Akadama and Kuroboku soil beads were packed in two sets of 80 cm × 120 cm steel bath to the height of 50 cm, respectively, and the wastewater from the stock farm, after passing it through a gravel pit for prefiltration, was continuously pumped to the soil system at the flow rate of 2m/day. The influent of the pilot scale test contained ca. 4 mg/L of dissolved T-P (total phosphorus) and 14 mg/L of DOC. BOD5 of the influent was mostly below the detection limit (< 4 mgO2/L), and the biodegradability test showed that ca. 90 % of DOC there was recalcitrant. The influent and effluent from the pilot scale test were collected every two weeks, and were analyzed for T-P (dissolved and total), DOC, COD-Cr, pH and EC.
571

Y. Fujikawa et al.
2
Results of the sorption isotherm test are summarized in Table I. Sorption isotherm of DOM and FA was linear when the amount of OM sorbed was the order of 103 mg-organic carbon/kg-soil or less. The sorption isotherm of phosphate ion could be approximated with linear isotherm when the amount of T-P sorbed was < ca. 102 mg-P/kg-soil while it was compatible with the Freundlich isotherm when the amount of T-P sorbed was the order of 104 mg-P/kg-soil (Sugahara et al., this issue).
TABLE I. PARAMETER OBTAINED FROM THE SORPTION ISOTHERM PLOT Table 1 Parameter obtained from the sorption isotherm plot
soil
Kd (mL/kg) pH*2 Kd pH*2 Kd pH*2
Kuroboku beads(binder:bentonite)
509.8 (6.2) - - 39.7 (6.1)
Kuroboku soil 545.7 (6.2) 4.3 (6.5) 8.8 (6.9)Akadama beads600?
192.2 (6.8) 25.9 (6.7) 81.3 (6.4)
Kanuma beads600?
522.7 (7.1) 28.3 (7.0) 104.1 (6.5)
phosphate ion*1DOM recoveredfrom wastewater
from the stock farmfulvic acid*3
*1 sorption data was fitted to the linear isotherm when the amount of phosphate ion sorbed was the order of <125 mg (as total phosphorus)/kg-soil. *2 pH of the soil solution when sorption isotherm was obtained. *3 Sorption data was fitted to the linear isotherm when the amount of organic matter sorbed was the order of <103 mg (as organic carbon)/kg-soil.
The results of the column test were that the column packed with Akadama soil showed more retardation of the injected FA than in case of Kuroboku soil column. The observed tendency was in accordance with sorption test conducted under static water flow condition, in which FA was sorbed more to Akadama soil than to Kuroboku soil. Also ca. 50% loss of the FA injected into the Akadama soil column was found, probably due to the slow biological degradation of the FA once sorbed to the soil.
The results of the pilot scale test (Figs. 1 and 2) agreed well with the theory of sorptive solute transport in aggregated soil. The elongated tailing of breakthrough curves of T-P and DOC proved that the sorption and diffusion of the solute to internal pores of soil beads was effective. The removal of DOC was more effective in Akadama soil than in Kuroboku soil as was expected from the sorption isotherm. The removal of T-P, on the other hand, was higher in case Kuroboku soil unit than Akadama soil unit, as opposed to the sorption isotherm results. The investigation is under way to clarify the cause of such contradiction.
01
23
45
0 100 200 300 400 500T-P
(mg/
L) i
n th
e ef
fluen
t
Influent
Kurobokusoil
Akadamasoill
volume of effluent water (multiples of soil volume)
0
5
10
15
20
25
0 100 200 300 400 500
DO
C c
once
ntra
tion
Influent
Kuroboku soil
Akadama soill
volume of effluent water (multiples of soil volume)
FIG. 1. Breakthrough curve of T-P (pilpt scale test). FIG. 2. Breakthrough curve of DOV (pilot scale test).
572

EXTENDED SYNOPSIS IAEA-CN-118/125P
TOPIC: CONTAMINANTS IN THE ENVIRONMENT
1
Nuclear Detectives - Reconstructing Histories of Toxic Dinoflagellates & Blue Green Algae in Coastal Lakes and Estuaries
H. Heijnisa, A. McMinnb, G. Hallegraeffb, K. Srisuksawadc
a ANSTO Environment, PMB 1, Menai NSW 2234, Australia
bUniversity of Tasmania, Hobart, Australia
c Office of Atoms for Peace, Bangkok, Thailand
E-mail address of main author: [email protected]
Using isotopic, geochemical and microfossil analyses of sediment cores, it is possible to reconstruct pre and post-colonial environmental conditions of coastal lakes and estuaries and their catchments. This is an important management tool, not only for determining the base line 'natural' conditions of these ecosystems but also identifying the nature and extent of changes they have experienced through time, including the influx of pollutants and changes in sedimentation regimes. Such information is generally not available from historic records.
Practical examples includes the following case-studies:
1) Tasmania & South Australia - Over the past couple of decades “alien species” have been introduced to the coastal waters of Australia and of Tasmania in particular, such as the toxic dinoflagellate Gymnodinium Catenatum. Careful dating and reconstruction of sediment archives have revealed the time and nature of this arrival.
2) NSW Blue Green Algae in the Great Lakes Area: The occurrence of blue-green algal blooms in the Great Lakes area of NSW have now been linked with catchment changes and the dynamics of this coastal system, using reconstructed histories from sediment cores.
These detailed histories span the last 60 – 80 years, and cover the post World War II coastal population & development expansion.
573

EXTENDED SYNOPSIS IAEA-CN-118/126P
TOPIC: CONTAMINANTS IN THE ENVIRONMENT
1
Distribution of Heavy Metals in Marine Sediment of Zanzibar Islands, Tanzania
A. A. Hutahaeana, W. Balzerb
a Research Center for Maritime Territories & Non Living Resources - Agency for Marine and Fisheries Research (BRKP), Jakarta, Indonesia
bMarine Chemistry Laboratory, Faculty of Biology and Chemistry, University of Bremen, Germany
E-mail address of main author: [email protected]
Metals are natural constituents of rocks and soils. They enter the environment as a consequence of weathering and erosion [2, 4, 8]. Many metals are biologically essential, but all have a potential to be toxic to biota above certain threshold concentrations [5]. Sediments are the ends of the path for natural and anthropogenic materials. Besides that, sediments can provide information on contamination because the concentration of chemical substances in sediments varies with concentration and with conditions encountered within specific sediments [3, 7]. The aim of this study was to assess the levels of heavy metal concentrations such as copper (Cu), lead (Pb) and cadmium (Cd) beside aluminium (Al) as conservative element in sediments of Zanzibar’s coastal area.
Sediment samples were taken by sediment cores with 1inner diameter of 10 cm from different water depths. The sediment cores were sliced in different layers. A part of each slice was put into plastics bags and placed in a freezer for the metals analysis, and the other part used for porosity measurement.
Porosity was measured in order to know the water content of the samples. The mass of the tubes containing the wet sediments were measured by electrical balance with sensitivity ± 0,1 mg. The sediments were then dried in the oven constantly at temperature of 60°C for 5-6 days, until the sediments completely dry and had a constant weight. Porosity was calculated by the following formula [1]:
f = Wwater / (Wwater+Wsed) (1)
where : f = Porosity
W = Weight (gram)
The high performance digestion unit Microwave Laboratory System (MLS) 1200 Mega with a rotor for 6 Teflon digestion vessels was used for digestion of the sediments. This step has aim to solubilize the solids samples by using heat, pressures and several acids e.g. nitric acid (HNO3), hydro fluoric acid (HF), hydro chloride acid (HCl) and boric acid (H3BO3). Initial attempts ware made to digest around 50-100 mg dry sediment samples in 4 vessels and the 6th
574

A. Hutahaean and W. Balzer
2
vessel was loaded with 20-25 mg of MESS-1 as a reference element or acids with out sample as a blank.
AAS instrument had been used for metals analysis from the samples. The basic principle is that the light of a specific wavelength will impinge on previously generated ground state atoms. The atom absorbs this light and a transition to a higher energy level occurs. The intensity of this transition is related to the concentration of the ground atoms [6]. The heavy metals (Cu, Pb, Cd) in the sediments samples were analyzed by a graphite furnace atomic absorption spectrometer. In addition for conservative element (Al) had been measured by flame atomic absorption spectrometer.
[1] BERNER, A.R., Principles of Chemical Sedimentology, International series in the earth and planet sciences, McGraw Hill, USA (1971).
[2] COX, P.A., The elements on earth, Inorganic chemistry in the environment, Oxford University Press (1995) 287.
[3] HAYES, D., JOHNSON, J.E., Organ chlorine, heavy metal and polya romatic hydrocarbon pollutant concentrations in the Great barrier Reef (Australia) Environment: a review, Mar. Poll. Bull. 41 (2000) 267-278.
[4] LIBES, M.S., An Introduction to Marine Biogeochemistry, John Wiley and sons, Inc. (1992) 207-223.
[5] POWER, E., CHAMPION, P.M., Assessing sediment quality (BURTON, J.R., ALLEN, G., Eds) Sediment Toxicity Assessment, Lewis Publishers (1992).
[6] PELLY, Z.I., Determination of trace elements by atomic absorption spectrometry, (ALFASSI, Z. B., Ed), Determination of Trace Elements, Balaban Publ. Rehovot, Israel (1994) 146-190.
[7] SALOMONS, W., FÖRSTNER, U., Metals in the hydrocycle, Springer-Verlag, Heidelberg (1984).
[8] SCHIFF, K.C., WEISBERG, S.B., Iron as a reference element for determining trace metal enrichment in Southern California coastal shelf sediments, Mar. Environ. Res. 48 (1999) 161-176.
575

EXTENDED SYNOPSIS IAEA-CN-118/127P
TOPIC: CONTAMINANTS IN THE ENVIRONMENT
1
Effect of Physicochemical Variation on Heavy Metals Fluxes at the Sediment-Water Interface, Lake Naivasha, Kenya
J. N. Kamaua, A. N. Gachanjab, C. J. Ngilac, M. J. Kazungua, M. Zhaic
a Kenya Marine and Fisheries Research Institute, P.O Box 81651, Mombasa, Kenya
bJomo Kenyatta University of Agriculture and Technology, Faculty of Science, P.O. Box 62000, Nairobi, Kenya
c University of Botswana, Faculty of Science, Private Bag 00704, Gaborone, Botswana
E-mail address of main author: [email protected]
Lake Naivasha is a fresh water lake, approximately 145 km2 in area situated in the Eastern Rift Valley of Kenya (0° 45'S and 36° 20'E). It is considered to experience some sort of anthropogenic-induced stress, the effect of which is manifested in the decline of fish catch and low biodiversity [1]. Laboratory studies have shown that survival of fry of brown trout is reduced by Al concentrations of 250µg/l and their growth reduced by one tenth of this concentration [2].
To determine whether seasonal changes in physicochemical parameters triggers the release of heavy metals, flux measurements were conducted in situ and in the laboratory.
In situ flux experiments were set-up during the rainy season. To perform the experiment plexi glass incubation jars (enclosing an area of 0.066m2) were set up at the sewage input point (station SS) and at the papyrus field next to the horticultural farms (station SH). Laboratory flux experimental set-up comprised of sediment samples from the exposed riparian land sampled during the dry season at both the above sites.
Aluminium in situ fluxes were about one order of magnitude higher at the site next to the municipal sewage input point (6.96 mmoles/m2hour), as compared to the site near the horticultural farms (0.95 mmoles/m2hour). Contrary to the assumption that flooding during the rains would trigger the release of heavy metals due to changes in physicochemical parameters, it seemed not to apply with Al; laboratory fluxes of sediment samples collected during the dry season were quite low and could as well be considered as zero. Aluminium in situ fluxes at station SH were highly influenced by redox potential variation, mainly caused by the translocation of oxygen through the papyrus roots. Fluxes were twice as high at the site whose Al exchange correlated less inversely with Eh (where r=-0.43 flux= 4.02mmoles/m2/hour and where r=-0.93 flux=2.30mmoles/m2/hour). However the prevailing Al exchange was influenced by humic and fluvic acid solubilization (pH r=0.94 and pH r=0.93).
Similarly Cu in situ fluxes were higher at station SS (1.71 µmoles/m3/hour) and correlated positively with water pH r=0.89, an indication that dissolution of Cu was mainly from humic and fluvic acids. The mobility of organic-Cu may be significant under high pH conditions [3]. Copper in situ fluxes at the papyrus field (station SH) were negative (-
576

J. Kamau et al.
2
0.078µmoles/m3/hour) and related inversely with Eh (r=-0.91). An indication that Cu was being co-precipitated onto redox sensitive metals. Papyrus translocate oxygen form the air to the root rhizomes through their internal gas space aerenchyama [4], and would therefore mean that the surrounding sediments were aerated and had high Eh values, leading to precipitation of redox sensitive metals.
Seawage site 'a' in situ Al flux
y = 358.74x + 12.021R2 = 0.8776
0
500
1000
1500
2000
2500
3000
3500
0 1 2 3 4 5 6 7 8 9
Time in hours
Vt(C
t-Co)
m
oles
Al
Acknowledgement
This study was made possible by a grant from IFS, research facilities at Kenya Marine and Fisheries Research Institute and Botswana University.
[1] MALALA, J.O., OJUOK, J.E., MUGO, J., MWAMBURI, J., MORARA, G., KUNDU, R., Preliminary Report on the Lake Naivasha Fisheries, Naivasha report No: KMFRI/1 (2001).
[2] WILD, A., Soils and the environment an introduction, Cambridge University Press (1993) 187-188.
[3] MURRAY, B., MCBRIDE, C., Environmental chemistry of Soils, Oxford University Press, New York (1994) 308-339.
[4] DENNY, P., BAILEY, R., TUKAHIRWA, E., MAFABI, P., Heavy metal contamination of Lake George (Uganda) and its wetlands, Hydrobiologia 297 (1995) 229-239.
577

EXTENDED SYNOPSIS IAEA-CN-118/128P
TOPIC: CONTAMINANTS IN THE ENVIRONMENT
1
An Investigation of the Important Parameters used for Application of Chemical Reaction Model at Environmental Soils in Egypt
N. H. M. Kamel
Radiation Protection Department, Nuclear Research Center, Atomic Energy Authority, P. O. Box 13759, Cairo, Egypt
E-mail address of main author: [email protected]
Aquatic sediments are principally derived from weathering process. The Industrial wastes and mining activities are the potential sources of pollution. Uranium is a common element in the earth, it has moved and will be moved by naturally occurring geochemical process. Phosphates are usually from naturally and/or synthetic wastes. The objective of our research was to test of the environmental soils and/or sediments as an adsorbent media for the removal of uranium and phosphate compounds from environmental sediment samples. The coastal line sites such as Sharm El-Sheikh, Taba, Dahab and Hardgea attract over one millions tourists every year. Contamination by phosphates and uranium represented a great hazardous effect on the tourism industries. Studying of the pollution by the phosphate compounds especially with uranium is very important. The experimental procedures in this study were carried out using the above mentioned marine sediments and other fresh water sediments from other parts along the River Nile in Egypt. mineralogical investigations were carried out with X-ray diffraction technique. The sediment samples showed that it contained of the major kaolonite mixed with feldspar and quartz minerals. Chemical analyses of the sediments showed that the environmental sediments contain, 60 to 85% SiO 2, 9 to 25% Al2O3 and 2 to 5% Fe2O3. carbonates were found 9 – 13% and the organics % are < 5%. Concentrations of the PO4
3- at the environmental sediments in aqueous distilled water was found 0.1 to 1.3 * 10-3 mg/kg , PO4-3 ions in the aqueous phase was found > 1.5 and 2 mg/kg at Port-Said and Rashid samples. Concentrations of the soluble UO2 was found less than 0.5 mg/kg at all the investigated samples. The pH of the soils in distilled water was found from 7.8 to 8.1, the pH of the Rashid sample was found 6.2. In order to obtain the limitation of the solubility of phosphate compounds .Different concentrations of PO4 were equilibrated with the fixed weights of the solid samples volume of the aqueous phosphate solutions ranged from 0.2 to 2 ppm were added to the dried sediment samples. Concentrations of PO4
3- remained at the aqueous phase were determined by the stannous chloride photometric method. The solid surfaces of environmental sediment and soils are amphoteric has a certain surface charge depends on the solution hydrogen ion concentrations. At a certain pH value, the solid surface has a net zero charge, in which the solid surface has no charge. The point of zero charge of the sediment samples were determined by the salt effect [1]. The PZC was found 7 to 8 for all the samples. Figure 1 shows an example of the determination of the PZC of sample (Dahab). The constant capacity model was used for the determination of the specific PO4
3- in equilibrium with solid phase. When a certain vo lume of distilled water were added to the environmental sediment samples, the slightly adsorbed phosphate and uranium ions were released, and sometimes phosphate only without uranium were released. Concentrations of the phosphates and uranium released depending on the pH of the solid in water. The species and the equilibrium constants of PO4
3-in water – sediment system at a certain pH value. According to the mass action law was given as:
578

N. Kamel
2
≡SOH + H+ ⇔ SOH2+ (1)
SOH ⇔ SO- + H+ (2) ≡SOH + H3PO4 ⇔ ≡SH2PO4 + H2O K1 = 10.5 (3) ≡SOH + H3PO4 ⇔ ≡SH2PO4
- + H+………. K2 = 5.00 . (4) ≡SOH + H3PO4 ⇔ SH2PO4
2- + H2O + 2 H+ K3 = -1.16 (5)
the possibility of the presence of the uranuyl phosphate species in water and their equilibrium constants Ka1, Ka2, Ka3 were given by the following Equations 6-8 as follows:
UO2HPO4 ⇔ UO2+ + HPO42- ……Ka1 = -8.41 (6)
UO2H2PO4+ ⇔ UO2
2+ + HPO42- + H+ Ka2 = -10.23 (7)
UHPO42+ ⇔ U4+ + HPO4
2- Ka3 = -12.05 (8)
Neglecting of the other uraniyl phosphate species because it has a low equilibrium constants. By applying the constant capacity model (CCM) and the intrinsic equilibrium constants. Eq. 9 is an example of that was applied for the reaction 1 as [2] : Ks1 (in) =
[ ][ ][ ] ( )RToF
HSOHSOH
/exp2 ψ+
+
(9)
by similar way the intrinsic equilibrium constant was applied for the other chemical reactions (2-8). The state of the different species, SOH2+, SO-, ≡SH2PO4, ≡SH2PO4
-, ≡SHPO42-,
UO2H2PO4, UO2H2PO4-, UHPO4
2+ at pH 7.8 to 8.1 were determined.
The results showed, by the ion activity products (IAP). The saturation index (SI) was calculated and equal log(IAP/Keq.), so, when SI = 0, the phosphate compound was in equilibrium with the solid phase, when, SI has a negative value, the phosphate compound will dissolve and when SI has a positive value, the phosphate compound will precipitate. Keq was used from the reactions of the Eq. 1-8. The results showed that, phosphate ions was in equilibrium with the solid phase at phosphate concentration 1.3 * 10-3 mg/kg, PO4
3- ions was soluble at the concentrations 0.01 to 0.1 * 10-3 mg/kg, PO4
3- ions was precipitated at the concentrations > 1.5 * 10-3 mg/kg and uranium was soluble at the concentrations < 0.5 * 10-3 mg/kg. Phosphate compounds at most of the sediments of the River Nile, Agamy, Port-Said and Rashid samples are over saturated that is mean that these sites are more polluted and the uranyl phosphate compound has a great hazardous effect on the living organisms.
FIG. 1. The point of zero charge of Dahab sample.
[1] WERNER, S., Chemistry of the Solid – Water Interface John Wiley & Sons, Inc (1992). [2] URE., A.M., DAVIDSON, Chemical Speciation in the Environment, Blackie Academic
& Professional (1995).
579

EXTENDED SYNOPSIS IAEA-CN-118/129P
TOPIC: CONTAMINANTS IN THE ENVIRONMENT
1
Speciation of Mercury and Tin in Marine Sediments and Biological Matrix
N. Mzoughia, M. Bravab, T. Stoichevb, M. Dachraouic, G. Lespesb, D. Amourouxb, M. Potin-Gautierb, O. F. X. Donardb
a Institut National des Sciences et Technologie de la Mer, Laboratoire Milieu Marin, 28 Rue 2 Mars 1934, 2025 Salammbô, Tunisia
bEquipe de Chimie Analytique, Laboratoire de Chimie Analytique Bio-Inorganique et Environnement CNRS UMR 5034, CNRS, Université de Pau et des Pays de l’Adour, Pau, France
c Laboratoire de Chimie Analytique et Electrochimie, Faculté des Sciences de Tunis, Tunisia
E-mail address of main author: [email protected]
The aim of this study was to investigate for the first time, the distribution of mercury and tin compounds in marine sediments and mussel tissues collected in Bizerte lagoon, Tunisia during two seasons (summer and winter).
Butyl-, Phenyl- and octyltin compounds were determined using a rapid speciation method. This analytical procedure is based on one-step simultaneous ethylation/extraction with sodium tetraethylborate in aqueous phase. Gas chromatography interfaced to Pulsed Flame Photometric Detection (GC-PFPD) was used to perform quantitative determination [1].
Analysis of methylmercury MMHg and inorganic mercury Hg2+ was performed by hyphenated system combining ethylation and/or hydride generation on- line with Cryogenic trapping, gas chromatography and atomic fluorescence spectrometry [2].
Validation of methods was performed using a certified sediment and biological reference material.
Results of organotin species cannot allow to establish any significant difference between the seasonal levels of contamination. The high values found in the South East of the lagoon and specially in the region of Menzel Bouguiba can be related to the intense industrial activities in this area. The predominance of butyl- and phenyltins comes probably from antifouling paints on boats and piers [3]. Indeed tributyl- and triphenyltins contained in these paints are directly released into the environment. Results show the predominance of butyltin compounds for all stations, and of monosubstituted compounds during summer.
Among all the organotins, the trisubstituted ones and specially TBT have quite high concentrations, which are widely due to releasing from antifouling paints, since an important maritime traffic exists in the lagoon.
580

N. Mzoughi et al.
2
The increasing of mono- and disubstituted compounds is attributed to the biodegradation phenomenon, which conducts to the successive desalkylation or desarylation of all the organotins since the concentrations of monoorganotins are slowly increasing.
Organotin contamination of biomass probably limited because concentrations observed in mussel tissues are rather low compared to those found in other coastal living organisms.
Results for speciation of mercury suggest that a fraction of the inorganic mercury load in the sediments of the lagoon undergoes methylation pathways. The MMHg produced is assimilated in the mussels more readily than the Hg2+.
However, anthropogenic sources of inorganic mercury Hg2+, most probably from metallurgy or tire production industries have been evidenced. One part of Hg2+ is methylated in the sediments and is assimilated by the mussels from the lagoon of Bizerte more readily than do Hg2+. Finally, MMHg contamination of biological organisms is probably limited because concentrations observed in mussels tissues are rather low when compared to other coastal environments [4].
Consequently, for filter- feeding organisms, such as mussels, the concentrations of mercury and tin species determined in the Bizerte Lagoon do not present significant toxicological risk for human consumption.
[1] CARLIER-PINASSEAU, C., LESPES, G., ASTRUC, M., Appl. Organometal. Chem. 10 (1996) 505-512.
[2] TSENG, C.M., AMOUROUX, D., ABRIL, G., TESSIER, E., ETCHEBER, H., DONARD, O.X.F., Environ. Sci. .Technol. 35 (2001) 2627-2633.
[3] MAKKAR, N.S., KRONICK, A.T., COONEY, J.J., Chemosphere 18 (1989) 2043. [4] COSSA, D., CLAISSE, D., Le methylmercure dans les mollusques du littoral Français,
Ifremer, France (1999).
581

EXTENDED SYNOPSIS IAEA-CN-118/130P
TOPIC: CONTAMINANTS IN THE ENVIRONMENT
1
Fate of Alkylphenols, Chlorophenols and Bisphenol A in the Lake Shihwa, Korea
J. R. Oh, D. Li
South Sea Institute, KORDI, Geoje, Korea
E-mail address of main author: [email protected]
Surface water, suspended particles in surface water and sediment samples from the brackish lake, Shihwa, and its surrounding creeks were collected during Aug. 2001 to May 2004 in Korea. Representative endocrine disrupting chemicals (EDCs) such as alkylphenols, chlorophenols and bisphenol A, were determined from each matrix by GC/MS [1]. Among them, alkylphenol compounds were recorded as the major pollutants affecting Lake Shihwa water quality [2, 3].
High concentration of alkylphenols were measured in those matrices in and around industrial complexes. The levels decreased gradually with distance from the industrial areas. Though alkylphenols concentration in sediment varied from that of water and suspended particle, high concentrations were generally found in industrial area and in central part of the Lake Shihwa. Concentrations of nonylphenol from industrial area were similar or higher than US and EU regulatory value which is 1 µg/L. Spatial and seasonal variation of alkylphenol in dissolved water and suspended particulate were similar but not in the sediment. The alkylphenol concentration was the highest in summer and the lowest in winter. There is no annual correlation on the levels of alkylphenol in water and particulate. Phenolic compounds are continuously discharged into Lake Shihwa from surrounding industries and hence the input of alkylphenols increases in time. Alkylphenol compounds were continuously produced by biodegradation of alkylphenol polyethoxylate and it was accumulated in the sediments by adsorption. Nonylphenol and bisphenol A were the major endocrine dis rupting chemicals determined in the Lake Shihwa. The contents of nonylphenol and bisphenol A in dissolved water, suspended particle and sediment are 60, 70, 90% and 35, 25, 8%, respectively. The levels of these chemicals measured in creeks were about 25 times higher than those in Lake Shihwa.
In order to identify the source and behavior of alkylphenols in the environment, the relationship between nonylphenol and water quality parameters such as salinity, pH, DO, COD, TN and TP were studied. Those parameters point to industrial input as the principle source of alkylphenol pollution to Lake Shihwa.
In order to investigate vertical distribution profile of alkylphenols in the sediment, two sediment cores were collected from Lake Shihwa. The concentrations profile indicates that the lowest concentration were at the surface layer and the highest at the bottom. The degradation rate of nonylphenol in the seawater was lower than it's parent compounds namely nonylphenol diethoxylate. Detailed study is underway in our laboratory to understand this fully.
582

J. Oh and D. Li
2
[1] LI, D., OH, J.R., PARK, J., Silyl derivatization of alkylphenols, chlorophenols and bisphenol A for simultaneous GC/MS determination, Anal. Chem. 73 (2001) 3089-3095.
[2] LI, Z., LI, D., OH, J.R., JE, J-G., Seasonal and spatial distribution of nonylphenol in Shihwa Lake, Korea, Chemosphere 56 (2004) 611-618.
[3] LI, D., KIM, M., OH, J.R., PARK, J., Distribution characteristics of nonylphenols in the artificial Lake Shihwa, and surrounding creeks in Korea, Chemosphere 56 (2004) 783-790.
583

EXTENDED SYNOPSIS IAEA-CN-118/131P
TOPIC: CONTAMINANTS IN THE ENVIRONMENT
1
Impact of Past Industrial Activity on the Content of Heavy Metals in the Soil/Grass System in Šibenik (Croatia)
V. Orescanina, D. Barisica, L. Mikelica, I. Lovrencica, M. Rubcicb, M. Rozmaric-Macefatb, S. Lulica
a Institute Rudjer Boskovic, Bijenicka c.54, 10000 Zagreb, Croatia
bFaculty of Science, Department of Inorganic Chemistry, Zvonimirova 8, 10000 Zagreb, Croatia
E-mail address of main author: [email protected]
The objective of this study was chemical/mineralogical characterization of soil samples affected by the dust emission and slag dumping from ferro-manganese smelter as well as uptake of metals by vegetation growing on that soil. Ferro-manganese smelter (named ‘crnica’) situated in a small Mediterranean town Sibenik (Croatia) operated in the period from 1900 to 1991. Through the whole production period there was no strategy in metal pollution control implemented. Industrial fumes and dust were emitted directly into the air while metallurgical slag was partially spread around or deposited in the vicinity of the smelter. It was assumed that the strong wind called «bura» coming from the north distributed pollutants emitted from the smelter to a wide area. So far there has been no systemic investigation concerning either environmental degradation arising from smelting activities or its adverse effects on the local folk. Professionally exposed workers had been under the continuous medical control. For this population positive correlation between neurological disorders and the years of exposure was found, especially for alcohol consumers (personal communication, data are not published). As recently as the late 1990s smelter was demounted and transferred to another location leaving behind devastated and highly polluted environment. The aim of this study is to investigate the degree of heavy metal pollution in soil caused by the smelter’s 91 year history and estimate a potential of metal mobility and bioavailability. Composite samples of metallurgical slag, six samples of soils in the 1-km circle around the smelter and four control (background) soil samples were collected. Control samples were taken about 10 km from the smelter in the opposite direction of the wind. On every sampling point vegetation was also sampled. Fourteen soil samples were collected from the Rogoznica Peninsula, located 35 km south of Sibenik, that is away from any sort of industrial or agricultural pollution. In order to avoid natural differences in chemical composition all samples were taken from the soil developed over the Upper Cretaceous layers (K2
3) represented by limestone and dolomite. Energy dispersive X-ray fluorescence (EDXRF) was used for the determination of elemental concentrations in soil, vegetation and different soil extracts whiled mineralogical composition of soil samples was determined by XRD analysis.
584

V. Orescanin et al.
2
Results of chemical and statistical analyses together with calculated enrichment factors indicate that ex-Sibenik’s ferro-manganese smelter caused the severe heavy metal pollution of its surroundings which is still visible thirteen years after the production was ceased. Iron was the main component of metallurgical slag deposited near the smelter. Slag material was highly enriched in Zn, Cr, Cu, Co and Pb. V and Cr were enriched in the soil taken near the smelter approximately by a factor of two, Pb and Cu were increased fivefold whereas the mean content of Mn was about 130 times higher than the levels in background soil samples. Plot of factor 1 against factor 2, obtained by Principal component analysis, showed perfect separation of the samples taken in the vicinity of the smelter, slag material and normal background agricultural soil. Contrary to the results pointing on the low degree of leaching of heavy metals from soil, heavy metal uptake by vegetation growing on the contaminated soil was found to be significant. Perfect correlation (Canonical R = 0.992) was obtained between chemical composition of soil and vegetation samples taken from the same spots. The content of Mn was approximately 36 times higher in vegetation taken from the vicinity of the smelter compared to the background values.
585

EXTENDED SYNOPSIS IAEA-CN-118/132P
TOPIC: CONTAMINANTS IN THE ENVIRONMENT
1
Study of the Pollution of Tropical Lagoon (Côte d’Ivoire Lagoon) System by Measuring Organochlorine Compounds in Oysters
S. Ouffoue Koffia, A. Ahibo Coffya, G. Morelb, D. E. Sessc, Y. T. N’guessana
a Laboratoire de Chimie Organique Structurale – UFR-SSMT, Université de Cocody, 22 BP 582, Abidjan 22, Ivory Coast
bWater Quality Institute (VKI), Danish Hydrology Institute (DHI), Agern 5, DK-2970 Horholm, Denmark
c Laboratoire Central des études Environnementales (LCE) du Centre Ivoirien Antipollution (CIPAOL), 20 BP 650 Abidjan 20, Ivory Coast
E-mail address of main author: [email protected]
The lagoon system of Côte d’Ivoire (Ebrié, Bia, Lahou) with 1200 km2 area, is the one of the most important in west Africa. The Ebrié lagoon is the main hydrology network of Abidjan and its suburbs (Fig. 1). So it constitutes the receptacle of all kind of various origins effluents [1]. Covering an area of 566 km2, it stretches all along the Guinean Gulf between 3°40’ and 4°50’ West at the latitude of 5°20’ North. In the context of national quality water assessment, a study of chemicals pollutants has been carried out on 11 stations along the lagoon system of Côte d’Ivoire. We were interested in organochlorine pesticides and PCB stored in oysters living in the lagoon bottoms.
The samples taken in different stations have been extracted with hexane and purified on column of florisil deactivated at 5% at chemical treatment. Then the analysed is made by CPG/ECD [2].
Our study shows the presence of compounds wastes such as the lindane, the heptachlor, the dieldrin, the endrin, the two metabolites of the DDT (PP’DDD and PP’DDE) and PCBs.
The use of the ACP (Fig. 2) has permitted to highlight the highest stations of contamination that are those of Abidjan, the main industrial and urban zones (PCB:15-227 ng/g, DDT + DDD+DDE: 1.7-130ng/g).
The use of variation of organochlorines compounds in oysters in time shows that contamination is reduced. Even if concentration still remain are important level. The contamination is representing acute and chronic poisoning for aquatic organisms and for humans [3].
586

S. Ouffoue Koffi et al.
2
FIG. 2. PCA score plot for Factor 1 and Factor 2 for contaminants measured in oysters taken on the bottom of lagoon system of Côte d’Ivoire. STATGRAPH plus4./SIGMA plot.
[1] KOUASSI, A.M., KABA, N., METONGO, S., Land-based sources of pollution and environment quality of the ebrie lagoon waters, Mar. Poll. Bull. 30 5 (1995) 295-300.
[2] VILLENEUVE, J.P., Course of determination of organochlorine pesticides and hydrocarbon petroleums in environmnement; AIEA/MEL/MESL September 1996.
[3] SEBASTIEN, O.K., AHIBO, C.A., MOREL, G., SESS, E.D., NGUESSAN Y.T., Study of pollution of tropical lagoon (Ebrié lagoon) by measuring the orgnochlorine compounds), J. SOC. Ouest-Afr. Chim. 015 (2003) 23-35.
ST11
ST8
ST9ST10
Zone of Abidjan : 7 stations (Bietry ST1, Banco ST2, Cococdy ST3, Marcory ST4,Hôtel golf. ST5 Parc a bois ST6, Adiopodoumé ST7)
Scatter Plot
Factors 1 (32.8%)
-4 -2 0 2 4 6
-4
-3
-2
-1
0
1
2
3
4Factors 2 (23.4% )
Plot of Factor Loading
-1,0 -0,8 -0,6 -0,4 -0,2 0,0 0,2 0,4 0,6 0,8 1,0 1,2
-0,8
-0,6
-0,4
-0,2
0,0
0,2
0,4
0,6
0,8
1,0 Factors 2(23.4%)
Factors 1 (32.8%)
Lindane
Endrine
Heptachlore
DieldrineDDT
PCB
BiétryBancoCocodyMarcoryH.GolfP.BoisAdiopo.Bingerv.NjemG.LahouAssinie
Graphe of coefficients :variables
Graphe of scores : distribution of samples
FIG. 1. Map of the lagoon system of Côte d’Ivoire: Location of selected stations for sampling oysters (during 1992 - 2002).
587

EXTENDED SYNOPSIS IAEA-CN-118/133P
TOPIC: CONTAMINANTS IN THE ENVIRONMENT
1
Arsenic Accumulation by Ferns from the Iron Quadrangle, Minas Gerais, Brazil
H. E. L. Palmieria, H. A. Nalini Jr.b, M. Â. de B. C. Menezesa, J. B. S. Barbosaa, J. dos S. J. Pereiraa, L. V. Leonela
a Nuclear Technology Development Centre/ National Commission for Nuclear Energy (CDTN/CNEN) Belo Horizonte, Minas Gerais, Brazil
bFederal University of Ouro Preto, Geological Department, Ouro Preto, Minas Gerais, Brazil
E-mail address of main author: [email protected]
The Iron Quadrangle, located in the Brazilian state of Minas Gerais, is considered one of the richest mineral-bearing region in the world [1, 2]. It is well known for the occurrence of iron and gold ores. A great number of active and ancient gold mines can be found in this region. The gold ore is rich in arsenic with the As/Au ratios ranging from 300 to 3000 [3]. In the past companies produced As-oxide as a byproduct in Nova Lima and Passagem de Mariana regions. Dressing materials were usually stored along the rivers or simply thrown in the drainage (e.g. Carmo river in Passagem de Mariana). Nowadays, big dams have been built to store the tailings and the effluents are being treated according to environmental regulations [3]. Ma et al. [4] and Francesconi et al. [5] have demonstrated that the fern species, Pteris vittata and Pityrogramma calomelanos are arsenic hyperaccumulate plants and recommend them for use in the remediation of arsenic-contaminated soils. These species were suggested for phytoremediation due to their high bioaccumulation factors, short life cycle, high propagation rates, wide distribution, large shoot mass and their ability to tolerate high arsenic concentrations in soils [6]. Phytoremediation, an emerging plant-based technology for the removal of toxic elements from the soil and water has been receiving renewed attention. The aim of this work was to evaluate the uptake of arsenic by the ferns Pteris vittata and Pityrogramma calomelanos collected in an area of the Iron Quadrangle that might be suffering influence from contaminated arsenic waste from old gold mines. These ferns are commonly found in this region. Fern samples and the soil within the root mass were collected in February and March 2003. The samples (Pteris vittata) were divided into leaves and rhizoids. The leaves and rhizoids were washed thoroughly with tap water, rinsed with deionized water and sliced in small pieces. After freeze dried, the samples were ground and sieved (< 5 mm) to be analyzed. The soil samples were air-dried, sieved and the finest–grains < 250 mesh, consisting of silt and clay, were used for analysis.
Arsenic concentration in the soil and fern tissue was determined using neutron activation analysis (NAA) specifically the k0-standardization method and the energy dispersive spectrometry technique (EDS). A KEVEX RAY with Am241 as photons source, was used. The
588

H. Palmieri et al.
2
irradiation was performed in the reactor TRIGA MARK I IPR-R1 at CDTN, at 100 kW, under a thermal flux 6.6 1011 neutrons. cm-2 s-1. The gamma spectroscopy was performed in a HPGe detector 15% of efficiency. The gamma spectra were obtained and evaluated by HyperLab PC software and the concentration calculated using the KAYZERO/SOLCOI software.
As shown in Table I, the results obtained confirm literature data. The ferns Pteris vittata and Pityrogramma calomelanos actually extract arsenic from the soil and translocate it into its fronds with higher arsenic concentration in the leaves than in the rhizoids. The highest value of arsenic was found in the soil and ferns collected at site 04. In the past this region was the local where waste from the Passagem de Mariana mine used to be thrown.
Further studies on arsenic accumulation by these ferns are necessary to evaluate the use of the phytoremediation in Brazilian arsenic-contaminated soils.
TABLE I. ARSENIC CONCENTRATION IN SOIL AND FERN TISSUE
Site UTM coordinates Sample Arsenic (µg g-1 dry mass)
Soil 12 Pteris vittata (rhizoid) 55 01 676 762 / 7 749 122 Pteris vittata (leaves) 102
Soil 12 Pteris vittata (rhizoid) 263 02 658 496 / 7 755 208 Pteris vittata (leaves) 373
Soil 100 Pteris vittata (rhizoid) 128 03 658 395 / 7 755 080 Pteris vittata (leaves) 202
Soil 957 Pteris vittata(leaves) 2585 04 663 945 / 7 746 302
Pityrogramma calomelanos (leaves) 1710
[1] BRAZIL GOLD’91 – The economics, geology, geochemistry and genesis of gold deposits. Proceedings...Symposium Brazil Gold’91, 13 – 17 May 1991, Belo Horizonte.
[2] MATSCHULLAT, J., BORBA, R.P., DESCHAMPS, E., FIGUEIREDO, B.R., GABRIO, T., SCHWENK, M., Human and environmental contamination in the Iron Quadrangle, Brazil, Appl. Geochem. 15 (2000) 181-190.
[3] BORBA, R.P., Arsênio em ambiente superficial: processos geoquímicos naturais e antropogênicos em uma área de mineração aurífera. PhD Thesis, State University of Campinas, Geoscience Institute, São Paulo (2002).
[4] MA, L.Q., KOMART, K.M., TU, C., ZHANG, W., CAI, Y., KENNELLY, E.D., A fern that hyperaccumulates arsenic, Nature 409 (2001) 579.
[5] FRANCESCONI, K., VISOOTTIVISETH, P., SRIDOKCHAN, W., GOESSLER, W., Arsenic species in a hyperaccumulating fern, Pityrogramma calomelanos: a potencial phytoremediator of arsenic-contaminated soils, Sci. Tot. Environ. 284 (2002) 27-35.
[6] VISOOTTIVISETH, P., FRANCESCONI, K., SRIDOKCHAN, W., The potential of Thai idigenous plant species fort he pytoremediation of arsenic contaminated land, Environ. Poll. 118 (2002) 453-461.
589

EXTENDED SYNOPSIS IAEA-CN-118/134P
TOPIC: CONTAMINANTS IN THE ENVIRONMENT
1
Microbial Contamination of Groundwater in Chennai, India
R. Ramanibai
Department of Zoology, University of Madras, Chennai – 600025, India
E-mail address of main author: [email protected]
A survey of groundwater quality in Chennai, Tamilnadu, India showed that some drinking water wells were consistently contaminated with bacteria. The aim of this study was to identify susceptible wells and if possible to provide remedial measures. During 2003 the Chennai city recorded poor rainfall (738 mm as against the normal 1267 mm). The third lowest recorded in the past 100 years, which in turn might have influenced the groundwater table. The study carried out during late 2003 and early 2004 assessed the microbial quality of groundwater collected from bore-wells whose depth ranged between 22 ft and 60 ft. in a densely populated area of Chennai. To assess the microbial load, indicator parameters, viz. heterotrophic plate count, total coliform count, faecal coliform count and faecal streptococci count were studied. Overall, faecal coliform counts were higher than faecal streptococci count. This indicates that the source of contamination may be from human origin. The highest load of faecal coliform load was 1000 organisms/100 ml. Bacterial indicators are distributed throughout North Chennai but their distribution was not uniform. The rainfall during the sampling period was meagre. This study shows that the groundwater quality deteriorated rapidly when contaminated by bacterial populations. Apart from poor rainfall, improper method of sanitation may also boost bacterial contamination
590

EXTENDED SYNOPSIS IAEA-CN-118/135P
TOPIC: CONTAMINANTS IN THE ENVIRONMENT
1
Mercury in Aquatic Environments of Nahuel Huapi National Park, Patagonia, Argentina1
S. Ribeiro Guevaraa, M. Arribére a, D. Bubacha, P. Viglianob, A. Rizzoa, R. Sáncheza, S. Pérez Catána
a LAAN, Centro Atómico Bariloche, Comisión Nacional de Energía Atómica, Argentina
bGrupo de Evaluación y Manejo de Recursos Ícticos, CRUB, UNC, Argentina
E-mail address of main author : [email protected]
Hg contents were determined in abiotic and biotic compartments of five lakes of Nahuel Huapi National Park, Patagonia, Argentina. Historically, this area was mostly protected from anthropogenic heavy metal contamination due to its remoteness, low population density and access difficulty. National Parks within the region also provided additional protection for whole or specific parts of particular watersheds. Even though no local source was identified, rather high Hg concentrations were measured in suspended load collected from lake Nahuel Huapi in previous work [1]. The water bodies studied were lakes Nahuel Huapi, Moreno, Escondido, Espejo Chico, and Traful, the latter chosen as a reference lake. Hg concentration profiles of short sediment cores, dated by 210Pb and 137Cs techniques, were analyzed by INAA, as well as suspended load collected from three sites of lake Nahuel Huapi. Water samples were collected from the surface (1-3 m depth) and at 30 m depth (1m above the sediment) at lake Nahuel Huapi, and Hg concentrations were determined in unfiltered samples by CVAFS. The biota studied was the native mussel Dip lodon chilensis (digestive gland and total soft tissues pooled samples) and five species of fish, two native and three introduced (liver and muscle pooled samples). Hg contents were determined by INAA.
Hg concentration profiles of sediment cores sampled from sites with higher productivity (OM contents of upper most layer ranging from 17 to 24%) showed a peak at 1 to 2 cm below lake bottom, with concentration values ranging from 0.6 to 2.8 µg.g-1, revealing modifications of Hg inputs in recent times. The water body studied with lower productivity (6 % organic matter contents) does not show this peak in the concentration profiles, and Hg contents range from 0.2 to 0.3 µg.g-1 in upper core layers. Two background levels were determined from deep layers measurements; the lower associated with pre- industrial time according to core dating, ranging from less than 0.07 to 0.2 µg.g-1, and the other associated with modern times, ranging from 0.1 to 0.3 µg.g-1. Hg flux to core sediments was computed when relevant enrichment in upper core layers over background was observed. Hg fluxes to core sediments ranged from 30 to 110 µg.m-2.y-1. Hg contents of suspended load ranged from 1 to 7 µg.g-1. Hg contents of water samples from lake Nahuel Huapi were higher near Bariloche city (0.1 to 1 µg.l-1) most relevant human settlement in the region with 100000 inhabitants, and near La Angostura village (up to 0.6 µg.l-1), while other lake sites ranged from less than 0.01 to 0.2
1 This work was performed within IAEA Technical Co-operation Project ARG/7/006 “Investigation of mercury and other heavy metals in water bodies of Nahuel Huapi National Park, Argentine Patagonic Andean Range. Base lines determinations, trophic web pathways investigation and contamination source identification”
591

S. Ribeiro Guevara et al
2
µg.l-1, suggesting that human activities in the region are a local source of Hg to the aquatic environment.
Hg highest concentration values measured in total soft tissues pooled samples from lakes Nahuel Huapi and Moreno, were found to be similar to those observed in some Hg contamination situations, ranging from 0.5 to 0.9 µg.g-1 dw, and 3 to 5 times higher than reference samples collected in lake Traful. No correlation was observed between Hg concentration in digestive gland and total soft tissues. Hg in total soft tissues is considered to be more representative of Hg mussel content distribution in the lakes studied. Hg contents in fish liver and muscle tissues are higher than those expected for pristine lakes, however the values are not unusual in remote lakes (Hg concentration in liver pooled samples ranged from 0.06 to 4 µg.g-1 dw, and concentrations in muscle ranged from 0.07 to 2.5 µg.g-1 dw). The most remarkable result is that no bio-magnification phenomena were observed.
[1] RIBEIRO GUEVARA, S., MASSAFERO, J., VILLAROSA, G., ARRIBÉRE, M., RIZZO, A., Heavy metal contamination in sediments of Lake Nahuel Huapi, Nahuel Huapi National Park, Northern Patagonia, Argentina, Water, Air, Soil Poll. 137 (2002) 21-44.
592

EXTENDED SYNOPSIS IAEA-CN-118/136P
TOPIC: CONTAMINANTS IN THE ENVIRONMENT
1
A New 202Hg Isotopically Enriched Methylmercury Spike Material with SI-traceable Reference Values for Isotope Dilution Measurements in Biological and Environmental Samples
J. P. Snell, C. R. Quétel
Institute for Reference Materials and Measurements, Joint Research Centre - European Commission, Retieseweg 111, B-2440 Geel, Belgium.
E-mail address of main author: [email protected]
HgO enriched in 202Hg was used for the preparation of a solution of 202Hg enriched CH3Hg. The CH3HgCl was synthesised by reaction with a Grignard reagent and a subsequent comproportionation reaction between dimethylmercury, (CH3)2Hg, and HgCl2, that was optimised to give a high yield of the product, pure from other Hg species and by-products of the synthesis reaction. To prepare the CH3HgCl for use as an IDMS spike, it was dissolved in 2 % ethanol. The spike was thereby maintained in a relatively reactive form without solution preservatives that might alter its chemical behaviour compared to incipient CH3Hg in a sample. Aliquots were sealed in quartz ampoules and a 1-year stability study was undertaken by storing a series of ampoules under different temperature conditions to all be measured on the same occasion (an isochronous study) and by retaining a portion of the solution in a closable bottle under recommended storage conditions, with measurements at 3-month intervals.
The Hg amount content in the form of CH3Hg was obtained by subtraction of the inorganic Hg amount content (determined by gas chromatography inductively coupled plasma mass spectrometry, GC-ICP-MS) from the total Hg amount content (determined by blending with IRMM-639, a natural Hg isotopic certified reference material, ICRM, and isotope dilution mass spectrometry of the digested material). Only CH3Hg and inorganic Hg were detectable in the reference material with inorganic Hg in <2 % of the total amount. GC-ICP-MS was also used to confirm that the isotopic composition of Hg in the form of CH3Hg was identical to that of IRMM-640, an inorganic Hg ICRM prepared from the same 202Hg enriched HgO, within enlarged uncertainty statements. These processes allowed the SI-traceable certification of both the amount content of CH3Hg and its isotopic composition, accompanied by combined uncertainty statements estimated according to ISO/GUM.
The final uncertainty on the Hg amount content in the form of CH3Hg (3.5 % relative, k=2) included a contribution covering for potential changes over 2 years of shelf- life. No degradation of the CH3Hg content or isotopic composition was statistically observable over the storage period, so this contribution was extrapolated from the uncertainty in measurement repeatability of the isochronous study.
Ampoules are now available for distribution as an ICRM, named IRMM-670, with the certified reference values listed in the table.
593

J. Snell and C. Quetel
2
Material : CH3202HgCl in 2 % ethanol/water
amount content Certified value Uncertainty 1
mol (CH3(202Hg)Cl) · g-1 171.0 · 10-9 6.1 · 10-9
mol (CH3HgCl) · g-1 175.1 · 10-9 6.2 · 10-9
isotope amount ratios of Hg in the form of CH3HgCl Certified value Uncertainty 1
n(196Hg)/n(202Hg) 0.000 018 0.000 013
n(198Hg)/n(202Hg) 0.000 623 0.000 050
n(199Hg)/n(202Hg) 0.001 603 0.000 096
n(200Hg)/n(202Hg) 0.005 50 0.000 22
n(201Hg)/n(202Hg) 0.013 35 0.000 53
n(204Hg)/n(202Hg) 0.002 60 0.000 16
molar mass of Hg in the form of CH3HgCl Certified value Uncertainty 1
g · mol-1 201.944 66 0.000 76
1) All uncertainties are expanded uncertainties, with a coverage factor, k = 2
594

EXTENDED SYNOPSIS IAEA-CN-118/137P
TOPIC: CONTAMINANTS IN THE ENVIRONMENT
1
Basic Experimental Research for the Reconstruction of Water Purification System Using Soil - Sorption Isotherm of Fulvic Acid and Phosphate Ion for Selected Materials under Different pH
M. Sugaharaa, Y. Fujikawab, R. Imadaa, H. Ozakia, G. Prasaia, T. Hamasakia
a Osaka Sangyo University (OSU), Daito-shi, Osaka 574-8530, Japan
bKyoto University Research Reactor Institute (KURRI), Kumatori, Osaka 590-0494, Japan
E-mail address of main author: [email protected]
A series of sorption experiments was conducted for the establishment of water purification technique using soil and the other materials as a sorbent. Materials that showed comparatively high sorption of dissolved organic matter (DOM) and phosphate ion were selected among more than 100 soil and sludge samples collected from Japan, based on the results of batch sorption experiment using fulvic acid (FA hereafter) and phosphate ion as sorbate (Table 1). Materials that had high FA sorptivity were rarer than those with high phosphate ion sorptivity. Sorption isotherm of phosphate ion and FA was obtained for the selected sorbent under different pH conditions.
Table 1 Materials from Japan that showed high sorption of fulvic acid and phophate ionHigh sorption of fulvic acid High sorption of phosphate ion
apatite (reagent) volcanic ash soil (subsoil from Amagase, Oita)calcium phsophate (reagent) volcanic ash soil ( 'Akadama soil' from
deeper layer, Tochigi)Andosol (Koga, Shiga) volcanic ash soil (fine grained 'Kanuma soil',
from Tochigi)charcoal made out of wood silt from Sakishima, Osaka
volcanic ash soil ('Akadama soil' fromTochigi)
vocanic ash soil ('Shirasu' from Kagoshima)
Andosol (Santo, Shiga) sludge from water treatment plant in Shigasludge from a WTP in Shiga calchium phosphate (reagent)
limonite (goethite from Kumamoto) limonite (goethite from Akamizu, Kumamoto)goethite (Gifu) Andosols from Santo, Shiga
charcoal made out of bamboo sludge from water treatment plant in Shigavolcanic ash soil (Andosol from Ibaragi) coal fly ash mixed with gypsum
bentonite Andosols from Mt. Sanbe, Shimane
The obtained sorption isotherm parameters are shown in Tables 2 and 3. The results could be summarized as follows: (1) sorption of fulvic acid could be approximated by linear isotherm (Langmuir isotherm) when the amount of DOM sorbed was < 103 mg-organic carbon/kg-soil (104 mg-organic carbon/kg-soil), (2) sorption of phospha te ion could be described by linear isotherm (Freundlich isotherm) when the amount of phosphorus sorbed was < 103 mg-P/kg-soil (< 104 mg-P/kg-soil), (3) sorption of fulvic acid and phosphate ion varied with pH of the soil solution, (4) Kd (slope of the linear sorption isotherm) of FA was smaller at higher concentration of fulvic acid. Obviously, the type of soil used, and pH and the concentration of
595

M. Sugahara et al.
2
the sorbate in the water to be treated significantly influences the performance of the soil percolation sys tem regarding the removal of pollutants in dissolved form.
Table 3 Sorption isotherm parameters obtained from the experiment (sorbate: phsophate ion)
sample name pH T-P sorbedmg-P/kg *1
Kd (mL/g) ofphosphate ion
k *2 n *2
limonite 3.8 <1.2× 10² 230.7 - -Andosol (Hiroshima) 6.2 <3.8× 10³ 286.7 - -
Akadama soil (Tochigi) 6.3 <3.6× 10³ 3347.7 - -Kanuma soil (Tochigi) 7.1 <2.9× 10³ 621.3 - -Andosol (Hiroshima) 5 <9.4× 10³ - 2.3×10³ 0.40Andosol (Hiroshima) 6.3 <8.4× 10³ - 1.5×10³ 0.38Andosol (Hiroshima) 7.5 <7.0× 10³ - 9.6×10² 0.42
Akadama soil (Tochigi) 5.5 <6.9× 10³ - 2.2×10³ 0.36Akadama soil (Tochigi) 6.5 <7.0× 10³ - 1.3×10³ 0.36Akadama soil (Tochigi) 7.5 <6.5× 10³ - 1.7×10³ 0.30Kanuma soil (Tochigi) 5 <9.7× 10³ - 2.4×10³ 0.34Kanuma soil (Tochigi) 6.8 <6.2× 10³ - 8.6×10² 0.40Kanuma soil (Tochigi) 7.5 <5.2× 10³ - 8.3×10² 0.38
*1 the observed range of the amount of solute sorbed by the sorbent
*2 Parameters of Freundlich isotherm q=kcn where q is the amount of solute sorbed per unit mass of sorbent, c is the concentration of solute in the liquid phase at sorption equilibrium.
Table 2 Sorption isotherm parameters obtained from the experiment (sorbate: fulvic acid)
sample name pH DOM
sorbed mg-OC/kg *1
Kd (mL/g) offulvic acid qm
*3 b *3
charcoal 7.8 < 900 443.9 - -apatite (reagent) 7.5 <1.1× 10⁴ 54.8 - -
limonite 6 <900 53.8 - -Andosol (Santo, Shiga) 6 <900 14.7 - -Andosol (Hiroshima) 6.4 <10× 103 54.3 - -
Akadama soil (Tochigi) 6.5 <10× 103 141.2 - -Kanuma soil (Tochigi) 6.5 <10× 103 104.1 - -Andosol (Hiroshima) 5.2 <1.1× 10⁴ (28.3)*2 1.4×10⁴ 0.013Andosol (Hiroshima) 6.9 <4.0× 10³ (8.8)*2 - -Andosol (Hiroshima) 7.2 <9.7× 10³ (17.8)*2 1.4×10⁴ 0.008
Akadama soil (Tochigi) 5.3 <1.9× 10⁴ (62.9)*2 2.0×10⁴ 0.63Akadama soil (Tochigi) 7.2 <1.6× 10⁴ 49.3 - -Akadama soil (Tochigi) 7.5 <1.5× 10⁴ (46.7)*2 2.0×10⁴ 0.018Kanuma soil (Tochigi) 5 <1.5× 10⁴ (36.3)*2 1.7×10⁴ 0.05Kanuma soil (Tochigi) 7.1 <1.0× 10⁴ (24.8)*2 1.4×10⁴ 0.008Kanuma soil (Tochigi) 7.7 <1.1× 10⁴ (34.8)*2 2.0×10⁴ 0.005
*1 the observed range of the amount of solute sorbed by the sorbent *2 slope of the quasilinear isotherm*3 Parameters of Langmuir isotherm q=qmbc/(1+bc) where q is the amount of solute sorbed per unit mass of sorbent, c is the concentration of solute in the liquid phase at equilibrium.
596

EXTENDED SYNOPSIS IAEA-CN-118/138P
TOPIC: CONTAMINANTS IN THE ENVIRONMENT
1
A Survey of Metal Pollution in Mussels Mytilus galloprovincialis (L.1758) from Northern Coast of Turkish Aegean Sea
U. Sunlu
Ege University, Faculty of Fisheries, Department of Hydrobiology, Bornova-Izmir, Turkey
E-mail address of main author: [email protected]
Marine organisms generally, mussels and benthic fish are selected as suitable indicator species of coastal pollution, as they give complementary information on chemicals bio-available in the water column and sediments, respectively. Bioaccumulation patterns of the different pollutants vary substantially among species. Habitat, season and food web play a key role on the bioaccumulation process. Filter feeder organisms accumulate most of the pollutants at more higher levels than those found in water column so that they permit to reflect the quality of coastal environments. Mediterranean mussels Mytilus galloprovincialis (L.1758) have criteria of ideal bio-monitors as sedentary and easy to sample over Mediterranean coastal zones[1, 2].
The aim of this study was to investigate the present status of the distribution of heavy metal levels in economically important bivalve from Northern coast of Turkish Aegean Sea.
The mussels were collected by hand on rocks along the coastal zones at 5 sampling locations during the period of November 2002-April 2003. The 5 sampling stations are shown in Fig. 1.
All samples transported daily to the laboratory. Edible soft tissues of mussels were removed from the shells on the day of sampling and were kept at frozen at –30°C until the analysis.
597

U. Sunlu
2
The collected mussels were divided in two groups according to their size (small size 3-4 cm. and big size 7-8 cm.).The composite samples of soft mussel tissues were wet–ashed by nitric and percloric acid. Solutions of tissues were analysed by 2380 Perkin–Elmer AAS. Inter-calibration homogenate sample (IAEA –142/ TM) was used as a quality control for the analytical methodology [3].
The concentrations of some heavy metals (Pb, Cu, Zn) in the soft tissues of M. galloprovincialis were determined separately from different regions of Northern Turkish Aegean Sea. The Average levels of heavy metals in mussels are given in Table I.
TABLE I. THE AVERAGE CONCENTRATIONS OF SOME HEAVY METALS IN M. GALLOPROVINCIALIS FROM DIFFERENT REGIONS OF NORTHERN TURKISH AEGEAN SEA (µGG-1 WET WEIGHT)
Stations Pb Zn Cu Ayvalik (1) 0.40 ± 0.04 18.22± 0.61 0.95± 0.09 Candarli (2) 0.60± 0.03 25.60± 1.87 1.50± 0.18 Homa (3) 1.40± 0.14 22.59± 1.77 1.60± 0.15 Inciralti (4) 1.70± 0.17 35.45± 4.21 1.82± 0.21 Urla Iskele (5) 0.80± 0.08 20.15± 1.20 1.45± 0.10
It can be seen from the table that there are significant differences in metal concentrations according to the localities. The maximum heavy metal concentrations measured in station 4. In this station, a dominant source of metal concentration is from urban and industrial activities Station 2 and 3 are affected by the heavy polluted rivers (Gediz and Bakircay) For each sampling location the highest concentrations of heavy metals was found in small size mussels while the smallest concentrations were found in big size mussels. An inverse relationship metal concentration and animal size.
Concentrations of lead, copper and Zinc in mussels collected in the Northern Turkish Aegean Sea coast are of the same order of magnitude as those which were reported fo r other places in this area of the Mediterranean Sea [2-5].
[1] PORTE, C., ALBAIGES, J., Spatial and Temporal Trends in the Distribution of Contaminants and Their Biological Effects in the NW Mediterranean, Med. Mussel Watch Workshop Document (2002) 57-58.
[2] UGUR, A., YENER, G., BASSARI, A., Trace Metals and 210Po (210Po) Concentrations in Mussels (Mytilus galloprovincialis) Consumed at Western Anatolia, Appl. Rad. Isotop. 57 (2002) 565-571.
[3] BERNHARD, M., Manual of Methods in Aquatic Environment Research, FAO Fisheries Technical Paper FIRIT/T 158 (1976) 1-123.
[4] VEGLIA, A.A., Survey of Heavy Metals in Mussels (Monaco 1989-1996), IAEA-TECDOC-1094, IAEA, Vienna (1998) 593-595.
[5] SUNLU, U., Comparison of Heavy Metal Levels in Native and Cultured Mussel Mytilus galloprovincialis (L.1758) from The Bay of Izmir (Aegean Sea-Turkey), Med. Mussel Watch Workshop Document (2002) 69-72.
598

EXTENDED SYNOPSIS IAEA-CN-118/139P
TOPIC: CONTAMINANTS IN THE ENVIRONMENT
1
Distribution and Relationship of Mercury, Lead and Cadmium in Selected Tissues of Pagellus erythrinus from the Aegean Sea
E. Uluturhan, F. Kucuksezgin
Dokuz Eylul University, Institute of Marine Sciences and Technology, Inciralti, 35340 Izmir, Turkey
E-mail address of main author: [email protected]
Among the more dangerous pollutants are the so-called heavy metals introduced into marine environment by waste and sewage. Fish are widely used as sentinels of contamination in aquatic environmental. The study area extends from Edremit Bay in the north to Fethiye in the southeastern Aegean. The present environmental problems are due to unmanaged shipping activity, river run-off and untreated sewage discharge by coastal settlements, dumping of toxic and industrial wastes from the western part of Turkey. Red Pandora (Pagellus erythrinus) is very important commercial species and is most consumed ones, so it is selected in this study. Fish tissues (muscle, liver) are commonly used as indicators of degree of contamination of marine environment with metals. [1, 2] studied metal concentrations in selected marine fishes in the Aegean Sea.
FIG. 1. Location of sampling stations in the Aegean Sea.
Biota samples were collected by trawling from sampling stations in May 1996, September 1997, January and July 1998. Biota tissue is digested in microwave digestion system. All the analyses are performed by atomic absorption spectrophotometer. Hg is measured by cold vapour technique, Cd, Pb are determined by graphite furnace. Intercalibration fish homogenate samples (from IAEA, Monaco) were used as a control for the analytical methods. Statistical analysis was performed using Statistica software.
The mean concentrations and standards errors of metals are summarized in Table I. The concentrations found in muscle and liver tissues varied, with Hg ranging from 16-716 and
599

E. Uluturhan and F. Kucuksezg in
2
125-5451, Cd ranging from nd-9.6 and 1.4-2245, Pb ranging from nd-1397 and nd-8311 µg kg-1, respectively. There are no significant correlations between fork lengths and metal concentrations.
TABLE I. RANGE AND MEAN±STANDARD ERROR VALUES OF THE HEAVY METAL CONCENTRATIONS IN MUSCLE AND LIVER OF RED PANDORA (mg/kg WET WEIGHT)
May-1995 September 1997 Mean Min-Max Mean Min-Max
Hg Ma: 302±68 148-716 M: 201±38 39-616 Cd M: 1.7±0.30 0.61-3.2 M: 2.6±0.67 nd-9.6 Pb M: 71±18 27-152 M: 278±90 15-1397
January-1998 July-1998 Mean Min-Max Mean Min-Max
Hg Ma: 259±22 Lb: 1064±162
52-680 125-5451
M: 154±22 L: 643±95
16-403 172-2057
Cd M: 1.1±0.14 L: 796±85
0.2-5.9 45-2245
M: 1.6±0.41 L: 204±28
nd-8.8 1.4-743
Pb M: 136±26 L: 2657±281
nd-702 nd-8311
M: 110±23 L: 2007±408
nd-444 402-7964
a: muscle; b: liver
Concentration in muscle tissue differed significantly among season for Hg (p<0.05, F=3.93), is showed that levels in July differed significantly from January. Mercury is showed that levels at Göcek (9) differed significantly from Izmir Bay (3) and Kusadasi (5). The One-way ANOVA test showed the statistically significant seasonal differences for Cd (p<0.05, F=13.31) and January is different from July in liver tissues. The significant differences among stations are found for the concentrations of Hg (p<0.05, F=3.76), Kusadasi (5) is different from Didim (6), Gökova (7), Marmaris (8), Göcek (9). In consequence, the comparison of muscle concentrations of metals, demonstrate that, there are significant (p<0.05) seasonal variations. For liver, there are significant (p<0.05) seasonal variations for Cd and regional variations for Hg and Pb in muscle and liver.
The levels of Hg and Cd are ranged 53-805 and 4-80 µg/kg in muscle of Red Pandora in the eastern Mediterranean [3]. Mercury levels are similar to eastern Mediterranean but cadmium level is lower than this region in this study. The levels of Hg, Cd and Pb are varied 50-280, 10-51 and 50-350 ng g-1 in the western Mediterranean [4].
[1] BEI, F., CATSIKI, V.A., PAPATHANASSIOU, E., Copper and cadmium levels in fish from the Greek waters (Aegean and Ionian Seas), Rapp. Comm. Int. Mer Medit. 33 (1992) 167.
[2] KUCUKSEZGIN, F., ALTAY, O., ULUTURHAN, E., KONTAS, A., Trace metal and organochlorine residue levels in red mullet (Mullus barbatus) from the Eastern Aegean, Turkey, Water Res. 35 9 (2001) 2327-2332.
[3] HORNUNG, H., KRESS, N., Trace elements in offshore and inshore fish from the Mediterranean coast of Israel, Toxicol. Environ. Chem. 31-32 (1991) 135-145.
[4] PASTOR, A., HERNANDEZ, F., PERIS, M.A., BELTRAN, J., SANCHO, V., CASTILLO, M.T., Levels of heavy metals in some marine organisms from the Western Mediterranean area (Spain), Mar. Poll. Bull. 28 1 (1994) 50-53.
600
EXTENDED SYNOPSIS IAEA-CN-118/140P
TOPIC: CONTAMINANTS IN THE ENVIRONMENT
1
Heavy Metals in Environmental Studies in Minas Gerais State - Brazil
M. A. R. V. Veadoa,b, A. H. Oliveiraa, C. K. B. Q. M. Oliveirab, S. F. Moreirac, R. A. Migueld, M. I. Severoe, I. A. Arantesf
a Researcher Profix/CNPQ, Brazil
bNuclear Engineering Department of the Federal University of Minas Gerais State – UFMG, Belo Horizonte, Brazil
c ICEX - Department of Physics of the Federal University of Minas Gerais State (UFMG)
dCenter of Nuclear Technology Development National - Committee of Nuclear Energy (CDTN/CNEN), Belo Horizonte, Brazil
e University Of Santa Cruz, Itabuna BA, Brazil
f Pontifical Catholic University of Minas Gerais (PUC), Brazil
E-mail address of main author: [email protected]
Intense mining activities in Minas Gerais State – Brazil bring out tons of waste to the environment. Considerable concentration of toxic elements penetrate the soil, ground waters and rivers. This endangers the environment quality not only in the surrounding areas but also occurs in ichthyofauna and in more distant areas of cattle raising and agricultural activities. After seasonal floods, veterinary clinic studies have shown that most animals raised in this region are affected by symptomatologic nervous diseases, still not clearly diagnosed, that suggests intoxication. These pathologies are mostly noted after floods. Instrumental Neutron Activation Analysis - INAA was applied to determine major and trace elements in environmental samples. The obtained results show that the contaminated water and sediment with heavy metals and toxic elements from the Das Velhas River upstream basin, the mining region, carry contamination to the ichthyofauna and farming region within a distance of approximately 400 km.
Key words: Trace elements, water, sediment, forage, fish.
601

EXTENDED SYNOPSIS IAEA-CN-118/141P
TOPIC: CONTAMINANTS IN THE ENVIRONMENT
1
Heavy Metals Contents in Some Fish Species of the Black Sea
V. L. Zubachenko, S. O. Omelchenko, G. V. Simchuk
Crimean State Scientific & Research Center of Standardization, Metrology and Certification, Simpheropol, Krymskaya Pravda st., 61, Crimea, Ukraine, 95000
E-mail address of main author: [email protected]
The effects of chemical contamination, including heavy metals and organic compounds in the Black Sea led negative ecological consequences. The main sources of heavy metals are the riparian and non-riparian industrial effluents from the ferrous and non-ferrous metallurgical enterprises, port zones and domestic waste waters. High concentrations of Cu, Pb, Zn, Cr, As are presented in the sewage discharging in the Black Sea ecosystem especially in the coastal zones [1]. These contaminants led very negative changes in living communities because they transferred in food chains and accumulated in marine organisms led their death, worsening of health and loss biodiversity [2].
The concentration levels of heavy metals Pb, Cd, Cu, Zn, As and Hg were studied in five fish species, including commercial ones, inhabited Sevastopol coastal zone (Crimea, Ukraine) in the period of the winter season 2004. The results of the analysis of fish samples are presented in Table I.
TABLE I. HEAVY METALS CONCENTRATIONS IN FISH SPECIES IN BLACK SEA COASTAL ZONE (mg per kg weight)
Fish species Cu Pb Cd Zn As Hg
Mesogobius bathrachocephalus 0.31 0.008 - 1.78 1.21 0.07
Trachurus mediterraneus 0.41 0.01 - 1.64 1.24 0.04
Scorpaena porcus 0.29 0.02 - 1.01 0.26 0.067
Merlangus merlangus euxinus 0.23 0.01 - 1.25 1.02 0.024
Mugil cephalus 0.049 0.01 - 2.33 0.52 0.015
It was shown that the heavy metals concentrations varied in different fish species, seasons and examined areas, which could be depended of environmental pollution. High concentrations of heavy metals in fish led negative effects for fish and human health. Thus the heavy metal concentrations level in fish could be applied for the evaluation of the marine pollution of different areas an for ecological risk estimation.
602

V. Zubachenko et al.
2
[1] RUDNEVA, I., "Impact of metallurgical industry on the coastal ecosystem of Black Sea countries", Approaches to Handling Environmental Problems in the Mining and Metallurgical regions, (FILHO, L., BUTORINA, I., Eds.), Kluwer Academic Publishers, Netherlands (2003) 27-33.
[2] MOISEENKO, T.I., Evaluation of ecological risk in the cases of metal pollution in water, Water Res. 26 2 (1999) 186-197 (in Russian).
603

SAMPLE EXTENDED SYNOPSIS IAEA-CN-118/142P
TOPIC: CONTAMINANTS IN THE ENVIRONMENT
1
Occurrence and Availability of Prioritary Compounds (Chlorinated Pesticides, Polybrominated Diphenyl Ethers, Alkylphenols and Heavy Metals) in Freshwater Sediments and Fish
S. Lacorte, E. Martínez, D. Raldúa, A. Navarro, D. Barceló
a Department of Environmental Chemistry, IIQAB-CSIC, Barcelona, Catalonia, Spain
E-mail address of main author: [email protected]
The aim of this work was to determine priority organic and inorganic compounds in river sediments and fish and to study their availability. Twelve organ chlorinated compounds (OC), 40 polybromodiphenyl ethers (PBDEs), 2 alkylphenols (nonylphenol and octylphenol) (AP), and 9 heavy metals (HM) were investigated in samples taken in 20 locations along the Ebro river, in north east Spain. Sediment samples represent a stable matrix which indicate recent pollution episodes, whereas fish samples are good sentinels to monitor bioavailability and bioaccumulation. Compound selection was based on their inclusion in European priority lists (Directives 76/464/CEE and 60/2000/EU). The study area covered the Ebro hydrographic basin which is the main tributary in Spain and flows through large agricultural areas characterized by wines, corn and maize and represents an important water source for the many industrial and urban activities settled along its course. To control the quality of the river basin, and in accordance with EU Directives, priority pollutants have been determined in sediment and fish to determine most ubiquitous compounds, geographical distribution and bioavailability of pollutants to two different fish species. For such purpose, different analytical methods were developed to analyse all the above mentioned chemical species in the upper 2 cm sediment layer and in whole fish (Barbus graellsii, Cyprinus carpio). Among compounds studied, hexachlorocyclohexane, pentachlorophenol, aldrin, dieldrin and isodrin, and trichlorobenzene were never detected. All samples contained organic pollutants at total levels between 134 and 3199 µg/Kg-dw and total HM from 60.9 and 5131 mg/kg-dw, depending on sample location. For 18 of the 20 samples points, a correlation of 0.53 was found between total organic and total inorganic concentration. In sediment samples, among the 4 chemical groups studied, HM were present at levels between 0.17 and 4036 mg/kg dry weight (dw), being Hg detected at a high concentration downstream from an important chemical industry and Cu, Pb and Zn showed highest levels at the river source and at the river outlet. It is relevant that octylphenol was found in the totality of sediments analysed at a concentration from 48.5 to 152.1 µg/kg-dw whereas nonylphenol was detected in 8 samples out of 18 analysed but at much higher concentration, from 160.6 to 3000 µg/kg-dw, being the levels highest in industrialized areas (in river source, close to Zaragoza city, in the industrialized area of Monzón and in the city of Tortosa). 2,4 and 4,4-DDT, DDD and DDEs were also detected in all sediments with total levels between 4.7 to 240.9 µg/kg-dw. In most locations, the levels of DDTs were higher than DDEs or DDDs, indicating a slow degradation or a still recent input. In other cases, only DDT was encountered. Highest levels were in the city of Tortosa, located just before the estuary and characterized by both agricultural and industrial activities. PBDEs were found in 16 samples at a concentration range between 0.04 and 20.9 µg/kg-dw, being the main congeners encountered BDE 47 and BDE 99, as reported in other sediment samples (1). In some locations, high levels of DDT were correlated also
604

S. Lacorte et al.
2
with high levels of PBDEs, indicating point source pollution of these two families of compounds.
Fish samples followed a similar picture as regards to the fact that all fishes contained levels of organic and inorganic compounds, as indicated in previous works (2). However, despite 2 species were collected from each site, no correlation was found between the levels of organic nor inorganic compounds, probably due to the fact that although they corresponded to the same trophic level, the biology is different. Among the organic compounds studied, hexachlorobenzene, DDT and metabolites, AP and PBDEs were detected. HM were detected at levels between 0.04 and 68.9 mg/kg ww, being in all cases lower than the levels found in sediments. Only in one site close to an industrial area, Hg was found at highest levels (up to 1.89 mg/kg-dw) and this correlated with high levels of hexachlorobenzene in the same fish (up to 169 µg/kg-dw). In contrast to sediment samples, OP was detected in only one sample at a level of 6.9 µg/kg-dw whereas NP was detected in 2 stations at levels from 74.5 to 146.4 µg/kg-dw. No correlation was found between AP levels in sediment and fish, indicating that sediments was not a source of AP to fish or that fish may metabolise such compounds.
On the other hand, total DDTs and total PBDEs, concentration was higher in fish than in sediment, with levels from 5.1 to 2447.4 µg/kg-dw for the former and between 0.1 and 218.5 µg/kg-dw for PBDEs. For total DDTs total PBDEs, good agreement was found among levels in sediment and in fish, indicating that these compounds can be bioaccumulated in freshwater fish. Fish with highest loads were situated close to big urban areas or with important agricultural activities.
It can be concluded that DDTs and PBDEs, which account for the more persistent organic compounds, have been encountered in practically all samples analysed and that levels in fish are higher than in sediment, indicating that sediment can be a drainage of persistent pollutants and a source to biota.
[1] LACORTE, S., GUILLAMON, M., MARTINEZ, E., VIANA, P., BARCELÓ, D., Occurrence and specific congener profile of 40 polybrominated diphenyl ethers in river and coastal sediments from Portugal, Environ. Sci. Techn. 37 (2003) 892-898.
[2] VIVES, I., GRIMALT, J.O., LACORTE, S., GUILLAMÓN, M., BARCELÓ, D., Polybromodiphenyl Ether (PBDE) Flame Retardants in fish from lakes in European high mountains and Greenland, Environ. Sci. Techn. 38 (2004) 2338-2344.
605

EXTENDED SYNOPSIS IAEA-CN-118/143P
TOPIC: CONTAMINANTS IN THE ENVIRONMENT
1
Basic Experimental Research for the Reconstruction of Water Purification System using Soil - Changes of Sorption of Fulvic Acid and Phosphoric Acid by Heating Processing
T. Hamasakia, Y. Fujikawab, R. Imadaa, M. Nagatomoa, M. Sugaharaa, H. Ozakia
a Osaka Sangyo University, Osaka, Japan
bResearch Reactor Institute, Kyoto University, Osaka, Japan
E-mail address of main author: [email protected]
Sorption ability of pollutants such as organic matters and nutrient salts is necessary to soils for water purification system. Sorption experiments were conducted on the sorption of fulvic acid (a form of humic substances, designated as FA hereafter) and phosphoric acid, promising soils and solid wastes were found for the system [1, 2].
These materials should have permeability and water resisting with keeping sorption ability of pollutants. For this reason, it is necessary to process into beads and strengthen against water flowing. However, FA sorption of some materials was blocked by processing into beads. The reason may be attributable to leaching of organic matter from a soybean extract as binder material added upon processing of the soil into beads [3].
The purpose of this study is to conduct an experiment of heating processing of promising materials for the system to confirm changes of FA and phosphoric acid sorption. Two volcanic soils (Akadama-soil and Kanuma-soil) discharged from manufacturing and four kinds of sludge from water treatment plants (hereinafter referred to as WTT) were preferred to promising materials. Two kinds of sludge of water source are grand water, two others are river water.
Heating Processing was conducted each material sieved under 2 mm diameter at 200, 400, 600, 880 and 1200 deg. C, 30 minutes in a muffle furnace.
The sorption experiment of heated and unheated materials was conducted at 25 deg. C in a dark place, at the solid to liquid ratio of 1: 2.5. The amount of added FA and phosphoric acid was equivalent to 33 mg/L DOC (dissolved organic carbon) and 2 mg/L T-P (total phosphorus).
Kd (sorption coefficient) was calculated as an index of sorption from the equation assuming linear sorption isotherm:
Kd=(V/m) ((Cb+C0)/C-1)
where C0 (mg/L) and C (mg/L) are the respective added and measured DOC (or T-P) concentrations in the liquid phase; Cb (mg/L) is the DOC (or T-P) concentration in the sample blank, and m (g) and V (L) respectively are the mass of sorbent and the volume of the solution in each flask.
606

T. Hamasaki et al.
2
The result of FA and phosphoric acid sorption is shown in the following figure. Most samples of both sorptions descend at 200 and 400 deg. C, and ascend at 600 deg. C. The reason may be concentration of organic matter which easy to liquate out are decreased by combustion at 600 deg. C, and organic matter is easy to liquate out by heating at 200 and 400 deg. C. WTT sludge of Osaka North and Osaka South is sourced from grand water, unheated and 600 deg. C of their FA sorption are higher than FA sorption of sludge of Aichi and Kyoto sourced from river water. Concentration of iron in four kind of sludge is Osaka North 23.7%, Osaka South 13.8%, Aichi 3.7% and Kyoto 3.2%; iron concentration may be one of the reasons for the different FA sorption. Peak of FA sorption is around 600 deg. C. FA sorption of two kind of sludge at 880 and 1200 deg. C is decreased compared with the sorption at 600 deg. C.
a) Fulvic acid
0
10
20
30
40
No
heat
ing
200
deg.
400
deg.
600
deg.
880
deg.
1200
deg
.
Kd
(mL
/g)
b) Phosphorus
0
1000
2000
3000
4000
5000
6000
No
heat
ing
200
deg.
400
deg.
600
deg.
Kd
(mL
iter/g
r.)
FIG. 1. Correlation between sorption coefficient and heating processing.
Heating processing makes strength against water flowing. This study indicates sorption of FA and phosphoric acid keep even heating at 600 deg. C as no heating. As the result of this sorption experiment, heating processing is the one of effective methods for strength against water flowing.
To construct the next water purification system using soil, mechanism of sorption changes by heating processing should be solved, and an experiment with pilot scale plant using these materials should be also conducted.
[1] FUJIKAWA, Y., HAMASAKI, T., SUGAHARA, M., OZAKI, H., et al., Characterization of Japanese soil and other geological materials based on the sorption of humic substances (Proc. Int. Conf. Radioactivity in the Environment) (2002) 619-623.
[2] FUJIKAWA, Y., HAMASAKI, T., SUGAHARA, M., OZAKI, H., et al., Re-evaluation and Re-construction of Water Purification System Using Soil I: Assessment of Soil as a Sorbent of Humic Substances and Phosphorous Acid, ECOHAZARD 2003, International Water Association (IWA) (2003).
[3] HAMASAKI, T., FUJIKAWA, Y., SUGAHARA, M., OZAKI, H., et al., Re-evaluation and Re-construction of Water Purification System Using Soil II: Mechanisms of Removal of Pollutants from Infiltrating Water, ECOHAZARD 2003, International Water Association (IWA) (2003).
Akadama soil Kanuma soil
WTT Sludge of Osaka North
WTT Sludge of Osaka South
WTT Sludge of Aichi WTT Sludge of Kyoto
607

EXTENDED SYNOPSIS IAEA-CN-118/144P
TOPIC: THE MEDITERRANEAN
1
Chronology of Metal Pollution Offshore Coruh Mouth, Eastern Black Sea
D. Secrierua, S. Gulinb, I. Osvathc
a GeoEcoMar Institute of Geology and Geo-Ecology, Constanta, Romania
bInstitute of Biology of Southern Seas, Sevastopol, Ukraine
c Marine Environment Laboratory, International Atomic Energy Agency, Monaco
E-mail address of main author: [email protected]
Among the areas investigated during two international cruises organised by the IAEA in the Black Sea in 1998 and 2000, two areas were singled out, on the NW Shelf and offshore the Coruh mouth, as having the highest levels of heavy metals in sediment. The River Coruh drains mountainous regions of Turkey and Georgia, having a high transport energy. Offshore its mouth, Cu reaches up to 340 µg/g and Ba up to 2350 µg/g in sediment. These maximum levels are about 7, respectively 10 times higher than “background” values measured in Black Sea sediments. It can be noted that at two of the four locations in the studied area Cu exceeded the ERL concentration for marine sediments (270 µg/g), indicating a likely impact on marine bio ta at the respective sites. Most of the other heavy metals (Co, Ni, Pb, Zn, Cd, Cr and V), the major component Fe2O3 and the minor component TiO 2 were also enriched, to a lesser degree, in the area offshore the Coruh mouth. Ba and Cu were related here by a significant linear correlation (rBa-Cu=0.905), indicating a common origin for both metals. At the same time both metals were significantly correlated (α≤0.01) with Pb, Cd and Zn, Ba being also significantly correlated with Cr. All these metals have no significant correlations with any potential normalizing component. The general enrichment of these elements points to a substantial input from a region characterized by the presence of polymetallic and barite mineralizations, the paragenesis being specific for porphyry copper deposits. Deposits of this type are present in both Georgia and Turkey and both countries are mining them. Both natural erosion and transport and anthropic activities can contribute to the measured enrichment and it is of interest to identify and characterize the sources and the processes and timescales involved in transport and deposition as well as the post-depositional processes. The spatial distribution of Cu and Ba surface sediment concentrations offshore the Coruh mouth clearly confirms the river as the source of input of heavy metals. The vertical distributions of copper concentrations are characterized by ample fluctuations (Fig. 1 illustrates the profile at one of the sampled sites). 137Cs was used to derive down-core chronology and, until further insight will be obtained on post-depositional processes, the observed variations in the Cu profile were tentatively attributed to variations in the input resulting from copper industry upstream Coruh. The most likely source lies in the Artvin area, where a major Cu processing center, Murgul-Artvin, is located, about 60 km from the mouth of the river. The most likely source for the increased Ba concentrations is the Cerattepe high-grade gold ore deposit near Artvin, where gold is located in oxidized barite rich units and the mining and processing of the ore results in a great quantity of Ba rich wastes. No detailed production data are at this stage available for these industries, however global data were available for Cu mining in Turkey since the early 1960s. The timeline corresponding to the measured Cu profile in Fig. 1, when taking into
608

D. Secrieru et al.
2
account transport, deposition and post-depositional processes, matches fairly well key time points such as: significant growth of mining industry in the mid 1930s; actions to address environmental concerns starting to be implemented in the 1970s and being consolidated with the Turkish Environmental Law coming into force in 1973. Further detailed studies and additional information will be required to make a complete assessment of the site’s contamination, to trace the burying of the sub-surface Cu peak, to corroborate chronologies using additional tracers and to identify effects of post-depositional processes. Combined with previous results obtained by the authors on the buffering capacity of this river’s watershed, this study could improve the predictive capabilities concerning the fate of contaminants released in or deposited on the basin.
Acknowledgement : This study was carried out in the framework of the International Technical IAEA Project RER/2003 'Marine Environmental Assessment in the Black Sea Region”.
FIG. 1. Cu and Ba concentrations in sediment at a location situated offshore the mouth of River Coruh (Station BS2K-17, 41°39’656 N, 41°33’231, 70 m water depth, sampled on 01.10.2000) and 137Cs-based geochronology. Cu production in Turkey is also represented.
Cu, µg/g60 80 100 120 140 160 180 200 220 240
Dep
th (u
ncom
pact
ed),
cm
0
10
20
30
40
50
Yea
r
1920
1930
1940
1950
1960
1970
1980
1990
2000
Ba, µg/g250 300 350 400 450 500 550 600 650 700
Copper Production, thousands tones
500 1000 1500 2000 2500 3000 3500 4000 4500 5000
Legend:
Cu concentration
Ba concentration
Cu production
609

EXTENDED SYNOPSIS IAEA-CN-118/145P
TOPIC: RADIOMETRICS AND MASS SPECTROMETRIC TECHNIQUES
1
Optimisation of Sample Geometry for Gamma Spectrometric Measurements through Monte Carlo Simulation
C. Dovletea and I. Osvathb
Private consultant, 06360 Eze-sur-Mer, France
Marine Environment Laboratory, International Atomic Energy Agency, Monaco
E-mail address of main author: [email protected]
Gamma-ray spectrometry of environmental samples is generally a low-level counting technique, therefore it is important to minimise the external (background) radiation to the detector, using an adequate shield, and to maximize the detection of radiation emitted by the sample itself, using an adequate measurement geometry. The optimum sample geometry depends on the sample quantity available, sample density, energy of interest and the size and shape of the detector. A modelling approach allows the determination of the optimum sample geometry with respect to various criteria and also the estimation of uncertainties, complementing effectively a rather laborious purely experimental approach.
Commonly utilised geometries in environmental measurements are cylindrical and Marinelli type. Cylindrical geometries were studied for several types of matrices, sample volumes and HPGe detectors in use in the laboratory. The optimisation criteria selected refer to maximising detection efficiency by changing the aspect ratio of the sample geometry (diameter to height ratio) and minimising systematic errors related to small deviations from the prescribed geometry. Simulations were carried out using the GESPECOR software package for the range of energies of usual interest for environmental measurements: 46.5 keV (210Pb line), 59.5 keV (241Am), 661.6 keV (137Cs) and 1460.7 keV (40K).
Fig. 1 presents results of efficiency calculations for sediment (ρ = 1.6 g·cm-3) samples of 10 cm3, 49 cm3, 98 cm3 and 140 cm3 volume, in polypropylene (ρ = 1.1 g·cm-3) cylindrical containers, measured on a 170 cm3 HPGe detector. It can be seen that for small samples (10 cm3) a 0.5 – 0.8 cm sample height corresponds to maximum detection efficiency, sensitivity to sample height reaching however also a maximum here for the lower energy range. For high energies (1460.7 keV) an increase of the sample height from 0.8 to 2.8 cm results in a detection efficiency decrease of only 20%. Usually the measurement accuracy is the key criterion, therefore a well defined measurement geometry is preferable, i.e. one with a low aspect ratio. This generally results in lower measurement efficiencies, except for large volume samples and the higher energy range. For example, in the case of a 140 cm3 sample, sample heights between 2 and 4 cm ensure both high detection efficiency and lower contribution to combined uncertainties related to uncertainties in sample height.
The Monte-Carlo simulations thus permitted a quantitative determination of the optimum sample geometries so as to maximise detection efficiencies and minimise measurement uncertainties.
610

C. Dovlete and I. Osvath
2
FIG. 1. Calculated detection efficiency as a function of sample height for various sample volumes and gamma-ray energies (sediment sample, density ρ=1.6 g⋅cm-3, on coaxial HPGe detector of 170 cm3 volume).
Sample heigth (cm)
0 1 2 3 4 5 6 7
Effi
cien
cy
0.00
0.02
0.04
0.06
0.08
0.10
0.12
0.14
46.5 keV59.5 keV661.6 keV1460.7 keV
Sample heigth (cm)
0 1 2 3 4 5 6 7
Effi
cien
cy
0.00
0.02
0.04
0.06
0.08
0.10
46.5 keV59.5 keV661.6 keV1460.7 keV
Sample volume 10 cm3
Sample volume 49 cm3
Sample heigth (cm)
0 1 2 3 4 5 6 7
Effi
cien
cy
0.00
0.02
0.04
0.06
0.0846.5 keV59.5 keV661.6 keV1460.7 keV
Sample heigth (cm)
0 1 2 3 4 5 6 7
Effi
cien
cy
0.00
0.02
0.04
0.06
0.08 46.5 keV59.5 keV661.6 keV1460.7 keV
Sample volume 98 cm3
Sample volume 140 cm3
611

EXTENDED SYNOPSIS IAEA-CN-118/146P
TOPIC: HYDROLOGY
1
Application of Environmental Isotopes of Hydrogen (3H), Carbon (13C & 14C) and Oxygen (16O/18O) in Studies of Groundwater-streamflow Interactions
D. Stone, G. Jacobsen, C. Hughes, R. Szymczak
ANSTO Environment, PMB 1, Menai NSW 2234, Australia
E-mail address of main author: [email protected]
A current major effort in Australian water management is the conjunctive management of hydraulically connected Groundwater and Surface water systems, to provide the maximum benefit to water stakeholders. In particular Australia has a legislative limit on the amount of surface water that can be utilised in a particular catchment, but that is not the case for Groundwater, leading to tension amongst users in connected systems.
FIG. 1. Tritium in precipitation at selected stations in Southern Australia, 1979-2000.
Groundwater and streamflow samples were collected during several studies in the Bega Valley and Murray-Darling Basin, NSW [1, 2]. Streamflow was sampled using a plastic bailer while groundwaters were withdrawn with the use of a Grundfos MP1 environmental sampling pump. They were analysed for stable isotopes (2H/H, 18O/16O) ratios, tritium (3H), radiocarbon (14C) and major and minor chemical species. Rainwaters were collected and analysed for stable isotopes only. Previous tritium in precipitation data were also utilised (Fig. 1). Ion Chromatography was used for the analysis of the anions while either ICP-MS or ICP-AES was used for cations. The tritium analysis was carried out by standard procedures of electrolytic concentration and liquid scintillation counting [3]. Analysis of the water samples for deuterium was conducted by CSIRO, Isotope Analysis laboratory using the zinc reduction method and a VG Isogas mass spectrometer (error; ± 0.8 per mil). Radiocarbon in groundwaters are measured using accelerator mass spectrometry (AMS). The water samples are filtered to 45 µm prior to CO2 collection. Dissolved inorganic carbon (DIC) is separated by acidifying the water samples with 85% phosphoric acid, the resulting CO2 is collected by
0
1
2
3
4
5
6
7
8
9
1975 1980 1985 1990 1995 2000 2005
Cape Grim
Melbourne
Brisbane
Adelaide
3 per. Mov. Avg. (Cape Grim)
3 per. Mov. Avg. (Adelaide)
612

D. Stone et al.
2
sparging with He for 15 mins and cryogenic trapping. The CO2 is purified by heating overnight to 600oC in the presence of Ag wire. Graphite targets are then prepared by the reduction of the CO2 using H2 with an Fe catalyst at 600oC. The resulting graphite/iron mix is measured in the ANTARES 10MV Tandem Accelerator. The determination of oxygen-18 was conducted at the University of Wollongong using the CO2 gas equilibration method, purified using a Micromass Multiprep Unit and measured on a Micromass Prism III (error; ± 0.1 per mil).
FIG. 2. Plot of tritium activity versus depth of sample for groups of bores in Bega Valley, NSW [1].
A plot of tritium activity versus borehole location and depth (Figure 2), indicates that the Brogo River (Bega Valley, NSW) is not recharging the adjacent alluvium since the tritium is much lower than in the streamwater. The Bega river however is recharging the adjacent alluvium, both above and below its confluence with the Brogo river, since tritium values are similar in stream and alluvium.
Isotopes such as the stable and radioactive isotopes of water and carbon are particularly appropriate for the study of these connected water systems, providing a clear method of determining the source of groundwater, and hence the extent of mixing of nearby surface water (such as the local river), and the time frame for the mixing process. In particular the stable isotopes 2-H, 18-O, and 13-C provide a robust end-member analysis for the hydrographic separation of regional groundwater and any amount of river water which was replenished at a remote location; while the radioactive isotopes 3-H and 14-C are used to confirm the presence in groundwater of (isotopically modern) surface water, but also accurately determine the apparent rate of mixing at particular distances from the river.
[1] STONE, D.J.M., THOMAS, M., RUSSELL, G., Investigation of Groundwater-
Streamflow interactions in the Bega alluvial aquifer using Tritium and Stable Isotope ratios (Proc. 4th Aust. Nuclear Assoc. Conf. on Nuclear Science and Engineering in Australia, Oct 2001) Sydney, Australia, (2001) 191-196.
[2] STONE, D.J.M., Streamflow-Groundwater interactions in the Murray Darling Basin determined by Tritium, 14-C and stable isotopes (Proc. 2004 Robertson Workshop on Environmental Geochemistry and Geochronology: Quaternary Chronologies Apr/May 2004) Ranelagh House, Robertson NSW (2004) 7.
[3] CALF, G.E., SEATONBURY, B.W., SMITH, L.W., The Measurement of Natural Levels of Tritium in Water (1975) AAEC /E373.
0
10
20
30
40
50
600 0.5 1 1.5 2 2.5 3 3.5 4
Tritium activity (TU)
dept
h of
sam
ple
(met
res)
Brogo River bore transect
Downstream Bega River
Bega River Transect, upper
Below Confluence
Confluence
Streamflow
Shallow, Confluence
613