Auto-summarization of audio-video presentations
10
Auto-Summarization of Audio-Video Presentations Liwei He, Elizabeth Sanocki, Anoop Gupta, and Jonathan Grudin Microsoft Research Redmond, WA 98052 ABSTRACT As streaming audio-video technology becomes widespread, there is a dramatic increase in the amount of multimedia content available on the net. Users face a new challenge: How to examine large amounts of multimedia content quickly. One technique that can enable quick overview of multimedia is video summaries; that is, a shorter version assembled by picking important segments from the original. We evaluate three techniques for automatic creation of summaries for online audio-video presentations. These techniques exploit information in the audio signal (e.g., pitch and pause information), knowledge of slide transition points in the presentation, and information about access patterns of previous users. We report a user study that compares automatically generated summaries that are 20%- 25% the length of full presentations to author generated summaries. Users learn from the computer-generated summaries, although less than from authors’ summaries. They initially find computer-generated summaries less coherent, but quickly grow accustomed to them. Keywords: Video summarization, video on-demand, streaming media, corporate training, digital library, user log analysis, user evaluation 1 INTRODUCTION Digital multimedia content is becoming pervasive both on corporate Intranets and on the Internet. For example, many corporations are making audio and video of internal seminars available online for both live and on-demand viewing—at Microsoft Research about 5-10 internal seminars are made available online every week. Similarly, many academic institutions are making lecture videos and seminars available online. For example, Stanford University is currently making lecture videos from ~25 courses available online every quarter (http://stanfordonline.stanford.edu ), and research seminars from Stanford, Xerox PARC, University of Washington, and other sites can be watched at the MURL Seminar Site (http://murl.microsoft.com ). These numbers are likely to grow dramatically in the near future. With thousands of hours of such content available on-demand, it becomes imperative to give users necessary summarizing and skimming tools so that they can find the content they want and browse through it quickly. We humans are great at skimming text to discover relevance and key points; in contrast, multimedia content poses challenges because of the temporal rather than spatial distribution of content. In this paper we focus on techniques for automatic creation of summaries for audio-video presentations; that is, informational talks given with a set of slides. Auto-summarization is particularly important for such informational content as contrasted to entertainment content, such as movies. Entertainment content is more likely to be watched in a leisurely manner and costs so much to produce that it is reasonable to have a human produce previews and summaries. The techniques we propose for summarizing informational talks exploit information available in the audio signal (e.g., pitch and pause information), knowledge about slide transition points in the presentation, and information about access patterns of previous users. We present results from user studies that compare these automatically generated summaries to author generated summaries. Several techniques have been proposed for summarizing and skimming multimedia content to enable quick browsing. In one class of schemes [1,2,18,25,26], a static storyboard of thumbnail images is built from the video channel using information such as amount of motion or the newness of visual context. These techniques are less applicable to informational presentations, in which the video channel consists primarily of a talking head and most of the useful information is in the audio channel. Another class of techniques is that of time compression [3,5,17,23,24]. These can allow the complete audio-video to be watched in a shorter amount of time by speeding up the playback with almost no pitch distortion. These techniques, however, allow a maximum time saving of a factor of 1.5-2.5 depending on the speech speed [10], beyond which the speech becomes incomprehensible. Removing and shortening pauses in speech can provide another 15-20% time reduction [9]. In this paper we explore techniques that allow greater timesavings by removing portions of the content rather than just playing it faster (although time-compression can be added to provide further savings). The result is a “summary” that highlights the content and can be 4 to 5
Transcript of Auto-summarization of audio-video presentations

Auto-Summarization of Audio-Video PresentationsLiwei He, Elizabeth Sanocki, Anoop Gupta, and Jonathan Grudin
Microsoft ResearchRedmond, WA 98052
ABSTRACTAs streaming audio-video technology becomes widespread,there is a dramatic increase in the amount of multimediacontent available on the net. Users face a new challenge:How to examine large amounts of multimedia contentquickly. One technique that can enable quick overview ofmultimedia is video summaries; that is, a shorter versionassembled by picking important segments from the original.
We evaluate three techniques for automatic creation ofsummaries for online audio-video presentations. Thesetechniques exploit information in the audio signal (e.g.,pitch and pause information), knowledge of slide transitionpoints in the presentation, and information about accesspatterns of previous users. We report a user study thatcompares automatically generated summaries that are 20%-25% the length of full presentations to author generatedsummaries. Users learn from the computer-generatedsummaries, although less than from authors’ summaries.They initially find computer-generated summaries lesscoherent, but quickly grow accustomed to them.
Keywords: Video summarization, video on-demand,streaming media, corporate training, digital library, user loganalysis, user evaluation
1 INTRODUCTIONDigital multimedia content is becoming pervasive both oncorporate Intranets and on the Internet. For example, manycorporations are making audio and video of internalseminars available online for both live and on-demandviewing—at Microsoft Research about 5-10 internalseminars are made available online every week. Similarly,many academic institutions are making lecture videos andseminars available online. For example, Stanford Universityis currently making lecture videos from ~25 coursesavailable online every quarter(http://stanfordonline.stanford.edu), and research seminarsfrom Stanford, Xerox PARC, University of Washington,and other sites can be watched at the MURL Seminar Site(http://murl.microsoft.com). These numbers are likely to
grow dramatically in the near future. With thousands ofhours of such content available on-demand, it becomesimperative to give users necessary summarizing andskimming tools so that they can find the content they wantand browse through it quickly.
We humans are great at skimming text to discoverrelevance and key points; in contrast, multimedia contentposes challenges because of the temporal rather than spatialdistribution of content. In this paper we focus on techniquesfor automatic creation of summaries for audio-videopresentations; that is, informational talks given with a set ofslides. Auto-summarization is particularly important forsuch informational content as contrasted to entertainmentcontent, such as movies. Entertainment content is morelikely to be watched in a leisurely manner and costs somuch to produce that it is reasonable to have a humanproduce previews and summaries.
The techniques we propose for summarizing informationaltalks exploit information available in the audio signal (e.g.,pitch and pause information), knowledge about slidetransition points in the presentation, and information aboutaccess patterns of previous users. We present results fromuser studies that compare these automatically generatedsummaries to author generated summaries.
Several techniques have been proposed for summarizingand skimming multimedia content to enable quickbrowsing. In one class of schemes [1,2,18,25,26], a staticstoryboard of thumbnail images is built from the videochannel using information such as amount of motion or thenewness of visual context. These techniques are lessapplicable to informational presentations, in which thevideo channel consists primarily of a talking head and mostof the useful information is in the audio channel.
Another class of techniques is that of time compression[3,5,17,23,24]. These can allow the complete audio-videoto be watched in a shorter amount of time by speeding upthe playback with almost no pitch distortion. Thesetechniques, however, allow a maximum time saving of afactor of 1.5-2.5 depending on the speech speed [10],beyond which the speech becomes incomprehensible.Removing and shortening pauses in speech can provideanother 15-20% time reduction [9].
In this paper we explore techniques that allow greatertimesavings by removing portions of the content rather thanjust playing it faster (although time-compression can beadded to provide further savings). The result is a“summary” that highlights the content and can be 4 to 5

times shorter. Previous techniques in this area have variedfrom straightforward sampling of the time line (e.g., play 10seconds, skip 50 seconds, play 10 seconds, etc.) to moresophisticated techniques based on pitch, pause, speechenergy, speech-to-text content analysis, and video channelanalysis [1,2,7,8,12,16,22].
We present a detailed comparison with related works inSection 7, but at a high level, the work reported here differsas follows: First, we focus specifically on informationalpresentations with slides. This context provides us with acritical new source of information, the time-points whenslides are changed, allowing new algorithms. Second, weuse the access patterns of users who have watched the talkprior to the current user. Finally, we present detailedcomparison with author-generated summaries, somethingthat most of the earlier studies do not do.
The paper is organized as follows: Section 2 describes ourstudy context and discusses sources of informationavailable for the summarization task. Section 3 presents thethree automatic video summarization algorithms proposedin this paper. Section 4 gives details of the experimentaldesign of our user study. Sections 5 and 6 present theresults. We discuss related work in Section 7 and concludein Section 8.
2 SOURCES OF INFORMATIONAs stated earlier, our focus is on creating summaries forinformational talks. Let us begin by enumerating thecharacteristics of this domain and the sources ofinformation available to it.
2.1 Informational TalksInformational talks are often accompanied by slides. Asconcrete example, we consider seminars made availableonline by the Microsoft Technical Education (MSTE)group.
The displays of online courses are usually very similar.Figure 1 shows the typical view for a MSTE seminar: avideo-frame with VCR controls (play/pause/fast-forward/rewind), a table-of-contents frame (lower leftcorner) where users can click to go to that particular sectionof the talk, and a slide-frame where the users can see theslide relevant to the current audio-video content. As thevideo progresses, the slide-flips are automatic, requiring nouser intervention. The slide-frame is often needed, becausethe video window is too small to show the detailed contentof the slides.
While the process of authoring such content used to bequite cumbersome, it is quite simple nowadays. With thedeployment of Microsoft PowerPoint Presenter, the timingof each slide-switch is recorded in real-time as the speakerflips slides on the laptop, and linked in with the audio-videostream being recorded at the video server.
The client-server architecture also makes user actionlogging possible. Every time a user interacts with a controlelement, such as an item in table-of-contents (TOC) or a
video speed control, an event is generated. The interfacecan be instrumented so that each event is time stamped andlogged, along with the user's ID, as a database record on theserver.
Figure 1: User Interface for MSTE talks.
2.2 Sources of Information for SummarizationAt a high level, we can consider four major sources ofinformation that can be used in automatically producingsummaries: 1) video channel; 2) audio channel; 3) speaker’sactions; and 4) end-users’ actions watching the talk.Unfortunately, for the talks considered here, the video isprimarily a low-resolution face shot. Although we might getsome useful information from the degree of animation ofthe speaker and hand gestures that are captured, for thisstudy we ignore this channel and focus on the other threesources of information.
2.2.1 Audio channelIn informational talks, audio carries much of the content ofthe presentation. There are two main sources of informationhere: 1) the spoken text or the natural-language content, and2) the pitch, pause, intensity, intonation, and other prosodyinformation in audio. In this paper, we focus on the latter.
Research in speech and linguistics communities [11,13,20]has shown that changes in pitch occur under variousspeaking conditions. The introduction of a new topic oftencorresponds with an increased pitch range. Pitch activityprovides information in speech that is important forcomprehension and understanding. In this paper, weexplore the use of pitch to identify the speaker’s emphasisin the presentation. Our algorithm is based on Barry Aron’swork [4]. We use it both by itself (providing comparison toBarry’s earlier work), and in combination with new sourcesof information discussed below. We also use pauseinformation to avoid selecting segments that start in themiddle of a phrase, which can be annoying.
2.2.2 Speaker actionsIn addition to a speaker’s audio, there is useful informationin the speaker’s actions: gestures, when he/she transitions to

the next slide, how much time he/she spends on a slide, andso forth. As stated earlier, for this study we ignore gestureinformation in the video channel, but we do consider theinformation in slide transition points.
This information is easily and automatically gathered andcontains two potentially important elements: 1) A slidetransition usually indicates the introduction of a new topicor sub-topic, revealing the logical structure of thepresentation; 2) The duration between slide transitions, thetime spent on each slide, provides an indication of a slide’srelative importance.
2.2.3 End-user actionsIt is unlikely that a user going to watch an online talk is thefirst person to do so. Many people have likely watched thatseminar before him/her, and we suggest using this as anadditional source of information for creating summaries.
On the MSTE video server, for research purposes,information is logged regarding the segments of videowatched by each user. We have 117,000 records from 6685viewing sessions for 163 different presentations. Figure 3shows the data accumulated across all sessions that hadwatched this given talk for over 10 minutes. The dottedvertical lines denote the slide transition points.
010203040506070
0 10 20 30 40 50 60 70 80 90
Nth minute into the talk
Use
rco
unt
A B
Figure 2: User-count vs. time plotted for one of the MSTEpresentations. The vertical lines denote the slide-transitionpoints. Note the spikes in user counts at the beginning of eachslide transition point indicating users’ jumping using table ofcontents.
There are several trends that we can see. First, in general,the number of viewers decreases as the time progresses.This is understandable as people start at the beginning andgiven limited time, opt out at some time before the end.Second, we see jumps in user-count at the beginning ofslides. This is due to the availability of table-of-contentswith the talk. When users get bored with the content of theslide, or think they have gotten the essence, they maydecide to jump to the next interesting slide. This alsoaccounts for the observation that within a slide, the numberof viewers decreases as time progresses.
Thirdly, in contrast to the first observation, we see that forsome slides (e.g., marked by label “A” in Figure 3) theaverage number of users increases as compared to theprevious slide. We found that this corresponded to majortopic transitions in the talk, and hence was significantinformation usable in the summary.
Finally, we see that for some slides, the number of usersthat watched the audio associated with that slide droppedvery rapidly after the beginning of the slide (e.g., marked bylabel “B” in Figure 3). This indicates while the title of slidemight have been interesting, its contents were most likelynot interesting ─ gain a useful hint for us in thesummarization task. We present how we use all thisinformation in the next section.
2.3 Desirable Attributes of a SummaryBefore going into summarization algorithms, it is good tothink about the desirable attributes for an ideal summary.We believe the following four properties, the 4 Cs, offer astarting point.
1. Conciseness: Any segment of the talk that is selectedfor the summary should contain only necessaryinformation. Thus, each segment should be as short aspossible.
2. Coverage: The set of segments selected for thesummary should cover all the “key” points of the talk.
3. Context: The segments selected and their sequencingshould be such that prior segments establishappropriate context (e.g., critical terms should bedefined before being used in a segment).
4. Coherence: The flow between the segments in thesummary should be natural and fluid.
Of course, even an average human editor won't consistentlyproduce summaries that satisfy all four criteria. However,we asked our users to evaluate the summaries along thesedimensions.
3 THE SUMMARIZATION ALGORITHMSWe developed three automatic summarization algorithms.The first algorithm (denoted by S) uses information inslide-transition points only. The second algorithm (denotedby P), introduced by Arons [4], tries to identify emphasizedregions in speech by pitch activity analysis. The thirdalgorithm (denoted by SPU) uses all three sources ofinformation: the slide-transitions, pitch activity, and user-access patterns.
In our pilot studies, users found it very annoying whenaudio segments in the summary began in the middle of aphrase. For all algorithms, we use a heuristic to ensure thisdoes not happen by aligning segments to pauses in speech.The pauses in speech are detected using a pause detectionalgorithm proposed by Gan [9].
3.1 Slide-transition Based Summary (S)The slide-transition-based summary uses the heuristics thatslide transitions indicate change of topic, and that relativetime spent by speaker on a slide indicates its relativeimportance. Given a target summary duration, thealgorithm therefore allocates time to each slide inproportion to what the speaker did in the full-length talk.Furthermore, we use the heuristic that importantinformation is spoken at the beginning of a slide, so we take

the appropriate duration segment right after each slidetransition and add it to the summary.
3.2 Pitch-activity Based Summary (P)The pitch-based summary uses the algorithm proposed byArons [4] to identify emphasis in speech. The use of thisalgorithm allows us to compare the new algorithms withthis seminal earlier work.
The pitch tracker we use is loosely based on an algorithmdeveloped by Medan, Yair, and Chazan [15]. Another keyattribute is the length of individual audio segments that areselected for the summary. In contrast to Arons, who hadchosen 8-second segments, we decided to target roughly 15-second segments. This was based on the segment lengthswe found in author-generated summaries (see Table 3).The algorithm works as follows.
1. The audio wave file is divided into 1ms frames.
2. The pitch tracker computes fundamental pitchfrequency for each frame.
3. A threshold is chosen to select the pitch framescontaining the top 1% of pitch values.
4. The number of frames in each one-second window thatare above this threshold is counted to provide ameasure of “pitch activity.”
5. A sliding-window algorithm is used to determine thecombined “pitch activity” for each 15-second window.They provide a measure of emphasis for phrase- orsentence-sized segments of a speech recording.
6. The 15-second windows are sorted according to thecombined score.
7. Segments in the windows are added to the summary inthe order of decreasing combined score until thesummary reaches its specified length.
3.3 Summary Based on Slide, Pitch, and User-Access Information (SPU)
This algorithm combines the information sources used bythe two algorithms above and adds information from user-access patterns. In developing the algorithm, a keyquestion was how to incorporate this user-accessinformation.
Our first attempt was to use the information fairly directly,that is, if a lot of users watched a given 10-second segmentof the talk, then we would give that segment extra weight tobe included in the final summary. We finally decidedagainst this straightforward approach because of the biasesin our data collection approach. First, most users tend tolisten to a talk from beginning to end until they run out oftime or are interrupted and have to leave, etc. Thus, there isunnecessary emphasis given to the front part of the talk (seeFigure 3), even though there may be important content lateron. Our data showed that for high summarization factors,the latter part of the talk got totally dropped. Second, thetable-of-contents markers can only take users to thebeginnings of the slides. So similar to first point, at a finergranularity this time, there is unnecessary emphasis given tothe content right after a slide transition (see Figure 3).
Given the above biases, we decided to exploit user-accessinformation in a fairly coarse-grained manner for this study
– to prioritize the relative importance of slides. In future,we plan to study its use in finer-grained ways. To do this,we used the latter two heuristics mentioned in Section 2.2.3:1) If there is a surge in the user-count of a slide relative tothe previous slide, it likely indicates a topic transition. 2) Ifthe user-count for a slide falls quickly, the slide is likely notinteresting. The specific quantitative measure we used inthis paper was the ratio between the average-user-count ofthe current slide and the average-user-count of the previousslide. Here is an outline of the algorithm we used.
1. Compute the importance measure for each slide as theratio average-user-count for current slide divided bythat for previous slide. Since there is no previous slidefor first slide, it is always marked as the most important.
2. The slides in the talk are partitioned into three equal-sized groups based on the metric computed above:important, medium, and unimportant. The slides in thefirst group are allocated 2/3 of the total summary time;the medium group slides are allocated 1/3 of the totalsummary time; the least important slides are allocatedno summary time. (1/3 and 2/3 were selectedheuristically.)
3. Within each group, each slide gets a fraction of the totaltime allocated to that group using the slide-transitionbased algorithm described in Section 3.1. (This is howwe incorporate slide-transition information into thealgorithm.)
4. Given a time quota for a slide, we use the “pitch-activity” based algorithm outlined in Section 3.2 to pickthe segments included in the summary.
3.4 Author Generated Summaries (A)To establish a reference point for the effectiveness ofsummaries created using auto-summarization techniques,we asked human experts to produce summaries of the talks.Experts were defined as the author of the talk or someoneregarded as qualified by that author.
Each author was given a text transcript of the talk dividedinto sections based on the places where slide transitionsoccurred. Authors marked summary segments on thetranscripts with a highlighting pen. These sections werethen assembled into a video summary by aligning thehighlighted sentences with the corresponding video.
For the subsequent user study, each author also wrote 9 to15 quiz questions that covered the content of their talksummary. Questions required participants to drawinferences from the content of the summary or to relayfactual information contained in the summary. Either way,the quizzes were used to determine whether the computer-generated summaries had captured the content of the talkdeemed relevant by the author.
4 EXPERIMENTAL METHODEvaluating summarization algorithms is a fundamentallydifficult task. For example, the criteria we listed in Section2.3 are both highly complex and subjective. As a result, theprimary method we employ is a user-study with humansubjects. We begin by describing the talks used in thestudy.

4.1 Talks Used in the StudyFor our study, we chose four presentations from the MSTEinternal web site. The criteria used were:
• The presentations had been viewed in the past by 30+users to ensure that the usage logs were meaningful.
• Each presentation covered one topic rather thancomprising a number of autonomous sections.
• An expert (preferably the author of the talk) wasavailable to create the summary and quiz questions.
The four talks we chose were on the topics of user-interfacedesign (UI), Internet Explorer 5.0 (IE), Dynamic HTML(DH), and Microsoft Transaction Server (MT). Table 1below shows the number of slides used by the author andthe original duration, and the number of users for each ofthe talks.Table 1: Number of slides, length (mm:ss), and the user count of thechosen talks.
UI IE DH MT
Slide count 17 27 18 52
Original Length 71:59 47:01 40:32 71:03
User count 68 37 41 38
4.2 User Study DesignTo compare the summarization techniques we used acombination of two methods. 1) We administered quizzesto users before and after watching summaries to quantifythe effectiveness of summaries in capturing key content. 2)We used surveys to gauge participant’s subjective reactionsto the summaries.
We used 24 subjects in our study. This number allowed usto construct a procedure where we could completelycounterbalance against ordering effects, i.e., the order inwhich users experienced the summarization methods andthe talks.
The 24 participants were internal Microsoft employees andcontingent staff members working in technical jobpositions. All lacked expertise in the topic areas of thetalks. No mention was made until study sessions were overthat computer algorithms were used to construct thesummaries. Employees were rewarded with a coupon for afree espresso drink; contingent staff members were giventhe option of an espresso drink coupon or a free softwareproduct.
Participants first completed a background survey and took a32-question multiple-choice pre-study quiz to documenttheir expertise in the topic areas of the talks. Note, thesewere simply the combined questions generated by all fourauthors of the talks. We took the precaution of jumbling upthe ordering of questions within and across talks, so that thesubjects had less recollection of the questions whilewatching the talk summaries and at post-summary quiztime.
Each participant watched four summaries, deploying adifferent summarization technique across the four talks. Theorder in which talks and summarization techniques werepresented to each subject was such that we counterbalancedagainst all ordering effects.
While watching a summary, a participant could pause andjump back and jump forward. Once finished watching,however, participants were instructed to stop and notreview portions of the summary. Participants were providedpen and paper to take notes. Figure 3 shows the userinterface seen by the subjects.
Figure 3: User interface for the subject testing software. The slides,shown on the right, are synchronized with summary-segment transitions.
After watching each summary, participants filled out anopinion survey and took a post-summary quiz. The surveyevaluated the participants’ qualitative experience watchingthe summaries. The score difference between the pre-summary and the post-summary quiz measured the amountof new information gained.
5 CHARACTERISTICS OF SUMMARIESBefore discussing the results of the user-study, we brieflycomment on some basic quantitative characteristics of thesummaries produced by the four methods.Table 2: Duration of original talk and summaries (mm:ss).
UI IE DH MT
Original 71:59 47:01 40:32 71:03
A 13:44 11:37 9:59 14:20
SPU 13:48 12:08 9:54 14:16
P 14:14 12:06 9:58 14:03
S 13:58 11:36 10:19 14:30
Summar. Factor 5.2 4.0 4.1 5.0
Table 2 lists the duration of the original presentations andthe four summaries, and the summarization factor. There issome variation on how much the different talks aresummarized. We had given the authors a target of roughly1/5th the duration, and we naturally got some variation inhow much of the text transcript they marked up. Once wegot the author summaries, we gave the auto-summarizationalgorithms the same target duration. Again, we see somevariation in the duration between different methods for the

talk. This is because the segments are extended to the nextphrase boundary (see Section 3).Table 3: Average length and standard deviation (in parentheses) ofthe summary segments in seconds.
UI IE DH MT
A 15 (12) 21 (15) 19 (15) 15 (10)
SPU 19 (4) 20 (7) 18 (3) 18 (6)
P 18 (2) 18 (3) 18 (2) 19 (7)
S 48 (43) 25 (22) 33 (25) 16 (8)
Another interesting attribute that we can examine isstatistics about the length of individual segmentsconstituting the summaries. In the past, Arons [4], Christel[7] and Smith and Kanade [22] have chosen relatively smallsegments of 2-8 seconds for their browsing/highlightgeneration applications. Before conducting the study, wewere curious what the author-generated summaries wouldlook like.
Table 3 shows average segment length and standarddeviation across the summarization algorithms and talkswhile Figure 4 shows detailed distributions averaged acrossthe four talks. We see that, in contrast to earlier work,author-generated summaries have much longer segmentlengths, with averages between 15-21 seconds and standarddeviations of 10-15 seconds. To some extent this may beexplained by the fact that when browsing, one simply wantsbetter coverage with lots of shorter segments—we mayexpect the human to use other VCR-like controls to explorethe surrounding region if he/she feels so inclined.
0
40
80
120
160
0
40
80
120
160
0
40
80
120
160
0
40
80
120
160
0-5
5-10
10-1
5
15-2
0
20-2
5
25-3
0
30-3
5
35-4
0
40-4
5
45-5
0
55-6
0
60-6
5
65-7
070
+
SPU
P
S
A
Figure 4: Distributions of segment lengths for differentsummarization algorithms. The horizonal axis contains bins of differentsegment lengths (in seconds). The vertical axis is the number of segmentsin a specific bin.
As for auto-summarization algorithms, based on ourobservations from the author-generated summaries, wetuned the P and SPU algorithms to have averages close to15 seconds (see Sections 3.2 and 3.3). The variations thatwe see are present due to forced alignment with phraseboundaries identified by long pauses. For the slide-based
algorithm (S), the average segment length and the variationare very large. The reason is that only the beginningportion of each slide is selected by the algorithm, and timethat authors spend on each slide can vary a lot.
Another interesting metric to look at is if there is muchoverlap between the segments chosen by the variousalgorithms. This data are shown in Table 4 below. On onehand, if the emphasis detection algorithms were doing agreat job, we should see more than just chance overlapbetween the author-generated and the auto-summarizationalgorithms. (The chance overlap percentages for the fourtalks are roughly 19% for UI, 25% for IE, 25% for DH, and20% for MT.) On the other hand, given that authorsummarization leverages semantic understanding of thecontent while the auto-summarization algorithms don’t, ourexpectations should be fairly low.Table 4: Percentage of overlap between two different summarieswithin the talk.
UI A SPU P S DH A SPU P S
A 100% A 100%
SPU 12% 100% SPU 23% 100%
P 15% 56% 100% P 24% 67% 100%
S 24% 18% 12% 100% S 27% 23% 27% 100%
IE A SPU P S MT A SPU P S
A 100% A 100%
SPU 25% 100% SPU 21% 100%
P 38% 54% 100% P 15% 57% 100%
S 36% 34% 33% 100% S 25% 31% 39% 100%
We indeed see that there is not a significant overlapbetween the author-generated segments and theautomatically generated segments (look down column A inTable 4). In fact, the overlap is the most with the slide-based algorithm, which covers the beginning content ofeach slide, indicating that that is a resonable heuristic.There is considerable overlap between the P and the SPUalgorithms, as they both use pitch-activity as the primaryemphasis detection algorithm, but that does not translate tosignificant overlap with the author-based summary.Table 5: Slide coverage for the different summaries.
UI IE DH MT
Slide count 17 27 18 52
A 94% 67% 78% 50%
SPU 59% 78% 67% 77%
P 76% 85% 61% 71%
S 100% 100% 100% 100%
Finally, in the user-interface provided to our subjects (seeFigure 3), the slides carry a substantial fraction of the usefulinformation. So, we wanted to explore what fraction of theslides was shown to the subjects under the variousalgorithms. This data are shown in Table 5. For the author-
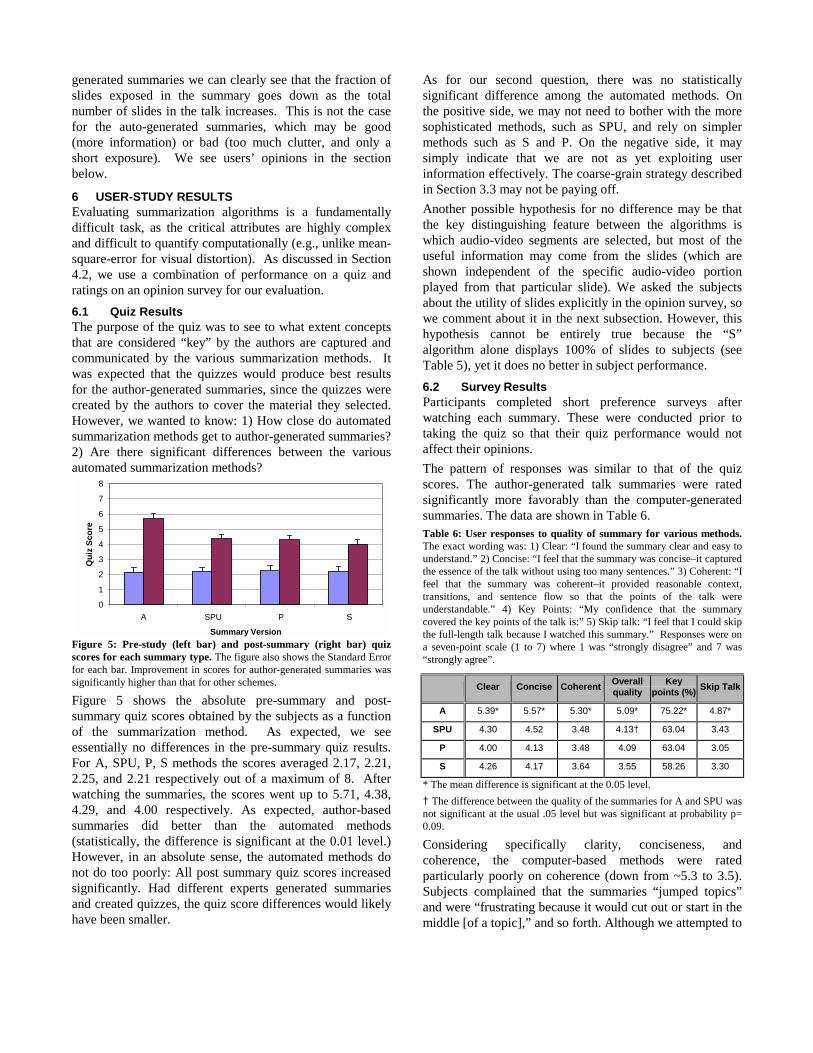
generated summaries we can clearly see that the fraction ofslides exposed in the summary goes down as the totalnumber of slides in the talk increases. This is not the casefor the auto-generated summaries, which may be good(more information) or bad (too much clutter, and only ashort exposure). We see users’ opinions in the sectionbelow.
6 USER-STUDY RESULTSEvaluating summarization algorithms is a fundamentallydifficult task, as the critical attributes are highly complexand difficult to quantify computationally (e.g., unlike mean-square-error for visual distortion). As discussed in Section4.2, we use a combination of performance on a quiz andratings on an opinion survey for our evaluation.
6.1 Quiz ResultsThe purpose of the quiz was to see to what extent conceptsthat are considered “key” by the authors are captured andcommunicated by the various summarization methods. Itwas expected that the quizzes would produce best resultsfor the author-generated summaries, since the quizzes werecreated by the authors to cover the material they selected.However, we wanted to know: 1) How close do automatedsummarization methods get to author-generated summaries?2) Are there significant differences between the variousautomated summarization methods?
0
1
2
3
4
5
6
7
8
A SPU P S
Summary Version
Qu
izS
core
Figure 5: Pre-study (left bar) and post-summary (right bar) quizscores for each summary type. The figure also shows the Standard Errorfor each bar. Improvement in scores for author-generated summaries wassignificantly higher than that for other schemes.
Figure 5 shows the absolute pre-summary and post-summary quiz scores obtained by the subjects as a functionof the summarization method. As expected, we seeessentially no differences in the pre-summary quiz results.For A, SPU, P, S methods the scores averaged 2.17, 2.21,2.25, and 2.21 respectively out of a maximum of 8. Afterwatching the summaries, the scores went up to 5.71, 4.38,4.29, and 4.00 respectively. As expected, author-basedsummaries did better than the automated methods(statistically, the difference is significant at the 0.01 level.)However, in an absolute sense, the automated methods donot do too poorly: All post summary quiz scores increasedsignificantly. Had different experts generated summariesand created quizzes, the quiz score differences would likelyhave been smaller.
As for our second question, there was no statisticallysignificant difference among the automated methods. Onthe positive side, we may not need to bother with the moresophisticated methods, such as SPU, and rely on simplermethods such as S and P. On the negative side, it maysimply indicate that we are not as yet exploiting userinformation effectively. The coarse-grain strategy describedin Section 3.3 may not be paying off.
Another possible hypothesis for no difference may be thatthe key distinguishing feature between the algorithms iswhich audio-video segments are selected, but most of theuseful information may come from the slides (which areshown independent of the specific audio-video portionplayed from that particular slide). We asked the subjectsabout the utility of slides explicitly in the opinion survey, sowe comment about it in the next subsection. However, thishypothesis cannot be entirely true because the “S”algorithm alone displays 100% of slides to subjects (seeTable 5), yet it does no better in subject performance.
6.2 Survey ResultsParticipants completed short preference surveys afterwatching each summary. These were conducted prior totaking the quiz so that their quiz performance would notaffect their opinions.
The pattern of responses was similar to that of the quizscores. The author-generated talk summaries were ratedsignificantly more favorably than the computer-generatedsummaries. The data are shown in Table 6.Table 6: User responses to quality of summary for various methods.The exact wording was: 1) Clear: “I found the summary clear and easy tounderstand.” 2) Concise: “I feel that the summary was concise–it capturedthe essence of the talk without using too many sentences.” 3) Coherent: “Ifeel that the summary was coherent–it provided reasonable context,transitions, and sentence flow so that the points of the talk wereunderstandable.” 4) Key Points: “My confidence that the summarycovered the key points of the talk is:” 5) Skip talk: “I feel that I could skipthe full-length talk because I watched this summary.” Responses were ona seven-point scale (1 to 7) where 1 was “strongly disagree” and 7 was“strongly agree”.
Clear Concise Coherent Overallquality
Keypoints (%)
Skip Talk
A 5.39* 5.57* 5.30* 5.09* 75.22* 4.87*
SPU 4.30 4.52 3.48 4.13† 63.04 3.43
P 4.00 4.13 3.48 4.09 63.04 3.05
S 4.26 4.17 3.64 3.55 58.26 3.30
* The mean difference is significant at the 0.05 level.
† The difference between the quality of the summaries for A and SPU wasnot significant at the usual .05 level but was significant at probability p=0.09.
Considering specifically clarity, conciseness, andcoherence, the computer-based methods were ratedparticularly poorly on coherence (down from ~5.3 to 3.5).Subjects complained that the summaries “jumped topics”and were “frustrating because it would cut out or start in themiddle [of a topic],” and so forth. Although we attempted to

avoid cutting in the middle of phrases, a more elaboratetechnique may be required.
As for overall quality, as expected, Table 6 shows that thesubjects preferred author generated summaries. However,many subjects were very pleasantly surprised to learn thatthree of the methods were computer based. Quotes included“Yeah, interesting. Wow! Then it’s very cool.” and “hum,that’s pretty good for a computer. I thought someone hadsat down and made them..” Real users will presumably beaware of the origins of summaries.
We also asked subjects about their confidence level that thesummary had covered key points in the talk. Author-basedsummaries got a confidence-level of 75%; computer-basedsummaries got a respectable ~60%. We were expecting thatthe slide-based scheme would get high points here, becausethe subjects saw all the slides, but it got the lowest score.The fact that points in the middle and end of slides were notcovered by the audio seemed to dominate judgments.
Finally, we asked subjects if they would skip the talk basedon the summary. After hearing author-based summaries,subjects were more convinced that they could skip the talk.Table 7: User responses to relative value of slides, audio, video insummaries. The exact questions was “What percent of the informationdo you feel came from the slides, the audio portion and the video portionof the summary (e.g. 30% slides, 30% audio, 40% video)?” Responsesare in percent. Awareness asked the users to rate the extent “The videoportion of the summary fostered a sense awareness of the speaker that Idon’t get from slides alone”. Responses were on a seven-point scale(1...7) where 1 was “strongly disagree” and 7 was “strongly agree”.
Slides Audio Video Awareness
A 47.17 38.26 14.57 5.04
SPU 44.32 35.14 18.09 5.04
P 42.61 39.13 18.26 5.00
S 50.65 30.22† 19.13 4.87
† The difference between the audio for S was significantly different for Aand P, but not SPU.
Given our focus on informational presentations, we wereinterested in learning the value subjects felt they derivedfrom slides vs. audio- and. video-tracks (Table 7). Clearly,most information was attributed to reading slide content(mean = 46.2%), followed by audio-track (mean = 35.7%)and video-track (mean = 18.1%). Clearly, it is imperativethat slides be shown if at all feasible. Although the outcomeis not particularly surprising in retrospect, it is useful tohave this preference quantified.
There are no significant differences in the perceived valueof slides, audio, and video across the summarizationmethods, except that the audio-track for author-based andpitch-based methods offers significantly more value thanthat for slide-based method (significant at the 0.05 level).We believe the reason is that the slide-based approach oftenhas very short audio segments as it does not drop any slide,and these short segments often add no value at all to thesubjects’ understanding.
The contribution of the small video window found in manyonline presentation user-interfaces (see Figure 1, Figure 3)to the overall experience and/or sense of awareness of thespeaker has been questioned. We asked this question of thesubjects; the result is shown in the “awareness” column ofTable 7. Given that 4.0 is the neutral value in this scale of 1to 7, the score of ~5.0 indicates that subjects derive valuefrom the video channel.Table 8: Perception of clarity of summary (higher number better),choppiness of summary (lower number better), and overall quality ofsummary (higher number better) as a function of the order in whichsummaries were presented to subjects. Responses were on a seven-point scale where 1 was “strongly disagree” and 7 was “strongly agree”.
Sequence instudy
Clear Choppy Quality
1 4.04 6.00* 3.65
2 4.39 5.09 4.09
3 4.39 4.70 4.00
4 5.13* 3.91* 5.18*
* The mean difference is significant at the 0.05 level.
Finally, we observed significant habituation effects.Participants’ perceptions of summary quality improved overtime. Table 8 shows the results as a function of thesequence in which they watched a summary (the study wasdesigned so that each of the four summary methods waspresented equally often in each position in the sequence).The last summary shown in the study was consistently ratedas being clearer (p=.048), less choppy (p=.001), and ofhigher quality (p=.013) than the first three summaries. Thisspecific result lends a silver-lining to the generally veryhard task of computer-based summarization: Over time,even with the early-stage summarization technologypresented in this paper, users may indeed find considerablesatisfaction from the summaries.
7 DISCUSSION AND RELATED WORKThere has been considerable research on indexing,searching and browsing the rapidly expanding sources ofdigital video [1,2,18,25,26]. These approaches all focus onvisual aspects of media, primarily employing image-recognition and image-processing techniques.
This study focuses on informational talks accompanied byslides. It has several characteristics: 1) audio carries most ofthe information; 2) slides provide a logical structure to thetalk; 3) user access information logged on the server couldgive further information as to which part of the talk isimportant. Since the video mainly consists of a talkinghead, storyboard or keyframe compression approaches usedfor other types of video are not effective.
Barry Arons’ SpeechSkimmer [5] allows audio to be playedat multiple levels of detail. Speech content can be played atnormal speeds, with pauses removed, or restricted to phasesemphasized by the speaker. A knob orthogonally controlspitch-preserved time-compression of the speech. LisaStifelman introduced Audio Notebook, a prototype note-pad combining pen-and-paper and audio recording [23,24].

Audio Notebook relies on the synchronization of thekeypoints marked by pen on paper to provide structure tothe recorded audio.
Our work shares some of the audio emphasis-detectionframework with SpeechSkimmer and the Audio Notebook.However, it differs by focusing on informational talks, andthus exploiting information from sources such as slidetransitions and end-user access logs recorded on a server.Both SpeechSkimmer and the Audio Notebook also focusedon interactive browsing interfaces; in contrast, we focus onmore passive summary viewing. Hence, the user-studiesand the results are quite different. Our studies do reflectsome on pitch-based emphasis detection algorithmsproposed by Arons. For example, we see that the overlapbetween author-generated segments and pitch-basedsegments is not any more than what would be achieved byrandom chance.
Chen and Withgott [6] did a more comparable study inwhich an emphasis-recognition system was used to producesummaries of recorded telephone or interviewconversations. The high correlation they found betweenemphasis and utility for inclusion in a summary suggeststhat emphasis may be used differently in brief, animatedconversations and in long lectures. The study was alsodone by training a Hidden Markov Model on the first halfof a recorded conversation and using it to predict emphasisin the latter half of the same conversation. It is not clearhow the results will generalize to our situation, where nosuch training is possible.
More recently, in the CMU Informedia project, Smith andKanade [22] produce a summary of non-lecture videoautomatically by image and language analysis. Forexample, if a face is recognized and a proper name appearson screen, they may conclude that a person is beingintroduced, and include a 2-second video shot in thesummary. In contrast to our work, there is much greateremphasis on video channel, audio is used mainly forspeech-to-text, and segments chosen are only 2 secondslong. They did not report user tests.
Also at CMU, Christel et al [7] report subjective evaluationof summaries created from image analysis, keyword speechrecognition, and combinations, again from general-purposevideo. Based on analysis, summaries/skims are constructedfrom video shots of 3-5 seconds each. They tested qualityof skims using image recognition and text-phraserecognition tasks. Performance and subjective satisfactionof all skimming approaches contrasted unfavorably withviewing of the full video; the latter was negative for eachtechnique on each dimension examined. Again, because ofour study focus, we use different and new informationsources not available to them. We also compare ourtechniques to author-generated summaries rather thanwatching full videos.
8 CONCLUDING REMARKSWith widespread availability of streaming-media solutions,ever decreasing storage costs, and increasing networkbandwidths, we are seeing a dramatic increase in theamount of multimedia content available on the net. In theworkplace and academic environments, a substantialfraction of such content takes the form of presentationsconsisting of audio, video and slides. In this paper wehave presented techniques to automatically summarize suchinformational multimedia presentations.
Our focus on informational presentations allowed us toexploit new sources of information such as slide-transitiontiming and user-access logs that had not been exploredbefore, in addition to traditional sources such as pitch-basedemphasis detection. We described three algorithms basedon these sources of information and compared them toauthor-generated summaries.
An analysis of author-generated summaries showedsegment lengths of 15-21 seconds. This is in contrast to the2-8 second segments generated by most earlier algorithms.We were also surprised to find little more than chanceoverlap between the segments generated by the proposedalgorithms and the author-generated summaries. It appearspresentations may be less susceptible to pitch-basedemphasis analysis, or that spoken emphasis did not trulycorrespond to semantically important material.
User study with 24 subjects clearly showed that theypreferred author-generated summaries to computer-generated ones. While the preference was large along somedimensions (e.g., they found author-generated summariesmuch more coherent), computer-generated summariesfaired respectably along other dimensions (e.g., theconfidence level that “key” points of talk had been coveredby the summary).
Interestingly, we did not find any significant differencebetween users’ preferences for the three computer-basedmethods, leading us to conclude that the simpler methods (Sand P) may be preferable for now. Overall, the computer-based summaries were well received by most subjects, andmany expressed surprise when they learned that a computerhad generated them. Another very surprising result wasusers increasing tolerance to computer-generatedsummaries. The last summary shown to the subjects wasconsistently rated as being clearer (p=.048), less choppy(p=.001), and of higher quality (p=.013) than the first threesummaries, even though the study was designed so thateach of the four summary methods was presented equallyoften in each position in the sequence. This indicates to usthat the user community may be ready to accept currentgeneration summarization methods, even though we knowthat there are many improvements to be made.
There are several future directions to be explored. We areconducting a study comparing audio-video summaries andtext summaries of transcripts. We will be looking intoexploiting other new sources of information (e.g., natural

language parsing and video analysis), fine tuning our use ofcurrent sources of information (e.g., more effective use ofuser-access logs as in collaborative-filtering systems [19]),understanding what role authors/speakers may play inhelping generate better summaries (e.g., marking relativeimportance of slides), and making a more interactive andintelligent video browsing system, where the end-user willbe a participant in a tight loop with the system.
ACKNOWLEDGEMENTSThanks to the Microsoft Usability Labs for use of their labfacilities. Steve Capps, Pat Helland, Dave Massy, andBriand Sanderson gave their valuable time to create thesummaries and quiz questions for their presentations.
REFERENCES1. Aoki, H., Shimotsuji, S. & Hori, O. A Shot Classification
Method of Selecting Effective Key-frames for VideoBrowsing. In Proceedings of the 6th ACM internationalconference on Multimedia, 1996, pp 1-10.
2. Arman, F., Depommier, R., Hsu, A. & Chiu M.Y. Content-based Browsing of Video Sequences, In Proceedings of the6th ACM international conference on Multimedia, 1994, pp97-103.
3. Arons, B. Techniques, Perception, and Applications of Time-Compressed Speech. In Proceedings of 1992 Conference,American Voice I/O Society, Sep. 1992, pp. 169-177.
4. Arons, B. Pitch-based Emphasis Detection for SegmentingSpeech Recordings. In Proceedings of InternationalConference on Spoken Language Processing, vol. 4, 1994, pp1931-1934.
5. Arons, B. SpeechSkimmer: A System for InteractivelySkimming Recorded Speech. ACM Transactions on ComputerHuman Interaction, 4, 1, 1997, 3-38.
6. Chen, F.R. & Withgott M. The use of emphasis toautomatically summarize a spoken discourse, Proceedings ofthe International Conference on Acoustics, Speech, andSignal Processing, 229-233. 1992. IEEE.
7. Christel, M.G., Smith, M.A., Taylor, C.R. & Winkler, D.B.Evolving Video Skims into Useful Multimedia Abstractions.In Proceedings of CHI, April 1998, pp. 171-178.
8. Foote, J., Boreczky, J., Girgensohn, A. & Wilcox, L. AnIntelligent Media Brower using Automatic MultimodalAnalysis. In Proceedings of ACM Multimedia, September1998, pp. 375-380.
9. Gan, C.K. & Donaldson, R.W. Adaptive Silence Deletion forSpeech Storage and Voice Mail Applications. IEEETransactions on Acoustics, Speech, and Signal Processing 36,6 (Jun. 1988), pp 924-927.
10. Heiman, G.W., Leo, R.J., Leighbody, G., & Bowler, K. WordIntelligibility Decrements and the Comprehension of Time-Compressed Speech. Perception and Psychophysics 40, 6(1986): 407-411.
11. Hirschberg, J. & Grosz, B. Intonational Features of Local andGlobal Discourse. In Proceedings of the Speech and NaturalLanguage Workshop, San Mateo, CA: Morgan KaufmannPublishers, 1992, pp. 441-446.
12. Ju, S.X., Black, M.J., Minnerman, S. & Kimber D. Analysis ofGesture and Action in Technical Talks for Video Indexing. InIEEE Trans. on Circuits and Systems for Video Technology.
13. Kutik, E.J., Cooper, W.E. & Boyce, S. Declination ofFundamental Frequency in Speakers’ Production ofParenthetical and Main Clauses. Journal of the AcousticSociety of America 73, 5 (1983), pp 1731-1738.
14. Lienhart, R., Pfeiffer, S., Fischer S. & Effelsberg, W. VideoAbstracting, ACM Communications, December 1997.
15. Medan, Y., Yair, E. & Chazan, D. Super Resolution PitchDetermination of Speech Signals, IEEE Transactions onSignal Processing, 39(1), Jan, 1991, pp 40-48.
16. Merlino, A., Morey, D. & Maybury, M. Broadcast NewsNavigation Using Story Segmentation. In Proceedings of the6th ACM international conference on Multimedia, 1997.
17. Omoigui, N., He, L., Gupta, A., Grudin, J. & Sanocki, E.Time-compression: System Concerns, Usage, and Benefits.Proceedings of ACM Conference on Computer HumanInteraction, 1999.
18. Ponceleon, D., Srinivasan, S., Amir, A., Petkovic, D. &Diklic, D. Key to Effective Video Retrieval: EffectiveCataloging and Browsing. In Proceedings of the 6th ACMinternational conference on Multimedia, September 1998.
19. Resnick, P. & Varian, H.R. (Guest Editors) RecommenderSystems. In ACM Communications, March 1997.
20. Silverman, K.E.A. The Structure and Processing ofFundamental Frequency Contours. Ph.D. dissertation,University of Cambridge, Apr. 1987.
21. Stanford Online: Masters in Electrical Engineering, 1998.http://scpd.stanford.edu/cee/telecom/onlinedegree.html
22. Smith M. and Kanade T. Video skimming andcharacterization through the combination of image andlanguage understanding techniques. Proceedings of IEEEComputer Vision and Pattern Recognition (CVPR), 775-781.1997. IEEE.
23. Stifelman, L. The Audio Notebook: Paper and Pen Interactionwith Structured Speech Ph.D. dissertation, MIT MediaLaboratory, 1997.
24. Stifelman, L.J., Arons, B., Schmandt, C. & Hulteen, E.A.VoiceNotes: A Speech Interface for a Hand-Held VoiceNotetaker. Proc. INTERCHI’93 (Amsterdam, 1993), ACM.
25. Tonomura, Y. & Abe, S., Content Oriented Visual InterfaceUsing Video Icons for Visual Database Systems. In Journalof Visual Languages and Computing, vol. 1, 1990. pp 183-198.
26. Zhang, H.J., Low, C.Y., Smoliar, S.W. and Wu, J.H. Videoparsing, retrieval and browsing: an integrated and content-based solution. In Proceedings of ACM Multimedia,September 1995, pp. 15-24.