Complex coacervation between β-lactoglobulin and acacia gum in aqueous medium
14
Complex coacervation between b-lactoglobulin and acacia gum in aqueous medium C. Schmitt a, * , C. Sanchez a , F. Thomas b , J. Hardy a a Laboratoire de Physicochimie et Ge ´nie Alimentaires, INPL-ENSAIA, 2 Avenue de la Fore ˆt de Haye, BP 172, F-54505 Vandoeuvre les Nancy Cedex, France b Laboratoire Environnement et Mine ´ralurgie, UMR 7569, CNRS-INPL, 15 Avenue du Charmois, BP 40, F-54501, Vandoeuvre les Nancy Cedex, France Received 1 March 1999; accepted 14 July 1999 Abstract The compatibility of b-lactoglobulin (b-lg) and acacia gum in aqueous medium was investigated as a function of the pH (3.6–5.0), the protein to polysaccharide weight ratio (50:1–1:20) and the total biopolymer concentration (0.1–5 wt%). The ternary phase diagrams obtained at low ionic strengths (0.005–10.7 mM) typically accounted for phase separation through complex coacervation. Thus a drop- shaped two-phase region was anchored in the water-rich corner. The electrostatic nature of the interactions between the two biopolymers was pointed out according to the pH dependence of the two-phase region’s breadth. Following the absorbance of the mixtures at 650 nm, the influence of the protein to polysaccharide ratio was also demonstrated. Electrophoretic mobility (m E ) measurements and chemical analyses of separated phases revealed the formation of soluble and insoluble coacervates and complexes. A remarkable value of the protein to poly- saccharide weight ratio (2:1) at pH 4.2 gave the same protein to polysaccharide (Pr:Ps) ratio in the two phases after 2 days, implying that electrostatic interactions are maximum between b-lg and acacia gum. The increase of the total biopolymer concentration reduced the influence of pH and protein to polysaccharide ratio. Also, the increase of the pH close to the b-lg IEP reduced the influence of the total biopolymer concentration and Pr:Ps ratio. As the biopolymer content was increased at pH 3.6 and 4.2, the relative b-lg solubility increased probably because of the self-suppression of complex coacervation. q 1999 Elsevier Science Ltd. All rights reserved. Keywords: Protein–polysaccharide interactions; Polyelectrolyte complexes; Associative phase separation; Phase diagram; Food hydrocolloids 1. Introduction Proteins and polysaccharides are the most widely used hydrocolloids in the food industry (Kilara, 1995). As the two biopolymers are often used simultaneously, the knowl- edge of their interactions is of great importance in the control of structure and texture of manufactured foods (Dickinson, 1995; Tolstoguzov, 1996). In this context, the question of the compatibility between proteins and poly- saccharides in solutions appears fundamental. A global explanation of the compatibility problems associated with macromolecules interactions is given by Flory–Huggin’s theory of polymer solutions (Flory, 1953). When two macromolecules are mixed with a solvent, the stability of the resulting ternary system is characterised, as a first global approach, by a one- or two-phase equilibrium state. This depends primarily on biopolymer–biopolymer and biopoly- mer–solvent interaction forces (enthalpic effects) and the size and structures of biopolymers (entropic effects). If the two biopolymers mixed together in an aqueous solvent are highly compatible, i.e. two oppositely charged macromole- cules, two phases are commonly obtained at equilibrium. Whereas a remaining dilute phase contains large amounts of solvent, the so-called coacervate phase is essentially composed by electrostatic interactions-based complexes that spontaneously rearrange to form liquid coacervates containing small amounts of solvent (Bungenberg de Jong, 1949). These macromolecular complexes, coacervate-type nano or microparticles can be used as food ingredients, microencapsulation systems or biomaterials (Sanchez & Paquin, 1997; Schmitt, Sanchez, Desobry-Banon & Hardy, 1998). A number of studies have demonstrated that the forma- tion of complexes and coacervates is sensitive to chemical, physical and structural parameters. The pH and the ionic strength are well known factors influencing the formation of complexes. Both affect the number of charges present on the biopolymers, controlling the intensity of the electrostatic interactions (Burgess, 1990; Xia & Dubin, 1994). Other important parameters have to be considered as for example Food Hydrocolloids 13 (1999) 483–496 0268-005X/99/$ - see front matter q 1999 Elsevier Science Ltd. All rights reserved. PII: S0268-005X(99)00032-6 www.elsevier.com/locate/foodhyd * Corresponding author. Tel.: 1 33-3-83-59-58-61; fax: 1 33-3-83-59- 58-04. E-mail address: [email protected] (C. Schmitt)
-
Upload
univ-montpellier -
Category
Documents
-
view
3 -
download
0
Transcript of Complex coacervation between β-lactoglobulin and acacia gum in aqueous medium

Complex coacervation betweenb-lactoglobulin and acacia gum inaqueous medium
C. Schmitta,* , C. Sancheza, F. Thomasb, J. Hardya
aLaboratoire de Physicochimie et Ge´nie Alimentaires, INPL-ENSAIA, 2 Avenue de la Foreˆt de Haye, BP 172, F-54505 Vandoeuvre les Nancy Cedex, FrancebLaboratoire Environnement et Mine´ralurgie, UMR 7569, CNRS-INPL, 15 Avenue du Charmois, BP 40, F-54501, Vandoeuvre les Nancy Cedex, France
Received 1 March 1999; accepted 14 July 1999
Abstract
The compatibility ofb-lactoglobulin (b-lg) and acacia gum in aqueous medium was investigated as a function of the pH (3.6–5.0), theprotein to polysaccharide weight ratio (50:1–1:20) and the total biopolymer concentration (0.1–5 wt%). The ternary phase diagramsobtained at low ionic strengths (0.005–10.7 mM) typically accounted for phase separation through complex coacervation. Thus a drop-shaped two-phase region was anchored in the water-rich corner. The electrostatic nature of the interactions between the two biopolymers waspointed out according to the pH dependence of the two-phase region’s breadth. Following the absorbance of the mixtures at 650 nm, theinfluence of the protein to polysaccharide ratio was also demonstrated. Electrophoretic mobility (mE) measurements and chemical analyses ofseparated phases revealed the formation of soluble and insoluble coacervates and complexes. A remarkable value of the protein to poly-saccharide weight ratio (2:1) at pH 4.2 gave the same protein to polysaccharide (Pr:Ps) ratio in the two phases after 2 days, implying thatelectrostatic interactions are maximum betweenb-lg and acacia gum. The increase of the total biopolymer concentration reduced theinfluence of pH and protein to polysaccharide ratio. Also, the increase of the pH close to theb-lg IEP reduced the influence of the totalbiopolymer concentration and Pr:Ps ratio. As the biopolymer content was increased at pH 3.6 and 4.2, the relativeb-lg solubility increasedprobably because of the self-suppression of complex coacervation.q 1999 Elsevier Science Ltd. All rights reserved.
Keywords:Protein–polysaccharide interactions; Polyelectrolyte complexes; Associative phase separation; Phase diagram; Food hydrocolloids
1. Introduction
Proteins and polysaccharides are the most widely usedhydrocolloids in the food industry (Kilara, 1995). As thetwo biopolymers are often used simultaneously, the knowl-edge of their interactions is of great importance in thecontrol of structure and texture of manufactured foods(Dickinson, 1995; Tolstoguzov, 1996). In this context, thequestion of the compatibility between proteins and poly-saccharides in solutions appears fundamental. A globalexplanation of the compatibility problems associated withmacromolecules interactions is given by Flory–Huggin’stheory of polymer solutions (Flory, 1953). When twomacromolecules are mixed with a solvent, the stability ofthe resulting ternary system is characterised, as a first globalapproach, by a one- or two-phase equilibrium state. Thisdepends primarily on biopolymer–biopolymer and biopoly-mer–solvent interaction forces (enthalpic effects) and the
size and structures of biopolymers (entropic effects). If thetwo biopolymers mixed together in an aqueous solvent arehighly compatible, i.e. two oppositely charged macromole-cules, two phases are commonly obtained at equilibrium.Whereas a remaining dilute phase contains large amountsof solvent, the so-called coacervate phase is essentiallycomposed by electrostatic interactions-based complexesthat spontaneously rearrange to form liquid coacervatescontaining small amounts of solvent (Bungenberg de Jong,1949). These macromolecular complexes, coacervate-typenano or microparticles can be used as food ingredients,microencapsulation systems or biomaterials (Sanchez &Paquin, 1997; Schmitt, Sanchez, Desobry-Banon & Hardy,1998).
A number of studies have demonstrated that the forma-tion of complexes and coacervates is sensitive to chemical,physical and structural parameters. The pH and the ionicstrength are well known factors influencing the formationof complexes. Both affect the number of charges present onthe biopolymers, controlling the intensity of the electrostaticinteractions (Burgess, 1990; Xia & Dubin, 1994). Otherimportant parameters have to be considered as for example
Food Hydrocolloids 13 (1999) 483–496
0268-005X/99/$ - see front matterq 1999 Elsevier Science Ltd. All rights reserved.PII: S0268-005X(99)00032-6
www.elsevier.com/locate/foodhyd
* Corresponding author. Tel.:1 33-3-83-59-58-61; fax:1 33-3-83-59-58-04.
E-mail address:[email protected] (C. Schmitt)

the biopolymer weight ratio and the biopolymer chargedensity, that affect the extent of the electrostatic interaction,the molecular weight of biopolymers and the total biopoly-mer concentration, that contribute to a low entropy ofmixing. The importance of physical factors has also beendescribed. For instance the temperature affects the Flory–Huggins interactional parameter between the biopolymersand the solvent. Also, the pressure and the shear rate affectthe structure of biopolymers as well as the formation and thestructure of the complexes and the coacervates (Schmitt etal., 1998).
Most of the studies on protein–polysaccharide coacerva-tion considered the effect of parameters such as the pH, theionic strength, the biopolymer charge density or molecularweight on the extent of the phase separation (Nairn, 1995).However, influence of processing parameters on the struc-ture of the coacervates has not been fully investigated.Moreover, to our knowledge, few studies have beenperformed on the stability of these coacervates without theaddition of chemical stabilising agents such as glutaralde-hyde that should be avoided for the use in foods. In thiscontext, we proposed to study the formation of suchelectrostatic complexes and coacervates betweenb-lacto-globulin, a whey protein, and acacia gum, a vegetal poly-saccharide, that are currently used in food formulation.
The b-lactoglobulin (b-lg) has been chosen due to itsquite well known structure (Sawyer, Brownlow, Polikarpov& Wu, 1998). It can play the role ofin situmolecular markerand will therefore contribute to the study of the structure andstability of the coacervate. Theb-lactoglobulin is the majorprotein of whey (40–50% in mass), thus it contributes in amajor way to whey proteins functional properties, i.e. ther-mal aggregation/gelation, surface properties (Kinsella,1984; de Wit, 1998; Wong, Camirand & Pavlath, 1996).The isoelectrical pH (IEP) ofb-lg is around 5.2, therefore,the protein displays an excess of positive charges below 5.2and an excess of negative charges above this value. More-over, an interesting property ofb-lg is its faculty of self-association. Depending on the environmental conditions ofpH, ionic strength, temperature, concentration,b-lg presentsa molecular weight of 18 350 as well as oligomeric forms,up to octamers (McKenzie, Sawyer & Smith, 1967; Mills &Creamer; 1975; Pantaloni, 1965; Townend & Timasheff,1960).
The acacia gum used in combination with theb-lg in thisstudy is exuded from theAcacia senegal(L.) African tree(Anderson, Millar & Weiping, 1991). Acacia gum (or gumarabic) is a complex polysaccharide containing a proteinfraction responsible for its efficient surface property that isattributed to the structure of the gum, the so-called “wattle-blossom” model (Connolly, Fenyo & Vandevelde, 1987;Menzies, Osman, Malik & Baldwin, 1996). Acacia gum isan arabinogalactan type polysaccharide composed of threedistinct fractions with different protein contents anddifferent molecular weights (Osman, Williams, Menzies &Phillips, 1993; Phillips, Takigami & Takigami, 1996;
Randall, Phillips & Williams, 1989). Its composition analy-sis revealed the presence of a main galactan chain carryingheavily branched galactose/arabinose side-chains. There-fore, gum arabic carries a net negative charge for pH valuesabove 2.0 (Kravtchenko, 1997). This peculiar compositionconfers to acacia gum a charge density which is six timesgreater than that of a linear polysaccharide having the samecomposition (Vandevelde & Fenyo, 1987), and a good cold-solubility due to the presence of residual charged groups andpeptidic fragments (Phillips et al., 1996). Gum acacia is awidely used polysaccharide in microencapsulation proce-dures (Dash, 1997; Nairn, 1995), film formation or emulsionstabilisation (Ray, Bird, Iacobucci & Clark, 1995).
The main objective of this first study is to characterisemacroscopically theb-lg–acacia gum coacervation inaqueous medium. We first choose to study the influence ofthe pH, that controls the biopolymer charge and the aggre-gation state of theb-lg, the biopolymer ratio and the totalbiopolymer concentration that have an effect on the forma-tion of complexes. The investigated pH range was below theIEP of theb-lg to maximise the compatibility between thebiopolymers.
2. Material and methods
2.1. Material
Acid processedb-lactoglobulin (lot 838) was a gift fromthe Besnier–Bridel Research Centre (Retiers, France). Thepowder contained (g/100 g powder) 4.75% moisture, 91%protein�N × 6:38�; 3.85% lactose and 0.40% ash (0.0008%Mg21, 0.012% Ca21, 0.027% Na1, 0.008% K1, 2% Cl2) asdetermined according to the AOAC procedures (AOAC,1984).
Acacia gum (lot 97 J 716) was a gift from the ColloidesNaturels International Company (Rouen, France). Thepowder contained (g/100 g powder) 6.65% moisture,89.95% polysaccharide, 0.30% nitrogen and 3.10% ash(0.2% Mg21, 0.61% Ca21, 0.032% Na1 and 0.9% K1).
Sodium hydroxide, hydrochloric acid (pH adjustment),and concentrated sulphuric acid were of analytical grade(Fischer Scientific SA, Elancourt, France). The Bradfordreagent used for the protein determination was obtainedfrom the Bio-Rad company (Hercules, CA, USA).
2.2. Preparation ofb-lg and acacia gum stock dispersions
b-lg and acacia gum aqueous stock dispersions wereprepared in percent by weight (wt%). Known amounts ofbiopolymer powder were dispersed in distilled water undergentle stirring at 20 18C during at least 2 h. The disper-sions were left at 4 18C during 18 h to allow completehydration of macromolecules. The stock dispersions werethen centrifuged at 3100g for 30 min �25^ 28C� to removeinsoluble matter and air bubbles. The pH adjustment of thedispersions was achieved at 2018C by careful addition of
C. Schmitt et al. / Food Hydrocolloids 13 (1999) 483–496484

1, 0.1 and 0.01N HCl or NaOH. When necessary, distilledwater was added to adjust the total biopolymer content.
2.3.b -lg and acacia gum molecular masses
The b-lg and acacia gum weight average molecularmasses (Mw) were determined by gel permeation chromato-graphy (GPC). The system consisted of a Shodex KW 802.5(7.8 mm× 300 mm) silica column (Showa Denko, Dussel-dorf, Germany), a Waters 510 HPLC isocratic pump systemequipped with a Waters 7171 Autosampler and a Waters996 Photodiode Array Detector preset at 280 nm (WatersSA, Saint-Quentin-en-Yvelines, France). The column wascalibrated with eight protein standards covering the mole-cular mass range from 1450 to 480 000 (ICN BiomedicalsInc, Aurora, OH, USA). 100ml of sample dispersion(0.5 wt%) were injected into the column after filtrationthrough 0.2mm filters (Lida Manufacturing Corp, WI,USA). The temperature was kept at 200:58C: Eluentwas distilled water containing 30 mM NaCl at a flow rateof 1 ml min21.
2.4. Electrophoretic mobility measurements
Determination of the electrophoretic mobility (mE) ofcolloids in aqueous solution is a convenient means for eval-uating their surface charge density. We determined themE ofb-lg, acacia gum and mixedb-lg–acacia gum dispersions ata total biopolymer concentration of 0.1 wt% for the three pHtested (3.6–4.2–5.0). In mixed solutions, the protein topolysaccharide ratios (Pr:Ps) were set to 8:1, 4:1, 2:1 and1:1. Measurements were carried out on a Zetaphoremetre IIapparatus equipped with an Oscar OS-45D CCD videocamera (Sephy Technology, France). The biopolymerdispersions were injected using a plastic syringe into aquartz-measuring cell containing two electrodes. At thesame time, the cell was lighted with a 2 mW He/Ne lasersource to obtain the scattering spots of the particles. A100 V electric field was then alternatively applied. Thevelocity of the particles was recorded (during five times1 s in each direction) using the Image Analysis 1.9 softwarevia the video camera (Sephy Technology, France). ThemE
of the particles was calculated according to the Smolu-chowsky equation, assuming that the particle dimensionsare much greater than the electronic double-layer thicknessand independently from their shape (Hunter, 1986):
n � mE × E �1�where n is the velocity of the particles in the solution(mm s21), E the applied electrical field per unit length ofthe measuring cell (V cm) and themE of the particles(mm s21 V21 cm21 that will be referred as e.m.u. in thefollowing). Reliability of measurements was checked witha 2:5 × 1024 wt% titanium oxide solution in 0.1N KCl�mE � 21:99^ 0:03 e:m:u:�: Two experiments wereperformed (three assays per experiment).
2.5. Size ofb -lg aggregates
The size ofb-lg aggregates was determined by laser lightscattering (LLS). Theb-lg dispersions (pH 4.2) were char-acterised using a Mastersizer S 2.01 granulometer equippedwith a 5 mW He/Ne (632.8 nm) laser beam (Malvern,Orsay, France). Concentrated aliquots were introducedinto the optical measuring cell with a sampling device oper-ating at 1000 rpm and containing distilled water at pH 4.2.The amount of dispersion needed to obtain reliable resultscorresponded to at least 15% signal obscuration. For prac-tical reasons (too low obscuration value) the 0.1 wt%b-lgconcentration could not be investigated. The resulting lightscattering spectra were analysed according to a polydispersemodel in order to calculate the size distribution of the aggre-gates. The optical properties of the solutions were assumedto be those of milk proteins in water. The experiment wasduplicated (three assays per experiment).
2.6.b -lg–acacia gum–water ternary phase diagrams
Ternary phase diagrams ofb-lg–acacia gum mixedaqueous dispersions were established at pH 3.6, 4.2 and5.0 at 20 18C: The ionic strength of the dispersions wasnot adjusted and was only due to the mineral content of thebiopolymer powders (0.005 mM at 0.1 wt% to 10.7 mM at20 wt% biopolymer concentration). An aqueous dispersionof b-lg (at an exact wt% concentration) was titrated with anaqueous dispersion of acacia gum at the same concentration(and conversely). The phase separation points were deter-mined by the appearance of turbidity on the basis of a 10%increase of optical density as recorded at 650 nm using anUltrospec III UV/Visible spectrophotometer with a 1 cmpathway (Pharmacia LKB, England). The amounts ofb-lgand acacia dispersions used were determined by weight(^0.0001 g) using a Sauter RE 1614 weighting device(Ebingen, Germany). The wt% biopolymer concentrationscould then be calculated.
The tie-lines of the system, corresponding to the compo-sition of each component in the two phases at the thermo-dynamic equilibrium, were determined at pH 4.2. Knownamounts ofb-lg and acacia gum solutions were mixed intohermetically sealed tubes. A Pr:Ps ratio of 2:1 was selected,as it corresponded to total biopolymer concentrationenclosed in the two-phase region of the phase diagram.The mixed solutions were left at 20 18C for 2 days toreach equilibrium, then centrifuged at 10 000g during 1 h.The two phases were separated and weighted to determinethe wet mass fraction of each phase. Water,b-lg and acaciagum compositions were determined in the supernatant. Thewater content was evaluated by weighting the sample toconstant weight at 1038C. The acacia gum content wasdetermined on 10 samples (two experiments) by thephenol–sulphuric colorimetric method (Dubois, Gilles,Hamilton, Rebers & Smith, 1956). The Bradford colori-metric method was used forb-lg determination (Bradford,
C. Schmitt et al. / Food Hydrocolloids 13 (1999) 483–496 485
1976). The biopolymer and solvent contents in the bottomphase were calculated by subtracting the supernatantcontents from the total biopolymer and solvent concentra-tions. It is important to note that the presence of acacia gumdid not affect the results obtained by the Bradford method.Conversely, due to the presence of lactose, a small effect ofb-lg was noticed on the phenol–sulphuric method. In orderto take this interference into account, the absorbancerecorded at 470 nm according to the Dubois method wascorrected after determination of the protein content, usingthe Bradford’s method.
The resulting water,b-lg and acacia gum values (in %)were compiled to build up a ternary phase diagram repre-sented by an equilateral triangle using the TContour 4.1
shareware (John Pilling, Michigan Technological Univer-sity, USA).
2.7. Effects of pH andb -lg to acacia gum weight ratio
Effects of pH and protein to polysaccharide ratio werefollowed by mixing solutions ofb-lg and acacia gum atdifferent pH values (3.6–5.0) and different total biopolymerconcentrations (0.1–5 wt%). Distinct mixing proportionswere used to obtain a Pr:Ps ratio ranging from 50:1 to1:20. The absorbance of the mixtures was recorded at650 nm (two experiments, four assays per experiment). Inorder to check the effect of the mineral content difference ofthe two powders before mixing, the ionic strength of eachbiopolymer solution was adjusted by the addition of NaClfor the highest biopolymer concentration (5 wt%) at all thetested ratios. No significant difference in the absorbancevalues was observed as compared to those obtained forthe same solutions without ionic strength adjustment�p ,0:05�: Consequently, all the following experiments werecarried out without adjustment of the ionic strength.
The b-lg and acacia gum compositions of the differentphases in the control solutions and in three mixtures (ratios8:1, 2:1 and 1:1) at 0.1, 0.5, 1.0 and 5.0 wt% were deter-mined after 2 days (centrifugation 10 000g, 1 h) using theabove mentioned methods at pH 3.6, 4.2 and 5.0 (twoexperiments, 10 assays per experiment).
2.8. Statistical analysis
The obtained results were analysed by Anova using theStatView 5121 software (Brain Power Inc., CA, USA).Comparison of means was carried out using the FisherPLSD test at a confidence level of 0.05.
3. Results and discussion
3.1. Characterisation ofb -lg and acacia gum
3.1.1. Molecular massesThe molecular masses (Mw) of theb-lg and acacia gum as
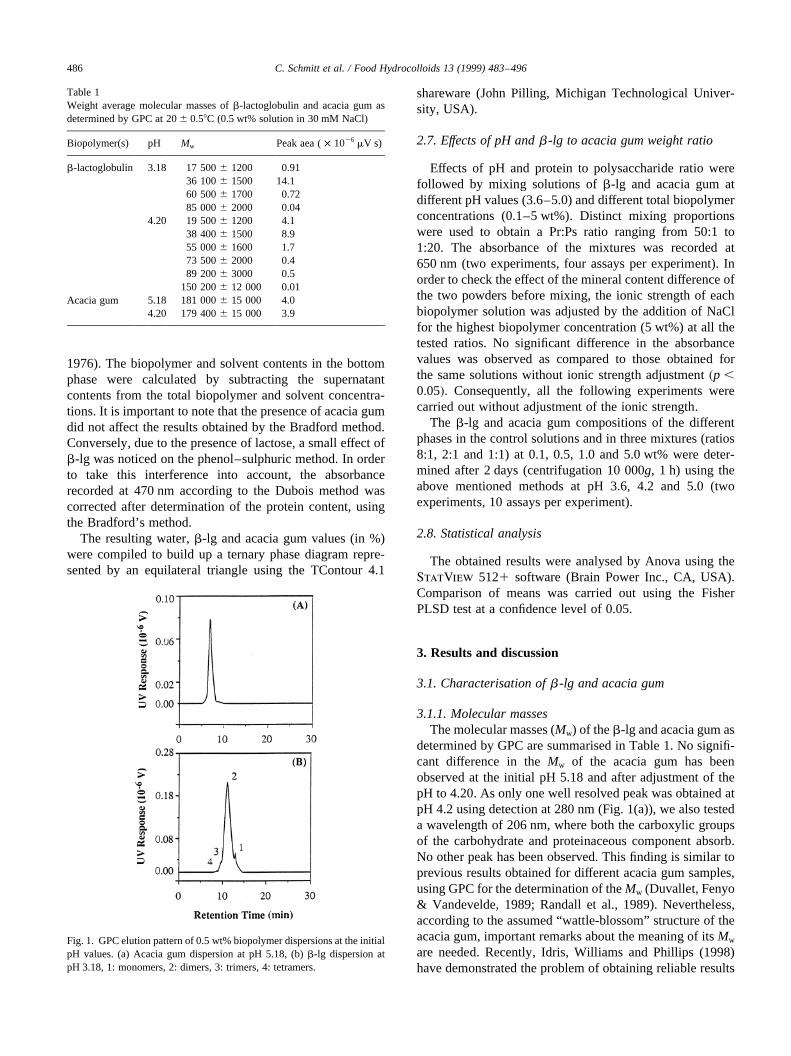
determined by GPC are summarised in Table 1. No signifi-cant difference in theMw of the acacia gum has beenobserved at the initial pH 5.18 and after adjustment of thepH to 4.20. As only one well resolved peak was obtained atpH 4.2 using detection at 280 nm (Fig. 1(a)), we also testeda wavelength of 206 nm, where both the carboxylic groupsof the carbohydrate and proteinaceous component absorb.No other peak has been observed. This finding is similar toprevious results obtained for different acacia gum samples,using GPC for the determination of theMw (Duvallet, Fenyo& Vandevelde, 1989; Randall et al., 1989). Nevertheless,according to the assumed “wattle-blossom” structure of theacacia gum, important remarks about the meaning of itsMw
are needed. Recently, Idris, Williams and Phillips (1998)have demonstrated the problem of obtaining reliable results
C. Schmitt et al. / Food Hydrocolloids 13 (1999) 483–496486
Table 1Weight average molecular masses ofb-lactoglobulin and acacia gum asdetermined by GPC at 20 0:58C (0.5 wt% solution in 30 mM NaCl)
Biopolymer(s) pH Mw Peak aea (× 1026 mV s)
b-lactoglobulin 3.18 17 500 1200 0.9136 100^ 1500 14.160 500^ 1700 0.7285 000^ 2000 0.04
4.20 19 500 1200 4.138 400^ 1500 8.955 000^ 1600 1.773 500^ 2000 0.489 200^ 3000 0.5
150 200^ 12 000 0.01Acacia gum 5.18 181 000 15 000 4.0
4.20 179 400 15 000 3.9
Fig. 1. GPC elution pattern of 0.5 wt% biopolymer dispersions at the initialpH values. (a) Acacia gum dispersion at pH 5.18, (b)b-lg dispersion atpH 3.18, 1: monomers, 2: dimers, 3: trimers, 4: tetramers.

concerning theMw of acacia gum, depending on the compo-sition of the sample, its origin and the age ofAcacia senegaltrees. The GPC–UV detection performed on eight distinctsamples of gum arabic accounted for a molecular massdistribution ranging from 2× 10⁵ to 7:9 × 10⁵
: Three prin-cipal components (fractions 1–3) withMw ranging from 124 × 106
; 1:5 2 3 × 10⁵ and 1:8 × 10⁵ were detected. More-over, high intensity UV-spectra were obtained for fractions1 and 3, indicating high protein contents. Considering thesefindings together with the GPC pattern of the gum obtainedon Fig. 1(a), we consider theMw of our acacia gum sampleas monodisperse and mainly composed by the fraction 3previously described.
Theb-lg sample presented a polydisperseMw distributionboth before and after pH adjustment to 4.2. Fig. 1(b) showsthat fourb-lg species were present in the initial 0.5 wt%dispersion. The major intensity peak corresponded to thedimeric form of the protein. Monomers and trimers werealso detected as well as small amounts of higher aggregatedstates (tetramers and/or pentamers) ofb-lg (Table 1). AfterpH adjustment to 4.2, that is closer to the protein IEP (5.2),largerMw species were also detected, namely pentamers andoctamers (Table 1). Although at pH 4.2, the dimer peak isstill unambiguously the larger one, monomer and trimerpeaks are larger than at pH 3.18. Our results clearly showedthe effect of the pH on the aggregation of the protein. As theintensity of peak corresponding to the dimeric formdecreased at pH 4.2, as compared to pH 3.18, we expectthat the pH-induced formation of pentamers and octamerswas essentially due to the interaction of the dimers with theother species of theb-lg present at the initial pH (Fig. 1).Similar mechanism has been reported recently in the forma-tion of thermal-inducedb-lg oligomers using Multi AngleLaser Light Scattering–GPC (Bauer, Hansen & Øgendal,1998).
3.1.2. Size distribution ofb -lg aggregatesFig. 2 displays the size distribution in volume and number
of b-lg dispersions at pH 4.2 for biopolymer concentrationsof 0.5, 1.0 and 5.0 wt%. Considering the particle diameterdistribution expressed in volume, the aggregate size varied
from 1 to 60mm (Fig. 2). The mean value was around 8mmindependently of the initial biopolymer concentration. Thevolume to surface average diameters (d32) were 8:1^
1 mm at 0.5 wt%, 7:4^ 0:8 mm at 1 wt% and 7:1^
1:2 mm at 5.0 wt%. On the contrary, the diameter in numberof b-lg aggregates varied from 50 to 800 nm. The meanvalue was centred around 200 nm and significantlydepended on the protein concentration (Fig. 2). Around50% of the b-lg aggregates exhibited a mean diameterbelow 180 10 nm at 0.5 wt%, 210 11 nm at 1 wt%and 290 10 nm at 5 wt%, respectively. Thus, whereasthe size of the large-sized aggregates was unaffected bythe b-lg concentration, small-sized aggregates exhibited asignificant increase in size when the protein concentrationwas increased. This observation confirmed the polydisper-sity of b-lg dispersions already showed by GPC measure-ments. However, it should be noted that middle- and large-sized aggregates did not appear on GPC profiles, even in thevoid volume of the column. We assumed that discardmentof these aggregate populations occurred in the guardcolumn, since GPC measurements performed withoutsample filtration gave the same results as in Fig. 1. Onecan also imagine that large-sized aggregates were notpresent in the small GPC sample volume (100ml) becausetheir number was much low compared to the total number ofaggregates. The mean diameter of 200 nm determined bydynamic light scattering for the small-sized aggregates isclose to the values already reported for non-purifiedb-lgsamples at pH 3.5 and 258C (Haque & Sharma, 1997).Formation of these aggregates has been attributed to thepresence of small amphipatic peptides on the surface ofthe non-purifiedb-lg molecules, which induce hydrophobic
C. Schmitt et al. / Food Hydrocolloids 13 (1999) 483–496 487
Fig. 2. Size distributions ofb-lg aggregates at pH at 0.5 wt% (—), 1.0 wt% (- -) and 5.0 wt% (…).
Fig. 3. Electrophoretic mobility of 0.1 wt% biopolymer dispersions at208C. Bars represent standard deviation. (a)b-lg (W), acacia gum (X).(b) b-lg–acacia gum blends at 8:1 (W), 4:1 (X), 2:1(A), and 1:1 (B) ratios.

interactions and aggregation. Thus, no aggregation of theprotein was observed in the same conditions when theprotein was purified by GPC after dispersion in water(Sharma, Haque & Wilson, 1996). However, our opinionis that the presence ofb-lg aggregates at all pH studiedcan be primarily explained by the partial denaturation ofb-lg during whey processing. This could favour thepresence of protein oligomers as reported in recent studiesinvolving heat treatment ofb-lg solutions (Bauer, Hansen &Øgendal, 1998; Hoffman, Sala, Olieman & de Kruif, 1998)or whey proteins solutions (Ju & Kilara, 1998).
The influence of the pH and the total biopolymer concen-tration on the molecular association of theb-lg have beenunambiguously demonstrated here. Thus the polydispersityof the protein sample has to be considered as a significantparameter, in the control of the interactions with the acaciagum as well as in the explanation of the phase diagrams.
3.1.3. Electrophoretic mobility ofb -lg and acacia gumdispersions
In order to predict the most appropriate region for theformation of electrostatic complexes, electrophoretic mobi-lities (mE) of the two biopolymers were investigated in func-tion of the selected pH (3.6–5.0; Fig. 3(a)). ThemE of theacacia gum was negative and increased linearly with theincrease of the pH, i.e.20.5 e.m.u. at pH 3.6 vs22 e.m.u. at pH 5.0. Similar variation ofmE has beenreported in the pH range 3.5–5.0 for acacia gum adsorbedonto Aerosil 200 particles (Peters, van Bommel & Fokkens,1992). In the same vein, Burgess and Carless (1984) foundmE values up to22.2 e.m.u. using the latter method in thesame pH range. We explain the different values found by theprobable polydispersity and origin of the acacia gumsamples.
mE of the b-lg decreased by increasing the pH(11.5 e.m.u. at pH 3.6 to20.5 e.m.u. at pH 5.0). A zerovalue was obtained at pH 4.8, thus we concluded to the IEPof ourb-lg sample. It is important to note that the difference
between themE of the two biopolymers remained unchanged(2 e.m.u.) on the whole pH range tested. According to thesemeasurements, strong electrostatic interactions between thetwo biopolymers should be effective in the 3.6–4.6 pHrange, where themE of biopolymers are of opposite signs.
3.2. Characterisation of theb-lg and acacia gum mixtures
3.2.1. Electrophoretic mobilities ofb -lg–acacia gummixtures
Fig. 3(b) reports the results obtained forb-lg–acacia gummixtures at different Pr:Ps weight ratios, but at the sameweight concentration (0.1 wt%). ThemE obtained for thefour tested blends were different from those obtained forthe biopolymers alone at pH# 4.6. Above pH 4.6, themE
obtained for all mixtures were close to that of the acaciagum alone, indicating a good accessibility of the polysac-charide to the solvent. These observations were in favour ofthe formation of electrostatic complexes between the twobiopolymers and were confirmed by the sharp increase ofthe absorbance in the dispersions. Moreover, formation ofcomplexes could be easily followed on the screen of thevideo camera. ThemE of the mixtures depended on thePr:Ps ratio. As a general trend, the IEP of the complexesincreased with the increase of the Pr:Ps ratio. This factimplied the control of themE of the mixture by the protein.For example, a positive value has been obtained between pH3.6 and 4.2 for the 8:1 ratio. The IEP was attained at pH 4.2revealing a total neutralisation of the charges carried by themacromolecular complexes. ThemE then decreased almostlinearly to reach22 e.m.u. at pH 5.0. It is worth noting thatthe shape of the curve was close to that of theb-lg alone, butwith a decline of20.75 e.m.u. towards the negative values.The mE profile obtained for the protein to polysaccharideratio of 1:1 was clearly different to those obtained for theother ratios. It was, however, close to that of the polysac-charide alone, excepted at low pH values (3.6–3.8) wheremE sharply decreased from20.25 to21.75 e.m.u. There-after, themE remained constant at22 e.m.u., i.e. less nega-tive than for acacia gum alone at the same pH values.Intermediate ratios between 8:1 and 1:1 gave intermediatemE profiles. For biopolymer weight ratios of 4:1 and 2:1, theextrememE values were comprised between those obtainedfor ratios of 8:1 and 1:1 (10.8 e.m.u. at pH 3.6 and22 e.m.u. at pH 5.0). Nullity of themE was obtainedbetween pH 3.8 and 4.0 for both ratios. These observationscould indicate that the maximum in electrostatic inter-actions, and therefore in the formation of complexes wasattained. ThemE measurements on mixtures revealed thatcontrol of such systems at industrial scale could be prob-lematic in the 3.8–4.4 pH range, according to the sharpmE
variations recorded (drop of 2 e.m.u. between pH 4.0 and4.2 for the 2:1 ratio). However, it is interesting to note thatthese charged complexes could be advantageously used incombination with other charged component (biopolymers,
C. Schmitt et al. / Food Hydrocolloids 13 (1999) 483–496488
Fig. 4. Complete phase diagram of the water–b-lg–acacia gum system at208C and pH 4.2 (A), tie-lies; (B), binodal points.

surfactants, lipids) to obtain new functional supramolecularentities.
3.2.2. Ternary phase diagramsThe ternary phase diagram obtained for the intermediate
pH of 4.2 exhibited a drop-shaped two-phase region locatedin the water-rich corner (Fig. 4). This shape is characteristic
of complex coacervation which generally takes placebetween oppositely charged macromolecules at low ionicstrength (Piculell, Bergfeldt & Nilsson, 1995). Such a resultis backed up by the partition of the tie lines on each sides ofthe water corner bisector, as it is generally the case forcomplex coacervation. The confinement of the two-phaseregion into the solvent corner typically traduces the exis-tence of an equilibrium between a rich solvent phase (phaseI on Fig. 4) and a rich biopolymer phase (phase II on Fig. 4).Similar behaviour has been already reported for a number ofpolymeric systems (Thalberg, Lindman & Karlstro¨m, 1990),biological systems (Albertsson, 1971; Bungenberg de Jong,1949) or mixed ones (Xia & Dubin, 1994). The formation ofelectrostatic complexes has been already reported insystems containing acacia gum and a protein, as for examplegelatin or albumin (Burgess, 1990; Burgess & Singh, 1993).It is usually explained in terms of entropic and enthalpiceffects between the biopolymers and the solvent molecules(Tolstoguzov, 1997; Zhang, Karlstro¨m & Lindman, 1994).In fact, the biopolymer association decreases the entropy ofmixing of the system by lowering the number of possiblemacromolecule conformations, but this effect is counter-balanced by a strong enthalpic contribution, arising fromthe liberation of water molecules and counter-ions. Thebalance between the two effects contribute to the stabilisa-tion of the system.
It is worth noting that the protein apex did not correspondto a pure component as theb-lg sample was polydispersed.Strictly, the phase diagram obtained in the present study is apseudo ternary phase diagram, as we also neglected thepresence of micro-ions in the dispersions. However, it willbe assumed that, as a first approximation, theb-lg solutionswere monodisperse in size at all the pH tested.
Some questions arise from the significance of tworegions. For instance, we considered the two separatedphases at the equilibrium after 2 days and centrifugation at10 000g, but the supernatant phase could still containunreacting biopolymers and/or soluble complexes and parti-cles that could not be removed according to our experimen-tal conditions. It is known that phase diagram determinationsharply depends on the experimental conditions that areused (Reisman, 1970). Such problems of complexes/parti-cles solubility could be avoided using molecular biophysicalmethods such as Fourier transform infrared spectroscopy orsmall angle neutron scattering that could reveal local micro-phase separation phenomena (Durrani, Prystupa, Donald &Clark, 1993; Renard, Boue´ & Lefebvre, 1997). Neverthe-less, taking into account the limits of the method, ternaryphase diagrams showed that phase separation occursbetweenb-lg and acacia gum in aqueous medium in thepH and concentration range tested.
3.2.3. Effect of the pHThe effect of pH has been first determined on partial
phase diagrams obtained at different pH values, namely3.6, 4.2 and 5.0 where theb-lg carried positive charges
C. Schmitt et al. / Food Hydrocolloids 13 (1999) 483–496 489
Fig. 5. Partial phase diagrams of ternary water–b-lg–acacia gum mixtures.(a) pH 3.6, (b) pH 4.2, (c) pH 5.0 (see text for details). I: one-phase region.II: two-phases region.

(see Fig. 3(a)). The shape of the two-phase region was asym-metrical at all the pH studied (Fig. 5(a)–(c)). Thus, the upperlimit of the two-phase region was closer to the water–b-lg sidethan the lower limit. This indicated that an aqueous solution ofacacia gum could dissolve large amounts ofb-lg solutionbefore phase separation. By contrast, phase separationappeared almost instantly upon addition of an acacia gumsolution into ab-lg one. The breadth of the two-phaseregion strongly depended on the pH value. It was broader asthe pH value was away from the IEP of theb-lg. Theseresults are consistent with the involvement of coulombicinteractions in complex coacervation phenomenon (Schmittet al., 1998).
The asymmetry and shrinking of the two-phase regioncan be explained according to the variation of themE ofeach macromolecule with the pH (Fig. 3(a)). Fig. 3(a)clearly shows that themE of the acacia gum is always higherthan that of theb-lg, independently from the pH. For thatreason, considering total charge compensation, greateramounts of a protein solution are required to neutralise anacacia gum solution when the pH is increased (Wang, Gao& Dubin, 1996). According to our experiments, these condi-tions are met at pH 4.2 for the 8:1 Pr:Ps ratio as the resultingmE of the complexes is zero. These results are in agreementwith those obtained for water–gelatin–acacia gum (Burgess& Carless, 1984) and water–gelatin–sodium carboxy-methylcellulose mixtures (Koh & Tucker, 1988a). Thisresult also suggested the ability of creating different kindsof b-lg–acacia gum complexes by choosing the order ofmixing the biopolymer solutions, as the charge neutralisa-tion will differ.
The effect of pH on the complex coacervation betweenb-lg and acacia gum was also determined by following thevariation of the blends’ absorbance at 650 nm. As a preli-minary remark, any significant variation of absorbanceshould reveal the appearance of coacervates or aggregatesby modifying the light properties of the system. In a firststep, the contribution of each biopolymer in the absorbancevalues was determined at 650 nm in function of the pH(Fig. 6). We found that acacia gum dispersions displayeda small contribution in the absorbance variation on the pHrange tested. As usual,b-lg dispersions displayed a different
C. Schmitt et al. / Food Hydrocolloids 13 (1999) 483–496490
Fig. 6. Absorbance (650 nm) ofb-lg and acacia gum dispersions in func-tion of pH.b-lg concentration: 0.1 wt% (W); 0.5 wt% (A); 1.0 wt% (K) and5.0 wt% (S); acacia gum concentration 0.1 wt% (X); 0.5 wt% (B); 1.0 wt%(O) and 5.0 wt% (V).
Table 2Compositions of the two phases obtained after 2 days forb-lg/Acacia gum mixtures at pH 3.6 and 208C (similar superscripts within a column indicate nosignificant difference (PLSD,p , 0:05�)
Biopolymerconcentration (wt%)
Mixing proportions (%) Partition of theb-lg in the twophases (%)
Partition of the Acacia gum inthe two phases (%)
Protein to polysaccharide ratioin the two phases
Acacia gum (Acaciagum1 b-lg)
Bottom phase Supernatant Bottom phase Supernatant Bottom phase Supernatant
0.1 0 32a 68a – – – –11 88b 12b 91a 9a 7.00a 11.00a
33 95c 5c 88a 12b 2.20b 0.87b
50 86bg 14b 92a 8a 0.93c 1.75c
100 – – 0b 100c – –0.5 0 34a 66a – – – –
11 79dg 21dg 67c 33d 8.50d 5.00d
33 88b 12b 92a 8a 1.93e 2.81e
50 76d 24d 68c 32d 1.11f 0.75f
100 – – 0b 100c – –1.0 0 35a 65a – – – –
11 42e 58e 91a 9a 3.36g 51.00g
33 58f 42f 64c 36d 1.85e 2.33h
50 82g 18g 76d 24e 1.07f 0.75f
100 – – 0b 100c – –5.0 0 30a 70a – – – –
11 47e 53e 96a 4f 3.56g 116.50i
33 62f 38hf 64c 36d 1.96e 2.15j
50 64f 36h 96a 4f 0.66h 9.00k
100 – – 0b 100c – –

C. Schmitt et al. / Food Hydrocolloids 13 (1999) 483–496 491
Table 3Compositions of the two phases obtained after 2 days forb-lg/Acacia gum mixtures at pH 4.2 and 208C (similar superscripts within a column indicate nosignificant difference (PLSD,p , 0:05�)
Biopolymer concentration (wt%) Mixing proportions (%) Partition of theb-lg in thetwo phases (%)
Partition of the Acacia Gumin the two phases (%)
Protein to polysaccharideratio in the two phases
Acacia gum (Acaciagum1 b-lg)
Bottom pase Supernatant Bottom pase Supernatant Bottom pase Supernatant
0.1 0 62a 38ad – – – –11 85b 12b 91a 9a 7.00a 11.00a
33 83b 5c 88a 12b 2.20b 0.87b
50 76c 14b 92a 8a 0.93c 1.75c
100 – – 0b 100c – –0.5 0 60a 40d – – – –
11 65ae 35ad 82b 18b 5.91d 13.63d
33 73c 27c 73e 27e 2.00b 2.11b
50 76c 26c 6c 94c 12.67e 0.25c
100 – – 0d 100d – –1.0 0 57d 43d – – – –
11 59d 41d 81b 19b 5.36f 15.65e
33 66ae 34a 71e 29e 1.91b 2.30f
50 64ae 36a 9c 91c 7.11g 0.39g
100 – – 0d 100d – –5.0 0 67ae 33a – – – –
11 59d 41d 79b 21b 5.48f 14.28h
33 69e 31a 68f 32e 2.06b 1.96b
50 61a 39d 20g 80f 3.04h 0.49i
100 – – 0d 100d – –
Table 4Compositions of the two phases obtained after 2 days forb-lg/Acacia gum mixtures at pH 5.0 and 208C (similar superscripts within a column indicate nosignificant difference (PLSD,p , 0:05))
Biopolymer concentration (wt%) Mixing proportions (%) Partition of theb-lg in thetwo phases (%)
Partition of the Acacia Gumin the two phases (%)
Protein to polysaccharideratio in the two phases
Acacia gum (Acaciagum1 b-lg)
Bottom phase Supernatant Bottom phase Supernatant Bottom phase Supernatant
0.1 0 65ad 35af – – – –11 82b 18b 45a 55a 13.30a 2.42a
33 76c 24c 15b 85b 10.20b 0.57b
50 68a 32a 28c 72c 2.42c 0.44c
100 – – 0d 100d – –0.5 0 63ad 37a – – – –
11 60de 40df 27c 73c 16.30d 4.02d
33 65ad 35a 19eg 81b 6.93e 0.88e
50 64ad 36a 28c 72c 2.28c 0.50f
100 – – 0d 100d – –1.0 0 60de 40df – – – –
11 56e 44dg 24c 76c 17.12f 4.62g
33 60d 40df 46a 54e 2.65g 1.50h
50 57e 43d 35f 65f 1.62h 0.66i
100 – – 0d 100d – –5.0 0 61de 39a – – – –
11 57e 43dg 26c 74c 16.07d 4.26j
33 52e 48eg 15b 85b 7.05i 1.14k
50 54e 46dg 22cg 78c 2.46g 0.58b
100 – – 0d 100d – –

behaviour, especially at 1.0 and 5.0 wt% concentrationswhich exhibited a sharp increase of the absorbance at pHvalues close to 5.0 (maximum at pH 4.8). Obviously, theseresults can be attributed to the presence of small and largeb-lg aggregates in the dispersions. Thus, the large increase ofthe absorbance at 650 nm at pH values close to the IEP (5.2)is mainly due to the increase of the particles’ number andsize. Interestingly, the maximum in absorbance obtained atpH 4.8 corresponded to the zero value ofb-lg mE (Fig. 3(a)).The 4.2–5.0 pH range also corresponded to an increase oftheb-lg insolubilisation. For example, 30% of theb-lg wasinsoluble at pH 3.6, whereas this proportion reached 57–67% at pH 4.2 and 5.0 (Tables 2–4). This low solubility ofb-lg at low ionic strength in the 4.6–5.0 pH range has beenalready reported on commercialb-lg concentrates (de Wit& van Kessel, 1996). At these pH values,b-lg oligomerscould interact, resulting in protein aggregates of highermolecular weight that modified the light absorption proper-ties of the sample. In our case, the high absorbance valuesobtained at high biopolymer concentrations could also resultfrom multiple light scattering phenomena, light absorptionand diffusion due to an excess of particles (Hermansson,1990; Koh & Tucker 1988b). Thus, for practical reasons,total biopolymer concentrations higher than 5.0 wt% werenot selected.
Fig. 7 presents the results obtained for the water–b-lg–acacia gum mixtures. For the 0.1 wt% biopolymer concen-tration, no absorbance variation was observed at pH valuesabove 4.4 independently of the Pr:Ps ratio (Fig. 7(a)).
Moreover, all the curves exhibited a similar shape, with amaximum in absorbance around pH 4.0. One exception was,the curve obtained for the 1:1 biopolymer ratio, thatexhibited an increase of the absorbance with thedecrease of the pH. The maximum absorbance valueobtained below pH 4.4 decreased with Pr:Ps ratiofrom 2:1 to 50:1. When the total biopolymer concentra-tion increased to 0.5 wt%, a move of the previouscurves towards higher pH values was observed (Fig. 7(b)).The pH value of 4.4 was also critical for detecting the firstclear absorbance variation for a 1:2 ratio. Interestingly, noabsorbance variation was observed in the pH range consid-ered for ratios where the acacia gum was in excess (1:6, 1:10and 1:20). At 1 wt% biopolymer concentration, the maxi-mum of absorbance was obtained at pH 4.4 for a Pr:Ps ratioof 4:1 (Fig. 7(c)). Similarly to 0.5 wt%, the ratios of 1:6 to1:20 did not exhibit absorbance variation. On the contrary,the difference in absorbance variation was reduced betweenthe curves corresponding to ratios from 6:1 to 50:1 (excessof protein). For the last total biopolymer concentrationtested (5.0 wt%), the absorbance varied at all pH valuesand ratios. The maximum in absorbance variation wasfound at pH 4.2 for a 2:1 ratio. Finally, only slight variationcould be observed between the 8:1 to 50:1 ratio curves whenthe pH was above 4.6 (Fig. 7(d)). These findings showedboth the effect of pH and biopolymer concentration. Forexample, higher total biopolymer concentrations arerequired to obtain complexes at ratios where the acaciagum is in excess.
C. Schmitt et al. / Food Hydrocolloids 13 (1999) 483–496492
Fig. 7. Absorbance (650 nm) ofb-lg–acacia gum mixtures in function ofthe pH at different total biopolymer concentrations and Pr:Ps ratios: (a)0.1 wt% total biopolymer concentration; (b) 0.5 wt% total biopolymerconcentration; (c) 1.0 wt% total biopolymer concentration; (d) 5.0 wt%total biopolymer concentration. (W): ratio 50:1, (X): ratio 25:1, (A): 20:1,(B): ratio 10:1, (e): ratio 8:1, ( ): ratio 6:1, (S): ratio 4:1, (V): ratio 2:1,( ): ratio 1:1, ( ): ratio 1:2, (K): ratio 1:6, (O): ratio 1:10, (+): ratio 1:20.
Fig. 8. Absorbance (650 nm) ofb-lg–acacia gum mixtures in function ofthe Pr:Ps ratio at various total biopolymer concentrations and pH: (a)0.1 wt% total biopolymer concentration; (b) 0.5 wt% total biopolymerconcentration; (c) 1.0 wt% total biopolymer concentration; (d) 5.0 wt%total biopolymer concentration. (W) pH 3.6, (X) pH 3.8, (K) pH 4.8, (O)pH 4.2, (A) pH 4.4, (B) pH 4.6, (S) pH 4.8, (V) pH 5.0.

3.2.4. Effects of the protein to polysaccharide (Pr:Ps) ratioThe Pr:Ps ratio is a meaningful parameter in mixed biopo-
lymer systems. It controls the balance of macromoleculescharges and therefore, the intensity of the electrostatic inter-actions. Studying the effect of such a parameter on ourwater–b-lg–acacia gum system means to cross the two-phase region of the ternary phase diagram from side toside through a straight line parallel to theb-lg–acaciagum axis (at a constant total biopolymer concentration).As shown in Fig. 8(a)–(d), the asymmetrical shape of thetwo-phase region was confirmed. Thus, the 1:1 Pr:Ps ratiodid not correspond to the symmetry axis of the curves,implying that total charge neutralisation was not achievedat this ratio. Regarding the absorbance at 0.1 wt%, variationonly occurred at pH values below 4.4 and protein to poly-saccharide ratios above 0.5 (excess of protein; Fig. 8(a)). Onthe contrary, at 0.5 wt%, absorbance changes occurred atratios where the polysaccharide was in excess for the lowestpH values (1:6 and 1:2 at pH 3.6 to 4.2). Closer to the IEP ofthe b-lg, an excess of protein (ratio higher than 1:1) wasrequired to obtain any absorbance variation (Fig. 8(b)). For1.0 wt% total biopolymer concentration, the absorbance ofsamples began to rise for the 1:6 ratio at pH 3.6 (Fig. 8(c)).At last, for the 5 wt% total biopolymer concentration, threesets of curves could be distinguished. The first one wasobtained within pH 4.8–5.0. At these pH,b-lg–acaciagum blends exhibited limited absorbance changes for ratioshigher than 4:1 (Fig. 8(d)). A second set of curves wasobtained at pH 4.6. It presented an increase of the sampleabsorbance up to an 8:1 ratio. Finally, the third set of curveswas obtained from pH 4.4–3.6 and showed a maximum inthe absorbance value for Pr:Ps ratios ranging from 1:2 to2:1.
All these data confirmed the effect of the total biopolymerconcentration on the coacervation between theb-lg and theacacia gum. Coacervation arises at low protein to poly-saccharide ratios for pH values away from the IEP of theb-lg. On the contrary, coacervation was observed for all thetested ratios when the total biopolymer concentration wassufficiently high (above 1.0 wt%). For low biopolymerconcentrations (0.1 wt%), the phase separation only occurs
when the protein is in excess (ratio above 2:1; Fig. 8(a)).Otherwise, the number of protein molecules is not sufficientto neutralise all the acacia gum ones. The resultingcomplexes still carry a net negative charge and becomesoluble (Zaitzev, Izumrudov & Zezin, 1992). In the samevein, for an excess of protein (ratio$ 8:1) the complexesare positively charged, as could be seen on themE variationof the complexes (Fig. 3(b)). When the biopolymer concen-tration increases, phase separation appears even if the ratiois in favour of the acacia gum because of the large numberof protein molecules able to interact (Wang et al., 1996).Similarly, this explains the displacement of the curvestowards the IEP of theb-lg at high Pr:Ps ratios, the lowercharge carried by the protein being counter-balanced by itsnumber (Koh & Tucker, 1988b). Such a behaviour has beenreported by Mattisson, Brittain and Dubin (1995) foraqueous mixtures of bovine serum albumin (BSA) and anammonium salt, the poly(dimethyldiallylammonium) chlor-ide (PDMDAAC). To conclude with the effects of the pHand the protein to polysaccharide ratio, we could highlightthe remarkable 2:1b-lg to acacia gum ratio at pH 4.2 thatresults in the same protein to polysaccharide ratios in thetwo phases after 2 days (Table 3). According to Bungenbergde Jong (1949), these conditions correspond to the maxi-mum of interaction between the two biopolymers. In thispeculiar case, the charge of the resulting complexes shouldbe close to zero. However, the complexes obtained at0.1 wt% for the 2:1 ratio were negatively charged (Fig.3(b)). To take this result into account, we should rememberthat the 4.0–4.2 pH range leads to sharpmE variation for thisratio. Thus, small variation of pH could lead to negativecharge apparition on the acacia gum through carboxylicgroup dissociation, leading to a sharp decrease of thecoacervatesmE.
3.2.5. Evolution of theb-lg and acacia gum compositions inthe equilibrium phases
To get more insights on the phase separation betweenb-lg and acacia gum, the compositions of the phases obtainedafter mixing the two biopolymers at pH 3.6, 4.2 and 5.0 andprotein to polysaccharide ratios of 8:1, 2:1 and 1:1 weredetermined according to the Bradford (protein content)and Dubois phenol–sulphuric methods (polysaccharidecontent).
Fig. 9 presents the evolution of the wet weight fractionsof the two phases after 2 days for total biopolymer concen-tration ranging from 0 to 20 wt%. In this experiment, theratio and pH were set to 2:1 and 4.2, respectively. Whereas,the wet weight fraction of the supernatant decreasedprogressively to a value of 50% at 20 wt% total concentra-tion, the evolution of the bottom phase is typically thereverse. Obviously, the 50% value was critical because itimplies that the solvent content in both phases were approxi-mately equal.
Chemical analyses revealed that the solubility of the acaciagum alone was pH- and total concentration-independent.
C. Schmitt et al. / Food Hydrocolloids 13 (1999) 483–496 493
Fig. 9. Variation of the wet weight fraction of the two phases at equilibriumafter centrifugation (10 000g, 1 h) at pH 4.2 after 2 days at 208C. (W)supernatant, (X) bottom phase.

Thus, all the gum was recovered in the supernatant after2 days, emphasizing the good cold-solubility of the gumat 208C (Tables 2–4). On the contrary, theb-lg alone exhib-ited both pH and total biopolymer concentration-dependentsolubility. One third of the initial amount ofb-lg precipi-tated at pH 3.6 independently of the total biopolymerconcentration. At pH 4.2 and 5.0, more than half of theprotein was insoluble according to our centrifugation condi-tions (10 000g, 1 h). Considering the blends at pH 3.6, themarked effect of the addition of the gum to the protein liedin the appearance of acacia gum in the bottom phase and thedecrease of the protein solubility. These findings constitutea quantitative proof of the biopolymer interaction. Thepercentage of gum insolubilization (64–96%) at pH 3.6depended on the Pr:Ps ratio and total biopolymer concentra-tion. Interestingly, for all the tested ratios, the relativeb-lgcontent increased in the supernatant when the total biopo-lymer concentration increased, especially when low amountof acacia gum was present in the initial blend (11%). For allthe biopolymer concentrations tested at pH 4.2, an increaseof the acacia gum content in the supernatant could be notedwhen the protein to polysaccharide ratio decreased. Thisspecific effect of the biopolymer ratio has not been observedfor pH 3.6 and is attributed to the increase of the number ofprotein molecules needed to neutralise the acacia gum. Theevolution of the Pr:Ps ratio in each equilibrium phase both atpH 3.6 and 4.2 was characterised by a decrease in the super-natant for all the concentrations tested when the content inpolysaccharide increased in the initial mixture. Interest-ingly, when the Pr:Ps mixing ratio was set at 2:1 at pH4.2, the Pr:Ps ratio still was around two in both phasesafter 2 days (Table 3).
At pH 4.2 and especially at pH 5.0, that is when themE ofthe protein is close to zero, excepted for the 0.1 wt%, theb-lg content in the bottom phase was almost constant ascompared to the sample containing the protein alone.Regarding the polysaccharide, more acacia gum was recov-ered in the supernatant than at pH 3.6 and 4.2, independentlyfrom the initial Pr:Ps ratio and total biopolymer concentra-tion. This could indicate that interactions between the twobiopolymers were still effective but of lesser intensity thanat pH 3.6 and 4.2. This assumption is confirmed by theevolution of the Pr:Ps ratio in the two phases, practicallyunaffected by the biopolymer concentration but lowered bya decrease of the initial biopolymer ratio of the blend (Table4).
Lets us first consider the influence of theb-lg concentra-tion on the phase separation phenomenon without the addi-tion of acacia gum. The marked result is the presence ofprotein in both phases independently from the initialconcentration (Tables 2–4). However, the amount ofb-lgin the bottom phase is increased by the increase of the pH.Such a result is in agreement with the presence of an equili-brium between the monomeric and oligomeric forms ofb-lg(Casal, Kohler & Mantsch, 1988; Pessen, Purcell & Farrell,1985) and is corroborated by the decrease of the proteinmE
allowing non-electrostatic interactions, i.e. hydrophobicinteractions or hydrogen bonding (Fig. 3(a)). Self-exclusionof theb-lg from the aqueous medium seems here to be themajor reaction to consider. Since the protein concentrationincreases, non-electrostatic interactions betweenb-lg mole-cules could give rise to the formation of aggregates exhibit-ing higher size (especially close to the IEP of the protein).Taking into account that a critical value of 0.5 must be reachfor x cr, the interactional parameter defined by the Flory–Huggins theory (1953), for phase separation and thatx cr isgiven by:
xcr � 1=2�1 1 r21=2�2 �2�
wherer is the ratio of solvent to solute. In these conditions,phase separation occurs more easily when the size of aggre-gates increases. Similar effect of the aggregation state ofproteins on their thermodynamic compatibility in aqueoussolutions have been reported for water–bovine serum albu-min–ovalbumin (Polyakov, Popello, Grinberg & Tolstogu-zov, 1986). In this study, the presence of thermoaggregatesof ovalbumin induced phase separation after mixing withbovine serum albumin, although miscibility between the twoproteins was total in aqueous medium without aggregates.
Mixing b-lg with the acacia gum mainly results in adecrease of the acacia gum solubility at low pH values.Such results are consistent with an electrostatic interactionbetween the two biopolymers, and are backed up by theresults obtained for the evolution of the complexesmE
(Fig. 3(b)). Interestingly, acacia gum is still present in thesupernatant and the bottom phase at pH values close to theb-lg IEP, where the electrostatic interactions are of lessintensity. This could occur because of the presence of solu-ble non-interacting gum in the supernatant. However, onecould also imagine that a fraction of the acacia gum isinvolved in the formation of solubleb-lg–acacia gumcomplexes, even at high pH values (presence of positivecharge patches on the protein). Such kind of behaviourhas been elsewhere demonstrated for soluble BSA/PDMDAAC complexes (Xia & Dubin, 1994; Zaitzev, Izum-rudov & Zezin, 1992). This assumption is in accordancewith the net negativemE obtained at high pH values andlow protein to polysaccharide ratios (Fig. 3(b)). On thecontrary, to take into account for the presence of acaciagum in the bottom phase, several hypothesis could beproposed. We could first consider that this feature is onlydue to the formation of coacervates through interaction ofsoluble complexes, leading to a coacervated phase.Secondly, protein aggregates could also explain thepresence of acacia gum in the bottom phase even at highpH. Thus, considering that protein aggregates exhibit a highsurface hydrophobicity responsible for their low solubility,engulfment of the aggregates by a coacervate layer to lowerthe interfacial tension of the system is conceivable (Torza &Mason, 1970). A third explanation could be the presence ofprotein aggregates coated with polysaccharide molecules,
C. Schmitt et al. / Food Hydrocolloids 13 (1999) 483–496494

like polysaccharides on casein micelles (Syrbe, Bauer &Klostermeyer, 1998). In such a case, acacia gum could actthrough its interfacial properties, by adsorbing onto the inso-luble protein aggregate surface (Vaziri, 1976). This assump-tion is consistent with the negative value (close to that of thegum alone) ofmE measured at pH value close to 5.0, forcomplexes where the protein to polysaccharide ratio is 8:1or 4:1 (Fig. 3 (a) and (b)).
4. Conclusion
The preliminary results obtained in this study support thehypothesis of complex coacervation phenomenon betweenb-lactoglobulin and acacia gum in aqueous medium. Build-ing of ternary phase diagrams gives a general overview ofthe pH-dependence (3.6–4.2–5.0) of the areas of the twophases in presence. Effects of pH and protein to polysac-charide ratio were demonstrated by following the absor-bance of the mixtures at 650 nm. The ratio of 2:1 at pH4.2 seems to be remarkable, as the chemical analysis ofthe compositions for protein and polysaccharide in thetwo phases at equilibrium revealed the same ratio of 2:1for both phases. The influence of the total biopolymerconcentration on the weight average molecular mass oftheb-lg was demonstrated by GPC and LLS measurements.However, some questions arise from this study, especiallyconsidering the effect of the aggregation state of the proteinon the formation and structure of complexes and coacer-vates. For example, it could be interesting to repeat thesame experiments usingb-lg solutions without aggregatesand protein dispersions containing aggregates of controlledsize and surface properties. Also interesting would be tostudy the effect of pH, Pr:Ps ratio and total biopolymerconcentration on the size distribution of complexes andcoacervates in determined processing conditions. Finally,the use of microscopic and spectroscopic methods at well-defined points of the phase diagram could be a means ofstudying the microstructure of the mixed system, therespective location of each macromolecule in thecomplexes and coacervates, and the molecular structure ofthe macromolecules.
Acknowledgements
PhD thesis grant from the “Ministe`re Franc¸ais de l’Edu-cation Nationale, de la Recherche et de la Technologie” ishere gratefully acknowledged.
References
Albertsson, P. A˚ . (1971).Partition of cell particles and macromolecules, 2.New York: Wiley.
Anderson, D. M. W., Millar, J. R. A., & Weiping, W. (1991). Gum arabic(Acacia senegal), unambiguous identification by13C-NMR spectro-scopy as a adjunct to the revised JECFA specification, and the
application of 13C-NMR spectra for regulatory/legislative purposes.Food Additives and Contaminants, 8 (4), 405–421.
AOAC (1984). In W. Horwitz (Ed.),Official methods of analysis, 40.Washington, DC: Association of Official Analytical Chemists.
Bauer, R., Hansen, S., & Øgendal, L. (1998). Detection of intermediateoligomers, important for the formation of heat aggregates ofb-lacto-globulin. International Dairy Journal, 8, 105–112.
Bradford, M. M. (1976). A rapid and sensitive method for the quantificationof microgram quantities of protein utilizing the principle of protein-dyebinding.Analytical Biochemistry, 72, 248–254.
Bungenberg de Jong, H. G. (1949). Crystallisation–coacervation–floccula-tion. In H. R. Kruyt (Ed.) (pp. 232–258).Colloid science, 2. Amster-dam: Elsevier.
Burgess, D. J. (1990). Practical analysis of complex coacervate systems.Journal of Colloid and Interface Science, 140, 227–238.
Burgess, D. J., & Carless, J. E. (1984). Microelectrophoretic studies ofgelatin and acacia for the prediction of complex coacervation.Journalof Colloid and Interface Science, 98 (1), 1–8.
Burgess, D. J., & Singh, O. N. (1993). Spontaneous formation of smallsized albumin/acacia coacervate particles.Journal of Pharmacy andPharmacology, 45, 586–591.
Casal, H. L., Ko¨hler, U., & Mantsch, H. H. (1988). Structural and confor-mational changes ofb-lactoglobulin B: an infrared spectroscopic studyof the effect of pH and temperature.Biochimica et Biophysica Acta,957, 11–20.
Connolly, S., Fenyo, J. C., & Vandevelde, M. C. (1987). Heterogeneity andhomogeneity of an arabinogalactan–protein:Acacia senegalgum.FoodHydrocolloids, 1 (5–6), 477–480.
Dash, A. K. (1997). Determination of physical state of drug in microcapsuleand microsphere formulations.Journal of Microencapsulation, 14 (1),101–112.
Dickinson, E. (1995). Mixed biopolymers at interfaces. In S. E. Harding &S. E. Hill & J. R. Mitchell (Eds.),Biopolymers mixtures, (pp. 349–372).Nottingham: Nottingham University Press.
Dubois, M., Gilles, K. A., Hamilton, J. K., Rebers, P. A., & Smith, F.(1956). Colorimetric method for determination of sugars and relatedsubstances.Analytical Chemistry, 28 (3), 350–356.
Durrani, C. M., Prystupa, D. A., Donald, A. M., & Clark, A. H. (1993).Phase diagram mixtures of polymers in aqueous solution using Fouriertransform infrared spectroscopy.Macromolecules, 26 (5), 981–987.
Duvallet, S., Fenyo, J. C., & Vandevelde, M. C. (1989). Meaning of molecularweight measurements of gum arabic.Polymer Bulletin, 21, 517–521.
Flory, P. J. (1953).Principles of polymer chemistry, Ithaca: Cornell Univer-sity Press.
Haque, Z. U., & Sharma, M. (1997). Thermal gelation ofb-lactoglobulinAB purified from Cheddar whey. 1. Effect of pH on association asobserved by dynamic light scattering.Journal of Agricultural andFood Chemistry, 45 (8), 2958–2963.
Hermansson, A. M. (1990). Viscoelastic behaviour ofb-lactoglobulin gelstructures.Food Hydrocolloids, 4 (2), 121–135.
Hoffman, M. A. M., Sala, G., Olieman, C., & de Kruif, K. G. (1998).Molecular mass distribution of heat-inducedb-lactoglobulin aggre-gates.Journal of Agricultural and Food Chemistry, 45 (8), 2949–2957.
Hunter, R. J. (1986). Transport properties of suspensions. In R. J. Hunter(Ed.), (pp. 494–563).Foundations of colloid science, 1. New York:Oxford University Press.
Idris, O. H. M., Williams, P. A., & Phillips, G. O. (1998). Characterizationof gum fromAcacia senegaltrees of different age and location usingmultidetection gel permeation chromatography.Food Hydrocolloids,12, 379–388.
Ju, Z. Y., & Kilara, A. (1998). Effects of preheating on properties of aggre-gates and cold-set gels of whey protein isolate.Journal of Agriculturaland Food Chemistry, 46 (9), 3604–3608.
Kilara, A. (1995). Interactions of ingredients in food systems: an introduc-tion. In A. G. Gaonkar (Ed.),Ingredient interactions, effects on foodquality (pp. 1–12). New York: Marcel Dekker.
Kinsella, J. E. (1984). Milk proteins, physicochemical and functional
C. Schmitt et al. / Food Hydrocolloids 13 (1999) 483–496 495

properties.Critical Reviews in Food Science and Nutrition, 21 (3),197–261.
Koh, G. L., & Tucker, I. G. (1988a). Characterization of sodium carbox-ymethylcellulose–gelatin complex coacervation by viscosity, turbidityand coacervate wet weight and volume measurements.Journal of Phar-macy and Pharmacology, 40, 233–236.
Koh, G. L., & Tucker, I. G. (1988b). Characterization of sodium carbox-ymethylcellulose–gelatin complex coacervation by chemical analysisof the coacervate and equilibrium fluid phases.Journal of Pharmacyand Pharmacology, 40, 309–312.
Kravtchenko, T. P. (1997). Application of acacia gum as a natural source ofsoluble dietary fibre.Food Ingredients Europe, Conference Proceed-ings, (pp. 56–60). Maarssen, Netherlands: Miller Freeman Plc.
Mattisson, K. W., Brittain, I. J., & Dubin, P. L. (1995). Protein–polyelec-trolyte phase boundaries.Biotechnology Progress, 11, 632–637.
McKenzie, H. A., Sawyer, W. H., & Smith, M. B. (1967). Optical rotatorydispersion and sedimentation in the study of association–dissociation:bovineb-lactoglobulins near pH 5.Biochimica Biophysica Acta, 147,73–92.
Menzies, A. R., Osman, M. E., Malik, A. A., & Baldwin, T. C. (1996). Acomparison of the physicochemical and immunological properties ofthe plant gum exudates ofAcacia senegal(gum arabic) andAcaciaseyal(gum tahla).Food Additives and Contaminants, 13 (8), 991–999.
Mills, O. E., & Creamer, L. K. (1975). A conformational change in bovineb-lactoglobulin at low pH.Biochimica et Biophysica Acta, 379, 618–626.
Nairn, J. G. (1995). Coacervation-phase separation technology. In B.Ganderton & T. Jones & J. McGinity (Eds.), (pp. 93–219).Advancesin pharmaceutical science, 7. London: Academic Press.
Osman, M. E., Williams, P. A., Menzies, A. R., & Phillips, G. O. (1993).Characterization of commercial samples of gum arabic.Journal ofAgricultural and Food Chemistry, 41 (1), 71–77.
Pantaloni, D., (1965).Structure et changements de conformations de lab-lactoglobuline en solution. Doctorate thesis, Faculte´ des Sciences del’Universite de Paris, France.
Pessen, H., Purcell, J. M., & Farrell Jr, H. M. (1985). Proton relaxation ratesof water in dilute solutions ofb-lactoglobulin, determination of crossrelaxation and correlation with structural changes by the use of twogenetic variants of a self-associating globular protein.Biochimica etBiophysica Acta, 828, 1–12.
Peters, H. J. W., van Bommel, E. M. G., & Fokkens, J. G. (1992). Effect ofgelatin properties in complex coacervation processes.Drug Develop-ment and Industrial Pharmacy, 18 (1), 123–134.
Phillips, G. O., Takigami, S., & Takigami, M. (1996). Hydration character-istics of the gum exudate from Acacia senegal.Food Hydrocolloids, 10(1), 11–19.
Piculell, L., Bergfeldt, K., & Nilsson, S. (1995). Factor determining phasebehaviour of multi-component polymer systems. In S. E. Harding &S. E. Hill & J. R. Mitchell (Eds.),Biopolymer mixtures(pp. 13–36).Nottingham: Nottingham University Press.
Polyakov, V. I., Popello, I. A., Grinberg, V. Ya., & Tolstoguzov, V. B.(1986). Thermodynamic compatibility of proteins in aqueous medium.Nahrung, 3–4, 365–368.
Randall, R. C., Phillips, G. O., & Williams, P. A. (1989). Fractionation andcharacterization of gum from Acacia senegal.Food Hydrocolloids, 3(1), 65–75.
Ray, A. K., Bird, P. B., Iacobucci, G. A., & Clark Jr, B. J. (1995). Func-tionality of gum arabic, fractionation, characterization and evaluation ofgum fractions in citrus oil emulsions and model beverages.FoodHydrocolloids, 9 (2), 123–131.
Reisman, A. (1970).Phase equilibria, basic principles, applications,experimental techniques, New York: Academic Press.
Renard, D., Boue´, F., & Lefebvre, J. (1997). Protein–polysaccharidemixtures: structure and effect of shear studied by small-angle neutron
scattering. In E. Dickinson & B. Bergensta˚hl (Eds.), Food colloids,proteins, lipids and polysaccharides, (pp. 303–315). London: TheRoyal Society of Chemistry.
Sanchez, C., & Paquin, P. (1997). Protein and protein–polysaccharidemicroparticles. In S. Damodaran & A. Paraf (Eds.),Food proteinsand their applications, (pp. 503–528). New York: Marcel Dekker.
Sawyer, L., Brownlow, S., Polikarpov, I., & Wu, S. -Y. (1998).b-Lacto-globulin, structural studies, biological clues.International Dairy Jour-nal, 8, 65–72.
Schmitt, C., Sanchez, C., Desobry-Banon, S., & Hardy, J. (1998). Structureand technofunctional properties of protein–polysaccharide complexes. Areview.Critical Reviews in Food Science and Nutrition, 38(8), 689–753.
Sharma, M., Haque, Z. U., & Wilson, W. W. (1996). Association tendencyof b-lactoglobulin AB purified by gel permeation chromatography asdetermined by dynamic light scattering under quiescent conditions.Food Hydrocolloids, 10 (3), 323–328.
Syrbe, A., Bauer, W. J., & Klostermeyer, H. (1998). Polymer scienceconcepts in dairy systems—an overview of milk protein and foodhydrocolloid interaction.International Dairy Journal, 8, 179–193.
Thalberg, K., Lindman, B., & Karlstro¨m, G. (1990). Phase diagram of asystem of cationic surfactant and anionic polyelectrolyte, tetradecyltri-methylammonium bromide–hyaluronan–water.Journal of PhysicalChemistry, 94 (10), 4289–4295.
Tolstoguzov, V. B. (1996). Structure-property relationships in foods. In N.Parris & A. Kato & L. K. Creamer & J. Pearce (Eds.),Macromolecularinteractions in food technology, (pp. 2–14).ACS symposium series 650.
Tolstoguzov, V. B. (1997). Protein–polysaccharide interactions. In S.Damodaran & A. Paraf (Eds.),Food proteins and their applications,(pp. 171–198). New York: Marcel Dekker.
Torza, S., & Mason, S. G. (1970). Three-Phase Interactions In Shear andElectrical Fields.Journal of Colloid and Interface Science, 33, 67–83.
Townend, R., & Timasheff, S. N. (1960). Molecular interactions inb-lactoglobulin. III. Light scattering investigation of the stoichiometryof association between pH 3.7 and 5.2.Journal of the American Chemi-cal Society, 82, 3168–3174.
Vandevelde, M. C., & Fenyo, J. C. (1987). Estimation of the charge densityof arabic acid by potentiometry and dye binding.Polymer Bulletin, 18,47–51.
Vaziri, A. (1976). Coacervation of acacia gum for emulsification purposes.Planta medica, 29, 20–25.
Wang, Y. F., Gao, J. Y., & Dubin, P. L. (1996). Protein separation viapolyelectrolyte coacervation, selectivity and efficiency.BiotechnologyProgress, 12 (3), 356–362.
de Wit, J. N. (1998). Nutritional and functional characteristics of wheyproteins in food products.Journal of Dairy Science, 81 (3), 597–608.
de Wit, J. N., & van Kessel, Th. (1996). Effects of ionic strength on thesolubility of whey protein products, a colloid chemical approach.FoodHydrocolloids, 10 (2), 143–149.
Wong, D. W. S., Camirand, W. M., & Pavlath, A. E. (1996). Structure andfunctionalities of milk proteins.Critical Reviews in Food Science andNutrition, 36 (8), 804–844.
Xia, J., & Dubin, P. L. (1994). Protein–polyelectrolyte complexes. In P. L.Dubin & J. Bock & R. Davies & D. N. Schulz & C. Thies (Eds.),Macromolecular complexes in chemistry and biology, (pp. 247–274).Berlin: Springer.
Zaitzev, V. S., Izumrudov, V. A., & Zezin, A. B. (1992). A new family ofwater-soluble protein–polysaccharide complexes.Polymer ScienceUSSR, 34 (1), 54–55.
Zhang, K., Karlstro¨m, G., & Lindman, B. (1994). Ternary aqueous mixturesof a nonionic polymer with a surfactant or a second polymer, a theore-tical and experimental investigation of the phase behavior.Journal ofPhysical Chemistry, 98 (16), 4411–4421.
C. Schmitt et al. / Food Hydrocolloids 13 (1999) 483–496496