Investigations on Movima, a linguistic isolate of lowland Bolivia
Journal of Food Engineering 115 (2013) 459–465
Contents lists available at SciVerse ScienceDirect
Journal of Food Engineering
journal homepage: www.elsevier .com/ locate / j foodeng
Development and characterization of composite edible films based on sodiumalginate and pectin
Sabina Galus ⇑, Andrzej LenartDepartment of Food Engineering and Process Management, Faculty of Food Sciences, Warsaw University of Life Sciences–SGGW (WULS–SGGW), 159c Nowoursynowska St.,02-776 Warsaw, Poland
a r t i c l e i n f o
Article history:Available online 13 March 2012
Keywords:Edible filmsAlginatePectinMoistureMechanical propertiesMicrostructure
0260-8774/$ - see front matter � 2012 Elsevier Ltd. Ahttp://dx.doi.org/10.1016/j.jfoodeng.2012.03.006
⇑ Corresponding author. Tel.: +48 22 59 37 579; faxE-mail address: [email protected] (S. Galus).
a b s t r a c t
The objective of this study was to characterize physical properties including thickness, colour, watervapour sorption kinetics and isotherms, water vapour permeability, tensile strength, elongation at break,and microstructure of composite films prepared by casting sodium alginate and low methoxy pectin atproportions of: 100–0%, 75–25%, 50–50%, 25–75%, and 0–100%. Combination of both polysaccharidesgave continuous, homogenous and transparent films. All of analyzed films reached their state of equilib-rium within the 24 h of adsorption time. Water sorption isotherms for all films had a sigmoidal shape andwere not influenced by the film composition. Sorption kinetics and isotherms indicated hydrophilic char-acter of investigated films. Statistically significant (p < 0.001) correlations were found between colour,water vapour permeability, tensile strength, elongation at break, and chemical composition (alginateand pectin) of composite films. A different internal arrangement was observed as a function of filmcomposition.
� 2012 Elsevier Ltd. All rights reserved.
1. Introduction
Film formulation requires at least one component capable ofproducing a structural matrix of sufficient cohesiveness, whereastheir functional efficiency strongly depends on the nature of addi-tional components (Donhowe and Fennema, 1994). Numerousstudies have been carried out to study properties of films madeof a single hydrocolloid component: a polysaccharide or protein.The most frequently utilized polysaccharides were cellulose andstarch (and their derivatives), chitosan, seaweed extracts (carrag-eenans and alginates), exudates (arabic gum), seed (guar gum) ormicrobial fermentation gums (xanthan and gellan gum) and pectin(Falguera et al., 2011).
A recent approach to edible and biodegradable films technologyinvolves production of composite films, by combining differentpolysaccharides, proteins and lipids in order to improve their func-tionality. Composite films may be designed to achieve a synergisticeffect of combined features of pure components, even though, aswith synthetic polymers, mechanical and barrier properties ofcomposite biofilms strongly depend on characteristics of constitut-ing polymers and their compatibility (Garcia et al., 2004; Altenho-fen da Silva et al., 2009).
Pectin and alginate, both belonging to the group of polyuronates,are two characteristic examples of natural ionic polysaccharides
ll rights reserved.
: +48 22 59 37 576.
undergoing chain–chain association and forming hydrogels uponaddition of divalent cations (e.g. Ca2+) (Fang et al., 2008). Both poly-saccharides form synergistic mixed gels in the presence of Ca2+
(Walkenstrom et al., 2003). Pectin is a complex anionic polysaccha-ride composed of b-1,4-linked D-galacturonic acid residues, where-in carboxyl groups of uronic acid are either fully (HMP, highmethoxyl pectin, DE > 50%) or partially (LMP, low methoxyl pectin,DE < 50%) methyl esterified. Like alginates, low methoxyl pectins,form gel with divalent cations (Marudova et al., 2004). The pectingelation processes are rather complex (Cardoso et al., 2003). Themost important environmental factors are pH, Ca2+ and soluble sol-ids. They have different and partly opposite effects on the gellingprocess of different pectin types (Kastner et al., 2012).
Alginates are structural polysaccharides extracted from brownalgae. From the molecular point of view alginates are composedof glucuronic (G) and mannuronic (M) acid units forming regionsof M-blocks, G-blocks and blocks of alternating sequence (MG-blocks), where the relative proportions of these sequential organi-zations depends on the source (Ertesvag and Valla, 1998). Mostapplications of alginate is based on its gel-forming ability throughcations binding; the transition from water-soluble sodium alginateto water insoluble calcium alginate, for example. Divalent cationspreferentially bind toward the G-block rather than the M-block(Braccini and Perez, 2001).
Understanding the relative importance of different mechanismscontrolling moisture transfer through hygroscopic films is alsoimportant for designing new films with improved and selective
460 S. Galus, A. Lenart / Journal of Food Engineering 115 (2013) 459–465
barrier properties. Consequently, both equilibrium properties andkinetics of water transport through the packaging material are ofgreat importance (Muller et al., 2009). Sorption isotherms charac-terize a relationship between water content and its activity at con-stant temperature (Sablani et al., 2007) and have been widelyconduced on edible films (Shih et al., 2011). Selection of an appro-priate mathematical model of sorption behaviour is a difficult task,because of complex chemical composition and structure of food(Raharitsifa and Ratti, 2010).
The objective of this study was to investigate physical proper-ties including thickness, colour, water vapour kinetics and iso-therms, water vapour permeability, tensile strength, elongationat break, and microstructure of composite edible films based onsodium alginate and pectin.
2. Materials and methods
2.1. Materials
Apple pectin (type NEJ-A2) was obtained from PEKTOWIN(Jaslo, Poland). Sodium alginate was obtained from AGNEX (Bialy-stok, Poland). Anhydrous glycerol, calcium chloride, and thymolwere purchased from POCH S.A. (Gliwice, Poland). Salts to preparesaturated solutions for the determination of water vapour sorptionisotherms, including lithium chloride, potassium acetate, magne-sium chloride, potassium carbonate, magnesium nitrate, sodiumnitrate, sodium chloride, sulphate ammonium, and barium chlo-ride were supplied by POCH S.A. (Gliwice, Poland). Saturated saltsolution of sodium chloride (POCH, Gliwice, Poland) was used tocontrol the water activity (aw) at 0.753 at 25 �C for water vapoursorption kinetics.
2.2. Film preparation
Film forming aqueous solutions were prepared by casting so-dium alginate (1.25%) and low methoxy pectin (2.5%) at the follow-ing proportions: 100–0% (Film A), 75–25% (Film B), 50–50% (FilmC), 25–75% (Film D), and 0–100% (Film E). Powdered calcium chlo-ride was used at 1% and glycerol as a plasticizer at 50% (% w/w ofpolysaccharides). Solutions were stored without mixing for 2 daysto allow dissolution of ingredients. After that time solutions wereheated with mixing up to 70 �C and poured onto a series of Petridishes (diameter 15 cm). To control film thickness, volume of eachfilm-forming solution poured onto a plate was always 15 mL. Filmswere dried at 25 �C and at 53% relative humidity (RH) for 24 h.Dried films were peeled-off and conditioned at 53 ± 1% RH and25 ± 1 �C for 7 days prior to testing.
2.3. Water content
Water content was measured by determination of the weightloss of the film after 4 h of drying at 105 �C. Measurements weremade in triplicate.
2.4. Thickness
Film thickness was measured with an electronic gauge (METRI-SON, Poland). Precision of the measurement was 1 lm. Prior to filmthickness measurements the electronic gauge was calibrated at 74and 139 lm using standards. Five thickness measurements weretaken of each film, one of the centre and four around the perimeter,and a mean value was used in the calculations.
2.5. Colour
Colour of films on air surface was determined with a colorime-ter (Minolta, Model CR-300, Japan) using the CIELAB colour param-eters: L⁄, from black (0) to white (100); a⁄, from green (�) to red(+); and b⁄, from blue (�) to yellow (+) (Gennadios et al., 1996).Colour of the films was expressed as the total colour difference(DE) according to the following equation (Sobral et al., 2005):
DE ¼ffiffiffiffiffiffiffiffiffiffiffiffiffiffiffiffiffiffiffiffiffiffiffiffiffiffiffiffiffiffiffiffiffiffiffiffiffiffiffiffiffiffiffiffiffiffiffiffiffiffiffiffiðDL�Þ2 þ ðDa�Þ2 þ ðDb�Þ2
qð1Þ
where DL⁄, Da⁄ and Db⁄ – the differentials between a sample colourparameter and the colour parameter of a standard (L⁄ = 87.8,a⁄ = 2.39, b⁄ = 0.32) used as the film background.
2.6. Water vapour sorption kinetics
Measurement of water vapour sorption kinetics was conductedin at least two repetitions for each type of film using a stand whichensured continuous measurement of mass increase in conditions ofconstant temperature and relative humidity. Saturated sodiumchloride solution was used to obtain constant water activity ofthe environment (0.753). The measurement was carried out atthe temperature of 25 ± 1 �C for 24 h. Investigated samples con-sisted of 0.25 g of films, and their mass increase was registeredby means of the ‘‘measurement for DOS’’ computer software. Anexponential equation (Kowalska et al., 2006) was used for mathe-matical interpretation of the obtained results:
u ¼ aþ b ð1� expð�csÞÞ: ð2Þ
where u – water content (g water g d m�1), a, b, c – constant param-eters of equation, s – time (h).
2.7. Water vapour sorption isotherms
Water vapour sorption isotherms were drawn based on the sta-tic method (Spiess and Wolf, 1987) by equilibration of film samples(0.25 g in triplicate) at 25 �C in desiccators with saturated salt solu-tions at water activity ranging from 0.113 to 0.901. Thymol as afungistatic substance was used in desiccators with water activityabove 0.75 to avoid microbial growth. Water content of each sam-ple was determined as the weight gain at equilibrium. Water activ-ity of the sample after storage was evaluated by using AqualabSeries 3 Quick Start (Decagon Devices, Inc., Pullman, WA, USA).
The Peleg’s equation (Peleg, 1993) was used to for experimentaldata of water vapour sorption isotherms of alginate/pectin films:
u ¼ a � abw þ c � ad
w ð3Þ
where a, b, c, d – constants of equation, aw – water activity, u –water content (g water g d m�1).
2.8. Water vapour permeability
Water vapour permeability of films was measured gravimetri-cally according to Debeaufort et al. (1993). The method is basedon the mass variation of the permeation cells over time. Film sam-ples were placed between two rubber-based rings on the top of aglass cell containing distilled water, which allowed fixing the inter-nal RH of permeation cells at 100%. Those permeation cells wereintroduced into a ventilated chamber maintained at 30% RH and25 �C ensuring RH gradient between two sides of the film at30–100%. Water vapour permeability was calculated using the fol-lowing equation:
WVP ¼ Dm � eA � Dt � Dp
ð4Þ
Table 1Thickness, water vapour permeability (WVP), tensile strength (TS) and elongation atbreak (E) of sodium alginate/pectin films (A: 100% alginate; B: 75% alginate + 25%pectin; C: 50% alginate + 50% pectin; D: 25% alginate + 75% pectin; E: 100% pectin).
Film Thickness(lm)
WVP(10�10 g m�1 s�1 Pa�1)
TS (MPa) E (%)
A 12.5 ± 2.1a 0.84 ± 0.07a 35.0 ± 8.2c 8.6 ± 2.3b
B 14.0 ± 2.6a 0.95 ± 0.04a 28.2 ± 4.5b 11.8 ± 2.4c
C 18.5 ± 1.3b 1.22 ± 0.03b 42.3 ± 7.0d 14.9 ± 2.2d
D 19.3 ± 1.8b 1.39 ± 0.10c 39.6 ± 5.4cd 9.2 ± 1.8b
E 26.8 ± 2.2c 1.73 ± 0.08d 22.5 ± 2.4a 5.9 ± 1.2a
Values were given as mean ± standard deviation. Values with the same superscriptletters within a column are not significantly different (p < 0.05).
S. Galus, A. Lenart / Journal of Food Engineering 115 (2013) 459–465 461
where Dm/Dt – weight of moisture loss per unit of time (g s�1),A – film area exposed to moisture transfer (8.04 � 10�4 m2), e – filmthickness (m), Dp – water vapour pressure difference between thetwo sides of the film (Pa). Measurements were performed in at leastthree replicates.
2.9. Mechanical properties
Tensile strength and elongation at break of the films(100 mm � 25 mm), as the average of 10 determinations, weredetermined using a Texture Analyzer TA-XT2i (Stable Microsys-tems, United Kingdom) according to the ASTM D882-95 method(ASTM, 1995). Self-tightening roller grips were used as the probeto perform tensile assays. The initial distance of separation andvelocity were adjusted to 50 mm and 1 mm s�1, respectively, con-sidering conditioned samples with the cell load of 5 kg. Mechanicalproperties were calculated using the average thickness of each filmsample.
2.10. Microstructure
Film microstructure was observed under a scanning electronmicroscope (Quanta 200, FEI, Brno, Czech Republic). A5 mm � 5 mm film was fixed on the support using silver paste, atan angle of 90� to the surface, which allowed observation of thecross-section of the film. No particular film preparation was neces-sary. Films were observed at a magnification of �5000.
2.11. Statistical analysis
Statistical analysis was performed with Statgraphics Plus 5.0version program (Manugistics Corp., Rockville, MD, USA). The anal-ysis of variance (ANOVA) and Fisher’s LSD multiple comparisonswere performed to detect significant differences in films proper-ties. The significance level used was 0.001.
The adequacy of fitted Peleg’s equation was evaluated by deter-mination coefficient (R2), mean relative error (MRE), root meansquare (RMS), relative squares sum (RSS), and error of water con-tent estimation (SEE) using the following equations:
R2 ¼
Pni¼1ðup � ueÞ2
Pni¼1ðue � ueÞ2
ð5Þ
MRE ¼ 100n�X ue � up
ue
�������� ð6Þ
RMS ¼
ffiffiffiffiffiffiffiffiffiffiffiffiffiffiffiffiffiffiffiffiffiPðue�uo
ueÞ2
n
s� 100% ð7Þ
SEE ¼ffiffiffiffiffiffiffiffiffiffiffiffiffiffiffiffiffiffiffiffiffiffiffiffiffiffiffiffiXðue � uoÞ2
qð8Þ
RSS ¼Xðue � uoÞ2 ð9Þ
with n – number of observations; up – predicted water content(g water g d m�1); ue – average water content (g water g d m�1);ue – experimental water content (g water g d m�1).
The adequacy of fitted exponential equation was evaluated bydetermination coefficient (R2) and mean relative error (MRE)according to Eqs. (5) and (6).
3. Results and discussion
Sodium alginate/pectin composite films were homogeneousand transparent, without pores and cracks. The same characteris-tics were found for pure alginate and pure pectin films. However,alginate films were visually more transparent than pectin film.
Similar observations were presented by Altenhofen da Silva et al.(2009) who analyzed effect of plasticizer on alginate and pectincomposite films.
3.1. Thickness
The film formation during the drying process was different.Debeaufort and Voilley (1995) observed that thickness of a liquidfilm-forming dispersion affects also the drying kinetics, whichmay cause differences in the film structure. There are severalmethods to obtain controlled thickness of a final film. Among themapplication of constant volume on a specified surface is more pop-ular. Film thickness is a crucial parameter in calculation ofmechanical properties and water vapour permeability values. Finalthickness strongly depends on preparation method and dryingconditions. Several explanations for thickness effects on ediblefilms have been reported (Kokoszka et al., 2010; Kurek et al., 2012).
Thickness of alginate/pectin films changed significantly(p < 0.001) from 12.5 to 26.8 lm, depending on composition ofthe film forming mixture, as shown in Table 1. Those values arelower than showed in the literature for composite films based onpolysaccharides (Vargas et al., 2011). Increasing content of pectinaffects increasing thickness of composite films. It is associated withthe compound’s unique colloidal properties including thickeningand suspending, and interaction between components. Films withhigher alginate content (Films A and B) had lower thickness.Altenhofen da Silva et al. (2009) analyzing the effect of glycerolcontent on alginate/pectin films obtained thickness of about 45–70 lm. Similar results were presented for composite films basedon sodium alginate with lactose (Bajdik et al., 2009) or with wheyprotein isolate and gelatin (Wang et al., 2010).
3.2. Colour
In food products sensory aspects are essential to ensure thatapplication of emerging technologies such as edible films and coat-ings becomes successful. Thus, colour is one of the most importantparameters that has to be controlled (Falguera et al., 2011). Ediblefilms and coatings should be as close to colourless as possible tosimulate the appearance of common polymeric films (Rhim et al.,2002). Any change in surface colour of films can be also used asan indicator for development of cross-linking between film mole-cules (Rhim, 1998). Colour attributes are of utter importance be-cause they directly influence consumer acceptability.
All investigated alginate/pectin films appeared clear and trans-parent. There was no visible change in appearance of films withvarious film compositions. Colour of films is relevant since colourhas a direct impact on appearance of a packaged product. In orderto evaluate differences between films, L⁄, a⁄, and b⁄were calculatedfrom the spectral distribution of films on a standard plate. Totalcolour difference values (DE) were also presented. All values are
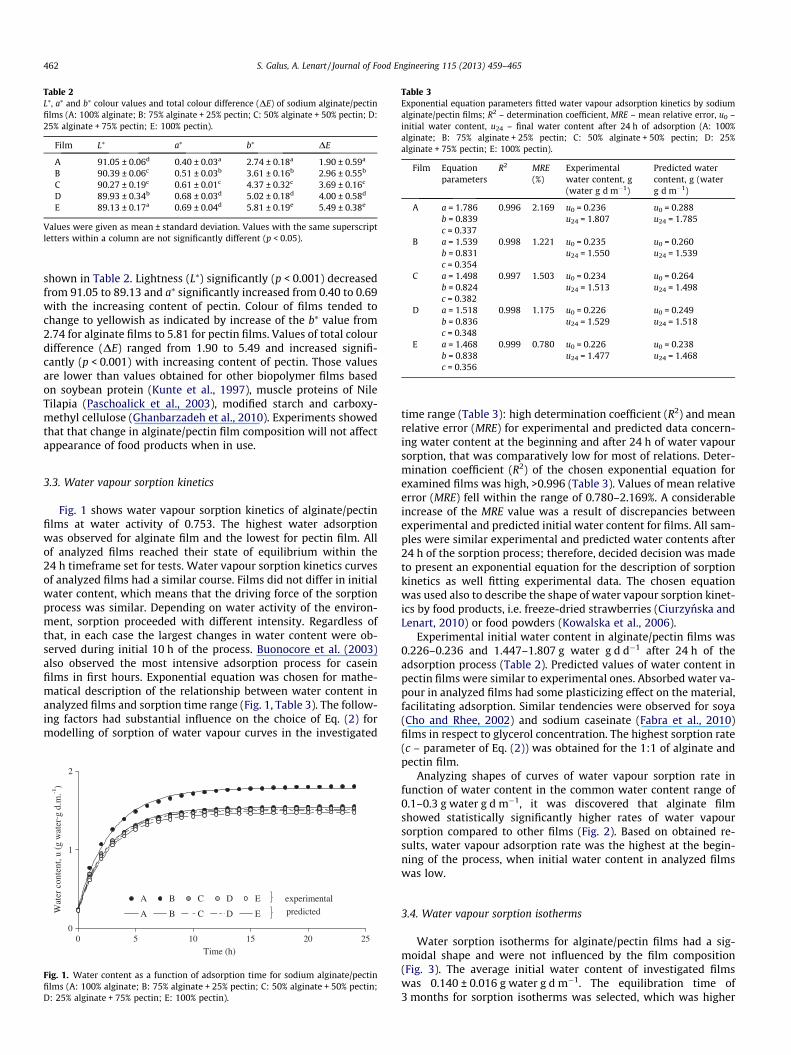
Table 2L⁄, a⁄ and b⁄ colour values and total colour difference (DE) of sodium alginate/pectinfilms (A: 100% alginate; B: 75% alginate + 25% pectin; C: 50% alginate + 50% pectin; D:25% alginate + 75% pectin; E: 100% pectin).
Film L⁄ a⁄ b⁄ DE
A 91.05 ± 0.06d 0.40 ± 0.03a 2.74 ± 0.18a 1.90 ± 0.59a
B 90.39 ± 0.06c 0.51 ± 0.03b 3.61 ± 0.16b 2.96 ± 0.55b
C 90.27 ± 0.19c 0.61 ± 0.01c 4.37 ± 0.32c 3.69 ± 0.16c
D 89.93 ± 0.34b 0.68 ± 0.03d 5.02 ± 0.18d 4.00 ± 0.58d
E 89.13 ± 0.17a 0.69 ± 0.04d 5.81 ± 0.19e 5.49 ± 0.38e
Values were given as mean ± standard deviation. Values with the same superscriptletters within a column are not significantly different (p < 0.05).
Table 3Exponential equation parameters fitted water vapour adsorption kinetics by sodiumalginate/pectin films; R2 – determination coefficient, MRE – mean relative error, u0 –initial water content, u24 – final water content after 24 h of adsorption (A: 100%alginate; B: 75% alginate + 25% pectin; C: 50% alginate + 50% pectin; D: 25%alginate + 75% pectin; E: 100% pectin).
Film Equationparameters
R2 MRE(%)
Experimentalwater content, g(water g d m�1)
Predicted watercontent, g (waterg d m�1)
A a = 1.786b = 0.839c = 0.337
0.996 2.169 u0 = 0.236u24 = 1.807
u0 = 0.288u24 = 1.785
B a = 1.539b = 0.831c = 0.354
0.998 1.221 u0 = 0.235u24 = 1.550
u0 = 0.260u24 = 1.539
C a = 1.498b = 0.824c = 0.382
0.997 1.503 u0 = 0.234u24 = 1.513
u0 = 0.264u24 = 1.498
D a = 1.518b = 0.836c = 0.348
0.998 1.175 u0 = 0.226u24 = 1.529
u0 = 0.249u24 = 1.518
E a = 1.468b = 0.838c = 0.356
0.999 0.780 u0 = 0.226u24 = 1.477
u0 = 0.238u24 = 1.468
462 S. Galus, A. Lenart / Journal of Food Engineering 115 (2013) 459–465
shown in Table 2. Lightness (L⁄) significantly (p < 0.001) decreasedfrom 91.05 to 89.13 and a⁄ significantly increased from 0.40 to 0.69with the increasing content of pectin. Colour of films tended tochange to yellowish as indicated by increase of the b⁄ value from2.74 for alginate films to 5.81 for pectin films. Values of total colourdifference (DE) ranged from 1.90 to 5.49 and increased signifi-cantly (p < 0.001) with increasing content of pectin. Those valuesare lower than values obtained for other biopolymer films basedon soybean protein (Kunte et al., 1997), muscle proteins of NileTilapia (Paschoalick et al., 2003), modified starch and carboxy-methyl cellulose (Ghanbarzadeh et al., 2010). Experiments showedthat that change in alginate/pectin film composition will not affectappearance of food products when in use.
3.3. Water vapour sorption kinetics
Fig. 1 shows water vapour sorption kinetics of alginate/pectinfilms at water activity of 0.753. The highest water adsorptionwas observed for alginate film and the lowest for pectin film. Allof analyzed films reached their state of equilibrium within the24 h timeframe set for tests. Water vapour sorption kinetics curvesof analyzed films had a similar course. Films did not differ in initialwater content, which means that the driving force of the sorptionprocess was similar. Depending on water activity of the environ-ment, sorption proceeded with different intensity. Regardless ofthat, in each case the largest changes in water content were ob-served during initial 10 h of the process. Buonocore et al. (2003)also observed the most intensive adsorption process for caseinfilms in first hours. Exponential equation was chosen for mathe-matical description of the relationship between water content inanalyzed films and sorption time range (Fig. 1, Table 3). The follow-ing factors had substantial influence on the choice of Eq. (2) formodelling of sorption of water vapour curves in the investigated
0
1
2
0 5 10 15 20 25
A B C D E
A B C D EWat
er c
onte
nt, u
(g
wat
er·g
d.m
.-1)
Time (h)
experimental
predicted
Fig. 1. Water content as a function of adsorption time for sodium alginate/pectinfilms (A: 100% alginate; B: 75% alginate + 25% pectin; C: 50% alginate + 50% pectin;D: 25% alginate + 75% pectin; E: 100% pectin).
time range (Table 3): high determination coefficient (R2) and meanrelative error (MRE) for experimental and predicted data concern-ing water content at the beginning and after 24 h of water vapoursorption, that was comparatively low for most of relations. Deter-mination coefficient (R2) of the chosen exponential equation forexamined films was high, >0.996 (Table 3). Values of mean relativeerror (MRE) fell within the range of 0.780–2.169%. A considerableincrease of the MRE value was a result of discrepancies betweenexperimental and predicted initial water content for films. All sam-ples were similar experimental and predicted water contents after24 h of the sorption process; therefore, decided decision was madeto present an exponential equation for the description of sorptionkinetics as well fitting experimental data. The chosen equationwas used also to describe the shape of water vapour sorption kinet-ics by food products, i.e. freeze-dried strawberries (Ciurzynska andLenart, 2010) or food powders (Kowalska et al., 2006).
Experimental initial water content in alginate/pectin films was0.226–0.236 and 1.447–1.807 g water g d d�1 after 24 h of theadsorption process (Table 2). Predicted values of water content inpectin films were similar to experimental ones. Absorbed water va-pour in analyzed films had some plasticizing effect on the material,facilitating adsorption. Similar tendencies were observed for soya(Cho and Rhee, 2002) and sodium caseinate (Fabra et al., 2010)films in respect to glycerol concentration. The highest sorption rate(c – parameter of Eq. (2)) was obtained for the 1:1 of alginate andpectin film.
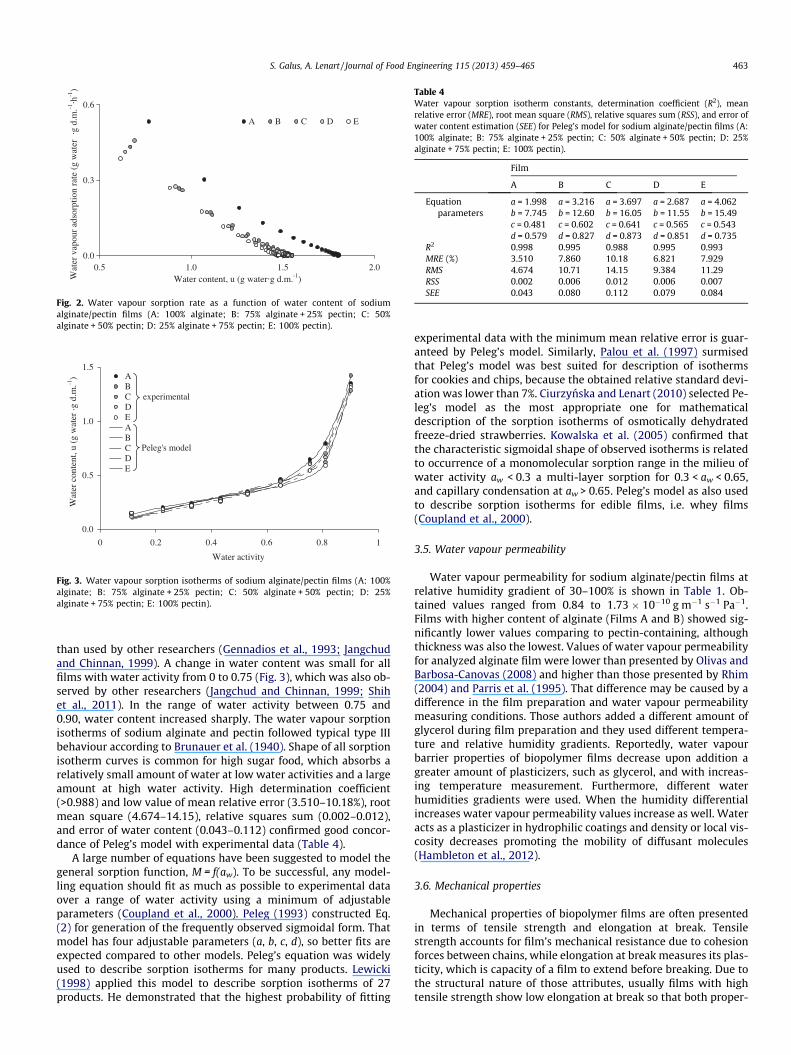
Analyzing shapes of curves of water vapour sorption rate infunction of water content in the common water content range of0.1–0.3 g water g d m�1, it was discovered that alginate filmshowed statistically significantly higher rates of water vapoursorption compared to other films (Fig. 2). Based on obtained re-sults, water vapour adsorption rate was the highest at the begin-ning of the process, when initial water content in analyzed filmswas low.
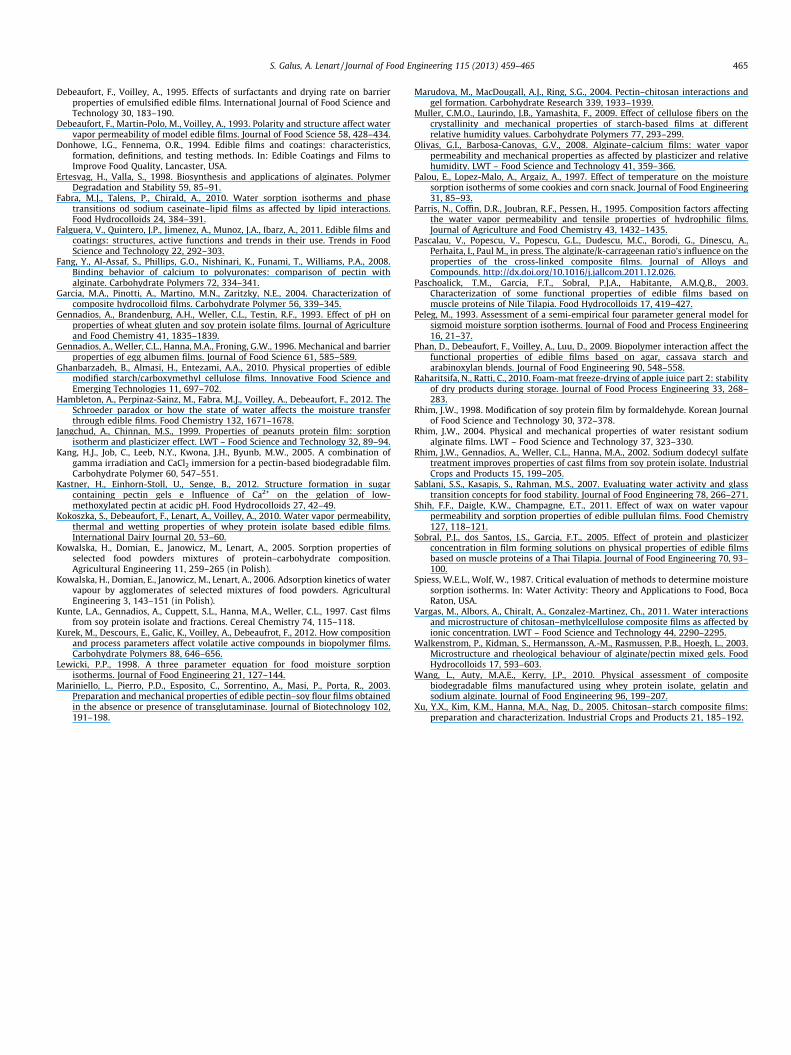
3.4. Water vapour sorption isotherms
Water sorption isotherms for alginate/pectin films had a sig-moidal shape and were not influenced by the film composition(Fig. 3). The average initial water content of investigated filmswas 0.140 ± 0.016 g water g d m�1. The equilibration time of3 months for sorption isotherms was selected, which was higher
0.0
0.3
0.6
0.5 1.0 1.5 2.0
A B C D E
Water content, u (g water·g d.m.-1)Wat
er v
apou
r ad
sorp
tion
rate
(g
wat
er ·
g d.
m.-1·h
-1)
Fig. 2. Water vapour sorption rate as a function of water content of sodiumalginate/pectin films (A: 100% alginate; B: 75% alginate + 25% pectin; C: 50%alginate + 50% pectin; D: 25% alginate + 75% pectin; E: 100% pectin).
0.0
0.5
1.0
1.5
0 0.2 0.4 0.6 0.8 1
ABCDEABCDE
Water activity
experimental
Peleg's model
Wat
er c
onte
nt, u
(g
wat
er ·g
d.m
.-1)
Fig. 3. Water vapour sorption isotherms of sodium alginate/pectin films (A: 100%alginate; B: 75% alginate + 25% pectin; C: 50% alginate + 50% pectin; D: 25%alginate + 75% pectin; E: 100% pectin).
Table 4Water vapour sorption isotherm constants, determination coefficient (R2), meanrelative error (MRE), root mean square (RMS), relative squares sum (RSS), and error ofwater content estimation (SEE) for Peleg’s model for sodium alginate/pectin films (A:100% alginate; B: 75% alginate + 25% pectin; C: 50% alginate + 50% pectin; D: 25%alginate + 75% pectin; E: 100% pectin).
Film
A B C D E
Equationparameters
a = 1.998b = 7.745c = 0.481d = 0.579
a = 3.216b = 12.60c = 0.602d = 0.827
a = 3.697b = 16.05c = 0.641d = 0.873
a = 2.687b = 11.55c = 0.565d = 0.851
a = 4.062b = 15.49c = 0.543d = 0.735
R2 0.998 0.995 0.988 0.995 0.993MRE (%) 3.510 7.860 10.18 6.821 7.929RMS 4.674 10.71 14.15 9.384 11.29RSS 0.002 0.006 0.012 0.006 0.007SEE 0.043 0.080 0.112 0.079 0.084
S. Galus, A. Lenart / Journal of Food Engineering 115 (2013) 459–465 463
than used by other researchers (Gennadios et al., 1993; Jangchudand Chinnan, 1999). A change in water content was small for allfilms with water activity from 0 to 0.75 (Fig. 3), which was also ob-served by other researchers (Jangchud and Chinnan, 1999; Shihet al., 2011). In the range of water activity between 0.75 and0.90, water content increased sharply. The water vapour sorptionisotherms of sodium alginate and pectin followed typical type IIIbehaviour according to Brunauer et al. (1940). Shape of all sorptionisotherm curves is common for high sugar food, which absorbs arelatively small amount of water at low water activities and a largeamount at high water activity. High determination coefficient(>0.988) and low value of mean relative error (3.510–10.18%), rootmean square (4.674–14.15), relative squares sum (0.002–0.012),and error of water content (0.043–0.112) confirmed good concor-dance of Peleg’s model with experimental data (Table 4).
A large number of equations have been suggested to model thegeneral sorption function, M = f(aw). To be successful, any model-ling equation should fit as much as possible to experimental dataover a range of water activity using a minimum of adjustableparameters (Coupland et al., 2000). Peleg (1993) constructed Eq.(2) for generation of the frequently observed sigmoidal form. Thatmodel has four adjustable parameters (a, b, c, d), so better fits areexpected compared to other models. Peleg’s equation was widelyused to describe sorption isotherms for many products. Lewicki(1998) applied this model to describe sorption isotherms of 27products. He demonstrated that the highest probability of fitting
experimental data with the minimum mean relative error is guar-anteed by Peleg’s model. Similarly, Palou et al. (1997) surmisedthat Peleg’s model was best suited for description of isothermsfor cookies and chips, because the obtained relative standard devi-ation was lower than 7%. Ciurzynska and Lenart (2010) selected Pe-leg’s model as the most appropriate one for mathematicaldescription of the sorption isotherms of osmotically dehydratedfreeze-dried strawberries. Kowalska et al. (2005) confirmed thatthe characteristic sigmoidal shape of observed isotherms is relatedto occurrence of a monomolecular sorption range in the milieu ofwater activity aw < 0.3 a multi-layer sorption for 0.3 < aw < 0.65,and capillary condensation at aw > 0.65. Peleg’s model as also usedto describe sorption isotherms for edible films, i.e. whey films(Coupland et al., 2000).
3.5. Water vapour permeability
Water vapour permeability for sodium alginate/pectin films atrelative humidity gradient of 30–100% is shown in Table 1. Ob-tained values ranged from 0.84 to 1.73 � 10�10 g m�1 s�1 Pa�1.Films with higher content of alginate (Films A and B) showed sig-nificantly lower values comparing to pectin-containing, althoughthickness was also the lowest. Values of water vapour permeabilityfor analyzed alginate film were lower than presented by Olivas andBarbosa-Canovas (2008) and higher than those presented by Rhim(2004) and Parris et al. (1995). That difference may be caused by adifference in the film preparation and water vapour permeabilitymeasuring conditions. Those authors added a different amount ofglycerol during film preparation and they used different tempera-ture and relative humidity gradients. Reportedly, water vapourbarrier properties of biopolymer films decrease upon addition agreater amount of plasticizers, such as glycerol, and with increas-ing temperature measurement. Furthermore, different waterhumidities gradients were used. When the humidity differentialincreases water vapour permeability values increase as well. Wateracts as a plasticizer in hydrophilic coatings and density or local vis-cosity decreases promoting the mobility of diffusant molecules(Hambleton et al., 2012).
3.6. Mechanical properties
Mechanical properties of biopolymer films are often presentedin terms of tensile strength and elongation at break. Tensilestrength accounts for film’s mechanical resistance due to cohesionforces between chains, while elongation at break measures its plas-ticity, which is capacity of a film to extend before breaking. Due tothe structural nature of those attributes, usually films with hightensile strength show low elongation at break so that both proper-

464 S. Galus, A. Lenart / Journal of Food Engineering 115 (2013) 459–465
ties should be analyzed simultaneously (Altenhofen da Silva et al.,2009).
Table 1 shows tensile strength and elongation at break of so-dium alginate/pectin films. Values of tensile strength ranged signif-icantly (p < 0.001) from 22.5 to 42.3 MPa with the lowest value forpectin film and the highest for 1:1 alginate to pectin film (Film C).Elongation at break ranged from 5.9% to 14.9% with the highest val-ues for mixed films. Values of pure pectin film are different com-pared to those obtained by Kang et al. (2005) who demonstratedtensile strength of 193 MPa and elongation at break of 2.6%. Simi-larly, values for pure alginate film were also different from thosepresented by Rhim (2004) and Olivas and Barbosa-Canovas(2008). Combination of sodium alginate and pectin gave films withhigher tensile strength and elongation at break due to compatibil-ity and chemical synergetic interaction between components (Ta-ble 1). The mechanical profiles of pectin and sodium alginatecomposite films could indicate the structure development. Thisphenomenon was presented in literature. Pascalau et al. (in press)showed significant increase in elongation at break for compositefilms from alginate and k-carrageenan. Similar results were pre-sented by Wang et al. (2010) for gelatin–sodium alginate compos-ite films and by Xu et al. (2005) for chitosan–starch compositefilms.
Fig. 4. Scanning electron micrograph of cross-section of sodium alginate/pectinfilms (magnification 5000�) – A: 100% alginate; B: 75% alginate + 25% pectin; C:50% alginate + 50% pectin; D: 25% alginate + 75% pectin; E: 100% pectin.
3.7. Microstructure
Scanning electron microscopy observations were carried out toget a better insight in the homogeneity and the microscopic struc-ture of films. Scanning electron micrographs of cross sections ofalginate/pectin films are shown in the Fig. 4. Based on variousfilm-forming polysaccharides, single polymeric films may have dif-ferent structures (Phan et al., 2009). Appearance of both sides ofthe film was different. Film side facing the casting plate was shinyand the other one was dull. Pure alginate film was the smoothest. Afilm containing pectin showed more structural discontinuities.That could be a result of drying conditions, chemical compositionand polysaccharide interactions. A different internal arrangementwas observed as a function of film composition. Pectin film net-work is less organized than alginate film. It can be also observedthat film thickness increased when pectin content increased infilm-forming solutions. That could be closely related to differencesbetween water-holding ability of alginate and pectin. Similar re-sults were reported in pectin–soy flour films obtained in the pres-ence of transglutaminase showing that modified films had asmoother surface and higher homogeneity (Mariniello et al.,2003). Presence of pectin or other components may be responsiblefor that phenomenon, because existence of an interaction betweenboth components is obvious. Cross sections of investigated filmsshowed compact microstructure.
4. Conclusions
Combination of sodium alginate and pectin gives continuous,homogenous and transparent edible films. Changing in compositefilms composition does not affect their visual appearance. Filmsthickness depends on film forming solutions composition. Sorptionkinetics and isotherms show hydrophilic character of both compo-nents with higher short-term ability to gain water vapour by algi-nate films. Alginate films show higher rates of water vapoursorption compared to pectin or composite films. Mechanical andbarrier properties of investigated composite films not only dependon compounds used, but also on their compatibility. A differentinternal arrangement is observed as a function of film composition.Higher content of pectin tends to disturb the internal structure offilms. Pectin films network is less organized than alginate ones.
References
Altenhofen da Silva, M., Krause Bierhalz, A.C., Guenter Kieckbush, T., 2009. Alginateand pectin composite films crosslinked with Ca+2 ions: effect of the plasticizerconcentration. Carbohydrate Polymers 77, 736–742.
ASTM, 1995. Standard Test Method for Tensile Properties of Thin Plastic Sheeting,Method D 882-95. American Society for Testing and Materials, Philadelphia.
Bajdik, J., Makai, Z., Berkesi, O., Suvegh, K., Marek, T., Eros, I., Pintye-Hodi, K., 2009.Study of the effect of lactose on the structure of sodium alginate films.Carbohydrate Polymers 77, 530–535.
Braccini, I., Perez, S., 2001. Molecular basis of Ca2+-induced gelation in alginates andpectins: the egg-box model revisited. Biomacromolecules 2, 1089–1096.
Brunauer, S., Deming, L.S., Deming, W.E., Teller, E., 1940. On theory of the van derWaals adsorption of glass. Journal of the American Chemistry Society 62, 1723–1732.
Buonocore, G.G., Del Nobile, M.A., Di Martino, C., Gambacorta, G., La Notte, E.,Nicolais, L., 2003. Modeling the water transport properties of casein-basededible coatings. Journal of Food Engineering 60, 99–106.
Cardoso, S.M., Coimbra, M.A., Lopes da Silva, J.A., 2003. Temperature dependence ofthe formation and melting of pectin–Ca2+ networks: a rheological study. FoodHydrocolloids 17, 801–807.
Cho, S.Y., Rhee, Ch., 2002. Sorption characteristics of soy protein films and theirrelation to mechanical properties. LWT – Food Science and Technology 35, 151–157.
Ciurzynska, A., Lenart, A., 2010. Rehydration and sorption properties of osmoticallyprepared freeze-drying strawberries. Journal of Food Engineering 97, 267–274.
Coupland, J.N., Shaw, N.B., Monahan, F.J., O’Riordan, E.D., O’Sullivan, M., 2000.Modeling the effect of glycerol on the moisture sorption behavior of wheyprotein edible films. Journal of Food Engineering 43, 25–30.
S. Galus, A. Lenart / Journal of Food Engineering 115 (2013) 459–465 465
Debeaufort, F., Voilley, A., 1995. Effects of surfactants and drying rate on barrierproperties of emulsified edible films. International Journal of Food Science andTechnology 30, 183–190.
Debeaufort, F., Martin-Polo, M., Voilley, A., 1993. Polarity and structure affect watervapor permeability of model edible films. Journal of Food Science 58, 428–434.
Donhowe, I.G., Fennema, O.R., 1994. Edible films and coatings: characteristics,formation, definitions, and testing methods. In: Edible Coatings and Films toImprove Food Quality, Lancaster, USA.
Ertesvag, H., Valla, S., 1998. Biosynthesis and applications of alginates. PolymerDegradation and Stability 59, 85–91.
Fabra, M.J., Talens, P., Chirald, A., 2010. Water sorption isotherms and phasetransitions od sodium caseinate–lipid films as affected by lipid interactions.Food Hydrocolloids 24, 384–391.
Falguera, V., Quintero, J.P., Jimenez, A., Munoz, J.A., Ibarz, A., 2011. Edible films andcoatings: structures, active functions and trends in their use. Trends in FoodScience and Technology 22, 292–303.
Fang, Y., Al-Assaf, S., Phillips, G.O., Nishinari, K., Funami, T., Williams, P.A., 2008.Binding behavior of calcium to polyuronates: comparison of pectin withalginate. Carbohydrate Polymers 72, 334–341.
Garcia, M.A., Pinotti, A., Martino, M.N., Zaritzky, N.E., 2004. Characterization ofcomposite hydrocolloid films. Carbohydrate Polymer 56, 339–345.
Gennadios, A., Brandenburg, A.H., Weller, C.L., Testin, R.F., 1993. Effect of pH onproperties of wheat gluten and soy protein isolate films. Journal of Agricultureand Food Chemistry 41, 1835–1839.
Gennadios, A., Weller, C.L., Hanna, M.A., Froning, G.W., 1996. Mechanical and barrierproperties of egg albumen films. Journal of Food Science 61, 585–589.
Ghanbarzadeh, B., Almasi, H., Entezami, A.A., 2010. Physical properties of ediblemodified starch/carboxymethyl cellulose films. Innovative Food Science andEmerging Technologies 11, 697–702.
Hambleton, A., Perpinaz-Sainz, M., Fabra, M.J., Voilley, A., Debeaufort, F., 2012. TheSchroeder paradox or how the state of water affects the moisture transferthrough edible films. Food Chemistry 132, 1671–1678.
Jangchud, A., Chinnan, M.S., 1999. Properties of peanuts protein film: sorptionisotherm and plasticizer effect. LWT – Food Science and Technology 32, 89–94.
Kang, H.J., Job, C., Leeb, N.Y., Kwona, J.H., Byunb, M.W., 2005. A combination ofgamma irradiation and CaCl2 immersion for a pectin-based biodegradable film.Carbohydrate Polymer 60, 547–551.
Kastner, H., Einhorn-Stoll, U., Senge, B., 2012. Structure formation in sugarcontaining pectin gels e Influence of Ca2+ on the gelation of low-methoxylated pectin at acidic pH. Food Hydrocolloids 27, 42–49.
Kokoszka, S., Debeaufort, F., Lenart, A., Voilley, A., 2010. Water vapor permeability,thermal and wetting properties of whey protein isolate based edible films.International Dairy Journal 20, 53–60.
Kowalska, H., Domian, E., Janowicz, M., Lenart, A., 2005. Sorption properties ofselected food powders mixtures of protein–carbohydrate composition.Agricultural Engineering 11, 259–265 (in Polish).
Kowalska, H., Domian, E., Janowicz, M., Lenart, A., 2006. Adsorption kinetics of watervapour by agglomerates of selected mixtures of food powders. AgriculturalEngineering 3, 143–151 (in Polish).
Kunte, L.A., Gennadios, A., Cuppett, S.L., Hanna, M.A., Weller, C.L., 1997. Cast filmsfrom soy protein isolate and fractions. Cereal Chemistry 74, 115–118.
Kurek, M., Descours, E., Galic, K., Voilley, A., Debeaufrot, F., 2012. How compositionand process parameters affect volatile active compounds in biopolymer films.Carbohydrate Polymers 88, 646–656.
Lewicki, P.P., 1998. A three parameter equation for food moisture sorptionisotherms. Journal of Food Engineering 21, 127–144.
Mariniello, L., Pierro, P.D., Esposito, C., Sorrentino, A., Masi, P., Porta, R., 2003.Preparation and mechanical properties of edible pectin–soy flour films obtainedin the absence or presence of transglutaminase. Journal of Biotechnology 102,191–198.
Marudova, M., MacDougall, A.J., Ring, S.G., 2004. Pectin–chitosan interactions andgel formation. Carbohydrate Research 339, 1933–1939.
Muller, C.M.O., Laurindo, J.B., Yamashita, F., 2009. Effect of cellulose fibers on thecrystallinity and mechanical properties of starch-based films at differentrelative humidity values. Carbohydrate Polymers 77, 293–299.
Olivas, G.I., Barbosa-Canovas, G.V., 2008. Alginate–calcium films: water vaporpermeability and mechanical properties as affected by plasticizer and relativehumidity. LWT – Food Science and Technology 41, 359–366.
Palou, E., Lopez-Malo, A., Argaiz, A., 1997. Effect of temperature on the moisturesorption isotherms of some cookies and corn snack. Journal of Food Engineering31, 85–93.
Parris, N., Coffin, D.R., Joubran, R.F., Pessen, H., 1995. Composition factors affectingthe water vapor permeability and tensile properties of hydrophilic films.Journal of Agriculture and Food Chemistry 43, 1432–1435.
Pascalau, V., Popescu, V., Popescu, G.L., Dudescu, M.C., Borodi, G., Dinescu, A.,Perhaita, I., Paul M., in press. The alginate/k-carrageenan ratio’s influence on theproperties of the cross-linked composite films. Journal of Alloys andCompounds. http://dx.doi.org/10.1016/j.jallcom.2011.12.026.
Paschoalick, T.M., Garcia, F.T., Sobral, P.J.A., Habitante, A.M.Q.B., 2003.Characterization of some functional properties of edible films based onmuscle proteins of Nile Tilapia. Food Hydrocolloids 17, 419–427.
Peleg, M., 1993. Assessment of a semi-empirical four parameter general model forsigmoid moisture sorption isotherms. Journal of Food and Process Engineering16, 21–37.
Phan, D., Debeaufort, F., Voilley, A., Luu, D., 2009. Biopolymer interaction affect thefunctional properties of edible films based on agar, cassava starch andarabinoxylan blends. Journal of Food Engineering 90, 548–558.
Raharitsifa, N., Ratti, C., 2010. Foam-mat freeze-drying of apple juice part 2: stabilityof dry products during storage. Journal of Food Process Engineering 33, 268–283.
Rhim, J.W., 1998. Modification of soy protein film by formaldehyde. Korean Journalof Food Science and Technology 30, 372–378.
Rhim, J.W., 2004. Physical and mechanical properties of water resistant sodiumalginate films. LWT – Food Science and Technology 37, 323–330.
Rhim, J.W., Gennadios, A., Weller, C.L., Hanna, M.A., 2002. Sodium dodecyl sulfatetreatment improves properties of cast films from soy protein isolate. IndustrialCrops and Products 15, 199–205.
Sablani, S.S., Kasapis, S., Rahman, M.S., 2007. Evaluating water activity and glasstransition concepts for food stability. Journal of Food Engineering 78, 266–271.
Shih, F.F., Daigle, K.W., Champagne, E.T., 2011. Effect of wax on water vapourpermeability and sorption properties of edible pullulan films. Food Chemistry127, 118–121.
Sobral, P.J., dos Santos, J.S., Garcia, F.T., 2005. Effect of protein and plasticizerconcentration in film forming solutions on physical properties of edible filmsbased on muscle proteins of a Thai Tilapia. Journal of Food Engineering 70, 93–100.
Spiess, W.E.L., Wolf, W., 1987. Critical evaluation of methods to determine moisturesorption isotherms. In: Water Activity: Theory and Applications to Food, BocaRaton, USA.
Vargas, M., Albors, A., Chiralt, A., Gonzalez-Martinez, Ch., 2011. Water interactionsand microstructure of chitosan–methylcellulose composite films as affected byionic concentration. LWT – Food Science and Technology 44, 2290–2295.
Walkenstrom, P., Kidman, S., Hermansson, A.-M., Rasmussen, P.B., Hoegh, L., 2003.Microstructure and rheological behaviour of alginate/pectin mixed gels. FoodHydrocolloids 17, 593–603.
Wang, L., Auty, M.A.E., Kerry, J.P., 2010. Physical assessment of compositebiodegradable films manufactured using whey protein isolate, gelatin andsodium alginate. Journal of Food Engineering 96, 199–207.
Xu, Y.X., Kim, K.M., Hanna, M.A., Nag, D., 2005. Chitosan–starch composite films:preparation and characterization. Industrial Crops and Products 21, 185–192.
Copyright © 2022 FDOKUMEN