DIFFUSIVITY AND ELECTRICAL PROPERTIES OF GUM ARABIC, CARBON BLACK/KBRO3 COMPOSITE MATERIAL
7
[Ishage, 4(4): April, 2015] ISSN: 2277-9655 Scientific Journal Impact Factor: 3.449 (ISRA), Impact Factor: 2.114 http: // www.ijesrt.com © International Journal of Engineering Sciences & Research Technology [263] IJESRT INTERNATIONAL JOURNAL OF ENGINEERING SCIENCES & RESEARCH TECHNOLOGY DIFFUSIVITY AND ELECTRICAL PROPERTIES OF GUM ARABIC, CARBON BLACK/KBRO3 COMPOSITE MATERIAL A. Elhadi H. M. Ishage, Hatim M. Elkhair, Mohamed A. Siddig, Abdelrahman A. Elbadawi * Department of Physics, Faculty of Science and Technology, AlNeelian University, P.O. Box 12702- Khartoum 11121-Sudan Department of Physics, College of Science, Al Imam Mohammad Ibn Saud Islamic University, P.O Box 5701, Riyadh 11432 Department of Physics, Faculty of Science and Technology, AlNeelian University, P.O. Box 12702- Khartoum 11121-Sudan Department of Physics, Faculty of Science and Technology, AlNeelian University, P.O. Box 12702- Khartoum 11121-Sudan ABSTRACT Porous Gum Arabic (GA) doped with carbon black (Soot) was prepared using solid state chemical method. Potassium spectroscopy (IS), scanning electron microscope (SEM) and Energy-dispersive X-ray Spectroscopy (EDS) were used in order to investigate the electrical properties of Gum Arabic, the diffusion coefficient, dielectric constant and the existence of elements, respectively. The results of diffusion coefficient and dielectric showed direct proportionality with the logarithmic frequency. The porosity of the sample was found to be directly proportional to the dielectric constant. The effect of temperature was profound as diffusivity and conductivity were found to increase with temperature. KEYWORDS: Diffusion, Porous, soot, impedance spectroscopy, scanning electron microscope Introduction Diffusion is defined as the transport of mass in gases, liquids and solids under the influence of a concentration gradient proceeds spontaneously due to microscopic movement of mass is an irreversible process which leads to an increase in entropy and is only reversible by supply of work [1]. Another definition of diffusion is defined as the process by which an innovation is adopted and gains acceptance by members of a certain community [2]. Impedance spectroscopy was said to be the most useful technique for measuring diffusion and various electrical parameters such as, conductivity, dielectrics etc; and physical parameters can be utilized for calculating different physical features including; diffusivity, permeability and overall microstructure properties of a given specimen [3]. Anja Buchwald determines the diffusion coefficients of salt ions in masonry materials such as brick, mortar and sandstone. Beside the usage of diffusion experiments the impedance spectroscopy has also be applied [3]. Binay K. Dutta et al fabricated a homogeneous silica film by dip coating, they annealed the film at elevated temperatures, and characterize the film by the measurement of particle size distribution, scanning electron microscopy, spectroscopy measurement of the refractive index and thermal conductivity. They found that the porosity of the films decreased whereas refractive index and dielectric constant of it increased with the increase in the annealing temperature [4]. General formulations for diffusion and mass transport are outlined in Fick’s first law of diffusion, which expresses the steady state flux of diffusion per unit area [5 ]. Diffusion following the Fick’s first and second laws is termed Fickian diffusion, generalized diffusion model containing terms for both stress (pressure) and thermal gradient. Therefore the diffusion coefficients were determined by impedance spectroscopy measurements [2, 6]. In this work, we aim to improve the properties of Gum Arabic (GA) by doping it with carbon black (soot) and potassium bromide. Sample of GA doped with Carbon black/KBrO3 was prepared. The effect of doped and effect of different temperature on the properties of GA was investigated using Impedance spectroscopy (IS), scanning electron
-
Upload
independent -
Category
Documents
-
view
0 -
download
0
Transcript of DIFFUSIVITY AND ELECTRICAL PROPERTIES OF GUM ARABIC, CARBON BLACK/KBRO3 COMPOSITE MATERIAL

[Ishage, 4(4): April, 2015] ISSN: 2277-9655
Scientific Journal Impact Factor: 3.449
(ISRA), Impact Factor: 2.114
http: // www.ijesrt.com © International Journal of Engineering Sciences & Research Technology
[263]
IJESRT INTERNATIONAL JOURNAL OF ENGINEERING SCIENCES & RESEARCH
TECHNOLOGY
DIFFUSIVITY AND ELECTRICAL PROPERTIES OF GUM ARABIC, CARBON
BLACK/KBRO3 COMPOSITE MATERIAL A. Elhadi H. M. Ishage, Hatim M. Elkhair, Mohamed A. Siddig, Abdelrahman A. Elbadawi
* Department of Physics, Faculty of Science and Technology, AlNeelian University, P.O. Box 12702-
Khartoum 11121-Sudan
Department of Physics, College of Science, Al Imam Mohammad Ibn Saud Islamic University, P.O Box
5701, Riyadh 11432
Department of Physics, Faculty of Science and Technology, AlNeelian University, P.O. Box 12702-
Khartoum 11121-Sudan
Department of Physics, Faculty of Science and Technology, AlNeelian University, P.O. Box 12702-
Khartoum 11121-Sudan
ABSTRACT Porous Gum Arabic (GA) doped with carbon black (Soot) was prepared using solid state chemical method. Potassium
spectroscopy (IS), scanning electron microscope (SEM) and Energy-dispersive X-ray Spectroscopy (EDS) were used
in order to investigate the electrical properties of Gum Arabic, the diffusion coefficient, dielectric constant and the
existence of elements, respectively. The results of diffusion coefficient and dielectric showed direct proportionality
with the logarithmic frequency. The porosity of the sample was found to be directly proportional to the dielectric
constant. The effect of temperature was profound as diffusivity and conductivity were found to increase with
temperature.
KEYWORDS: Diffusion, Porous, soot, impedance spectroscopy, scanning electron microscope
Introduction Diffusion is defined as the transport of mass in gases, liquids and solids under the influence of a concentration gradient
proceeds spontaneously due to microscopic movement of mass is an irreversible process which leads to an increase in
entropy and is only reversible by supply of work [1]. Another definition of diffusion is defined as the process by which
an innovation is adopted and gains acceptance by members of a certain community [2]. Impedance spectroscopy was
said to be the most useful technique for measuring diffusion and various electrical parameters such as, conductivity,
dielectrics etc; and physical parameters can be utilized for calculating different physical features including; diffusivity,
permeability and overall microstructure properties of a given specimen [3]. Anja Buchwald determines the diffusion
coefficients of salt ions in masonry materials such as brick, mortar and sandstone. Beside the usage of diffusion
experiments the impedance spectroscopy has also be applied [3]. Binay K. Dutta et al fabricated a homogeneous silica
film by dip coating, they annealed the film at elevated temperatures, and characterize the film by the measurement of
particle size distribution, scanning electron microscopy, spectroscopy measurement of the refractive index and thermal
conductivity. They found that the porosity of the films decreased whereas refractive index and dielectric constant of
it increased with the increase in the annealing temperature [4]. General formulations for diffusion and mass transport
are outlined in Fick’s first law of diffusion, which expresses the steady state flux of diffusion per unit area [5].
Diffusion following the Fick’s first and second laws is termed Fickian diffusion, generalized diffusion model
containing terms for both stress (pressure) and thermal gradient. Therefore the diffusion coefficients were determined
by impedance spectroscopy measurements [2, 6].
In this work, we aim to improve the properties of Gum Arabic (GA) by doping it with carbon black (soot) and
potassium bromide. Sample of GA doped with Carbon black/KBrO3 was prepared. The effect of doped and effect of
different temperature on the properties of GA was investigated using Impedance spectroscopy (IS), scanning electron
[Ishage, 4(4): April, 2015] ISSN: 2277-9655
Scientific Journal Impact Factor: 3.449
(ISRA), Impact Factor: 2.114
http: // www.ijesrt.com © International Journal of Engineering Sciences & Research Technology
[264]
microscope (SEM). The IS was used for exploring the electrical properties while the structure and existence of
elements were studied using (SEM) and Energy-dispersive X-ray Spectroscopy (EDS), respectively.
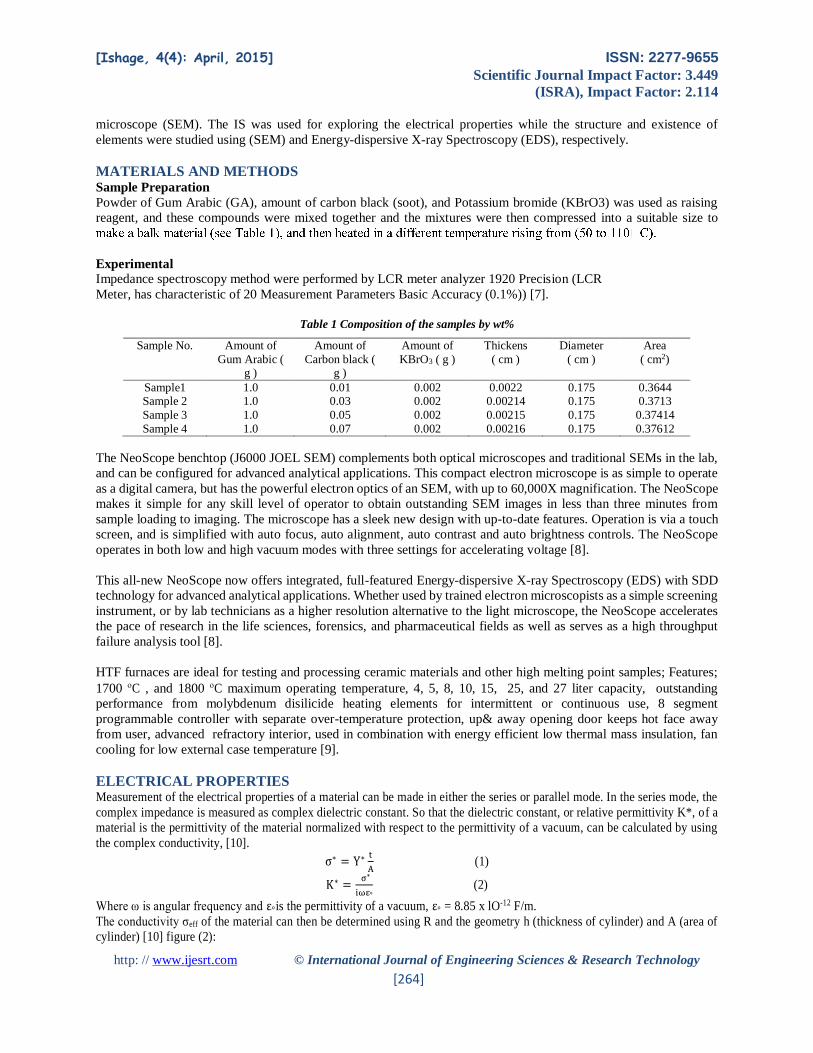
MATERIALS AND METHODS Sample Preparation
Powder of Gum Arabic (GA), amount of carbon black (soot), and Potassium bromide (KBrO3) was used as raising
reagent, and these compounds were mixed together and the mixtures were then compressed into a suitable size to
Experimental
Impedance spectroscopy method were performed by LCR meter analyzer 1920 Precision (LCR
Meter, has characteristic of 20 Measurement Parameters Basic Accuracy (0.1%)) [7].
Table 1 Composition of the samples by wt%
The NeoScope benchtop (J6000 JOEL SEM) complements both optical microscopes and traditional SEMs in the lab,
and can be configured for advanced analytical applications. This compact electron microscope is as simple to operate
as a digital camera, but has the powerful electron optics of an SEM, with up to 60,000X magnification. The NeoScope
makes it simple for any skill level of operator to obtain outstanding SEM images in less than three minutes from
sample loading to imaging. The microscope has a sleek new design with up-to-date features. Operation is via a touch
screen, and is simplified with auto focus, auto alignment, auto contrast and auto brightness controls. The NeoScope
operates in both low and high vacuum modes with three settings for accelerating voltage [8].
This all-new NeoScope now offers integrated, full-featured Energy-dispersive X-ray Spectroscopy (EDS) with SDD
technology for advanced analytical applications. Whether used by trained electron microscopists as a simple screening
instrument, or by lab technicians as a higher resolution alternative to the light microscope, the NeoScope accelerates
the pace of research in the life sciences, forensics, and pharmaceutical fields as well as serves as a high throughput
failure analysis tool [8].
HTF furnaces are ideal for testing and processing ceramic materials and other high melting point samples; Features;
1700 C , and 1800 C maximum operating temperature, 4, 5, 8, 10, 15, 25, and 27 liter capacity, outstanding
performance from molybdenum disilicide heating elements for intermittent or continuous use, 8 segment
programmable controller with separate over-temperature protection, up& away opening door keeps hot face away
from user, advanced refractory interior, used in combination with energy efficient low thermal mass insulation, fan
cooling for low external case temperature [9].
ELECTRICAL PROPERTIES Measurement of the electrical properties of a material can be made in either the series or parallel mode. In the series mode, the
complex impedance is measured as complex dielectric constant. So that the dielectric constant, or relative permittivity K*, of a
material is the permittivity of the material normalized with respect to the permittivity of a vacuum, can be calculated by using
the complex conductivity, [10].
σ∗ = Y∗ t
A (1)
K∗ = σ∗
iωε° (2)
Where ω is angular frequency and ε°is the permittivity of a vacuum, ε° = 8.85 x lO-12 F/m.
The conductivity σeff of the material can then be determined using R and the geometry h (thickness of cylinder) and A (area of
cylinder) [10] figure (2):
Sample No. Amount of
Gum Arabic ( g )
Amount of
Carbon black ( g )
Amount of
KBrO3 ( g )
Thickens
( cm )
Diameter
( cm )
Area
( cm2)
Sample1 1.0 0.01 0.002 0.0022 0.175 0.3644 Sample 2 1.0 0.03 0.002 0.00214 0.175 0.3713
Sample 3 1.0 0.05 0.002 0.00215 0.175 0.37414
Sample 4 1.0 0.07 0.002 0.00216 0.175 0.37612

[Ishage, 4(4): April, 2015] ISSN: 2277-9655
Scientific Journal Impact Factor: 3.449
(ISRA), Impact Factor: 2.114
http: // www.ijesrt.com © International Journal of Engineering Sciences & Research Technology
[265]
σeff = h
R A (3)
Using Nernst-Einstein-relation, the diffusion coefficient Deff can be calculated from σeff and the carbon concentration in the
sample [3]:
Deff = σeff K T
Z2F e c (4)
k: Boltzmann constant, T: Temperature, z: charge number, F: Faraday constant, and e: electron charge.
RESULTS AND DISCUSSION The measurements of dielectric impedance, diffusion and scanning electron microscope are done for the pure gum
Arabic sample and that doped with carbon black (soot)/ Potassium Bromide Oxide (KBrO3). Figure (1) shows the
Nyquist plot of a sample with Xs (Imaginary part of impedance Z'') is plotted as function of Rs (Real part of impedance
Z'). The frequency range is chosen between (20- 1MHz).The effect of temperature is investigated and the Xs was
found to be inversely proportional to the temperature.
Figure 1 Nyquist plot of a sample (Rs: Real part of impedance Z', and Xs: Imaginary part of impedanceZ'') at frequency
ranging between (20-1MHz).
The conductivity as a function of frequency for sample for different temperature is shown in Figure (2). The
conductivity is found to decrease with increase in temperature, (sample have more pores), but when we increase the
amount of carbon bla
be conducting, (carbon black properties), at low frequency [11].
Figure 1 The conductivity of Gum Arabic adopted with carbon black (soot)/KBrO3; with constant weight; heated in different
temperatures (T). The numbers represent frequency in kilohertz; the axes are in arbitrary scale units.
Dielectric constant as a function of frequency was performed for different temperature as shown in Figure 3. It can be
observed that the dielectric is decreased when temperature was further increased. This behavior is expected as an
opposite of that observed in case of conductivity.

[Ishage, 4(4): April, 2015] ISSN: 2277-9655
Scientific Journal Impact Factor: 3.449
(ISRA), Impact Factor: 2.114
http: // www.ijesrt.com © International Journal of Engineering Sciences & Research Technology
[266]
Figure 2 Dielectric constant of Gum Arabic adopted with carbon black (soot)/KBrO3; with constant weight; heated in
different temperatures (T). The numbers represent frequency in kilohertz; the axes are in arbitrary scale units.
The diffusivity was calculated using equation (4). The effect of different temperature on diffusivity was investigated
and plotted as shown in Figure 4. At low frequency the diffusivity was found to be identical for sample with different
temperature. The diffusivity was found to increase with temperature. Furthermore, the relation between diffusion
coefficient and heating treatment was shown in Figure (5). Linear relationship is observed for sample with different
temperature. It can be observed that diffusivity and conductivity is increased as temperature is further increased.
Figure 3 Diffusion coefficient of Gum Arabic adopted with carbon black (soot)/KBrO3; with constant weight; heated in
different temperatures (T). The numbers represent frequency in kilohertz; the axes are in arbitrary scale units.
Figure 5 The relation between Diffusion coefficient and conductivity of the sample heated in different temperatures (T) is
linearity; the axes are in arbitrary scale units.

[Ishage, 4(4): April, 2015] ISSN: 2277-9655
Scientific Journal Impact Factor: 3.449
(ISRA), Impact Factor: 2.114
http: // www.ijesrt.com © International Journal of Engineering Sciences & Research Technology
[267]
Figure 6 EDX spectrum of pure Gum Arabic; which indicates the presence of carbon, aluminum and potassium (Gum is
composed of mainly Polysaccharides, Arabinose and Rhamnose).
NeoScope offers integrated, full-featured Energy-dispersive X-ray Spectroscopy (EDS) with SDD technology for
advanced analytical applications. As it can be seen in Figure 6, the spectrum of the Gum Arabic sample, so the
spectrum is indicated the existence of Carbon, Aluminum and Potassium. Table (2) shows the analysis of EDX of GA
doped with carbon black/KBrO3 composite.
Table 2 The analysis of the EDX results for Gum Arabic composite (carbon black (soot)/KBrO3
( a ) ( b )
( c ) ( d )
Element (keV) Mass%
Sigma Atom% K
C K 0.277 54.39 0.57 64.28 35.8260 O K 0.525 32.47 0.96 28.81 28.6761
Al K 1.486 13.14 0.24 06.91 35.4979
Total - 100.00 - 100.00 -

[Ishage, 4(4): April, 2015] ISSN: 2277-9655
Scientific Journal Impact Factor: 3.449
(ISRA), Impact Factor: 2.114
http: // www.ijesrt.com © International Journal of Engineering Sciences & Research Technology
[268]
( e ) ( f )
( g ) ( h )
( i ) ( j )
Figure (7) a, b, c, d, e, f, g, h, i and j show the Scanning Electron Microscope (SEM) images, pores structure and micrograph
of Gum Arabic composite (carbon black (soot)/KBrO3 with constant weight; heated in different temperatures (T).
Scanning electron microscope is performed for sample with different temperature. Figure 7 a-j shows the images of
SEM for GA doped with carbon black/KBrO3 composite for different temperature. From the results it can be noticed
that, there is a clear difference in the doped samples when heated, and the difference is obvious for the all samples.
The conductivity of the samples that doped by carbon black (soot) and KBrO3 is found to be decrease when frequency
and temperature is increased, as shown in Figure (2), while a dielectric constant and diffusion coefficient (K') increase,
Figure (3, 4) respectively. These results is found to be in agreement with, porosity of the material (sample) is increase
when temperature increase and diffusion decreasing, Figure (7-j) represents the image of pure Gum Arabic without
carbon (soot) at room temperature, and there is no pore (grain). On the other hand, Figure (7-i) represents the image
of pure Gum Arabic with carbon (soot) at room temperature, and there is few pores (grain). But in Figures (7 a-h)
there are more of pores which can be observed and this may lead to that the sample porosity increase with temperature.
At low frequency there will be more vacancy, hence increase in dielectric constant (K') was expected and at the same
time such vacancy may represent the highest diffusion sites leading to interstitial diffusion for carbon black atoms
[11].
CONCLUSION Sample of Gum Arabic doped with carbon black (Soot) and Potassium bromide (KBrO3) was successfully prepared
using solid state chemical method. The results of diffusion coefficient and dielectric showed direct proportionality
with the logarithmic frequency. The porosity of the sample was found to be directly proportional to the dielectric
constant. The effect of temperature was profound as diffusivity and conductivity were found to increase with
temperature. Such results might be attributed to the increase in grains surface to volume ratio obtained in our sample
and being the good evident for porosity formation. The rate of diffusion is proportional to the concentration gradient

[Ishage, 4(4): April, 2015] ISSN: 2277-9655
Scientific Journal Impact Factor: 3.449
(ISRA), Impact Factor: 2.114
http: // www.ijesrt.com © International Journal of Engineering Sciences & Research Technology
[269]
of the diffusion. General formulations for diffusion and mass transport are outlined in Fick’s first law of diffusion,
expresses the steady state flux of diffusion per unit area.
REFERENCES [1] Cornelia Breitkopf, Diffusion in porous media – measurement and modeling, (09.12.2011), Lecture Series at
Fritz-Haber-Institute Berlin, Modern Methods in Heterogeneous Catalysis.
[2] Paul Heitjans, Diffusion in Condensed Matter Methods, Materials, Models, (2005), University of Hannover,
Germany. 2005 2nd ed. XXVI, 965 p. 448 illus. Hardcover.
[3] A. Buchwald: Determination of the Ion Diffusion Coefficient in Moisture and Salt Loaded Masonry Materials
by Impedance Spectroscopy. In: 3rd Int. PhD Symposium 11.-13.10.2000 Vienna. Proceedings. vol. 1, p.
475-482 (2000)
[4] Binay K. Dutta, Tayseir M. Abd Ellateif, and Saikat Maitra, Development of a Porous Silica Film by Sol-gel
Process. (2011) World Academy of Science, Engineering and Technology 73 508-512.
[5] M. Kizilyalli, J. Corish and R. Metselaar. Definitions of terms for diffusion in the solid, state (IUPAC
Recommendations 1999), Pure Appl. Chem. Vol. 71. Printed in Great Britain. Pure Appl. Chem., Vol. 71,
No. 7, pp. 1307–1325, 1999.
[6] L. Valek, M. Metikoš-Huković and Z. Grubač Impedance Spectroscopy Characterization Of the
Electrodeposited Ni-15Mo Catalyst Designed for the HER in Acid Solution, Modified Porous Model, (March
15, 2006), University of Zagreb, POB 177 10000 Zagreb, Croatia. Journal of New Materials for
Electrochemical Systems 9, 145-153 (2006).
[7] Quad Tech I so 9001 Certified, LCR Measurement Primer, (July 2003), 3rd Edition, Maynard, Massachusetts.
[8] Nikon Metrology Inc. Industrial & Measurement, Copyright (2015), JEOL USA, Inc Voltage, magnification,
m-bar, and m value www.nikonmetrology.com.
[9] Carbolite Leading Heat technology, Introduction to Carbolite Ovens & Furnaces, UK.
[10] Rosemary J. Knight and Amos Nur. The Dielectric Constant of Sandstones, 60 KHz to 4MHz, (May 1987),
Geophysics. Vol. 52-No.5. page 644-654.
[11] Working Groups, Carbon Black, Titanium Dioxide, and Talc [IARC MONOGRAPHS. CARBON BLACK],
in April, March (IARC, 1984, 1987, 1996) volume 93. IARC Monographs on the Evaluation of Carcinogenic
Risks to Humans VOLUME 93 (2010)
[12] Kozo Ishizaki, Sridhar Komameni and Mokoto Nanko. Porous Materials Process Technology and
Applications, (Materials Technology Series) Kluwer Academic Publishers (1998).
[13] C. Brosseau, F. Boulic, P. Queffelec, C. Bourbigot, Y. Le Mest, and J. Loaeca A. Beroual, Dielectric and
microstructure properties of polymer carbon black composites, (15 January 1997) Appl. Phys., Vol. 81,
France.
[14] Marco Bittelli, Markus Flury, and Kurt Roth, Use of dielectric spectroscopy to estimate ice content in frozen
porous media, (22 April 2004), Water Resources Research, W04212, doi:10.1029/2003WR002343,
published.
[15] A. Elhadi H. M. Isaaq, Hatim M. Elkhair, Abdelrahman A. Elbadawi, Mohamed A. Siddig, Murwan K. Sabah
Elkhair. Determination of Dielectric Constant of Gum Arabic / Carbon Black Composite Material, Nova
Journal of Engineering and Applied Sciences Vol 3(1), Jan 2015:1-7.
[16] Eduardo J. Bothani and Juan M. Tascon, Adsorption by Carbons, first edition (2008), Elsevier Science and
Technology, Right Department in Oxford UK.
[17] J. ROSS Macdonald, Impedance Spectroscopy, (1992) Annals of Biomedical Engineering, Vol. 20, pp. 289-
305. Department of Physics and Astronomy University of North Carolina.