Crude malva nut gum affects pasting and textural properties of ...
Ep
MDS
a
ARRAA
KMGRSB
1
paTtwobpeuetsutptar
m(
0h
International Journal of Biological Macromolecules 53 (2013) 168– 176
Contents lists available at SciVerse ScienceDirect
International Journal of Biological Macromolecules
jo u rn al hom epa ge: www.elsev ier .com/ locate / i jb iomac
ffect of gum tragacanth exuded by three Iranian Astragalus on mixed milkrotein system during acid gelation
ohammad Nejatian, Masoud Hatami, Mohammad Amin Mohammadifar ∗
epartment of Food Science and Technology, National Nutrition and Food Technology Research Institute, Faculty of Nutrition Sciences and Food Technology,hahid Beheshti University of Medical Sciences, 193954741 Tehran, Iran
r t i c l e i n f o
rticle history:eceived 23 September 2012eceived in revised form 21 October 2012ccepted 1 November 2012vailable online 9 November 2012
a b s t r a c t
The effects of various concentrations of three species of gum tragacanth on the gelation process,microstructure and viscoelastic properties of milk protein mixed gels acidified at 37 ◦C by glucono-�-lactone (GDL) were investigated using dynamic rheometry and microscopy. According to rheologicalmeasurements, the addition of gum tragacanth in the range of 0.05–0.2% (w/w) into milk protein dis-persions led to a weaker structure for the milk protein network, compared to the control sample.
eywords:ilk protein gelum tragacanthheologycanning electron microscopy
This weakening effect could be eliminated by adding 0.3% (w/w) gum tragacanth exudates from A.gossypinus; the compositional features of gum tragacanth may have been responsible for the improvedprotein–protein interactions, greater structural strength and reduced gelation time onset. It was deter-mined by scanning electron microscopy that the addition of gum tragacanth at a low concentration causedthe density of the matrix to increase, while an open structure was observed in the presence of a higher
iopolymer interactions gum concentration.
. Introduction
Gelation involves the formation of a three-dimensional matrix,rimarily through the association of long polymer chains, whichllows the immobilization of water within the gel structure [1].his phenomenon is of practical significance in the food indus-ry, as it contributes to food texture and matrices for retainingater, flavor, lipids or other food ingredients. The food technol-
gist who wishes to produce a gelled product is faced with twoasic options for achieving the desired effect; whether to use arotein or a polysaccharide [2]. Although a gel can be formed usingither one, currently there exists an increasing number of man-factured products that include both protein and polysaccharidelements in their formulation to achieve the desired physical struc-ure, perceived “eating quality”, behavior during processing andtability during storage [3]. This is especially true for low-fat prod-cts, where the fat content is to be reduced without changinghe characteristic properties of the food products. Nutritionally,olysaccharides are classified as dietary fibers and can increase
he functional properties of food products [4]. Sodium caseinatend whey protein concentrate are used as ingredients in a wideange of foods, particularly desserts, where polysaccharides are the∗ Corresponding author. Tel.: +98 2122376426; fax: +98 2122357487.E-mail addresses: [email protected] (M. Nejatian),
[email protected] (M. Hatami), [email protected]. Mohammadifar).
141-8130/$ – see front matter © 2012 Elsevier B.V. All rights reserved.ttp://dx.doi.org/10.1016/j.ijbiomac.2012.11.001
© 2012 Elsevier B.V. All rights reserved.
other main constituents. Such usages of milk proteins are partiallyattributed to their ability to form excellent gels [5].
To a large extent, the nature and strength of protein/polysaccharide interactions determine the overall texture andstructural properties of mixed gels. Therefore, understanding themechanism occurring in the mixed gel systems is necessary tomodel and improve conventional foods, to develop novel formu-lated foods and to control the functional properties of food products[6]. Because of the polyelectrolyte character of milk proteins andsome polysaccharides, electrostatic interactions play an importantrole in the interaction between these biopolymers. The overallpolymer–polymer electrostatic interaction is very sensitive to pHvariations [7,8,9]. At pH values between 6.7, normal milk pH, to4.6, the isoelectric point of casein, both proteins and polysac-charides (anionic polysaccharides and/or nonionic polysaccharideswith isoelectric points around or below 3) have similar electri-cal charges or are uncharged. As a result of the difference in thismolecular property, protein and polysaccharides repel each other,leading to phase separation [10]. The range of minimum concen-trations for biopolymer gelation is usually lower than that of thephase separation threshold. Indeed, the gelation and phase separa-tion processes compete, and depending on which is dominating orarresting the other formation, the different microstructure will beproduced [11]. The nature or chemical composition of a polysac-
charide, such as whether it is adsorbing or non-adsorbing, theesterification degree, the presence of sulfate or carboxylate groupsand the relative concentration of a protein–polysaccharide mixture,are factors that influence the competition (balance) between phase
f Biolo
sabatgGpGbd2deo(tmcepaeocosmeItatdttodstaiwtg
2
2
(crb(NSf
2
pc
M. Nejatian et al. / International Journal o
eparation and gel formation [12]. These factors are also stronglyssociated with each other, and one of these factors should note considered without the others. For example, both adsorbingnd non-adsorbing polysaccharides, depending on their concen-rations and their ratio to milk proteins, are able to enhance theel formation process or to prevent the gel formation process [13].um tragacanth (GT) is a branched, heterogeneous and anionicolysaccharide that is exuded from Asiatic species of Astragalus.T consists of a linear 1,4 linked �-d-galacturonic acid back-one with three types of side chains: single �-d-xylopyranose andisaccharide units of 2-O-�-l-fucopyranosyl-d-xylopyranose and-O-�-d-galactopyranosyl-d-xylopyranose [8]. GT’s exudate fromifferent species exhibits different structural and functional prop-rties, which might be due to a unique feature of GT; GT consistsf two major fractions: tragacanthin (water-soluble) and bassorinwater-swellable) [14]. The bassorin and tragacanthin composi-ions may differ, particularly in terms of their uronic acid and
ethoxyl contents. Furthermore, the ratio of soluble/insolubleomponents in different species is varied. As a result of the differ-nt properties, various species of GT can be used instead of otherolysaccharides, adsorbing or non-adsorbing, in a wide range ofpplications [15]. However, there is little information about theffects of this polysaccharide on the structure of protein gels. Mostf the previous research in this area has been too highly empiri-al and qualitative in nature and has not investigated the detailsf the interaction between the components of the system. In fact,tudies on the behavior of GT–milk protein mixtures as a dairyodel system are scarce. Moreover, the influence of the differ-
nt GT species on the interactions of such systems is unknown.n this study, we investigated the interactions between milk pro-eins and GT exudates from three species of Iranian Astragalus incidified gels formulated with these three polysaccharides. Theseri-polymeric systems have been examined as a model system forairy acidified gels, as the interference caused by food componentshat do not have an important role in forming the gel are removed,hereby allowing an understanding of the underlying mechanismsf gel formation. Manipulative control of product texture in actualairy systems may be derived from this model. The objective of thistudy was to determine the effects of three types of Iranian GT onhe rheology and microstructure of sodium caseinate-whey proteincid-induced gels. To reach this goal, a combination of techniquesncluding small amplitude oscillatory rheology and microscopy
ere used, and the possible relationships between these proper-ies and milk protein–polysaccharide interactions during acidifiedelation were also discussed.
. Materials and methods
.1. Materials
Three species of Iranian GT exuded from Astragalus gossypinusA.g), Astragalus rahensis (A.r) and Astragalus fluccosus (A.f) wereollected from plants growing in different provinces of Iran. Theaw gum was ground and sieved. Powdered gum with a mesh sizeetween 200 and 500 �m was used. Whey protein concentrateWPC) was supplied by DMV international (Veghel, Netherlands).a-caseinate and glucono-�-lactone (GDL) were purchased fromigma Chemical Co (St Louis, MO) and sodium azide was purchasedrom merck (Darmstadt, Germany).
.2. Preparation of dispersions
Binary Na-caseinate/WPC dispersions at 3.5% (w/w) totalrotein concentration were prepared with 2.8% (w/w) Na-aseinate/0.7% (w/w) WPC by dispersing 3.5 g of protein powder
gical Macromolecules 53 (2013) 168– 176 169
(Na-caseinate to WPC ratio of 4/1) in 96.5 g of distilled water undercontinuous stirring at 45 ◦C for 2 h. GT dispersion was preparedby weight (w/w percent). The required amount of polysaccharidepowder (0.02, 0.05, 0.2 and 0.3%, w/w) was dispersed in distilledwater under gentle stirring at room temperature for 2 h. Approx-imately 0.025% NaN3 (sodium azide) was added to the differentblends to prevent bacterial growth. The gum and milk proteindispersions were stored for 24 h at 5 ◦C to enable biopolymer hydra-tion.
Mixed dispersions were prepared by adding a Na-caseinate/WPC dispersion to GT dispersion at a protein to polysaccharideweight ratio of 1:1.
2.3. Acid-induced milk protein polysaccharide gels
The mixed samples were heated at 85 ◦C for 30 min. Followingcooling in an ice water bath, 0.55% GDL (sufficient to achieve a pHof 4.6 after 200 min) was added to the dispersions with vigorousstirring for 5 min. Acidification of dispersions was carried out at37 ◦C for 200 min.
2.4. Monitoring of pH
The reduction patterns of pH during acidification of the milkprotein dispersions with or without GT was continuously moni-tored in parallel samples by means of a pH meter (Metrohm, 827 pHLab, Switzerland) equipped with an electrode. The measurementswere carried out after a two-point calibration at the incubationtemperature (37 ◦C).
2.5. Rheological measurements
The rheological properties of the acidified control milk pro-teins and milk protein–GT mixtures were monitored usinglow-amplitude dynamic oscillation. A Physica MCR 301 Rheome-ter (Anton Paar, GmbH, Graz, Austria) and a four-blade vane St14geometry were used for all experiments. Following the additionof GDL, 37 mL of solution was transferred to the rheometer cup. Asolvent trap was used to prevent evaporation of the samples. Thetemperature was regulated by a Viscotherm VT2 circulating bathand controlled with a Peltier system (Anton Paar, GmbH) with anaccuracy of ±0.01 ◦C. Time-sweep measurements were performedthroughout the gelation process at 37 ◦C at a frequency of 0.5 Hz andwith an applied strain of 0.5% that was within the linear viscoelasticrange. Measurements were taken every 1 min for 200 min. Gelationwas defined as the point at which the storage modulus (G′) wasabove the instrument noise level (ca. 1 Pa). The gelation rate of sam-ples up to pH 4.6 was calculated using the expression �G′ (Pa)/�t(min). Strain sweep tests were performed (0.01–1000%, 1 Hz) tomeasure the linear viscoelastic range (LVE), resistance to mechan-ical force or yield stress (�y; which is also a measure of structuralstrength), which can be calculated from the limiting value of the LVErange in term of shear stress, and shear stress values at the flowingpoint (�f). For the frequency sweep, a constant strain of 1% (LVErange) was applied, and the range of frequency was 20–0.01 Hz.Power low model (G′ = a·ωb) was fitted on the experimental data todetermine the structural strength (a) and type of structure (b) [15].
2.6. Scanning electron microscopy (SEM)
Pieces of gel (approximately 4 mm cubes) were rapidly frozenin liquid nitrogen at −196 ◦C. Freeze-fixed specimens were dried
by sublimation of the frozen water in a vacuum at −90 to −85 ◦C(Christ, Alpha 2-4 LD Plus, Osterode, Germany) and then mountedon aluminum stubs and coated with gold in a sputter-coater (typeSCD005, Baltec Inc., Balzers, Switzerland). Photomicrographs at a
1 f Biolo
mX
2
wu(pwr
3
3
3
Giobtoftshp9iaot
pF
tapGi
dfpABpn(t
tmot1
iaa
70 M. Nejatian et al. / International Journal o
agnification of 250, 500, and 1000× were taken using a PhilipsL30 (Eindhoven, The Netherlands) operated at 17 kV.
.7. Statistical analyses
The preparations of all dispersions and subsequent analysesere performed in duplicate. Analysis of variance (ANOVA) wassed for data analyses (SPSS, 16). When F-values were significantP < 0.05) in ANOVA, Duncan’s multiple range test was used to com-are treatment means. Spearman’s correlation-coefficient analysesere used to evaluate the potential relationships between different
heological parameters.
. Results and discussion
.1. Rheological properties
.1.1. Time sweepsThe gelation process of milk proteins in the absence of added
T was studied by a time sweep test (Fig. 1). An initial ‘lag period’n the development of G′ and G′′ was observed in the early stagesf the acidification process. This may be related to the attractionetween the particles, which is not effective enough to overcomehe repulsive interactions between k-casein chains, so formationf a three-dimensional network is inhibited [16]. When the pHell to a critical value of 5.13, the milk protein dispersion begano exhibit gel-like characteristics (G′ or G′′ > 1 Pa). The removal ofteric stabilization with the charge neutralization at this pH mayave contributed to the onset of acid gelation. By decreasing theH to 4.6, G′ undergoes a gradual increase up to a final value of8.13 Pa. According to a study by Matia-Merino et al. [17], the
ncrease in the G′ value at a pH of 4.6 can be attributed to netttractive forces (hydrophobic, electrostatic and van der Waals)vercoming the repulsive electrostatic forces when approachinghe isoelectric point of milk proteins.
The effects of the addition of GT on the gelation process of milkroteins, as investigated with time sweep tests, are displayed inig. 1.
Although the added gum did not change the acidification pat-ern, the gelation process and the final gel structure were greatlyffected by the type and concentration of GT. The key gelationarameters are presented in Table 1. The addition of three types ofT up to 0.2% (w/w) to acidified milk protein dispersions resulted
n no change in the gelation time and pH (Table 1).However, at 0.3%, the gelation time for the gel containing A.g
ecreased significantly. Correspondingly, the gelation pH assessedor this gel was slightly higher than the other gels. The gelationH depends on the effective attraction between protein molecules..g molecules appear to be adsorbed on the surface of proteins.y saturating the protein surfaces with this polysaccharide, excessolysaccharides in the system (free polysaccharides) acted ason-adsorbing polysaccharides and induced depletion flocculationinteraction), which increased protein–protein interactions and ledo early gelation.
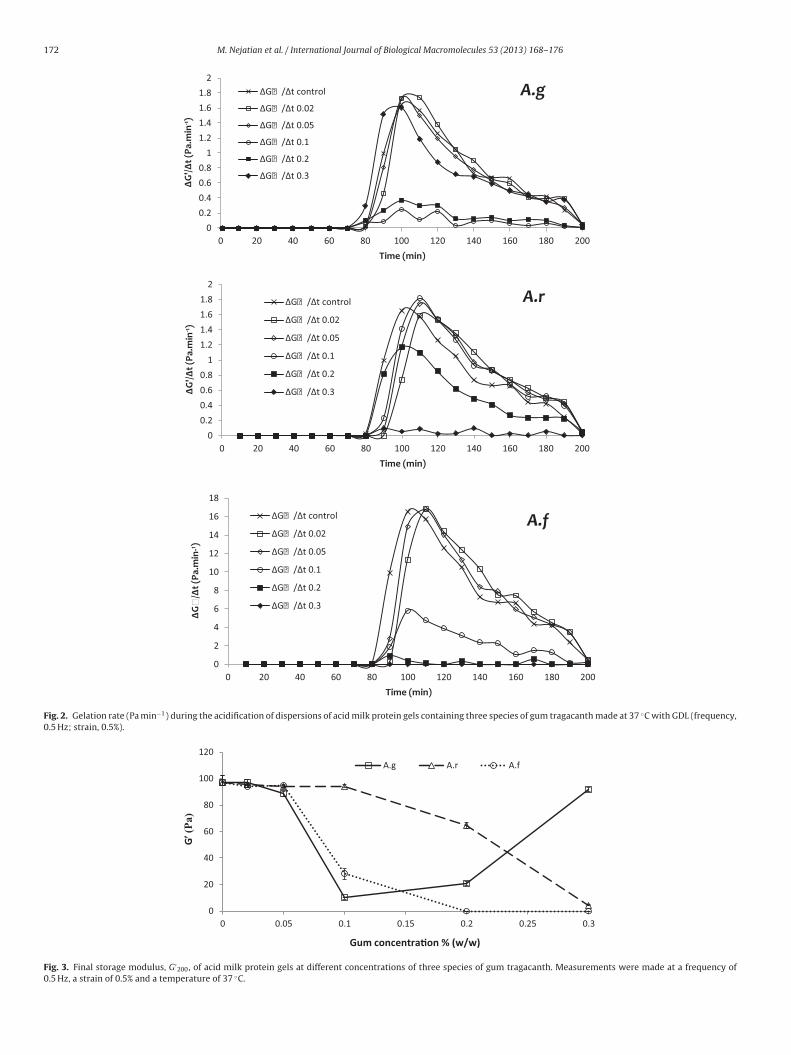
The type and concentration of GT significantly affected the gela-ion rate (Gr) (Fig. 2). The shape of the gelation rate curve for most
ixed gels was determined by an initial rapid increase in the ratef modulus development (up to 1.8 Pa min−1), which peaked athe time of gelation and subsequently decreased to approximately
Pa min−1 after 200 min (Fig. 2).
The graph clearly illustrates that the increasing rate of G′ wasnitially slower in the presence of 0.1 and 0.2% (w/w) of A.g, 0.2nd 0.3% (w/w) of A.r and 0.1, 0.2 and 0.3% (w/w) of A.f. There was
significant (P < 0.05) positive Spearman’s correlation among G′200
gical Macromolecules 53 (2013) 168– 176
and Gr, which indicates that the mixed gels with faster gelationrates had greater final G′ values.
The reduction in the gel strength observed in the current studyis similar to others observing the addition of low-methoxyl ami-dated pectin to acid-induced sodium caseinate gels [17] and sodiumcaseinate acid gels containing added gelatin [18]. These studiesreported that the presence of pectin or gelatin and caseinate aggre-gates together during acidification caused some interference to theformation of casein gel network connections, which was eventuallyreflected in a reduced G′
200 modulus.GT is an anionic polysaccharide, as it has weakly dissociat-
ing surface acidic groups (carboxylic groups) and thus belongsto the adsorbing polysaccharide category [19]. During acidifica-tion of the GT–milk protein mixed dispersion and the reductionof the pH to 4.6, both caseinate and GT carry negative charges,but as it has already been demonstrated, the electrostatic inter-actions between anionic carboxyl-containing polysaccharides andpositively charged subunits of proteins can still occur. As a result,a negatively charged polysaccharide can adsorb to the casein par-ticles [20]. At pH values below 5.1 (the IEP of whey proteins), GTand whey protein carry opposite net charges, resulting in maximumelectrostatic attraction. In addition, the contribution of a hydropho-bic interaction in the attraction between these three biopolymersshould be noted. Yokoyama et al. [19] reported that the strong inter-action of GT attached to the different particles presumably inducesthe conformational change, thereby producing tails and loops. For-mation of such loops on casein micelles was previously reportedfor pectin by Tromp et al. [21]. This study inferred that the adsorp-tion of the pectin chain on the micelle surface takes place only atthe charged block, whereas the uncharged portions between thecharged blocks form entropy-rich loops that extend into the solu-tion. These loops cause a repulsive interaction between the proteinparticles at low pH. Syrbe et al. [13] reported that at high surfacecoverage, adsorbing polysaccharides have a stabilizing effect onmilk protein dispersions. Thus, the steric stability of the milk pro-tein particles against aggregation due to the presence of GT mayresult in a reduction of the storage modulus of the mixed gels.
Adding A.g, A.r and A.f up to 0.02%, 0.1% and 0.05% (w/w) in theacidified milk protein dispersion, respectively, did not change thestorage modulus at the end of the gelation process (G′
200). However,the addition of greater amounts of A.g, A.r and A.f changed the valueof the G′
200 (structural strength). For example, the addition of 0.1%A.g to the system decreased drastically the G′
200. However, additionof 0.3% A.g to the system increased considerably the value of theG′
200 (Fig. 3).Complete inhibition of acid-induced gelation was observed in
the presence of a 0.2% (w/w) or greater content of A.f (Fig. 2).The high final G′
200 value of milk protein gels containing 0.3%(w/w) A.g may be explained by the contribution of depletion floc-culation. Adding 0.3% (w/w) A.g to the milk protein dispersionappears to completely cover the surface of the colloidal particles,and the excess polysaccharides act as free, non-adsorbing polysac-charides. In this condition, the osmotic pressure generated by freepolysaccharides in the bulk will be greater than the osmotic pres-sure of the solvent between protein particles. Consequently, thewater is transferred diffusely from the gap between the proteinparticles to the dispersion system, and particles come closer andultimately aggregate. A recent study on the stabilization of acidi-fied dairy drinks reported that the insoluble fraction of GT behaveslike non-adsorbing polysaccharides, and increasing the viscosity ofthe continuous phase contributes to the stabilization of the sys-tem [22]. Among different types of GT, the gum exuded from A.g
has been reported to have the greatest proportion of the insolu-ble fraction [15]. The presence of a greater amount of insolublefraction in the mixed dispersion appears to increase viscosity andeventually enhance the osmotic pressure of the bulk phase. Due
M. Nejatian et al. / International Journal of Biological Macromolecules 53 (2013) 168– 176 171
4
4.5
5
5.5
6
6.5
7
0
20
40
60
80
100
120
0 20 40 60 80 100 120 140 160 180 200
pH
G'
(Pa)
Time (min)
A.gcontrol 0.02% 0.05% 0.10% 0.20% 0.30% pH
4
4.5
5
5.5
6
6.5
7
0
20
40
60
80
100
120
0 20 40 60 80 10 0 12 0 14 0 16 0 18 0 20 0p
H
G'(
Pa
)
Time (min)
A.fcontrol 0.02% 0.05% 0.10% 0.20% 0.30% pH
4
4.5
5
5.5
6
6.5
7
0
20
40
60
80
100
120
0 20 40 60 80 100 120 140 160 180 200
pH
G'
(Pa)
Time (min)
A.rcontrol 0.02% 0.05% 0.10% 0.20% 0.30% pH
Fig. 1. Storage modulus, G′ , as a function of time for acid milk protein gels containing three species of gum tragacanth made at 37 ◦C with GDL (frequency, 0.5 Hz; strain,0.5%). The pH curve is included.
Table 1Gelation parameters of acid milk proteins gels including different concentrations of three species of gum tragacanth as determined by time sweep measurements (frequency,0.5 Hz; strain, 0.5%; 37 ◦C)X.
Gelation parameters Gum concentration% (w/w)
0 0.02 0.05 0.1 0.2 0.3
pHgel
A. gossypinus 5.13 ± 0.02aA 5.14 ± 0.01aA 5.15 ± 0.01aA 5.14 ± 0.01aA 5.14 ± 0.01aA 5.27 ± 0.01b
A. rahensis 5.13 ± 0.02aA 5.14 ± 0.03aA 5.14 ± 0.01aA 5.15 ± 0.01aA 5.14 ± 0.01aA –A. fluccosus 5.13 ± 0.02aA 5.13 ± 0.01aA 5.14 ± 0.02aA 5.15 ± 0.03aA – –
tgel (min)A. gossypinus 91 ± 1bA 90 ± 2bA 90 ± 2bA 90 ± 1bA 92 ± 1bA 79 ± 1a
A. rahensis 91 ± 1aA 89 ± 3aA 91 ± 1aA 89 ± 3aA 91 ± 1aA –A. fluccosus 91 ± 1aA 91 ± 1aA 90 ± 2aA 88 ± 3aA – –
Tan ı200
A. gossypinus 0.34 ± 0.00 bcA 0.34 ± 0.00 bcA 0.33 ± 0.00 bA 0.29 ± 0.01 aA 0.34 ± 0.01 bcA 0.35 ± 0.00 cA
A. rahensis 0.34 ± 0.00 dA 0.34 ± 0.00 dA 0.34 ± 0.00 dB 0.32 ± 0.01cB 0.30 ± 0.01 bB 0.22 ± 0.01 aB
A. fluccosus 0.34 ± 0.00 bA 0.34 ± 0.00 bA 0.33 ± 0.00 bA 0.31 ± 0.02 aAB – –
XValues are means of triplicate samples ± standard deviations.a–dMeans within same row with different superscript letters are significantly different (P < 0.05).A–BMeans within same column with different superscript letters are significantly different (P < 0.05).
172 M. Nejatian et al. / International Journal of Biological Macromolecules 53 (2013) 168– 176
0 0.2 0.4 0.6 0.8
1 1.2 1.4 1.6 1.8
2
0 20 40 60 80 100 120 140 160 180 200
∆G
'/∆t (
Pa.m
in-1 )
Time (min)
A.g ∆G
∆G
∆G
∆G
∆G
∆G
0 0.2 0.4 0.6 0.8
1 1.2 1.4 1.6 1.8
2
0 20 40 60 80 100 120 140 160 180 200
∆G
'/∆t (
Pa.m
in-1 )
Time (min)
A.r ∆G
∆G
∆G
∆G
∆G
∆G
0
2
4
6
8
10
12
14
16
18
0 20 40 60 80 100 120 140 160 180 200
∆G
/∆t (
Pa.m
in-1 )
Time (min)
A.f ∆G
∆G
∆G
∆G
∆G
∆G
Fig. 2. Gelation rate (Pa min−1) during the acidification of dispersions of acid milk protein gels containing three species of gum tragacanth made at 37 ◦C with GDL (frequency,0.5 Hz; strain, 0.5%).
0
20
40
60
80
100
120
0 0.05 0.1 0.15 0.2 0.25 0.3
G′ (
Pa
)
Gum concentra�on % (w/w)
A.g A.r A.f
Fig. 3. Final storage modulus, G′200, of acid milk protein gels at different concentrations of three species of gum tragacanth. Measurements were made at a frequency of
0.5 Hz, a strain of 0.5% and a temperature of 37 ◦C.

M. Nejatian et al. / International Journal of Biological Macromolecules 53 (2013) 168– 176 173
Table 2Limiting value of strain �L, yield stress at the limit of the LVE range �y, flow-point stress (�f), and flow-point stress with corresponding modulus Gf: G′ = G′′ for acid milkproteins gels including different concentrations of three species of gum tragacanth as determined by strain sweep tests at 37 ◦C and a frequency of 1 Hz. �y, �f , and Gf unitsare Pascal.
Gum species Gum concentration% (w/w)
0 0.02 0.05 0.1 0.2 0.3
LVE (%)A. gossypinus 212.33 ± 14.98eA 151.00 ± 11.00dA 53.43 ± 8.17bA 25.67 ± 4.76aA 25.53 ± 5.36aA 121.00 ± 9.00cB
A. rahensis 212.33 ± 14.98eA 151.67 ± 12.05 dA 126.67 ± 8.74cB 82.33 ± 3.91bB 37.27 ± 2.89aB 33.57 ± 4.30aA
A. fluccosus 212.33 ± 14.98dA 151.78 ± 13.73cA 56.63 ± 7.62bA 32.90 ± 2.26aA – –�y (Pa)
A. gossypinus 218 ± 9eA 151 ± 10dA 53.5 ± 9.6bA 2.77 ± 0.35aA 3.71 ± 0.46aA 120 ± 9cA
A. rahensis 218 ± 9fA 161 ± 9eA 135 ± 10dB 72.8 ± 4.3cB 24.0 ± 2.6bA 2.06 ± 1.24aB
A. fluccosus 218 ± 9dA 140 ± 26cA 58.0 ± 9.2bA 9.05 ± 1.41aC – –�f (Pa)
A. gossypinus 127 ± 4cA 134.13 ± 1.65dA 97.47 ± 3.52bA 12.79 ± 0.77aA – –A. rahensis 127 ± 4dA 138.59 ± 10.49dA 129.72 ± 10.17dB 109.56 ± 8.29cC 65.63 ± 3.50b 5.11 ± 1.49a
A. fluccosus 127 ± 4cA 140.10 ± 4.07dA 107.87 ± 3.19bA 35.58 ± 4.20aB – –Gf (Pa)
A. gossypinus 12.29 ± 0.34dA 12.90 ± 0.32cA 9.82 ± 0.47bA 1.24 ± 0.12aA – –A. rahensis 12.29 ± 0.34dA 13.24 ± 0.88dA 12.64 ± 0.86dcB 11.76 ± 1.04cB 7.46 ± 0.65b 0.71 ± 0.48a
A. fluccosus 12.29 ± 0.34cA 12.73 ± 0.44cA 11.34 ± 0.26bC 3.37 ± 0.24aC – –
XValues are means of triplicate samples ± standard deviations.a–d ent (P
A fferen
tefofr[celfihct�dttdmIfibFvcoodawdufivtttsgr
Means within same row with different superscript letters are significantly differ–CMeans within same column with different superscript letters are significantly di
o a greater amount of uronic acid and net negative charge, anxtended conformation and larger hydrodynamic size are expectedor polysaccharides of this type of GT [23]. Therefore, the occupationf a large hydrodynamic volume could be considered responsibleor its greater susceptibility to induced depletion flocculation. Thisesult is in agreement with those of Girard and Schaffer-Lequart24], who studied the role of the negative charge of exopolysac-harides on milk gelation. They reported that milk gels containingxopolysaccharides with a high net negative charge, high molecu-ar weight and sulfate groups were the most efficient at increasingrmness and brittleness of milk gels. This may be due to strongydrophobic casein–casein interactions induced by depletion floc-ulation. In another study, Everett and McLeod [25] explained thathe greater dynamic modulus of stirred yogurt containing ≥3 g L−1
-carrageenan compared to low methoxyl pectin was due to theepletion flocculation of unadsorbed �-carrageenan. The concen-ration dependency of the mixed gel strength of A.g was similaro �-carrageenan, and comparison of their results with currentata indicates similar trends; the concentration dependency of theixed gel strength of A.r and A.f were similar to that of pectin [25].
ncreasing the concentration of A.g over 0.2% (w/w) in the acidi-ed milk protein dispersion appears to enhance the gel strengthut diminish the gel elasticity (increasing both G′
200 and tan ı200).or all samples, the tan ı200 of the set gels were < 1, indicating aiscoelastic solid behavior (Table 1). The tan ı200 of gels did nothange up to 0.05% (w/w) of GT, though an increase in its value wasbserved in the presence of a greater amount of all three typesf GT up to 0.1% (w/w). For samples containing A.r, tan ı200wasecreased up to 0.3% (w/w) polysaccharide. With the addition ofll three types of GT up to 0.05% (w/w), tan ı200 did not change, butith increasing gum concentrations of GT up to 0.1% (w/w), tan ı200eclined. For samples containing A.r, the decrease in tan ı contin-ed to 0.3% (w/w) polysaccharide. For these samples, the decreasedrmness in the presence of gum was correlated with reduced tan ıalues, indicating the greater decrease in viscous components ofhe gels in comparison to the elastic components. Fig. 3 illustrateshat among A.g, A.r and A.f, the addition of greater concentra-
ions of A.r (up to 0.2%) to milk protein dispersions induced themallest changes to the G′200 (structural strength) of the mixedels. The lack of hydrophobic monosaccharide (such as fucose) andeduced uronic acid contents, and the consequently more compact
< 0.05).t (P < 0.05).
structure of A.r [23], may have resulted in less interference with theaggregation of casein particles.
3.1.2. Strain sweepStrain sweep tests were conducted on mixed gel samples to
determine the limits of the linear viscoelastic domains and to char-acterize the viscoelastic properties of the final gel. For all gels, it waspossible to discriminate two different regions: a linear viscoelasticregion in which G′ and G′′ are practically constant and deformationin the gel structure is reversible (small deformation); and a non-linear region, in which G′ and G′′ began to decrease with increasingstrain (large deformations). The structural character of the samplein the LVE range is expressed by comparing the values of G′ and G′′;if G′ > G′′, there is a gel character (solid character), if G′′ > G′, how-ever, then a liquid character is present. For the control gel and gelscontaining GT, G′ dominated G′′, and all samples exhibited tan ı val-ues of less than 1. Parameters obtained from the strain sweep testsare presented in Table 2.
In general, all parameter values were decreased by adding gumup to 0.2% (w/w). Reduction in �L and a shorter LVE range for themilk protein gels indicates the contribution of GT to reducing thestability of the viscoelastic mixed gel under the �-amplitude. Stronggels are reported to stay within the linear viscoelastic region upto much greater strain values than weak gels [26]. In addition, thereduced �f value of milk protein gels in the presence of various typesof gums compared to the control sample indicates that these sam-ples require greater mechanical forces to have a visible flow. Withthe exception of gels containing GT at 0.02% concentration (w/w),increased G′ (a measure of structural strength or shape retentionability) is accompanied by increased �f (a measure of resistance tomechanical force) (Table 2).
3.1.3. Frequency sweepDynamic frequency sweep tests were performed to provide a
better understanding of the effect of the addition of GT on thetype of network or structure of the mixed system. For the three-dimensional network of forces, variation in density and strength of
binding (sparsely bonded or highly bonded systems) will result indifferently shaped frequency sweep curves. The frequency depend-ence of G′ for acid milk protein gels in the absence and presence of0.1% (w/w) of three species of GT is illustrated in Fig. 4.
174 M. Nejatian et al. / International Journal of Biological Macromolecules 53 (2013) 168– 176
1
10
100
1000
0.01 0.1 1 10
G', G
" (P
a)
Frequ ency (Hz)
G' control G' A .g G' A .r G' A .f
G" contr ol G" A .g G" A .r G" A .f
the ab
sd(sonoovrofifb(w
twaitpn
TPs
X
a
A
Fig. 4. Frequency sweeps of moduli G′ and G′′ for milk protein gels in
To determine the degree of the frequency dependence of thetorage modulus, the power-law model was fitted on obtainedata from frequency sweep tests [27]. The power-law parametersG′ = a·ωb) are presented in Table 3. Here, the coefficient (a) repre-ents the magnitude of G′ at a frequency of 1 Hz, and it is a measuref the strength of interaction between rheological units. The expo-ent (b), which is the slope of G′ versus ω plot, indicates the extentf interaction or the number of rheological units correlated withne another in the three-dimensional structure. Therefore, the a-alue and b-value are related to the strength and nature of the gel,espectively. b ≈ 1 for a viscous gel, low b-values are characteristicf elastic gels, and b = 0 for covalent gels [27,28]. No significant dif-erence in calculated b-values was found between the gel samplesn the presence and absence of added concentrations of GT, exceptor the mixed gel containing 0.3% (w/w) A.r, which had the lowest-value and eventually the least sensitivity to frequency variationTable 3). According to the b-values of the samples, all mixed gelsere elastic, or physical, gels.
For mixed gels, the addition of 0.1% A.g decreased drasticallyhe a-value of the system, which indicated that 0.1% A.g caused aeaker elastic structure than the control gel. However, the a-values
pproached that of the control gel when the A.g concentration was
ncreased to 0.3%. For mixed gels containing A.r and A.f at concen-rations greater than or equal to 0.1%, the a-value was decreased,articularly in the presence of 0.3% A.r. The b-values remainedearly constant, except for the mixed gel containing 0.3% A.r.able 3ower-law parameters for the elastic modulus for acid milk proteins gels including differweep tests at 37 ◦C and a strain of 1%X.
Gum species Gum concentration% (w/w)
0 0.02 0.05
a (Pa s)A. gossypinus 73.97 ± 3.08cbA 77.12 ± 2.75cA 71.39 ±A. rahensis 73.97 ± 3.08dA 75.74 ± 2.49dA 78.46 ±A. fluccosus 73.97 ± 3.08bA 73.15 ± 7.51bA 75.14 ±
bA. gossypinus 0.211 ± 0.006aA 0.209 ± 0.001aA 0.207 ±A. rahensis 0.211 ± 0.006cA 0.208 ± 0.004cA 0.198 ±A. fluccosus 0.211 ± 0.006aA 0.199 ± 0.006aA 0.202 ±
Values are means of triplicate samples ± standard deviations.–dMeans within same row with different superscript letters are significantly different (P–CMeans within same column with different superscript letters are significantly differen
sence and the presence of 0.1% A.g, A.r, A.f at 37 ◦C and a strain of 1%.
3.2. Microstructural properties
The microstructures of different milk protein gels are displayedin Fig. 5. The addition of GT to milk protein dispersions in differentconcentrations notably changed the microstructure of mixed gels(Fig. 5).
The addition of 0.05% (w/w) A.g and A.f and 0.02% (w/w) A.r to gelformulations caused a more compact microstructure with smallerpore size than observed in the control gel (Fig. 5A, B, C, F, J andK). Similarly, it has been reported that the addition of locust beangum and/or xanthan gum to skim milk led to compacting of thecasein network [29]. This compact structure of mixed gels in thepresence of low concentrations of gum can be attributed to thebridging of casein aggregates by gum. Maroziene and de Kruif [30],also reported that bridging flocculation was taking place at a pectinconcentration that was not enough for full coverage of the micelles.
However, with an increase of A.g concentration (0.1%, w/w) inthe gel formulation, a microstructure with less density and con-siderably larger spaces was observed (Fig. 5D). In the presence of0.3% (w/w) A.r and ≥0.2 A.f, gelation was inhibited and their micro-graphs were not taken. However, at 0.3% (w/w) A.g, the visualizedmicrostructure differed greatly from those of the other gels. The
addition of 0.3% (w/w) A.g modified the typical network to a morecompact and regular structure with small spheres surrounded byan entangled network (Fig. 5E). Increasing the A.f concentrationto greater than 0.05% (w/w) and A.r to greater than 0.02% (w/w)ent concentrations of three species of gum tragacanth as determined by frequency
0.1 0.2 0.3
3.15bA 8.30 ± 2.86aA 13.31 ± 2.92aA 73.38 ± 2.48cbA
3.51dA 65.97 ± 6.20cC 52.26 ± 4.33bB 4.92 ± 2.23aB
4.91bA 20.91 ± 5.89aB – -
0.002aA 0.196 ± 0.009aA 0.199 ± 0.009aA 0.204 ± 0.008aA
0.007cbA 0.197 ± 0.009bA 0.197 ± 0.009bA 0.141 ± 0.006aB
0.008aA 0.199 ± 0.010aA – -
< 0.05).t (P < 0.05).

M. Nejatian et al. / International Journal of Biological Macromolecules 53 (2013) 168– 176 175
F 02% (B0 50 �m
iaSpitrortlBrtst
4
wet
ig. 5. SEM micrographs of milk protein gels in the absence (A) and the presence 0..2% (I) of A. rahensis and 0.02% (J), 0.05% (K) and 0.1% (L) of A. fluccosus. The scale is
n milk protein dispersions largely decreased the network density,nd an open structure (larger voids) formed, as illustrated by theEM micrographs (Fig. 5G, H, I and L). As noted previously, the inter-enetration of polysaccharide chains at high concentrations result
n a mixture of trains, loops and tails. Presumably, the presence ofhese trains, loops and tails on the protein surfaces causes a stericepulsion between protein aggregates and lead to the formationf a more open structure. Recently, the effects of adding GT to aeal system was investigated, and it was discovered that the addi-ion of GT as a fat replacer in nonfat yogurt at low concentrationsed to a more compact structure compared to the control yogurt.y increasing the amount of gum, the density of the matrix waseduced [31]. This indicates that the results for the effects of GT onhe microstructure of the model system of milk proteins during alow acidification process is in agreement with those obtained inhe real system.
. Conclusion
A model system (sodium caseinate-whey protein concentrate)as used to study the effect of various concentrations of GT
xudates from three species of Iranian Astragalus on the gela-ion process and final gel properties of milk proteins during a
), 0.05% (C), 0.1% (D) and 0.3% (E) of A. gossypinus, 0.02% (F), 0.05% (G), 0.1% (H) and.
slow acidification process. The addition of A.g, A.f and A.r in therange of 0.05–0.2% (w/w) into milk protein dispersions interferedwith the formation of a continuous casein network, likely due tosteric stabilization between protein aggregates, thereby reducingthe gel structure rigidity. However, this effect could be elimi-nated by adding a certain level (0.3%, w/w) of A.g. GT exudedfrom A.g, which has greater fucose and uronic acid contents anda greater ratio of insoluble to soluble fractions (presence of morehydrophobic groups), had an increased ability to induce strongerprotein–protein interactions, improved structural strength andshorter gelation time. This was related to the depletion flocculationphenomenon induced by high concentration of the gum.
Acid-set milk protein gels had the least sensitivity to the addi-tion of GT from A.r. SEM micrographs indicated that the addition ofall three species of GT at low concentrations caused the density ofthe matrix to increase, and by increasing the gum concentration,the density of the matrix was reduced.
References
[1] J.I. Boye, M. Kalab, I. Alli, C. Yung Ma, Milchwissenschaft 33 (2000) 165–172.[2] P. Harris, Food Gels, Elsevier Science Publishers Ltd., London, England, 1990.[3] V. Kontogiorgos, C. Ritzoulis, C.G. Biliaderis, S. Kasapis, Food Hydrocolloids 20
(2006) 749–756.

1 f Biolo
[[
[
[
[
[[
[
[
[
[[
[[
[[[
[
[
[29] C. Sanchez, R. Zuniga-Lopez, C. Schmitt, S. Despond, J. Hardy, International DairyJournal 10 (2000) 199–212.
76 M. Nejatian et al. / International Journal o
[4] C.C. Fagan, C.P. O’Donnell, P.J. Cullen, C.S. Brennan, Journal of Food Engineering77 (2006) 261–268.
[5] Y. Hemar, M. Tamehana, P.A. Munro, H. Singh, Food Hydrocolloids 15 (2001)565–574.
[6] D. Renard, F. Boué, J. Lefebvre, in: G.O. Phillips, P.A. Williams (Eds.), Gums andStabilisers for the Food Industry, Royal Society of Chemistry, Cambridge, UK,1998, pp. 189–201.
[7] E. Dickinson, Trends in Food Science and Technology 9 (1998) 347–354.[8] M. Hatami, M. Nejatian, M.A. Mohammadifar, International Journal of Biological
Macromolecules 50 (2012) 1109–1115.[9] M. Hasandokht Firooz, M.A. Mohammadifar, P. Haratian, International Journal
of Biological Macromolecules 50 (2012) 923–931.10] D.J. McClements, Biotechnology Advances 24 (2006) 621–625.11] D. Renard, F. van de Velde, R.W. Visschers, Food Hydrocolloids 20 (2006)
423–431.12] E.E. Ndi, Food Science and Human Nutrition, Washington State University, Pull-
man, Washington, 1994, p. 86.13] A. Syrbe, W.J. Bauer, H. Klostermeyer, International Dairy Journal 8 (1998)
179–193.14] M.A. Mohammadifar, S.M. Musavi, A. Kiumarsi, P.A. Williams, International
Journal of Biological Macromolecules 38 (2006) 31–39.15] S. Balaghi, M. Mohammadifar, A. Zargaraan, Food Biophysics 5 (2010) 59–71.16] B.T. O’Kennedy, J.S. Mounsey, F. Murphy, E. Duggan, P.M. Kelly, International
Dairy Journal 16 (2006) 1132–1141.17] L. Matia-Merino, K. Lau, E. Dickinson, Food Hydrocolloids 18 (2004) 271–281.
[[
gical Macromolecules 53 (2013) 168– 176
18] M.W.W. Koh, L. Matia Merino, E. Dickinson, Food Hydrocolloids 16 (2002)619–623.
19] A. Yokoyama, K.R. Srinivasan, H.S. Fogler, Journal of Colloid and Interface Sci-ence 126 (1988) 141–149.
20] A. Ye, International Journal of Food Science and Technology 43 (2008) 406–415.21] R.H. Tromp, C.G. de Kruif, M. van Eijk, C. Rolin, Food Hydrocolloids 18 (2004)
565–572.22] F.F. Azarikia, S. Abbasi, Food Hydrocolloids 24 (2010) 358–363.23] S. Balaghi, M.A. Mohammadifar, A. Zargaraan, H.A. Gavlighi, M. Mohammadi,
Food Hydrocolloids 25 (2011) 1775–1784.24] M. Girard, C. Schaffer-Lequart, Food Hydrocolloids 21 (2007) 1031–1040.25] D.W. Everett, R.E. McLeod, International Dental Journal 15 (2005) 1175–1183.26] S. Ikeda, E.A. Foegeding, Current Protocols in Food Analytical Chemistry, John
Wiley & Sons, Inc., 2003.27] T. Yoneya, K. Ishibashi, K. Hironaka, K. Yamamoto, Carbohydrate Polymers 53
(2003) 447–457.28] D. Khondkar, R.F. Tester, N. Hudson, J. Karkalas, J. Morrow, Food Hydrocolloids
21 (2007) 1296–1301.
30] A. Maroziene, C.G. de Kruif, Food Hydrocolloids 14 (2000) 391–394.31] S. Aziznia, A. Khosrowshahi, A. Madadlou, J. Rahimi, Journal of Dairy Science 91
(2008) 2545–2552.
Copyright © 2022 FDOKUMEN