Development of Polymer-based Gels for Multimodal Medical ...
139
Development of Polymer-based Gels for Multimodal Medical Imaging Phantoms by Eunji In A thesis submitted in conformity with requirements for the degree of Doctor of Philosophy Department of Mechanical and Industrial Engineering University of Toronto © Copyright by Eunji In 2016
-
Upload
khangminh22 -
Category
Documents
-
view
3 -
download
0
Transcript of Development of Polymer-based Gels for Multimodal Medical ...

Development of Polymer-based Gels for Multimodal Medical Imaging Phantoms
by
Eunji In
A thesis submitted in conformity with requirements for the degree of Doctor of
Philosophy Department of Mechanical and Industrial Engineering
University of Toronto
© Copyright by Eunji In 2016

ii
Development of Polymer-based Gels for Multimodal Medical Imaging Phantom
By Eunji In
Doctor of Philosophy
Department of Mechanical and Industrial Engineering
University of Toronto
2016
Abstract
In the field of medical imaging, there have been numerous efforts to combine multiple
imaging modalities such as ultrasound (US), Magnetic Resonance Imaging (MRI), x-rays and
Computed Tomography (CT), positron emission tomography (PET), ultrasound (US), and
single photon emission CT. Multimodal imaging allows the fusion and analysis of various
image data to provide morphological and functional information. With the progress in
medical imaging technology and increased importance of quality assurance, the research in
medical imaging phantom is necessary. Phantom is an anthropomorphic object that mimics
the properties of human tissue for calibration, training and surgical planning purposes. This
research thesis examines four different types of polymer-based materials for constructing
medical phantoms: carrageenan-based polymer gel, polymer cross-linked aerogels, UV-
curable silicone and self-healing polymer materials.
In the first study, water-based carrageenan gel found to have a good correlation with the
imaging properties of human tissue, but its long-term stability issue restricts its applicability
as commercial phantoms. Since samples contained high water content, mechanical and
iii
imaging properties of carrageenan-based gel fluctuated due to water expulsion and absorption
cycles over six-week period.
In the second study, silica and cellulose aerogel cross-linked with polymer was also
investigated as a phantom material. Contrast agents are cross-linked to fabricate an MRI/CT-
compatible material. Results demonstrate that the imaging properties of these aerogels met
the values of some human tissue values but due to volume shrinkage and complex fabrication
process restricts its production in large scale.
Furthermore, in the third study UV-curable silicone material was considered as a 3D
printable phantom material. The addition of hydrophilic silicone and water is shown to
improve the curing time and imaging properties of silicone. With suitable properties of UV-
curable silicone, it will assist to produce real-size liver phantom using 3D printing technique
for a patient-specific phantoms.
There is an increased demand for phantom application in clinician training and surgical
planning with needle-insertion or dissection is necessary. In the final chapter, self-healing
silicone with microcapsule healing mechanism was investigated as proof-of-concept for
surgical planning tool. Throughout four different studies, different polymer-based materials
are examined subsequently with novelty in each study.

iv
Acknowledgment
I would like to thank Professor Hani Naguib for his patience, support and guidance
throughout Ph.D research. During Ph.D years, there were many times that I wanted to give
up, was in doubt of myself and required motivation and encouragements on different level
from MASc research. Without Professor Naguib’s support in many ways, I wouldn’t have
been able to complete my studies. I was very fortunate to have him as my supervisor for 10
years.
I would also like to thank all of my fellow lab mates and colleagues in SAPL; Reza Rizvi,
Shahrza Ghaffari, Harvey Shi, Gary Sun, Nazanin Khalili, Carlton Hoy, Sherif Ramadan,
Farooq Al Jahwari, Muhammad Anwer, Sharon Li, and Kyle Eastwood for aiding me through
their technical and spiritual support. With countless memories with them, I was able to
overcome the times when I am discouraged, stressed or confused. I would like to
acknowledge my undergraduate and M.Eng students Rohit Rathi, Marina Noguchi, William
Sun, Xiaoji Zhang, Hwi Jang and Elisabeth Walker for their dedication, creativity and
enthusiasm.
I would like to acknowledge Aaron Boyes at Sunnybrook Hospital, Dr. Karim Danaei and Dr.
Bahman Lashkari for their assistance and knowledge on MRI, XRD and US experiments.
I would like to dedicate this thesis to my family and friends, Deokyoung, Jeeyoung, Eric,
Yongsuk, Juhee, and Norman for their encouragement, belief and endless love. Without their
support and prayers, I would not be where I am now.
I learned a lot during my years at University of Toronto and ready to take next step to a new
chapter of my life.

v
Table of Contents Abstract .................................................................................................................................... ii
Acknowledgment ..................................................................................................................... iv
Table of Contents ..................................................................................................................... v
List of Tables ............................................................................................................................ x
List of Figures .......................................................................................................................... xi
List of Abbreviations ............................................................................................................. xv
1 Introduction ........................................................................................................................ 11.1 Preamble ................................................................................................................................... 11.2 Medical Imaging Phantom ..................................................................................................... 11.3 Problem Statement and Objectives ........................................................................................ 3
1.3.1 Problem Statement ............................................................................................................. 31.3.2 Objectives .......................................................................................................................... 3
1.4 Thesis Organization ................................................................................................................ 4
2 Background and Literature Review ................................................................................. 6
2.1 Ultrasound ................................................................................................................................ 72.1.1 Ultrasound imaging technique ........................................................................................... 72.1.2 US Imaging Techniques ..................................................................................................... 9
2.1.2.1 Contrast-specific Techniques ..................................................................................................... 92.1.3 Ultrasound Phantoms ....................................................................................................... 11
2.1.3.1 Ultrasound Phantom Applications ........................................................................................... 122.1.4 Phantom Materials ........................................................................................................... 12
2.1.4.1 Agar ......................................................................................................................................... 122.1.4.2 Polyvinyl Alcohol Cryogel (PVA) .......................................................................................... 132.1.4.3 Polyacrylamide Hydrogel ........................................................................................................ 14
2.2 Computed Tomography ........................................................................................................ 142.2.1 Image construction ........................................................................................................... 152.2.2 Computed Tomography Scanning Procedure .................................................................. 152.2.3 Computed Tomography Sequences ................................................................................. 172.2.4 Image Quality ................................................................................................................... 182.2.5 Computed Tomography Phantoms .................................................................................. 182.2.6 Phantom Materials ........................................................................................................... 19
2.2.6.1 Polyethylene ............................................................................................................................ 192.2.6.2 Epoxy ....................................................................................................................................... 20

vi
2.2.6.3 Polymethyl methacrylate (PMMA) ......................................................................................... 202.2.6.4 Various Polymer Materials ...................................................................................................... 21
2.3 Magnetic Resonance Imaging ............................................................................................... 212.3.1 Signal Generation ............................................................................................................. 222.3.2 Signal Detection: Relaxation ........................................................................................... 23
2.3.2.1 Longitudinal Relaxation .......................................................................................................... 232.3.2.2 Transverse Relaxation ............................................................................................................. 24
2.3.3 Image Reconstruction ...................................................................................................... 242.3.4 Magnetic Resonance Imaging Phantoms ......................................................................... 252.3.5 Phantom Materials ........................................................................................................... 26
2.3.5.1 Carrageenan ............................................................................................................................. 272.3.5.2 TX-150 and TX-151 ................................................................................................................ 272.3.5.3 Polyvinyl Alcohol Cryogel ...................................................................................................... 28
2.4 Multimodal imaging .............................................................................................................. 282.4.1 Positron emission tomography (PET)/Computed Tomography (CT) .............................. 30
2.4.1.1 Potential and Limitations of Combined PET/CT ..................................................................... 322.4.1.2 Co-registration Errors .............................................................................................................. 322.4.1.3 Breathing Artifacts ................................................................................................................... 322.4.1.4 Contrast Agents ....................................................................................................................... 32
2.4.2 Positron Emission Tomography (PET)/ Magnetic Resonance Imaging (MRI) ............... 332.4.2.1 Technical Challenges ............................................................................................................... 332.4.2.2 PET/MR Development ............................................................................................................ 342.4.2.3 PET Attenuation Correction based on MRI Data .................................................................... 35
2.4.3 Phantom Materials ........................................................................................................... 352.4.3.1 Agarose .................................................................................................................................... 352.4.3.2 Polyvinyl Chloride ................................................................................................................... 362.4.3.3 Polyvinyl Alcohol Cryogel ...................................................................................................... 362.4.3.4 Silicone .................................................................................................................................... 37
2.5 Radiation Therapy Phantoms .............................................................................................. 372.5.1 Radiation Therapy Planning ............................................................................................ 38
2.5.1.1 External-beam Radiation Therapy ........................................................................................... 382.5.1.2 Internal Radiation Therapy ...................................................................................................... 382.5.1.3 Systemic Radiation Therapy .................................................................................................... 39
2.5.2 Radiation Phantoms ......................................................................................................... 392.6 Summary ................................................................................................................................ 40
3 Mechanical Stability Analysis of Carrageenan-Based Polymer Gel for MRI Liver
Phantom with Lesion Particles ............................................................................................. 41
3.1 Introduction ........................................................................................................................... 41

vii
3.2 Motivation and Objectives .................................................................................................... 413.3 Experimental Setup ............................................................................................................... 43
3.3.1 Experimental Materials .................................................................................................... 433.3.2 Fabrication of Carrageenan-based Polymer Gel .............................................................. 433.3.3 Characterization ............................................................................................................... 44
3.3.3.1 Chemical Properties of carrageenan-based polymer gel ......................................................... 443.3.3.2 Mechanical Properties of carrageenan-based polymer gel ...................................................... 443.3.3.3 Dielectric Properties of carrageenan-based polymer gel ......................................................... 453.3.3.4 Imaging Properties of carrageenan-based polymer gel ........................................................... 463.3.3.5 Polymer Gel Liver Phantom with Lesion Particles ................................................................. 47
3.4 Results and Discussion .......................................................................................................... 483.4.1 Chemical Properties of carrageenan-based polymer gel .................................................. 483.4.2 Mechanical Properties of carrageenan-based polymer gel .............................................. 493.4.3 Dielectric Properties of carrageenan-based polymer gel ................................................. 523.4.4 Imaging Properties of carrageenan-based polymer gel .................................................... 543.4.5 Polymer Gel Liver Phantom with Lesion Particles .......................................................... 57
3.5 Summary ................................................................................................................................ 58
4 Novel Development of Organic and Inorganic Aerogels for Medical Imaging
Phantom Application ............................................................................................................. 604.1 Introduction ........................................................................................................................... 604.2 Motivation and Objectives .................................................................................................... 604.3 Experimental Setup ............................................................................................................... 61
4.3.1 Experimental Materials .................................................................................................... 614.3.2 Fabrication Procedure ...................................................................................................... 62
4.3.2.1 Fabrication of Silica Aerogel ................................................................................................... 624.3.2.2 Fabrication and Cross-linking of Cellulose Aerogel ............................................................... 62
4.3.3 Characterization ............................................................................................................... 634.4 Results and Discussion .......................................................................................................... 64
4.4.1 Structural and Morphological Properties of Aerogels ..................................................... 664.4.2 Chemical Properties of Silica and Cellulose Aerogels .................................................... 684.4.3 Imaging Properties of Silica and Cellulose Aerogels ...................................................... 69
4.5 Summary ................................................................................................................................ 75
5 Novel Development of 3D-Printable UV-Curable Silicone for Multimodal Imaging
Phantom .................................................................................................................................. 765.1 Introduction ........................................................................................................................... 765.2 Motivations and Objectives .................................................................................................. 76

viii
5.3 Experiments ........................................................................................................................... 775.3.1 Experimental Materials .................................................................................................... 775.3.2 Preparation of Silicone Gel Samples ............................................................................... 775.3.3 Characterization ............................................................................................................... 78
5.3.3.1 Experimental Setup: Silicone Curing ...................................................................................... 785.3.3.2 Experimental Setup for Ultrasound ......................................................................................... 795.3.3.3 Experimental Setup for MRI and CT ....................................................................................... 80
5.4 Results and discussions ......................................................................................................... 805.4.1 Polymer Conversion: Curing Time .................................................................................. 815.4.2 Chemical Properties of Silicone Gel ................................................................................ 835.4.3 Hardness of Silicone Gel ................................................................................................. 845.4.4 Ultrasound Properties of Silicone Gel ............................................................................. 855.4.5 MRI Properties of Silicone Gel ........................................................................................ 865.4.6 CT scan of Silicone Gel ................................................................................................... 88
5.5 Summary ................................................................................................................................ 89
6 Self-Healing Silicone for Future Phantom as training and surgical planning tool .... 91
6.1 Introduction ........................................................................................................................... 916.2 Motivation and Objective ..................................................................................................... 916.3 Experimental Setup ............................................................................................................... 93
6.3.1 Experimental material ...................................................................................................... 936.3.2 Fabrication Methods ........................................................................................................ 93
6.3.2.1 Microcapsule Fabrication ........................................................................................................ 936.3.2.2 Self-healing Sample Fabrication .............................................................................................. 94
6.3.3 Characterization of self-healing silicone .......................................................................... 956.3.3.1 Microscope Characterization of self-healing silicone ............................................................. 956.3.3.2 Mechanical Characterization of self-healing silicone .............................................................. 956.3.3.3 Ultrasonic Characterization of self-healing silicone ................................................................ 95
6.4 Results and Discussions ........................................................................................................ 966.4.1 Physical Properties of self-healing silicone ..................................................................... 966.4.2 Structural and Morphological Properties of Self-healing Silicone .................................. 976.4.3 Self-healing properties of silicone ................................................................................... 996.4.4 Ultrasound Measurement of Self-healing silicone ......................................................... 101
6.5 Summary .............................................................................................................................. 101
7 Conclusions and Recommendations ............................................................................. 1037.1 Concluding Remarks ........................................................................................................... 1037.2 Contributions ....................................................................................................................... 1087.3 Recommendations ............................................................................................................... 108

ix
References ............................................................................................................................. 110

x
List of Tables
Table 1.1 Normal Liver Tissue Properties ................................................................................. 4
Table 2.1. Propagation speed of US in various media [2] ......................................................... 8
Table 2.2. Acoustic parameters for various tissues [23, 24] .................................................... 11
Table 2.3. Typical T1 and T2 values for various tissues measured at 1.5T and 3T [68] .......... 26
Table 3.1 Contents of carrageenan, agar, GdCl3, and water in the polymer gel samples ........ 44
Table 3.2. Dielectric properties of human organs [117] .......................................................... 45
Table 3.3 T1 and T2 relaxation times of human tissues at 3T [68, 119-121] ............................ 55
Table 5.1. Human liver tissue values [135, 143, 144] ............................................................. 78
Table 7.1. Summary table of property values of each phantom materials ............................. 107

xi
List of Figures
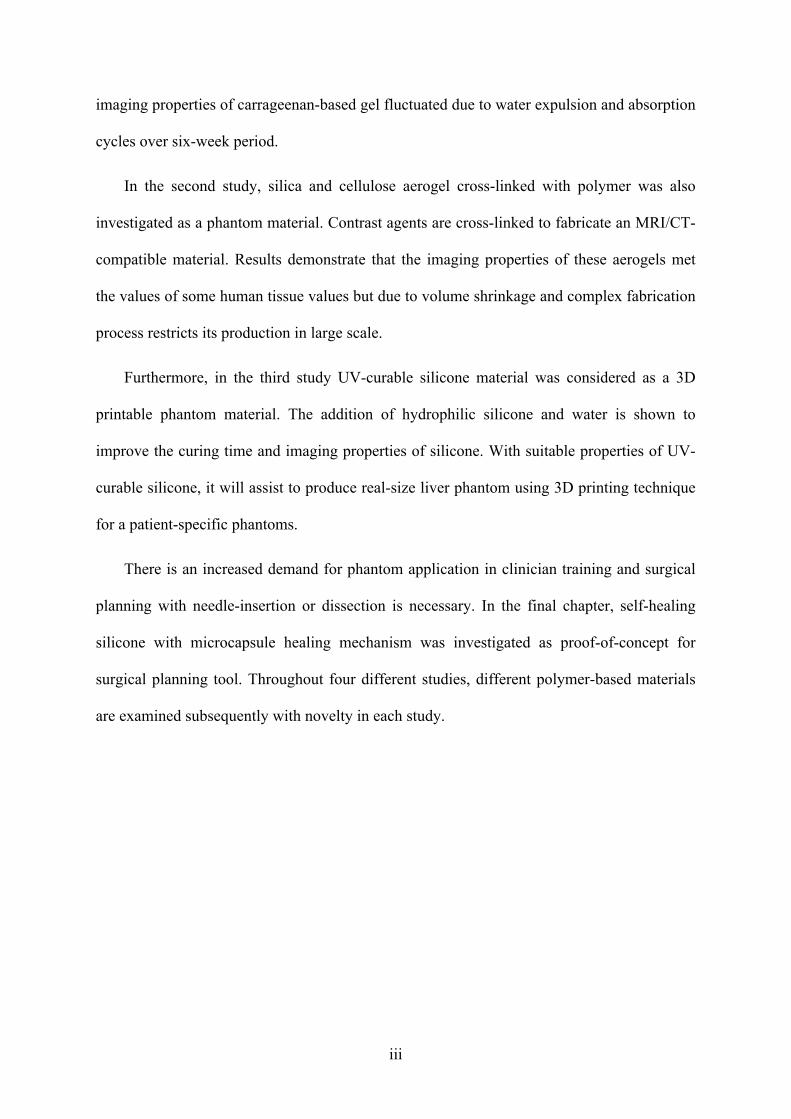
Figure 1.1. Thesis organization chart ......................................................................................... 5
Figure 2.1. Positions of various imaging methods in the electromagnetic spectrum [1] ........... 6
Figure 2.2. Principle of propagation of US ................................................................................ 8
Figure 2.4. Ranges of CT values of the most important organs .............................................. 16
Figure 2.5. MRI of the skull metastasis from hepatocellular carcinoma. (A) T1-weighted MRI
and (B) T2-weighted MRI demonstrating a homogeneous, well-defined, and iso-signal
intensity mass in the occipital midline. (C) Gadolinium-enhanced T1-weighted MRI
showing a strong enhancement of the tumor [65] ............................................................ 25
Figure 2.6. Schematic workflow of the PET/CT examination. (a) A fast scout scan to
determine examination regions for PET and diagnostic CT. (b)The acquisition of either a
low-dose or diagnostic CT scan. (c) PET data acquired at multiple bed positions,
reconstructed and corrected for attenuation. (d) PET and CT images are registered and
displayed as fused images. [78] ....................................................................................... 31
Figure 2.7. Potential realizations of PET/MRI scanners. (a) PET/MRI side by side. Two
individual devices are mounted back-to-back and have a common control unit. (b) PET
inserted within an MRI; the bore size is drastically reduced and the PET detectors have
to be compact. (c) PET detector embedded into an MRI system. Both devices are
merged together into one multimodality scanner. [78] .................................................... 34
Figure 3.1. Schematic diagram of polymer gel lesion and phantom fabrication ..................... 47
Figure 3.2. (a) Spherical lesion particle placement and (b) a fabricated phantom with
embedded lesion particles ................................................................................................ 48
Figure 3.3. FTIR graph of carrageenan-based polymer gel ..................................................... 48
Figure. 3.4 Density changes in the carrageenan-based gel samples ........................................ 49
Figure. 3.5 Changes in elastic modulus of eight polymer gel samples over six weeks: (a)
Samples with various agar concentrations (0.0–1.5 wt%); (b) Samples with various
carrageenan concentrations (1.0–3.0 wt%) ...................................................................... 51
Figure. 3.6 Compressive strength of eight polymer gel samples over six weeks .................... 52

xii
Figure. 3.7 (a) Permittivity and (b) conductivity of sample 4 over six weeks ........................ 53
Figure. 3.8 T1 and T2 maps of polymer gel samples at week 3, generated by a MATLAB
algorithm .......................................................................................................................... 54
Figure. 3.9 T1 and T2 relaxation times of polymer gel samples after five weeks. .................... 55
Figure. 3.10 T1 and T2 relaxation times of sample 2 over six weeks ....................................... 56
Figure 3.11.CT numbers obtained from Aquilion ................................................................... 57
Figure. 3.12 T1 and T2 maps of the phantom layer with lesion particles ................................. 58
Figure. 4.1 Silica aerogels with increasing concentrations of di-isocyanate ........................... 65
Figure. 4.2 Cellulose aerogels with increasing in CoFe2O4 concentrations ............................ 65
Figure. 4.3 SEM images of non-cross-linked and cross-linked silica aerogels (SA, surface
area; wt% indicates cross-linking polymer [di-isocyanate] concentration) ..................... 66
Figure. 4.4 (a)-(c) SEM images of non-cross-linked cellulose aerogel with increasing
cellulose content; (d)-(f) cross-linked cellulose aerogel with higher content of
superparamagnetic nanoparticles ..................................................................................... 67
Figure. 4.5 FTIR spectroscopy of silica aerogels cross-linked with varying concentrations of
di-isocyanate .................................................................................................................... 68
Figure. 4.6 XRD pattern of non cross-linked cellulose Aerogel and cross-linked with
CoFe2O4 ........................................................................................................................... 69
Figure. 4.7 (a) The effect of di-isocyanate cross-linker and (b) Gd concentrations on MRI T1
and T2 relaxation times (ms) ............................................................................................ 71
Figure. 4.8 (a) The effect of di-isocyanate and (b) Gd concentrations on CT number (HU) .. 72
Figure. 4.9 MRI (left) and CT (right) images with Hounsfield units for silica aerogels ......... 72
Figure. 4.10 MRI (a) and CT (b) of cross-linked cellulose aerogel with 0.24 mol/L CoFe2O4
complex with increase in cellulose content ..................................................................... 74
Figure 5.1. Experimental setup of ultrasonic measurement system of the samples ................ 80
Figure 5.2. Fabricated Silicone samples with different concentrations of deionized water and
hydrophilic silicone .......................................................................................................... 81

xiii
Figure 5.3. FTIR of liquid and solid states of silicone samples (liquid with 10 vol% HS and
20 vol% water; solid with 10 vol% and 20 vol% HS and 20 vol% water) ...................... 84
Figure 5.4. Hardness of silicone samples with increase in water content ................................ 85
Figure 5.5. US measurements performed on silicone samples a) SOS (m/s) and b) attenuation
coefficient (dB/cm-MHz) ................................................................................................. 86
Figure 5.6. Effect of water content (vol %) on the T1 relaxation times for 10, 20 and 30 vol%
HS content ........................................................................................................................ 87
Figure 5.7. Effect of water content (vol %) on the T2 relaxation times for 10, 20, and 30 vol%
HS content ........................................................................................................................ 88
Figure 5.8. Effect of HS content (vol%) and T1 and T2 Relaxation times ............................... 88
Figure 5.9. CT Hounsfield Unit values of silicone over 80, 100, 120 and 135 kVp (a) 10 vol%
HS and (b) 20 vol% HS ................................................................................................... 89
Figure 6.1. Vinyl-terminated polydimethylsiloxane (PDMS) resin and platinum catalyst
encapsulated together in poly(urea-formaldehyde) (UF) shell.
Poly(methylhydrosiloxane) copolymer is encapsulated separate in the same shell. Both
capsules are embedded in vinyl-terminated PDMS base matrix. .................................... 94
Figure 6.2. At room temperature or higher, liquid polymethylhydrosiloxane copolymer and
liquid vinyl-terminated polydimethylsiloxane (PDMS) resin react to form solid, inert
vinyl-terminated PDMS. .................................................................................................. 96
Figure 6.3. Ruptured self-healing silicone samples with 0, 10, 15, and 20 wt% of
microcapsule A and fixed 5 wt% of microcapsule B ....................................................... 97
Figure 6.4. Optical Microscope image of rupture region of samples with different
microcapsule A concentrations. a) 10 wt%, b) 15 wt% and c) 20 wt% ........................... 98
Figure 6.5. SEM image of cross-section region of ruptured silicone with self-healing
microcapsules at different magnifications ....................................................................... 99
Figure 6.6. Young's modulus of undamaged self-healing silicone with 0, 10, 15 and 20 wt%
microcapsule part A ......................................................................................................... 99
Figure 6.7. Load-displacement graph of undamaged samples with different concentrations of
microcapsule A content .................................................................................................. 100

xiv
Figure 6.8. Load-displacement graph of damaged samples with different concentrations of
microcapsule A content .................................................................................................. 100
Figure 6.9. Attenuation Coefficient of self-healing samples with different concentrations .. 101

xv
List of Abbreviations
Chapter 1
CT – Computed Tomography US – Ultrasound
MRI – Magnetic Resonance Imaging HU – Hounsfield Unit
UV – Ultraviolet
Chapter 2
RF – Radio frequency SPECT – Single photon emission tomography
PET – Positron emission tomography USCAs – Target specific ultrasound contrast agents
CFM – Color-flow mapping MB – Microbubbles
SAE – Stimulated acoustic emission TM – Tissue mimicking
SOS – Speed of Sound QA – Quality assurance
PVA – Polyvinyl alcohol cryogel PAA – Polyacrylamide gel
HIFU – High-intensity focused ultrasound BSA – Bovine-serum albumin
PAG – Polyacrylamide hydrogel WL – Window level
WW – Window width TF – Table feed
SC – Slice thickness MSCT – Multi-slice CT
SSCT – Single-slice CT CTDI – CT dose index

xvi
PMMA – Polymethyl methacrylate AAPM – The American Association of Physicists in Medicine
PE – Polyethylene EMF – Electromotive force
SNR – Signal-to-noise ratio CNR – Contrast-to-noise ratio
NIST – National Institute of Standards and Technology NIRS – Near-field infrared spectroscopy
EEG – Electroencephalography MEG – Magnetoencephalography
PMT – Photomultiplier tubes APD – Avalanche photodiode
TRUS – Transrectal ultrasound PVC – Polyvinyl chloride
CRT – Conformal radiation therapy IGRT – Image-guided radiation therapy
IMRT – Intensity-modulated radiation therapy IGRT – Image-guided radiation therapy
Chapter 3
Gd-DTPA – Gadopentetic acid
FTIR – Fourier transform infrared spectroscopy DI – De-ionized water
Chapter 4
TEOS – Tetraehtyl orthosilicate
SPIONs – Superparamagnetic iron oxide nanoparticles TMOS – Tetramethylorthosilicate
APTES – 3-aminopropyl triethoxysilane HDI – Hexamethylene di-isocyanate
XRD – X-ray diffraction SSA – Specific surface area
BET – Braunauer-Emmet-Teller

xvii
SEM – Scanning electron microscopy
Chapter 5
PDMS – Polydimethylsiloxane DLP – Digital Light Processing
HS – Hydrophilic Silicone SLA – Stereolithography
PMMA – Poly(methyl methacrylate) ATR – Attenuated Total Reflectance
Chapter 6
DCPD – Dicyclopentadiene
ROMP – Ring-opening metathesis polymerization EMA – Poly(ethylene-alt-maleic anhydride)
NaOH – Sodium hydroxide HCl – Hydrochloric acid
UF – Poly(urea-formaldehyde) RF – Radio frequency

1
1 Introduction
1.1 Preamble This thesis examines various polymer-based materials for the construction of medical
imaging phantoms. A medical imaging phantoms are anthropomorphic objects that mimic the
properties of human tissue. It is used for calibration, training and surgical planning purposes.
Different imaging modalities are based on different physics theory and measurement
parameters, their requirements also vary. Novel polymer-based materials were developed and
their physical, mechanical and imaging properties were examined. Each study addresses new
findings and problems with existing phantom materials. First, long-term stability of water-
based polymer gel was investigated and the problem with consistency and clinical accuracy
of the phantom was addressed. This suggests that although most of the water-based materials
provide good tissue-mimicking properties, the values may not be consistent. Based on the
first study, novel development of organic and inorganic aerogel was suggested as a solid
phantom material. Aerogels were found to have similar imaging properties to human tissue
upon incorporation of contrast agents. Their potential application is perfusion flow phantoms
to simulate in-vitro blood flow. Another type of solid material, UV-curable silicone was
investigated for 3D printable phantom material. Incorporation of hydrophilic silicone and
water changed the imaging properties to mimic human liver tissue. With fine-tuned
properties, UV-curable silicone can be used as 3D printing resin to allow doctors and health
technicians to easily print the phantom of target area based on US, CT and/or MRI images.
Lastly, growing need for training and surgical planning phantoms motivated the study of self-
healing polymer material. Training and surgical planning often requires multiple needle-
insertion or dissection of the phantom under different modalities such as MRI and US. In
order to endure multiple needle insertion without leaving behind a visible scar is desired. The
proof-of-concept self-healing silicone material was fabricated and its self-healing efficiency
and ultrasound property was examined.
1.2 Medical Imaging Phantom In healthcare, medical imaging is a vital tool for the prevention and early detection of
diseases, helping to identify the optimal treatment and need for surgical intervention, and
monitoring the response to treatment. Since the first discovery of x-rays, the medical uses of
Chapter 1 Introduction to the Dissertation

2
radiation quickly spread and evolved. However, the harmful effects of high radiation doses
became apparent with the occurrence of side effects such as erythema and cell squamation.
This restricted further developments, as people were reluctant to volunteer for radiation
experiments. As the harmful effects of radiation were realized, physicists developed tissue
substitutes, known as phantoms, to simulate the response of real patients, thus allowing
dosimetric measurements and identifying the limitations of their systems. These medical
imaging phantoms are anthropomorphic objects that is scanned or imaged by imaging
technicians to evaluate, analyze, and tune the performance of various medical devices for
optimal results. The phantom is used instead of a living subject or a cadaver because it gives
more consistent results and avoids unnecessarily exposing patients to excess radiation. This
process should be done regularly to tune the devices to ensure accurate, clear results and
avoid misdiagnoses and oversights.
Other uses of medical imaging phantoms include simulating the conditions of a
procedure to measure the radiation within the phantom, simulating patient’s motion that
occur during radiotherapy treatments, testing new medicine or protocols or practicing
surgical procedure. The purpose of the phantom will dictate the physical design of the
phantom, such as the size, shape, composition, and other details of the phantom such as
composition.
The earliest phantoms took the form of water tanks or wax blocks for the measurement
of radioactive sources or x-ray beams. Water is a very good approximation of the human
tissue, but it is difficult to simulate tissues with different properties, both physical and
radiological. Ideally, a phantom should reflect these physical and radiological properties as
accurately as possible. The variety of wax types, however, led to inconsistent measurements
and a lack of tissue equivalency at low energies, and so wax was not a particularly good
material for phantom applications. Wood was proposed as a potential tissue substitute, and
became fairly popular in this role during the 1930s, but, like wax, suffers from problems
regarding the degree of variability among each wood sample.
In the 1970s, the applicability of phantoms expanded from dosimetry in radiotherapy
treatments to various imaging systems such as mammography, computed tomography (CT),
ultrasound (US), and magnetic resonance imaging (MRI). Phantoms are mainly designed to
test the image quality of such systems. They have become increasingly complex and reliable
in this role as the materials used in their construction became more reproducible and able to
accurately mimic tissues over a wider range of energies. In recent years, with the rise in
popularity of computer simulations in the field of medical physics, the detail and complexity

3
of computational phantoms have increased significantly, with advanced imaging modalities
such as CT and MRI aiding the creation of these complex computational phantoms.
1.3 Problem Statement and Objectives
1.3.1 Problem Statement
Multimodal imaging allows the fusion and analysis of image data, which provides
morphological and functional information that can be used towards the ultimate goal of the
early detection of disease at the vascular, cellular, or genomic level. With rapid technological
developments and attempts to fuse two or more modalities together, there is a significant
need for the development of phantoms that can evaluate quality of number of imaging
modalities. Phantom studies have been conducted for individual imaging modalities, but there
is a lack of development in the area of multimodal imaging. Furthermore, the future of
phantoms lies in their application to surgical planning and patient customization. Thus, such
phantom material development is necessary.
1.3.2 Objectives
The goal of this research is to fabricate and characterize several phantom materials to mimic
the characteristics of human tissue and enhance the performance of different medical imaging
modalities, specifically for multimodal applications. The scope of this project is the
fabrication and characterization of polymer gel materials to satisfy the calibration
requirements of several modalities including MRI, CT, and US. To ensure accurate
performance under multiple imaging modalities, evaluation of standard values should be
performed regularly to control the quality and reliability of images. Therefore, a phantom that
behaves similarly to human soft tissue is developed to replace the need for a real human
volunteer. In consideration of these goals, the objectives of this dissertation are as follows:
1. To fabricate and characterize phantom materials to mimic the properties of human
tissue, specifically human liver tissue;
2. To study the chemical and mechanical properties of these materials and their stability
over an extended period of time;
3. To investigate the imaging properties of each material, including the T1 and T2
relaxation times for MRI, the Hounsfield units for CT, and the speed of sound and

4
attenuation coefficient for US. These imaging properties will be compared with those
of normal liver tissue values.
Table 1.1 Normal Liver Tissue Properties
Modality Property Liver Tissue MRI T1 812 ± 64 (ms)
T2 42 ± 3 (ms)
CT HU +40 to +60 (HU)
US Speed of Sound
1549 (m/s)
Attenuation Coefficient
0.9 dB/(cm-MHz)
Elasticity 6.4- 60 kPa
T1 and T2 relaxation times are measure of how quickly magnetized vectors return to its
equilibrium state at either longitudinal or transverse direction. CT housfield unit (HU) is a
scale measurement of linear attenuation coefficient with respect to distilled water at standard
pressure and temperature. Speed of sound is speed of ultrasound waves travel through
different tissues and attenuation coefficient is a measure of energy loss as sound propagates
in a media.
The materials investigated in this study are carrageenan, silica aerogel and cellulose
aerogel, silicone, and self-healing polymer.
1.4 Thesis Organization The body of this thesis is organized into seven chapters, as illustrated in Fig. 1.1. Chapter 1
gives a statement of the problem and outlines the objectives of the dissertation. Chapter 2
provides a brief but relevant literature review on the current state of research into medical
imaging modalities and their phantoms. Chapter 3 describes an investigation of the
mechanical stability of carrageenan-based polymer gel for an MRI liver phantom with lesion
particles. The development of organic and inorganic aerogels for medical imaging phantoms
is discussed in Chapter 4. Chapter 5 then examines 3D printable UV-curable silicone for
multimodal imaging phantoms. Chapter 6 investigates a self-healing polymer that can be used
to create training phantoms for radiation therapy or surgical planning. Finally, a summary of
this research and its key contributions are provided in Chapter 7, along with
recommendations for future work on medical imaging phantoms. Each chapter describes the
5
motivation and objectives behind the study, and details the experimental procedure and
materials. Results for the physical, mechanical, and imaging properties of each material are
also presented.
Figure 1.1. Thesis organization chart

6
2 Background and Literature Review
In diagnostic imaging, various medical imaging modalities are used to generate an image of
the body, either through the detection of photons or the use of electromagnetic waves. Each
imaging modality is distributed in different regions of the electromagnetic spectrum, as
shown in Fig. 2.1. For example, MRI employs radio frequency (RF) or short waves to
produce images of the body. The x-ray spectrum can be divided into two regions: soft (low-
energy) and hard (high-energy). To image soft tissue, low-energy x-ray photons are used,
because high-energy x-ray photons would probably penetrate the tissue without sufficient
attenuation. For example, mammographic imaging uses low-energy x-rays, whereas CT uses
high-energy x-ray photons. Gamma cameras, single photon emission tomography (SPECT),
and positron emission tomography (PET) all produce images through the detection of gamma
rays. The difference between x-rays and gamma rays is in the source of the radiation. X-rays
are produced as a result of the movement or acceleration/deceleration of electrons, whereas
gamma rays are produced as a result of a nuclear decay process. This literature survey
discusses the three imaging modalities of MRI, CT, and US, and looks at their combinations
and phantom materials.
Figure 2.1. Positions of various imaging methods in the electromagnetic spectrum [1]
Chapter 2

7
2.1 Ultrasound
Ultrasound is one of the most common techniques used in diagnostic investigations.
Compared with some other diagnostic modalities, it is safe, noninvasive, and inexpensive,
making it relatively convenient and stress-free for patients. With advances in sonographic
equipment and techniques and the introduction of commercially produced echo-enhancing
agents, there have been substantial improvements in US image quality, and this has widened
the scope of sonography. Furthermore, new US technologies such as µ-ultrasound and the
feasibility of creating target-specific US contrast agents (USCAs) for molecular imaging have
opened up new possibilities in the field of experimental pharmacology. These have allowed
the noninvasive visualization of biological processes in living animals, the real-time tracking
of the spread of diseases, and the observation of the effects of a drug throughout the system.
2.1.1 Ultrasound imaging technique
The US waves are generated by piezoelectric elements such as tiny chips of vibrating quartz.
These produce elastic vibrations that are transmitted to the target material. When sound
waves are transmitted from the transducer, the elastic vibrations emanate from the transducer
in the direction of propagation of the waves. A sound wave consists of a series of
compressions and rarefactions. The distance between the start of a wave and the next is
denoted as one wavelength (λ). The number of vibrations per second at one point is the
frequency (f). The relationship between the wavelength, frequency, and velocity of
propagation (v) is as follows (see Fig. 2.2):
λ =νf

8
Figure 2.2. Principle of propagation of US
The speed of sound is material-specific, depending on the density and the amount of mass
particles (see Table 2.1). Table 2.1. Propagation speed of US in various media [2]
Media Density (g/cm3) Propagation Speed (m/s) Air 1.2 × 10⁻³ 330
Water (37°C) 1.0 1,520
Soft Tissue 1.026 1,540 (mean)
Bone 1.9 3,800
The phenomena of reflection and refraction, which take place at the transition between
materials with different propagation velocities, also occur with sound waves. The reflected
portion of the ultrasonic energy depends on both the difference between the velocity of sound
in the two media and on the angle of the incident beam with respect to the interface. When
light moves through tissue, the energy of the wave weakens continuously due to internal
friction, also known as absorption. The specific absorption rate is not the same for all
frequencies: low frequencies have a relatively low absorption rate compared with high
frequencies. Low frequencies also have the disadvantage of having a low spatial resolution,
which increases with frequency. Depending on the diagnostic targets and the penetration
depths needed, different types of transducers with different frequencies are used.

9
2.1.2 US Imaging Techniques
The basis for the medical use of US began with the discovery of the piezoelectric effect. This
effect is a characteristic of crystals or ceramic materials, which become electrically polarized
under physical pressure. Such materials begin to vibrate and emit high-frequency acoustic
waves when charged with an alternating electrical voltage. The ultrasonic waves reflected by
the body are collected by the transducer and converted by piezo elements into electrical
signals, which are then processed by the US machine and represented as pixels. Since the
discovery of the piezoelectric effect, several researchers have developed US machines. The
“A mode” technique uses the amplitude over a period of time to obtain the backscattered
signal intensities. The amplitude reflects the intensity of the backscattered ultrasonic signals,
and the distance between peak amplitudes gives the running time. This A mode enabled the
differentiation of healthy and tumorous intestine and breast tissue. The “B mode” approach
was developed to provide real-time images for clinical use. The B mode is a modified
representation of the A mode, where the amplitudes of the A-mode lines are translated into
gray tones. The highest amplitude is assigned the brightness value white, whereas the zero
line of the amplitude scale is assigned the brightness value black. Intermediate amplitudes are
assigned gray tones on an appropriate scale (maximum 256). The next qualitative leap in
medical US was the use of the Doppler effect to measure blood flow. Doppler’s acoustic law
states that frequency changes occur in the sound field if the transmitter and receivers move in
relation to one another. To determine the blood flow, the transducer emits ultrasonic waves of
a known frequency that are reflected by the blood cells and received again by the transducer.
The received frequencies will differ depending on the direction in which the blood cells are
flowing. For example, blood cells moving towards the transducer will emit higher
frequencies, whereas those moving away will produce lower frequencies. This discovery led
to the development of the continuous Doppler (CW-Doppler), pulse Doppler (PW-Doppler),
color-flow mapping (CFM), and intensity-Doppler modes. [3-10]
2.1.2.1 Contrast-specific Techniques
The beginnings of diagnostic US were characterized by USCA-free examinations for the
morphological characterization of tissue, followed soon after by functional examinations
through the introduction of Doppler technologies. Gas-filled microbubbles (MBs) were then
used to enhance the contrast due to their special physical and acoustic characteristics. The
contrast characteristics of MBs can be induced and employed as a function of the frequency

10
and sound intensity of the irradiated ultrasonic wave. Some techniques involve the
destruction of these MBs, whereas they are preserved in others. Ultrasonic waves of very low
sound intensity lead to a resonant oscillation of the MBs. Acoustic waves of the same
frequency to which these MBs have been exposed are reflected and converted into an image
by the US device [11, 12].
An increase in sound intensity causes asymmetrical oscillations in the MBs, since the
encapsulated gas bubbles oppose compression with a greater resistance than they do
expansion. During this process, other frequencies besides the output frequency are also
emitted in the signal response. These other frequencies are known as harmonic frequencies,
or overtones and undertones. The second harmonic overtone frequency is particularly
important because of its high amplitude. The basic frequency received from tissue and the
contrast-agent bubbles is suppressed by special filtering techniques during signal processing.
This procedure results in a clear reduction of the tissue signal portion, resulting in a more
intensive representation of the contrast signal in relation to the tissue and an improved signal-
to-noise ratio (SNR). As opposed to second-harmonic imaging, the technology of wideband
harmonic imaging uses the entire frequency spectrum to represent the contrast-agent-specific
signals. This method achieves higher signal intensity from the contrast-agent bubbles, and the
use of a wideband transducer results in better spatial resolution than with second-harmonic
imaging. [11, 13-16]
Although most procedures do not destroy the contrast-agent bubbles, other technologies
utilize their destructibility. At very high sound intensities, the MBs are destroyed by
mechanical force. Sound pressure can vary in intensity because of the different morphologies
presented by various USCAs. Three mechanical destroying phenomena have been identified:
the fragmentation of gas bubbles, the destruction of the bubble shell, and the radiation effect.
It is known that the wall thickness and elasticity of the material encapsulating the gas MBs
are crucial in triggering the destruction of the encapsulation. Fragmentation causes one gas
MB to create many smaller bubbles. The destruction of the encapsulation causes the gas to
escape through a tear in the encapsulating material and dissolve in the blood. [17] Using this
observation, the color pixels on the monitor of the US device during the destruction of
polymer-coated air MBs can provide an indicative medium. During the destruction process, a
short-lived wideband, nonlinear frequency signal is emitted, which is called the stimulated
acoustic emission (SAE). The discovery of the SAE signal provided a crucial basis for the
new field of diagnostic molecular imaging with US. [18]

11
2.1.3 Ultrasound Phantoms
Ultrasound phantoms have been constructed to model the human anatomy and tissue
characterization. Early phantoms were essentially water-filled containers, with metal rods at
specific locations to provide some distance calibration. As US equipment became more
advanced, new phantom materials (known as “tissue mimicking”) were developed to ensure
the transmission of sound at the correct speed, incorporate reflectors that caused an echo to
be returned to the transducer, and provide sound attenuation similar to that experienced in
tissues. The physical basis for US imaging is rather complex, which raises the necessity of
accurate physical parameters in US phantoms used for image quality measurements. The
three key parameters are (1) the speed of sound (SOS), (2) attenuation and its frequency
dependence, and (3) scattering. Other physical parameters include the density, which is a
nonlinear parameter (B/A). [19] These physical properties should be applicable over the
frequency range of most clinical diagnostic US systems (2–15 MHz). In response to the
development of higher-frequency probes for higher resolution imaging (preclinical at 20
MHz and above), characterizations at higher frequencies are also desirable [20-22]. Typical
ranges of these parameters for a set of tissues are listed in Table 2.2.
Table 2.2. Acoustic parameters for various tissues [23, 24]
Tissue/Material Velocity (m/s)
Attenuation (dB/(cm-MHz))
Density (kg/m3)
Acoustic impedance (MRayl)
Backscatter coefficient (10-4/(cm-sr))
Air 330 1.2 0.0004 Water 1480 0.0022 1000 1.48 Soft tissue (average)
1540 0.3-0.8 1043 1.63
Muscle 1547 – 1600 0.2-0.6 1050 1.62 Blood 1560 – 1584 0.2 1060 1.68 0.1 – 1 Breast 1510 0.75 1020 1.54 Liver 1555–1595 0.4 – 0.7 1060 1.69 1 – 25 Cardiac 1576 0.52 1060 1.67 Fat 1450–1480 0.5 –1.8 950 1.40
More recently, mechanical (viscoelastic) properties have been characterized to enable the
analysis of US echo signals under varying degrees of compression or through the use of
acoustic radiation. [23, 25, 26] It is desirable to mimic the properties of tissue in which the
Young’s modulus is from 6–12 kPa (or stiffer with inclusions or lesions).

12
2.1.3.1 Ultrasound Phantom Applications
There are three major applications for ultrasound phantoms. First, they are used as test tools
for SOS, attenuation, and backscatter measurements. Typically, the phantom is immersed in
water to control the temperature and provide a coupling medium for the acoustic transducers.
The second application is for teaching and training. Ultrasound technicians must understand
the underlying anatomy and its appearance as they perform studies. Anthropomorphic
phantoms are intended to provide a reusable, repeatable, and realistic representation, or to
allow the trainee the experience of placing the US probe on the correct part of the body.
Phantoms used for training purposes can have a mannequin-like appearance. Small portions
of the phantom may be enclosed within a box, with an opening for the insertion of the
transducer [27]; or include target cysts and lesions for practicing needle-based biopsy
procedures or performing peripheral nerve blocks under US guidance. The third, most
common application is for the verification of imaging system performance, such as with
Doppler phantoms.
2.1.4 Phantom Materials
2.1.4.1 Agar
Cannon et al. [28] developed a novel agar-based tissue-mimicking material for use in
clinically relevant, quality assurance (QA), and anthropomorphic breast phantoms. The
motivation for their work was to simulate the properties of the tissue types in the breast,
primarily glandular tissue, subcutaneous fat, pectoral muscle, areola, and malignant and
benign lesions. The samples were fabricated with a mixture of agar, silicon carbide, and
aluminum oxide in deionized water, and their acoustic characteristics were obtained. The
SOS of the samples ranged from 1490–1570 m/s, their attenuation coefficients ranged from
0.1–0.9 dB/(cm MHz), and the relative backscatter ranged from -20–0 dB. The acoustic
properties of the materials were independent of frequency in the wide diagnostic ranges,
demonstrating their suitability for high-frequency applications. Agar is relatively easy to
manufacture and its acoustic properties are easily controlled. By tailoring the acoustic
properties, agar can mimic the values of human tissue. Thus, it is suitable for use in clinically
relevant, QA, and anthropomorphic phantoms.
Foroozandehasl et al. [29] fabricated agar-based tissue-mimicking material for US breast
phantoms. They chose agar because it is inexpensive, reproducible, and nontoxic. The
phantom was fabricated with agar, 2-isopropyl alcohol, anise oil, tartrazine, and distilled

13
water. The effect of physical properties such as temperature and the percentage composition
on the SOS was evaluated. The SOS increased from 1400 m/s to 1600 m/s over the
temperature range 15–35°C. The SOS was also found to be inversely proportional to the
concentration of anise oil.
2.1.4.2 Polyvinyl Alcohol Cryogel (PVA)
Price et al. [30] studied the optical and x-ray properties of a compressible polyvinyl alcohol
cryogel (PVA-C) breast phantom for dual-modality imaging. A solution of PVA in ethanol
creates a solid yet elastically compressible gel whose x-ray attenuation coefficients are
equivalent to breast tissue. Titanium dioxide can be added to obtain the desired transport
scattering coefficient. The phantom contains a compressible inclusion made of an inflatable
latex tube, and different volumes of dye were injected to simulate the blood flow into a
lesion. Gels with 5–20% w/v concentrations demonstrated linear x-ray attenuation within the
range 0.76–0.86 cm-1, which is equivalent to that of healthy breast, adipose, and glandular
tissue.
Zell et al. [31] compared the acoustic properties of agar, silicone, PVA, and
polyacrylamide gel (PAA) for breast phantoms. Two US sources of 5 MHz and 20 MHz core
frequencies were used to compare the acoustic attenuation in each gel. The results showed
that PVA exhibits the best acoustical properties up to 10 MHz, although it has the
disadvantage of a time-consuming preparation procedure. Agar, on the other hand, is quick
and easy to prepare, and offers satisfactory acoustic properties, but its long-term stability is
not good. The acoustical properties of silicone do not fit perfectly with the required values,
but it is a good material for a stable phantom. PAA is not a good candidate due to its potential
toxicity during preparation.
Surry et al. [32] created PVA-C phantoms for use in US and MR imaging. The properties
of the PVA-C samples varied depending on the number of freeze–thaw cycles (FTCs) and the
rate of temperature change. The velocity of sound was found to be 1520–1540 m/s, which is
well within the typical range for tissue. However, the attenuation coefficients were just
0.075–0.28 dB/(cm MHz), compared to the value of 1 dB/(cm MHz) for tissue. The obtained
T1 values of 680–980 ms were similar to those for gray and white matter and muscle, whereas
the T2 values varied from 100–150 ms. Fabricated brain, vessel, and breast biopsy phantoms
demonstrated that small, regularly, or irregularly shaped volumes could be made to mimic
human tissue values by varying the number of FTCs.
14
2.1.4.3 Polyacrylamide Hydrogel
Choi et al. [33] studied phantoms with similar acoustic properties to human tissue to visualize
the therapeutic effects of high-intensity focused ultrasound (HIFU). The minimally invasive
nature of HIFU surgery offers an advantage over other therapeutic means of tumor treatment.
The conventional bovine-serum albumin (BSA)-polyacrylamide hydrogel (PAG) reported by
Lafon et al. [34] does not recreate the scattering and attenuation of biological tissue.
Therefore, Choi et al. modified the standard BSA-PAG by increasing the concentration of
acrylamide to adjust the attenuation coefficient and suspending glass beads to tune the
backscatter coefficient. The constructed BSA-PAG exhibited acoustic properties close to
those of liver tissue, and had thermal and optical characteristics comparable to the standard
BSA-PAG.
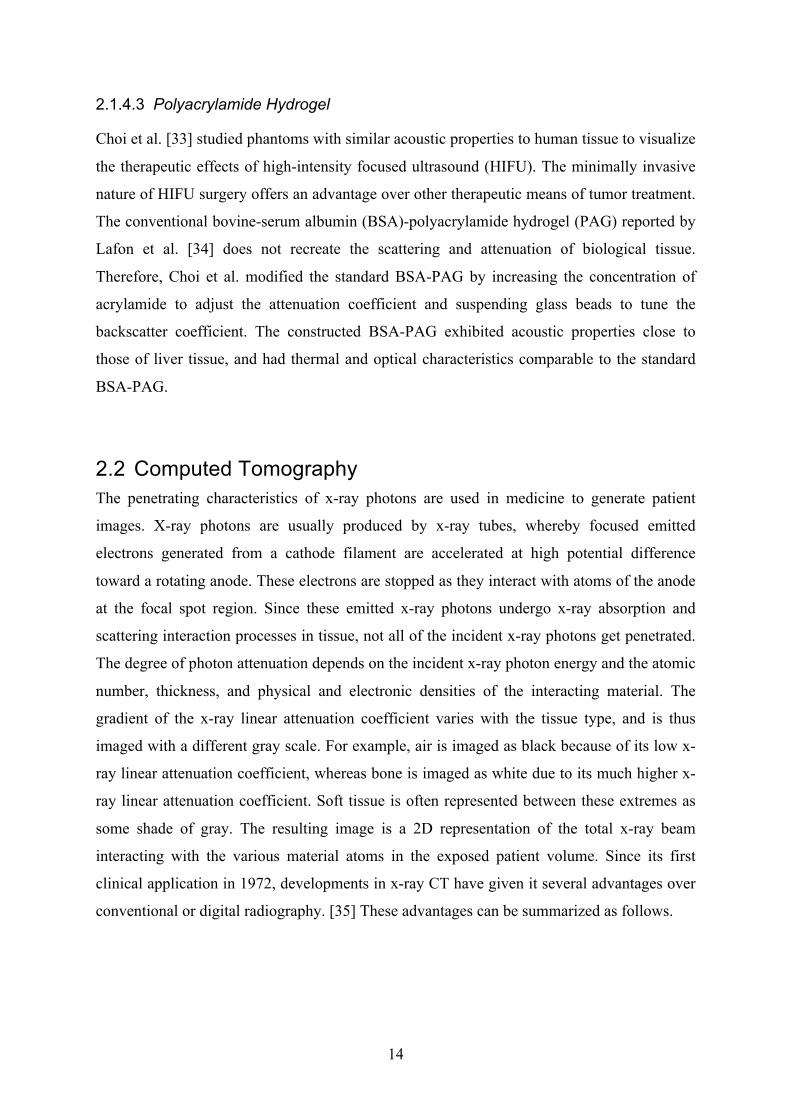
2.2 Computed Tomography The penetrating characteristics of x-ray photons are used in medicine to generate patient
images. X-ray photons are usually produced by x-ray tubes, whereby focused emitted
electrons generated from a cathode filament are accelerated at high potential difference
toward a rotating anode. These electrons are stopped as they interact with atoms of the anode
at the focal spot region. Since these emitted x-ray photons undergo x-ray absorption and
scattering interaction processes in tissue, not all of the incident x-ray photons get penetrated.
The degree of photon attenuation depends on the incident x-ray photon energy and the atomic
number, thickness, and physical and electronic densities of the interacting material. The
gradient of the x-ray linear attenuation coefficient varies with the tissue type, and is thus
imaged with a different gray scale. For example, air is imaged as black because of its low x-
ray linear attenuation coefficient, whereas bone is imaged as white due to its much higher x-
ray linear attenuation coefficient. Soft tissue is often represented between these extremes as
some shade of gray. The resulting image is a 2D representation of the total x-ray beam
interacting with the various material atoms in the exposed patient volume. Since its first
clinical application in 1972, developments in x-ray CT have given it several advantages over
conventional or digital radiography. [35] These advantages can be summarized as follows.

15
1. A sequential CT comprises a set of 2D cross-sectional images instead of a single 2D image
obtained by compressing a 3D body structure volume onto a 2D image plane. Therefore, it
gives a clear image containing the location and contrast of the subject tissue. [36]
2. The volume of data can be reformatted in various planes (sagittal, coronal, and axial) or
even as a volumetric (3D) representation (e.g., multiplanar reformation, maximum intensity
projection, and virtual colonoscopy) of the structure.
3. The sensitivity of CT to subtle differences in in x-ray attenuation is increased by a factor of
16 compared with normal film/screen radiography systems. This can be achieved using a
much narrower, finely collimated CT x-ray beam profile that reduces the scatter photon
contribution and the use of detectors with higher x-ray absorption efficiencies.
2.2.1 Image construction
In sequential CT, 2D images (or slices) are typically acquired in a 512 × 512 image matrix
with 16-bit resolution. The picture element (or pixel) after digitization is given in Hounsfield
units (HU) (or simply the CT number), which are defined as:
CT Number (HU) =C ⋅µp −µw
µw
where C is an integer constant called the contrast scale (typically set to 1000); μp is the
calculated pixel mean x-ray attenuation coefficient; and μw is the mean x-ray attenuation
coefficient of water or water-equivalent phantoms. Because x-ray attenuation coefficients are
affected by the x-ray beam energy, it is important to properly evaluate the CT scanner x-ray
tube generator to ensure accurate and reproducible CT numbers. The calibration is energy-
dependent, and must be carried out for the complete range of available tube voltages,
proliferations, filtration shapes, and so on. When quantitative analysis is required, it is
recommended that a calibration phantom is scanned prior to the actual scans. [37, 38]
2.2.2 Computed Tomography Scanning Procedure
In third-generation CT scanner geometry, the patient lies on an examination table that can be
moved through the scanner gantry, and the x-ray tube and detector array, which are
mechanically fixed directly opposite the x-ray tube, rotate around the patient at some fixed

16
radius from the gantry center of rotation. Sequential 2D images can then be reconstructed
from multiple x-ray projections acquired by rapidly rotating the x-ray tube 360° around the
patient while exposing a detector subsystem to the transmitted x-radiation. At specific x-ray
tube angles, the intensity of the transmitted x-ray photons is measured and the collected data
are combined to form a single view or projection. The image is reconstructed from
approximately 1000 views, which are used to compute the mean x-ray attenuation coefficient
of the tissue at each voxel (the position on the image) and the CT number.
Because the human body comprises fluids and tissue that can vary in their x-ray attenuation
properties, a single CT image can have voxels with CT numbers ranging from −1000 (air) to
2000 HU (dense cortical bone). This would require 3000 or more gray levels to differentiate
different types of tissue/fluids in one image, as demonstrated in Fig. 2.4. Therefore,
windowing is required to assign the total monitor display intensity to the CT number range of
interest. For example, voxels with CT values below the lower window (L) will be displayed
as black, whereas voxels with CT values above the upper window (U) setting will be
displayed as white. The windowing procedure is performed by the CT operator according to
two parameters: the window level (WL) and the window width (WW). The WL is chosen to
correspond to the mean CT number of the tissue structure of interest, and the WW is chosen
to determine the display contrast of the image. As the WW decreases, the range of CT
numbers represented by each gray level becomes smaller, which improves the display
contrast visibility. A narrow WW can display very small x-ray attenuation differences,
whereas a wider WW can display larger differences in x-ray attenuation.
Figure 2.3. Ranges of CT values of the most important organs

17
2.2.3 Computed Tomography Sequences
To optimize image quality while minimizing x-ray radiation exposure to the patient, image
artifacts, and study acquisition times, CT manufacturers and the medical community have
implemented various improvements in modern CT scanners, such as third-generation
geometry, ¼ detector width offset relative to the gantry center of rotation, low-voltage slip
rings, and multiple ceramic detector arrays. These major technological improvements allow
CT scanners to be operated in numerous acquisition modes.
First, a scout image is acquired to assist the CT operator in planning the patient
protocol and to establish the target organ location. Scout images are generated by selecting an
x-ray tube orientation with respect to the patient or table, then moving the table at constant
speed through the gantry. Since the x-ray tube and detector array do not rotate around the
patient during the acquisition, the resulting image looks similar to a regular x-ray radiograph.
In axial (or step-and-shoot) acquisition, the x-ray tube continuously rotates around the
patient while the table travel is adjusted and moved in predefined increments on the z-axis.
Since the table is fixed during the image acquisition process, axial scanning is preferred for
high-quality CT imaging.
In spiral (helical) acquisition, the x-ray tube rotates around the patient and the table moves
continuously through the gantry at a predefined speed throughout the scan. This approach has
no interscan delays and can scan a large target volume very quickly. The volume coverage
obtained during a helical scan acquisition is determined by a scan parameter called the helical
pitch, which is defined as:
Helical Pitch = TFSC
where TF is the table feed per rotation (mm/rotation) and SC is the slice thickness. The
helical pitch value depends on the examination, as the tradeoff between coverage and
effective slice thickness accuracy must be considered. Despite the advantages of helical scan
acquisition, there is not enough projection data collected on any one helical loop to
reconstruct a 2D axial slice, since the table is in constant motion. This problem can be
overcome by using multi-slice CT (MSCT) scanners. MSCT scanners are similar to single-
slice CT (SSCT) scanners, but the detector array consists of more than one row of detectors.
The major benefits of MSCT are their shorter acquisition times, retrospective creation of
thinner or thicker sections from the same raw data, increased speed of volume coverage, and

18
the ability to achieve isotropic voxel resolution to reduce the helical artifacts. The added
image slice data allow larger and more accurate volume datasets to be obtained, resulting in
improved 3D reconstruction and rendering techniques.
Real-time CT fluoroscopy acquisition generates continuous images from a fixed z-axis
position, which is updated several times per second. CT fluoroscopy is often used to guide
biopsy and aspiration procedures, but risks unnecessary x-ray radiation exposure to the
patient. To minimize this exposure, the recent trend is toward a series of discrete rapid
acquisitions. [39, 40]
2.2.4 Image Quality
Manufacturers are continuing to optimize the image quality of CT by examining aspects of
noise, resolution, and helical pitch. Noise in CT images is measured by calculating the
standard deviation of a region of interest in a homogeneous water phantom. The noise level
depends on the object of the scan, the tube current, and the size of the detector. The standard
deviation of the CT value in an image is calculated as [39]:
σ =CRI0 / IεQS
where the factor CR varies with the reconstruction algorithm, ε is the efficiency of the overall
system, Q is the current-scan time product (mAs), and S is the slice thickness. A higher ratio
of I0/I denotes higher attenuation, which results in more noise. As the volume of the patient
increases, the noise level also increases.
The in-plane spatial resolution in CT is a function of focus size, detector size, and the
movement of the focus, as the x-ray source continuously moves during the scanning. This
resolution can be measured using wire phantoms that provide a line-spread function.
The image quality of SSCT decreases with increasing helical pitch. There are two
reasons for this. First, nominal slice thickness broadening occurs with increasing table speed,
and second, the z-interpolation errors increase during image reconstruction as the helical data
loops become stretched.
2.2.5 Computed Tomography Phantoms
Various new CT technologies have emerged, such as multi-slice, current-modulated, half-
second rotation, dual-energy, dedicated breast, and 4D cone beam CT. As a result, the

19
development of suitable and effective phantoms is important in verifying that these CT
scanners balance patient safety and diagnostic capabilities.
There are three types of phantoms for CT: 1) those for determining dosimetry; 2) those
for examining image quality; and 3) anthropomorphic phantoms. Dosimetry can be
characterized using the CT dose index (CTDI). The CTDI considers the dose profile to be a
superposition of a primary dose distribution, related to the portion of the x-ray beam
modulated by the pre-patient collimator, which is used to produce the image, and a scatter
profile given by the interaction of the primary beam with the phantom material. Typically,
the standardized phantom material used in CDTI measurements is polymethyl methacrylate
(PMMA). [41]
CT phantoms for assessing image quality aim to quantify the main properties of the CT
images, such as their spatial resolution under low- and high-contrast background, image
noise, slice thickness, and certain artifacts (motion, beam hardening, uniformity). [42-44] E.
McCullough et al. developed a guide for quality control and dosimetry known as The
American Association of Physicists in Medicine (AAPM) CT test phantom, which includes
inserts for of the dose profile measurements and alignment. [45-47] However, this phantom is
inconvenient, as it must be filled with water. Thus, QA CT phantoms were improved using
tissue-equivalent epoxy resin [48] or with holes for inserting small disks that provide specific
information about image quality parameters. [49]
Anthropomorphic phantoms were introduced to mimic human tissue radiation absorption
properties and average anatomical characteristics such as electron density and effective
atomic number variations. Alderson et al. [50] introduced the concept of tissue-equivalent
material associated with a human-shaped phantom for applications in radiation therapy
treatment plans. These phantoms are usually associated with the insertion of film or
thermoluminescent dosimeters, which assist dose investigations. [53, 54]
2.2.6 Phantom Materials
2.2.6.1 Polyethylene
Kalender et al. [55] have fabricated a calibration phantom for quantitative CT. They used
different concentrations of polyethylene (PE) and calcium hydroxyapatite [Ca5(PO)4OH] to
fabricate water-equivalent and bone-equivalent phantoms. The CT numbers (HU) for the
water-equivalent plastic and bone-equivalent plastic were -6.0 and 291.8, respectively, at 96

20
kVp. These phantoms were placed in a cutout of the table map to compare the uncalibrated
and calibrated HU values of a reference phantom. The results show that the HU values
changed from 399 to 322 HU following calibration. Although two reference materials cannot
ensure the accuracy of the calibration, the small phantom cross-section is very lightweight,
making for easy handling and improved patient comfort, since the patient is essentially
supported by the table mat.
2.2.6.2 Epoxy
Iodinated phantoms have been studied for quality control measurements and system
calibration. However, liquid phantoms suffer from variability between repeated dilutions,
inhomogeneities from air bubbles or precipitates, and long set-up times. Therefore, Hill et al.
[56] investigated a durable and reproducible iodinated phantom material that remains stable
over time. Two different sets of calibration materials were fabricated with epoxy as the
matrix and iodine concentrations of 0.0–3.0 mg/ml. They found a good agreement between
the molded and experimentally determined µeff, although some small systematic difference
appeared. In addition, both demonstrated a linear relationship between µeff and iodine
concentrations. The relationship between the linear attenuation coefficient and the iodine
concentration is shown in Fig. 2.5. The material uniformity can be improved by using a
shorter cure time at an elevated temperature. The manufacturing reproducibility of the iodine
concentration was 0.03 mg/ml between each manufacturing run. Over the first six months,
and then for another 1.5-year period, there was no statistically significant change in the µeff
value of the calibration phantoms.
2.2.6.3 Polymethyl methacrylate (PMMA)
Dynamic contrast-enhanced imaging allows the assessment of functional information in
addition to morphology using various modalities. Brauweiler et al. [57] developed a phantom
for generating reproducible contrast-enhancement curves and providing a standard for the
comparison of different protocols and modalities in dynamic imaging. Polymethyl
methacrylate was used as the base material of the phantom, and the water flow was generated
by a peristaltic pump with injected contrast agents. The phantom was used to assess the
perfusion, SNR, spatiotemporal resolution, and reproducibility. The phantom showed good
reproducibility in repeated measurements, with maximal deviations of 4% for time to peak,

21
9% for mean transit time, and 8% for peak enhancement. The area under the curve was
constant to within 3.5% for different injection protocols. For the static case, highly
constrained back projection (HYPR) LR maintained its spatial resolution, whereas for the
dynamic case, it reduced the spatial resolution by up to 19% for the highest dynamics. The
proposed phantom demonstrated good reproducibility, enabling it to act as a reference
standard for comparing sampling strategies, injection protocols, and post-processing methods
for QA.
2.2.6.4 Various Polymer Materials
Homolka et al. [58] compared different polymer materials for water equivalent phantom
materials to study the temperature dependence on HU values. They examined epoxy resin,
polyethylene, polystyrene–polypropylene mixture, and commercially available phantom
materials (Solid WaterTM and Plastic WaterTM). Cylindrical samples of each material were
scanned using a Tomoscan SR-6000 (Philips) at 120 kV and temperatures of 15–40°C. Their
results demonstrate that, at a reference temperature of 20°C, materials gave HU values close
to zero, while the commercial materials exhibited an offset of 119.77 HU (Plastic Water) and
27.69 HU (Solid Water). The temperature dependence was lowest for epoxy-based materials
and highest for a polyethylene-based material, as demonstrated in Fig. 2.6. Polystyrene or
mixtures with polypropylene are appropriate phantom materials, because they have lower
thermal expansion and lower sensitivity to temperature changes.
2.3 Magnetic Resonance Imaging
Magnetic resonance imaging uses the macrolevel behavior of atomic nuclei that possess
magnetic properties under a strong magnetic field. Hydrogen (H) atoms are the most
abundant element in the human body, and these are used in MRI. There are several
advantages of MRI over other imaging modalities. Unlike CT, SPECT, and PET, MRI
operates in RF range; thus, there is no ionizing radiation involved. Furthermore, MRI can
generate excellent soft tissue contrast, and is capable of producing 3D volumetric images.
MRI can produce images at any orientation, whereas CT is limited to axial slices and other
orientations are reconstructed through post-processing interpolation. For each tissue, the

22
image pixel values vary according to their intrinsic properties. Thus, we can obtain exquisite
images by enhancing or suppressing the effects of the desired parameters in terms of
anatomical, functional, and molecular imaging. The MRI process can be divided into three
steps: signal generation, detection, and reconstruction. [59]
2.3.1 Signal Generation
A fundamental property of nuclei is that those with odd atomic weights or atomic numbers
possess angular momentum, often referred to as spin. A nucleus with nonzero spin rotates
around its own axis. If there is a net electrical charge associated with that nucleus, a magnetic
field is created. For example, H atoms are used in MRI because of their abundance in the
human body in the form of water (H2O). Since H atoms have one proton, they have a net
angular momentum. Under normal conditions, the magnetic fields are oriented in random
directions, canceling each other out and resulting in zero net magnetization. During the
imaging, a strong magnetic field B0 is applied to create coherent magnetization M, which
restricts the probability of the spin canceling itself out. This coherence alone is not sufficient
to generate a detectable signal, as static magnetic fields do not generate any signal. Once
coherence has been achieved, an input signal (RF excitation), denoted by B1(t), is applied to
the system to change the direction of M. This induces a change in the magnetic field, which
generates a response that is recorded as the output signal. B1(t) is applied perpendicular to B0
for a short duration, and falls into RF range in the following form:
B1(t) = Be1(t)e−i ω0t+φ( )
where Be1(t) is the envelope of the pulse, ω0 is the excitation carrier frequency, and Φ is the
initial phase, generally assumed to be zero. The spin causes the nucleus to rotate around its
own axis at a frequency of ω. To provide coherent spin transitions from the equilibrium state
to another, we use the Larmor frequency ω0, which lies within the RF range and is given by:
ω0 = γB0
where γ is the gyromagnetic ratio constant and is characteristic of a particular nuclide. [60]
23
2.3.2 Signal Detection: Relaxation
After the magnetized spin has been disturbed from its equilibrium state by an RF pulse, it will
return to the equilibrium state once the RF pulse is removed. This process is known as free
induction decay or relaxation. The recovery of the longitudinal component Mz is called
longitudinal or T1 relaxation, whereas the decay of the transverse magnetization Mxy is called
transverse or T2 relaxation. The underlying mechanism is complicated; however, we can
account for the T1 and T2 relaxation in the Bloch equation:
dMdt
=M ×γB =Mxi+My j
T2=Mxi+M0( )k
T1
where M and B are vector forms of the magnetization and magnetic field, respectively, and i,
j, and k are unit vectors along the x, y, and z directions, respectively. In the Bloch equation,
the first term on the right-hand side describes the rotational behavior, whereas the relaxation
terms describe the exponential behavior of the transverse and longitudinal magnetization
components. The rotational term does not change the magnitude of the magnetization vector,
whereas the relaxation processes do.
2.3.2.1 Longitudinal Relaxation
The longitudinal relaxation process is governed by
dMz
dt=Mz −M0( )
T1
where T1 is the spin-lattice relaxation time constant, which determines the time taken to
return to equilibrium along the direction of the B0 field. [60] We can solve this equation for
Mz:
Mz =M0 + Mz (0)−M0( )e−tT1
At 90° excitation, Mz(0)=0, which can further simplify the equation as:
Mz =M0 1− e−tT1
⎛
⎝⎜
⎞
⎠⎟

24
where T1 is a field-strength-dependent parameter that measures the amount of energy
exchanged between the nuclei and the surrounding lattice. At higher frequencies, a greater
energy exchange is required to switch between equilibrium and non-equilibrium states. Thus,
T1 increases with B0.
2.3.2.2 Transverse Relaxation
The transverse component of magnetization behaves according to [60]
dMxy
dt=Mxy
T2
where T2 is the spin–spin relaxation time constant, which describes the decay of the
transverse magnetization. Under longitudinal relaxation, the xy-components of the fluctuating
magnetic dipoles at the spin resonant frequency are responsible for T1 relaxation. Under
transverse relaxation, the z-component fluctuation and xy-component fluctuations account for
T2 relaxation, which makes T2 greater than T1. Since z-component fluctuation often
dominates T2 relaxation, it is largely independent of the field strength. [60]
2.3.3 Image Reconstruction
According to Faraday’s law of induction, the changing magnetic field induces an
electromotive force (EMF) in the receiver coil through precession. The RF coil that generates
the RF excitation field can be used to detect this signal, commonly known as free induction
decay (FID). Once the signal has been recorded, the inverse Fourier transform can be used to
reconstruct the image or spin distribution m(x, y). There are several acquisition techniques,
such as parallel imaging. An example of a skull in a T1-, T2-weighted MRI is shown in Fig.
2.7.

25
Figure 2.4. MRI of the skull metastasis from hepatocellular carcinoma. (A) T1-weighted MRI and (B) T2-weighted MRI demonstrating a homogeneous, well-defined, and iso-signal intensity mass in the occipital midline. (C) Gadolinium-enhanced T1-weighted MRI showing a strong enhancement of the tumor [65]
2.3.4 Magnetic Resonance Imaging Phantoms
MRI phantoms are fluid-filled objects that mimic body shapes and dimensions. Phantoms can
be constructed to evaluate image contrast, SNR, image uniformity, spatial resolution, slice
thickness, and geometric accuracy. Examples of MRI phantoms include the Magphan®
qualitative imaging phantom to measure SNR, contrast-to-noise ratio, or image contrast and
spatial distortion [66] or and the phantom created by the National Institute of Standards and
Technology (NIST) that upholds national standards [67].
Although widely appreciated for its high-resolution, soft tissue imaging, MRI is also a
quantitative technique that can measure several tissue-specific characteristics such as proton
density and relaxation time. The tissue-specific longitudinal relaxation time (T1) and
transverse relaxation time (T2) depend on molecular motion and the local microenvironment.
Therefore, tissue relaxation times that differ from normal indicate inflammation, edema,
microhemorrhage, or biological dysfunction. For accurate and precise measurements of
human T1 and T2 values, standardized pulse sequences are essential. Furthermore, T1 and T2
are also strongly influenced by the viscosity of rigidity of a tissue. If a tissue or a phantom
has the greater viscosity and rigidity, the value for T1 and T2 are smaller. For most soft tissues
in the body, the proton density is homogeneous and it does not contribute significantly to the
strength of the MRI signal. Table 2.3 presents typical T1 and T2 values for common tissues
imaged at 1.5 and 3.0T and measured in vitro immediately after excision. [68] Phantoms have
been constructed using aqueous solutions doped with paramagnetic ions such as GdCl3,
MnCl2, CuSO4, and NiCl2. These phantoms provide a homogeneous solution in a rigid
container, but generally suffer from flow or motion artifacts. Thus, gelatin phantoms doped
with paramagnetic ions are developed with polyacrylamide, polyvinyl alcohol, gelatin,

26
carrageenan, agarose, or agar. NaCl can be used to modify conductivity, GdCl3 to modify T1,
and agarose to modify T2.
Table 2.3. Typical T1 and T2 values for various tissues measured at 1.5T and 3T [68] Tissue T1 values (ms) T2 values (ms)
3T 1.5T 3T 1.5T Blood 1932 ± 85 1441 ± 120 275 ± 50 290 ± 30 White matter 1084 ± 45 884 ± 50 69 ± 3 72 ± 4 Gray matter 1820 ± 114 1124 ± 50 99 ± 7 95 ± 8 Muscle 1412 ± 13 1008 ± 20 50 ± 4 44 ± 6 Liver 812 ± 64 576 ± 30 42 ± 3 46 ± 6
Diffusion-weighted MRI is a quantitative method that measures tissue-specific diffusion
characteristics, such as the apparent diffusion coefficient, mean diffusivity, and fractional
anisotropy. These help clinicians to better understand the brain architecture and microscopic
characteristics Diffusion techniques can be extensively used for imaging neurological
dysfunction and disease such as inflammation, multiple sclerosis, traumatic axonal injury,
cellular infiltration/activation, and connectivity studies [69, 70].
2.3.5 Phantom Materials
MRI phantoms can be used for the development, adjustment, or maintenance of a system, as
well as for evaluating MR image performance, determining the application range for new
systems and pulse sequences, training MRI operators, and establishing standardization.
Phantoms are used to study MRI systems without the need for human subjects. For such
purposes, MRI phantoms must have the following characteristics: (1) relaxation times
equivalent to human tissues; (2) dielectric properties equivalent to human tissues; (3)
homogenous relaxation times and dielectric properties throughout the phantom; (4) sufficient
strength to fabricate a torso without the use of physical reinforcements; (5) possible to
fabricate in the shape of human organs; (6) ease of handling; and (7) chemical and physical
stability over an extended time. [71]. In recent years, there have been many studies on tissue-
mimicking polymers for calibration phantoms of medical imaging modalities. In the
following section, the properties of various polymer gel materials are described in detail.

27
2.3.5.1 Carrageenan
ageenan is a polysaccharide that can be extracted with hot water from Chondrus, Gigartina,
Eucheuma, Furcellaria, and Phyllophora. There are three main carrageenans: κ-carrageenan,
ι-carrageenan, and λ-carrageenan. All three types can be prepared in a solution with
concentrations of up to 10% in water above 70°C. Similar to agar, carrageenan gels are
thermally reversible, so they melt when heated above 55–85°C. The gel strength and
viscosity of the carrageenan solution increase nonlinearly with the concentrations of
carrageenan [72]. Kato et al. [73] found that carrageenan is ideal for providing gel phantoms
with sufficient mechanical strength, and has little impact on the T1 and T2 relaxation times. In
addition, Yoshimura et al. [74] asserted that carrageenan has a higher elasticity and is less
brittle than agar gel. These mechanical properties enable the gels to be molded into a range of
different shapes. This particular study uses 3% carrageenan and 1% agarose to make a body
phantom for a shape-retaining capability test. The gel was found to suffer minimal sagging
under its own weight, and was thus deemed appropriate for creating a phantom that is capable
of retaining its shape. Similar to agar, carrageenan phantoms are prone to water loss, which
leads to changes in the T1 and T2 relaxation times. The above study mentioned that a good
seal around the container can minimize water loss, but the long-term stability of the phantoms
is yet to be explored. Despite the common water evaporation problem, carrageenans are
among the most suitable materials for creating a phantom, since they are easy to handle,
transparent, have a minimal effect on T1 and T2 relaxation times, and offer reliable
mechanical strength [74].
2.3.5.2 TX-150 and TX-151
One of the earliest variations of polymer gel phantoms was created by using a polysaccharide
material. A study conducted by Groch et al. [75] described the development of a novel
phantom material named polysaccharide, which is a natural structural element of tissue cell
walls and connective tissues. The study claimed that polysaccharides have an advantage over
animal gelatin or agar in that they can be cast at relatively low temperatures (5–l0°C) and
produce phantoms with contiguous regions of differing relaxation properties. A modified
polysaccharide, TX-151, is more realistic, inexpensive, and easy to mold compared to TX-
150. Mazzara et al. [76] demonstrated that TX-151 can be used to fabricate tissue-equivalent
material to mimic the human breast. Furthermore, the study revealed that this novel
polysaccharide material experiences temporal changes in T1 and T2 relaxation times.

28
Refrigerated samples exhibit smaller changes in T1 and T2 values than room temperature
samples, and sealed samples perform better in maintaining their T1 and T2 values. [76]
2.3.5.3 Polyvinyl Alcohol Cryogel
Polyvinyl alcohol cryogel is considered to be one of the most promising water-based
polymers, as it exhibits a similar texture and has the mechanical and imaging properties of
soft tissues. It is a nontoxic, water-soluble polymer that is synthesized from polyvinyl acetate
through hydrolysis to remove the acetate groups. The liquid PVA solution undergoes an FTC
in which it freezes to a set temperature at a specific rate and is then thawed to room
temperature. The number of FTCs transforms the liquid PVA solution into an elastic, semi-
opaque gel known as PVA-C. The mechanical and imaging properties of PVA-C vary with
the number of FTCs.
In recent years, several research groups have focused on fabricating PVA-C phantoms
for different modalities. For instance, PVA-C was adapted by Mano et al. [77] into gels of 70,
75, 80, and 85% water content, and the resulting 1H density, T1 and T2 values were measured.
They also studied the effect of adding Ni2+ and graphite at different concentrations. It was
found to be difficult to obtain a combination of T1 and T2 values that correspond to living
tissue over a wide range. The long-term stability of the PVA gels was also examined, with
1% weight reduction and T1 and T2 value reductions of 4–12% after six months.
2.4 Multimodal imaging Medical imaging plays an important role in the field of healthcare, both in clinical settings
and for research and development. It is used in the prevention and early detection of disease,
in choosing the optimal treatment, during surgical interventions, and for monitoring the
treatment effects. In recent years, noninvasive multimodal imaging has become standard
clinical practice, and is rapidly changing the evolving field of molecular imaging. As a result,
researchers and engineers from fields such as molecular pharmacology and nanotechnology
have worked together to enhance the state-of-the-art. Multimodality imaging involves the
incorporation of two or more modalities within the setting of a single examination. For
example, US or optical studies can be performed within MRI, SPECT, or x-ray CT
environments. Clinically, the best examples of rapidly evolving multimodality imaging are
the PET-SPECT and PET-CT scanner hybrids. The use of PET in single, hybrid, and

29
multimodal imaging methods is a result of the functional and anatomic information it
provides.
The role of multimodal imaging is to identify the exact localization, extent, and
metabolic activity of the target tissue, yield the tissue flow and function or functional changes
within the surrounding tissues, and highlight any pathognomonic changes leading to eventual
disease. Newer tools that possess the potential to be integrated in multimodal utilities include
near-infrared spectroscopy or optical imaging for real-time assessment of wavelength specific
absorption of photons by oxygenated and deoxygenated tissues. Two-dimensional
electroencephalography and magnetoencephalography techniques, as well as functional MRI,
also exhibit potential for multimodal imaging. [78]
Despite considerable advances over the past few decades, rapid changes in technology
and the variety of imaging parameters that differ between manufacturers have restricted
further development. Furthermore, to allow the development of image-guided therapeutic
interventions and diagnostic imaging techniques and systems, phantoms that simulate human
or animal tissue are required.
As mentioned above, there has been intensive research on combining several imaging
modalities to provide morphological and functional image data that can be divided in several
ways to provide the necessary data. For visual fusion, images obtained from two independent
acquisitions are displayed and analyzed side by side by an observer. This method is time-
consuming, and the success of revealing additional information from two independently
acquired images depends on the experience and skill of the observer. However, this method is
widely used, since it requires no technical infrastructure and is cost-effective. The use of
software fusion techniques is increasingly attractive, as these use fully automated algorithms
and computing power, which provide a time-effective workflow. [79] Software-based fusion
typically employs fiducial markers or contour-finding algorithms to determine landmarks
within both images and find the “best fit” with the fewest discrepancies. Since this is a rigid
fusion, any distortion caused by patient repositioning or the movement of internal organs
makes it difficult to accurately fuse the images [80]. More advanced non-rigid transformation
techniques often require manual user assistance, and are therefore more time-consuming. To
reduce the probability of patient or organ movement during scans, multimodality imaging can
be used. In this case, both modalities are physically mounted next to each other, and they are
fully integrated into one device with a fixed and known transformation matrix. Since the
patient bed is transferred from one to the other modality, the movement of the patient is
minimized. However, to minimize the movement of internal organs over longer scan times,

30
advanced non-rigid image fusion algorithms should be adopted to ensure higher accuracy. In
the following section, the theory, potential, and limitations of PET/CT and PET/MRI are
discussed.
2.4.1 Positron emission tomography (PET)/Computed Tomography (CT)
Positron emission tomography is one of the most meaningful functional imaging technologies
because of its high sensitivity in the picomolar range, as well as its ability to observe
metabolic processes over time and track radiolabeled bio-markers. Although PET data are
very quantitative, they lack spatial resolution and do not provide sufficient anatomical
information. This limitation often requires additional morphological data to provide more
accurate oncological diagnosis, tumor staging, or radiation therapy planning. [82, 83] Thus,
x-ray CT is used to provide anatomical information to the PET data, since this technique is
well established in the field of clinical oncological imaging and provides very good spatial
resolution. In general, hybrid PET/CT devices are basically the two individual devices
mounted next to each other, with a patient bed to transfer the patient from one device to the
other controlled by one computer console (see Fig. 2.8). A very fast CT projection scan is
used for anatomical orientation and to plan the examination regions for the PET and CT
scans. After planning, low-dose or diagnostic CT scans are performed. Following the CT
scans, PET images are acquired in a multi-bed position mode to cover the whole body of the
patient. Special fusion software is then implemented to overlay the acquired image datasets.
Usually, when gamma rays penetrate through tissue, there is a known probability that they
will be absorbed. This is called attenuation, and leads to a subsequent quantification error. In
PET/CT systems, the CT scan can be used for attenuation correction. These data are acquired
at a lower energy, typically 80–120 keV, and up-scaled to the tissue absorption factors at 511
keV. The CT can be performed much faster than conventional transmission scans, resulting in
a drastic reduction of the overall examination time. Thus, PET/CT systems provide
anatomical information within a shorter examination time than conventional PET. [84, 85]
The use of a combined PET/CT system enables tumor detection and staging as well as
therapy monitoring and planning in a single device. Several studies have shown the clear
advantage of combined PET/CT over PET or CT alone or when carried out side by side. A
study by Antoch et al. [86] that considered 260 patients with different tumor diseases
revealed that the staging accuracy was 84% when combined PET/CT was used, compared
with an accuracy of only 76% when images were evaluated side by side. The staging
accuracy was only 63% (64%) when CT (PET) information was used alone. In addition,

31
PET/CT exhibits great potential for the planning of radiation therapy, especially when tumor
regions are difficult to define. With both PET and CT information, a more accurate definition
of irradiation regions is possible. Areas showing high tumor activity in PET images may not
necessarily be detected by CT, and might thus be overseen by conventional therapy planning
based on CT alone. Furthermore, tissue appearing as lesion expansion in CT may be
indicated as benign in a PET scan, and thus not irradiated. [87]
Figure 2.5. Schematic workflow of the PET/CT examination. (a) A fast scout scan to determine examination
regions for PET and diagnostic CT. (b)The acquisition of either a low-dose or diagnostic CT scan. (c) PET data acquired at multiple bed positions, reconstructed and corrected for attenuation. (d) PET and CT images are
registered and displayed as fused images. [78]

32
2.4.1.1 Potential and Limitations of Combined PET/CT
Besides the shorter scan times available with PET/CT systems, the CT-based attenuation map
also produces better statistics. Therefore, a lower noise contribution than conventional
attenuation is measured with 511 keV gamma sources. Despite these advantages, in regions
with high-density materials, such as inlays or obese patients, CT causes beam-hardening
artifacts whereby the lower x-ray energy attenuates more than the high energies, resulting in a
shift of the polychromatic x-ray spectra to higher energies. This effect can cause significant
artifacts in the CT images, and lead to false attenuation values for the PET images.
2.4.1.2 Co-registration Errors
Shorter scan times result in increased patient comfort and a reduced probability of
misalignment of the PET and CT data caused by patient-induced motion artifacts. However, a
significant time-window remains between the CT scan and the last PET bed position. To
avoid patient motion during the acquisition, comfortable and secured patient bedding is
mandatory.
2.4.1.3 Breathing Artifacts
Breathing artifacts represent another source of misaligned PET and CT data. Computed
tomography scans are usually very fast and can be acquired during inspiration according to
standard diagnostic CT scan protocols. However, PET scans are acquired over several
minutes while the patient breathes normally. This can lead to a mismatch between the PET
and CT data, especially around the diaphragm, thorax, and abdomen. To avoid such artifacts,
examination protocols use instructed respiration cycles (mid-expiration, breath-hold) or CT
scans during normal respiration. [89, 90]
2.4.1.4 Contrast Agents
Diagnostic CT usually requires the intake of contrast agents either intravenously or orally.
Contrast agents help to distinguish the vascular system and digestive tract from other soft
tissue. However, the effects of CT contrast agents are not included in the linear scaling model
for calculating PET attenuation correction data from x-ray absorption factors. These contrast
agents contain iodine and range from 100–1000 HU. [85] The contrast-enhanced structures
are considered as bone in the attenuation map, which might lead to a false PET attenuation
correction if the PET/CT examination protocols are not adjusted accordingly.

33
2.4.2 Positron Emission Tomography (PET)/ Magnetic Resonance Imaging (MRI)
As mentioned in the previous section, the use of PET/CT systems introduces advantages such
as more accurate diagnosis and shorter scan times. However, CT cannot achieve adequate
soft-tissue contrast. If the contrast agents or CT radiation dose is not applied, the morphology
and image quality is insufficient for clinical purposes. On the other hand, MRI provides
excellent soft-tissue contrast in regions such as the brain or abdomen. In addition, MRI
examinations do not require the use of ionizing radiation, thus minimizing the radiation dose
to the patient. [91, 92]
2.4.2.1 Technical Challenges
However, it is a challenge to combine two modalities without compromising their
performance or causing mutual interference. One of the main challenges in merging the
hardware of PET and MRI into a single device is that conventional PET detector designs use
photomultiplier tubes to detect light. The functional principles of accelerating electrons in a
strong electric field inside a vacuum tube mean that these photomultiplier tubes are very
sensitive to magnetic fields. If PET and MRI are combined for simultaneous use, both fields
of view have to be physically aligned. This means that the PET detectors need to be built
within the MRI bore, resulting in very limited space for the PET detectors. To combine PET
and MRI, alternative PET detectors have been studied.
The avalanche photodiode (APD), which was developed as an alternative light detector,
which is capable of detecting very small amounts of scintillation light. [93-95] Although the
internal gain of an APD is only of order 100–1000 and a charge-sensitive preamplifier is
needed to obtain a readout, APDs provide sufficiently fast and low-noise electrical signals.
APDs are known to be insensitive to magnetic fields and have a very small size. However,
for combined PET/MRI, the charge-sensitive preamplifiers require very careful design to
avoid potential interference with the MRI radiofrequencies or gradients.
Furthermore, MRI requires a homogeneous static magnetic field; materials inside the
detector interacting with the magnetic field may cause distortions, which will show up as
artifacts. Using a PET detector inside a magnet requires the insertion of different materials,
such as scintillator crystals, a light detector, electronics, and electronic shielding materials.
These different components must be magnetically compatible with susceptibilities close to
that of human tissue to maintain acceptable MRI performance. Most of the material-related

34
MRI artifacts can be avoided if the PET detector is located outside the RF probe and
preserves a certain distance to the object. Additionally, electronic components such as
capacitors, amplifiers, and resistors must be nonmagnetic, and large solid areas of metal
should be avoided.
2.4.2.2 PET/MR Development
Unlike the simple combination of PET/CT, PET/MRI involves major modifications,
especially to the PET detector technology. The three basic concepts of combined PET and
MRI are shown in Fig. 2.9. First, the simplest approach is to mount the PET and MRI side by
side. This design results in limited latitude for the data acquisition. The major drawback is
that the scans cannot be performed simultaneously. Since MRI is much slower than CT
imaging, this increases the examination time. This issue also rules out the possibility of
acquiring two different sets of information simultaneously from PET and MRI. To achieve
simultaneous PET/MRI data acquisition, the PET detector must be fully integrated inside the
MRI scanner. In general, there are two different ways to construct an integrated PET/MRI
scanner: the first method of inserting a PET detector in a standard MRI (Fig. 2.9(b)) will
drastically reduce the bore size, but does allow the MRI scanner to be used without PET; the
second technique of fully embedding the PET detector into the MRI scanner hardware
maintains a larger clear MRI bore (Fig. 2.9(c)), but this preferable solution represents the
most expensive and challenging PET/MRI system.
Figure 2.6. Potential realizations of PET/MRI scanners. (a) PET/MRI side by side. Two individual devices are
mounted back-to-back and have a common control unit. (b) PET inserted within an MRI; the bore size is drastically reduced and the PET detectors have to be compact. (c) PET detector embedded into an MRI system.
Both devices are merged together into one multimodality scanner. [78]

35
2.4.2.3 PET Attenuation Correction based on MRI Data
As discussed for PET/CT systems, accurate PET quantification requires mandatory correction
of the 511-keV photon attenuation caused by the tissue. In contrast to PET/CT, where the CT
image data provide an attenuation map for the PET images, MRI image data contain
information about the tissue proton density. The proton density does not necessarily reflect
the photon attenuation probability; thus, a simple re-mapping of the MR signal intensities
would not provide accurate PET attenuation correction. There are several approaches for
deriving PET attenuation data for a combined PET/MRI scanner from the MRI data. These
include regional segmentation of the images into body regions and organs, [96] and support
vector machines [97]. However, it is still unclear which attenuation correction approach is
better for PET/MRI data.
The original aim of combining PET and MRI as a dual-mode imaging system was to
overcome the weaknesses of existing PET/CT systems, namely the lack of soft-tissue contrast
and relatively high radiation dose from CT. However, not only does MRI offer high-quality
anatomical images with high soft-tissue contrast, but also functional information such as
fMRI and proton spectroscopy. Therefore, the potential for PET/MRI extends beyond tracer
uptake and morphology towards multifunctional imaging.
2.4.3 Phantom Materials
2.4.3.1 Agarose
Huber et al. [98] fabricated a phantom for transrectal ultrasound (TRUS) combined with PET,
CT, and MRI. This TRUS was found to provide good anatomical detail of the prostate region
and accurate measurements of the prostate volume. Two basic tissue-mimicking materials
were fabricated for high- and low-scatter US with different concentrations of agarose, gelatin,
and deionized water, with the addition of GeCl4 radioactivity in a 0.5 molar hydrocholoric
acide (HCl) solution for repeated PET imaging. The PET-TRUS prostate phantom did not
exactly mimic the PET and TRUS properties of the prostate region, but as this phantom was
only used to validate image co-registration, it was sufficient for interventional procedures
such as brachytherapy. The diffusion of the 68GeCl4 molecules rendered this phantom
unsuitable for long-term use. The mechanical properties appeared stable, and there was no
sign of bacterial or fungal invasion in the phantom when stored at room temperature for ten
months.

36
2.4.3.2 Polyvinyl Chloride
Hungr et al. [99] attempted to fabricate a deformable phantom for prostate cancer to help
robot-assisted image-guided needle insertion. The imaging modalities of US, CT, and MRI
are most commonly used for prostate techniques. The objective of this study was to improve
the anatomical realism, adapt the phantom for transrectal US applications, and ensure its
multimodality applicability while satisfying the required mechanical and imaging
characteristics. Six common base materials were considered for phantom construction,
including agarose, gelatin, PVA-C, polyvinyl chloride (PVC), silicone, and the proprietary
commercialized material of Zerdine (CIRS). However, agarose and gelatin were found to be
too fragile, the CIRS phantoms exhibited no evident deformation during needle insertion and
are expensive, PVA-C has a long, complex preparation procedure, and silicone has
inappropriate acoustic properties. Thus, PVC was used for phantom fabrication, and the SOS,
stress–strain relationship, storage methods, imaging, needle-insertion force, and
deformability characteristics were evaluated. The average SOS in the phantom was 1380±20
m/s, and the stress–strain relationship was found to be viscoelastic, which is within the range
of typical prostatic tissues. The phantom had a clearly distinguishable morphology in all three
imaging modalities, with embedded targets that could be precisely segmented, resulting in an
average US-CT rigid registration error of 0.66 mm, as illustrated in Fig. 2.10. The mobility of
the phantom prostate upon needle insertion was 2–4 mm, with 0–2 rotations. These
mechanical and imaging characteristics remained stable at cooler storage temperatures.
2.4.3.3 Polyvinyl Alcohol Cryogel
Chen et al. [100] fabricated a PVA-C brain phantom for multimodal imaging using the
Colin27 brain dataset. The objective of this study was to simulate anatomically accurate
cortical structures using a mold fabricated by stereolithographic printing, recreate the texture
of live human cerebral tissues, and obtain CT, US, and MR images. To increase the
backscattering of sound waves in US imaging, commercial-grade talcum powder was added
to the phantom. Powdered barium sulfate (BaSO4) was used as a contrast agent in CT
imaging, and CuSO4 was used to increase the contrast in T1 and T2 weighted images. A PVA-
C “tumor” was created using 4% PVA solutions with one FTC to test the guidance accuracy
in surgical procedures. It was found that 5% BaSO4, 0.2% CuSO4, and 5% talcum as contrast
agents in 8% PVA with two FTCs provided adequate contrast for CT, MR, and US,
respectively. However, the rheological and mechanical properties of these phantoms require

37
further investigation. Moreover, the MR contrast agent, CuSO4, diffuses from the spherical
tumor phantom into the surrounding tissue.
2.4.3.4 Silicone
Goldstein et al. [101] studied silicone gel for MRI, PET, and CT imaging phantoms. Silicone
gel has T1 and T2 values that are similar to the human tissue range and can easily be molded
into any shape. It is also easy to inject solutions into pre-molded cavities within the phantom
to produce regions with different contrast. The T1 and T2 relaxation time values were obtained
with different resin-to-catalyst ratios and different mixing times. The T1 values ranged from
430–500 ms and the T2 ranged from 50–130 ms. The corresponding CT number was 160 HU.
The gel sealed itself immediately after needle puncture, preventing any leakage back into the
puncture canal.
Chmarra et al. [102] also studied silicone as a potential multimodal phantom material.
The goal of their work was to develop a protocol and manufacture a multimodal liver
phantom. The main requirements for the phantom were its suitability for US, CT, and MR
imaging modalities; ease of production; standardized fabrication; low cost; and life-cycle
friendliness, i.e., re-usability of phantom parts and materials and avoidance of using toxic
resources. The phantom was fabricated with a silicone container, tumor tissue using agarose
gel, and liver parenchyma using candle gel and silicone string to mimic portal veins. The
researchers obtained US, CT, and MRI images, but could not produce an exact representation
of the portal and hepatic veins or various lesions.
2.5 Radiation Therapy Phantoms Radiation therapy uses high-energy radiation to shrink tumors and kill cancer cells. X-rays,
gamma rays, and charged particles are all used for the treatment of cancer. The radiation may
be delivered externally by a machine (external-beam radiation therapy) or from a radioactive
substance placed internally near to the cancer cells (internal radiation therapy, or
brachytherapy). Systematic radiation therapy uses radioactive substances, such as radioactive
iodine, that travel in the blood to kill cancer cells. Radiation therapy kills cancer cells by
damaging their DNA directly or creating free radicals within the cells that can in turn damage
the DNA. [103]

38
2.5.1 Radiation Therapy Planning
When a patient is diagnosed with cancer, a radiation oncologist develops a treatment plan
through a process called treatment planning. This process begins with a simulation, during
which medical imaging such as CT, MRI, PET, or US is performed to locate the patient’s
tumor and the surrounding normal tissue. CT is most commonly used in treatment planning.
During the simulation, the patient must repeatedly take exactly the same position relative to
the machine delivering the treatment. Body molds, head masks, or other devices may be
constructed to make it easier to position the patient. Radiation doses for cancer treatment are
measured in grays (Gy), which are defined as the number of joules of radiation energy
absorbed by one kilogram of human tissue. Different doses of radiation are needed to kill
different types of cancer cells.
2.5.1.1 External-beam Radiation Therapy
External-beam radiation therapy is usually delivered in the form of photon beams (i.e., x-rays
or gamma rays). Many types of external-beam radiation therapy are delivered using a
machine called a linear accelerator, which uses electricity to form a stream of fast-moving
subatomic particles. This high-energy radiation may be used to treat cancer over the course of
several weeks. Common types of external-beam radiation therapy are 3D conformal radiation
therapy (3D-CRT), intensity-modulated radiation therapy (IMRT) [104], image-guided
radiation therapy (IGRT) [105], tomotherapy [106], stereotactic radiosurgery, stereotactic
body radiation therapy [107], and proton therapy [108]. During IGRT treatment, repeated
imaging scans (CT, MRI, or PET) are performed to identify the change in tumor size and
location from the planned radiation dose, enabling a future treatment plan to be formulated.
2.5.1.2 Internal Radiation Therapy
Internal radiation therapy (brachytherapy) is radiation delivered by radioactive substances
that are placed within or on the body. [109] Radioactive isotopes may be sealed in pellets that
are placed inside the patient using delivery devices such as needles, catheters, or other types
of carrier. As the isotopes decay, they give off radiation that damages nearby cancer cells.
There are three types brachytherapy. Interstitial brachytherapy uses a radiation source placed
within tumor tissue. Intercavity brachytherapy uses a source placed within a surgical cavity
near a tumor. Episcleral brachytherapy uses a source that is attached to the eye to treat
melanoma inside the eye.

39
2.5.1.3 Systemic Radiation Therapy
In systemic radiation therapy, a patient swallows or is injected with radioactive material, such
as radioactive iodine or a radioactive substance bound to a monoclonal antibody that helps to
accurately locate and kill the tumor cells.
2.5.2 Radiation Phantoms
The successful use of high-energy external beam radiation for therapeutic purposes depends
on the spatial distribution of the absolute dose within the patient. Since the therapy is three-
dimensional in nature, particles not only affect the immediate interaction site but also the
surrounding, healthy tissues. Thus, precise knowledge and control of the dose distribution is
critical to maximize the therapeutic effect of the radiation. To ensure the accuracy of the
imaging data and dose deposition, phantoms are used to investigate the effects of radiation
beams. Phantom materials range from water to complex chemical mixtures that mimic how
the human body interacts with radiation.
There are two primary uses of therapeutic dosimetry phantoms: (1) characterization and
calibration of delivered external radiation beams, and (2) validation of numerical dose
modeling and design through treatment planning. Ideally, the dose distribution could be
measured within a patient in real time during beam delivery, enabling the dose to be adjusted
as necessary. The advantages of using a phantom are that the object can receive repeated
doses and can be created in various geometries and densities to allow for the interpretation of
measurements for comparison with calculations.
There are several design goals for therapeutic dose measurements from both a material and
geometry perspective:
1. Similarity to tissue so that the dose to tissue can be estimated from the measurements 2. Ease of traceability to reference standards 3. Composition that can be well characterized by radiation type and energy and is
reproducible 4. Robustness to radiation damage 5. Ability to accommodate various beam field sizes and shapes in an accurate and
efficient manner
Dosimetry phantoms can be divided into water and non-water categories. Water is
commonly used because it is contained in major tissue components and is suitable for
calibration standards. The non-water materials are used for setup efficiency, compatibility
with film, and as a component for integrated phantoms.

40
Furthermore, with surgical placement and practices, phantoms specific to
brachytherapy are needed for image evaluations. Many of the imaging modalities used within
radiation therapy clinics for external-beam radiography, such as x-ray, CT, and MRI, are also
available for brachytherapy.
2.6 Summary In this chapter, several modalities and their phantoms have been discussed. As each modality
functions with different background physics and imaging parameters, the functions of the
phantoms vary. In the following chapters, we will discuss several materials that can be used
to construct multimodal imaging phantoms for use in MRI, CT, and US.

41
3 Mechanical Stability Analysis of Carrageenan-Based Polymer Gel for MRI Liver Phantom with Lesion Particles
3.1 Introduction In this study, soft-tissue-equivalent carrageenan-based polymer gel is fabricated and its
mechanical and imaging properties are determined. These properties include the density,
dielectric constant, and modulus values, as well as MRI relaxation times and CT numbers.
These properties are observed over a prolonged period to analyze the stability of the
materials. Since carrageenan gels consist of almost 97% water, certain properties are
susceptible to fluctuation over time, possibly because of water evaporation during storage.
Finally, an MRI phantom is fabricated from carrageenan gel with small particles to represent
liver lesions.
3.2 Motivation and Objectives Among medical imaging modalities, MRI is recognized as the most advanced for detailed 3D
visualizations of the internal structures and soft tissues of the body. Unlike imaging methods
such as x-rays and CT, MRI does not utilize ionizing radiation, and therefore the harmful side
effects associated with prolonged exposure to radiation are eliminated. Physicians can use
MRI to detect and evaluate lesions, multiple sclerosis, tumors, and strokes within soft tissues.
The technology involved in MRI has improved over recent decades, leading to enhanced
image quality and various diagnostic techniques and image-guided therapy. To ensure an
accurate diagnosis, MRI requires regular systematic calibration of the equipment using a
phantom that mimics human tissue. An imaging phantom is a calibration medium that is
scanned or imaged to evaluate, analyze, and tune the performance of various imaging
devices. A phantom used to evaluate an imaging device should respond in a manner similar
to that of human soft tissue in the specific imaging mode. Currently, a normal human patient
is used for imaging calibration, but this process is time-consuming, costly, and does not
Chapter 3

42
provide consistent values suitable for calibration. Therefore, a phantom that behaves similarly
to human soft tissue functions as a replacement.
The optimal characteristics of MRI phantoms used for such purposes are as follows: (1)
relaxation times equivalent to those of human tissues, (2) dielectric properties equivalent to
those of human tissues, (3) relaxation times and dielectric properties that are homogeneous
throughout the phantom, (4) mechanical properties suitable for fabricating a human torso
without the need for reinforcement, (5) able to form shapes of human organs, (6) easy to
handle, and (7) stable physical and imaging properties over an extended period. [73]
Over the past few decades, several studies have been conducted on water-based polymer
gels with paramagnetic ions as potential materials for MRI phantom materials. Paramagnetic
ions (i.e., CuSO4, NiCl2, MnCl2, and GdCl3) are known to improve the visibility of internal
body structures in MRI by altering the T1 and T2 relaxation times. The T1 and T2 relaxation
times represent the rate at which the longitudinal and transverse components of the
magnetization vector of human tissue return to their thermodynamic equilibrium. Some
polymer gels that have been investigated include agarose, [72, 110, 111] agar, [112, 113],
PVA, [114] gelatin, [77] and polysaccharide gels TX-150 [75] and TX-151 [76]. These
materials have the potential to be used in phantoms, but are limited by their fragility and
storage issues.
Similar to the materials stated above, the viability of carrageenan-based gel as an MRI
phantom material has been studied. [73] The results demonstrated that, by varying the
concentrations of carrageenan and a modifier, the T1 and T2 values could be modified to
match those of human tissues. However, no studies have investigated the mechanical stability
of carrageenan-based materials, except for a brief report on fungal growth over time. Because
carrageenan gels have a high water content, their properties may fluctuate with time due to
the continuous cycles of water expulsion and absorption. For the purpose of
commercialization, it is essential that the material properties of a phantom, such as the
density, elastic modulus, and T1 and T2 relaxation times, remain stable owing to the required
long shelf life. If the properties of a phantom varied with time, false results would be
obtained when used to evaluate the performance an MRI system.
Therefore, the objective of this study is to identify changes in the properties of a
carrageenan-based gel phantom by investigating its stability over a six-week period. A
carrageenan-based liver phantom was fabricated by the copolymerization of carrageenan, and

43
agar and gadolinium-diethylenetriamine pentaacetic acid (Gd-DTPA) were used as T1 and T2
modifiers. To investigate the effects of the polymer and modifier on the structural integrity
and relaxation times of the phantom, eight material samples with different concentrations of
the polymer and modifier were fabricated and characterized. The sample densities and
chemical, dielectric, mechanical, and imaging properties (relaxation times and CT number)
were determined and compared with those of human tissue. The properties of each sample
were measured and analyzed to assess their stability for MRI phantom application.
Furthermore, a polymer-based liver phantom was fabricated with embedded lesion particles
(i.e., cyst, hemangiomas, and tumors). The lesions are spherical particles of 1–10 mm
diameter that are randomly distributed between layers of phantom material.
3.3 Experimental Setup
3.3.1 Experimental Materials
Polymers with two gelling agents, namely carrageenan and agar, were used for the study.
Commercial-grade type-1 carrageenan (Sigma Life Science) was used as a gelling agent, and
agar (BioShop) was used as both a gelling agent and T2 modifier. Gd-DTPA Omniscan
gadodiamide injection ISP 287 mg/ml (0.5 mmol ml) (GE Healthcare) was used as the T1
modifier. Table salt was used to enhance the conductivity, and NaN3 was employed as an
antiseptic to prevent the polymer gel from deteriorating over a prolonged period.
3.3.2 Fabrication of Carrageenan-based Polymer Gel
The polymer gel samples were fabricated in test tubes prior to the phantom study for
characterization. Different degrees of cross-linking were achieved using various amounts of
the gelling agents. One-hundred mL of deionized water (DI) was heated to 70–85°C in a 150
ml beaker. A parabolic-shaped glass lid was placed on top of the beaker to minimize
evaporation during heating. Eight different samples with various concentrations of
carrageenan (1–3 wt%) and agar (0–1.5 wt%) were fabricated by pouring a powder mixture
of carrageenan and agar into the heated water. The solution was stirred to obtain a
homogeneous solution of the powder, and 1.7 µL of Gd-DTPA was dropped into the solution
via a micropipette (Finnepipette). The sample compositions are listed in Table 3.1. After
mixing for approximately 30 min to ensure homogeneity, the gel mixture was poured into a

44
15 mL glass test tube and set at room temperature for 30 min for cooling and to remove air
bubbles. Parafilm was used to seal the open end of the glass test tube to minimize water
evaporation during storage. The samples were then stored in a refrigerator at 4°C, and
changes in their properties were observed.
Table 3.1 Contents of carrageenan, agar, GdCl3, and water in the polymer gel samples
Sample Carrageenan
(g)
Agar
(g)
GdCl3
(µL)
H2O
(mL)
Sample Carrageenan
(g)
Agar
(g)
GdCl3
(µL)
H2O
(mL)
1 3.0 0.0 1.7 97 5 2.5 1.5 1.7 96
2 3.0 0.5 1.7 96.5 6 2.0 1.5 1.7 96.5
3 3.0 1.0 1.7 96 7 1.5 1.5 1.7 97
4 3.0 1.5 1.7 95.5 8 1.0 1.5 1.7 97.5
3.3.3 Characterization
The polymer gel samples were categorized according to their chemical properties,
mechanical properties (density and compressive modulus), dielectric properties (conductivity
and permittivity), and imaging properties (T1 and T2 relaxation times and HUs). Three
samples of each were tested to examine the repeatability.
3.3.3.1 Chemical Properties of carrageenan-based polymer gel
Fourier Transform Infrared Spectroscopy (FTIR) was performed with a Bruker Alpha FT-IR
spectroscope to analyze the spectrum of the polymer gel.
3.3.3.2 Mechanical Properties of carrageenan-based polymer gel
The density of the polymer gels was compared to that of real human tissue, known to be 1.03
g/cm3. [115] The relationship between the material composition and density of the polymer
gel can be established to match the real human tissue density. The density of each gel sample
was determined by dividing its mass by its volume. This procedure was carried out over the
testing period to monitor any density change in the polymer gels stored in the refrigerator.
The compressive modulus was measured using an Instron compression-testing machine
with a 500 N load cell in accordance with ASTM standards. [116] With regards to the
polymer gel, a significant correlation can be found between the compressive modulus and the

45
ability for the polymer gel to retain its shape. A cylindrical disk was cut from the mold in size
of 16mm diameter and 10mm height. A 2cm × 2cm piece of Kimwipe was placed on the test
plate to prevent the sample from slipping away during the experiment. The cylindrical disk
samples were placed on the compression testing plate and a 500 N load cell was slowly
lowered until it made contact with the sample. The contact between sample and the plate was
ensured by slowly moving the plate down until the Instron detects the load. The compression
test, which was conducted after calibration, was conducted with a 500N load cell at a rate of
1 mm/min. A significant correlation was observed between the compressive modulus of the
polymer gel and its ability to maintain its shape without sagging or distortion.
3.3.3.3 Dielectric Properties of carrageenan-based polymer gel
The dielectric properties of a material, such as its conductivity (σ) and permittivity (ε), vary
with the test frequency range. Gabriel et al. [117] studied the dielectric properties of
biological tissue in a frequency range of 10Hz–20 Hz (see Table 3.2). As listed in the table,
muscles and high-density tissues have relatively high conductivity and permittivity. On the
other hand, low-water-content tissue, such as adipose or fat, has comparatively low
permittivity and conductivity values. As the frequency increases, it was found that the
permittivity decreases and the conductivity increases.
Table 3.2. Dielectric properties of human organs [117]
Organs Conductivity Range (S/m) Permittivity Brain (Grey Matter) 1.0e-1 – 1.0e+1 1.0e+2 – 1.0e+6 Heart Muscle 1.0e-1 – 1.0e+2 1.0e+2 – 1.0e+7 Kidney (Cortex) 1.0e-1 – 1.0e+2 1.0e+2 – 1.0e+8 Liver 1.0e-2 – 1.0e+1 1.0e+1 – 1.0e+7 Lung 1.0e-2 – 1.0e+1 1.0e+1 – 1.2e+7 Spleen 1.0e-1 – 1.2e+1 1.2e+1 – 1.5e+7 Muscle (along) 1.0e-1 – 1.0e+1 1.0e+1 – 1.0e+8 Uterus 1.0e-1 – 1.2e+1 1.2e+2 – 1.2e+9 Skin 1.2e-4 – 1.0e+1 1.0e+1 – 1.0e+5 Adipose 1.0e-2 – 2.0e+1 2.0e+1 – 1.0e+7 Cartilage 2.0e-1 – 2.0e+0 1.0e+1 – 1.1e+3
The dielectric properties of the polymer gel samples were measured using a dielectric
Win DETA 5.64 (Novocontrol Technologies, Germany). The samples were cut to have flat
surfaces and placed between two gold plates to obtain accurate results. The gold plates were
placed in the dielectric equipment between two electrodes and secured by tightening the

46
sample mounting screw. The dielectric properties were measured over a frequency range of
1.0×10⁻¹–3.0×10⁵ Hz. [117]
3.3.3.4 Imaging Properties of carrageenan-based polymer gel
An MRI technician at Sunnybrook Hospital (Toronto, Canada) assisted the acquisition of the
imaging properties of the polymer gel samples. We examined the stability of the properties
over six weeks and assessed the viability of the polymer gels as MRI phantom materials. The
prepared samples in glass test tubes were arranged on a Styrofoam tube rack. The T1 and T2
relaxation times of the samples were obtained using a GE 3 Tesla MRI system with a 32-
channel head coil. The sample was placed inside the head coil of the MRI and aligned with
the guideline. Inversion recovery was applied to measure the T1 value, and spin echo was
used to determine the T2 sequence. To measure the T1 relaxation time, repetition time (TR)
values of 2400, 1700, 1000, 500, 300, 150, 90, and 50 ms were used. The T2 relaxation time
was measured using echo time (TE) values of 10, 20, 30, 50, 75, 100, 150, 200, and 300 ms
and TR of 2500 ms. The image resolution was 256×256 over a 16 cm field of view with a
pixel size of 0.625 mm and 5 mm slice thickness. After the MRI images of the polymer
samples had been obtained, a MATLAB algorithm was used to analyze the T1 and T2 values
for every pixel of an image and store them in a large matrix form. For this particular
experiment, a nonlinear least-squares fit equation was used to fit the test data to a high-order
polynomial. The following equations were used to obtain the T1 and T2 signal values for the
calculation:
S =M0 1− exp −TRT1
"
#$
%
&'
"
#$$
%
&'' ------------------------------(1)
S =M0 exp −TET2
"
#$
%
&' ------------------------------------(2)
where S is the signal intensity and M0 is the initial magnetization. [30] A set of eight different
samples was stored in a low-temperature refrigerator for six weeks and then tested under
MRI to examine the stability of the T1 and T2 values of the polymer gels over time. SNRs of
435–850 were calculated.
Computed tomography measurements were performed using wide-volume CT (Toshiba
320 MDCT Aquilion ONE, Toshiba Medical Systems, Japan). The samples were aligned and

47
attached to a template and placed perpendicular on the CT scanning platform. The scanning
conditions were set to use 0.5 mm detector collimation, 0.5 s gantry rotation time, 50 mA
nominal tube current, and tube potentials of 80, 100, 120, and 135 kVp. The images were
reconstructed using a single filter kernel with 1 mm sections at 0.5 mm intervals.
3.3.3.5 Polymer Gel Liver Phantom with Lesion Particles
Following the fabrication of the polymer gels, a liver phantom of 1 L volume was constructed
with embedded lesions, as illustrated in Fig. 3.1. First, spherical lesion particles with
diameters of 1–10 mm were pre-fabricated with different agar and carrageenan
concentrations. The molten polymer gel solution was extracted with a 10 mL syringe and
dropped into chilled oil. The chilled oil was composed of olive and castor oils to obtain high
viscosity, thus allowing the polymer gel particles to slowly sink to the bottom. As the
particles sink to the bottom of the oil beaker, they retain their spherical shape. The size of the
lesion particles can be varied according to the force exerted on the syringe. The size of the
spherical inclusions was measured after fabrication.
Figure 3.1. Schematic diagram of polymer gel lesion and phantom fabrication
To mimic the liver tissue, 1 L of polymer gel solution was prepared. A small amount of NaN3
was added as antiseptic material to enhance the quality of the phantom and prevent fungus
forming over time. A layer of polymer gel was poured into a plastic container of size 10 cm ×
10 cm × 10 cm, and this was placed in a vacuum chamber to remove air bubbles and then into
the freezer to quickly solidify. When the solution had solidified, pre-fabricated lesions of
different sizes were spread on top of the polymer gel layer. Another layer of molten gel was

48
slowly poured to avoid melting or disrupting the location of the lesions. Once four layers of
polymer gel had been stacked with lesion particles, a final layer was poured on top to cover
the phantom. The lesion placement and final phantom is illustrated in Fig. 3.2. The phantom
was stored in the refrigerator until it was ready to be imaged under MRI.
a) b)
Figure 3.2. (a) Spherical lesion particle placement and (b) a fabricated phantom with embedded lesion particles
3.4 Results and Discussion
3.4.1 Chemical Properties of carrageenan-based polymer gel
The compositions of the carrageenan gel samples were examined by FTIR, as shown in
Fig. 3.3. The samples exhibited similar IR peaks, such as the strong broad band at 3150–3350
cm-1, which corresponds to the O-H stretch, and a peak at 1640 cm-1, which indicated the
C=O stretch bond. The broad peaks reflect the high water content of the samples. The height
of the peak increased with increasing water content.
Figure 3.3. FTIR graph of carrageenan-based polymer gel
Frequency (Hz)
O-H Stretch C=O Stretch
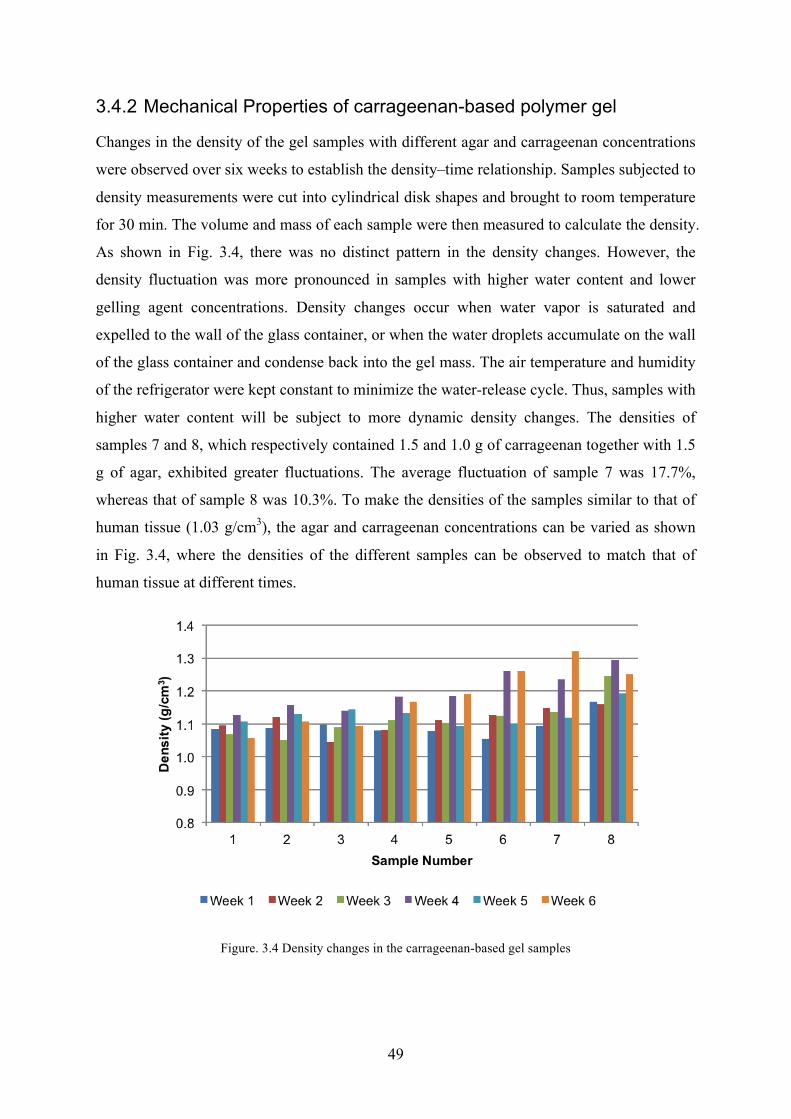
49
3.4.2 Mechanical Properties of carrageenan-based polymer gel
Changes in the density of the gel samples with different agar and carrageenan concentrations
were observed over six weeks to establish the density–time relationship. Samples subjected to
density measurements were cut into cylindrical disk shapes and brought to room temperature
for 30 min. The volume and mass of each sample were then measured to calculate the density.
As shown in Fig. 3.4, there was no distinct pattern in the density changes. However, the
density fluctuation was more pronounced in samples with higher water content and lower
gelling agent concentrations. Density changes occur when water vapor is saturated and
expelled to the wall of the glass container, or when the water droplets accumulate on the wall
of the glass container and condense back into the gel mass. The air temperature and humidity
of the refrigerator were kept constant to minimize the water-release cycle. Thus, samples with
higher water content will be subject to more dynamic density changes. The densities of
samples 7 and 8, which respectively contained 1.5 and 1.0 g of carrageenan together with 1.5
g of agar, exhibited greater fluctuations. The average fluctuation of sample 7 was 17.7%,
whereas that of sample 8 was 10.3%. To make the densities of the samples similar to that of
human tissue (1.03 g/cm3), the agar and carrageenan concentrations can be varied as shown
in Fig. 3.4, where the densities of the different samples can be observed to match that of
human tissue at different times.
Figure. 3.4 Density changes in the carrageenan-based gel samples

50
The mechanical properties of the elastic modulus and compressive strength were
measured to determine the compressive force that the gel samples could withstand while
retaining their shape. A cylindrical disk was cut from the sample in similar fashion to the
density measurements, and the elastic modulus was measured once per week over a six-week
period. Changes were observed in all samples, although the magnitude of this change varied.
As shown in Fig. 3.5, the modulus of samples with different agar concentrations fluctuated
more dramatically than that of samples with different carrageenan concentrations. For
example, the modulus of sample 4 initially increased by 25% from 0.51 to 0.64 MPa, but
dropped back to 0.45 MPa after three weeks. The modulus changes continuously with time,
and the fluctuation of the modulus values may be due to inconsistencies in the water content.
Although the samples were completely sealed with Parafilm and the container cap, they
continually release and absorb water vapor within the glass container. Thus, the rigidity of
each sample could change. Similar trends in the modulus were observed in samples with
different concentrations. It can be seen from Fig. 3.5 that samples with lower concentrations
of carrageenan, which acts as a gelling agent, had lower modulus values of about 0.1–0.4
MPa. The elastic modulus of normal liver tissue reported in the literature ranges from 6.4–60
kPa. [118]. Comparing the modulus values of liver tissue, the elastic modulus obtained from
carrageenan samples ranged from 0.13–0.66 MPa. The results are two orders of magnitude
higher than that of normal human liver tissue. Considering the wide range of modulus values
that can be achieved by varying the carrageenan and agar content, polymer gel can be tailored
to match the modulus of human liver tissue.

51
a)
b)
Figure. 3.5 Changes in elastic modulus of eight polymer gel samples over six weeks: (a) Samples with various agar concentrations (0.0–1.5 wt%); (b) Samples with various carrageenan concentrations (1.0–3.0 wt%)
Similarly, the compressive stress at maximum load of the samples, as determined by the
Instron compression test machine, exhibits some variations. As can be seen from Fig. 3.6, the
compressive stresses were highest for sample 1 (0.181 MPa) and lowest for sample 8 (151
kPa). This is understandable, as sample 1 had the highest carrageenan concentration, whereas
sample 8 had the lowest. Furthermore, the compressive strength fluctuated over time. In the
case of sample 1, the strength initially increased by 42% from 0.128 to 0.181 MPa, and then

52
decreased back to 0.171 MPa after six weeks. The percentage change in the compressive
strength was greatest for samples 1 and 8 (42% and 53%, respectively), which had the highest
water content.
Figure. 3.6 Compressive strength of eight polymer gel samples over six weeks
3.4.3 Dielectric Properties of carrageenan-based polymer gel
The conductivity (σ) and permittivity (ε) of soft human tissue can take a wide range of values
and vary with the test frequency. The dielectric properties of phantom materials need to be
similar to those of human tissue, because the homogeneity of the magnetic field depends on
the wavelengths of the tissue and air. The wavelength of an RF field in air is about 468 cm-1,
but is much higher in human tissue. If the wavelength of the RF field were different from that
in human tissue, it would create constructive or destructive interference with the transmitted
field, resulting in regional brightening or signal loss. [71] Thus, to achieve optimal
calibration, the dielectric properties of polymer gels should mimic those of human tissue. The
dielectric properties of the polymer gel samples were measured using a dielectric Win DETA
5.64 (Novocontrol Technologies) over a frequency range of 1.0×10⁻²–3.0×10⁵ Hz. Normally,
the dielectric test of human tissue is conducted using frequencies between 915 MHz and 2.45
GHz, [71] which is beyond the range of the machine. However, the results of the present test
show that the conductivity increased and the permittivity decreased with increasing frequency.
As shown in Fig. 3.7, the conductivity and permittivity of sample 4 exhibited no significant

53
changes over six weeks.
a)
b)
Figure. 3.7 (a) Permittivity and (b) conductivity of sample 4 over six weeks

54
3.4.4 Imaging Properties of carrageenan-based polymer gel
The T1 and T2 relaxation times of the samples were determined using a GE 3.0 Tesla head
MRI system, and their variation with time was investigated. The T1 and T2 maps of the
samples are shown in Fig. 3.8.
Figure. 3.8 T1 and T2 maps of polymer gel samples at week 3, generated by a MATLAB algorithm
Figure 3.9 compares the effects of the agar, carrageenan, and Gd-DTPA concentrations
on the relaxation times. Theoretically, carrageenan should not have any effect on the
relaxation times, because it was only used as a gelling agent. Higher concentrations of agar,
which was used as a T2 modifier, should give lower T2 values. Similarly, Gd-DTPA, which
was used as a T1 modifier, was expected to suppress the T1 values of the samples. The T1 and
T2 values varied among the samples according to the different carrageenan and agar
concentrations. For sample 5, the T1 values ranged from 186.56–232.41 ms, and the T2 values
were 72.43–88.77 ms. As expected, the T2 values for samples 1 and 4 were different. The T2
values for samples 6, 7, and 8 were similar, whereas that for sample 5 was much lower at 78
ms. As each sample had the same GdCl3 concentration, the T1 value was expected to remain
constant; however, it varied among the samples. These results indicate that the agar and
carrageenan concentrations can be used to further modify the T1 and T2 values. Therefore,
further study on the effect of the constituent concentrations on the T1 and T2 values should be
pursued to achieve polymer gels that mimic the T1 and T2 values of human tissue and lesion
particles given in Table 3.3. [68, 119-121]
T1 map T2 map

55
Figure. 3.9 T1 and T2 relaxation times of polymer gel samples after five weeks.
Table 3.3 T1 and T2 relaxation times of human tissues at 3T [68, 119-121]
Tissue T1 (ms) T2 (ms) Tissue T1 (ms) T2 (ms)
Liver 812±64 42±3 White matter 1084±45 69±3
Skeletal
Muscle
1412±13 50±4 Gray matter 1820±114 99±7
Heart 1471±31 47±11 Optic nerve 1083±39 78±5
Kidney 1194±27 56±4 Spinal cord 993±47 78±2
Cartilage 0° 1168±18 27±3 Blood 1932±85 275±50
Cartilage 55° 1156±10 43±2
Several studies conducted on other polymer gel phantoms have not revealed significant
changes in the T1 and T2 relaxation times when the phantoms were stored in tightly sealed
containers. [122] Thus, further time-sensitivity studies of T1 and T2 should be conducted
using more reliable storage systems.
The T1 and T2 relaxation times of sample 2 over six weeks are shown in Fig. 3.10. T1
changed by 29% (from 204.27 to 286.8 ms) over three weeks. However, T2 changed by 23%
(from 91.09 to 119.04 ms) in the first two weeks. These changes are notable because any
inconsistency in the relaxation times over a phantom’s lifetime could result in inaccurate
MRI calibration.

56
Figure. 3.10 T1 and T2 relaxation times of sample 2 over six weeks
A CT scan was also performed using a clinical Toshiba One Aquilion CT scanner to
confirm the HU values of the carrageenan gel samples. The CT numbers of gel samples 3–6
at 120 kVp are illustrated in Fig. 3.11. The values varied from 24.6–57.5 HU. There is no
correlation between the carrageenan and agar content and the HU values. These values
correspond to the value of kidney, muscle, blood, and liver. Tailoring the concentrations of
carrageenan, agar, and GdCl3 would enable samples to be produced for specific parts of
organs.

57
Figure 3.11.CT numbers obtained from Aquilion
3.4.5 Polymer Gel Liver Phantom with Lesion Particles
A 1-L volume phantom was constructed layer by layer as described in Sec. 3.2.3.5. Magnetic
resonance images were taken, and the T1 and T2 values were measured for both the phantom
and lesions, as shown in Fig. 3.12. We have successfully fabricated a phantom with
embedded lesion particles located randomly between the layers. The T1 and T2 values of the
lesions were obtained using a MATLAB program. The T1 values ranged from 411–766 ms
and the T2 values were 102–209 ms. Compared with the relaxation values in Table 3.3, these
results are closer to normal liver tissue. The relaxation times of liver cyst and hemangioma
can be obtained by changing the concentrations of carrageenan, agar, and Gd-DTPA in the
lesion solution. Despite the success of our liver phantom with lesion particles, several
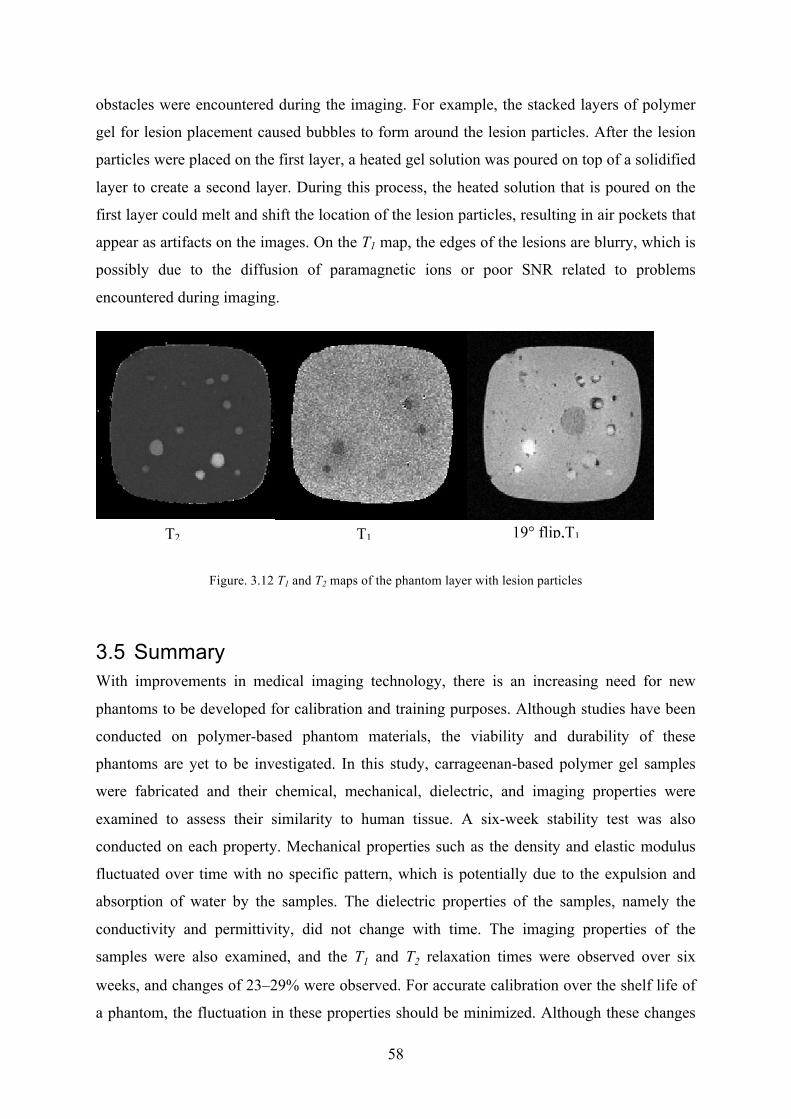
58
obstacles were encountered during the imaging. For example, the stacked layers of polymer
gel for lesion placement caused bubbles to form around the lesion particles. After the lesion
particles were placed on the first layer, a heated gel solution was poured on top of a solidified
layer to create a second layer. During this process, the heated solution that is poured on the
first layer could melt and shift the location of the lesion particles, resulting in air pockets that
appear as artifacts on the images. On the T1 map, the edges of the lesions are blurry, which is
possibly due to the diffusion of paramagnetic ions or poor SNR related to problems
encountered during imaging.
Figure. 3.12 T1 and T2 maps of the phantom layer with lesion particles
3.5 Summary With improvements in medical imaging technology, there is an increasing need for new
phantoms to be developed for calibration and training purposes. Although studies have been
conducted on polymer-based phantom materials, the viability and durability of these
phantoms are yet to be investigated. In this study, carrageenan-based polymer gel samples
were fabricated and their chemical, mechanical, dielectric, and imaging properties were
examined to assess their similarity to human tissue. A six-week stability test was also
conducted on each property. Mechanical properties such as the density and elastic modulus
fluctuated over time with no specific pattern, which is potentially due to the expulsion and
absorption of water by the samples. The dielectric properties of the samples, namely the
conductivity and permittivity, did not change with time. The imaging properties of the
samples were also examined, and the T1 and T2 relaxation times were observed over six
weeks, and changes of 23–29% were observed. For accurate calibration over the shelf life of
a phantom, the fluctuation in these properties should be minimized. Although these changes
T1
map
T2
map
19° flip,T1
Input

59
in properties have no direct effects in terms of calibration accuracy and clinical relevance,
they do have an indirect impact on the performance of a phantom. The shelf life of a phantom
should be at least six months, and ideally up to three years. If the physical, mechanical, and
imaging properties change significantly over a six-week period, they can be projected to
change even more over the longer period of the phantom’s shelf life. Each property is of
different importance, with the mechanical and physical properties being more important as
they may change the shape or rigidity of the phantom over time. The most significant factor
is the imaging performance, since this is related to the phantom’s calibration accuracy and
clinical relevance. Since our aim in this study is to mimic the parameters of liver and lesion
particles to provide a standard value for comparison to human tissue, it is important to retain
stability. There is no standard guideline that defines an acceptable degree of variation.
However, since the T1 and T2 relaxation times found in the literature [33, 34] have standard
deviations of 45 ms for T1 and 4.4 ms for T2, the degree of variation in our measurements
should be within this range. The difference in relaxation times in sample 2 demonstrates a
variation of 84 ms for T1 and 28 ms for T2. These are much larger fluctuations over time than
the measurement range of human tissue at 3 T. Therefore, we can conclude that the change in
relaxation values is not within an acceptable range, and thus, the carrageenan or agar gel does
not perform as a stable material for the construction of phantoms. CT numbers were also
obtained at 120 kVp, and the values were consistent with those of human tissue. However,
the long-term stability of the CT numbers was not validated.
A carrageenan gel phantom with embedded lesion particles was fabricated to simulate
human liver tissue and imaged under MRI. The T1 and T2 maps demonstrate the potential of
carrageenan gel as an MRI phantom material, and the ability of lesion particles to represent
various T1 and T2 relaxation times. However, several challenges remain in the production
procedure to reduce the generation of air bubbles and diffusion of paramagnetic ions.

60
4 Novel Development of Organic and Inorganic Aerogels for Medical Imaging Phantom Application
4.1 Introduction This chapter studies a polymer-reinforced silica aerogel and a cross-linked cellulose aerogel.
The unique properties of aerogels, such as low density, small pore size, mesoporosity, large
surface area, and excellent thermal insulation, are suited to many applications. However,
aerogels have not been investigated for medical phantom applications. This chapter
emphasizes the applicability of organic and inorganic aerogels to medical imaging phantoms
by examining their mechanical and imaging properties.
4.2 Motivation and Objectives
The study described in Chapter 3 found that agar or carrageenan water-based gels have long-
term stability issues. These issues are mainly due to a high water content—water-based gels
are susceptible to changes over time because of the continuous water expulsion and
absorption cycles. As medical imaging phantoms serve as a calibration medium to provide
standard testing, the stability of the phantoms is crucial. Therefore, there is a need to develop
a solid material that can be imaged under MRI with T1 and T2 values and CT numbers that are
similar to those of human tissue. In this study, we investigate the potential of aerogels to be
used as a non-water-based MR/CT-compatible phantom material.
Aerogels are known for their high specific surface area (500–1200 m2/g), small pore size,
ultralow density (0.003–0.5 g/cm3), low dielectric permittivity (1.0–2.0), and low thermal
conductivity (0.005–0.1 W/(m K)). These unique properties suggest promising applications in
catalysts, photography, electronics, antibacterial, and optical applications. [123] Aerogels
can be synthesized from a number of different precursors including tetraethyl orthosilicate
(TEOS), certain metal oxides such as Gd2O3, cellulose, and various polymers, which result in
aerogels with very different properties. [124-127] In this study, silica and cellulose aerogels
were examined. Aerogels are non-water-based materials that can serve as water reservoirs
Chapter 4

61
similar to conventional aqueous phantoms. The advantage of an aerogel is its long shelf-life
and its ability to be stored in a dried state. Moreover, as the water content in aerogels is low,
they do not experience property fluctuations caused by water. In addition, since aerogels use
different contrast agent solutions, their imaging properties can be tailored easily. However,
the fabrication of aerogels is costly and time-consuming.
In this study, the objective is to fabricate a silica aerogel and cellulose aerogel and verify
whether these non-water-based materials have the potential to be used to construct phantoms.
Silica aerogels were cross-linked with di-isocyanate, a polyurethane group that bonds
covalently to the surface of the aerogel, to enhance their mechanical stability by widening the
neck regions with the minimum loss of porosity. A cellulose aerogel was chosen because it
has a low density and relatively high strength and ductility compared to inorganic or
polymeric aerogels. To obtain MRI/CT-compatible material, each aerogel was incorporated
with different modifiers. Dry silica aerogel was fabricated and immersed in a Gd-DTPA
doped solution of different concentrations before imaging. Cellulose aerogel was immersed
in a solution of superparamagnetic iron oxide nanoparticles (SPIONs) before subject to
supercritical drying. These SPIONs have been successfully used as contrast agents for
clinical applications. [128-130]
4.3 Experimental Setup
4.3.1 Experimental Materials
For preparing the silica aerogel, tetramethyl orthosilicate (TMOS) and 3-aminopropyl
triethoxysilane (APTES) were used as the silica precursor and base catalyst, respectively.
Both the materials were purchased from Sigma Aldrich. Acetonitrile (CH3CN) was used as a
solvent and was obtained from EMD Chemical Inc. The polymer cross-linker, Desmodur N-
3200, which is composed of 1,6-hexamethylene di-isocyanate (HDI)-based oligomers, was
donated by Bayer Corporation. The Gd-DTPA Omniscan gadodiamide injection ISP 287
mg.ml (0.5 mmol/ml) from GE Healthcare was used as a contrast agent.
The cellulose aerogel was prepared with Sigmacell cellulose, urea, and sodium
hydroxide solution, which were purchased from Sigma Aldrich. Cobalt (II) nitrate
hexahydrate (Co(NO3)2�6H2O) and iron (II) nitrate nonahydrate (Fe(NO3)3�9H2O) for the
superparamagnetic ions were also purchased from Sigma Aldrich.

62
4.3.2 Fabrication Procedure
4.3.2.1 Fabrication of Silica Aerogel
The native silica aerogel was prepared via a sol-gel process by mixing two separate
solutions, A and B. In solution A, both TMOS and APTES (Sigma Aldrich) were mixed
together with CH3CN to obtain a 2.0 mol/L total silane. Solution B was prepared by mixing
equal amounts of CH3CN and water to achieve an H2O content of 10.0 mol/L. Two different
H2O concentrations (10.0 and 15.0 mol/L) were used to investigate the effect of water on the
properties of silica aerogels. Prior to mixing, the solutions A and B were cooled in a dry
ice/acetone bath at −78 °C to avoid premature gelation. After cooling, the solutions were
mixed and stirred vigorously in a parafilm-capped beaker. Immediately after mixing, the
mixture was poured into cylindrical molds (14 mL centrifuge test tubes, Falcon). The molds
were sealed with parafilm. Gelation occurred within 1–2 min while the solution was still
cold. The gels were allowed to age for 24 h. The wet gels were carefully removed from the
molds and washed with CH3CN three times every 24 h. Owing to their internal structure,
silica aerogels are susceptible to damage even by small external forces. To strengthen the
silica aerogel framework, the wet gels were cross-linked with di-isocyanate by immersion in
baths of di-isocyanate in acetonitrile (0, 20, 40, and 50 wt%) and were oven cured at 71 °C
for 72 h.
4.3.2.2 Fabrication and Cross-linking of Cellulose Aerogel
The cellulose hydrogel was synthesized by dissolving cellulose powder (Sigmacell cellulose)
and urea in a sodium hydroxide solution. Various concentrations of cellulose (5 wt%, 7.5
wt%, 10 wt%) were dispersed in an aqueous solution of sodium hydroxide at room
temperature. The solution was then frozen for 30 min and thawed at room temperature. The
resultant cellulose solution was centrifuged for 10 min to prevent bubble formation in the
viscous solution and cast in the mold. The sample solution was then immersed in ethanol to
coagulate and regenerated for 4 h. The hydrogel was then thoroughly washed in deionized
water to remove any residual chemicals.
To cross-link the cellulose hydrogel with superparamagnetic ions, the hydrogel samples
were immersed in a freshly prepared aqueous solution containing cobalt (II) nitrate
hexahydrate (Co(NO3)2�6H2O) and iron (II) nitrate nonahydrate (Fe(NO3)3�9H2O) for 24 h.
The cellulose aerogel was cross-linked with SPIONs rather than with Gd-DTPA because
SPIONs can adhere better to the nanofibril structure of cellulose aerogels. The molar ratio of

63
the cobalt and iron ions remained constant at [Fe]/[Co] = 2. Three concentrations of
superparamagnetic ions (0.06, 0.12, and 0.24 mol/L) were used. The cellulose hydrogel was
immersed and stirred in metal precursor solution for three days to ensure a homogeneous
distribution throughout the cellulose network. The hydrogel was transferred into an aqueous
NaOH solution (2 mol/L). The color of the sample changed immediately once it was
immersed in NaOH solution. After the cellulose hydrogel had been cross-linked with
CoFe2O4 complex, it was transferred to an oven at 90°C for 4 h to promote further
transformation of soluble iron/cobalt hydroxides to insoluble oxyhydroxide complexes. The
hydrogel was then washed in NaOH solution at 90°C for 16 h to remove any unreacted
residue.
After the fabrication of both the silica and cellulose hydrogels, they were subjected to
supercritical drying in a temperature-controlled pressure chamber for conversion to aerogels.
The pressure was set at approximately 1480 psi for 10 h. During this interval, the pressure
was released and reapplied every 2 h (total 5 cycles). After 10 h of pressurizing with CO2 gas,
the temperature was increased from 25 to 45 °C, which caused the pressure to increase to
approximately 3200 psi. At this point, the CO2 gas reached its supercritical state. The gas was
slowly vented and the dry aerogels (silica and cellulose) were formed. In order to confirm the
reproducibility of the synthesis procedure reported here, each sample was fabricated three
times.
4.3.3 Characterization
Several characteristics tests were performed to evaluate the structural, chemical, and imaging
properties of the silica and cellulose aerogels. Microstructural analysis was performed using
two scanning electron microscopes (SEM): (Hitachi S-5200; Hitachi Ltd., Tokyo, Japan) and
(FEI QUANTA FEG 250 ESEM; FEI, Hillsboro, OR, USA). The sample surfaces were
carbon coated to provide electrical conductivity. The chemical properties were analyzed by
Fourier transform infrared (FTIR) spectrometry (PerkinElmer; PerkinElmer Inc., Walthan,
MA, USA) for the silica aerogel and wide-angle X-ray diffraction (XRD; Rigaku MiniFlex
600; Rigaku Corp, Tokyo, Japan) for the cellulose aerogel. The surface area (SBET) was
calculated from the N2 adsorption isotherms by Brunauer-Emmett-Teller (BET) analysis of
the amount of gas adsorbed at P/P0 in the range of 0.05–0.3. For FTIR, the samples were
powdered and mixed with spectral-grade potassium bromide (KBr) for forming translucent

64
pelletized discs. The discs were then placed into the FTIR machine and the IR spectra were
recorded in the 4000–400 cm-1 region at room temperature. For XRD, Cu Kα radiation at 40
kV and 15 mA was used and the diffraction patterns were recorded for 2θ values ranging
from 5 to 80°. The specific surface area (SSA) was determined using the BET method from
the N2 adsorption isotherm. Magnetic resonance imaging was performed at Sunnybrook
Hospital to acquire the T1 and T2 relaxation times using a GE Discover MR750 3.0T MRI
system (GE Healthcare) with a 32-channel head coil. After obtaining MRI images, a
MATLAB algorithm was used to analyze the T1 and T2 values. Computed tomography
measurements were also performed at Sunnybrook Hospital using a Philips CT system
(Philips Healthcare, USA).
4.4 Results and Discussion The silica aerogels with varying di-isocyanate concentrations are shown in Fig. 4.1. Despite
their unique properties, fragility and environmental sensitivity restrict the use of monolithic
silica aerogels. Fracture of silica aerogels occurs mainly because of their ball-like particles
that are accumulated in the neck regions and create a "pearl necklace-like" structure with
large voids17-19. Fracture may also occur at the interface of these particles when an external
load is applied. Since the structural stability of imaging phantoms is important, we
investigated cross-linking of silica aerogels with di-isocyanate. Polyurethane group of di-
isocyanate bonds covalently to the surface of the silica aerogel and enhances its mechanical
stability by widening the neck regions with a minimum loss of porosity21, 22.
As described above, non-cross-linked silica aerogels have a translucent glassy appearance
with small cracks inside the structure. They are susceptible to damage by small external
forces and can be crumbled into pieces with a force exerted by hands. It is hypothesized that
when liquid in a porous material is removed by evaporation, the capillary stress in the pores
causes the structure of the pore network to collapse and shrink. Since the pore network in a
native silica aerogel is not reinforced, the pore walls are easily broken and lose their integrity.
Compression from a tightly sealed pressure chamber cap and highly pressurized gas can also
cause cracks. On the other hand, the di-isocyanate cross-linked aerogels were opaque and
became dull with the increasing polymer concentrations. In comparison with the cross-linked
aerogels, the native aerogels showed a considerable shrinkage. Similar phenomena were
observed for the cellulose aerogels as shown in Fig. 4.2. Unlike the wet aerogels, the dried

65
cellulose aerogels shrank and sometimes fractured upon drying. The color of the cellulose
aerogel became darker as the concentration of superparamagnetic ions increased.
We faced a few challenges during the fabrication of the silica and cellulose aerogels. First,
the fabrication of an aerogel sample was a lengthy procedure, which required approximately
2 weeks, and the final sample was sensitive to changes in various parameters such as
temperature, time, and concentrations of contrast agents. Also, the aerogels were susceptible
to volume shrinkage after the supercritical drying procedure, which made it difficult to
control the shape and size of the final aerogel sample.
Figure. 4.1 Silica aerogels with increasing concentrations of di-isocyanate
Figure. 4.2 Cellulose aerogels with increasing in CoFe2O4 concentrations
0 wt% 20 wt% 40 wt% 50 wt%
Wet State
Dry State
Increasing CoFe2O4 Concentration
0.06 mol/L 0.12 mol/L 0.24 mol/L

66
4.4.1 Structural and Morphological Properties of Aerogels
High-resolution scanning electron microscopy (SEM) was used to observe the
microstructural morphology of the non-cross-linked and cross-linked aerogels. Figure 4.3(a)
shows the non-cross-linked aerogel, in which primary particles are clustered together to form
secondary particles arranged in a string-of-pearls structure. The bonding between these
secondary particles is weak, and the structure is easily broken when force is applied. Di-
isocyanate cross-linking reinforces the bonding between the secondary particles. The di-
isocyanate polymer accumulates within the neck regions of the secondary particles, which
become wider, while the primary particles remain in a mesoporous structure. The SEM image
of the 20 wt% cross-linked aerogel in Fig. 4.3(b) shows the secondary particles connected by
bridges that improve the structure of the aerogel and allow it to withstand greater forces. The
neck region between the secondary particles of a 40 wt% cross-linked silica aerogel is shown
in Fig. 4.3(c). At this concentration, the region became wider and fused. This strengthened
the structure, but significantly decreased the amount of void space, while simultaneously
increasing the bulk density. The BET surface area analysis to examine the effects of cross-
linking on the total surface area (SA) showed that SA decreased from 417.6 m2/g to 104.0
m2/g when the aerogel was cross-linked with 20 wt% di-isocyanate. This is thought to be due
to the decrease in the amount of void space as the polymer accumulated in the neck regions
of the secondary particles during cross-linking.
Figure. 4.3 SEM images of non-cross-linked and cross-linked silica aerogels (SA, surface area; wt% indicates
cross-linking polymer [di-isocyanate] concentration)

67
Figure 4.4 shows SEM images of non-cross-linked and cross-linked cellulose aerogels
prepared by the in situ synthesis of CoFe2O4 nanoparticles in the cellulose matrix. The non-
cross-linked cellulose aerogels formed a long and entangled nanofibril network of cellulose.
As the cellulose content increased, it was found that branching occurred in the cellulose
nanofibril network, which resulted in a dendritic structure (Fig. 4.4(a)–(c)). It can also be
observed that the CoFe2O4 nanoparticles are located on the nanofibril surfaces. As the
cellulose aerogel was cross-linked with higher concentrations of CoFe2O4 complex, more
superparamagnetic nanoparticles were attached to the cellulose nanofibril network (Fig.
4.4(d)–(f)). The surface area, SBET, was inferred from the N2 adsorption isotherms via the
BET analysis of the amount of gas adsorbed at P/P0 values of 0.05–0.3. The surface area of
pristine cellulose aerogel was 180 m2/g, and this increased slightly to 214, 137, and 243 m2/g
with an increase in the nanoparticle content. Nanoparticles bind to the cellulose matrix and by
incorporating a higher nanoparticle content, the total surface area of the nanoparticles
increases. However, the pore volume and porosity decrease with increasing CoFe2O4 content.
[129].
Figure. 4.4 (a)-(c) SEM images of non-cross-linked cellulose aerogel with increasing cellulose content; (d)-(f) cross-linked cellulose aerogel with higher content of superparamagnetic nanoparticles
v Dried pure cellulose aerogel (5 wt%)
v Dried loaded cellulose aerogel (0.06 mol/L)
v Dried pure cellulose aerogel (7.5 wt%) v Dried pure cellulose aerogel (10 wt%)
v Dried loaded cellulose aerogel (0.12 mol/L) v Dried loaded cellulose aerogel (0.24 mol/L)
(a)
(b) (c)
(d)
(e)
(f)

68
4.4.2 Chemical Properties of Silica and Cellulose Aerogels
The FTIR spectra for non-cross-linked and cross-linked aerogels (20, 40, and 50 wt%
polymer concentrations) are shown in Fig. 4.5. The 1,6-hexamethylene di-isocyanate known
as HDI is a major chemical component of Bayer’s Desmodur N3200. In the present study, we
found that adding this polymer rendered a slight change in the infrared absorption
performance. The spectra of non-cross-linked and cross-linked aerogels had similar IR peaks.
The absorption band around 3500–3300 cm-1 is consistent with the presence of a hydroxyl
group with hydrogen bonding between water molecules. A broad absorption band around
1065–1105 cm-1 is due to the asymmetric stretching vibration of the Si-O-Si bonds. The
absorption band at 692 cm-1 represents the Si-O functional groups, and the additional peaks
on the cross-linked aerogel spectrum, including the broad band near 1740 cm-1 and another
band around 1690 cm-1, correspond to a carbonyl stretch in the diazetidinedione group of the
N3200 and the carbonyl stretch of the silica-isocyanate composite. The polyurethane is
incorporated into the silica network via a hydrogen-bonding interaction between
polyurethane and siloxane groups. [131, 132]
H-O-H
Si-O
Carbonyl stretch
Si-O-SiNon-cross-linked
20 wt% 40 wt%
50 wt%
Wavenumber (cm-1)
Abs
orba
nce
Figure. 4.5 FTIR spectroscopy of silica aerogels cross-linked with varying concentrations of di-isocyanate
Figure 4.6 shows the XRD pattern of the non-cross-linked and cross-linked aerogels. The
diffraction peaks at 2θ = 20.1° and 21.9° are believed to represent the (1 0 ), and (0 2 1)

69
planes of cellulose II crystalline, respectively. [92] In addition to the cellulose II peaks, there
are diffraction peaks that confirm the presence of CoFe2O4, especially at 2θ = 35° (powder
diffraction file, JCPSD card no. 79-1744). The diffraction peaks are considerably broad,
which indicates the low crystallinity or very small crystalline size of the cellulose matrix. The
electron-rich oxygen atoms in the cellulose matrix attract electropositive metal cations. The
Co2+ and Fe3+ ions present at the surface of the cellulose nanofibrils ultimately led to the
nucleation of CoFe2O4 and prevented the growth of these nanoparticles. [134]
Figure. 4.6 XRD pattern of non cross-linked cellulose Aerogel and cross-linked with CoFe2O4
4.4.3 Imaging Properties of Silica and Cellulose Aerogels
The potential usefulness of the silica aerogels as a material for multimodal imaging phantoms
was examined by determining the T1 and T2 relaxation times in MR imaging and the CT
numbers. First, silica aerogels cross-linked with different di-isocyanate concentrations were
immersed in Gd-DTPA solution to enhance the MR imaging. The 20 wt% di-isocyanate
cross-linked aerogel was then immersed in solutions containing 0.085, 0.17, and 0.34 µL/mL
Gd-DTPA to study the effects of varying concentrations of contrast material. The non-cross-
linked silica aerogel was not used because of its extensive shrinkage upon supercritical
drying. Although it was difficult to visualize the nanoporous structure of the aerogels, we
were able to obtain values of 614–2983.8 ms for T1 and 9.2–690.6 ms for T2, as illustrated in

70
Fig. 4.7. The T1 values decreased slightly as the di-isocyanate concentration increased from
20–50 wt%, whereas the T2 values increased markedly, from 334–690 ms. The effect of
polymer density on T2 values has not previously been studied, but T2 values in human tissues
under 3T imaging are known to increase with density or viscosity (Table 4.1). [135] To study
the effect of Gd-DTPA, the silica aerogel sample with 20 wt% di-isocayante was chosen
since it provided the lowest T2 value. As shown in Fig. 4.7(b), at a known and constant value
of T2, the Gd-DTPA concentration increased with a decrease in the T1 value. These values
mimicked those of liver tissue, breast fibroadenoma, and bone marrow (see Table 4.1).
Although cross-linking with di-isocyanate enhanced the mechanical stability of the silica
aerogel, it caused some deviation in the T1 and T2 relaxation times from those of human tissue.
For instance, the values for human lung are reported to be T1 = 1013 ± 150 ms and T2* = 1498
± 393. [136] By adjusting the concentrations of di-isocyanate and Gd-DTPA, we should be
able to match the specific human tissue values, including in lung tissue. It is known that MRI
is sensitive to hydrogen atoms, and if there is insufficient hydrogen within the material, it is
difficult to acquire useful images, as for the dry aerogel sample. Further investigation is
needed to establish sample preparation and enhancement methods and MR imaging protocols
for silica aerogels without the need for immersion in a contrast solution.

71
Figure. 4.7 (a) The effect of di-isocyanate cross-linker and (b) Gd concentrations on MRI T1 and T2 relaxation
times (ms)

72
Figures 4.8 and 4.9 show the CT imaging results of the silica aerogels. The aerogel
samples had HU values of 142–227 (Fig. 4.8). The HU values increased with increasing di-
isocyanate concentration. It is known that, as the density of human tissue increases, the HU
value increases (i.e., bone = 3000 HU). Thus, while an increase in the HU values with
increased density due to the increased di-isocyanate concentrations was anticipated, we noted
that the changes were not significant. Furthermore, when the aerogels were immersed in a
doped solution of Gd-DTPA (0.24 mol/L), the HU value was decreased by 37 units. These
values are consistent with the values for human soft tissues, which are in the range of +100–
+300 HU.
Figure. 4.8 (a) The effect of di-isocyanate and (b) Gd concentrations on CT number (HU)
Figure. 4.9 MRI (left) and CT (right) images with Hounsfield units for silica aerogels

73
Three cellulose aerogels at each superparamagnetic concentration were fabricated and
imaged under MRI and CT to validate their feasibility as phantom materials, as demonstrated
in Fig. 4.10. The MRI results demonstrate that the cross-linked cellulose aerogel only gave a
signal when immersed in water. Furthermore, only samples cross-linked with 0.24 mol/L
CoFe2O4 were visible under these modalities. The T1 value ranged from 172–536 ms and the
T2 value ranged from 52–77 ms. As shown in Figure 10(a), as the cellulose concentration
increased from 5–10 wt%, the T1 value decreased and T2 increased. On comparison these
values for human tissue, as given in Table 4.1, T1 value was found to be close to that of bone
marrow, and the T2 value matched those for various tissues. By altering the concentrations of
CoFe2O4, the resulting T1 and T2 values could mimic those of human tissues, as indicated in
Table 4.1. The HU values for the non-cross-linked and cross-linked cellulose aerogels were
also measured. The HU value decreased from 250 HU to a value in the range of 167–395 HU
upon cross-linking. A further decrease in the HU value was observed with the increasing
cellulose concentration. Despite the success in imaging these samples, the samples shrank
during the drying process, thus making it difficult to control the final volume of the samples.

74
Figure. 4.10 MRI (a) and CT (b) of cross-linked cellulose aerogel with 0.24 mol/L CoFe2O4 complex with increase in cellulose content
Table 4.1. 3T MRI and CT values of human tissues [135]
MRI CT Tissue T1 (ms) T2 (ms) Tissue T1 (ms) T2 (ms) Tissue HU Muscle 1412 50 Cervix 1616 83 Lung -500 Liver 812 42 Bone Marrow 586 49 Liver 40-60 Heart 1471 47 White matter 832 80 Soft Tissue 100-300
Kidney 1194 56 Subcutaneous fat 371 133 Muscle 10- 40
Pancreas 725 43 Blood 1932 275 Cancellous Bone 700
Each aerogel has its advantages and disadvantages as an MR/CT-compatible phantom
material. Although the silica aerogel showed good mechanical stability with di-isocyanate
cross-linking, the values obtained from the MRI and the CT measurements did not resemble
specific human tissue values, especially the T2 values. However, by using different contrast
agent solutions, different imaging properties of the silica aerogel could be obtained. On the
other hand, the cellulose aerogel with 0.24 mol/L CoFe2O4 demonstrated good MRI and CT
measurements. Nevertheless, during the supercritical drying process of the cellulose aerogel,
it was difficult to control the changes in the shape and the size, as the hydrogel was too soft.
Non-cross-linked

75
4.5 Summary
In this study, the feasibility of silica and cellulose aerogel as a material for medical imaging
phantoms was examined. As silica aerogel was cross-linked with di-isocyanate, it widened
the neck regions of the microstructure. This helps the material to withstand applied force, as
confirmed by SEM images. The diagnostic imaging properties of silica aerogels, including T1
and T2 relaxation times for MRI and CT numbers, indicated some correlation between the
aerogels and human tissues. Cellulose aerogel cross-linked with a superparamagnetic
complex was also examined as a potential medical imaging phantom material. X-ray
diffraction was performed to confirm the presence of CoFe2O4 using powder diffraction file,
JCPSD card no. 79-1744. With the uptake of water, the cellulose aerogel demonstrated
MRI/CT compatibility. The T1 value ranged from 172–626 ms and the T2 value varied from
36–129 ms. The CT number ranged from 167–395 HU. However, at CoFe2O4 concentrations
of 0.06 mol/L and 0.12 mol/L, MRI and CT results could not be obtained. Thus, a higher
concentration should be examined to verify the effect of superparamagnetic concentrations on
the MRI results. The T1 and T2 values varied according to the modifier concentrations (Gd-
DTPA and CoFe2O4).
To mimic a specific human tissue, we can tailor the aerogel concentrations to reach the
desired values. Since aerogels have a dried form, they can be reused with different
concentrations after the subsequent drying process. Their structural stability and ability to be
imaged under MRI and CT give silica and cellulose aerogels the potential to be used as a
perfusion phantom to mimic the porous structure of the lungs.
The significant shrinkage in aerogel volume during the supercritical drying process
restricts the fabrication of aerogel phantoms at human tissue sizes. Thus, various drying
procedure conditions should be examined in an attempt to minimize this change in volume.

76
5 Novel Development of 3D-Printable UV-Curable Silicone for Multimodal Imaging Phantom
5.1 Introduction This chapter examines the fabrication of silicone, known as polydimethylsiloxane (PDMS),
as a multimodal phantom material. Several studies have examined the suitability of silicone
in the construction of phantoms. Silicone is robust, easily molded into different shapes, and
applicable under different modalities. In this study, hydrophilic silicone and deionized water
are added to study their effects on the properties of silicone, particularly on the imaging
properties. Furthermore, because of its fast UV-curing rate, we propose that silicone be used
in a Digital Light Processing (DLP) 3D printer. With the development of 3D printable
silicone, doctors could easily create customized phantoms using to assist with radiation
therapy, surgical planning, or training purposes.
5.2 Motivations and Objectives As mentioned in previous chapters, water-based gels, which are the conventional phantom
material, have limited long-term stability and repeatability of measurements. Recently, a
number of papers have addressed the use of silicone in the development of phantoms. The
advantages of silicone are that it can be molded into different shapes, achieve various
viscosities, and be imaged under different modalities.
High-temperature vulcanization is the most common silicone curing method, whereby
the homolytic cleavage of organic peroxides generates free radicals that attack the vinyl C=C
double bond with the formation of chemical crosslinks between the polymeric chains. During
this curing reaction, known as hydrosilation, one hydrogen atom and one silicon atom are
added to form a new silicon–carbon bond, which gives rise to a crosslink between silicone
polymer chains. [137-139]
Despite the advantages of silicone, its slow curing time can be problematic. With
advances in medical technology and the customization of medical devices for improved
Chapter 5

77
patient care, faster silicone curing is desirable. This could allow doctors to obtain computer-
aided design models from MRI or CT images and customize patient’s organ phantoms for
surgery planning or training. Thus, we propose the use of photo-polymerization.
Photo-polymerization uses light irradiation to initiate chemical reactions, leading to the
formation of new polymers. The resulting rapid cure times, low energy requirements, room
temperature treatment, and lower material costs make photo-polymerization preferable to the
thermal cure process. [99] Photo-polymerization reactions require a photoinitiator, which
generates a photoactive species when exposed to light irradiation, and a reactive
multifunctional monomer or oligomer that gives rise to cross-linking. Many researches have
studied the effective curing of different UV-curable silicone with various platinum-based
catalysts such as platinum (II) acetylacetonate (Pt2acac), diphenyl iodonium
hexafluorophosphate salt, and N-alkyl morpholino acetophenone. [137, 141, 142]
The objective of this study is to develop a human liver tissue-mimicking UV-curable
silicone phantom that can be used to accurately assure the quality of the multimodal medical
imaging devices. In this study, we use commercially available silicone with a fast curing
speed that can be applied to 3D printing techniques.
5.3 Experiments
5.3.1 Experimental Materials
UV-curable silicone and its catalysts, UV Electro 225 and UV LSR catalyst, were kindly
provided by Momentive Performance Materials. Silicone thinner and hydrophilic silicone
were purchased from Smooth-On Inc. and United Chemical Technologies, respectively.
5.3.2 Preparation of Silicone Gel Samples
Silicone gel samples were fabricated from Momentive Silopren UV Electro 225 and UV LSR
catalyst. Momentive is a photo-polymer composed of a catalyst (part A) and resin (part B). A
mixture was prepared by adding a 2:1 ratio of Momentive UV Electro 225 with Smooth-On
Silicone thinner. The silicone thinner decreases the viscosity and stiffness of the silicone.
Momentive UV LSR catalyst was added to the mixture to initiate the photo-polymerization
reaction. Hydrophilic silicone (HS) and deionized water was also added at different

78
concentrations to study the effects on the mechanical and imaging properties of the silicone
samples. Hydrophilic silicone assists the addition of water to silicone. The mixture was
stirred until a homogeneous solution was achieved and poured into an aluminum mold. The
solution was then exposed to UV light (Swordfish UV lamp at 36 W) until a completely
cured sample was obtained.
5.3.3 Characterization
Several characterization tests were performed to determine the mechanical, and imaging
properties of the silicone gel. Because deionized water had been incorporated into each
sample, thorough mixing of the contents was essential to obtain homogeneous samples. The
properties of the silicone samples were compared with reference human liver values found in
the literature as indicated in Table 5.1. [135, 143, 144]
Table 5.1. Human liver tissue values [135, 143, 144]
Liver
T1 812 ± 64 (ms)
T2 42 ± 3 (ms)
HU 40–60 (HU)
Refractive Index 1.37
Speed of Sound 1575 ± 10(m/s)
Elasticity 6.4–60 kPa
5.3.3.1 Experimental Setup: Silicone Curing
The key to this study is to develop a solid silicone material that can be fabricated using a 3D
rapid prototyping to print any organ shape. Some studies have examined phantoms have used
negative molds that were produced with fused deposition 3D printing and the material is
poured into the mold in order to obtain its shape. However, theses approaches lack of
accuracy, have a slow build speed, and involve a complicated processing for the phantom. In
this study, we propose a UV curable silicone solution that can be used as a resin for the
stereolithography (SLA) additive technique termed DLP. Using DLP, UV-curable resin
material is positioned in a tank under the UV light source, and the UV light is projected in a
graphic pattern, which forms and hardens in a thin solid layer of material. A thin layer is
cured within a few seconds, and the platform is lowered to obtain another cross-sectional
layer of the desired part. DLP is preferred to SLA techniques used in most other studies [145,
146] because of its bottom-up approach, the absence of a molding procedure, fast curing, and

79
easy to change UV-curable resin. Since the platform of DLP 3D printer moves, viscosity of
the resin should be low enough to avoid any shifts in position. In this study, we applied a 0.5
mm-thick layer of homogeneous solution on an aluminum foil and irradiated it with UV light
to promote curing. The produced parts have high resolutions under 30 microns and smooth
surfaces.
To ensure the complete conversion of the polymer, an FTIR measurements were taken to
compare the peaks of the silicone in the liquid and cured solid states. Attenuated Total
Reflectance (ATR) measurements were performed using an Bruker ALPHA FTIR
(Massachusetts, USA). The sample in the liquid state was carried in a dark container to
minimize its exposure to UV light. Cured samples with hydrophilic silicone concentrations of
10 and 20 vol% were compared to observe the differences in their IR peaks.
5.3.3.2 Experimental Setup for Ultrasound
We performed US experiments as illustrated in Fig. 5.1. Two ceramic transducers were
placed facing each other and immersed in water with the sample located between them. The
transmitter was a focused 3.5 MHz transducer with a focal distance of 5 inches (~127 mm)
and the receiver was a flat 3.5 MHz transducer. The transmitted signal was amplified using a
computer-controlled pulser/receiver (NDT Model 5800, Olympus Panametrics, Japan). Data
acquisition and signal processing were performed on a PC using the LabView software. The
US samples were disk-shaped with a diameter of 8 mm and thickness of 3–6 mm to allow the
signal to pass through without any turbulence. To transmit the detected signals to the
software, an analog-to-digital converter (ADC, PXIe-1082) and NI-SCOPE software
(National Instruments, Austin, TX) were used. A total of ten measurements were taken from
each sample. The acquired data were used to calculate the average SOS and attenuation
coefficients of each sample. [147, 148] The water used as the ultrasonic coupling fluid had a
temperature of 23 ± 2°C.

80
Figure 5.1. Experimental setup of ultrasonic measurement system of the samples
5.3.3.3 Experimental Setup for MRI and CT
Magnetic resonance images to acquire the T1 and T2 relaxation times were taken at
Sunnybrook Hospital using a GE Discover MR750 3.0T MRI system (GE Healthcare) with a
32-channel head coil. For the T1 relaxation time measurements, TR times of 2400, 1700,
1000, 500, 300, 150, 90, and 50 ms were used. The T2 relaxation time was measured using TE
values of 10, 20, 30, 50, 75, 100, 150, 200, and 300 ms and a TR value of 2500 ms. After
obtaining the MR images, a MATLAB algorithm was used to analyze the T1 and T2 values.
Computed tomography measurements were performed using a wide-volume CT system
(320 MDCT Aquilion ONE, Toshiba Medical Systems, Japan). The samples were aligned
and attached to a template, and placed perpendicularly on the CT scanning platform. The
scanning conditions were set up to have 0.5 mm detector collimation, 0.5 s gantry rotation
time, 50 mA nominal tube current, and tube potentials of 80, 100, 120, and 135 kVp. The
images were reconstructed using a single filter kernel with 1 mm sections at 0.5 mm
intervals.
5.4 Results and discussions As shown in Fig. 5.2, the UV-cured silicone samples were prepared with four concentrations
of deionized water (0, 5, 10, 20 vol%) and two concentrations of hydrophilic silicone (HS,
10, 20 vol%). Samples with 0 vol% water have a gooey texture with a soft structure. As the
water and hydrophilic silicone concentration increases, the silicone becomes more rigid and
whiter in appearance.
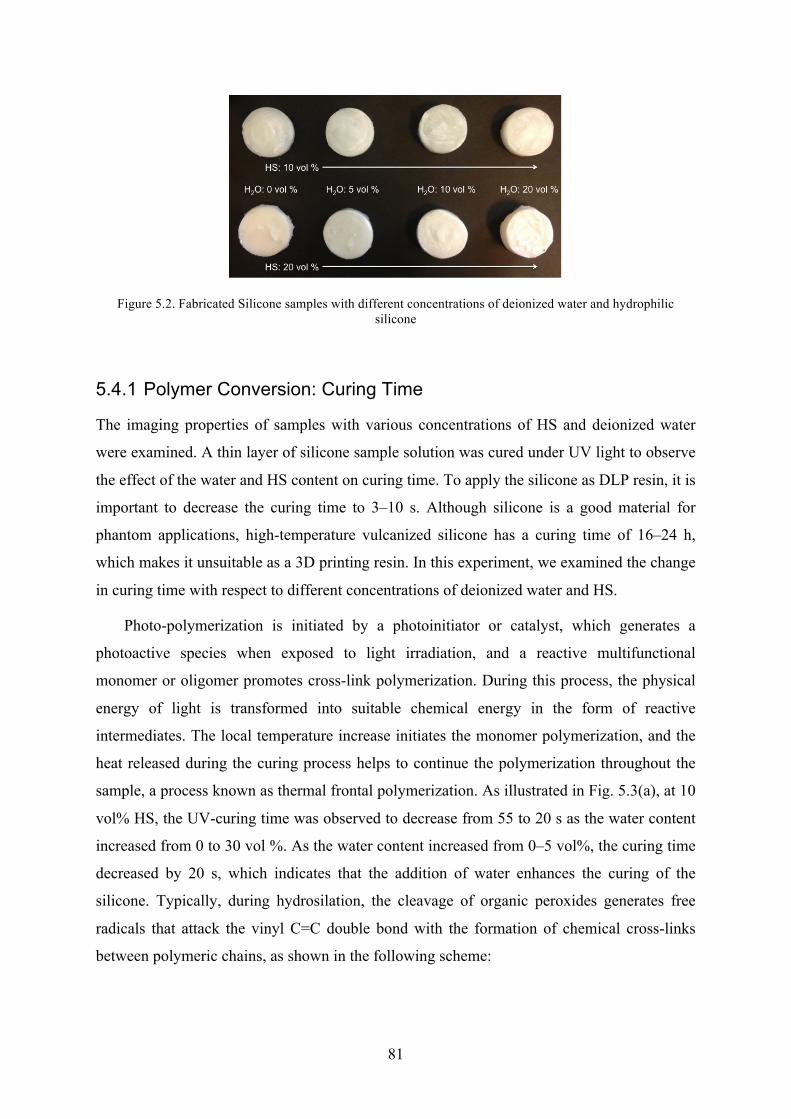
81
Figure 5.2. Fabricated Silicone samples with different concentrations of deionized water and hydrophilic silicone
5.4.1 Polymer Conversion: Curing Time
The imaging properties of samples with various concentrations of HS and deionized water
were examined. A thin layer of silicone sample solution was cured under UV light to observe
the effect of the water and HS content on curing time. To apply the silicone as DLP resin, it is
important to decrease the curing time to 3–10 s. Although silicone is a good material for
phantom applications, high-temperature vulcanized silicone has a curing time of 16–24 h,
which makes it unsuitable as a 3D printing resin. In this experiment, we examined the change
in curing time with respect to different concentrations of deionized water and HS.
Photo-polymerization is initiated by a photoinitiator or catalyst, which generates a
photoactive species when exposed to light irradiation, and a reactive multifunctional
monomer or oligomer promotes cross-link polymerization. During this process, the physical
energy of light is transformed into suitable chemical energy in the form of reactive
intermediates. The local temperature increase initiates the monomer polymerization, and the
heat released during the curing process helps to continue the polymerization throughout the
sample, a process known as thermal frontal polymerization. As illustrated in Fig. 5.3(a), at 10
vol% HS, the UV-curing time was observed to decrease from 55 to 20 s as the water content
increased from 0 to 30 vol %. As the water content increased from 0–5 vol%, the curing time
decreased by 20 s, which indicates that the addition of water enhances the curing of the
silicone. Typically, during hydrosilation, the cleavage of organic peroxides generates free
radicals that attack the vinyl C=C double bond with the formation of chemical cross-links
between polymeric chains, as shown in the following scheme:

82
In this process, one hydrogen atom and one silicon atom are added across a multiple
bond. [137-139, 149] The hypothesis is that water exhibits a fast curing rate, whereby the
addition of water to a UV-curable monomer results in a net decrease in the curing time. As
water reacts with silicone, more carbon double bonds are broken down, enhancing the
formation of cross-linked silicone polymer chains.
On the other hand, as Fig 5.3(b) indicates, the curing time increased considerably as the
HS content increased from 20–30 vol%, regardless of water content. This indicates that
increasing the HS content increases the curing time. The addition of HS increases the [SiR2-
O-] backbone structure, adding functional groups to which the photo-catalysts can adhere and
polymerize. Thus, the catalyst effect on the silicone curing process decreases as the HS
content increases.
(a)

83
Figure 5.3 (a) Curing time with change in water content for 10 and 20 vol% HS; (b) Curing time with in HS content for 10 and 20 vol% water
5.4.2 Chemical Properties of Silicone Gel
To identify the chemical change during the UV-curing process, FTIR was performed on
samples in the liquid and solid states after polymerization. First, it was found that the
spectrum of the solid samples does not change, as shown in Fig. 5.4. The other FTIR results
confirmed that the infrared spectra of silicone samples do not alter with the HS and water
concentrations.
The liquid and solid states of silicone generally demonstrate similar absorption peaks.
The liquid state exhibits two peaks at 1600–1680 cm-1 for the C=C stretching of alkene and a
broad band at 3200–3500 cm-1 representing the O-H stretch of H-bonds. This proves that the
mixture contains HS, which contains alkene oxides as well as water. When the sample is
cross-linked, an absorption peak appears at around 2800–2950 cm-1 because of the C-H
stretch. As the UV-curing finishes, the carbon double bonds are broken down into single
bonds and cross-links in the silicone polymer chains. This verifies that UV-curing was
successful.
(b)

84
Figure 5.3. FTIR of liquid and solid states of silicone samples (liquid with 10 vol% HS and 20 vol% water; solid with 10 vol% and 20 vol% HS and 20 vol% water)
5.4.3 Hardness of Silicone Gel
The hardness of the silicone samples was compared using an Instron Shore Hardness Tester
with a OOO-type load. Three samples of each concentration were measured and compared.
As Fig. 5.5 demonstrates, there were no drastic differences in the hardness of the samples
with different water and HS concentrations. However, it is interesting to note that the 0 vol%
water sample remains soft and gooey after complete curing. As the water content increases,
the sample becomes more rigid and the hardness increases. This is contrary to the silicone
solution prior to curing, where the viscosity was lowered by the addition of water. As
hypothesized earlier, water enhances the cross-linking polymerization of the silicone, which
could increase its rigidity.

85
Figure 5.4. Hardness of silicone samples with increase in water content
5.4.4 Ultrasound Properties of Silicone Gel
Figure 5.6 shows the measured SOS and attenuation coefficients for disk-shaped silicone
samples. These measurements were performed at a frequency of 3.5 MHz and repeated ten
times for different samples.
The measured SOS was between 1275 ± 40 m/s and 1237 ± 47 m/s for each HS content
at 5 vol% water. This is much lower than the SOS of normal human liver tissue (1575±11
m/s [144]). The SOS value decreased to 906 and 1094 m/s at a water content of 20 vol%.
Lower SOS values could be due to the inhomogeneity in the solution and uneven sample
surfaces. Previously reported values for different types of silicone were in the range 969–
1250 m/s. [109] The attenuation coefficients were 0.40 ± 0.183 and 0.35 ± 0.056 dB/(cm
MHz) at a frequency of 3.5 MHz for 10 and 20 vol% HS content at 5 vol% water. The
attenuation also decreased at higher water contents. Normal human liver tissue has an
attenuation coefficient of 0.52 ± 0.03 at 1 MHz. [144] Considering that the attenuation
coefficient increases linearly with the frequency, the extrapolated normal liver attenuation
coefficient at 3.5 MHz would be approximately 2.4 [151] The values for the silicone samples
are significantly lower than those of liver tissue, and thus it may not be give a good
representation of human tissue. Further studies should be performed to improve the acoustic
properties of the silicone phantom by adding metal particles or other polymer materials such
as graphite powder [152], evaporated milk [153, 154], Al2O3 [155] and /or poly(methyl
methacrylate) PMMA microsphere [156].

86
Figure 5.5. US measurements performed on silicone samples a) SOS (m/s) and b) attenuation coefficient (dB/cm-MHz)
5.4.5 MRI Properties of Silicone Gel
The T1 and T2 relaxation times were obtained using a GE Discover MR750 3.0T MRI system
and compared with the values of human liver tissue. The T1 and T2 values represent the rates
at which the longitudinal and transverse components of the magnetization vectors of human
tissues return to their thermodynamic equilibrium. Theoretically, since MRI detects the
presence of hydrogen protons, water content plays an important role in the signal detection.
Thus, it is hypothesized that higher water contents will decrease T1 and increase T2. Since HS
is a non-reactive silicone fluid with alkene oxides that has been modified to enhance the
solubility in water, altering the amounts of alkene oxide (hydrophile) and dimethylsiloxane
(lipophile), the desired hydrophilicity can also be achieved. As shown in Figs. 5.7 and 5.8, T1
increases and T2 decreases as the water content increases to 10 vol%. Up to 10 vol%, the
water content enhances both T1 and T2 relaxation values at 448 ms and 40 ms, respectively,
which are close to the values in human liver tissue of T1 = 812 ± 64 ms and T2 = 42 ± 3 ms.
[135]
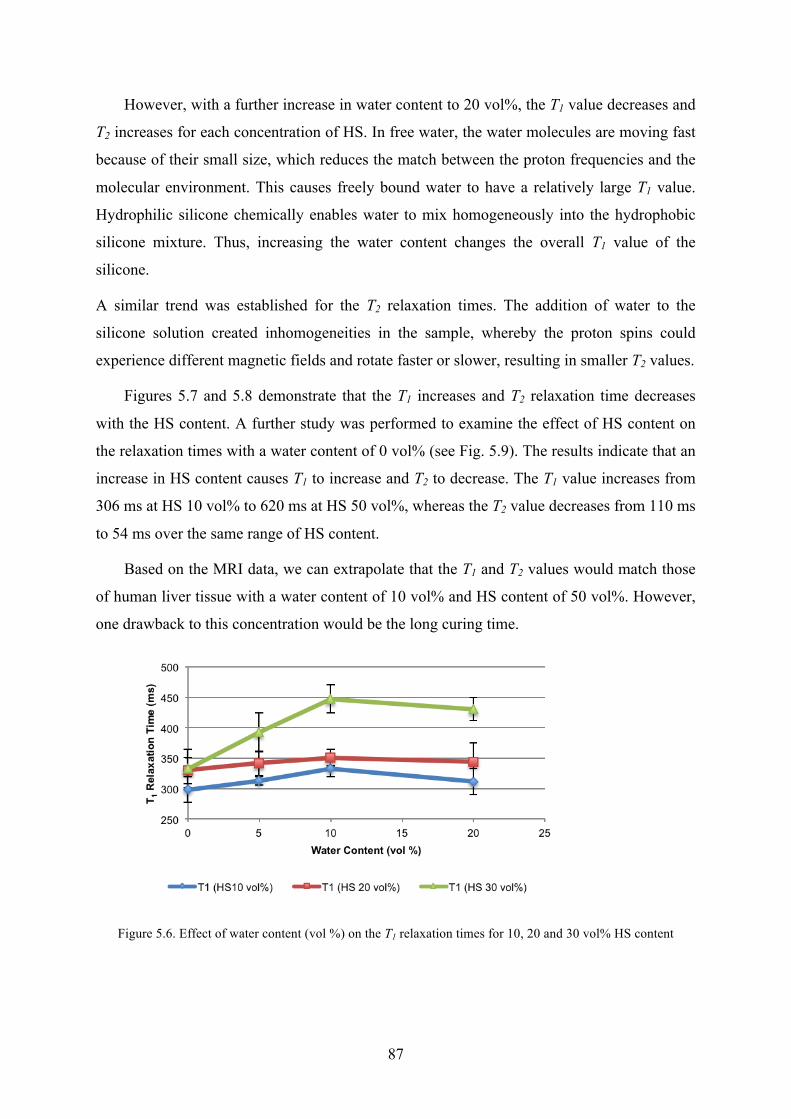
87
However, with a further increase in water content to 20 vol%, the T1 value decreases and
T2 increases for each concentration of HS. In free water, the water molecules are moving fast
because of their small size, which reduces the match between the proton frequencies and the
molecular environment. This causes freely bound water to have a relatively large T1 value.
Hydrophilic silicone chemically enables water to mix homogeneously into the hydrophobic
silicone mixture. Thus, increasing the water content changes the overall T1 value of the
silicone.
A similar trend was established for the T2 relaxation times. The addition of water to the
silicone solution created inhomogeneities in the sample, whereby the proton spins could
experience different magnetic fields and rotate faster or slower, resulting in smaller T2 values.
Figures 5.7 and 5.8 demonstrate that the T1 increases and T2 relaxation time decreases
with the HS content. A further study was performed to examine the effect of HS content on
the relaxation times with a water content of 0 vol% (see Fig. 5.9). The results indicate that an
increase in HS content causes T1 to increase and T2 to decrease. The T1 value increases from
306 ms at HS 10 vol% to 620 ms at HS 50 vol%, whereas the T2 value decreases from 110 ms
to 54 ms over the same range of HS content.
Based on the MRI data, we can extrapolate that the T1 and T2 values would match those
of human liver tissue with a water content of 10 vol% and HS content of 50 vol%. However,
one drawback to this concentration would be the long curing time.
Figure 5.6. Effect of water content (vol %) on the T1 relaxation times for 10, 20 and 30 vol% HS content

88
Figure 5.7. Effect of water content (vol %) on the T2 relaxation times for 10, 20, and 30 vol% HS content
Figure 5.8. Effect of HS content (vol%) and T1 and T2 Relaxation times
5.4.6 CT scan of Silicone Gel
CT scan was also performed on samples at four different peak kilovoltages (80, 100, 120 and
135kVps). Fig. 5.10 demonstrates that the HU decreases linearly with increasing the kVp. As
the water concentration increases from 0 to 20 vol% the HU values decreases. For CT
number accuracy, the American College of Radiology (ACR) recommends that the scans
were performed between 120 and 130kVp. [115] At 120kVp, the HU value of sample with 0
vol% water and 10 vol% HS is 142, whereas the HU value of sample with 20 vol% water and
10 vol% HS is 77. Also, at higher HS content, the HU values tend to be higher. At 120kVp,

89
the HU value of samples with 10 vol% water varied between 100 and 125 at 10 and 20 vol%
HS content. The higher HU value may be due to higher density of the sample with higher HS
content. In comparison to human soft tissue values, the HU values are slightly higher.
However, this can be adjusted with higher water content or higher silicone thinner content to
decrease the density of the samples.
Figure 5.9. CT Hounsfield Unit values of silicone over 80, 100, 120 and 135 kVp (a) 10 vol% HS and (b) 20 vol% HS
5.5 Summary In this study, the potential for UV-curable silicone to mimic human liver tissue as a 3D
printable multimodal imaging phantom material was investigated. The results demonstrate
that increasing the water content decreases the UV curing time, with just 20 s curing time
Human Liver Range
(b)
(a)

90
required at 20 vol% water content. Ideally, a curing time of less than 10 s is needed for 3D
printing application. An FTIR study confirmed the occurrence of silicone polymerization by
breaking down the double carbon bonds. Hardness does not vary significantly but, as the
water content increases, cured silicone samples become more rigid and less gooey. The US
results indicate a lower SOS than that of human liver tissue value at 1575 m/s. The MRI
results suggest that a water content of 10 vol% gives T1 and T2 relaxation times that are close
to those of human liver tissue. As the HS content increases, the T1 value increases and T2
decreases toward the values of human liver tissue. In future, higher HS contents at 10 vol%
water should be investigated to acquire relaxation values close to the target.
This study has demonstrated that silicone is a suitable material for the construction of a
liver phantom. The addition of water and HS improved the mechanical and imaging
properties. To enhance the imaging properties of silicone further, it may be possible to add
subsequent contrast agents. With suitable properties of UV-curable silicone, we intend to
fabricate a real-size liver phantom using DLP 3D printing for the customization of patient-
specific phantoms.

91
6 Self-Healing Silicone for Future Phantom as training and surgical planning tool
6.1 Introduction Several phantom materials have been investigated in previous chapters for applications in
multi-modal imaging. Clinical simulators or phantoms provide similar properties or
requirements as that of real medical procedures, and therefore, they are commonly used for
clinicians’ training and the calibration or testing of medical devices [158]. The advancement
of technology and the increasing concern for quality assurance and patient-specific activities
has resulted in phantoms playing an important role in the medical industry. Recently,
phantoms are gaining importance as tools for training in needle-based procedures that use
needles, catheters, guidewires, and other small-bore instruments. Currently, it is mandatory
for nurses and clinicians to be trained using medical phantoms for all needle-based
procedures [159]. To employ phantoms for training, it is essential to develop tissue-
mimicking phantoms with self-healing properties for recovery from needle insertions. In this
chapter, self-healing silicone with microcapsules was investigated as a proof-of-concept for
this purpose. Based on the results obtained from previous chapter, silicone provided imaging
properties similar to human liver tissue values for multiple imaging devices. Self-healing was
studied as an additional property to enhance the function of silicone as phantom material. The
morphological, mechanical, and ultrasound properties of self-healing silicone were
investigated.
6.2 Motivation and Objective There is an increased need for phantoms in radiation therapy and surgical planning. Phantoms
are primarily used in training clinicians and surgeons to locate tumors and targeted areas
accurately. When performing real-life surgical simulation training, needle insertion or
dissection of the phantom structure is inevitable. However, it would defeat the purpose of the
training if a trainee can observe the cut made by a previous trainee. Further, these phantom
structures are not easy to fabricate and commercial phantoms are expensive; therefore, the
Chapter 6

92
phantom material should also be reusable. Thus, the development of a phantom material with
self-healing property is required. A phantom with self-healing properties is particularly useful
for training ultrasonography (US) -guided needle interventions; the needle tracks should be
invisible on the US image for repeated training. [160]
Over the past decades, materials that display self-healing properties either with or
without the presence of external stimulants such as UV light and heat have attracted
considerable research interest. The first self-healing system was developed by White et al.
[119] and it contained a microencapsulated dicyclopentadiene (DCPD) monomer and a solid
phase Grubbs’ catalyst embedded in an epoxy matrix. Damage served as the trigger
mechanism when an approaching crack ruptured the embedded microcapsules releasing
DCPD into the crack plane through capillary action. Ring-opening metathesis polymerization
(ROMP) of the liberated DCPD was initiated by contact with the embedded catalyst, bonding
the two crack faces together. Self-healing polymers can be categorized into three classes: (1)
capsule-based, (2) vascular-based, and (3) intrinsic. The first mechanism to achieve self-
healing is embedding microcapsules containing healing agents in the base material. On
damage, the microcapsules rupture and release the healing agents, which fill the damage area
by polymerizing new material [161–167]. Most techniques involve the combination of two
types of microcapsules or one type of capsule with a catalyst. Examples of healing agents
include a metal catalyst (Grubb’s catalyst) and DCPD or any form of polymer with its
catalyst. Capsule-based polymers are designed for one-time healing response, and they are
limited by the number of microcapsules present in the epoxy matrix.
A vascular-based self-healing polymer stores healing agents either in the embedded
vascular microchannel or in the external reservoir [168–171]. For the latter ones, the micro-
vascular serves as a channel for directing the flow of healing agents. When the composite is
damaged, the healing agent is charged into the composite through these microchannels. The
system of vascular-based composites can be categorized into 1D, 2D, and 3D designs.
Although the depletion of the healing agent is not problematic, the viscosity of healing agents
and the complexity of the fabrication method and limited size restrict the use of this type of
polymer. Vascular-based polymers can be designed for both single- and multiple-time
healing responses.
Intrinsic polymers contain reversible bonds that are activated after being subjected to
damage and these are generally designed to face repetitive damages. The intrinsic healing can
be achieved through thermally reversible reactions, hydrogen bonding, and macromolecular

93
diffusion. According to the literature, intrinsic polymers can withstand a considerable amount
of repetitive damage [172–174]. However, the disadvantage of these polymers is that the
process for preparing a sample is more complex compared with microcapsule-based and
vascular-based techniques, and the reaction kinetic can be very slow or difficult to achieve
successful self-healing.
Cheung et al. [175] created pediatric-sized abdominal organs to investigate silicone
rubber for magnetic resonance (MR) imaging and surgical robot validation. Keller et al.
proposed a microcapsule-based healing system, which consist of two parts of microcapsules,
one with vinyl-functionalized polydimethylsiloxane (PDMS) resin and platinum catalyst, and
the other containing poly(methylhydrosiloxane) copolymer. [162]
In this study, we investigate PDMS using the microcapsule self-healing system. The
advantages of PDMS are its inertness, ease of fabrication, and high deformability. The
objective of this project is to develop a self-healing polymer that can heal intrinsically while
simulating the properties of human liver tissue. The phantom should be able to self-heal after
multiple cuts without retaining an obvious mark. Further, it should mimic the imaging
properties of human tissue under ultrasound.
6.3 Experimental Setup
6.3.1 Experimental material
All materials for the experiment—urea, resorcinol, 1-octanol, 37 wt% formaldehyde solution,
poly(ethylene-alt-maleic anhydride) (EMA), ammonium chloride, hydrochloric acid, and
heptane—were purchased from Sigma Aldrich. The microcapsule content, Sylgard® 184
Silicone Elastomer, was purchased from Dow Corning.
6.3.2 Fabrication Methods
6.3.2.1 Microcapsule Fabrication
A two-part Sylgard® 184 Silicone Elastomer was used as the healing agent and base matrix.
Microcapsules were prepared by in situ polymerization in an oil-in-water emulsion. At room
temperature, 50 mL of 2.5 wt% aqueous solution of EMA copolymer was mixed with 200
mL deionized water in a 500 mL beaker. 5 g of urea, 0.5 g of ammonium chloride, and 0.5 g

94
of resorcinol was added to the solution, and then, it was sonicated using the ultrasonic liquid
processor (Misonix, USA) until it was well-mixed. Then, the beaker was transferred to the
magnetic stirring plate for constant mixing at a stir rate of 7.5. The stir rate determines the
size of the microcapsules. The pH was adjusted to 3.5 by adding either sodium hydroxide
(NaOH) or hydrochloric acid (HCl). One to two drops of 1-octanol were added to eliminate
surface bubbles. A slow stream of 60 mL microcapsule content, two-part Sylgard® 184
silicone, was added to form an emulsion and was allowed to stabilize for 10 min. After
stabilization, 11.18 mL of 37 wt% aqueous solution of formaldehyde was added to obtain a
1:1.9 molar ratio. The emulsion was placed in a water bath and heated at a rate of 1°C/min to
achieve the target temperature of 55°C. After 4 h of continuous agitation, the mixture was
cooled to room temperature. The microcapsule was suspended under vacuum with a coarse
filter. The microcapsules were rinsed with deionized water and air dried for 24–48 h.
Microcapsule fabrication was performed for each part of the silicone elastomer separately.
6.3.2.2 Self-healing Sample Fabrication
Once two-part healing agents were encapsulated in poly(urea-formaldehyde) (UF) shells and
dried microcapsules were obtained, self-healing samples were fabricated. The two-part
Sylgard® 184 Silicone Elastomer was used as the base matrix. As mentioned earlier,
microcapsule part A contains PDMS resin and microcapsule part B contains the Pt catalyst.
Samples with various concentrations of microcapsule part A (0, 10, 15, and 20 wt%) and part
B (fixed at 5 wt%) were fabricated as demonstrated in Fig. 6.1. Three samples of each
concentration were fabricated to verify reproducibility.
Figure 6.1. Vinyl-terminated polydimethylsiloxane (PDMS) resin and platinum catalyst encapsulated together in poly(urea-formaldehyde) (UF) shell. Poly(methylhydrosiloxane) copolymer is encapsulated separate in the same
shell. Both capsules are embedded in vinyl-terminated PDMS base matrix.
95
6.3.3 Characterization of self-healing silicone
6.3.3.1 Microscope Characterization of self-healing silicone
An optical microscope (Micromaster, Fisher Scientific, USA) was used to capture
images of the surface and microcapsules of the silicone samples. The area of rupture after
healing was observed by ultra-compact 14-bit CCD camera (pco.pixelfly, PCO, Kelhem,
Germany) equipped in the microscope and image analysis software. A scanning emission
microscope (SEM) (JEOL JSM6060, USA) was used to examine the morphology of the
microcapsules. Samples were sputter coated with a thin layer of platinum to reduce charging.
6.3.3.2 Mechanical Characterization of self-healing silicone
In order to test the self-healing properties, dogbone-shaped samples were fabricated
using a metal mold according to ASTM D638. Tensile tests were performed using Instron
5848 Dual Column Tabletop Testing Systems with a 500 N load cell at a strain rate of 0.1
mm/s until the samples ruptured. Both ends of the sample were gripped tightly with the
tensile testing grips. Damaged samples were manually pressed on together to gain instant
attachment and cured for 24 h at room temperature. The tensile properties of undamaged and
damaged samples were compared.
6.3.3.3 Ultrasonic Characterization of self-healing silicone
Ultrasonic measurements were conducted using a through-transmission normal incidence
setup as demonstrated in Fig. 5.2. A 3.5-MHz focused immersion transducer with a focal
distance of 17cm (V381-SU, Olympus Panametrics NDT) was used to transmit a signal,
which was received by a 3.5-MHz flat immersion transducer (A381S-SU, Olympus
Panametrics NDT). A radio frequency (RF) power amplifier was used to amplify the signal
(411LA, ENI Co., 10 W and 40 dB) before transmitting it through a sample. The detected
signal was transmitted by an analog-to-digital converter (ADC, PXIe-5122) and NI-SCOPE
software (National Instruments) to the LabView software for signal processing. The
temperature of the water was 23 ± 2°C. Rectangular samples (180 × 65 × 5 mm3) were
fabricated, and an ultrasonic signal was transmitted through five different points across the
length of the samples. Speed of sound (SOS) and frequency-dependent attenuation coefficient
α(f) were calculated using MATLAB. Note that the arrival time difference dt was taken as the
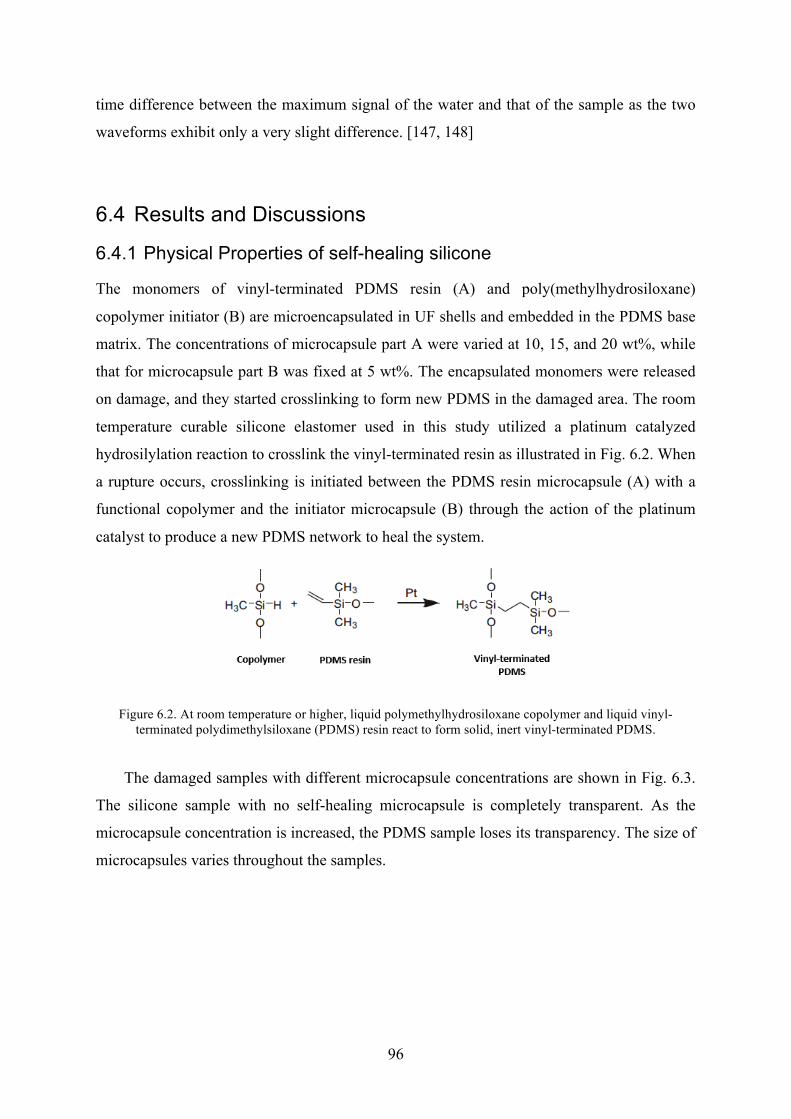
96
time difference between the maximum signal of the water and that of the sample as the two
waveforms exhibit only a very slight difference. [147, 148]
6.4 Results and Discussions
6.4.1 Physical Properties of self-healing silicone
The monomers of vinyl-terminated PDMS resin (A) and poly(methylhydrosiloxane)
copolymer initiator (B) are microencapsulated in UF shells and embedded in the PDMS base
matrix. The concentrations of microcapsule part A were varied at 10, 15, and 20 wt%, while
that for microcapsule part B was fixed at 5 wt%. The encapsulated monomers were released
on damage, and they started crosslinking to form new PDMS in the damaged area. The room
temperature curable silicone elastomer used in this study utilized a platinum catalyzed
hydrosilylation reaction to crosslink the vinyl-terminated resin as illustrated in Fig. 6.2. When
a rupture occurs, crosslinking is initiated between the PDMS resin microcapsule (A) with a
functional copolymer and the initiator microcapsule (B) through the action of the platinum
catalyst to produce a new PDMS network to heal the system.
Figure 6.2. At room temperature or higher, liquid polymethylhydrosiloxane copolymer and liquid vinyl-terminated polydimethylsiloxane (PDMS) resin react to form solid, inert vinyl-terminated PDMS.
The damaged samples with different microcapsule concentrations are shown in Fig. 6.3.
The silicone sample with no self-healing microcapsule is completely transparent. As the
microcapsule concentration is increased, the PDMS sample loses its transparency. The size of
microcapsules varies throughout the samples.

97
Figure 6.3. Ruptured self-healing silicone samples with 0, 10, 15, and 20 wt% of microcapsule A and fixed 5 wt% of microcapsule B
6.4.2 Structural and Morphological Properties of Self-healing Silicone
The morphological properties of the self-healed samples are examined at the location of the
rupture. Fig. 6.4 shows the rupture area of the damaged sample after it was manually pressed
and healed for 24 h. For effective self-healing, the healing agent needs to be released from
the ruptured microcapsules, and it has to fill the damaged region. Optical microscope images
confirmed that areas of damage were filled with the self-healing PDMS resin. White particles
exist in parts of the filled resin (Fig. 6.4 (a) and (b)); these particles are small microcapsules
that have not been activated.
0 wt% 10 wt% 15 wt% 20 wt%

98
Figure 6.4. Optical Microscope image of rupture region of samples with different microcapsule A
concentrations. a) 10 wt%, b) 15 wt% and c) 20 wt%
The microstructure of the rupture region of the self-healing silicone was also captured as
demonstrated by the SEM image. The SEM images of the cross-section of the rupture region
demonstrate microcapsules of different sizes distributed throughout the sample. (Fig. 6.5 (a)–
(d)) Three major structures appear in the SEM images of the cross-section of a failure plane:
an empty hole, an agglomerate region of multiple small microcapsules, and a filled hole. An
empty hole could be air pockets created during the fabrication process or microcapsules from
where the healing agent flows out. The next two structures are interesting to consider as
clearly illustrated in Fig. 6.5 (c) and (d). As mentioned earlier, microcapsules were fabricated
with different sizes. Smaller microcapsules tend to agglomerate in certain areas or pockets.
This restricts the microcapsules to activate properly when rupture occurs to polymerize the
new form of the PDMS resin. The last region is where holes are present with a thin layer of
coating. These holes are considered to be microcapsules that activate upon rupture and
release self-healing agents. Although it is difficult to identify which microcapsule healing
content was contained, when microcapsule A or B contents are in contact, they start the
polymerization to initiate self-healing.
(a) (b) (c)

99
Figure 6.5. SEM image of cross-section region of ruptured silicone with self-healing microcapsules at different magnifications
6.4.3 Self-healing properties of silicone
The self-healing property of silicone was examined by tensile tests using an Instron machine.
First, the samples were subjected to tensile load at a rate of 0.1 mm/s until the samples were
ruptured and its Young’s modulus was obtained. Fig. 6.6 demonstrates that the modulus
reduces as the microcapsules are incorporated and it increases as the microcapsule
concentration increases. Typically, the Young’s modulus of a human liver tissue ranges
between 6.4-60 Pa. [118] The modulus of silicone with microcapsules is much higher than
those reported liver values.
Figure 6.6. Young's modulus of undamaged self-healing silicone with 0, 10, 15 and 20 wt% microcapsule part A
(a) (b)
(c) (d)

100
The load-displacement graph was also compared for the control (no microcapsule) and
self-healing samples prior to damage and after, as illustrated in Figs. 6.7 and 6.8. It is shown
that the samples withstand lower load for longer displacement with an increase in
microcapsule concentration. After the sample was ruptured, tensile testing was performed to
compare the behavior of the samples with respect to microcapsule concentrations. As
demonstrated in Fig. 6.8, the displacement decreased by 20% with 20 wt% microcapsule A
content. The self-healing property decreases further when microcapsule A content increases.
This may be because the ratio or size of microcapsules A and B is not precise. The
microcapsule-based self-healing occurs when parts A and B react and polymerize.
Figure 6.7. Load-displacement graph of undamaged samples with different concentrations of microcapsule A
content
Figure 6.8. Load-displacement graph of damaged samples with different concentrations of microcapsule A
content
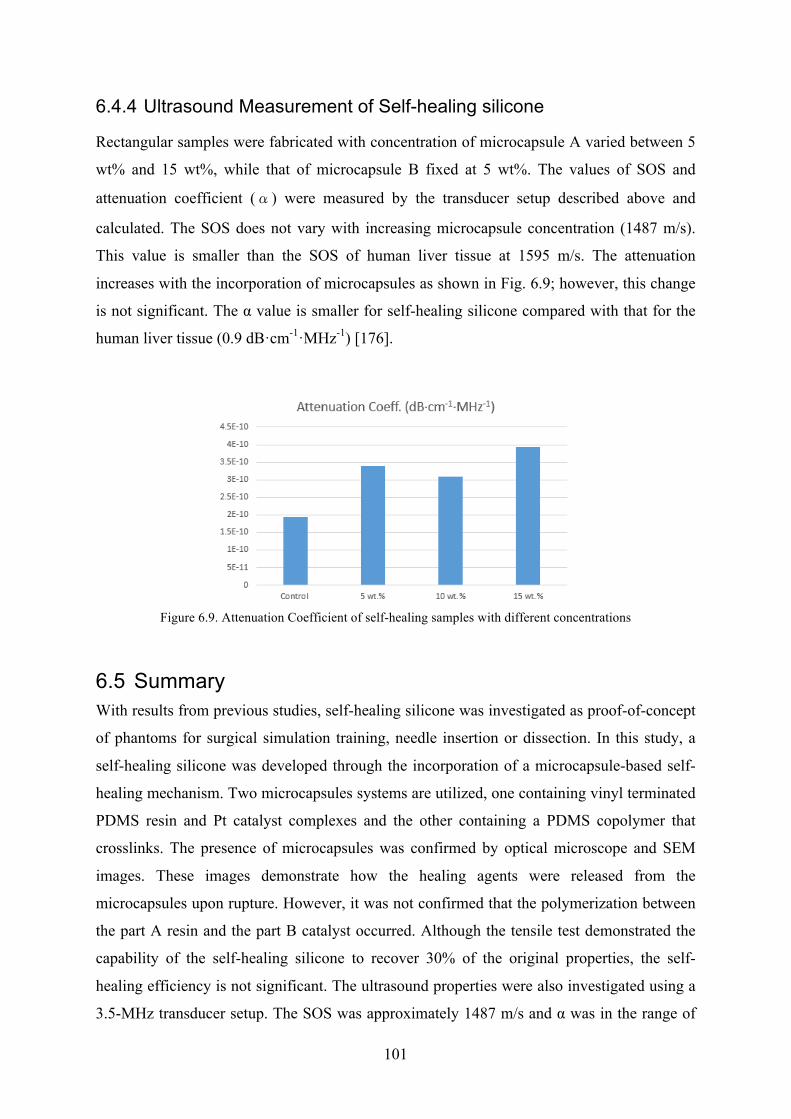
101
6.4.4 Ultrasound Measurement of Self-healing silicone
Rectangular samples were fabricated with concentration of microcapsule A varied between 5
wt% and 15 wt%, while that of microcapsule B fixed at 5 wt%. The values of SOS and
attenuation coefficient (α) were measured by the transducer setup described above and
calculated. The SOS does not vary with increasing microcapsule concentration (1487 m/s).
This value is smaller than the SOS of human liver tissue at 1595 m/s. The attenuation
increases with the incorporation of microcapsules as shown in Fig. 6.9; however, this change
is not significant. The α value is smaller for self-healing silicone compared with that for the
human liver tissue (0.9 dB·cm-1·MHz-1) [176].
Figure 6.9. Attenuation Coefficient of self-healing samples with different concentrations
6.5 Summary With results from previous studies, self-healing silicone was investigated as proof-of-concept
of phantoms for surgical simulation training, needle insertion or dissection. In this study, a
self-healing silicone was developed through the incorporation of a microcapsule-based self-
healing mechanism. Two microcapsules systems are utilized, one containing vinyl terminated
PDMS resin and Pt catalyst complexes and the other containing a PDMS copolymer that
crosslinks. The presence of microcapsules was confirmed by optical microscope and SEM
images. These images demonstrate how the healing agents were released from the
microcapsules upon rupture. However, it was not confirmed that the polymerization between
the part A resin and the part B catalyst occurred. Although the tensile test demonstrated the
capability of the self-healing silicone to recover 30% of the original properties, the self-
healing efficiency is not significant. The ultrasound properties were also investigated using a
3.5-MHz transducer setup. The SOS was approximately 1487 m/s and α was in the range of

102
2.0–4.0 ×10⁻¹⁰ dB/cm-MHz. These values are lower than those reported for human liver
tissue. In the future, the effect of the microcapsule, the ratio of parts A and B, and detailed
self-healing testing needs to be performed to confirm the applicability of self-healing silicone
as a phantom.
103
7 Conclusions and Recommendations
7.1 Concluding Remarks With the advancement of medical imaging technology and increasing concern for quality
assurance, the need for the development of a phantom for calibration and training purposes
has risen. The objective of this research was to examine various polymer-based materials for
multimodal medical imaging phantoms and to study their physical, mechanical and imaging
properties to mimic the human tissue values, mainly human liver tissue. The focus of the
project has advanced based on the findings of each study.
First, we started with water-based carrageenan gel for fabrication of phantom with lesion
particles. The objective of this study is to validate the viability and durability of the water-
based gels since few papers have dealt with its long-term stability and only reported on
fungal growth. Carrageenan-based polymer gel samples were fabricated and their chemical,
mechanical, dielectric, and imaging properties were examined to assess their similarity to
those of human tissue. With variation in the concentrations of constituents, the carrageenan-
based gel samples were in good agreement with human liver tissue values. A six-week
stability test was also conducted on each property. The mechanical properties such as the
density and elastic modulus fluctuated with time with no specific pattern, which was
hypothesized to be due to the expulsion and absorption of water by the samples. The
dielectric properties of the samples, namely the conductivity and permittivity, did not change
with time. The imaging properties, T1 and T2 relaxation times, of the samples were also
observed over six weeks. Changes of about 23-29 % were observed in T1 and T2. The CT
Hounsfield units were also obtained at 120kVp and the values simulate those of human tissue
values. However, the long-term stability of CT numbers is not validated. Although each
property does not serve the equal importance, mechanical, physical and imaging properties
should be maintained small deviation to maintain its shape, rigidity and calibration accuracy
over time. For accurate calibration over the shelf life of a phantom, the fluctuation of its
properties should be minimized. The recommended shelf life of a phantom is more than 6
months up to 3 years. If the physical, mechanical and imaging properties change significantly
over 6 week period, it can be projected to change with wider range over longer period during
the shelf life of the phantom. However, there is no standard guideline to define an acceptable
Chapter 7

104
degree of variation. Based on the reported measurements in the literature, the fluctuation of
the measured values on carrageenan-based gels was much bigger than the mean standard
deviation on human tissue measurements. Therefore, we conclude that the change in the
relaxation values is not within the acceptable range and thus, the carrageenan or agar gel does
not perform as stable material for phantom.
Based-on the long-term stability validation from the first study, there was an urge to
fabricate a solid phantom that is not made of a water-based material. It led us to the second
study where the feasibility of silica and cellulose aerogel as a material for medical imaging
phantoms was examined. Aerogel has unique properties such as mesoporosity, high surface
area, and lightweight. If the aerogel can be immersed in water during calibration procedure
and provide tailored imaging properties of human tissue, it can be adequate as phantom
application. First, silica aerogel was cross-linked with di-isocyanate to widen the neck
regions of the microstructure to help withstand applied force as it was confirmed by SEM
images. Diagnostic imaging properties of silica aerogels, including T1 and T2 relaxation times
on MRI and CT HU values indicated some correlation between the aerogels and human
tissues. Next, cellulose a aerogel cross-linked with superparamagnetic complex was also
examined as a potential medical imaging phantom material. XRD was performed to confirm
the presence of CoFe2O4 with JCPSD card no.79-1744. With the uptake of water, the
cellulose aerogel demonstrated MRI/CT-compatibility. The T1 value ranged from 172 to 626
ms and the T2 value ranges between 36 and 129 ms, while CT number ranged between 167 to
395HU. However, at CoFe2O4 concentrations of 0.06 mol/L and 0.12 mol/L, the MRI and CT
result could not be obtained. Thus, a higher concentration should be examined to verify the
effect of superparamagnetic concentrations on the MR results. In order to mimic a specific
human tissue, we can tailor the concentrations of modifiers (Gd-DTPA and CoFe2O4) to
mimic its values. Since aerogel is in dried form, it can be reused with different concentrations
after subsequent drying process. Due to its structural stability and ability to be imaged under
MRI and CT, silica and cellulose aerogel has potential as perfusion phantom or phantom that
mimics the porous structure of human organs. However, due to significant volume shrinkage
during the supercritical drying process and complex fabrication setup restricts the mass-
production at larger scale phantoms. Thus, various drying procedure conditions should be
examined to minimize the volume change.
Aerogels have shown its potential as medical phantom; however, its complicated
fabrication process could pose restriction on its use. In this study, UV-curable silicone,
105
another type of solid polymer, was investigated as potential liver tissue mimicking phantom.
With various concentrations of silicone constituents, we proposed 3D printable silicone using
DLP technique. Several studies introduced the concept of 3D printing for phantom
application but these techniques required fabrication of mold using 3D printing and filling the
mold with phantom material. This study suggests a novel material that can be employed as
resin for bottom up UV-curing system. Commercially available UV-curable silicone was
mixed with hydrophilic silicone and water to alter the properties. Results demonstrate that
increasing water content enhances the UV-curing time. The curing time lowered to 20
seconds with 20 vol% water content. It is desirable to achieve less than 10 seconds of curing
time to achieve fast curing for 3D printing application. The ultrasound results were lower
than the human liver tissue value at SOS of 1575 m/s. MRI results demonstrate that at water
content of 10vol%, T1 and T2 relaxation times were closest to the human liver tissue. As
increase in HS content, the T1 increases and T2 decreases, reaching the values of human liver
tissue. In the future, higher HS content at 10 vol% water should be investigated to acquire
relaxation values close to the target. CT results show that as the water content increases, the
HU values lowered as well, reaching the value of human soft tissue values. In this study,
silicone has been proven to be good material to be suitable for liver phantom. By addition of
water and HS, we improved the mechanical and imaging properties. In order to enhance the
imaging properties of silicone further, addition of subsequent contrast agents is suggested.
With suitable properties of UV-curable silicone, we will fabricate real-size liver phantom by
using Digital Light Processing (DLP) 3D printing technique for customization of phantom
specific to a patient.
From the third study, the silicone has proven to be a suitable as tissue-mimicking
material. With increase demand for phantom application in clinician training, surgical
planning with needle-insertion or dissection, self-healing material is suggested as proof-of-
concept in this study. In this study, a self-healing silicone has been developed through
incorporation of a microcapsule-based self-healing mechanism. Two microcapsules system is
utilized, one containing vinyl terminated poly(dimethyl siloxane) (PDMS) resin and platinum
catalyst complexes and the other containing a PDMS copolymer that crosslinks. The presence
of microcapsules was confirmed by optical microscope and SEM images. These images
demonstrate that the healing agents were released from the burst microcapsules upon rupture.
However, it was not confirmed that the polymerization between part A resin and part B
initiator has happened. Although the tensile test demonstrated the capability of the self-

106
healing silicone to recover 30% of the original properties, the self-healing efficiency is not
great. The ultrasound properties were also investigated using 3.5MHz transducer setup. The
speed of sound was approximately 1487m/s and the attenuation coefficient in the range of 2.0
to 4.0 ×10⁻¹⁰ dB/cm-MHz. These values are lower than reported human liver tissue. In the
future, the effect of microcapsule, ratio of part A and B, and detailed self-healing testing
needs to be performed to confirm the self-healing silicone for its phantom application.
Overall, imaging properties of each material has been summarized in Table 7.1.
Concentrations of each material can be selected to simulate different human tissues, organs or
abnormalities. Among materials examined in this thesis, silicone is the most suitable
candidate for phantom since it can be manufactured with simplicity and well maintains
stability of its properties.
There are a number of properties that can be used as measure of tissue equivalence of a
phantom. The physical density and effective atomic number (Zeff) can be used to provide
insight into the physical properties of properties. The electron density (ρe) and the mass
energy-absorption coefficient (µen/ρ) can be used to find the energy deposited locally in the
targeted tissue. If these properties can be controlled, imaging properties will be better
controlled.

107
Table 7.1. Summary table of property values of each phantom materials
Material Modality Property Concentration Values Liver Values
Carrageenan Gel MRI
T1 Carrageenan 3g, Agar 0-1.5g Values vary between 248 to 364 ms
812±64 Carrageenan 1-2.5g, Agar 1.5g Values vary between 230 to 646 ms
T2 Carrageenan 3g, Agar 0-1.5g Values vary between 99 to 169 ms
42±3 Carrageenan 1-2.5g, Agar 1.5g Values vary between 78 to 137ms
CT HU Carrageenan 3g, Agar 0-1.5g Values vary between 24 to 48 HU +40 to +60 Carrageenan 1-2.5g, Agar 1.5g Values vary between 36 to 59 HU
Silica Aerogel MRI T1 Gd-DTPA, 0.085 – 0.34 µL/mL Decreases from 1415 to 541 ms 812±64
T2 Gd-DTPA, 0.085 – 0.34 µL/mL Increases from 230 to 295 ms 42±3
CT HU Gd-DTPA, 0.085 – 0.34 µL/mL Decreases 227 to 190 HU +40 to +60
Cellulose Aerogel (0.24 mol/L CoFe2O4)
MRI T1 Cellulose 5-10 wt% Decreases from 536 to 172 ms 812±64
T2 Cellulose 5-10 wt% Increases 52 to 77 ms 42±3 CT HU Cellulose 5-10 wt% Decreases from 395 to 167 HU +40 to +60
Silicone
MRI
T1 HS 30 vol%, Water 0-10 vol%, Increases from 333 to 430 ms 812±64 HS 10 – 50 vol% Increases from 306 to 620 ms T2 HS 30 vol%, Water 0-10 vol% Decreases from 33 to 27 ms 42±3 HS 10 – 50 vol% Decreases from 110 to 54 ms
CT HU HS 10 vol%, 0-20 vol% Water Decreases from 142 to 77HU +40 to +60 HS 20 vol%, 0-20 vol% Water Decreases from 156 to 123 HU
US
SOS HS 10 vol%, 0-20 vol% Water Decreases from 1275 to 905 m/s 1549 (m/s) HS 20 vol%, 0-20 vol% Water Decreases from 1237 to 1095 m/s
α HS 10 vol%, 0-20 vol% Water Decreases from 0.4 to 0.17 dB/(cm-MHz) 0.9 dB/(cm-MHz)
HS 20 vol%, 0-20 vol% Water Decreases from 0.35 to 0.32 dB/(cm-MHz)
Self-healing US SOS Microcapsule A Content 5-15wt% 1487 m/s 1549 (m/s) α Microcapsule A Content 5-15wt% 2.0–4.0 ×10⁻¹⁰ dB/cm-MHz 0.9 dB/(cm-MHz)

108
7.2 Contributions The key contributions of this research are as follows:
1. Novel polymer-based materials were developed and their physical, mechanical and
imaging properties were investigated for multimodality imaging phantom.
2. Long-term stability of water-based polymer gel was investigated and addressed the
problem with consistency and clinical accuracy of the phantom. This suggests that although
most of the water-based materials provide good tissue-mimicking properties, the values may
not be consistent.
3. Novel approach of organic and inorganic aerogels was suggested as a solid phantom
material. It was found that aerogels could be used as reservoir of water to function to provide
similar imaging properties to human tissue. Prior to the calibration, aerogels with optimal
concentrations of contrast agents (Gd-DTPA or CoFe2O4) can be soaked in water to serve as
phantom. After the use, the aerogels can be dried again for storage. These materials can be
used as perfusion phantoms where water uptake is necessary.
4. UV-curable silicone can open an opportunity for patient-specific customized phantom
production. Commercially available phantoms are costly and difficult to fabricate. However,
if UV-curable silicone material is fine-tuned to provide optimal concentrations correlated
with each human tissue properties, doctors and health technicians can easily print the
phantom of target area based on US, CT and/or MRI images.
5. The concept of applying self-healing material for training and surgical planning tool is
introduced and proof-of-concept silicone material was fabricated and examined. This new
concept will increase the shelf life of the phantom and repeatability of needle-insertion
operation.
7.3 Recommendations Throughout the studies in this research, we have demonstrated fabrication of several
polymer-based materials and its properties. With increase need for phantom in different
applications, we believe that each studied material has potential as phantom material. In the

109
following section, few recommendations are provided to improve its feasibility and future
research and development.
1. Although results show that properties fluctuate due water expulsion and absorption, the
water-based gels still exhibit good tissue-mimicking properties. If an efficient storage system
is developed to minimize the fluctuation of water, the change in properties can be minimized,
hence the accuracy of the calibration phantom can be consistent.
2. Other drying techniques (freeze drying or ambient drying) should be investigated to
improve the aerogel fabrication method. Volume shrinkage and difficult drying process limits
the use of aerogel. Furthermore, other contrast agents should be examined to identify the
optimal properties and to minimize any artifacts.
3. The curing time plays an important role in 3D printing technique. As results demonstrated,
the curing time decreases as the water content increases. Also, the imaging properties were
closest to the human liver tissue values when water content is at 10 vol%. Thus, further
investigation is recommended to study the effect of HS content or other contents at 10 vol%
H2O on imaging properties. To improve US, CT and MRI measurements, addition of iodine,
graphite powder or PMMA is suggested.
4. Self-healing silicone was investigated as proof-of –concept. Further investigation on ratio
of microcapsule part A and B, other type of self-healing mechanisms and their self-healing
efficiency needs to be done. For the purpose of the training and needle-insertion, multiple
repetition of the self-healing efficiency is highly recommended. Thus, intense study on the
efficiency and repetition of the self-healing ability needs to be carried out.
5. It is highly recommended to investigate a silicone material that have ability to be 3D
printed and serve multiple self-healing at the same time to meet the material properties to
mimic human tissue values. If such material can be achieved, customization of the phantom
can be generalized to promote new surgical procedures or assist training of clinicians.

References [1] “Medical Imaging Systems” in O. Demirkaya, M.H. Asyali, P.K. Sahoo (Eds.) Image processing with MATLAB: application in medicine and biology, pp. 1-47, 2008, Florida, CRC Press, Taylor & Francis Group.
[2] P. Hauff, M. Reinhardt, S. Foster, Ultrasound Basics in W. Semmler, M. Schewaiger (eds.) Molecular Imaging I, pp. 91-103, 2008, Berlin, Springer-Verlag.
[3] A. Lorenz, B. Betsch, (1995). Zur Geschichte der Ultraschalldiagnostik - von der Compoundtechnik zur Realtimesonographie. Ultraschall Klin Prax, 10, pp. 41–49.
[4] I. Edler, K. Lindstr¨om, (2004). The history of echocardiography. Ultrasound Med Biol, 30 pp. 1565–1644.
[5] J.P. Baker JP, (2005). The history of sonographers, J Ultrasound Med, 24, pp.1–14.
[6] D.E. Goertz, D.A. Christopher, J.L. Yu et al., (2000). High-frequency color flow imaging of the microcirculation, Ultrasound Med. Biol., 26, pp. 63–71.
[7] D.E. Goertz, J.L. Yu, R.S. Kerbel et al., (2002). High-frequency Doppler ultrasound monitors the effects of antivascular therapy on tumor blood flow, Cancer Res., 62, pp. 6371–6375.
[8] D.E. Goertz, J.L. Yu, R.S. Kerbel et al., (2003). High-frequency 3-D color-flow imaging of the microcirculation, Ultrasound Med Biol, 29, pp. 39–51.
[9] D.E. Goertz, A. Needles, P.N. Burns et al., (2005). High Frequency Nonlinear Color Flow Imaging of Microbubble Contrast Agents. IEEE Trans Ultrason, Ferroelect, Freq Contr, 52, pp. 495–502.
[10] Feigenbaum's Echocardiography, 6th Edition, (2005). Lippincott Williams & Wilkins, Philadelphia, PA, USA.
[11] V. Schrope, V.L. Newhouse, V. Uhlendorf, (1992). Simulated capillary blood flow measurement using a non-linear ultrasonic contrast agent, Ultrasonic Imaging, 14, pp.134-158.
[12] N. De Jong, (1997). “Physics of microbubble scattering” In: Nanada NC, R.Schlief, B.B. Goldber (eds) Advances in echo imaging using contrast enhancement, 2nd Ed, Kluwer, Dordrecht, pp.39-64.
[13] F. Forsberg, W.T. Shi, B.B Goldberg, (2000). Subharmonic imaging of contrats agents. Ultrasonics, 38, pp. 93–98
[14] P.N. Burns, J.E. Powers, T. Fritzsch, (1992). Harmonic imaging: a new imaging and Doppler method for contrast enhanced ultrasound, Radiology, 185, pp. 142.

111
[15] N. De Jong, R. Cornet, C.T. Lancee, (1994). Higher harmonics of vibrating gas-filled microspheres. Part one: Simulations, Ultrasonics, 32, pp. 447–453.
[16] Zheng H, Mukdadi O, Kim H et al., (2005). Advantages in using multifrequency excitation of contrast microbubbles for enhancing echo particle image velocity techniques: initial numerical studies using rectangular and triangular waves, Ultrasound Med. Biol., 32, pp. 99–108.
[17] M.Postema, A.Boukaz, M.Versluis, (2005). Ultrasound-induced gas release from contrast agent microbubbles, IEEE Transaction of Ultrason., Ferroelec., Freq. Contr., 52, pp.1035-1041.
[18] M.Reinhardt, P.Hauff, A.Briel, (2005). Sensitive particle acoustic quantification (SPAQ): a new ultrasound-based approach for the quantification of ultrasound contrast media in high concentrations, Investigative Radiology, 40, pp.2-7.
[19] J. Browne, K.V. Ramnarine, A.J. Watson, P.R. Hoskins, (2003). Assessment of the acoustic properties of common tissue-mimicking test phantoms, Ultrasound in Medicine and Biology, 20, pp. 1053-1060.
[20] L.M.Cannon, A.J. Fagan, J.E. Browne. (2011). Novel tissue mimicking materials for high frequency breast ultrasound phantoms. Ultrasound in Medicine and Biology, 37, pp.122-135.
[21] M.O. Culjat, D. Goldenberg, P. Tewari, R.S. Singh. (2010). A Review of tissue substitutes for ultrasound imaging, Ultrasound in Medicine and Biology, 36, pp. 861-873.
[22] M.P. Brewin, L.C. Pike, D.E. Rowland, M. J. Birch, The acoustic properties, centered on 20MHZ, of an IEC agar-based tissue-mimicking material and its temperature, frequency and age dependence. Ultrasound in Medicine and Biology, 34, pp.1292-1306 (2008).
[23] P.N.T. Wells, Biomedical Ultrasonics, New York: Academic Press, 1977
[24] Wolbarst, Physics of Radiology Norward, CT, Appleton and Lange, 1993.
[25] J. Ophir, I. Cespedes, H. Ponnekanti, Y. Yazdi, X. Li, (1991). Elastography: A quantitative method for imaging the elasticity of biological tissues. Ultrasounic Imaging, 13, pp.111-134.
[26] W.F. Walker, F.J. Fernandez, L.A.Nergron, (2000). A method of imaging viscoelastic parameters with acoustic radiation force. Physics in Medicine and Biology, 45, pp.1437-1447.
[27] D. Xu, S. Abbas, V.W. Chan, (2005). Ultrasound phantom for hands-on practice. Regional Anesthesia and Pain Medicine, 30, pp.593-594.
[28] L.M.Cannon, A.J.Fagan, J.E.Browne, (2010). Tissue Mimicking Materials for High Frequency Breast Ultrasound Phantoms, Ultrasound in Medicine and Biology, 37(1), pp. 122-135.
[29] S.P. Foroozandehasl, M. Jaafar, Proceedings of IEEE International Conference on Imaging Systems and Techniques, 2011, p 215-218.

112
[30] B.D.Price, A.P. Gibson, G.J. Royle, (2010). Dual-modality imaging of a compressible breast phantom with realist optical and x-ray properties, in Proceedings of SPIE, Medical Imaging, 7622, 762207.
[31] K. Zell, J. I. Sperl, M.W. Vogel, R. Niessner, C. Haisch, (2007). Acoustical properties of selected tissue phantom materials for ultrasound imaging, Physics of Medicine and Biology, 52, pp N475-N484.
[32] K.J.M.Surry, H.J.B.Austin, A.Fenster, T.M.Peters, (2004). Poly(vinyl alcohol) cryogel phantoms for use in ultrasound and MR imaging, Physics in Medicine and Biology, 49, pp.5529-5546.
[33] M.Choi, S.Guntur, K.Lee, D.Paeng, A. Coleman, (2013). A Tissue Mimicking Polyacrylamide Hydrogel Phantom for Visualizing Thermal Lesions Generated by high Intensity focused Ultrasound, Ultrasound in Medicine and Biology, 39(3), pp.439-448.
[34] C. Lafon, Z. Vesna, M. Noble, J.C.Yuen, S.J.Vaezy, (2005). Gel phantom for use in high intensity focused ultrasound dosimetry, Ultrasound Med. Biol., 31, pp.1383–1389.
[35] G.N. Hounsfield, (1973) Computerized transverse axial scanning (tomography). Part I. Description of system. Br J Radiol., 46, pp. 1016.
[36] A.C. Kak, M. Slaney, “Principles of Computerized Tomographic Imaging”, New York, IEEE Press, 1988.
[37] C. Axelsson, P.E. Danielsson, (1994). Three-dimensional reconstruction from cone-beam data in O(N3 log N) time, Phys. Med. Biol., 39(3), pp. 477–491.
[38] Basu S, Bresler Y (2000) An O(N2\log2N) filtered backprojection reconstruction algorithm for tomography. IEEE Trans Image Process, 9(10), pp. 1760–1773.
[39] W.A. Kalender, “Computed Tomography: Fundamentals, system Technology, Image Quality, Applications”, Publicis MCD, Munich, Germany: Verlag, 2000.
[40] M. Kachelrieß, O. Watzke, W.A. Kalender, (2001). Generalized multi-dimensional adaptive filtering for conventional and spiral single-slice, multi-slice, and cone-beam CT, Med. Phys., 28(4), pp. 475–490.
[41] International Electrotechnical Commission. (2009). Medical electrical equipment: Part 2-44- Particular requirements for the safety of x-ray equipment for computed tomography. Publication no. 60601-2-44. Ed. 3.: International Electrotechnical Commission, 1-36, Geneva, Switzerland.
[42] J. Hsieh, (1999). Three-dimensional artifact induced by projection weighting and misalignment, IEEE Trans Med Imaging, 18(4), pp. 364–368.
[43] G.M. Stevens, R. Saunders, N.J. Pelc, (2001). Alignment of a volumetric tomography system, Med. Phys., 28(7), pp. 1472–1481.

113
[44] L. von Smekal, M. Kachelrieß, E. Stepina, W.A. Kalender, (2004). Geometric misalignment and calibration in cone-beam tomography, Med. Phys., 31(12), pp. 3242–3266.
[45] E.C. McCullough, H.I. Raker, O.W. Houser, D.F. Reese, (1974). An evaluation of the quantitative and radiation features of a scanning x-ray transverse axial tomography: the EMI scanner. Radiology, 111, pp. 709-715.
[46] E.C. McCullough, J.T. Payne, H.L. Baker, R.R. Hattery, P.P. Sheedv, D.S. Stephens et al. (1976). Performance evaluation and quality assurance of computed tomography (CT) equipment with illustrative data for ACTA, delta and EMI scanners, Radiology, 120, pp. 173-188.
[47] P.F. Judy, S. Balter, D. Bassano, E.C. McCullough, J.T. Payne, L. Rothenberg, (1977). Phantoms for performance evaluation and quality assurance of CT scanners. AAPM report nr. 1. American Association of Physicists in Medicine, Chicago.
[48] D.R. White, R. Martin, R. Darlison, (1977). Epoxy resin based tissue substitutes. British Journal of Radiology, 50, pp. 247-255.
[49] The Institute of Physics and Engineering in Medicine (2003). Measurement of the performance characteristics of diagnostic x-ray systems used in medicine. IPEM Report No:32 Part III: Computed tomography x-ray scanners (2nd edition). Institute of Physics and Engineering in Medicine, New York.
[50] S.W. Alderson, L. Lanzl, M. Rollins, J. Spira. (1962). An instrumented phantom system for analog computation of treatment plans. American Journal of Roentgenology, 87, pp.185-195.
[51] D.R. White. (1978). Tissue substitutes in experimental radiation physics. Medical Physcis, 5, pp. 467-479.
[52] B.R. Archer, S. Glaze, L.B. North, S.C. Bushong. (1977). Dosimeter placement in the rando phantom. Medical Physics, 4, pp 315-318.
[53] S.J. Vacirca, B.S. Pasternack, H. Blatz. (1972). A film-thermoluminescent dosimetry method for predicting body doses due to diagnostic radiography. Physics in Medicine & Biology, 17, pp.71-80.
[54] M.G. Yalcintas, O. Nalcioglu. (1979). A method for dose determination in computerized tomography. Health Physics, 37, pp. 543-548.
[55] W. Kalender, C. Suess, (1987). A new calibration phantom for quantitative computed tomography, Medical Physics, 14, pp. 863-866.
[56] M. Hill, J. Mainprize, G. Mawdesley, M. Yaffe, (2009). A solid iodinated phantom material for use in tomographic x-ray imaging, Medical Physics, 36, pp. 4409-4420.
[57] R. Brauweiler, F. Eisa, M. Hupfer, T. Nowak, D. Kolditz, W. Kalender, (2012). Development and Evaluation of a Phantom for Dynamic Contrast- Enhanced Imaging, Investigative Radiology, 47(9), pp. 462-467.
114
[58] P. Homolka, A. Gahleitner, R. Nowotny, (2002). Temperature dependence of HU values for various water equivalent phantom materials, Physics in Medicine and Biology, 47, pp. 2917-2923.
[59] A. Macovski, “Medical Imaging Systems”, Englewood Cliffs, NJ: Prentice-Hall, 1983.
[60] S. R. Cherry, J.A. Sorenson, M.E. Phelps, “Physics in Nuclear Medicine”, 3rd Ed. Philadelphia, PA: Saunders, 2003.
[61] F. Bloch, WW. Hansen, M.E. Packard, (1946). Nuclear induction, Phys. Rev., 69, pp. 127.
[62] R.C. Mehta, G.B. Pike, D.R. Enzmann, (1996). Magnetization transfer magnetic resonance imaging: a clinical review. Top Magn. Reson. Imaging, 8(4), pp. 214–230.
[63] E.M. Haacke, R.W. Brown, M.R. Thomson et al., (1999). Magnetic resonance imaging, physical principles and sequence design. Wiley-Liss, New York.
[64] M.T. Vlaardingerbroek, J.A. den Boer JA, (2002). Magnetic resonance imaging, theory and practice, 3rd edn. Springer, Berlin Heidelberg New York.
[65] Y.S. Shim, J.Y. Ahn, J.H. Cho, K.S. Lee, (2008). Solitary skull metastisis as initial manifestation of hepatocellular carcinoma, World Journal of Surgical Oncology, 6, pp.66.
[66] J.L. Gunter. (2009). Measurement of MRI scanner performance with the ADNI phantom. Medical Physics, 36(6), pp. 2193-2205.
[67] S. Russek et al. (2012). Characterization of NIST/ISMRM MRI system phantom. Proc. Intl. Soc. Mag. Reson. Med., pp. 2456.
[68] G.J. Stanisz et al. (2005). T1, T2 relaxation and magnetization transfer in tissue at 3T. Magnetic Resonance in Medicine, 54(3), pp. 507-512.
[69] P.C. Sundgren et al. (2004). Diffusion tensor imaging of the brain: Review of clinical applications. Neuroradiology, 46(5), pp. 339-350.
[70] D. Le Bihan. (2003). Looking into the functional architecture of the brain with diffusion MRI. Nature Reviews Neuroscience, 4(6), pp. 469-480.
[71] R. Bitar et al., “MR Pulse Sequences: What Every Radiologist Wants to Know but Is Afraid to Ask”, RadioGraphics, 2006, 26(2), pp. 513-537.
[72] Fisheries and Aquaculture Department, Chapter III: Properties, manufacture and application of seaweed polysaccharides- agar, carrageenan and algin. 6: 107, 1990.
[73] H. Kato et al., (2005). Composition of MRI phantom equivalent to human tissues, Medical Physics. 32(10).
[74] K. Yoshimura et al., (2003). Development of a tissue-equipment MRI phantom using carrageenan gel, Magnetic Resonance in Medicine, 50(5), pp. 1011-1017.

115
[75] M.W. Groch, J.A. Urbon, W.D. Erwin, and S. Al-Doohan. (1991). An MRI tissue equivalent lesion phantom using a novel polysaccharide material. Magnetic Resonance Imaging, 9(3), pp. 417- 421.
[76] G.P. Mazzara, R.W. Briggs, Z. Wu, and B.G. Steinbach. (1996). Use of a modified polysaccharide gel in developing a realistic breast phantom for MRI. Magnetic Resonance Imaging, 14(6), pp. 639- 648.
[77] I. Mano, H. Goshima, M. Nambu, M. Iio, (1986). New Polyvinyl Alcohol Gel Material for MRI Phantoms, Magnetic Resonance in Medicine, 3, pp. 921-926.
[78] B.J. Pichler, M.S. Judenhofer, C. Pfannenberg, Hauff, Multimodal Imaging Approaches: PET/CT and PET/MRI in W. Semmler, M. Schewaiger (eds.) Molecular Imaging I, pp. 109-129, 2008, Berlin, Springer-Verlag.
[79] P.J.Slomka, (2004). Software approach to merging molecular with anatomic information, Journal of Nuclear Medicine, 45(Suppl 1), pp. 36S-45S.
[80] R.Shekhar, V. Waimbe, S. Rja, V. Zagrodsky, M. Kandvinde, (2005). Automated 3-dimensional elastic registration of whole-body PET and CT from separate or combined scanners, Journal of Nuclear Medicine, 46, pp. 1488-1496.
[81] J. Czernin, M.E. Phelps, (2002). Positron emission tomography scanning: current and future applications, Annu. Rev. Med., 53, pp. 89–112.
[82] T. Beyer, D.W. Townsend, T. Brun, P.E. Kinahan, M. Charron et al., (2000). A combined PET/CT scanner for clinical oncology, J. Nucl. Med., 41, pp.1369–1379.
[83] D.W. Townsend, J.P. Carney, J.T. Yap, N.C. Hall, (2004). PET/CT today and tomorrow, J. Nucl. Med., 45(Suppl 1), pp. 4S–14S.
[84] T. Beyer, D.W. Townsend, T.M.Blodgett, (2002). Dual-modality PET/CT tomography for clinical oncology, Q. J. Nucl. Med., 46, pp. 24-34.
[85] W.H.G. Mohnike, “PET/CT Atlas”, Berlin, Springer, 2006.
[86] G. Antoch, N.Saoudi, H.Kuehl, G.Dahmen, S.P.Muelle, (2004). Accuracy of whole-body dual-modality fluorine-18-2-fluoro-2-deoxy-D-glucose positron emission tomography and computed tomography (FDG-PET/CT) for tumor staging in solid tumors: comparison with CT and PET, Journal of Clinical Oncology, 22, pp. 4357-4368.
[87] R.Herrmann, (2005). Radiation oncology and functional imaging, Nuklearmedizin, 44 (Suppl 1), pp. S38-S40.
[88] T. Beyer, G. Antoch, T. Blodgett, L.F. Freudenberg, T. Akhurst, S. Mueller, (2003). Dual-modality PET/CT imaging: the effect of respiratory motion on combined image quality in clinical oncology, Eur. J. Nucl. Med. Mol. Imaging, 30, pp. 588–596.

116
[89] K. Brechtel, M. Klein, M. Vogel, M. Mueller, P. Aschoff, (2006). Optimized contrast-enhanced CT protocols for diagnostic whole-body 18F-FDG PET/CT:technical aspects of single-phase versus multiphase CT imaging, Journal of Nuclear Medicine, 47, pp.470-476.
[90] G.W. Goerres, C. Burger, M.R. Schwitter, T.N. Heidelberg, B. Seifert, G.K. von Schulthess, (2003). PET/CT of the abdomen: optimizing the patient breathing pattern. Eur. Radiol., 13, pp. 734–739.
[91] T. Vaughan, L. DelaBarre, C. Snyder, J. Tian, C. Akgun et al., (2006). 9.4T human MRI: preliminary results, Magn. Reson. Med., 56, pp. 1274–1282.
[92] S. Vandenberghe, P.K. Marsden, (2015). PET-MRI: a review of challenges and solutions in the development of integrated multimodality imaging. Phys. Med. Biol. 60, pp. R115-R154.
[93] R. Lecomte, C.M.Pepin, M.D. Lepage, J-F Pratte, H. Dautet, D.M. Binkley, (2001). Performance analysis of phoswich/APD detectors and low-noise CMOS preamplifiers for high-resolution PET systems, IEEE Transaction of Nuclear Science, 48, pp. 650-655.
[94] R. Grazioso, M. Aykac, M.E. Casey, M. Schmand, (2005). APD Performance in Light Sharing PET Applications, IEEE Trans. Nucl. Sci., 52, pp. 1413–1416.
[95] B.J. Pichler, B.K. Swann, J. Rochelle, R.E. Nutt, S.R. Cherry, S.B. Siegel, (2004). Lutetium oxyorthosilicate block detector readout by avalanche photodiode arrays for high resolution animal PET, Phys. Med. Biol., 49, pp. 4305–4319.
[96] H. Zaidi, B. Hasegawa, (2003). Determination of the attenuation map in emission tomography. J Nucl. Med., 44, pp. 291–315.
[97] A. Zien, G. Ratsch, S. Mika, B. Scholkopf, T. Lengauer, K.R. Muller, (2000). Engineering support vector machine kernels that recognize translation initiation sites. Bioinformatics, 16, pp. 799–807.
[98] J. Huber, Q. Peng, W.Moses, (2009). Multi-Modality Phantom Development, IEEE Transactions on Nuclear Science, 56(5), pp. 2722-2727.
[99] N. Hungr, J.A. Long, V. Beix, J. Trocaz, (2012). A realistic deformable prostate phantom for multimodal imaging and needle-insertion procedure, Medical Physics, 39, pp. 2031-2041.
[100] S. Chen, P. Hellier, M. Marchal, J-Y Gauvrit, R.Carpentier, X.Morandi, D. Collins, (2012). An anthropomorphic polyvinyl alcohol brain phantom based on Colin27 for use in multimodal imaging, Medical Physics, 39(1), pp.554-561.
[101] D. Goldstein, H. Kundel, M. Daube-Witherspoon, L. Thibault, E. Goldstein, (1987). A Silicone Gel Phantom Suitable for Multimodality Imaging, Investigative Radiology, 22, pp. 153-157.
[102] M. Chmarra, R. Hansen, R. Marvik, T. Lango, (2013). Multimodal Phantom of Liver Tissue, PLOS ONE, 8(5), e64180.

117
[103] T.S. Lawrence, R.K. Ten Haken, A. Giaccia. Principles of Radiation Oncology. In: DeVita VT Jr., Lawrence TS, Rosenberg SA, editors. Cancer: Principles and Practice of Oncology. 8th ed. Philadelphia: Lippincott Williams and Wilkins, 2008.
[104] A. Taylor, M.E. Powell, (2004). Intensity-modulated radiotherapy—what is it? Cancer Imaging, 4(2), pp. 68–73.
[105] S.E. Noda, T. Lautenschlaeger, M.R. Siedow et al., (2009). Technological advances in radiation oncology for central nervous system tumors. Seminars in Radiation Oncology, 19(3), pp. 179–186.
[106] N.A. Detorie, (2008). Helical tomotherapy: A new tool for radiation therapy, Journal of the American College of Radiology, 5(1), pp. 63–66.
[107] B.D. Kavanagh, R.D. Timmerman, (2006). Stereotactic radiosurgery and stereotactic body radiation therapy: An overview of technical considerations and clinical applications. Hematology/Oncology Clinics of North America, 20(1), pp. 87–95.
[108] D. Schulz-Ertner, O. Jäkel, W. Schlegel, (2006). Radiation therapy with charged particles. Seminars in Radiation Oncology, 16(4), pp. 249–259.
[109] P.R. Patel, D.W. Arthur, (2006). The emergence of advanced brachytherapy techniques for common malignancies. Hematology/Oncology Clinics of North America, 20(1), pp. 97–118.
[110] E. M. Shapiro et al., (2007). MR imaging of RF heating using a paramagnetic doped agarose phantom, Magnetic Resonance Materials in Physics, Biology and Medicine, 10(2), 114-121.
[111] F. A. Howe, (1988). Relaxation times in paramagnetically doped agarose gels as a function of temperature and Ion concentration, Magnetic Resonance Imaging, 6, pp. 264-270.
[112] K. A. Kraft, P.P.Farouros, G.D. Clarke, and P.R.Kishore, (1987). An MRI phantom material for quantitative relaxometry, Magnetic Resonance in Medicine, 5(6), pp. 555-562.
[113] B. W. Derbyshire and I. D. Durr, (1974). NMR of agarose gels, Faraday Discussion of the Chemical Society, 57, pp. 243-265.
[114] N. N. Morrin and N. M. Rofsky, (2001). Techniques for Liver MR Imaging, MRI Clinics of North America, 9(4), pp. 675-696.
[115] P. M. Fong et al., (2001). Polymer gels for magnetic resonance imaging of radiation dose distributions at normal room atmosphere, Physics in Medicine and Biology 46(12), pp. 3105-3113.
[116] ASTM International, D695-08 (2009).
[117] S. Gabriel et al., (1996). The dielectric properties of biological tissues: II. Measurements in the frequency range 10Hz to 20GHz, Phys. Med. Biol., 41, pp. 2251-2269.

118
[118] W.C. Yeh et al., (2002). Elastic modulus measurements of human liver and correlation with pathology. Ultrasound in Medicine and Biology, 28(4), pp. 467-474.
[119] S. J. Graham, S. Ness, B. S. Hamilton, and M. J. Bronskill, (1997). Magnetic resonance in medicine, Magn. Reson. Med., 38, 669–677.
[120] P. A. Bottomley, C. J. Hardy, R. E. Argersinger, and G. Allen-Moore, (1987). A review of 1H nuclear magnetic resonance relaxation in pathology: are T1 and T2 diagnostic?, Med. Phys. 14, pp. 1–37.
[121] S. F. Akber, (1996). NMR relaxation data of water proton in normal tissues, Physiol. Chem. Phys. Med. NMR, 28, pp. 205–238.
[122] H. Kato et al., (2000). An MRI phantom using carrageenan gel, Japanese Journal of Magnetic Resonance in Medicine, 20(8), pp. 365-373.
[123] A. S. Dorcheh and M. H. Abbasi, (2008). Silica aerogel; synthesis, properties and characterization,” Journal of Materials Processing Technology, 199(1–3), pp. 10–26.
[124] H. D. Zhang, B. Li, Q. X. Zheng, M. H. Jiang, X. T. Tao, (2008). Synthesis and characterization of monolithic Gd2O3 aerogels, J. of Non-Crystalline Solids, 354, pp. 4089-4093.
[125] M.A.B. Meador, L. A. Capadona, L. McCorkle, D. S. Papadopoulos, N. Leventis, (2007). Structure-Property Relationships in Porous 3D Nanostructures as a function of Preparation Conditions: Isocyanate Cross-linked Silica Aerogels, Chem. Mater., 19(9), pp. 2247-2260,
[126] S. Hoepfiner, L. Ratke, B. Milow, (2008). Synthesis and characterization of nanofibrillar cellulose aerogels, Cellulose, 15, pp. 121-129.
[127] E. Choo, X. Tang, Y. Sheng, B. Shuter, J. Xue, (2011). Controlled loading of superparamagnetic nanoparticles in fluorescent nanogels as effective T2-weighted MRI contrast agents, J. of Mater. Chem., 21, pp. 2310-2319.
[128] M. Casula , P. Floris, C. Innocenti, A. Lascialfari, M. Marinone, M. Corti, R. A. Sperling, W. J. Parak, C. Sangregorio, (2010). Magnetic Resonance Imaging Contrast Agents Based on Iron Oxide Superparamagnetic Ferrofluids, Chem. Mater., 22, pp. 1739-1748.
[129] S.Liu, Q. Yan, D. Tao, T. Yu and X. Liu, (2012). Highly flexible magnetic composite aerogels prepared by using cellulose nanofibril networks as templates, Carbohydrate Polymers, 89, pp. 551-557.
[130] W. Li, X. Zhao, S. Liu, (2013). Preparation of entangled nanocellulose fibers from APMP and its magnetic functional property as matrix, Carbohydrate Polymers, 94, pp. 278-285.
[131] G. Zhang et al., (2004). Isocyanate-crosslinked silica aerogel monoliths: preparation and characterization, J. Non Cryst. Solids, 350, pp. 152–164.

119
[132] S.M Lai, C. K. Wang, H. F. Shen, (2005). Properties and preparation of thermoplastic polyurethane/ silica hybrid using sol-gel process, Applied Polymer, 97(3), pp. 1316-1325.
[133] M. Aegerter, Aerogels Handbook, New York: Springer (2011).
[134] E. N. J. Ford, S. K. Mendon, S. F. Thames, J. W. Rawlins, (2010). X-ray Diffraction of Cotton treated with Neutralized Vegetable Oil-based Macromolecular Crosslinkers, J. of Engineered Fibers and Fabrics, 5(1), pp. 10-20.
[135] K. Hattori, Y. Ikemoto, W. Takao, S. Ohno, T. Harimoto, S. Kanazawa, M. Oita, K. Shibuya, M. Kuroda, H. Kato, (2013). Development of MRI phantom equivalent to human tissues for 3.0-T MRI, Med. Phys., 40, pp. 032303-1-11.
[136] S. M. F. Triphan et al., (2015). Oxygen Enhanced Lung MRI by Simultaneous Measurement of T1 and T2* during Free Breathing Using Ultrashort TE, J. Magn.Reson.Imaging, 41, pp. 1708-1714,
[137] S. M. Sangermano. (2013). UV-Activated Hydrosilation Reaction for Silicone Polymer Crosslinking. Journal of Applied Polymer Science. 128, pp. 1521-1526
[138] N. R. Marco Sangermano. (2014). Cationic UV-Curing: Technology and Applications. Journal of Macromolecular Materials and Engineering. 299, pp. 775-793.
[139] J. M. Labert. (2006). The Nature of Platinum in Silicones for Biomedical and Healthcare Use. Journal of Biomedical Materials Research Part B: Applied Biomaterials. 78(1), pp. 167-180.
[140] N. R. Marco Sangermano. (2014). Cationic UV-Curing: Technology and Applications. Journal of Macromolecular Materials and Engineering. 299, pp. 775-793.
[141] H. A. Chemtob et al. (2014). UV-Activated Silicone Oligomer Cross-linking through Photoacid and Photobase Organocatalysts. Journal of Applied Polymer Science, 131(3), pp. 39875(1-6).
[142] S. Marchi, M. Sangermano, P.Meier, X.Kornmann. (2015). Visible light-activated hydrosilation reaction. Journal of Phtochemistry and Photobiology A, 303-304, pp. 86-90.
[143] Pat Price, K. Sikora, T. Illidge, Treatment of Cancer, 5th Ed. Edward Arnold Ltd, UK, 2008.
[144] J. Ophir, M.A. P.A. Jaeger. (1982). Aternary solution for independent acoustic impedance and speed of sound matching to biological tissues, Ultrasonic Imaging, 4, pp. 163-170.
[145] M. Gatto et al., (2012). Three-Dimensional Printing (3DP) of neonatal head phantom for ultrasound: Thermoccouple embedding and simulation of bone, Medical Engineering & Physics, 34, pp. 929-937.

120
[146] P. Cao et al., (2013). “A New Production Method of Elastic Silicone Carotid Phantom Based on MRI Acquisition Using Rapid Prototyping Technique” in Proceedings on IEEE EMBS, Osaka, Japan, pp. 5331-5334.
[147] C. Roux et al. (2001). Ultrasonic Backscatter and Transmission Parameters at the Os Calcis in Postmenopausal Osteoporosis, Journal of Bone and Mineral Research, 16(7), pp. 1353-1362.
[148] B. Lashkari, A. Manbachi, A. Mandelis, R. Cobbold. (2012). Slow and fast ultrasonic wave detection improvement in human trabecular bones using Golay code modulation. Journal of Acoustical Society of America, 132(3), pp. 222-228.
[149] S. M. Sangermano. (2013). UV- Induced Frontal Polymerization of a Pt-Catalyzed Hydrosilation Reaction. Macromolecular Chemistry and Physics, 214(8), pp. 943-947.
[150] D. Ceh, T.M. Peters, E. Chen, (2015). “Characterization of Polyvinyl Chloride and Self-healing Silicone as Phantom Materials,” in Proceedings of SPIE Medical Imaging, pp. 94123G-1-8.
[151] S. Guntur and M. Choi. (2014). An Improved Tissue-mimicking Polyacrylamide Hydrogel Phantom for Visualizing Thermal Lesions with High-intensity focused Ultrasound, Ultrasound in Med. & Biol., 40(11), pp. 2680-1691.
[152] E.L. Madsen, J.A. Zagzebski, R.A. Banjavie, R.E. Jutila, (1978). Tissue mimicking materials for ultrasound phantoms, Med. Phys, 5, pp.391-394, 1978.
[153] E.L. Madsen, G.R. Frank, F. Dong, (1998). Liquid or solid ultrasonically tissue-mimicking materials with very low scatter, Ultr. In Med. and Biol., 24, pp. 535-542.
[154] E.L. Madsen, Ultrasonically soft tissue-mimicking materials and phantoms. In “Tissue Characterization with Ultrasound”. (J.F. Greenleaf ed.), CRC Press, Boca Raton, Florida
[155] C.J. Teirlinck et al., (1998). Development of an example flow test object and comparison of five of these test objects, constructed in various laboratories, Ultrasonics, 36, pp. 653-660.
[156] T. Kondo, M. Kitatuji, (2005). New tissue mimicking materials for ultrasound phantoms, Ultrasonics Symposium, 3, pp. 1664-1667.
[157] R.J. Cropp, P. Seslija, D. Tso, T. Thakur, (2013). Scanner and kVp dependence of measured CT numbers in ACR CT phantom, J. of App. Clin. Med. Phys.,14(6), pp. 338-349.
[158] T.R. Coles, D. Maeglan, N.W. John, (2011). The Role of Haptics in Medical Training Simulators: A Survey of the State of the Art, IEEE Trasn. Haptics, 4(1), pp. 51-66.
[159] A. Liu, F. Tendick, K. Cleary, C. Kaufmann, (2003). A Survey of Surgical Simulation Applications, Technology and Education, Presence: Teleop. Virtual Environ., 12(6), pp. 599-614.

121
[160] H.J. Won , J.K. Han , K.H. Do , K.H. Lee , K.W. Kim , S.H. Kim , C J. Yoon , Y.J. Kim , C M. Park and B.I. Choi , (2003). Value of Four-dimensional Ultrasonography in Ultrasonographically Guided Biopsy of Hepatic Masses, Journal of Ultrasound in Medicine, 22, pp. 215-220.
[161] S. White, N. Sottos and P. Geubette, (2001). Autonomic healing of polymer composites, Lett. To Nature, 409, pp. 794-799.
[162] M. W. Keller, S. R. White and N. R. Sottos, (2007). A Self-Healing Poly(Dimethyl Slioxane) Elastomer, Advanced Functional Materials, 17, pp. 2399-2404.
[163] E. N. Brown , M. R. Kessler, N. R. Sottos and S. R. White, (2003). In situ poly(urea-formaldehyde) microencapsulation of dicyclopentadiene, Journal of microencapsulation , 20(6), pp. 719-730.
[164] Y. Yuan, M. Rong and M. Zhang, (2008). Self-Healing Polymeric Materials Using Epoxy/Mercaptan as the Healant, Macromolecules, 41, pp. 5197-5202.
[165] R. Scott and B. Keller, (2007). A Self-Healing Poly(DimethylSiloxane) Elastomer, Advanced Functional Material, 17, pp. 2399-2404.
[166] D.G. Bekas, K. Tsirka, D. Baltzis, A.S. Paipetis, “Self-healing materials: A review of advances in materials, evaluation, characterization and monitoring techniques,” Composites Part B, 2016, 87, pp. 92-119.
[167] Y.K. Song, C.M. Chung, (2013). Repeatable self-healing of a microscapsule-type protective coating, Polym. Chem., 4, pp. 4940-4947.
[168] A. Hamilton, M. Sottos and S. White, (2012). Pressurized vascular systems for self-healing materials, The Royal Society, 9, pp. 1020-1028.
[169] O. Fito, K. Ryan and B. Basu, (2010). Glass fiber polyester composite with in vivo vascular channel for use in self-healing, IOP Publishing, 23, pp. 346-355.
[170] C. Hansen, K. Toohey and J. Lewis, (2011). Delivery of Two-Part Self-Healing Chemistry via Microvascular Networks, Advnaced Functional Material, 19, pp. 1399-1405.
[171] P. Zhang et al., (2010). A Surprise from 1954: Siloxane Equilibration Is a Simple, Robust, and Obvious Polymer Polymer Self-Healing Mechanism, Jac J. American Chemical Analysis, 56, pp. 2024-2026.
[172] M. Yamaguchi, S. Ono and M. Terano, (2007). Self-repairing property of polymer network with dangling chains, Science Direct, 61, pp. 1396-1399.
[173] H. Ying, Y. Zhang and J. Cheng, (2014). Dynamic urea bond or the design of reversible and self-healing polymers, Nature Communication, 10(4218), pp. 346-355.

122
[174] N. Oya, T. Ikezaki & N.Yoshie, (2013). A crystalline supramolecular polymer with self-healing capability at room temperature, Polymer J. Polymer Polymer Science, 35, pp. 2098–2105.
[175] C. L. Cheung, T. Looi, J. Drake and P. C. W. Kim , (2012). "Magnetic resonance imaging properties of multimodality anthropomorphic silicone rubber phantoms for validating surgical robots and image guided therapy systems," in Proceedings of SPIE.
[176] K. Zell, J.I. Sperl & R.Nienesser, (2007). Acoustical properties of selected tissue phantom materials for ultrasound imaging, Pubmed,. 52(20), pp. 475–484.