Sri Lanka: Multimodal Transport Project
223
Technical Assistance Consultant’s Report This consultant’s report does not necessarily reflect the views of ADB or the Government concerned, and ADB and the Government cannot be held liable for its contents. (For project preparatory technical assistance: All the views expressed herein may not be incorporated into the proposed project’s design. Project Number: 41249-022 June 2012 Sri Lanka: Multimodal Transport Project (Financed by the Japan Fund for Poverty Reduction) Main Report Volume 2 – Costs, Revenue, Financial Analysis, Economic Appraisal Prepared by Roughton International Ltd., in association with Nippon Koei Co., Ltd. and Engineering Consultants Ltd. United Kingdom For Ministry of Transport
-
Upload
khangminh22 -
Category
Documents
-
view
2 -
download
0
Transcript of Sri Lanka: Multimodal Transport Project

Technical Assistance Consultant’s Report
This consultant’s report does not necessarily reflect the views of ADB or the Government concerned, and ADB and the Government cannot be held liable for its contents. (For project preparatory technical assistance: All the views expressed herein may not be incorporated into the proposed project’s design.
Project Number: 41249-022 June 2012
Sri Lanka: Multimodal Transport Project (Financed by the Japan Fund for Poverty Reduction)
Main Report Volume 2 – Costs, Revenue, Financial Analysis, Economic Appraisal
Prepared by Roughton International Ltd., in association with Nippon Koei Co., Ltd. and Engineering Consultants Ltd.
United Kingdom
For Ministry of Transport
The Asian Development Bank The Democratic Socialist
Republic of Sri Lanka
7600SRI: Multimodal Transport Project
Final Report – Main Report Volume 2
Costs, Revenue, Financial Analysis, Economic Appraisal
June 2012

TA 7600 SRI – Multimodal Transport Project Sri Lanka
Final Report 1
SRI LANKA MULTIMODAL TRANSPORT PROJECT
FINAL REPORT – VOLUME 2
CONTENTS
8 Project costs 148
8.1 Railway costs 148
8.2 Cost components of each project 152
8.3 Port railhead – 3 track and 4 track options 153
8.4 Sedwatta link 157
8.5 Veyangoda ICD site and Daraluwa Bemmulla Loop 158
8.6 Enderamulla ICD site 159
8.7 Peliyagoda/Telangapata ICD site 160
8.8 Ratmalana ICD site 161
8.9 Total project costs 162
9 Forecast gross revenue 167
9.1 Results 167
9.2 Key determinants 169
10 Applicable forms of Procurement Contracts 171
10.1 Responsibility for Procurement 171
10.2 Selecting a Delivery Model 172
10.3 Procurement under BOO/BOT, Concessions etc. 179
10.4 Packaging of Procurement and Bidding Strategy 179
11 Procurement Strategy under PPP and Public Finance 187
11.1 Introduction 187
11.2 Procurement Approach from Public Finance to Private Finance 188
11.3 Evaluation Approach of Public Finance and PPP Options 189
11.4 Identification of Procurement Options 190
11.5 Risk Assessment 196
11.6 Proposed Sensitivity Cases for Sensitivity Testing 203
12 Financial evaluation and recommendations 204
12.1 Basic Assumptions for the Financial Analysis 204
12.2 Revenue and Costs 205
12.3 Base Case Analysis for Public Financing 209
12.4 Base Case Analysis for PPP 210
12.5 Sensitivity Analysis for PPP Options 229
12.6 Further Sensitivity Analysis for PPP Options 231
12.7 Summary of Sensitivity Testing on PPP Options 233
12.8 Recommended Procurement Options and Implementation Plan 234
12.9 Summary and Recommendations 237
13 Summary of environmental, resettlement & social reports 241
13.1 Initial Environmental Examination (IEE) 241
13.2 Resettlement plans of ICD sites 242
13.3 Poverty and Social Assessment Report 250
14 Economic evaluation methodology 252
14.1 The “Without Project” Case 252
14.2 Opportunity Costs 252
14.3 Incremental Capital Costs 252
14.4 Shadow Pricing 255
TA 7600 SRI – Multimodal Transport Project Sri Lanka
Final Report 2
15 Economic appraisal 268
15.1 Land Values 268
15.2 Incremental Capital Costs 270
15.3 Recurrent Costs 276
15.4 Traffic Impacts and Decongestion Benefits 282
15.5 Results 283
15.6 Interpretation 290
15.7 Risk and Sensitivity 292
15.8 Poverty and Benefits Distribution 294
15.9 Reductions in Noxious Emissions 302
15.10 Other Benefits 304
16 Traffic modeling and decongestion benefits 305
16.1 Introduction 305
16.2 Types of transport model 305
16.3 Short term Do Nothing analysis 306
16.4 The University of Moratuwa traffic model 308
16.5 Future year scenarios 312
16.6 Traffic model output 313
16.7 Vehicle Categories and Unit Cost Savings 320
16.8 Decongestion benefits 331
17 Project impact monitoring 333
17.1 Project Impact Monitoring Framework 333
17.2 Baseline data and monitoring approach 335
18 Conclusions 337
Tables
Table 8.1 Cost of container transport by rail from the port each ICD
Table 8.2 Components of project costs
Table 8.3 Summary of costs at the port railhead (3 track version for one ICD site)
Table 8.4 Summary of costs at the port railhead (4 track version for two ICD sites)
Table 8.5 Summary of costs at the new Sedawatta link
Table 8.6 Summary of costs at Veyangoda ICD site and Daraluwa Bemmulla Loop
Table 8.7 Summary of costs at Enderamulla ICD site
Table 8.8 Summary of costs at Peliyagoda/Telangapata ICD site
Table 8.9 Summary of costs at Ratmalana ICD site
Table 9.1 Forecast gross revenue (Rs Million) between 2015 and 2034
Table 9.2 Calculation of transport & cranage revenue and stuffing/destuffing revenue
Table 10.1 Sample Procurement Plan, Procurement of Goods and Works by ICB/NCB
Table 10.2 Sample Procurement Plan, Procurement Services
Table 11.1 ICD Sites and Facility Requirements
Table 11.2 General Procurement Options from Preliminary Evaluation
Table 11.3 Risk Score Structure
Table 11.4 Evaluated Risks for ICD Service Project
Table 11.5 Sensitivity Testing Scenarios

TA 7600 SRI – Multimodal Transport Project Sri Lanka
Final Report 3
Table 12.1 Revenue Projection for the ICD and ICD Combinations (Rs m)
Table 12.2 Estimate of the Starting Project Costs (Rs m)
Table 12.3 CAPEX during Concession Period 2015-2034 (Rs m)
Table 12.4 Operation and maintenance Cost Summary (Rs m)
Table 12.5 Project IRR under Public Fundings
Table 12.6 The Weighted Average Costs of Capital for each ICD
Table 12.7 FIRR of Veyangoda ICD under different PPP options
Table 12.8 FIRR of Enderamulla ICD under different PPP options
Table 12.9 FIRR of Peliyagoda/Telangapata ICD under different PPP options
Table 12.10 FIRR of Ratmalana ICD under different PPP options
Table 12.11 FIRR of Veyangoda + Ratmalana ICDs under different PPP options
Table 12.12 FIRR of Enderamulla + Ratmalana ICD under different PPP options
Table 12.13 FIRR of Peliyagoda/Telangapata + Ratmalana ICDs under different PPP options
Table 12.14 ICD Base Case Summary
Table 12.15 ICD Base Case Cash Flow Summary (Rs m)
Table 12.16 Financial projections: FIRR sensitivities to revenue
Table 12.17 Financial projections: FIRR sensitivities to construction and M&E costs
Table 12.18 Financial projections: FIRR sensitivities to O&M costs
Table 12.19 Veyangoda ICD FIRR Sensitivities
Table 12.20 Enderamulla ICD FIRR Sensitivities
Table 12.21 Peliyagoda/Telangapata ICD FIRR Sensitivities
Table 12.22 Ratmalana ICD FIRR Sensitivities
Table 12.23 Veyangoda + Ratmalana ICD FIRR Sensitivities
Table 12.24 Enderamulla+ Ratmalana ICD FIRR Sensitivities
Table 12.25 Peliyagoda/Telangapata + Ratmalana ICD FIRR Sensitivities
Table 12.26 FIRR sensitivity Summary
Table 12.27 Recommended ICD PPP Equity Structure
Table 12.28 ICD PPP Implementation
Table 13.1 Summary of resettlement costs
Table 14.1 Container Tracking
Table 14.2 Government Tax Revenues, 2008 -2011 (Rs’000)
Table 14.3 Nominal Rate vs Tax Take, Cement, 2011
Table 14.4 Selected Tax Rates, 2011
Table 14.5 Calculation of Total Taxes on Imports, Excluding Fuels, 2011
Table 14.6 Taxes on Vehicle Imports (Rs. per 100 Rs. CIF value)
Table 14.7 International Fuel Prices, 2nd half of September 2011
Table 14.8 Taxes/Subsidies and Shadow Prices, September 2011 (Rs)
Table 14.9 Sri Lanka Trade Performance in Jan-Dec 2010
Table 14.10 Minimum Wages vs Average Earnings 2003 – 2009 (Rs/day)
Table 14.11 Import Shadow Prices
Table 14.12 Domestic Shadow Prices
Table 15.1 Opportunity Cost of Land

TA 7600 SRI – Multimodal Transport Project Sri Lanka
Final Report 4
Table 15.2 Economic Costs of Land and Civil Works (Rs million)
Table 15.3A Economic Capital Costs of Rolling Stock & Cargo Handling Equipment:
Veyangoda (Rs million)
Table 15.3B Economic Capital Costs of Rolling Stock & Cargo Handling Equipment:
Enderamulla (Rs million)
Table 15.3C Economic Capital Costs of Rolling Stock & Cargo Handling Equipment:
Peliyagoda/Telangapata (Rs million)
Table 15.3D Economic Capital Costs of Rolling Stock & Cargo Handling Equipment:
Ratmalana (Rs million)
Table 15.4 Veyangoda Railway Recurrent Costs Breakdown 2015
Table 15.5A Economic Recurrent Costs of Railways and ICD for Veyangoda (Rs million)
Table 15.5B Economic Recurrent Costs of Railways and ICD for Enderamulla (Rs million)
Table 15.5C Economic Recurrent Costs of Railways and ICD for Peliyagoda/Telangapata (Rs
million)
Table 15.5D Economic Recurrent Costs of Railways and ICD for Ratmalana (Rs million)
Table 15.6 Annual Transport and Congestion Savings (Rs. million/yr)
Table 15.7 Veyangoda: Economic Costs and Benefits (Rs. Million)
Table 15.8 Enderamulla: Economic Costs and Benefits (Rs. Million)
Table 15.9 Peliyagoda/Telangapata: Economic Costs and Benefits (Rs. Million)
Table 15.10 Ratmalana: Economic Costs and Benefits (Rs. Million)
Table 15.11 Veyangoda + Ratmalana: Economic Costs and Benefits (Rs. Million)
Table 15.12 Enderamulla + Ratmalana: Economic Costs and Benefits (Rs. Million)
Table 15.13 PelTel + Ratmalana: Economic Costs and Benefits (Rs. Million)
Table 15.14 Results Summary - 1
Table 15.15 Results Summary - 2
Table 15.16 Project Ranking
Table 15.17A Sensitivity Results for Veyangoda
Table 15.17B Sensitivity Results for Enderamulla
Table 15.17C Sensitivity Results for Peliyagoda/Telangapata
Table 15.18 Poverty Headcount Ratio by District
Table 15.19 Percentage of Poor Households Based on the Official Poverty Line by District
Table 15.20 Distribution of Benefits: Veyangoda (Rs million)
Table 15.21 Distribution of Benefits: Enderamulla (Rs million)
Table 15.22 Distribution of Benefits: Peliyagoda/Telangapata (Rs million)
Table 15.23 Fuel Balance for Enderamulla, 2015
Table 15.24 Emissions by Engine Type (g/l)
Table 16.1 Times of day of police control at Ingunkade junction
Table 16.2 Typical green times and cycle times when not under police control
Table 16.3 Incidence of no queue on the Port Access Road approach
Table 16.4 Transport and congestion savings 2015
Table 16.5 Transport and congestion savings 2024
Table 16.6 Transport and congestion savings 2034
Table 16.7 Principal highways for congestion savings
Table 16.8 Breakdown of veh-kms and veh-hrs savings by highway corridor
Table 16.9 ADT data vehicle classes
Table 16.10 HDM4 data vehicle classes

TA 7600 SRI – Multimodal Transport Project Sri Lanka
Final Report 5
Table 16.11 Vehicle distributions
Table 16.12 Expansion of TransPlan vehicle population
Table 16.13 Central road user costs (Rs/km)
Table 16.14 Weighted average values per truck km saved (Rs./km)
Table 16.15 Weighted average values per vehicle hour saved (Rs./hr)
Table 16.16 Daily transport and congestion savings (Rs. million)
Table 16.17 Annual transport and congestion savings (Rs. million)
Table 17.1: Project Impact Monitoring Framework
Figures
Figure 8.1 Annual expenditure profile for the Veyangoda project (SLR millions)
Figure 8.2 Annual expenditure profile for the Enderamulla project (SLR millions)
Figure 8.3 Annual expenditure profile for the PelTel project (SLR millions)
Figure 8.4 Annual expenditure profile for the Ratmalana project (SLR millions)
Figure 8.5 Annual expenditure profile for Veyangoda + Ratmalana (SLR millions)
Figure 8.6 Annual expenditure profile for Enderamulla + Ratmalana (SLR millions)
Figure 8.7 Annual expenditure profile for PelTel + Ratmalana (SLR millions)
Figure 9.1 Forecast gross revenue at Veyangoda ICD site
Figure 9.2 Forecast gross revenue at Enderamulla ICD site
Figure 9.3 Forecast gross revenue at Peliyagoda/Telangapata ICD site
Figure 9.4 Forecast gross revenue at Ratmalana ICD site
Figure 11.1 Overview of Procurement Approaches
Figure 11.2 Evaluation Process Chart
Figure 11.3 Public Finance Model
Figure 11.4 PPP Basic Option
Figure 11.5 PPP Alternative Option
Figure 11.6 The ICD Risk Assessment Procedure
Figure 11.7 Major Risk Constituents for ICD Projects
Figure 12.1 Veyangoda ICD - Project Revenue and Costs
Figure 12.2 Relationship between Government Grant and FIRR for Veyangoda ICD
Figure 12.3 Veyangoda ICD - Cash Flow from PPP Option 5
Figure 12.4 2020 Expansion Costs being Redistributed for Four Years
Figure 12.5 Enderamulla ICD: Project Revenue and Costs
Figure 12.6 Enderamulla ICD - Cash Flow from PPP Option 1
Figure 12.7 2020 Expansion Costs being Redistributed for Four Years
Figure 12.8 Peliyagoda/Telangapata ICD: Project Revenue and Costs
Figure 12.9 Peliyagoda/Telangapata ICD - Cash Flow for PPP Option 3
Figure 12.10 Ratmalana ICD: Project Revenue and Costs
Figure 12.11 Ratmalana ICD - Cash Flow from PPP Option 2
Figure 12.12 Veyangoda + Ratmalana ICDs: Project Revenue and Costs
Figure 12.13 Relationship between Govt Grant and FIRR for Veyangoda+Ratmalana ICDs

TA 7600 SRI – Multimodal Transport Project Sri Lanka
Final Report 6
Figure 12.14 Veyangoda + Ratmalana ICDs - Cash Flow from PPP Option 5
Figure 12.15 Enderamulla + Ratmalana ICDs: Project Revenue and Costs
Figure 12.16 Enderamulla + Ratmalana ICDs - Cash Flow from PPP Option 3
Figure 12.17 Peliyagoda/Telangapata + Ratmalana ICD: Project Revenue and Costs
Figure 12.18 Peliyagoda/Telangapata + Ratmalana ICDs - Cash Flow from PPP Option 5
Figure 16.1 Traffic flow on Port Access Road approach to Ingurukade junction
Figure 16.2A Veyangoda decongestion corridor
Figure 16.2B Enderamulla decongestion corridor
Figure 16.2C Peliyagoda/Telangapata decongestion corridor
Figure 16.2D Ratmalana decongestion corridor
Figure 16.3 Road haulage price model derived from regression of ACT data
Figure 16.4 Road user costs: articulated truck
Figure 16.5 Road user costs: car
Appendices
Appendix A SLPA’s Peliyagoda scheme and complementary long term options
Appendix B Responses to comments on the Draft Final Report
Appendix C Terms of Reference

TA 7600 SRI – Multimodal Transport Project Sri Lanka
Final Report 7
FINAL REPORT
EXECUTIVE SUMMARY
See Volume 1

TA 7600 SRI – Multimodal Transport Project Sri Lanka
Final Report 148
FINAL REPORT
8 Project costs There are many elements of project costs, firstly by category and location:
• Capital expenditure (capex) at ICD sites;
• O & M expenditure at ICD sites;
• Capex at the New Port railhead;
• O & M expenditure at the New Port railhead;
• Capex on the Sedawatta link and the rest of the connecting railway; and
• O & M expenditure on the Sedawatta link and the rest of the connecting railway.
Both capex and O&M are broken down by item type, examples being equipment purchases
and fuel consumption. We begin with a detailed examination of railway costs; these exclude
all lifting equipment costs.
8.1 Railway costs
The unit costs of rail transport can be shown to decline with increasing distance and with
increasing transport unit capacity and with increasing transport volume. This results from
the fact that (a) there is a high level of fixed cost associated with railway operation and (b)
that rail carrying capacity cannot be adjusted easily to match the level of transport demand.
The costs of operating container trains of various sizes, over various distances and for
various levels of ICD throughput were assessed for the purposes of:
• Providing a basis for comparison with road container haulage charges, to determine
the scope for setting a competitive level of rail container haulage tariff in future;
• Demonstrating the extent to which costs will vary with train size (and hence
container carrying capacity), distance and transport volume.
A point-to-point train costing model was adapted to generate the cost estimates for this
assessment.
8.1.1 Cost model adaptation
Train operating costs were estimated for future railway services to the ICDs under
consideration – Veyangoda, Enderamulla, Peliyagoda/Telengapata and Ratmalana.
For this purpose, the unit rates for individual items of cost were obtained from the Sri Lanka
Railways and other sources, for inputting to the model. The relevant items of cost are as
follows:
Variable costs

TA 7600 SRI – Multimodal Transport Project Sri Lanka
Final Report 149
• Train crews
• Fuel consumption
• Locomotive maintenance
• Wagon maintenance
• Variable track maintenance
Fixed costs
• Fixed cost of infrastructure maintenance
(track and bridges, buildings and signalling)
• Station operations
Administrative overhead
Incremental capital costs
• Locomotive capital
• Wagon capital
• Infrastructure capital
(i) Variable costs
(a) Train crews. The total annual cost of train crews in the Sri Lanka Railway system
was calculated from personnel data which showed that there were 460 drivers,
460 assistant drivers and 600 guards and assistant guards in the system, each
with a monthly wage, including overtime and benefits of Rs. 75,000.1 The
resulting cost of Rs. 1.368 billion was distributed over an estimated 411,756 train
hours in 2010 (both passenger and freight), to derive an average crew cost of Rs.
3,332 per train hour.
(b) Fuel consumption. Based on the rate of fuel consumption per engine km2 for M8
locomotives, the rate of fuel consumption was calculated at 4.2 litres per gross
trailing tonne-km. For the more modern 3,500 HP locomotives, a fuel
consumption rate of 3.9 litres per gross trailing tonne-km was applied. The
current price of Rs. 80 per litre paid by Sri Lanka Railways for diesel fuel was used
to estimate the fuel consumption cost.
(c) Locomotive maintenance. The cost of overhaul for M8 locomotives was given as
Rs. 40 million per unit.3 Since these overhauls are undertaken every 360,000 km,
the average cost per locomotive km is Rs. 111.11. To this cost was added 10% to
cover the cost of running repairs and servicing, giving an all-up estimate of Rs.
122.2 per locomotive-km.
1 Meeting with Commercial Superintendent and Principal Costing Officer, Sri Lanka Railways, 20 May 2011. 2 FT Study – ADB 07/07/2011, prepared by former Sri LaMnka Railways staff. 3 Chief Mechanical Engineer, Sri Lanka Railways, 11 August 2011.

TA 7600 SRI – Multimodal Transport Project Sri Lanka
Final Report 150
(d) Wagon maintenance. The cost of scheduled overhaul of wagons (based on the
Bogie Low Sided, or BLS, wagon) was given as Rs. 2 million every 4 years.4 Based
on an average of 50,000 km per wagon per year in future, the average cost per
wagon-km was estimated at Rs. 10 per wagon-km. With the addition of 10% to
cover running maintenance, all-up maintenance was estimated to cost Rs. 11 per
wagon-km.
(e) Variable track maintenance. The cost of maintaining track (including bridges,
culverts, tunnels and other track structures) may be divided into variable and
fixed portions. The variable portion is that which varies directly with the level of
traffic (measured in gross tonne-km) passing over the track, while the fixed
portion is invariant with the level of traffic. Advice was given that the fixed
portion would represent approximately 90% of the total track maintenance cost
in Sri Lanka.5 This largely reflects the effects of a tropical climate, where time-
related maintenance activities such as vegetation control or ballast tamping in
areas of high rainfall would account for a high proportion of track maintenance.
The system-wide cost of track maintenance was given as Rs. 740 million in 2010.6
The variable portion of this amount was estimated at Rs. 74 million, which when
distributed over the 5,248 million GTK estimated for the Sri Lanka Railway system
in 2010, gave an average rate of Rs. 0.0141 per gross tonne-km.
(ii) Fixed costs
(a) Fixed cost of infrastructure maintenance. This comprises 90% of the cost of track
maintenance, as indicated above, plus the costs of buildings and signalling
system maintenance, both of which categories are invariant with traffic. The
total fixed cost of infrastructure maintenance was estimated as Rs. 1.09 billion in
2010. When distributed over the total track length of the Sri Lanka Railways
system (1,569 km), this gave an average cost of Rs. 694,779 per track-km per
year. The model distributes this cost between container and other trains in direct
proportion to the numbers of each operated. On the Main Line to Enderamulla,
container trains would represent only 12% of the total number of trains on the
line in 2034, so would bear only 12% of the fixed maintenance cost, or Rs.
83,373 per track-km.
(b) Station operations. The number of station staff for 329 stations in Sri Lanka (i.e.
all excluding Colombo Fort) was reported as 3950, or an average of 12 staff per
station.7 Application of the average monthly wage, including overtime and
benefits, of Rs. 50,000 per person gives an average annual cost per station of Rs.
7,203,647. The model allocates some station costs to container trains, since the
station staff have a safe-working function in addition to their passenger handling
functions. The allocation is in direct proportion to the share of freight trains in
the total number of trains operated on the system in 2010. This share was
4 Ibid 5 Mr P De Silva, former GM Sri Lanka Railways 6 Chief Engineer (Track and Bridges) Sri Lanka Railways. 7 Op cit. Commercial Superintendent Sri Lanka Railways
TA 7600 SRI – Multimodal Transport Project Sri Lanka
Final Report 151
calculated at 6%, so that container trains would bear a cost of 0.06 x Rs. 7.2
million = Rs. 400,000 per station per year.
(iii) Administrative overhead
An administrative overhead rate of 20% was applied to the total of the variable
and fixed costs attributable to the container traffic to provide an estimate of the
administrative overhead cost of this traffic.
(iv) Incremental capital cost
(a) Locomotive capital. Based on the number of container trains estimated to be
operated per day and the train cycle time for a single trip, the required number
of train sets may be calculated. This gives the incremental number of
locomotives to be purchased to support the traffic. The purchased quantity is
then valued at the assumed purchase price for a 3,500 HP locomotive of Rs. 320
million and the resulting capital cost is depreciated over an assumed life of 25
years to obtain the annual cost of the locomotive purchases.
(b) Wagon capital. The number of train sets calculated by the above method
multiplied by the number of wagons per train set gives the incremental number
of wagons to be purchased to support the traffic. The purchased quantity is then
valued at the assumed purchase price for a 3-TEU wagon of Rs. 6.78 million and
the resulting capital cost is depreciated over an assumed life of 20 years to
obtain the annual cost of the wagon purchases.
(c) Infrastructure capital. Calculation of the incremental infrastructure capital cost is
based on the assessed need for construction of the following trackage:
• Construction of loading/unloading tracks in the New Port and in the
proposed ICDs;
• Reconstruction of the existing port access line;
• Construction of a “Y” short-cut track at Sedawatta to connect the port
access line to the Main Line;
• Construction of access tracks from the Main and Coast lines to connect
with ICDs.
For train costing purposes, the cost for construction of fully signalled embedded track in the
port and the ICD’s was assumed to be US$ 2.0 million per km (Rs. 218.5 million), while the
cost for construction of fully signalled ballasted track outside of the terminals was assumed
to be US$ 1.0 per km (Rs. 109.3 million). The annual cost of the incremental infrastructure is
calculated by depreciating the total capital cost over an assumed track life of 50 years.
8.1.2 Cost results
This section contains the results generated by the railway cost model, excluding the
incremental capital costs, which are summarized later.

TA 7600 SRI – Multimodal Transport Project Sri Lanka
Final Report 152
(i) Estimates of railway operating costs for transportation of containers to/from
ICD’s
Table 8.1 gives the estimated cost per TEU and per TEU-km of container transport by rail
from the port to the various ICDs in 2015, 2020, 2021 and 2034. Distances from the port
railhead to the ICDs are given in the table headings. At Veyangoda, short trains – 15 x 3 TEU
wagons (shaded green) – are used in all years. At the other ICDs, short trains are used until
2020, after which long trains – 35 x 3 TEU wagons (shaded yellow) – are used.
Table 8.1: Cost of container transport by rail from the port each ICD
Year Veyangoda
(42.5 km)
Enderamulla
(16.3 km)
PelTel
(14.3 km)
Ratmalana
(27.0 km)
Rs per
TEU
Rs per
TEU-km
Rs per
TEU
Rs per
TEU-km
Rs per
TEU
Rs per
TEU-km
Rs per
TEU
Rs per
TEU-km
2015 1072 25.26 517 31.79 478 33.51 797 29.47
2020 501 30.79 466 32.65 761 28.11
2021 351 21.59 389 27.27 648 23.96
2034 991 23.35 334 20.56 372 26.10 599 22.12 Source: SLMMT train cost model
During a visit to the ICD of Aitken Spence at Wattala, the project team was informed that
the prevailing rate for road haulage of a laden 20 ft container to the port is US$ 50 (Rs.
5,500). The distance involved is about 8 km, giving a unit cost of Rs. 687.5 per TEU-km. This
is considerably more than the rail unit costs in Table 8.1 but the road haulage unit cost
includes truck replacement costs, whereas locomotive and wagon replacement costs are
additional to the Figures in Table 8.1, as are lifting equipment costs.
8.2 Cost components of each project
Each alternative project consists of one or two ICD sites, a compatible railhead at the New
Port and works on the connecting railway. Table 8.2 shows the components of project costs.
If there are two ICD sites, four tracks are needed at the port railhead. If there is only one ICD
site, three tracks suffice. Reinstatement of the Sedawatta link is necessary for all three
northern ICD sites but not for Ratmalana on its own.
Table 8.2 Components of project costs
Project description
Component
Port
Rail-
head
4 tracks
Port
Rail-
head
3 tracks
Seda-
watta
Link
Veyan-
goda
ICD
Endera-
mulla
ICD
PelTel
ICD
Ratma-
lana
ICD
Veyangoda Include Include Include
Enderamulla Include Include Include
Peliyagoda/Telangapata Include Include Include
Ratmalana Include Include
Veyangoda + Ratmalana Include Include Include Include
Enderamulla + Ratmalana Include Include Include Include
PelTel + Ratmalana Include Include Include Include

TA 7600 SRI – Multimodal Transport Project Sri Lanka
Final Report 153
8.3 Port railhead – 3 track and 4 track options
Table 8.3 summarises costs at the port railhead for the 3 track option (if one ICD site is
chosen). Table 8.4 summarises costs at the port railhead for the 4 track option (if two ICD
sites are chosen).
Both tables shows key results from detailed spreadsheets compiled by Roughton
International from local, international, government, commercial and internet sources. In
both tables, item descriptions indicate which ICD(s) the railhead is connected to.
‘Operations staff – Veyangoda’ denotes expenditure on operations staff at the 3 track
railhead if Veyangoda is the ICD. ‘Equipment + container control system maintenance –
Enderamulla + Ratmalana’ denotes expenditure on such maintenance at the 4 track railhead
if Enderamulla and Ratmalana are the ICDs.
As may be expected, within the infrastructure capital expenditure railway construction costs
are higher for the 4 track railhead than for the 3 track railhead.
Equipment required at the railhead consists of rubber tyred gantries (RTGs) and tractor-
trailer units. The former load and unload the containers at the railhead and the number of
RTGs required is related to the number of TEUs per train and the number of trains to be
loaded and unloaded at once. Each RTG can move between 28 and 30 TEU/hr. Each
incoming train must be unloaded and loaded in 105 minutes. Veyangoda can handle only
short trains (45 TEU); the other ICDs will handle long trains (105 TEU) from 2021. The
number of RTGs required by 2034 varies from 3 if Veyangoda is the only ICD to 10 if
Enderamulla + Ratmalana or Peliyagoda/Telengapata + Ratmalana are the ICDs selected.
The unit price is 175.5 SLR millions.
Tractor-trailer units will transfer containers between the railhead and the New Port. The
number required is related to the anticipated daily TEU throughput. Each tractor-trailer unit
can make 4 round trips per hour, carrying 12 TEU/hr. The number of units required by 2034
varies from 3 if Ratmalana is the only ICD to 11 if Enderamulla + Ratmalana or
Peliyagoda/Telengapata + Ratmalana are the ICDs selected. The unit price per tractor-trailer
is 19.0 SLR millions.
A management information system is required for the control of containers. The server and
software would be located at the railhead, with monitors at the ICDs. One system has been
investigated. There is a purchase cost and an annual maintenance and support charge. The
purchase cost is greater if the system has to monitor containers at two ICDs rather than one.

TA 7600 SRI – Multimodal Transport Project Sri Lanka
Final Report 154
Table 8.3 Summary of costs at the port railhead (3 track version for one ICD site)
Item Stage 1 Stage 2 Total
(1 US$ = 110 SLR) US$ m SLR m US$ m SLR m US$ m SLR m
Preliminaries 0.45 49 0.45 49
Land acquisition N/A
Resettlement N/A
Deck preparation 1.88 207 1.88 207
Circulation N/A
Access road 0.06 7 0.06 7
Boundary wall N/A
CFS buildings N/A
Other buildings 0.62 68 0.62 68
Sub-total civil & building works 3.01 331 3.01 331
Railway track & buildings 8.38 922 8.38 922
Level crossings & signaling 4.03 443 4.03 443
Sub-total railways works 12.41 1,365 12.41 1,365
Rubber tyred gantries 4.79 527 4.79 527
Trucks & trailers 0.35 38 0.35 38 0.69 76
Container control system 0.26 29 0.26 29
Sub-total equipment + container control
system capex – Veyangoda
5.40 594 0.35 38 5.74 632
Rubber tyred gantries 4.79 527 4.78 526 9.57 1,053
Trucks & trailers 0.69 76 0.86 95 1.55 171
Container control system 0.26 29 0.26 29
Sub-total equipment + container control
system capex – Enderamulla
5.74 632 5.64 621 11.38 1,253
Rubber tyred gantries 4.79 527 4.78 526 9.57 1,053
Trucks & trailers 0.69 76 0.86 95 1.55 171
Container control system 0.26 29 0.26 29
Sub-total equipment + container control
system capex – PelTel
5.74 632 5.64 621 11.38 1,253
Rubber tyred gantries 4.79 527 4.78 526 9.57 1,053
Trucks & trailers 0.35 38 0.17 19 0.52 57
Container control system 0.26 29 0.26 29
Sub-total equipment + container control
system capex – Ratmalana
5.40 594 4.95 545 10.35 1,139
Capex sub-total – Veyangoda 20.82 2,290 0.35 38 21.16 2,328
Capex sub-total – Enderamulla 21.16 2,328 5.64 621 26.80 2,948
Capex sub-total – Peliyagoda 21.16 2,328 5.64 621 26.80 2,948
Capex sub-total – Ratmalana 20.82 2,290 4.95 545 25.77 2,835
Operations staff – Veyangoda 4.16 458
Operations staff – Enderamulla 8.21 903
Operations staff – PelTel 8.21 903
Operations staff – Ratmalana 5.94 653
Other staff 4.50 495
Energy 22.37 2,461
Equipment + container control system
maintenance – Veyangoda
7.03 773
Equipment + container control system
maintenance – Enderamulla
11.25 1,238

TA 7600 SRI – Multimodal Transport Project Sri Lanka
Final Report 155
Equipment + container control system
maintenance – PelTel
11.25 1,238
Equipment + container control system
maintenance – Ratmalana
9.03 993
O&M sub-total – Veyangoda 38.06 4,187
O&M sub-total – Enderamulla 46.33 5,096
O&M sub-total – PelTel 46.33 5,096
O&M sub-total – Ratmalana 41.84 4,602
Overall total – Veyangoda 59.22 6,515
Overall total – Enderamulla 73.13 8,044
Overall total – PelTel 73.13 8,044
Overall total – Ratmalana 67.61 7,437 Sources: Government of Sri Lanka, commercial sources, internet sources, Consultant’s calculations
Table 8.4 Summary of costs at the port railhead (4 track version for 2 ICD sites)
Item Stage 1 Stage 2 Total
(1 US$ = 110 SLR) US$ m SLR m US$ m SLR m US$ m SLR m
Preliminaries 0.45 49 0.45 49
Land acquisition N/A
Resettlement N/A
Deck preparation 1.88 207 1.88 207
Circulation N/A
Access road 0.06 7 0.06 7
Boundary wall N/A
CFS buildings N/A
Other buildings 0.62 68 0.62 68
Sub-total civil & building works 3.01 331 3.01 331
Railway track & buildings 9.94 1,093 9.94 1,093
Level crossings & signaling 4.03 443 4.03 443
Sub-total railways works 13.97 1,537 13.97 1,537
Rubber tyred gantries 7.98 878 4.78 526 12.76 1,404
Trucks & trailers 0.52 57 0.52 57 1.04 114
Container control system 0.34 38 0.34 38
Equipment + container control system –
Veyangoda + Ratmalana
8.85 973 5.30 583 14.14 1,556
Rubber tyred gantries 7.98 878 7.97 877 15.96 1,755
Trucks & trailers 0.86 95 1.04 114 1.90 209
Container control system 0.34 38 0.34 38
Equipment + container control system –
Enderamulla + Ratmalana
9.18 1,011 9.01 991 18.20 2,002
Rubber tyred gantries 7.98 878 7.97 877 15.96 1,755
Trucks & trailers 0.86 95 1.04 114 1.90 209
Container control system 0.34 38 0.34 38
Equipment + container control system –
PelTel + Ratmalana
9.18 1,011 9.01 991 18.20 2,002
Capex sub-total – V + R 25.83 2,841 5.30 583 31.12 3,424
Capex sub-total – E + R 26.16 2,879 9.01 991 35.18 3,870
Capex sub-total – P + R 26.16 2,879 9.01 991 35.18 3,870
Operations staff – 8.69 956

TA 7600 SRI – Multimodal Transport Project Sri Lanka
Final Report 156
Veyangoda + Ratmalana
Operations staff –
Enderamulla + Ratmalana
11.85 1,304
Operations staff – PelTel + Ratmalana 11.85 1,304
Other staff 4.50 495
Energy 34.97 3,847
Equipment + container control system
maintenance – Veyangoda + Ratmalana
12.55 1,380
Equipment + container control system
maintenance – Enderamulla + Ratmalana
15.98 1,758
Equipment + container control system
maintenance – PelTel + Ratmalana
15.98 1,758
O&M s/t – Veyangoda + Ratmalana 60.71 6,678
O&M s/t – Enderamulla + Ratmalana 67.31 7,404
O&M s/t – PelTel + Ratmalana 67.31 7,404
Overall total – Veyangoda + Ratmalana 91.83 10,102
Overall total – Enderamulla + Ratmalana 102.49 11,274
Overall total – PelTel + Ratmalana 102.49 11,274 Sources: Government of Sri Lanka, commercial sources, internet sources, Consultant’s calculations

TA 7600 SRI – Multimodal Transport Project Sri Lanka
Final Report 157
8.4 Sedwatta link
The Sedawatta link is the missing arm of a ‘Y’ rail junction located near Orugodawatta. In its
absence, trains travelling between the port and northern locations have to divert to the
south and reverse the engine at sidings before proceeding northwards. This wastes an hour
and restoration of the link is essential for efficient operation. The site has been surveyed
and an alignment selected so as to minimize the need for resettlement. Construction of a
trough span bridge is needed and a signaling upgrade is needed to control trains travelling
along the restored ‘Y’ link.
Table 8.5 Summary of costs at the new Sedawatta link
Item Stage 1 Stage 2 Total
(1 US$ = 110 SLR) US$ m SLR m US$ m SLR m US$ m SLR m
Preliminaries 0.10 11 0.10 11
Land acquisition 0.00 0 0.00 0
Resettlement 1.44 158 1.44 158
Deck preparation 1.60 176 1.60 176
Circulation N/A
Access road N/A
Boundary wall N/A
CFS buildings N/A
Other buildings N/A
Sub-total civil & building wks 3.14 345 3.14 345
Railway track & buildings 4.40 484 4.40 484
Level crossings & signaling 0.90 99 0.90 99
Sub-total railway works 5.30 583 5.30 583
Locomotives and wagons N/A
Rubber tyred gantries N/A
Trucks & trailers N/A
Forklift trucks N/A
Sub-total equipment capex 0.00 0 0.00 0
Capex sub-total 8.44 928 8.44 928
Transport costs N/A
Operations staff N/A
Other staff N/A
Energy N/A
Equipment maintenance N/A
Infrastructure maintenance N/A
O&M sub-total 0.00 0 0.00 0
Total 8.44 928 8.44 928

TA 7600 SRI – Multimodal Transport Project Sri Lanka
Final Report 158
8.5 Veyangoda ICD site and Daraluwa Bemmulla Loop
At the Veyangoda site, expenditure falls naturally into three categories:
• Infrastructure capex, with most expenditure occurring in either 2014 (stage 1) or
2020 (stage 2); stage 2 expenditure is mainly on additional CFS building capacity and
associated works;
• Equipment capex, in which equipment is bought as required. ‘Stage 1’ refers to
equipment to be purchased between 2014 and 2019. ‘Stage 2’ refers to equipment
bought in 2020 onwards; and
• Operations and maintenance costs, where expenditure occurs in every year and is
generally on a rising trend, as TEU throughput increase.
There are significant resettlement costs. Deck preparation costs of 1,225 SLR millions
include 749 SLR millions for demolition of existing structures. Within infra buildings, the
building of CFS stations will cost 570 SLR millions in 2014, 719 SLR millions in 2020. By 2034,
equipment purchase needs will be 4 locomotives, 56 wagons, 7 RTGs, 14 tractor-trailers and
22 forklift trucks.
Table 8.6 Summary of costs at Veyangoda ICD site and Daraluwa Bemmulla Loop
Item Stage 1 Stage 2 Total
(1 US$ = 110 SLR) US$ m SLR m US$ m SLR m US$ m SLR m
Preliminaries 0.91 100 0.91 100
Land acquisition 0.00 0 0.00 0
Resettlement 9.67 1,064 9.67 1,064
Deck preparation 11.14 1,225 2.16 238 13.30 1,463
Circulation 0.32 35 0.36 40 0.68 75
Access road 0.28 31 0.28 31
Boundary wall 0.74 81 0.74 81
CFS buildings 5.70 627 6.54 719 12.24 1,346
Other buildings 5.11 562 5.11 562
Sub-total civil & building wks 33.87 3,726 9.06 997 42.93 4,722
Railway works on ICD site 5.51 606 5.51 606
Daraluwa Bemmulla loop 1.25 137 1.25 137
Sub-total railway works 6.76 743 6.76 743
Locomotives and wagons 1.48 163 9.25 1,017 10.73 1,180
Rubber tyred gantries 7.97 877 1.60 176 9.57 1,053
Trucks & trailers 1.73 190 0.69 76 2.42 266
Forklift trucks 0.25 28 0.25 27 0.50 55
Sub-total equipment capex 11.43 1,258 11.78 1,296 23.22 2,554
Capex sub-total 52.06 5,727 20.84 2,293 72.91 8,020
Transport costs 37.32 4,105
Operations staff 54.67 6,014
Other staff 16.45 1,810
Energy 22.37 2,461
Equipment maintenance 15.01 1,651
Infrastructure maintenance 3.52 387
O&M sub-total 149.34 16,427
Overall total 222.25 24,447

TA 7600 SRI – Multimodal Transport Project Sri Lanka
Final Report 159
8.6 Enderamulla ICD site
At the Enderamulla site, expenditure falls naturally into three categories:
• Infrastructure capex, with most expenditure occurring in either 2014 (stage 1) or
2020 (stage 2); stage 2 expenditure is mainly on additional CFS building capacity and
associated works;
• Equipment capex, in which equipment is bought as required. ‘Stage 1’ refers to
equipment to be purchased between 2014 and 2019. ‘Stage 2’ refers to equipment
bought in 2020 onwards; and
• Operations and maintenance costs, where expenditure occurs in every year and is
generally on a rising trend, as TEU throughput increase.
Deck preparation costs of 2,763 SLR millions include 2,072 SLR millions of costs incurred by
building on marshy land. Within infra buildings, the building of CFS stations will cost 1,452
SLR millions in 2014, 1,665 SLR millions in 2020. By 2034, equipment purchase needs will be
4 locomotives, 131 wagons, 14 RTGs, 30 tractor-trailers and 54 forklift trucks.
Table 8.7 Summary of costs at Enderamulla ICD site
Item Stage 1 Stage 2 Total
(1 US$ = 110 SLR) US$ m SLR m US$ m SLR m US$ m SLR m
Preliminaries 1.36 150 1.36 150
Land acquisition 1.51 166 1.51 166
Resettlement 1.71 188 1.71 188
Deck preparation 25.12 2,763 4.16 458 29.28 3,221
Circulation 0.62 68 0.64 70 1.26 138
Access road 1.04 114 1.04 114
Boundary wall 1.33 146 1.33 146
CFS buildings 14.52 1,597 16.65 1,832 31.17 3,429
Other buildings 12.10 1,331 12.10 1,331
Sub-tot civil & building works 59.31 6,524 21.45 2,360 80.76 8,883
Railway track & buildings 3.59 395 3.59 395
Level crossings & signalling 2.02 222 2.02 222
Sub-total railway works 5.61 617 5.61 617
Locomotives and wagons 3.45 380 15.55 1,710 19.00 2,090
Rubber tyred gantries 11.16 1,228 11.17 1,229 22.34 2,457
Trucks & trailers 3.11 342 2.07 228 5.18 570
Forklift trucks 0.59 65 0.64 70 1.23 135
Sub-total equipment capex 18.31 2,014 29.43 3,237 47.74 5,252
Capex sub-total 83.23 9,155 50.88 5,597 134.12 14,753
Transport costs 34.86 3,835
Operations staff 133.68 14,705
Other staff 16.45 1,810
Energy 48.08 5,289
Equipment maintenance 28.50 3,135
Infrastructure maintenance 6.97 767
O&M sub-total 268.55 29,541
Overall total 402.67 44,294

TA 7600 SRI – Multimodal Transport Project Sri Lanka
Final Report 160
8.7 Peliyagoda/Telangapata ICD site
At the Peliyagoda/Telangapata site, expenditure falls naturally into three categories:
• Infrastructure capex, with most expenditure occurring in either 2014 (stage 1) or
2020 (stage 2); stage 2 expenditure is mainly on additional CFS building capacity and
associated works;
• Equipment capex, in which equipment is bought as required. ‘Stage 1’ refers to
equipment to be purchased between 2014 and 2019. ‘Stage 2’ refers to equipment
bought in 2020 onwards; and
• Operations and maintenance costs, where expenditure occurs in every year and is
generally on a rising trend, as TEU throughput increase.
There will be high resettlement costs on the Thelangapata side, particularly in 2020. Within
infra buildings, the building of CFS stations will cost 1,452 SLR millions in 2014, 1,665 SLR
millions in 2020. By 2034, equipment purchase needs will be 4 locomotives, 131 wagons, 14
RTGs, 30 tractor-trailers and 54 forklift trucks.
Table 8.8 Summary of costs at Peliyagoda/Telangapata ICD site
Item Stage 1 Stage 2 Total
(1 US$ = 110 SLR) US$ m SLR m US$ m SLR m US$ m SLR m
Preliminaries 1.36 150 1.36 150
Land acquisition 0.00 0 0.00 0 0.00 0
Resettlement 22.81 2,509 68.00 7,480 90.81 9,989
Deck preparation 21.48 2,363 4.32 475 25.80 2,838
Circulation 0.64 70 0.55 61 1.19 131
Access road 0.67 74 0.67 74
Boundary wall 0.79 87 0.42 46 1.21 133
CFS buildings 14.52 1,597 16.65 1,832 31.17 3,429
Other buildings 12.10 1,331 0.02 2 12.12 1,333
Sub-tot civil & building works 74.37 8,181 89.96 9,896 164.33 18,077
Railway track & buildings 2.88 317 1.45 160 4.33 477
Level crossings & signalling 1.72 189 0.20 22 1.92 211
Sub-total railway works 4.60 506 1.65 182 6.25 688
Locomotives and wagons 3.45 380 15.55 1,710 19.00 2,090
Rubber tyred gantries 11.16 1,228 11.17 1,229 22.34 2,457
Trucks & trailers 3.11 342 2.07 228 5.18 570
Forklift trucks 0.59 65 0.64 70 1.23 135
Sub-total equipment capex 18.31 2,015 29.43 3,237 47.75 5,252
Capex sub-total 97.28 10,702 121.04 13,315 218.33 24,017
Transport costs 37.35 4,109
Operations staff 133.68 14,705
Other staff 16.45 1,810
Energy 48.08 5,289
Equipment maintenance 28.50 3,135
Infrastructure maintenance 6.55 721
O&M sub-total 270.62 29,768
Overall total 488.95 53,785

TA 7600 SRI – Multimodal Transport Project Sri Lanka
Final Report 161
8.8 Ratmalana ICD site
At the Ratmalana site, expenditure falls naturally into three categories:
• Infrastructure capex, with most expenditure occurring in either 2014 (stage 1) or
2020 (stage 2); stage 2 expenditure is mainly on additional CFS building capacity and
associated works;
• Equipment capex, in which equipment is bought as required. ‘Stage 1’ refers to
equipment to be purchased between 2014 and 2019. ‘Stage 2’ refers to equipment
bought in 2020 onwards; and
• Operations and maintenance costs, where expenditure occurs in every year and is
generally on a rising trend, as TEU throughput increase.
There will be high resettlement costs in 2014. Within infra buildings, the building of CFS
stations will cost 433 SLR millions in 2014, 496 SLR millions in 2020. By 2034, equipment
purchase needs will be 1 locomotive, 44 wagons, 7 RTGs, 14 tractor-trailers and 17 forklift
trucks.
Table 8.9 Summary of costs at Ratmalana ICD site
Item Stage 1 Stage 2 Total
(1 US$ = 110 SLR) US$ m SLR m US$ m SLR m US$ m SLR m
Preliminaries 0.82 90 0.82 90
Land acquisition 0.00 0 0.00 0
Resettlement 14.98 1,648 14.98 1,648
Deck preparation 2.49 274 0.91 100 3.40 374
Circulation 0.18 20 0.21 23 0.39 43
Access road 0.13 14 0.13 14
Boundary wall 0.75 83 0.75 83
CFS buildings 4.32 475 4.96 546 9.28 1,021
Other buildings 4.19 461 4.19 461
Sub-total civil & building wks 27.86 3,065 6.08 669 33.94 3,734
Railway track & buildings 2.83 311 2.83 311
Level crossings & signalling 1.35 149 1.35 149
Sub-total railway works 4.18 460 4.18 460
Locomotives and wagons 1.17 129 5.18 570 6.35 699
Rubber tyred gantries 9.57 1,053 9.57 1,053 19.14 2,106
Trucks & trailers 1.73 190 2.07 228 3.80 418
Forklift trucks 0.20 22 0.19 21 0.39 43
Sub-total equipment capex 12.67 1,394 17.01 1,872 29.68 3,266
Capex sub-total 44.71 4,919 23.10 2,541 67.81 7,459
Transport costs 17.98 1,978
Operations staff 51.69 5,686
Other staff 16.45 1,810
Energy 18.35 2,019
Equipment maintenance 23.65 2,601
Infrastructure maintenance 1.63 179
O&M sub-total 129.76 14,274
Overall total 197.57 21,733

TA 7600 SRI – Multimodal Transport Project Sri Lanka
Final Report 162
8.9 Total project costs
All the projects consist of works at one or two ICD sites, at the railhead by the New Port and,
in the case of any project containing a northern ICD site (all ICD sites except Ratmalana), the
Sedawatta link. All involve major expenditure in 2014 and a second wave of expenditure in
2020. Amounts vary and main features are highlighted for each project.
8.9.1 Veyangoda project
Veyangoda is the most remote northern site, with an anticipated annual throughput of
109,909 TEU per annum in 2015, rising to 318,781 in 2034. The Veyangoda project consists
of Veyangoda ICD + a 3-track New Port railhead + Sedawatta link. The expected expenditure
profile is shown in Figure 8.1. Some aspects of O&M costs increase with throughput. The
ratio of expenditure in 2020 to that in 2014 is less than at other sites because Veyangoda
runs short trains throughout; larger, more expensive locomotives are unnecessary.
Figure 8.1 Annual expenditure profile for the Veyangoda project (SLR millions)
8.9.2 Enderamulla project
Enderamulla is a large northern site located just south of Ragama, with an anticipated
annual throughput of 279,904 TEU per annum in 2015, rising to 811,838 in 2034. The
Enderamulla project consists of Enderamulla ICD + a 3-track New Port railhead + Sedawatta
link. The expected expenditure profile is shown in Figure 8.2. Some aspects of O&M costs
increase with throughput. Expenditure in 2014 includes a high site preparation cost.
Expenditure in 2020 includes the costs of 3 powerful SD-50 locomotives and additional CFS
buildings.
0
1,000
2,000
3,000
4,000
5,000
6,000
7,000
8,000
9,000
10,000
20
14
20
15
20
16
20
17
20
18
20
19
20
20
20
21
20
22
20
23
20
24
20
25
20
26
20
27
20
28
20
29
20
30
20
31
20
32
20
33
20
34
SLR
mil
lio
ns
Veyangoda project costsOperation & maintenance
Equipment capex
Railway works
Civil & building works

TA 7600 SRI – Multimodal Transport Project Sri Lanka
Final Report 163
Figure 8.2 Annual expenditure profile for the Enderamulla project (SLR millions)
8.9.3 Peliyagoda/Telangapata project
Peliyagoda/Telangapate (PelTel) is a large northern site located across the Kelania river from
Colombo, with an anticipated annual throughput of 279,904 TEU per annum in 2015, rising
to 811,838 in 2034. The PelTel project consists of PelTel ICD + a 3-track New Port railhead +
Sedawatta link. The expected expenditure profile is shown in Figure 8.3. Some aspects of
O&M costs increase with throughput. Expenditure in 2014 includes a high land acquisition
cost. Expenditure in 2020 includes high resettlement and compensation costs.
Figure 8.3 Annual expenditure profile for the PelTel project (SLR millions)
0
2,000
4,000
6,000
8,000
10,000
12,000
14,0002
01
4
20
15
20
16
20
17
20
18
20
19
20
20
20
21
20
22
20
23
20
24
20
25
20
26
20
27
20
28
20
29
20
30
20
31
20
32
20
33
20
34
SLR
mil
lio
ns
Enderamulla project costs
Operation & maintenance
Equipment capex
Railway works
Civil & building works
0
2,000
4,000
6,000
8,000
10,000
12,000
14,000
16,000
20
14
20
15
20
16
20
17
20
18
20
19
20
20
20
21
20
22
20
23
20
24
20
25
20
26
20
27
20
28
20
29
20
30
20
31
20
32
20
33
20
34
SLR
mil
lio
ns
PelTel project costs
Operation & maintenance
Equipment capex
Railway works
Civil & building works

TA 7600 SRI – Multimodal Transport Project Sri Lanka
Final Report 164
8.9.4 Ratmalana project
Ratmalana is the only ICD site south of Colombo, located on the southern railway, with an
anticipated annual throughput of 83,356 TEU per annum in 2015, rising to 241,767 in 2034.
The Ratmalana project consists of Ratmalana ICD + a 3-track New Port railhead. The
expected expenditure profile is shown in Figure 8.4. Some aspects of O&M costs increase
with throughput. Expenditure in 2014 includes high land and resettlement costs.
Expenditure in 2020 includes the costs of one powerful SD-50 locomotives and additional
CFS buildings.
Figure 8.4 Annual expenditure profile for the Ratmalana project (SLR millions)
8.9.5 Veyangoda + Ratmalana project
The Veyangoda + Ratmalana project consists of Veyangoda ICD + Ratmalana ICD + a 4-track
New Port railhead + Sedawatta link. Anticipated annual throughput at the New Port railhead
would be 193,265 TEU per annum in 2015, rising to 560,548 in 2034. The expected
expenditure profile is shown in Figure 8.5. Costs would be less than the sum of Veyangoda
project and Ratmalana project costs because two 3-track railheads in the New Port would
be replaced by one 4-track railhead.
0
1,000
2,000
3,000
4,000
5,000
6,000
7,000
8,000
20
14
20
15
20
16
20
17
20
18
20
19
20
20
20
21
20
22
20
23
20
24
20
25
20
26
20
27
20
28
20
29
20
30
20
31
20
32
20
33
20
34
SLR
mil
lio
ns
Ratmalana project costsOperation & maintenance
Equipment capex
Railway works
Civil & building works

TA 7600 SRI – Multimodal Transport Project Sri Lanka
Final Report 165
Figure 8.5 Annual expenditure profile for Veyangoda + Ratmalana (SLR millions)
8.9.6 Enderamulla + Ratmalana project
The Enderamulla + Ratmalana project consists of Enderamulla ICD + Ratmalana ICD + a 4-
track New Port railhead + Sedawatta link. Anticipated annual throughput at the New Port
railhead would be 363,260 TEU per annum in 2015, rising to 1,053,605 in 2034.The expected
expenditure profile is shown in Figure 8.6. Costs would be less than the sum of Enderamulla
project and Ratmalana project costs because two 3-track railheads in the New Port would
be replaced by one 4-track railhead.
Figure 8.6 Annual expenditure profile for Enderamulla + Ratmalana (SLR millions)
0
2,000
4,000
6,000
8,000
10,000
12,000
14,000
16,0002
01
4
20
15
20
16
20
17
20
18
20
19
20
20
20
21
20
22
20
23
20
24
20
25
20
26
20
27
20
28
20
29
20
30
20
31
20
32
20
33
20
34
SLR
mil
lio
ns
Veyangoda + Ratmalana costs
Operation & maintenance
Equipment capex
Railway works
Civil & building works
0
2,000
4,000
6,000
8,000
10,000
12,000
14,000
16,000
18,000
20,000
20
14
20
15
20
16
20
17
20
18
20
19
20
20
20
21
20
22
20
23
20
24
20
25
20
26
20
27
20
28
20
29
20
30
20
31
20
32
20
33
20
34
SLR
mil
lio
ns
Enderamulla + Ratmalana costsOperation & maintenance
Equipment capex
Railway works
Civil & building works

TA 7600 SRI – Multimodal Transport Project Sri Lanka
Final Report 166
8.9.7 Peliyagoda/Telangapata + Ratmalana project
The Peliyagoda/Telangapata (PelTel) + Ratmalana project consists of PelTel ICD + Ratmalana
ICD + a 4-track New Port railhead + Sedawatta link. Anticipated annual throughput at the
New Port railhead would be 363,260 TEU per annum in 2015, rising to 1,053,605 in
2034.The expected expenditure profile is shown in Figure 8.7. Costs would be less than the
sum of Enderamulla project and Ratmalana project costs because two 3-track railheads in
the New Port would be replaced by one 4-track railhead.
Figure 8.7 Annual expenditure profile for PelTel + Ratmalana (SLR millions)
0
5,000
10,000
15,000
20,000
25,000
20
14
20
15
20
16
20
17
20
18
20
19
20
20
20
21
20
22
20
23
20
24
20
25
20
26
20
27
20
28
20
29
20
30
20
31
20
32
20
33
20
34
SLR
mil
lio
ns
PelTel + Ratmalana costs
Operation & maintenance
Equipment capex
Railway works
Civil & building works

TA 7600 SRI – Multimodal Transport Project Sri Lanka
Final Report 167
9 Forecast gross revenue
9.1 Results
Chapter 3 presented the demand forecast, including TEU throughput at each ICD site, the
proportion of TEU expected to be stuffed / destuffed, and the charges for rail transport
needed to achieve these targets. Table 9.1 summarises the forecast gross revenue. Note
that revenue accrues only at the ICD sites, not at the port railhead. Figures 9.1 to 9.4 show
the forecast gross revenue streams for each site, subdivided into five categories.
For the two ICD projects – Venyangoda + Ratmalana, Enderamulla + Ratmalana, PelTel +
Ratmalama – the revenue is the sum of the revenues at the two individual ICD sites.
Table 9.1 Forecast gross revenue (Rs Million) between 2015 and 2034
Revenue item Veyangoda Enderamulla Peliyagoda /
Telangapata
Ratmalana
Transport charges 28,770 51,057 47,739 13,195
Stuffing & destuffing 17,827 45,400 44,946 13,520
Container storage 1,764 4,493 4,493 1,338
Warehousing & inventory 1,470 3,744 3,744 1,115
Office rentals 2,341 5,962 5,962 1,775
Total 52,172 110,657 106,884 30,944
Figure 9.1 Forecast gross revenue at Veyangoda ICD site
0
500
1,000
1,500
2,000
2,500
3,000
3,500
4,000
4,500
20
15
20
16
20
17
20
18
20
19
20
20
20
21
20
22
20
23
20
24
20
25
20
26
20
27
20
28
20
29
20
30
20
31
20
32
20
33
20
34
An
nu
al r
ev
en
ue
(R
s m
illi
on
)
Veyangoda gross revenue
Office rentals
Warehouing & inventory
Container storage
Stuffing & destuffing
Transport charges

TA 7600 SRI – Multimodal Transport Project Sri Lanka
Final Report 168
Figure 9.2 Forecast gross revenue at Enderamulla ICD site
Figure 9.3 Forecast gross revenue at PelTel ICD site
0
1,000
2,000
3,000
4,000
5,000
6,000
7,000
8,000
9,000
10,0002
01
5
20
16
20
17
20
18
20
19
20
20
20
21
20
22
20
23
20
24
20
25
20
26
20
27
20
28
20
29
20
30
20
31
20
32
20
33
20
34
An
nu
al r
ev
en
ue
(R
s m
illi
on
)
Enderamulla gross revenue
Office rentals
Warehousing & inventory
Container storage
Stuffing & destuffing
Transport charges
0
1,000
2,000
3,000
4,000
5,000
6,000
7,000
8,000
9,000
20
15
20
16
20
17
20
18
20
19
20
20
20
21
20
22
20
23
20
24
20
25
20
26
20
27
20
28
20
29
20
30
20
31
20
32
20
33
20
34
An
nu
al r
ev
en
ue
(R
s m
illi
on
)
Peliyagoda/Telangapata gross revenue
Office rentals
Warehousing & inventory
Container storage
Stuffing & destuffing
Transport charges

TA 7600 SRI – Multimodal Transport Project Sri Lanka
Final Report 169
Figure 9.4 Forecast gross revenue at Ratmalana ICD site
9.2 Key determinants
As indicated, the principal revenue earners would be transport and cranage charges and
charges for stuffing and destuffing, accounting for more than 85% of all revenue. The key
unit charges and annual revenues are indicated in Table 9.2 below.
Table 9.2 Calculation of transport & cranage revenue and stuffing/destuffing revenue
Item Unit Veyangoda Enderamulla Peliyagoda /
Telangapata
Ratmalana
Year 2015
Annual TEU throughput TEU 109,909 279,904 279,904 83,356
Transport & cranage
charge/trip
Rs / TEU 7,175 5,000 4,675 4,339
Annual transport &
cranage revenue
Rs million 789 1,400 1,309 362
CFS throughput TEU 36,636 93,301 92,368 17,785
Stuffing/destuffing charge Rs / TEU 13,338 13,338 13,338 13,338
Annual stuffing/destuffing
revenue
Rs million 489 1,244 1,232 371
Year 2034
Annual TEU throughput TEU 318,781 811,838 811,838 241,767
Transport & cranage
charge/trip
Rs / TEU 7,175 5,000 4,675 4,339
Annual transport &
cranage revenue
Rs million 2,287 4,059 3,795 1,049
CFS throughput TEU 106,260 270,613 267,906 80,589
Stuffing/destuffing charge Rs / TEU 13,338 13,338 13,338 13,338
Annual stuffing/destuffing
revenue
Rs million 1,417 3,609 3,573 1,075
0
500
1,000
1,500
2,000
2,500
3,0002
01
5
20
16
20
17
20
18
20
19
20
20
20
21
20
22
20
23
20
24
20
25
20
26
20
27
20
28
20
29
20
30
20
31
20
32
20
33
20
34
An
nu
al r
ev
en
ue
(R
s m
illi
on
)
Ratmalana gross revenue
Office rentals
Warehousing & inventory
Container storage
Stuffing & destuffing
Transport charges

TA 7600 SRI – Multimodal Transport Project Sri Lanka
Final Report 170
The forecast of annual revenue is crucially dependent on the two unit charge rates – for
transport and cranage and for stuffing / destuffing. Derivation of the transport and cranage
charges to/from each ICD has been presented in Chapter 4.
The Rs 13,338 per TEU is a composite. Prices for stuffing & destuffing 20ft, 40 ft and 45 ft
containers were obtained from 3 sources, SLPA and two commercial sources. The middle of
the 3 data sets, those of a leading consolidator, were used. These were Rs 16,500 for 20 ft
containers, Rs 11,000 per TEU for 40ft and 45 ft containers. The numbers of laden 20ft, 40 ft
and 45 ft passing through Colombo Port in 2010 were used as the basis for forming the
composite rate.

TA 7600 SRI – Multimodal Transport Project Sri Lanka
Final Report 171
10 Applicable forms of Procurement Contracts
10.1 Responsibility for Procurement
The responsibility for the implementation of the project, and therefore for the payment of
goods, works, and services under this Project, rests solely with the borrower. ADB, for its
part, is required by its Charter to ensure that funds are paid from ADB financing only as
expenditures are incurred. Disbursements are made only at the borrower’s request.
Supporting evidence that the funds are used in accordance with the financing agreement
and/or the procurement plan shall be submitted with the borrower’s withdrawal
application.
Payment may be made (a) to reimburse the borrower for payment(s) already made from its
own resources, (b) directly to a third party (usually to a supplier or contractor), or (c) to a
commercial bank for expenditures against a Commitment Letter covering a commercial
bank’s letter of credit. The borrower is legally responsible for the procurement. It invites,
receives, and evaluates bids, and awards the contract. The contract is between the
borrower and the supplier or contractor. ADB is not a party to the contract.
ADB’s Role
ADB reviews the procurement procedures, documents, bid evaluations, award
recommendations, and the contract to ensure that the process is carried out in accordance
with agreed procedures, as required in the financing agreement. In the case of major
contracts, the documents are reviewed by ADB prior to their issue.
ADB, for its part, has the obligation to ensure that the proceeds of its financing are used
with due attention to considerations of economy and efficiency.
If, at any time in the procurement process (even after the award of contract), ADB
concludes that the agreed procedures were not followed in any material respect, ADB may
declare misprocurement. However, if a borrower has awarded a contract after obtaining
ADB’s “no objection,” ADB will declare misprocurement only if the “no objection” was
issued on the basis of incomplete, inaccurate, or misleading information furnished by the
borrower. Furthermore, if ADB determines that corrupt or fraudulent practices were
engaged in by representatives of the borrower or of the bidder, ADB may impose applicable
sanctions.
Bidder’s Role
Once a bidder receives the prequalification or bidding document, the bidder should study
the documents carefully to decide if it can meet the technical, commercial, and contractual
conditions, and if so, proceed to prepare its bid. The bidder should then critically review the
documents to see if there is any ambiguity, omission, or internal contradiction, or any
feature of specifications or other conditions which are unclear or appear discriminatory or
restrictive; if so, it should seek clarification from the borrower, in writing, within the time
period specified in the bidding documents for seeking clarifications.

TA 7600 SRI – Multimodal Transport Project Sri Lanka
Final Report 172
The criteria and methodology for selection of the successful bidder are outlined in the
bidding documents, generally under Instructions to Bidders and Specifications. If these are
not clear, clarification should be similarly sought from the borrower.
ADB's Procurement Guidelines require that borrowers must use the appropriate standard
procurement documents issued by ADB for International Competitive Bidding.
ADB's standard procurement documents for the procurement of goods, and for the
procurement of works (large contracts) are based on Master Procurement Documents
prepared jointly by multilateral development banks and other public international financing
institutions.
Roughton International has considered and will recommend the use of these documents for
this Project, an important feature of the documents is that they can be used with minimum
changes, as they do not contain explanations, footnotes or examples.
The rights and obligations of the borrower and the providers of goods and works for the
project are governed by the bidding documents, and by the contracts signed by the
borrower with the providers of goods and works.
On a large project, there may be a number of different contracts and delivery models.
Roughton International wish to emphasise that the ADB will review the borrower’s
procurement procedures, documents, bid evaluations, award recommendations, and
contracts to ensure that the procurement process is carried out in accordance with the
agreed procedures. The procurement plan approved by ADB shall specify the extent to
which these review procedures shall apply in respect of the different categories of goods
and works to be financed, in whole or in part by ADB.
10.2 Selecting a Delivery Model
10.2.1 The Choice
Determining the procurement method is a critical step in the project delivery process. It is
important to consider which method will best balance the control of project cost and risk
against achieving project objectives and outcomes. The key issue is which form of project
delivery provides the best value for money in meeting the client's service objectives.
The vast majority of investment in Sri Lankan public services has been, and will continue to
be, procured through traditional means. However, other innovative approaches, PPPs
(Public Private Partnerships)8 in particular, must be considered to be used to deliver some
of the country's most complex and significant public sector infrastructure projects.
Major infrastructure projects require detailed and careful planning and it is important that a
robust, value for money assessment is made when choosing the procurement option.
8
Refer Chapters 11 & 12 of this Report

TA 7600 SRI – Multimodal Transport Project Sri Lanka
Final Report 173
Open competition is the basis for efficient public procurement. Borrowers need to select the
most appropriate method for the specific procurement. In most cases, international
competitive bidding (ICB), properly administered, and with the allowance for preferences
for domestically manufactured goods and, where appropriate, for domestic contractors for
works under prescribed conditions is the most appropriate method. In most cases,
therefore, ADB requires its borrowers to obtain goods, works and services through ICB open
to eligible suppliers and contractors.
10.2.2 Procurement Plan
As part of the preparation of the project the borrower must prepare and, before loan
negotiations, furnish to ADB for its approval, a Procurement Plan acceptable to ADB setting
forth: (a) the particular contracts for the goods, works, and/or services required to carry out
the project during the initial period of at least 18 months; (b) the proposed methods for
procurement of such contracts that are permitted under the financing agreement, and (c)
the related ADB review procedures. The borrower must update the Procurement Plan
annually or as needed throughout the duration of the project. The borrower must
implement the Procurement Plan in the manner in which it has been approved by ADB.
The Procurement Plan for this Project can be found later in this Chapter of this report.
10.2.3 International Competitive Bidding
The objective of International Competitive Bidding (ICB) is to provide all eligible prospective
bidders with timely and adequate notification of a borrower’s requirements and an equal
opportunity to bid for the required goods and works.
The bidding documents clearly state the type of contract to be entered into and contain the
proposed contract provisions appropriate therefore. The most common types of contracts
provide for payments on the basis of a lump sum or unit prices, or combinations thereof.
The size and scope of individual contracts depend on the magnitude, nature, and location of
the project. For projects requiring a variety of goods and works, separate contracts generally
will be awarded for the supply and/or installation of different items of equipment and plant
and for the works.
On this Project, International Competitive Bidding (ICB) procedures will be used for works
contracts valued above $3 million and goods valued above $500,000, National competitive
bidding for works and goods beneath that stated for ICB. Shopping will be used for contracts
for procurement of works and equipment worth less than $100,000.
When and if any National Competitive Bidding (NCB) is proposed, before starting any
procurement, ADB and the Government will review the public procurement laws of the
central and state governments to ensure consistency with ADB’s Procurement Guidelines.

TA 7600 SRI – Multimodal Transport Project Sri Lanka
Final Report 174
Two-Stage Bidding
For certain packages of this Project, for example, for the construction of the Inland
Container Depots, Roughton International are recommending two-envelope bidding
procedures. With these procedures, bids with separate envelopes for technical and financial
proposals are submitted simultaneously. Such procedures are also recommended for the
procurement of goods. The borrower uses the two-envelope procedure with single-stage
bidding. In this procedure, the technical proposal is opened first and reviewed to determine
responsiveness to the bidding documents. Only the financial proposals of bidders with
responsive technical proposals are opened for evaluation and comparison. The financial
proposals of bidders whose technical proposals are not responsive shall be returned
unopened. The use of these procedures must be agreed upon by ADB and the borrower.
10.2.4 National Competitive Bidding
General
National competitive bidding shall conform to the provisions for "National Competitive
Bidding" as prescribed in the Procurement Guidelines 2006 for Goods and Works issued in
January 2006 by the National Procurement Agency, and the specific procedures prescribed
by the Procurement Manual issued on March 2006, with the clarifications and modifications
described in the following paragraphs required for compliance with the provisions of the
ADB Procurement Guidelines.
Registration
(i) Bidding shall not be restricted to pre-registered firms under the national
registration system of the Institute for Construction, Training and Development
(ICTAD), and such registration shall not be a condition for the submission of bids
in the bidding process.
(ii) Where registration is required prior to award of contract, bidders: (i) shall be
allowed a reasonable time to complete the ICTAD registration process; and (ii)
shall not be denied registration for reasons unrelated to their capability and
resources to successfully perform the contract, which shall be verified through
post-qualification.
(iii) National sanction lists or blacklists may be applied only with prior approval of
ADB.
10.2.5 Notification and Advertising
Timely notification of bidding opportunities is essential in competitive bidding. For this
Project the borrower will be required to prepare and submit to ADB a draft general
procurement notice. ADB will arrange for its publication. The notice shall contain
information concerning the borrower (or prospective borrower), amount and purpose of the
loan, scope of procurement under ICB, and the name, telephone number, e-mail address (or
fax number) and address of the borrower’s agency responsible for procurement and the

TA 7600 SRI – Multimodal Transport Project Sri Lanka
Final Report 175
address of the website where specific procurement notices will be posted. If known, the
scheduled date for availability of prequalification or bidding documents should be indicated.
The related bidding documents shall not be released to the public earlier than the date of
publication of the general procurement notice.
10.2.6 Bidding Documents
General
Bidding documents have been prepared by Roughton International, these documents state
that payments from the proceeds of ADB loans or grants will be limited to goods produced
in, and services supplied by, member countries of ADB.
These documents provide all the information necessary for bidders to prepare responsive
bids. While the detail and complexity of these documents vary depending upon the kind of
goods to be procured and the size of the contract, they include the following: invitation for
bids; instructions to bidders; bidding forms; conditions of contract, both general and special;
technical specifications; bills of quantities and drawings; schedule of prices; and necessary
appendixes, proforma bid securities and performance securities.
For this Project, sample documents are separately bound.
Roughton International have used the appropriate Standard Bidding Documents (SBDs)
issued by ADB with minimum changes, acceptable to ADB, as necessary to address the
Project specific conditions. Any changes to the SBDs shall be introduced only through bid or
contract data sheets, or through special conditions of contract, and not by introducing
changes in the standard wording of ADB’s SBDs.
Validity of Bids
Bidders shall be required to submit bids valid for the period specified in the bidding
documents. The period is to be sufficient to enable the borrower to complete the
comparison and evaluation of bids, review the recommendation of award with ADB (if prior
review is required), and obtain all the necessary approvals so that the contract can be
awarded within that period.
Clarity of Bidding Documents
The Bidding documents have been so worded as to permit and encourage international
competition, and they set forth clearly and precisely the work to be carried out, the location
of the work, the goods to be supplied, the place of delivery or installation, the schedule for
delivery or completion, minimum performance requirements, and the warranty and
maintenance requirements, as well as any other pertinent terms and conditions. In addition,
the bidding documents define the tests, standards, and methods that will be employed to
judge the conformity of equipment as delivered, or works as performed, with the
specifications.

TA 7600 SRI – Multimodal Transport Project Sri Lanka
Final Report 176
Pricing
Bids for goods are invited on the basis of CIF, or CIP for all goods offered from abroad.
Where inland transportation, installation, commissioning or other similar services are
required to be performed by the bidder, as in the case of “supply and installation” contracts,
the bidder shall be required to provide a separate quotation for these services.
The bidder shall be required to quote the price of the installed plant at site, including all
costs for supply of equipment, marine and local transportation and insurance, installation
and commissioning, as well as associated works and all other services included in the scope
of contract such as design, maintenance and operation. Unless otherwise specified in the
bidding documents, the price shall include all duties, taxes, and other levies.
Terms and Methods of Payment
Payment terms are to be in accordance with the international commercial practices
applicable to the specific goods and works, and shall be made in accordance with the
procedures provided in ADB’s Loan Disbursement Handbook.
(i) Contracts for supply of goods shall provide for full payment on the delivery
and inspection, if so required, of the contracted goods except for contracts
involving installation and commissioning, in which case a portion of the
payment may be made after the supplier has complied with all its obligations
under the contract.
(ii) Contracts for works shall provide in appropriate cases for mobilization
advances, advances on contractor’s equipment and materials, regular
progress payments, and reasonable retention amounts to be released upon
compliance with the contractor’s obligations under contract.
Conditions of Contract
The contract documents clearly define the scope of work to be performed, the goods to be
supplied, the rights and obligations of the borrower and of the supplier or contractor, and
the functions and authority of the engineer, in the supervision and administration of the
contract. In addition to the general conditions of contract, special conditions particular to
the specific goods or works to be procured and the location of the project have been
included. The conditions of contract provide a balanced allocation of risks and liabilities.
General Conditions of Contract should always be used un-amended; however each
procurement exercise is a unique one and will require specific terms and conditions that will
only apply to one contract. There is therefore a clear need for a method of introducing
specific clauses into the documents.
The most effective way of doing this is through the use of Special Conditions of Contract
that are used to supplement those in the general conditions of contract, taking precedence
over the general conditions in the event of a conflict between the two.

TA 7600 SRI – Multimodal Transport Project Sri Lanka
Final Report 177
A set of generic special conditions have been employed by Roughton International, who has
selected from the generic conditions those that apply to the particular procurement
exercise and amended them to suit.
Specifications
Specifications for works may be based on specifications recommended by ICTAD to the
extent possible, but ICTAD approval shall not be required for adoption of specifications in a
particular procurement activity.
The “Technical Specifications” is the section of the Bidding Document that communicates to
the prospective bidders the Project’s exact requirements with regard to each item to be
supplied or works to be completed. The Technical Specifications section should include a full
commentary of the intended use of the items as well as a list of all the required attributes,
variables and parameters.
A Technical Specification can simply be described as one or more of the following:
• A statement of attributes of a product, a service or a process;
• The communication of a requirement;
• A means which enables the “like-for-like” comparison of bids;
• A description of the required performance.
When standards are used, as they will need to be especially in the case of works contracts,
the specifications must present a clear statement of the required standards of
workmanship, materials, and performance of the goods and services to be procured.
References to Brand and Trade Names
References to brand names, catalogue numbers or similar classifications have been avoided
whenever possible as they potentially limit competition. When there was no other
alternative to clarify an otherwise incomplete specification, the words "or equivalent" have
been added after such reference.
When the specifications refer to trade or brand names the bidding document and
specification make it clear that the purchaser or employer will accept items that have similar
characteristics and which provide performance at least substantially equivalent to those
specified.
All drawings shall be consistent with the text of the specifications, and an order of
precedence between the two shall be specified.

TA 7600 SRI – Multimodal Transport Project Sri Lanka
Final Report 178
Preferences
No preference of any kind shall be given to domestic bidders or for domestically
manufactured goods.
Foreign suppliers and contractors from ADB member countries shall be allowed to bid,
without registration, licensing, and other government authorizations, leaving compliance
with these requirements for after award and before signing of contract.
Member Country Restrictions
Bidders must be nationals of member countries of ADB, and offered goods, works and
services must be produced in and supplied from member countries of ADB.
10.2.7 Bid Opening, Evaluation, and Award of Contract
Time for Preparation of Bids
The time allowed for the preparation and submission of bids has been determined with due
consideration of the particular circumstances of the project and the magnitude and
complexity of the contract. Generally, not less than six weeks from the date of the invitation
to bid or the date of availability of bidding documents, whichever is later, shall be allowed
for ICB. Where large works or complex items of equipment are involved, a longer period has
been allowed.
Bid Opening Procedures
The time for the bid opening is the same as for the deadline for receipt of bids, and has
been announced, together with the place for bid opening, in the invitation to bid. The
borrower will open all bids at the stipulated time and place. Bids shall be opened in public;
bidders or their representatives shall be allowed to be present.
Evaluation and Comparison of Bids
The purpose of bid evaluation is to determine the cost to the borrower of each bid in a
manner that permits a comparison on the basis of their evaluated cost. The bid with the
lowest evaluated cost, but not necessarily the lowest submitted price, shall be selected for
award.
The bidding documents also specify the relevant factors, in addition to price, to be
considered in bid evaluation, and the manner in which they will be applied for the purpose
of determining the lowest evaluated bid. For goods and equipment, other factors may be
taken into consideration including, among others, payment schedule, delivery time,
operating costs, efficiency and compatibility of the equipment, availability of service and
spare parts, and related training, safety, and environmental benefits.

TA 7600 SRI – Multimodal Transport Project Sri Lanka
Final Report 179
Award of Contract
The borrower will award the contract, within the period of the validity of bids, to the bidder
who meets the appropriate standards of capability and resources and whose bid has been
determined (i) to be substantially responsive to the bidding documents and (ii) to offer the
lowest evaluated cost.
10.3 Procurement under BOO/BOT, Concessions etc.
For more detail on BOO/BOT, concessions and similar private sector arrangements, refer to
Chapter 11 of this report.
In the case of loans made by ADB to the private sector without government guarantee, ADB
does not insist on ICB procedures, but will request borrowers to satisfy ADB that
procurement procedures have been applied in a transparent manner, preferably through
competitive bidding procedures, and that the goods and works procured are from eligible
member countries and are suitable for the project. Where ADB is participating in financing a
BOO/BOT or similar type of project, either of the following procurement procedures shall be
used:
(a) The project sponsor for a BOO/BOT or similar type of project shall be selected
in a transparent manner, preferably through competitive bidding procedures
acceptable to ADB, which may include several stages in order to arrive at the
optimal combination of criteria for the purpose of establishing the most
economic and efficient proposal, such as the performance specifications of
the facility offered, the cost charged to the user or purchaser, and the period
of the facility depreciation. The project sponsor selected in this manner shall
then be free to procure the goods and works required for the facility from
eligible member countries, using suitable procedures.
Or,
(b) If the project sponsor has not been selected in the manner set forth as above,
the goods and works required for the facility and to be financed by ADB, shall
be procured from eligible member countries in a transparent manner,
through competitive bidding procedures acceptable to ADB.
10.4 Packaging of Procurement and Bidding Strategy
Definitions
A procurement lot is an item or number of similar items that are collected into one lot for
the purpose of letting one single contract
A procurement package is a number of lots – that again will be similar grouped together to
be treated as one procurement exercise (included in the same bidding document).

TA 7600 SRI – Multimodal Transport Project Sri Lanka
Final Report 180
Lots are to be packaged so that they attract the maximum of competition. Desegregation
into small lots to avoid procurement process and review thresholds is strictly prohibited.
Also artificially consolidating of lots to avoid delegation to decentralized units is prohibited.
Roughton International has utilised the Asian Development Bank Procurement Guidelines to
complete set of bidding documents for use on this Multimodal Transport Project. These
documents form annexes to this Report and their use is mandatory. They are not in a final
form at this stage because the designs produced to date are preliminary designs.
The following documents form the Bidding Documents for the Project:
10.4.1 Works – Large Contracts for the Procurement of Works
These use the Conditions of Contract for Construction for Building and Engineering Works
Designed by the Employer, Multilateral Development Bank Harmonized Edition 2010,
prepared by the Fédération Internationale des Ingénieurs-Conseils, or FIDIC.
10.4.2 Using Single-Stage: Two-Envelopes Bidding Procedure.
This document requires Bidders to submit two sealed envelopes simultaneously, one
containing the Technical Proposal and the other the Price Proposal, enclosed together in an
outer single envelope. This procedure allows the Employer to evaluate the Technical
Proposals without reference to price. Bids of Bidders who do not conform to the specified
requirements may be rejected as deficient Bids.
Roughton International has prepared such documents, seperately bound, for:
(i) Single Inland Container Depot site, consisting of Enderamulla plus Sedawatta plus
Port Railhead (3 track version), Civil and Building Works.
(ii) Single Inland Container Depot site, consisting of Enderamulla plus Sedawatta plus
Port Railhead (3 track version), Railway Infrastructure Works.
(iii) Double Inland Container Depot site, consisting of Enderamulla, Ratmalana plus
Sedawatta plus Port Railhead (4 track version), Civil and Building Works.
(iv) Double Inland Container Depot site, consisting of Enderamulla, Ratmalana plus
Sedawatta plus Port Railhead (4 track version), Railway Infrastructure Works.
Similar documents (apart from Scope Description, Bills of Quantities and Drawings), can be
expeditiously prepared for other ICD sites, if and when selected.
10.4.3 Works – Small Contracts for the Procurement of Works.
These bidding documents adopt a post qualification procedure that requires bidders to
submit the information pertaining to their qualification together with their technical bids.
These documents include a model form of conditions of contract which has been developed
on the basis of considerable international experience in the drafting and management of

TA 7600 SRI – Multimodal Transport Project Sri Lanka
Final Report 181
contracts, bearing in mind a trend in the construction industry towards a simpler, more
straightforward language.
10.4.4 Goods - Using Single-Stage: One-Envelope Bidding Procedure
This is the main bidding procedure used for most of the procurement financed by ADB.
Roughton International has prepared such documents, separately bound, for:
(i) All lifting equipment – RTGs, reachstackers, fork lift trucks and some containers.
(ii) Locomotives and Wagons
10.4.5 Consultant Services
All consultants will be recruited according to ADB’s Guidelines on the Use of Consultants.
Consulting services are distinct from both goods and works in that they present different
challenges when we try to quantify them. Instead of using a specification “Terms of
Reference” are used. Terms of Reference are broken down into six standard parts:
(i) Background,
(ii) Objectives,
(iii) Scope of the Services,
(iv) Training (when appropriate),
(v) Outputs and Time Schedule, and
(vi) Data, Local Services, Personnel, and Facilities to be provided by the Client.
The Terms of Reference for all consulting services for this Project are detailed in a
separate document.

TA 7600 SRI – Multimodal Transport Project Sri Lanka
Final Report 182
INDICATIVE CONTRACT PACKAGES AND PROCUREMENT PLAN
1. Program Information
Country Sri Lanka
Name of Borrower Democratic Socialist Republic of Sri Lanka
Project Name Multimodal Transport Project
Loan Reference Related to TA 7600 SRI (RFP syle)
Date of Effectiveness To be determined
ADB Financing Amount To be determined
Executing Agency Ministry of Transport
Implementing Agency Sri Lanka Ports Authority
Approval Date of Original Procurement Plan N/A
Approval of Most Recent Procurement Plan N/A
Publication of Local Advertisement April 2012
Period Covered by this Plan April 2012 to September 2013
2. Program Thresholds for Goods and Related Services, Works and Supply, and
Installation
Procurement Method Threshold
International Competitive Bidding (ICB) Works Equal, or above, $3 million
ICB Goods Above $500,000
National Competitive Bidding (NCB) Works Beneath that stated for ICB, Works
3. Program Thresholds for Consultant Services
Procurement Method Threshold
Quality- and Cost-Based Selection Above $200,000
Consultants Qualifications Selection (CQS) Less than or equal to $200,000
4. ADB Prior or Post Review
Procurement Method Prior or Post
ICB Works Prior
ICB Goods Prior
NCB Works and Goods Post
Quality- and Cost-Based Selection Prior
Consultants Qualifications Selection (CQS) Prior

TA 7600 SRI – Multimodal Transport Project Sri Lanka
Final Report 183
5. Contract Packages in Excess of $100,000 Goods, Work and Consultancy Services
Package
No.
Contract Description Estimated
Cost ($m)
Procurement
Method
Expected Date
of
Advertisement
Prior
Review
SLICDA1a
Endermulla +
Sedawatta + Port
Railhead (3 Track
version), Stage 1, Civil
and Building Works
58.88
International
Competitive
Bidding (ICB)
Works
Q2/2012
SLICDA1b
Endermulla +
Sedawatta + Port
Railhead (3 Track
version), Stage 1,
Railway Construction
22.88
International
Competitive
Bidding (ICB)
Works
Q2/2012
SLICDA2a
Endermulla +
Ratmalana +
Sedawatta + Port
Railhead (4 Track
version), Stage 1, Civil
and Building Works
70.96
International
Competitive
Bidding (ICB)
Works
Q2/2012
SLICDA2b
Endermulla +
Ratmalana +
Sedawatta + Port
Railhead (4 Track
version), Stage 1,
Railway Construction
28.56
International
Competitive
Bidding (ICB)
Works
Q2/2012
SLICDA1rw Provision of Railway
Wagons 3.72
International
Competitive
Bidding (ICB)
Goods
Q2/2012
SLICDA1rtg
Provision of Rubber
Tyred Gantry (RTG)
Cranes
33.5
International
Competitive
Bidding (ICB)
Goods
Q2/2012
SLICDA1tt Provision of Tractor-
Trailers 1.00
International
Competitive
Bidding (ICB)
Goods
Q2/2012
SLICDA1f Provision of Forklifts 1.70
International
Competitive
Bidding (ICB)
Goods
Q2/2012

TA 7600 SRI – Multimodal Transport Project Sri Lanka
Final Report 184
6. Consulting Services Contracts Estimated to Cost More Than $100,000
No. Contract Description Estimated
Cost ($m)
Procurement
Method
Expected Date of
Advertisement
Prior
Review
1
Consulting services
for construction
supervision and
6.0
Quality- and Cost-
Based Selection Q1/2012
7. Goods and Works Contracts Estimated to Cost Less than $1,000,000 and Consulting
Services Contracts Less than $100,000

TA 7600 SRI – Multimodal Transport Project Sri Lanka
Final Report 185
Table 10.1 Sample Procurement Plan, Procurement of Goods and Works by ICB/NCB9
Project name:___________________________ As At _____________________[insert date]
Contract No.____________________________ Prior or Post Review______________
ADB Loan/Credit___________________ Method of Selection ICB/NCB
Description of Goods or Works_____________ Consultants Name____________ Amount______
Activity Time Planned Planned Actual Actual
Period Start Finish Start Finish
Int./Nat
Preparation
Specification and cost estimate prepared 3w/1w
Bidding Document drafted 3w/1w
Bidding Document Approved by Committee 1w
Bidding Document Submitted to Bank 1w
NOL Issued 1d
Pre
Qu
al
(wh
en
ap
pli
cab
le) Advertisement issued 1d/NA
Invitation to pre-qualification period 6w/NA
Applications received 1d/NA
Application evaluated 2w/NA
Pre-qualification evaluations sent to Bank 1d/NA
Bid
din
g
Per
iod
Specific Procurement Notice Issued 1d
Bidding Period 6w/4w
Bid Closing Date 1d
Bid Opening Minutes Distributed 1d
Ev
alu
ati
on Evaluation of Bids 4w/2w
Procurement Committee Review 2w/1w
Evaluation Sent to Bank 1w
NOL Issued 1d
Contract Formation
Notification of Award Issued 1d
Performance security received 3w
Contract Signed 1d
Letter of Credit Established 2w/NA
Special Commitment Applied for 2w/NA
Special Commitment Issued 1d/NA
Contract Effective 1d
Contract
Implementation
Delivery Period
Goods delivered/Taking Over certificate Issued
Final Acceptance (goods) 2w
Start of Warranty/Latent Defects
Expiry of Warrant/Latent Defects
9
Those activities shown in italics are only applicable to prior review and should not be considered when the contract is
subject to post review. The above standard time periods are applicable to international procurement. When procurement
is undertaken through NCB the second period is to be used. Pre qualification will only be used in exceptional cases and with
the Bank’s no objection

TA 7600 SRI – Multimodal Transport Project Sri Lanka
Final Report 186
Table 10.2 Sample Procurement Plan, Procurement Services10
Project name:___________________________ As At _____________________[insert date]
Contract No.____________________________ Prior or Post Review______________
ADB Loan/Credit___________________ Method of Selection QCBS/QBS/LCS/FBS/CQS/SSS
Description of Goods or Works______________ Consultants Name____________ Amount____________
Activity Time Planned Planned Actual Actual
Period Start Finish Start Finish
Int./Nat
EOI/ToR
ToR and Request for EOIs sent to Bank 1d
for NOL
Bank’s NOL 1w
Request for EOI issued 1w
EOI Closing date 6w/4w
Evaluation of EOI and drafting of RFP 3w/2w
RF
P
Shortlist and RFP sent to Bank 1d
Bank’s NOL 1w
RFP Issued 1d
Proposals Received 6w/4w
Tec
hn
ica
l
Ev
alu
ati
on
Technical Evaluation of Proposals 4w/2w
Technical Evaluation sent to Bank 1d
Bank’s NOL 1w
Firms Invited to Financial Opening 2w/1w
Financial
Evaluation
Financial proposal Publicly Opened 1d
Financial Evaluation 1w
Financial Evaluation sent to Bank 1d
Bank’s NOL 1w
Recommended Firm invited to 3w/1w
Negotiate
Contract Formation
Contract negotiations 1w
Draft Contract Approved 1w
Draft Sent to Bank 1d
Bank’s NOL 1w
Contract Signature and advance 3w/1w
payment security requested
Advance Payment Security Received 1d
Advance Payment Made 3w
Consultants Mobilize 3w/1w
Contract
Implementation
Inception Report Issued
Progress Report #1
Progress Report #2
Progress Report #3
Draft Final Report Issued
Final Report Accepted
Final Payment Made
10
Those activities shown in italics are only applicable to prior review and should not be considered when the contract is
subject to post review. The above standard time periods are applicable to international procurement. When procurement
is undertaken only with national consulting firms the recommended time period is shown as the second period.

TA 7600 SRI – Multimodal Transport Project Sri Lanka
Final Report 187
11 Procurement Strategy under PPP and Public Finance
11.1 Introduction
In Chapter 10, we identified procurement methods and contracts to obtain the supply of
particular packages of works and equipment – the ‘what and how?’ of procurement. In
Chapters 11 and 12, we look at the more strategic aspects, namely the types of institution
doing the procurement and the funding methods available – the ‘who and why’ of
procurement.
11.1.1 Funding Options
This chapter and the next chapter provide a detailed analysis of the proposed PPP options
which are viable for the implementation of ICD services for Colombo. These include the
study of procurement approaches under different funding options with traditional public
funding and Public and Private Partnership (PPP), equity structure analysis, and the
recommended investment profile, geared to risk identification and mitigation.
This study is to identify a financially viable and sustainable implementation option for the Sri
Lanka Government on the ICD project development. This option will involve less project
investment from the Government, with a practical risk sharing/management scheme
between the private and public sectors.
11.1.2 Project Cases
Four potential sites have been selected for the possible construction of Inland container
depots (ICDs) to serve Colombo port.
Based on the projection of container throughput volumes, revenues and cost estimates of
each of the proposed ICDs, and railway system and rolling stock analysis as discussed in the
previous chapters, this chapter and the next one discuss the procurement options and
financial assessment of each one.
The selected ICD sites are located at:
• Veyangoda
• Enderamulla
• Peliyagoda/Telangapata (PelTel)
• Ratmalana
As discussed in earlier chapters, each of the above sites has been considered in isolation. In
addition, each of the first three has been considered in conjunction with the fourth site at
Ratmalana, making a total of seven potential projects. Implementation of each project
requires additional investment as shown below.

TA 7600 SRI – Multimodal Transport Project Sri Lanka
Final Report 188
Table 11.1 ICD Sites and Facility Requirements
Case
No
ICD description
Port
Rail
head
Port
Rail
head
Seda-
watta
Veyan-
goda
Endera-
mulla Pel Tel
Ratma-
lana
4 rail
tracks
at port
3 rail
tracks
at port
New rail
link ICD ICD ICD ICD
1 Veyangoda
√ √ √
2 Enderamulla
√ √
√
3
Peliyagoda/Tel
angapata
(PelTel)
√ √
√
4 Ratmalana
√
√
5 Veyangoda +
Ratmalana √
√ √
√
6 Enderamulla +
Ratmalana √
√
√
√
7 PelTel +
Ratmalana √
√
√ √
11.2 Procurement Approach from Public Finance to Private Finance
Public Private Partnership (PPP) has been widely adopted by both developed countries and
developing countries as an instrument to enable government to utilise private investment
for public infrastructure project development. The traditional project procurement
approach with the public sector taking the majority of risks (as shown in the figure below),
including cost overruns and delays, is not an efficient way to procure infrastructure projects.
Providing ICDs in Colombo under a PPP approach presents a case where income directly
related to usage can be derived from users. Using the PPP procurement method to
construct the ICD service area and procure rail rolling stock is therefore considered as a
financing option which will enable the Sri Lanka Government to retain development funds
available for use in other areas less attractive to private investment.

TA 7600 SRI – Multimodal Tra
Final Report
Figure 11.1 Overview of Procurement Approaches
Considering the last two scenarios above, the ICD projects can be procured either:
• under a DBFO (Design
having ownership of the ICD and rail facilities and a Special Purpose Vehicle (SPV)
under the procurement to lease the asset back for operation and maintenance; or
• under a BOOT (Build
during a concession period, and transferring the asset back to the government at the
end of the concession period.
11.3 Evaluation Approach of
The evaluation approach comprises five main study components including container
throughput, cost, asset, finance and risk analysis. The throughput projection and cost
estimates have been completed in the previous chapters. The methodology for evaluation
of the ICD projects is illustrated in the flow chart given below:
Multimodal Transport Project
189
Overview of Procurement Approaches
two scenarios above, the ICD projects can be procured either:
under a DBFO (Design-Build-Finance-Operate) form of contrac
having ownership of the ICD and rail facilities and a Special Purpose Vehicle (SPV)
under the procurement to lease the asset back for operation and maintenance; or
under a BOOT (Build-Own-Operate-Transfer) with the SPV having full owner
during a concession period, and transferring the asset back to the government at the
end of the concession period.
Evaluation Approach of Public Finance and PPP Options
The evaluation approach comprises five main study components including container
throughput, cost, asset, finance and risk analysis. The throughput projection and cost
estimates have been completed in the previous chapters. The methodology for evaluation
of the ICD projects is illustrated in the flow chart given below:
Sri Lanka
two scenarios above, the ICD projects can be procured either:
Operate) form of contract, with the public
having ownership of the ICD and rail facilities and a Special Purpose Vehicle (SPV)
under the procurement to lease the asset back for operation and maintenance; or
Transfer) with the SPV having full ownership
during a concession period, and transferring the asset back to the government at the
Options
The evaluation approach comprises five main study components including container
throughput, cost, asset, finance and risk analysis. The throughput projection and cost
estimates have been completed in the previous chapters. The methodology for evaluation

TA 7600 SRI – Multimodal Transport Project Sri Lanka
Final Report 190
Figure 11.2 Evaluation Process Chart
11.4 Identification of Procurement Options
It is necessary that the financial viability of the project is assessed and meets various
requirements including sustainable development, environmental, re-settlement and social
assessment aspects. Additionally, it is necessary to establish an implementable equity
structure, and subsequently a concession agreement for construction, operations and
maintenance.
As part of an important exercise, the Consultant held a number of meetings with public
sector and private sector representatives in Colombo, including the Ministry of Finance
(MoF), the Ministry of Transport (MoT), Sri Lanka Ports Authority (SLPA), Sri Lanka Railways
(SLR), Asian Development Bank (ADB), HSBC, and Sri Lanka Commercial Bank. It was noticed
that the financial institutions in Sri Lanka have a limitation on providing loans in a hard
currency to a project in Sri Lanka, of around US$ 20m from each loan provider. The opinions
from the public and private sectors on ICD investment and procurement are valuable,
assisting the Consultant to identify the most viable PPP procurement strategy for this
project.
For the ICD project, typical procurement structures for public finance and private finance, as
shown in the figures below, are used for the project evaluation through financial analysis:
Risk Analysis
Operational
Assumptions
CAPEX
• Facility maintenance
• Expansion developmental
• Asset management & lifecycle
OPEX
• Staff costs (fixed and variable)
• Railway transport charge
• Material and maintenance (fixed
and variable)
PPP Model
Scenario Management
Key Outputs:
Annual Revenues
Annual Costs
CAPEX
Sensitivities/ScenariosBenchmarking
Analysis
Financial
Assumptions
Financial Viability
Report
Economic
AssumptionsContainer Transhipment
Evaluation
Key Outputs:
ContainerVolume
Key year revenue
Year for Expansion
Container Volume
survey
Financial Model

TA 7600 SRI – Multimodal Transport Project Sri Lanka
Final Report 191
• Public finance: SLPA and SLR to obtain public funds and an ADB loan for project
finance;
• PPP basic option: Joint Venture (JV) between SLPA, SLR and private investors with
project financing; and
• PPP alternative option: JV between SLPA and private investors with project financing.
In a PPP arrangement, a private investment company will partner the government’s owned
enterprise or its agency, as a consortium. Formation of a project company (Special Purpose
Vehicle, SPV) to execute the PPP project is essential. The difference between the PPP
options is the number of public enterprises/authorities involved and the procurement
approaches to railway services. This will depend on the capability of Sri Lankan Railways to
invest in this project or provide land to ICD projects.
Figure 11.3 Public Finance Model
Figure 11.4 PPP Basic Option
(100-X)%X%
Railway Corporation
Project Company
EPCContractor
RailwayOperator
ADB
SLPA
ICDOperator
(Outsourcing/
subsidy)
(100-X-Y)%Y%
SLPARailway
Corporation
SPV
EPCContractor
RailwayOperator
Lending Banks
PrivateInvestor
X%
ICDOperator

TA 7600 SRI – Multimodal Transport Project Sri Lanka
Final Report 192
Figure 11.5 PPP Alternative Option
The ICD projects generate different levels of operations revenue. Financial analysis is an
effective tool to identify the options which are the most financially viable for PPP
implementation. A typical equity structure consists of private finance, supported by
government grants or loans to fill the funding gap of a project. A financial analysis will
identify the portion of the investment (X% or X+Y%) to be made by a private investor based
on the minimum return to equity. The funding gap (100-X or 100-X-Y)% will be supported by
government grants or loans with a zero return. In a PPP procurement, the project Company
is an SPV which undertakes the project execution and financing. The project Company may
appoint an EPC contractor for construction work and an O&M contractor for the operations
and maintenance, or may carry out these functions itself. Note that an EPC contractor is an
Engineering Project Management Contractor: the term typically refers to firms such as
Bechtel and Fluor.
Further to the procurement option analysis above, the feasibility of the procurement
options for each ICD project are evaluated in this section.
Based on a preliminary evaluation of the ICD projects, it is shown that the revenue
generated from operation at each ICD cannot provide an adequate financial return to
private investors. It is also noted that the ICD projects would heavily involve the railway and
port authorities. Private investors would face significant challenges in respect of land
acquisition, resettlement, rail operations and coordination of port operations. Therefore,
100% private finance would be the least favoured option for this project.
In order to make the PPP procurement feasible, it is recommended that the government
make the investment in part of the project, such as land, resettlement or rolling stock, or
part of engineering costs. The procurement option matrix, which is based on the project
financial internal return rates viable for public financing and PPP financing for the ICD
services, is summarised below.
100-X%X %
Railway Corporation
SPV
ICDOperator
RailwayOperator
FinancingBank
PrivateInvestor
EPCContractor
SLPA

TA 7600 SRI – Multimodal Transport Project Sri Lanka
Final Report 193
Table 11.2 General Procurement Options from Preliminary Evaluation
No ICD description Public
Financing PPP
Private
Financing
1 Veyangoda √ √ ×
2 Enderamulla √ √ ×
3
Peliyagoda/
Telangapata
(PelTel)
√ √ ×
4 Ratmalana × √ ×
5
Veyangoda +
Ratmalana √ √ ×
6
Enderamulla +
Ratmalana √ √ ×
7 PelTel + Ratmalana √ √ ×
11.4.1 Public Funding Option: Government Providing 100% Funding
Before the PPP and private investment options are considered, a preliminary review of the
ICD services under public funding is presented.
From the project experience of Sri Lanka Port Authority using the ADB fund for the Colombo
Port extension project, SLPA had the ADB’s loan lending facility with an average rate of
LIBOR + 15 - 40 basis points for a 25 year loan period. It is noted that the current LIBOR is in
a low level after the global financial crisis, and an average 3% borrowing cost is assumed for
a 20 year loan period to test the project financial performance.
The preliminary evaluation indicated that Veyangoda ICD, Enderamulla ICD, and
Peliyagoda/Telangapata ICD are feasible under public finance while Ratmalana ICD has a
project IRR of 4.2% which is well below the benchmark of approval from public sector for a
public funded project. The major issue for Ratmalana ICD is the high cost of the project
construction and M&E procurement, with low container throughput which results in
relatively low revenue from the project. In order to develop the Ratmanlana ICD under
public funding, the ICD has to be developed together with at least one of the other ICDs,
such as Veyangoda ICD, Enderamulla ICD or Peliyagoda/Telangapata ICD, which have IRRs
higher than the benchmark for government approval.
Table 11.2 indicates that all cases, apart from the Ratmalana ICD site, are feasible for public
funding. However, it is understood that the Ministry of Finance is willing to procure this type
of project with private investment or private participation such as a PPP arrangement. This
would provide the government with flexibility to use the government’s funds on other
projects that are much needed by the public, and also most importantly sharing risks with
private investors.

TA 7600 SRI – Multimodal Transport Project Sri Lanka
Final Report 194
11.4.2 PPP Options
Under a PPP arrangement, there are two potential public organisations/companies which
can be the shareholders for the project company, which is normally called a Special Purpose
Vehicle (SPV). The activities of the public companies/organisations must be closely related
to the business of the ICDs. Sri Lanka Railways is the only rail service provider in Sri Lanka
and the ICD will fully rely on the railway operations. The Sri Lanka Port Authority will be the
land provider for the ICDs within the Colombo port area, and the authority is responsible for
the Colombo port administration.
The potential private investors could include a port investor, or a port operator, or a
logistics company with business at the Colombo port. This would bring in mutual benefits to
private and public bodies with business links with the existing port operations.
The PPP option is applicable when the public and private sectors are willing to share the
project risks under a PPP arrangement. The public sector will have the capability to pay a
portion of project costs, such as land acquisition, railway rolling stocks or M&E equipment
for ICD operations, when the minimum equity return to private investors would otherwise
not be achieved. The entire operation, maintenance, financing costs and capital expenditure
(CAPEX) within the concession period (which is assigned as 22 years in this report) are the
responsibilities of the SPV; and the operations revenue will meet the minimum expectation
of financial returns to the private investors. The SPV will be responsible for engineering
construction, operation and maintenance. At the end of the concession period the project
will be transferred back to the government. It is a clear PPP model as all the activities are on
construction and O&M at ICD sites. The proposed options are as below:
• Option 1: Public funding of land acquisition and resettlement; private sector
investing in civil engineering, rolling stock and M&E;
• Option 2: Public funding of land acquisition, resettlement, and civil engineering;
private sector investing in rolling stock and M&E;
• Option 3: Public funding of land acquisition, resettlement, and rolling stock; private
sector investing in civil engineering and M&E;
• Option 4: Public funding of land acquisition, resettlement, rolling stock and M&E;
private sector investing in civil engineering; and
• Option 5: Public funding of land acquisition, resettlement and 50% of civil
engineering; private sector investing in rolling stock and M&E.
Option 1: Public Funding of Land Acquisition and Resettlement
This option requires government grant or funding to cover the funding gap. Land acquisition
and resettlement costs are the components to be provided by the public sector to attract
private investors. It is assumed that SLPA will provide free land within the Colombo Port
area for the development of the port railhead. This option will be viable when the
operations revenue is sufficient to repay the remaining project costs, and the entire
operation, maintenance, CAPEX and financing costs within the concession period for the
SPV. In addition, the operations revenue must meet the minimum expected financial return
to the private investors. The SPV will be responsible for engineering construction, operation

TA 7600 SRI – Multimodal Transport Project Sri Lanka
Final Report 195
and maintenance. At the end of the concession period the project will be transferred to the
government.
The ownership of ICDs can be with the SPV during the concession period and the asset can
be transferred back to Sri Lanka Government at the end of the concession period (BOOT).
For the rail facilities, such as rolling stock and new railway tracks, the ownership of these
facilities could be with the SPV as the SPV is the investor for these facilities. Alternatively,
all the assets apart from M&E equipment could be transferred to the government when the
construction is completed (DBFO). The SPV will lease back the assets for operations and
maintenance over the concession period.
Option 2: Public Funding on Land Acquisition, Resettlement and Civil Engineering
This option is based on Option 1 not being sufficiently attractive to attract potential private
investors. It requires government grant or funding to cover land acquisition, resettlement
costs and civil engineering costs including rail tracks. The public sector will pay these costs at
stage 1 development in 2014 and stage 2 in 2020 as well. It is assumed that SLPA will
provide free land within the Colombo Port area for the development of the port railhead.
This option will be viable when the operations revenue is sufficient to repay the remaining
project costs, and the entire operation, maintenance, CAPEX on rolling stock and M&E and
financing costs within the concession period for the SPV. In addition, the revenue must meet
the minimum expectation of financial returns to the private investors. The SPV will be
responsible for engineering construction, operation and maintenance. At the end of the
concession period the project will be transferred to the government.
The ownership of ICDs will be with the government, and the SPV will have the asset of
rolling stock and M&E during the concession period and the asset will be transferred to the
Sri Lanka Government at the end of the concession period.
Option 3: Public Funding on Land Acquisition, Resettlement, and Rolling Stock
This option is based on Option 1 not being sufficiently attractive to attract potential private
investors, and is an alternative option in that the government will not invest in civil
engineering costs. This option requires the government to provide more grants or funding
to cover the land acquisition, resettlement, and rolling stock costs to improve the project
financial performance during the concession period. It is assumed that SLPA will provide
free land within the Colombo Port area for the development of the port railhead. This
option will be viable when the operations revenue is sufficient to repay the remaining
project costs, and the entire operation, maintenance, financing costs and CAPEX within the
concession period for the SPV. In addition, the operations revenue must meet the minimum
expectation of financial returns to the private investors. The SPV will be responsible for
engineering construction, operation and maintenance. At the end of the concession period
the project will be transferred to the government.
The ownership of ICDs can be with the SPV during the concession period (BOOT) and the
asset can be transferred to the Sri Lanka Government at the end of the concession period.
For the rail facilities, such as rolling stock, the ownership of rolling stock could be with the

TA 7600 SRI – Multimodal Transport Project Sri Lanka
Final Report 196
Sri Lanka Railways as the Government is the investor for these facilities. A lease agreement
will be required when SPV needs to use these facilities.
Option 4: Public Funding on Land Acquisition, Resettlement, Rolling Stock and M&E
This option may work when Options 1 and 3 are not sufficiently attractive to attract
potential private investors. This option requires the government to provide more grants or
funding than for Option 2, to cover the land acquisition, resettlement, partial rolling stock
and M&E equipment costs, so as to improve the project financial performance during the
concession period. It is assumed that SLPA will provide free land within the Colombo Port
area for the development of the port railhead. This option will be viable when the operation
revenue is sufficient to repay the remaining project costs which are invested by private
investors, and the entire operation, maintenance, financing costs and CAPEX within the
concession period for the SPV. In addition, the operations revenue must meet the minimum
expectation of financial returns to the private investors. The SPV will be responsible for
engineering construction, operation and maintenance. At the end of the concession period
the project will be transferred back to the government.
The ownership of ICDs can be with the SPV during the concession period (BOOT) and the
asset can be transferred back to the Sri Lanka Government at the end of the concession
period. For the rail facilities, such as rolling stock and new railway tracks, the ownership of
these facilities could be with Sri Lanka Railways and SLPA (DBFO) as they are the investors in
these facilities. A lease agreement will be required when the SPV needs to use these
facilities.
Option 5: Public Funding on Land Acquisition, Resettlement and 50% Civil Engineering
This option is appropriate when Option 2 makes an excessive return to the private investor,
and there is room for the government to invest less than the entire engineering cost. This
option requires government grant or funding to cover land acquisition, resettlement costs
and 50% of the civil engineering costs, including rail tracks. The public sector will pay these
costs at stage 1 development and stage 2 in 2020 as well. It is assumed that SLPA will
provide free land within the Colombo Port area for the development of the port railhead.
This option will be viable when the operation revenue meets the minimum expectation of
financial returns to the private investors. The SPV will be responsible for managing
engineering construction, operation and maintenance. At the end of the concession period
the project will be transferred to the government.
The ownership of ICDs will be with the government or SPV as both parties are the investors
(BOOT). The SPV will have the asset of rolling stock and M&E during the concession period
and the asset will be transferred to Sri Lanka Government at the end of the concession
period (DBFO).
11.5 Risk Assessment
Rigorous risk assessment is critical in any PPP project. The effective allocation of risk
between the parties is the key to success or failure. A private investor will wish to control

TA 7600 SRI – Multimodal Transport Project Sri Lanka
Final Report 197
costs and outcomes, whilst government will emphasise service delivery and quality. It is
important that a balance is attained and reflected in the risk allocation structure within the
overall project framework.
11.5.1 Risk Evaluation Approach
A risk assessment process for the PPP arrangement has been conducted. The aim has been
to establish the risks (technical, contractual and commercial risks) involved, their impact on
the project, and methods to manage and/or mitigate the said risks. Risk assessment is
carried out normally in a workshop with the private investor and public sector respectively
in order to develop a risk register. In the absence of such a workshop we have relied on our
extensive knowledge of the project gained while working on the project development. The
risk assessment has attempted to:
• Identify key risks associated with the project under a PPP arrangement: revenue,
technical design, environmental, major costs streams and financial. Lessons have
been drawn from international practice;
• Identify and classify risks in construction, operations, and maintenance; and
• Identify any alternative options in financial structures in order to mitigate risks.
Risk Management Procedure
Figure 11.6 illustrates the 4 main stages we have followed to establish the risk factors.
Figure 11.6: The ICD Risk Assessment Procedure
Mitigation of Risks
This involves identifying measures to ensure that either the probability of occurrence and/or
the severity of impact of the risk are reduced during the entire project life cycle. For each
risk an ‘owner’ is identified with responsibility for ensuring that the mitigation measures are
implemented and are effective.
Identify AssessMitigate /
RespondReview
� Methods of Identification
� Likelihood� Impact
� Proximity
� Time
� Cost� Quality
� Prioritisation
� Management of risks� Risk response
planning� Eliminate / Avoid
� Reduce / mitigate
� Transfer� Accept
� Update Register
� Communicate
�Lessons learned
Plan, Conduct, review

TA 7600 SRI – Multimodal Transport Project Sri Lanka
Final Report 198
Risk Review
It is important to highlight that a Risk Register should be updated periodically and
communicated to all relevant stakeholders.
11.5.2 Risk Identification
Typically, under a PPP scheme, project risks during construction, operation and
maintenance are shared between government and private investors. The issues which
constitute the major risks for the project are shown in the figure below and are fairly typical
for a railway related project, under PPP arrangements:
Figure 11.7 Major Risk Constituents for ICD Projects
For the ICD projects, these risks occur during:
• The project development process and project approval stage;
• Construction and the M&E installation stage; and
• The operations and maintenance stage.
Where the risks are quantifiable, such as construction costs, and low revenue due to
economic downturn, they have been tested and examined through sensitivity analysis in the
financial model.
Planning and approval risks
• Land acquisition risk;
• Re-planning of the existing rail network in Colombo;
• Competition from the new terminal and other ports in Sri Lanka; and
• Environmental approval risk.
3. Less rapid
economic growth –
reduction of container
volume
5. Currency risks -
Local devaluation
6. Civil war/Security
risks
1. Construction and
M&E cost overrun,
poor quality, and
delay
8. Inflation risks –
high labour costs and
material costs
7. Poor Management –
operations cost
overrun.
4. Competition from
new ports/terminals
2. Change of
Government polices,
regulations, planning/
Rail network
Project
Major Risks

TA 7600 SRI – Multimodal Transport Project Sri Lanka
Final Report 199
Construction and M&E procurement risks
• Overrun of construction and M&E procurement costs;
• An incorrect bill of quantities;
• Material/market prices;
• Late completion of construction and M&E installation;
• Additional financing costs; and
• Impact on the concession agreement, revenue and security.
Operations and maintenance risks
• Overrun of operations and maintenance costs;
• Poor management;
• Higher inflation, increase of labour costs and material costs; and
• Low efficiency from employing more resources.
Revenue risks
Revenue projections are based on positive economic growth and Colombo port expansion. If
the assumed growths are not met, the revenue targets are unlikely to be achieved.
• Lower economic growth/slower port expansion;
• Changes of market demands;
• Competition from other adjacent ports or new ports;
• Change of government's multimodal regulation/policy; and
• Leading to one or more of (i) reduced annual TEU throughput (ii) reduced CFS station
throughput (iii) reduced unit prices.
Foreign exchange risk
• Fluctuating foreign exchange rates and availability of hard currency;
• Difficulty in obtaining competitive interest rates for long term funds; and
• Local currency devaluation.
Political and security risks
• Political stability: reducing concession years;
• Inadequate or subjective enforcement of laws and regulations: factored into costs -
the worst case scenario; invested capital in front, arbitrary termination; and
• Security risk.

TA 7600 SRI – Multimodal Transport Project Sri Lanka
Final Report 200
Unforeseeable events (natural disasters, changes to national and state legislation)
A number of the key risks identified which can be quantified, such as those growth factors
related to lower GDP growth and global financial crisis, are tested and examined through
sensitivity analysis in the financial model.
11.5.3 Risk Assessment
At this feasibility stage, we have assessed only the following risks:
• Revenue risks;
• Construction and M&E procurement risks;
• Operations and Maintenance risks.
Based on the probability and impact of each of these three risk items, the risks are
presented in the categories shown in the table below. Depending on how it is scored against
both probability of occurrence and impact, each event was classified as high, medium or low
risk. This stage also involved understanding the causes of the risks and the interrelationships
between various risks.
Following the identification of the risks, a qualitative risk assessment is undertaken in the
next section to provide an indication of the likelihood of the event giving rise to the risk
occurring.
The following scoring system was adopted in which each risk was categorised by probability
of occurrence (P) and impact (I).
Table 11.3 Risk Score Structure
Scale Description Score
Probability
High
Medium
Low
Very Likely
Likely
Unlikely
3
2
1
Impact
High
Medium
Low
Large
Significant
Small
3
2
1
The table below details the output of the risk assessment under the categories of revenue
(R), construction (C), and operations (OM). Risks with a (P times I) value of 4 or above
(shaded) were taken forward for sensitivity analysis. GOS represents the Government of Sri
Lanka.

TA 7600 SRI – Multimodal Transport Project Sri Lanka
Final Report 201
Table 11.4 Evaluated Risks for ICD Service Project
CODE RISK CATEGORY H/M/L P x I Risk Owner
P I
R1
Shortfall in expected transport and cranage
revenue:
� Annual throughput (TEU) below forecast
� Unable to realise desired unit charge per
TEU trip
M H 6 SPV/GOS
R2
Shortfall in expected Container Freight
Station (CFS) revenue:
� Annual CFS throughput (TEU) below
forecast
� Unable to realise desired unit charge per
TEU for stuffing / destuffing
M H 6 SPV/GOS
R3 Shortfall in other revenue sources – container
storage, warehousing & inventory, rentals M M 4 SPV/GOS
C1
Overrun of construction costs and M&E
procurement costs :
� detailed design not completed
� unforeseen ground conditions
� errors of BOQ
� Inflation on material price and equipment
price
� Variations
M H 6 SPV/GOS
C2
Late completion of the construction and M&E
installation:
� additional financial costs
� delay of service revenue and impact to
the period of concession agreement and
revenue
M M 4 GOS/SPV
OM1
Overrun of operations and maintenance costs
� higher inflation,
� increase of labour costs and material
costs,
� low efficiency employing more resources,
� Increase of CAPEX
M M 4
SPV/
O&M
Contractor
11.5.4 Risks and Risk Mitigation
Revenue risks, Construction and M&E procurement cost risks, and Operations &
Maintenance cost risks have been identified as major risks. Each of these risks is considered
in turn. Mitigation measures are in some cases possible.
Revenue risks
A shortfall in revenue can arise from a number of factors:
• Less than expected import / export container growth for Sri Lanka;
• Less than expected import / export container growth at Colombo Port due to
(future) competition from other Sri Lanka ports;

TA 7600 SRI – Multimodal Transport Project Sri Lanka
Final Report 202
• A lower than expected market share for train transport via the ICD;
• A lower than expected unit charge for transport and cranage between the port and
the ICD(s);
• A lower than expected market share of stuffing / destuffing activities; and
• A lower than expected unit charge per TEU for stuffing / destuffing.
Until the ICD(s) are actually built, we cannot collect data on these items, so we have to
content ourselves with a sensivity test with respect to total revenue.
As the sole or dominant owner of any project, SLPA would naturally carry most of the
revenue risks. Under PPP, asking the private sector to share revenue risks is possible.
However, if the private sector partner is being lent money by commercial banks, it must be
remembered that banks are very risk averse. The financial markets are generally not very
receptive to PPP project proposals where the private concessionaire carries the
throughput/traffic volume risk. In practice, therefore, the private sector’s exposure to
revenue risk must be limited.
Construction and M&E procurement cost risks
Infrastructure projects have historically experienced cost overruns, above early planning
estimates. A recent study of 258 infrastructure projects spanning a time period of more than
70 years found that project costs were underestimated in approximately 90% of the
projects. Actual costs averaged 28% higher than estimated from a survey in 2002. For the
ICD projects, the likely increases in construction costs and M&E procurement costs are not
only related to inflation but also to material availability, security and unforeseen ground
conditions.
As indicated from the financial analysis for the ICD projects, it is highly likely that GOS will
fund certain project costs, and that the cost overrun risks will be borne by both government
and private investors. With GOS’s desire to fast track the implementation of the ICD
projects it would be reasonable to distribute the management of this risk between GOS and
the selected EPC contractor.
It is expected that SPV will negotiate a risk sharing mechanism with the EPC contractor to
agree an acceptable price. In order to facilitate such negotiation it is important that the EPC
contractor provides a detailed breakdown of its tender.
The sensitivity of risks of construction costs has been tested in the financial evaluation in the
last section of this chapter.
Operation and Maintenance costs risk
Operation and maintenance costs can overrun because of increases in unit labour costs and
materials and because of low employee efficiency.
The sensitivity of risks of O&M costs has been tested in the financial evaluation in the last
section of this chapter.

TA 7600 SRI – Multimodal Transport Project Sri Lanka
Final Report 203
11.6 Proposed Sensitivity Cases for Sensitivity Testing
The table below details the various sensitivity testing scenarios from the impact assessment
developed for input into the financial model as a result of the above risk assessment which
includes risks of revenue and costs.
Table 11.5 Sensitivity Testing Scenarios
Scenario
Number Primary Risk Measurement
Risk
Score
Assumption
for Scenario
Model
Assumptions
SA01 – 1 ICD revenue decrease Revenue 6 20% increase 1.20 of Base
case
SA01 – 2 ICD revenue increase Revenue 6 20%
decrease
0.80 of Base
case
SA01 – 3 ICD revenue decrease Revenue 6 10% increase 1.10 of Base
case
SA01 – 4 ICD revenue increase Revenue 6 10%
decrease
0.90 of Base
case
SA02 - 1 Construction Costs & M&E
Costs increase Construction 6 20% increase
1.20 of Base
case
SA02 – 2 Construction Costs & M&E
Costs decrease Construction 6 20% saving
0.80 of Base
case
SA02 - 3 Construction Costs & M&E
Costs increase Construction 6 10% increase
1.10 of Base
case
SA02 – 4 Construction Costs & M&E
Costs decrease Construction 6 10% saving
0.90 of Base
case
SA03 – 1 Future operation costs
increase
CAPEX/OPEX
Costs increase 6
20% increase
in O&M
costs
1.20 of Base
case
SA03 – 2 Future operation costs
decrease
CAPEX/OPEX
Costs decrease 6
20% saving
in O&M
costs
0.80 of Base
case
SA03 – 3 Future operation costs
increase
CAPEX/OPEX
Costs increase 6
10% increase
in O&M
costs
1.10 of Base
case
SA03 – 4 Future operation costs
decrease
CAPEX/OPEX
Costs decrease 6
10% saving
in O&M
costs
0.90 of Base
case

TA 7600 SRI – Multimodal Transport Project Sri Lanka
Final Report 204
12 Financial evaluation and recommendations This section includes financial analyses for ICD projects with public finance and PPP
respectively on the procurement models proposed in Section 11 and shown in Figures 11.3
and 11.4.
12.1 Basic Assumptions for the Financial Analysis
12.1.1 Basic Assumptions
It is assumed that the first full year of operation would be 2015 with the assumption of a 2
year construction period. A major upgrade and expansion is assumed in 2020. The basic
assumptions for the ICD projects comprise the following:
• Land is assumed to be free, or an estimated land acquisition cost is assumed to be
incurred a year before construction;
• Estimated daily container traffic flow and relevant revenue projected in the previous
chapters are used;
• Estimated construction costs obtained from the engineering designs and related bills
of quantities are used;
• Professional service fees such as project development, design, legal, financial, and
supervision fees and contingencies have been included;
• Estimated annual operational and maintenance costs have been obtained from the
previous chapters;
• All the financial analysis has been in terms of nominal prices;
• Short term financing options are included when high CAPEX occurs;
• Corporate tax rate: 28%;
• Resource cost price index: 7%, other cost price index: 4%; and
• Average exchange rate in November 2011: 1USD=110 Rs.
12.1.2 Assumptions for PPP Procurement
Financial assumptions under PPP procurement:
• Equity/Debt ratio: 40/60 for private investment (based on the consultation with
commercial banks in Sri Lanka for project finance); and
• It is assumed that a 10 year loan would be taken out at 8% real interest (based on
the consultation with commercial banks in Sri Lanka) to cover stage 1 project costs
including rolling stock costs, construction costs, professional fees and other project
costs.
• As the project is funded by the Government, there will be little impact on the
financial performance with the different equity shares between the SLPA and
Railway Corporation.
12.1.3 Assumptions for Public Financing
Financial assumptions under public financing:

TA 7600 SRI – Multimodal Transport Project Sri Lanka
Final Report 205
• Equity/Debt ratio: 15/85 in which the Government will provide funding equivalent to
15% of the total project costs from national budget, and remaining 85% of the total
project costs would be ADB’s loan ; and
• It is assumed that the Government will apply for a 20 year loan from ADB, and an
average 3% real interest rate (average from historical LIBOR rates plus ADB’s
charges) is assumed to finance project costs for stage 1 and stage 2.
12.2 Revenue and Costs
12.2.1 Revenue Projection
Based on the analysis in the previous chapters, the revenue projections from providing ICD
container services for the key calendar years are summarised in real terms below:
Table 12.1 Revenue Projection for the ICD and ICD Combinations (Rs m)
Case No ICD Project 2015 2020 2025 2030 2034
1 Veyangoda 1,430 1,932 2,589 3,364 4,148
2 Enderamulla 3,033 4,098 5,492 7,135 8,797
3 Peliyagoda/Telangapata
(PelTel) 2,930 3,958 5,305 6,892 8,498
4 Ratmalana 848 1,146 1,536 1,995 2,460
5 Veyangoda + Ratmalana 2,278 3,078 4,125 5,360 6,608
6 Enderamulla + Ratmalana 3,881 5,243 7,028 9,131 11,258
7 PelTel + Ratmalana 3,778 5,104 6,841 8,888 10,958
Note: the details of the revenue forecast on an annual basis are given in Chapter 9.
12.2.2 Cost Estimates
Based on the cost estimates presented in Chapter 8, the costs for the combinations of the
ICD sites for the project development at stage 1 in real terms are summarised in the table
below including land, engineering, rolling stock and M&E.
Table 12.2 Estimate of the Starting Project Costs (Rs m)
Case
No ICD Project
Engin-
eering Land
Resettle-
ment
Rolling
stock M&E
Total
cost
(Rs m)
Total
cost
(US$ m)
1 Veyangoda 5,872 - 1,222 129 2,427 8,427 77
2 Enderamulla 9,253 166 346 305 3,609 13,167 120
3 Peliyagoda/Tela
ngapata (PelTel) 8,644 - 2,667* 305 3,609 12,558 114
4 Ratmalana 3,573 - 1,648 102 2,265 5,939 54
5 Veyangoda +
Ratmalana 7,919 - 2,870 231 4,478 12,627 115
6 Enderamulla +
Ratmalana 11,300 166 1,994 407 5,679 17,386 158
7 PelTel +
Ratmalana 10,691 - 4,315 407 5,679 16,777 153
* Includes compensation for buying out 95 year leases

TA 7600 SRI – Multimodal Transport Project Sri Lanka
Final Report 206
The CAPEX in the concession period is summarised in Table 12.3 in real terms including land,
resettlement, engineering, rolling stock and M&E. There will be a major expansion in 2020,
and therefore the CAPEX in 2020 is significantly higher than in the other calendar years. In
this revision, the land acquisition costs for Peliyagoda/Telangapata (PelTel) ICD have been
removed; compensation to be paid to companies holding long term leases is included in the
resettlement costs.
The cost estimates for operation and maintenance over the entire concession period in real
terms are summarised in Table 12.4. The O&M costs consist of three major cost
components, transport, resource and material/utilities. All the railway operation costs are
included in the transport costs as it may be operated by the Railway Corporation rather than
the project company. Resource costs include all the staff costs of ICDs. Material costs are
the costs of materials used for maintenance and operations. Utility costs include the costs of
electricity, water, and gas.

TA 7600 SRI – Multimodal Transport Project Sri Lanka
Final Report 207
Table 12.3 CAPEX during Concession Period 2015-2034 (Rs m)
Case No. ICD Project 2015 2016 2017 2018 2019 2020 2021 2022 2023 2024 2025 2026 2027 2028 2029 2030 2031 2032 2033 2034
1 Veyangoda 3 0 3 0 36 1,739 3 0 5 0 22 3 0 79 3 0 5 296 3 0
2 Enderamulla 3 22 3 79 80 5,136 24 3 8 22 5 5 81 200 5 5 276 424 27 0
3 Peliyagoda / Telangapata (PelTel) 3 22 3 79 80 12,854 24 3 8 22 5 5 81 200 5 5 276 424 27 0
4 Ratmalana 0 5 0 19 30 2,905 0 3 0 3 0 3 0 5 0 22 0 144 3 0
5 Veyangoda + Ratmalana 22 5 3 0 66 4,644 3 22 5 3 3 5 19 84 3 3 24 421 5 0
6 Enderamulla + Ratmalana 3 27 3 79 109 7,884 5 5 27 5 5 27 5 81 205 8 276 568 29 0
7 PelTel + Ratmalana 3 27 3 79 109 15,602 5 5 27 5 5 27 5 81 205 8 276 568 29 0

TA 7600 SRI – Multimodal Transport Project Sri Lanka
Final Report 208
Table 12.4 Operation and maintenance Cost Summary (Rs m)
Case No. Cost Item 2015 2016 2017 2018 2019 2020 2021 2022 2023 2024 2025 2026 2027 2028 2029 2030 2031 2032 2033 2034
1
Transport Costs 118 125 132 139 147 156 165 175 185 195 205 215 226 237 248 261 273 287 301 316
Resource costs 290 304 313 321 327 342 388 403 417 425 440 458 474 488 522 536 553 567 593 615
Material/utility Costs 260 266 273 280 288 296 353 362 372 383 392 405 416 427 459 471 484 498 516 531
2
Transport Costs 145 153 161 170 180 189 143 151 160 169 177 186 195 204 214 225 235 247 259 271
Resource costs 521 543 569 591 639 661 779 812 842 879 912 948 978 1,035 1,082 1,118 1,164 1,230 1,276 1,332
Material/utility Costs 379 391 406 419 453 467 595 615 632 651 671 689 708 748 772 795 818 866 892 922
3
Transport Costs 134 141 149 158 167 176 159 168 178 188 198 208 218 229 241 253 266 279 293 308
Resource costs 521 543 569 591 639 661 779 812 842 879 912 948 978 1,035 1,082 1,118 1,164 1,230 1,276 1,332
Material/utility Costs 377 388 404 417 450 465 593 613 630 649 669 687 706 746 770 792 816 863 889 920
4
Transport Costs 66 70 74 77 81 86 77 82 86 91 96 100 105 110 115 120 126 132 138 145
Resource costs 258 264 271 279 290 298 429 438 452 459 468 475 489 497 512 527 537 552 567 582
Material/utility Costs 234 240 246 252 262 270 421 429 437 446 455 463 473 482 493 503 518 530 543 556
5
Transport Costs 184 195 205 217 229 242 242 256 271 286 300 315 330 346 363 381 400 419 439 461
Resource costs 515 539 555 570 584 607 782 806 838 853 877 898 928 954 1,003 1,032 1,056 1,087 1,125 1,162
Material/utility Costs 445 459 472 484 497 512 697 713 734 752 769 786 805 828 869 890 913 941 966 993
6
Transport Costs 211 223 235 248 261 275 221 233 246 260 273 286 300 314 329 345 362 379 397 416
Resource costs 749 778 811 841 896 926 1,170 1,208 1,252 1,300 1,338 1,381 1,429 1,494 1,556 1,607 1,660 1,741 1,802 1,872
Material/utility Costs 568 584 605 623 662 683 936 960 984 1,014 1,038 1,064 1,094 1,143 1,176 1,208 1,241 1,299 1,336 1,378
7
Transport Costs 200 211 223 235 248 262 236 250 264 279 293 308 323 339 356 373 392 411 431 453
Resource costs 684 713 746 776 831 861 1,068 1,106 1,150 1,198 1,237 1,279 1,327 1,392 1,454 1,506 1,559 1,639 1,701 1,771
Material/utility Costs 531 547 568 586 626 647 884 908 932 962 987 1,012 1,043 1,091 1,125 1,156 1,189 1,247 1,284 1,326

TA 7600 SRI – Multimodal Transport Project Sri Lanka
Final Report 209
12.3 Base Case Analysis for Public Financing
From a preliminary assessment on the project revenue, the total revenue from a 20 year
operation is clearly not able to meet the expectation of a minimum financial return from
private investors after covering the entire construction costs, M&E equipment costs, CAPEX
and O&M costs in the concession period. The project IRRs shown in the table below indicate
that the government will carry a significant financial burden under a public funding
procurement approach although the Government could acquire a cheaper longer term loan
from ADB or other financial organisations.
Table 12.5 Project IRR under Public Funding
Case
No. ICD Project NPV (USD m) IRR
1 Veyangoda -29.9 11.0%
2 Enderamulla 7.3 19.0%
3 Peliyagoda/Telangapata (PelTel) -60.9 12.9%
4 Ratmalana -57.6 1.5%
5 Veyangoda + Ratmalana -71.8 8.9%
6 Enderamulla + Ratmalana -32 15.3%
7 PelTel + Ratmalana -100.3 11.1%
Although the public finance gets cheaper loans than the private sector, the project returns
will be low in most ICD cases. The disadvantages are that the Government will be
responsible for both initial investment costs and O&M and further investment costs, and
majority risks for the entire project life.
Enderamulla ICD shows the highest IRR and NPV among all other six ICDs but the return is
relatively low in terms of financial viability. In addition, there are significant cash flow
deficits in 2020 for all ICDs, from USD 20.8 m for Case 1 to USD 171.6 m for Case 7 in 2020 in
nominal terms. It is obvious that further public funds will be required in 2020 to meet the
CAPEX and O&M requirements due to expansion. No matter which ICD case is chosen for
development with public finance, the entire project costs and risk are significant and not
sustainable to the Government.
With such low IRRs of the ICD cases under public financing, it is clearly financially unviable
for private finance on its own. Unless the Government is willing to fund the entire project
costs and majority risks, it becomes necessary to introduce Public and Private Partnership to
attract private investment to reduce the financial burden to the Government and risks
carried by the Government.
From the brief analysis above, the public financing option appears not sustainable. The
remaining options are the PPP options studied in Section 11.4, where 5 PPP options were
proposed for the ICD projects. The financial viability of these PPP options are analysed in
Sections 12.4-12.8.

TA 7600 SRI – Multimodal Transport Project Sri Lanka
Final Report 210
12.4 Base Case Analysis for PPP
For a PPP procurement project, the concession period is normally 25 years to 30 years.
However the project TOR indicates the concession to be the construction period plus 20
years, which has been adopted in the financial analysis.
Five PPP options have been proposed in order to identify the best possible PPP equity
structure for both the public and private sectors:
• Option 1: Public funding of land acquisition and resettlement; private sector
investment in civil engineering, rolling stock and M&E;
• Option 2: Public funding of land acquisition, resettlement, and civil engineering;
private sector investment in rolling stock and M&E;
• Option 3: Public funding of land acquisition, resettlement, and rolling stock; private
sector investment in civil engineering and M&E;
• Option 4: Public funding of land acquisition, resettlement, rolling stock and M&E;
private sector investment in civil engineering;
• Option 5: Public funding of land acquisition, resettlement and 50% of civil
engineering; private sector investment in rolling stock and M&E.
As there is a major expansion and upgrading programme around year 2020, it is assumed
that the government grant or funding (with zero return) will be available to each option
listed above. For example, the government will be responsible for the land acquisition and
resettlement costs in 2020 if Option 1 is chosen. Similarly, the government will be
responsible for the land acquisition, resettlement and civil engineering costs in both 2014
and 2020 if Option 2 is chosen.
The financial analysis indicates that the Weighted Average Costs of Capital (WACC) for each
ICD project are as shown in the table below with the assumption of full private finance and
PPP with the government to invest on land and resettlement:
Table 12.6 The Weighted Average Costs of Capital for each ICD
Case No. ICD Project WACC (%)
Under Private finance
WACC (%)
under PPP
1 Veyangoda 5.81 4.85
2 Enderamulla 5.81 5.53
3 Peliyagoda / Telangapata (PelTel) 5.81 4.46
4 Ratmalana 5.81 4.19
5 Veyangoda + Ratmalana 5.81 4.38
6 Enderamulla + Ratmalana 5.81 4.95
7 PelTel + Ratmalana 5.81 4.21
12.4.1 Veyangoda ICD – Base Case
It is here assumed that Veyangoda ICD site will be operated separately. This operation
requires a 3 track railhead within Colombo Port, and a new rail link at Sedawatta.

TA 7600 SRI – Multimodal Transport Project Sri Lanka
Final Report 211
The figure below shows the projected revenue and costs over a 20 year concession period in
nominal terms. Revenue will grow with the increase in container throughput while the costs
are also related to the container throughput and the M&E equipment. Costs and revenues
are expressed in nominal terms over the concession period.
Figure 12.1 Veyangoda ICD - Project Revenue and Costs
The analysis results show that the project IRR is 11.0%. The table below shows the FIRRs on
equity in nominal terms under each PPP investment option for Veyangoda ICD. Obviously,
FIRRs from PPP Options 1 and 3 are below 20% and these equity arrangements will not
attract the private sector to invest and operate under this PPP scenario starting from 2015.
Options 2, 4 and 5 are financially viable and attractive to private investors as the FIRRs are
higher than the 20% benchmark. Option 2 requires high percentages of government
investment and the return to equity is excessive. The government will not achieve the
maximum benefits from PPP Option 2 but will take more risks, and therefore Option 2 is not
recommended for PPP procurement.
Table 12.7 FIRR of Veyangoda ICD under different PPP options
Option
No Public Investment Private Investment
Public/private
equity ratio
NPV (USD
m) FIRR
1 Land, resettlement
Civil engineering,
rolling stock,
M&E equipment
12/88 28.1 15.3%
2 Land, resettlement,
civil engineering
Rolling stock,
M&E equipment 69/31 71.1 55.1%
3 Land, resettlement,
Rolling stock
Civil engineering
M&E equipment 13/87 32.7 17.4%
4
Land, resettlement,
Rolling stock,
M&E equipment
Civil engineering 36/51 51.7 24.3%
5 Land, resettlement,
50% civil engineering
50% Civil
engineering,
rolling stock,
M&E equipment
40/60 49.6 24.1%

TA 7600 SRI – Multimodal Transport Project Sri Lanka
Final Report 212
The above analysis shows the FIRR on the equity investment and NPV under different public
and private investment scenarios. The FIRRs with different percentages of government
grants to the project costs are shown in the figure below. Private investors’ expected rate of
financial return is 20%. The results show that the most viable equity investment structure
for Veyangoda ICD is Option 5, with the public/private equity ratio being 40/60 with FIRR
24.1%. Alternatively, the government funding level at a minimum 25% of the total project
costs in 2014 and 2020 is recommended as the PPP procurement option shown in the figure
below.
Figure 12.2 Relationship between Government Grant and FIRR for Veyangoda ICD
Figure 12.3 shows the cash flow from 2015 to 2034 for Veyangoda ICD with the assumption
of Government grants for land, resettlement and 50% of civil engineering costs (Option 5).
Option 5 shows a negative cash flow in 2020 and the support of short term loans or
refinancing is required to resolve the cash flow deficit. The minimum debt service coverage
ratio is 2.33 excluding year 2020. In reality, the expansion investment in 2020 could be over
a number of years and cash flow deficit could be reduced significantly as shown in Figure
12.4, and it may not require short term loans under an optimized investment plan.
The details of cash flow are summarized in Table 12.15.
0
10
20
30
40
50
60
0 10 20 30 40 50 60 70 80
FIR
R
Government Grant aginst total costs (%)
+

TA 7600 SRI – Multimodal Transport Project Sri Lanka
Final Report 213
Figure 12.3 Veyangoda ICD - Cash Flow from PPP Option 5
Figure 12.4 2020 Expansion Costs being Redistributed for Four Years
In summary, in order to ensure a workable cash flow during the concession period for a PPP
implementation, it is suggested that the Government provide grants or funding (with zero
returns) for 25% of project costs, and this would attract private investors to invest the
remaining 75% of project costs. Private investors would be responsible for O&M and
provide short term loans to resolve the cash flow deficit for project expansion in 2020.
12.4.2 Enderamulla ICD – Base Case
It is here assumed that Enderamulla ICD site will be operated separately. This operation
requires a 3 track railhead within Colombo Port, and a new rail link at Sedawatta.
The figure below shows the projected revenue and costs over a 20 year concession period in
nominal terms. Revenue will grow with the increase in container volume throughput while
the costs are also related to the container throughput and the M&E equipment. Costs and
revenues are expressed in nominal terms over the concession period.
-20.0
-10.0
0.0
10.0
20.0
30.0
40.0
2015
2017
2019
2021
2023
2025
2027
2029
2031
2033
USD m
0.0
10.0
20.0
30.0
40.0
2015
2017
2019
2021
2023
2025
2027
2029
2031
2033
USD m

TA 7600 SRI – Multimodal Transport Project Sri Lanka
Final Report 214
Figure 12.5 Enderamulla ICD: Project Revenue and Costs
The analysis results show that the project IRR is 19.0%. The table below shows the FIRRs on
equity in nominal terms under each PPP investment option for Enderamulla ICD. All the
options are financially viable and attractive to private investors as the FIRRs are higher than
the 20% benchmark. Option 2 requires high percentages of government investment and the
return to equity is excessive. The government will not achieve the maximum benefits from
PPP Option 2 but will take more risks, and therefore Option 2 is not recommended for PPP
procurement.
Table 12.8 FIRR of Enderamulla ICD under different PPP options
Option
No Public Investment Private Investment
Public/private
equity ratio
NPV
(USD m) FIRR
1 Land, resettlement
Civil engineering,
rolling stock,
M&E equipment
04/96 80.6 20.3%
2 Land, resettlement,
civil engineering
Rolling stock,
M&E equipment 68/32 152.4 75.5%
3 Land, resettlement,
rolling stock
Civil engineering
M&E equipment 06/94 89.2 21.9%
4
Land, resettlement,
rolling stock,
M&E equipment
Civil engineering 31/69 127.8 34.0%
5 Land, resettlement,
50% civil engineering
50% Civil engineering,
rolling stock,
M&E equipment
35/65 116.5 32.4%
In view of the implementation feasibility and the principle of PPP procurement with
minimum government investment, Option 1 is recommended as the PPP procurement
option for Enderamulla ICD. Option 1 requires the government to invest in land and re-
settlement, with the public/private equity ratio being 4/96 with an equity FIRR of 20.3%.
Alternatively, the government funding level at 5% of the total project costs in 2014 and
2020 is recommended as the PPP procurement option.
Figure 12.6 shows the cash flow of Option 1 from 2015 to 2034 for Enderamulla ICD with the
assumption of Government grants for land and resettlement costs. Option 1 shows negative
cash flow between 2020 and 2021, and the support of short term loans or refinancing is

TA 7600 SRI – Multimodal Transport Project Sri Lanka
Final Report 215
required to resolve the cash flow deficit. The minimum debt service coverage ratio is 1.94
excluding 2020 and 2021. In reality, the expansion investment in 2020 could be over a
number of years and the cash flow deficit could be reduced significantly as shown in Figure
12.7, and it only requires a very small amount of short term loans under an optimized
investment plan.
The details of cash flow are summarized in Table 12.15.
Figure 12.6 Enderamulla ICD - Cash Flow from PPP Option 1
Figure 12.7 2020 Expansion Costs being Redistributed for Four Years
In summary, in order to ensure a workable cash flow during the concession period for a PPP
implementation, it is suggested that the Government provides grants or funding (with zero
returns) for 4% of project costs, and this would attract private investors to invest the
remaining 96% of project costs. Private investors would be responsible for O&M and
provide short term loans to resolve the cash flow deficit for project expansion in 2020.
12.4.3 Peliyagoda/Telangapata ICD – Base Case
It is here assumed that Peliyagoda/Telangapata ICD site will be operated separately. This
operation requires a 3 track railhead within Colombo Port, and a new rail link at Sedawatta.
-80.0
-60.0
-40.0
-20.0
0.0
20.0
40.0
60.0
80.0
2015
2017
2019
2021
2023
2025
2027
2029
2031
2033
USD m
-10.0
0.0
10.0
20.0
30.0
40.0
50.0
60.0
70.0
80.0
201
5
201
7
201
9
202
1
202
3
202
5
202
7
202
9
203
1
203
3
USD m

TA 7600 SRI – Multimodal Transport Project Sri Lanka
Final Report 216
It is assumed that most publicly land owned land will be provided free of charge to the
project, in line with the assumption made for other potential ICD sites. However, some of
this land has already been leased to the private sector on a long term basis. Compensation
to buy out these leases, as estimated by a professional valuer, has been included in the
resettlement costs. The figure below shows the projected revenue and costs over a 20 year
concession period in nominal terms. Revenue will grow with the increase in container
throughput while the costs are also related to the container volume throughput and the
purchase of M&E equipment. Costs and revenues are expressed in nominal terms over the
concession period.
Figure 12.8 Peliyagoda/Telangapata ICD: Project Revenue and Costs
The analysis results show that the project IRR is 12.9%. The table below shows the FIRRs on
equity, in nominal terms under each PPP investment option for Peliyagoda/Telangapata ICD.
In this analysis, the only land acquisition costs relate to buying out long term leases held by
companies; these are included in the resettlement costs. All the options in the table below
apart from Option 1 are financially viable and attractive to private investors as the FIRRs are
higher than the 20% benchmark. Options 2, 4 and 5 require high percentages of government
investment and the return to equity is excessive. The government will not achieve the
maximum benefits from these PPP options, which are therefore are not recommended.

TA 7600 SRI – Multimodal Transport Project Sri Lanka
Final Report 217
Table 12.9 FIRR of Peliyagoda/Telangapata ICD under different PPP options
Option
No Public Investment Private Investment
Public/private
equity ratio
NPV
(USD m) FIRR
1 Land, resettlement
Civil engineering,
rolling stock,
M&E equipment
17/83 72.2 19.6%
2 Land, resettlement,
civil engineering
Rolling stock,
M&E equipment 71/29 141.4 71.4%
3 Land, resettlement,
rolling stock
Civil engineering
M&E equipment 18/82 80.9 21.2%
4
Land, resettlement,
rolling stock,
M&E equipment
Civil engineering 41/59 120.7 34.3%
5 Land, resettlement,
50% civil engineering
50% Civil
engineering,
rolling stock,
M&E equipment
44/56 106.8 31.2%
In view of the implementation feasibility and the principle of PPP procurement with
minimum government investment, Option 3 is recommended as the PPP procurement
option for Peliyagoda/Telangapata ICD. Option 3 requires the government to invest in land
re-settlement and civil engineering costs, with the public/private equity ratio being 18/82
with FIRR 21.2%. The government grant or funding level of 18% of the total project costs in
2014 and 2020 is recommended as the PPP procurement option.
The figure below shows the cash flow of Option 3 from 2015 to 2034 for
Peliyagoda/Telangapata ICD with the assumption of the Government grants for land,
resettlement and rolling stock costs. Option 3 shows negative cash flow in 2020 and the
support of short term loans or refinancing is required to resolve the cash flow deficit. The
minimum debt service coverage ratio is 1.1 excluding 2020.
The details of cash flow are summarized in Table 12.15.
Figure 12.9 Peliyagoda/Telangapata ICD - Cash Flow for PPP Option 3
-60.0
-40.0
-20.0
0.0
20.0
40.0
60.0
80.0
2015
2017
2019
2021
2023
2025
2027
2029
2031
2033
USD m

TA 7600 SRI – Multimodal Transport Project Sri Lanka
Final Report 218
In summary, in order to ensure a workable cash flow during the concession period for a PPP
implementation, it is suggested that the Government provide grants or funding (with zero
returns) for 18% of the project costs. This would attract private investors to invest the
remaining 82% of project costs. Private investors would be responsible for O&M and
provide short term loans to resolve the short term cash flow deficit.
12.4.4 Ratmalana ICD – Base Case
It is here assumed that Ratmalana ICD site will be operated separately. This operation
requires a 3 track railhead within Colombo Port, but does not require a new rail link at
Sedawatta.
The figure below shows the projected revenue and costs over a 20 year concession period in
nominal terms. Revenue will grow with the increase in container throughput while the costs
are also related to the container throughput and the M&E equipment. Costs and revenues
are expressed in nominal terms over the concession period.
Figure 12.10 Ratmalana ICD: Project Revenue and Costs
The analysis results show that the project IRR is 1.5%. The table below shows the FIRRs on
equity in nominal terms under each PPP investment option for Ratmalana ICD. It is shown
that FIRRs from all the PPP Options are below 20% apart from Option 2 and these equity
arrangements will not attract private sector to invest and operate under this PPP scenario
starting from 2015. The highest return is from Option 2, with an FIRR of 26.2%, which is
financially viable but would require government funding of 63% of the investment.

TA 7600 SRI – Multimodal Transport Project Sri Lanka
Final Report 219
Table 12.10 FIRR of Ratmalana ICD under different PPP options
Option
No Public Investment Private Investment
Public/private
equity ratio
NPV
(USD m) FIRR
1 Land, resettlement
Civil engineering,
Rolling stock,
M&E equipment
20/80 -7.1 7.5%
2 Land, resettlement,
civil engineering
rolling stock,
M&E equipment 63/27 19.4 26.2%
3 Land, resettlement,
rolling stock
Civil engineering
M&E equipment 21/79 -4.2 8.4%
4
Land, resettlement,
rolling stock,
M&E equipment
Civil engineering 49/51 15.6 19.5%
5 Land, resettlement,
50% civil engineering
50% Civil engineering,
rolling stock,
M&E equipment
42/58 6.2 13.0%
The figure below shows the cash flow of Option 2, with the highest FIRR of all options.
Provision of short term loans could resolve the cash flow problem in 2020. The minimum
debt service coverage ratio is 3.18 excluding 2020.
The details of cash flow are summarized in Table 12.15.
Figure 12.11 Ratmalana ICD - Cash Flow from PPP Option 2
Unless the government is to invest under the proposal for Option 2, Ratmalana ICD will not
be viable when developed separately under a PPP procurement. It is unlikely that the
government will be willing to invest in a small scale project requiring a large percentage of
public funding to cover 63% of project costs, since the project IRR is only 1.5%.
12.4.5 Veyangoda + Ratmalana ICDs – Base Case
It is here assumed that Veyangoda ICD will be operated together with Ratmalana ICD. This
operation requires a 4 track railhead within Colombo Port, and a new rail link at Sedawatta.
The figure below shows the projected revenue and costs over a 20 year concession period in
nominal terms. Revenue will grow with the increase of container throughput while the costs
-15.0
-10.0
-5.0
0.0
5.0
10.0
15.0
20
15
20
17
20
19
20
21
20
23
20
25
20
27
20
29
20
31
20
33
USD m

TA 7600 SRI – Multimodal Transport Project Sri Lanka
Final Report 220
are also related to the container throughput and the M&E equipment. Costs and revenues
are expressed in nominal terms over the concession period. Only one headquarter
management team is included as a cost saving scheme.
Figure 12.12 Veyangoda + Ratmalana ICDs: Project Revenue and Costs
The analysis results show that the project IRR is 8.9%. The table below shows the FIRRs on
equity in nominal terms under each PPP investment option for the ICD combination
Veyangoda ICD + Ratmalana ICD, recognizing that the latter is not financially viable on its
own. With the ICD combination, management costs and operation costs will be optimised.
FIRRs from PPP Options 1 and 3 are below 20% and these equity arrangements will not
attract the private sector. Options 2, 4 and 5 are financially viable and attractive to private
investors as the FIRRs are higher than the 20% benchmark. Option 2 requires high
percentages of government investment and the return to equity is excessive. The
government will not achieve the maximum benefits from PPP Option 2 but will take more
risks, and therefore Option 2 is not recommended for PPP procurement.

TA 7600 SRI – Multimodal Transport Project Sri Lanka
Final Report 221
Table 12.11 FIRR of Veyangoda + Ratmalana ICDs under different PPP options
Option
No Public Investment Private Investment
Public/private
equity ratio
NPV
(USD m) FIRR
1 Land, resettlement
Civil engineering,
Rolling stock,
M&E equipment
18/82 25.6 13.7%
2
Land,
resettlement,
civil engineering
Rolling stock,
M&E equipment 66/34 85.2 40.1%
3
Land,
resettlement,
rolling stock
Civil engineering
M&E equipment 19/81 33.1 14.9%
4
Land,
resettlement,
rolling stock,
M&E equipment
Civil engineering 46/54 70.6 25.9%
5
Land,
resettlement,
50% civil
engineering
50% Civil
engineering,
rolling stock,
M&E equipment
42/58 55.4 21.0%
The above analysis shows the FIRR on the equity investment and hence its attractiveness to
private investment. The FIRRs with different percentages of government grants to the
project costs are shown in the figure below. A private investor’s expected rate of financial
return is 20%. The results show that the most viable equity investment structure for
Veyangoda + Ratmalana ICDs is Option 5, with the public/private equity ratio being 42/58
with FIRR 21%. Therefore, a government funding level at 40% or above of the total project
costs in 2014 and 2020 is recommended as the PPP procurement option shown in the figure
below.
Figure 12.13 Relationship between Government Grant and FIRR for Veyangoda +
Ratmalana ICDs
The figure below shows the cash flow from 2015 to 2034 for Veyangoda + Ratmalana ICDs,
with the assumption of the Government grants for land, resettlement and 50% of the civil
engineering cost (Option 5). Option 5 shows a negative cash flow in 2020 and the support of
0
10
20
30
40
50
0 10 20 30 40 50 60 70
FIR
R
Government Grant aginst total costs (%)
+

TA 7600 SRI – Multimodal Transport Project Sri Lanka
Final Report 222
short term loans or refinancing is required to resolve the cash flow deficit. The minimum
debt service coverage ratio is 1.67 excluding 2020.
The details of cash flow are summarized in Table 12.15.
Figure 12.14 Veyangoda + Ratmalana ICDs - Cash Flow from PPP Option 5
In summary, in order to ensure a workable cash flow during the concession period for a PPP
implementation, it is suggested that the Government provide grants or funding (with zero
returns) for 42% of the project costs, and this would attract private investors to invest the
remaining project costs. Private investors would be responsible for O&M and provide short
term loans to resolve the cash flow deficit for project expansion in 2020.
12.4.6 Enderamulla + Ratmalana ICD – Base Case
It is here assumed that Enderamulla ICD will be operated together with Ratmalana ICD. This
operation requires a 4 track railhead within Colombo Port, and a new rail link at Sedawatta.
The figure below shows the projected revenue and costs over a 20 year concession period in
nominal terms. Revenue will grow with the increase of container volume while the costs are
also related to the container volume and the M&E equipment in nominal terms over the
concession period.
-80.0
-60.0
-40.0
-20.0
0.0
20.0
40.0
60.0
80.0
100.0
2015
2017
2019
2021
2023
2025
2027
2029
2031
2033
USD m

TA 7600 SRI – Multimodal Transport Project Sri Lanka
Final Report 223
Figure 12.15 Enderamulla + Ratmalana ICDs: Project Revenue and Costs
The analysis results show that the project IRR is 15.3%. The table below shows the FIRRs on
equity in nominal terms under each PPP investment option for Enderamulla + Ratmalana
ICDs. Options 2 to 5 are financially viable and attractive to private investors as the FIRRs are
higher than the 20% benchmark. Option 2 requires a high percentage of government
investment and the return to equity is excessive. The government will not achieve the
maximum benefits from PPP Option 2 but will take more risks, and therefore Option 2 is not
recommended for PPP procurement.
Table 12.12 FIRR of Enderamulla + Ratmalana ICDs under different PPP options
Option
No Public Investment Private Investment
Public/private
equity ratio
NPV (USD
m) FIRR
1 Land, resettlement
Civil engineering,
rolling stock,
M&E equipment
11/89 80.8 17.8%
2 Land, resettlement,
civil engineering
Rolling stock,
M&E equipment 66/34 169.3 57.2%
3 Land, resettlement,
rolling stock
Civil engineering
M&E equipment 12/88 92.3 19.4%
4
Land, resettlement,
rolling stock,
M&E equipment
Civil engineering 40/60 148.6 32.9%
5 Land, resettlement,
50% civil engineering
50% Civil
engineering,
rolling stock,
M&E equipment
38/62 125 27.5%
In view of the implementation feasibility and the principle of PPP procurement with
minimum government investment, Option 3 is recommended as the PPP procurement
option for combining Enderamulla ICD with Ratmalana ICD. Option 3 requires the
government to invest in land and re-settlement plus rolling stock, with the public/private
equity ratio being 12/88 and the FIRR 19.4%, only slightly below the 20% bench mark
expectation.

TA 7600 SRI – Multimodal Transport Project Sri Lanka
Final Report 224
The figures below shows the cash flow of Option 3 from 2015 to 2034 for Enderamulla +
Ratmalana ICDs with the assumption of Government grants for land, resettlement and
rolling stock costs. Option 3 shows negative cash flow in 2020 and the support of short term
loans or refinancing is required to resolve the cash flow deficit. The minimum debt service
coverage ratio is 1.94 excluding 2020 and 2021. In 2021, the minimum debt service coverage
ratio is 0.89, and a short term loan is required to cover the operation of 2020 and 2021.
The details of cash flow are summarized in Table 12.15.
Figure 12.16 Enderamulla + Ratmalana ICDs - Cash Flow from PPP Option 3
In summary, in order to ensure a workable cash flow during the concession period for a PPP
implementation, it is suggested that the Government provide grants or funding (with zero
returns) for 12-15% of the project costs, and this would attract private investors to invest
the remaining 85-88% of the project costs. Private investors would be responsible for O&M
and provide short term loans to resolve the cash flow deficit for project expansion in 2020.
12.4.7 Peliyagoda/Telangapata + Ratmalana ICD – Base Case
It is here assumed that Peliyagoda/Telangapata ICD will be operated together with
Ratmalana ICD. This operation requires a 4 track railhead within Colombo Port, and a new
rail link at Sedawatta.
The figure below shows the projected revenue and costs over a 20 year concession period in
nominal terms. Revenue will grow with the increase of container volume while the costs are
also related to the container volume and the M&E equipment in nominal terms over the
concession period. Only one headquarter management team is included as a cost saving
scheme.
-80.0
-60.0
-40.0
-20.0
0.0
20.0
40.0
60.0
80.0
100.0
2015
2017
2019
2021
2023
2025
2027
2029
2031
2033
USD m

TA 7600 SRI – Multimodal Transport Project Sri Lanka
Final Report 225
Figure 12.17 Peliyagoda/Telangapata + Ratmalana ICD: Project Revenue and Costs
The analysis results show that the project IRR is 11.1%. The table below shows the FIRRs on
equity in nominal terms under each PPP investment option for combining
Peliyagoda/Telangapata ICD with Ratmalana ICD. Options 2, 4 and 5 meet the private
sector’s target 20%+ FIRR. Options 2 and 4 require high percentages of government
investment and the return to equity is excessive. The government would not achieve the
maximum benefits from these PPP options, which are therefore not recommended for PPP
procurement.
Table 12.13 FIRR of Peliyagoda/Telangapata + Ratmalana ICDs under different PPP options
Option No Public Investment Private Investment Public/private
equity ratio
NPV
(USD m) FIRR
1 Land, resettlement
Civil engineering,
rolling stock,
M&E equipment
20/80 72.3 17.2%
2 Land, resettlement,
civil engineering
Rolling stock,
M&E equipment 68/32 158.7 54.2%
3 Land, resettlement,
rolling stock
Civil engineering
M&E equipment 21/79 83.8 18.8%
4
Land, resettlement,
rolling stock,
M&E equipment
Civil engineering 47/53 141.4 33.1%
5
Land, resettlement,
50% civil
engineering
50% Civil
engineering,
rolling stock,
M&E equipment
44/56 115.2 26.4%
From the point of view of implementation feasibility and the principles of PPP procurement
with minimum government investment, Option 5 is recommended as the PPP procurement
option for Peliyagoda/Telangapata ICD + Ratmalana ICD. Option 5 requires the government
to invest in land and re-settlement costs plus 50% of engineering costs, with the
public/private equity ratio being 44/56; this option yields an FIRR of 26.4%. Therefore, a
government grant or funding level at 45% of the total project costs in 2014 and 2020 is
recommended as the PPP procurement option.

TA 7600 SRI – Multimodal Transport Project Sri Lanka
Final Report 226
The figure below shows the cash flow of Option 5 from 2015 to 2034 for
Peliyagoda/Telangapata + Ratmalana ICDs with the assumption of Government grants for
land and resettlement costs, plus 50% of engineering costs. Option 5 shows negative cash
flow in 2020 and the support of short term loans or refinancing is required to resolve the
cash flow deficit. The minimum debt service coverage ratio is 2.06 excluding 2020.
The details of cash flow are summarized in Table 12.15.
Figure 12.18 Peliyagoda/Telangapata + Ratmalana ICDs - Cash Flow from PPP Option 5
In summary, in order to ensure a workable cash flow during the concession period for a PPP
implementation, it is suggested that the Government provide grants or funding (with zero
returns) for 45% of the project costs, and this would attract private investors to invest the
remaining 50% of the project costs. Private investors would be responsible for O&M and
provide short term loans to resolve cash flow deficit for project expansion in 2020.
-80.0
-60.0
-40.0
-20.0
0.0
20.0
40.0
60.0
80.0
100.0
2015
2017
2019
2021
2023
2025
2027
2029
2031
2033
USD m

TA 7600 SRI – Multimodal Transport Project Sri Lanka
Final Report 227
12.4.8 Base Case Summary
Based on the analysis in the above section, the main issue under PPP is the high costs of
land, resettlement and civil engineering in the Stage 1 project development in 2014 and the
major expansion in 2020. There is a cash flow problem in 2020 for all the ICD projects. Some
projects require short term loans to resolve the cash flow problem. In some other cases,
with smaller container volumes, refinancing may be considered.
The tables below show the summary of the recommended equity structure with the return
to equity and detailed cash flow under the recommended PPP scheme, with Government
providing grant or funding (with zero return) for the project funding gap. It is recommended
that the Government should seek ADB funds or other financial organization funds to finance
the grants and subsequently the total project costs to the Government should be
significantly lower than the costs from pure public financing.
These recommendations are preliminary and a detailed analysis is required in the
implementation stage with a more realistic equity structure accepted by both public and
private investors.
Table 12.14 ICD Base Case Summary
Case
No. ICD Project
PPP
Option
Public/priv
ate equity
ratio
NPV (USD m) FIRR
1 Veyangoda 5 40/60 49.1 25.6%
2 Enderamulla 1 04/96 80.6 20.3%
3 Peliyagoda/Telangapata
(PelTel) 3 18/82 80.9 21.2%
4 Ratmalana 2 63/37 19.4 26.2%
5 Veyangoda + Ratmalana 5 42/58 55.4 21.0%
6 Enderamulla + Ratmalana 3 12/88 92.3 19.4%
7 PelTel + Ratmalana 5 44/56 115.2 26.4%

TA 7600 SRI – Multimodal Transport Project Sri Lanka
Final Report 228
Table 12.15 ICD Base Case Cash Flow Summary (Rs m)
Case
No. 2015 2016 2017 2018 2019 2020 2021 2022 2023 2024 2025 2026 2027 2028 2029 2030 2031 2032 2033 2034
1
6.7
7.2
4.2
5.0
5.5
(14.6)
7.5
8.6
9.7
11.1
12.1
13.8
18.8
20.2
21.8
23.6
25.4
22.2
29.7
32.1
2
12.7
13.7
7.1
9.0
9.9
(62.0)
15.4
18.2
20.9
20.0
26.5
30.0
41.3
40.0
47.7
51.7
51.2
52.4
64.8
70.6
3
12.3
13.3
7.1
8.9
9.7
(53.2)
14.3
16.9
19.5
22.1
25.0
28.3
38.9
37.3
44.8
48.6
47.8
48.7
60.8
66.2
4
4.5
4.6
3.2
3.4
3.6
(12.0)
3.1
0.7
4.0
4.5
5.0
5.6
7.9
8.4
9.0
9.2
10.3
8.5
11.9
12.9
5
8.7
9.6
5.0
6.3
7.0
(32.5)
9.3
7.9
12.6
14.7
16.5
18.9
26.1
28.4
30.8
33.4
35.9
31.8
42.7
46.4
6
14.8
16.1
7.6
10.0
11.1
(62.7)
17.0
17.3
23.3
23.5
30.5
34.6
49.0
48.4
57.0
61.8
62.4
62.0
78.1
85.2
7
15.1
16.3
11.0
13.1
14.0
(66.6)
19.0
19.0
24.7
28.2
31.5
35.2
46.2
45.4
53.7
58.2
58.6
57.9
73.6
80.4

TA 7600 SRI – Multimodal Transport Project Sri Lanka
Final Report 229
12.5 Sensitivity Analysis for PPP Options
From the results of risk assessment, two key risk components identified with the highest risk
scores in Table 11.4, costs and revenue, are tested in this section.
12.5.1 Revenue Growth Sensitivity
For the revenue sensitivities in Table 11.5, Cases SA01, SA02, we tested sensitivity to a range
of revenues, ranging from 0.80 x base (=lower revenue case) to 1.20 x base revenue case
(=upper revenue case). The returns to equity in all the cases are as shown in the table
below.
From testing the upper revenue case for PPP options, there are 10-11% gains in FIRRs,
above the base case, apart from the ICD project 4, when the revenue are increased by 14%
from the base case.
When the revenue is reduced by 20% from the base case, i.e. the lower revenue base, the
impact on FIRR is mostly having 8-13% reduction and FIRRs drop below 20% which is
normally the minimum expected level of return to private investors. The impact is
significant.
The impact of revenue sensitivity is greater than that of cost sensitivity, analysed below.
Revenue risk is the biggest risk for ICD projects, and the best way for the revenue risk
allocation is sharing between the Government and private investors.
Table 12.16 Financial projections: FIRR sensitivities to revenue
Revenue Sensitivity case ICD Project
1 2 3 4 5 6 7
Base revenue x 80% 17.3 12.9 13.5 12.7 12.4 11.8 16.2
Base revenue 25.6 20.3 21.2 26.2 21 19.4 26.4
Base revenue x 120% 33.6 27.4 28.7 38.4 29.1 26.5 37
12.5.2 Construction and M&E Cost Sensitivity
The sensitivity to a range of costs, ranging from 0.80 x base (=lower cost case) to 1.20 x base
construction and M&E (=upper cost base) cost case is tested. The returns to equity in all
cases, including all the ICD projects with the recommended PPP options, are as shown in the
table below.
There are significant 6-7% gains on FIRRs when the construction and M&E costs are reduced
by 20% from the base case, i.e. the lower case base.
However when the construction and M&E costs overrun by 20% from the base case, i.e. the
higher cost base, the impact on FIRR is between 6-12% reduction, letting FIRRs drop below
20%, which is normally the minimum expected level of return to private investors. This
indicates that when private investors take the risk of the construction and M&E costs
overrunning, they may request more protection from the government, or alternatively for
higher government grants.

TA 7600 SRI – Multimodal Transport Project Sri Lanka
Final Report 230
Under PPP procurement, the Government may wish to share the extra profits from the ICD
projects and also to share part of risks on the revenue. As a realistic implementation plan, it
is recommended that the Government invest the land and resettlement project costs as the
minimum investment requirements and make further investment in partial civil engineering
costs or either rolling stocks or M&E equipment.
Table 12.17 Financial projections: FIRR sensitivities to construction and M&E costs
Cost Sensitivity case ICD Project
1 2 3 4 5 6 7
Base investment cost x
80% 33.7 27 28.2 38.5 27.9 25.6 35.8
Base investment cost 25.6 20.3 21.2 26.2 21 19.4 26.4
Base investment cost x
120% 20.4 15.9 16.7 19 16.4 15.2 26.4
12.5.3 Operation and Maintenance Cost Sensitivities
For the O&M cost sensitivities Table 11.5, Cases SA03), we tested sensitivity to a range of
O&M costs, ranging from 0.80 x base (=lower cost case) to 1.20 x base O&M cost case
(=upper cost base). The returns to equity at all the cases are as shown in the table below.
In comparison with the sensitivities from the project construction and M&E costs, the
impacts on FIRRs from the O&M costs are generally smaller than those from the project
construction and M&E costs.
From testing the lower cost case, there are 4-5% gains in FIRRs apart from the ICD project 4,
when the FIRR is increased by about 9%.
When the O&M costs overrun by 20% from the base case, i.e. the higher cost base, the
impact on FIRR is mostly having 4-5% reduction and FIRRs drop below 20% which is normally
the minimum expected level of return to private investors. The impact is slightly higher than
the sensitivity to the project construction and M&E costs.
In comparison with the construction and M&E cost sensitivities, the O&M cost sensitivities
are smaller, and this is the risk which private investors will be able to take for a concession
contract as the O&M costs are more controllable by management from private sector.
Table 12.18 Financial projections: FIRR sensitivities to O&M costs
Cost Sensitivity case ICD Project
1 2 3 4 5 6 7
Base O&M cost x 80% 29.5 22.9 24.1 35 25 22.3 30.7
Base O&M cost 25.6 20.3 21.2 26.2 21 19.4 26.4
Base O&M cost x 120% 21.8 17.6 18.3 16.7 16.8 16.4 22.2

TA 7600 SRI – Multimodal Transport Project Sri Lanka
Final Report 231
12.6 Further Sensitivity Analysis for PPP Options
This section shows the analysed results under ADB’s format. The items of sensitivity testing
are in line with Section 12.5 and Table 11.5. The sensitivity indicators and switching values
are calculated based on the ADB guidelines on sensitivity and risk analyses.
12.6.1 Veyangoda ICD
Table 12.19 Veyangoda ICD FIRR Sensitivities
Item Change NPV FIRR (%) Sensitivity
Indicator
Switching
Value (%)
Base case (Option 5) 49.6 24.1
Construction & M&E +10% 44.5 22.8 -1.0 -97.3
Construction & M&E -10% 54.6 29.2 -1.0 -99.2
Revenue +10% 63.5 29.6 2.8 35.7
Revenue -10% 35.6 21.5 2.8 35.4
O&M Costs +10% 43.1 23.7 -1.3 -76.3
O&M Costs -10% 56.1 27.6 -1.3 -76.3
12.6.2 Enderamulla ICD
Table 12.20 Enderamulla ICD FIRR Sensitivities
Item Change NPV FIRR (%) Sensitivity
Indicator
Switching
Value (%)
Base case (Option 1) 80.6 20.3
Construction & M&E +10% 67.7 17.9 -1.6 -62.5
Construction & M&E -10% 93.5 23.2 -1.6 -62.5
Revenue +10% 110.1 23.8 3.7 27.3
Revenue -10% 51.1 16.6 3.7 27.3
O&M Costs +10% 69.4 18.9 -1.4 -72.0
O&M Costs -10% 91.8 21.6 -1.4 -72.0
12.6.3 Peliyagoda/Telangapata ICD
Table 12.21 Peliyagoda/Telangapata ICD FIRR Sensitivities
Item Change NPV FIRR (%) Sensitivity
Indicator
Switching
Value (%)
Base case (Option 3) 80.9 21.2
Construction & M&E +10% 69.1 18.7 -1.5 -68.6
Construction & M&E -10% 92.6 24.3 -1.4 -69.1
Revenue +10% 109.4 25 3.5 28.4
Revenue -10% 52.4 17.4 3.5 28.4
O&M Costs +10% 69.6 19.8 -1.4 -71.6
O&M Costs -10% 92.2 22.7 -1.4 -71.6

TA 7600 SRI – Multimodal Transport Project Sri Lanka
Final Report 232
12.6.4 Ratmalana ICD
Table 12.22 Ratmalana ICD FIRR Sensitivities
Item Change NPV FIRR (%) Sensitivity
Indicator
Switching
Value (%)
Base case (Option 2) 19.4 26.2
Construction & M&E +10% 16.6 22.2 -1.4 -69.3
Construction & M&E -10% 22.3 31.5 -1.5 -66.9
Revenue +10% 27.7 32.4 4.3 23.4
Revenue -10% 11.2 19.8 4.2 23.7
O&M Costs +10% 13.4 21.6 -3.1 -32.3
O&M Costs -10% 25.4 30.7 -3.1 -32.3
12.6.5 Veyangoda + Ratmalana ICD
Table 12.23 Veyangoda + Ratmalana ICD FIRR Sensitivities
Item Change NPV FIRR (%) Sensitivity
Indicator
Switching
Value (%)
Base case 55.4 21
Construction & M&E +10% 47.2 18.5 -1.5 -67.6
Construction & M&E -10% 63.7 24 -1.5 -66.7
Revenue +10% 77.6 25 4.0 25.0
Revenue -10% 33.2 16.8 4.0 25.0
O&M Costs +10% 44.4 18.9 -2.0 -50.4
O&M Costs -10% 66.4 23 -2.0 -50.4
12.6.6 Enderamulla + Ratmalana ICD
Table 12.24 Enderamulla+ Ratmalana ICD FIRR Sensitivities
Item Change NPV FIRR (%) Sensitivity
Indicator
Switching
Value (%)
Base case (Option 3) 92.3 19.4
Construction & M&E +10% 76.6 17.1 -1.7 -58.8
Construction & M&E -10% 107.9 22.2 -1.7 -59.2
Revenue +10% 130 23 4.1 24.5
Revenue -10% 54.5 15.7 4.1 24.4
O&M Costs +10% 76.7 17.9 -1.7 -59.2
O&M Costs -10% 107.8 20.8 -1.7 -59.5

TA 7600 SRI – Multimodal Transport Project Sri Lanka
Final Report 233
12.6.7 Peliyagoda/Telangapata + Ratmalana ICD
Table 12.25 Peliyagoda/Telangapata + Ratmalana ICD FIRR Sensitivities
Item Change NPV FIRR (%) Sensitivity
Indicator
Switching
Value (%)
Base case (Option 5) 115.2 26.4
Construction & M&E +10% 102.9 23.2 -1.1 -93.7
Construction & M&E -10% 127.5 30.5 -1.1 -93.7
Revenue +10% 152 31.7 3.2 31.3
Revenue -10% 78.4 21.3 3.2 31.3
O&M Costs +10% 99.6 24.3 -1.4 -73.8
O&M Costs -10% 130.8 28.6 -1.4 -73.8
12.7 Summary of Sensitivity Testing on PPP Options
Based on the risk sensitivity analysis above, the major findings are as below:
• Revenue has a greater impact on FIRR; 20% reduction of annual total revenue will
reduce FIRR by 8-13% apart from Ratmalana;
• A container volume guarantee policy will be required to attract private investors,
and private investors will be able to take the tariff risk;
• Ratmalana ICD is highly sensitive to variations in costs and revenue due to its
relatively small size and capacity. The ICD project would not attract potential private
investors without a large percentage of government funding on the total project
costs from PPP Option 2. Therefore Ratmalana ICD is highly likely to be developed
together with other ICDs, with a better return to equity than that from Ratmalana
ICD alone;
• The sensitivity to O&M costs is lower than that to investment costs (Construction
and M&E costs), and the private investor would be able to carry and manage the
risk;
• Construction costs and M&E procurement costs have a greater impact than that of
the O&M costs, and the Government should finance the land acquisition and
resettlement costs, as the minimum, for each ICD project; and
• For the ICD projects with lower returns, the Government should invest further on
civil engineering costs or rolling stock or M&E equipment as these have been
identified as higher risk components, because the government is the party which can
control these cost components better.

TA 7600 SRI – Multimodal Transport Project Sri Lanka
Final Report 234
Table 12.26 FIRR sensitivity Summary
Cost
Sensitivity
case
ICD Project
1 2 3 4 5 6 7
Recommended
PPP Option 5 1 1 2 5 1 1
Base Case 25.6 20.3 21.2 26.2 21 19.4 26.4
Base revenue x
80% 17.3 12.9 13.5 12.7 12.4 11.8 16.2
Base O&M
cost x 120% 21.8 17.6 18.3 16.7 16.8 16.4 22.2
Base
investment
cost x 120%
20.4 15.9 16.7 19 16.4 15.2 26.4
Base O&M
cost x 80% 29.5 22.9 24.1 35 25 22.3 30.7
Base
investment
cost x 80%
33.7 27 28.2 38.5 27.9 25.6 35.8
Base revenue x
120% 33.6 27.4 28.7 38.4 29.1 26.5 37
12.8 Recommended Procurement Options and Implementation Plan
From the financial analysis and risk sensitivity analysis on PPP options, the results of FIRR
and NPV show that overall project costs are relatively high in terms of revenue level at each
ICD. The analyses indicate that public financing will lead to the Government to carry higher
financial burden and majority risks, which appear unsustainable.
In financial viability terms, the ICD project will be able to attract private investors under an
implementable PPP equity structure, subject to a certain level of the support from
government grants, a container volume guarantee from the SLPA, with the return to equity
to meet private investors’ expectations, of 20% as the minimum.
A cash flow deficit will appear in 2020 and some cases in 2021 as well when the expansion
plan is introduced and a short term loan could be a solution to resolve the short term cash
flow problem. Refinancing could be a solution, or increasing the government fund in 2020.
In reality, the expansion investment in 2020 could last over a number of years and the cash
flow deficit could be reduced significantly in most cases, and it only requires a very small
amount of short term loans under an optimized investment plan.
Generic Recommendations are presented below, followed by site-specific
recommendations.
12.8.1 Generic Recommendations
Each single site ICD will require a 3 track railhead within the Colombo Port, while each two-
site ICD project will require a 4 track railhead within the Colombo Port. Each project, except
TA 7600 SRI – Multimodal Transport Project Sri Lanka
Final Report 235
Ratmalana as a single site project will require a new rail link at Sedawatta. The following
points are common to all projects:
• Potential private investors could be the existing port investors, or port operators or
logistics companies having port related business in Sri Lanka;
• A container volume guarantee policy may be required for attracting private
investors;
• Recommended procurement forms are DBFO or BOOT;
• Construction to be procured under an engineering procurement contract;
• If the Special Purpose Vehicle (SPV) is outsourcing O&M services, the contract should
be in a 3-5 years renewable base;
• Expected starting O&M year: 2015.
12.8.2 Veyangoda ICD
Recommendations:
• Procurement PPP option: Option 5 is recommended for the procurement for
Veyangoda ICD:
• Government would invest in land acquisition, resettlement, and 50% of civil
engineering costs in 2014 and 2020;
• Private investors would invest in rolling stock, M&E equipment and 50% of civil
engineering costs;
• Public and private equity ratio: 40/60 from PPP Option 5 analysis; Recommended
ratio: 40/60;
• Project return to equity: 25.6% in the base case; and
• A short term loan will be required when expansion is carried out in 2020.
12.8.3 Enderamulla ICD
Recommendations:
• PPP Option 1 is recommended for the procurement for Enderamulla ICD:
• Government would invest in land acquisition and resettlement;
• The private investors would investment in rolling stock, M&E equipment and civil
engineering;
• Public and private equity ratio: 4/96 from PPP Option 1 analysis; Recommended
ratio: 5/95;
• Project return to equity: 20.3% in the base case; and
• A short term loan will be required when expansion is carried out in 2020.
12.8.4 Peliyagoda/Telangapata ICD
Recommendations:
• Procurement PPP option: Option 3 is recommended for the procurement for
Peliyagoda/Telangapata ICD;
• Government would investment in land acquisition, resettlement and rolling stock;
• Private investors would invest in M&E equipment and civil engineering costs;

TA 7600 SRI – Multimodal Transport Project Sri Lanka
Final Report 236
• Public and private equity ratio: 18/82 from PPP Option 1 analysis; Recommended
ratio: 20/80;
• Project return to equity: 21.2% in the base case; and
• A short term loan will be required when expansion is carried out in 2020.
12.8.5 Ratmalana ICD
Recommendations:
• Procurement PPP option: Option 2 is the best option under PPP but it could not
attract private investment on this project;
• Government would investment in land acquisition, resettlement and full civil
engineering costs;
• Private investors would invest in rolling stock and M&E equipment costs;
• Public and private equity ratio: 63/37 from PPP Option 1 analysis; Recommended
ratio: 65/35;
• Project return to equity: 26.2% in the base case; and
• A short term loan will be required when expansion is carried out in 2020.
12.8.6 Veyangoda + Ratmalana ICDs
Recommendations:
• Procurement PPP option: Option 5 is recommended for the procurement for
Veyangoda and Ratmalana ICDs;
• Government would invest in land acquisition, resettlement, and 50% of civil
engineering costs in 2014 and 2020;
• Private investors would invest in rolling stock, M&E equipment and 50% of civil
engineering costs;
• Public and private equity ratio: 42/58 from PPP Option 5; Recommended ratio:
45/55;
• Project return to equity: 21% in the base case; and
• A short term loan will be required when expansion is carried out in 2020.
12.8.7 Enderamulla + Ratmalana ICDs
Recommendations:
• Procurement PPP option: Option 3 is recommended for the procurement for
Enderamulla and Ratmalana ICDs;
• Government would invest in land acquisition, resettlement and rolling stock;
• Private investors would invest in M&E equipment and civil engineering costs;
• Public and private equity ratio: 12/88 from PPP Option 1 analysis; Recommended
ratio: 15/85;
• Project return to equity: 19.4% in base case; and
• A short term loan will be required when expansion is carried out in 2020.

TA 7600 SRI – Multimodal Transport Project Sri Lanka
Final Report 237
12.8.8 Peliyagoda/Telangapata + Ratmalana ICDs
Recommendations:
• Procurement PPP option: Option 5 is recommended for the procurement for
Peliyagoda/Telangapata and Ratmalana ICDs;
• Government would invest in land acquisition, resettlement and 50% of civil
engineering costs;
• Private investors would invest in rolling stock, M&E equipment and 50% civil
engineering costs;
• Public and private equity ratio: 44/56 from PPP Option 1; Recommended ratio:
45/55;
• Project return to equity: 26.4% in the base case; and
• A short term loan will be required when expansion is carried out in 2020.
12.9 Summary and Recommendations
12.9.1 Public Financing Option
Although the public finance gets cheaper loans than private sector, the disadvantages are
that the Government will be responsible for both initial investment costs and O&M and
further investment costs, and majority risks for the entire project life. No matter which case
is chosen for development with public finance, the entire project costs and risk are
significant and not sustainable to the Government.
With such low IRRs of the ICD cases under public financing, it becomes necessary to
introduce Public and Private Partnership to attract private investment to reduce the
financial burden to the Government and risks carried by the Government.
12.9.2 Project Financial Viability under PPP
Five PPP options have been proposed to evaluate the financial viability of each ICD. These
PPP options are based on different levels of government investment on each ICD project.
Due to the complexity of land acquisition, resettlement, and railway asset and railway
operations, the project is not financially viable under a full private finance scheme. PPP or a
full public funding option is considered to be a more practical approach.
Under a PPP procurement approach, it is anticipated that the operations would commence
in 2015, followed by a major upgrade and expansion in 2020.
Based on the financial analysis as discussed in this chapter, it is indicated that most of these
ICD Projects are financially viable under a PPP procurement strategy, However, the
Ratmalana ICD project, with an IRR of 4.4%, is less attractive with its limited capacity for
containers handling and storage.
Due to the complexity of the ICD asset structure, involving port and railway investment and
operations, the forms of procurement that can be adopted would include DBFO or BOOT.

TA 7600 SRI – Multimodal Transport Project Sri Lanka
Final Report 238
12.9.3 Public and Private Partnerships
The parties representing public and private sectors are as below:
• Public sector bodies to participate: SLPA and Railway Corporation
• Potential private investors: Port investors / operators, logistics companies
/operators, financial institutions
Table 12.27 is the recommended equity ratio of each ICD and its combinations for public
and private investors. It is recommended that the Government should seek ADB funds or
other financial organization funds to finance the grants and subsequently the total project
costs to the Government should be significantly lower than the costs from pure public
financing.
These recommendations are preliminary and a detailed analysis is required in the
implementation stage with a more realistic equity structure accepted by both public and
private investors.
Table 12.27 Recommended ICD PPP Equity Structure
Case
No. ICD Project IRR
PPP
Option*
Recommended
Public/private
equity ratio
FIRR
1 Veyangoda 11.0% 5 40/60 >20%
2 Enderamulla 19.0% 1 5/95 >20%
3 Peliyagoda/Telangapata
(PelTel) 12.9% 3 20/80 >20%
4 Ratmalana 1.5% 2 65/35 >20%
5 Veyangoda + Ratmalana 8.9% 5 45/55 >20%
6 Enderamulla + Ratmalana 15.3% 3 15/85 >20%
7 PelTel + Ratmalana 11.1% 5 45/55 >20%
Note: The PPP options are defined in Section 12.4 above.
12.9.4 Government Grants
Each ICD project would require a government grant or government funding (with zero
return on the public sector funding), varying from 5% to 65% of the total investment in the
startup period and in the expansion/upgrading period in 2020.
If Ratmalana ICD is developed separately, i.e., without combining with another ICD, this ICD
would require a government grant or government funding (with zero return) of over 65% of
the total investment at the start up period and the expansion periods in 2020.To this extent,
it is considered that Ratmalana ICD should not be developed as a separate project, but be
bundled with another ICD in order to reduce the overall cost and gain critical mass.

TA 7600 SRI – Multimodal Transport Project Sri Lanka
Final Report 239
12.9.5 Government Policy Support and Risk Sharing on Volume of
Container Transhipment
Revenue risk has been identified as the biggest risk for the ICD projects.
In view of the increasing economic importance of international trade to the economy of Sri
Lanka, coupled with GOS's current policy thrust on promotion of PPPs, it is recommended
that the government offer to share the risk on ICD container throughputs with private
investors, through profit sharing schemes, as the government provides grants to cover the
funding gaps.
12.9.6 ICD Implementation Plan
Based on the financial evaluation and projection, Table 12.27 shows the Consultant's
recommendation of ICD development under the PPP approach. It is recommended that the
ICD implementation should follow the following sequence:
Highly Recommended option:
Development of Enderamulla ICD (USD 120m) or combining Enderamulla ICD with
Ratmalana ICD (USD 158 m) is highly recommended as there are no land acquisition costs at
Enderamulla ICD site and low resettlement costs in comparison with those from other ICDs.
The required government investment on this project is the lowest compared to other
options.
Secondary Recommended option:
Development of Veyangoda ICD (USD 77m) or combining Veyangoda ICD with Ratmalana
ICD (USD 115 m) is a secondary recommended option as there are no land acquisition costs
at Veyangoda ICD site, and moderate resettlement costs in comparison with those at
Peliyagoda/Telangapata ICD. There is a requirement for the government to invest 50% of
civil engineering costs, and the government's investment will be higher than that at
Enderamulla ICD.
Least Recommended option:
Development of Peliyagoda/Telangapata ICD (USD 114m) or combining
Peliyagoda/Telangapata ICD with Ratmalana ICD (USD 153m) would only be recommended
if the above two options are not adopted. The land acquisition costs was assumed
significantly high originally at the Peliyagoda/Telangapata ICD site but was removed from
this analysis, and the resettlement costs are also high. The high resettlement costs would be
required to be paid by the government in order to make this option viable. Hence, the
government's investment will be the highest among the other ICD projects.

TA 7600 SRI – Multimodal Transport Project Sri Lanka
Final Report 240
Table 12.28 ICD PPP Implementation
Case No. ICD Project PPP
Option
Recommended
Public/private
equity ratio
Recommendation
Score
1 Veyangoda 5 40/60 High
2 Enderamulla 1 5/95 Very High
3 Peliyagoda/Telangapata
(PelTel) 3 20/80 Medium
4 Ratmalana 2 65/35 Very Low
5 Veyangoda + Ratmalana 5 45/55 High
6 Enderamulla + Ratmalana 3 15/85 Very High
7 PelTel + Ratmalana 5 45/55 Medium

TA 7600 SRI – Multimodal Transport Project Sri Lanka
Final Report 241
13 Summary of environmental, resettlement & social reports The following documents have been produced as part of this Draft Final Report in separately
bound volumes:
• Initial Environmental Examination;
• Initial Environmental Examination + Annexes;
• Resettlement Plans;
• Involuntary Resettlement screening; and
• Poverty and Social Assessment Report.
Summaries are presented here, including summaries of the Resettlement Plans.
13.1 Initial Environmental Examination (IEE)
The Initial Environmental Examination (IEE) was undertaken during the feasibility stage of
the project to investigate ecological, geological, hydrological and social implications
associated with the proposed four sites at Veyangoda, Enderamulla, Peliyagoda /
Telangapata and Ratmalana, in order to suggest the most feasible two sites with the least
environmental impacts.
Biogeographically, all proposed sites (Ratmalana, Peliyagoda/Telangapata, Enderamulla and
Veyangoda) lie within the Lowland Intermediate Zone. Floristically, it is under the Northern
Wet Lowlands Floristic Zone and Tropical Wet Evergreen Forests are typical natural
vegetation formations in the Northern Wet Lowlands Floristic Zone. Most of the lands in and
around the proposed sites are now under human influence and hence cleared for human
settlements, agriculture and developments. Therefore, no natural or typical vegetation
formations (Tropical Wet Evergreen Forests) can be seen in and around the proposed sites.
However, the Enderamulla site is predominantly marshland and part of the
Peliyagoda/Telangapata site is also marshland. There are interconnected canals or streams
in those sites. The Ratmalana and Veyangoda sites are predominately terrestrial lands and
there are a few small marshes, water holes and interconnected streams in the Veyangoda
site. None of them fall in or are in close proximity to reserved areas under Department of
Wild Life Conservation or Forest Department.
The proposed sites are spread among different types of land topography consisting of flood
plains, wetlands and low flat terrains. The climate is more or less similar in all the identified
locations as bio-geographically the sites are within the intermediate zone. Enderamulla and
Peliyagoda/Telangapata are located in flood prone areas where hydrological impacts are
moderate to high as per IEE findings. There are no such issues with respect to the Ratmalana
and Veyangoda sites. However, a detailed hydrological study is recommended if either
Enderamulla or Peliyagoda/Telangapata is selected for the proposed project, in order to
identify the drainage capacity and possible water retention areas.
The geological study was carried out for all four sites to have an understanding about the
general geological and soil distribution of the proposed areas. Veyangoda was
recommended by the geologist as the site is good for erecting permanent structures.
However, before finalizing foundation type and design of permanent structures, it is

TA 7600 SRI – Multimodal Transport Project Sri Lanka
Final Report 242
recommended to conduct a proper bore hole study within the land to further check the
ground situation.
The proposed sites are spread among different types of land topography consisting of flood
plains, wetlands and low flat terrains. The climate is more or less similar in all five identified
locations as bio-geographically the sites are within the intermediate zone. Enderamulla,
Peliyagoda and Telangapata are located in flood prone areas where hydrological impacts are
moderate to high. There are no such issues with respect to Ratmalana and Veyangoda sites.
A detailed hydrological study is recommended if Enderamulla, Peliyagoda and Telangapata
sites are identified for the proposed project in order to identify the drainage capacity and
possible water retention areas.
From a socio-economic point of view, Ratmalana and Veyangoda have different levels of
impact. Veyangoda is located in state land under the Food Department and the Economic
Development Ministry. The present land use in Veyangoda is commercial while in Ratmalana
it is more residential with some public buildings such as a school, religious places etc.
Therefore the resettlement issues will be great at Ratmalana.
The overall (negative) environmental impact scores are:
• Enderamulla 7%
• Ratmalana 51%
• Peliyagoda/Telangapata 50%
• Veyangoda 32%
The basis of these percentages was marks out of 200 awarded for assessments of various
impacts under the following headings:
• Physical Environmental Sensitivity Index (70 marks);
• Biological Environmental Sensitivity Index (55 marks); and
• Socio-economic Environmental Sensitivity (75 marks).
The IEE has addressed all the possible impacts that can be anticipated in both constructional
and operational phases referring to similar project activities. Since the IEE has been carried
out during the feasibility stage, preparation of a complete Environmental Management and
Monitoring Plan is not possible. However, considering the impacts for all sites, a general
Environmental Management Plan (EMP) is given in the IEE report. Contractors will be
required to minimize negative environmental impacts during construction. Construction
costs include 10% contingency, from which mitigation measures may be financed.
13.2 Resettlement plans of ICD sites
At the Interim Report stage, ten candidate sites located surrounding the Colombo city port
for the establishment of the ICDs, were evaluated by multi-criteria analysis, which included
key criteria such as demand, availability of lands, quality of onward access to road and rail
network and external costs for land acquisition like loss of assets etc. The conclusions of the
assessment were that the following sites should be taken forward to full feasibility:

TA 7600 SRI – Multimodal Transport Project Sri Lanka
Final Report 243
a. Veyangoda – a large site to the north of Colombo on the main railway line to
Jafna, Trincomalee and other eastern and northern locations in Sri Lanka.
b. Enderamulla – a large site north of Enderamulla station, which is south of
Ragama station, on the western side of the railway.
c. Peliyagoda/Telangapata – adjacent to the railway just north of Kelaniya station,
and occupying both sides of the expressway.
d. Ratmalana – this is located near Ratmalana railway station and the SLR
workshop. Ratmalana is the only known suitable site for freight traveling south.
These four sites had to be assessed for resettlement of people and businesses and any
associated costs. There were also resettlement issues at the railway link to be reinstated at
Sedawatta. This link is essential to reduce travel time and inefficiencies when moving
containers between the New Port and any of the three northern sites.
Most of the above sites are on government owned land, with minimum resettlement
impacts like acquisition of privately owned lands, resulting loss of lands, structures and
livelihoods for affected people. Five resettlement surveys were conducted in October 2011
by the Resettlement Expert and her staff. In order to assess possible resettlement impacts
and plan appropriate measures, five Resettlement Plans (RP) were prepared in line with
government’s land acquisition act (1950) and its amendments, NIRP guidelines in 2001 and
safeguard guidelines contained in ADB safeguard policy statement in 2009. A brief summary
of each RP is presented below.
13.2.1 Procedures common to all RPs
Legal framework
The legal framework within which these resettlement plans have been prepared is described
in each RP document. This describes national law relating to involuntary resettlement as
prescribed by the government Land Acquisition Act No. 9 of 1950 and the National
Involuntary Resettlement Policy (2001). The requirements of NIRP were compared with
those of ADB policy as established by the Policy on Involuntary Resettlement (1995) and
revised by the Safeguards Policy Statement (2009).
Families who are living in temporary structures on encroached land are not eligible for
compensation under the Land Acquisition Act (LAA) of Sri Lanka. However, providing
housing and basic amenities on new sites and restoring their livelihoods is needed to comply
with ADB and NIRP policy. The owners of commercial structures which are to be re-located
must be compensated to comply with the LA Act, and ADB and NIRP policies.
Resettlement plans
The Resettlement Plan (RP) provides an estimate of, and proposed means for,
compensation/new housing units for lost assets and resettlement of Affected Persons (APs).

TA 7600 SRI – Multimodal Transport Project Sri Lanka
Final Report 244
These are based on the set of eligibilities and entitlements of APs for various categories of
losses incurred by them due to the project. These are spelt out specifically in the project
entitlement matrix (EM). The RP identifies (i) the extent of losses; (ii) policy and legal
framework for compensation and resettlement; (iii) institutional framework for participation
and implementation; (iv) measures for income restoration and poverty reduction; and (v)
responsibilities for monitoring the implementation measures.
Entitlement matrix
An entitlement matrix sets out actions to be taken by the Executing Agency to compensate
affected persons for any loss of assets, income and livelihoods they may experience as a
result of the project. It covers a wide range of circumstances for anticipated resettlement
impacts that are expected, so that appropriate compensation in the form of built structures
or assistance may be provided. The entitlements and options for each impact category are
provided in the entitlement matrix. Mitigation and impact minimisation measures may be
included. The matrix also specifies additional assistance to be provided to vulnerable
groups who were found to be affected by the project. The entitlement matrix enables a
resettlement budget and financing plan for RP implementation to be calculated.
Executing Agency
The Executing Agency (EA) for overall responsibility of the ICD project is the Ministry of
Transport (MoT) in Sri Lanka. A project office established under the supervision and
guidance of MoT would implement the project under a separate Director who would be
responsible for all land transfer activities and resettlement related activities such as
disbursing compensation to APs, providing assistance, looking into grievance redress,
briefing and cooperating with the External Monitoring and Evaluation Consultant (EMEC),
etc. The project management unit (PMU) would also hire a full time resettlement officer
with adequate assistance to help him to implement the RP in the project area.
The MoT would post the approved RP on its website and endorse the posting of the same
on the ADB's resettlement website. MoT would also ensure that summaries of RPs are
translated into local languages and distributed among the affected people and local
stakeholders at the earliest opportunity. A copy of the final RP would be made available at
the local DS Office and the Project Office of the site for display and ready reference for
consultation to the APs / communities affected by the project.
Monitoring
The resettlement plan would be monitored both internally by the PMU and externally by an
independent consultant, with the objective of providing feedback to management on
implementation and identifying problems and successes as early as possible, to facilitate
timely adjustment of implementation arrangements. A project office established under the
supervision and guidance of MoT would implement the project. As the PMU would be the
agency to manage implementation of the RP, its implementation capacity would be
strengthened, including necessary staff and financial assistance under the project. The PMU

TA 7600 SRI – Multimodal Transport Project Sri Lanka
Final Report 245
under the guidance of MoT would prepare quarterly resettlement implementation progress
reports which would be submitted to the EA and to ADB.
Implementation schedules
Resettlement plan implementation (excluding monitoring, which will be undertaken
throughout the project period), is expected to be completed within 18 months. This would
start during the pre-construction period to comply with ADB policy that compensation/ new
housing units for employees and encroaching households for resettlement impacts must be
provided before the impact occurs. An implementation schedule specific to this project
includes the activities within three subproject stages: i) sub-project initiation stage, ii)
resettlement plan preparation stage iii) resettlement plan implementation stage.
(Note: At Ratmalana, resettlement plan implementation might take 36 months, delaying the
opening of the site.)
Grievance redress mechanism
A Grievance Redress Mechanism (GRM) would be made accessible to affected persons. The
GRM would be capable of responding to a wide scope of issue related grievances,
construction related grievances, and alternative house related grievances. The resettlement
officer (RO) and focal point in the PMU would record any grievances and the contact
information of affected persons. Any grievances not able to be addressed by the PMU would
be relayed to the RO. Grievances not redressed by the RO would be brought to the
Resettlement Committee (RC). If an affected person was dissatisfied with the outcome of
the process they may refer their case to the appropriate court of law. All affected
communities would be made aware of the GRM.
13.2.2 Veyangoda RP
This site is located close to Veyangoda Railway station, which is North East of Colombo in
the Gampaha district of Sri Lanka. Ownership of the site is with Government under the Food
Department (FD). An area of 21.5 hectares is required to establish the proposed ICD project.
Field observations made at the site (October 2011) identified buildings and activities that
need to be relocated elsewhere to clear the site. They included several FD buildings which
were under-utilized, a Weekly Fair with 33 renting traders and an Economic Center with 70
renting shop traders, two government institutions – vocational training center and cultural
center – and temporary buildings belonging to the Sri Lanka Army. For the relocation of
these activities, it was planned under this project to find the land from 12 acres of land
owned by the government and Veyangoda textile mill and to purchase the required balance
of about 4 acres from privately owned vacant land in the vicinity of the project. It was
planned with a view to minimizing negative resettlement impacts. Acquisition of privately
owned land, and negative impacts like loss of land, housing and livelihoods for the affected
parties, were to be avoided.
In order to assess the negative resettlement impacts for the 33 renting traders in the
Weekly Fair and 70 renting shop owners in the Economic Center, a short resettlement plan
(SRP) was prepared in line with the Land acquisition act (1950) and its amendments, NIRP

TA 7600 SRI – Multimodal Transport Project Sri Lanka
Final Report 246
policies of 2001 and the ADB Involuntary resettlement policy statement of 2009. A
resettlement framework and an entitlement matrix were prepared. In the SRP, appropriate
mitigation measures for identified negative impacts for affected traders, an estimated
budget for purchasing additional land and reconstruction of buildings, shops and required
infrastructure, information disclosure, monitoring, and required staff were included in
adhering to the above national laws and ADB safeguard policy.
13.2.3 Enderamulla RP
Enderamulla is one of the candidate sites which were identified for the feasibility study. It is
situated In Wattala DS Division in Gampaha District. The land is owned by Sri Lanka Railways
and the government, and would be released for the project. 90% of the site consists of
marshy land. Land acquisition is necessary to accommodate the new access road to the site.
This land belongs to a private party. When developing the land for provision of an ICD site,
33 housing units of 35 families and some commercial units would be affected. Compared
with other proposed sites, this site would cause less resettlement and relocation activities.
The requirement of completing information disclosure, consultation and participation was
carried out successfully. Stakeholder meetings were held. Individual meetings were also
held with some key officials in affected commercial properties and representatives of
communities.
According to the data found through the resettlement survey, there are 35 low-income
families living in 33 temporary housing structures which were constructed in encroached
government land, with minimum basic facilities. The survey also found that 100% of the
families are willing to relocate to a better place with housing and infrastructure facilities.
Since it was found that the majority of families are involved in temporary employments, the
relocation site should be close to the present location. The requirement of provision of
proper houses, basic amenities, and a strong livelihood restoration assistance program
including special attention to vulnerable families, is highlighted by the survey results and the
outcome of the consultation process. The need of a comprehensive RP to ensure fulfillment
of the above requirements would be compiled for Enderamulla.
Thirty three (33) temporary housing units would be re-located in a land within two km,
complying with the ADB and NIRP social safeguard policies on housing, infrastructure with
basic amenities, and livelihood restoration. Vulnerable families would be identified for
special attention and special assistance would be provided. Assistance available from
government at DS office level would also be linked with these 35 families. The entitlement
matrix is specially designed to ensure identification of AP’s requirements and provide
assistance as appropriate.
13.2.4 Peliyagoda/Telangapata RP
Resettlement and relocation requirements for this site have been considered through the
Resettlement Plan that was based on the proposed resettlement and re-location activities of
the stage 1 & 2 areas of the Peliyagoda/Telangapata site. Stage 1 lasts until 2020, in which
year extra land would be bought to facilitate long trains (stage 2). Resettlement activities
would be:

TA 7600 SRI – Multimodal Transport Project Sri Lanka
Final Report 247
Stage 1
• Telangapata side: relocating 30 houses along the canal located behind warehouses;
• Telangapata side: relocating 24 houses that are close to the railway main line and on
the line of the rail spur into the site;
• Peliyagoda side: relocating 28 houses that are close to the CKE; and
• Telangapata side: compensation for 5 commercial properties which would be
removed.
Stage 2
• Telangapata side: relocating 84 houses which are in the land strip of the proposed
railway track;
• Telangapata side: compensation for 3 commercial properties which would be
removed; and
• Peliyagoda side: compensation for 3 commercial properties which would be
removed.
Stakeholder consultation was given priority and data collection was carried out for this
project by the Resettlement Expert and her team to prepare different reports at different
stages of the project. Key steps were followed in the resettlement survey, such as
consultation with the Divisional Secretary of Mahara to make him aware of the project and
to obtain his support to work with the respective Grama Niladharies relevant to the area.
Informal meetings with the relevant Grama Niladaries in the area were held by the
Resettlement Expert to obtain their comments and views on relocation. Their views are
incorporated in the RP. A resettlement survey of 100% of affected persons was also
completed in October 2011.
Socio-economic data shows that all the housing structures are temporary and unauthorized.
The availability of common amenities is very poor. Although the majority of them use water
and toilets, they are not fulfilling the required hygienic conditions. Most working family
members are labourers and income levels are below Rs. 15000. Housing structures are also
not suitable for living. The floor area of the majority of them is below 300 sq.ft. There are no
expansion possibilities of settlements with better housing and infrastructure in this area.
Relocation of 166 encroaching houses and 11 commercial enterprises is unavoidable in
getting adequate land released for the ICD project at Peliyagoda/Telangapata. Provision of
new housing units within a reasonable distance of the present location has been planned.
Land developed by SLLRDC in Mudun Ela, 3km far from the original locations would provide
new houses and common amenities for families to be resettled. Rs. 10,600,000 would be
spent to construct a 500 sq. ft house and to provide other infrastructure for each house
owner in the relocated site. Paying compensation for commercial structures through
government valuation would be carried out.
13.2.5 Ratmalana RP
The Ratmalana site is situated In Dehiwala DS Division in Colombo District. It has a total land
area of around 21.1 hectares, owned by Sri Lanka Railways (SLR). Occupied structures
include 280 SLR quarters, 71 encroaching houses, 15 SLR buildings/structures, one

TA 7600 SRI – Multimodal Transport Project Sri Lanka
Final Report 248
government school, two Buddhist temples and one unauthorized business center. If it is
decided to establish an ICD site here, rearrangement and resettlement of existing structures
would be necessary to release 15 hectares for establishment of the ICD and 10 hectares
outside the site would have to be used for reconstruction of existing structures on a land
sharing basis under the project cost. The RP is prepared for assessment of resettlement
impacts due to implementation of the rearrangement plan at Ratmalana site and specifies
the measures required to mitigate or minimize negative resettlement impacts, according to
the national law and ADB safeguard policy statement of 2009.
Avoiding involuntary resettlement impacts (including minimizing the acquisition of privately
owned land and relocation of households and businesses) was a key feature of preliminary
site selection of the project, consistent with national law and ADB safeguard policy. Most
such impacts were successfully avoided by selecting government land owned by the Sri
Lanka Railway (SLR) which comes under the ministry of Transport (MoT), the Executing
Agency that implements the ICD project. Since the entire project area is owned by SLR and
the government, relocation and resettlement of all identified activities and structures will
not need any land acquisition.
Expected resettlement impacts due to the relocation of 280 quarters are not significant, as it
is planned to provide alternative quarters stage by stage and residents will not be affected
as their quarters will be demolished after provision of new quarters. Dwellers living in 71
encroached houses would have to be provided with new houses with tenure rights. They
would not be affected by adverse resettlement impacts as their houses would be
demolished after handing over the new serviced housing units with improved infrastructure
(pipe borne water and sewerage facilities). The only shop which collects discarded items
would be allocated a space suitable for its business under a lease agreement with SLR. One
of two religious temples would have to be relocated outside the project site by allocating
suitable land. SLR has agreed to provide the alternative land located outside this site. The
other temple land is situated in the identified resettlement area and could be incorporated
within a proposed redevelopment plan. The school could be relocated on public ground and
released land. After construction of the required buildings and facilities, the school could
continue in a new location in the vicinity. Studies in the school would not be disrupted due
to the change of location.
Selection of SLR land for the ICD project has resulted in minimizing loss of incomes for
affected parties as the options to provide alternative houses in released spaces would take
place at replacement cost in the vicinity of the original occupied location. Since the
employee residents in SLR quarters would receive new quarters in the vicinity, there would
not be negative resettlement impacts like loss of land, house or incomes.
Public consultations were held at several meetings and discussions with affected persons in
the Ratmalana project area while conducting a resettlement survey by the Resettlement
Expert in October 2011. This has informed the affected communities of the project,
regarding resettlement methodology, benefits envisaged and the time schedule. At special
meetings, primary stakeholders like SLPA, SLR and Education Department officials with AP
representatives were invited and their participation was helpful. The Ministry of Transport
(MoT) would post the approved RP on its website and endorse the posting of the same on

TA 7600 SRI – Multimodal Transport Project Sri Lanka
Final Report 249
ADB's resettlement website. MOT would also ensure that summaries of RPs are translated
into local languages and distributed among the affected people and local stakeholders at
the earliest opportunity. A copy of the final RP would be made available at the SLR Office at
Ratmalana for display and ready reference for consultation to the APs / communities
affected by the project.
The budget for resettlement covers the cost of: (i) construction of quarters, serviced
housing units, school buildings and SLR structures and assets; (ii) information disclosure,
consultation and participation; and (iii) management and monitoring of the resettlement
process. It also includes contingency items to provide special assistance to vulnerable
households who are identified by the detailed measurement surveys, and to cover the cost
of any unforeseen items.
13.2.6 Sedawatta RP
With the purpose of facilitating railway transport for container movements, a new rail link
has been planned to interconnect two rail lines, the harbour line to/from Colombo Port and
the northern railway system. A land strip of 767 m with an area of 13,848 sq.m has been
identified as a feasible site at Sedawatta to locate this proposed link. Formation of a new
embankment would first be necessary. The identified area is owned by SLR and occupied by
40 encroaching houses which would need to be relocated in close proximity in accordance
with a resettlement plan. The RP also suggests measures to mitigate or minimize negative
resettlement impacts.
Avoiding involuntary resettlement impacts (including minimizing the acquisition of privately
owned land and relocation of households and businesses) was a key feature of preliminary
site selection of the project, consistent with national law and ADB safeguard policy. Most
such impacts were successfully avoided by selecting government land owned by the Sri
Lanka Railway (SLR) which comes under the Ministry of Transport. Since the entire project
area comes under the ownership of the SLR, relocation and resettlement of all identified
activities and structures would not need any land acquisition.
Dwellers living in 40 encroaching houses would have to be provided with new houses with
tenure rights. They would not be affected with adverse resettlement impacts as their
houses would be demolished after handing over the serviced housing units with improved
infrastructure (piped water and sewerage facilities) in close proximity to the Sedawatta site.
At present they are living in unauthorized houses constructed on government owned land
under the SLR. The available infrastructure is also in poor condition. Since the relocation is
planned under two options, their livelihoods and other social needs like schooling and
cultural links would also not be significantly affected.
Public consultations were held at several meetings and discussions with affected persons at
the Sedawatta project area while conducting a resettlement survey by the Resettlement
Expert in October 2011. This informed the 40 APs of the project, resettlement methodology,
benefits envisaged and the time schedule. At special meetings, primary stakeholders like
SLPA, SGRD and Divisional Secretariat officials participated with AP representatives; these
were helpful. The Ministry of Transport (MoT) would post the approved RP on its website
and endorse the posting of the same on ADB's resettlement website. MoT would also

TA 7600 SRI – Multimodal Transport Project Sri Lanka
Final Report 250
ensure that summaries of RPs were translated into local languages and distributed among
the affected people and local stakeholders at the earliest opportunity.
The resettlement budget covers the purchase land close to the site and provision of
alternative serviced houses. This includes the cost of: (i) construction of serviced housing
units, (ii) information disclosure, consultation and participation, and (iii) management and
monitoring of the resettlement process. It also includes contingency items to provide special
assistance to vulnerable households who are identified by the detailed measurement
surveys, and to cover the cost of any unforeseen items.
13.2.7 Resettlement Budgets
The rates that would be used in preparation of the resettlement budget have been derived
from the following information sources:
• rates used in paying compensation to APs of the Outer Circular Highway;
• rates paid to APs of the adjoining projects of the RDA;
• interviews with stakeholders;
• discussions with valuation offices and property developers; and
• paper advertisements by prospective sellers etc.
Table 13.1 Summary of resettlement costs
Name of site Resettlement Cost (Rs)
Veyangoda 1,063,246,206
Enderamulla 188,419,000
Telangapata/Peliyagoda-stage1 2,509,413,500
Telangapata/Peliyagoda-stage2 7,479,752,500
Ratmalana 1,647,617,070
Sedawatta 158,493,500
13.3 Poverty and Social Assessment Report
In the course of this study, the Consultant has prepared a Poverty and Social Assessment
Report, including a Summary Poverty Reduction and Social Strategy in accordance with the
Bank’s format. This has been submitted as a separate volume, and is summarized in this
section.
The analysis of the poverty and social impacts is based on data collected from primary data,
collected by the Consultant, and available secondary data. The primary stakeholders are
considered to be the people residing in the vicinity of each of the four potential ICD sites.

TA 7600 SRI – Multimodal Transport Project Sri Lanka
Final Report 251
In Ratmalana ICD site, many families are residing within the identified project land and this
community will have negative impacts due to possible evacuation. The same situation is
observed in Peliyagoda/Telangapata site. In Enderamulla there is one residential area
established within the identified land. The land proposed in Veyangoda is presently used for
stores and various other business establishments by the government and private parties;
the owners of these establishments will have to shift their business activities to other
appropriate locations.
The majority of the population in all the ICD site areas are Sinhala but with minorities from
other groups, primarily Tamil and Muslim. With the exception of Veyangoda, the potential
ICD sites are located in urban areas. On all sites, the percentage of people employed in
agriculture is small. The primary income generation activities are government employment,
private sector employment and daily paid labour.
In 2002, when the last poverty level survey was conducted, the levels of poverty in the
districts in which the sites are located were much lower than the national headcount index
of 22.7%. In Gampaha district (Veyangoda and Enderamulla) the index was 11%, while in
Colombo district it was 6%. Data at Divisional Secretariat (DS) level was also available.
Each site is close to a number of schools, hospitals and religious centres. One school on the
Ratmalana site will have to be relocated. With that exception, project impacts, both
positive and negative, to such social infrastructure, are expected to be small.
It is expected that the ICDs, when implemented will generate opportunities for both direct
and indirect employment.
Re gender issues, some women in Ratmalana, Peliyagoda/Telangapata and Enderamulla are
vulnerable to social discriminations. Most of these vulnerable women live in shanty type
houses in project land and the vicinity.
Risks of human trafficking and child labour are discussed, and it is recognized that, especially
in the Peliyagoda and Enderamulla areas, a significant number of under-age children are in
employment.
While levels of HIV prevalence are low, it is recognized that there are significant risks,
especially in respect of shanty dwellers, for whom dangerous drug sales, prostitution and
alcoholism pose risks.
Stakeholder perceptions are generally positive, including enhanced employment
opportunities, reduced traffic congestion and improved water and electricity infrastructure.
There is concern about the possibility of flooding resulting from filling in wetlands in
Enderamulla and Peliyagoda/Telangapata.
The project is classified as GI (General Intervention) and therefore full poverty analysis is not
required. The Summary Poverty Reduction and Social Strategy has identified a need for a
Resettlement Strategy, addressed elsewhere in this report, but found no need for a Gender
Plan, Indigenous Peoples Plan, Labour Plan or HIV/AIDS Plan.

TA 7600 SRI – Multimodal Transport Project Sri Lanka
Final Report 252
14 Economic evaluation methodology
14.1 The “Without Project” Case Economic appraisal compares one or more “with project cases” with a “without project
case”, usually by calculating the incremental costs and benefits arising as a result of
implementing the project. To do this a “Without Project” case is needed.
“In the “Without Project” case, it is assumed that all stripping and stuffing of containers will
take place in the port, except in respect of that proportion of containers (LCL or FCL) which
is currently stripped or stuffed at shipper/consignee premises or at existing groupage
operator premises.
“Incremental costs and benefits”, are best understood by considering the possibility that, as
a result of constructing an ICD, investment on similar facilities inside the port was to be
scaled back. The “incremental cost” would then be the cost of the ICD investment less the
port investment saved. Similarly, if the creation of an ICD were to render some port assets
redundant, and those redundant assets were to have some value in some other use, the
incremental cost would be the cost of providing the ICD less the value expected to be
realised from the redundant facilities.
14.2 Opportunity Costs
Few resources are free. It has been suggested that government land at some possible sites
may be given to the project free of charge. This would certainly help with the project
finances but nevertheless, the land concerned would have a value in another use, best
described as its Opportunity Cost, and this is a recognised economic cost. “Opportunity
Cost” is defined as the cost of any activity measured in terms of the value of the best
alternative that is not chosen (that is foregone). In practice it is not necessary to know what
the alternative use would be: a fair valuation of the market price is a good indicator.
Also, it is proposed to use the existing fleet of M8 locomotives to haul container trains in the
early days of the project. These will not be purchased and so their capital costs are not
easily known. However, ignoring the fact that rail passenger services seem to be heavily
subsidised, those locomotives have an opportunity cost – if not taken into the service of the
proposed project, they would no doubt be in use hauling trains for the Sri Lankan railways.
In this respect, there is no market, and no easy way to estimate the opportunity cost, so the
Consultant has instead worked on the basis of replacement cost, adjusted to reflect asset
age, as discussed in Section 15.2.1.
14.3 Incremental Capital Costs
The team’s engineers have calculated the capital cost of developing each of the four
proposed sites. The capital cost used includes design, construction, equipment,
environmental amelioration, land acquisition and compensation and resettlement costs. It
also includes the necessary railway, investment including any track works required, and also
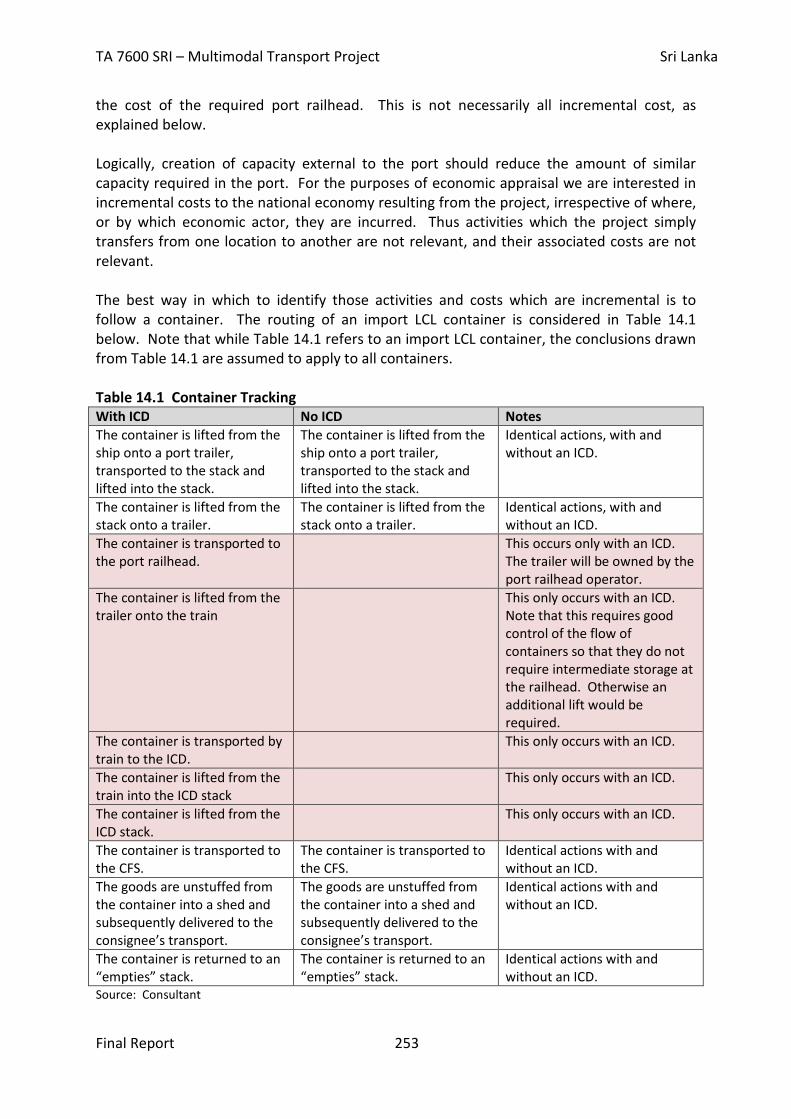
TA 7600 SRI – Multimodal Transport Project Sri Lanka
Final Report 253
the cost of the required port railhead. This is not necessarily all incremental cost, as
explained below.
Logically, creation of capacity external to the port should reduce the amount of similar
capacity required in the port. For the purposes of economic appraisal we are interested in
incremental costs to the national economy resulting from the project, irrespective of where,
or by which economic actor, they are incurred. Thus activities which the project simply
transfers from one location to another are not relevant, and their associated costs are not
relevant.
The best way in which to identify those activities and costs which are incremental is to
follow a container. The routing of an import LCL container is considered in Table 14.1
below. Note that while Table 14.1 refers to an import LCL container, the conclusions drawn
from Table 14.1 are assumed to apply to all containers.
Table 14.1 Container Tracking
With ICD No ICD Notes
The container is lifted from the
ship onto a port trailer,
transported to the stack and
lifted into the stack.
The container is lifted from the
ship onto a port trailer,
transported to the stack and
lifted into the stack.
Identical actions, with and
without an ICD.
The container is lifted from the
stack onto a trailer.
The container is lifted from the
stack onto a trailer.
Identical actions, with and
without an ICD.
The container is transported to
the port railhead.
This occurs only with an ICD.
The trailer will be owned by the
port railhead operator.
The container is lifted from the
trailer onto the train
This only occurs with an ICD.
Note that this requires good
control of the flow of
containers so that they do not
require intermediate storage at
the railhead. Otherwise an
additional lift would be
required.
The container is transported by
train to the ICD.
This only occurs with an ICD.
The container is lifted from the
train into the ICD stack
This only occurs with an ICD.
The container is lifted from the
ICD stack.
This only occurs with an ICD.
The container is transported to
the CFS.
The container is transported to
the CFS.
Identical actions with and
without an ICD.
The goods are unstuffed from
the container into a shed and
subsequently delivered to the
consignee’s transport.
The goods are unstuffed from
the container into a shed and
subsequently delivered to the
consignee’s transport.
Identical actions with and
without an ICD.
The container is returned to an
“empties” stack.
The container is returned to an
“empties” stack.
Identical actions with and
without an ICD.
Source: Consultant

TA 7600 SRI – Multimodal Transport Project Sri Lanka
Final Report 254
For convenience, the incremental tasks have been shaded. These provide a guide as to
which costs are incremental, but some practicalities also have to be considered.
Relevant Capital Costs
It is clear from the above that the capital costs of the port railhead plus any capital costs
incurred in respect of the rail link and some part of the ICD capital costs are incremental
costs and therefore relevant as incremental costs.
Considering the port railhead, the entire capital cost is relevant, including the cost of the
tractor trailer units used to transport containers to and from the railhead (In fact, it is
expected that the said tractor and trailer units will be purchased as part of the project).
As noted all capital expenditure related to the rail link, including rolling stock, additional
track works etc. is relevant.
The ICD is more complicated:
• Clearly the land acquisition for the entire site will not be offset by the port not
acquiring land of equivalent value, and so is relevant;
• Initial equipment costs are similarly not likely to be offset by the port not acquiring
equipment at the same date, and so are relevant (this is a conservative assumption
as the acquisition of new equipment may save the economy the cost of replacing
some old port equipment);
• After the initial phase, replacement costs of equipment used in the shaded activities
of Table 14.1 above, and additional equipment required to cater for expansion
beyond the initial phase will be relevant; but
• The costs of replacing CFS equipment, and equipment used for stacking empties and
of providing additional equipment to cater for expansion in these areas (activities
not in the shaded part of Table 14.1) is not relevant because such replacements and
additions will simply offset similar expenditures which would, in the absence of an
ICD, have been made in the port.
Recurrent Costs
Recurrent costs are simpler. All recurrent costs at the port railhead are relevant.
Railway recurrent costs are less simple as they should exclude any costs which would have
been incurred by the Sri Lankan railways in the absence of the project. Railway costs have
to be scrutinised with this objective in mind.
In respect of ICD recurrent costs, the same distinction between costs relating to the shaded
area of Table 14.1 and the unshaded area has to be observed.

TA 7600 SRI – Multimodal Transport Project Sri Lanka
Final Report 255
14.4 Shadow Pricing
14.4.1 Numeraire
The consultant considered whether to use the domestic price numeraire or the world price
numeraire, and chose the former as being easier for the reader to understand. As noted on
p200 of the Bank’s Guidelines for the Economic Appraisal of Projects: “As long as consistency
is maintained across all project effects, project decisions will not be affected by whether the
domestic price level or the world price level is used to express the numeraire.”
14.4.2 General
Shadow pricing will be applied to correct for significant market failures. This section
discusses taxation, Section 14.4.3 relates taxation to shadow pricing in general, Section
14.4.4 discusses the Shadow Exchange Rate Factor (SERF) and Section 14.4.5 discusses the
shadow pricing of labour.
Sri Lanka has the normal range of taxes, including income tax, corporate tax, import duties
and VAT, plus some less common taxes.
Table 14.2 shows government tax revenues, actual or estimated, from 2008 to 2011, with a
breakdown of revenue from taxes on international trade (Revenue Code 10.01). Similar
breakdowns of Revenue Codes 10.02, 10.03 and 10.04 are available, but not shown in the
table. It can be seen that:
• Total Tax Revenue has increased from Rs 585 bn. (billion) in 2008 to an estimated Rs
862 bn. in 2011; and
• Taxes on Domestic Goods and Services (Revenue Code 10.02) yield the largest
amount, followed by Taxes on International Trade (Revenue Code 10.01), which yield
about one third more than Taxes on Income and Profits (Revenue Code 10.04).
License Taxes and Other (Revenue Code 10.03) yield a very small amount.
Considering the Taxes on International Trade:
• Import Duties are fully documented in the National Imports Tariff Guide 2011;
• Export Duties are less relevant, except to calculating the Shadow Exchange rate (if
we apply one);
• Import and Export Licence fees are small, and are not differentiated between import
and export;
• The Ports and Airports development Levy (PAL) is a tax on imports, levied at 2% or
5%, and is fully documented in the National Imports Tariff Guide 2011;
• It is not clear why the cesses are levied separately from import and export duties,
They are simply additional import and export taxes. Import Cesses are documented
in the National Imports Tariff Guide 2011; and
• The only remaining source still existing is the Special Commodity Levy, which again is
documented in the National Imports Tariff Guide 2011.

TA 7600 SRI – Multimodal Transport Project Sri Lanka
Final Report 256
Table 14.2 Government Tax Revenues, 2008 -2011 (Rs’000)
2010 Revised 2011
Revenue Description 2008 2009 Budget Budget Budget
Code Actual Actual Estimate 2010 Estimate
Tax Revenue 585,770,457 619,182,257 733,464,000 720,040,500 862,142,600
10.01 Taxes on International Trade 136,958,276 164,447,689 188,526,000 158,242,500 212,051,000
10.01.01.00 Import Duties 63,994,292 79,809,561 85,507,000 66,304,000 93,003,000
10.01.02.00 Export Duties 39,524 79,935 110,000 21,500 30,000
10.01.03.00 Import & Export Licenses Fees 231,232 240,660 250,000 250,000 260,000
10.01.04.00 Ports & Airports Development Levy 31,016,970 36,286,024 42,012,000 49,000,000 63,000,000
10.01.05.00 Cess Levy 24,472,031 28,519,946 35,233,000 29,774,000 40,758,000
10.01.05.01 Import Cess Levy 22,800,414 26,938,572 33,285,000 27,926,000 33,808,000
10.01.05.02 Export Cess Levy 1,671,617 1,581,374 1,948,000 1,848,000 6,950,000
10.01.06.00 Motor Vehicle Concessionary Levy 2,076 591
10.01.07.00 Regional Infrastructure Development levy 2,598,939 546,058 525,000 2,500,000
10.01.08.00 Special Commodity Levy 14,603,213 18,964,916 24,889,000 10,393,000 15,000,000
10.01.99.00 Other
10.02 Taxes on Domestic Goods And Services 320,480,038 311,907,974 381,014,000 421,336,000 488,236,000
10.03 License Taxes & Other 1,790,959 3,268,546 3,580,000 5,422,000 6,972,600
10.04 Taxes on Income & Profits 126,541,183 139,558,049 160,344,000 135,040,000 154,883,000 Source: Government Estimates 2011, Code 4.2.1 Government Revenue - Tax Revenue

TA 7600 SRI – Multimodal Transport Project Sri Lanka
Final Report 257
In addition to the above, the National Imports Tariff Guide 2011 also documents Value
Added Tax (VAT), Nation Building Tax (NBT); and Excise. These are all included under
Revenue Code 10.02: Taxes on Domestic Goods and Services.
Value Added Tax is levied at 12%. The Nation Building Tax on importers, retailers etc. is
levied at 2% of turnover. Excises mostly apply to cigarettes, liquor etc, but do also apply to
motor vehicles and fuel. There are many other taxes in this group, but they are not of direct
relevance to this study.
As already noted, the amounts collected under 10.03: License Taxes & Other are small.
Revenue Code 10.04: Taxes on Income & Profits, includes: Corporate Taxes, Non-corporate
taxes, Withholding Taxes and the Economic Service Charge. While the purpose of the
Economic Service Charge is unclear, it seems unlikely that any of the above taxes are of
direct relevance, except in calculating the Weighted Average Cost of Capital (WACC).
Small companies and venture capital companies are taxed at 12% of taxable income, while
larger companies pay 28%. Income tax rates are progressive up to 24%.
In addition to charging PAYE (personal income tax paid by employees through their
employers), and remitting it to the taxation authorities, employers also have to pay.
14.4.3 Application to Imports
For the purposes of this study, the taxes likely to have the greatest impact on costs, and
therefore most needing to be corrected by shadow prices are those ad valorem taxes
affecting the costs of inputs. These are particularly numerous in respect of imports and, as
noted above, include:
• Customs Duty;
• Ports and Airports development Levy (PAL);
• Cess Levy;
• Excise Duty;
• Value Added Tax (VAT); and
• Nation Building Tax (NBT).
Some of the above are additive, and some are compounded. In addition the CIF value is
arbitrarily increased before some taxes are charged, increasing the tax take. Sri Lanka
Customs provides a tariff calculator in the form of a small spreadsheet, from which the
following expressions have been taken:
Customs Duty (c) = f x rc
Ports and Airports development Levy (PAL) (p) = f x rp
Cess Levy (s) = f x 1.1 x rs

TA 7600 SRI – Multimodal Transport Project Sri Lanka
Final Report 258
Excise Duty (e) = ((f x 1.15) + c + p + f) x re
Value Added Tax (VAT) (v) = ((f x 1.1)+(c + p + s + e)) x rv
Nation Building Tax (NBT) (n) = ((f x 1.1) + (c + p + s + e)) x rn
Where:
f is the CIF price of the imported goods;
c, p, s, e, v and n are as defined above; and
rc, rp, rs, re, rv and rn are the rates at which the above taxes are levied.
Sri Lanka imports large of cement, both as clinker and as the finished product. Taking
imported finished cement as an example, the relevant tax rates are shown under “Nominal
Rate” below, while “Tax Take” shows the percentage of the CIF price raised by each tax.
Table 14.3 Nominal Rate vs Tax Take, Cement, 2011
Tax Nominal Rate Tax Take(a)
Customs duty(b) 5% 5.000%
PAL 5% 5.000%
Cess Levy 8% 8.800%
Excise Duty 0% -
VAT 12% 15.456%
NBT 2% 2.576%
Total Tax 36.832% Source: Consultant
(a) as a percentage of the CIF price
(b) Cement imports from India and Pakistan are free of duty
This implies that, at the market exchange rate, the price of cement in Sri Lanka exceeds the
world price by some 37%. So, subject to taxes being the only distortion, it would be
necessary to apply a shadow price factor of 0.731 (=100/136.832) to reduce the domestic
price of cement to an international price. In fact taxes also distort the exchange rate itself,
as discussed below.
Table 14.4 extracts various useful rates from the National Imports Tariff Guide, 2011,
concentrating on the project costs. For some imports a range of preferential rates is shown.
These refer to imports from:
• IN: India
• PK: Pakistan
• SF: the South Asia Free Trade Area (SAFTA), including Bangladesh, Bhutan, India,
Maldives, Nepal, and Pakistan; and
• SD: the Least Developed Countries under SAFTA, including Bangladesh, Bhutan,
Maldives, and Nepal.
Table 14.5 shows the application of the said taxes.

TA 7600 SRI – Multimodal Transport Project Sri Lanka
Final Report 259
Table 14.4 Selected Tax Rates, 2011
Item HS Heading
/Code Customs Duty VAT PAL NBT Cess Excise
Preferential General
IN PK SF SD
Aggregates, Tarred Macadam 2517 – various Free Free 10.83% 4.5% 15% 12% 5% 2%
Portland Cement 2523.10 Free Free Free Free 5% 12% 5% 2% 8%
Petrol 2710.11.20 Rs 35/l Ex 5% Ex Rs 25/l
Diesel/Gas oil 2710.19.40 Rs 15/l Ex 5% Ex Rs 25/l
Lubricants 2710.19.80 30% 12% 5% Ex
Tyres: cars, truck and bus: new 4011.10 30% or Rs90/kg 12% 5% 2% 10%
Tyres: motorcycle: new 4011.30 30% 12% 5% 2% 10%
Tyres: used or retread 4012 – various 30% 12% 5% 2% 10%
Re-bar(a) 7214.20.90 30% 12% 5% 2%
Railway track 7302 – various Free Free 10.83% 4.5% 15% 12% 5% 2%
Cranes 8426 – various Free Free Free Free Ex 5% 2%
Fork lift trucks 8427 – various Free Free Free Free Free 12% 5% 2%
Railways(b) 86 – various 4% 1.50% 5% 12% 5% 2% Source: National Imports Tariff Guide, 2011, Sri Lanka Customs
(a) Described as: Other bars and rods of iron or non-alloy steel, not further worked than forged, hot-rolled, hot drawn or hot extruded, but including those twisted after
rolling: containing indentations, ribs, grooves or other deformations produced during the rolling process or twisted after rolling: other.
(b) Chapter 86 shows duties and related taxes on locomotives, wagons, track fixtures and fittings and signalling equipment. In total there are about 24 codes, but all have
the same tax rates.

TA 7600 SRI – Multimodal Transport Project Sri Lanka
Final Report 260
Table 14.5 Calculation of Total Taxes on Imports, Excluding Fuels, 2011
Aggregates,
Tarred
Macadam Portland
Cement Lubricants
Tyres:
cars,
truck and
bus:
new(a)
Tyres:
motorcycle:
new
Tyres:
used or
retread Re-
bar Railway
track Cranes
Fork
lift
trucks Railways
CIF 100 100 100 100 100 100 100 100 100 100 100
Customs duty 15 30 30 30 30 30 15 - 5
PAL 5 5 5 5 5 5 5 5 5 5 5
Cess Levy - 9 - 11 11 11 - - - - -
VAT 16 15 17 19 19 19 17 16 - 14 14
NBT 3 2 - 3 3 3 3 3 2 2 2 Total Tax
Value 38 31 52 68 68 68 55 38 7 21 27 Source: Consultant
(a) Based on the ad valorem customs duty rate.

TA 7600 SRI – Multimodal Transport Project Sri Lanka
Final Report 261
Table 14.6 shows the taxes on imported vehicles relevant to the study. These have been
worked out in the same way as the taxes shown in Table 14.5, and apply to the vehicle
classes used in estimating congestion.
Table 14.6 Taxes on Vehicle Imports (Rs. per 100 Rs. CIF value)
Motor
Cycle 3-
Wheeler Car/
saloon
Utility
(Pickup/
Jeep/Van) Mini
Bus Large
Bus
Light
Goods
Veh
Medium
Goods
Veh
Heavy
Goods
Veh
Multi
Axle
Goods
Veh
54 38 119 119 55 21 38 27 27 27 Source: Consultant
Notes: Motorcycle: 50-200cc imported, not more than 3 years old, from India (HS Code 8711.20.10).
3-wheeler: not more than 3½ years old, from anywhere (There is no preferential rate for imports
from India) (HS Code 8703.21.53).
Car/ saloon: 1,000-1,500cc, not more than 3½ years old, from anywhere (HS Code 8703.22.59).
Utility (Pickup/ Jeep/Van): includes disparate vehicle types, but has been assumed the same as
the Car/Saloon above (HS Code 8703.22.59).
Mini Bus: 13-17 passengers, not more than 5 years old, from anywhere (HS Code 8702.90.39).
Large Bus: more than 17 passengers, not more than 5 years old, from anywhere (HS Code
8702.90.59).
Light Goods Vehicle: Carrying capacity less than 1,500kg, Not more than 5 years old, (HS Code
8704.21.61).
Medium Goods Vehicle gvw 5-20 tonnes, Not more than 5 years old (HS Code 8704.22.10).
Imports from India are free of customs duty, so the figure given reduces to 21.
Heavy Goods Vehicle: Goods Vehicle gvw 20 tonnes +, Not more than 5 years old (HS Code
8704.23.30). Again this figure reduces to 21 in respect of imports from India.
Multi Axle Goods Vehicle: Tractor Unit only, imported not more than 5 years old (HS Code
8701.20.10) . Again this figure reduces to 21 in respect of imports from India.
Semi-trailers (the trailer part of an articulated truck) are manufactured locally, and are
not included in the above table.
Taxes on fuels have been calculated separately because the pump prices strongly
suggested to the Consultants that pricing does not follow the National Imports Tariff
Guide.
It was reported on Apr 02, 2011 (Lanka Business Online) that Sri Lanka had raised fuel
prices: the Ceylon Petroleum Corporation had raised petrol (90 Octane) prices by 10
rupees a litre to 125 rupees but had raised auto diesel by only 3 rupees to 76 rupees.
Because international petroleum products are traded freely, with the price varying day-
by-day, or even hour by hour, it is difficult to know exactly which international price to
compare with the pump price for the purpose of determining shadow prices. However,
during the half month preceding the weekend of 1 – 2 October, the reported
international prices for both fuels, on the Singapore market, had been moving around
the US$123 per barrel level, suggesting the resource costs shown below.

TA 7600 SRI – Multimodal Transport Project Sri Lanka
Final Report 262
Table 14.7 International Fuel Prices, 2nd half of September 2011
International Price Resource cost
(US$ per Barrel) (US$ per Litre) (Rs per Litre) (Rs per Litre)
Petrol 95 Octane Unleaded 123 0.77 85 90
Diesel 123 0.77 85 90 Source: Singapore Market Reports
Note: I barrel = almost exactly 159 litre.
US$1.00 = Rs110.
Distribution cost, a legitimate part of the resource cost at the pump, has been assumed at Rs5
per litre.
The petrol price shown in Table 14.7 refers to 95 octane petrol, while the price given in
the preceding text is for 90 octane petrol. 95 octane petrol is sold for about 10 rupees
per litre more than 90 octane petrol, giving a pump price of Rs 135/l.
Comparing pump prices with the resource costs shown above gives the tax/subsidy
estimates shown below.
Table 14.8 Taxes/Subsidies and Shadow Prices, September 2011 (Rs)
Petrol Diesel
Pump Price 135 76
Resource cost 90 90
Taxes/(Subsidies) 45 (14) Source: Consultant
In practice shadow pricing should be applied to the marginal supply of each input,
because it is at the margin that savings will be made. Thus, on the basis of the
Consultant’s understanding of the Sri Lankan economy, of the inputs discussed above,
only aggregates and cement should be locally produced, and the primary input of
cement, cement clinker, is itself an import. Other items are either:
• not locally produced, like railway locomotives; or
• meet marginal demand through imports. For example Sri lanka has a refinery
but remains a significant importer of petrol and diesel fuel.
14.4.4 Shadow Exchange Rate Factor (SERF)
The SERF Calculation
As explained in Appendix 16 to the Guidelines for the Economic Analysis of Projects,
“Where tariffs represent the main distortion in the market for foreign exchange, the
SERF has been approximated by one plus the weighted average tariff rate”. This is easily
calculated as demonstrated below.
As 2011 is not yet over, this calculation has been based on the revised 2010 budget, as
shown in Table 14.2 above, except that:

TA 7600 SRI – Multimodal Transport Project Sri Lanka
Final Report 263
• The Regional Infrastructure Development Levy has been ignored as it appears
not to exist in 2011; and
• The revenue from Import & Export Licenses Fees has been ignored as the mix of
revenue raised on imports and revenue raised on exports is not clear.
Both of the above raised only small amounts of revenue, so their exclusion is not likely
to greatly change the calculation results.
The weighted average tax rate is given by:
Revenue raised from imports – Revenue raised from exports
Value of total Trade
Where:
• From Table 14.2, Revenue raised from imports = the sum of revenues from:
Import Duties, Ports & Airports Development Levy, Import Cess Levy and Special
Commodity Levy = Rs 153.6 tr.;
• Also from Table 14.2, Revenue raised from exports = the sum of revenues from:
Export Duties and the Export Cess Levy = Rs 1.9 tr.; and
• From Table 14.9 below, the value of total trade in 2010 is estimated as Rs
2,461.6 bn.
So calculated, the SERF = 1 + 153.6 – 1.9 = 1.062
2,461.6
It is clear that there is a large trade imbalance, with imports greatly exceeding exports.
In this respect, an IMF staff mission led by Brian Aitken visited Colombo May 31-June 10,
and, at the end of the mission, issued a generally favourable press release which did
however carry the following advice:
“Strong export growth and continued large remittance inflows have supported reserves,
but going forward, rapid import growth and high oil prices could put pressure on the
balance of payments. In this event, the central bank should allow the exchange rate to
reflect market forces flexibly and avoid sustained sales of foreign exchange, ensuring
that reserves remain healthy and the economy competitive”.
Whether or to what extent the rupee will decline is not known to the Consultant, and
estimating the size of any decline would a require a knowledge both of the elasticity of
demand for imports and the elasticity of demand, in importing countries, for Sri Lanka’s
exports. However, the Consultant has not taken into account the possible future decline
in value of the Rupee, and has assumed a SERF of 1.06, based on the calculation above.
The Consultant’s approach to estimating the economic prices of tradable inputs, such as
railway track, is to take the sale price, reduce it by correcting for the various taxes, and
then increase it by multiplying by the SERF. This is done by means of Shadow Price
Factors, as described in Section 14.4.6.

TA 7600 SRI – Multimodal Transport Project Sri Lanka
Final Report 264
Total Trade
The trade data in Table 14.9 below are taken from statistical tables published by the
Central Bank of Sri Lanka, actually showing the balance of payments breakdown by year,
denominated in US$.
Table 14.9 Sri Lanka Trade Performance in Jan-Dec 2010
2010 2009 Y/Y growth
(in millions of dollars) (in percent)
Exports 8,307.00 7,084.50 17.3
Imports 13,511.70 10,206.60 32.4
Balance of trade 5,204.70 3,122.10 66.7 Source: www.xe.com (website)
From the above, the total value of external trade in 2010, the sum of imports and
exports, was US$ 21.818 bn. Converting at a mid 2010 exchange rate of US$1.00 = Rs
112.8200 (Central Bank – 1 July 2010), gives a total of Rs 2,461.6 bn.
14.4.5 Unskilled labour
Appendix 12 of the Bank’s Guidelines for the Economic Appraisal of Projects divides
labour into three classes: skilled, semi-skilled and unskilled. Semi skilled workers are
generally not relevant to this project, being more relevant to manufacturing projects,
and so two classes have been considered: skilled and unskilled workers.
Paragraph 4 of the above appendix states that “Since skilled workers are generally in
short supply in DMCs, prevailing market wages in the project area may be taken as
corresponding to their supply price”. The Consultant is in agreement with this view and
finds that this assumption can be applied in respect of the project under consideration.
A unity shadow price factor has been assumed for skilled labour.
Considering unskilled labour, the above appendix gives guidance on how to correct for
taxes, but is relatively silent on how to correct for market failure, preferring to use
expressions such as “If the market works fairly well” (para.9). In many DMCs, including
Sri Lanka, there is market failure, for example where the wages of the unskilled are
raised above a market level by their own action through trade unions, or by government
imposing minimum wages which are higher than would have been set by the market.
In respect of Sri Lanka, the Encyclopaedia of the Nations website reports that:
“The country has a strong trade union tradition, and the constitutional right to form
unions is respected by the government. Approximately 25% of the nationwide labor
force are union members, with over 70% of agricultural workers unionized as well. The
largest trade union federations are the Ceylon Workers' Congress, the National Workers'
Union, the Democratic Workers' Congress, and the Ceylon Federation of Labor. With the
exception of essential workers, employees have the right to strike. It is illegal for an
employer to discriminate against those who engage in union activity. Collective
bargaining is widely practiced.”

TA 7600 SRI – Multimodal Transport Project Sri Lanka
Final Report 265
There is no national minimum wage, but there are minimum wages set in individual
sectors and industries…”
The various minimum wages seem to be set by industry-specific wages boards.
Considering the Construction Industry, Statistics from the Ministry of Labour, shown
below, show that the average minimum wage for Construction is higher than those for
Agriculture and Manufacturing and that average earnings, while lower than those for
manufacturing are considerably higher than the minimum wage. However, it should be
noted that, while the statistics shown are the most detailed the Consultant has been
able to find, they do not disaggregate by skill level within sector. At the same time, it
would be surprising if no one benefitted from the minimum wage, and those most likely
to benefit from it are the least skilled.
Table 14.10 Minimum Wages vs Average Earnings 2003 – 2009 (Rs/day)
Average minimum wage rate (Daily) Average Earnings (Daily)
Agriculture Manufacturing Construction Agriculture Manufacturing Construction
2003 114.6 114.52 155 138.43 306.28 276.42
2004 119.53 123.72 155 152.94 310.84 316.16
2005 127.52 126.31 178.5 178.47 336.49 416.75
2006 147.94 128.51 178.5 206.33 356.11 424.55
2007 170.53 173.15 200.5 198.01 411.6 408.37
2008 222.34 221.65 252 298.85 469.47 443.91
2009 235.15 247.04 292.5 323.2 492.73 472.58 Source: Department of Labour
In practice:
• The operation of the project is unlikely to add significantly to long term employment
in Sri Lanka: it will transfer some mostly skilled employment from the trucking
industry to the railway industry and will transfer some port tasks to new locations in
the ICDs;
• It will create short term employment, including employment for the unskilled in the
construction industry; and
• It is unlikely that unskilled workers pay significant amounts of tax.
The Consultant has therefore chosen to assume that the shadow wage factor for
unskilled workers in the construction industry should correct for market failure rather
than for taxes, and, having no basis for a more detailed estimate, have assumed the
shadow wage rate factor for unskilled labour to be 90% of the actual wage rate.
It should be noted that this study is not of a labour intensive industry and that precision
in estimating the shadow wage rate factor for unskilled workers is not crucial to the
results.
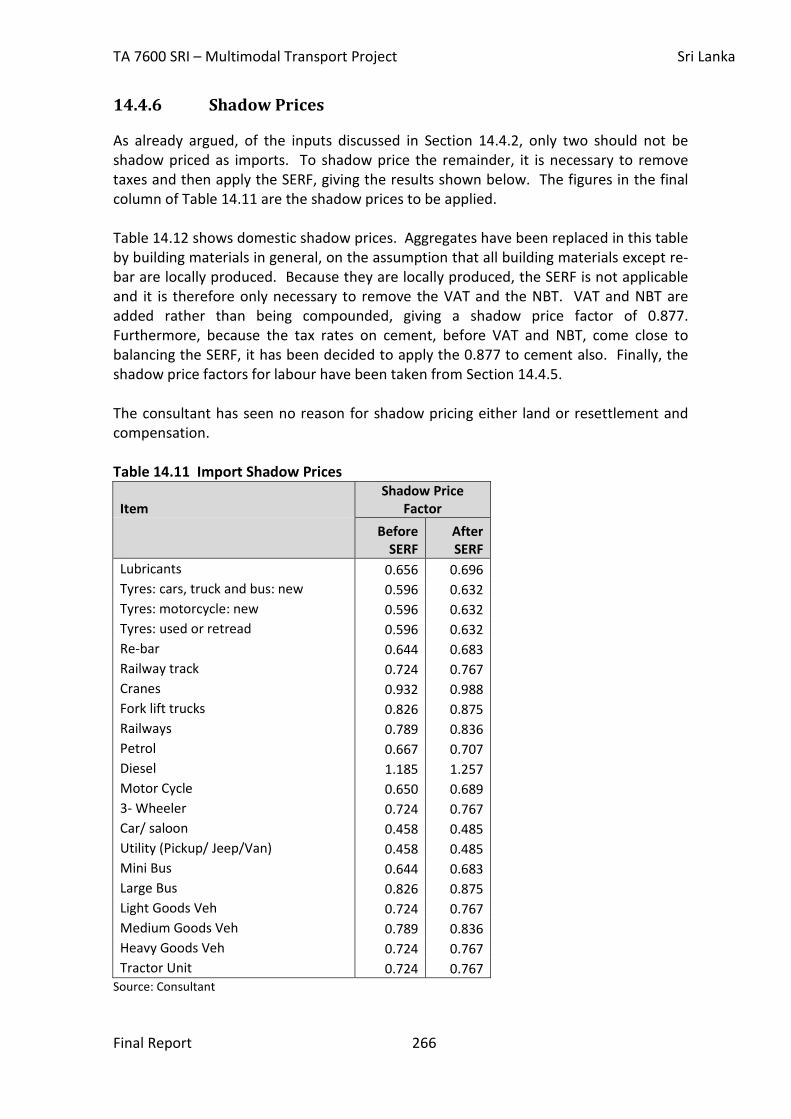
TA 7600 SRI – Multimodal Transport Project Sri Lanka
Final Report 266
14.4.6 Shadow Prices
As already argued, of the inputs discussed in Section 14.4.2, only two should not be
shadow priced as imports. To shadow price the remainder, it is necessary to remove
taxes and then apply the SERF, giving the results shown below. The figures in the final
column of Table 14.11 are the shadow prices to be applied.
Table 14.12 shows domestic shadow prices. Aggregates have been replaced in this table
by building materials in general, on the assumption that all building materials except re-
bar are locally produced. Because they are locally produced, the SERF is not applicable
and it is therefore only necessary to remove the VAT and the NBT. VAT and NBT are
added rather than being compounded, giving a shadow price factor of 0.877.
Furthermore, because the tax rates on cement, before VAT and NBT, come close to
balancing the SERF, it has been decided to apply the 0.877 to cement also. Finally, the
shadow price factors for labour have been taken from Section 14.4.5.
The consultant has seen no reason for shadow pricing either land or resettlement and
compensation.
Table 14.11 Import Shadow Prices
Item Shadow Price
Factor
Before
SERF After
SERF
Lubricants 0.656 0.696
Tyres: cars, truck and bus: new 0.596 0.632
Tyres: motorcycle: new 0.596 0.632
Tyres: used or retread 0.596 0.632
Re-bar 0.644 0.683
Railway track 0.724 0.767
Cranes 0.932 0.988
Fork lift trucks 0.826 0.875
Railways 0.789 0.836
Petrol 0.667 0.707
Diesel 1.185 1.257
Motor Cycle 0.650 0.689
3- Wheeler 0.724 0.767
Car/ saloon 0.458 0.485
Utility (Pickup/ Jeep/Van) 0.458 0.485
Mini Bus 0.644 0.683
Large Bus 0.826 0.875
Light Goods Veh 0.724 0.767
Medium Goods Veh 0.789 0.836
Heavy Goods Veh 0.724 0.767
Tractor Unit 0.724 0.767 Source: Consultant

TA 7600 SRI – Multimodal Transport Project Sri Lanka
Final Report 267
Table 14.12 Domestic Shadow Prices
Item Shadow Price Factor
Building Materials 0.877
Cement 0.877
Trailers 0.877
Skilled labour 1.000
Unskilled labour 0.900 Source: Consultant

TA 7600 SRI – Multimodal Transport Project Sri Lanka
Final Report 268
15 Economic appraisal Throughout, an international exchange rate of 1 US$ = 110 Rs has been used. Where
appropriate, the Shadow Exchange Rate Factor (SERF) has been used to modify this –
see Section 14.4.4.
15.1 Land Values
As noted earlier it is assumed that land for most ICD sites will be provided to the project
free of charge. Nevertheless, such land is a resource with an opportunity cost, which
should be included in the appraisal whether or not money actually changes hands.
Table 15.1 shows the areas of land to be acquired, separating good quality land from
marshy land, and estimates the opportunity cost of that land.
Market prices of land are a good indicator of opportunity costs, and indicative market
prices have been collected for all sites except the port railhead sites, which are
discussed below. Land prices are not uniform, both location and quality matter, and as
a result there are prices for each site and for good land and marshy land.
The values shown are commercial sale prices and it can be assumed that they related to
sites which are cleared for development, not sites in respect of which compensation and
resettlement has to be paid. It can further be expected that the need to pay
compensation and resettlement costs will depress site values, by an amount equal to
the said costs. Thus, for those sites in respect of which compensation and resettlement
is payable, the land acquisition cost shown in the economic appraisal has been assumed
to be inclusive of the compensation and resettlement cost.
The potential site of the port railhead would be on reclaimed land, forming part of the
proposed Port City, and there is clearly no market in land which has yet to be reclaimed
from the sea. However, press reports say that, under a presidential directive, the Sri
Lankan government is to reclaim 300-400 acres of sea land between the Colombo South
Port Development project and the Galle Face Green in order to build a Port City at a cost
of US$ 300 million.
The reported total cost implies a unit development cost of around US$1 million per acre.
Further press releases say that of the 330 acres (a more precise figure), 200 acres of the
City are to be either sold outright or given out on a long term lease to investors,
implying a cost of at least US$ 1.5 million per acre sold or leased. While it is not yet
clear to the Consultant under what arrangements the project will use or own the port
railhead site, it is clear that the land will have a value and, if the decision to develop Port
City is rational, that the opportunity cost of the land will be not less than US$1.5 million
per acre, equivalent to Rs. 408 million/ha. This unit price has been taken into Table
15.1, and is not out of proportion to the prices given in respect of other sites.
The totals given in Table 15.1 have been taken into the economic appraisals.

TA 7600 SRI – Multimodal Transport Project Sri Lanka
Final Report 269
Table 15.1 Opportunity Cost of Land
Land Requirement (Ha) Cost per
Ha (Rs
million)
Opportunity cost (Rs million)
Site Stage 1 Stage 2
Total Stage 1 Stage 2
Good Marshy Good Marshy Good Marshy Total Good Marshy Total
Enderamulla 2.84 316.29 898
43.26 46.10 79.07 3,421 4,319
Ratmalana 13.83 13.83 988.42 13,670 0 13,670
Telangapata side of PelTel 2.86 8.22
27.60 See
valuation
report
1,950 4,530 16.52 0.00
Peliyagoda side of PelTel 4.38
3.60
16.05 1,645 1,980
7.80
0.27
Veyangoda 21.63 21.63 71.17 1,539 0 1,539
Sedawatta 0.07 474.44 475
1.32 1.39 336.06 444 918
Port Railhead - 3 lines 3.36 3.36 408 1,371 0 1,371
Port Railhead - 4 lines 3.71 3.71 408 1,514 0 1,514
Source: Consultant, Peliyagoda/Telangapata land compensation valuation report

TA 7600 SRI – Multimodal Transport Project Sri Lanka
Final Report 270
15.2 Incremental Capital Costs
This section shows the capital costs for each of the four candidate IDC sites, the
Sedawatta Link and the alternative port railhead sites. The costs shown are economic
costs. It has been assumed that the contingencies shown in the Consultants’ costing will
be spent in full. All costs in this chapter are at 2011 prices.
15.2.1 Economic costs of Civil and Track Works at ICD sites
Table 15.2 shows the economic capital costs for civil works at the four ICD sites. These
have been developed from the financial costs shown in Chapter 8. Preliminaries are
small, and have been included in full, without shadow pricing.
The economic prices of land at the sites have been estimated above in Table 15.1. As
explained in the preceding section, compensation and resettlement costs have been
included in the land acquisition cost, all shadow priced at unity.
Deck Preparation is a major item, which should be included in full as it seems unlikely
that there would be an offsetting saving in the port. A weighted average shadow price
has been calculated assuming 50% construction materials (SPF = 0.877), 25% skilled
labour (SPF = 1.00) and 25% unskilled labour (SPF = 0.90). All other civil works items
except railway construction have been treated in the same way as Deck Preparation.
Considering Infrastructure and buildings, most of the items are one off and their
construction is unlikely to be offset by savings elsewhere. The exception is the CFS, for
which staged construction is planned, and where it seems reasonable to assume that,
after the first tranche, expansion of the CFS will offset the need for more CFS capacity at
the port. Thus only the first tranche has been recognised as an incremental cost, again
shadow priced at the same rate as the Deck Preparation. This is a conservative
assumption, meaning one which is biased against the project, in that even though it is
unlikely that the first tranche of CFS construction will be immediately offset by a
reduction in investment at the port, it will probably be offset by a reduction in later
investment.
Finally, it is recognised that the railway construction will include steel track, and also
trackside furniture, which have their own shadow prices. A composite shadow price has
been applied made up of the shadow prices for skilled labour (25%), unskilled labour
(25%), construction materials (30%), track (10%) and “railways” (10%).
Table 15.2 shows the results of applying the above assumptions. The numbers for
Peliyagoda/Telengapa look a little different from those for the other three sites because
staged construction has been assumed as discussed in Chapter 8; there is a significant
land acquisition cost in Stage 2.

TA 7600 SRI – Multimodal Transport Project Sri Lanka
Final Report 271
Table 15.2 Economic Costs of Land and Civil Works (Rs million)
Economic Costs Veyangoda Enderamulla PelTel Ratmalana
2014 2020 2014 2020 2014 2020 2014 2020
Preliminaries 100
150 150 90
Land acquisition* 1,539 4,319 3,595 6,510 13,670
Deck preparation 1,119 217 2,524 418 2,158 434 250 91
Circulation 32 36 62 64 64 55 18 21
Access road 28 105 67 13
Boundary wall 74 134 79 42 75
CFS buildings 573 1,459 1,459 434
Other buildings 513
1,216 1,216 2 421
Railway works on site 545
355 285 143 280
Signalling, level Xings 124
200 170 20 133
Total Civil Works 4,647 253 10,523 482 9,243 7,206 15,385 113
Source: Consultant Note: * Land acquisition one year earlier, in 2013 & 2019
15.2.2 Economic costs of Rolling Stock and Cargo Handling Equipment
M8 locomotives
All locomotives and wagon purchases are incremental to the project, but one cost is
excluded from the Consultant’s costing. That is the use of M8 locomotives in the early
years of the project. While these locomotives are already inside the economy, and so
will not be imported, they have a value to the economy, and their use involves an
opportunity cost.
The M8 locomotives were first imported in 1996 and are described as being of 2,600hp
(horsepower). In the absence of a market for second hand M8 locomotives, there is a
need to estimate their capital costs for inclusion in the Consultant’s appraisals. The
Consultant is unaware of the value at which these locomotives are held in SLR’s books
and, given that a book value is an artificial figure based on a purchase price, long since
eroded by inflation, and an artificial idea of the asset life, would not find such
knowledge helpful.
Veyangoda
It has been assumed that the M8 equivalent locomotives proposed for Veyangoda from
2021 would cost Rs. 200 million, at today’s prices. It has therefore also been assumed
that today’s price for new M8 locomotives would also be Rs. 200 million.
But the existing M8 locomotives are not new, and how long a locomotive can be
expected to last is a relevant question. The Consultant understands that a reasonable
assumption is that the life of an M8 is 25 years.
Accountants typically depreciate assets on a straight line basis, but this is just a
simplification, with arguments for various other approaches. Nevertheless, for the
purpose of this analysis, it has been assumed that locomotive value declines, in real
terms, over the assumed life. On this basis, a locomotive imported in 1996, with new
TA 7600 SRI – Multimodal Transport Project Sri Lanka
Final Report 272
price of 200 million, will have a 2014 value of Rs 56 million, declining at a rate of Rs. 8
million per year, all at 2011 prices. It has further been assumed that, by the end of
2020, these locomotives will be very close to the ends of their lives, and so have no
value.
Finally, it has been assumed that 4 such locomotives will be taken into the project in
2014, and will remain in service until the end of 2020, the year in which the new
locomotives are assumed to be acquired, all before shadow pricing. The resulting costs
have been inserted into the Consultant’s calculations.
Locomotives and wagons have been shadow priced using the shadow price factor shown
in Chapter 14 (0.836). Additional wagons and locomotives are assumed to have been
purchased as and when necessary.
In deciding about the relevance of cargo handling equipment purchases, it is necessary
to be guided by Table 14.1, showing which activities, and hence which plant items, are
incremental, and which are simply existing activities, transferred from the port. It is
clear from Table 14.1 that all RTG lifts are incremental, and the ICD RTGs are included in
full in the economic costing and shadow priced using the shadow price factor shown in
Chapter 14 (0.988).
Considering tractor trailer units, It is clear that insofar as tractor trailer units are used for
transporting containers between the railway siding and the stack, their costs are
relevant to the appraisal, but when they are transporting containers between the stack
and the CFS, their costs are not relevant, because they are simply carrying out an activity
which would otherwise have been carried out at the port. A tractor-trailer unit is
assumed to consist of an imported tractor, shadow priced at the same rate as a road
tractor unit, and a trailer shadow priced as a locally constructed trailer, giving a
weighted average shadow price factor of 0.784.
Equipment required at the CFS is not relevant to the economic appraisal, except as
argued in respect of the CFS buildings themselves, for the first tranche. Hence, only the
first tranche of small fork lift trucks has been taken into account. A shadow price factor
of 0.875 has been applied.
Table 15.3A shows the economic capital costs for rolling stock and cargo handling
equipment for Veyangoda.
Enderamulla
The economic capital costs for rolling stock and cargo handling equipment for
Enderamulla have been worked out in the same way as those for Veyangoda above. Five
existing M8 locomotives are assumed to be taken into the project in 2014. However, the
locomotives to be acquired in 2020 would be of 3,500 h.p. and hence larger and more
expensive than the M8s.
Table 15.3B shows the year by year economic cost of rolling stock and cargo handling
equipment for Enderamulla.

TA 7600 SRI – Multimodal Transport Project Sri Lanka
Final Report 273
Peliyagoda/Telengapa
The economic capital costs for rolling stock and cargo handling equipment for
Peliyagoda/Telengapa have been worked out in the same way as those for Enderamulla
above, with the same assumptions concerning locomotives.
Table 15.3C shows the year by year economic cost of rolling stock and cargo handling
equipment for Peliyagoda/Telengapa.
Ratmalana
The economic capital costs for rolling stock and cargo handling equipment for
Ratmalana have been worked out in the same way as those for Enderamulla above. For
Ratmalana, only two M8 locomotives are assumed to be taken into the project in 2014.
Table 15.3D shows the year by year economic cost of rolling stock and cargo handling
equipment for Ratmalana.

TA 7600 SRI – Multimodal Transport Project Sri Lanka
Final Report 274
Table 15.3A Economic Capital Costs of Rolling Stock and Cargo Handling Equipment: Veyangoda (Rs million)
2014 2015 2016 2017 2018 2019 2020 2021 2022 2023 2024
Total Wagons and Locomotives 295 0 0 0 0 28 621 0 0 0 0
Total RTGs 1,040 0 0 0 0 0 0 0 0 0 0
Tractor trailer units 149 0 0 0 0 0 0 0 0 0 0
Forklift trucks 18 0 0 0 0 0 0 0 0 0 0
Total 1,502 0 0 0 0 28 621 0 0 0 0
2025 2026 2027 2028 2029 2030 2031 2032 2033 2034
Total Wagons and Locomotives
0 0 0 0 0 0 0 230 0 0
Total RTGs
0 0 0 0 0 0 0 0 0 0
Tractor trailer units
0 0 0 0 0 0 0 0 0 0
Forklift trucks
0 0 0 0 0 0 0 0 0 0
Total
0 0 0 0 0 0 0 230 0 0
Source: Consultant
Table 15.3B Economic Capital Costs of Rolling Stock and Cargo Handling Equipment: Enderamulla (Rs million)
2014 2015 2016 2017 2018 2019 2020 2021 2022 2023 2024
Total Wagons and Locomotives 442 0 0 0 0 62 1,082 0 0 0 0
Total RTGs 1,214 0 0 0 0 0 867 0 0 0 0
Tractor trailer units 149 0 0 0 0 0 179 0 0 0 0
Forklift trucks 44 0 0 0 0 0 0 0 0 0 0
Total 1,849 0 0 0 0 62 2,128 0 0 0 0
2025 2026 2027 2028 2029 2030 2031 2032 2033 2034
Total Wagons and Locomotives 0 0 0 0 0 0 0 348 0 0
Total RTGs 0 0 0 173 0 0 173 0 0 0
Tractor trailer units 0 0 0 0 0 0 0 0 0 0
Forklift trucks 0 0 0 0 0 0 0 0 0 0
Total 0 0 0 173 0 0 173 348 0 0
Source: Consultant

TA 7600 SRI – Multimodal Transport Project Sri Lanka
Final Report 275
Table 15.3C Economic Capital Costs of Rolling Stock and Cargo Handling Equipment: Peliyagoda/Telengapata (Rs million)
2014 2015 2016 2017 2018 2019 2020 2021 2022 2023 2024
Total Wagons and Locomotives 442 0 0 0 0 62 1,082 0 0 0 0
Total RTGs 1,214 0 0 0 0 0 867 0 0 0 0
Tractor trailer units 149 0 0 0 0 0 179 0 0 0 0
Forklift trucks 44 0 0 0 0 0 0 0 0 0 0
Total 1,849 0 0 0 0 62 2,128 0 0 0 0
2025 2026 2027 2028 2029 2030 2031 2032 2033 2034
Total Wagons and Locomotives 0 0 0 0 0 0 0 348 0 0
Total RTGs 0 0 0 173 0 0 173 0 0 0
Tractor trailer units 0 0 0 0 0 0 0 0 0 0
Forklift trucks 0 0 0 0 0 0 0 0 0 0
Total 0 0 0 173 0 0 173 348 0 0
Source: Consultant
Table 15.3D Economic Capital Costs of Rolling Stock and Cargo Handling Equipment: Ratmalana (Rs million)
2014 2015 2016 2017 2018 2019 2020 2021 2022 2023 2024
Total Wagons and Locomotives 272 0 0 0 0 23 359 0 0 0 0
Total RTGs 1,040 0 0 0 0 0 0 0 0 0 0
Tractor trailer units 149 0 0 0 0 0 0 0 0 0 0
Forklift trucks 13 0 0 0 0 0 0 0 0 0 0
Total 1,474 0 0 0 0 23 359 0 0 0 0
2025 2026 2027 2028 2029 2030 2031 2032 2033 2034
Total Wagons and Locomotives 0 0 0 0 0 0 0 118 0 0
Total RTGs 0 0 0 0 0 0 0 0 173 0
Tractor trailer units 0 0 0 0 0 0 0 0 0 0
Forklift trucks 0 0 0 0 0 0 0 0 0 0
Total 0 0 0 0 0 0 0 118 173 0
Source: Consultant
TA 7600 SRI – Multimodal Transport Project Sri Lanka
Final Report 276
15.2.3 Port Railhead
The opportunity cost of reclaimed land for the port railheads has been discussed above.
Unlike at the ICD sites, where the situation is more complex, and in line with Table 14.1, all
activities, and all costs at the Port Railhead can be viewed as being incremental.
15.2.4 Sedawatta Link
The Sedawatta Link land acquisition and construction costs have been shadow priced using
the shadow price factors already applied to the ICDs.
15.3 Recurrent Costs
15.3.1 Railway Operations & Maintenance
Veyangoda Trains
It has been assumed that Veyangoda will operate with 15-wagon trains over the full period
addressed by the appraisal.
The railway recurrent costs shown in Chapter 8 bring together a number of different costs,
some of which vary with traffic level and some of which do not. Consequently, the weighted
average shadow price factor (SPF) varies slightly from year to year.
On the basis that all train crews are assumed to be skilled workers, an SPF of unity has been
applied. The shadow price of diesel fuel has been taken from Chapter 14.
The Consultant has assumed the cost of locomotive maintenance to be made up 50% of
spare parts and materials, to which the Railways shadow price factor of 0.946 has been
applied, and 50% of skilled labour, to which a unity shadow price factor has been applied,
giving an overall shadow price factor of 0.973. The same shadow price has been applied to
wagon maintenance.
The SPF for track maintenance, fixed and variable, has been assumed to be made up of
equal portions of construction materials, railway inputs, track and skilled labour, giving a
weighted average shadow price factor of 0.918.
The Interim Report identifies station operations as a fixed cost and argues that, as station
staff have a safe-working function in addition to their passenger handling functions, and will
therefore have some involvement with the container trains. Nevertheless, station operating
staff are only relevant to the economic costing of the container services if the introduction
of the container services leads to the employment of additional staff. In the Consultant’s
opinion this is unlikely to be the case, and so station operations have been excluded. In
practice, these costs are very small. Similarly, the costs shown in Chapter 8 include an
allocation of fixed maintenance costs for track shared with Sri Lankan Railways. This is also

TA 7600 SRI – Multimodal Transport Project Sri Lanka
Final Report 277
unlikely to be an incremental cost and so has been excluded. For convenience, these
excluded costs are shown in the tables above, with an SPF of zero.
As explained in the Interim Report, an administrative overhead rate of 20% was applied to
the total of the variable and fixed costs attributable to the container traffic to provide an
estimate of the administrative overhead cost of this traffic. Insofar as true incremental
costs have been identified, and accepting that cost areas require administration, there is a
case for including an administrative overhead in the economic costs. The figure of 20%
seems both high and arbitrary, but has nevertheless been adopted, and a unity shadow
price factor has been applied.
The above leads to weighted average shadow prices a little higher than unity, a
consequence of the domestic price of diesel fuel being below the international price.
Enderamulla Trains
It has been assumed that Enderamulla will operate with 15-wagon trains over the period
2015 to 2020, and 35-wagon trains thereafter. In all other respects the economic costing
has followed the approach outlined above in respect of Veyangoda.
Peliyagoda/Telangapata Trains
The economic costing has followed the approach outlined above in respect of Enderamulla.
Ratmalana Trains
The economic costing has followed the approach outlined above in respect of Enderamulla.
Table 15.4 shows sample recurrent cost breakdowns for each ICD site in 2015.

TA 7600 SRI – Multimodal Transport Project Sri Lanka
Final Report 278
Table 15.4 Railway Recurrent Costs Breakdown in 2015
Economic Costs Veyangoda Enderamulla Peliyagoda/Telengapa Ratmalana
Item % SPF
Weighted
SPF % SPF
Weighted
SPF % SPF
Weighted
SPF % SPF
Weighted
SPF
Non – incremental 2.7 0 0 1.0 0 0 0.8 0 0 1.4 0 0
Train crews 18 1 0.18 30.1 1 0.301 32.3 1 0.323 21.0 1 0.210
Fuel/energy consumption 25.9 1.257 0.325 20.5 1.257 0.258 19.5 1.26 0.245 22.2 1.257 0.279
Locomotive maintenance 12 0.973 0.117 11.2 0.973 0.109 10.9 0.97 0.106 10.9 0.973 0.106
Wagon maintenance 14.5 0.973 0.141 11.5 0.973 0.112 10.9 0.97 0.106 12.4 0.973 0.121
Variable track maintenance 0.9 0.918 0.008 0.7 0.918 0.006 0.7 0.92 0.006 0.7 0.918 0.007
Fixed cost of infrastructure maintenance 9.3 0.918 0.086 8.2 0.918 0.075 8.2 0.92 0.075 14.7 0.918 0.135
Administrative overhead cost 16.7 1 0.167 16.7 1 0.167 16.7 1 0.167 16.7 1 0.167
Total 100 1.024 100 1.029 100 1.029 100 1.024
Source: Consultant

TA 7600 SRI – Multimodal Transport Project Sri Lanka
Final Report 279
15.3.2 Operations & Maintenance in the ICDs
The CFS activities to be conducted within the ICD will largely be identical to those currently
conducted in the port’s CFSs. Also, there is no reason to assume that their costs will be
different, here meaning resource costs, not charges. This is particularly the case if the ICDs
are to be run by the SLPA, but even if they are not to be run by the SPLA, the costs of the
SPLA are the best “first guess” to the costs of ICD operation.
Under these assumptions, and to the extent that the activities are truly identical, the
incremental cost is zero – an activity is simply being transferred from one location to
another.
As demonstrated in Table 14.1, all activities from the arrival of import containers at the ICD,
to their being lifted from the stack, and the reverse for export containers, are incremental. It
follows from the above that CFS staff should be excluded from the appraisal as non-
incremental. All other staff are assumed to be skilled, and so subject to a unity SPF.
Logically, all RTG drivers but only those tractor trailer unit drivers needed to serve the
loading and unloading of trains should be included in the economic appraisal. All yard staff
have been treated as relevant to the study.
Some simplifications have been made in respect of energy. The full assumed volume of
6l/TEU has been assumed to be used by RTGs and tractor trailer units, although in reality
some would be used by the CFS fork lift trucks, and should be excluded, and electricity has
not been shadow priced on the grounds that the small sum involved does not justify what
could be a major shadow pricing effort. Diesel fuel has been shadow priced using the SPF
given in the preceding chapter.
In respect of equipment maintenance, an SPF has been chosen which is the arithmetic mean
of the SPF for a skilled worker (1) and that for the specific equipment referred to. For
infrastructure maintenance the SPF applied is that already used for civil works.
Tables 15.5A to D summarise the recurrent costs, railway and ICD, at each of the four sites.

TA 7600 SRI – Multimodal Transport Project Sri Lanka
Final Report 280
Table 15.5A Economic Recurrent Costs of Railways and ICD for Veyangoda (Rs million)
2015 2016 2017 2018 2019 2020 2021 2022 2023 2024
Railway Recurrent Costs 121 128 135 143 151 165 169 179 190 201
ICD Recurrent Costs 262 267 273 278 283 289 358 365 372 379
Total 383 395 408 421 434 454 527 544 562 580
2025 2026 2027 2028 2029 2030 2031 2032 2033 2034
Railway Recurrent Costs 211 221 232 244 256 269 282 296 311 326
ICD Recurrent Costs 384 392 401 408 427 436 446 456 467 477
Total 383 395 408 421 434 454 527 544 562 580
Source: Consultant
Table 15.5B Economic Recurrent Costs of Railways and ICD for Enderamulla (Rs million)
2015 2016 2017 2018 2019 2020 2021 2022 2023 2024
Railway Recurrent Costs 148 156 165 174 184 194 147 156 165 174
ICD Recurrent Costs 437 449 462 476 500 515 723 739 758 778
Total 585 606 627 650 684 709 870 895 922 951
2025 2026 2027 2028 2029 2030 2031 2032 2033 2034
Railway Recurrent Costs 182 191 201 211 221 232 243 255 267 280
ICD Recurrent Costs 795 814 834 865 886 909 934 970 997 1,026
Total 977 1,005 1,034 1,075 1,107 1,141 1,177 1,225 1,265 1,306
Source: Consultant

TA 7600 SRI – Multimodal Transport Project Sri Lanka
Final Report 281
Table 15.5C Economic Recurrent Costs of Railways and ICD for Peliyagoda/Telengapa (Rs million)
2015 2016 2017 2018 2019 2020 2021 2022 2023 2024
Railway Recurrent Costs 137 145 153 162 171 181 163 173 183 194
ICD Recurrent Costs 434 446 459 473 497 512 721 738 756 776
Total 571 591 612 635 668 693 884 910 939 969
2025 2026 2027 2028 2029 2030 2031 2032 2033 2034
Railway Recurrent Costs 203 214 225 236 248 261 274 288 302 318
ICD Recurrent Costs 793 812 832 863 885 907 932 969 996 1,024
Total 996 1,026 1,057 1,099 1,133 1,168 1,206 1,256 1,298 1,342
Source: Consultant
Table 15.5D Economic Recurrent Costs of Railways and ICD for Ratmalana (Rs million)
2015 2016 2017 2018 2019 2020 2021 2022 2023 2024
Railway Recurrent Costs 68 72 75 79 84 88 80 84 89 94
ICD Recurrent Costs 270 273 277 280 285 290 355 361 366 372
Total 338 344 352 360 369 378 435 445 455 466
2025 2026 2027 2028 2029 2030 2031 2032 2033 2034
Railway Recurrent Costs 98 103 108 113 118 124 130 136 143 150
ICD Recurrent Costs 378 383 389 395 402 409 416 423 431 451
Total 476 486 497 508 520 533 546 560 574 600
Source: Consultant

TA 7600 SRI – Multimodal Transport Project Sri Lanka
Final Report 282
15.3.3 Port Railhead
The capital and operating costs of the Port Railhead are shown in Table 8.3 for the 3 track
variant, to serve 1 ICD, and in Table 8.4 for the 4 track variant, to serve 2 ICDs.
As will be clear from Table 14.1, all activities at the Port Railhead are incremental and so
can be taken in full into the economic appraisal, subject to application of appropriate
shadow pricing.
The shadow price factors (SPFs) applied to the recurrent costs at the port railhead are
those which have also been applied to the candidate ICD sites. For example:
• Recurrent staff costs are taken to apply to people skilled in their various disciplines,
and a unity SPF has been applied;
• An SPF of 1.257 has been applied to diesel fuel as shown in Table 14.11. As
explained in the preceding section, electricity has not been shadow priced on the
grounds that the small sum involved does not justify what could be a major shadow
pricing effort;
• As explained in the preceding section, In respect of equipment maintenance, As
explained in the preceding section, an SPF has been chosen which is the arithmetic
mean of the SPF for a skilled worker (1) and that for the specific equipment referred
to. This gives SPFs of 0.994 for RTGs, and 0.892 for Tractor-trailer Units; and
• The operation and maintenance of the container control system has been shadow
priced at unity.
15.4 Traffic Impacts and Decongestion Benefits
The desire for decongestion benefits, by removing traffic from Colombo’s roads and
transferring the goods to rail, is the major objective of the project. A full chapter, Chapter
16, is devoted to the subjects of traffic modelling and decongestion benefits, with the
supporting calculations. Table 15.6 replicates Table 16.17, the final table of Chapter 16;
it shows the estimated savings for 2015, 2024 and 2025. Annual savings for years 2016 to
2023 and for years 2025 to 2033 have been estimated by assuming savings to grow on a
straight line basis between 2015 and 2024, and between 2024 and 2034.
The valuation of the above savings has been taken into the Consultant’s economic
appraisal, as described in Chapter 14. The results are given in Section 15.5.

TA 7600 SRI – Multimodal Transport Project Sri Lanka
Final Report 283
Table 15.6 Annual Transport and Congestion Savings (Rs. million/yr)
2015 2024 2034
Veyangoda - Trucking Savings 2,245 6,450 15,112
- Congestion Savings 464 60 1,320
- Total 2,709 6,510 16,431
Enderamulla - Trucking Savings 2,133 5,648 14,954
- Congestion Savings 1,838 2,140 1,142
- Total 3,971 7,788 16,096
Peliyagoda - Trucking Savings 918 2,303 6,114
- Congestion Savings 2,484 4,789 743
- Total 3,402 7,093 6,857
Ratmalana - Trucking Savings 715 2,026 4,703
- Congestion Savings 285 1,432 334
- Total 1,000 3,458 5,037
Source: Consultant
15.5 Results
15.5.1 Veyangoda
Table 15.7 shows the cost/benefit flows for an ICD at Veyangoda: These have been
generated by adding together the economic cost streams for Veyangoda ICD site, the
Sedawatta Link, the 3-line Port Railhead, the container control system and the traffic
impact. Costs are shown as negative numbers while savings or benefits are shown as
positive.
Also as noted above, a discount rate of 12% has been taken into account. In view of the
high discount rate, no residual value is shown. While all costs and the NPVs are shown at
2011 prices, discounting is to 2014.

TA 7600 SRI – Multimodal Transport Project Sri Lanka
Final Report 284
Table 15.7 Veyangoda: Economic Costs and Benefits (Rs. Million)
Year Civil Equipment:
Railway
Equipment:
ICD +
Railhead
Recurrent:
Railway
Recurrent:
ICD +
Railhead
Traffic
Benefits
Total
2013 -3,828 0 0 0 0 0 -3,828
2014 -5,337 -295 -1,795 0 0 0 -7,427
2015 0 0 0 -121 -453 2,709 2,136
2016 0 0 0 -128 -462 3,132 2,542
2017 0 0 0 -135 -472 3,554 2,947
2018 0 0 0 -143 -481 3,976 3,352
2019 0 -28 0 -151 -491 4,399 3,728
2020 -253 -621 0 -160 -502 4,821 3,285
2021 0 0 0 -169 -601 5,243 4,473
2022 0 0 0 -179 -613 5,666 4,874
2023 0 0 0 -190 -626 6,088 5,272
2024 0 0 0 -201 -640 6,510 5,670
2025 0 0 -15 -211 -653 7,502 6,624
2026 0 0 0 -221 -673 8,495 7,601
2027 0 0 0 -232 -688 9,487 8,566
2028 0 0 0 -244 -703 10,479 9,532
2029 0 0 0 -256 -728 11,471 10,487
2030 0 0 0 -269 -744 12,463 11,450
2031 0 0 0 -282 -763 13,455 12,410
2032 0 -230 -15 -296 -781 14,447 13,126
2033 0 0 0 -311 -807 15,439 14,321
2034 0 0 0 -326 -827 16,431 15,278
ENPV @12% DR(a)
26,258
EIRR (%)
29%
(a) in 2011 prices but discounted to 2014
Source: Consultant
The ENPV is positive, at Rs 26,258 million.

TA 7600 SRI – Multimodal Transport Project Sri Lanka
Final Report 285
15.5.2 Enderamulla
Table 15.8 shows the cost/benefit flows for an ICD at Enderamulla, following the format
above.
Table 15.8 Enderamulla: Economic Costs and Benefits (Rs. Million) Year Civil Equipment:
Railway
Equipment:
ICD +
Railhead
Recurrent:
Railway
Recurrent:
ICD +
Railhead
Traffic
Benefits
Total
2013 -6,608 0 0 0 0 0 -6,608
2014 -8,432 -442 -2,010 0 0 0 -10,884
2015 0 0 0 -148 -600 3,971 3,223
2016 0 0 -15 -156 -616 4,395 3,608
2017 0 0 0 -165 -640 4,819 4,014
2018 0 0 0 -174 -658 5,243 4,411
2019 0 -62 0 -184 -687 5,668 4,734
2020 -482 -1,082 -1,566 -194 -707 6,092 2,061
2021 0 0 -15 -147 -979 6,516 5,375
2022 0 0 0 -156 -1,008 6,940 5,777
2023 0 0 0 -165 -1,032 7,364 6,167
2024 0 0 -15 -174 -1,058 7,788 6,541
2025 0 0 0 -182 -1,088 8,619 7,349
2026 0 0 0 -191 -1,113 9,450 8,145
2027 0 0 0 -201 -1,139 10,280 8,940
2028 0 0 -188 -211 -1,177 11,111 9,535
2029 0 0 0 -221 -1,213 11,942 10,509
2030 0 0 0 -232 -1,243 12,773 11,298
2031 0 0 -188 -243 -1,276 13,604 11,897
2032 0 -348 0 -255 -1,327 14,434 12,505
2033 0 0 -15 -267 -1,363 15,265 13,620
2034 0 0 0 -280 -1,408 16,096 14,408
ENPV @12% DR(a)
24,354
EIRR (%)
24%
(a) in 2011 prices but discounted to 2014
Source: Consultant
The ENPV is positive, at Rs 24,354 million.

TA 7600 SRI – Multimodal Transport Project Sri Lanka
Final Report 286
15.5.3 Peliyagoda/Telangapata
Table 15.9 shows the cost/benefit flows for an ICD at PelTel , following the format above.
Table 15.9 Peliyagoda/Telangapata: Economic Costs and Benefits (Rs. Million)
Year Civil Equipment:
Railway
Equipment:
ICD +
Railhead
Recurrent:
Railway
Recurrent: ICD
+ Railhead
Traffic
Benefits
Total
2013 -4,239 0 0 0 0 0 -4,239
2014 -7,877 -442 -2,010 0 0 0 -10,329
2015 0 0 0 -137 -598 3,402 2,667
2016 0 0 -15 -145 -614 3,812 3,038
2017 0 0 0 -153 -638 4,222 3,432
2018 0 0 0 -162 -656 4,632 3,815
2019 -6,451 -62 0 -171 -685 5,042 -2,327
2020 -697 -1,082 -1,566 -181 -705 5,452 1,223
2021 0 0 -15 -163 -977 5,862 4,708
2022 0 0 0 -173 -1,006 6,272 5,094
2023 0 0 0 -183 -1,030 6,682 5,470
2024 0 0 -15 -194 -1,056 7,093 5,828
2025 0 0 0 -203 -1,086 7,069 5,780
2026 0 0 0 -214 -1,111 7,045 5,721
2027 0 0 0 -225 -1,137 7,022 5,660
2028 0 0 -188 -236 -1,175 6,998 5,399
2029 0 0 0 -248 -1,211 6,975 5,516
2030 0 0 0 -261 -1,241 6,951 5,450
2031 0 0 -188 -274 -1,274 6,928 5,192
2032 0 -348 0 -288 -1,325 6,904 4,943
2033 0 0 -15 -302 -1,361 6,880 5,202
2034 0 0 0 -318 -1,406 6,857 5,133
ENPV @12% DR(a)
11,893
EIRR (%) 20%
(a) in 2011 prices but discounted to 2014
Source: Consultant
The ENPV is positive, at Rs. 11,893 million.

TA 7600 SRI – Multimodal Transport Project Sri Lanka
Final Report 287
15.5.4 Ratmalana
Table 15.10 shows the cost/benefit flows for an ICD at Ratmalana, following the format
above.
Table 15.10 Ratmalana: Economic Costs and Benefits (Rs. Million)
Year Civil Equipment:
Railway
Equipment:
ICD +
Railhead
Recurrent:
Railway
Recurrent:
ICD +
Railhead
Traffic
Benefits
Total
2013 -15,041 0 0 0 0 0 -15,041
2014 -3,248 -272 -1,776 0 0 0 -5,297
2015 0 0 0 -68 -421 1,000 512
2016 0 0 0 -72 -427 1,273 774
2017 0 0 0 -75 -436 1,547 1,035
2018 0 0 -15 -79 -444 1,820 1,282
2019 0 -23 0 -84 -460 2,093 1,527
2020 -113 -359 -1,739 -88 -469 2,366 -402
2021 0 0 0 -80 -741 2,639 1,818
2022 0 0 0 -84 -752 2,912 2,076
2023 0 0 0 -89 -764 3,185 2,333
2024 0 0 0 -94 -776 3,458 2,589
2025 0 0 0 -98 -787 3,616 2,731
2026 0 0 0 -103 -798 3,774 2,873
2027 0 0 0 -108 -811 3,932 3,013
2028 0 0 0 -113 -824 4,090 3,153
2029 0 0 0 -118 -838 4,248 3,291
2030 0 0 -15 -124 -852 4,405 3,414
2031 0 0 0 -130 -874 4,563 3,559
2032 0 -118 0 -136 -890 4,721 3,577
2033 0 0 0 -143 -906 4,879 3,830
2034 0 0 0 -150 -925 5,037 3,962
ENPV @12% DR(a)
-9,663
EIRR (%)
7%
(a) in 2011 prices but discounted to 2014
Source: Consultant
The ENPV is negative, at Rs. -9,663 million.

TA 7600 SRI – Multimodal Transport Project Sri Lanka
Final Report 288
15.5.5 Veyangoda + Ratmalana
Table 15.11 shows the cost/benefit flows for an ICD at Veyangoda combined with an ICD
at Ratmalana, following the format above.
Table 15.11 Veyangoda + Ratmalana: Economic Costs and Benefits (Rs. Million)
Year Civil Equipment:
Railway
Equipment:
ICD +
Railhead
Recurrent:
Railway
Recurrent:
ICD +
Railhead
Traffic
Benefits
Total
2013 -17,641 0 0 0 0 0 -17,641
2014 -7,206 -567 -3,345 0 0 0 -11,118
2015 0 0 -15 -189 -789 3,710 2,717
2016 0 0 0 -199 -810 4,405 3,396
2017 0 0 0 -211 -827 5,101 4,063
2018 0 0 0 -222 -844 5,796 4,730
2019 0 -51 0 -235 -861 6,491 5,344
2020 -366 -979 -1,739 -248 -881 7,187 2,973
2021 0 0 0 -249 -1,226 7,882 6,407
2022 0 0 -15 -263 -1,248 8,578 7,052
2023 0 0 0 -278 -1,278 9,273 7,717
2024 0 0 0 -295 -1,302 9,969 8,372
2025 0 0 0 -309 -1,325 11,119 9,484
2026 0 0 0 -324 -1,348 12,269 10,596
2027 0 0 -15 -340 -1,374 13,418 11,689
2028 0 0 0 -357 -1,407 14,568 12,804
2029 0 0 0 -374 -1,445 15,718 13,899
2030 0 0 0 -393 -1,474 16,868 15,002
2031 0 0 -15 -412 -1,505 18,018 16,086
2032 0 -348 0 -432 -1,544 19,168 16,845
2033 0 0 0 -454 -1,578 20,318 18,286
2034 0 0 0 -476 -1,614 21,468 19,378
ENPV @12% DR(a)
20,315
EIRR (%)
18%
(a) in 2011 prices but discounted to 2014
Source: Consultant
The ENPV is positive, at Rs. 20,315 million.

TA 7600 SRI – Multimodal Transport Project Sri Lanka
Final Report 289
15.5.6 Enderamulla + Ratmalana
Table 15.12 shows the cost/benefit flows for an ICD at Enderamulla combined with an ICD
at Ratmalana, following the format above.
Table 15.12 Enderamulla + Ratmalana: Economic Costs and Benefits (Rs. Million)
Year Civil Equipment:
Railway
Equipment:
ICD +
Railhead
Recurrent:
Railway
Recurrent:
ICD +
Railhead
Traffic
Benefits
Total
2013 -20,421 0 0 0 0 0 -20,421
2014 -10,302 -715 -3,574 0 0 0 -14,590
2015 0 0 0 -216 -942 4,972 3,813
2016 0 0 -15 -228 -964 5,669 4,461
2017 0 0 0 -241 -995 6,366 5,130
2018 0 0 0 -254 -1,020 7,063 5,789
2019 0 -85 0 -268 -1,057 7,760 6,350
2020 -595 -1,440 -3,147 -282 -1,086 8,458 1,907
2021 0 0 0 -227 -1,597 9,155 7,331
2022 0 0 0 -240 -1,629 9,852 7,983
2023 0 0 -15 -253 -1,664 10,549 8,617
2024 0 0 0 -268 -1,707 11,246 9,271
2025 0 0 0 -281 -1,740 12,235 10,214
2026 0 0 -15 -294 -1,775 13,224 11,140
2027 0 0 0 -309 -1,819 14,212 12,085
2028 0 0 -188 -324 -1,868 15,201 12,821
2029 0 0 0 -339 -1,917 16,190 13,934
2030 0 0 0 -356 -1,960 17,178 14,863
2031 0 0 -188 -373 -2,006 18,167 15,600
2032 0 -466 0 -391 -2,071 19,156 16,227
2033 0 0 -15 -410 -2,121 20,144 17,598
2034 0 0 0 -430 -2,182 21,133 18,521
ENPV @12% DR(a)
18,536
EIRR (%)
17%
(a) in 2011 prices but discounted to 2014
Source: Consultant
The ENPV is positive, at Rs 18,536 million.

TA 7600 SRI – Multimodal Transport Project Sri Lanka
Final Report 290
15.5.7 PelTel + Ratmalana
Table 15.13 shows the cost/benefit flows for an ICD at Peliyagoda/Telangapata combined
with an ICD at Ratmalana, following the format above.
Table 15.13 PelTel + Ratmalana: Economic Costs and Benefits (Rs. Million)
Year Civil Equipment:
Railway
Equipment:
ICD +
Railhead
Recurrent:
Railway
Recurrent:
ICD +
Railhead
Traffic
Benefits
Total
2013 -18,052 0 0 0 0 0 -18,052
2014 -9,747 -715 -3,574 0 0 0 -14,035
2015 0 0 0 -205 -940 4,402 3,257
2016 0 0 -15 -216 -962 5,086 3,892
2017 0 0 0 -229 -993 5,769 4,547
2018 0 0 0 -241 -1,018 6,452 5,193
2019 -6,451 -85 0 -255 -1,055 7,135 -711
2020 -809 -1,440 -3,147 -269 -1,084 7,818 1,070
2021 0 0 0 -242 -1,595 8,501 6,664
2022 0 0 0 -257 -1,627 9,185 7,301
2023 0 0 -15 -272 -1,662 9,868 7,919
2024 0 0 0 -287 -1,705 10,551 8,558
2025 0 0 0 -302 -1,738 10,685 8,645
2026 0 0 -15 -317 -1,773 10,819 8,715
2027 0 0 0 -333 -1,817 10,954 8,804
2028 0 0 -188 -349 -1,866 11,088 8,685
2029 0 0 0 -367 -1,915 11,222 8,941
2030 0 0 0 -385 -1,958 11,356 9,014
2031 0 0 -188 -404 -2,004 11,491 8,895
2032 0 -466 0 -424 -2,069 11,625 8,666
2033 0 0 -15 -445 -2,119 11,759 9,180
2034 0 0 0 -467 -2,180 11,893 9,246
ENPV @12% DR(a)
6,075
EIRR (%) 14%
(a) in 2011 prices but discounted to 2014
Source: Consultant
The ENPV is positive, at Rs 6,075 million.
15.6 Interpretation
Table 15.14 below brings together the results for all seven variants shown above.

TA 7600 SRI – Multimodal Transport Project Sri Lanka
Final Report 291
Table 15.14 Results Summary - 1
ENPV EIRR
(Rs. Mil)
Veyangoda 26,258 29%
Enderamulla 24,354 24%
PelTel 11,893 20%
Ratmalana -9,663 7%
Veyangoda + Ratmalana 20,315 18%
Enderamulla + Ratmalana 18,536 17%
PelTel + Ratmalana 6,075 14%
Source: Consultant
The ADB’s threshold for economic viability is an EIRR of 12%. From the above table it can
be seen that the Ratmalana project is not viable and can be rejected on economic
grounds. All other projects are economically viable.
The question, in repect of Veyangoda, Enderamulla or PelTel is: does adding Ratmalana
benefit the economy. This can be resolved by:
• calculating the incremental cost and benefit flows resulting from adding the
incremental project, in this case Ratmalana, and discounting them to find out whether
there is a net benefit to the economy; or
• where NPVs have been calculated using a common discount rate and a common base
year, by simply subtracting NPVs to find the NPV of the incremental investment.
The calculations are shown below. In all three cases, adding Ratmalana has a negative
NPV. Thus Veyangoda + Ratmalana, Enderamulla + Ratmalana and PelTel + Ratmalana
can all be rejected on economic grounds.
Table 15.15 Results Summary - 2
ENPV (Rs. Mil)
Veyangoda Enderamulla PelTel
Combined Project 20,315 18,536 6,075
Single Project 26,258 24,354 11,893
Net Benefit from adding Ratmalana -5,943 -5,818 -5,818
Source: Consultant
The remaining viable projects are for potential ICDs at Veyangoda, Enderamulla and
PelTel. These are alternatives in that to a large extent, they serve the same traffic: it
would not make sense to implement more than one of them unless no single site had the
capacity to cater for the long term demand. While the Consultant recognises that the
choice of site will not be based purely on economic criteria, it may be instructive to rank
these three projects. It is generally accepted that the appropriate way to do this, given
that the supply of capital is usually limited, is to rank projects by ENPV/C: Economic Net
Present Value divided by capital cost. In this particular case, where capital costs are
spread over a number of years, the denominator is the present value of capital costs,
leading to the ranking shown below.

TA 7600 SRI – Multimodal Transport Project Sri Lanka
Final Report 292
Table 15.16 Project Ranking
Veyangoda Enderamulla PelTel
ENPV (Rs.mil) 26,258 24,354 11,893
PV of Capital costs (=C) 12,210 20,043 20,604
NPV/C 2.2 1.2 0.6
Ranking 1 2 3
Source: Consultant
Thus, in economic terms, only three projects are viable: those for stand-alone ICDs at
Veyangoda, Enderamulla and PelTel. Based on the NPV/C ratio, the economic ranking is
(1) Veyangoda (2) Enderamulla and (3) PelTel.
15.7 Risk and Sensitivity
15.7.1 Construction and M&E
The Consultant has tested the sensitivity of the three viable projects (ICDs at Veyangoda,
Enderamulla and Pel/Tel) to variations of +/- 10% in Construction and M&E costs.
15.7.2 Traffic Benefits
The projects under discussion display complex costs, with many different inputs. The
benefit side is much simpler, with all quantifiable benefits coming from traffic benefits.
As described in Chapter 16, traffic benefits consist of two closely related components
resulting from a single model and single costing exercises. Clearly, because they are the
only source of benefits, traffic benefits are particularly important, and the sensitivity of
the project NPV to this benefit is particularly important.
As explained in Chapter 16, road vehicle cost savings are particularly difficult to value. In
the Consultant’s opinion, there are two other sources of uncertainty in respect of traffic
benefits, which are the uncertainty in the traffic modelling process itself, and the
uncertainty attached to the consultant’s ICD throughput forecasts. The uncertainty
attached to the ICD throughput forecasts is discussed in the next sub-section. The
uncertainty in the modelling process is difficult to quantify, but has been combined with
vehicle time savings by adopting high and low values relative to the central value +/-20%.
15.7.3 O&M Costs
The Consultant has tested the sensitivity of the three viable projects (ICDs at Veyangoda,
Enderamulla and Pel/Tel) to variations of +/- 10% in Construction and O&M costs.
15.7.4 The SERF
The Consultant has considered testing the sensitivity of the three viable projects (ICDs at
Veyangoda, Enderamulla and Pel/Tel) to variations in the Shadow Exchange Rate Factor
(SERF). However, it was decided not to do this because:
• Bringing out the impact of the SERF in a way which would permit variations to be
tested would require extensive and time consuming reworking of the Consultant’s

TA 7600 SRI – Multimodal Transport Project Sri Lanka
Final Report 293
spreadsheets which, in view of the argument presented below, would be unlikely to
be justified by the output; and
• Both costs and revenues include significant proportions of traded items, here meaning
imports. The project is not one of those, such as a manufacturing project using local
inputs to provide a wholly exported output, or using imported inputs to provide a
locally consumed output, which are likely to be highly sensitive to variations in the
SERF. The Consultant is therefore confident that the results will not be highly
sensitive to the SERF.
15.7.5 Sensitivity Results
Tables 15.17A to 15.17C show the Sensitivity Results.
Table 15.17A Sensitivity Results for Veyangoda
Item Change ENPV (Rs
million)
EIRR (%) Sensitivity
Indicator
Switching
Value (%)
Base Case 26,258 29%
Construction and M&E 10% 25,466 28% -30% 331%
Construction and M&E -10% 27,051 30%
Traffic Benefits 10% 30,657 31%
167% -60% Traffic Benefits -10% 21,860 26%
Traffic Benefits 20% 35,055 33%
Traffic Benefits -20% 17,462 24%
O&M Costs 10% 25,707 28% -21% 477%
O&M Costs -10% 26,810 29%
Source: Consultant
Table 15.17B Sensitivity Results for Enderamulla
Item Change ENPV (Rs
million)
EIRR (%) Sensitivity
Indicator
Switching
Value (%)
Base Case 24,354 24%
Construction and M&E 10% 23,090 23% -52% 193%
Construction and M&E -10% 25,618 25%
Traffic Benefits 10% 29,567 26%
214%
-47%
Traffic Benefits -10% 19,141 22%
Traffic Benefits 20% 34,779 28%
Traffic Benefits -20% 13,929 19%
O&M Costs 10% 23,581 24% -32% 315%
O&M Costs -10% 25,127 24%
Source: Consultant

TA 7600 SRI – Multimodal Transport Project Sri Lanka
Final Report 294
Table 15.17C Sensitivity Results for PelTel
Item Change ENPV (Rs
million)
EIRR (%) Sensitivity
Indicator
Switching
Value (%)
Base Case 11,893 20%
Construction and M&E 10% 10,673 19% -102% 98%
Construction and M&E -10% 13,112 22%
Traffic Benefits 10% 15,916 23%
333% -30% Traffic Benefits -10% 7,869 18%
Traffic Benefits 20% 19,939 26%
Traffic Benefits -20% 3,846 15%
O&M Costs 10% 11,119 20% -65% 154%
O&M Costs -10% 12,666 21%
Source: Consultant
Even at the ± 10% level, traffic benefits most influence the ENPVs and EIRRs. At the more
realistic ± 20% level, traffic benefits are the dominant influence. In all cases, the ENPVs
and EIRRs remain above the ADB threshold of 12%. This demonstrates that each of
Veyangoda, Enderamulla and PelTel is robustly economically viable.
15.8 Poverty and Benefits Distribution
15.8.1 Theory
Historically, the main test of viability for ADB projects was an economic appraisal, which
broadly answered the question: does the project make a positive contribution to the
national economy? Over time the hurdles to be cleared by projects for which ADB
financing is sought have increased in number. In particular:
• Project impacts on the society and on the environment have been taken into
account; and
• Sustainability, in particular financial sustainability, has become important, as was
necessary. A project which shows a positive economic net present value, but
collapses because of financial problems, is of no use.
The ADB has been concerned with poverty reduction since its inception. However, in
1999, the Bank adopted poverty reduction as its overarching goal and announced its
Poverty Reduction Strategy (PRS) to achieve this end. Given this overarching goal, it is
important not only that a project be economically viable, financially sustainable and
environmentally and socially acceptable but also that its impact on the poor be known.
In this respect, both the ADB's Guidelines for the Economic Analysis of Projects (in
Chapter XIV and Appendices 25 and 26) and the ADB's Handbook for Integrating Poverty
Impact Assessment in the Economic Analysis of Projects present advice on how to
estimate the distribution of project net benefits among stakeholders and how to calculate
the Poverty Impact ratio.

TA 7600 SRI – Multimodal Transport Project Sri Lanka
Final Report 295
As recognised in the Consultant’s Poverty and Social Assessment Report, the project
under consideration is not a strongly pro-poor project. The main beneficiaries will be the
shippers and receivers of containerised cargo. However, the poor may benefit if:
• As a result of improved transport, the businesses for which they work become
more competitive;
• They are included in the workforces which construct and operate the dry port and
associated works; or
• As members of the Colombo general public, they benefit from reduced congestion
and pollution.
Considering poor members of the construction and operational workforces, the benefits
to them will be revealed through shadow pricing, but will be taken into the poverty
impact ratio calculation, as discussed below.
Table 15.18 and Table 15.19 below are taken from the 2010 Statistical Abstract on the
Department of Census and Statistics website. The percentages in Table 15.18 are a little
higher than those in Table 15.19, probably because poor households tend to be larger
than the average household.
The overall picture is one of stagnation between 1990-91 and 1995-96, and then of
retreating poverty thereafter. Furthermore, the last year for which data is available
(2006-7) is almost five years ago. Finally the first year of operation of the ICDs is expected
to be 2015, or 8½ years after the date of the most recent data, and will continue for a
further 20 years. Thus even the most recent data is only a poor guide to poverty over the
life of the project.
The Consultant has assumed that the reduction in the poverty level will continue. This
assumption has been taken into account in the analysis in the next section.

TA 7600 SRI – Multimodal Transport Project Sri Lanka
Final Report 296
Table 15.18 Poverty Headcount Ratio by District
District
Survey Period
1990-91 1995-96 2002 2006-07
(%) (%) (%) (%)
Sri Lanka 26.1 28.8 22.7 15.2
Colombo 16 12 6 5
Gampaha 15 14 11 9
Kalutara 32 29 20 13
Kandy 36 37 25 17
Matale 29 42 30 19
Nuwara Eliya 20 32 23 34
Galle 30 32 26 14
Matara 29 35 27 15
Hambantota 32 31 32 13
Kurunegala 27 26 25 15
Puttalam 22 31 31 13
Anuradhapura 24 27 20 15
Polonnaruwa 24 20 24 13
Badulla 31 41 37 24
Moneragala 34 56 37 33
Ratnapura 31 46 34 27
Kegalle 31 36 32 21
Note - Northern and Eastern Provinces are excluded.
Source - Household Income and Expenditure Survey 1990-91, 1995-96, 2002, 2006-07
Department of Census and Statistics

TA 7600 SRI – Multimodal Transport Project Sri Lanka
Final Report 297
Table 15.19 Percentage of Poor Households Based on the Official Poverty Line by
District
District
Survey Period
1990-91 1995-96 2002 2006-07
(%) (%) (%) (%)
Sri Lanka 21.8 24.3 19.2 12.6
Colombo 13.1 8.8 5 3.9
Gampaha 11.7 11.3 9.2 7.2
Kalutara 27 24.6 17.7 10.3
Kandy 30.9 32.7 20.9 13.9
Matale 24.3 36.8 24.5 15.7
Nuwara Eliya 15.6 25.9 18.2 27.5
Galle 25 25.5 21.7 10.7
Matara 23.3 29.5 23.2 11.7
Hambantota 26.3 26.2 27.8 10.5
Kurunegala 22.8 22.6 21.2 12.9
Puttalam 18.6 25.8 24.5 10.6
Anuradhapura 20.1 21.9 17.2 12.7
Polonnaruwa 21.2 17.1 20.1 10
Badulla 26.8 35.8 31.5 21
Moneragala 27.4 48.4 32.4 29.2
Ratnapura 26.4 40 30.1 21.5
Kegalle 27.3 31.7 27.5 18.4 Note - Northern and Eastern Provinces are excluded.
Source - Household Income and Expenditure Survey 1990-91, 1995-96, 2002, 2006-07
Department of Census and Statistics
15.8.2 Poverty Impact Ratio
This Section estimates the distribution of the project benefits between the various
stakeholders, and calculates the project’s Poverty Impact Ratio. The reader should note
that:
• All financial and economic numbers in Tables 15.20 - 15.22 are present values, at
2011 prices, discounted to 2014;
• Both financial and economic figures include only those activities which have been
included in the economic appraisal in accordance with Table 14.1. This primarily
means that, except for some initial costs, CFS operation is excluded. Revenue
from CFS operation is also excluded (44.7% of total revenue). It follows that
where activities are simply transferred from one location to another, as in CFS
activity being transferred from the port to an ICD, no additional jobs are created;
• Traffic benefits include a reduction in the number of trucks employed in carrying
containers and container cargo, and a saving in time for other vehicles, including
both freight and goods vehicles. It has been assumed that vehicle owners are not
able to make super-normal profits except in the very short term so that all savings
accrue to vehicle users, including both passengers and cargo owners;
• 55% of the traffic benefits have been estimated to be received by freight
transport, with the remainder being received by passenger transport;

TA 7600 SRI – Multimodal Transport Project Sri Lanka
Final Report 298
• To a large extent, the sources of the ICD’s revenue are the same people or firms as
benefit from savings in road freight transport costs;
• Unskilled construction labour would benefit from the project, and all such
labourers have been assumed to be poor. From the assumptions made in shadow
pricing civil works and railway construction costs, both assumed to include 25%
unskilled labour with an SPF of 0.9, it follows that 2.5% of these costs is benefit to
unskilled, and hence poor, labour. Further, because they are shadow priced at
unity, skilled workers do not feature in the difference between economic and
financial costs;
• Operating labour is assumed not to benefit. This is because the exclusion of the
CFS activity from the appraisal has removed the element of unskilled labour,
leaving only skilled workers, whose wage and/or salary rates are assumed not to
be distorted;
• The general public is also shown, but again without benefits. In practice they
would benefit in two ways, as passengers, already included as such in the table,
and as beneficiaries of reductions in vehicle emissions, which have been
recognised as being real but unquantifiable economically;
• The entity, firm or corporation owning the ICD has been shown as a separate
stakeholder, though it may in practice be part of the government. It has been
assumed that it earns normal profit, after taking risk into account; and
• The proportion of the benefits to freight transport users going to the poor is
difficult to determine and doing so would require a detailed study of the various
industries generating demand for container transport. However a figure of 20%
has been adopted as reasonable.
As shown in Table 15.18, the proportions of poor people in Colombo and Gampaha in
2006/7 were 5% and 9% respectively making them, with the probable exception of the
areas then experiencing war, the least poor districts in Sri Lanka. Most probably, the
extent of poverty has since declined further, but the Consultant has no data to confirm
that. Furthermore, as poor people are probably not large users of passenger transport
and have low values of time, it is likely that their participation in the benefits to passenger
transport users is small. A figure of 0.05 has been assumed.
Below are shown analyses of the distribution of benefits for Veyangoda, Enderamulla and
PelTel.

TA 7600 SRI – Multimodal Transport Project Sri Lanka
Final Report 299
Table 15.20 Distribution of Benefits: Veyangoda (Rs million)
A. Distribution of Project
Effects
Financial
Returns
Economic
Returns Difference
Freight
Transport
Users
Passenger
Transport
Users Labour
General
Public
Mananging
Owning
Entity
Government/
Economy Total
Capital Cost -9,073 -12,210 -3,136 141 -3,278
O&M Cost -5,643 -5,513 131 131
Traffic Benefits 43,981 43,981 24,189 19,791
Revenues 10,026 -10,026 -10,026
Total -4,691 26,258 30,950 14,164 19,791 210 0 0 -3,147
B. Poverty Impact Ratio
Beneficiaries
14,164 19,791 210 0 0 -3,147
NEB - NFB -4,691
Financial Return 14,164 19,791 210 0 -4,691 -3,147
Benefits 0.2 0.05 1 0 0.1
Proportion to poor
2,833 990 210 -315 3,718
Benefits to poor 14,164 19,791 210 0 0 -3,147
Poverty Impact Ratio = Benefits to poor/NPV = 0.14158
Source: Consultant

TA 7600 SRI – Multimodal Transport Project Sri Lanka
Final Report 300
Table 15.21 Distribution of Benefits: Enderamulla (Rs million)
A. Distribution of Project
Effects
Financial
Returns
Economic
Returns Difference
Freight
Transport
Users
Passenger
Transport
Users Labour
General
Public
Managing
Owning
Entity
Government/
Economy Total
Capital Cost -14,001 -20,043 -6,042 225 -6,267
O&M Cost -6,625 -7,729 -1,104 -1,104
Traffic Benefits 52,125 52,125 28,669 23,456
Revenues 18,767 -18,767 -18,767
Total -1,859 24,354 26,213 9,902 23,456 210 0 0 -7,371
B. Poverty Impact Ratio
Beneficiaries
NEB - NFB 9,902 23,456 210 0 0 -7,371
Financial Return -1,859
Benefits 9,902 23,456 210 0 -1,859 -7,371
Proportion to poor
0.2 0.05 1 0 0.1
Benefits to poor 1,980 1,173 210 -737 2,626
Poverty Impact Ratio = Benefits to poor/NPV = 0.10784
Source: Consultant

TA 7600 SRI – Multimodal Transport Project Sri Lanka
Final Report 301
Table 15.22 Distribution of Benefits: PelTel (Rs million)
A. Distribution of Project
Effects
Financial
Returns
Economic
Returns Difference
Freight
Transport
Users
Passenger
Transport
Users Labour
General
Public
Mananging
Owning
Entity
Government/
Economy Total
Capital Cost -15,584 -20,603 -5,020 210 -5,229
O&M Cost -7,274 -7,738 -464 -464
Traffic Benefits 40,234 40,234 22,129 18,105
Revenues 17,736 -17,736 -17,736
Total -5,122 11,893 17,015 4,393 18,105 210 0 0 -5,693
B. Poverty Impact Ratio
Beneficiaries
NEB - NFB 4,393 18,105 210 0 0 -5,693
Financial Return
-5,122
Benefits 4,393 18,105 210 0 -5,122 -5,693
Proportion to poor
0.2 0.05 1
0 0.1
Benefits to poor 879 905 210
-569 1,425
Poverty Impact Ratio = Benefits to poor/NPV = 0.11979
Source: Consultant

TA 7600 SRI – Multimodal Transport Project Sri Lanka
Final Report 302
The reader may note that the Financial NPV is shown as negative. This does not imply that
the Managing/Owning entity’s financial expectations will not be met. More likely, it is a
consequence of an acceptable financial return being lower than the 12%, in real terms,
used as a discount rate and of profitable CFS activity being excluded from the appraisal.
The Poverty impact ratios are 14.2% for Veyangoda, 10.8% for Enderamulla and 12.0% for
for PelTel.
15.9 Reductions in Noxious Emissions
15.9.1 General
The consultant is required to quantify the environmental benefits and costs of
implementing the projects, rather than road use, to cater to demand. In practice few
environmental costs and benefits can be usefully expressed in economic terms, and most
negative environmental benefits are better addressed through ameliorative measures
than through being included in the economic appraisal. This section addresses the likely
consequences of the project in respect of noxious emissions from the consumption of
fuels.
In practice three energy sources are of relevance:
• Diesel fuel, consumed in trucks and some other vehicles, the railway and the ICDs;
• Petrol, consumed by some vehicles which may benefit from a reduction in
congestion; and
• Electricity, also consumed at the ICD.
In practice there are three steps to assessing emissions:
• Quantifying the amount of energy used from each source;
• Assessing the emissions consequences per unit of energy consumed; and
• Bringing the two together to assess the emissions consequences.
This analysis focuses on Enderamulla as a model, and extends the findings to Veyangoda
and PelTel candidate ICD sites. Furthermore, because the focus is on the balance
between with-project and without project, which is not likely to vary much from year to
year, the calculations have been done for 2015.
15.9.2 Electricity
The Consultant estimates that the ICD’s would each consume about 51,900 kWh per Ha
year for lighting and general electrical purposes. After taking account of transmission
losses (7%) and generation efficiency (99%), this is equivalent to around 56,000KWh per
Ha year at the power station prime mover.
Sri Lanka is understood to use coal, diesel and renewable power, mostly hydro, to
generate electricity, but it is unlikely that hydro power is the marginal supplier, while no

TA 7600 SRI – Multimodal Transport Project Sri Lanka
Final Report 303
further coal fired power stations will be commissioned. Assuming that the marginal
supplier is diesel power and applying a realistic specific fuel consumption of 250 g/kWh,
gives a requirement for 14,000 kg (15,730 l) per Ha year, or 236,000 l at Enderamulla in
2015.
15.9.3 Other Fuel Consumption and Savings
Diesel fuel will also be consumed by the railway, the port railhead and the ICD itself, in
the course of operations, while diesel fuel will be saved as a result of displacing trucks.
Considering the above, all for Enderamulla in 2015:
• The port railhead is estimated to consume 1,680,000 litres of diesel fuel in 2015;
• The ICD is also expected to consume 1,680,000 litres of diesel fuel in 2015; and
• Fuel is expected to account for 27.7% of railway variable costs, or 530,000 l of
diesel fuel in 2015.
Considering fuel savings, the Consultant has estimated that implementing the project, in
2015 will save 51,519 truck km per day, with a consequent saving in fuel of 18,262 litres
per day, equivalent to 6,660,000 litres per year.
In addition, traffic will travel slightly more quickly and slightly more fuel efficiently, saving
14,668 litres of diesel and 1,179 litres of petrol per day, equivalent to 430,000 litres of
petrol and 5,350,000 litres of diesel per year.
Table 15.23 Fuel Balance for Enderamulla, 2015
Project Fuel Consumption: Diesel Litres
Electricity Generation 236,000
Port Railhead 1,680,000
Enderamulla ICD 1,680,000
Railway 530,000
4,126,000
Fuel Savings: Diesel
Truck Removal 6,660,000
Decongestion 5,350,000
12,010,000
Fuel Savings: Petrol
Decongestion 430,000
Net Savings: Diesel 7,884,000
Net Savings: Petrol 430,000
Source: Consultant.
15.9.4 Emissions
The use of leaded-fuel for road vehicles has been banned in Sri Lanka since 1999.
The consultant has consulted a number of sources and has found data concerning the
emissions from petrol and diesel engine road vehicles. The data found vary between
sources, but overall, they give a fairly consistent picture, as shown below.

TA 7600 SRI – Multimodal Transport Project Sri Lanka
Final Report 304
Table 15.24 Emissions by Engine Type (g/l)
Pollutant Petrol Diesel
Hydrocarbons 46-88 14
Carbon monoxide (CO) 200-1,000 15-22
Carbon dioxide (CO2) 2,200-2,300 2,550-2,600
Nitrous oxide (NOx) 3-20 10-40
Particulates 3-6 5
Sulphur Dioxide (SO2) 0.2 0.5
Source: Consultant, various
The impact of some emissions is not well understood, for example in connection with
global warming, while the impact of others is very time and location specific. It is thus not
realistic to attempt to value emissions in monetary terms for inclusion in the economic
appraisal. It is to be noted though that the project would save some 8.3 million litres of
fuel in its first year of operation, if implemented at Enderamulla. Savings in other years
and at other sites can be assumed to be proportional, and so to increase over time.
While the cost of the fuel has been taken into the economic appraisal, the reduction in
emissions is a large and growing, but unquantifiable externality.
15.10 Other Benefits
There are two other types of benefit that could be evaluated in if sufficient data were
available.
15.10.1 Road maintenance cost savings
There would be savings in road maintenance costs. However, while road maintenance
cost data is available, we would need to distinguish between road maintenance costs
attributable to weather effects and those attributable to traffic effects.
15.10.2 Safety benefits
There would potentially be safety benefits related to accident savings – reduced fatalities,
serious injuries and slight injuries. However, while accident statistics for road and rail are
available, the rail statistics relate mainly to the current passenger services. Accidents on a
freight railway are not known but would be at a lower level because of the reduced
human involvement.

TA 7600 SRI – Multimodal Transport Project Sri Lanka
Final Report 305
16 Traffic modeling and decongestion benefits
16.1 Introduction
Several readers of the Draft Final Report commented on the fact that the objective of
reducing congestion on Colombo’s road outside the port, and the computation of
decongestion benefits, had not been discussed. In fact, this topic had been discussed but
was well hidden inside Chapter 15 of the DFR. In the Final Report, we have decided to
give more prominence to the topic by giving it a chapter of its own and also to describe
the traffic observations and traffic modeling processes that preceded the computations.
Chapter 16 contains the following sections:
• Section 16.2 summarises the two transport models used and their roles;
• Section 16.3 presents the Short Term Do Nothing Analysis, based on traffic
observations made at Ingurukade junction in November 2011;
• Section 16.4 gives a full description of the University of Moratuwa’s Transplan
traffic model, used in the analysis of future year scenarios;
• Section 16.5 describes the three future year scenarios – 2015, 2024, 2034 – in
terms of key inputs such as GDP growth, regional development etc;
• Section 16.6 tabulates the traffic model outputs for 2015, 2024 and 2034. These
are the physical quantities prior to monetization;
• Section 16.7 deals with vehicle characteristics and unit cost savings. It
synthesises two road user models, one based on local haulage data, the other
based on the World Bank program HDM4. Weighted average values per truck
km saved and per vehicle hour saved; and
• Section 16.8 applies these weighted average values to traffic model outputs to
derive the truck savings (freight trucks removed from the road) and
decongestion benefits (vehicles remaining on the road but travelling faster).
The exposition in Sections 16.6 to 16.8 is detailed but all the calculations are reported in
chronological order.
16.2 Types of transport model
16.2.1 Multi-modal price based competition model
Two types of model have been used during this study. The first is a simple spreadsheet
model used in pricing and demand forecasting. It is a multi-modal price based model. The
way it works is that there is a demand forecast for each of the four ICDs under
consideration and a price based logit model representing the competition between road
only journeys and rail/road journeys via the ICD. The price of journeys by road has been
estimated by fitting a relationship to real data. The pricing of the rail portion of the
journeys has been adjusted by trial and error to yield the required overall ICD throughput
for which the design has been created. The details appear in Chapter 4. Such a model is
an aid to financial analysis, not economic analysis.

TA 7600 SRI – Multimodal Transport Project Sri Lanka
Final Report 306
16.2.2 Traffic model including representation of congestion
In economic analysis, we have to compare Do Something scenarios, each of which
includes the construction and operation of one or two ICD sites, with either a Do Nothing
scenario or a Do Minimum scenario. A Do Nothing scenario is viable only for a few years.
There is already significant queuing at the Ingurukade Junction on the Port Access Road
approach, coming from Colombo Port gate 6, the gate for laden containers.
In this chapter, we first analyse the probable short term outcome of a Do Nothing
scenario over the next few years, by making use of data collected at the Ingunkade
Junction and our import/export growth forecast.
In the longer term, we need to recognize two factors. Firstly, if absolutely nothing is done,
increased queuing delays at Ingurukade junction would eventually lead to suppressed
import/export demand. The Sri Lanka authorities would not tolerate this. Secondly, there
are other measures that can be taken to relieve congestion and our project is likely to be
one of a number of measures implemented. We need to define a sensible Do Minimum
(base) scenario and use a traffic model to aid our analysis and help us to compute
decongestion benefits.
16.3 Short term Do Nothing analysis
A programme of traffic counts and observations was undertaken. There were
observations at six sites; these are included in a separately bound Traffic Counts report.
The first five sites were potential junctions where ICD site access roads connect to main
roads. The sixth site was the Ingurukade Junction, and the observations recorded on 22nd
November 2011 were:
• Classified counts into and out of the junction on the Port Access Road approach
between 06:00 and 19:00 in quarter hour intervals. Hourly counts have been
computed from these;
• Traffic signal timings (cycle time and red/green alternation) at the junction on the
Port Access Road approach;
• Times of day when there was no queue on the Port Access Road approach; and
• Times of day when there was a policeman on duty overriding the traffic signals.
Summaries of this data appear below. Figure 16.1 shows the traffic flow on the approach,
with the heaviest flows in the afternoon.

TA 7600 SRI – Multimodal Transport Project Sri Lanka
Final Report 307
Figure 16.1 Traffic flow on Port Access Road approach to Ingunkade junction
Table 16.1 shows the times when the junction was controlled by a policeman, so that the
normal green times and cycle time of the traffic signals were overridden.
Table 16.1 Times of day of police control at Ingurukade junction
Period Start time End time
1 06:53 09:11
2 13:34 14:10
3 14:17 14:30
4 16:28 16:40
5 17:00 18:30
Source: Traffic survey 22nd
November 2011
There were only four hours when there was no police control. Details of the signals cycles
during these four hours are shown in Table 16.2. As can be seen, the Port Access Road
approach was allocated only a small portion of the cycle time, which is why the flows
across the stop line were so low. Between 10:00 and 12:00, the flow crossing the stop line
averaged 130 vehicles per hour and the green time / cycle time ratio averaged 0.037,
indicating a saturation flow of at least 3,500 vehicles per hour; the percentage of goods
vehicles was 55%. In the hour beginning 15:00, flow across the stop line was 175 vehicles
per hour and the green time / cycle time ratio was 0.072, indicating a saturation flow of at
least 2,400 vehicles per hour; the proportion of goods vehicles was 68%. These saturation
flows are plausible for two traffic lanes, as on the Port Access Road approach.
Table 16.2 Typical green times and cycle times when not under police control
Hour
beginning
Number of
cycles
Green time
(seconds)
Red time
(seconds)
Cycle time
(seconds)
Ratio
green/cycle
10:00 20 6.05 170.00 176.05 0.034
11:00 21 7.24 168.76 176.00 0.041
12:00 21 6.33 168.43 174.76 0.036
15:00 20 12.75 165.35 178.10 0.072
Source: Traffic survey 22nd
November 2011
0
50
100
150
200
250
Flo
w in
ve
hic
les
pe
r h
ou
r
Time (24-hour)
Traffic flow on Port Access Road approach
Traffic flow

TA 7600 SRI – Multimodal Transport Project Sri Lanka
Final Report 308
Flows crossing the stop line are supply flows. When demand flow on the approach
exceeds supply flow, a queue built up; when it is less, the queue diminishes. A record was
made of the times when there was no queue on the approach, each occurrence being
towards the end of a green period and the start of the following red period. As an
indicator, the number of cycles with no queue for part of the cycle has been compared
with the overall number of cycles, within each interval. In Table 16.3, the unshaded rows
are hours when there was no police control; the shaded rows are hours when there was
police control at least part of the time. It is clear that traffic volume and time of day were
the important factors rather than the presence or absence of police control. After 14:00
flows were greater (see Figure 16.1) and continuous queuing was the norm.
Table 16.3 Incidence of no queue on the Port Access Road approach
Start time End time Number of
cycles
Number of
cycles with
no residual
queue
Percentage of
cycles with
no residual
queue
06:30 07:00 9 8 89%
07:00 08:00 19 14 74%
08:00 09:00 18 11 61%
09:00 10:00 19 17 89%
10:00 11:00 20 18 90%
11:00 12:00 21 14 67%
12:00 13:00 21 14 67%
13:00 14:00 21 10 48%
14:00 15:00 22 0 0%
15:00 16:00 20 3 15%
16:00 17:00 20 3 15%
17:00 18:00 20 1 5%
18:00 18:30 9 1 11%
Source: Traffic survey 22nd
November 2011
The queuing problems on the Port Access Road Approach to Ingurukade junction are
clearly soluble by allocating a greater proportion of the cycle time to the green time from
that approach. That does not seem difficult. To cope with the resultant reduction of green
time on other approaches, a variety of measures are possible, ranging from area wide
traffic management schemes to reduce non-port traffic going through the junction to
increasing the capacity of Ingurukade junction.
16.4 The University of Moratuwa traffic model
From the above analysis of the situation on the Port Access Road approach to Ingurukade
junction, it is clear that the Do Nothing hypothesis – steadily increasing import / export
demand with no modifications to the operation of the junction – is not tenable. For
longer term analysis, we need to compare the situation with our project to a sensible Do
Minimum (base case) scenario without our project. To do this, we need to use a wider
area traffic model and define the base case scenario.
The TransPlan Estimation and Forecasting Model is computer software that can estimate
the traffic conditions of the present and future on the road network in Sri Lanka. The
model is capable of estimating the performance of the road network with respect to:

TA 7600 SRI – Multimodal Transport Project Sri Lanka
Final Report 309
• Changes to the road network itself (adding new roads, improvements or closures)
and
• Changes to the socioeconomic conditions (population, income, vehicle ownership,
jobs etc
The scope of the model can be understood by the following features (acknowledgement
to the University of Moratuwa).
• Study area
• Input data
• Model algorithms
• Model output
16.4.1 Study area
The study area of the TransPlan model is the entire country of Sri Lanka. The area is
divided into Divisional Secretariat Divisions (DSDs) the smallest administrative units for
which sufficient socioeconomic data is available. The model provides for coarser zoning
by combining a few DSDs.
16.4.2 Input data
The input data is made up of several categories.
• Network data
• Socioeconomic data
• Vehicle characteristics
Road network
There are a total of 2,460 links in the road network used by the TransPlan model. Some
important C Class Roads are also included. Furthermore, it includes links of proposed
expressways. The road network is also made up of 1,677 nodes. Nodes are essentially
intersections of roads within the network. The links then form sections of road between
nodes. There are also several nodes such as provincial boundaries where ‘artificial’ nodes
have been created to facilitate the model output requirements.
Existing roads
The road network data that was included in this database consists of the following
geometric, traffic and road condition parameters.
• Number of lanes
• Lane width
• Center median width (if any)
• Sidewalk width (if any)
• Shoulder width (if any)
• The location of all intersections with type of intersection control
• Pedestrian crossings
• Signalized pedestrian crossings
• At grade railway crossings
• Rise and fall for each link.
• Design curvature for each link
• Surface type with approximate International Roughness Index
TA 7600 SRI – Multimodal Transport Project Sri Lanka
Final Report 310
• Design speed
• Road side development
• Parking
New roads
The new expressways included in this network are as follows:
• A999: Colombo Katunayake Expressway (CKE)
• A998: Outer Circular Highway (OCH) :
• A997: Southern Highway (SH)
• A997: Extension to Southern Highway
• A996: Colombo-Kandy Alternate Highway
Socioeconomic data
The socioeconomic data used by the TransPlan model is arranged according to Divisional
Secretariat Divisions (DSD’s). That is, the basic planning data such as population, number
of households, vehicles by type, employment, jobs and unemployed persons etc. have
been collected and stored under a coded DSD format for the entire country. Data that is
not available at the DSD level, such as income, have been stored as district or provincial
data as the case may be. Data pertaining to 322 DSD’s have been used in the TransPlan
model.
Vehicle characteristics
The following vehicle types were identified in data collection.
a) Motor Cycle
b) Three Wheeler
c) Passenger Car
d) Passenger Van
e) Small Commercial Vehicle (including delivery van)
f) Medium Commercial Vehicle (Two Axle Truck with not more than 6 wheel)
g) Large Commercial Vehicle (Container carrier and Trucks with more than two axle)
h) Tractor (Land Vehicles and Construction equipment)
i) Large Bus (Bus with seating capacity of 40 or more)
j) Small to Medium Bus (Bus with seating capacity less than 40)
The model identifies only two vehicles categories.
a) Private Vehicles which includes vehicle types a) to d) including those used for para
transit
b) Goods Vehicles including vehicles types e) to h)
The model does not include route bus traffic.
16.4.3 Modelling algorithms
The TransPlan model uses several internal algorithms to estimate the traffic under
different socioeconomic, road network and transport policy conditions. These algorithms
use the variables discussed in the previous section of this report. The different algorithms
used in the TransPlan model are described in simple terms to provide a better

TA 7600 SRI – Multimodal Transport Project Sri Lanka
Final Report 311
appreciation of the modeling environment. All these models have been calibrated in the
Sri Lankan context after several years of study and analysis of land use, traffic and
socioeconomic conditions that have been included in the model algorithms.
Free flow speed model
Free flow speed is defined as the speed at which vehicles will travel on average, given
that there are no other vehicles (and other activities) on the road link. An algorithm has
been included in the TransPlan model to estimate this speed for each link of the road
network. This model has been calibrated using speed surveys on Sri Lankan highways
correlated with geometric and road condition parameters. For example, according to the
model, a unit increase in road width or an improvement to curvature or roughness will
contribute to different measures of increase to the free flow speed. Similarly, increase in
the commercial use of road frontage or an increase in the number of pedestrian crossings
will have a corresponding effect towards reduction of free flow speeds.
Speed flow model
The speed-flow model estimates the average travel speed on a link of any road as a
function of the rate of traffic flow. Based on the fundamental principles of traffic flow
theory and the Underwood speed-flow theoretical formulation, a model has been
calibrated to estimate travel speed under free flow conditions. Another model to
estimate speed under congested flow conditions has also been incorporated in the
TransPlan model. This algorithm is based on Smock’s theorem of traffic flow under
congested flow conditions. These have been calibrated using data from Sri Lankan
highways.
Traffic model
The traffic model is used to estimate the demand for vehicular traffic between any two
nodes in the road network. Traffic flow is generally estimated between any two DSD's in
the country. Therefore, a 322 x 322 matrix is generated for this purpose. The trips are
then distributed within the DSD area according to the number of nodes and also the
relative weight of importance attached to each node. There are three basic models that
are used for this purpose in TransPlan at present. These are, a) a private vehicle model for
estimating traffic between DSD’s; b) a model to estimate goods vehicle traffic between
DSD’s and c) a model to estimate all traffic that is entirely made within any one DSD. The
extension of this model to include bus travel and rail travel is presently under
development.
This model uses as input a number of socioeconomic, road condition and transport policy
variables discussed earlier. It is capable of estimating the traffic flows between DSD's for
any given year provided the input data for that year is know. Furthermore, the model is
capable of estimating separately for different vehicle types.
Traffic assignment
The TransPlan model uses a complex assignment technique to distribute the traffic
between any two nodes to the road network. In this process, traffic is distributed over the
network depending on either the distance, travel time or a combination of both. In this
particular application, a distance base was used. Due to the extensive network, capacity
constraints have not been used in this process; hence the assignment technique may be
referred to as the all-or-nothing approach to traffic assignment.

TA 7600 SRI – Multimodal Transport Project Sri Lanka
Final Report 312
Travel time model
The model estimates the travel speed on each link of the network by computing the total
assigned traffic on that link and then estimating the travel speed using the free flow
model and speed flow models described earlier. Travel time is computed by dividing the
distance by the estimated speed.
Travel cost model
The travel cost model is based on a Vehicle Operating Cost model. In this instance,
different VOC models have been calibrated. The TransPlan model has used some of these
models with suitable adjustments. The model also computes the value of user time. The
travel cost is then computed as the total of vehicle operating cost; user time cost and tolls
(if any).
Traffic route diversion
The traffic diversion model comprises an algorithm that would examine the traffic
diversion between different alternative routes. Presently this is limited to a defined study
area (as opposed to the entire country in the case of the traffic estimation and
assignment). In this case, the total trips assigned within the study area are kept at a
constant, while their internal assignment by route is enabled using a detailed route
assignment model.
Route choice model
This route assignment algorithm uses a basic logit type model formulation to distribute
trips between any two nodes in the study area among the any number of ‘most probable
routes’. Such routes for a study area are designed according to the possible pre-identified
routes of travel.
In applying the logit model, travel cost on each alternative is used as the criterion of
distribution. Travel cost can be computed by adding a) speed based vehicle operating
cost; b) speed based travel time costs and c) proposed toll rate.
16.5 Future year scenarios
Demand forecasts were produced for years 2015, 2024 and 2034. They were developed
from socio-economic data based on the following growth and development assumptions:
• Real GDP growth of 8% per annum until 2015, then 5.2% per annum to 2034; Real
GDP per capita 1% less than GDP in each year;
• Hambantota port related additional growth as currently used; and
• North East additional growth as currently used.
Two road network scenarios were modeled:
• Existing network – tested for year 2015 only; and
• All expressways currently approved including Southern Highway (SH), Extension to
Southern Highway (ESH), Colombo – Katunayake (CK), Outer Circular Highway
(OCH), Colombo Kandy Alternative Highway (CKAH) , and Hambantota
development highways; tested for years 2015, 2024 and 2034.

TA 7600 SRI – Multimodal Transport Project Sri Lanka
Final Report 313
Port switch scenarios:
The effect of opening one ICD was modeled by moving a portion of Colombo Port
import/export demand (the estimated ICD market share as given by the multi-modal
model) to the location of the ICD site. Proportions moved are given below:
• Port in Colombo with ICD only at Veyangoda (7.3%)
• Port in Colombo with ICD only at Enderamulla (18.5%)
• Port in Colombo with ICD only at Peliyagoda (18.5%)
• Port in Colombo with ICD only at Ratmalana (5.5%)
The model was not used to test directly the three projects involving two ICDs.
16.6 Traffic model output
16.6.1 Veh-km and veh-hrs savings
For each of the 3 years 2015, 2024 and 2034, model runs were undertaken for a base case
scenario and a with project scenario:
• Base case scenario: Demand forecast, with expressways network, without ICD
• With project scenario: Demand forecast, with expressways network, with ICD and
partial relocation of port import / export demand.
Tables 16.4, 16.5 and 16.6 compare veh-km per day, veh-hrs per day and network average
speed for the base and with project scenarios. Savings are computed to take forward to
the decongestion benefit calculations. The veh-hr savings have been sub-divided by
separating out the veh-hrs saved by goods vehicles removed from the road network and
the veh-hrs saved by vehicles remaining on the road network but travelling at higher
speeds. The former figure is derived by dividing the total veh-kms saved (column (3) of
the tables) by the average speed (Column (1)); the latter figure is the remainder of the
veh-hrs savings.
The values highlighted in the three tables are the veh-km savings and the veh-hrs savings
attributable to increases in travel speeds. Later, these are costed.

TA 7600 SRI – Multimodal Transport Project Sri Lanka
Final Report 314
Table 16.4 Transport and Congestion Savings 2015
TransPlan output Consultant’s calculations
hrs/day
saved by
removing Veh
km
Congestion
savings
(hrs/day)
(1) (2) (3) (4) (5)
Veyangoda Base case With project Savings
Vehicle Kms/day 3,300,986 3,248,698 52,288
Vehicle Hrs/day 112,195 109,549 2,646 1,777 869
Speed (km/hr) 29.42179 29.65517 (0.23338)
Enderamulla Base case With project Savings
Vehicle Kms/day 2,643,303 2,591,784 51,519
Vehicle Hrs/day 85,344 77,642 7,702 1,663 6,038
Speed (km/hr) 30.97228 33.38104 (2.40876)
Peliyagoda Base case With project Savings
Vehicle Kms/day 2,643,303 2,621,133 22,170
Vehicle Hrs/day 85,344 76,661 8,683 716 7,967
Speed (km/hr) 30.97228 34.19116 (3.21889)
Ratmalana Base case With project Savings
Vehicle Kms/day 3,300,986 3,284,339 16,647
Vehicle Hrs/day 112,195 111,093 1,102 566 536
Speed (km/hr) 29.42179 29.56378 (0.14199)
Table 16.5 Transport and Congestion Savings 2024
TransPlan output Consultant’s calculations
hrs/day
saved by
removing Veh
km
Congestion
savings
(hrs/day)
(1) (2) (3) (4) (5)
Veyangoda Base case With project Savings
Vehicle Kms/day 5,491,404 5,400,984 90,420
Vehicle Hrs/day 325,754 320,279 5,475 5,364 111
Speed (km/hr) 16.85752 16.86338 (0.00586)
Enderamulla Base case With project Savings
Vehicle Kms/day 4,370,591 4,276,228 94,363
Vehicle Hrs/day 225,761 217,930 7,831 4,874 2,957
Speed (km/hr) 19.35939 19.62204 (0.26265)
Peliyagoda Base case With project Savings
Vehicle Kms/day 4,370,591 4,332,116 38,475
Vehicle Hrs/day 225,761 217,260 8,500 1,987 6,513
Speed (km/hr) 19.35939 19.93974 (0.58035)
Ratmalana Base case With project Savings
Vehicle Kms/day 5,491,404 5,462,997 28,408
Vehicle Hrs/day 325,754 321,445 4,309 1,685 2,624
Speed (km/hr) 16.85752 16.99514 (0.13761)

TA 7600 SRI – Multimodal Transport Project Sri Lanka
Final Report 315
Table 16.6 Transport and Congestion Savings 2034
TransPlan output Consultant’s calculations
hrs/day
saved by
removing Veh
km
Congestion
savings
(hrs/day)
(1) (2) (3) (4) (5)
Veyangoda Base case With project Savings
Vehicle Kms/day 10,137,559 9,984,611 152,949
Vehicle Hrs/day 932,680 912,782 19,898 14,072 5,826
Speed (km/hr) 10.86928 10.93865 (0.06938)
Enderamulla Base case With project Savings
Vehicle Kms/day 8,059,864 7,900,305 159,559
Vehicle Hrs/day 672,968 655,493 17,475 13,323 4,152
Speed (km/hr) 11.97659 12.05246 (0.07587)
Peliyagoda Base case With project Savings
Vehicle Kms/day 8,059,864 7,994,629 65,235
Vehicle Hrs/day 672,968 664,814 8,154 5,447 2,707
Speed (km/hr) 11.97659 12.02537 (0.04878)
Ratmalana Base case With project Savings
Vehicle Kms/day 10,137,559 10,089,963 47,597
Vehicle Hrs/day 932,680 926,819 5,861 4,379 1,482
Speed (km/hr) 10.86928 10.88666 (0.01738)
16.6.2 Location of the savings
The forecast veh-kms and veh-hrs savings would be located on or in the corridors of four
main highways, as indicated in Table 16.7 and shown in Figure 16.2. The breakdown by
highway corridor of the savings shown in Tables 16.4 to 16.6 is indicated in Table 16.8.
Table 16.7 Principal highways for congestion savings
ID code Description
A001 Old Parliament Road at Fort to Mahara junction at Kiribathgoda
A002 Old Parliament Road at Fort to Golumadana, Ratmalana
CKAH Kadawatta Interchange to Balabowa Interchange
CKE Kelani Bridge to OCH at Karawalapitiya
Table 16.8 Breakdown of veh-kms and veh-hrs savings by highway corridor
ICD site Veh-kms Veh-hrs
ID code 2015 2024 2034 2015 2024 2034
Veyangoda ICD site
A001 40% 40% 40% 79% 62% 39%
CKAH 60% 60% 60% 21% 38% 61%
Enderamulla ICD site
A001 41% 41% 41% 90% 75% 47%
CKE 59% 59% 59% 10% 25% 53%
Peliyagoda/Telangapata ICD site
A001 100% 100% 100% 100% 100% 100%
Ratmalana ICD site
A002 100% 100% 100% 100% 100% 100%


TA 7600 SRI – Multimodal Transport Project Sri Lanka
Final Report 320
16.7 Vehicle Categories and Unit Cost Savings
Having used the TransPlan model to estimate veh-kms and veh-hrs savings in future
years, we must convert these quantities to economic benefits. Several processes were
involved:
• Relating the available classified traffic data to the two model vehicle categories;
• Selection of a suitable road user cost model; and
• Application of the road user cost model to the TransPlan model output.
Traffic benefits include:
• Savings in trucking costs, arising from the replacement of some truck transport by
rail transport; and
• Savings in costs to other vehicles on congested roads, arising from the fact that
the removal of a volume of trucking, above, permits other vehicles, including the
remaining trucks, to move at a higher speed.
These have been explored using the University of Moratuwa's traffic model, called
TransPlan.
16.7.1 Vehicle Classes
The output from the TransPlan traffic model aggregates all vehicle classes including:
• Private Vehicles consisting of: Motor Cycles, Three Wheelers, Passenger Cars and
Passenger Vans; and
• Goods Vehicles consisting of: Small Commercial Vehicles (including delivery vans),
Medium Commercial Vehicles (Two Axle Truck with not more than 6 wheels),
Large Commercial Vehicles (Container carrier and Trucks with more than two
axles) and Tractors (Land Vehicles and Construction equipment).
Buses are not included.
The Consultant has also been provided with national ADT data for 2004, which uses 14
vehicle classes as shown in Table 16.9 below:
Table 16.9 ADT Data Vehicle Classes
Motor Cycle 3wheeler Car/saloon Utility (Pickup/Jeep/Van)
Mini Bus Large Bus Service Vehicle Bicycle
Cart Light Goods Veh. Medium Goods Veh. Heavy Goods Veh.
Multi Axle Goods Veh. Tractors
Source: University of Moratuwa
Only some of these classes are of relevance to this study. Service vehicles are few in
number and can be ignored, while bicycles, carts and tractors are not relevant to a study
of mostly urban congestion. The remaining 10 classes are relevant to this study.
Finally, there are the HDM4 classes used in Sri Lanka, primarily by the Roads Development
Authority (RDA). They are:

TA 7600 SRI – Multimodal Transport Project Sri Lanka
Final Report 321
Table 16.10 HDM4 Data Vehicle Classes
Motor Cycle 3wheeler Car/saloon Utility (Pickup/Jeep/Van)
Mini Bus Large Bus Light Goods Veh. Medium Goods Veh.
Heavy Goods Veh. Multi Axle Goods Veh.
Source: RDA
It will be noted that, after removal of service vehicles, bicycles, carts and tractors from
the classes shown in Table 16.9, they closely resemble, but are not identical to, the
classes shown in Table 16.10. The objective of this section is to use the ADT data to
expand the aggregate TransPlan vehicle population into the 10 HDM 4 classes.
The ADT data provided included a weighted average traffic breakdown for “all roads
except rural roads”. The consultant has considered the relevance of this breakdown to
this study, and has concluded that establishment of ICD’s will have its greatest impact on
roads carrying large volumes of trucks and that a neutrally weighted average would
therefore be inappropriate, and that one giving a greater weighting to roads carrying
larger volumes of trucks would be more appropriate.
In this respect most trucks entering Colombo do so along four roads: the A001 Colombo-
Kandy Road, the A003 Colombo-Negombo Road; the B435 Urugodawatte-Ambatale Road,
and the B062 Cotta Road carried most of the large trucks, as counted at the CMC
(Colombo Municipal Council) cordon. Table 16.11 below shows both the national average
traffic distribution and the average traffic distribution of the four roads carrying most
heavy trucks in and out of Colombo. On the grounds that the correct traffic distribution
for the purposes of this study probably lies somewhere between the two, a straight
average has been taken to give the distribution shown.
Table 16.11 Vehicle Distributions
Motor
Cycle
3-
Wheeler
Car/
saloo
n
Utility
(Pickup/
Jeep/
Van)
Mini
Bus
Large
Bus
Light
Goods
Veh.
Medium
Goods
Veh.
Heavy
Goods
Veh.
Multi
Axle
Goods
Veh Total
National Average 21.9 17.9 16.4 21.2 2.4 4.7 4.1 9.9 0.6 0.9 100.0
4 Roads Average 17.6 16.8 21.3 27.2 2.3 3.5 2.4 5.9 0.9 2.1 100.0
Average 19.7 17.4 18.9 24.2 2.4 4.1 3.2 7.9 0.7 1.5 100.0
Source: Consultant
Large buses and mini buses make up 6.5% of the above traffic, or 6.9% of the non-bus
traffic. The Consultant has assumed that TransPlan underestimates traffic volumes
vehicle time savings and vehicle km. saved or additional, by excluding buses, and has
therefore added such buses in, as shown below.
Table 16.12 Expansion of TransPlan Vehicle Population
TransPlan Vehicles
Motor
Cycle
3-
Wheeler
Car/
saloon
Utility
(Pickup/
Jeep/
Van)
Light
Goods
Veh
Medium
Goods
Veh
Heavy
Goods
Veh
Multi
Axle
Goods
Veh
Total Mini
Bus
Large
Bus
21.1 18.6 20.1 25.9 3.5 8.4 0.8 1.6 100 2.5 4.4
Source: Consultant

TA 7600 SRI – Multimodal Transport Project Sri Lanka
Final Report 322
While the above analysis is based on 2004 data, the consultant has reviewed traffic count
data for “A” roads covering the period from 2006 to 2011, including the main roads
serving Colombo (AA0001, AA0002, AA003, AA004 and AA0008) and found no reason to
change the above distribution.
16.7.2 Alternative Models of Road User Costs
General
Road user costs can be defined as including all costs related to the use of vehicles
including:
• fuel;
• lubricating oil;
• tyres;
• spare parts and maintenance;
• capital;
• crew;
• overhead; and
• passenger time.
Many of these costs, when expressed in terms of cost/vehicle km, vary with vehicle
speed. Capital costs and passenger time are particularly important. Capital costs are the
costs of owning a vehicle, effectively the sum of depreciation and interest on the capital
tied up in the vehicle. Passenger time cost is the cost of an individual’s time and is
generally recognised as approximating to the sum of the individuals pay rate plus payroll
costs during working time, and as being a proportion of that amount during leisure time.
Even when individuals’ time values are low, delays to large buses, carrying up to 40
people may be costly.
In theory, the cost of financing cargo in transit is also relevant, but in practice, this tends
to be insignificant.
The Consultant had two alternative models available to be used to estimate road user
costs. They were:
• The road user cost (RUC) model in HDM4. This is a data-hungry computer
programme, which has been much used in Sri Lanka, by the RDA and others, and
has similar vehicle classes to those in the TransPlan model. HDM4 itself is much
used for economic appraisals of road investments and road maintenance
programmes, and the RUC model is used to generate costs expressed in economic
terms for these purposes. It is not usually used to study traffic networks, or for
urban traffic studies; and
• A pricing model, developed by the Consultant, for articulated trucks, primarily for
use in preparing forecasts of the split between road and rail transport.

TA 7600 SRI – Multimodal Transport Project Sri Lanka
Final Report 323
HDM4
Much of the HDM4 input data changes only slowly over time, for example with advancing
vehicle technology, but costs and other financial inputs change quickly, with inflation and
economic growth. They include: vehicle purchase prices, tyres, fuel, maintenance labour,
crew costs and value of passengers’ time. In addition, vehicle life is a particularly
important input.
Team members had access to the slowly changing data, as used in Sri Lanka in the recent
past. However, the Consultant collected cost and price data relating to typical vehicles,
converted it to economic terms using the shadow price factors (SPFs) in Chapter 12 and
used it with existing technical data to run HDM 4 and generate road user costs at various
vehicles speeds, for 10 classes of vehicles. The results of this exercise were credible but,
to the Consultant, appeared rather low, most probably because HDM4 is not intended to
model congested conditions. The consultant would expect the cost of travelling at a low
average speed, with much stopping and starting, as occurs under congested conditions, as
including increased fuel consumption and additional maintenance costs, for example
clutch wear, particularly in respect of heavy vehicles.
The HDM4 results were used for a number of purposes in addition to providing an
indication of total road user costs: for example they were used to give an indication of
fuel consumption against for the purpose of discussing emissions.
The price model, referred to above, was used to check on the HDM4 results for
articulated trucks.
The Price Model
At the Interim Report stage, we created a road haulage price model that included a speed
related term. This was based on limited data from freight forwarders and on the
assumption that the difference in tariffs for road journeys from Colombo Port and for
other road journeys was down to congestion on the road network. However, subsequent
inquiry revealed that standing charges for waiting inside the port were a contributory
factor.
We therefore abandoned the Interim Report model and developed a model that related
the price charged for freight to/from the port to a constant term plus a multiple of
distance from the port. The constant term includes the standing charges. The price model
was developed from prices recommended by the Association of Container Transporters
(ACT) for various distances along a number of routes from the port.
The model was fitted to 27 ACT data points along six different routes out of Colombo
using linear regression. The data was limited to prices for distances not exceeding 100.5
km (Kandy). Prices were for the transport of 40 foot laden containers. The resultant
regression formula is shown below and in Figure 16.3.
Price = Rs. 10,000 + Rs. 228.47/km.

TA 7600 SRI – Multimodal Transport Project Sri Lanka
Final Report 324
Figure 16.3 Road haulage price model derived from regression of ACT data
The Consultant had used this price model results in forecasting container throughput at
each site, as described in Chapter 4. The pricing model was appropriate for the
forecasting purpose and, as prices must be cost based to some extent, was also relevant
as a source of vehicle operating cost data, as a supplement or alternative to the HDM4
results described above.
It should be noted that this is a price formula, including profit and is also based on
financial costs rather than economic ones. As an approach to costing, the said formula
had been recast as a formula which gave a price per unit km for a range of vehicle speeds.
This can be done by:
• Taking the slope of the expression above as representing the cost per km of
operating a truck at “normal” operating speed;
• Taking the intercept as consisting of a standing cost, for loading and unloading, and
a congestion cost, being the additional cost per kilometre of operating at a low
speed, under congested conditions multiplied by the distance travelled under
congested conditions. This is only a constant if the routes to all or most destinations
considered include a similar distance travelled under congested conditions; and
• Taking a realistic formula relating price (actually cost plus any normal or super-
normal profit element) to speed and adjusting it by trial and error until it gave
price/km under congested and normal conditions which, when passed through the
above formula, replicated the charges for transport between the port and the
hinterland, for a number of different hinterland origins/destinations.
The outcome is a formula relating price to distance and speed. It is a pricing formula
and not a cost formula. A number of adjustments were required to convert the above
price formulae to cost formulae, and to make the results comparable with those from
HDM4. They were applied initially to the linear regression result above, as follows:
y = 228.47x + 10000
R² = 0.8937
0
5,000
10,000
15,000
20,000
25,000
30,000
35,000
40,000
0.0 20.0 40.0 60.0 80.0 100.0 120.0
Pri
ce p
er
40
ft
con
tain
er
(Rs)
Distance from Port Gate (km)
Road haulage price vs distance
Journeys up to 100 km
Linear (Journeys up to 100
km)

TA 7600 SRI – Multimodal Transport Project Sri Lanka
Final Report 325
• The HDM4 results were in economic rather than financial terms but, because the
Shadow Price Factor for fuel is large and acts in the opposite direction from the
other shadow prices, this makes little difference;
• There may be a profit element in the price model which is not reflected in the
HDM4 results;
• There may also be confidential discounts, often a feature of the shipping industry,
leading to the average price being lower than that suggested by the formula;
• The intercept was interpreted in part as compensation for congestion, leading to
low vehicle speed and possibly high costs, and in part to vehicle standing time;
and
• The slope above was interpreted as an amount per unit km. But, because this is a
price model, the kilometres forming the horizontal axis are not kilometres
travelled by the truck, but km travelled by the cargo being transported. In the
extreme case, the truck may have an empty return leg, and so travel twice the
distance, or even more if its depot is remote from the start and finish points of its
paid work. Obviously, trucking companies try to minimise empty running, but
even where there is return road, there may be a repositioning leg to pick it up.
To arrive at more realistic values, the consultant has:
• Assumed profit and confidential discounts to account for 20% of the apparent
price;
• Assumed that shadow pricing would reduce it by a further 3%;
• Assumed 50% of the remaining intercept to be accounted for by standing time;
and
• Assumed the true km travelled to be 1.6 times the paid km, i.e. empty running is
60% of loaded journeys.
The result of applying the above is to create the following hypothetical cost model:
Price = Rs. 3,880 + Rs. 111/km.
It is now referred to as a cost model because it no longer includes a profit element and
the kilometres referred to are kilometres run by the vehicle rather than “paid” km,
carrying cargo.
Central Values
The price model results above relate only to articulated trucks. The Consultant found that
there was a good agreement between the two sources at normal highway running speed
(70 k/h), with the results derived from the pricing model being significantly higher at low
speeds. As noted above, the Consultant recognises that results derived from HDM4 are
likely to be low, so it was no surprise that those from the price model were higher than
the HDM4 ones. It is also the case that there are uncertainties regarding the price model
and its conversion into a cost model. These uncertainties were addressed by taking the
mid point between each HDM4 result and the corresponding result derived from the price

TA 7600 SRI – Multimodal Transport Project Sri Lanka
Final Report 326
model as the central value, again, only for articulated trucks. The said central values are
shown in the final row of Table 16.13, below.
Recognising that other trucks have similar dynamics to articulated trucks, with fuel
consumption being related to frequent acceleration of a heavy mass, the central values
for other trucks were for each speed, derived by increasing the HDM4 result by the
percentage by which the central value for an articulated truck exceeded the
corresponding HDM4 result.
Lighter vehicles have different dynamics, with energy consumption related more to
overcoming rolling resistance than to acceleration, implying that the central values should
be closer to the HDM4 results. For these vehicles, the HDM4 result was increased by only
half the percentage by which the central value for an articulated truck exceeded the
corresponding HDM4 result.
The above approach gave the “central” values shown below.
Table 16.13 Central Road User Costs (Rs/km)
Speed (km/h)
5 10 20 30 40 50 60 70
Motor Cycle 37.72 18.98 9.76 6.93 5.66 5.06 4.83 4.85
Three Wheeler 37.43 18.86 9.72 6.91 5.66 5.06 4.83 4.85
Car/Saloon 200.49 108.02 61.85 46.87 39.49 35.19 32.65 30.78
Utility 347.84 175.47 90.00 62.19 48.64 40.79 36.20 32.64
Mini Bus 315.55 157.95 79.98 55.11 43.20 36.51 32.78 30.18
Large Bus 569.96 281.02 138.82 93.61 71.88 59.50 52.29 47.18
Light Goods 105.36 54.61 29.59 22.02 18.68 17.13 16.54 16.64
Medium Goods 222.45 116.34 63.78 47.37 39.66 35.55 33.34 32.31
Heavy Goods 546.59 283.30 152.86 110.75 91.01 80.39 74.62 71.58
Articulated Trucks 684.59 363.41 203.57 151.54 126.87 113.43 105.97 102.01
Source: Consultant
Figures 16.4 and 16.5 below show the cost curves for a car and an articulated truck: in
fact the cost curves for all vehicle classes are the same shape, falling steeply at low
speeds and then levelling out. This is the source of congestion savings: a small increase in
vehicle speed at low speeds generates large savings, while at optimum speed, a small
increase in vehicle speed generates no saving at all.

TA 7600 SRI – Multimodal Transport Project Sri Lanka
Final Report 327
Figure 16.4 Road User Costs: Articulated Truck
Source: Consultant
Figure 16.5 Road User Costs: Car
Source: Consultant
16.7.3 Savings
Table 16.14 below shows the calculation of the weighted average values per truck km
saved. Travel speeds are shown in column (2). The central user costs of Table 16.13 were
used as a look-up table, with interpolation based on speed between the columns of the
0
100
200
300
400
500
600
700
800
0 10 20 30 40 50 60 70 80
Cost
(Rs./km
Speed (km/h)
0
50
100
150
200
250
0 10 20 30 40 50 60 70 80
Cost
(Rs./km
Speed (km/h)

TA 7600 SRI – Multimodal Transport Project Sri Lanka
Final Report 328
articulated trucks, heavy goods and medium goods rows; these are shown in columns (3),
(4) and (5). Vehicle proportions 0.5, 0.25 and 0.25 were then applied to yield the
weighted average unit cost savings in Rs/km displayed in column (6).
Table 16.14 Weighted average values per truck km saved (Rs./km)
Candidate ICD
site
Speed
(km/hr)
Unit costs saving (Rs/km)
Articulated
truck
HGV rigid
bodied
MGV rigid
bodied
Weighted
average
0.5 0.25 0.25
(1) (2) (3) (4) (5) (6)
Year 2015
Veyangoda 29.42 154.54 113.18 48.32 117.65
Enderamulla 30.97 149.14 108.83 46.62 113.43
PelTel 30.97 149.14 108.83 46.62 113.43
Ratmalana 29.42 154.54 113.18 48.32 117.64
Year 2024
Veyangoda 16.86 253.80 193.85 80.30 195.44
Enderamulla 19.36 213.81 161.21 67.15 164.00
PelTel 19.36 213.81 161.21 67.15 164.00
Ratmalana 16.86 253.80 193.85 80.30 195.44
Year 2034
Veyangoda 10.87 349.51 271.96 111.77 270.69
Enderamulla 11.98 331.81 257.52 105.95 256.77
PelTel 11.98 331.81 257.52 105.95 256.77
Ratmalana 10.87 349.51 271.96 111.77 270.69
Table 16.15 below shows the calculation of the weighted average values per veh-hr saved
as a result of increased speeds. All vehicle categories are affected. For each year, there
are two blocks of data, each with one line per ICD.
First data block: Travel speeds on the base case and with project networks are displayed
in columns (2) and (3). From these, the time saved per veh-km was computed, as shown
in column (4). The central user costs of Table 16.13 were used as a look-up table. The
speed interval containing the base case and with project speeds was selected; for each
vehicle category, the unit costs at the ends of this speed interval were extracted from
Table 16.13 and the difference was computed. This difference was then scaled down to
be compatible with the difference between the base case and with project travel speeds.
These results are shown in columns (5) to (14) of Table 16.15.
Second data block: Weightings in accordance with the vehicle mix were then applied to
these costs and the results are displayed in columns (5) to (14). These outputs were
added together and multiplied by 106.9% (to allow for the buses that are not included in
the traffic model); the result is displayed in column (15). Finally, the values in column (15)
of the second data block were divided by the time savings per veh-km in column (3) of the
first data block. The results, which are savings per veh-hr, are displayed in column (3) of
the second data block.

TA 7600 SRI – Multimodal Transport Project Sri Lanka
Final Report 329
Table 16.15 Weighted average values per vehicle hour saved (Rs./hr)
ICD site Speed Speed Time
saved per
veh-km
Saving per veh-km
(km/hr) (km/hr) (hrs) (Rs) (Rs) (Rs) (Rs) (Rs) (Rs) (Rs) (Rs) (Rs) (Rs) (Rs)
Base
case
With
project
Artic HGV MGV LGV
Large
Bus
Mini
Bus Utility Car
3-
wheeler
Motor-
cycle All
(1) (2) (3) (4) (5) (6) (7) (8) (9) (10) (11) (12) (13) (14) (15)
Year 2015
Veyangoda 29.42 29.66 0.0002675 1.2144 0.9828 0.3830 0.1767 1.0550 0.5805 0.6490 0.3496 0.0656 0.0662
Endearmulla 30.97 33.38 0.0023298 5.9408 4.7536 1.8564 0.8037 5.2352 2.8687 3.2633 1.7768 0.3017 0.3046
PelTel 30.97 34.19 0.0030396 7.9389 6.3524 2.4807 1.0741 6.9960 3.8335 4.3608 2.3744 0.4032 0.4070
Ratmalana 29.42 29.56 0.0001632 0.7389 0.5979 0.2330 0.1075 0.6419 0.3532 0.3949 0.2127 0.0399 0.0403
(Rs/hr) Weighting
1.62% 0.79% 8.43% 3.46% 4.39% 2.53% 25.88% 20.15% 18.56% 21.11% 106.9%
Veyangoda 1,463 0.0197 0.0077 0.0323 0.0061 0.0463 0.0147 0.1680 0.0704 0.0122 0.0140 0.3913
Endearmulla 834 0.0962 0.0373 0.1566 0.0278 0.2297 0.0725 0.8447 0.3580 0.0560 0.0643 1.9431
PelTel 854 0.1286 0.0499 0.2092 0.0371 0.3070 0.0969 1.1287 0.4783 0.0748 0.0859 2.5967
Ratmalana 1,459 0.0120 0.0047 0.0197 0.0037 0.0282 0.0089 0.1022 0.0429 0.0074 0.0085 0.2381
Year 2024 (hrs)
Veyangoda 16.86 16.86 2.060E-05 0.0936 0.07639 0.0308 0.0146 0.0833 0.0457 0.0501 0.0270 0.0054 0.0054
Endearmulla 19.36 19.62 0.0006914 4.1982 3.4261 1.3805 0.6571 3.7351 2.0479 2.2450 1.2129 0.2399 0.2421
PelTel 19.36 19.94 0.0015034 9.2761 7.5701 3.0502 1.4518 8.2528 4.5249 4.9605 2.6799 0.5301 0.5350
Ratmalana 16.86 17.00 0.0004804 2.1995 1.7950 0.7233 0.3442 1.9569 1.0729 1.1762 0.6355 0.1257 0.1268
(Rs/hr) Weighting
1.62% 0.79% 8.43% 3.46% 4.39% 2.53% 25.88% 20.15% 18.56% 21.11% 106.9%
Veyangoda 1,484 0.0015 0.0006 0.0026 0.0005 0.0036 0.0012 0.0130 0.0054 0.0010 0.0011 0.0306
Endearmulla 1,983 0.0681 0.0269 0.1164 0.0227 0.1639 0.0518 0.5811 0.2444 0.0445 0.0511 1.3708
PelTel 2,015 0.1503 0.0594 0.2573 0.0502 0.3621 0.1144 1.2839 0.5399 0.0984 0.1130 3.0290
Ratmalana 1,495 0.0356 0.0141 0.0610 0.0119 0.0859 0.0271 0.3044 0.1280 0.0233 0.0268 0.7182

TA 7600 SRI – Multimodal Transport Project Sri Lanka
Final Report 330
Year 2034 (hrs)
Veyangoda 10.87 10.94 0.0005835 1.1089 0.9050 0.3646 0.1736 0.9866 0.5409 0.5930 0.3204 0.0634 0.0640
Endearmulla 11.98 12.05 0.0005256 1.2127 0.9897 0.39887 0.1898 1.0789 0.5915 0.6485 0.3504 0.0693 0.0699
PelTel 11.98 12.03 0.0003387 0.7796 0.6362 0.2564 0.1220 0.6936 0.3803 0.4169 0.2252 0.0446 0.0450
Ratmalana 10.87 10.89 0.0001469 0.2778 0.2267 0.0913 0.0434 0.2471 0.1355 0.1485 0.0802 0.0159 0.0160
Weighting
1.62% 0.79% 8.43% 3.46% 4.39% 2.53% 25.88% 20.15% 18.56% 21.11% 106.9%
Veyangoda 621 0.0180 0.0071 0.0308 0.0060 0.0432 0.0137 0.1535 0.0645 0.0118 0.0135 0.3621
Endearmulla 753 0.0196 0.0078 0.0336 0.0066 0.0473 0.0150 0.1679 0.0706 0.0129 0.0148 0.3960
PelTel 752 0.0126 0.0050 0.0216 0.0042 0.0304 0.0096 0.1079 0.0454 0.0083 0.0095 0.2546
Ratmalana 618 0.0045 0.0018 0.0077 0.0015 0.0108 0.0034 0.0384 0.0162 0.0029 0.0034 0.0907

TA 7600 SRI – Multimodal Transport Project Sri Lanka
Final Report 331
16.8 Decongestion benefits
Table 16.16 displays the calculation of daily transport and congestion savings. The truck savings
are copied from Tables 16.4 to 16.6. The rates per veh-km and per veh-hr are copied from
Tables 16.14 and 16.15 respectively. Column (4) is the product of columns (2) and (3), divided
by 10^6 to convert to Rs million. Column (7) is the product of columns (5) and (6), divided by
10^6 to convert to Rs million.
Table 16.16 Daily transport and congestion savings (Rs. million)
ICD site
Year
Trucking savings Congestion savings
Trucking
savings
(veh-
km/day)
Rate
(Rs/veh-
km)
Value of
daily saved
truck km
(Rs m/day)
Congest-
ion savings
(hrs/day)
Rate
(Rs/veh-
hr)
Value of
daily
congest-
ion savings
(Rs m/day)
(1) (2) (3) (4) (5) (6) (7)
Veyangoda
2015 52,288 117.65 6.1516 869 1,463 1.2713
2024 90,420 195.44 17.6714 111 1,484 0.1651
2034 152,949 270.69 41.4017 5,826 621 3.6154
Enderamulla
2015 51,519 113.43 5.8439 6,038 834 5.0362
2024 94,363 164.00 15.4750 2,957 1,983 5.8621
2034 159,559 256.77 40.9705 4,152 753 3.1284
Peliyagoda
2015 22,170 113.43 2.5147 7,967 854 6.8062
2024 38,475 164.00 6.3097 6,513 2,015 13.1218
2034 65,235 256.77 16.7505 2,707 752 2.0352
Ratmalana
2015 16,647 117.65 1.9585 536 1,459 0.7820
2024 28,408 195.44 5.5519 2,624 1,495 3.9232
2034 47,597 270.69 12.8839 1,482 618 0.9152

TA 7600 SRI – Multimodal Transport Project Sri Lanka
Final Report 332
Table 16.17 converts the daily savings of Table 16.16 to annual savings.
Table 16.17 Annual transport and congestion savings (Rs. million)
2015 2024 2034
Veyangoda - Trucking Savings 2,245 6,450 15,112
- Congestion Savings 464 60 1,320
- Total 2,709 6,510 16,431
Enderamulla - Trucking Savings 2,133 5,648 14,954
- Congestion Savings 1,838 2,140 1,142
- Total 3,971 7,788 16,096
Peliyagoda - Trucking Savings 918 2,303 6,114
- Congestion Savings 2,484 4,789 743
- Total 3,402 7,093 6,857
Ratmalana - Trucking Savings 715 2,026 4,703
- Congestion Savings 285 1,432 334
- Total 1,000 3,458 5,037
Source: Consultant
The valuation of the above savings has been taken into the appraisals shown in Chapter 15.

TA 7600 SRI – Multimodal Transport Project Sri Lanka
Final Report 333
17 Project impact monitoring
17.1 Project Impact Monitoring Framework
In this section, as in the rest of the report, the term “ICD” (Inland Container Depot) has been
used, rather than “dry port”, the term used in the ToR.
Logically, the Project Impact Monitoring Framework (PIMF) cannot be completed until such
time as it has been decided which site is to be developed, or which sites are to be developed,
and how that development is to be financed. Nevertheless, the Consultant has taken the PIMF
as far as practicable at this Final Report stage.
Originally identified study objectives were;
• Policy objective 1 – to provide sustainable and environmentally friendly hinterland
transport;
• Policy objective 2 – to minimize congestion on the roads around Colombo port, to
improve road safety and benefit the environment by reducing noise and emissions from
trucks;
• To select up to two ICDs with integrated multimodal logistic centres in the vicinity of
Colombo;
• To provide the said ICD(s) with supporting functions for packing, storing and value
addition to goods;
• To connect these ICDs via railway lines to Colombo port;
• To rehabilitate the existing railway line to Colombo port;
• To construct transhipment yards in the ICDs and in Colombo port;
• To address capacity constraints on the railway in and around Colombo; and
• To quantify the needs of the railway in terms of rolling stock, maintenance facilities,
signalling, communication and lifting equipment to cater for the additional demand
triggered by the rail connected ICDs.
These are general and could relate to any of the potential ICD sites. Once ICD(s) have been
selected and constructed, most of the above will be easily verifiable. However, monitoring to
determine whether the policy objectives have been achieved and whether the ICD(s) are
financially sound will require specific measurements. Quantitative monitoring should take place
of:
• Annual ICD throughput in TEU;
• Annual CFS throughput in TEU;
• Financial viability;
• Traffic levels; and
• Congestion outside the port.
Staged construction is envisaged and, while the consultant has coordinated the phasing with
the throughput forecasts, it is clear that, in the event that the throughput grows more quickly

TA 7600 SRI – Multimodal Transport Project Sri Lanka
Final Report 334
or more slowly than envisaged, the phasing should also be adjusted.
A suitable PMIF is presented as Table 17.1 below, while Section 17.2 below discusses baseline
data.
Table 17.1: Project Impact Monitoring Framework
Design
Summary
Performance
Targets/Indicators
Data Sources/
Reporting
Mechanisms
Assumptions
and Risks
Impact
Reduce congestion and
pollution around Colombo
port
Traffic congestion around
Colombo Port does not
worsen
Air pollution around
Colombo port does not
increase
Traffic counts /
air quality
measurements
by
RDA/Colombo
City Council.
Assumptions
Steps are taken to
control/reduce non-port
traffic and congestion.
Risks
Uncontrolled
traffic/population Growth
Outcome
(i) Increased rail transport
of containers
(ii) Reduced container and
general cargo
transportation by road
(iii) transport costs for
imports and exports are
reduced
(iv) The ICD(s), including the
port railhead and rail links
are a financially viable
business.
Rail transport of
containers into and out of
Colombo port increases in
line with the forecasts.
Use of the ICD proves
attractive to customers.
Financiers’ expectations
are realised.
SLPA and
managing/
owning entity
reports.
Market reports
from the
managing/
owning entity.
Annual Report
and Accounts
Assumptions
Other factors affecting
investment and economic
development are in place.
Costs and revenues are as
predicted.
Risk
Customs/Port authority
rules and practices
disadvantage the ICD(s)
Outputs
(i) Construction of up to
two ICDs with integrated
multimodal logistic centres
in the vicinity of Colombo,
with supporting functions
for packing, storing and
value addition to goods;
(ii) Rehabilitation/
extension of the rail system
to connect these ICDs to
Colombo port, with
adequate capacity;
(iii) Construction of
transshipment yards in the
ICDS and in Colombo port;
ICD(s) constructed and
operational by start 2015.
Railway
rehabilitation/extension
completed and
operational by start 2015.
Transshipment yards in
the ICDs and Colombo
port completed and
operational by start 2015.
Necessary rolling stock
and other railway
equipment procured by
start 2015.
Consultant
reports and
reports from
the managing/
owning entity.
Assumptions
Contract award for
infrastructure and works
is done on schedule.
Contracts are completed
on schedule.
Rolling stock and
equipment are procured
on schedule.
Risk
Delays caused by
Government/institutional
factors.

TA 7600 SRI – Multimodal Transport Project Sri Lanka
Final Report 335
(iv) Quantify the needs of
Sri Lanka Railways in terms
of rolling stock and
infrastructure to cater for
the additional demand
triggered by the multimodal
logistics centres.
Activities with Milestones
1. Project approval and establishment of project managing/owning entity.
2. Contract award for civil works component is awarded by Oct 2013.
3. Site(s) available to the Contractor by end 2013
4. Civil works and procurement are completed by end 2014.
5. ICDs reach full operation by start 2015.
Inputs
• ADB: $? million
• Government: $? million
• Private sector: $?
million
ADB = Asian Development Bank, SLPA = Sri Lanka Ports Authority. RDA = Roads Development Authority,
ICD = Inland container deport
Source: Consultant
17.2 Baseline data and monitoring approach
Baseline data is the data against which the results of monitoring must be assessed to provide
meaning to monitoring results.
The ToR ask the Consultant, in Paragraph e(vii), to “Develop a project impact monitoring
framework and carry out socio-economic baseline survey”. The team’s Social Development
Expert has conducted an extensive survey of the socio-economic conditions of the people living
on and around the four candidate sites, and the resulting data can be used as baseline data if
necessary. However, it is clear that the intended main beneficiaries of the project are the
people and businesses who will benefit from the reduction in congestion on and along the
roads serving the port. These are a very diffuse population and do not lend themselves to
survey techniques. Instead, it will be necessary to monitor:
• The extent to which the project does indeed take containers and their contents off the
roads;
• The extent to which the project is financially successful: financial failure could lead to
the loss of all the envisaged benefits; and
• The extent to which congestion benefits are realised.
In order to achieve this, the monitoring process will provide:
• Comparisons of import and export container movements through Colombo Port with
the forecasts made in this report;
• Counts of containers passing through Colombo Port road and rail gates in order to check
that rail is attaining the market share predicted;
• Comparisons of annual ICD throughput in TEU, unit transport and cranage charges, and
annual gross revenue derived from transport and cranage charges, with the forecasts;

TA 7600 SRI – Multimodal Transport Project Sri Lanka
Final Report 336
• Comparisons of annual CFS throughput in TEU, unit stuffing / destuffing charges, and
annual gross revenue derived from stuffing / destuffing charges, with the forecasts;
• Measurements of journey times by road to/from the Colombo Port container gates, and
more generally, by non-port traffic in the area east of the container gates.

TA 7600 SRI – Multimodal Transport Project Sri Lanka
Final Report 337
18 Conclusions
Decongestion benefits
A principal project objective was to alleviate congestion in the area around Colombo Port by
constructing one or two Inland Container Depots (ICDs) in the vicinity of Colombo, connected to
the port by environmentally friendly and economical rail transport. Our study has shown that
the project will yield substantial decongestion benefits, dependent on the site chosen.
The four ICD sites
The Inland Container Depot (ICD) sites taken forward to full feasibility, all adjacent to the
existing railway and indicated on the location map, were:
• Veyangoda – a site to the north, on the main railway line to Jaffna and Trincamalee but
too far from Colombo for a substantial TEU demand;
• Enderamulla – a large site north of Enderamulla station, which is south of Ragama
station, on the western side of the railway;
• Peliyagoda/Telangapata – a large site lying on both sides of the Colombo Katunayake
Expressway, adjacent to the railway just north of Kenaliya station; and
• Ratmalana – a site lying adjacent to the Sri Lanka Railways workshop; the only southern
site but with limited demand.
Projects evaluated
Projects evaluated comprised one or two ICDs, correspondingly a 3-track or 4-track railhead in
the New Port and (for the 3 northern sites) the Sedawatta link, as follows:
• Veyangoda + 3-track railhead + Sedawatta link;
• Enderamulla + 3-track railhead + Sedawatta link;
• Peliyagoda/Telangapata (PelTel) + 3-track railhead + Sedawatta link;
• Ratmalana + 3-track railhead;
• Veyangoda + Ratmalana + 4-track railhead + Sedawatta link;
• Enderamulla + Ratmalana + 4-track railhead + Sedawatta link; and
• Peliyagoda/Telangapata + Ratmalana + 4-track railhead + Sedawatta link.
Timing
A task in our study was to undertake a preliminary design during 2011. A reasonable schedule is
that detailed design will take place during 2012, and land acquisition, procurement,
construction and implementation will occupy late 2013 and 2014. The first full year that the
ICD(s) will be open to traffic is 2015. A twenty year period takes us to 2034, the final evaluation
year. So the total project evaluation period is 21 years.
The train service
Between the port and each ICD, a shuttle service would operate via the single track port access
line. Initially, it would operate with trains carrying 15 new wagons, each with a capacity to carry
3 TEUs. At most ICDs, the service would operate with trains carrying 35 wagons and 105 TEU
from 2021, requiring powerful new locomotives. At Veyangoda, short trains would remain in
force because this ICD site cannot accommodate long trains.
Estimated construction costs and land costs
The estimated construction cost of each ICD site has been compared with that calculated from
regional data in the UNESCAP 2007 report ‘Policy Framework for the Development of

TA 7600 SRI – Multimodal Transport Project Sri Lanka
Final Report 338
Intermodal Interfaces as part of an Integrated Transport Network in Asia (US$ million). The
costs are similar except for the issue of land costs.
Following discussions with the Urban Development Authority (UDA) and Sri Lanka Railways, we
understand that government and railway land would be provided free to the project at
Veyangoda, Enderamulla, Peliyagoda/Telangapata, Sedawatta and Ratmalana. However,
compensation payments would be made where government land has been leased to private
sector entities for 95 years (Telangapata) and where private sector land has to be acquired to
construct part of the site (Enderamulla access road).
Demand and revenue
Market evaluation and forecasting has yielded estimates of annual ICD throughput and annual
Container Freight Station throughput, measured in TEU, at each ICD site. Transport and cranage
charges between the port and the ICD, and stuffing / destuffing charges at CFS stations, are
expected to be the principal revenue earners. The unit charge for stuffing / destuffing activities
is estimated to be Rs 13,338 per TEU.
Estimated annual throughput at ICDs in TEU
Year Veyangoda Enderamulla Peliyagoda /
Telangapata
Ratmalana
2015 109,909 279,904 279,904 83,356
2024 188,866 480,983 480,983 143,328
2034 318,781 811,838 811,838 241,767
Estimated annual throughput at Container Freight Stations in TEU
Year Veyangoda Enderamulla Peliyagoda /
Telangapata
Ratmalana
2015 36,636 93,301 93,301 27,785
2024 62,995 160,328 160,328 47,746
2034 106,260 270,613 270,613 80,589
Rail and cranage charges between the New Port railhead and ICDs (Rs per TEU)
ICD site Base Cost
(Rs)
Co-efficient
(Rs per km)
Distance from
Port Gate (km)
Charge per TEU
trip (Rs)
Veyangoda 3,475 100 37 7,175
Enderamulla 4,000 100 10 5,000
Peliyagoda/Telangapate 3,975 100 7 4,675
Ratmalana 2,239 100 21 4,339
Financial analysis
Analysis was carried out for both a publicly owned project and a public private partnership
(PPP) project. For the former, Ratmalana would yield a very low FIRR. Enderamulla would be a
good investment, yielding an FIRR of 19%, close to the minimum 20% acceptable for purely
private investment. Veyangoda and Peliyagoda/Telangapata would yield FIRR’s in excess of
11%, acceptable for a public scheme. The addition of Ratmalana as a second ICD site to any of
Enderamulla, Veyangoda and Peliyagoda/Telangapata would reduce the FIRR.
PPP is designed to secure private sector investment and participation. Under PPP, the private
sector investor is assumed to want an FIRR in excess of 20% and the public sector partners have

TA 7600 SRI – Multimodal Transport Project Sri Lanka
Final Report 339
to ensure that this happens by accepting a low or zero return. Ratmalana would require 65%
public funding, an unattractive prospect for the Government. All the other six projects would
require 45% public funding or less.
Economic appraisal
If land is provided free to the project, the cost of land can be omitted from financial analysis.
However, in economic appraisal, the opportunity cost of land must be included. Economic land
costs are high at Peliyagoda/Telangapata and Ratmalana. Ratmalana has a negative overall
ENPV and an EIRR of 7%, less than ADB’s minimum requirement of 12%. As a result, Ratmalana
is not economically viable. Veyangoda, Enderamulla and Peliyagoda have EIRRs of 29%, 24%
and 20% respectively, exceeding the minimum requirement of 12%.
Traffic benefits are a function of reductions in veh-km and veh-hrs of travel by road. The latter
are commonly known as ‘decongestion benefits’. These benefits would be high if Enderamulla
were to be selected but almost as great if Veyangoda or Peliyagoda/Telangapata were selected.
Veyangoda has a high EIRR because its traffic benefits are large in relation to the project cost.
Environmental, resettlement and social issues
Environmental, resettlement and social issues influence site selection. Enderamulla would have
a high level of negative environmental impacts, Veyangoda a low one. The negative
environmental impacts were scored out of 70 for physical impacts, 55 for biological impacts and
75 for socio-economic impacts, a total of 200. Resettlement costs would be significant at
Ratmlana. They would be high at Peliyagoda/Telangapata, especially in phase 2 when business
premises must be taken over to accommodate the long trains. It is anticpated that many daily
paid labour jobs would be created at Peliyagoda/Telangapata, some at Enderamulla.
Fulfilment of Government of Sri Lanka’s international commitments
The feasibility study has identified three projects – based on ICDs at Veyangoda, Enderamulla
and Peliyagoda/Telangapata – that satisfy ADB financial and economic performance
requirements and have been assessed for environmental, resettlement and social factors. It is,
therefore, possible to satisfy international commitments made by the Government of Sri Lanka.
These are given in full in the Ministry of Transport’s letter of 2nd February 2012 commenting on
the Draft Final Report. In brief, they are:
• Inter-governmental Agreements on the Asia Highway Network and the Trans Asian
Railway, which entered into force in 2005 and 2009 respectively;
• Agreement on the international importance of dry ports, as a refinement to these
Inter-Governmental Agreements, at a 2011 September 13th – 14th meeting of the
Committee on Transport; and
• Commitment to the UNESCAP South and South West Asia sub-region to establish dry
ports, to be confirmed in an agreement due to be signed in 2013.
Summary of the assessment of the ICD sites
Ratmalana cannot proceed on its own. It has a low financial internal rate of return (FIRR) and an
economic internal rate of return (EIRR) less than the ADB’s 12% minimum.
Veyangoda, Enderamulla and Peliyagoda/Telangapata would all produce reasonable FIRRs,
suitable for either public ownership or for Public Private Partnership. They also have EIRRs well
in excess of ADB’s 12% minimum. Enderamulla has the best FIRR and Veyangoda the best EIRR.

TA 7600 SRI – Multimodal Transport Project Sri Lanka
Final Report 340
Adding Ratmalana to any of Veyangoda, Enderamulla or Peliyagoda/Telangapata, giving a two-
ICD project, would reduce the FIRRs and EIRRs of those projects.
Recommendation
In our view, maximizing throughput and the financial return are paramount. Enderamulla would
yield a higher FIRR than Veyangoda and would be a much more ambitious project (design
throughput 811,838 TEU per annum versus 318,781). It is recommended that Enderamulla
proceed immediately, plus the Sedawatta link and a 4-track New Port railhead for later
provision of a southern ICD site.
It is recommended that implementation of Ratmalana be delayed for a few years until:
(a) Throughput can be expected to be higher and returns better
(b) RDA’s plans for the southwards extension of Marine Drive, which could cross our site,
and for improved east west links connecting Marine Drive, Galle Road and the Southern
Expressway become clearer. Timing is important.
Ownership
The practical options for ownership of the ICDs, New Port railhead and equipment are:
Public ownership: Sri Lanka Ports Authority the sole owner
Public ownership: SLPA the main owner with Sri Lanka Railways in support
Public Private Partnership: Private sector investor + SLPA as the sole public sector owner
Public Private Partnership: Private sector investor + SLPA as the main public sector owner + Sri
Lanka Railways as a minority investor
The final choice between public ownership and PPP is likely to depend on the size of loan that
ADB is willing to make. Our thinking is that if ADB is willing to lend 85% of the project cost, the
Government of Sri Lanka would contribute the remaining 15% and opt for public ownership. If
ADB is only willing to lend a much smaller proportion of the project cost, GoSL would do better
to select PPP and gain the benefit of private sector input. ADB loans for public sector projects
are at a lower rate of interest than for PPP projects.
Outsourcing
Ownership is not the same thing as managing the facility. It is perfectly possible to have public
ownership and to outsource the management of the facility or parts of it to the private sector.
-----------------------------------------------------------------------------------------------------------------------------
Sri Lanka Ports Authority and their Peliyagoda ICD site
SLPA have decided to proceed with an ICD at Peliyagoda, with provision for expansion into
Telangapata. They have produced a plan of their proposed railhead in Colombo Port and
provided summary information of their scheme. It differs from our PelTel scheme in that their
railhead would be on the Peliyagoda side of CKE and it would use ultra-short trains carrying 30
TEU. Twenty trains per day would be run in each direction, giving an annual throughput of
420,000 TEU.
It is not known how SLPA propose to increase annual capacity as demand grows towards
1,000,000 TEU per annum in the long term. Some options are discussed in Appendix A,
including later provision of a truncated site at Enderamulla.

TA 7600 SRI – Multimodal Transport Project Sri Lanka
Final Report 341
APPENDIX A – SLPA’s PELIYAGODA SCHEME AND COMPLEMENTARY LONG TERM OPTIONS
A1 SLPA’s policy and Peliyagoda scheme
At the second Tri-partite Workshop for the presentation of the Draft Final Report, held at the
Galadari hotel on Friday 20th January 2012, Dr Wickrama, Chairman of the Sri Lanka Ports
Authority, stated that SLPA would proceed with the construction of an ICD at Peliyagoda using
their own resources. In conversation afterwards, Dr Wickrama confirmed that:
• It was SLPA’s intention to implement and control the Dry Port / ICD construction
programme for Sri Lanka’s ports;
• One ICD site at Peliyagoda was sufficient for Colombo Port;
• ICDs to serve Sri Lanka’s other ports would be proposed by SLPA as the need arose;
• Revenue from stuffing/activities, expected to profitable, would be retained by SLPA;
• Some other activities would be leased to the private sector by competitive tender;
• High revenue from transport and cranage charges was not essential; such charges would
be at ‘reasonable levels’, ‘for the benefit of the nation’; and
• The long term potential throughput of an ICD at Peliyagoda was approximately
1,000,000 (one million) TEU per annum.
Subsequently, in two letters from the Chairman of SLPA, Dr Wickrama, an outline of SLPA’s
scheme was supplied. There are supporting drawings.
Dr Wickrama’s letter of 18th March 2012 stated:
“SLPA has selected a land at Peliyagoda and preliminary planning has been commenced to
implement the project. This land will be connected with the rail track so that transport of
containers will be done by train. Main objective of the project is to shift following activities to
the proposed Peliyagoda site as this will help to minimize traffic congestion due to transport of
containers on the road.
1. LCL operations.
2. Container (export) transfers.
3. MCC/SPECIAL cargo operations.
4. Providing facilities for BONDING and ENTRE PORT cargo operations etc.
However, there will be a consideration by the SLPA for outside operators to handle MCC,
BONDING and SPECIAL operations other than LCL cargo operations depending on the
requirement and necessary approval of the SLPA.”
A subsequent letter of 29th May 2012, written in response to a request for additional
information by Roughton International, stated:
“The requested information is summarized below for your information.
(01) The planned length of the Train at the initial stage is 230m length and it includes 15
number of wagons having 02 numbers of TEU capacity each.
(02) It is expected to operate Twenty numbers trains per day.

TA 7600 SRI – Multimodal Transport Project Sri Lanka
Final Report 342
(03) Railhead inside the Colombo Port is 300m x 25m and it is expected to deliver and
receive containers from and to the Railhead using stacking yards already available at
the JCTs and other terminals. Hence, number of container rows and stacking height are
not relevant to the Colombo Port Railhead.
(04) SLPA also stress the need of Sedawatta Loop and a passing loop (outside the port) is
mandatory for an uninterrupted and smooth transportation system of containers. It is
also noted the involvement of compensation for this work.
(05) Drawings of the proposed Railhead at the port is forwarded herewith please.”
A2 Comments on the proposed SLPA Peliyagoda scheme
A2.1 Information Provided
SLPA’s Peliyagoda scheme differs radically from Roughton International’s Peliyagoda /
Telangapata (PelTel) proposal. In the latter, the ICD railway track would remain on the
Telangapata side. In the former, an arch would be built underneath the Colombo – Katunayake
Expressway to accommodate a railway track leading to the Peliyagoda side. Roughton
International has been shown several drawings of possible railway track alignments to fit under
such an arch; it seems that tight track radii of approximately 130 metres would be needed.
SLPA plan to use ultra-short trains carrying 30 TEU each, less than the short trains carrying 45
TEU that Roughton International have proposed during Stage 1 of the project (up to 2020).
The plans provided to us for the port rail indicate parallel track sections of 300m, plus tapers
either end. Although we have not received plans of SLPA’s proposed Peliyagoda ICD
development, the site dimensions indicate that this would also be the maximum length of rail
head achievable west of the Katunaya expressway.
There is no explicit mention of FCL operations or container (import) transfers, so some
clarification of the split between port and ICD business is needed.
A2.2 Capacity of SLPA’s initial Peliyagoda scheme
Based on SPLA figures, the annual 2-way throughput for their initial Peliyagoda scheme is 2
directions x 20 trains/day x 30 TEU/train x 350 operating days/year, = 420,000 TEU. This is
confirmed by the assessment below.
The annual TEU capacity of a system based on one or two ICDs and a port railhead is the lower
of two calculations:
• The capacity of the single track harbour line immediately outside the port, as boosted
by the provision of a passing loop; and
• The capacity derived from the train cycle time for loading, transporting and unloading
trains, in both directions, and the number of trains that can operate simultaneously.
According to Scott’s formula (see Chapter 6 of Volume 1), the ultimate capacity of the single
track line is 40 trains per day, 20 in each direction. A harbour line passing loop would increase
this slightly but it would be difficult to build the passing manoeuvres into a detailed schedule.
We shall take 20 trains each way per day as the practical capacity.

TA 7600 SRI – Multimodal Transport Project Sri Lanka
Final Report 343
In Chapter 6, we undertook detailed train planning for the combination of 12 long trains each
way per day to Enderamulla and 4 long trains each way per day to Ratmalana. Figure 6.2
displays the train diagram for a 24-hour period in 2034. It shows that 4 trains could operate the
shuttle service. Four trains in operation simultaneously is taken as the practical limit for any
container service operating between the port and one or two ICDs.
We can use information in the tables of sub-section 6.2.6 of Volume 1 to determine the train
cycle time for short and ultra-short trains. The cycle would be comprised of:
• 90 minutes to unload and load at the port railhead;
• 5 minutes delay (e.g. waiting clearance from the controller);
• 36 minutes transit time;
• 90 minutes to unload and load at the ICD site;
• 5 minutes delay (e.g. waiting for a signal); and
• 36 minutes transit time.
Thus, the cycle time would thus be 262 minutes, leading to 5.5 round trips per train per day. It
would be possible to operate 4 trains simultaneously, leading to 22 round trips in total. The
carrying annual capacity based on the train cycle would be 22 x 60 x 350 = 462,000 TEU.
In conclusion, the capacity of a system based on SLPA’s Peliyagoda ICD proposals would be Min
(420,000, 462,000) = 420,000 TEU per annum.
A2.3 Implementation Issues
The arch under CKE must accommodate international standard 9’6” containers in order for the
SLPA scheme to be commercially viable, so the means to achieve this must be addressed:
• What is the cost of constructing the arch under CKE? If RDA have offered to construct it
at no cost, that affects financial analysis but not economic analysis. It still involves Sri
Lanka resources;
• Has it been necessary to alter the vertical alignment of CKE to accommodate the arch?
• Has it been necessary to lower the track under the arch to below ground level? If so,
what are the drainage plans?
• Does the rolling stock need to have ultra-small wheels so as to lower the container
carrying platform?
• Does the proposed railway track cross New Nuge Road and/or the canal system? If so,
what mitigation measures are needed?
Other major questions that would have to be addressed are:
• Would illegal settlers (squatters) be resettled, compensated or evicted without
compensation? Under ADB’s Safeguard Policy 2009, such settlers have rights but under
the Sri Lanka Land Acquisition Act they do not. SLPA have promised compensation along
the Sedawatta link the harbour line passing loop but there has been no statement about
compensation within the Peliyagoda ICD site; and
• Is there a long term plan, with drawings, to increase the capacity of SLPA’s Peliyagoda
ICD to 1,000,000 TEU per annum?
Were SLPA to seek an ADB loan for their scheme as outlined, there would need to be an audit
after SLPA had taken their planning and preliminary design to the level we have taken our

TA 7600 SRI – Multimodal Transport Project Sri Lanka
Final Report 344
schemes. The audit would need to be reasonably wide ranging, covering physical, operational
and commercial aspects of their proposals as well as resettlement and environmental issues.
Compliance with ADB Safeguard Policy 2009 would be required. Roughton International’s work
on the Sedawatta link alignment, resettlement, cross sections and quantities would make
useful starting points. So, too, would the Resettlement Plan and the environmental assessment
for RI’s PelTel site.
Such an audit though would cause a delay. In the remainder of this appendix, therefore, we
assume that due to SLPA’s stated urgency they will proceed with their initial scheme using their
own funding sources.
A3 Planning for long term demand
SLPA and Roughton International agree that by 2034 demand could reach 1,000,000 TEU per
annum, especially if SLPA bear down on the transport and cranage charges as promised. We
therefore need to address capacity issues, and examine all options for increasing capacity from
420,000 TEU per annum to approaching 1,000,000 TEU per annum.
As virtually all currently available train paths are used up by SLPA’s initial Peliyagoda proposal,
the only conceptual options for increasing capacity are:-
• Increasing the number of train paths, or
• Using longer trains
We have only briefly considered the first of these options. Increasing train paths would require
double-tracking a substantial portion of the route, including within the port, the arch under the
main road, and most of the route, including use of a second track over the new Kelaniya railway
bridge (either by addition of a further track or joint use of a passenger one.) Provision of
additional train paths therefore seems unrealistic, and the rest of this assessment addresses
use of longer trains.
It should be noted that this has major implications for upgrade costs both at the Port railhead,
and at Peliyagoda. The planned railhead in the port is more or less constrained to its current
length by a proposed internal road bridge at one end and by the Main Stores building at the
other. It is designed for 30 TEU trains, though might take slightly more. The overall dimensions
of the Peliyagoda site limit a railhead there, west of the expressway, to a similar length, and any
upgrade to longer trains is likely to involve relocation of the railhead to the Telangapatha side.
In section A4 we assess two capacity upgrades involving an expansion of SLPA’s Peliyagoda
scheme. In section A5 we assess three capacity upgrades involving the provision of a second
ICD site in addition to Peliyagoda.
A4 Expansion of SLPA’s Peliyagoda scheme to 1,000,000 TEU per annum
A4.1 First upgrade option – long trains (105 TEU)
With a move to long trains (105 TEU), a harbour line passing loop might not be long enough,
and we would introduce a contingency factor, as for the Roughton International Enderamulla /
Ratmalana scheme, using only 32 of the 40 train paths. The effects would be:
• Harbour line annual capacity increased to 32 x 105 x 350 = 1,176,000 TEU;

TA 7600 SRI – Multimodal Transport Project Sri Lanka
Final Report 345
• Unload / load time increased from 90 minutes to 105 minutes (only a modest increase
because additional rubber tyred gantries could be deployed);
• Train cycle time increased to 292 minutes, leading to 4.93 round trips per train per
day, or 19 round trips per day in total;
• Capacity based on the train cycle time increased to 19 x 210 x 350 = 1,396,500 TEU.
Therefore, a move to long trains (105 TEU) trains would provide sufficient capacity to meet a
1,000,000 per annum TEU demand. However, such trains are not favoured by SLPA because of
operational considerations inside the port, so this option is not carried forward.
A4.2 Second option – intermediate length trains (75 or 70 TEU)
Intermediate length trains would make use of the harbour line passing loop and the harbour
line capacity would be 20 trains each way each day. To give a line capacity of 1,000,000 TEU per
annum, each train would have to carry 1,000,000 / (2 x 20 x 350) = 71 TEU.
Using a train cycle time of 292 minutes, implying 19 round trips per day, the train carrying
capacity needed to hit the 1,000,000 TEU per annum target would be 1,000,000 / (19 x 2 x 350)
= 75 TEU.
As a practical compromise, trains carrying 35 of the 2 TEU wagons being ordered by SLPA would
yield 70 TEU per train and a capacity, based on the train cycle time, of 931,000 TEU per annum.
Such a train would be 527 metres long and the harbour line passing loop would need to be long
enough to accommodate it; the harbour line has approximately 2 km of straight track, so this
should be possible.
This second option is taken forward to the summary of alternatives in Section A6.
A5 Provision of an additional ICD site to achieve 1,000,000 TEU per annum
A5.1 Preliminary assessment
If little or no expansion at the Peliyagoda site were possible (other than provision of a longer
railhead), construction of an additional ICD site would be needed to deliver the required
capacity. We have assessed two possible upgrades involving Peliyagoda plus a site at
Veyangoda, and an upgrade involving Peliyagoda plus a truncated Enderamulla site (a smaller
site than the one proposed by RI).
In making our assessment, we first looked at the potential demand by adapting our multimodal
transport model to consider the following 3-way transport choices between the port and each
origin / destination:
• Road only, rail & road via Peliyagoda ICD, rail and road via Veyangoda ICD; and
• Road only, rail & road via Peliyagoda ICD, rail and road via Enderamulla ICD.
The results are shown in Table A.1 below, retaining the same unit prices per rail trip from port
railhead to ICD as used for the single site case.

TA 7600 SRI – Multimodal Transport Project Sri Lanka
Final Report 346
Table A.1 Demand for two ICD sites vs demand for one ICD site
ICD site Context Rail price
(Rs/trip)
2015 2024 2034 Market
share
Peliyagoda/Telangapata + Veyangoda
Peliyagoda Two competing 4,675 255,170 438,480 740,097 16.8%
Veyangoda Two competing 7,175 88,935 152,824 257,948 5.9%
Total Two competing 344,104 591,304 998,045 22.7%
Peliyagoda Single site 4,675 280,047 481,229 812,252 18.5%
Veyangoda Single site 7,175 109,784 188,651 318,419 7.2%
Peliyagoda/Telangapata + Enderamulla
Peliyagoda Two competing 4,675 219,113 376,521 635,519 14.5%
Enderamulla Two competing 5,000 220,677 379,209 640,055 14.6%
Total Two competing 439,791 755,730 1,275,575 29.0%
Peliyagoda Single site 4,675 280,047 481,229 812,252 18.5%
Enderamulla Single site 5,000 280,075 481,277 812,333 18.5%
Superficially, these results look encouraging – competition between two northern sites means
that each achieves less than its full potential but in both cases the total is greater than for
Peliyagoda on its own. However, capacity, determined by the number of train paths per day on
the harbour line, is still a limiting factor. This is particularly true when Veyangoda is one of the
two ICD sites, since Veyangoda can only accommodate short trains (45 TEU).
In considering the provision of an additional ICD site, we have based our calculations on short
45 TEU trains (15 X 3 TEU wagons each 20.2 metres long) and intermediate length 75 TEU trains
(25 x 3 TEU wagons). The 2 TEU wagons favoured by SLPA are 14 metres long. Trains of similar
length in metres, based on the 2 TEU wagons, would be 42 TEU (21 wagons) and 70 TEU (35
wagons) respectively, having roughly 7% less carrying capacity, which is acceptable.
None of the additional site options that we now consider would retain the ultra-short 30 TEU
trains, either in Peliyagoda or in the additional site. Given the limited number of train paths
available, they could not provide sufficient capacity. All of the upgrades would therefore
involve longer railheads in Peliyagoda and in Colombo Port.
It should be noted that all the above train length options are less than the 105 TEU trains
recommended in the main report, and will therefore to varying degrees be a little bit less
economic per TEU to run.
A 5.2 Peliyagoda & Veyangoda combination
If 45 TEU trains were used between the port railhead and each ICD site, then the train cycle
times would be 262 minutes for Peliyagoda as derived above and 342 minutes for Veyangoda,
which is 30 km further from the port. Assuming a ratio of 3 trains to Peliyagoda for every train
to Veyangoda, the weighted average train cycle time would be 282 minutes. That would give
5.1 train cycles per train pr day, or 20.4 train cycles per day for 4 trains in operation. Capacity
based on train cycle time would therefore be 20.4 x 90 x 350 = 642,600 TEU per annum. To
reduce demand to this level would involve an increase in rail transit unit prices in excess of Rs
600 per TEU trip, as shown in Table A.2 below.

TA 7600 SRI – Multimodal Transport Project Sri Lanka
Final Report 347
Table A.2 Demand for Peliygoda + Veyangoda (increased rail transit price)
ICD site Context Rail price
(Rs/trip)
2015 2024 2034 Market
share
Peliyagoda/Telangapata + Veyangoda
Peliyagoda Two competing 5,313 159,540 274,152 462,733 10.5%
Veyangoda Two competing 7,813 61,970 106,489 179,739 4.1%
Total Two competing 221,510 380,640 642,472 14.6%
A5.3 Peliyagoda & Veyangoda combination (variant)
The only way to boost annual capacity would be to run 45 TEU trains to Veyangoda and 75 TEU
intermediate length trains to Peliyagoda. Operationally that would be difficult and it would
need the active cooperation of SLPA.
The train cycle times would be 292 minutes for Peliyagoda and 342 minutes for Veyangoda,
which is 30 km further from the port. Assuming a ratio of 3 trains to Peliyagoda for every train
to Veyangoda, the weighted average train cycle time would be 304.5 minutes. That would give
4.7 train cycles per train pr day, or 18.9 train cycles per day for 4 trains in operation. Capacity
based on train cycle time would therefore be 18.9 x 2 x (75x0.75 + 45x0.25) x 350 = 893,025
TEU per annum.
A5.4 Peliyagoda + Truncated Enderamulla combination
For the Peliyagoda + Enderamulla combination, an increase of Rs 400 per TEU trip from the port
railhead to each ICD would dampen total demand to 1,000,000 TEU per annum. This could be
achieved using the harbour line passing loop, together with intermediate length (75 TEU) trains.
Table A.3 Demand for Peliyagoda + Truncated Enderamulla (increased rail transit price)
ICD site Context Rail price
(Rs/trip)
2015 2024 2034 Market
share
Peliyagoda + Enderamulla
Peliyagoda Two competing 5,075 171,127 294,062 496,339 11.3%
Enderamulla Two competing 5,400 173,420 298,002 502,989 11.4%
Total Two competing 344,547 592,064 999,328 22.7%
A6 Long term recommendation if SLPA’s Peliyagoda scheme is implemented
The currently planned SLPA scheme will deliver less than half of the capacity required in the
long term, which is 1,000,000 TEU per annum. Table A.4 below summarises the contending
options to increase system capacity in the longer term.

TA 7600 SRI – Multimodal Transport Project Sri Lanka
Final Report 348
Table A.4 Summary of options to deliver overall throughput of 1,000,000 TEU pa by 2034
Scheme name Features / comments
Expansion of SLPA’s Peliyagoda
site
Use trains capable of carrying 75 TEU / 70 TEU
Would deliver annual throughput approaching 1,000,000 TEU
Pelyagoda + Veyangoda ICDs Use trains capable of carrying 45 TEU (Veyangoda constraint)
Would only deliver annual throughput of 642,600 TEU
Pelyagoda + Veyangoda ICDs
(variant)
Use trains carrying 75 TEU / 70 TEU to/from Peliyagoda
Use trains capable of carrying 45 TEU to/from Veyangoda
Operationally difficult to mix trains of different lengths
Would deliver annual throughput approaching 900,000 TEU
Pelyagoda + Truncated
Enderamulla ICDs
Use trains capable of carrying 75 TEU / 70 TEU
Would deliver annual throughput approaching 1,000,000 TEU
Note: It is assumed that SLPA’s initial scheme includes Sedawatta link and a harbour line
passing loop.
The two schemes most likely to deliver a throughput of about 1,000,000 TEU per annum are:
• Expansion of SLPA’s Peliyagoda site; or
• SLPA Peliyagoda site amended + Truncated Endermulla ICD.
Which of these two schemes is most likely to be cost effective may be determined when SLPA
have defined their initial scheme in more detail. In both cases, the railheads in Colombo Port
and in the Peliyagoda ICD site would need reconstruction to accommodate longer trains.
Trains would have to be able to carry 75 TEU, based on 25 of the 3 TEU wagons identified by RI.
Alternatively, 70 TEU trains, based on 35 of the 2 TEU wagons favoured by SLPA, could be
operated. SLPA’s dislike of long (105 TEU) trains, for operational reasons inside the port, is
known. However, 70 or 75 TEU trains would be needed to meet the long term capacity
requirement because the number of train paths available is limited, even with the passing loop.
A financial evaluation of constructing a truncated Enderamulla project in 2020, with an
evaluation period from 2021 to 2040, is summarized below. The evaluation is compared with
the financial evaluation of the full Enderamulla project from 2014 to 2040.
Table A.5 Financial evaluation of a Truncated Enderamulla project
Item Unit Full Enderamulla
project (Capex in 2014
and 2020)
Truncated Enderamulla
project (Capex in 2020)
Design throughput TEU/annum 811,838 502,989
20 years of revenue Rs million 110,657 91,340
ICD costs including rolling stock Rs million 44,294 35,081
Railhead costs in the port Rs million 7,787 8,033
Container control system Rs million 258 268
Sedawatta link Rs million 928 Sunk cost
Harbour line passing loop Rs million Not included Sunk cost
21 years of costs Rs million 53,267 43,482
FIRR % 19.0% 18.6%
Add Peliyagoda ICD upgrade costs Rs million Not applicable 5,000
Revised FIRR % Not applicable 13.3%
TA 7600 SRI – Multimodal Transport Project Sri Lanka
Final Report 349
In the evaluation of a truncated Enderamulla project, it has been assumed that the Sedawatta
link and the harbour line passing loop would be sunk costs, having been constructed as part of
SLPA’s initial Pelyagoda scheme. The FIRR would be 18.6%. However, some allowance must be
made for the cost of modifying the Peliyagoda ICD site to take longer trains and a slightly higher
throughput. If Rs 5,000 million is allocated for this, then the anticipated FIRR drops to 13.3%.
Our provisional conclusion, therefore, is that construction of a truncated Enderamulla ICD in
2020, together with the necessary complementary upgrades to the port railhead, the container
control system and within the Peliyagoda ICD site, would be a financially viable project.
However, expansion of Peliyagoda to use the Telangapatha side of the site would be expected
to have a cost advantage, provided the design of SLPA’s Phase 1 scheme takes the requirement
for subsequent expansion to 1,000,000 TEU per annum throughput adequately into account.

TA 7600 SRI – Multimodal Transport Project Sri Lanka
Final Report 350
APPENDIX B – RESPONSES TO COMMENTS ON THE DRAFT FINAL REPORT
tm3
Typewritten Text
tm3
Typewritten Text
tm3
Typewritten Text
tm3
Typewritten Text
(This information has been removed as it falls within exceptions to disclosure specified in paragraph 97, (i) & (ii) of ADB's Public Communications Policy.)
tm3
Typewritten Text
tm3
Typewritten Text
tm3
Typewritten Text
tm3
Typewritten Text
tm3
Typewritten Text
tm3
Typewritten Text
tm3
Typewritten Text

TA 7600 SRI – Multimodal Transport Project Sri Lanka
Final Report 351
APPENDIX C – TERMS OF REFERENCE

SRI LANKA MULTIMODAL TRANSPORT PROJECT OUTLINE TERMS OF REFERENCE FOR CONSULTANTS
A. Background
1. Due to its geographical location as an island nation, efficient sea transport is essential to achieve higher levels of economic growth needed for sustainable poverty reduction in Sri Lanka. To fully benefit from the enhanced capacity of Colombo Port, sustainable and environmentally friendly hinterland transport is required combined with supporting functions for packing, storage and value addition to goods. Due to congestion in Colombo City surrounding the Colombo Port area, the Government of Sri Lanka (GOSL) intends to establish up to two dry ports with integrated multimodal logistic centers in the vicinity of Colombo and connect these dry ports via railway lines to Colombo Port. The existing railway line to Colombo Port needs to be rehabilitated, the dry ports need to be connected to the railway network and transshipment yards have to be constructed in the dry ports and in Colombo Port. Furthermore, capacity constraints on the railway network in and around Colombo have to be addressed and Sri Lankan Railways (SLR) needs adequate rolling stock, maintenance facilities, signaling, communication and lifting equipment to cater the additional demand triggered by the multimodal logistic centers. 2. ADB is supporting the development of Colombo Port by the ongoing Loan 2319-SRI: Colombo Port Expansion Project. The container-handling capacity of Colombo Port will be increased from 3.3 million twenty foot equivalent units (TEU) in 2006 to 8.1 million TEU by 2015 and 10.5 million TEU by 2024. The Project will facilitate economic growth by enhancing national competitiveness in international trade via lower costs and faster delivery times. Export container traffic handled by Colombo Port is expected to increase by 9.5% per annum starting in 2011. Whilst the ongoing project in Colombo Port will especially support the port’s role as a regional hub as described in the SAARC Regional Multimodal Transport Study (SRMTS) 1, which identified Colombo Port as SAARC Maritime Gateway No. 10. The proposed project will improve Colombo Port’s ability to cater the national Sri Lankan market and improve therefore sustainable economic growth in Sri Lanka. Shifting the hinterland transport of Colombo Port from road to rail will ease congestion in Colombo, improve road safety and benefit the environment by reducing emissions and noise from trucks. B. Consulting Services
3. As no feasibility study is available, this consulting service will prepares the Multimodal Transport Project for possible financing by ADB. A feasibility study with preliminary engineering design for all project components and economic and financial assessment will be carried out. The main outcome of the Technical Assistance (TA) will be the project design fully agreed to by the Government and ADB and related safeguards planning documents prepared. 4. The consulting services shall be carried out in two phases following an initial inception phase of one month, during which the consultant will discuss with the executing agency, the government and all major stakeholders to further agree on the scope and objective of the project and identify all relevant projects to be considered and parties involved. The consultant
1 South Asian Association for Regional Cooperation (SAARC), 2006:SAARC Regional Multimodal Transport Study
(SRMTS), supported by ADB RETA 6187: Promoting South Asian Regional Economic Cooperation; SAARC is composed of Afghanistan, Bangladesh, Bhutan, India, Maldives, Nepal, Pakistan, and Sri Lanka.

will submit an Inception Report within one month and organize a meeting with the executing agency and the government to discuss on the inception report. Afterwards, during the first phase of the project, the consultant shall review and all compare the potential locations for the multimodal logistic centers including road and rail access, carry out interviews with potential stakeholders and surveys for the traffic forecast as input for the technical, economic and financial viability of each option and summarize this in an interim report. The findings of the Interim Report shall be discussed with the Government in a tri-partite workshop comprising the executing agency, the consultants, ADB and other relevant stakeholders as required. This first workshop will discuss initial findings of the TA including potential private sector involvement (within 4 months after the start of services), and agree on the way forward for the second phase of the Feasibility Study with more detailed scrutiny of the proposals as outlined in these TOR. The Consultant will submit a Draft final Report after completion all the tasks as outlined in the TOR and organize a second workshop to discuss the findings of the feasibility study including safeguard-related requirements and procedures, and overall implementation of the project (within 7 months after the start of services). Based on the discussions during the second workshop and the written comments from the executing agency, ADB and other stakeholder, the consultant will complete the Final Report. 5. The TA will be carried out by a firm of consultants consisting of experts in transport planning, railway engineering, road and bridge design, transport economics and financial analysis, procurement and contract management, social impact assessment, involuntary resettlement and environmental assessment. The consultants firm will be recruited in accordance with ADB’s Guidelines on the Use of Consultants. The consultant will be selected in accordance with ADB's quality and cost based selection method with a quality to cost ratio of 90:10. Simplified technical proposals shall be submitted. 6. The TA, among other tasks, needs to adequately address the following aspects relating to the ensuing loan project: (i) detailed loan executing agency /implementing agency capacity assessment, and suggested remedial action plan to build executing agency and implementing agency capacity to minimize procurement and financial management risks; (ii) proposed or indicative loan related procurement plan with suggested level of priority or, if applicable, post review based on executing agency and implementing agency capacity assessment; and (iii) indicative implementation schedule with proposed sequencing of consultant recruitment and procurement bidding and awarding. C. Scope of Works
7. The team leader of the consultant will coordinate the preparation of all documentation required by ADB guidelines and the ADB project officer to develop the report and recommendation of the President document for the ensuing loan, including (i) a design and performance monitoring framework; (ii) project performance monitoring and evaluation arrangements, including baseline data; and (iii) an assessment of the detailed procurement and implementation arrangements. The team leader will be accountable for the quality and timeliness of all deliverables, and will ensure that all components are clearly and concisely documented to the full satisfaction of the ADB project team. The team leader will also be responsible for ensuring that the proposed investment that will be prepared through the feasibility study is complete, cohesive, economically and financially viable, and in full compliance with all pertinent ADB and Government policies and guidelines. The outline terms of references for the project preparatory TA consultants shall include the following:

a. Transport Planner/Team Leader (international, 6 person-months), Transport Planner/Deputy Team Leader (national, 7 person-months), Multimodal Transport Expert (international, 2 person-months), Road and Bridge Engineer (national, 3 person-months, two Railway Engineers (international 2 person-months and national, 3 person-months); Logistic and supply-chain Expert (national 2 person-months); Intermodal Expert (national 3 person-months):
8. The activities of the above positions shall include, but not be limited to the following:
(i) Review available data and studies, establish the overall scheme for the multimodal transport and identify alternatives and conduct the necessary surveys;
(ii) Liaise with all parties involved in the project, especially Colombo Port Authority, the future operator of the new container terminal, potential shippers from the dry port, etc. to optimize the design for the project;
(iii) Prepare in the inception period an approval procedure for the preliminary design process and identify all stakeholders in the railway, government authorities and other related agencies to be involved including the time allocated for review and approvals.
(iv) Establish a general layout of the integrated multimodal logistic centers including dry ports, free port area, road and railway lines, lifting equipment, auxiliary services etc. and design and/or specify all components required;
(v) Establish the train operation program for the multimodal transport project together with the existing infrastructure layout, including locations of stations with passing loops, crossovers, signals, stations and yards, connections of Colombo Harbor Station and the dry ports to the existing network, etc. to identify key infrastructure bottlenecks in the short and long term scenario, recommend options to optimize the infrastructure layout and propose standard layouts from operational point of view.
(vi) Review the signaling and dispatching system and recommend measures to increase the transport capacity, quality, flexibility and reliability of operation by analyzing the impact of additional intermediate block signals, location and layout of passing loops, turnouts with higher operation speed in the diverging tracks, crossovers in regular intervals, bi-directional operation on both tracks, etc. on the line capacity during normal and degraded operation and in case of maintenance.
(vii) Review the design and operation of the existing level crossings and propose improvements considering for example automatic barriers for those level crossings not replaced by road-over bridges (ROB).
(viii) Review the safety concept for freight train operations and propose improvements if necessary, considering the transport of dangerous goods, trains passing bridges in case of strong wind, alignment in tunnels, if any, and underpasses, fencing of the line, ROB, alignment parallel along existing roads and passing congested areas, etc.
(ix) Develop a design standard for rehabilitation/improvement of railways and for new roads based on the traffic forecast;
(x) Assess the technical feasibility of the design and alignments; alternatives based on inputs from technical, financial, social, resettlement and environmental studies, recommend a preferred alignment for further study; conduct a preliminary geometric design;
(xi) Prepare the preliminary engineering design of the physical infrastructure for the selected option including alignment design, all civil works structures such as

bridges and culverts, railway track, signaling and telecom system, roads, equipments as cranes and storage yards to be constructed in the dry port and port areas etc. and the related reports on resettlement, safeguard issues etc. to prepare a comprehensive cost estimate for the project.
(xii) Review and supplement where necessary the preliminary engineering design with the horizontal and vertical alignment, alignment for stations, yards, connections with the existing railway network, bridges, tunnels and earthworks, all changes in existing infrastructure such as roads, waterways, power transmission lines etc. displaced by the project, all major auxiliary installations needed such as maintenance depots, buildings for signaling and telecom equipment etc.
(xiii) Prepare technical specifications for all civil works necessary for the project and all equipments to be purchased;
(xiv) Prepare the Bill of Quantities (BOQ) and Cost Estimate within a 10% margin of error; investigate availability and costs of local and imported construction materials and equipment;
(xv) Clarify with the borrower whether financing of taxes and duties is requested, and if so, calculate ADB's financing percentages inclusive of taxes and duties. considering ADB’s list of eligible expenditures.
(xvi) Develop a quality management system for the design and construction stage of the project;
(xvii) Prepare the terms of reference (TOR) for detailed design, project management and supervisory consultants who will be recruited for the implementation of the investment loans
(xviii) Review whether all components of the project can be implemented solely through central government involvement; of provincial or local authorities have authority over any part of the project component, the consultant shall consider this in the suggestions for implementation arrangements and identify, how the provincial governments will contribute to the counterpart funding obligations for the project.
(xix) Identify institutional and financial requirements for maintaining the project during operations; prepare relevant documents for ADB to process the loan.
b. Financial Adviser (international, 2 person-months):
9. The Financial Adviser will review the project design and identify components in the scheme suitable for private sector participation, describe the different possible schemes with their pros and cons, identify institutional arrangements to ensure efficient project implementation as well as operation and maintenance of the scheme. The Financial Advisor shall comment whether the current regulatory environment is sufficiently developed to launch private sector participation, discuss the findings with the Government and other relevant stakeholders and make recommendation on regulatory changes that may be deemed necessary.
c. Procurement Specialist (international, 2 person-months): 10. The activities of the above position shall include, but not be limited to the following:
(i) Prepare procurement and implementation arrangements including contract packaging and a project implementation schedule taking into account the geographic/socioeconomic conditions in the project area;
(ii) Prepare standard bid documents to be used in accordance with ADB’s Procurement Guidelines (2007, as amended from time to time);

(iii) Assist in finalizing civil works bidding documentation and bids evaluation, and prepare a procurement plan.
d. Transport Economist (international, 3 person-months, national 3 person-
months), Traffic Modeler (national, 3 person-months and Financial Analyst (national, 3 person-months):
11. The activities of the above positions shall include, but not be limited to the following:
(i) Review existing traffic data and study for the project area, if any; plan and carry out necessary traffic counts, origin-destination surveys and interviews; and forecast traffic demand over a 20-year period.
(ii) Undertake the economic evaluation following ADB's Guidelines for the Economic Analysis of Projects taking into account modal shift and diversion of existing traffic,
(iii) estimate the expected distribution of project net benefits among freight transport users, passenger transport users, vehicle owners, labor, the Government, and the economy in general, including international trade; conduct poverty impact assessment in accordance with ADB's Handbook for Integrating Poverty Impact Assessment in the Economic Analysis of Projects;
(iv) Conduct a quantitative risk analysis in accordance with ADB’s Handbook for Integrating Risk Analysis in the Economic Analysis of Projects.
(v) Undertake sensitivity analysis for various scenarios such as changes to the cost, generated and diversion traffic, modal shift, construction period, etc.
(vi) In cooperation with the environment expert, quantify the environmental benefits and costs of implementing the projects, rather than road use, to cater to demand.
(vii) Develop a project impact monitoring framework and carry out socio-economic baseline survey.
(viii) Carry out financial analysis and sensitivity analysis for the project. (ix) Obtain the financial internal rate of return (FIRR), and comparing the FIRR with
the weighted average cost of capital. (x) Identify financing requirements for operation and maintenance (O&M) of the
project; assess the level of funding required for sustainable O&M of existing assets and the availability of funds.
(xi) Carry out financial management assessment of Sri Lankan Railways in accordance with ADB guidelines, and provide advice how the financial management systems could be improved, e.g., action plan.
e. Social Development Expert (national, 3 person-months):
12. The Social Development Expert will prepare (i) Indigenous Peoples (IP) screening and impact categorization checklists, (ii) Summary Poverty Reduction and Social Strategy (SPRSS) and (iii) Indigenous Peoples Development Plans (IPDPs), if required, in accordance with ADB's Safeguards Policy Statement (SPS,2009) and other related policies such as the Public Communications Policy (2005). 13. Specifically, the tasks will include, but not be limited to, the following:
(i) Based on the issues identified in the summary Initial Poverty and Social Analysis (IPSA) report, review and analyze relevant available data and reports, and undertake field visits to the proposed Project sites.

(ii) Together with other team members, conduct interviews, focus group discussions or other meetings with stakeholders in order to determine the scale and scope for further detailed social analysis to make project design more pro-poor, socially inclusive, and sustainable, and to effectively deal with significant issues related to participation, gender, indigenous or vulnerable people, labor, affordability, HIV/AIDS transmission and human trafficking, or other social risks, including the need to prepare any action or mitigation plans or other measures.
(iii) Identify key stakeholders, possible barriers to benefiting the Project, prepare initial stakeholder analysis and initial C&P plan (see appendix 5 of the ADB Handbook on Social Analysis, 2007).
(iv) Assess the institutional, personnel, and financial capacities of the executing and implementing agencies and other stakeholders working with and for indigenous peoples, and develop a strategy for their participation in the project.
(v) Based on this initial review of existing documentation and field investigations, prepare and submit Indigenous Peoples (IP) screening and impact categorization forms for each sub-project road to ADB and the EA for review and comments.
(vi) Conduct in-depth social and poverty analysis, in accordance with ADB’s Handbook on Social Analysis (2007) and Poverty Handbook (2006), to assess local demand for the proposed road investments, employment opportunities, gender specific capacity to take advantage of the likely socioeconomic opportunities that would result from the Project, HIV transmission and/or other health and safety risks, and to collect baseline data for monitoring social impacts.
(vii) Conduct gender analysis and identify project design elements that have the potential to address gender equity if appropriate.
(viii) Propose measures to ensure that the Project is in compliance with national labor laws and international core labor standards.
(ix) If required, prepare separate Indigenous Peoples Development Plans (IPDPs) or specific actions for each relevant sub-project road in accordance with ADB's Safeguard Policy Statement (SPS, 2009).
(x) These IPDPs or specific actions should also incorporate the findings of the resettlement census to be conducted by the Resettlement Specialist (see TOR Part f).
(xi) Submit all draft final IPDPs to ADB and the EA for review and comments. (xii) Incorporate comments and finalize the IPDPs accordingly, then re-submit the
revised IPDPs based on Feasibility Studies to ADB through the EA. (xiii) Submit a draft final Poverty and Social Analysis (PSA) report to ADB and the EA
for review and comments. (xiv) Incorporate comments and finalize the PSA accordingly, then re-submit the
revised PSA to ADB through the EA. Summarize and submit these PSA findings in the Summary Poverty Reduction and Social Strategy (SPRSS) Report Form.
(xv) Conduct a workshop to provide guidance to the EA on Project-related social issues and ADB’s IP policy procedural requirements during Project preparation and implementation.
f. Resettlement Expert (national, 6 person-months):
14. The resettlement Expert will prepare (i) Involuntary Resettlement (IR) screening and impact categorization checklists, and (ii) Resettlement Plans (RPs) in accordance with ADB's Safeguard Policy Statement (2009) and other related policies such as the Public Communications Policy (2005).

15. Specifically, the tasks will include, but not be limited to, the following:
(i) Based on the issues identified in the summary Initial Poverty and Social Analysis (IPSA) report, review and analyze relevant available data and reports, and undertake field visits to the proposed Project sites.
(ii) Together with other team members, conduct interviews, focus group discussions or other meetings with stakeholders to identify permanent and temporary socioeconomic impacts as a result of possible land acquisition, changes of land use, or restrictions of access to assets and common property resources.
(iii) Based on this initial review of existing documentation and field investigations, prepare and submit Involuntary Resettlement (IR) screening and impact categorization forms for each sub-project road to ADB and the EA for review and comments.
(iv) If required, prepare separate Resettlement Plans (RPs) for each sub-project road in accordance with relevant laws and regulations related to land acquisition and resettlement; and ADB's Safeguard Policy Statement (2009). The scope and format of the required RPs should be consistent with ADB's Handbook on Resettlement: A Guide to Good Practice (1998).
(v) RPs should be based on a complete enumeration (100%) of all Affected People (APs) and their affected assets. RPs should also incorporate, where relevant, the findings of the socioeconomic survey to be conducted by the Social Development Consultant (see TOR Part e).
(vi) Define categories of impact and eligibility of affected persons for compensation, and prepare an entitlement matrix covering compensation for all lost assets and income, and assistance to achieve full replacement costs for lost assets, income, and livelihoods. Assess whether the compensation standards for all types of assets, crops, and trees are based on replacement value and discuss in detail the valuation methodology used.
(vii) Develop detailed budget and implementation schedules for the resettlement plan. (viii) Identify management, consultation, and dispute resolution mechanisms for the
resettlement plan. (ix) Review the organizational structure and capacity of executing and implementing
agencies to implement the resettlement plan and recommend improvements required before the start of land acquisition.
(x) Ensure that gender concerns are incorporated in the resettlement plan. (xi) Identify targets and indicators related to the resettlement plan for inclusion in the
DMF and PPMS, and make arrangements for internal and independent monitoring and evaluation.
(xii) Together with the executing agency, prepare and carry out a consultation plan and a format for documenting consultation with affected people, listing events, people consulted, documents disclosed, and timing of disclosure in accordance with ADB’s public communications policy (2005) and summarizing the issues raised, agreed actions, and improvements resulting from the consultation. Assess stakeholders’ concerns and consider possible changes in the project design to minimize resettlement impacts. Help the executing agency to finalize, disclose, and obtain government endorsement of the resettlement plan prior to submission to ADB for review and approval.
(xiii) As the resettlement plan is prepared based on a feasibility study or preliminary project design, it should also provide for updating the plan based on the detailed project design, and disclosing the updated plan to the affected persons prior to submitting it to A DB for review and approval.
(xiv) Submit all draft final RPs to ADB and the EA for review and comments. (xv) Incorporate comments and finalize the RPs accordingly, then re-submit the
revised RPs based on Feasibility Studies to ADB through the EA.
g. Environment Expert (national, 6 person-months):
16. The Environmental Expert will repare (i) environmental categorization form and environmental assessment checklist; and (ii) an initial environmental examination (IEE) or environmental impact assessment (EIA) in accordance with ADB's Safeguard Policy Statement (2009) by taking into consideration the Government's guidelines on Environmental Impact Assessment (EIA). 17. Specifically, the tasks will include, but not be limited to, the following:
(i) Undertake the reconnaissance survey for the project, and prepare the scoping and TOR of the EIA. The scoping will include the scope of study areas, sampling methods, and approach on assessment of the environmental impacts as required by government and ADB policies.
(ii) Process the approval for the scope and TOR in accordance with government and ADB requirements.
(iii) Undertake data collection to describe environmental conditions of the project areas and consultation with local community to gather their environmental concerns.
(iv) Gather data from the engineering consultant on the detailed project activities for the project to enable the accurate assessment of the potential environmental impacts.
(v) Assess the potential environmental impacts (direct and indirect impacts, and accumulated impacts) of the project and prepare the environmental management and monitoring plan (EMP).
(vi) Work closely with the transport economist to quantify environmental costs and benefits.
(vii) Undertake alternative analysis from environmental point of view for various transports and engineering options
(viii) Undertake second consultation with affected people of the project. (ix) Prepare the final draft EIA report and its summary with EMP for the project in
accordance to the Government and ADB’s requirement. This EMP should include: (a) clear identification of institutional arrangement for its implementation and potential involvement of community-based organizations as well as NGO, and (b) environmental costs including environmental monitoring plan.
(x) Facilitate the process of obtaining environmental clearance for the Project as per Government’s requirement

D. Time Schedule and Staff Requirements
18. For a team of experts, the assignment will be implemented for 8 months from April 2011 to December 2011. International inputs of 17 person-months and national inputs of 42 person-months are required as in Table 1.
Table 1: Summary of Consulting Services Requirement International National Name of Positions Person-months Name of Positions Person-months
Transport Planner (TL) 6 Transport Planner (Dty. TL) 7 Railway Engineer 2 Road and bridge Engineer 3 Multimodal Transport Expert 2 Railway Engineer 3 PPP Expert & Financial Adviser 2 Logistic and supply-chain Expert 2 Procurement Specialist 2 Intermodal Expert 3 Transport Economist 3 Transport Economist 3 Traffic modeler 3 Financial Analyst 3 Social Development Expert 3 Environmental Expert 6 Resettlement Expert 6 TL = Team Leader; Dty. TL = Deputy Team Leader Source: ADB E. Reports and Workshops
19. The consultants will submit the following reports:
Table 2: Summary of Major Outputs and Activities
Major Activities Expected
Completion Date Major Outputs Expected
Completion Date
Tri-partite meeting (Inception Report) June 2011 Inception Report May 2011 Mid-term workshop August-September
2011 Interim Report August 2011
Final workshop November-December
Draft Final Report November 2011
Feasibility Study November 2011 Final Report December 2011 Economic/Financial Analysis November 2011 Institutional Assessment November 2011 Safeguard Documents November 2011 Source: ADB 20. In addition, during TA implementation, the consultant will submit monthly progress reports. 21. ADB requires 3 copies of each report, and the EA requires 3 copies of each report. ADB and EA require also a softcopy of the report. 22. The consultants will also organize two tripartite meetings/workshops comprising the executing agency, the consultants, ADB and other relevant stakeholders as required. The first meeting/workshop will discuss initial findings of the TA including potential private sector involvement (within 3 months after the start of services), and the second meeting/workshop will

discuss feasibility study of the project including safeguard-related requirements and procedures, and overall implementation of the project (within 5 months after the start of services).