Project Completion Report: Sri Lanka: Southern Province ...
88
Completion Report Project Number: 31282 Loan Number: 1849 December 2010 Sri Lanka: Southern Province Rural Economic Advancement Project
-
Upload
khangminh22 -
Category
Documents
-
view
2 -
download
0
Transcript of Project Completion Report: Sri Lanka: Southern Province ...
Completion Report
Project Number: 31282 Loan Number: 1849 December 2010
Sri Lanka: Southern Province Rural Economic Advancement Project

CURRENCY EQUIVALENTS
Currency Unit – Sri Lanka rupee/s (SLRe/SLRs)
At Appraisal At Project Completion 27 July 2001 1 October 2010
SLRs1.00 = $0.011 $0.009 $1.00 = SLRs90.00 SLRs112.100
ABBREVIATIONS
ADB – Asian Development Bank AWDR – average weighted deposit rate AWPLR – average weighted prime lending rate EA – executing agency EDS – enterprise development service EIRR – economic internal rate of return ENPV – economic net present value FIRR – financial internal rate of return ICB – international competitive bidding Km – kilometer LCB – local competitive bidding NDB – National Development Bank OFID – OPEC Fund for International Development OPEC – Organization of the Petroleum Exporting Countries PCR – project completion report PIC – project implementation consultant PFI – participating financial institution PPMC – provincial project management committee PMO – project management office SDR – special drawing right SME – small and medium-sized enterprises SPC – Southern Provincial Council SPRDA – Southern Provincial Road Development Authority
NOTES
(i) The fiscal year (FY) of the government ends on 31 December. FY before a calendar year denotes the year in which the fiscal year ends, e.g. FY2009 ends on 31 December 2009.
(ii) In this report, "$" refers to US dollars.

Vice-President X. Zhao, Operations 1 Director General S.H. Rahman, Director General, South Asia Department (SARD) Director R. Vokes, Sri Lanka Resident Mission, SARD Team leader K. M. Tilakaratne, Senior Project Implementation Officer, Sri Lanka
Resident Mission, SARD Team member N. Buhar, Administrative Assistant, Sri Lanka Resident Mission, SARD
A. M. Rajapakse, Assistant Project Analyst, Sri Lanka Resident Mission, SARD J. A. Ranaweera, Disbursement Analyst, Sri Lanka Resident Mission, SARD
In preparing any country program or strategy, financing any project, or by making any designation of or reference to a particular territory or geographic area in this document, the Asian Development Bank does not intend to make any judgments as to the legal or other status of any territory or area.

CONTENTS
Page
BASIC DATA ii
I. PROJECT DESCRIPTION 1 II. EVALUATION OF DESIGN AND IMPLEMENTATION 2
A. Relevance of Design and Formulation 2 B. Project Outputs 3 C. Project Costs 4 D. Disbursements 5 E. Project Schedule 6 F. Implementation Arrangements 6 G. Conditions and Covenants 7 H. Consultant Recruitment and Procurement 7 I. Performance of Consultants, Contractors, and Suppliers 8 J. Performance of the Borrower and the Executing Agency 9 K. Performance of the Asian Development Bank 9
III. EVALUATION OF PERFORMANCE 10 A. Relevance 10 B. Effectiveness in Achieving Outcome 10 C. Efficiency in Achieving Outcome and Outputs 11 D. Preliminary Assessment of Sustainability 12 E. Impact 13
IV. OVERALL ASSESSMENT AND RECOMMENDATIONS 14 A. Overall Assessment 14 B. Lessons 14 C. Recommendations 15
APPENDIXES 1. Project Design and Monitoring Framework 16 2. Project Output Component Summary 19 3. Roads, Pedestrian Bridges, and Markets Details 26 4. Surveys 33 5. Training 38 6. Project Costs 41 7. Cumulative Projected and Actual Disbursements 44 8. Chronology of Main Events 45 9. Project Implementation Schedule 53 10. Project Component Annual Disbursement and Approvals 58 11. Project Organization Chart 61 12. Status of Compliance with Loan Covenants 62 13. Consultant Recruitment and Procurement Details 66 14. Economic and Financial Reappraisal 70 15. Quantitative Assessment of Overall Project Performance 80
ii
BASIC DATA A. Loan Identification 1. Country 2. Loan Number 3. Project Title 4. Borrower 5. Executing Agency 6. Amount of Loan 7. Project Completion Report Number
Sri Lanka 1849-SRI(SF) Southern Province Rural Economic Advancement Project Government of Sri Lanka Ministry of Plan Implementation SDR19,384,000 (equivalent to $25,000,000) PCR:SRI 1191
B. Loan Data 1. Appraisal – Date Started – Date Completed 2. Loan Negotiations – Date Started – Date Completed 3. Date of Board Approval 4. Date of Loan Agreement 5. Date of Loan Effectiveness – In Loan Agreement – Actual – Number of Extensions 6. Closing Date – In Loan Agreement – Actual – Number of Extensions 7. Terms of Loan – Interest Rate – Maturity (number of years) – Grace Period (number of years) 8. Terms of Relending (if any) – Interest Rate – Maturity (number of years) – Grace Period (number of years) – Second-Step Borrower
12 July 2001 28 July 2001 24 September 2001 28 September 2001 26 October 2001 10 January 2002 10 April 2002 12 December 2002 5 31 July 2008 31 December 2009 2 1.0% during the grace period, 1.5% thereafter 32 years 8 years Average weighted deposit rate of 1% After 15 years, one installment 15 years National Development Bank

iii
9. Disbursements a. Dates Initial Disbursement
17 January 2003
Final Disbursement
5 August 2010
Time Interval
90 months
Effective Date
12 December 2002
Original Closing Date
31 July 2008
Time Interval
67 months
b. Amount (SDR)
No. Category Original
Allocation
Last Revised
Allocation Amount
Disbursed Undisbursed
Balance 01A Civil works, rural infrastructure 2,537,000 6,563,000 6,471,837 91,16301B Civil works, flood rehabilitation 0,000 3,474,000 3,284,779 189,22102A Vehicles 214,000 162,000 156,948 5,05202B Equipment 139,000 170,000 170,581 (581)03 Training 255,000 153,000 150,795 2,20504 Studies and surveys 146,000 126,000 99,457 26,54305 Consulting services 1,186,000 612,000 671,677 (59,677)
06 Micro, small, and medium-sized enterprise support 1,548,000 460,000 350,827 109,173
07 Credit 10,855,000 6,311,000 6,388,815 (77,815)08 Operation and maintenance 452,000 467,000 435,552 31,44809 Recurrent costs (roads) 717,000 5,000 0 5,00010 Unallocated 564,000 110,000 0 110,00011 Interest charges 771,000 771,000 461,280 309,720 Total 19,384,000 19,384,000 18,642,549 741,452 Total ($ equivalent) 25,000,000 29,221,848 28,086,447 1,135,401
() = negative. Note: All actual amounts are as of 10 August 2010. 10. Local Costs (ADB financed) At Appraisal At Completion - Amount ($ million) 29.5 15.9 - Percent of local costs 47.0 37.0 - Percent of total cost 32.0 28.0 C. Project Data
1. Project Cost ($ million) Cost Appraisal Estimate Actual Foreign Exchange Cost 13.2 14.1 Local Currency Cost 29.5 43.0 Total 42.7 57.2
Note: All actual amounts are as of 10 August 2010. This may change with further disbursements by ADB.

iv
2. Financing Plan ($ million) Cost Appraisal Estimate Actual Implementation Costs Borrower-Financed 6.7 15.4 ADB-Financed OFID-Financed
24.0 5.0
27.4 5.0
PFIs Beneficiaries
2.0 4.0
2.5 6.2
Total 41.7 56.5 IDC Costs Borrower-Financed 0.0 ADB-Financed 1.0 0.7 Other External Financing 0.0 0.0 Total 42.7 57.2 ADB = Asian Development Bank, IDC = interest during construction, OFID = OPEC Fund for International Development, PFI = participating financial institution. Note: All actual amounts are as of 10 August 2010. These may change with further disbursements by ADB. OFID figures are based on project management office reports. Sources: Asian Development Bank and project management office.
3. Cost Breakdown by Project Component ($ million)
Component Appraisal Estimate Actual
Micro and SME Credit EDS Support
20.0 2.8
18.2 0.8
Improvement and maintenance of rural infrastructure Institutional support Support for project implementation Contingencies - Physical - Price Interest charge
12.2 1.2 2.5
1.6 1.4 1.0
33.3 1.0 3.2
0.0 0.0 0.7
Total 42.7 57.2 EDS = enterprise development service, SME = small and medium-sized enterprises. Notes: All actual amounts are as of 10 August 2010. These may change with further disbursements by ADB. OFID figures are based on project management office reports. Sources: Asian Development Bank and project management office. 4. Project Schedule Item Appraisal Estimate Actual Contract with main consultant Appointment of individual consultant to supervise the works
Q1 2001–Q4 2001
Q4 2002–Q1 2003 Q4 2006–Q4 2009
Civil Works Contract
A. Construction of rural roads I. Gravel roads II. Surfaced roads
B. Markets C. Bridges
Credit Line A. Finalize agreements with PFls B. Initiate lending activities
Q4 2001–Q4 2002
Q3 2002–Q4 2004
Q1 2001–Q42001 Q1 2002–Q42003
Q1 2005–Q4 2005 Q3 2005–Q4 2009 Q3 2005–Q4 2009 Q1 2007–Q4 2009
Q2 2002–Q1 2005 Q3 2003–Q3 2008
PFI = participating finance institution, Q = quarter. Source: Project management office.

v
5. Project Performance Report Ratings
Ratings
Implementation Period Development
Objectives Implementation Progress From 30 October 2001 to 29 June 2002 Satisfactory Satisfactory From 30 July 2002 to 30 November 2002 Satisfactory Unsatisfactory From 31 December 2002 to 29 April 2010 Satisfactory Satisfactory
Source: Asian Development Bank. D. Data on Asian Development Bank Missions
Name of Mission Date No. of
Persons
No. of Person-
Days Specialization of Members
Fact-finding 22 April–12 May 2001 1 3 c Appraisal Special project administration Inception Special project administration Special project administration Review Special project administration Review Special project administration Special project administration Midterm Review Review Disbursement Review Special project administration Review Review Review Project completion report
12–28 July 2001 19–21 March 2002 27 January–1 February 2003 13–17 October 2003 12–13 May 2004 3–7 November 2004 14–15 February 2005 13–20 June 2005 6–10 February 2006 22–23 May 2006 12–27 July 2006 17–23 July 2007 20–21 December 2007 28 January–1 February 2008 24–29 March 2008 3–5 July 2008 4–8 November 2008 4–8 May 2009 24–27 November 2009 12–16 July 2010
3 2
2
4 3
2 5
5
3
3 1 3
1
1 1 1 1 2
18 6
4
20 6
16 25
10
96
42 2 15
6
3 5 5 4 10
a, b, c a, c
a, c
a, b, c, d a, e
a, f
a, f, g, h
h, i, j, k
l, m, k
h, i, j i
d, l, l
i i i i i
i, m a = senior project economist, b = assistant project analyst, c = social sector resettlement specialist, d = finance officer, e = portfolio management specialist, f = associate project analyst, g = senior project implementation officer, h = consultant, i = project specialist, j = control officer, k = project analyst, l = senior financial control specialist, m = disbursement analyst. Source: Asian Development Bank.

I. PROJECT DESCRIPTION 1. The Southern Province Rural Economic Advancement Project 1 was a focused intervention for economic advancement in partnership with the private sector. It was designed to stimulate economic growth and to create income and employment opportunities in Sri Lanka's Southern Province by promoting private sector investments in agriculture-based enterprises, with a focus on micro, small, and medium-sized enterprises (SMEs). Simultaneously, the project was to assist in establishing an enabling physical and institutional environment to promote and sustain this process by supporting the devolution of responsibility for planning and implementation to provincial and local governments. Entrepreneurs wanting to invest in the province would be assisted by contracted private sector agencies to identify economic opportunities and to formulate suitable projects. A credit line was also to be provided to meet the financing requirements of potential entrepreneurs. The project also aimed to provide capacity-building support to the public sector and to assist pradeshiya sabhas (local governments) in upgrading and maintaining key rural infrastructure. 2. The scope of the project comprised two interrelated parts that were implemented simultaneously. Part I stimulated economic activity in the province, including support to (i) enterprise development services (EDS), and (ii) a credit line for financing term loans. Part II built an enabling environment for economic growth and included support for (i) providing rural infrastructure, particularly access roads and markets; (ii) enhancing the technical and financial capacity of pradeshiya sabhas to maintain rural infrastructure; (iii) providing skills and capacities at the provincial level and to the executing agency (EA), the Ministry of Plan Implementation2 to facilitate private sector participation in rural development; and (iv) providing project administration and management. The project framework is in Appendix 1. 3. Three major changes were made to the scope of the project during implementation as requested by the Government of Sri Lanka. After a major flood in May 2003, the Asian Development Bank (ADB) agreed in April 2004 to reconstruct 20 pedestrian bridges and gravel roads damaged by the flood, through a reallocation of $2.650 million from the loan’s credit component. In August 2006, ADB agreed to a second major change of scope and a $3.1 million reallocation from the credit component to the civil works component to improve the selected roads with paved surfaces and concrete. This changed the scope for improved roads from 1,050 kilometers (km) of rural gravel roads to 200 km of paved and concrete roads and 170 km of gravel roads. In June 2009, ADB agreed to a request for reallocation of loan funds to complete additional road improvement works, using $2 million in loan savings. In addition, as the road improvement subcomponent was co-financed with the OPEC 3 Fund for International Development (OFID) and the OFID funds were fully allocated to existing contract packages, ADB agreed to increase its financing percentage from 40% to 65% to cover the total contract package, without requesting additional funds from OFID. The government agreed to maintain its financing percentage at 37%. The scope of all changes was consistent with the project’s overall objectives.
1 ADB. 2001. Report and Recommendation of the President to the Board of Directors: Proposed Loan to the
Democratic Republic of Sri Lanka for the Southern Province Rural Economic Advancement Project. Manila (Loan 1849-SRI[SF], for $25 million, approved 26 October).
2 Following the swearing in of the new government in December 2001, several ministries were reorganized. The Ministry of Plan Implementation's EA role was first vested to the Ministry of Southern Region Development. In 2004, it was transferred to the Ministry of Regional Infrastructure Development; in 2006, to the Ministry of Regional Development; to the Ministry of National Building and Estate Infrastructure Development in 2008; and finally to ministry of Economic Development in 2010.
3 Organization of the Petroleum Exporting Countries.
2
II. EVALUATION OF DESIGN AND IMPLEMENTATION A. Relevance of Design and Formulation 4. At the time of appraisal, 80% of the Southern Province's population was rural, and the poverty level stood at 40%.4 To remedy this situation, the government was employing several strategies including (i) promoting growth in the nonrural sectors to find alternative means of economic production for a section of the rural population; (ii) improving the efficiency of the agriculture sector by encouraging a switch to higher-value crops and improvements to the transport and marketing infrastructure serving rural areas; (iii) promoting rural enterprises, especially those that related to processing and marketing of agriculture and agriculture-related products; and (iv) improving governance and building the capacity of provincial governments and pradeshiya sabhas to plan for and support rural economic development by increasing the devolution of powers and development responsibilities. 5. The socioeconomic characteristics at appraisal indicated a lack of economic opportunities in the province. Poverty originated both from low productivity in agriculture and from the sluggish growth of the nonfarm sector. At the same time, the uneconomic size of landholding required the population to engage in off-farm employment to reduce its economic vulnerability.5 This situation was compounded by the high unemployment rate (14%) and lack of economic opportunities available. 6. The formulation of the project incorporated these economic and social circumstances, and the project design was consistent with the government strategies. Consultation during appraisal with entrepreneurs, producers, processors, market associations, and pradeshiya sabhas identified a wide range of potential economic opportunities for Southern Province. The project design recognized that a way to promote economic growth and poverty reduction in rural areas was to create an environment in which private rural enterprises can flourish, and that a tool to accomplish this involved the provision of credit for such enterprises.
7. The project design drew on the considerable consultation work undertaken during the project preparatory technical assistance.6 A 1997 study of post-evaluated projects in Sri Lanka7 and lessons learned from several ADB-financed agriculture, rural development, and finance projects highlighted the importance of (i) proper staffing, and institutional and project management capability in the EA and implementing agencies; (ii) beneficiary participation and involvement in project design, implementation, operation, and maintenance; and (iii) a flexible project implementation system based on a process-oriented approach. 8. In terms of specific lessons learned, the most relevant project was the Southern Province Rural Development Project.8 The government's evaluation of this project indicated that (i) adequate capacity existed in provincial governments to implement rural development projects; (ii) activities, such as credit provision for rural enterprises, promotion of new
4 The incidence of poverty is measured by the higher poverty line, which is set at SLRs950 per person per month. 5 Government of Sri Lanka, Ministry of Finance and Planning, Department of National Planning. 2001. Public
Investments towards Poverty Reduction. Colombo. 6 ADB. 1999. Technical Assistant to the Democratic Socialist Republic of Sri Lanka for Southern Province Rural
Economic Advancement. Manila (TA 3385-SRI, for $800,000, approved 29 December). 7 ADB. 1997. Country Synthesis of Postevaluation Findings in Sri Lanka. Manila. 8 ADB. 1991. Report and Recommendation of the President to the Board of Directors: Proposed Loan to the
Democratic Republic of Sri Lanka for the Southern Province Rural Development Project. Manila (Loan 1128-SRI, for $38 million, approved 26 November).

3
technologies, and construction of rural infrastructure, can be successfully carried out at the provincial level; and (iii) institutional arrangements for different components need to be put in place to avoid start-up delays. Therefore, civil works, credit, and capacity development components were included to be implemented through a provincial project management office (PMO). 9. The project was consistent with the intent and directions of the ADB country and sector strategy at the time of appraisal. The ADB poverty reduction strategy emphasized pro-poor, sustainable economic growth; social development; and good governance as its three pillars.9 It focused on the development of the agriculture and rural sectors, since poverty is most prevalent in rural areas, especially the low-value agriculture sector. The country operational strategy also stated that ADB involvement in rural development needed to be reestablished in light of ADB’s focus on policy reform and institutional development.10 The ADB country assistance plan, 2001–2003, and its country strategy and program update 2001 supported ADB's role in creating opportunities for the poor to participate in economic growth.11 These prerequisites were met in the project design; thus, the project was highly relevant to poverty reduction in Southern Province. B. Project Outputs 10. Appendix 2 provides a detailed outline of the project outputs for each component. Under part I, relating to stimulating economic growth, 701 SMEs and 3,493 microenterprises were established by generating 13,244 actual employment opportunities. Further, the PMO recruited 23 EDS providers to implement the credit component. Under part II, the project completed 328 km of paved and gravel roads, comprising 102 km of gravel roads, 161 km of asphalt surface roads, and 65 km of concrete pavement roads. It also rehabilitated or constructed 605 km of flood-damaged gravel roads, 19 new pedestrian bridges, and 23 rural markets. Details are provided in Appendix 3. The project also conducted 60 training programs for about 10,100 people. Training details are provided in Appendix 5. 11. The credit component was administered by the National Development Bank (NDB) as the apex agency, channeling subloan disbursement funds to participating financial institutions (PFIs) with the assistance of a lead EDS provider. The role of the lead EDS provider was a key element of the project design, but full benefits of this role were not achieved due to (i) a long delay in appointment of the initial lead EDS provider; (ii) poor performance of the first lead EDS provider; and (iii) a long delay in appointing a replacement.12 During the engagement period of the replacement lead EDS provider, subloan approvals surged, thus demonstrating the value of the role as a catalyst for subloans. 12. At appraisal, the PFIs were expected to provide credit loans to 1,500 SMEs and about 7,000 microenterprises thereby generating 20,000 job opportunities.13 The primary reason for 9 ADB. 1999. Fighting Poverty in the Asia and the Pacific: The Poverty Reduction Strategy of the Asian Development
Bank. Manila. 10 ADB. 1998. Promoting the Environment for Growth: Sri Lanka Country Operational Strategy. Manila. 11 ADB. 2001. Sri Lanka: Country Assistance Plan 2001-2003. M,anila. ADB.2001.Sri Lanka: Country Strategy and Program Update 2001. Manila 12 Initially, the PMO sought to undertake the lead EDS provider role. Thus, a technical proposal from the second-
ranked bidder in the initial selection process was not requested until 7 months after the termination of the initial lead EDS provider, following strong ADB representations to the PMO during mission visits.
13 Small enterprises were defined as those with fixed assets, excluding land and buildings, of not more than SLRs7 million on completion of the subproject. Microenterprises were defined as those having fixed assets, excluding land and buildings, of not more than SLRs500,000 on completion of the subproject.

4
the shortfall (para. 10) is the poor performance of PFIs and the first lead EDS provider, as well as the reallocation of loan funds from the credit component to civil works. Significant accumulated recoveries collected through the revolving fund allowed a further 1,465 enterprises to be approved, though only 647 enterprises were disbursed by project completion, when there remained an unutilized revolving fund of SLRs550 million. 13. The changing of the project design (from the improvement of rural gravel roads to the creation of fewer asphalt and concrete pavement roads) provided more opportunities to increase the capacity of pradeshiya sabhas to maintain the rural paved roads. Although the output of the gravel roads was reduced, paved surface roads will reduce the vehicle operating costs and travel time and also benefit those walking. Creation of paved rural road infrastructure has also decreased the maintenance costs for pradeshiya sabhas in the short term, although this also has a higher level of cost for road maintenance in the future. 14. The flood rehabilitation works, which were not in the original project scope, rehabilitated 605 km of rural gravel roads and built 19 pedestrian bridges. The bridges have been successful and contributed to improving the living conditions of the communities. A post-project survey determined a range of unanticipated benefits.14 Since these works were incorporated in the project as emergency additional works after appraisal, no assessment of actual performance to expected outputs is possible. However, these works are sustaining the environment for rural economic growth by providing accessibility in the rural communities for economic and social activities. 15. The market upgrading was designed to improve 20 markets at appraisal, but the actual output resulted in 23 markets upgraded. Implementation of this subcomponent initially experienced some delays due to the lack of engineering staff for design, cost estimation, preparation of tender documents, and supervision, as well as disagreements between implementing agencies and pradeshiya sabhas on the design and location of the activities. However, the initial delay was recovered after introducing an effective monitoring and supervision system at the midterm review. A post-project survey recorded positive opinions on service and other improvements in the upgraded markets. Survey details are provided in Appendix 4. 16. The project also provided training programs and resources to enhance the technical and financial capacity of pradeshiya sabhas to maintain rural infrastructure, to improve project administration and management, and to upgrade skills and capacities at the provincial level and EA to facilitate private sector participation in rural development. The Provincial Management Training Institute in Wakwella was given some resources to conduct training programs for the Southern Provincial Council (SPC), pradeshiya sabhas, and private sector. C. Project Costs
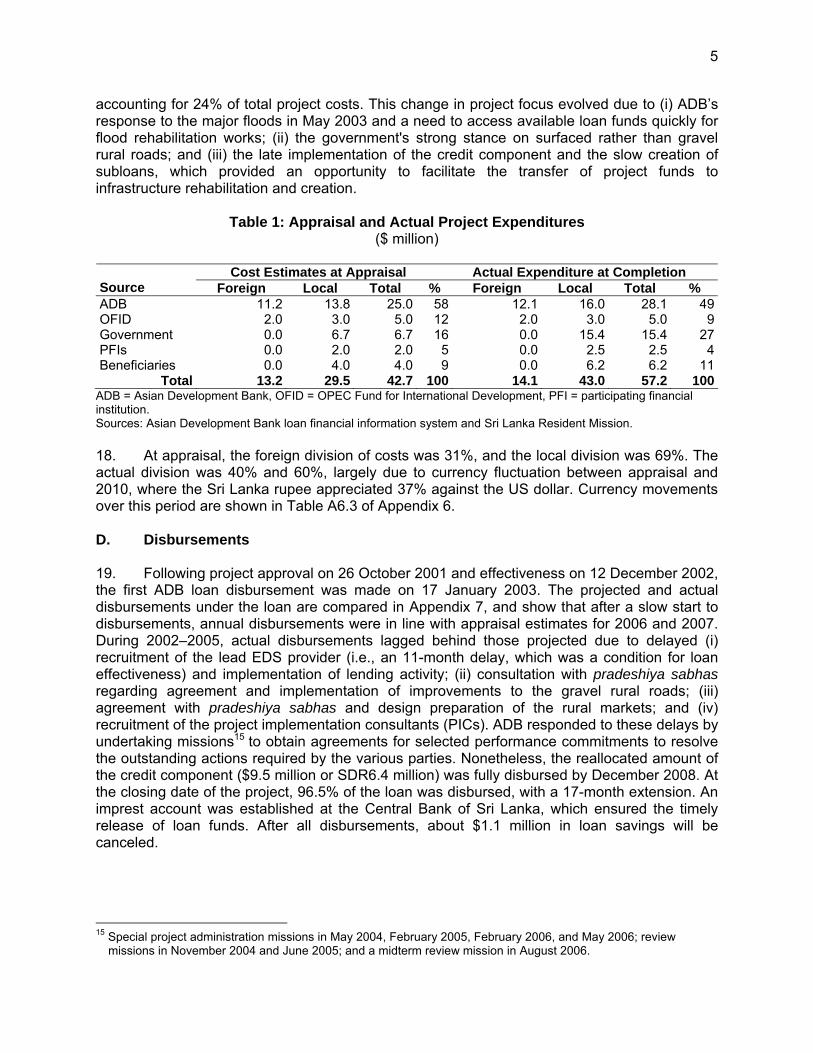
17. Components of the appraised costs and actual project costs are detailed in Table A6.1 and summarized in the Table 1, together with an outline of the financing plan. At appraisal, 53% of total project costs were associated with the Part I, of which 47% related to the credit component, while 29% of total project costs were allocated to the Part II with the civil works component, with the balance of project costs (18%) related to project and institutional support, contingencies, and interest. Actual project costs demonstrate the changed balance, with the civil works component accounting for 66% of total project costs and the credit component only
14 Government of Sri Lanka, Ministry of Nation Building. 2009. SPREAP Impact Evaluation Study. Galle, pp. 61–62.
5
accounting for 24% of total project costs. This change in project focus evolved due to (i) ADB’s response to the major floods in May 2003 and a need to access available loan funds quickly for flood rehabilitation works; (ii) the government's strong stance on surfaced rather than gravel rural roads; and (iii) the late implementation of the credit component and the slow creation of subloans, which provided an opportunity to facilitate the transfer of project funds to infrastructure rehabilitation and creation.
Table 1: Appraisal and Actual Project Expenditures ($ million)
Cost Estimates at Appraisal Actual Expenditure at Completion
Source Foreign Local Total % Foreign Local Total % ADB 11.2 13.8 25.0 58 12.1 16.0 28.1 49OFID 2.0 3.0 5.0 12 2.0 3.0 5.0 9Government 0.0 6.7 6.7 16 0.0 15.4 15.4 27PFIs 0.0 2.0 2.0 5 0.0 2.5 2.5 4Beneficiaries 0.0 4.0 4.0 9 0.0 6.2 6.2 11
Total 13.2 29.5 42.7 100 14.1 43.0 57.2 100ADB = Asian Development Bank, OFID = OPEC Fund for International Development, PFI = participating financial institution. Sources: Asian Development Bank loan financial information system and Sri Lanka Resident Mission. 18. At appraisal, the foreign division of costs was 31%, and the local division was 69%. The actual division was 40% and 60%, largely due to currency fluctuation between appraisal and 2010, where the Sri Lanka rupee appreciated 37% against the US dollar. Currency movements over this period are shown in Table A6.3 of Appendix 6. D. Disbursements 19. Following project approval on 26 October 2001 and effectiveness on 12 December 2002, the first ADB loan disbursement was made on 17 January 2003. The projected and actual disbursements under the loan are compared in Appendix 7, and show that after a slow start to disbursements, annual disbursements were in line with appraisal estimates for 2006 and 2007. During 2002–2005, actual disbursements lagged behind those projected due to delayed (i) recruitment of the lead EDS provider (i.e., an 11-month delay, which was a condition for loan effectiveness) and implementation of lending activity; (ii) consultation with pradeshiya sabhas regarding agreement and implementation of improvements to the gravel rural roads; (iii) agreement with pradeshiya sabhas and design preparation of the rural markets; and (iv) recruitment of the project implementation consultants (PICs). ADB responded to these delays by undertaking missions15 to obtain agreements for selected performance commitments to resolve the outstanding actions required by the various parties. Nonetheless, the reallocated amount of the credit component ($9.5 million or SDR6.4 million) was fully disbursed by December 2008. At the closing date of the project, 96.5% of the loan was disbursed, with a 17-month extension. An imprest account was established at the Central Bank of Sri Lanka, which ensured the timely release of loan funds. After all disbursements, about $1.1 million in loan savings will be canceled.
15 Special project administration missions in May 2004, February 2005, February 2006, and May 2006; review
missions in November 2004 and June 2005; and a midterm review mission in August 2006.

6
E. Project Schedule 20. Appendix 8 provides a chronology of main events during project implementation. At appraisal, it was estimated that the project would be implemented over 6 years. The original closing date was 31 July 2008, which was extended twice to 31 December 2009 due to implementation delays and additional works. It was expected that the first year would focus on (i) recruiting staff and consultants; (ii) undertaking initial benchmark and investment surveys to delineate specific potential enterprises to be promoted; (iii) contracting service providers, and establishing enterprise development and information centers; (iv) undertaking consultation work with pradeshiya sabhas; (v) finalizing the memorandums of understanding; and (vi) constructing demonstration roads. Some borrowing from the credit line was expected to occur by the beginning of the second year, but full-scale operation of the credit line and advisory services, as well as civil works under part II, were anticipated to commence only in the second year. Appendix 9 outlines a comparison of the time-based appraisal implementation schedule with actual implementation. While a number of the preparatory tasks were completed in the first year, the actual elapsed time for the recruitment of consultants was almost 2 years; the construction of demonstration roads started after an elapsed time of 21 months; contracting EDS providers was completed after an elapsed time of 18 months; and borrowing of the credit line commenced slowly after a delay of almost 2 years. 21. The loan extension was due to delays in project implementation and approved additional works for the flood rehabilitation works. These implementation delays were due to the (i) initial 11-month delay before loan effectiveness; (ii) delay in commencement of road improvement with asphalt surfacing and concrete paving; (iii) delayed agreement with pradeshiya sabhas over the design and construction of rural markets; (iv) delays in the design of the flood-damaged pedestrian bridges; and (vii) approval of additional works for the loan savings. F. Implementation Arrangements 22. Implementation arrangements were complex. The framework is illustrated in Appendix 11. At appraisal, the Ministry of Plan Implementation was the EA, but this arrangement changed five times. There were two implementing agencies, with SPC responsible for project implementation and supervision for the civil works component, and NDB responsible for implementation of the credit component. NDB served as the apex bank for the provision of the project's credit line, which was provided by the government under subsidiary loan agreements. 23. The project implementation arrangements at appraisal were overambitious and assumed smooth coordination among NDB, the PMO, and SPC. Individually, these agencies had the capacity to handle the project, but they failed to coordinate activities in the field. While the PMO capacity was supplemented by assigning implementation of the civil works for the pedestrian bridges to the Southern Province Road Development Authority (SPRDA) and additional workload to staff working under the Tsunami-Affected Areas Rebuilding Project,16 PMO capacity was stretched beyond expectations. However, this improved after appointment of additional staff for implementation of the Tsunami-Affected Area Rebuilding Project. 24. Implementation arrangements for the flood rehabilitation works were changed as follows: (i) pedestrian bridge restoration was implemented by SPRDA because of their proven competency in this work; and (ii) flood-damaged rural gravel road rehabilitation was
16 ADB. 2005. Report and Recommendation of the President to Board of Directors: Proposed Loan to the Democratic
Socialist Republic of Sri Lanka for Tsunami-Affected Area Rebuilding Project. Manila.

7
implemented by the pradeshiya sabhas, assisted by the Local Government Department of SPC. Apart from these changes, actual implementation arrangements were broadly as proposed at appraisal. Some issues of coordination and information flow from NDB and the PMO arose during the project, particularly in monitoring the revolving fund by the PMO. The project completion report (PCR) mission noted that institutional arrangements of project supervision and monitoring were unclear between the PMO and SPC on civil works, as both agencies were supervising the civil works. G. Conditions and Covenants 25. Details of compliance with the loan covenants are provided in Appendix 12. The loan conditions and covenants were generally complied with, although there were some instances of late compliance. The requirement to develop self-financing EDS that would continue operations after project completion was partially complied with since the poor performance of the lead EDS provider resulted in inadequate attention applied to training and follow-up with EDS providers. Implementation of credit component was also partly complied with due to insufficient NDB coordination with the EA and PMO, and NDB's inability to open the revolving fund within 1 year of loan effectiveness. NDB is only mandated by the government to operate the revolving fund until 31 January 2011, and the addendums contain onlending terms different from those contained in the loan agreement between ADB and the government as well as the project agreement between ADB and NDB. 26. Further, the requirement to enter into management agreements with pradeshiya sabhas was partially complied with due to some pradeshiya sabhas not opening separate accounts for maintenance, and some not implementing management plans or cleaning and maintenance activities for the markets. Covenants relating to allocation of loan funds for road maintenance were deleted as result of the major change of scope from gravel roads to paved roads. 27. The PCR mission takes the view that all loan covenants were relevant to the project. However, allocation of additional budget and technical staff for road maintenance by the pradeshiya sabhas is very difficult to implement due to inadequate funds being transferred from the central government. H. Consultant Recruitment and Procurement 28. All consulting services, including those financed by OFID, followed ADB Guidelines on the Use of Consultants (2010, as amended from time to time). The lead EDS provider was recruited under local consultant selection procedures and commenced services on 7 January 2003, after a 16-month delay. Due to its poor performance,17 the contract with this consultant was terminated on 30 April 2004. Replaced consultants were not mobilized until March 2006 due to some disagreements between the EA and ADB on the selection process. A detailed explanation of this is in Appendix 13. 29. The PICs were selected under international competitive bidding procedures and commenced work on 1 November 2004 after a 28-month delay, which affected implementation of civil works during the first 2 years of the project. Further, the PMO recruited 20 individual engineer and engineering assistant consultants for the increased civil works, and they were mobilized in June 2005. Performance of the individual consultants was generally satisfactory. 17 First cited in the aide-mémoire of the Special Project Administration Mission in November 2003.

8
30. Goods and services financed by ADB and OFID were procured in accordance with ADB Procurement Guidelines (2010, as amended from time to time). Procurement comprised small contracts for road maintenance, road resurfacing, and construction of market facilities. With the inclusion of the flood-damaged pedestrian bridges, larger contracts were involved, estimated to cost the equivalent or more than $1 million. They were to be awarded on the basis of international competitive bidding. Civil works for market improvement were to be awarded through local competitive bidding (LCB). Details of the civil works contracts are provided in Appendix 3 I. Performance of Consultants, Contractors, and Suppliers 31. As outlined in Appendix 13, the services of the first-ranked lead EDS provider was terminated after 16 months due to poor performance. The PICs were similarly of concern to ADB project missions due to the (i) poor performance of some consultant team members and failure to field nominated consultants; (ii) late delivery and poor quality of some final reports; and (iii) nondelivery of the public finance management consultant’s final report and the overall PIC final report.18 Nonetheless, the PICs did contribute to some improvements in the performance and service delivery of pradeshiya sabhas. The performance of individual engineers and engineering assistants appointed for supervision for civil works was generally satisfactory after introducing laboratory testing to assess the quality of materials. The performance and outputs from the replacement lead EDS provider and the consultants engaged to prepare impact assessment reports was likewise satisfactory. Therefore, the overall performance of the consultants is rated partially satisfactory. 32. While the demonstration gravel rural roads were completed broadly to the contract timetable, the other gravel roads contracts were delayed in some cases by more than 12 months due to difficulties in obtaining suitable gravel. In response, the subsequent contracts for rural roads surfacing were issued in packages. The contracts for flood-damaged gravel roads were completed on time. The performance of these contracts was a measurable improvement, although some were delayed. Further, three large contract packages assigned to one contractor were terminated as a result of poor performance and subsequently retendered. 19 All road contract groups were completed at a lower actual cost to original contract amounts. The quality of the rural road surfacing and flood-damaged gravel rural roads contracts was satisfactory. Overall, the road civil works contractor performance is rated satisfactory. 33. The pedestrian bridge construction was protracted, involving two contractors. The final contract cost was 8% higher than the contract amount. Some implementation delays were attributed to the limited experience of the contractors and engineering supervision for these bridge designs, as well as delays in importing bridge materials. The contractors were able to complete all bridges, and the overall quality was highly satisfactory. Overall, the bridge civil works contractor performance is rated satisfactory. 34. Although contracting for the rural market improvements was initially delayed due to some disagreement with local authorities on the selection of markets and designs, all 23 markets were upgraded within the project period, with construction commencing in June 2005. Delays were due to (i) markets designed without adequate consultation with pradeshiya sabhas and traders; and (iii) lack of SPC supervision. Successive ADB project missions reported on
18 While the consultant’s contract was not terminated, the final payment of $19,000 was withheld. 19 This contractor has subsequently pursued legal action to prevent recovery of performance bonds. These actions
continue at the time of this PCR.

9
these difficulties and recommended remedial action on a continuing basis between 2006 and 2009. The final contract cost was 14% higher than the contract amount due to variations for additional works. Since the contractors completed three markets over the target, overall, the market civil works contractor performance is rated satisfactory. J. Performance of the Borrower and the Executing Agency 35. The borrower’s performance is rated partly satisfactory. As previously stated, the EA role was transferred five times to five different ministries, which impacted the continuity of overall project supervision. Also, the project director changed three times, with the retirement of the first two project directors after serving 3-year terms. While the PMO staffing was generally satisfactory, there were delays in appointing and maintaining the head of the enterprise development and monitoring and evaluation unit. Civil works contract delays were partly due to slow PMO processing as well as the reluctance of pradeshiya sabhas to accept the rehabilitation of gravel rural roads. Key staff members of the same PMO were responsible for implementing a component of the Tsunami-Affected Areas Rebuilding Project, increasing their workload. 36. The borrower’s performance had slowly improved during the first 3 years of project implementation, when the same delays were evident in tendering and procurement. Although the Provincial Project Management Committee (PPMC) was held on monthly basis, the National Project Coordination Committee organized by the EA was not held regularly to discuss implementation issues. The government PCR report also lacks key information. 37. The performance of NDB is rated partly satisfactory due to the slow mobilization of the initial credit funding of PFI subloans, slow mobilization of institutional support to PFIs, and the delayed establishment of the revolving fund by 3 years. During the project, the PMO indicated that NDB did not fulfill its project coordination requirements, particularly in relation to details of the accumulation and operation of the revolving fund after the initial credit line was disbursed to PFIs. The consultant’s impact evaluation study commented that NDB performance as an independent implementer for disbursement of the credit line had not assisted the project positively, as NDB did not work with the EA (footnote 14, p. 51). During the PCR mission, it was disclosed that there have been two addendums to the subsidiary loan agreement that had not been referred to ADB for concurrence. Further, NDB submitted a project PCR that was incomplete, particularly regarding revolving fund information, and did not cover the recommended PCR content. 38. SPC established a monitoring mechanism to discuss project implementation issues and progress through the PPMC on a monthly basis, but NDB did not report to the PPMC on regular basis. Although the PPMC recommended remedial action for the implementation issues, some pradeshiya sabhas did not implement the recommendations. The EA had not established a proper monitoring system for the credit component with NDB. Therefore, implementation of the credit component was slow during the first half of the project. K. Performance of the Asian Development Bank 39. The processing of the project was relatively short, taking 4 months from appraisal to Board approval in October 2001. Regular ADB missions were completed to facilitate loan effectiveness, and the inception mission was conducted 1 month after loan effectiveness. The project was delegated to the Sri Lanka Resident Mission on 1 March 2006. ADB undertook a total of 18 review missions to monitor, supervise, and administer the project. These provided

10
advice on technical issues; procurement procedures; bid document preparation, documentation, and evaluation; civil works quality assurance; and loan administration. The PCR mission found that although there was a delay in ADB approval for the government request of change of scope from the gravel roads to surface roads, ADB responded quickly to the government request including agreeing to include flood rehabilitation works in the project scope. ADB also used the project to address the emergency assistance request by the government following extensive flood damage to rural gravel roads and pedestrian bridges in May 2003. Throughout the project, ADB worked to facilitate progress resulting from procurement and contracting delays. Overall, the project benefited from the close consultation provided through the resident mission. The role played by ADB to achieve the project targets and intended benefits was rated by the government PCR as very positive and effective. Thus, the overall performance of ADB is rated satisfactory.
III. EVALUATION OF PERFORMANCE A. Relevance 40. The credit component provided loans totaling SLRs1,003 million to 701 SMEs and 3,493 microenterprises, creating employment for 13,244 persons through the initial credit line. A further SLRs92 million was disbursed from the revolving fund by the project closing date. Civil works completed through the civil works component included (i) 126 km of paved roads and 102 gravel roads, (ii) 605 km of flood-damaged gravel roads, (iii) 19 new pedestrian bridges, and (iv) 23 rural markets upgraded. Both the credit loans and civil works contracts have stimulated private sector-led growth in rural areas of Southern Province through the creation and expansion of business and development and the strengthening of private sector contractors engaged in road, small bridge, and rural market civil construction. Rural infrastructure has also been improved to increase economic activities. Training and skills development with the rural pradeshiya sabhas improved operation, maintenance, and financial planning in many. Skills training for unemployed youth also helped them find employment. The PICs provided training and prepared management plans for the maintenance of markets by pradeshiya sabhas, although implementation has only proceeded in some pradeshiya sabhas. 41. The project objectives were in line with government ADB and strategies, although the balance between the credit component and civil works component was changed, with the credit impacts reduced. These changes were incorporated as a result of changing the government’s policies as well as urgent basic needs of the rural community to carry out economic activities. The real social and economic impact of the project was ensured after the change of scope and implementing additional works under the civil works component. The rationale for the project is assessed as highly relevant. B. Effectiveness in Achieving Outcome 42. The effectiveness in the credit component was variable, with the creation of subloans to stimulate private sector-led growth commencing slowly due to the late recruitment of the initial lead EDS provider. With the appointment of a replacement lead EDS provider, the component's effectiveness was clearly demonstrated in the rapid uptake of the reduced credit loan funding. During 2005–2007, 83% of the credit line was disbursed, compared with 16% of the credit line disbursed during 2003–2004, when the initial lead EDS provider was engaged and the PMO attempted to operate the EDS concept prior to the appointment of the replacement lead EDS provider. Disbursement of revolving fund was slow due its delayed establishment.

11
43. The PCR mission observed that the effectiveness of the civil works component when inspecting selected roads, pedestrian bridges, and rural market sites. The PMO also undertook sample surveys of rural community users of road segments, pedestrian bridges, and rural markets, as well as before and after indicators to demonstrate impacts (Appendix 4). 44. Rural road improvement generally involved widening 4–5 meters of right-of-way with a carriageway of 3 meters. The roads are used more (50% increase in pedestrians and 140% increase in vehicle traffic), and there has been a 140% increase in land values, with no increase in traffic accidents. The pedestrian bridges experienced an increase in daily use of 140% overall (business traffic increased some 370%), as well as a 50% increase in access to government offices, schools, hospitals, and industries. Daily vehicle traffic increased from 72 bicycles to 1,726 vehicles, and daily agriculture products carried across the bridges increased more than six times. Land prices have increased 170% and house prices 70%. Fatalities by drowning when crossing the river decreased from 7 to zero, and no falls from the permanent bridges have been recorded.20 Journey distances have also fallen by 55%, and journey times have been reduced by 65%. 45. The rural markets also generated a significant growth in economic activity. The effectiveness of the market improvements was demonstrated through a 150% increase of revenue, with a 70% increase in operating stallholders on market days and an 80% increase in market shoppers. Weekly market turnover increased by 75%, recording an average weekly turnover increase from SLR4.6 million to SLR8.0 million. The annual income for pradeshiya sabhas from market operations increased 115%, with the market average increasing from SLRs0.8 million to SLRs1.7 million. 46. The effectiveness of institutional support and training is evident. Some EDS providers created strong, viable businesses providing advice to rural enterprises and undertaking other project support consultancies. The PMO conducted several capacity-development training programs for provincial council and local government staff, including the chairpersons of pradeshiya sabhas, to improve their technical and management capacity and institutional development (Appendix 5). The training included (i) computer training for financial management, (ii) administration and management training for SPC staff, (iii) technical training for road and market maintenance, and (iv) preparation of manuals for financial management and road maintenance. The annual income, management capabilities, and service delivery system of pradeshiya sabhas have improved. Since the project achieved all of its revised targets and additional works, the project is rated effective. C. Efficiency in Achieving Outcome and Outputs 47. The project remained efficient despite major project changes and delayed performance of most components, although the efficiency of the credit component could not be reappraised fully because of the lack of subloan project data collected. Details of the economic and financial reappraisal are in Appendix 14. The PCR mission reviewed the methodologies, assumptions, and results of appraisal; followed the same methodology; and benefited from having actual project costs and post-project survey data on use of project roads and bridges as well as the market sales and rental revenue of the rural markets built. 48. The rural road civil works subcomponent recorded an economic internal rate of return (EIRR) of 21%, slightly below the 23% estimated during appraisal, and above the cut-off rate of 20 Previously, 119 falls were recorded.
12
12%. This slightly lower result is due to various project delays and the high costs and lower distances associated with the change from rural gravel road maintenance to surfaced road provision. The reappraisal sensitivity analyses indicated that without the time cost savings, the rural roads had an EIRR of 12.6%. The switching value occurred with an 18.5% reduction in total benefits assumed. This result suggests that maintenance could problematic, and if the pradeshiya sabhas do not fulfill their responsibility for adequate maintenance, the economic returns could dip to unacceptable levels. 49. The pedestrian bridge civil works subcomponent recorded an EIRR of 24%, and the reappraisal sensitivity analyses indicated that the switching value occurs with a 40% reduction in total benefits assumed. As these civil works were not incorporated at appraisal, no appraisal indicators are available. 50. The market civil works subcomponent EIRR was 85%, compared to the 26% estimated during appraisal, due to a significant underestimation of the expected growth in market sales resulting from the new market locations (5% compared to the recorded increase of 75%). Sensitivity analyses indicated the robustness of these figures. A with- and without-project analysis of pradeshiya sabhas revenues indicated that the largest market surveyed increased its annual revenue by SLRs2.5 million, compared with the large market example considered at appraisal, which expected an increase of SLRs1.3 million annually. The smaller markets surveyed recorded increases in annual revenue of SLRs0.9 million–SLRs1.5 million, compared with SLRs0.3 million anticipated at appraisal. A financial reappraisal of the markets recorded a financial internal rate of return (FIRR) of 10%. Pradeshiya sabha revenue increased from 0.5% of total market turnover to 0.6% in the with-project situation, indicating that the pradeshiya sabhas were able to increase collections at a slightly faster rate that total market sales. In view of the low FIRR, there is room to increase the collection rate to 1.0% or 1.5%, which would yield an FIRR of 12%–23%. 51. In measuring the efficiency of the credit component, the rates of return for the 10 indicative enterprises identified at appraisal were still applicable and considered economically viable, indicating their economic benefits to the local economy. Taking account of the employment impacts of the subloan projects as an alternative impact measurement, the project benefited from the favorable exchange rate movement of SDR and the Sri Lanka rupee, so that while the SDR loan amount was reduced from SDR10.855 million to SDR6.162 million (a 43% reduction) the Sri Lanka rupee value of disbursements was only reduced from SLRs1,270 million to SLRs1,094 million (a 14% reduction). Despite the fortuitous exchange rate movement, the employment generation targets at appraisal were underachieved, with actual employment opportunities only being 13,244, a shortfall of 34% below the lower end of the target range due to the reduction of the original allocation. The slow disbursement of the initial credit line, and NDB's failure to expedite the disbursement of the revolving fund, suggest this component is partly efficient. D. Preliminary Assessment of Sustainability 52. The sustainability of the credit component is cause for concern because (i) with the subsidiary loan agreement between the government and NDB for the operation of the revolving fund expires on 31 January 2011, there is uncertainty over the further extension and operation of the revolving fund ; (ii) the disbursement of the revolving fund credit line by NDB continues to be slow; (iii) NDB has relaxed the need for PFIs to utilize services of EDS providers; and (iv) NDB has reduced the flexibility of interest rate margins for PFIs, which limit their margins. ADB is discussing these concerns with the Ministry of Finance and Planning and NDB.

13
53. The project roads remain in good condition 2–3 years after their completion, though the hard shoulders are being encroached upon by vegetation and sidecutting, and general road maintenance is not adequately maintained by the pradeshiya sabhas. Some pradeshiya sabhas have allocated sufficient funds to a separate road maintenance account, and some that have made allocations have not yet proceeded to use the funds. If the reluctance to both allocate and expend funds on regular road maintenance continues, the integrity of the project roads will be in jeopardy. A similar situation applies to the pedestrian bridges, and while they are constructed with materials to minimize maintenance, there are already preliminary signs of deterioration requiring minor periodic maintenance, which should be carried out by SPRDA. 54. Rural market maintenance and sustainability are also of concern, as some pradeshiya sabhas have failed to implement the agreed market management plans to provide adequate facilities and labor for maintenance. During the PCR mission, the need for some building maintenance and market surface repairs was evident. The PCR mission considers the slow progress of the revolving fund as well as poor evidence of pradeshiya sabhas maintaining markets and roads in its rating of overall sustainability as less likely. E. Impact 55. Any environmental impact of subprojects financed by the credit line was assessed, and environmental impact assessments were completed where appropriate. Localized problems of liquid and solid waste disposal, as well as noise and dust, did not present significant environmental issues. The PMO environment consultant also formulated appropriate guidelines for the project-related infrastructure. The rural roads works were mainly simple rehabilitation and maintenance works, and no serious environmental impacts were encountered, apart from some periods of dust. Road sections, where surfacing with asphalt and concrete were involved, generally featured only existing road alignments. By continuing to maintain rural roads, this subcomponent had a positive environmental effect by preventing sheet erosion and gulling. The rehabilitation of pedestrian bridges generally replaced existing poor-quality river crossings and had significant positive social impact. In the case of market upgrading, some noise, dust, and disturbance were experienced for a short period during the upgrading works, but the market sites were improved, with better drainage and traffic movement. Solid and liquid waste disposal at the markets was also improved through the plans prepared by participating pradeshiya sabhas. 56. The improved rural markets created an additional 4,000 market trader opportunities, some for new traders. By generating employment and upgrading business opportunities, the project addressed the key poverty issues, with some poor persons directly becoming microentrepreneurs. The beneficiaries of the project ranged from the economically disadvantaged poor to higher income groups, and the increased number of entrepreneurs improved the terms of trade for poor agricultural producers through the availability of credit and the creation of more effective local markets for their produce. The PMO undertook specific initiatives to enhance benefits to vulnerable groups, particularly unemployed youth and women. About 25% (2,998) of the employment created through the subloans was for women.

14
IV. OVERALL ASSESSMENT AND RECOMMENDATIONS A. Overall Assessment 57. The PCR mission rates the project successful. Even though it achieved fewer of its targets in the credit component due to delays in project implementation and reallocation of funds, the project design was relevant and its outcome effective and efficient, as it achieved additional outcomes through changing of scope and reallocations. The project achieved significant economic and social impact through improvement of paved rural roads, pedestrian bridges, and rural markets. It also achieved a good outcome through improving capacity of local authorities. Because of the poor performance of the initial lead EDS provider and the slow disbursement of the credit line during the first half of the project, the major change in scope and the reallocation of loan funds were approved from the credit line to the rehabilitation of flood-damaged roads, pedestrian bridges, and surfacing of the gravel roads. While it is recognized that the project offered the opportunity to mobilize funds quickly for these necessary works, the consequence was a shift in project focus away from the stimulation of economic activity to civil works designed to build the enabling environment. However, with the change of scope, the project achieved positive economic and social outcomes and output effectively and efficiently. 58. The sustainability of some subcomponents is less likely, particularly the continuing operation of the credit line through the revolving fund, as well as the ongoing maintenance of the rural markets. In terms of effectiveness, only the credit line and provision of project administration and management are rated partly effective. In terms of efficiency, the rural roads and bridges and provision of skills and capacity at provincial, local government, and EA levels of the project are considered efficient. B. Lessons 59. The project was particularly effective in meeting the needs of the government. The project responded very effectively by repairing the damaged rural gravel roads and pedestrian bridges after the May 2003 floods. As requested by the government, the project also responded positively by changing its scope from gravel roads to paved surface roads. The responsiveness and flexibility demonstrated by the project was laudable, and the project provided a worthy example for the design and management of future projects. 60. Since the project had two implementing agencies supervised by different agencies, project coordination was difficult. A more suitable arrangement involving dual implementation agencies may be through a region-based apex financial institution, which is also assigned responsibility for establishment and operation of EDS support activities and works closely with the regional organization responsible for sustaining the enabling environment. During the design stage, project implementation arrangements and responsibilities of each agency should be clearly explained in the project administration memorandum. 61. Future projects need to address issues associated with the financial capacity of pradeshiya sabhas to develop and maintain rural infrastructure through closer monitoring, obtaining greater commitments from provincial and local organizations, and the use of soft loans for capital works tied to user-pay financial plans for civil works such as rural markets, where a financing charges mechanism already exists. 62. Future projects designed to address rural gravel road maintenance issues need to be more carefully designed through (i) identification of project roads during appraisal; (ii)

15
identification of suitable gravel sources in proximity of the project roads; and (iii) prior commitment from each pradeshiya sabha to participate in the project, including prior establishment and commitment of funds to a road maintenance account. C. Recommendations
1. Project-Related 63. Future monitoring. To maintain the objective of stimulating regional economic growth, ADB and the EA should continue to monitor subloan disbursement of the revolving fund to measure the continuing economic impact on the development of existing and the creation of new SMEs, and the related employment impacts, particularly among minority target groups. Regular quarterly reports should be provided by NDB detailing approvals, disbursements, and the revolving fund balance. SPC should closely monitor maintenance of roads, markets, and bridges with pradeshiya sabhas and SPRDA. 64. Covenants. Covenant 14, requiring NDB to maintain a revolving fund for at least 15 years, should continue to be applied with close supervision by the Ministry of Planning and Finance. Covenants 12 and 13, stating that a participation agreement is to be signed between NDB and each PFI, should continue to be applied for the duration of the revolving fund. 65. Further action or follow-up. The government should take immediate action to help NDB implement the revolving fund through PFIs and in accordance with the current loan conditions.
2. General 66. The absence of an effective benefit and monitoring evaluation system, including the collection of detailed information on project performance variables, should be remedied in future projects, as this would form the basis for more effective PCR reports from EAs. A procurement specialist should be involved in missions to facilitate the procurement process and to provide early guidance on effective, efficient procurement of consultants and civil works.
16 Appendix 1
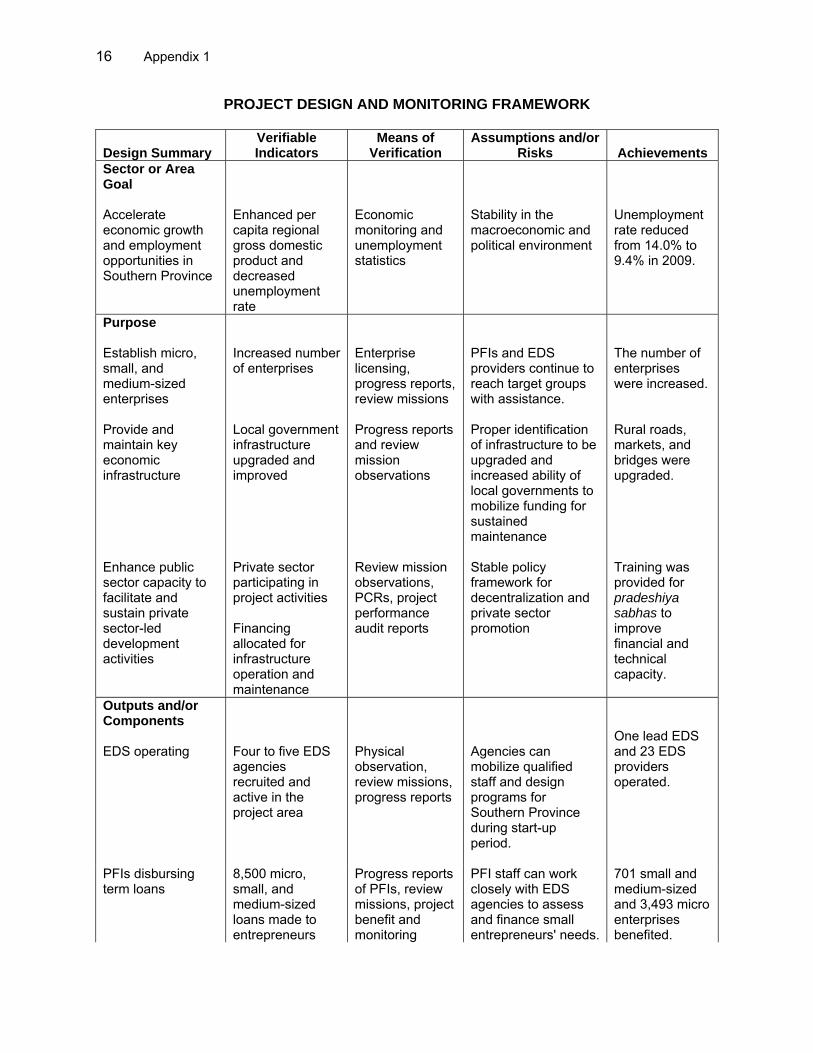
PROJECT DESIGN AND MONITORING FRAMEWORK
Design Summary Verifiable Indicators
Means of Verification
Assumptions and/or Risks Achievements
Sector or Area Goal Accelerate economic growth and employment opportunities in Southern Province
Enhanced per capita regional gross domestic product and decreased unemployment rate
Economic monitoring and unemployment statistics
Stability in the macroeconomic and political environment
Unemployment rate reduced from 14.0% to 9.4% in 2009.
Purpose Establish micro, small, and medium-sized enterprises Provide and maintain key economic infrastructure Enhance public sector capacity to facilitate and sustain private sector-led development activities
Increased number of enterprises Local government infrastructure upgraded and improved Private sector participating in project activities Financing allocated for infrastructure operation and maintenance
Enterprise licensing, progress reports, review missions Progress reports and review mission observations Review mission observations, PCRs, project performance audit reports
PFIs and EDS providers continue to reach target groups with assistance. Proper identification of infrastructure to be upgraded and increased ability of local governments to mobilize funding for sustained maintenance Stable policy framework for decentralization and private sector promotion
The number of enterprises were increased. Rural roads, markets, and bridges were upgraded. Training was provided for pradeshiya sabhas to improve financial and technical capacity.
Outputs and/or Components EDS operating
Four to five EDS agencies recruited and active in the project area
Physical observation, review missions, progress reports
Agencies can mobilize qualified staff and design programs for Southern Province during start-up period.
One lead EDS and 23 EDS providers operated.
PFIs disbursing term loans
8,500 micro, small, and medium-sized loans made to entrepreneurs
Progress reports of PFIs, review missions, project benefit and monitoring
PFI staff can work closely with EDS agencies to assess and finance small entrepreneurs' needs.
701 small and medium-sized and 3,493 micro enterprises benefited.

Appendix 1 17
Design Summary Verifiable Indicators
Means of Verification
Assumptions and/or Risks Achievements
Markets upgraded and operating Rural roads upgraded and being maintained Institutional support provided to the public sector
20 markets upgraded 1,050 km of key rural access roads kept in operational condition and long-term maintenance financing identified (this was reduced to 200 km of paved roads and 170 km of gravel roads by the major change of scope) PMO functional, and pradeshiya sabhas undergoing financial upgrading
evaluation reports Physical observation, progress reports, PCRs Physical observation, progress reports, PCRs Physical observation, progress reports
Markets that meet selection criteria can be identified within project period. Financing sources available to local councils are adequate to allow recurrent budgeting for maintenance. Competent consultants recruited, timely appointment of staff, timely selection of personnel for training
23 markets were upgraded. After change of scope, 102 km of gravel roads, 161 of asphalt surface roads, 65 km of concrete roads, 605 km of flood-damaged rural gravel roads, and 19 pedestrian bridges were completed. Financial management and technical capacity of pradeshiya sabhas were upgraded by providing training and computers.
1. PMO set up and operating 2. Contracts with EDS agencies signed 3. EDS staffed and operating 4. Entrepreneurs
SPC staff time and consulting services, and advisory consulting services Advisory consulting services, provision of funds EDS staff inputs Consulting
Physical observation, inception report Signed contracts Progress reports, review missions Progress
SPC can field staff expeditiously. Willingness of agencies to participate in project at negotiated rates Competent staff can be recruited and trained; enterprise packages can be developed. Entrepreneurs are

18 Appendix 1
Design Summary Verifiable Indicators
Means of Verification
Assumptions and/or Risks Achievements
provided guidance and training 5. PFIs selected 6. Credit funds disbursed 7. Markets and other infrastructure selected for improvement 8. Markets and other infrastructure improved and functioning
services, project management staff time PFI staff time PMO staff time, local government staff time, consulting services Civil works contracts, PMO staff time, local government staff time
reports, observation Agreements with PFIs signed Progress reports Progress reports Progress reports, physical observation, PCRs
interested in services provided. Qualified and interested PFIs exist in the project area. Viable subproject proposals are received from entrepreneurs.
Need for upgrading felt among local government representatives. Competent supervision by the PMO, competent contractors chosen
9. Road links chosen for transitional maintenance 10. Maintenance funding handed over to local governments 11. Capacity building training carried out
PMO staff time, local government staff time, consulting services Local government staff time and consulting services Consulting services and staff time
Progress reports Progress reports, PCR, performance audit reports Progress reports
Local government officials can prioritize important road links. Willingness of local governments to improve their budgeting procedures Capacity of budget to accommodate recurrent expenditures required. Interest in capacity upgrading exists in Ministry of Plan Implementation, SPC, and local governments.
EDS = enterprise development service, km = kilometer, PCR = project completion report, PFI = participating financial institution, PMO = project management office, SPC = Southern Provincial Council.
Appendix 2 19
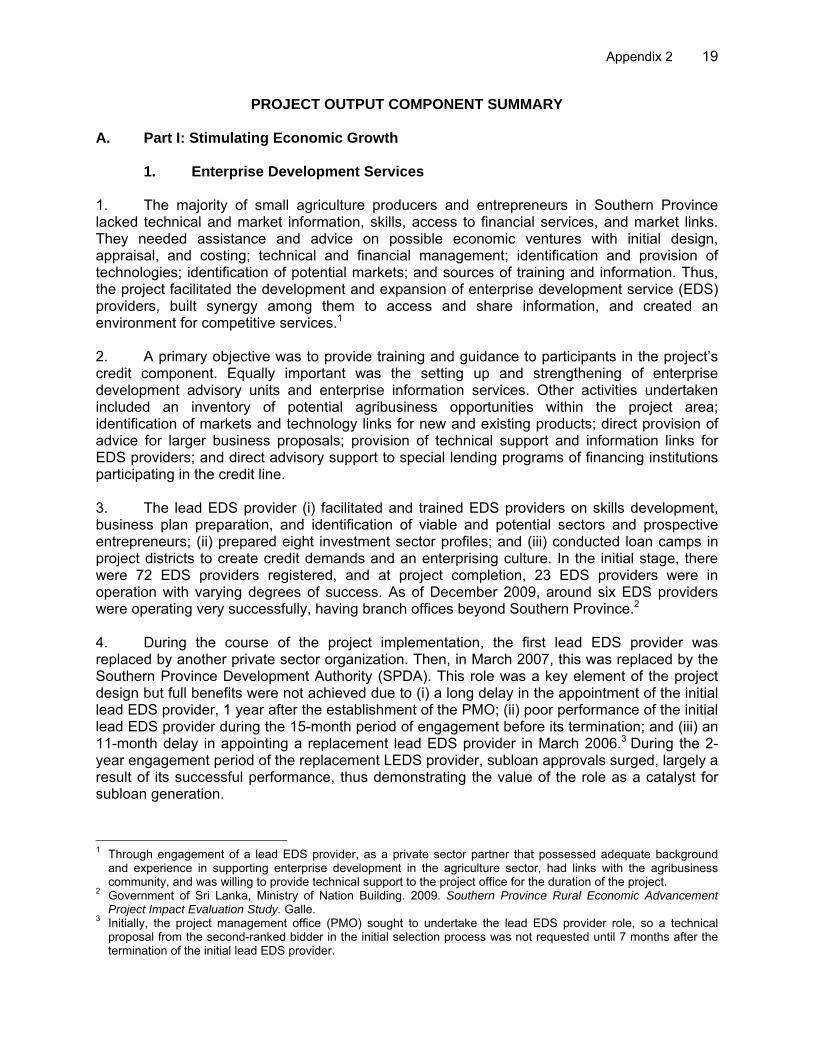
PROJECT OUTPUT COMPONENT SUMMARY A. Part I: Stimulating Economic Growth
1. Enterprise Development Services 1. The majority of small agriculture producers and entrepreneurs in Southern Province lacked technical and market information, skills, access to financial services, and market links. They needed assistance and advice on possible economic ventures with initial design, appraisal, and costing; technical and financial management; identification and provision of technologies; identification of potential markets; and sources of training and information. Thus, the project facilitated the development and expansion of enterprise development service (EDS) providers, built synergy among them to access and share information, and created an environment for competitive services.1 2. A primary objective was to provide training and guidance to participants in the project’s credit component. Equally important was the setting up and strengthening of enterprise development advisory units and enterprise information services. Other activities undertaken included an inventory of potential agribusiness opportunities within the project area; identification of markets and technology links for new and existing products; direct provision of advice for larger business proposals; provision of technical support and information links for EDS providers; and direct advisory support to special lending programs of financing institutions participating in the credit line. 3. The lead EDS provider (i) facilitated and trained EDS providers on skills development, business plan preparation, and identification of viable and potential sectors and prospective entrepreneurs; (ii) prepared eight investment sector profiles; and (iii) conducted loan camps in project districts to create credit demands and an enterprising culture. In the initial stage, there were 72 EDS providers registered, and at project completion, 23 EDS providers were in operation with varying degrees of success. As of December 2009, around six EDS providers were operating very successfully, having branch offices beyond Southern Province.2 4. During the course of the project implementation, the first lead EDS provider was replaced by another private sector organization. Then, in March 2007, this was replaced by the Southern Province Development Authority (SPDA). This role was a key element of the project design but full benefits were not achieved due to (i) a long delay in the appointment of the initial lead EDS provider, 1 year after the establishment of the PMO; (ii) poor performance of the initial lead EDS provider during the 15-month period of engagement before its termination; and (iii) an 11-month delay in appointing a replacement lead EDS provider in March 2006.3 During the 2-year engagement period of the replacement LEDS provider, subloan approvals surged, largely a result of its successful performance, thus demonstrating the value of the role as a catalyst for subloan generation.
1 Through engagement of a lead EDS provider, as a private sector partner that possessed adequate background
and experience in supporting enterprise development in the agriculture sector, had links with the agribusiness community, and was willing to provide technical support to the project office for the duration of the project.
2 Government of Sri Lanka, Ministry of Nation Building. 2009. Southern Province Rural Economic Advancement Project Impact Evaluation Study. Galle.
3 Initially, the project management office (PMO) sought to undertake the lead EDS provider role, so a technical proposal from the second-ranked bidder in the initial selection process was not requested until 7 months after the termination of the initial lead EDS provider.

20 Appendix 2
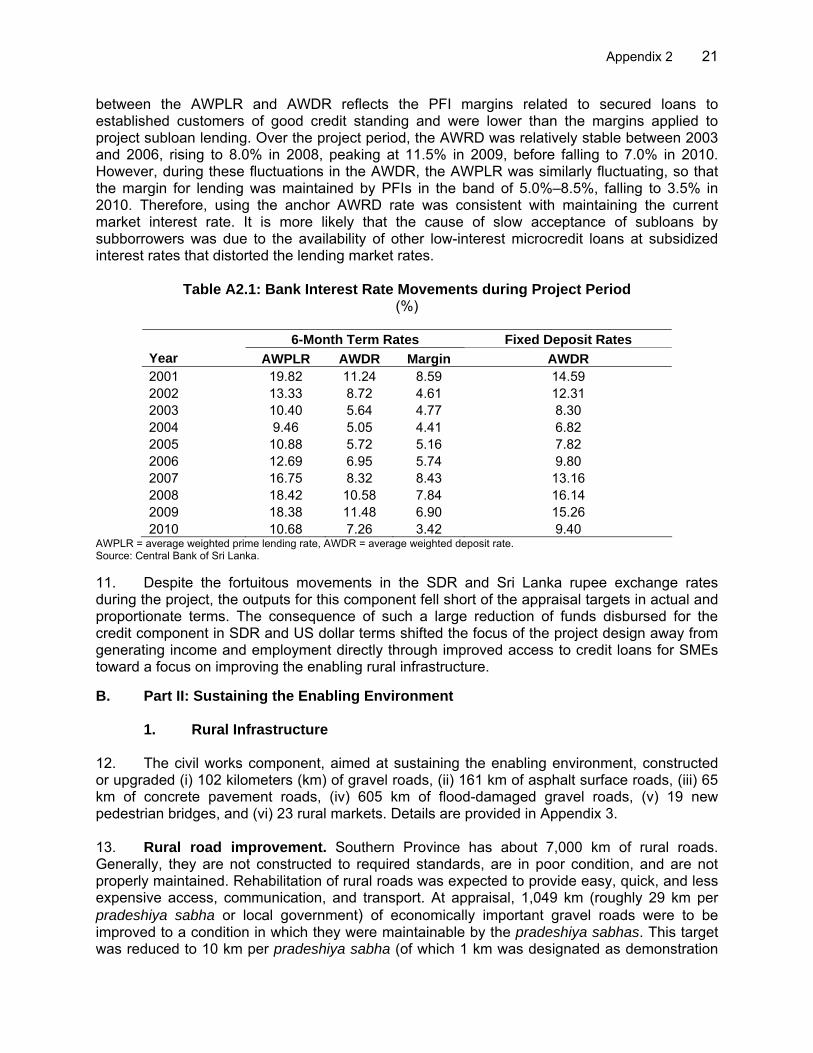
2. Credit for Economic Growth
5. The credit component was administered by the National Development Bank (NDB) as the apex agency for channeling subloan disbursement funds to participating financial institutions (PFIs). At project appraisal, the maximum subproject size was pegged at SLRs7.0 million for small enterprises and SLRs0.5 million for microenterprises. The Asian Development Bank (ADB) credit line supported 70% of the total subproject cost, PFIs were to contribute 10%, and the balance was contributed by the subborrower. In March 2005, ADB agreed to provide 88% of each credit line subloan, with the balance from the PFIs, and the subborrower’s contribution in in kind or in cash in addition to the total value of the subloan. 6. The PFIs were expected to provide credit loans to finance medium- and long-term investment needs of about 1,500 small and medium-sized enterprises (SMEs) and about 7,000 microenterprises.1 The actual number of credit loans provided was only 701 to SMEs and 3,493 to microenterprises, a shortfall of 51%. The main reasons for this shortfall were the average loan amount of SLRs0.250 million and the reallocation of funds. The SDR loan amount for this component was reduced from SDR10.855 million to SDR6.162 million (43% reduction); however, the Sri Lanka rupee value of disbursements was only reduced from SLRs1,270 million to SLRs1,094 million (a 14% reduction).2 7. Similarly, the employment generation target at appraisal (i.e., 20,000–25,000 new job opportunities) was underachieved, with actual employment opportunities only reaching 13,244 (9,812 males and 3,432 females). This shortfall—34% below the lower end of the target range—was primarily due to poor performance of PFIs and the lead EDS provider at the initial stage of the project, as well as the reallocation of loan funds. However, the revised allocation under the credit component was fully utilized 1 year before the project closing date. In addition, significant accumulated recoveries collected through the revolving fund allowed a further 1,465 projects to be approved, involving total loans of SLRs497.5 million, though only 647 projects and SLRs219 million were disbursed by project completion. 8. The revolving fund was opened by NDB after a 4-year delay. At project completion, there was an unutilized revolving fund of SLRs550 million. NDB's subsequent failure to mobilize revolving fund disbursement has constrained the fund's continuing impact and effectively stifled the ongoing development of EDS, which NDB and PFIs have failed to endorse. 9. NDB blamed delays in credit subloan disbursement on implementation arrangements, although this is not supported by interest rate data available from Central Bank of Sri Lanka (CBSL). NDB argued that the anchor average weighted deposit rate (AWDR) for onlending to PFIs resulted in high onlending interest rates to the PFIs that in turn required PFIs to pass on subloan interest rates higher than the subborrowers were prepared to accept. Appendix 10 details the banking system interest rates over the project period, comparing AWDR with the average weighted prime lending rate (AWPLR). 10. NDB used the 6-month AWDR as the anchor rate rather than the fixed term rate, which includes longer-term rates more appropriate for the credit subloan lending terms. The margin
1 Small enterprises were defined as those with fixed assets, excluding land and buildings, of not more than SLRs7
million on subproject completion. Microenterprises were defined as those having fixed assets, excluding land and buildings, of not more than SLRs0.500 million on subproject completion.
2 The component was reduced from $20.0 million at appraisal to $9.5 million at project completion.
Appendix 2 21
between the AWPLR and AWDR reflects the PFI margins related to secured loans to established customers of good credit standing and were lower than the margins applied to project subloan lending. Over the project period, the AWRD was relatively stable between 2003 and 2006, rising to 8.0% in 2008, peaking at 11.5% in 2009, before falling to 7.0% in 2010. However, during these fluctuations in the AWDR, the AWPLR was similarly fluctuating, so that the margin for lending was maintained by PFIs in the band of 5.0%–8.5%, falling to 3.5% in 2010. Therefore, using the anchor AWRD rate was consistent with maintaining the current market interest rate. It is more likely that the cause of slow acceptance of subloans by subborrowers was due to the availability of other low-interest microcredit loans at subsidized interest rates that distorted the lending market rates.
Table A2.1: Bank Interest Rate Movements during Project Period (%)
6-Month Term Rates Fixed Deposit Rates
Year AWPLR AWDR Margin AWDR 2001 19.82 11.24 8.59 14.59 2002 13.33 8.72 4.61 12.31 2003 10.40 5.64 4.77 8.30 2004 9.46 5.05 4.41 6.82 2005 10.88 5.72 5.16 7.82 2006 12.69 6.95 5.74 9.80 2007 16.75 8.32 8.43 13.16 2008 18.42 10.58 7.84 16.14 2009 18.38 11.48 6.90 15.26 2010 10.68 7.26 3.42 9.40
AWPLR = average weighted prime lending rate, AWDR = average weighted deposit rate. Source: Central Bank of Sri Lanka. 11. Despite the fortuitous movements in the SDR and Sri Lanka rupee exchange rates during the project, the outputs for this component fell short of the appraisal targets in actual and proportionate terms. The consequence of such a large reduction of funds disbursed for the credit component in SDR and US dollar terms shifted the focus of the project design away from generating income and employment directly through improved access to credit loans for SMEs toward a focus on improving the enabling rural infrastructure. B. Part II: Sustaining the Enabling Environment
1. Rural Infrastructure 12. The civil works component, aimed at sustaining the enabling environment, constructed or upgraded (i) 102 kilometers (km) of gravel roads, (ii) 161 km of asphalt surface roads, (iii) 65 km of concrete pavement roads, (iv) 605 km of flood-damaged gravel roads, (v) 19 new pedestrian bridges, and (vi) 23 rural markets. Details are provided in Appendix 3. 13. Rural road improvement. Southern Province has about 7,000 km of rural roads. Generally, they are not constructed to required standards, are in poor condition, and are not properly maintained. Rehabilitation of rural roads was expected to provide easy, quick, and less expensive access, communication, and transport. At appraisal, 1,049 km (roughly 29 km per pradeshiya sabha or local government) of economically important gravel roads were to be improved to a condition in which they were maintainable by the pradeshiya sabhas. This target was reduced to 10 km per pradeshiya sabha (of which 1 km was designated as demonstration

22 Appendix 2
roads) in October 2006.1 The government cited (i) government policy to improve rural roads with paved surfaces, (ii) scarcity of the right type of gravel in the project area, (iii) limited laboratory facilities for testing samples of gravel, (iv) contractors' tendency not to use the right type of gravel, (v) heavy dust and health problems arising from gravel roads, (vi) increased traffic on selected roads, and (vii) gravel roads not being preferred by politicians and beneficiaries.2 14. Preparation of tender packages, construction supervision, and quality control was provided by trained technical staff. The number of roads and km by district are included in Table A2.2. The shift of the project design away from the maintenance of rural gravel roads to the creation of fewer asphalt and concrete pavement roads has not led to a significant increase in the capacity of pradeshiya sabhas to maintain rural roads. However, the creation of improved rural road infrastructure has decreased the rural road maintenance costs for pradeshiya sabhas in the short term, although it requires a higher level and cost of road maintenance in the future.
Table A2.2: Completed Rural Roads (kilometers)
First Phase: Gravel Roads Second Phase: Surfaced Roads out of
Improved Gravel Roads District Demonstration Subbased Total Asphalt Concrete Total Galle 16 119 135 74 3 77 Matara 7 102 109 33 45 78 Hambantota 8 76 84 54 18 72 Total 31 297 328 161 65 226
Notes: Selected gravel subbased roads were resurfaced with asphalt and concrete. Concrete was used in steep sections. Source: Project management office. 15. Flood-damaged rural roads and bridges. Flood damage rehabilitation works, following major floods that occurred in May 2003, included the repair of rural roads and pedestrian bridges. This component comprised the rehabilitation of 605 km of flood-damaged roads, and this work was completed satisfactorily without significant contract delays. Many footbridges3 were washed away or completely destroyed by the floods, and the destruction of these bridges and roads caused immediate and severe impacts on the livelihoods of communities, with children lacking a safe mode of transport to and from schools. 16. Under this subcomponent, the project successfully rehabilitated 605 km of rural gravel roads and built 19 steel pedestrian bridges. The bridge subcomponent was highly successful and made a significant contribution in improving the living conditions of the communities. These works determined a range of unanticipated benefits (footnote 22, pp. 61–62) including (i) improved social coherence among the communities; (ii) use of three-wheel vehicles as the main mode of transport for schoolchildren; (iii) new bus services on routes where no services had been previously available; (iv) a sense of confidence and safety among women and children as well as the sick and elderly; (v) community participation in sustainable management of the pedestrian bridges; (vi) elimination of the risk of accidents, such as villagers and schoolchildren falling into the river; (vii) increased property values; and (viii) improved community health
1 At this time, the overall progress of the civil works was unsatisfactory due to the PS disagreement on using gravel
for road improvement, with only 326 km of gravel roads completed up to subbase level. 2 The Prime Minister intervened and requested a special meeting with the ADB Special Project Administration
Mission on 11 May 2004. 3 Many of these footbridges were temporary, fragile arrangements made out of wood used to cross rivers.

Appendix 2 23
conditions, as a result of more visits by government officials, as well as easier access to hospitals.1 17. As rehabilitation works were incorporated in the project after appraisal, no assessment of actual performance to expected outputs is possible. However, this subcomponent made a significant contribution to sustaining the environment for rural economic growth. 18. Rural market improvement. The subcomponent providing market upgrading was designed to improve a selection of the 92 formal markets in Southern Province that were in poorly developed and maintained.2 These markets represent an important source of direct revenue, and it was envisaged that the improvements could result in a substantial increase of revenue and provide better management. As they provide the foremost marketing channel for fresh produce and constitute accumulation points for the transport of produce to other parts of the country, they could provide a stimulus to rural economic growth. At appraisal, it was envisaged that 20 markets would be upgraded, and the output from this subcomponent resulted in 23 market upgraded as requested by the government. 19. Implementation of this subcomponent initially experienced lengthy delays due to the lack of engineering staff for design, cost estimation, preparation of tender documents, and supervision. Disagreements between implementing agencies and pradeshiya sabhas on designing and location of project activities also delayed implementation. The Urban Development Authority was commissioned to prepare detailed market designs in February 2005, and contracts for individual market works were awarded from May 2005 with water, sanitation, and electricity facilities for sellers and consumers. 20. A survey, conducted by the project management office (PMO) covering the before and after operations of nine markets where improvement works had been undertaken, showed (i) the average weekly market turnover increased by 75%; (ii) average number of consumers increased by 79%; (iii) average number of traders increased by 70%; (iv) average number of stalls increased by 67%; and (v) average annual income for pradeshiya sabhas increased by 115%. Opinions on service and other improvements were all positive, although during the project completion report (PCR) mission inspection of selected markets, there was still room for further improvements in the cleaning and maintenance of these markets. Survey details are provided in Table A4.2.
2. Technical and Financial Capacity Building of Local Governments 21. This component, designed to enhance the technical and financial capacity of local governments to maintain rural infrastructure, recognized that the pradeshiya sabhas required advice on how to make best use of their financial resources and their legislated income-generating powers to fulfill their local government mandates. The provision of advice and training on sound financial management and resource utilization for staff and elected members was undertaken as an integral part of the package of rural road and market upgrading activities. Such advice was provided on a one-to-one basis by public finance advisors. Technical officers attached to the pradeshiya sabhas were also trained on leveling, surveying, soil testing, AutoCAD drafting, and estimation and tender procedures. This training was assessed to be very
1 At Maramba Walihena, as many as 15 deaths were reported; pedestrians fell into the river prior to completion of
the new bridge. Also, a one-perch property in the village of Batuwangala worth SLRs5,000 before construction of the bridge sold for SLRs10,000 after bridge completion.
2 These open markets sell vegetables, fruits, fish and meat, and household items.

24 Appendix 2
effective, and the technical officers developed confidence in performing their activities effectively (footnote 22, p. 17). 22. The project implementation consultants also provided training to pradeshiya sabha chairpersons and staff in all 36 pradeshiya sabhas on the local government accounting system, preparation of final accounts, generation of additional revenue, and improved budgeting and assets management. Consultants developed documents, covering systems and procedures on the above fields, to be followed by the pradeshiya sabhas. Most pradeshiya sabhas improved their financial management capacities. Those local authorities, who have not prepared their annual accounts for years, cleared their arrears and completed final accounts for 2008 and 2009 during the stipulated period. Four pradeshiya sabhas have received satisfactory audits by the auditor general. Appendix 5 indicates details of the training programs.
3. Skills Development to Facilitate Private Sector Participation in Rural Development
23. This component, providing skills and capacities to the executing agency to facilitate private sector participation in rural development, was designed to assist formulation of policy and regulatory issues in the sectors promoted under the project. The executing agency at the end of the project was the Ministry of Nation Building and Estate Infrastructure Development, and the project was implemented by the Southern Provincial Council (SPC) with the assistance of NDB for the credit component. Monitoring of project progress was carried out by the Provincial Project Management Committee, chaired by the SPC chief secretary at the provincial level and the PMO at the district level. 24. Training was provided to SPC and PMO on enterprise development, business promotion and marketing, as well as public relations and information management. Briefings were provided for the elected members and staff of the pradeshiya sabhas on the intent and implementation arrangements for the project to facilitate their participation and ensuring that they maximized potential benefits from the project. Courses and seminars in governance, public management, public accountability, interaction with the private sector, and development planning were also provided. SPC received support to undertake special policy studies, to upgrade skills and equipment in its Department of Local Government, and to strengthen and fully utilize the existing Provincial Management and Training Institute at Wakwella as a venue for project-related training programs. At the national level, project support was provided to establish and equip a private sector promotion and policy unit under the executing agency. This unit developed strategies to enhance working relationships and coordination with the private sector and worked on key policy and regulatory issues in the sector.
4. Project Management Office Component 25. This component was provided as determined at appraisal. A professionally administered PMO was established within 2 months of loan approval to coordinate and monitor project activities. The PMO coordinated with and contracted EDS providers, coordinated with PFIs, set up and supported enterprise development and information centers, administered the civil works component, and undertook project implementation monitoring and evaluation tasks. District PMOs were established in the three districts to implement and monitor the project activities at the district level. Incremental staff, equipment, and materials needed by the Department of Local Government to supervise and implement the rural road and market improvement activities were

Appendix 2 25
provided, along with training for project and Department of Local Government staff on subjects and activities relevant to their duties under the project. 26. PMO staff and selected Department of Local Government staff were trained in project management, monitoring, and supervision through the selected training programs. After the December 2004 tsunami devastated Southern Province's coast, ADB provided emergency assistance through the Southern Province Reconstruction component of the Tsunami-Affected Area Rebuilding Project to rehabilitate the damaged infrastructure. ADB and the government decided to implement this project through the PMO with same key staff as the Southern Province Rural Economic Advancement Project. The PMO staff implemented both projects from May 2005.

26 Appendix 3
ROADS, PEDESTRIAN BRIDGES AND MARKETS DETAILS Table A3.1: Demonstration Gravel Rural Roads
Length of Road km
Contract Completion Date
Contract Value (with VAT) SLRs
millions Contract Number Name of Road Contractor Name Roads no. PS Area
Target Actual
Contract Tender
Date
Contract Award Date Original Actual Original Actual
Galle District 731026 Manawila Kabarayamulla Rd N.M.G.I. Asoka 1 Akmeemana 1.00 1.00 20.08.2003 01.09.2003 07.01.2004 15.07.2004 1.97 0.96 732019 Benwila Rd Sripali Contractors 1 Ambalangoda 1.50 1.50 20.08.2003 01.09.2003 07.01.2004 15.07.2004 1.10 1.06 733004 Niyagama Pitadeniya Rd R.P. Kumarage 1 Baddegama 1.00 1.00 20.08.2003 01.09.2003 07.01.2004 15.07.2004 1.59 0.20
734020 Puwakgahabokka Batukanaththa Rd P.J.H. Construction 1 Balapitiya 1.00 1.00 20.08.2003 01.09.2003 07.01.2004 15.07.2004 1.04 0.96
735044 Delkabalagoda Junction to Kekirigashena Rd S. Sachchciyananda 1 Bentota 1.00 1.00 12.08.2004 25.08.2004 30.11.2004 31.03.2005 1.30 1.07
736039 Opatha Haggodaduwa Rd R.P. Kumarage 1 Bope-Poddala 1.00 1.00 12.08.2004 18.08.2004 30.11.2004 27.02.2005 2.19 2.53
737037 Ganegoda Wathurawila Bogaha Junction
Hansagiri Contractors 1 Elpitiya 1.00 1.00 20.08.2003 01.09.2003 30.12.2004 30.12.2004 1.89 1.00
738010 Santhosagama Pelessa Rd H. Illeperuma 1 Habaraduwa 1.00 1.00 20.08.2003 01.09.2003 12.12.2004 14.10.2004 0.97 1.09
739030 Kekillamandiya Rd Vinith Kantha De Silva 1 Hikkaduwa 1.00 1.00 20.08.2003 01.09.2003 12.12.2004 14.10.2004 1.13 1.07
740032 Kopikade Junction to Unagaswala Rd S.P. Priyankara 1 Karandeniya 1.27 1.27 20.08.2003 01.09.2003 12.12.2004 14.10.2004 1.03 0.89
741015 Urala Jambugahawila Rd W.K.T. Darmawardana 1 Nagoda 1.00 1.00 20.08.2003 01.09.2003 11.12.2005 14.01.2005 1.30 0.65
742003 Neluwa Udawala Rd K.N.S. Construction 1 Neluwa 1.00 1.00 20.08.2003 01.09.2003 09.12.2005 28.02.2005 1.94 1.04 743034 Bambarawana Hiniduma Rd S.P. Priyankara 1 Niyagama 1.00 1.00 20.08.2003 01.09.2003 12.12.2004 14.10.2004 1.30 0.84
744015 Jesminevally Thawalama Mukalana Rd Ranweli Pvt. Ltd. 1 Thawalama 1.00 1.00 20.08.2003 01.09.2003 13.12.2004 30.10.2004 1.57 1.25
745042 Maragasduwa Wadiyawatta Rd A. Jayasinghe 1 Yakkalamulla 1.05 1.05 20.08.2003 01.09.2003 12.12.2004 15.06.2004 1.02 1.21 Subtotal 15 15.82 15.82 21.32 15.81 Matara District
CLG/LCB/MAT/01 Andadola junction to Dandana Kolaniya G.H. Ariyadasa 1 Matara 1.00 1.00 15.07.2003 12.09.2003 12.12.2004 12.12.2004 2.89 2.16
CLG/LCB/PAS/01 Galketiya Kanda Gomila Rd G.H. Ariyadasa 1 Pasgoda 1.00 1.00 12.10.2003 14.12.2004 10.03.2005 12.03.2005 2.27 2.39
CLG/LCB/THI/01 Yatiyana Atikehelara Rd Liyanaarachchi Builders 1 Thihagoda 1.00 1.00 22.07.2004 19.08.2004 09.11.2004 14.11.2004 2.10 2.43
CLG/LCB/WEL/01 Delkabalagoda Junction to Kekirigashena Rd A.G.M. Bogahawatta 1 Weligama 1.00 1.00 14.08.2003 12.09.2003 07.12.2003 12.12.2003 2.67 1.89
ACLGM/LCB/AKU/1 Halgoda Pinnapola Rd Rathnayaka Builders 1 Akuressa 1.00 1.00 18.12.2003 08.01.2004 03.01.2004 05.01.2004 1.13 1.34 ACLGM/LCB/DIK/1 Hanwella Polpitiya Rd U.K. padmathilaka 1 Dickwella 1.00 1.00 01.12.2003 15.01.2004 17.12.2003 18.12.2003 1.65 1.76
ACLGM/LCB/HAK/1 Narawalpitiya (North) Welipotha Rd
Napatha Ella Construction 1 Hakmana 1.00 1.00 15.07.2004 29.08.2004 30.07.2004 01.07.2004 1.45 0.92
ACLGM/LCB/KOT/1A Miriswatta Rd W.D. Karunadasa 1 Kotapola 1.00 1.00 06.06.2006 20.06.2006 22.06.2006 24.06.2006 2.94 0.21 ACLGM/LCB/MAL/1 Deddugoda Karantholla Rd R.S. Abeywickrama 1 Malimboda 1.00 1.00 12.12.2003 26.01.2004 24.12.2003 24.12.2003 1.32 1.27
11 7.00 7.00 21.50 16.94
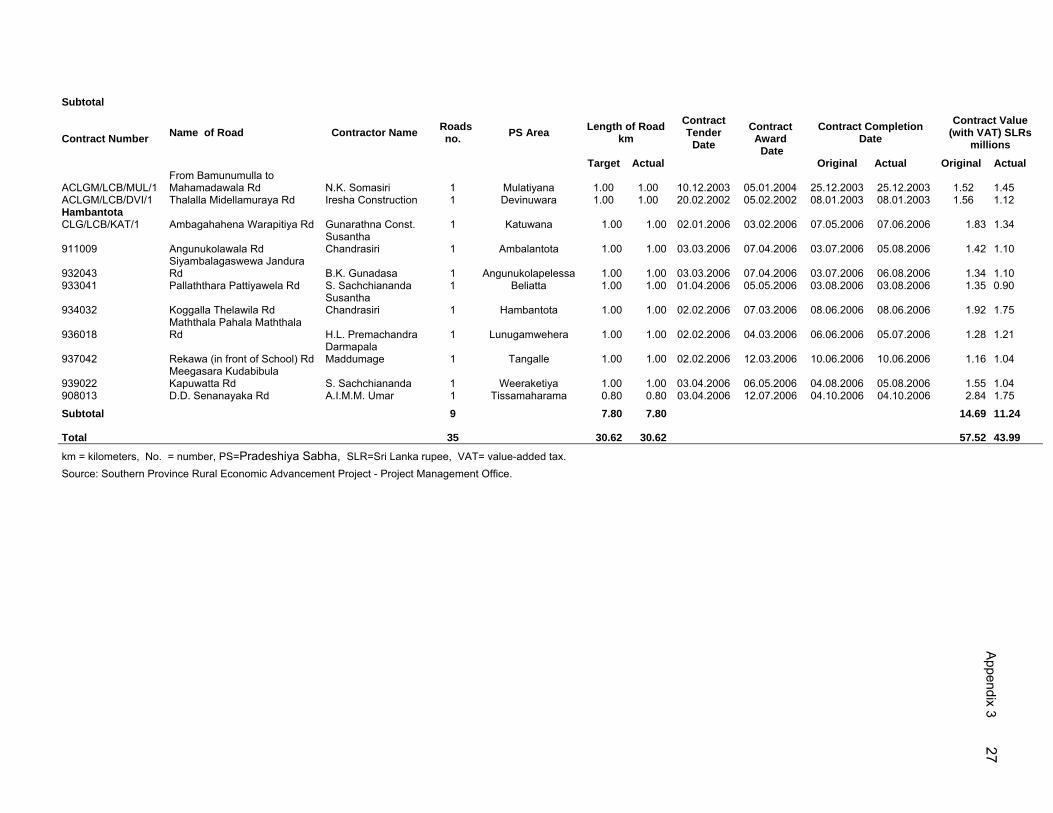
Appendix 3
27
Subtotal
Contract Number Name of Road Contractor Name Roads
no. PS Area Length of Road km
Contract Tender
Date
Contract Award Date
Contract Completion Date
Contract Value (with VAT) SLRs
millions
Target Actual Original Actual Original Actual
ACLGM/LCB/MUL/1 From Bamunumulla to Mahamadawala Rd N.K. Somasiri 1 Mulatiyana 1.00 1.00 10.12.2003 05.01.2004 25.12.2003 25.12.2003 1.52 1.45
ACLGM/LCB/DVI/1 Thalalla Midellamuraya Rd Iresha Construction 1 Devinuwara 1.00 1.00 20.02.2002 05.02.2002 08.01.2003 08.01.2003 1.56 1.12 Hambantota CLG/LCB/KAT/1 Ambagahahena Warapitiya Rd Gunarathna Const. 1 Katuwana 1.00 1.00 02.01.2006 03.02.2006 07.05.2006 07.06.2006 1.83 1.34
911009 Angunukolawala Rd Susantha Chandrasiri 1 Ambalantota 1.00 1.00 03.03.2006 07.04.2006 03.07.2006 05.08.2006 1.42 1.10
932043 Siyambalagaswewa Jandura Rd B.K. Gunadasa 1 Angunukolapelessa 1.00 1.00 03.03.2006 07.04.2006 03.07.2006 06.08.2006 1.34 1.10
933041 Pallaththara Pattiyawela Rd S. Sachchiananda 1 Beliatta 1.00 1.00 01.04.2006 05.05.2006 03.08.2006 03.08.2006 1.35 0.90
934032 Koggalla Thelawila Rd Susantha Chandrasiri 1 Hambantota 1.00 1.00 02.02.2006 07.03.2006 08.06.2006 08.06.2006 1.92 1.75
936018 Maththala Pahala Maththala Rd H.L. Premachandra 1 Lunugamwehera 1.00 1.00 02.02.2006 04.03.2006 06.06.2006 05.07.2006 1.28 1.21
937042 Rekawa (in front of School) Rd Darmapala Maddumage 1 Tangalle 1.00 1.00 02.02.2006 12.03.2006 10.06.2006 10.06.2006 1.16 1.04
939022 Meegasara Kudabibula Kapuwatta Rd S. Sachchiananda 1 Weeraketiya 1.00 1.00 03.04.2006 06.05.2006 04.08.2006 05.08.2006 1.55 1.04
908013 D.D. Senanayaka Rd A.I.M.M. Umar 1 Tissamaharama 0.80 0.80 03.04.2006 12.07.2006 04.10.2006 04.10.2006 2.84 1.75
Subtotal 9 7.80 7.80 14.69 11.24
Total 35 30.62 30.62 57.52 43.99
km = kilometers, No. = number, PS=Pradeshiya Sabha, SLR=Sri Lanka rupee, VAT= value-added tax. Source: Southern Province Rural Economic Advancement Project - Project Management Office.

28 Appendix 3
Table A3.2: Improved Gravel Rural Roads at the First Phase
Length of Roads (km)
Contract Completion Date
Contract Value (with VAT) SLRs
millions Contractors no.
Roads no. PS Area Target Actual
Contract Tender
Date Contract Award
Dates Original Actual Original Actual Galle District
4 5 Akmeemana 8.93 8.93 Various Sep 2004 − Oct 2005 Jan 2006 June 2006 8.72 8.10
3 6 Ambalangoda 6.15 6.15 Various Aug 2004 − Mar 2006 June 2006 June 2006 11.88 11.71
4 4 Baddegama 9.50 9.50 Various Aug 2004 − Nov 2006 Feb 2007 May 2007 5.38 5.004 3 Balapitiya 8.37 8.37 Various Aug 2004 − Sep 2004 Dec 2004 June 2006 9.52 9.252 3 Bentota 7.94 7.94 Various Feb 2005 − July 2005 Oct 2005 June 2006 4.46 4.104 1 Bope-Poddala 6.15 6.15 Various Sep 2004 Dec 2004 June 2005 0.58 0.096 7 Elpitiya 9.10 9.10 Various Aug 2004 − Nov 2005 Feb 2006 May 2006 10.61 10.003 3 Habaraduwa 8.50 8.50 Various Nov 2004 − May2005 Aug 2005 June 2006 8.55 7.263 4 Hikkaduwa 9.10 9.10 Various Aug 2004 − Sep 2004 Dec 2004 July 2006 13.73 13.322 2 Karandeniya 8.81 8.81 Various Aug 2004 − Oct 2004 Jan 2005 Dec 2006 6.44 6.132 4 Nagoda 8.01 8.01 Various July 2004 − Feb 2006 May 2005 Dec 2006 8.23 8.012 1 Neluwa 6.35 6.35 Various Sep 2004 Dec 2004 Aug 2006 4.79 4.763 5 Niyagama 8.97 8.97 Various Oct 2004 − Dec 2005 Mar 2006 Dec 2006 7.49 5.314 2 Thawalama 3.53 3.53 Various Sep 2004 Dec 2004 May 2006 2.61 2.184 3 Yakkalamulla 9.91 9.91 Various Sep 2004 − Apr 2005 July 2005 June 2006 7.32 6.68
50 53 119.32 119.32 110.31 101.90Matara District
4 2 Akurassa 9.81 9.81 Various Nov 200 − 4 Apr 2005 July 2005 May 2006 16.72 16.216 7 Devinuwara 7.14 7.14 Various May 2005 − Nov 2005 Feb 2006 Apr 2006 7.34 7.045 5 Dickwella 8.78 8.78 Various Oct 2004 − June 2005 Sep 2005 Mar 2006 16.45 14.385 4 Hakmana 8.83 8.83 Various Sep 2004 − June 2005 Sep 2005 Feb 2006 14.14 11.414 6 Kamburupitiya 9.02 9.02 Various Mar 2005 − Aug 2005 Nov 2005 Apr 2006 15.09 13.644 4 Kotapola 9.13 9.13 Various Oct 2004 − Apr 2005 July 2005 May 2006 13.11 8.274 3 Malimbada 8.70 8.70 Various Aug 2005 − Sep 2005 Dec 2005 June 2006 15.58 12.435 6 Matara 7.25 7.25 Various Nov 2004 − May 2005 Aug 2005 May 2006 7.12 7.215 5 Mulatiyana 9.34 9.34 Various Sep 2004 − Sep 2005 Dec 2005 Dec 2006 13.54 11.02
4 4 Pasgoda 7.70 7.70 Various Oct 2004 − Mar 2005 June 2005 May 2006 10.36 8.52
6 6 Tihagoda 7.84 7.84 Various Sep 2004 − Aug 2005 Nov 2005 June 2006 12.15 12.035 7 Waligama 8.42 8.42 Various Nov 2004 − June 2005 Sep 2005 July 2006 10.81 10.67
57 59 101.96 101.96 152.41 132.83Hambantota District
4 4 Ambalanthota 8.40 8.40 Various Aug 2004 − May 2006 Aug 2006 May 2006 13.43 13.363 3 Angunukolapalassa 7.10 7.10 Various Aug 2004 − Dec 2004 Mar 2005 June 2006 8.83 8.755 5 Beliaththa 8.52 8.52 Various Aug 2004 − May 2006 Aug 2006 July 2006 10.27 9.251 1 Hambantota 9.00 9.00 Various Aug 2004 Nov 2004 Aug 2006 9.85 9.283 4 Katuwana 9.25 9.25 Various Mar 2005 − July 2005 Oct 2005 Oct 2006 9.91 9.502 5 Tangalle 7.90 7.90 Various Aug 2004 − Sep 2004 Dec 2004 July 2006 7.62 7.53
2 2 Tissamaharama 6.90 6.90 Various May 2005 − June 2005 Sep 2005 Aug 2006 12.06 7.48
3 3 Weerakatiya 9.01 9.01 Various Feb 2005 − Oct 2005 Jan 2006 Mar 2007 9.17 8.41
2 2 Lunugamwehera 10.10 10.10 Various Sep 2004 − June 2005 Sep 2005 May 2008 21.03 19.30
25 29 76.18 76.18 102.17 92.86Total 132 141 297.46 297.46 364.89 327.59Km = kilometers, No. = number, PS= Pradeshiya Sabha, SLR=Sri Lanka rupee, VAT= value-added tax. Source: Southern Province Rural Economic Advancement Project - Project Management Office
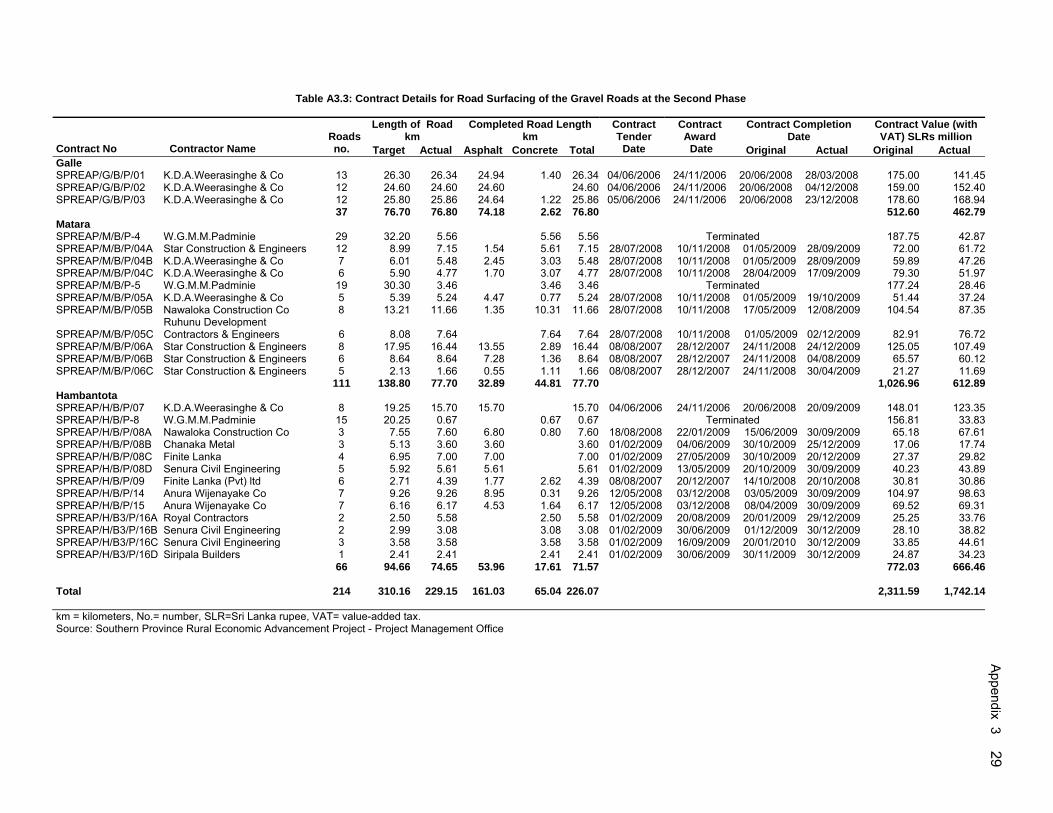
Appendix 3 29
Table A3.3: Contract Details for Road Surfacing of the Gravel Roads at the Second Phase
Length of Road km
Completed Road Length km
Contract Completion Date
Contract Value (with VAT) SLRs million
Contract No Contractor Name Roads
no. Target Actual Asphalt Concrete Total
Contract Tender
Date
Contract Award Date Original Actual Original Actual
Galle SPREAP/G/B/P/01 K.D.A.Weerasinghe & Co 13 26.30 26.34 24.94 1.40 26.34 04/06/2006 24/11/2006 20/06/2008 28/03/2008 175.00 141.45 SPREAP/G/B/P/02 K.D.A.Weerasinghe & Co 12 24.60 24.60 24.60 24.60 04/06/2006 24/11/2006 20/06/2008 04/12/2008 159.00 152.40 SPREAP/G/B/P/03 K.D.A.Weerasinghe & Co 12 25.80 25.86 24.64 1.22 25.86 05/06/2006 24/11/2006 20/06/2008 23/12/2008 178.60 168.94 37 76.70 76.80 74.18 2.62 76.80 512.60 462.79 Matara SPREAP/M/B/P-4 W.G.M.M.Padminie 29 32.20 5.56 5.56 5.56 Terminated 187.75 42.87 SPREAP/M/B/P/04A Star Construction & Engineers 12 8.99 7.15 1.54 5.61 7.15 28/07/2008 10/11/2008 01/05/2009 28/09/2009 72.00 61.72 SPREAP/M/B/P/04B K.D.A.Weerasinghe & Co 7 6.01 5.48 2.45 3.03 5.48 28/07/2008 10/11/2008 01/05/2009 28/09/2009 59.89 47.26 SPREAP/M/B/P/04C K.D.A.Weerasinghe & Co 6 5.90 4.77 1.70 3.07 4.77 28/07/2008 10/11/2008 28/04/2009 17/09/2009 79.30 51.97 SPREAP/M/B/P-5 W.G.M.M.Padminie 19 30.30 3.46 3.46 3.46 Terminated 177.24 28.46 SPREAP/M/B/P/05A K.D.A.Weerasinghe & Co 5 5.39 5.24 4.47 0.77 5.24 28/07/2008 10/11/2008 01/05/2009 19/10/2009 51.44 37.24 SPREAP/M/B/P/05B Nawaloka Construction Co 8 13.21 11.66 1.35 10.31 11.66 28/07/2008 10/11/2008 17/05/2009 12/08/2009 104.54 87.35
SPREAP/M/B/P/05C Ruhunu Development Contractors & Engineers 6 8.08 7.64 7.64 7.64 28/07/2008 10/11/2008 01/05/2009 02/12/2009 82.91 76.72
SPREAP/M/B/P/06A Star Construction & Engineers 8 17.95 16.44 13.55 2.89 16.44 08/08/2007 28/12/2007 24/11/2008 24/12/2009 125.05 107.49 SPREAP/M/B/P/06B Star Construction & Engineers 6 8.64 8.64 7.28 1.36 8.64 08/08/2007 28/12/2007 24/11/2008 04/08/2009 65.57 60.12 SPREAP/M/B/P/06C Star Construction & Engineers 5 2.13 1.66 0.55 1.11 1.66 08/08/2007 28/12/2007 24/11/2008 30/04/2009 21.27 11.69 111 138.80 77.70 32.89 44.81 77.70 1,026.96 612.89 Hambantota SPREAP/H/B/P/07 K.D.A.Weerasinghe & Co 8 19.25 15.70 15.70 15.70 04/06/2006 24/11/2006 20/06/2008 20/09/2009 148.01 123.35 SPREAP/H/B/P-8 W.G.M.M.Padminie 15 20.25 0.67 0.67 0.67 Terminated 156.81 33.83 SPREAP/H/B/P/08A Nawaloka Construction Co 3 7.55 7.60 6.80 0.80 7.60 18/08/2008 22/01/2009 15/06/2009 30/09/2009 65.18 67.61 SPREAP/H/B/P/08B Chanaka Metal 3 5.13 3.60 3.60 3.60 01/02/2009 04/06/2009 30/10/2009 25/12/2009 17.06 17.74 SPREAP/H/B/P/08C Finite Lanka 4 6.95 7.00 7.00 7.00 01/02/2009 27/05/2009 30/10/2009 20/12/2009 27.37 29.82 SPREAP/H/B/P/08D Senura Civil Engineering 5 5.92 5.61 5.61 5.61 01/02/2009 13/05/2009 20/10/2009 30/09/2009 40.23 43.89 SPREAP/H/B/P/09 Finite Lanka (Pvt) ltd 6 2.71 4.39 1.77 2.62 4.39 08/08/2007 20/12/2007 14/10/2008 20/10/2008 30.81 30.86 SPREAP/H/B/P/14 Anura Wijenayake Co 7 9.26 9.26 8.95 0.31 9.26 12/05/2008 03/12/2008 03/05/2009 30/09/2009 104.97 98.63 SPREAP/H/B/P/15 Anura Wijenayake Co 7 6.16 6.17 4.53 1.64 6.17 12/05/2008 03/12/2008 08/04/2009 30/09/2009 69.52 69.31 SPREAP/H/B3/P/16A Royal Contractors 2 2.50 5.58 2.50 5.58 01/02/2009 20/08/2009 20/01/2009 29/12/2009 25.25 33.76 SPREAP/H/B3/P/16B Senura Civil Engineering 2 2.99 3.08 3.08 3.08 01/02/2009 30/06/2009 01/12/2009 30/12/2009 28.10 38.82 SPREAP/H/B3/P/16C Senura Civil Engineering 3 3.58 3.58 3.58 3.58 01/02/2009 16/09/2009 20/01/2010 30/12/2009 33.85 44.61 SPREAP/H/B3/P/16D Siripala Builders 1 2.41 2.41 2.41 2.41 01/02/2009 30/06/2009 30/11/2009 30/12/2009 24.87 34.23 66 94.66 74.65 53.96 17.61 71.57 772.03 666.46 Total 214 310.16 229.15 161.03 65.04 226.07 2,311.59 1,742.14
km = kilometers, No.= number, SLR=Sri Lanka rupee, VAT= value-added tax. Source: Southern Province Rural Economic Advancement Project - Project Management Office

30 Appendix 3
Table A3.4: Contract Details for Flood Damaged Gravel Rural Roads
Length Road km Contract Completion Date
Contract Value (with VAT) SLRs
million Contractors no.
Roads no. PS Area Target Actual Contract Tender Date
Contract Award Date Original Actual Original Actual
Galle District
3 16 Baddegama 5.05 5.05 17.05.2004 − 22.02.2005 09.08.2004 − 27.05.2005 16.11.2004 − 05.09.2005 17.01.2005 − 05.09.205 3.65 4.49 2 20 Karandeniya 30.35 30.35 17.05.2004 − 20.07.2004 09.08.2004 − 25.08.2004 03.12.2004 − 03.03.205 10.02.2005 − 01.03.2005 5.03 4.37 4 44 Neluwa 41.20 41.20 06.09.2004 − 18.07.2005 30.11.2004 − 16.11.2005 09.03.2005 − 16.02.2006 01.03.2005 − 16.02.2006 7.02 4.21 4 45 Niyagama 43.54 43.54 20.07.2004 − 22.02.2005 25.08.2004 − 09.05.2005 03.12.2004 − 31.12.2005 30.03.2005 − 31.12.2005 8.07 6.20 5 14 Nagoda 29.15 29.15 17.05.2004 − 31.05.2005 09.08.2004 − 05.01.2005 18.11.2004 − 19.11.2005 15.03.2005 −19.11.2005 9.19 6.58 2 11 Elpitiya 17.25 17.25 20.07.2004 25.08.2004 − 01.09.2004 03.12.2004 − 30.04.2005 31.03.2005 − 27.05.2005 3.92 5.55
20 150 166.54 166.54 36.89 31.40
Matara District 7 97 Thihagoda 68.38 68.38 19.07.2004 − 06.09.2004 06.09.2004 −12.11.2004 21.12.2004 − 12.04.2005 12.04.2005 14.78 15.42 2 9 Akuressa 11.79 11.79 19.07.2004 − 31.05.2005 06.09.2004 − 18.04.2005 21.12.2004 21.12.2004 2.98 4.50 3 11 Pasgoda 19.50 19.50 06.09.2004 20.10.2004 − 20.12.2004 09.02.2005 − 24.04.2005 24.04.2005 4.18 3.68 1 5 Kotapola 9.15 9.15 09.06.2004 01.11.2004 01.03.2005 12.04.2005 1.08 1.79 3 10 Mulatiyana 19.00 19.00 06.04.2004 01.11.2004 − 26.10.2004 20.03.2005 − 10.05.2005 12.05.2005 4.24 3.58 3 35 Malimbada 31.12 31.12 19.07.2004 − 28.09.2004 15.09.2004 − 01.11.2004 25.01.2005 − 29.12.2005 29.12.2005 3.84 3.97 2 16 Hakmana 25.59 25.52 06.09.2004 01.11.2004 09.05.2005 − 11.05.2005 11.05.2005 1.61 1.14 7 35 Kamburupitiya 35.25 35.25 12.07.2005 17.08.2005 18.11.2005 19.11.2005 13.05 10.26 3 17 Matara 27.40 27.44 04.01.2005 12.02.2005 14.05.2005 14.11.2005 6.96 5.22 1 8 Kirinda Puhulwella 10.22 10.22 11.09.2005 12.10.2005 12.01.2006 13.01.2006 2.62 1.03
32 243 257.40 257.37 55.34 50.60
Hambantota District 6 37 Katuwana 52.00 52.00 04.09.2005 19.09.2005 20.12.2005 25.12.2005 10.43 9.92 5 12 Weeraketiya 32.00 32.00 04.06.2005 19.06.2005 25.09.2005 30.09.2005 9.12 8.33 5 24 Beliatta 30.30 30.30 03.09.2005 17.09.2005 17.12.2005 30.12.2005 7.42 7.63 6 32 Tangalle 42.10 42.10 04.05.2005 15.05.2005 15.08.2005 15.08.2005 8.74 7.35 3 10 Angunukolapelessa 25.00 25.00 15.07.2005 02.08.2005 02.11.2005 15.11.2005 3.71 3.20
25 115 181.40 181.40 39.41 36.43 Total 77 508 605.34 605.31 131.65 118.42
km = kilometers, No. = number, PS= Pradeshiya Sabha, SLR=Sri Lanka rupee, VAT= value-added tax.
Source: Southern Province Rural Economic Advancement Project - Project Management Office

Appendix 3 31
Table A3.5: Contract Details for Flood-Damaged Replacement Pedestrian Bridges
Contract Completion Date
Contract Value (with VAT) SLRs million
Contract Location of Bridge Bridge
Width m
Bridge Length
m Contractor Contract
Tender Date
Contract Award Date Original Actual Original Actual
Galle District Ketagoda (Nagoda DS) 1.8 55 08/05/2006 27/08/2007 30/12/2009 29.40 30.57 Aluth Ehala Mapalagama (Nagoda DS) 1.8 52 08/05/2006 27/08/2007 30/12/2009 28.87 30.02 Panangala Porupanawa (Thawalama DS) 1.8 62 08/05/2006 27/08/2007 30/12/2009 30.97 43.33 Pathawelivitiya Madakada (Karandeniya DS) 3.5 34 08/05/2006 27/08/2007 30/12/2009 53.55 61.41 Majuwana (Baddegama DS) 1.8 45 08/05/2006 27/08/2007 30/12/2009 29.40 30.57
SP/B/G-01
Ehalakanda (Thawalama DS) 1.8 52
State Development Construction Corporation
20/06/2005
08/05/2006 27/08/2007 30/12/2009 35.43 36.85 207.62 232.75
Neluwa Madugate (Neluwa DS) 1.8 38 32.12 29.74 Batuwangala (Neluwa DS) 1.8 38 29.97 39.62 Mawanana (Neluwa DS) 1.8 35 30.67 35.55 Neluwa (Neluwa DS) 1.8 36 29.97 31.85 Kosmulla (Neluwa DS) 1.8 48 29.70 27.26 Gagasiriya (Thawalama DS) 1.8 36 31.87 26.49
SP/B/G-02
Hiniduma (Thawalama DS) 1.8 52
CML Edwards Construction Ltd 06/08/2006 24/11/2006 26/06/2008
11/03/2009
33.60 43.79 217.91 234.30 SP/B/G-02A Lankagama 2.4 33 ELS Construction 04/07/2008 02/12/2008 31/05/2009 15/11/2009 45.20 45.00 45.20 45.00 Matara District
Miderapitiya Pitawela (Kotapola DS) 3.5 22 12/12/2006 30/06/2008 11/05/2009 25.32 26.79 Kekilla Gammanaya (Akuressa DS) 1.8 30 12/12/2006 30/06/2008 11/05/2009 27.76 28.72 Aranuwa (Kotapola DS) 1.8 32 12/12/2006 30/06/2008 11/05/2009 34.15 27.74
SP/B/M-01 Godapitiya Maramba Welihena (Akuressa DS) 1.8 48
CML Edwards Construction Ltd
06/08/2006
12/12/2006 30/06/2008 11/05/2009 38.37 54.39 125.59 137.64 SP/B/M-01A Urubokka 2.4 30 ELS Construction 04/07/2008 02/12/2008 31/05/2009 15/11/2009 41.16 36.86 41.16 36.86 Total 637.48 686.55 m = meters, SLR=Sri Lanka rupee, VAT= value-added tax.
Source: Southern Province Rural Economic Advancement Project - Project Management Office
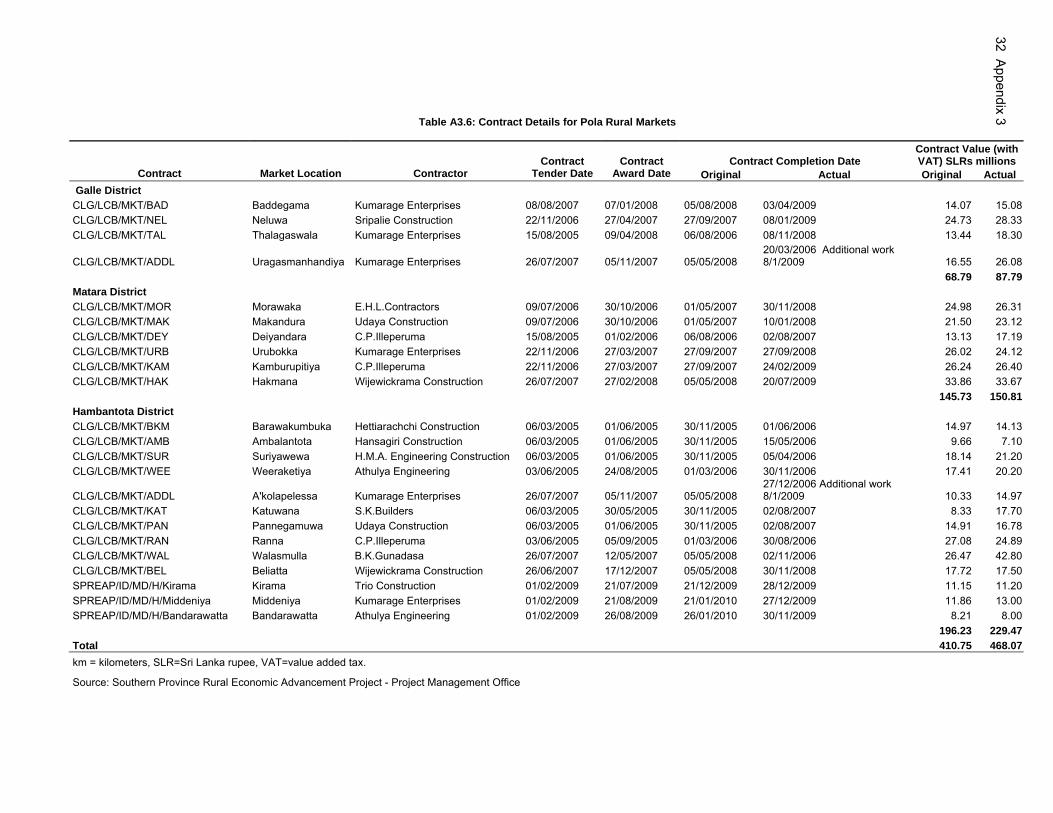
32 Appendix 3
Table A3.6: Contract Details for Pola Rural Markets
Contract Completion Date Contract Value (with VAT) SLRs millions
Contract Market Location Contractor Contract
Tender Date Contract
Award Date Original Actual Original Actual Galle District CLG/LCB/MKT/BAD Baddegama Kumarage Enterprises 08/08/2007 07/01/2008 05/08/2008 03/04/2009 14.07 15.08 CLG/LCB/MKT/NEL Neluwa Sripalie Construction 22/11/2006 27/04/2007 27/09/2007 08/01/2009 24.73 28.33 CLG/LCB/MKT/TAL Thalagaswala Kumarage Enterprises 15/08/2005 09/04/2008 06/08/2006 08/11/2008 13.44 18.30
CLG/LCB/MKT/ADDL Uragasmanhandiya Kumarage Enterprises 26/07/2007 05/11/2007 05/05/2008 20/03/2006 Additional work 8/1/2009 16.55 26.08
68.79 87.79 Matara District CLG/LCB/MKT/MOR Morawaka E.H.L.Contractors 09/07/2006 30/10/2006 01/05/2007 30/11/2008 24.98 26.31 CLG/LCB/MKT/MAK Makandura Udaya Construction 09/07/2006 30/10/2006 01/05/2007 10/01/2008 21.50 23.12 CLG/LCB/MKT/DEY Deiyandara C.P.Illeperuma 15/08/2005 01/02/2006 06/08/2006 02/08/2007 13.13 17.19 CLG/LCB/MKT/URB Urubokka Kumarage Enterprises 22/11/2006 27/03/2007 27/09/2007 27/09/2008 26.02 24.12 CLG/LCB/MKT/KAM Kamburupitiya C.P.Illeperuma 22/11/2006 27/03/2007 27/09/2007 24/02/2009 26.24 26.40 CLG/LCB/MKT/HAK Hakmana Wijewickrama Construction 26/07/2007 27/02/2008 05/05/2008 20/07/2009 33.86 33.67
145.73 150.81 Hambantota District CLG/LCB/MKT/BKM Barawakumbuka Hettiarachchi Construction 06/03/2005 01/06/2005 30/11/2005 01/06/2006 14.97 14.13 CLG/LCB/MKT/AMB Ambalantota Hansagiri Construction 06/03/2005 01/06/2005 30/11/2005 15/05/2006 9.66 7.10 CLG/LCB/MKT/SUR Suriyawewa H.M.A. Engineering Construction 06/03/2005 01/06/2005 30/11/2005 05/04/2006 18.14 21.20 CLG/LCB/MKT/WEE Weeraketiya Athulya Engineering 03/06/2005 24/08/2005 01/03/2006 30/11/2006 17.41 20.20
CLG/LCB/MKT/ADDL A'kolapelessa Kumarage Enterprises 26/07/2007 05/11/2007 05/05/2008 27/12/2006 Additional work 8/1/2009 10.33 14.97
CLG/LCB/MKT/KAT Katuwana S.K.Builders 06/03/2005 30/05/2005 30/11/2005 02/08/2007 8.33 17.70 CLG/LCB/MKT/PAN Pannegamuwa Udaya Construction 06/03/2005 01/06/2005 30/11/2005 02/08/2007 14.91 16.78 CLG/LCB/MKT/RAN Ranna C.P.Illeperuma 03/06/2005 05/09/2005 01/03/2006 30/08/2006 27.08 24.89 CLG/LCB/MKT/WAL Walasmulla B.K.Gunadasa 26/07/2007 12/05/2007 05/05/2008 02/11/2006 26.47 42.80 CLG/LCB/MKT/BEL Beliatta Wijewickrama Construction 26/06/2007 17/12/2007 05/05/2008 30/11/2008 17.72 17.50 SPREAP/ID/MD/H/Kirama Kirama Trio Construction 01/02/2009 21/07/2009 21/12/2009 28/12/2009 11.15 11.20 SPREAP/ID/MD/H/Middeniya Middeniya Kumarage Enterprises 01/02/2009 21/08/2009 21/01/2010 27/12/2009 11.86 13.00 SPREAP/ID/MD/H/Bandarawatta Bandarawatta Athulya Engineering 01/02/2009 26/08/2009 26/01/2010 30/11/2009 8.21 8.00
196.23 229.47 Total 410.75 468.07 km = kilometers, SLR=Sri Lanka rupee, VAT=value added tax.
Source: Southern Province Rural Economic Advancement Project - Project Management Office

Appendix 4
33
Table A4.1: Beneficiary Survey of Southern Province Rural Economic Advancement Project – Roads
Ehelapitiya
Pump House Road Gurusinghagoda
Temple Road Mee
Meduma Road Road Halgoda
Pinnapola Road
Vilpita Batugodawatta
Road
Vilamulla Bandarawatta
Road Road
Before After Before After Before After Before After Before After Before After Before After District Galle Galle Galle Galle Matara Matara Hambantota Invested Amount (SLR million) 20.41 5.51 12.16 12.07 0.26 0.37 9.54 Length (km) 4.19 1.55 3.18 0.87 0.21 0.22 0.46 Width (m) 2 3 2 3 2 3 3 3 3 3.5 2 3 3 3.5
Gravel Road Carpet Asphalt Tar
Road Asphalt Gravel Road Asphalt
Gravel Road Asphalt
Gravel Road Asphalt
Gravel Road
Gravel Road
Gravel Road Asphalt
Road Usage per day Pedestrians (No.) 160 200 150 250 170 200 150 175 100 160 100 250 100 150 Vehicles (No.) Bicycles 30 60 10 25-30 30 15 10 10 35 250 50 75 Motor Bicycles 25 100 50 150 40 5 10 25 25 100 50 100 Three-wheelers 30 10 30 50 2 6 4 75 25 200 Car 20 3 5 10 1 8 5 25 Van 15 20 25 2 5 2 Bus 1 1 1 1 1 Lorry 4 1 1 Tipper 4 2 Tractors (Small) 3 5 5 5 5 2 2 4 2 5 Tractors 1 1 1 2 1 1 3 1 3 Land Value (SLR ‘000) 100 300 100 400 100 300 200 400 900 1,000 1,000 4,000 200 400 Accidents (Nos.) 3 Maintenance Surface P G F G P G P G P G P G P G Drainage P F F F P F P F P F P F P F Cleaning two sides P F F F P F P F P F P F P F Notes: km = kilometers, m = meters, No. = number, P = Poor, F = Fair, G = Good. Source: Southern Province Rural Economic Advancement Project - Project Management Office

34 Appendix 4
Table A4.2 : Beneficiary Survey for Markets
Neluwa Uragasmanhandiya Baddegama Deyiyandara Morawaka Urubokka Pannegamuwa Makadura Sooriyawawe Pola Before After Before After Before After Before After Before After Before After Before After Before After Before After
G.S. Division Neluwa Uragasmanhandiya – South Baddegama Deyiyandara Morawaka Urubokka Pannegamuwa Makadura (Est) Sooriyawawe
D.S. Division Neluwa Uragasmanhandiya Baddegama Deyiyandara Pitabaddara Pasgoda Thissamaharamaya Mulatiyana Sooriyawawe P.S. Division Neluwa Baddegama Mulatiyana Pitabaddara Pasgoda Thissamaharamaya Mulatiyana Sooriyawawe Invested Amount (SLRs millions) 28.43 31.97 15.49 18.66 28.24 30.44 17.86 28.24 22.43 Capacity of the market Assistance of Local Government Department Annual income for PS (SLRs millions) 0.84 1.56 0.70 1.40 1.00 2.50 0.60 1.50 0.90 1.82 0.84 0.08 0.20 3.00 5.50 No. of stalls 180 240 175 320 179 266 50 215 96 n .d. 340 250 100 125 150 225 No. of shops 2 8 10 10 16 Details about market functioning Wholesale (days/week) 1 1 4 4 2 2 Retail (days/week) 1 1 1 1 2 2 1 1 1 2 2 2 2 2 2 2 No. of traders 250 380 175 200 300 360 200 320 100 250 300 600 350 450 100 200 200 600 No. of consumers 4,500 8,000 6,000 7,000 7,000 12,000 5,000 7,000 2,000 4,500 10,000 15,000 2,000 8,000 700 1,000 6,000 15,000 Total Turnover (per week) (SLR millions) 4.50 7.60 4.80 5.60 8.40 18.00 7.50 7.00 2.00 4.00 7.50 12.00 1.30 6.00 0.70 1.00 4.50 11.00
Development - Relevant to Management of Market) (Poor, Fair, Good)
Local products F G G G G G F G F F F G F G F G F G cottage industrial products F G F G F G F G F F F F F G F G F G Participation of local farmers F F F F G G F G F F F G F F F F F G Employment Generated F F F G F G F G F G F G F G F G F G Enhancement of Services (Poor, Fair, Good) Sanitary facility F G P P P G F G F G F G P G F G P G Parking spaces F G F F F G F G F F F G F G F G P G Water supply F G F P G G P G F G F G P G F G P G Maintenance of market premises P G F G F G F G P F F G P F F G F G Enhancement of customer care relationship P G F F F G P G F F F G F F F G F G Assistance of Local Government Department (Poor, Fair, Good)
Process of cleaning the market F G F G G G P F G G F G F G F G Collecting taxes F G G G G G F G F G F G P F F G F G Water and electricity supply service P G F F P G P F F G P G F G F G Development of management of market ( Yes / No )
Establishment of Management Office N Y Y Y Y Y N N N N N N N N N N N Y Progress review and taking remedial action N Y Y Y Y Y N Y N N N Y N Y Y Y N Y Notes: G.S. = grama seva, P.S. = pradheshiya sabha, D.S. = divisional secretariat, P = poor, F = fair, G = good, km = kilometers, m = meters, No. = number., Source: Southern Province Rural Economic Advancement Project - Project Management Office
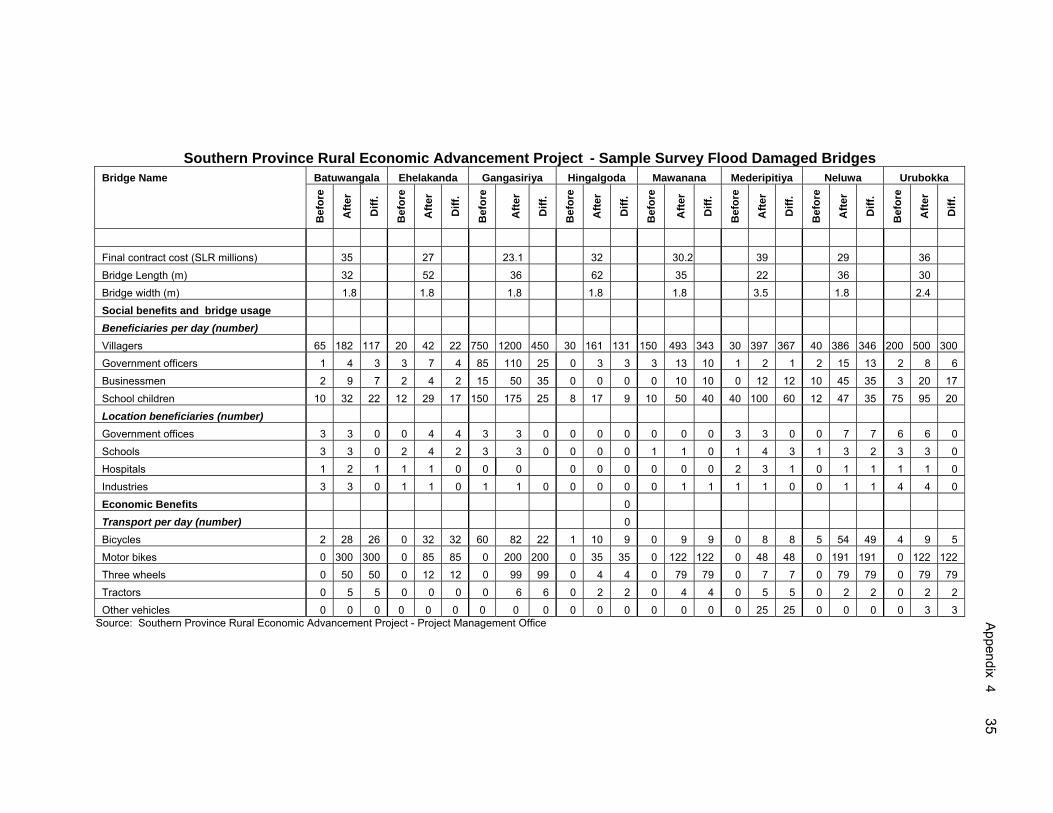
Appendix 4
35
Southern Province Rural Economic Advancement Project - Sample Survey Flood Damaged Bridges Bridge Name Batuwangala Ehelakanda Gangasiriya Hingalgoda Mawanana Mederipitiya Neluwa Urubokka
Bef
ore
Afte
r
Diff
.
Bef
ore
Afte
r
Diff
.
Bef
ore
Afte
r
Diff
.
Bef
ore
Afte
r
Diff
.
Bef
ore
Afte
r
Diff
.
Bef
ore
Afte
r
Diff
.
Bef
ore
Afte
r
Diff
.
Bef
ore
Afte
r
Diff
.
Final contract cost (SLR millions) 35 27 23.1 32 30.2 39 29 36 Bridge Length (m) 32 52 36 62 35 22 36 30 Bridge width (m) 1.8 1.8 1.8 1.8 1.8 3.5 1.8 2.4 Social benefits and bridge usage Beneficiaries per day (number) Villagers 65 182 117 20 42 22 750 1200 450 30 161 131 150 493 343 30 397 367 40 386 346 200 500 300 Government officers 1 4 3 3 7 4 85 110 25 0 3 3 3 13 10 1 2 1 2 15 13 2 8 6 Businessmen 2 9 7 2 4 2 15 50 35 0 0 0 0 10 10 0 12 12 10 45 35 3 20 17 School children 10 32 22 12 29 17 150 175 25 8 17 9 10 50 40 40 100 60 12 47 35 75 95 20 Location beneficiaries (number) Government offices 3 3 0 0 4 4 3 3 0 0 0 0 0 0 0 3 3 0 0 7 7 6 6 0 Schools 3 3 0 2 4 2 3 3 0 0 0 0 1 1 0 1 4 3 1 3 2 3 3 0 Hospitals 1 2 1 1 1 0 0 0 0 0 0 0 0 0 2 3 1 0 1 1 1 1 0 Industries 3 3 0 1 1 0 1 1 0 0 0 0 0 1 1 1 1 0 0 1 1 4 4 0 Economic Benefits 0 Transport per day (number) 0 Bicycles 2 28 26 0 32 32 60 82 22 1 10 9 0 9 9 0 8 8 5 54 49 4 9 5 Motor bikes 0 300 300 0 85 85 0 200 200 0 35 35 0 122 122 0 48 48 0 191 191 0 122 122 Three wheels 0 50 50 0 12 12 0 99 99 0 4 4 0 79 79 0 7 7 0 79 79 0 79 79 Tractors 0 5 5 0 0 0 0 6 6 0 2 2 0 4 4 0 5 5 0 2 2 0 2 2 Other vehicles 0 0 0 0 0 0 0 0 0 0 0 0 0 0 0 0 25 25 0 0 0 0 3 3
Source: Southern Province Rural Economic Advancement Project - Project Management Office

36 Appendix 4
Bridge Name Batuwangala Ehelakanda Gangasiriya Hingalgoda Mawanana Mederipitiya Neluwa Urubokka
Bef
ore
Afte
r
Diff
.
Bef
ore
Afte
r
Diff
.
Bef
ore
Afte
r
Diff
.
Bef
ore
Afte
r
Diff
.
Bef
ore
Afte
r
Diff
.
Bef
ore
Afte
r
Diff
.
Bef
ore
Afte
r
Diff
.
Bef
ore
Afte
r
Diff
.
Agricultural Products Carried Daily Tea Leaves (sacks) 2 60 58 150 250 100 20 35 15 4 11 7 2 12 10 0 600 600 0 20 20 6 25 19 Export crops Products (kg) 0 0 0 35 60 25 50 150 100 0 0 0 25 100 75 0 0 0 0 20 20 0 0 0 Rubber (sheets) 0 0 0 0 0 0 100 700 600 0 0 0 10 150 140 0 0 0 0 80 80 0 0 0 Coconut 0 0 0 0 0 0 0 0 0 0 0 0 10 1,000 990 0 0 0 0 0 0 20 300 280 Paddy (sacks) 0 0 0 10 12 2 0 0 0 0 0 0 0 0 0 0 0 0 0 0 0 0 0 0 Vegetable (kg) 0 0 0 20 50 30 30 100 70 0 0 0 30 150 120 0 0 0 0 0 0 10 45 35 Milk 0 0 0 0 0 0 0 0 0 0 0 0 0 0 0 0 0 0 0 0 0 0 0 0 Others 0 0 0 0 0 0 0 0 0 0 0 0 0 0 0 0 0 0 0 0 0 0 0 0 Kithul honey (Bottles) 0 0 0 0 0 0 0 0 0 2 8 6 5 8 3 4 8 4 0 4 4 0 0 0 Other Benefits Value added (SLRs) Others (per acre) 0 0 0 0 0 0 0 0 0 0 0 0 0 0 0 0.0 0 0 0 0 0 0 0 0 Social life development (numbers) 0 Bicycles 20 28 8 20 65 45 200 75 (125) 2 12 10 5 100 95 0 12 12 15 32 17 4 20 16 Motor Bikes 90 300 210 0 105 105 50 250 200 0 5 5 2 1,500 1,498 0 70 70 6 75 69 3 450 447 Three Wheels 8 50 42 0 20 20 25 75 50 0 6 6 0 100 100 0 20 20 0 20 20 0 10 10 Tractors 1 5 4 0 4 4 6 8 2 0 1 1 0 2 2 0 4 4 0 4 4 0 5 5 Others 0 0 0 0 0 0 3 3 0 5 5 0 0 0 0 4 4 Construction of building (number) Houses 200 300 100 360 400 40 5,000 5,000 0 16 20 4 150 600 450 800 800 0 250 250 0 600 650 50 Industrial Places 5 10 5 1 1 0 1 1 0 1 1 0 1 6 5 0 8 8 10 12 2 3 6 3 Public places 4 4 0 1 1 0 3 4 1 0 0 0 1 2 1 3 3 0 1 1 0 1 1 0 Information on accidents (per annum) Falling 0 0 0 0 0 0 35 0 (35) 0 0 0 6 0 (6) 8 0 (8) 10 0 (10) 60 0 (60) Death 0 0 0 0 0 0 0 0 0 0 0 0 1 0 (1) 1 0 (1) 2 0 (2) 3 0 (3)
Source: Southern Province Rural Economic Advancement Project - Project Management Office

Appendix 4
37
Bridge Name Batuwangala Ehelakanda Gangasiriya Hingalgoda Mawanana Mederipitiya Neluwa Urubokka
Bef
ore
Afte
r
Diff
.
Bef
ore
Afte
r
Diff
.
Bef
ore
Afte
r
Diff
.
Bef
ore
Afte
r
Diff
.
Bef
ore
Afte
r
Diff
.
Bef
ore
Afte
r
Diff
.
Bef
ore
Afte
r
Diff
.
Bef
ore
Afte
r
Diff
.
Supply services to village (number monthly) Arrival of agricultural officers 0 0 0 1 1 0 1 4 3 0 0 0 2 2 0 0 0 0 2 2 1 2 1 Arrival of health inspectors 1 4 3 1 1 0 8 30 22 0 3 3 1 4 3 1 8 7 4 4 0 1 4 3 Arrival of field officers 0 0 0 1 1 0 2 8 6 0 0 0 2 2 0 0 0 0 0 0 1 2 1 Arrival of GS officers and Samurdhi offices 2 8 6 1 1 0 10 10 0 0 3 3 1 6 5 2 10 8 0 0 0 1 6 5 Arrival of Other Govt. Officers 0 0 0 0 0 0 0 0 0 0 0 0 0 0 0 0 0 0 0 0 0 0 0 0 Travel time savings (trip minutes) for duty 1 0.5 0.5 2.5 1 1.5 0 0 0 1 0.3 0.8 6 0.5 5.5 5 2 3 1.5 0.3 1.3 0.8 0.3 0.5 for school 1.5 0.5 1.0 1 0.5 0.5 1.5 0.5 1 0.5 0.3 0.3 1 0.25 0.75 5 2 3 1.5 0.3 1.3 0.8 0.3 0.5 for hospital 1.5 0.5 1.0 2 1 1 0.5 0.25 0.25 1.5 0.8 0.8 1.5 0.75 0.75 5 2 3 1 0.3 0.8 1 0.5 0.5 for Purchasing 1 0.5 0.5 2 1 1 1 0.25 0.75 0.5 0.3 0.3 3 0.5 2.5 5 2 3 1.5 0.3 1.3 0.5 0.3 0.3 Travel distance savings (km) to office 5 3 2.0 25 10 15 6 6 0 1 1 0 10 5 5 5 3 2 5 0.5 4.5 5 2 3 to school 12 3 9.0 12 4 8 6 6 0 0.5 0.5 0 10 5 5 12 3 9 6 1 5 10 0.5 9.5 to town 5 3 2.0 12 5 7 2 2 0 0.5 0.5 0 10 5 5 5 3 2 4 0.5 3.5 5 2 3 to industry 8 4 4.0 - 2 0 0 0 0.5 0.5 0 0 0 0 0 0 0 0 0 0 5 0.5 4.5 to hospital 5 3 2.0 12 5 7 4 4 0 2 2 0 13 8 5 8 4 4 5 1 4 5 2 3
to business place 0 0 0.0 0 0 0 Note: ()=negative, kg = kilogram, km = kilometer, m=meter, SLR = Sri Lanka Rupees. Source: Southern Province Rural Economic Advancement Project - Project Management Office

38 Appendix 5
Training Programs Conducted by Southern Province Rural Economic Advancement Project
No. Program, Work shop and Seminars Target Group No.of
participants No. of
Programs Duration
Capacity Building program for Pradeshiya Sabhas and Southern Provincial Council
1 Revenue Assistant Training Officers of PSs (Galle, Matara, Hambantota) 70
1 program for a each
district office
5 days
2 Awareness Program Technical officers, 3 districts 30 1 3 days
3 Basic Computer Training Officers of PSs 108 1 6 Months
4 Capacity Building Training Program
Chairmen and Opposition Leaders and key official PSs 115 3 3 days
5 Capacity Building Program Technical officers and others of PSs (Galle, Matara, Hambantota)
120 1 1 day
6 Workshop on Project Monitoring Technical officers and others of PSs (Galle, Matara, Hambantota)
120 1 1 day
5 Quality Assurance and Construction Management
PMO tech. staff, technical officers of PSs 150 6 3 days
7 Capacity Building and Preparation of Corporate Plan 2006−2010
Officers and employers of CLG 35 1 2 days
8 Workshop on Budgeting and planning (Hambantota)
Secretaries and planning officers of PS 75 1 2 days
9 Workshop on Good Governance Officers and employers of CLG 69 1 3 days
10 Workshop on legal matters (Galle & Matara)
Chairmen and other officers of PSs 80 2 4 days
11 Management development Plan and Revenue Mobilization of PSs Officers and members of PSs 1,830 15
1 day for a each
Program
12 Strategic Plan Preparation for Management and Monitoring Officers of PMO, PS and CLG 50 1 2
13 Training in AutoCAD Technical staff (PMO, PS and SPC) 100 3 10
Months
14 Field visit on latest agricultural technology for political leadership and officers of SPC
Ministers, PSs chairmen and officers in SPC 225 2 6 days
15 Market Development Development officers, investigation officers 50 1 3 days
16 Presentation Technology CLG staff 20 1 2 days
17 Computerized Payroll management Management Assistants 84 1 1 week
18 Sound Financial Management Management assistants, investigation officers 150 2 2 days
19 Rural Infrastructure Management Technical staff (PMO, PS and SPC) 75 3 2 days

Appendix 5 39
No Program, Work shop and Seminars Target Group
No.of participant
s
No. of Programs Duration
20 Good governance (seminar series and exhibition)
Officers of (PMO, PS and SPC) 500 1 2 days
21 Training on GIS Newly recruited graduates 10 1 3 months
PMO Staff Training
1 New techniques of monitoring & evaluation PMO Staff 44 1 2 Days
2 Productivity improvement workshop PMO Staff 100 1 1 day
3 Financial regulations procedures for construction works and Contract Administration
PMO Staff 88 2 4 days
4 Capacity building for staff members PMO Staff 25 1 1 day
5
Workshop on development Implementation of strategic plan to accelerate the TAARP construction program.
PMO Staff 50 1 2 days
6 Workshop on Presentation Technologies PMO Staff 40 2 5 days
7 Workshop on Driving Excellence PMO Staff 20 1 2 days Special promotion activities for women and youths
1 Fruit nursery management and budding and grafting techniques
Unemployed youths and women 50 3 5 days
2 Computer Hardware Engineering Unemployed youths and women 10 1 6 Months
3 Quality seed production Program (Paddy)
Unemployed youths and women 30 3 4 days
4 Quality rice milling, processing and storage
Unemployed youths and women 30 1 5 days
5 Three-wheeler and motor bike repair Unemployed youths 20 1 3 months
6 Heavy Machinery Training Program Unemployed youths 76 3 15 weeks
7 Button Mushroom Cultivation Unemployed youths 80 1 1 day 8 Welding Course Unemployed youths 5 1 3 months
9 Home Gardening Members of PSs and unemployed women 100 1 3 days
Promotion and Awareness Programs
1 Awareness on Project activities Media personals 250 3 1 day 2 Exhibition – Deyata Kirula Public 3 days
3
Making Awareness for Political Leaders, Secretaries and Journalists of relevant Ministries- Hambantota, Galle
Political leaders and secretaries of relevant ministries and media persons
138 2 2 days

40 Appendix 5
CLG=Commissioner of Local Government, DASUNA = Name of Credit Scheme, EDS=enterprise development services, GIS=Geographical Information System, PSs=Pradeshiya Sabhas, PMO=project management office, SPC=Southern Provincial Councils, SPREAP = Southern Province Rural Economic Advancement Project, RDB=regional development bank. Source: Southern Province Rural Economic Advancement Project - Project Management Office.
No. Program, Workshops, and Seminars Target Group No.of
participantsNo. of
Programs Duration
EDS Agriculture
1
Cultivation of Hydroponics, Kirala, Mushrooms, Manioc, Chilies and Animal Husbandry
Farmers 1,874 25 43 days
EDS Others
1 Business Plan Preparation Workshop
EDS providers (Galle, Matara and Hambantota) 115 4 17 days
2 Workshop on relationship between Bank and EDS
EDS providers (Galle, Matara and Hambantota) 162 3 3 days
3
Business Plan Preparation workshops for EDS providers, services (Food Processing)
EDS and bank officers (RDB and Sanasa) 142 6 1 Month
EDS Workshops
1 Awareness Program for “DASUNA” credit scheme Entrepreneurs 231 3 3 day
2 Awareness Program for SPREAP PMO staff 90 1 1 day
3 Awareness Program Entrepreneurs and officers 1,065 18 20 days
4 Ornamental Fish Selected beneficiaries 19 3 6 days 5 Project Management Entrepreneurs 1 1 2 days
6 Technical Workshop for RDB
Bank officers and EDS Providers 150 2 1 day
7 Maintains and Repairs of Tractors Tractor owners 20 1 10 days
8 Workshop on Sales Management Entrepreneurs 21 2 3 days
9 Food Technology “DASUNA” borrowers 2 1 1 day
10 Fiber Blocks Products Selected beneficiaries 8 1 1 day
11 Training Program on Role of Trainers EDS Providers 1 1 2 days
12 Maintenance and Repairs of Tractors Tractor owners 1 1
13 Start your business Entrepreneurs 1 1 5 days
14 Small and Medium-sized Entrepreneurs Development
Entrepreneurs 1 1 1 year
15 Follow up survey on “DASUNA” Credit Scheme. Entrepreneurs 1,027 1 1 Month

Appendix 6 41
PROJECT COSTS
Table A6.1: Project Cost by Component and Sources of Funding ($ million)
Item Foreign Exchange
Local Currency
Total Cost
A. Base cost 1. Economic stimulation a. Micro-, small-, and medium-sized credit Micro-enterprise credit 1.9 5.3 7.2 Small- and medium-sized enterprise credit 2.9 8.1 11.0 Subtotal (a) 4.8 13.4 18.2 b. Enterprise development services support Technical support unit 0.0 0.5 0.5 Service providers 0.0 0.0 0.0 Entrepreneurs 0.0 0.3 0.3 Enterprise development and information centers 0.0 0.0 0.0 Subtotal (b) 0.0 0.8 0.8 Subtotal (1) 4.8 14.2 19.0 2. Enhancement of the physical and institutional environment a. Improvement and maintenance of rural infrastructure Rural roads* 4.3 16.4 20.7 Markets* 0.9 3.8 4.7 Flood rehabilitation activities 2.6 5.3 7.9 Subtotal (a) 7.8 25.5 33.3 b. Institutional support Southern provincial council 0.2 0.3 0.5 Pradeshiya sabhas 0.2 0.3 0.5 Ministry of plan implementation 0.0 0.0 0.0 Subtotal (b) 0.3 0.6 1.0 c. Support for project implementation 0.5 2.8 3.2 Subtotal (2) 8.6 28.9 37.5 Subtotal (A) 13.4 43.0 56.5B. Contingencies 1 Physical 0.0 0.0 0.0 2 Price 0.0 0.0 0.0 Subtotal (B) 0.0 0.0 0.0C. Interest Charges 1 EDA and OFID 0.7 0.0 0.7 Subtotal (C) 0.7 0.0 0.7 Total (A+B+C) 14.1 43.0 57.2*Asian Development Bank financing 40%, OPEC Fund for International Development financing 23% and the government financing 37%. Note : OPEC = Organization of the Petroleum Exporting Countries. Source: Asian Development Bank and Project Management Unit.

42 Appendix 6
Table A6.2: Project Costs by Components and Sources ($ million)
Appraisal Actual
Item Foreign Exchange
Local Currency
Total Cost
Foreign Exchange
Local Currency
Total Cost
A. Base cost 1 Economic stimulation
a. Micro-, small-, and medium-sized credit Microenterprise credit 2.0 3.7 5.7 1.9 5.3 7.2 Small- and medium-sized enterprise credit 5.0 9.3 14.3 2.9 8.1 11.0 Subtotal (a) 7.0 13.0 20.0 4.8 13.4 18.2
b. Enterprise development services (EDS) support
Technical support unit 0.0 0.6 0.6 0.0 0.5 0.5 Service providers 0.1 0.1 0.2 0.0 0.0 0.0 Entrepreneurs 0.0 1.8 1.8 0.0 0.3 0.3 Enterprise development and information centers 0.0 0.2 0.2 0.0 0.0 0.0 Subtotal (b) 0.1 2.7 2.8 0.0 0.8 0.8 Subtotal (1) 7.1 15.7 22.8 4.8 14.2 19.0
2. Enhancement of the physical and institutional environment
a. Improvement and maintenance of rural infrastructure Rural roads* 2.9 7.2 10.1 4.3 16.4 20.7 Markets* 0.5 1.6 2.1 0.9 3.8 4.7 Flood rehabilitation activities 0.0 0.0 0.0 2.6 5.3 7.9 Subtotal (a) 3.4 8.8 12.2 7.8 25.5 33.3 b. Institutional Support Southern provincial council 0.1 0.2 0.4 0.2 0.3 0.5 Pradeshiya sabhas 0.3 0.4 0.7 0.2 0.3 0.5 Ministry of plan implementation 0.0 0.2 0.2 0.0 0.0 0.0 Subtotal (b) 0.4 0.8 1.2 0.3 0.6 1.0 c. Support for project implementation 0.6 1.9 2.5 0.5 2.8 3.2 Subtotal (2) 4.4 11.5 15.9 8.6 28.9 37.5 Subtotal (A) 11.5 27.2 38.7 13.4 43.0 56.5 B. Contingencies 1. Physical 0.4 1.2 1.6 0.0 0.0 0.0 2. Price 0.3 1.1 1.4 0.0 0.0 0.0 Subtotal (B) 0.7 2.3 3.0 0.0 0.0 0.0 C. Interest Charges
1. Asian Development Bank and OPEC Fund for International Development 1.0 0.0 1.0 0.7 0.0 0.7
Subtotal (C) 1.0 0.0 1.0 0.7 0.0 0.7 Total (A+B+C) 13.2 29.5 42.7 14.1 43.0 57.2 * ADB financing 40%, OFID financing 23%, and the Government financing 37%. Source: Asian Development Bank and Project Management Unit.
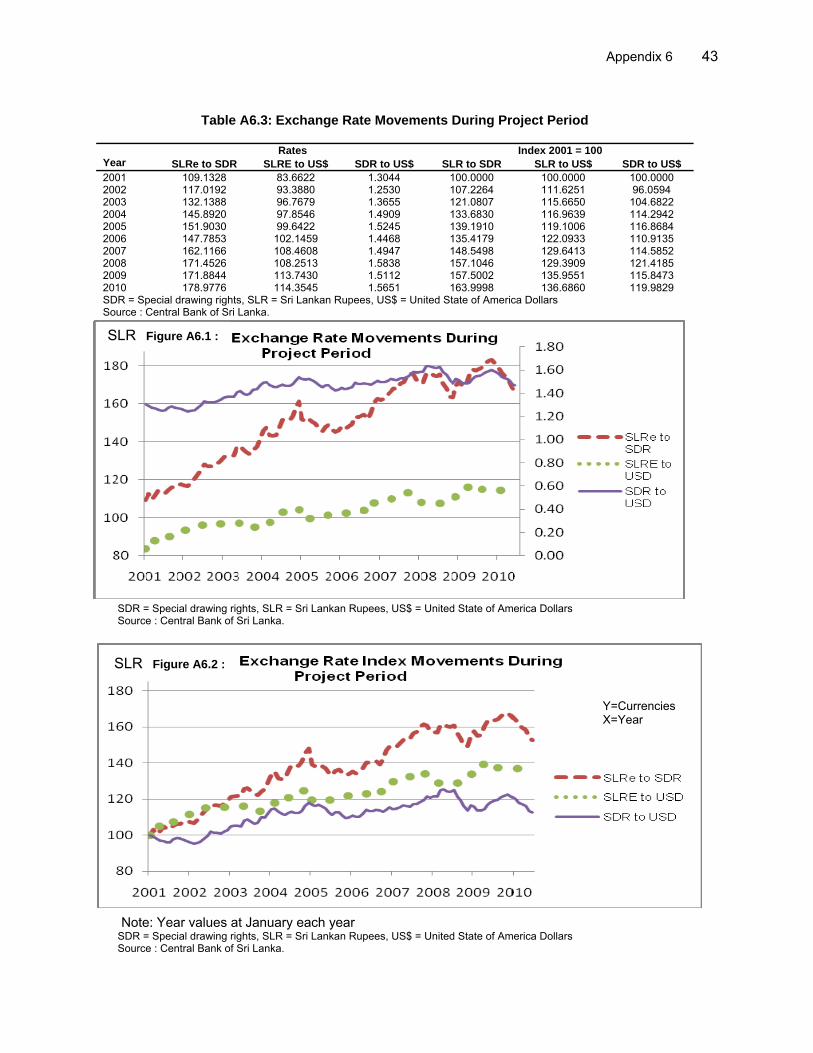
Appendix 6 43
Table A6.3: Exchange Rate Movements During Project Period
Rates Index 2001 = 100
Year SLRe to SDR SLRE to US$ SDR to US$ SLR to SDR SLR to US$ SDR to US$ 2001 109.1328 83.6622 1.3044 100.0000 100.0000 100.0000 2002 117.0192 93.3880 1.2530 107.2264 111.6251 96.0594 2003 132.1388 96.7679 1.3655 121.0807 115.6650 104.6822 2004 145.8920 97.8546 1.4909 133.6830 116.9639 114.2942 2005 151.9030 99.6422 1.5245 139.1910 119.1006 116.8684 2006 147.7853 102.1459 1.4468 135.4179 122.0933 110.9135 2007 162.1166 108.4608 1.4947 148.5498 129.6413 114.5852 2008 171.4526 108.2513 1.5838 157.1046 129.3909 121.4185 2009 171.8844 113.7430 1.5112 157.5002 135.9551 115.8473 2010 178.9776 114.3545 1.5651 163.9998 136.6860 119.9829 SDR = Special drawing rights, SLR = Sri Lankan Rupees, US$ = United State of America Dollars Source : Central Bank of Sri Lanka.
SDR = Special drawing rights, SLR = Sri Lankan Rupees, US$ = United State of America Dollars Source : Central Bank of Sri Lanka.
Note: Year values at January each year SDR = Special drawing rights, SLR = Sri Lankan Rupees, US$ = United State of America Dollars Source : Central Bank of Sri Lanka.
SLR Figure A6.1 :
Y=Currencies X=Year
SLR Figure A6.2 :

44 Appendix 7
CUMULATIVE PROJECTED AND ACTUAL DISBURSEMENTS ($ million)
Table A7 : Projected And Actual Disbursements
Year Projected Actual 2002 1.20 0.00 2003 3.03 1.62 2004 5.03 2.86 2005 7.43 7.57 2006 11.43 11.14 2007 17.14 17.98 2008 24.06 22.70 2009 27.06 25.94 2010 28.88 28.09
Source : Asian Development Bank Sri Lanka Resident Mission
Figure A7: Disbursements Timeline at Appraisal and Actual
Disbursements
048
121620242832
2001
2002
2003
2004
2005
2006
2007
2008
2009
2010
Year
$ m
illio
n
ProjectedActual
Source: Asian Development Bank Sri Lanka Resident Mission

Appendix 8
45
CHRONOLOGY OF MAIN EVENTS
Year Date Event 9 April ADB project brief held in Manila 22 April–12 May ADB fact-finding mission 11 May Memorandum of understanding signed between ADB and government on fact-
finding mission 21 May Back-to-office report of the fact-finding mission submitted 4 July ADB Management review meeting 12–28 July ADB appraisal mission 10 August Back-to-office report of the appraisal mission submitted 20 August Pre-staff review committee meeting draft circulation for interdepartmental
comments 3 September ADB staff review committee meeting 16 September Expression of intent advertisements for lead EDS consultant 24–28 September
Loan negotiation
3 October ADB President approved project 4 October Report and recommendation of the President circulated to Board 26 October ADB loan approval October Project director appointed and assumed position in December
2001
20 December Government ministry reorganized; the designated EA was vested from Ministry of Plan Implementation to MSRD
1 January PMO at Galle established ADB loan agreement signed by government 10 January ADB project agreement signed by NDB
January –June Four PMO units and three deputy project director offices established in Galle, Hambantota, and Matara districts
14 February Subsidiary loan agreement between government and NDB signed 26 February Loan agreement between government and OFID signed February Heads of finance unit and infrastructure unit of PMO appointed and in position 19–21 March ADB consultation mission ascertained that further delays in loan effectiveness
were anticipated due to slowness of consultant recruitment 22 March MSRD issued letter of intent for submissions from five shortlisted lead EDS
provider consultants 25 March Advertisements for PICs placed with expression of intent deadline of 30 May
2002 April Head of PMO monitoring and evaluation unit and training unit appointed and in
position June CSC recommended proceeding to contract negotiations with first-ranked lead
EDS provider consultants 30 June Subsidiary loan agreements signed with PFIs 19 July ADB and OFID signed cofinancing agreement July–October Protracted contract negotiations with first-ranked lead EDS provider
consultants concluded, and an agreement and contract signed by the EA, which was deemed by ADB as not effective prior to loan effectiveness
15 November ADB project note concerning capability and experience of selected lead EDS provider
2002
Loan effectiveness
12 December Project start-up workshop, which prepared a detailed project framework
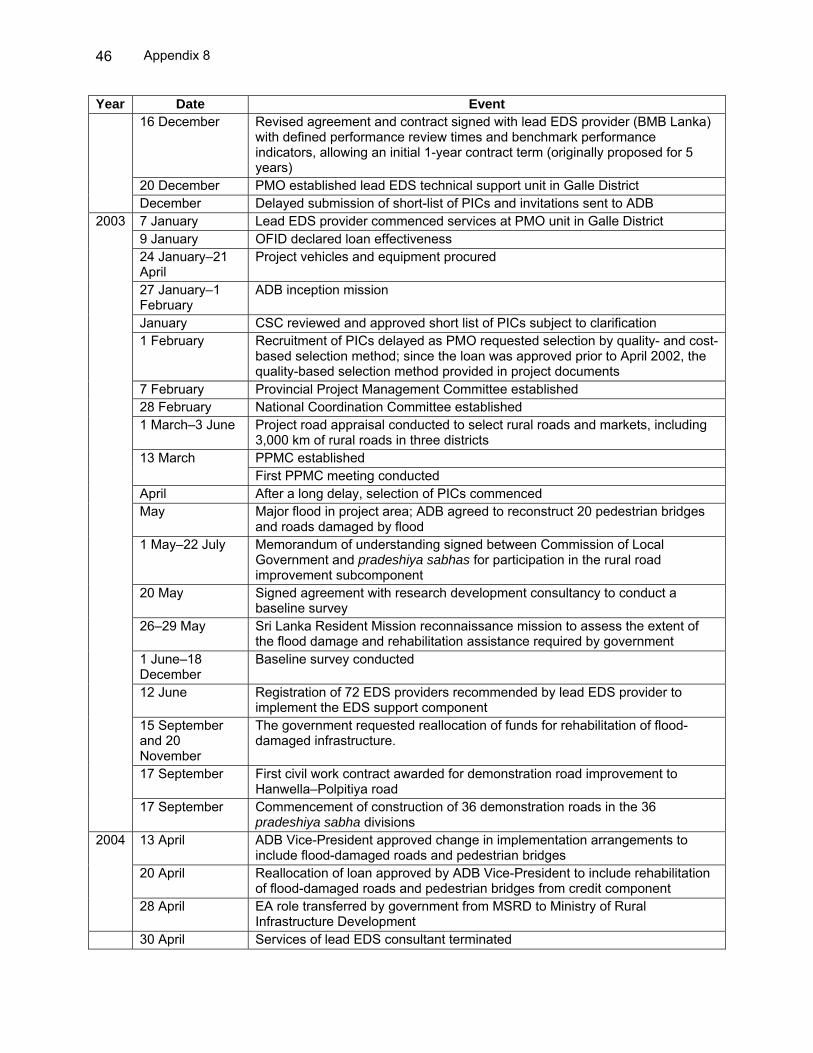
Appendix 8
46
Year Date Event 16 December Revised agreement and contract signed with lead EDS provider (BMB Lanka)
with defined performance review times and benchmark performance indicators, allowing an initial 1-year contract term (originally proposed for 5 years)
20 December PMO established lead EDS technical support unit in Galle District
December Delayed submission of short-list of PICs and invitations sent to ADB 7 January Lead EDS provider commenced services at PMO unit in Galle District 9 January OFID declared loan effectiveness 24 January–21 April
Project vehicles and equipment procured
27 January–1 February
ADB inception mission
January CSC reviewed and approved short list of PICs subject to clarification 1 February Recruitment of PICs delayed as PMO requested selection by quality- and cost-
based selection method; since the loan was approved prior to April 2002, the quality-based selection method provided in project documents
7 February Provincial Project Management Committee established 28 February National Coordination Committee established 1 March–3 June Project road appraisal conducted to select rural roads and markets, including
3,000 km of rural roads in three districts PPMC established 13 March First PPMC meeting conducted
April After a long delay, selection of PICs commenced May Major flood in project area; ADB agreed to reconstruct 20 pedestrian bridges
and roads damaged by flood 1 May–22 July Memorandum of understanding signed between Commission of Local
Government and pradeshiya sabhas for participation in the rural road improvement subcomponent
20 May Signed agreement with research development consultancy to conduct a baseline survey
26–29 May Sri Lanka Resident Mission reconnaissance mission to assess the extent of the flood damage and rehabilitation assistance required by government
1 June–18 December
Baseline survey conducted
12 June Registration of 72 EDS providers recommended by lead EDS provider to implement the EDS support component
15 September and 20 November
The government requested reallocation of funds for rehabilitation of flood-damaged infrastructure.
17 September First civil work contract awarded for demonstration road improvement to Hanwella–Polpitiya road
2003
17 September Commencement of construction of 36 demonstration roads in the 36 pradeshiya sabha divisions
13 April ADB Vice-President approved change in implementation arrangements to include flood-damaged roads and pedestrian bridges
20 April Reallocation of loan approved by ADB Vice-President to include rehabilitation of flood-damaged roads and pedestrian bridges from credit component
2004
28 April EA role transferred by government from MSRD to Ministry of Rural Infrastructure Development
30 April Services of lead EDS consultant terminated

Appendix 8
47
Year Date Event 1 May Special committee appointed for evaluation of EDS proposal and to make
recommendations to the project director on EDS component 5 May Amendment to loan agreement to reallocate fund to flood rehabilitation
activities 10–13 May ADB special project administration mission 11 May ADB special project administration mission meeting with the Prime Minister to
review project, specifically the issue of gravel versus sealed or paved road surfaces
1 August Services of 32 EDS providers extended out of the registered 72 EDS providers after conducting performance evaluation PMO signed agreement with civil works contractor for construction of rural roads (i.e., Southern Construction for Koggala–Telawila Road)
11 August
326 km of rural roads without surface layer commenced construction due to lack of suitable gravel (completed 30 June 2006) PMO signed agreement with civil works contractors to repair 605 km of flood-damaged roads (i.e., Selaka Associates for Baddegama, package 2)
17 August
Commenced repair of 605 km of flood-damaged roads (completed 23 August 2006)
19 October Project implementation consultant contract signed after protracted handling of process by government
1 November PICs commenced 3–11 November ADB review mission 16 November PMO workshop with political leaders in pradeshiya sabhas to promote the
merits of rural gravel road maintenance 30 November Replacement lead EDS provider required to submit a technical proposal for
services to PMO 1 December Appointment of new project director, following retirement of the first project
director 24 December Proposal submitted by replacement lead EDS provider, ISB Services 26 December Tsunami occurred in Southern Province 14–15 February ADB special project administration mission to discuss issues related to
tsunami in project area 17 February PMO signed agreement with the Urban Development Authority for detailed
market design 18 March ADB concurred to provide 88% of each credit line subloan, with balances from
PFIs and subborrower contribution in kind or in cash, to be monitored. 1 May PMO signed agreement with Harini Enterprises for construction of
Angunukolapalassa Market in Hambantota District 26 May PMO signed agreement with Archimedia for detailed market design 30 May PMO signed agreement with S. K. Builders for construction of Katuwana
Market in Hambanthota District PMO signed agreement with Udaya Construction for construction of Pannegamuwa Market in Hambantota District PMO signed agreement with Hettiarachchi Construction for construction of Barawakumbuka Market in Hambantota District PMO signed agreement with Hansagiri for construction of Ambalanthota Market in Hambantota District
1 June
PMO signed agreement with H. M. A. Engineering for construction of Sooriyawewa Market in Hambantota District
2005
7 June PMO signed agreement with Priyankara Construction for construction of
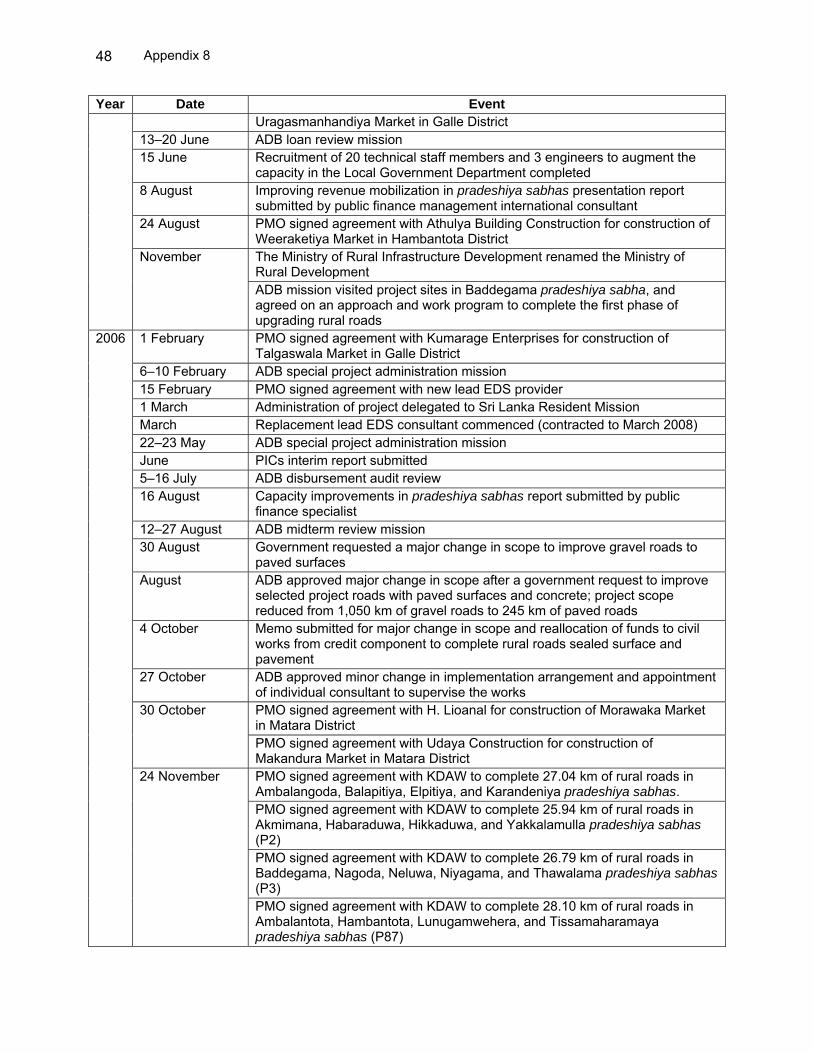
Appendix 8
48
Year Date Event Uragasmanhandiya Market in Galle District
13–20 June ADB loan review mission 15 June Recruitment of 20 technical staff members and 3 engineers to augment the
capacity in the Local Government Department completed 8 August Improving revenue mobilization in pradeshiya sabhas presentation report
submitted by public finance management international consultant 24 August PMO signed agreement with Athulya Building Construction for construction of
Weeraketiya Market in Hambantota District The Ministry of Rural Infrastructure Development renamed the Ministry of Rural Development
November
ADB mission visited project sites in Baddegama pradeshiya sabha, and agreed on an approach and work program to complete the first phase of upgrading rural roads
1 February PMO signed agreement with Kumarage Enterprises for construction of Talgaswala Market in Galle District
6–10 February ADB special project administration mission 15 February PMO signed agreement with new lead EDS provider 1 March Administration of project delegated to Sri Lanka Resident Mission March Replacement lead EDS consultant commenced (contracted to March 2008) 22–23 May ADB special project administration mission June PICs interim report submitted 5–16 July ADB disbursement audit review 16 August Capacity improvements in pradeshiya sabhas report submitted by public
finance specialist 12–27 August ADB midterm review mission 30 August Government requested a major change in scope to improve gravel roads to
paved surfaces August ADB approved major change in scope after a government request to improve
selected project roads with paved surfaces and concrete; project scope reduced from 1,050 km of gravel roads to 245 km of paved roads
4 October Memo submitted for major change in scope and reallocation of funds to civil works from credit component to complete rural roads sealed surface and pavement
27 October ADB approved minor change in implementation arrangement and appointment of individual consultant to supervise the works PMO signed agreement with H. Lioanal for construction of Morawaka Market in Matara District
30 October
PMO signed agreement with Udaya Construction for construction of Makandura Market in Matara District PMO signed agreement with KDAW to complete 27.04 km of rural roads in Ambalangoda, Balapitiya, Elpitiya, and Karandeniya pradeshiya sabhas. PMO signed agreement with KDAW to complete 25.94 km of rural roads in Akmimana, Habaraduwa, Hikkaduwa, and Yakkalamulla pradeshiya sabhas (P2) PMO signed agreement with KDAW to complete 26.79 km of rural roads in Baddegama, Nagoda, Neluwa, Niyagama, and Thawalama pradeshiya sabhas (P3)
2006
24 November
PMO signed agreement with KDAW to complete 28.10 km of rural roads in Ambalantota, Hambantota, Lunugamwehera, and Tissamaharamaya pradeshiya sabhas (P87)

Appendix 8
49
Year Date Event PMO signed agreement with W. G. M. M. Pathmini to complete 34.9 km of rural roads in Devenuwara, Dickwella, Matara, Thihagoda, and Weligama pradeshiya sabhas (P4) PMO signed agreement with W. G. M. M. Pathmini to complete 31.97 km of rural roads in Akuressa, Hakmana, Kaburupitiya, and Malimbada pradeshiya sabhas (P5)
21 December
PMO signed agreement with W. G. M. M. Pathmini to complete 33.98 km of rural roads at Agunukolapellessa, Beliatta, Katuwana, Thangalle, and Weeraketiya pradeshiya sabhas (P8) PMO signed agreement with CML to construct six pedestrian bridges in Matara District (M1) and six pedestrian bridges in Galle District (G2)
28 December
The Ministry of Rural Development transferred to the Ministry of Nation Building and Estate Infrastructure
1 March Establishment of senior resident engineer offices in the three districts PMO signed agreement with Ileperuma Construction for construction of Kamburupitiya Market in Matara District PMO signed agreement with Kumarage Enterprises for construction of Urubokka Market in Matara District
27 March
PMO signed agreement with Sripali Construction for construction of Neluwa Market in Galle
1 May Material testing laboratory established under preliminaries of road surfacing 4 May ADB imprest ceiling increases from $1.382 million to $1.500 million 17–23 July ADB project review mission, including disbursement audit review July All funds allocated under the credit component committed 31 August NDB commenced operation of revolving fund for credit component November Final report of local government specialist submitted 12 December PMO signed agreement with B. K. G. Aruna Construction for construction of
Walasmulla Market in Hambantota District PMO signed agreement with Kumarage Enterprises for improvements to Angunukolapalassa and Uragasmanhandiya markets(additional works)
17 December
PMO signed agreement with Wiewikrama Construction for construction of Beliatta Market in Hambantota District
20 December PMO signed agreement with Finite to complete 3.03 km of rural roads in Agunukolapella, Beliatta, Hambantota, Tangalle, and Thissamaramaya pradeshiya sabhas (P9)
20–21 December
ADB special project administration mission focused on roads and pedestrian bridges (two deaths were reported from falling off temporary bridges) PMO signed agreement with Star to complete 18.16 km of rural roads in Kotapola and Mulatiyana pradeshiya sabhas (P6A) PMO signed agreement with Star to complete 8.64 km of rural roads in Pasgoda pradeshiya sabha (P6B)
2007
28 December
PMO signed agreement with Kumarage Enterprises for construction of Baddegama Market in Galle District
28 January–1 February
ADB loan disbursement mission
1 February Addendum to subsidiary loan agreement between the government and NDB signed
2 February Lead EDS provider final report submitted 28 February Lead EDS provider completed assignment
2008
1 March SPDA selected for monitoring of revolving fund

Appendix 8
50
Year Date Event 11 March Appointment of new project director 24–29 March ADB project review mission 30 April Public finance management specialist (domestic) final report submitted 12 May Extension of loan closing approved from 31 July 2008 to 31 July 2009 5 June Termination of two contract packages (P4 and P5) due to poor performance
and CGF guarantees applied for recovering unsettled mobilization advance 15 June Project director resigned 3–5 July ADB special project administration mission (due to delayed work on pedestrian
bridges completion) 9 July PMO signed agreement with University of Ruhuna to conduct survey on
impact of credit component 13 July Extension of loan closing date approved from 31 July 2008 to 31 July 2009 24 July–20 November
Survey conducted on impact assessment of credit component
28 July PMO retended the terminated two contracts by dividing into six contract packages (5A, 5B, 5C, 4A, 4B, and 4C)
September Performance of Padmini Construction very poor and terminated for two contracts in Matara District and one in Hamabantota District
6 October PMO terminated another contract package (P8) due to poor performance and applied CGF guarantees to recover unsettled mobilization advance
23 October Contractor packages P4, P5, and P8 filed case in Galle District Court against the termination of contract and encashment of CGF guarantee
November Credit component completed 4–8 November ADB project review mission
PMO signed agreement with K. D. A. Weerasinhe to complete 5.19 km of rural roads in Akkuressa, Athraliya, and Kaburupitiya pradeshiya sabhas (5A) PMO signed agreement with Star Construction to complete 8.4 km of rural roads in Devinuwara, Matara, and Thihagoda pradeshiya sabhas (P4A) PMO signed agreement with Ruhunu Development to complete 7.87 km of rural roads in Hakmana pradeshiya sabha (P5C) PMO signed agreement with K. D. A. Weerasinhe to complete 7.46 km of rural roads in Weligama pradeshiya sabha (P4C) PMO signed agreement with K. D. A. Weerasinhe to complete 6.18 km of rural roads in Dickwella pradeshiya sabha (P4B)
10 November
PMO signed agreement with Nawaloka to complete 11.4 km of rural roads in Kamburupitiya and Malimbada pradeshiya sabha (P5B) PMO signed agreement with Anura Wijenayake to complete 9.85 km of rural roads in Hambantota, Sooriyawewa, and Tissamaharama pradeshiya sabhas (P14) PMO signed agreement with Anura Wijenayake to complete 6.35 km of rural roads in Ambalantota, Katuwana, Tangalle, and Weeraketiya pradeshiya sabhas (P15) PMO signed agreement with ELS to construct six pedestrian bridges in Galle District (G2A)
3 December
PMO signed agreement with ELS to construct six pedestrian bridges in Galle District (M1A)
30 November Implementation of credit component successfully completed January NDB advised that implementation of credit component completed 2009 9 January Judgment given in favor of project, and petition filed by the contractor for
terminated contract packages P4, P5, and P8 dismissed

Appendix 8
51
Year Date Event 22 January Contractor of terminated contract packages P4, P5, and P8 appealed 27 February PMO signed agreement with Kumarage Enterprises for construction of
Hakmana Market in Matara District 11 March New project director appointed 13 March Application to approve second loan extension of 5 months (cumulative 17
months) revised to 31 December 2009 30 March MOFP meeting attended by NDB and POM to discuss issues relating to the
revolving fund 31 March ADB received letter from NDB to MOFP setting out proposed terms being
considered to alter the subloan conditions for the revolving fund 16 April Letter from MOFP to NDB regarding approval of subloan terms under the
revolving fund, at significant variance with ADB loan agreement with government and ADB PA with NDB
30 April Extension of loan closing date approved from 1 August 2009 to 31 December 2009
4–8 May ADB project review mission 5 May Termination and encashment of bond for contract packages P4, P5, and P8
referred to the Dispute Adjudication Board by contractor 13 May PMO signed agreement with Senura to complete 5.92 km of rural roads in
Katuwana and Weeraketiya pradeshiya sabhas (P8D) 14 May Second addendum to subsidiary loan agreement between government and
NDB signed 27 May PMO signed agreement with Finite to complete 5.89 km of rural roads in
Beliatta pradeshiya sabha (P8C) Government requested reallocation of funds to complete additional road works 4 June PMO signed agreement with Canaka to complete 5.15 km of rural roads in Tangalle pradeshiya sabha (P8B)
9 June ADB approved major change in implementation arrangement, increase of civil works percentage financed by ADB and reallocation of loan funds PMO signed agreement with Senura to complete 4.86 km of rural roads in Beliatta pradeshiya sabha (P16B)
30 June
PMO signed agreement with Sripala to complete 3.30 km of rural roads in Weeraketiya pradeshiya sabha (P16D)
21 July PMO signed agreement with Trio Construction for construction of Kirama Market in Hambanthota District
20 August PMO signed agreement with Royal to complete 4.01 km of rural roads in Beliatta pradeshiya sabha (P16A)
21 August PMO signed agreement with Kumarage Enterprise for construction of Middeniya Market in Hambanthota District
26 August PMO signed agreement with Athlya Engineering for construction of Bandarawatta Market in Hambantota District
9 October PMO signed agreement with K. G. Aruna Construction for improvements to Katuwana Market (balance work) in Hambantota District
19–26 October OFID review mission PMO signed agreement with Ileperuma and Sons for improvement to Kamburupitiya Market (additional works) in Hambantota District
30 October
24–27 November
ADB project review mission
30 November

Appendix 8
52
Year Date Event PMO signed agreement with R. G. Kudaliyanage to conduct project benefit monitoring evaluation study
November Impact assessment of credit component submitted December Project impact evaluation report submitted 31 December Loan closing date 5 January Dispute Board gave a judgment in favor of project against the contractor for
project packages P4 and P5 19 January Contractor disagreed with the adjudicator’s decision on project packages P4
and P5 and proposed to commence arbitration 28 January–1 February
ADB loan disbursement mission
30 April The Ministry of Nation Building and Estate Infrastructure transferred to the Ministry of Economic Development
25 May Dispute Board judgment in favor of project against contractor for project package P8
30 June Contractor disagreed with the adjudicator’s decision on project package P8 and proposed to commence arbitration
5 July POM submission of draft PCR document 12–16 July ADB PCR mission 22 July NDB submitted draft PCRs for credit line and revolving fund
2010
13 August NDB submitted final PCRs for credit line and revolving fund ADB = Asian Development Bank; CGF = construction grantee fund , CSC = Consultant Selection Committee; EA = executing agency; EDS = enterprise development service; km = kilometer; MOFP = Ministry of Finance and Planning; MSRD = Ministry of Southern Region Development; NDB = National Development Bank; OFID = OPEC Fund for International Development; OPEC = Organization of the Petroleum Exporting Countries; PCR = project completion report; PFI = participating financial institution; PIC = project implementation contractor; PPMC = Provincial Project Management Committee; PMO = project management office; SPDA = Southern Province Development Authority. Sources: Sri Lanka Resident Mission project files, Southern Province Rural Economic Advancement Project Management Office, and National Development Bank.
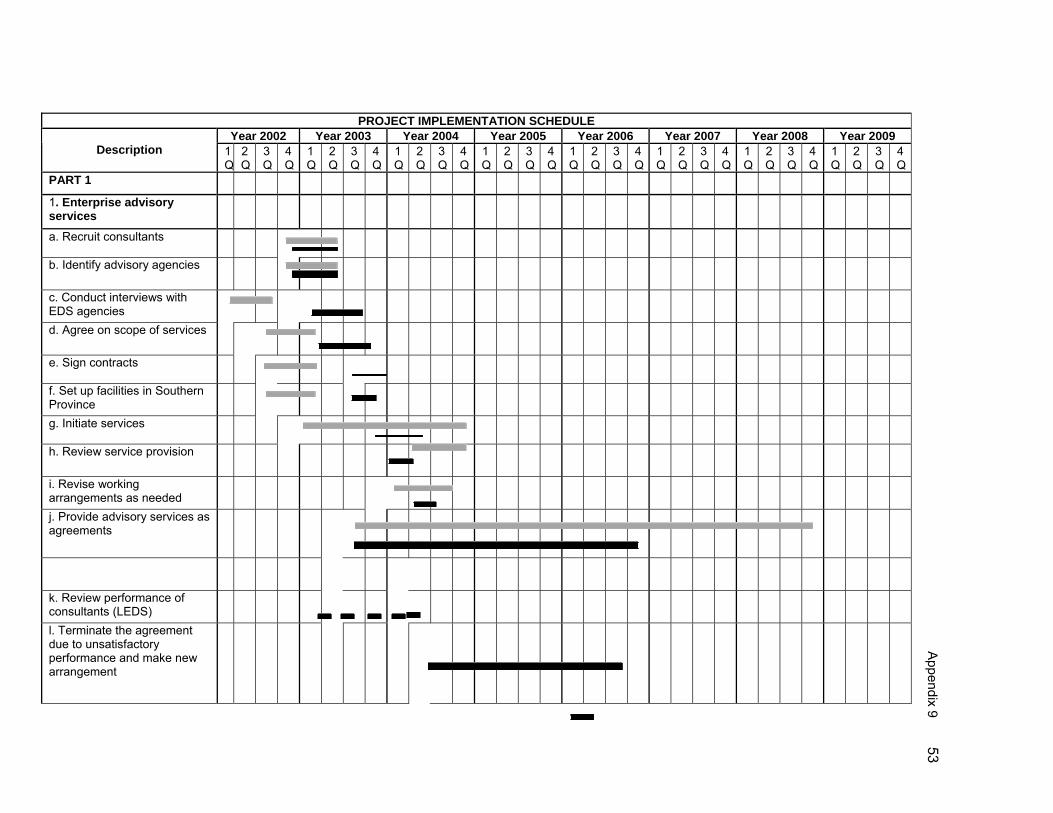
Appendix 9
53
PROJECT IMPLEMENTATION SCHEDULE Year 2002 Year 2003 Year 2004 Year 2005 Year 2006 Year 2007 Year 2008 Year 2009
Description 1Q
2Q
3Q
4Q
1Q
2Q
3Q
4Q
1Q
2Q
3Q
4Q
1Q
2Q
3Q
4Q
1Q
2Q
3Q
4Q
1Q
2Q
3Q
4Q
1Q
2Q
3Q
4Q
1Q
2Q
3Q
4Q
PART 1
1. Enterprise advisory services
a. Recruit consultants
b. Identify advisory agencies
c. Conduct interviews with EDS agencies
d. Agree on scope of services
e. Sign contracts
f. Set up facilities in Southern Province
g. Initiate services
h. Review service provision
i. Revise working arrangements as needed
j. Provide advisory services as agreements
k. Review performance of consultants (LEDS)
l. Terminate the agreement due to unsatisfactory performance and make new arrangement

54 A
ppendix 9 PROJECT IMPLEMENTATION SCHEDULE
Year 2002 Year 2003 Year 2004 Year 2005 Year 2006 Year 2007 Year 2008 Year 2009 Description 1
Q2Q
3Q
4Q
1Q
2Q
3Q
4Q
1Q
2Q
3Q
4Q
1Q
2Q
3Q
4Q
1Q
2Q
3Q
4Q
1Q
2Q
3Q
4Q
1Q
2Q
3Q
4Q
1Q
2Q
3Q
4Q
m. Recruitment of consultants
n. Provide advisory services as per agreements
o. Review performance of consultants (LEDS)
p. Review success
q. Evaluate sustainability
2. Credit Line a. Finalize agreements with PFls
b. Recruit consultants for PFI staff training
c. Undertake PFI staff training
d. Set up coordination link with advisory agencies
e. Devise appropriate credit packages
f. Initiate lending activities
g. Review lending success and credit package
h. Revise activities in light of review
i. Undertake full scale lending operations
PART 2
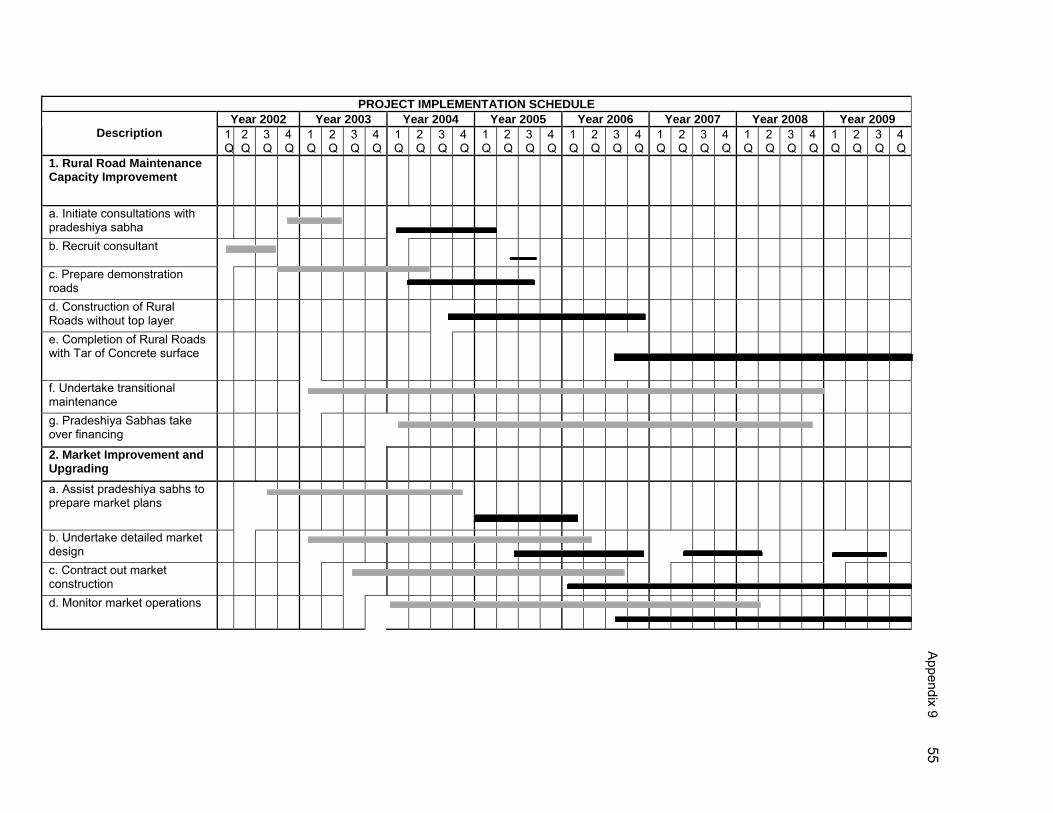
Appendix 9
55 PROJECT IMPLEMENTATION SCHEDULE
Year 2002 Year 2003 Year 2004 Year 2005 Year 2006 Year 2007 Year 2008 Year 2009 Description 1
Q2Q
3Q
4Q
1Q
2Q
3Q
4Q
1Q
2Q
3Q
4Q
1Q
2Q
3Q
4Q
1Q
2Q
3Q
4Q
1Q
2Q
3Q
4Q
1Q
2Q
3Q
4Q
1Q
2Q
3Q
4Q
1. Rural Road Maintenance Capacity Improvement
a. Initiate consultations with pradeshiya sabha
b. Recruit consultant
c. Prepare demonstration roads
d. Construction of Rural Roads without top layer
e. Completion of Rural Roads with Tar of Concrete surface
f. Undertake transitional maintenance
g. Pradeshiya Sabhas take over financing
2. Market Improvement and Upgrading
a. Assist pradeshiya sabhs to prepare market plans
b. Undertake detailed market design
c. Contract out market construction
d. Monitor market operations

56 A
ppendix 9 PROJECT IMPLEMENTATION SCHEDULE
Year 2002 Year 2003 Year 2004 Year 2005 Year 2006 Year 2007 Year 2008 Year 2009 Description 1
Q2Q
3Q
4Q
1Q
2Q
3Q
4Q
1Q
2Q
3Q
4Q
1Q
2Q
3Q
4Q
1Q
2Q
3Q
4Q
1Q
2Q
3Q
4Q
1Q
2Q
3Q
4Q
1Q
2Q
3Q
4Q
3. Flood damage Rehabilitations
a. Construction of flood damaged Roads
b. Construction of flood damaged Bridges
4. Support for financial resource management
a. Assist Pradeshiya Sabhas to prepare infrastructure maintenance plans and maintenance funding plan
b. Training and advisory support from consultants
5. Institutional Support
a. Recruit key project management office staff
b. Procure project management office vehicles and equipment
c. Undertake consultations with Pradeshiya Sabhas
d. Enter into agreements with advisory agencies and Pradeshiya Sabhas on project implementation
e. Supervise implementation of project components

Appendix 9
57 PROJECT IMPLEMENTATION SCHEDULE
Year 2002 Year 2003 Year 2004 Year 2005 Year 2006 Year 2007 Year 2008 Year 2009 Description 1
Q2Q
3Q
4Q
1Q
2Q
3Q
4Q
1Q
2Q
3Q
4Q
1Q
2Q
3Q
4Q
1Q
2Q
3Q
4Q
1Q
2Q
3Q
4Q
1Q
2Q
3Q
4Q
1Q
2Q
3Q
4Q
f. Undertake Project Benefit Monitoring & Evaluation
g. Participate in midterm review
h. Prepare Project Completion Report
Proposed
Actual
Source : Southern Province Rural Economic Advancment Project – Project Management Office.

Appendix 10
58
Project Component Annual Disbursement and Approvals
A. Table A10.1 : NDB Credit Line Component Credit Line Approvals Credit Line Disbursements Year (SLRs million) 2003 34.20 7.40 2004 278.30 150.00 2005 248.00 254.00 2006 422.90 231.60 2007 110.50 342.80 2008 0.00 17.40 Total 1,093.90 1,003.20
NDB=National Development Bank, SLRs = Sri Lanka rupees, Notes: Q1 = January to March, Q2 = April to June, Q3 = July to September, Q4 = October to December, First approval made in July 2003, First disbursement made in November 2003. Source: National Development Bank.
B. Table A10.2 : NDB Revolving Fund
Revolving Fund Balance Revolving Fund Approvals Revolving Fund Disbursements (SLRs million) 2003 60.00 (e) 2004 120.00 (e) 2005 180.00 (e) 2006 220.00 (e) 2007 381.77 2008 582.22 51.88 15.20 2009 676.90 167.00 76.86 August 2010 636.08 221.62 100.94 NDB=National Development Bank, SLRs = Sri Lanka Rupees. Notes: Q1 = January to March, Q2 = April to June, Q3 = July to September, Q4 = October to December, Revolving loans effective date April 2008, e = PCR Mission estimate. Source: National Development Bank.
C. Table A10.3 : Enterprise Development Services Expenditure
($ million) Year Appraisal Projected Expenditure Actual Expenditure 2002 0.46 0.00 2003 1.06 0.11 2004 1.58 0.17 2005 2.09 0.23 2006 2.61 0.39 2007 3.15 0.60 2008 3.15 0.72 2009 3.15 0.76 2010 3.15 0.76
Source: Loan Financial Information System, Asian Development Bank
D. Table A10.4 : Rural Gravel Roads Improvement Expenditure ($ million)
Year Appraisal Projected
Expenditure Actual Expenditure
Gravel Roads Actual Expenditure
Surfaced Roads
Actual Roads Total
2002 0.47 0.00 0.00 0.00 2003 3.42 0.06 0.00 0.06 2004 6.08 0.49 0.00 0.49 2005 8.84 2.16 0.00 2.16 2006 11.65 3.31 0.29 3.60 2007 11.84 3.74 3.30 7.04 2008 11.84 3.79 7.62 11.41 2009 11.84 3.79 16.89 20.68 2010 11.84 3.79 16.89 20.68
Source: Loan Financial Information System, Asian Development Bank.
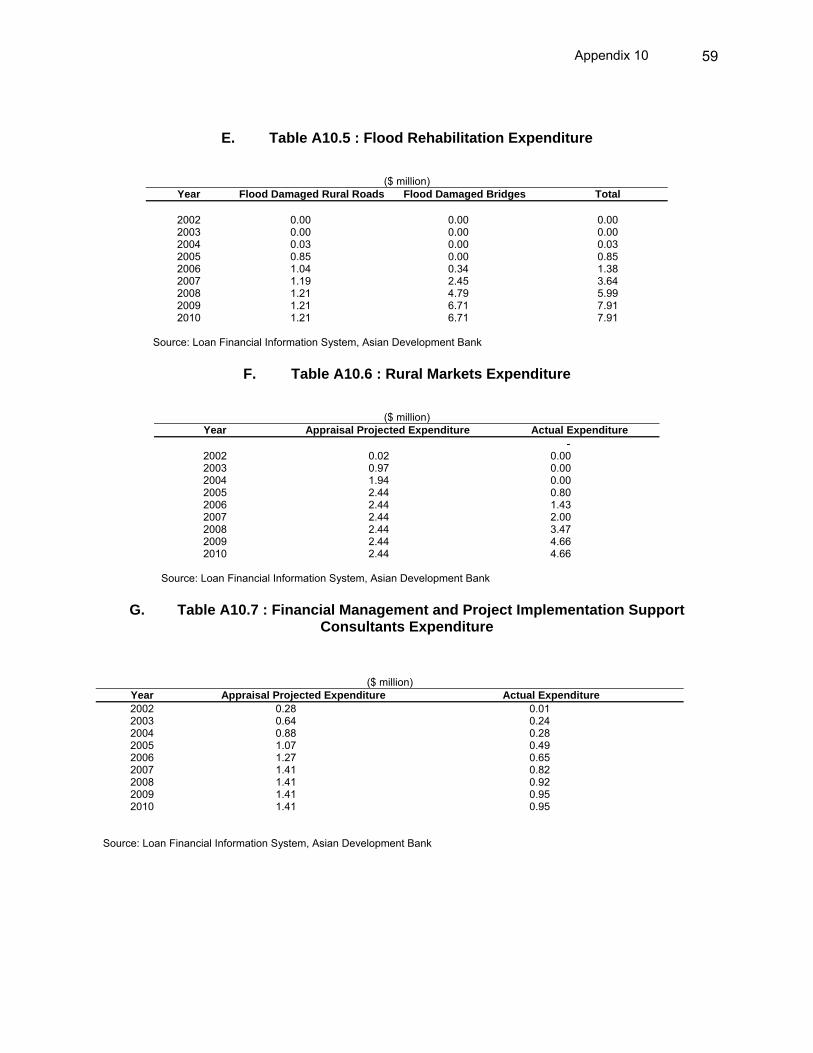
Appendix 10
59
E. Table A10.5 : Flood Rehabilitation Expenditure
($ million) Year Flood Damaged Rural Roads Flood Damaged Bridges Total
2002 0.00 0.00 0.00 2003 0.00 0.00 0.00 2004 0.03 0.00 0.03 2005 0.85 0.00 0.85 2006 1.04 0.34 1.38 2007 1.19 2.45 3.64 2008 1.21 4.79 5.99 2009 1.21 6.71 7.91 2010 1.21 6.71 7.91
Source: Loan Financial Information System, Asian Development Bank
F. Table A10.6 : Rural Markets Expenditure
($ million) Year Appraisal Projected Expenditure Actual Expenditure
- 2002 0.02 0.00 2003 0.97 0.00 2004 1.94 0.00 2005 2.44 0.80 2006 2.44 1.43 2007 2.44 2.00 2008 2.44 3.47 2009 2.44 4.66 2010 2.44 4.66
Source: Loan Financial Information System, Asian Development Bank
G. Table A10.7 : Financial Management and Project Implementation Support
Consultants Expenditure
($ million) Year Appraisal Projected Expenditure Actual Expenditure 2002 0.28 0.01 2003 0.64 0.24 2004 0.88 0.28 2005 1.07 0.49 2006 1.27 0.65 2007 1.41 0.82 2008 1.41 0.92 2009 1.41 0.95 2010 1.41 0.95
Source: Loan Financial Information System, Asian Development Bank

Appendix 10
60
H. Table A10.8 : Project Management Office Component Expenditure
($ million)
Year Appraisal Projected Expenditure Actual Expenditure
2002 1.10 0.12 2003 1.54 0.82 2004 1.92 1.07 2005 2.23 1.53 2006 2.53 1.96 2007 2.88 2.39 2008 2.88 2.90 2009 2.88 3.20 2010 2.88 3.20
Source: Loan Financial Information System, Asian Development Bank

Appendix 11 61
Project Organization Chart
EDSs = enterprise development services, MONB&EID = Ministry of National Building and Estate Infrastructure Development (formerly Ministry of Plan Implementation – at Appraisal) (Formerly Ministry of Plan Implementation – at Appraisal), NDB = National Development Bank of Sri Lanka, PFIs = participating financial institutions, PMO = project management office, SPC = Southern Provincial Council
Pradeshiya Sabhas Strengthened infrastructure maintenance capacity improves enabling environment
Project Beneficiaries
Rural-based micro and small entrepreneurs increase production and sales and generate employment
Line authority Guidance and coordination
SPC Project implementation and supervision
NDB Channel funds to PFIs: supervise PFI training
PMO Day to day implementation supervision, monitoring
PFIs Provision of loans to rural enterprises and small-to medium-sized processors
MONB and EID Overall coordination and
monitoring
Commissioner Of Local Government
(SPC) Provision of advice and guidance to Pradeshiya Sabhas
EDSs Provision of advice and guidance to potential rural entrepreneurs, establish market linkages
EDSs = enterprise development services, MONB and EID = Ministry of Nation Building and Estate Infrastructure Development (formally Ministry of Plan Implementation – at Appraisal), NDB = National Development Bank of Sri Lanka, PFIs = participating fianancial institutions, PMO=project management office, SPC= Southern Provincial Council.
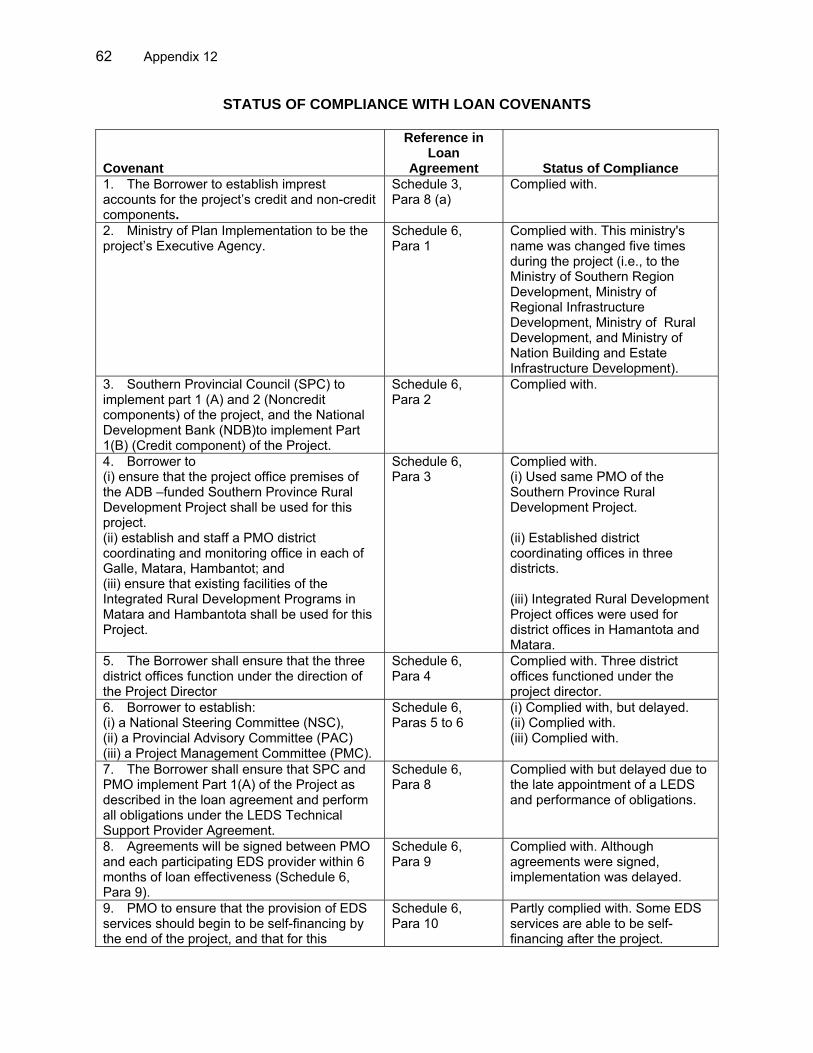
62 Appendix 12
STATUS OF COMPLIANCE WITH LOAN COVENANTS
Covenant
Reference in Loan
Agreement Status of Compliance 1. The Borrower to establish imprest accounts for the project’s credit and non-credit components.
Schedule 3, Para 8 (a)
Complied with.
2. Ministry of Plan Implementation to be the project’s Executive Agency.
Schedule 6, Para 1
Complied with. This ministry's name was changed five times during the project (i.e., to the Ministry of Southern Region Development, Ministry of Regional Infrastructure Development, Ministry of Rural Development, and Ministry of Nation Building and Estate Infrastructure Development).
3. Southern Provincial Council (SPC) to implement part 1 (A) and 2 (Noncredit components) of the project, and the National Development Bank (NDB)to implement Part 1(B) (Credit component) of the Project.
Schedule 6, Para 2
Complied with.
4. Borrower to (i) ensure that the project office premises of the ADB –funded Southern Province Rural Development Project shall be used for this project. (ii) establish and staff a PMO district coordinating and monitoring office in each of Galle, Matara, Hambantot; and (iii) ensure that existing facilities of the Integrated Rural Development Programs in Matara and Hambantota shall be used for this Project.
Schedule 6, Para 3
Complied with. (i) Used same PMO of the Southern Province Rural Development Project. (ii) Established district coordinating offices in three districts. (iii) Integrated Rural Development Project offices were used for district offices in Hamantota and Matara.
5. The Borrower shall ensure that the three district offices function under the direction of the Project Director
Schedule 6, Para 4
Complied with. Three district offices functioned under the project director.
6. Borrower to establish: (i) a National Steering Committee (NSC), (ii) a Provincial Advisory Committee (PAC) (iii) a Project Management Committee (PMC).
Schedule 6, Paras 5 to 6
(i) Complied with, but delayed. (ii) Complied with. (iii) Complied with.
7. The Borrower shall ensure that SPC and PMO implement Part 1(A) of the Project as described in the loan agreement and perform all obligations under the LEDS Technical Support Provider Agreement.
Schedule 6, Para 8
Complied with but delayed due to the late appointment of a LEDS and performance of obligations.
8. Agreements will be signed between PMO and each participating EDS provider within 6 months of loan effectiveness (Schedule 6, Para 9).
Schedule 6, Para 9
Complied with. Although agreements were signed, implementation was delayed.
9. PMO to ensure that the provision of EDS services should begin to be self-financing by the end of the project, and that for this
Schedule 6, Para 10
Partly complied with. Some EDS services are able to be self-financing after the project.

Appendix12 63
Covenant
Reference in Loan
Agreement Status of Compliance purposes, the EDS contracts shall be in one of two forms(i) a retainer contract or (ii) a contract for specific identified activities. 10. The lead EDS provider will ensure that each EDS provider will develop an annual work plan and consolidate all such work plans prior to the commencement of each year during the Project.
Schedule 6, Para 11
Complied with. EDS providers submitted annual work plans, and some are operating under the revolving fund.
11. PMO to ensure that training provided by EDS agencies shall be demand driven.
Schedule 6, Para 12
Complied with. The PMO provided training through the LEDS.
12. The Borrower shall ensure that NDB implements the Credit Component as describe in the loan agreement and perform all obligations under Subsidiary Loan Agreement.
Schedule 6, Para 13
Partly complied with. NDB did not have expected coordination with EA and PMO.
13. The project implementation unit at NDB will be established and staffed within one month of loan effectiveness and prior to relending of loan proceeds by the Government to NDB.
Schedule 6, Para 14
Complied with. NDB appointed staff on time to implement the credit component.
14. NDB to serve as the apex agency for the credit component.
Schedule 6, Para 15
Complied with.
15. A participation agreement will be signed between NDB and each PFI setting out the terms and conditions for relending from NDB to each PFI and from each PFI to end borrowers, including detailed operating instructions for the PFIs prior to any relending of loan proceeds by the Government.
Schedule 6, Para 16
Complied with. NDB signed the agreements with 10 PFIs.
16. NDB and each PFI will implement the PFI operating instructions during the term of the Project.
Schedule 6, Para 17
Complied with but implementation was slow.
17. NDB shall submit quarterly reports to PMO and the Bank on overall credit activities.
Schedule 6, Para 19
Complied with.
18. Within one year of loan effectiveness, NDB will establish a revolving fund to credit interest payments and principle payments by the project PFIs, and NDB will maintain the revolving fund for at least 15 years.
Schedule 6, Para 20
Complied with but delayed. Although the revolving fund is operating, its progress is unsatisfactory.
19. The Borrower shall ensure that NDB and each PFI implements the PFI operating instructions during the term of the Project.
Schedule 6, Para 21
Complied with.
20. The Borrower and NDB shall ensure that NDB provides orientation to PFI staff on EDS operation under the Project.
Schedule 6, Para 22
Complied with. NDB provided training for PFIs, EDS providers, and district chambers.
21. The credit line established under Part I will not be subject to debt amnesty or any other forgiveness of loan payment obligations.
Schedule 6, Para 23
The government has not granted any debt amnesty.
22. SPC to enter into agreements with each participating pradeshiya sabha (PS) not later than 6 months after the effective date.
Schedule 6, Para 24
Partially complied with. Agreements were not fully implemented.
23. The Borrower shall ensure that at the Schedule 6, Complied with. DLG conducted

64 Appendix 12
Covenant
Reference in Loan
Agreement Status of Compliance inception of the Project, staff of SPC Department of Local Government (DLG) shall conduct each pradeshiya sabha to explain the Project,
Para 25 the awareness program for pradeshiya sabhas with the assistance of PMO staff.
24. Borrower to ensure that (i) all roads for which maintenance funding shall be provided out of loan proceeds, (ii) no project funds are disbursed to any pradeshiya sabha until it has budgeted the full amount of the required contribution for road maintenance for the upcoming year.
Schedule 6, Paras 26
Not applicable, as the project did not provide maintenance funds due to the change of scope from gravel roads to paved roads.
25. The Borrower shall ensue that SPC ensures that participating pradeshiya sabhas demonstrate that their commitment to improving annual financing for infrastructure maintenance over a four year period.
Schedule 6, Paras 27
Partly complied with. Some pradeshiya sabhas have opened separate accounts for road and market maintenance and to increase funding allocation.
26. The Borrower shall ensure that no project funds are disbursed to any pradeshiya sabha until it has met the foregoing condition.
Schedule 6, Paras 28
Not applicable, as the project did not provide maintenance funds due to change of scope from gravel roads to paved roads.
27. Borrower to ensure that (i) participating pradeshiya sabha in the market upgrading component will submit market upgrading plans which would include plans for market management and maintenance as well as formulation of a financing structure for operation, solid and liquid waste disposal, (ii) market designs and layouts are developed in consultation with market users, and (iii) construction shall be under taken on a contract basis under the supervision of the Dept. of Local Government.
Schedule 6, Para 29
Partly complied with. Some pradeshiya sabhas are unable to implement management plans. The commissioner of local governments issued a circular to help implement the management plans.
28. The Borrower shall ensure that each agency involved in Project implementation (EDS agencies, PMO,NDB and PFIs) to establish and maintain accounts and records of Project Progress and expenditures.; and furnish certified copies of audited accounts and the Audit Reports (for the credit and non-credit components) to ADB.
Schedule 6, Paras 32-34; PA , Sec 3.02 & 3.05 (a)
Complied with. All agencies established separate accounts.
29. PMO to have the Project account for project activities and to submit audited financial statements annually
Schedule 6, Para 33
Complied with. The PMO established a project account and submitted audited reports.
30. NDB shall establish a separate unit to maintain detailed record on Credit Component and accounts of NDB and PFIs shall be audited annually by independent auditors.
Schedule 6, Para 34
Complied with. NDB established a project account unit and submitted audited reports.
31. NDB and SPC to submit quarterly reports, which the PMO shall consolidate and submit to ADB.
Schedule 6, Paras 19 & 35
Complied with.

Appendix12 65
Covenant
Reference in Loan Agreement
Status of Compliance
32. Borrower to conduct a comprehensive Project Midterm Review.
Schedule 6, Para 41
Complied with.
33. Borrower to ensure that environmental and social considerations (including the applicable laws and regulations of the borrower and ADB’s guidelines on environment and gender and development) are implemented.
Schedule 6, Para 46
Complied with.
34. Borrower and NDB to furnish ADB a project Completion Report.
Sec 4.07 (c); PA Section 3.04 (c)
Complied with but delayed. Both PCRs from the PMO and NDB were submitted late.
ADB = Asian Development Bank; DLG = Department of Local Government; EA = executing agency; EDS = enterprise development service; LEDS = lead enterprise development service; NDB = National Development Bank; PFI = participating financial institutions; PMO = Project management Office; SPC = Southern Provincial Council

Appendix 13
66
CONSULTANT RECRUITMENT AND PROCUREMENT DETAILS
A. General 1. All consulting services for the Southern Province Rural Economic Advancement Project, including those financed by the OPEC 1 Fund for International Development (OFID), were engaged in accordance with Guidelines on the Use of Consultants (2010, as amended from time to time) of the Asian Development Bank (ADB). Consulting services for national and international consultants were initially recruited through a firm in three packages: (i) lead enterprise development service (EDS) provider; (ii) project implementation consultants (PICs), providing public finance management and rural road engineering services; and (iii) benchmark survey consultants. After the midterm review, another package was added to accelerate the implementation of increased civil works to ensure the quality of construction. This involved individual recruitment of a team of engineering consultants because of the nature of expertise required. B. Lead Economic Development Service Provider 2. Recruitment of the lead EDS provider by local consultant bidding (LCB) was protracted. Advertisements for consultant expression of interest were issued on 16 September 2001. The Government of Sri Lanka's shortlisting was slow, and after an ADB consultation mission from 19 to 21 March 2002 expressed concern, the Ministry of Southern Region Development issued a letter of invitation to five firms on 22 March 2002. 3. In June 2002, the Consultant Selection Committee reviewed and confirmed the government's evaluation of technical proposals and concurred with the government's proposal to proceed with contract negotiations with the first-ranked firm. Between July and October 2002, there was extended correspondence between the executing agency (EA) and ADB on progress with the selected firm. ADB tried to guide the process, as negotiations were not occurring on the firm's proposed inputs and costs. Moreover, the firm's financial proposal for activities for the first 3 years exceeded the project cost estimate for the entire 5 years of the contract. 4. Ultimately, the EA agreed to a contract value with this firm of about SLRs44 million, much lower than the originally proposed amount, by reducing inputs and activities. The government sent ADB a copy of the signed agreement between RDA and the consulting firm, based on the EA's assurances that it would get the required outputs from the firm. ADB accepted the draft negotiated contract but suggested that a performance evaluation clause be added. 5. The country director of the Sri Lanka Resident Mission soon received reliable information that the selected firm had no agribusiness experience and had not submitted financial statements for last 8–9 years. The director of the South Asia Department, Agriculture, Environment and Natural Resources was advised and requested that an ADB staff member look into the matter during a mission in October 2002. The staff member visited the firm's office on 1 November 2002 to make an assessment of its experience and capacity. Unfortunately, the information provided by the firm raised doubts as to its credibility and capacity. 6. ADB asked the government to reconsider using the firm before the contract was finalized. The government thus decided to renegotiate the contract with the firm, reevaluate the
1 Organization of the Petroleum Exporting Countries.

Appendix 13
67
proposals, or reinvite bids for the contract. However, it was found the EA had not only signed the draft agreement with the firm but also the actual contract.1 Therefore, the government had no choice but to submit the lead EDS provider agreement to ADB on 12 December 2002, and a revised contract was signed incorporating defined performance review times, benchmark performance indicators, and an initial 1-year contract term for this firm. 7. The firm, the lead EDS provider, commenced services on 7 January 2003, an elapsed time of 16 months from the project commencement, causing significant delays to mobilizing support for the credit component. It soon became apparent that the firm was performing poorly.2 After discussions between ADB and the EA, the contract was terminated on 30 April 2004 after ad hoc extensions of the initial 1-year contract by 4 months. 8. Although ADB pressed for the urgency of appointing another lead EDS provider, this was delayed. The government was slow to recruit, despite an agreement with the ADB special project administration mission in May 2003 to review the other, initial shortlisted firms. Then, although the government promised the ADB loan review mission in November 2004 to ask the replacement lead EDS provider to submit technical and financial proposals by the end of November 2004 with a view to mobilization by 20 December 2004, it did not do so. Further delays arose during the ADB special project administration mission in February 2005, when new project director proposed to create a project management office (PMO) unit to replace the lead EDS provider. The mission did not agree to this proposal and emphasized that the lead EDS provider should be a private sector arm of the PMO. 9. ADB reviewed a proposal by Industrial Service Bureau (ISB), who was part of a business development center network and had a strong presence in Southern Province as well as an office in Matara. ADB advised the government that this proposal should be finalized without further delay. Yet further delays occurred, and the June 2005 loan review mission suggested that the EA discuss the proposal with ISB to obtain needed clarification, including a detailed action plan, and to finalize the contract without further delay. If required, the EA could obtain an independent assessment of the performance of ISB on another ADB project. After more delays, the February 2006 ADB special project administration mission reviewed a draft agreement for the replacement lead EDS provider finalized by the EA and provided suggestions to note when finalizing the agreement. Finally, the PMO signed an agreement with the replacement lead EDS provider, ISB, on 15 February 2006. The consultants were mobilized in March 2006, an elapsed time after the termination of the initial consultants of 23 months. C. Project Implementation Consultants 10. Recruitment of the PICs by international consultant bidding (ICB) was similarly drawn out. The government advertised the consultancy in May 2002, and the shortlisted and draft invitations were prepared and sent to ADB in December 2002. During the ADB inception mission in January 2003, the government sought to use the quality and cost-based selection method and awaited ADB concurrence. Then, during the ADB special project administration missions in November 2003 and May 2004, concern was expressed regarding recruitment delays, which were pending because of contradictory recommendations by the negotiating committee and the Tender Board. The EA minister and secretary agreed that expeditious action would be taken to reconvene the Tender Board to review the successfully concluded
1 The contract could not be signed until loan effectiveness, and ADB approval of the lead EDS provider agreement
was a condition of loan effectiveness. 2 First cited in the aide-mémoire of the special project administration mission in November 2003.

Appendix 13
68
negotiations with the first-ranked firm. Although this firm had quoted a very low cost, the project director expressed his confidence in their ability to deliver. 11. The contract with the PICs was finally signed on 19 October 2004, and a few members of the PIC team commenced work on 1 November 2004, an elapsed time of 28 months, causing significant delays to mobilizing support for the sustaining the enabling environment part of the project. D. Goods and Services 12. Goods and services financed by ADB and OFID were procured in accordance with ADB’s Procurement Guidelines (2010, as amended from time to time). Under part I, the major items procured for the lead EDS providers were equipment and materials by the PMO. The National Development Bank established procurement procedures acceptable to ADB that were used by subborrowers procuring goods and services financed under the credit component. For part II, the major goods and services procured were equipment and materials as well as civil works. Equipment comprised office, information technology, communications, and training equipment for the PMO, Department of Local Government (part of the Southern Provincial Council), and selected EDS agencies. As all contracts for goods and services were $100,000 or less, procurement was through direct purchase. E. Civil Works Contracts 13. Civil works contracts, intended to be modest at project appraisal, subsequently became more significant with the major changes to the loan. It was changed from anticipated routine road maintenance works and market upgrading under part II to include road surfacing with asphalt and concrete, rehabilitation of flood-damaged gravel roads, and the construction of steel and concrete pedestrian bridges capable of accommodating small three-wheel vehicles and farm tractors. Procurement comprised many small contracts for road maintenance, road resurfacing, and construction of market facilities. At appraisal, it was envisaged that no single contract was likely to exceed $200,000. Therefore, it was proposed that the procurement of civil works for road maintenance contracts would take a variety of forms, and could entail a full package contract with the rental of equipment along with the use of hired labor. The use of local direct purchase or other practices that were shown to be acceptable to ADB. 14. With the inclusion of the flood-damaged roads and pedestrian bridges, larger contracts were involved. The procurement of civil works contracts were estimated to cost the equivalent of more than $1.0 million, and each supply contract for equipment and materials was estimated to cost the equivalent of more than $0.5 million. They were to be awarded on the basis of ICB. Civil works for market improvement were to be awarded through LCB using procedures acceptable to ADB. 15. Details of the civil works contracts are provided in Appendix 2 and involved (i) 35 individual LCB contracts for 35 demonstration gravel rural roads with an average contract value of SLRs1.64 million, ranging from SLRs0.20 million to SLRs2.53 million; (ii) 132 individual LCB contracts for 141 partially formed gravel rural roads with an average contract value of SLRs2.48 million, ranging from SLRs0.09 million to SLRs16.21 million; (iii) 27 individual LCB contracts for 214 rural road surfacing and rehabilitation with an average contract value of SLRs64.52 million, ranging from SLRs11.69 million to SLRs168.94 million; (iv) 77 individual LCB contracts for the rehabilitation of 508 flood-damaged gravel rural roads with an average contract value of SLRs1.54 million, ranging from SLRs1.03 million to SLRs15.42 million; (v) 5 individual contracts

Appendix 13
69
(3 ICB and 2 LCB) for the replacement of 18 flood-damaged pedestrian bridges with an average contract value of SLRs137.31 million, ranging from SLRs36.86 million to SLRs234.30 million; and (vi) 23 individual LCB contracts for 23 rural polar markets with an average contract value of SLRs20.35 million, ranging from SLRs7.10 million to SLRs42.80 million. 16. Eight of the contracts issued for the rural road surfacing and rehabilitation works, including three terminated contracts, exceeded the $1 million limit for LCB contracts, following ADB agreement in February 2006 that ICB contract procedures did not apply due to the lack of interest from international firms for contracts below $3 million in Sri Lanka. During the ADB midterm review mission, it was found that the technical specifications in bid documents for the civil works did not match the bill of quantities. The Sri Lanka Resident Mission and PICs had several meetings with the PMO to update the bid documents to enable the procurement process to continue. F. Service Contract Procurement 17. Service contracts for EDS training were awarded on the basis of LCB among prequalified agencies using ADB guidelines. Service contracts for EDS providers were through direct purchase, negotiated on the basis of pre-selection of the service providers and with payment of standard fees. Service contracts were issued for an impact evaluation study of the project and an impact assessment of the credit component using LCB procedures.
Appendix 14
70
ECONOMIC AND FINANCIAL REAPPRAISAL A. Introduction 1. At project appraisal, it was assumed that the Southern Province Regional Economic Advancement Project would have a direct impact on the province's economy by (i) correcting market failure where information and new technology, which is required to establish new business enterprises, reached a limited number of entrepreneurs, and where inadequate marketing facilities and infrastructure impeded the marketing of produce; (ii) contributing to an equitable adjustment for the skewed distribution of economic opportunities in the project area by addressing the needs of identified socially vulnerable groups, such as women and unemployed youth; (iii) complementing the economic advancement impact of other Asian Development Bank (ADB)-funded projects, such as Southern Provincial Roads Improvement and Southern Transport Development projects; and (iv) generating nonquantifiable benefits, such as improved sanitation standards, by bettering market facilities and expanding employment by helping entrepreneurs establish new enterprises and upgrade existing businesses. B. Demand Analysis
1. Demand for Improvement of Markets and Rural Roads
2. At project appraisal, rural markets (active 1 or 2 days per week) comprised the most important marketing channel for farm produce in the project area. Most produce for local consumption is traded at these markets, and wholesale traders catering to urban markets also procure much of their fruits and vegetables from farmers and other traders there. The demand for better-quality vegetables and fruit was ascertained to be strong, both for local consumption and for urban markets.1 However, the existing markets were unsuitable for the high-quality produce trade due to their low sanitation standards and uncovered and earthen-floored facilities. Produce was also damaged during transit due to the poor quality of local rural access roads. Quantitative and qualitative produce losses incurred in the local marketing chain were estimated at about 40% of farm gate production.2 Appraisal discussions undertaken with producers and traders in the existing markets identified better facilities and management among their top priorities.3 Improvement of the quality and efficiency of markets and local access roads were viewed as directly benefiting consumers, farmers, and traders. 3. The project consultant’s economic impact assessment did not quantify the project’s roads, although it mentioned that the new markets made a substantial impact in improving income, creating employment, and bettering the quality of life of the communities and the income generation of pradeshiya sabhas (local governments).4 Market surveys conducted by the project management office (PMO) quantified impacts for the nine markets surveyed, and the results are in Table A2.9. These surveys established that the rural markets generated significant growth in economic activity thanks to the market upgrades, although they did not result in additional wholesale or retail markets days, as only 1 additional retail market day was recorded. The effectiveness of the rural market upgrades was demonstrated through a 150% increase in the number of stalls available, along with the creation of permanent shops (i.e., 46 shop units were created in the nine markets surveyed, and these shops operated outside of market days). 1 ADB. 2001. Southern Province Rural Economic Advancement Project. Consultant’s report. Manila (TA3385-SRI) 2 ADB. 2001. Southern Province Rural Economic Advancement Project. Consultant’s report. Manila. (TA 3385_SRI) 3 ADB. 2001. Southern Province Rural Economic Advancement Project. Consultant’s report. Manila. (TA3385_SRI) 4 Government of Sri Lanka, Ministry of Nation Building 2009. SPREAP Impact Evaluation Study, Galle. ( p. 58 and p.
62.)

Appendix 14
71
There was a 70% increase in operating stallholders on market days, and an 80% increase in market shoppers. Weekly market turnover increased by some 75%, recording an average weekly turnover increase from SLRs4.6 million to SLRs8.0 million. Further, the annual income for pradeshiya sabhas from market operations increased 115%, with the market average increasing from SLRs0.8 million to SLRs1.7 million. No analysis was conducted on the quantitative and qualitative produce loss reduction, although it is likely that part of the 75% trader turnover increase would comprise such loss reduction.
2. Demand for Credit
4. At project appraisal, the demand for credit by potential Southern Province entrepreneurs was estimated from the past experience of financial institutions participating in small and medium-sized enterprise (SME) development initiatives.1 From 1997 to 2002, the countrywide aggregate demand for SME credit for 13 prospective participating financial institutions was about $262.5 million, out of which $68.0 million was for 2001. About 10%–15% of this estimated demand was expected to emanate from the project area. Assuming a continuation of the historical growth in credit demand of 15%–20% per year, the credit demand among SME enterprises in the project area was assessed to be at least $60.0 million. 5. The reduction of the credit component as a result of major project fund reallocation reduced the loan allocation in SDR by 42%, from SDR10.855 million to SDR6.311 million, although the favorable movement of the US dollar to SDR only resulted in a 9% reduction of the credit component, from $20.0 million to $18.2 million, and a 14% reduction in the Sri Lanka rupee value of subloan disbursement by the National Development Bank from SLRs1,270 million to SLRs1,094 million, as a consequence of favorable movements between the Sri Lanka rupee and SDR. The project thus provided for around one-third of the assessed credit demand expected at appraisal. C. Economic Analysis
1. General 6. Prices and other information used in the project appraisal analysis were identified through market surveys and observations. To determine the expected direct benefits of the components, quantifiable effects were valued by comparison of with- and without- project scenarios. The basic assumptions included (i) a world price numeraire; (ii) values expressed in constant 2001 prices to exclude inflation; (iii) the Sri Lanka rupee as the unit of account, and the exchange rate as the prevailing rate at the time of project appraisal (SLRs90 per $1); (iv) for nontraded goods and services, a standard conversion factor of 0.9 and a shadow wage rate of 0.75; and (v) exclusion of transfer payments, such as taxes and subsidies, in the calculation of economic values. The reappraisal was undertaken using similar relevant assumptions: (i) values expressed in constant 2009 prices, the year of project completion; (ii) actual project costs converted to 2009 values using the Manufactures Unit Value Index, a proxy for the price of developing country imports of manufactures, for all foreign costs, and the Colombo Consumers’ Price Index2 for all local costs; (iii) the Sri Lankan rupee as the unit of account; (iv) for nontraded
1 Figures were based on projections from ADB. 1997. Report and Recommendation of the President to the Board of
Directors: Proposed Loan and Partial Credit Guarantee to the Democratic Republic of Sri Lanka for the Small and Medium Enterprise Assistance Project. Manila (Loan 1552-SRI, for $5 million and $50 million, approved 5 June).
2 The index is compiled by the Department of Census and Statistics, and the version used was the Core Inflation Index based on the Colombo Consumers’ Price Index and used for monetary policy purposes. The core inflation

Appendix 14
72
goods and services, a standard conversion factor of 0.9 and a shadow wage rate of 0.75; and (v) exclusion of transfer payments, such as taxes and subsidies, in the calculation of economic values.
2. Benefits
7. Improvement of rural roads. The economic analysis at appraisal related only to improving and maintaining gravel rural roads, while the final project incorporated four categories of road projects: (i) 31 kilometers (km) of demonstration roads and 328 km of gravel roads, mainly to the subbase level, under the first phase of the project; (ii) 161 km of bitumen-surface roads; (iii) 65 km of concrete pavement roads; and (iv) 605 km of flood-damaged rural gravel roads. The reappraisal was undertaken for all of these roads, rather than just the first phase of roads comparable to the scope at appraisal, using the same appraisal methodology. Benefits of these road enhancements are associated with the initial improvement in road quality plus the retention of that improved condition through timely and appropriate levels of maintenance. Through better compaction and the installation of drains, the improved roads are expected to be within the capacity of the pradeshiya sabhas to remain in good condition throughout the project life of 15 years. 8. Benefits include (i) decreased vehicle operating costs, estimated in 2001 prices to decline from SLRs9.0 per km to SLRs6.9 per km as a per vehicle average; (ii) reduced travel time for farmers and consumers, as the average speed on the roads increased from 10 km per hour to 15 km per hour; and (iii) a 15% decrease in the amount of produce spoilage during transport to the markets.1 Spoilage and traffic benefits were calculated in relation to the volume of business generated by the project markets as contained in the market survey results shown in Table A4.2. Traffic volumes with and without the road improvements were calculated using the road survey information shown in Table A4.1. To be conservative, benefits due to future traffic increases and the higher savings in vehicle operating costs and travel time associated with surfaced roads, which were not included in the appraisal analysis, were not included in the reappraisal analysis.
9. Rehabilitation of pedestrian bridges. The rehabilitation of flood-damaged pedestrian bridges was not included at appraisal yet was assessed during reappraisal using a modified analysis based on the rural road appraisal assumptions. Benefits of this activity relate to (i) improved social coherence among the communities; (ii) use of three-wheelers as the main mode of transport for schoolchildren; (iii) new bus services operating on routes where no services had been previously available: (iv) the newly linked road network creating a sense of confidence and safety among women and children as well as the elderly and sick; (v) community participation in sustainable management of the pedestrian bridges; (vi) elimination of the risk of accidents such as villagers and schoolchildren falling into the river; (vii) improved village access increasing property values; and (viii) improved community health conditions as a result of increased visits by government officials as well as quicker and easier access to hospitals.2 Benefits taken into account in the reappraisal were restricted to vehicle operating
index excludes the total food group and energy items (e.g., gas, kerosene, firewood, petrol, diesel, and electricity), to obtain a measure of underlying trend in inflation.
1 Figures were drawn from ADB. 1999. Technical Assistance to the Democratic Republic of Sri Lanka for the Southern Province Rural Economic Advancement Project. Manila (TA 3385-SRI, for $800,000, approved 29 December).
2 At Maramba Walihena, as many as 15 deaths were reported, with pedestrians falling in the river prior to completion of the new bridge. Also, a one-perch property in the village of Batuwangala worth SLRs5,000 before construction of the bridge was sold for SLRs10,000 after its construction.

Appendix 14
73
costs and travel time savings, which were tabulated in the PMO-conducted survey at a selection of the pedestrian bridge sites to identify bridge-use patterns as well as vehicle and pedestrian movements, including distance and time savings. 10. Improvements of markets. Before the project, rural markets usually included some open-sided stalls with roofs plus a larger area of bare-earth, open-air stalls. Access and parking were generally congested, and sanitation was poor. Improvements under the project included elements of sanitation, stall construction, paving, and parking improvements. Benefits assumed at appraisal included (i) a 9% decrease in the amount of produce spoilage during marketing, resulting in increased farmer sales; and (ii) a 5% increase in market business (beyond the increase due to decreased spoilage) due to better facilities for consumers and traders, half of which was assumed to be generated income included as an economic benefit. Discussions during the project completion report mission indicated that the produce spoilage decrease likely exceeds the appraisal assumption, but an accurate measure is unavailable. Therefore, the reappraisal analysis was undertaken with the conservative appraisal spoilage assumption and used actual market sales increases recorded and shown in Table A4.2. 11. Indicative economic activities. The project provided enterprise development services and access to credit for the upgrading and commercialization of existing agriculture-based enterprises, and the establishment of new enterprises. At project appraisal, it was assumed that the calculated generated net economic value of indicative enterprises represented the expected benefit to the local economy. Indicative enterprise activities analyzed included broiler production, fruit production and processing, ornamental fish production, fishpond culture, rice milling, shoe production, a poultry hatchery, and floriculture. Records of subloans provided under the project maintained by the National Development Bank only recorded the industry sector, number of subloans, and employment generated. Therefore, it was not possible for the project completion report mission to undertake a reappraisal of the project impact to determine overall financial and economic returns. However, there was no reason to conclude that the indicative enterprises financial and economic returns calculated during appraisal were not achieved, however. The PMO impact assessment consultancy related to the credit component also did not provide any quantitative estimate of the financial and economic returns.
3. Costs 12. Costs incorporated into the reappraisal were based on actual project costs in Sri Lanka rupees rather than the sample project components used in the appraisal evaluation. Figures were prepared by the PMO by annual cost allocation and were consistent with the project cost schedules. Project implementation costs were allocated between the various civil works subcomponents based on proportion of total project cost associated with the respective subcomponents.
4. Economic Returns 13. The rural road civil works subcomponent recorded an economic internal rate of return (EIRR) of 21%, slightly below the 23% estimated during appraisal, and an economic net present value (ENPV) of SLRs342 million compared with SLRs470 million during appraisal. Table A14.1 shows the annual distribution of costs and benefits. These results are due to the various project delays and the high costs and lower distances associated with the change from rural gravel road maintenance to surfaced road provision. The reappraisal sensitivity analyses indicated that without the time cost savings, the subcomponent had an EIRR of 12.6% and an ENPV of SLRs22 million, and the switching value (base case rate of 12%) occurred with a 18.5%

Appendix 14
74
reduction in total benefits assumed. This result suggests that maintenance could be a problem, and if the pradeshiya sabhas do not fulfill their responsibility for adequate maintenance, the economic returns to roads could dip to unacceptable levels. 14. The pedestrian bridge civil works subcomponent recorded an EIRR of 24% and an ENPV of SLRs204 million. Table A14.2 shows the annual distribution of costs and benefits. The reappraisal sensitivity analyses indicated that without the time cost savings, the subcomponent had an EIRR of 4% and an ENPV of –SLRs109 million, and the switching value occurred with a 40% reduction in total benefits assumed. 15. The market improvement civil works subcomponent EIRR was 85%, compared to the 26% estimated during appraisal. The ENPV was SLRs3,888 million compared with SLRs470 million at appraisal. This was due to a significant underestimation of the expected growth in market sales resulting from the new market locations (5%) compared to the survey recorded increase of 75%. Table A13.3 shows the annual distribution of costs and benefits. Sensitivity analyses indicated the robustness of these figures. 16. Rates of return for the 10 indicative enterprises identified at appraisal are summarized in Table A14.4. All can be considered economically viable, indicating their economic benefits to the local economy. D. Financial Analysis 17. Pradeshiya sabhas have responsibility for the provision of several local services, the largest of which, in monetary terms, is the maintenance of rural roads. Resources are generally inadequate for the budgetary demands. Pradeshiya sabhas receive 60%–70% of their revenue in the way of grants from provincial and central government authorities. They also raise some funds on their own via various licensing fees and rents. Of these sources, market revenues are particularly important. One of the goals of the market improvement civil works subcomponent was to increase the pradeshiya sabhas’ income from this source. A with- and without-project analysis of pradeshiya sabha revenues is summarized in Table A14.5. 18. The largest market surveyed increased its annual revenue by SLRs2.5 million compared with the large market example considered at appraisal, which expected an increase of SLRs1.3 million annually. The smaller markets surveyed recorded increases in their annual revenue of SLRs0.9 million–SLRs1.5 million, compared with SLRs0.3 million anticipated at appraisal. Reappraisal of the subcomponent recorded a financial internal rate of return (FIRR) of 10% and a financial net present value of –SLRs8.0 million. Pradeshiya sabha revenue increased from 0.5% of total market turnover to 0.6% of total turnover with the project, indicating that they were able to increase collections at a slightly faster rate that total market sales. However, in view of the low FIRR, there is room to increase the collection rate to 1.0% or 1.5%, which would yield an FIRR of 12%–23%. 19. Financial analyses were undertaken at appraisal for 10 agricultural-based indicative enterprises. Typical investment costs included equipment, implements and materials, land preparation, planning, and labor. Depending upon the enterprise, unskilled labor was usually used plus a limited amount of skilled labor. The FIRRs are summarized in Table A14.4. These rates range between 30% for leather footwear production to 66% for pineapple production. These results are expected to apply if a reappraisal is undertaken with updated data and demonstrates the profitability of enterprises that used the project subloans.

Appendix 14
75
Table A14.1: Economic Cash Flow for the Rural Roads Civil Works Component (SLRs millions in Year 2009 Prices)
Project Costs Project Benefits Sensitivity Tests
Year Without Project
With Project Net
Project Administration
Costs Share VOC
Savings
Value Time
Savings Spoilage Savings Total
Net Benefits
Net Benefits Excluding Time
Savings
18.5% Reduction
Total Benefits
2002 6.21 6.21 9.24 (15.45) (15.45) (15.45) 2003 6.21 30.78 24.57 66.69 (91.26) (91.26) (91.26) 2004 6.21 28.71 22.50 21.53 (44.03) (44.03) (44.03) 2005 6.21 164.45 158.24 21.53 (179.77) (179.77) (179.77) 2006 198.10 118.94 (79.16) 45.09 (34.07) 34.07 34.07 2007 6.21 301.58 295.37 49.14 105.50 66.92 210.82 383.23 38.72 (28.20) (32.18) 2008 6.21 384.34 378.13 49.09 105.50 66.92 210.82 383.23 (43.99) (110.91) (114.89) 2009 6.21 958.82 952.62 28.00 105.50 66.92 210.82 383.23 (597.38) (664.30) (668.28) 2010 6.21 198.76 192.55 131.40 83.35 262.57 477.31 284.76 201.42 196.46 2011 198.10 198.76 0.67 131.40 83.35 262.57 477.31 476.65 393.30 388.35 2012 6.21 198.76 192.55 131.40 83.35 262.57 477.31 284.76 201.42 196.46 2013 6.21 198.76 192.55 131.40 83.35 262.57 477.31 284.76 201.42 196.46 2014 6.21 198.76 192.55 131.40 83.35 262.57 477.31 284.76 201.42 196.46 2015 6.21 198.76 192.55 131.40 83.35 262.57 477.31 284.76 201.42 196.46 2016 198.10 198.76 0.67 131.40 83.35 262.57 477.31 476.65 393.30 388.35 2017 6.21 198.76 192.55 131.40 83.35 262.57 477.31 284.76 201.42 196.46 2018 6.21 198.76 192.55 131.40 83.35 262.57 477.31 284.76 201.42 196.46 2019 6.21 993.81 987.60 131.40 83.35 262.57 477.31 (510.29) (593.63) (598.59) 2020 6.21 198.76 192.55 131.40 83.35 262.57 477.31 284.76 201.42 196.46 2021 198.10 198.76 0.67 131.40 83.35 262.57 477.31 476.65 393.30 388.35 2022 6.21 198.76 192.55 131.40 83.35 262.57 477.31 284.76 201.42 196.46 2023 6.21 198.76 192.55 131.40 83.35 262.57 477.31 284.76 201.42 196.46 2024 6.21 198.76 192.55 131.40 83.35 262.57 477.31 284.76 201.42 196.46 Economic net Present value at 12% 342.30 21.84 2.78 Economic internal rate of return (%) 20.8 12.6 12.1 Note: ()=negative, VOC =vehicle operating cost Source: Mission estimates.

76 A
ppendix 14
Table A14.2: Economic Cash Flow for the Flood Rehabilitation Pedestrian Bridges Civil Works Component
(SLRs millions in Year 2009 Prices)
Project Costs Project Benefits Sensitivity Tests
Year Without Project With Project Net
Administration Costs Share
VOC Savings
Value Time Savings Total
Net Benefits
Net Benefits Excluding Time
Savings 40% Reduction Total Benefits
2002 0.00 0.00 0.41 (0.41) (0.41) (0.41) 2003 0.00 0.00 2.93 (2.93) (2.93) (2.93) 2004 0.00 0.00 0.95 (0.95) (0.95) (0.95) 2005 0.00 0.00 0.95 (0.95) (0.95) (0.95) 2006 20.65 20.65 1.98 (22.64) (22.64) (22.64) 2007 147.91 147.91 2.16 (150.07) (150.07) (150.07) 2008 171.09 171.09 2.16 17.87 25.51 (173.25) (198.76) (173.25) 2009 166.14 166.14 1.23 35.73 51.01 86.74 (80.62) (131.64) (114.89) 2010 25.29 25.29 71.46 102.03 173.49 148.20 46.17 79.67 2011 25.29 25.29 71.46 102.03 173.49 148.20 46.17 79.67 2012 25.29 25.29 71.46 102.03 173.49 148.20 46.17 79.67 2013 25.29 25.29 71.46 102.03 173.49 148.20 46.17 79.67 2014 25.29 25.29 71.46 102.03 173.49 148.20 46.17 79.67 2015 25.29 25.29 71.46 102.03 173.49 148.20 46.17 79.67 2016 25.29 25.29 71.46 102.03 173.49 148.20 46.17 79.67 2017 25.29 25.29 71.46 102.03 173.49 148.20 46.17 79.67 2018 25.29 25.29 71.46 102.03 173.49 148.20 46.17 79.67 2019 25.29 25.29 71.46 102.03 173.49 148.20 46.17 79.67 2020 25.29 25.29 71.46 102.03 173.49 148.20 46.17 79.67 2021 25.29 25.29 71.46 102.03 173.49 148.20 46.17 79.67 2022 25.29 25.29 71.46 102.03 173.49 148.20 46.17 79.67 2023 25.29 25.29 71.46 102.03 173.49 148.20 46.17 79.67 2024 25.29 25.29 71.46 102.03 173.49 148.20 46.17 79.67 Economic net present value at 12% 203.88 (108.91) 1.53 Economic internal rate of return (%) 24.2 3.6 12.1 Note: ()=negative, VOC=Vehicle operating cost. Source: Mission estimates

Appendix 14
77
Table A14.3: Economic Cash Flow for the Rural Markets Civil Works Component
(SLRs millions in Year 2009 Prices)
Project Capital Costs Project Benefits Sensitivity Tests
Year Without Project
With Project Net
Administration Costs Share
Spoilage Savings
Non Spoilage
Increment Total Net
Benefits
Net Benefits Excluding Increased
Sales
35% Reduction Spoilage Savings
Only 2002 2.35 2.35 1.57 (3.92) (3.92) (3.92) 2003 2.35 0.02 2.36 11.36 (13.72) (13.72) (13.72) 2004 2.35 0.16 2.51 3.67 (6.17) (6.17) (6.17) 2005 2.35 44.35 46.70 3.67 (50.36) (50.36) (50.36) 2006 2.35 38.26 40.61 7.68 (48.29) (48.29) (48.29) 2007 2.35 39.74 42.08 8.37 (50.45) (50.45) (50.45) 2008 2.35 107.75 105.41 8.36 (113.77) (113.77) (113.77) 2009 2.35 102.84 100.50 4.77 62.10 636.50 698.61 593.34 (43.16) (64.90) 2010 2.35 16.66 14.31 124.21 1,273.01 1,397.21 1,382.90 109.90 66.42 2011 2.35 16.66 14.31 124.21 1,273.01 1,397.21 1,382.90 109.90 66.42 2012 2.35 16.66 14.31 124.21 1,273.01 1,397.21 1,382.90 109.90 66.42 2013 2.35 16.66 14.31 124.21 1,273.01 1,397.21 1,382.90 109.90 66.42 2014 2.35 16.66 14.31 124.21 1,273.01 1,397.21 1,382.90 109.90 66.42 2015 2.35 16.66 14.31 124.21 1,273.01 1,397.21 1,382.90 109.90 66.42 2016 2.35 16.66 14.31 124.21 1,273.01 1,397.21 1,382.90 109.90 66.42 2017 2.35 16.66 14.31 124.21 1,273.01 1,397.21 1,382.90 109.90 66.42 2018 2.35 16.66 14.31 124.21 1,273.01 1,397.21 1,382.90 109.90 66.42 2019 2.35 16.66 14.31 124.21 1,273.01 1,397.21 1,382.90 109.90 66.42 2020 2.35 16.66 14.31 124.21 1,273.01 1,397.21 1,382.90 109.90 66.42 2021 2.35 16.66 14.31 124.21 1,273.01 1,397.21 1,382.90 109.90 66.42 2022 2.35 16.66 14.31 124.21 1,273.01 1,397.21 1,382.90 109.90 66.42 2023 2.35 16.66 14.31 124.21 1,273.01 1,397.21 1,382.90 109.90 66.42 2024 2.35 16.66 14.31 124.21 1,273.01 1,397.21 1,382.90 109.90 66.42 Net present value at 12% 3,888.46 129.61 1.25 Economic internal rate of return (%) 84.5% 20.1% 12.1% Note : ()=negative.
Source: Mission estimates.

Appendix 14
78
Table A14.4: Indicative Enterprises
Enterprise Financial Returns Economic Returns FIRR FNPV EIRR ENPV (%) (SLRS '000) (%) (SLRS '000) Poultry 50 1,374 51 1,325 Pineapples 66 149 80 170 Mangoes 39 446 40 413 Ornamental fish 54 206 61 221 Fishpond Tilapia culture 43 30 24 16 Rice mill 56 5,711 64 6,718 Coconut and medicinal plants 61 79 75 95 Leather shoe production 30 9,400 53 15,817 Poultry hatchery 48 76,736 41 57,804 Export floriculture 35 41,722 47 56,148 EIRR = economic internal rate of return, ENPV = economic net present value, FIRR = financial internal rate of return, FNPV = financial net present value. Source: Appraisal estimates.

Appendix 14
79
Table A14.5: Financial Cash Flow for the Rural Markets Civil Works Component (SLRs millions in Year 2009 Prices)
Project Capital Costs Project PS Revenue Sensitivity Tests
Year Without Project
With Project Net
Administration
Costs Share
Without Project Income
With Project Income Total
Net Cash Flow
PS Income
1% Market Sales
PS Income
1.5% Market Sales
2002 2.61 0.00 2.61 1.75 20.46 20.46 16.10 16.10 16.10 2003 2.61 0.02 2.63 12.62 20.46 20.46 5.21 5.21 5.21 2004 2.61 0.22 2.82 4.07 20.46 20.46 13.56 13.56 13.56 2005 2.61 59.02 61.62 9.50 20.46 20.46 (50.67) (50.67) (50.67) 2006 2.61 50.92 53.52 8.53 20.46 20.46 (41.60) (41.60) (41.60) 2007 2.61 52.88 55.48 9.30 20.46 20.46 (44.33) (44.33) (44.33) 2008 2.61 143.38 140.78 9.29 20.46 20.46 (129.61) (129.61) (129.61) 2009 2.61 136.85 134.24 5.30 10.23 22.02 32.25 (107.29) (92.61) (74.26) 2010 2.61 22.16 19.56 44.05 44.05 24.49 53.85 90.55 2011 2.61 22.16 19.56 44.05 44.05 24.49 53.85 90.55 2012 2.61 22.16 19.56 44.05 44.05 24.49 53.85 90.55 2013 2.61 22.16 19.56 44.05 44.05 24.49 53.85 90.55 2014 2.61 22.16 19.56 44.05 44.05 24.49 53.85 90.55 2015 2.61 22.16 19.56 44.05 44.05 24.49 53.85 90.55 2016 2.61 22.16 19.56 44.05 44.05 24.49 53.85 90.55 2017 2.61 22.16 19.56 44.05 44.05 24.49 53.85 90.55 2018 2.61 22.16 19.56 44.05 44.05 24.49 53.85 90.55 2019 2.61 22.16 19.56 44.05 44.05 24.49 53.85 90.55 2020 2.61 22.16 19.56 44.05 44.05 24.49 53.85 90.55 2021 2.61 22.16 19.56 44.05 44.05 24.49 53.85 90.55 2022 2.61 22.16 19.56 44.05 44.05 24.49 53.85 90.55 2023 2.61 22.16 19.56 44.05 44.05 24.49 53.85 90.55 2024 2.61 22.16 19.56 44.05 44.05 24.49 53.85 90.55 Net present value at 12% (7.55) 370.20 842.39 Economic internal rate of return (%) 10.0 12.2 23.4 Note : () = Negative, PS=Pradheshiya Sabha Source: Mission estimates.

Appendix 15
80
QUANTITATIVE ASSESSMENT OF OVERALL PROJECT PERFORMANCE
Table A15.1: Overall Rating
Criteria Assessment Rating(0–3)
Weights(%) Weighted Rating
Relevance Highly relevant 3 20 0.60 Effectiveness Effective 2 30 0.60 Efficiency Efficient 2 30 0.60 Sustainability Less likely 1 20 0.20 Overall Rating Successful 2.00
Notes: Relevance. Project objectives and outputs were highly relevant to strategic objectives of the government and the Asian Development Bank on poverty reduction. Effectiveness. Although the credit component achieved less than the target due to reallocation of funds, the project achieved its revised targets and objectives with additional outputs. Efficiency. Even though the project had initial delays, project achieved objectives in an efficient manner by implementing additional works. Sustainability. Project benefits and development impacts are sustainable, but maintenance of project assets needs more attention. Source(s): Project completion review mission.
Table A15.2: Rating System
Rating Value Relevance Effectiveness Efficiency Sustainability 3 Highly relevant Highly effective Highly efficient Most likely 2 Relevant Effective Efficient Likely 1 Partly relevant Partly effective Partly efficient Less likely 0 Irrelevant Ineffective Inefficient Unlikely
Notes: Greater than 2.5 = highly successful, 1.6–2.5 = successful, 0.6–1.6 = partly successful, and less than 0.6 = unsuccessful. Source(s): Project completion review mission.