Land use changes in the city hinterland: A Bengaluru case study
Upload
khangminh22Category
view
0download
0
Proposition Multimodal
Hinterland Connections
February, 2016

Content
• Proposition 3
• Introduction to multimodal hinterland logistics 6
• Why provide flexible multimodal hinterland solutions? 16
• Multimodal hinterland connections expertise in the Netherlands 19
• Innovation in multimodal hinterland connections in the Netherlands 25
• Dutch solutions: Hinterland IT platforms 37
• Dutch solutions: Hinterland IT solutions 42
• Dutch solutions: Multimodal logistics services 45
• Dutch solutions: Mutlimodal control towers 48
• Multimodal hinterland logistics analysis target markets 53

Proposition

Proposition Multimodal Hinterland Logisticsto logistics chain operators
“Dutch Multimodal Hinterland Logistics solutions enable your
service organization to improve asset availability and reliability,
and reduce operational costs through intelligent and optimized
planning, direction and execution of multimodal transport flows “

Proposition Multimodal Hinterland Logisticsto shippers
“Dutch Multimodal Hinterland Logistics solutions enable your
organization to improve customer satisfaction by increased
reliability, and reduce operational costs through intelligent and
optimized planning, direction and execution of multimodal transport
flows .”
Introduction to multimodal
hinterland logistics

• Combination of at least two means of transport
• Integrated transport chain for bulk and container transport
• Main characteristics
• Standardized and reusable loading units in case of intermodal container transport
• Transshipment terminals for cargo handling between short-distance and long-distance
traffic
What is multimodal transport?

• European development of nine "Core
network corridors" with public and
private resources. Focus on EU support
from the Connecting Europe Facility for ,
infrastructure investments that:
• remove bottlenecks
• build missing cross-border connections
• promote modal integration and
interoperability
• Three TEN-T corridors connect the
Netherlands to Europe
• North Sea-Mediterranean
• North Sea-Baltic Corridor
• Rhine-Alpine Corridor
TEN-T Connecting EuropeInfrastructure investments in multimodal corridors and connections

EU focus on hinterland transportdeveloping innovative multimodal solutions
• EU White paper “Roadmap to a Single
European Transport Area” 2011
• Focus: Optimizing the performance of
multimodal logistic chains, including using
more resource-efficient modes like rail and
barge transport more frequently.
• Targets in EU White Paper:
• 60% reduction of emissions in 2050
• 2030: 30% of transports > 300 km by barge
or rail transport
• 2050: 50% of transports > 300 km by barge
or rail transports

• Port of Rotterdam: nr. 1 in Europe Increased cargo flows calls for
optimized multi/intermodal solutions.
• 2015: Maasvlakte II, adding 600 ha containers transshipment facilities
Challengesin multimodal and intermodal hinterland connections

• The Netherlands: more
than 300 rail cargo
services to other EU
destinations
• The Netherlands rail cargo
sector is liberalized : more
than 20 rail transport
operators make rail cargo
transport competitive.
• Dedicated Betuwe railway
line from Rotterdam to
Germany
Multimodal rail cargo networkIntermodal rail hinterland connections

• The Netherlands: largest
inland waterway barge fleet
in Europa
• The Rhine is main
international waterway, but
whole of Netherlands is
crisscrossed by rivers and
canals.
• More than 100 million tons
annually crossing the
Dutch-German border by
inland waterway
Multimodal inland barge networkInland waterway hinterland connections

Dutch focus on inland waterways transportmultimodal solutions
Source Binnenvaart.eu / STC-group
Connected to main European
waterways: Rhine, Meuse, Moselle,
Danube, and canal system NW
Europe
Business:
> 50% of European barge fleet
registered in the Netherlands
Strong cluster maritime industry
Financial infrastructure for inland
shipping with specialized banks
Internationally oriented shipping
industry
Innovation cluster in IT, ship
design, shipbuilding and
intermodal networks
High quality education specialized
in inland shipping

Multimodal hinterland connectionsIntermodal corridors; an example from Rotterdam to the hinterland
Choices for
transport from port
of Rotterdam to end
customer:
• Using road, rail or
inland waterway
transport
• Using port of
Moerdijk as
transshipment
hub
• Intermodal
solutions

How to improve use of intermodal transport, and increase customer service?
The answer is in Innovation: Synchromodal transport. Logistics service
provider has ability to switch without effort between different modalities =
optimal, effective and sustainable utilization
Objective: Improved transport system:
• Increased reliability
• Increased predictability
• Cost efficiency
• Quality
• Sustainability
• Speed
Innovation in:
• Bundling
• Decision horizon
• Flexibility
• System approach
Multimodal hinterland connectionsInnovation: synchromodal transport solutions

Multimodal network collaborationEssential: sharing transport information in network from ports to
operators to hinterland hubs

Why provide flexible
multimodal hinterland
solutions?

Benefits of using multimodal hinterland solutions
Optimal use of transport
modality networks in Europe
Savings in costs and decreased
pressure on the environment by
combining different modalities
New logistics knowledge and
new profitable business activities
(incl. new jobs);

Hinterland connections
Shippers: A-modal bookings!
• Lower Price
• Fixed Time of delivery
• Higher Quality (safety, sustainability)
Logistic service provider:
• Optimization of assets
• Increased frequency of services
• Flexibility between modalities
Synchromodal innovation:
• a-modal booking for shippers
• Capability of IT systems
• Intermodal Infrastructure
• Contracts flexible
• Network business models
• Trust: mental shift required
Intermodal innovations and solutionsSynchromodal transport: intermodal transport in an optimal way

Multimodal hinterland
connections expertise
in the Netherlands

The Netherlands = Logistics
Geographical position as gateway to
Europe
Excellent Mainports (Rotterdam,
Schiphol/Amsterdam)
Excellent hinterland connections
(road, rail, barge, shortsea)
Logistics Service Providers (1PL-4PL)
Legislative framework & customs
High level of knowledge:8 research universities and 11 Universities
of Applied Sciences specialized in logistics,
Logistics/transport sector essential for Dutch GDP (2012):
65 billion euros (10% of GDP); 813,000 jobs (12% of Dutch workforce)

Multimodal hinterland service expertisethe Netherlands
Type of company Supply chain role Examples in the Netherlands
Carrier Haulage Services by shipping
companies
Maersk, MSC
Merchant Haulage Services by forwarders/ LSPs Seacon
Terminal Haulage Services by deep sea terminals
or inland terminals
ECT, BCTN
Rail/barge Haulage Rail or barge operators Alcotrans, Contargo
Network Haulage Services by 4PLs Wayz
Developed by different kind of service providers and some examples of companies active
in intermodal and synchromodal transport in the Netherlands

Focus on Inland waterway innovations
Ambition:
Accommodate high quality barge
transport as alternative for road transport
Projects in 3 clusters: sharing
information, Co-operation in logistics
chains and reliable voyage times
Improve logistic networks for ports and
hinterland destinations
133,000 TEU transferred from
road to waterways saving 12.8 million
KM’s by road and a reduction of 6,500
tons of CO2.
Sharing of (digital) information and cooperation in the logistics chain, more
appealing inland navigation (non-polluting, fast and safe) and reliable voyage times
and preparing the inland navigation sector for a growth in cargo transportation,
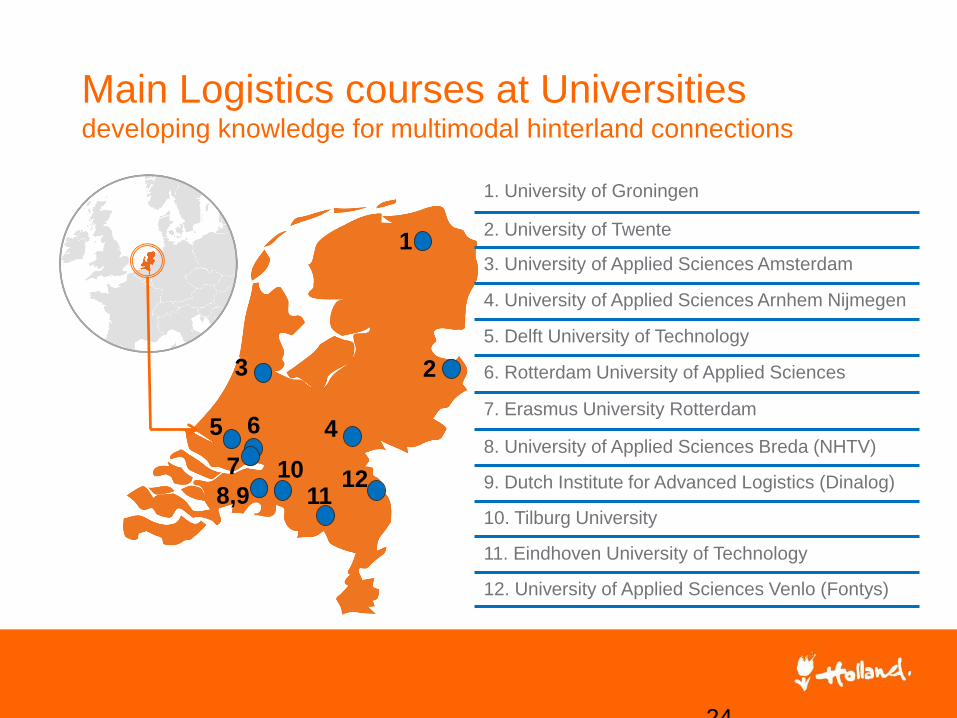
Main Logistics courses at Universitiesdeveloping knowledge for multimodal hinterland connections
24
1. University of Groningen
2. University of Twente
3. University of Applied Sciences Amsterdam
4. University of Applied Sciences Arnhem Nijmegen
5. Delft University of Technology
6. Rotterdam University of Applied Sciences
7. Erasmus University Rotterdam
8. University of Applied Sciences Breda (NHTV)
9. Dutch Institute for Advanced Logistics (Dinalog)
10. Tilburg University
11. Eindhoven University of Technology
12. University of Applied Sciences Venlo (Fontys)
1
2
5 6
7
1110
8,9
3
4
12

Innovation in multimodal
hinterland connections in
the Netherlands

Dutch Collaboration for economic competitiveness
Logistics is one of the nine priority sectors in Dutch economic policy. Government,
business and academia work together to increase competitiveness, in business
climate, education, infrastructure and innovation.
Ambition of logistics priority sector
In 2020, the Netherlands holds an
international top position
1. in handling transport flows through the NL,
2. as supply chain coordinator of international
logistic activities and
3. as a country with an attractive innovation
and business climate
Logistics priority in economic policy

1.
Open innovation
2.
Public private partnerships:
triple helix collaboration
3.
Supply chain collaboration
and coordination
Dutch collaborative innovation in logistics

National innovation program in logistics
The National Innovation program of the economic priority sector Logistics in the Netherlands
focuses on six innovation roadmaps, in which innovation is driven and carried out by all partners in
the supply chain.
1. Neutral Logistics Information Platform
2. Trade compliance and border management
3. Synchromodality
4. Cross Chain Control Centers
5. Service Logistics
6. Supply Chain Finance
The set up and use of multimodal hinterland connections, including synchromodal innovations, has
been recognized as one of the internationally competitive areas of the Netherlands, with further
development potential. Resources have been allocated to advance this competitive position even
further.
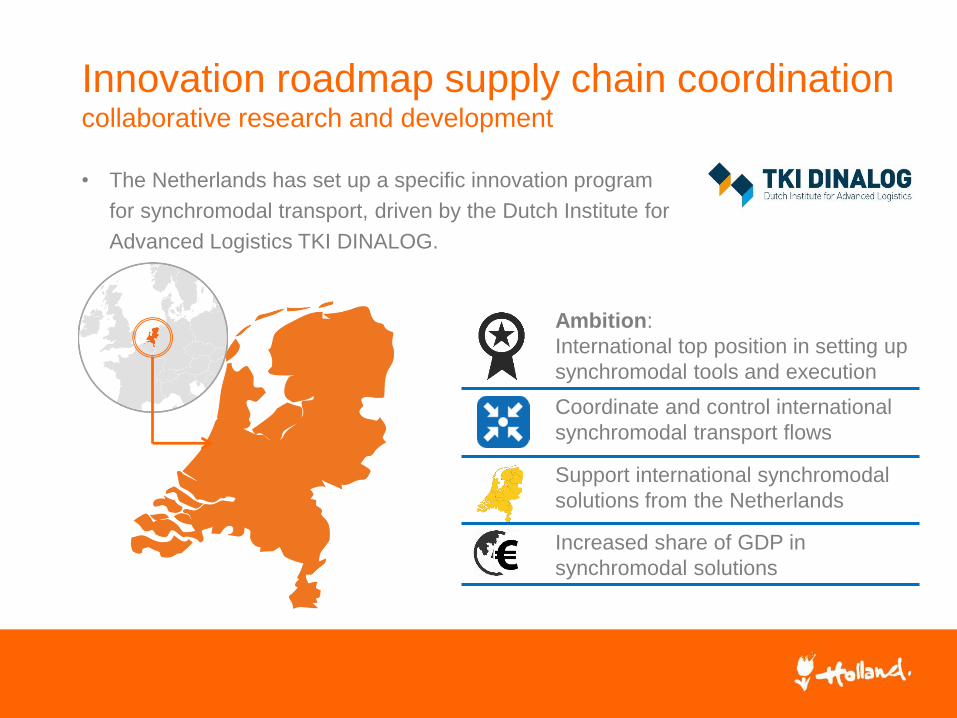
• The Netherlands has set up a specific innovation program
for synchromodal transport, driven by the Dutch Institute for
Advanced Logistics TKI DINALOG.
Innovation roadmap supply chain coordinationcollaborative research and development
Ambition:
International top position in setting up
synchromodal tools and execution
Coordinate and control international
synchromodal transport flows
Support international synchromodal
solutions from the Netherlands
Increased share of GDP in
synchromodal solutions

Innovation roadmap synchromodal transportCore activities
Set up and
Implementation
• Innovation of
synchromodal
concepts
• Shippers and
logistics service
providers
Improving IT tools
• Set up of control towers
• Advanced planning tools
• Automated synchromodal
booking platforms
Orgware
• Mental shift at companies
• Distributed business community system
• National collaboration networks
• Regional synchromodal hotspots

Innovation project ULTIMATEDeveloping efficient multimodal hinterland networks for smooth transport
ECT Participations BV, Port of Rotterdam NV, Modality Software Solutions BV, PORTB ASE BV, KEYRAIL BV, Port of Amsterdam, Brabant Intermodal BV, NV Region Venlo, Erasmus University Rotterdam, Eindhoven University of Technology
• An Extended Gate principle for
use in the hinterland, where
multi-modal choices can again
be made, releasing the
operational and administrative
bottlenecks in sea ports by
optimal use of information..
• Incorporation in supply chains
• Multimodal network design
• Port authority involvement
• Legal transport position of
terminals
• Software algorithm for efficient
planning in case of disruptions
• Potential cost reduction of 1
million euros

Innovation project SALOMOSituational Awareness for LOgistic Multimodal Operations in container supply chains and networks
TRAIL Research School, TU Delft, Open University, University of Maryland, TBA, In There, Rotterdam World Gateway, APM Terminals Maasvlakte 2, TeamSupport
• Higher volumes, larger transport-
tation sizes, dynamics in the sea
and hinter-land connections
hinder effective planning and
decision making
• develop and enhance understan-
ding of situational awareness,
• develop and test training suite for
planners and decision makers to
plan based on a holistic shared
situational awareness and in a
more collaborative fashion.
• model for situational awareness
and collaboration in supply chain
planning and decision making;
• toolbox and training suite for
planning and decision making;

Innovation project SIEEGSecure Information Exchange Extended Gate
• Improving efficiency in hinterland
operations by an innovative
methods along the entire
logistics chain of main ports.
• Public extended gate solution at
hinterland terminal with comple-
tely computerized gate proces-
sing and OCR empowered
visual gate at the hinterland
terminal ensures extra safety
and speed in the operation.
• 24/7 access to relevant data on
handling and transport of goods
• Throughput time for registration,
security and safety reduced from
15 minutes to 65 seconds
• 32% Reduction CO2 emissions

Innovation project SIEEGSecure Information Exchange Extended Gate
• Reinforce the logistic chain and
enable synchromodal transport
to support an efficient, sustaina-
ble and reliable handling of the
increasing flow of goods from
mainports of Antwerp and Rot-
terdam through inland terminals
to the European hinterland.
• Real-time insight and influencing
supply chain events with syn-
chromodality decision support
• Enriched real-time datasets as
input for decision support tool for
synchromodal transport service
• Stretch delivery window by 50%
• Webbased API for SPoT-platform

Innovation project Modal Shift in Total Logistics
• Collaboration between shippers,
service providers and inland
terminal with corresponding
inland shipping links from and to
Rotterdam and Antwerp.
• Realize an integrated method
through the establishment of a
Synchromodal Service Center
with integrated control function
• Integration of multi-actor order
management layer in information
system for paperless information
exchange facilitating optimal
operational decisions with
greater modal split opportunities
barge/rail and improved import
and export exchange

Innovation project Synchromodal IT
Universiteit Twente (UT), Thales Nederland B.V., Combi Terminal
Twente (CTT), Post-Kogeko Logistics, CAPE Groep, NexusZ
Hengelo, ARCADIS, Simacan, OV Software
Addressing the need for:
• unified European logistic network
• improving efficiency and sustai-
nability of logistics services
• the “mental switch” among
shippers and 4PLs, towards
synchromodality.
• Design of synchromodal logistics
network model and integrated
service platform;
• Development of planning and
scheduling policies and decision
support through serious gaming.
• IT, operations research
techniques, and serious gaming
for synchromodal planning.

Dutch solutions:
Hinterland IT Platforms
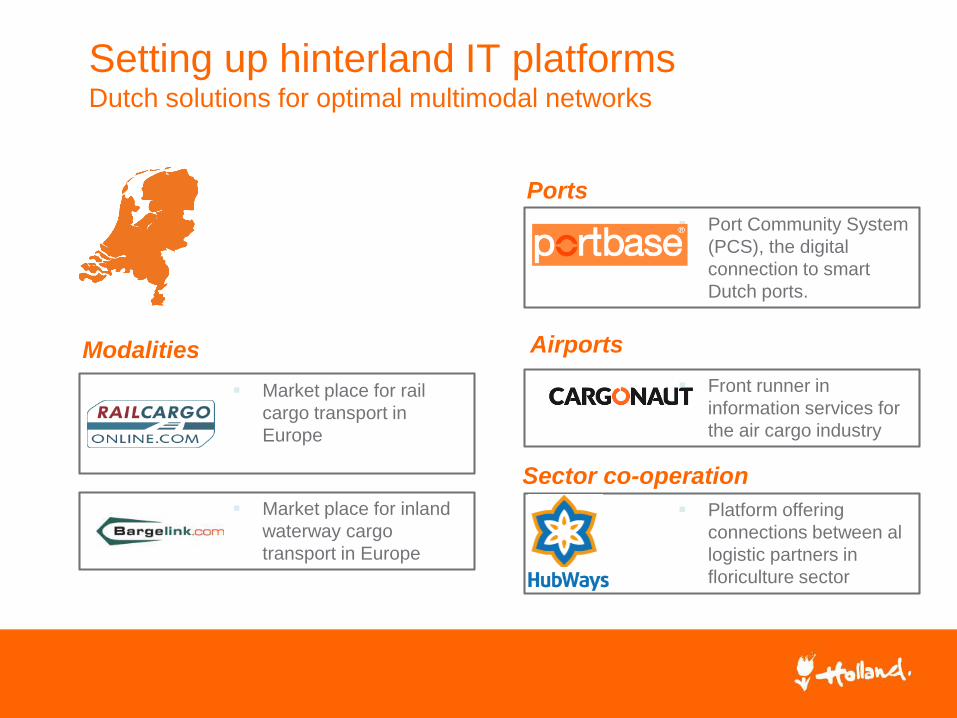
Modalities
Market place for rail
cargo transport in
Europe
Market place for inland
waterway cargo
transport in Europe
Port Community System
(PCS), the digital
connection to smart
Dutch ports.
Ports
Front runner in
information services for
the air cargo industry
Platform offering
connections between al
logistic partners in
floriculture sector
Setting up hinterland IT platformsDutch solutions for optimal multimodal networks
Airports
Sector co-operation

Nextlogicplatform optimizing freight flows in the hinterland network
Nextlogic is a project of the Port of
Rotterdam Authority, the Ministry of
Transport, deep sea terminals,
depots, barge operators/inland terminals
and shipping companies
Unreliable and unpredictable turnaround
time of barges at deep sea terminals,
inefficient use of the quays, cranes and
barges, too many (small) sea port calls.
Information exchange plus the Port
Community System based on neutral
integrated planning, call optimization and
performance measurement.
Extensive cooperation between all
logistics chain parties.
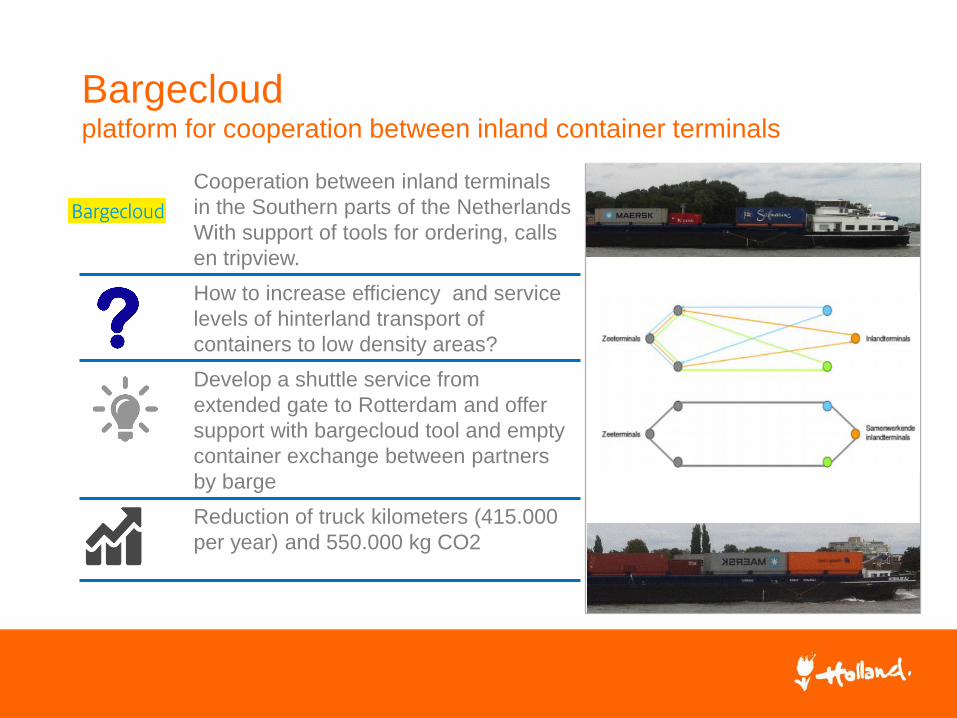
Bargecloudplatform for cooperation between inland container terminals
Cooperation between inland terminals
in the Southern parts of the Netherlands
With support of tools for ordering, calls
en tripview.
How to increase efficiency and service
levels of hinterland transport of
containers to low density areas?
Develop a shuttle service from
extended gate to Rotterdam and offer
support with bargecloud tool and empty
container exchange between partners
by barge
Reduction of truck kilometers (415.000
per year) and 550.000 kg CO2
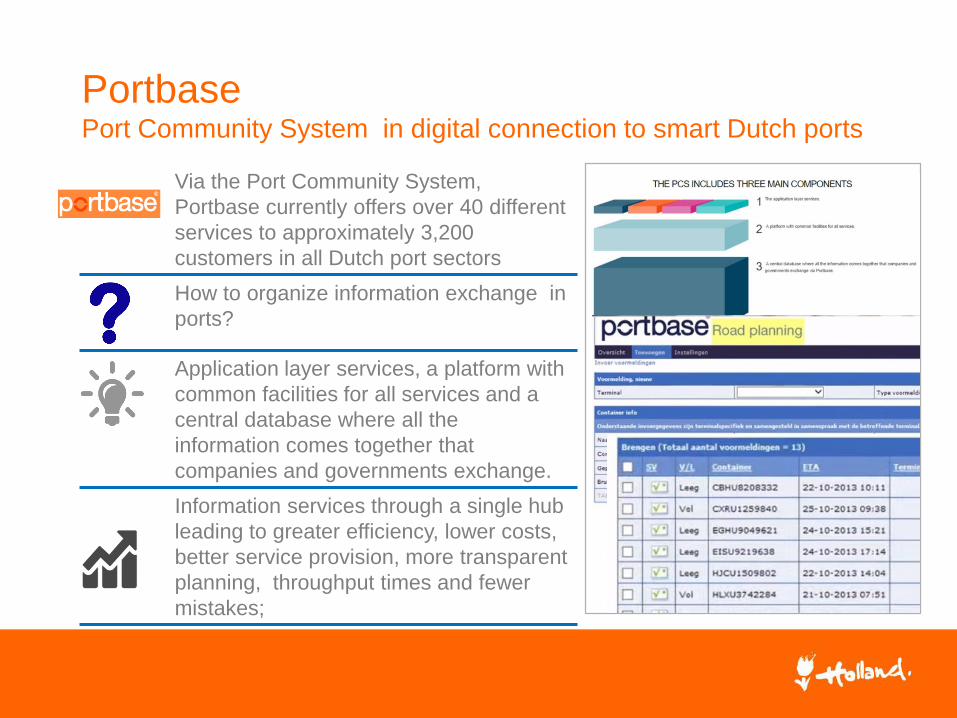
PortbasePort Community System in digital connection to smart Dutch ports
Via the Port Community System,
Portbase currently offers over 40 different
services to approximately 3,200
customers in all Dutch port sectors
How to organize information exchange in
ports?
Application layer services, a platform with
common facilities for all services and a
central database where all the
information comes together that
companies and governments exchange.
Information services through a single hub
leading to greater efficiency, lower costs,
better service provision, more transparent
planning, throughput times and fewer
mistakes;

Dutch solutions:
Hinterland IT solutions
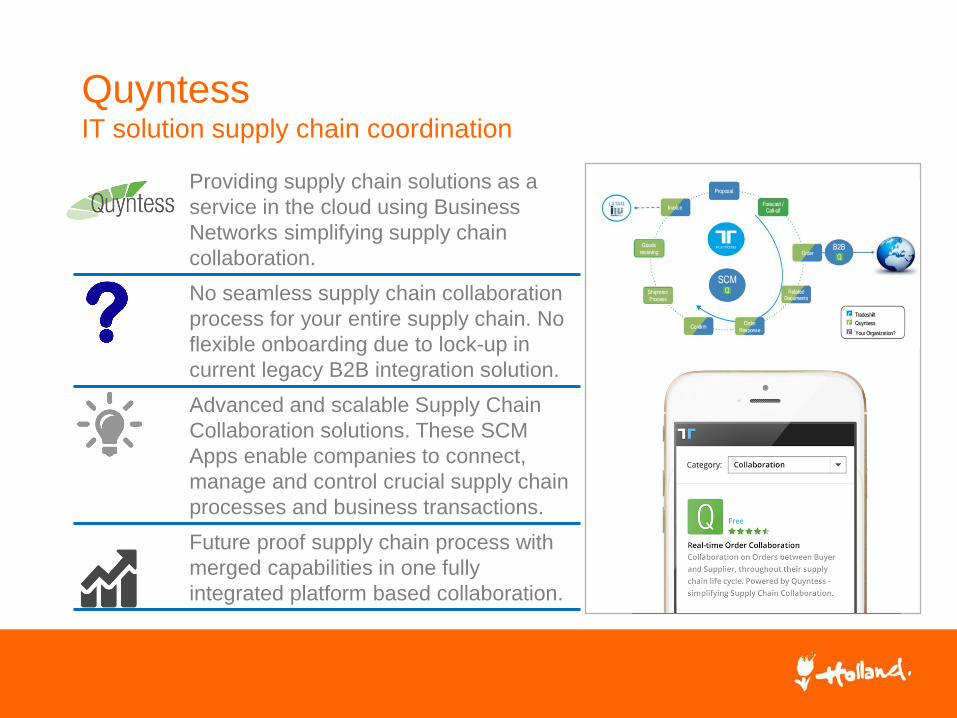
QuyntessIT solution supply chain coordination
Providing supply chain solutions as a
service in the cloud using Business
Networks simplifying supply chain
collaboration.
No seamless supply chain collaboration
process for your entire supply chain. No
flexible onboarding due to lock-up in
current legacy B2B integration solution.
Advanced and scalable Supply Chain
Collaboration solutions. These SCM
Apps enable companies to connect,
manage and control crucial supply chain
processes and business transactions.
Future proof supply chain process with
merged capabilities in one fully
integrated platform based collaboration.

Covademoptimal use of water depth of rivers with up to date data
IT solution provider of cooperative
navigable inland waterways
depth measurements
How to predict the actual water depths
of the route to be navigated and support
inland vessels to make maximum use of
the navigable area.
Vessel system to read the water depth
data from existing sensors and send this
to shore. The keel clearance is
converted into the actual water depth of
the route being navigated, made
available to shipmasters
5-10% better use of load capacity of the
vessels navigating on rivers

Dutch solutions:
Multimodal logistics
services

European Gateway Services (EGS)synchromodal logistics servies to the European hinterland
EGS offers high frequent rail and barge
connections between Rotterdam and an
integrated and rapidly expanding network
of inland terminals in the European
hinterland.
How to synchronize multimodal transport
from deepsea port to the hinterland?
EGS offers the synchromodal
organisation of hinterland transport. For
each trip, the modal choice (rail, barge,
feeder, truck) is based upon the most
efficient and sustainable solution.
Shorter lead times, reliable transport,
carbon reduction

Synchromodal service Rotterdam-Tilburgsynchromodal service in hinterland transport
MCT: inland terminal located midway
between Rotterdam and Antwerp
Railport Brabant/BTB: trimodal terminal
located in logistic hotspot Tilburg
How to optimize transport from deepsea
port to the hinterland?
Mode free booking of container transport
from seaport to warehouses in Tilburg
trough a synchromodal cooperation with
terminal operators, transport services
and shippers
Number of truck trips with containers is
reduced with 50% resulting in an
improvement of the carbon footprint with
250 tons per year

Dutch solutions:
Multimodal control towers

Multimodal planning IT solutionsDutch solutions: control towers realising efficient synchromodality

WayzSynchromodal control tower
Wayz researches/surveys logistics flows,
advises optimization of logistic
processes, and supports shippers and
logistic service providers to implement
innovative and sustainable projects.
How to manage strong growth in
container transport from deepsea port to
cooled warehouses in the region?
The Wayz Control Tower facilitates
increased synchromodal transported
refrigerated containers between the
Maasvlakte and Westland.
Peak shaving, simpler use of inland
shipping, improved response to future
demands of terminals and 18 tons
reduction of CO2 emissions in 2014

Seacon and CAPESynchromodal Control Tower for successful synchromodal planning
CAPE Groep supports the optimization
of logistic operations and management
and collaboration in logistic chains.
Seacon Logistics is leading logistics
chain director and leading in applying
the multimodal transport concept.
How to support synchromodal planning
and solutions in a control tower?
Control to support synchromodal
services. Combination of maritime and
continental freight flows from and to
Spain, Germany, Poland, Italy.
Modal shift of 10.000 TEU per year
resulting in a reduction of CO2
emissions of 1900 tons

Greenway Logistics/ Ewals LogisticsControl tower solution supply chain coordination
Ewals operates as a Lead Logistics
Provider (LLP) and manages total
logistics flow. Greenway is active in
mediation, buying and selling of logistic
services, developing logistic concepts,
IT, advice and consultancy.
How to increase the efficiency of
shipments from various Chinese
suppliers to individual Dutch stores?
Design and realization of central organi-
zation for "Bundling at source location“,
working IT SAAS platform and execution
for inbound transports from Shengzhen.
Reduction of handling costs of 30-40%
Reduction of distribution costs of 7%
Reduction in lead times

Multimodal hinterland
logistics
analysis target markets

Global developmentsfreight markets
Source: Freightxtension (2014)

Neighbouring countries Fast growing markets Developing markets
Target markets multimodal hinterland
connections - selection

European markettrends & developments
1. Vertical integration: when carriers and shippers increase profit pools by "conquering" additional parts of the
value chain
2. Yield Decline as shippers and carriers seek to exploit volatile freight rates to protect their own profit margins
3. Modal split as demand shifts from air freight to predominately ocean and, increasingly, rail to reduce costs
of supply chains
4. Volatility of freight rates is increasing and demands greater sophistication in steering hedged capacities
5. Specialization and value added services become key USPs as complex supply chains will call for
specialized logistics service providers
6. Industry specific solutions increasingly key, both in terms of IT and know-how, to meet complex customer
demands
7. Shift in the trade landscape with legacy trade lanes losing importance – emerging markets are new major
trading nations
8. Hinterland connections efficiency is of increasing importance – and even an entry condition for business
with Chinese shippers
9. Contract logistics – challenges from the tendency toward shorter contract lifecycles will increase hurdles to
achieve an appropriate ROI
10. Globalization vs. regionalization: demand will either grow for "global total solutions" or revert back to
regionalization
Source: Fraunhofer SCS, 2015 & Roland Berger 2014

Germanyoverview
Fast facts
GDP 2014 (Bill. Euro) 3.502
GDP per Capita (Euro) 36.107
Population 2014 (Mill.) 81
Rail network (km in 2009) 33.446
Road network (km in
2011)643.702
Source: WTO and WB

Germanymarket size & development
Source: Roland Berger 2014 Source: Fraunhofer SCS, 2014

Germanylogistics service providers
Most of the largest logistic players in
Germany do also have their
headquarters in Germany. Only
UPS, GeoPost and K+N have their
HQ abroad.
The combined top 10 turnover is just
over Euro 30 bn. and equals about
13% of the total German market.
Source: Fraunhofer SCS, 2015

• As the evolution of Germany as a logistic location is highly dependable on the
economy, the positive GDP forecast will also lead to increasing importance.
• Despite its well developed logistics infrastructure, investments are urgently
needed, especially on ports to prepare for larger container vessels , rail to solve
several bottleneck and road which in places over-crowded.
• Because of a lack of funding prioritizing (new) infrastructure projects is needed.
Germanytrends and challenges
Source: Fraunhofer SCS, 2015 & Roland Berger 2014
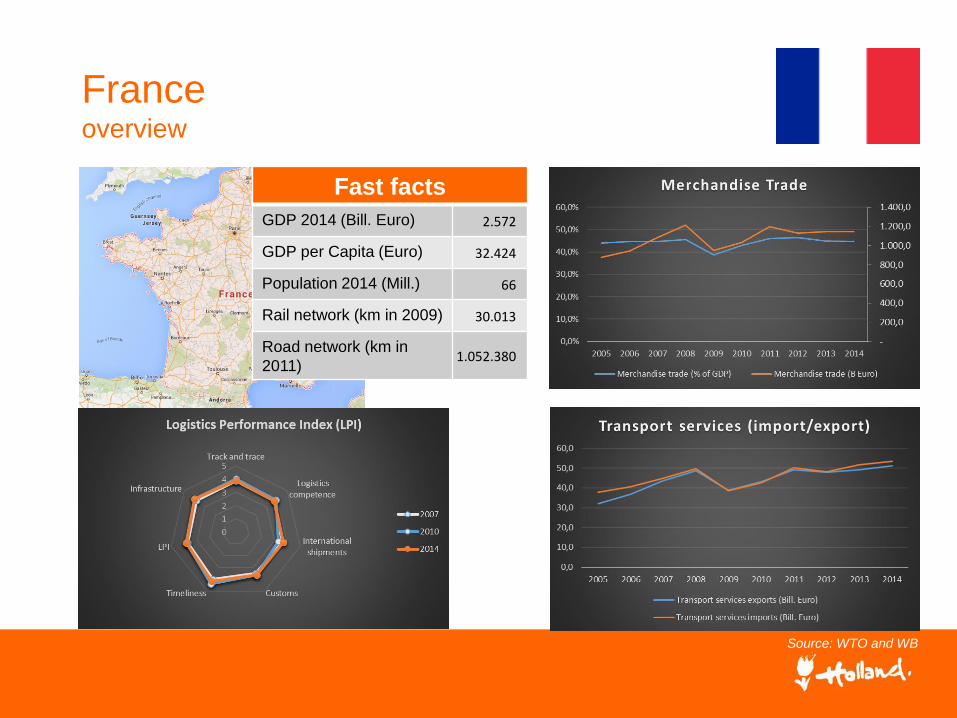
Franceoverview
Source: WTO and WB
Fast facts
GDP 2014 (Bill. Euro) 2.572
GDP per Capita (Euro) 32.424
Population 2014 (Mill.) 66
Rail network (km in 2009) 30.013
Road network (km in
2011)1.052.380

Francemarket size & development
Source: Roland Berger 2014

Francelogistics service providers
Source: Fraunhofer SCS, 2015
The France logistics market is
dominated is by French
companies. The top 5 only
contains French LSP’s which are
supported by a protective
government. As in many countries
the national railway company
leads the list.

• The national government is demanding increasing awareness of the environment
in logistic. For example a leading initiative is “Distripolis”, a city logistics concept
executed by Geodis on now rolled out to many French and maybe other
European cities.
• In 2017 the new channel Seine-Nord (CSNE) will be opened offering an
alternative freight route between Paris/ La Havre and Belgium/ Netherlands/
Germany
• Next to increasing awareness French government also stimulates alternative
freight transportation with the aim to reduce road freight transport.
Francetrends and challenges
Source: Fraunhofer SCS, 2015 & Roland Berger 2014

Chinaoverview
Source: WTO and WB
Fast facts
GDP 2014 (Bill. Euro) 9.418
GDP per Capita (Euro) 150
Population 2014 (Mill.) 1.364
Railnetwork (km in 2009) 66.298
Roadnetwork(km in 2011)4.106.38
7

Chinahinterland connections
Especially in the regions with
newly added logistics centers
new roads will increase the
need for transportation and
logistics.

Chinahinterland connections
2010 % total 2011 % total 2012 % total
Road 24.481 76% 28.201 76% 31.885 78%
Rail 3.643 11% 3.933 11% 3.904 10%
Air 6 0% 6 0% 6 0%
Water 3.789 12% 426 1% 4.587 11%
Pipeline 500 2% 571 2% 612 1%
Total 32.418 100% 36.970 100% 40.994 100%
Freight traffic in China
(million tonnes)
Source: Fung Business Intelligence Centre, 2013
• Road: Road transport is the major freight transport mode in China. In 2012, over 75% of cargo is
transported by road. About one-third of transport costs in China are road tolls. Excessive highway
tolls and price increases of fuel and labour reduce profitability of logistics companies considerable
• Rail: The Chinese Railway has been reformed in 2013 by introducing the China Railway
Corporation (CRC) which is now responsible for all commercial activities. Some of most important
changes are; a cargo plan is no longer required, handling charges are standardized, there are
more business resources for handling high-value products and daily necessities and door to door
service (instead of only station to station) is now available
• Inland waterways: With a navigable length of 123,495 km, China’s inland water transport network
is the largest in the world in length and in volume of cargo. It consists of more than 5,000 rivers,
of which the 6,300-km Yangtze and its tributaries is the longest

Chinamarket size & development
Source: Roland Berger 2014
Despite Chinese extraordinary
success, China’s transportation
and logistics industry as a whole
remains in the early stage of
development

Chinalogistics service providers
Nr. Name
Revenue (Euro) Million
1 China ocean shipping (group) corporation, 14.946
2 Sinotrans changhang group co., LTD., 10.232
3 China Shipping (group) corporation 6.372
4 Kailuan group international logistics co., LTD. 3.925
5 China material storage and transportation corporation 2.535
6 Xiamen xiangyu group co., LTD. 2.426
7 China railway materials group co., LTD. 2.012
8 Yizhong energy fengfeng group Hangdan Dingfeng logistics co., LTD., 1.594
9 Chinese oil and gas transportation company 1.430
10 Henan coal chemical industry group the kingdom dragon logistics co., LTD. 1.259

• Especially in the regions with newly added logistics centers new roads will
increase the need for transportation and logistics.
• Companies’ distribution models are moving from dealership models to multi-
channel and direct sale models requiring higher density network with quicker
response times
• Low carbon rules will force transportation and logistics companies to make
environmental protection a primary goal
• Chinese shipping companies increasingly viewing logistics as strategic area that
can provide key competitive advantage and therefore setting higher requirements
on service levels and offerings.
Chinatrends and challenges
Source: Fraunhofer SCS, 2015 & Roland Berger 2014

Colombiaoverview
Source: WTO and WB
Fast facts
GDP 2014 (Bill. Euro) 343
GDP per Capita (Euro) 4.234
Population 2014 (Mill.) 48
Rail network (km in 2009) 1672
Road network (km in
2011)214.433

Colombiahinterland connections
Source: JLL Research (2015)
• Bogotá’s El Dorado Airport is Latin
America’s busiest cargo airport.
• Colombia’s highway network is largely
outdated and in poor condition, heavy rains
complicate this problem
• Over 90% of all imports and exports are
transported by sea. Colombia’s largest port
is Buenaventura, (8,5m Tons) Other large
ports are; Cartagena (7,1m tons) Santa
Marta (3,3m tons) and Barranquilla (3.3m
tons)
• Colombia is investing until 2020 about USD
50 billion in improving infrastructure (26 for
road, 10 for railways, 8 for urban transport, 3
for port and 3 for inland waterways
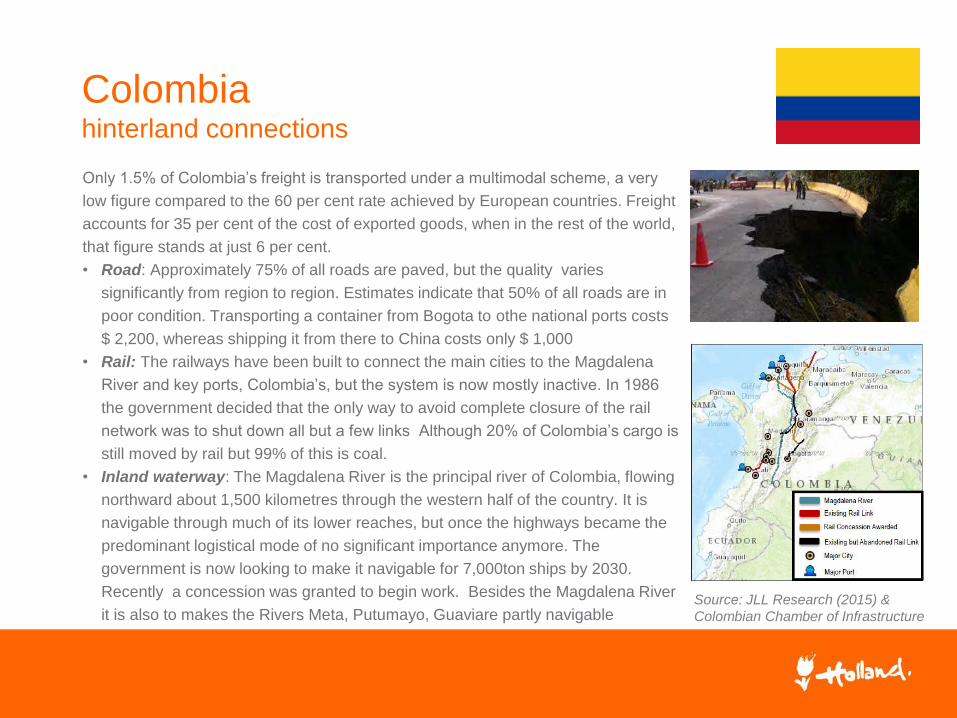
Colombiahinterland connections
Source: JLL Research (2015) &
Colombian Chamber of Infrastructure
Only 1.5% of Colombia’s freight is transported under a multimodal scheme, a very
low figure compared to the 60 per cent rate achieved by European countries. Freight
accounts for 35 per cent of the cost of exported goods, when in the rest of the world,
that figure stands at just 6 per cent.
• Road: Approximately 75% of all roads are paved, but the quality varies
significantly from region to region. Estimates indicate that 50% of all roads are in
poor condition. Transporting a container from Bogota to othe national ports costs
$ 2,200, whereas shipping it from there to China costs only $ 1,000
• Rail: The railways have been built to connect the main cities to the Magdalena
River and key ports, Colombia’s, but the system is now mostly inactive. In 1986
the government decided that the only way to avoid complete closure of the rail
network was to shut down all but a few links Although 20% of Colombia’s cargo is
still moved by rail but 99% of this is coal.
• Inland waterway: The Magdalena River is the principal river of Colombia, flowing
northward about 1,500 kilometres through the western half of the country. It is
navigable through much of its lower reaches, but once the highways became the
predominant logistical mode of no significant importance anymore. The
government is now looking to make it navigable for 7,000ton ships by 2030.
Recently a concession was granted to begin work. Besides the Magdalena River
it is also to makes the Rivers Meta, Putumayo, Guaviare partly navigable

• The gap between business conditions (as expressed by market compatibility) and
Colombia’s market size, growth attractiveness and connectedness is striking.
• Despite increased investment in developing road infrastructure and defining an
institutional structure, Colombia needs to diversify its transportation modal matrix
(including rail and river transport) and optimize the use of its logistics assets
Source: Agility Emerging Markets Logistics Index, 2015
Colombiatrends and challenges
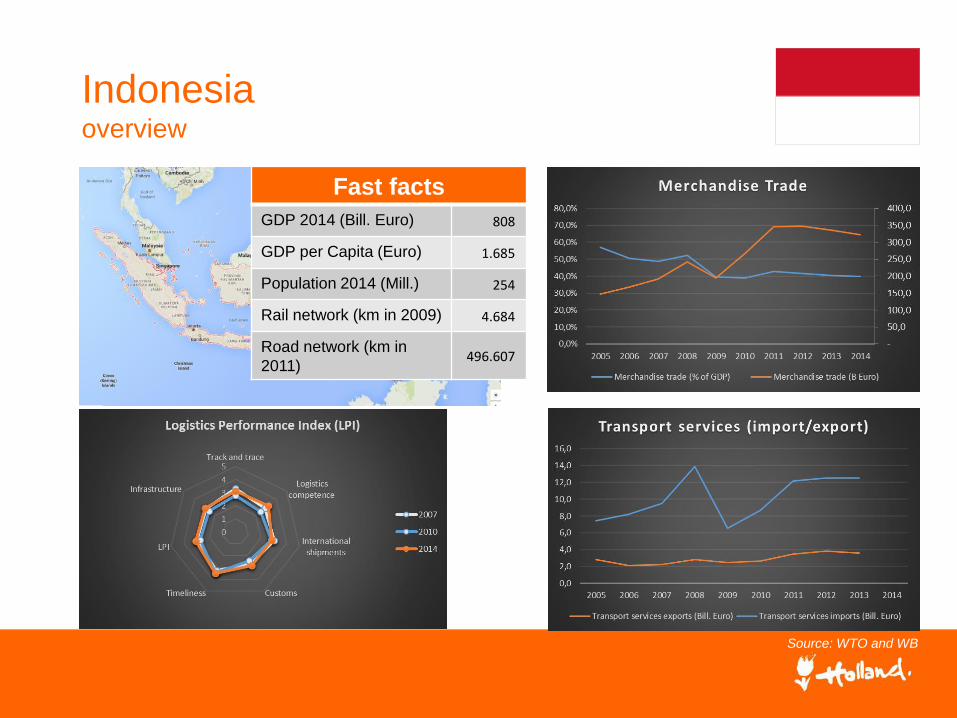
Indonesiaoverview
Source: WTO and WB
Fast facts
GDP 2014 (Bill. Euro) 808
GDP per Capita (Euro) 1.685
Population 2014 (Mill.) 254
Rail network (km in 2009) 4.684
Road network (km in
2011)496.607

Indonesiamarket size & development
Source: Indonesian Statistical Agency
Indonesiatrends and challenges
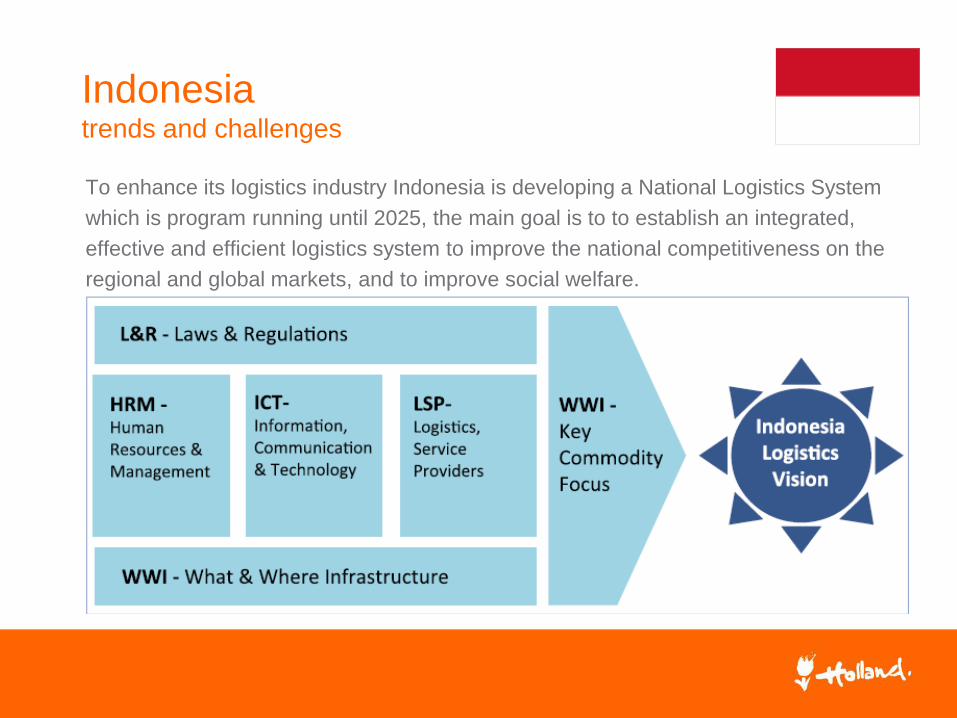
To enhance its logistics industry Indonesia is developing a National Logistics System
which is program running until 2025, the main goal is to to establish an integrated,
effective and efficient logistics system to improve the national competitiveness on the
regional and global markets, and to improve social welfare.

Indonesiatrends and challenges
Main goals:
• 2014-2015: Infrastructure
development among ASEAN
countries are expanded to
support the transportation &
logistics service in the region
• 2015-2020: ASEAN Logistics
Network Integration
• 2020-2025: Integrated Global
Logistics Network. Indonesia
will be connected to the
regional (ASEAN) and global
logistics systems via
International Hub Ports
Source: Frost & Sullivan Analysis

South Africaoverview
Source: WTO and WB
Fast facts
GDP 2014 (Bill. Euro) 318
GDP per Capita (Euro) 5.533
Population 2014 (Mill.) 54
Rail network (km in 2009) 20.500
Road network (km in
2011)-

South Africamarket size & development
Source: Stellenbosch University, 2015
South Africa has the largest economy in
Africa and is the most developed in Sub-
Saharan Africa with the most advanced
transport infrastructure. As a member of
the BRICS countries, South is recognised
as a key emerging market.
South Africahinterland connections
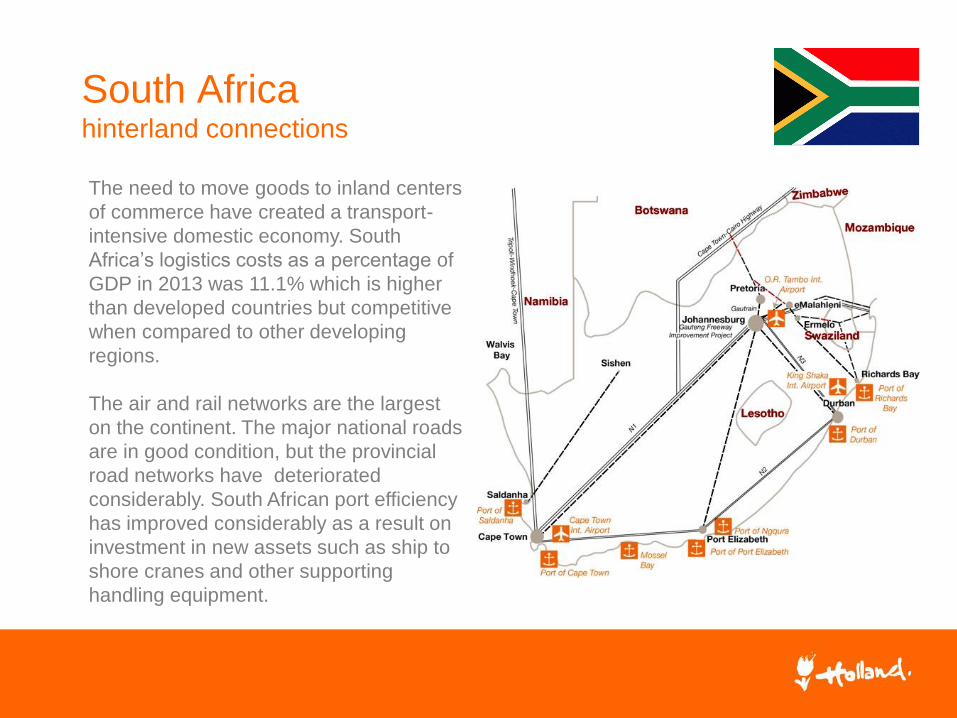
The need to move goods to inland centers
of commerce have created a transport-
intensive domestic economy. South
Africa’s logistics costs as a percentage of
GDP in 2013 was 11.1% which is higher
than developed countries but competitive
when compared to other developing
regions.
The air and rail networks are the largest
on the continent. The major national roads
are in good condition, but the provincial
road networks have deteriorated
considerably. South African port efficiency
has improved considerably as a result on
investment in new assets such as ship to
shore cranes and other supporting
handling equipment.

South Africalogistics service providers
• Barloworld: Barloworld Logistics is one of the leading logistics and supply chain
management businesses in southern Africa, with complementary operations in
China, the United Arab Emirates, Iberia, Germany and the United Kingdom.
• Jonen Freight (Pty) Ltd. is an independent South African owned company who
has been on the local market since 1979. They are one of the oldest of the
medium sized freight forwarders on the South African market today
• Logwin offers complete full service solutions. The service portfolio extends from
branch-appropriate supply chain management and warehousing through to
logistical value-added services to complete outsourcing projects. The business
segment Solutions thereby has a high level of competence in process control
and the development of customised IT solutions.
• Managed Freight developed an online freight management consultancy to
provide companies with an alternative to existing services and logistics service
provider selection. Most of our clients are small to medium businesses that
require support in their shipping department and do not have the volume to
negotiate preferable terms and rates.
www.logisticssouthafrica.org

South Africatrends and challenges
• In South Africa, there is much to be done about reducing the demand for
logistics – in other words reducing the kilometres travelled by each tonne,
how long it is stored and how often it is handled.
• A major objective is to achieve sustainable funding and maintenance for
the infrastructure used by each transport mode.
• Reducing the monetary cost of logistics is an important goal but equally
important is the reduction in societal costs such as emissions.
• More general Supply Chain challenges in S-A are:
– Improving service levels to customers
– Integration of technology
– Lowering procurement costs and reducing order lead times
– Improving visibility in the supply chain
– Improving the flow of business intelligence
– Aligning with key players in the supply chain.Source: Council for Scientific and
Industrial Research (CSIR), 2014 &
Stellenbosch University, 2015
Copyright © 2022 FDOKUMEN