Development of a chitosan–polyglutamate based injectable polyelectrolyte complex scaffold
Upload
khangminh22Category
view
0download
0
Collagen Scaffolds and Injectable Biopolymer Gels for Cardiac Tissue Engineering
by
Karen Kailin Ng
B.S. Materials Science and Engineering Northwestern University, 2006
SUBMITTED TO THE DEPARTMENT OF MATERIALS SCIENCE AND ENGINEERING
IN PARTIAL FULFILLMENT OF THE REQUIREMENTS FOR THE DEGREE OF
DOCTOR OF PHILOSOPHY IN MATERIALS SCIENCE AND ENGINEERING AT THE
MASSACHUSETTS INSTITUTE OF TECHNOLOGY
FEBRUARY 2012
© 2011 Massachusetts Institute of Technology. All rights reserved.
Signature of Author: ____________________________________________________________________
Department of Materials Science and Engineering October 21, 2011
Certified by: __________________________________________________________________________
Myron Spector Senior Lecturer, Mechanical Engineering
Professor of Orthopaedic Surgery (Biomaterials), Harvard Medical School Thesis Co-Advisor
Certified by: __________________________________________________________________________
Ioannis Yannas Professor, Polymer Science & Engineering
Thesis Co-Advisor Accepted by: _________________________________________________________________________
Gerbrand Ceder Professor, Materials Science and Engineering
Chair, Departmental Committee on Graduate Students

2
3
Collagen Scaffolds and Injectable Biopolymer Gels for Cardiac Tissue Engineering
by
Karen Kailin Ng
Submitted to the Department of Materials Science and Engineering On October 21, 2011 in partial fulfillment of the requirements for the degree of
Doctor of Philosophy in Materials Science and Engineering
Abstract
Three-dimensional biomaterial scaffolds have begun to shown promise for cell delivery for cardiac tissue engineering. Although various polymers and material forms have been explored, there is a need for: injectable gels that meet certain design specifications; a more in-depth characterization of the scaffold properties; and a deeper understanding of the relation of select properties to cellular behavior, to provide a rational basis for future in vivo studies.
The first objective of this thesis was to develop and characterize novel injectable biopolymer hydrogels capable of safely undergoing covalent cross-linking in vivo to provide a mechanically tunable nanofibrillar scaffold. Soluble type I collagen gels with genipin and transglutaminase cross-linkers, and gelatin-hydroxyphenylpropionic acid (Gtn-HPA) gels, the cross-linking of which are modulated by horse radish peroxidase and hydrogen peroxide, were investigated. The gels were characterized on the basis of rheological properties, resistance to degradation, and effects on stem cell behavior. Another objective was to evaluate the simultaneous differentiation of embryonic carcinoma cells (ECCs) incorporated in the gels into the three cell types in cardiac tissue—cardiomyocytes, neural cells, and vascular endothelial cells—and to determine the effects of certain properties of the gels on the differentiation profile, using mesenchymal stem cells as a comparative control. The injectable collagen-genipin and Gtn-HPA gels were found to be mechanically tunable hydrogel systems that supported cell encapsulation and proliferation at safe concentrations of the respective cross-linking agents. ECCs cultured as embryoid bodies (EBs) incorporated in the collagen-genipin and Gtn-HPA gels differentiated into cardiac, neural, and endothelial cells and combinations thereof, demonstrating the capability of EBs to express multiple cell lineages within the same EB. EBs cultured in collagen gels without cross-linkers and collagen gels with 0.25 mM genipin exhibited the highest differentiation efficiency compared to those cultured in monolayer, sponge-like scaffolds, and Gtn-HPA gels. The differentiation medium and culture time also had significant effects on differentiation efficiency. Notable findings included: the increased expression of neural and endothelial markers in EBs cultured in in mixed medium conditions compared to those cultured in neural or endothelial differentiation medium alone, and the correlation between angiogenic and neurogenic differentiation in the EBs in the non-cross-linked collagen gels for all media. Collectively, these findings show promise in using collagen gels cross-linked with 0.25 mM genipin, incorporated with EBs, for cellular therapy in cardiac tissue engineering applications. Thesis Advisor: Myron Spector Title: Senior Lecturer, Mechanical Engineering; Professor of Orthopaedic Surgery (Biomaterials), Harvard Medical School

4
5
Acknowledgments
The work presented herein could not have been accomplished without the help and guidance of numerous individuals, to whom I am deeply indebted.
First and foremost, I would like to express my sincere gratitude and thanks to my thesis advisor, Dr. Myron Spector, for the invaluable advice, guidance, and support over the years, not just on research and career paths, but also on life and relationships. Your enthusiasm, optimism, organization, wisdom, and creativity have been truly inspiring to me. I feel very fortunate that I was able to do learn from you and work in your research group.
To my thesis committee, Dr. Ioannis Yannas, Dr. Hemant S. Thatte, Dr. Krystyn Van Vliet, and Dr. Darrell Irvine – thank you for your guidance, ideas and support. It’s been a great experience learning from and interacting with all of you.
To the many people (past and present) in the VA Healthcare System Tissue Engineering group that have supported and helped me both in and outside of lab: Dr. Hu-Ping Hsu, Alix Weaver, Paul Elias, Cathal Kearney, Rahmat Cholas, Lily Jeng, Teck Chuan Lim, Daniel Macaya, Toh Wei Seong, Thomas Cheriyan, Hsi-Chin Wu, and Tzu-Wei Wang – thank you for your companionship, perspective, and encouragement. I enjoyed working with all of you and wish you the best in all you do.
To Dr. Simona Socrate at MIT, thank you for your assistance and insight with mechanical testing. To Dr. Xiu-Gui Lu at the VA Healthcare System at West Roxbury, thank you for your assistance with cell culture and western blot. To Dr. Gareth McKinley at MIT, thank you for your help with the rheological testing. To Patrick Boisvert at the Center for Materials Science and Engineering, thank you for your assistance with the ESEM.
To all my friends that have been an enormous source of encouragement, support, and joy in my life: Esther Cho, Doris Lin, Meredith Silberstein, Alisha Schor, Eugene Wu, Michelle Chiang, John Joo, Chi-Fong Wang, Friends07, sMITe, Hatch, Wuwu, and Mixed Nuts – you have made my graduate school experience a memorable and fulfilling one. Thanks for your kindness, laughter, generosity, and distractions. I couldn’t have done it without you.
To my family, especially my mother Suenee, my brother Gordon, and my grandma Chia Shia – for accepting, supporting, and loving me unconditionally.
To my husband, Bryan Ng – thank you for your never-ending unconditional love, support, and encouragement. Thank you for believing in me and never letting me give up.
This thesis is dedicated to my father, Dr. Vincent Shu.
Financial support for this work provided by the Department of Veterans Affairs is gratefully acknowledged. I am grateful to Ajinomoto Food Ingredients LLC for providing the microbial transglutaminase and the Institute of Bioengineering and Nanotechnology (Singapore) for providing the gelatin-hydroxyphenylpropionic acid.

6

7
Table of Contents
Chapter 1 Introduction .............................................................................................................. 21
Chapter 2 Background and motivation ..................................................................................... 25
2.1 Tissue response to myocardial infarct .............................................................................. 25
2.2 Cell types in cardiac tissue ............................................................................................... 26
2.3 Extracellular matrix molecules in cardiac tissue .............................................................. 26
2.4 Cardiac tissue engineering – An overview ...................................................................... 27
2.5 Scaffolding materials ....................................................................................................... 27
2.5.1 Porous sponge-like collagen scaffolds ...................................................................... 27
2.5.2 Injectable hydrogels .................................................................................................. 28
2.6 Cell therapy ...................................................................................................................... 31
2.6.1 Mesenchymal stem cells ............................................................................................ 31
2.6.2 Embryonic carcinoma cells ....................................................................................... 35
Chapter 3 Differentiation of MSCs and ECCs into cardiac, neural, and endothelial cells in monolayer and in 3-D collagen scaffolds ..................................................................................... 37
3.1 Introduction ...................................................................................................................... 37
3.2 Objective, hypothesis, and rationale ................................................................................ 38
3.3 Materials and methods ..................................................................................................... 39
3.3.1 Isolation and culture of MSCs ................................................................................... 39
3.3.2 MSC differentiation assays for chondrogenesis, osteogenesis, and adipogenesis .... 40
3.3.3 Culture of ECCs ........................................................................................................ 41
3.3.4 Monolayer culture ...................................................................................................... 41
3.3.5 Cardiac differentiation ............................................................................................... 41
3.3.6 Neural differentiation ................................................................................................ 41
3.3.7 Endothelial differentiation ......................................................................................... 42
3.3.8 Scaffold fabrication and cross-linking ....................................................................... 42
3.3.9 Environmental scanning electron microscopy ........................................................... 43
3.3.10 Collagen scaffold culture ......................................................................................... 43
3.3.11 Analysis of DNA and glycosaminoglycan content .................................................. 43
3.3.12 Immunocytochemistry ............................................................................................. 44

8
3.3.13 Histology and immunohistochemistry ..................................................................... 44
3.3.14 Immunofluorescence ............................................................................................... 45
3.3.15 Western blot ............................................................................................................. 45
3.3.16 Statistics ................................................................................................................... 46
3.4 Results .............................................................................................................................. 46
3.4.1 MSC differentiation assays for chondrogenesis, osteogenesis, and adipogenesis .... 46
3.4.2 MSC and ECC pellet culture for chondrogenesis ...................................................... 47
3.4.3 MSC and ECC scaffold culture for chondrogenesis .................................................. 49
3.4.4 α-SMA expression in monolayer culture ................................................................... 51
3.4.5 Monolayer cardiac differentiation ............................................................................. 52
3.4.6 Monolayer neural differentiation ............................................................................... 53
3.4.7 Monolayer endothelial differentiation ....................................................................... 55
3.4.8 Scaffold culture .......................................................................................................... 56
3.5 Discussion ........................................................................................................................ 61
3.5.1 Comparison of MSCs and ECCs for chondrogenesis ................................................ 61
3.5.2 Comparison of MSCs and ECCs for cardiac, neural, and endothelial differentiation in monolayer and 3-D collagen scaffolds .............................................................................. 63
3.6 Summary .......................................................................................................................... 68
Chapter 4 Injectable biopolymer gels for cardiac tissue engineering ....................................... 71
4.1 Introduction ...................................................................................................................... 71
4.1.1 Injectable gels for cardiac tissue engineering ........................................................... 71
4.1.2 Biopolymers to be investigated ................................................................................. 71
4.2 Objective, hypothesis, and rationale ................................................................................ 74
4.3 Materials and methods ..................................................................................................... 75
4.3.1 Collagen-genipin gels ................................................................................................ 75
4.3.2 Collagen-transglutaminase gels ................................................................................. 76
4.3.3 Gelatin-hydroxyphenylpropionic acid hydrogels ...................................................... 76
4.3.4 Rheology testing ........................................................................................................ 76
4.3.5 Unconfined compression testing ............................................................................... 77
4.3.6 Absorbance and fluorescence measurements of collagen-genipin gels ..................... 77
4.3.7 Enzymatic degradation .............................................................................................. 78
9
4.3.8 Swelling ratio ............................................................................................................. 78
4.3.9 Environmental scanning electron microscopy ........................................................... 78
4.3.10 Isolation and culture of MSCs ................................................................................. 79
4.3.11 Culture of ECCs ...................................................................................................... 79
4.3.12 Cell-incorporated gels .............................................................................................. 79
4.3.13 Rheological behavior of cell-incorporated gels ....................................................... 80
4.3.14 Cell viability ............................................................................................................ 81
4.3.15 Cell proliferation ...................................................................................................... 81
4.3.16 Statistics ................................................................................................................... 81
4.4 Results .............................................................................................................................. 81
4.4.1 Rheological Behavior ................................................................................................ 81
4.4.2 Compression testing .................................................................................................. 83
4.4.3 Environmental scanning electron microscopy ........................................................... 87
4.4.4 Absorbance and fluorescence of collagen-genipin gels ............................................ 89
4.4.5 Enzymatic degradation .............................................................................................. 90
4.4.6 Swelling ratio ............................................................................................................. 93
4.4.7 Cell-incorporated gels ................................................................................................ 94
4.4.8 Rheological behavior of cell-incorporated gels ......................................................... 96
4.4.9 Cell viability .............................................................................................................. 97
4.4.10 Cell proliferation ...................................................................................................... 99
4.5 Discussion ...................................................................................................................... 101
4.5.1 Collagen-genipin gels .............................................................................................. 101
4.5.2 Collagen-transglutaminase gels ............................................................................... 106
4.5.3 Gelatin-hydroxyphenylpropionic acid gels ............................................................. 106
4.6 Overview of hydrogels ................................................................................................... 109
4.7 Summary ........................................................................................................................ 110
Chapter 5 Differentiation of MSCs and ECCs into cardiac, neural and endothelial cells separately and simultaneously in biopolymer gels ..................................................................... 113
5.1 Introduction .................................................................................................................... 113
5.2 Objective, hypothesis, and rationale .............................................................................. 114
5.3 Materials and methods ................................................................................................... 116

10
5.3.1 Overview of experimental set-up ............................................................................ 116
5.3.2 Culture of P19 embryonic carcinoma cells ............................................................. 117
5.3.3 Differentiation medium ........................................................................................... 117
5.3.4 Cell incorporation in collagen-genipin gels ............................................................ 118
5.3.5 Cell incorporation in gelatin-hydroxyphenylpropionic acid gels ............................ 118
5.3.6 Immunohistochemistry and immunofluorescence .................................................. 119
5.3.7 Statistics .................................................................................................................. 122
5.4 Results ............................................................................................................................ 122
5.4.1 Cardiac staining ....................................................................................................... 123
5.4.2 Neural staining ........................................................................................................ 128
5.4.3 Endothelial staining ................................................................................................. 133
5.4.4 Correlation of angiogenesis and neurogenesis ........................................................ 138
5.5 Discussion ...................................................................................................................... 140
5.6 Summary ........................................................................................................................ 151
Chapter 6 In vivo feasibility of biopolymer gels ..................................................................... 153
6.1 Introduction .................................................................................................................... 153
6.2 Objective, hypothesis, and rationale .............................................................................. 154
6.3 Methods and materials ................................................................................................... 154
6.3.1 Gel injections into ex vivo cardiac tissue ................................................................ 154
6.3.2 Histological analysis ............................................................................................... 155
6.3.3 Pilot animal study .................................................................................................... 155
6.4 Results ............................................................................................................................ 156
6.4.1 Gel injections into ex vivo cardiac tissue ................................................................ 156
6.4.2 Animal study ........................................................................................................... 157
6.5 Discussion ...................................................................................................................... 158
6.5.1 Gel injections into ex vivo cardiac tissue ................................................................ 158
6.5.2 Methods of infarct creation ..................................................................................... 159
6.5.3 Animal study ........................................................................................................... 159
6.6 Summary ........................................................................................................................ 161
Chapter 7 Limitations and future work ................................................................................... 163
Chapter 8 Conclusions ............................................................................................................ 167

11
Chapter 9 Appendix ................................................................................................................ 169
9.1 Cell culture protocols ..................................................................................................... 169
9.1.1 Freezing cells ........................................................................................................... 169
9.1.2 Thawing cells .......................................................................................................... 169
9.1.3 Changing media ....................................................................................................... 170
9.1.4 Passaging cells ......................................................................................................... 171
9.1.5 Counting cells .......................................................................................................... 172
9.2 Scaffold fabrication protocols ........................................................................................ 174
9.2.1 Collagen slurry preparation ..................................................................................... 174
9.2.2 Virteous freeze-drying “ramp” protocol ................................................................. 175
9.2.3 Dehydrothermal treatment ....................................................................................... 175
9.2.4 Cross-linking collagen scaffolds by carbodiimide treatment .................................. 175
9.3 Cell-seeded collagen scaffold protocols ........................................................................ 179
9.3.1 Agarose coating of well-plates ................................................................................ 179
9.3.2 Seeding collagen scaffolds ...................................................................................... 180
9.4 Cell differentiation protocols ......................................................................................... 181
9.4.1 Osteogenic and adipogenic differentiation .............................................................. 181
9.4.2 Chondrogenic differentiation .................................................................................. 182
9.4.3 Pellet assay for chondrogenic differentiation .......................................................... 184
9.4.4 Cardiac, neural, and endothelial differentiation ...................................................... 184
9.5 Hydrogel preparation protocols ..................................................................................... 189
9.5.1 Collagen-genipin gels .............................................................................................. 189
9.5.2 Collagen-transglutaminase gels ............................................................................... 189
9.5.3 Gelatin-hydroxyphenylpropionic acid gels ............................................................. 190
9.6 Sample preparation for staining protocols ..................................................................... 191
9.6.1 Tissue processing and paraffin-embedding ............................................................. 191
9.6.2 OCT embedding and cryosectioning ....................................................................... 191
9.7 Staining protocols .......................................................................................................... 194
9.7.1 Hematoxylin and eosin (H&E) staining .................................................................. 194
9.7.2 Safranin O staining .................................................................................................. 195
9.7.3 Masson’s trichrome staining ................................................................................... 196

12
9.7.4 Immunohistochemical monolayer staining ............................................................. 198
9.7.5 Immunohistochemical section staining ................................................................... 204
9.8 Hydrogel characterization protocols .............................................................................. 206
9.8.1 Critical point drying ................................................................................................ 206
9.8.2 Rheological testing .................................................................................................. 207
9.8.3 Compression testing ................................................................................................ 209
9.8.4 Enzymatic degradation studies ................................................................................ 209
9.9 Biochemical assay protocols .......................................................................................... 211
9.9.1 Proteinase K digestion ............................................................................................. 211
9.9.2 Dimethylmethylene blue assay for sulfated glycosaminoglycans ........................... 211
9.9.3 PicoGreen dsDNA quantitation assay ..................................................................... 213
9.9.4 Live/Dead staining for cell viability ........................................................................ 216
9.10 Supplemental results .................................................................................................... 217
Chapter 10 References ............................................................................................................ 231

13
List of Figures
Figure 2-1 Histological stages of myocardial infarction [20]. ...................................................... 26 Figure 2-2 Collagen cross-linked with genipin [39] ..................................................................... 29 Figure 2-3 Cross-linking structures genipin-fixed collagen [40] .................................................. 30 Figure 2-4 Mesenchymal stem cell lineage [53] ........................................................................... 32 Figure 3-1 MSC differentiation assays (A,B) SafO stain and (C,D) type II collagen for
chondrogenesis, (E) Von Kossa stain for osteogenesis [118], (F) Oil red stain for adipogenesis [118]. ........................................................................................................... 47
Figure 3-2 Pig MSCs (A-D) and mouse ECCs (E-H) stained with H&E (A, E), Safranin-O (B,F), α-SMA (C,G) and type II collagen (D,H) at day 14 (n = 4). Scale bars, 100 µm (Inset scale bars, 20 µm). ............................................................................................................ 48
Figure 3-3 DNA content, GAG content, and GAG to DNA ratio of the cell pellets at days 1 and 14 (n = 6, mean ± S.E.). .................................................................................................... 49
Figure 3-4 Scaffold contraction over 14 days for MSCs and ECCs seeded on (A) type I and (B) type II collagen scaffolds (n = 8, mean ± S.E.). ................................................................ 49
Figure 3-5 Pig MSCs (A,B) and mouse ECCs (C,D) stained with type II collagen (A,C) and Safranin-O (B,D) at day 14 (n = 6). Scale bars, 2 mm. .................................................... 50
Figure 3-6 DNA and GAG contents, GAG:DNA ratio of scaffolds at day 1 and 14 (n = 4, mean ± S.E.)................................................................................................................................... 51
Figure 3-7 Immunohistochemistry of α-SMA in (A) pig MSCs, (B) dissociated mouse ECCs, and (C) EBs (n = 6). Scale bars, 50 µm. .................................................................................. 52
Figure 3-8 MSCs cultured in cardiac medium (A-E) and stained immunohistochemically for cardiac Tn-I at (A) 7 days and (B) 14 days, (C,D) MHC at 14 days, (E) α-SMA at 14 days, and (F) MSCs cultured in complete medium and stained for MHC at 14 days (n = 3). ...................................................................................................................................... 52
Figure 3-9 EBs cultured in cardiac medium (A-F) and stained immunohistochemically at 14 days for (A) α-actinin, (B) MHC, (C) Tn-I, (D) α-SMA, (E) Tn-I at 7 days, (F) Tn-I at 14 days, and (G) EBs cultured in complete medium and stained for Tn-I at 14 days (n = 3). Scale bars, 100 µm. .................................................................................................................... 53
Figure 3-10 Number of EB outgrowths with beating cells (%) over time (n = 6, mean ± S.D.) .. 53 Figure 3-11 MSCs cultured in neural medium and stained immunohistochemically for (A) TUJ1
and (B) α-SMA at 1 day (n = 4). Scale bars, 50 µm. ........................................................ 54 Figure 3-12 EBs cultured in in neural medium and stained immunohistochemically for TUJ1 at
(A) 2 days, (B) 7 days, (C) 14 days, and (D) EBs cultured in complete medium did not stain for TUJ1 for time points up until 14 days. Scale bar, 100 µm. ................................ 55
Figure 3-13 Western blot analysis confirms expression of N-Nos for EBs exposed to 10-7 M RA compared to those cultured in complete medium. ............................................................ 55
Figure 3-14 MSCs cultured in endothelial differentiation medium and stained immunohistochemically for vWF at (A) 7 days and (B) 14 days. Scale bar, 100 µm. ..... 56
14
Figure 3-15 EBs cultured in endothelial differentiation medium and stained immunohistochemically for vWF at (A) 7 days and (B) 14 days, (C) EBs cultured in complete medium and stained for vWF. Scale bar, 200 µm. ............................................ 56
Figure 3-16 ESEM image of collagen scaffolds ........................................................................... 57 Figure 3-17 Percent original diameter of scaffolds seeded with MSCs cultured in control,
cardiac, neural, and endothelial media for up to 14 days (n = 10, mean ± S.D.) .............. 57 Figure 3-18 Gross appearance of (A) MSCs and (B) ECCs seeded in collagen scaffolds cultured
in cardiac media in 12-well plates for 7 days. H&E staining of (C) MSCs and (D) ECCs in cardiac medium at 7 days. ............................................................................................. 58
Figure 3-19 MSC and ECC differentiation in collagen scaffolds in (A,D) cardiac media, stained for MHC at 14 days, (B,E) neural media, stained for TUJ1 at 1 and 7 days, (C,F) endothelial media, stained for vWF at 14 days (n = 2). .................................................... 60
Figure 3-20 Immunohistochemical staining for α-SMA for (A-D) MSCs and (E-H) ECCs cultured in (A,E) control medium, (B,F) cardiac medium, (C,G) neural medium, and (D,H) endothelial medium. Scale bars, 50 µm. ................................................................ 60
Figure 4-1 Cryotube molds for cell-seeded Gtn-HPA gels ........................................................... 80 Figure 4-2 Rheological behavior of collagen-genipin gels: (A) shear storage modulus G’; and (B)
gel time (n = 3, mean ± S.D.) ............................................................................................ 82 Figure 4-3 Rheological behavior of Gtn-HPA gels: (A) shear storage modulus G’; and (B) gel
time (n = 3, mean ± S.D.).................................................................................................. 83 Figure 4-4 Typical nominal and true stress/strain curves for collagen-based gels ....................... 84 Figure 4-5 Typical effect of strain rate (10%/s vs. 1%/s) on collagen-0.25 mM genipin gels (n =
3) ....................................................................................................................................... 84 Figure 4-6 Collagen-genipin compression results: (A) Typical loading and unloading curve
(collagen with 0.25 mM genipin), and (B) compression modulus for various concentrations of genipin for 10%/s and 1%/s strain rates (n = 3, mean ± S.D.) ............. 85
Figure 4-7 Typical nominal and true stress/strain curves for Gtn-HPA gels ................................ 86 Figure 4-8 Gtn-HPA compression testing: (A) typical true stress-strain curve, and (B)
compression moduli for 0.85 – 3.0 mM H2O2 (n = 3, mean ± S.D.) ................................ 87 Figure 4-9 Mooney-Rivlin characterization of Gtn-HPA gels: (A) Mooney plot; (B) shear
modulus, G (n = 3, mean ± S.D.) ...................................................................................... 87 Figure 4-10 ESEM images of collagen-genipin gels .................................................................... 88 Figure 4-11 Representative ESEM image of Gtn-HPA gel .......................................................... 89 Figure 4-12 Color change in collagen gels with: (A) no genipin; (B) 0.25 mM genipin; (C) 0.5
mM genipin; (D) 1.0 mM genipin ..................................................................................... 89 Figure 4-13 Weight remaining (%) of Collagen-genipin gels at various degradation times for
different concentrations of genipin (mM) (n = 3, mean ± S.D.) ....................................... 90 Figure 4-14 Weight remaining (%) of collagen-genipin gels at various degradation times for
different concentrations of genipin (n = 3, mean ± S.D.) ................................................. 91 Figure 4-15 Half-life of collagen-genipin gels matured for 1 and 24 hours (n=3, mean ± S.D.) . 92

15
Figure 4-16 Enzymatic degradation of Gtn-HPA gels for various concentrations of H2O2: (A) Weight remaining (%); and (B) Half-life (n = 3, mean ± S.D.) ........................................ 93
Figure 4-17 Swelling ratio of (A) collagen-genipin and (B) Gtn-HPA gels (n = 3, mean ± S.D.)94 Figure 4-18 Contraction data for MSCs incorporated in (A) collagen-genipin gels (0-2mM
genipin); (B) collagen-TGase (unpurified) gels (0-50 mg/ml TGase); (C) collagen-TGase (purified) gels (0-100 µg/ml TGase); and (D) Gtn-HPA gels (1.0 and 1.7 mM H2O2) (n = 3, mean ± S.D.) ................................................................................................................. 95
Figure 4-19 MSCs in collagen-genipin gels at day 7: (A) collagen-only; (B) collagen-0.25mM genipin; (C) collagen-0.5mM genipin (n = 3) ................................................................... 95
Figure 4-20 MSCs in collagen-TGase (purified) gels at day 7: (A) collagen-only; (B) collagen-5 µg/ml TGase; (C) collagen-50 µg/ml TGase; (D) collagen-100 µg/ml TGase (n = 3) ..... 96
Figure 4-21 MSCs in Gtn-HPA gels at day 7: (A) 1.0 mM H2O2 and (B) 1.7 mM H2O2 (n = 3) 96 Figure 4-22 Storage modulus for MSCs and ECCs at for various concentrations of genipin at 1
and 6 days (n = 4, mean ± S.D.) ........................................................................................ 97 Figure 4-23 Cell viability for MSCs incorporated collagen-genipin gels (0-2 mM genipin) (A)
before and (B) after excess genipin was removed (n = 3, mean ± S.D.) .......................... 98 Figure 4-24 Cell viability for MSCs incorporated in (A) collagen-TGase (unpurified) gels (0-50
mg/ml TGase); (B) collgen-TGase (purified) gels (0-100 µg/ml TGase); and (C) Gtn-HPA gels (1.0 and 1.7 mM H2O2) (n = 3, mean ± S.D.) ................................................... 99
Figure 4-25 DNA content for MSCs incorporated in (A) collagen-genipin gels (0-2 mM genipin); (B) collagen-TGase (unpurified) gels (0-50 mg/ml TGase); (C) collagen-TGase (purified) gels (0-100 µg/ml TGase); and (D) Gtn-HPA gels (1.0 and 1.7 mM H2O2) (n = 4-6, mean ± S.D.) ............................................................................................................................. 100
Figure 4-26 Correlation of G (from Mooney-Rivlin analysis) and G’ (from rheological testing) (n=3) ................................................................................................................................ 108
Figure 4-27 Materials characterization chart comparing (1) collagen scaffolds cross-linked with DHT and EDAC; (2) collagen-genipin gels; (3) collagen-TGase gels; (4) Gtn-HPA gels......................................................................................................................................... 110
Figure 5-1 Sample images of EBs stained with MHC that would (A) not be counted as a positive stain; and (B, C) would be counted as a positive stain. .................................................. 121
Figure 5-2 Sample images of EBs stained with TUJ1 that would have typical % Area stained values of (A) 5%, (B) 20%, and (C) 40%. ...................................................................... 122
Figure 5-3 EB diameter for EBs incorporated in (A) Col-only gels, (B) Col-Gen gels, (C) Gtn-HPA-comp gels, and (D) Gtn-HPA-stiff gels (n = 9, mean ± S.D.) ............................... 123
Figure 5-4 MHC expression of EBs cultured in C medium at 14 days in various gel types: (A) Col-only, (B) Col-Gen, (C), Gtn-HPA-comp, and (D) Gtn-HPA-stiff gels. .................. 124
Figure 5-5 MHC expression (% EBs stained) for EBs incorporated in various gel types cultured in (A) N, (B) C/N, (C) C/N/E, and (D) Cntl media for 7 and 14 days (n = 3, mean ± S.D.).......................................................................................................................................... 125
16
Figure 5-6 MHC expression (% Area) stained for EBs cultured in (A) C, (B) C/N, (C) C/N/E, and (D) Cntl media in various gel types for 7 and 14 days (n = 15-20, mean ± S.D.). .. 126
Figure 5-7 MHC expression of EBs incorporated in Col-only gels at 14 days cultured in (A) C, (B) N, (C) E, (D) C/N, (E) C/N/E, and (F) Cntl media ................................................... 127
Figure 5-8 MHC expression of EBs incorporated in Col-only gels, cultured in C medium at (A) 7 and (B) 14 days ............................................................................................................... 128
Figure 5-9 TUJ1 expression of EBs cultured in N medium at 14 days in various gel types: (A) Col-only, (B) Col-Gen, (C), Gtn-HPA-comp, and (D) Gtn-HPA-stiff gels. .................. 129
Figure 5-10 TUJ1 expression (% EBs stained) for EBs incorporated in various gel types cultured in (A) N, (B) C/N, (C) C/N/E, and (D) Cntl media for 7 and 14 days (n=3, mean ± S.D.).......................................................................................................................................... 131
Figure 5-11 TUJ1 expression (% Area stained) for EBs incorporated in various gel types cultured in (A) N, (B) C/N, (C) C/N/E, and (D) Cntl media for 7 and 14 days (n = 15-20, mean ± S.D.). ............................................................................................................................... 131
Figure 5-12 TUJ1 expression of EBs incorporated in Col-only gels at 14 days cultured in (A) C, (B) N, (C) E, (D) C/N, (E) C/N/E, and (F) Cntl media. .................................................. 132
Figure 5-13 TUJ1 expression of EBs incorporated in Col-only gels, cultured in N medium at (A) 7 and (B) 14 days ............................................................................................................ 133
Figure 5-14 CD31 expression of EBs cultured in C/N/E media at 14 days in various gel types: (A) Col-only, (B) Col-Gen, (C), Gtn-HPA-comp, and (D) Gtn-HPA-stiff gels. ............ 134
Figure 5-15 CD31 expression (% EBs stained) while incorporated in various gel types cultured in (A) N, (B) C/N, (C) C/N/E, and (D) Cntl media for 7 and 14 days (n = 3, mean ± S.D.).......................................................................................................................................... 135
Figure 5-16 CD31 expression (% Area stained) for EBs incorporated in various gel types cultured in (A) N, (B) C/N, (C) C/N/E, and (D) Cntl media for 7 and 14 days (n = 15-20, mean ± S.D.). .................................................................................................................. 136
Figure 5-17 CD31 expression of EBs incorporated in Col-only gels at 14 days cultured in (A) C, (B) N, (C) E, (D) C/N, (E) C/N/E, and (F) Cntl media. .................................................. 137
Figure 5-18 CD31 expression of EBs incorporated in Col-only gels, cultured in C/N/E media at (A) 7 and (B) 14 days ...................................................................................................... 138
Figure 5-19 TUJ1 (red) and CD31 (green) expression in EBs incorporated in Col-only gels cultured in C/N/E medium at (A) 7 and (B) 14 days. ..................................................... 139
Figure 5-20 Linear regression plots for the expression (% Area) of (A) cardiac vs. neural; (B) cardiac vs. endothelial; and (C) neural vs. endothelial markers for EBs incorporated in all gel types cultured in all differentiation media for 7 and 14 days. ................................... 139
Figure 5-21 Linear regression plot for the expression (% Area) of TUJ1 and CD31 for EBs incorporated in Col-only gels cultured in all media for 14 days. .................................... 139
Figure 6-1 Col-Gen gels injected into ex vivo cardiac tissue: (A) Col-Gen gels dyed with trypan blue; (B) Gross view of cardiac muscle; (C) Gross view of fixed cardiac tissue; (D) H&E stained paraffin-embedded section; (C) H&E stained cryosection. ................................ 157
17
Figure 6-2 Induction of myocardial infarct in swine through ligation of the LAD coronary artery: (A) the third left rib was marked for left anteromedial thoracotomy; (B) cauterizers were used to cut through muscle; (C) clamps were used to expose heart. .............................. 158
Figure 6-3 Induction of myocardial infarct in swine through occlusion of LAD coronary artery via Gelfoam delivery through catheter: (A) femoral vein and artery were cannulated; (B) animal was positioned under a C-arm to identify the LAD coronary artery; (C) a delivery of Gelfoam, saline, and contrast was used to occlude the vessel .................................... 158
Figure 9-1 Hemacytometer ......................................................................................................... 173 Figure 9-2 MHC expression (% EBs stained) for EBs incorporated in (A) collagen-only, (B)
collagen-genipin, (C) Gtn-HPA-comp, and (D) Gtn-HPA-stiff gels cultured in various media for 7 and 14 days (n = 3, mean ± S.D.). ............................................................... 217
Figure 9-3 MHC expression (% Area stained) for EBs incorporated in (A) collagen-only, (B) collagen-genipin, (C) Gtn-HPA-comp, and (D) Gtn-HPA-stiff gels cultured in various media for 7 and 14 days (n = 15-20, mean ± S.D.). ........................................................ 218
Figure 9-4 TUJ1 expression (% EBs stained) for EBs incorporated in (A) collagen-only, (B) collagen-genipin, (C) Gtn-HPA-comp, and (D) Gtn-HPA-stiff gels cultured in various media for 7 and 14 days (n = 3, mean ± S.D.). ............................................................... 219
Figure 9-5 TUJ1 expression (% Area stained) for EBs incorporated in (A) collagen-only, (B) collagen-genipin, (C) Gtn-HPA-comp, and (D) Gtn-HPA-stiff gels cultured in various media for 7 and 14 days (n = 15=20, mean ± S.D.). ....................................................... 220
Figure 9-6 CD31 expression (% EB stained) for EBs incorporated in (A) collagen-only, (B) collagen-genipin, (C) Gtn-HPA-comp, and (D) Gtn-HPA-stiff gels cultured in various media for 7 and 14 days (n = 3, mean ± S.D.). ............................................................... 221
Figure 9-7 CD31 expression (% Area stained) for EBs incorporated in (A) collagen-only, (B) collagen-genipin, (C) Gtn-HPA-comp, and (D) Gtn-HPA-stiff gels cultured in various media for 7 and 14 days (n = 3, mean ± S.D.). ............................................................... 222
Figure 9-8 Linear regression plots for the expression (% Area stained) of (A) cardiac vs. neural; (B) cardiac vs. endothelial; (C) neural vs. endothelial markers of EBs cultured in collagen-only gels in all differentiation media for all culture times ............................... 223
Figure 9-9 Linear regression plots for the expression (% Area stained) of (A) cardiac vs. neural; (B) cardiac vs. endothelial; (C) neural vs. endothelial markers of EBs cultured in collagen-only gels in all differentiation media for 14 days ............................................ 223
Figure 9-10 Linear regression plots for the expression (% Area stained) of (A) cardiac vs. neural; (B) cardiac vs. endothelial; (C) neural vs. endothelial markers of EBs cultured in collagen-genipin gels in all differentiation media for all culture times .......................... 224
Figure 9-11 Linear regression plots for the expression (% Area stained) of (A) cardiac vs. neural; (B) cardiac vs. endothelial; (C) neural vs. endothelial markers of EBs cultured in collagen-genipin gels in all differentiation media for 14 d ............................................. 224
18
Figure 9-12 Linear regression plots for the expression (% Area stained) of (A) cardiac vs. neural; (B) cardiac vs. endothelial; (C) neural vs. endothelial markers of EBs cultured in Gtn-HPA-comp gels in all differentiation media for all culture times ................................... 225
Figure 9-13 Linear regression plots for the expression (% Area stained) of (A) cardiac vs. neural; (B) cardiac vs. endothelial; (C) neural vs. endothelial markers of EBs cultured in Gtn-HPA-comp gels in all differentiation media for 14 d ..................................................... 225
Figure 9-14 Linear regression plots for the expression (% Area stained) of (A) cardiac vs. neural; (B) cardiac vs. endothelial; (C) neural vs. endothelial markers of EBs cultured in Gtn-HPA-stiff gels in all differentiation media for all culture times ..................................... 226
Figure 9-15 Linear regression plots for the expression (% Area stained) of (A) cardiac vs. neural; (B) cardiac vs. endothelial; (C) neural vs. endothelial markers of EBs cultured in Gtn-HPA-stiff gels in all differentiation media for 14 d ........................................................ 226
Figure 9-16 Linear regression plots for the expression of cardiac and neural markers (% Area stained) of EBs incorporated in all gels, cultured in (A) C; (B) N; (C) E; (D) C/N; (E) C/N/E, and (F) Cntl media, for 14 days. ......................................................................... 227
Figure 9-17 Linear regression plots for the expression of cardiac and endothelial markers (% Area stained) of EBs incorporated in all gels, cultured in (A) C; (B) N; (C) E; (D) C/N; (E) C/N/E, and (F) Cntl media, for 14 days. ................................................................... 228
Figure 9-18 Linear regression plots for the expression of neural and endothelial markers (% Area stained) of EBs incorporated in all gels, cultured in (A) C; (B) N; (C) E; (D) C/N; (E) C/N/E, and (F) Cntl media, for 14 days. ......................................................................... 229
19
List of Tables
Table 2-1 Cross-linking of collagen [37] ...................................................................................... 29 Table 2-2 Differentiation of MSCs into cardiomyocyte-like cells [20] ........................................ 32 Table 3-1 Differentiation efficiency of MSCs and ECCs in cardiac, neural, and endothelial
differentiation media (% stained cells) (n = 3, mean ± S.D.) ........................................... 59 Table 4-1 Design characteristics for gels for cardiac tissue engineering ...................................... 72 Table 4-2 Weight remaining (%) and half-life times for collagen-genipin gels for 1 and 24 hours
maturation times. (n = 3, mean ± S.D.) ............................................................................. 92 Table 4-3 Weight remaining (%) and half-life times for Gtn-HPA gels. (n = 3, mean ± S.D.) ... 93 Table 5-1: Independent variables and metrics for evaluation ..................................................... 116 Table 5-2: Mixed medium conditions ......................................................................................... 118

20
21
Chapter 1 Introduction
Cardiovascular disease is the leading cause of death in the Western world. Nearly 8 million people in the United States alone have suffered a myocardial infarction (MI), with 1.2 million new and recurrent cases each year (American Heart Association, 2011). In any given year, the survival rate from an MI is only 60%. Since myocardial tissue lacks intrinsic regenerative capability, MIs result in the substantial death of cardiomyocytes in the infarct zone followed by pathological remodeling of the heart. The remodeling process involves cardiac dilation, wall thinning, and severe deterioration of contractile function leading to congestive heart failure in 500,000 patients in the U.S. each year. Medical management for heart failure may improve symptoms and slow the progression to failure but does not restore a functioning myocardium. Once an MI has occurred, there is no treatment to recover the myocardial function from that portion of the heart. The current treatment of end-stage heart failure is heart transplantation, which is problematic due to the lack of organ donors and the complications associated with immunosuppressants. New solutions are needed to regenerate MI-damaged hearts. In particular, research in cardiac tissue engineering aims to restore contractility of the myocardium and prevent the adverse remodeling of the heart in patients who survive MIs.
Although many advances have been made in this field, regeneration is not complete and researchers face many problems including an appropriate cell source and a method of delivery to bring cells and therapeutics to the infarcted heart. Researchers combine cells, scaffolds, growth factors, and external stimuli including mechanical [1, 2] or electrical [3] exercise to differentiate stem cells into cardiomyocyte-like cells. Many different cell types are currently being investigated for cell-based therapies. Among these are neonatal cardiomyocytes [4], embryonic stem cells (ESCs) [5], ESC-derived cardiomyocytes [6], skeletal muscle cells [7], bone marrow cells [8], and mesenchymal stem cells (MSCs) [9, 10]. In particular, ESCs and MSCs have been studied extensively as promising cell candidates for cardiac tissue engineering. Totipotent ESCs can differentiate into beating cardiomyocyte clusters known as embryoid bodies (EBs) in vitro and have been integrated to pace an infarcted heart [6]. One particular type of embryonic stem cell line is the pluripotent P19 embryonic carcinoma cell (ECC) derived from an embryonal carcinoma in a C3H/He mouse. These ECCs are well characterized and have been used as a model embryonic cell type for various developmental and differentiation assays. Pluripotent bone marrow-derived MSCs can also differentiate into cardiomyocyte-like cells in vitro and improve cardiac function in vivo in a variety of different ways including stimulating neovascularization. Furthermore the implantation of autologous MSCs may reduce the chances of an adverse immune response.
These cells can be delivered to the myocardium in a variety of ways: injected directly into the diseased myocardium, delivered through an injectable gel, or seeded on a three-dimensional scaffold and then engrafted onto the infarct site. Although the actual mechanism of cardiac renewal is unknown and many theories have been proposed [11-13], researchers agree

22
that the ultimate functional goal of cardiac tissue engineering is the complete remodeling and restoration of cardiac function.
Collagen scaffolds and injectable gels have been investigated as promising methods of cell delivery to the myocardium. Porous collagen scaffolds with high surface areas allow the encapsulation of a high density of cells that can be engrafted onto a beating heart. Minimally invasive delivery vehicles such as injectable hydrogels provide a unique way to deliver cells and therapeutics without major surgery. Although many natural and synthetic polymers have been investigated, very few gel materials and cross-linkers have the capability to form covalent cross-links in situ, thus allowing the mechanical, rheological, and degradative properties of the gels to be tuned and optimized. An ideal material may be one that mimics the natural environment during embryonic cardiac development and differentiation. The extracellular matrix in which cardiogenesis takes place is referred to as “cardiac jelly.”
Cardiac jelly is a homogenous network of type I collagen fibrils and fine filaments present between the endothelium and myocardium of the embryonic heart, which transforms into the connective tissue of the endocardium [14, 15]. The structural stability of cardiac jelly is ensured by the presence of elastin and collagen, whereas its gel-like appearance is controlled by the glycosaminoglycan content, which determines the degree of hydration of the jelly. A few researchers have investigated cardiac jelly-like, collagen-based gels to incorporate EBs to facilitate in vitro cardiac differentiation [16, 17].
In addition to the functional contractile unit cardiomyocyte, myocardium contains other cell types including endothelial and smooth muscle cells that comprise the vasculature to support a highly metabolic organ, and cardiac neurons known as Purkinje cells that innervate cardiac tissue to regulate the intrinsic electrical conduction system of the heart. The closely intertwined neural and vasculature networks function together to allow efficient contraction of all four chambers of the heart, thereby allowing selective blood perfusion through both the lungs and systemic circulation. Although researchers have considered incorporating vasculature into cardiac tissue engineering constructs, no methods have incorporated neural networks in cardiac tissue.
This overall goal of this thesis was to investigate two types of stem cells (MSCs and ECCs) cultured in various 3-D environments including sponge-like type I collagen scaffolds and novel injectable hydrogels with covalent cross-linkers, that support cell proliferation and differentiation. Specifically, the three hydrogel materials characterized included type I collagen cross-linked with a small molecule known as genipin, type I collagen cross-linked with a large enzyme known as transglutaminase, and gelatin-hydroxyphenylpropionic acid, whose cross-linking is modulated by horse radish peroxidase and H2O2. Furthermore, it investigates the novel concept of simultaneous differentiation in which a single cell culture is exposed to mixed medium conditions and differentiated into cardiac, neural, and endothelial lineages in a spatially relevant distribution.

23
The hypothesis is that the tunable properties of the injectable gels can be optimized to match that of cardiac jelly, which would provide the environment to produce the most mature cardiomyocytes, neural cells, and endothelial cells that are differentiated from ECCs. Furthermore, ECCs seeded in collagen gels with a covalent cross-linker can differentiate into cardiac, neural and endothelial cells in the same culture when exposed to appropriate media. The key parameters in the injectable gels incorporated with cells include the cell type, the scaffold form (sponge-like scaffold or injectable gel), the gel material and cross-linker, and the differentiation medium. The results are summarized in four manuscripts, whose abstracts are included as Chapters 3-6.
Chapter 2 describes the background and motivation underlying this thesis, including the basics of cardiac muscle structure and function and an overview of tissue culture methods for cardiac tissue engineering up to date.
Chapter 3 compares the differentiation efficiency of two stem cell types (adult porcine and caprine bone marrow-derived MSCs and P19 ECCs) in two in vitro culture environments (2-D monolayer and 3-D collagen scaffolds) into the main cellular components of cardiac tissue, including cardiomyocytes, neural cells and vascular endothelial cells. MSCs and ECCs were also cultured in chondrogenic medium and investigated for associations among contraction, α-smooth muscle actin expression, and chondrogenesis in vitro.
Chapter 4 characterizes three mechanically tunable injectable gel systems that have the capability to form covalent cross-links in situ. These gel systems (collagen cross-linked with genipin, collagen cross-linked with transglutaminase, and gelatin-hydroxyphenylpropionic acid whose cross-linking is modulated with HRP and H2O2) were characterized in terms of mechanical and rheological behavior, resistance to enzymatic degradation, and cell behavior when incorporated in these gels. Furthermore, this chapter provides a thorough literature review about cardiac jelly as an optimal material for in vitro cardiac differentiation.
Chapter 5 describes the differentiation of MSCs and ECCs into cardiac, neural and endothelial cells separately and simultaneously in select gel types that were characterized in the previous chapter.
Chapter 6 investigates the in vivo feasibility of injectable collagen gels cross-linked with genipin and describes a pilot large animal study in which different methods of inducing MIs were investigated. Furthermore, this chapter provides an experimental set-up to investigate functional improvements of implanting a cell-incorporated gel into an infarcted heart.
Chapter 7 discusses the limitations of this thesis and identifies areas that need to be addressed in future work.
Chapter 8 lists the conclusions that this thesis supports.

24

25
Chapter 2 Background and motivation
2.1 Tissue response to myocardial infarct
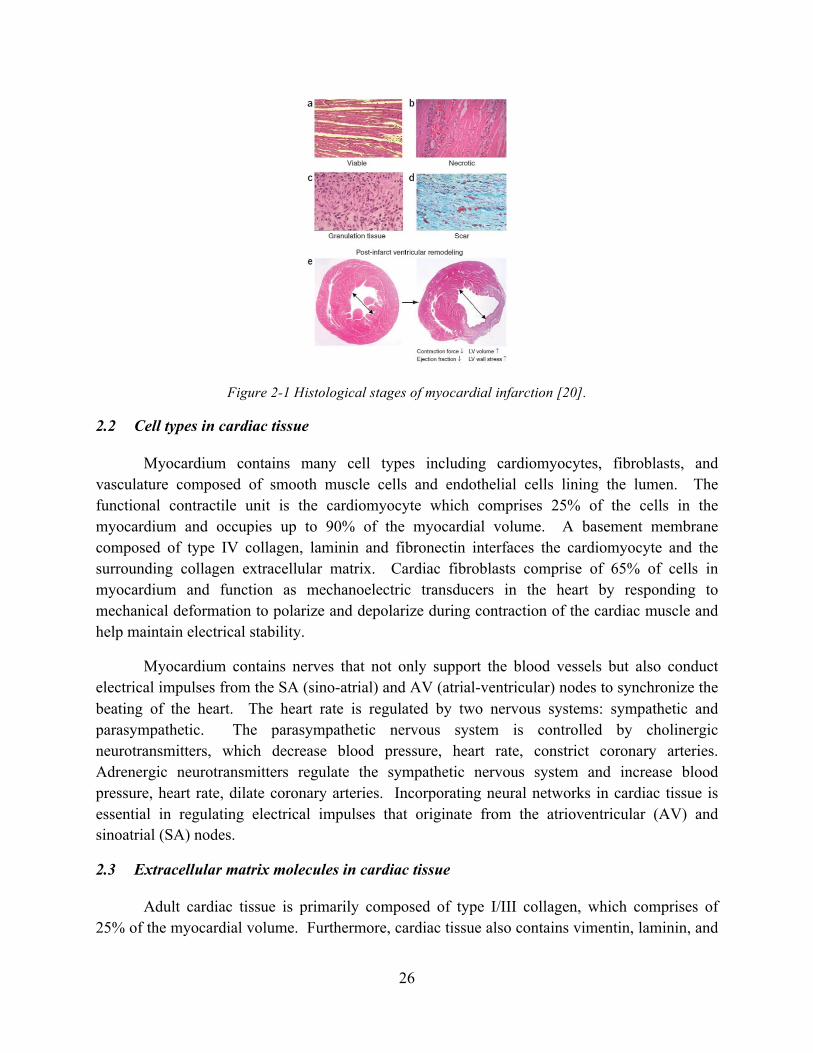
A myocardial infarction occurs when the blood supply to part of the heart muscle is blocked, usually by the sudden formation of a blood clot within a coronary artery, leading to death of part of the heart muscle. Large-scale tissue necrosis and massive cells loss occur in which more than a billion cells are lost. Heart failure ensues when contractile reserve is depleted below a critical threshold.
Because of its high metabolic rate and oxygen consumption, myocardium (Figure 2-1A) begins to undergo irreversible injury within 20 minutes of ischemia. Cell death spreads from the inner layers to the outer layers of the myocardium over 3-6 hours resulting in myocardial necrosis (Figure 2-1B) and eliciting an inflammatory response. Leukocytes, including neutrophils and macrophages, enter the infarct to phagocytose necrotic cell debris. Subsequently, granulation tissue consisting of fibroblasts and endothelial cells invade the necrotic area to initiate wound repair (Figure 2-1C). Over time, the granulation tissue remodels to form fibrotic scar tissue (Figure 2-1D). In humans, this myocardial repair process is completed in two months. MI results in thinning of the ventricular wall and dilation of the ventricular cavity (Figure 2-1E), termed “ventricular remodeling,” which increases the mechanical stress on the ventricular wall and debilitates contractile function. Healthy cardiac tissue in humans has a stiffness of 8 kPa in diastole and 40 kPa in systole [18]. After fibrotic tissue has formed, the stiffness of the left ventricle in both diastole and systole increased to 10 kPa and 60 kPa, respectively [18, 19]. Once an MI has occurred, there is no treatment to recover the myocardial function from that portion of the heart.
26
Figure 2-1 Histological stages of myocardial infarction [20].
2.2 Cell types in cardiac tissue
Myocardium contains many cell types including cardiomyocytes, fibroblasts, and vasculature composed of smooth muscle cells and endothelial cells lining the lumen. The functional contractile unit is the cardiomyocyte which comprises 25% of the cells in the myocardium and occupies up to 90% of the myocardial volume. A basement membrane composed of type IV collagen, laminin and fibronectin interfaces the cardiomyocyte and the surrounding collagen extracellular matrix. Cardiac fibroblasts comprise of 65% of cells in myocardium and function as mechanoelectric transducers in the heart by responding to mechanical deformation to polarize and depolarize during contraction of the cardiac muscle and help maintain electrical stability.
Myocardium contains nerves that not only support the blood vessels but also conduct electrical impulses from the SA (sino-atrial) and AV (atrial-ventricular) nodes to synchronize the beating of the heart. The heart rate is regulated by two nervous systems: sympathetic and parasympathetic. The parasympathetic nervous system is controlled by cholinergic neurotransmitters, which decrease blood pressure, heart rate, constrict coronary arteries. Adrenergic neurotransmitters regulate the sympathetic nervous system and increase blood pressure, heart rate, dilate coronary arteries. Incorporating neural networks in cardiac tissue is essential in regulating electrical impulses that originate from the atrioventricular (AV) and sinoatrial (SA) nodes.
2.3 Extracellular matrix molecules in cardiac tissue
Adult cardiac tissue is primarily composed of type I/III collagen, which comprises of 25% of the myocardial volume. Furthermore, cardiac tissue also contains vimentin, laminin, and

27
fibronectin [21]. Vimentin, the intermediate filament of mesenchymal cells, is present in fibroblasts, fibrocytes, and endothelial cells. Laminin is observed in the basal membrane of myocytes, smooth muscle and endothelial cells. Fibronectin is localized homogeneously throughout the extracellular space as matrix material in which the cellular elements and the various other proteins such as collagens are embedded.
Fetal cardiac development occurs in a gelatinous substance known as “cardiac jelly.” Cardiac jelly is a homogenous network of type I collagen fibrils and fine filaments present between the endothelium and myocardium of the embryonic heart, which transforms into the connective tissue of the endocardium [14]. The structural stability of cardiac jelly is ensured by the presence of elastin and collagen, whereas its gel-like appearance is controlled by the glycosaminoglycan content, which determines the degree of hydration of the jelly. The modulus of cardiac jelly has found to be 1-30 Pa, measured by various method s including microindentation [22] and mesomechanical testing [23]. A few researchers have investigated cardiac jelly-like gels to incorporate EBs to facilitate in vitro cardiac differentiation [16, 17, 24, 25].
2.4 Cardiac tissue engineering – An overview
Tissue engineering methods are employed to grow new myocardium in diseased hearts and restore cardiac function. Various strategies have been investigated, including stem cell injections [9, 26, 27], reconstruction of beating tissues ex vivo to be implanted in vivo [4], and cell-seeded scaffolds that are injected or implanted [28, 29]. Cell-seeded scaffolds can serve three purposes: to accommodate ingrowth and differentiation of endogenous progenitor cells [26, 30], to deliver therapeutic agents [31], and to host exogenous cells [32]. Furthermore, these cells, scaffolds, and growth factors can be combined with external stimuli including mechanical [1, 2] or electrical [3] exercise to differentiate stem cells into cardiomyocyte-like cells. In this section, various scaffold materials, including porous scaffolds and injectable hydrogels, and cell types, including mesenchymal stem cells and embryonic carcinoma cells, are explored.
2.5 Scaffolding materials
Scaffolding materials in the form of porous sponge-like scaffolds and injectable hydrogels have the capability to deliver large number of cells and growth factors to a defect site.
2.5.1 Porous sponge-like collagen scaffolds
The use of 3-D scaffolds that mimic the natural in vivo environment of cells has been shown to facilitate the reparative process and result in the successful repair and neovascularization of various functioning tissues. The 3-D environment of these porous sponge-like scaffolds serves as a desirable structural support for seeded or migrating endogenous cells and allows for a much greater surface to volume ratio for increased cell attachment as compared to a 2-D surface.

28
There are several design requirements for a scaffold to be used as an implant for cardiac regeneration. The scaffold needs to be biodegradable, non-toxic, able to be sutured to the defect site, facilitate cell attachment, regulate cell expression, and possess sufficient mechanical strength. Natural polymers such as collagen provide a native surface to cells, since it is a major component of the natural extracellular matrix (ECM) in cardiac tissue, and possess ligands that favor cellular attachment.
Type I collagen is a major constituent of cardiac ECM and is commended by its successful use as a regeneration template for dermis [33] and peripheral nerve [34] and its versatility in being able to be cross-linked using a variety of treatments, thus providing design control over its degradation rate and mechanical properties. Furthermore, beating cardiomyocytes can be seeded onto scaffolds, which can then be transplanted onto a beating heart [35, 36].
Various methods have been investigated to modulate the mechanical properties of porous collagen scaffolds. For example the cross-link density and thus stiffness of the scaffold can be modified by dehydrothermal or EDC treatment, modulating the degradation rate. Furthermore, properties such as pore size and pore connectivity can be tailored for various applications.
2.5.2 Injectable hydrogels
Injectable hydrogels have been explored as a minimally invasive method for the delivery of cells and growth factors. Cross-linking is an important characteristic that allows tenability of a polymer’s stiffness and resistance to degradation. And in particular to injectable gels, the cross-linker must be a covalent cross-linker able to form cross-links in situ.
Collagen gels
Collagen-based matrices are widely used in tissue regenerative applications due to its ubiquitous presence in the human body, antigenic behavior, and biodegradability. Thus it is critical to be able to manipulate the mechanical properties of collagen gels by cross-linking mechanisms.
Collagens comprise the majority of proteins in connective tissue such as skin, bone, cartilage, and tendons, and are therefore popular candidates for injectable biomaterials. Furthermore, collagen’s superior biocompatibility and nearly ubiquitous bioactivity have made it one of the most extensively investigated biomaterial scaffolds for tissue engineering. However, the effectiveness of collagen-based tissue engineered materials has been severely limited by their lack of mechanical strength.
A variety of methods exist to cross-link collagen gels [37]. Physical treatments such as ultraviolet (UV) and γ-irradiation and dehydrothermal treatments are not practical in because of their limited use in cellular tissues. Chemical treatments with aldehydes are often used to

29
preserve and stiffen tissues but these treatments are highly cytotoxic. In vivo, tissues are naturally cross-linked by enzymes such as lysyl oxidase and transglutaminase. However, use of these enzymes for bulk changes in mechanical properties in cultured tissue mimics is cost prohibitive. Chemical aldehydes are used as a fixative to preserve tissues but are highly toxic.
Table 2-1 Cross-linking of collagen [37]
Physical treatment UV radiation (254 nm) γ-‐irradiation Dehydrothermal treatment Chemical treatment Bifunctional agent
Aldehyde ex: glutaraldehyde (GTA) Diisocyanate ex: hexamethylene diisocyanate (HMDC) Polyepoxy ex: polyglycerol polyglycidyl ether
Activation of carboxylic acid groups
Carbodiimide ex: cyanamide 1-‐ethyl-‐3-‐(3-‐dimethyl aminopropyl) carboxdiimide HCl (EDC)
Acyl azide method ex: hydrazine diphenylphosphorylazide (DPPA)
Genipin has been investigated to modulate mechanical stiffness of collagen and gelatin. Genipin is the active compound found in Gardenia Jasminoides fruit extract and it crosslinks collagen through nucleophilic attack by primary amine groups on lysine and arginine residues on the C3 atom of genipin resulting in a gel strength comparable to glutaraldehyde, but it is 10,000-fold less cytotoxic (Figure 2-1) [38]. In addition to an increase in mechanical strength of collagen, genipin crosslinking is associated with a color change in which opaque collagen turns blue, and the crosslinks emit fluorescence at 630 nm when excited at 590 nm.
Figure 2-2 Collagen cross-linked with genipin [39]
Genipin may cross-link collagen in a variety of different mechanisms. Genipin molecules may react with amino groups within a tropocollagen molecule or between adjacent tropocollagen molecules to form intrahelical and interhelical crosslinks in the genipin-fixed tissue. In addition, intermicrofibrillar cross-links may be formed between collagen microfibrils via polymerization of genipin molecules before cross-linking (oligomeric cross-link).

30
Figure 2-3 Cross-linking structures genipin-fixed collagen [40]
Furthermore, the degradation rate of genipin-cross-linked gelatin was found to be significantly slower than glutaraldehyde-cross-linked counterparts [41]. The mechanical and rheological behavior of genipin-cross-linked gelatin has been investigated, revealing that with an increase in genipin concentration and temperature, the gelatin network shifts from being dominated by hydrogen bonds (physical cross-links) to covalent cross-linking (chemical cross-links) [42].
Although genipin is an attractive cross-linker for collagen, its cytotoxicity at high concentrations (5 mM) limits its usage to small concentrations [39]. Transglutaminase (TGase), a ubiquitous enzyme with a role in blood clotting, has also been investigated for cross-linking collagen gels [43]. TGases are able to covalently attach primary amine containing compounds to peptide bound glutamine, facilitating modification of the physical, chemical and biological properties of proteins [44]. Specifically, TGase catalyzes the formation of a covalent bond between the ε-amino group of a lysine residue and a γ-carboxamide group of glutamine, creating intramolecular covalent links within and between polymers. It has been mainly used in the food industry in processing meats and fish but has recently been used in the biomedical field for cross-linking natural polymers. TGase has been used to cross-link gelatin matrices to increase their strength [45] and, also, to incorporate cell adhesion factors within the gel matrix, enhancing cell proliferation [46].
Gelatin-hydroxyphenylpropionic (Gtn-HPA) gels
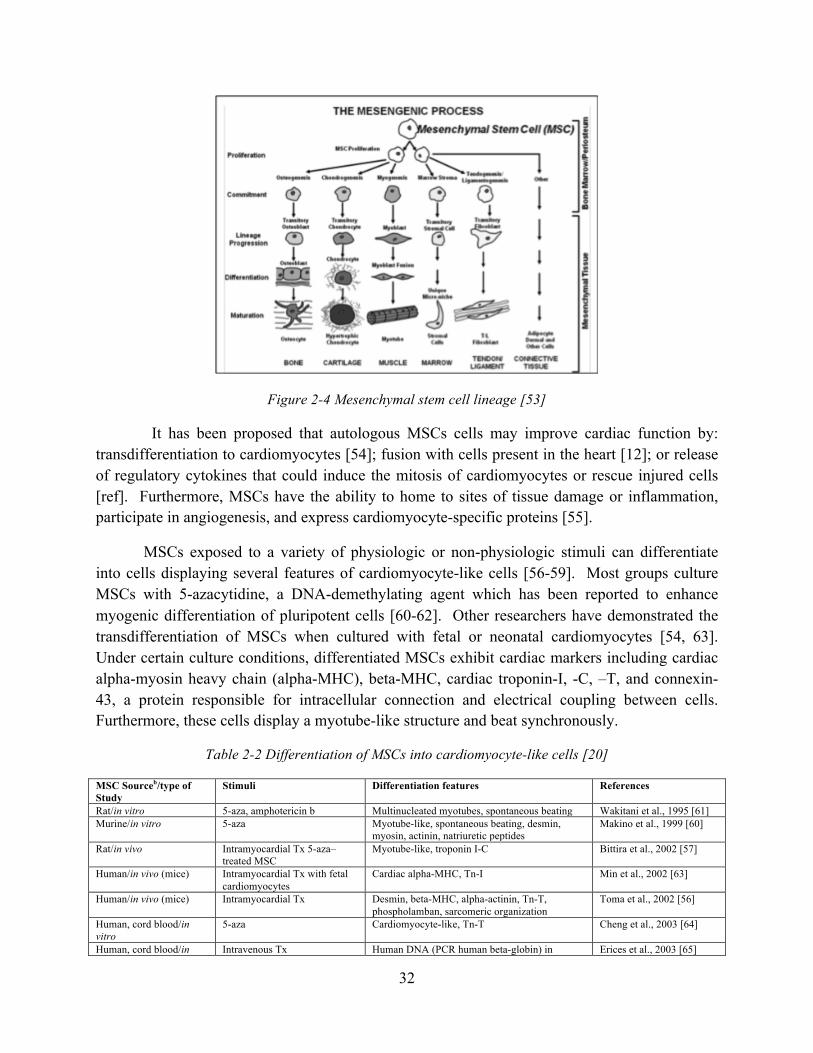
In the last few years, there has been a class of polymers that are enzymatically cross-linkable via pendant phenolic groups, which is catalyzed by H2O2 and HRP. The development of this cross-linking method 1has spurred the creation of many gels including hyaluronic acid-tyramine gels [47], carbomethyl-cellulose-tyramine gels [48], gelatin-tyramine gels [49], and dextra-tyramine/heparin-tyramine [50]. The H2O2 and HRP determined the hydrogel stiffness and the gelation rate of the hydrogel, respectively. Gtn-HPA gels have recently been investigated as an injectable material for cell delivery. Gelatin is a derivative of collagen containing single strands of collagen instead of the tropohelix of collagen, and has many of the same properties including cell adhesion. Although the mechanical and rheological properties of Gtn-HPA gels have been characterized, few studies have investigated cell behavior and differentiation while incorporated in the gels.
31
2.6 Cell therapy
Many different cell types are currently investigated for cell-based therapies. Among these are neonatal cardiomyocytes [4], ESCs [5], ESC-derived cardiomyocytes [6], skeletal muscle cells [7], bone marrow cells [8], and MSCs [9, 10]. These cells are injected into the diseased myocardium or seeded on a three-dimensional scaffold and then engrafted onto the infarct site. The actual mechanism of cardiac renewal is unknown but many theories have been proposed: 1) the exogenous cells stimulate endogenous progenitor cells to revascularize a myocardial infarct [11]; 2) the cells fuse with the existing cardiac myocytes, giving rise to hybrid cells expressing cardiac markers [12]; 3) the cells and subsequent new tissue formation attenuates pathological ventricular remodeling [13]. Although the actual mechanism of cardiac renewal is still under debate and research, researchers agree that the ultimate functional goal of cardiac tissue engineering is the complete remodeling and restoration of cardiac function.
Three main methods have been explored to deliver cells into the infracted myocardium. The first method is direct injection of cells into the myocardium [51]. However, direct injection has several drawbacks, including very low efficacy of cell engraftment and substantial cell death soon after the injection of cells. Nevertheless, there are currently ongoing clinical trials in humans investigating the safety and feasibility of direct injection of cells for cardiac therapy. The second method involves an intravenous injection of a cell suspension. Even though there have been positive results with this relatively painless method of delivery [52], a very small percentage of cells actually reach the myocardium. The final method of cell delivery is the implantation of a three-dimensional cell-seeded scaffold or injectable hydrogel. These constructs allow maintenance of cellular viability and differentiation, favor cell migration and promote angiogenesis [28].
2.6.1 Mesenchymal stem cells
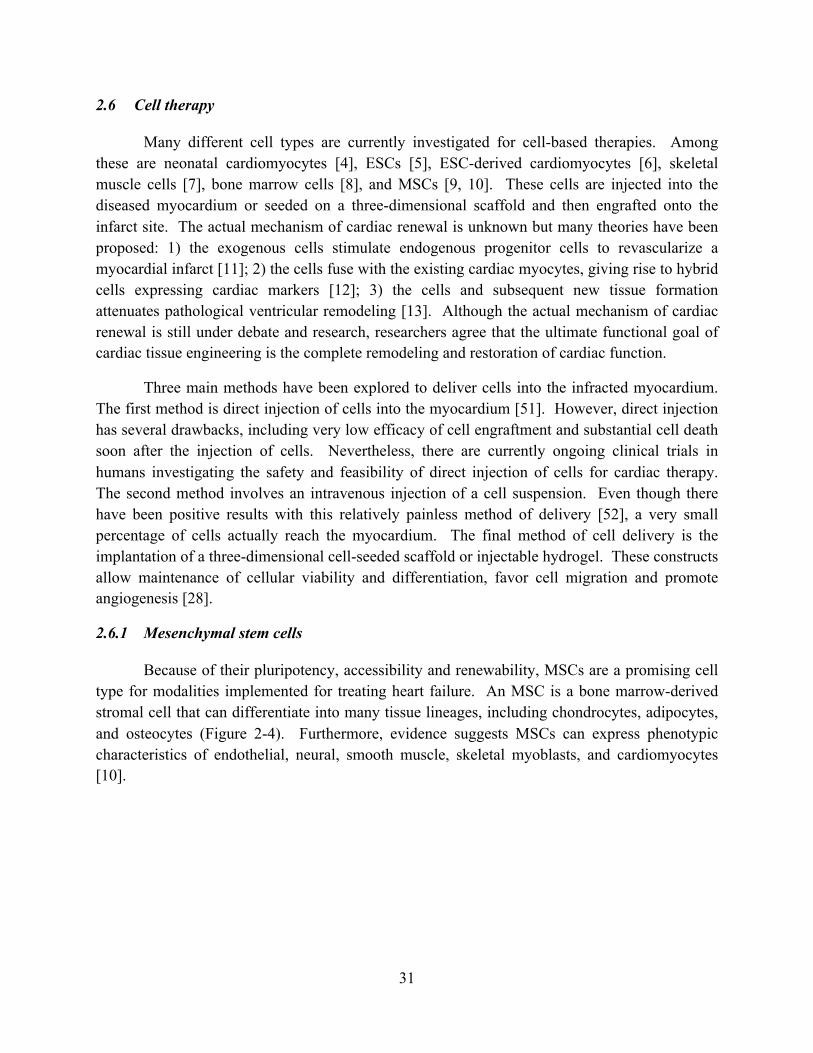
Because of their pluripotency, accessibility and renewability, MSCs are a promising cell type for modalities implemented for treating heart failure. An MSC is a bone marrow-derived stromal cell that can differentiate into many tissue lineages, including chondrocytes, adipocytes, and osteocytes (Figure 2-4). Furthermore, evidence suggests MSCs can express phenotypic characteristics of endothelial, neural, smooth muscle, skeletal myoblasts, and cardiomyocytes [10].
32
Figure 2-4 Mesenchymal stem cell lineage [53]
It has been proposed that autologous MSCs cells may improve cardiac function by: transdifferentiation to cardiomyocytes [54]; fusion with cells present in the heart [12]; or release of regulatory cytokines that could induce the mitosis of cardiomyocytes or rescue injured cells [ref]. Furthermore, MSCs have the ability to home to sites of tissue damage or inflammation, participate in angiogenesis, and express cardiomyocyte-specific proteins [55].
MSCs exposed to a variety of physiologic or non-physiologic stimuli can differentiate into cells displaying several features of cardiomyocyte-like cells [56-59]. Most groups culture MSCs with 5-azacytidine, a DNA-demethylating agent which has been reported to enhance myogenic differentiation of pluripotent cells [60-62]. Other researchers have demonstrated the transdifferentiation of MSCs when cultured with fetal or neonatal cardiomyocytes [54, 63]. Under certain culture conditions, differentiated MSCs exhibit cardiac markers including cardiac alpha-myosin heavy chain (alpha-MHC), beta-MHC, cardiac troponin-I, -C, –T, and connexin-43, a protein responsible for intracellular connection and electrical coupling between cells. Furthermore, these cells display a myotube-like structure and beat synchronously.
Table 2-2 Differentiation of MSCs into cardiomyocyte-like cells [20]
MSC Sourceb/type of Study
Stimuli Differentiation features References
Rat/in vitro 5-aza, amphotericin b Multinucleated myotubes, spontaneous beating Wakitani et al., 1995 [61] Murine/in vitro 5-aza Myotube-like, spontaneous beating, desmin,
myosin, actinin, natriuretic peptides Makino et al., 1999 [60]
Rat/in vivo Intramyocardial Tx 5-aza–treated MSC
Myotube-like, troponin I-C Bittira et al., 2002 [57]
Human/in vivo (mice) Intramyocardial Tx with fetal cardiomyocytes
Cardiac alpha-MHC, Tn-I Min et al., 2002 [63]
Human/in vivo (mice) Intramyocardial Tx Desmin, beta-MHC, alpha-actinin, Tn-T, phospholamban, sarcomeric organization
Toma et al., 2002 [56]
Human, cord blood/in vitro
5-aza Cardiomyocyte-like, Tn-T Cheng et al., 2003 [64]
Human, cord blood/in Intravenous Tx Human DNA (PCR human beta-globin) in Erices et al., 2003 [65]
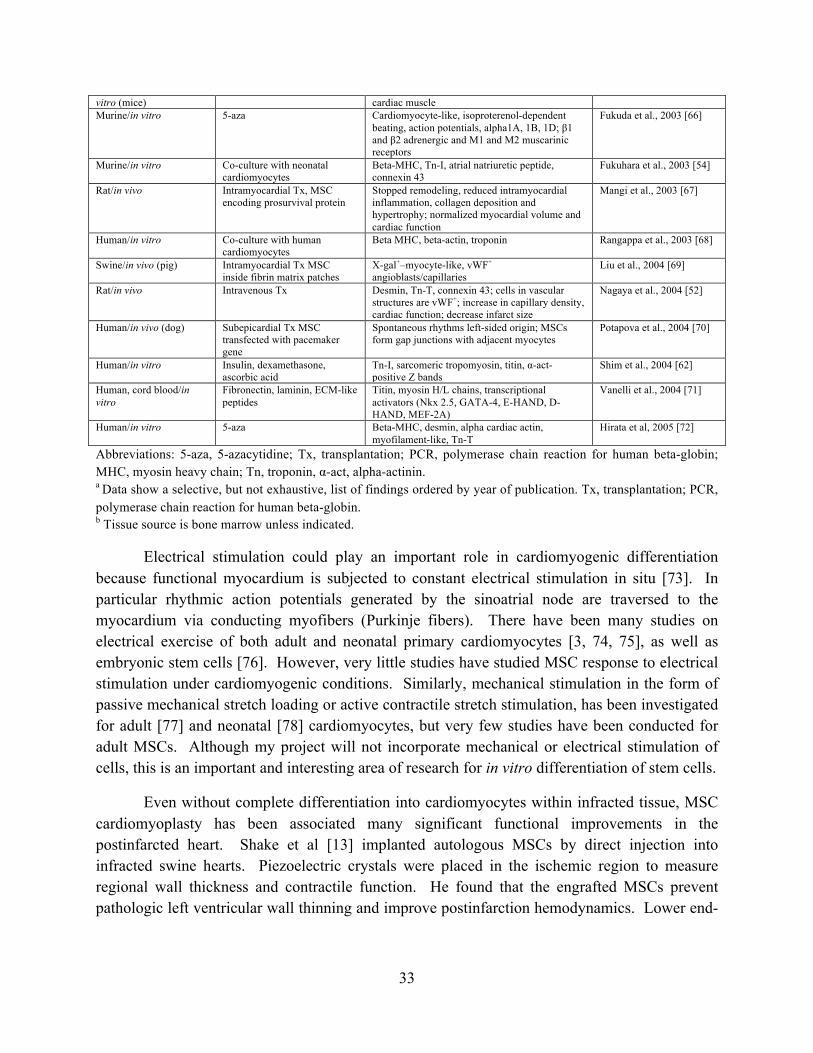
33
vitro (mice) cardiac muscle Murine/in vitro 5-aza Cardiomyocyte-like, isoproterenol-dependent
beating, action potentials, alpha1A, 1B, 1D; β1 and β2 adrenergic and M1 and M2 muscarinic receptors
Fukuda et al., 2003 [66]
Murine/in vitro Co-culture with neonatal cardiomyocytes
Beta-MHC, Tn-I, atrial natriuretic peptide, connexin 43
Fukuhara et al., 2003 [54]
Rat/in vivo Intramyocardial Tx, MSC encoding prosurvival protein
Stopped remodeling, reduced intramyocardial inflammation, collagen deposition and hypertrophy; normalized myocardial volume and cardiac function
Mangi et al., 2003 [67]
Human/in vitro Co-culture with human cardiomyocytes
Beta MHC, beta-actin, troponin Rangappa et al., 2003 [68]
Swine/in vivo (pig) Intramyocardial Tx MSC inside fibrin matrix patches
X-gal+–myocyte-like, vWF+
angioblasts/capillaries Liu et al., 2004 [69]
Rat/in vivo Intravenous Tx Desmin, Tn-T, connexin 43; cells in vascular structures are vWF+; increase in capillary density, cardiac function; decrease infarct size
Nagaya et al., 2004 [52]
Human/in vivo (dog) Subepicardial Tx MSC transfected with pacemaker gene
Spontaneous rhythms left-sided origin; MSCs form gap junctions with adjacent myocytes
Potapova et al., 2004 [70]
Human/in vitro Insulin, dexamethasone, ascorbic acid
Tn-I, sarcomeric tropomyosin, titin, α-act-positive Z bands
Shim et al., 2004 [62]
Human, cord blood/in vitro
Fibronectin, laminin, ECM-like peptides
Titin, myosin H/L chains, transcriptional activators (Nkx 2.5, GATA-4, E-HAND, D-HAND, MEF-2A)
Vanelli et al., 2004 [71]
Human/in vitro 5-aza Beta-MHC, desmin, alpha cardiac actin, myofilament-like, Tn-T
Hirata et al, 2005 [72]
Abbreviations: 5-aza, 5-azacytidine; Tx, transplantation; PCR, polymerase chain reaction for human beta-globin; MHC, myosin heavy chain; Tn, troponin, α-act, alpha-actinin. a Data show a selective, but not exhaustive, list of findings ordered by year of publication. Tx, transplantation; PCR, polymerase chain reaction for human beta-globin. b Tissue source is bone marrow unless indicated.
Electrical stimulation could play an important role in cardiomyogenic differentiation because functional myocardium is subjected to constant electrical stimulation in situ [73]. In particular rhythmic action potentials generated by the sinoatrial node are traversed to the myocardium via conducting myofibers (Purkinje fibers). There have been many studies on electrical exercise of both adult and neonatal primary cardiomyocytes [3, 74, 75], as well as embryonic stem cells [76]. However, very little studies have studied MSC response to electrical stimulation under cardiomyogenic conditions. Similarly, mechanical stimulation in the form of passive mechanical stretch loading or active contractile stretch stimulation, has been investigated for adult [77] and neonatal [78] cardiomyocytes, but very few studies have been conducted for adult MSCs. Although my project will not incorporate mechanical or electrical stimulation of cells, this is an important and interesting area of research for in vitro differentiation of stem cells.
Even without complete differentiation into cardiomyocytes within infracted tissue, MSC cardiomyoplasty has been associated many significant functional improvements in the postinfarcted heart. Shake et al [13] implanted autologous MSCs by direct injection into infracted swine hearts. Piezoelectric crystals were placed in the ischemic region to measure regional wall thickness and contractile function. He found that the engrafted MSCs prevent pathologic left ventricular wall thinning and improve postinfarction hemodynamics. Lower end-

34
diastolic pressure in MSC-treated animals suggests improved diastolic relaxation and decreased wall stress that are likely attributable to favorable ventricular remodeling [10].
Liu et al [69] investigated autologous MSC-seeded fibrin gels for cardiac regeneration. The MSCs were exposed to 5-azacytidine before implantation and showed an increase in muscle-specific protein genes, including phospholamban, troponin-T, and α-muscle-specific actin. Three weeks after implantation, magnetic resonance imaging data indicated a significant increase of LV systolic wall thickening fraction in the infarct zone of transplanted hearts compared with controls. Light microscopy demonstrated that transplanted cells had differentiated into cells with myocyte-like characteristics and a robust increase of neovascularization as evidenced by von Willebrand factor-positive angioblasts and capillaries in transplanted hearts.
Many challenges remain in the field of cell-based cardiac repair [20]. First, less than 10% of injected cells, either intravenously or intramyocardially, are actually delivered to the heart [79]. Worse still, retention is extremely variable from study to study, making graft size unpredictable. A second problem is the extensive death of transplanted cells. Multiple studies indicated that ~90% of cells successfully delivered to the heart die within the first week [80]. The massive cell death is probably due to ischemia and mechanical stress during injection. Thus the problems of cell retention and survival can be resolved by engrafting a cell-seeded construct which allows for localization and retention of cells at the site of implantation. Furthermore, the scaffold can be designed to provide some mechanical reinforcement of the weakened cardiac wall.
A final problem in cell-based cardiac repair is scar tissue. Fibrotic scar in a postinfarcted heart prevents grafted cells from forming electromechanical junctions with the host myocardium required for synchronous contraction [29]. Part of this problem can be ameliorated by neovascularization, which will allow macrophages to migrate to the infarct area and phagocytose fibrotic tissue. Furthermore, it has been found that porous scaffolds elicit a tissue response that promotes angiogenesis at the infarct site [28, 81].
In the last few years, several clinical trials have been initiated to assess the effect of transplantation of autologous cells in myocardial regeneration after acute MI [9]. In most of these studies however, the source of “repairing” cells has been the heterogeneous fraction of bone marrow cells, named bone marrow–derived mononuclear cells (BM-MNCs).
In one ongoing study sponsored by Osiris Therapeutics, patients received an intravenous dose (0.5, 1.6 or 5.0 million) of a mixture of human stem cells following an acute MI [82]. Other studies are investigating the safety of intravenous or intramyocardial injections of autologous MSCs [83, 84]. MSC-seeded scaffolds have not yet been investigated in clinical trials. The development of a cardiac patch in a large animal model provides a basis for translating this treatment to clinical trials.
35
2.6.2 Embryonic carcinoma cells
ESCs are an attractive source of stem cells for tissue engineering due to their unlimited renewability and pluripotency [85]. They have been shown to differentiate into cardiac [5], neural [86-88], and endothelial lineages [89]. One particular type of embryonic stem cell line is the pluripotent P19 ECC derived from an embryonal carcinoma in a C3H/He mouse. These P19 cells are well-characterized [90] and readily differentiate into neural cells in retinoic acid (RA) [91] and cardiac-like cells in DMSO [92], 5-azacytidine [93], or oxytocin [94]. Furthermore, ECCs have been differentiated into endothelial cells in the presence of vascular endothelial growth factor (VEGF) and display prominent capillary-like networks including platelet endothelial cell adhesion molecule-1 (PECAM-1)-positive cells that upregulate the expression of endothelial markers Tie-1, Tie-2, and Flk-1 [95].
In vitro culture of ESCs typically requires a feeder layer, which is a monolayer of cells (usually embryonic fibroblasts) to support the growth of and supply important metabolites for ESCs [96]. The P19 ECC is a unique pluripotent embryonic cell that does not require a feeder layer to be cultured in vitro, making it relatively less complicated to be used in culture. Many researchers have used it as a model system for studying development [97] or differentiation [16, 90]. P19 ECCs are used in these studies with the understanding that they face the same challenges as ESCs, and that the cells would have to be differentiated in vitro prior to implantation in order to obviate the formation of teratomas.

36

37
Chapter 3 Differentiation of MSCs and ECCs into cardiac, neural, and endothelial cells in monolayer and in 3-D collagen scaffolds
3.1 Introduction
Pre-formed collagen scaffolds have been employed in this thesis for the ultimate fabrication of cardiac tissue engineering constructs, and for investigation of certain cell behaviors in three-dimensional matrices in vitro, for a variety of reasons: 1) type I collagen is the principal structural protein of the body, and contains ligands for integrins of many cell types; 2) the large surface area of the three-dimensional sponge-like material allows for the delivery of a high cell density to the infarct site; 3) the scaffold allows for the localization and retention of the cells at the site of implantation; 4) the scaffold wall can be designed to provide some mechanical reinforcement for the weakened cardiac wall; and 5) the tissue response to the scaffold can promote angiogenesis at the implant site [28]. While most connective tissues principally contain type I collagen, cartilaginous tissues contain type II, thus serving as the rationale for comparing the chondrogenic behavior of stem cells in scaffolds fabricated from these collagen types. The advantage of using tissue-derived collagens is that other minor collagen types in the tissues, which may have favorable effects on cell behavior, may be retained. Furthermore, type I collagen is the major extracellular matrix component in cardiac tissue and thus makes it an ideal candidate for biomaterial scaffold for cell encapsulation and differentiation.
Various cell types have been investigated in previous studies for cardiac tissue engineering, including adult bone marrow-derived MSCs and ESCs. MSCs are a pluripotent population of cells with the capacity for differentiation along osteogenic, chondrogenic, and adipogenic lineages both in vitro and when implanted in immune-deficient mice [98-100]. Autologous MSCs have been investigated as a potential and promising cell source for cardiac tissue engineering due to their pluripotency, accessibility, renewability, and minimal immune response [9, 10, 69, 101]. It has been proposed that autologous MSCs cells may improve cardiac function by: transdifferentiation to cardiomyocytes [52, 54, 55]; fusion with cells present in the heart [12]; or release of regulatory cytokines that could induce the mitosis of cardiomyocytes or rescue injured cells [102]. Furthermore, MSCs have the ability to home to sites of tissue damage or inflammation and participate in angiogenesis by transdifferentiating into endothelial cells [52, 103]. Although MSCs are a promising cell source for cardiac tissue regeneration, there are limitations to the use of MSCs. They have limited capacity for self-renewal [104], and as donor age increases their proliferative potential is impaired [105].
Pluripotent ESCs provide a compelling alternative for tissue regeneration. Derived from the inner cell mass of mouse blastocysts, these cells can proliferate in an undifferentiated state for a prolonged period in culture. ECCs is an embryonic cell source which is a valuable cell line for developmental and differentiation studies. ECCs are pluripotent stem cells derived from the undifferentiated embryonic components of germ cell tumors that arise spontaneously or are
38
experimentally induced by transfer of cells from the epiblast to extrauterine sites in a C3H/He mouse [106]. ECCs are easier to employ than ESCs for the study of tissue and organ development because they can sustain an undifferentiated cell state indefinitely without a feeder-cell layer and have the ability to incorporate and express ectopic genes [107]. Furthermore, the culture of highly proliferative, undifferentiated embryonal cells without a feeder-cell layer is a great advantage in studying embryonic development while conserving costly materials and resources normally required for ESC culture.
ECCs can grow continuously in serum-supplemented media and their differentiation can be controlled by various nontoxic drugs [92]. RA induces the development of neurons, astroglia, and microglia [91]. ECCs cultured in low-attachment culture dishes spontaneously form EBs, which can differentiate into cardiac and skeletal muscle in the presence of dimethyl sulfoxide (DMSO) [90]. Furthermore, ECCs exposed to VEGF display capillary-like networks including PECAM-1-positive cells [95]. Recently, ECCs have been shown to exhibit gene expression patterns characteristic of mesoderm formation and also display elongation morphogenesis with a distinct axis orientation as in the embryo [108]. Collectively these findings commend P19 ECCs as a candidate cell type for cardiac regeneration, given the same challenge as with the implementation of ESCs, that the cells would have to be differentiated in vitro prior to implantation in order to obviate the formation of teratomas. For this in vitro study, ECCs were principally selected as a comparative control embryonic stem cell type based on the fact that they are an embryonic stem cell type which can be grown without a feeder layer.
Prior in vitro studies have demonstrated that MSCs express the gene for a contractile actin isoform, α-smooth muscle actin (α-SMA) [109]. Our own prior work indicated that α-SMA-expressing MSCs contract from the periphery of the cell pellet to facilitate the condensation process necessary for chondrogenesis [110]. However there has been little work describing the contractile behavior of MSCs in media other than chondrogenic media, such as cardiac, neural, and endothelial media.
Prior reports in the literature have shown that α-SMA is absent in undifferentiated ECCs, but becomes apparent in differentiating cultures within 2-3 days after exposure to DMSO for cardiac differentiation or RA for neural differentiation [111].
3.2 Objective, hypothesis, and rationale
The overall objective of this experiment was to compare the relative differentiation potential of MSCs and ECCs in monolayer and in 3-D porous collagen scaffolds. The motivation for comparing the behavior of select cells in 2-D and 3-D culture environments is that prior work has shown differences in cell behavior in 3-D culture environments that more closely simulate an in vivo environment, when compared to monolayer culture. The first part of this study is to investigate MSC and ECC differentiation into cardiac, neural, and endothelial lineages in monolayer and in collagen scaffolds in vitro, and to investigate associations among
39
scaffold contraction and α-SMA expression. The second part of this study is to investigate the potential of these cell types for chondrogenesis in pellets (without a 3-D scaffold) and in a 3-D collagen scaffold.
The hypotheses were that: 1) MSCs and ECCs cultured in collagen scaffolds in cardiac, neural, and endothelial differentiation media result in better differentiated (more mature) cardiomyocyte-like, neural-like, and endothelial-like cells than those cultured in monolayer; 2) cells expressing α-SMA contract the collagen scaffolds; and 3) cells expressing α-SMA contract the pellets and scaffolds and that chondrogenesis occur via condensation in these constructs.
This study design enabled comparison of the relative effects of the 2-D and 3-D environments on α-SMA expression in embryonic and mesenchymal stem cell types in different media. While such information has previously been reported for MSCs in collagen scaffolds during chondrogenesis [109], there have been no such prior studies of ECCs. Because embryonic stem cells, as well as other cell types, are routinely expanded in 2-D culture, an understanding of the relative effects of 2- and 3-D culture environments, and the make-up of the 3-D matrix, on the behavior of the cells was deemed important. The results relate to the judicious selection of a cell source for cardiac tissue engineering, and shed light on the reasons for differences in embryonic/fetal and adult wound healing.
3.3 Materials and methods
3.3.1 Isolation and culture of MSCs
Bone marrow aspirates were taken from the iliac crest of adult female Yorkshire swine (45 kg) and transferred to sterile tubes containing cold phosphate-buffered saline (PBS)/1 mM ethylenediamine tetraacetic acid (EDTA). Cell isolation technique was based on the protocol originally established by Friedenstein et al. [112] and recently expanded by others [98, 113]. Briefly, the marrow and adherent bone trabeculae were minced and vortexed to disperse the marrow cells. The mixture was strained through a 70-µm nylon mesh filter to remove remaining bone and debris, and the cell suspension was centrifuged at 1500 rpm for 10 min. Cells were resuspended, loaded onto a Ficoll-Histopaque gradient, and again centrifuged at 1500 rpm for 30 min. The cells at the interface (1.073 g/ml) were collected and resuspended in PBS followed by three washes in PBS. The cells were counted and their viability was assessed using a trypan blue exclusion test. They were then plated into 25-cm2 flasks at a density of 400,000 cells per cm2.
Medium was first changed after 48 hours to remove most of the nonadherent hematopoietic cells. After 10 days, the remaining adherent cells were detached and collected using 0.05% trypsin and 0.52 mM ethylenediaminetetraacetic acid (EDTA, Gibco, Carlsbad, CA) for 5 min and then subcultured; cells were replated at 5000 cells/cm2. Cells were cultured in complete medium consisting of low-glucose Dulbecco’s modified Eagle’s medium (LG-DMEM,
40
Invitrogen, Carlsbad, CA) containing 10% fetal bovine serum (FBS, Invitrogen), 100 U/ml penicillin and 100 µg/ml streptomycin (Invitrogen). Complete medium was supplemented with 10 ng/ml fibroblast growth factor (FGF)-2 (R&D Systems, Minneapolis, MN) which has been reported to promote MSC proliferation and maintain the cells in an undifferentiated state [114]. Medium was changed every 2-3 days. Cells were used for experiments when the flask reached 80% confluence.
3.3.2 MSC differentiation assays for chondrogenesis, osteogenesis, and adipogenesis
The capability of the bone marrow-derived adherent cells for chondrogensis, osteogenesis, and adipogenesis, was used to qualify them as mesenchymal stem cells as described in literature [98, 115].
Chondrogenic differentiation was achieved by culturing a micromass pellet of cells in chrondrogenic medium [116]. Cells (2 x 10⁵) were added to 15 ml Falcon conical tubes (BD Biosciences, Bedford, MA) and centrifuged at 1500 rpm for 10 minutes to form cell pellets. These pellets were cultured in chondrogenic medium [117], consisting of high-glucose Dulbecco’s Modified Eagle’s Medium (DMEM-HG; Invitrogen), 0.1 mM Non-Essential Amino Acids (Invitrogen), 10 mM 4-(2-hydroxyethyl)-1-piperazineethanesulfonic (HEPES) buffer (Invitrogen), 100 U/ml penicillin and 100 µg/mL streptomycin (Invitrogen), 1% insulin–transferrin–selenium (ITS+1; Sigma, St. Louis, MO), 0.1 mM ascorbic acid 2-phosphate (Wako Chemicals USA, Inc., Richmond, VA), 1.25 mg/ml bovine serum albumin (BSA; Invitrogen), 10 ng/mL recombinant human transforming growth factor-β1 (TGF-β1; R&D Systems), and 100 nM dexamethasone (Sigma). Medium was changed every 2-3 days and the cell pellets were cultured for 14 days. Chondrogenic differentiation was demonstrated by the accumulation of a proteoglycan-rich matrix as determined by Safranin-O staining and type II collagen by immunohistochemistry (see below). After 24 hours, cell pellets were washed in PBS and frozen at -20ºC for DNA and glycosaminoglycan (GAG) content controls (n = 4). For additional pellets, medium was changed every 2-3 days for 14 days before histological and immunohistochemical evaluation (n = 4) and analysis of DNA and GAG content (n = 6). As a second method of demonstrating the inducibility of the chondrogenic phenotype, cells were seeded into type I and II collagen matrices (see below) and cultured in the chondrogenic medium. As a comparative study, the chondrogenic potential of ECCs was investigated by culturing ECCs in parallel with MSCs.
Prior work in the lab confirmed the pluripotency of MSCs by osteogenic and adipogenic differentiation [118]. Osteogenic differentiation was induced by culturing adherent cells in osteogenic medium [119] consisting of: α-Minimal Essential Medium (α-MEM, Invitrogen) supplemented with 10% FBS, 1% antibiotic/antimycotic solution (Sigma), 50 µg/ml ascorbic acid phosphate (Wako Chemicals), 100 nM dexamethasone (Sigma), and 5mM β-glycerophosphate (Santa Cruz Biotechnology, Santa Cruz, CA). Cells were cultured for 4 weeks in monolayer. The cultures were evaluated for mineral deposits using von Kossa stain.

41
Adipogenesis was induced by culturing adherent cells for 21 days in adipogenic medium consisting of complete medium supplemented with 0.5 µM dexamethasone (Sigma), 0.5 mM isobutylmethylxanthine (Sigma), and 50 µM indomethacin (Sigma). Detection of lipid vacuoles was visualized by using the oil-red stain for fat.
3.3.3 Culture of ECCs
ECCs were thawed and expanded in 150-cm2 flasks in complete medium consisting of Minimum Essential Medium (MEM)-Alpha (Gibco), 7.5% newborn calf serum (Sigma), 2.5% fetal calf serum (Sigma), 1% penicillin/streptomycin (Invitrogen). They were subcultured 1:10 every 2-3 days until ready to use. ECCs from this source have already been shown to display pluripotent stem cell behavior [92]. For monolayer differentiation studies, 20 x 106 ECCs were cultured in suspension for 4 days in 100-mm ultra-low attachment culture dishes (Sigma-Aldrich) in various media to form EBs used for differentiation studies. For ECC culture in scaffolds, dissociated ECCs were used instead of EBs.
3.3.4 Monolayer culture
MSCs and ECCs were seeded on 2-well chamber slides (Thermo Fisher Scientific) (n = 6) at a seeding density of 5 x 10⁴ cells/well and cultured in complete medium for 48 hours. The monolayers were then stained for α-SMA using standard immunochemical techniques.
3.3.5 Cardiac differentiation
MSCs were cultured plated and cultured in complete medium first for 24 hours. To induce cardiac differentiation, the cells were exposed to cardiac media consisting of complete medium with 10 µM 5-azacytidine (Sigma) for 24 hours [60]. After 24 hours, cells were washed with PBS and medium was changed to complete media without the addition of 5-azacytidine. Media was changed every 2-3 days for the duration of the experiment.
To induce cardiac differentiation, EBs were formed in cardiac induction medium consisting of MEM-Alpha, 10% FBS, 1% penicillin/streptomycin, and 1% DMSO (Sigma-Aldrich). After 2 days, the EBs were washed with PBS and cardiac induction medium was replenished. After 4 days in suspension, the EBs were transferred to adherent culture dishes with post-induction medium consisting of MEM-Alpha, 10% FBS, 1% penicillin/streptomycin and cultured up to 21 days.
3.3.6 Neural differentiation
To induce neural differentiation, MSCs were cultured in neural induction medium according to Woodbury et al. [120]. Briefly, MSCs were cultured in neural pre-induction medium for 24 hours, consisting of DMEM, 20% FBS, and 1 mM β-mercaptoethanol (BME, Sigma). To initiate neuronal differentiation, the pre-induction medium were removed, the cells

42
were washed with PBS and transferred to neuronal induction medium composed of DMEM and 10 mM BME. In other experiments, neural differentiation was induced by culturing MSCs in DMEM, 2% dimethylsulfoxide (DMSO), and 200 mM butylated hydroxyanisole (BHA, Sigma) was utilized as the neuronal induction medium. To facilitate long-term survival of MSC-derived neurons several additional components were added to the neuronal induction medium. Long-term neuronal induction medium consisted of DMEM, 2% DMSO, 200 mM BHA, 25 mM KCl (Sigma), 2 mM valproic acid (Sigma), 10 mM forskolin (Sigma), 1 mM hydrocortisone (Sigma), and 5 mg/ml insulin (Sigma).
EBs were cultured in suspension in 100-mm ultra-low attachment culture dishes (Sigma-Aldrich) in neural induction medium consisting of MEM-Alpha, 10% FBS, 1% penicillin/streptomycin, and 10-7 µM RA. After 2 days, the EBs were washed with PBS and neural induction medium was replenished. After 4 days in suspension, the EBs were transferred to adherent culture dishes with continual exposure to neural induction medium.
3.3.7 Endothelial differentiation
To induce endothelial differentiation, MSCs were cultured in endothelial medium consisting of LG-DMEM, 10% FBS, 1% penicillin/streptomycin, and 50 ng/mL VEGF. Media was changed every 2-3 days.
EBs were cultured were cultured in suspension in 100-mm ultra-low attachment culture dishes (Sigma-Aldrich) in endothelial induction medium consisting of MEM-Alpha, 10% FBS, 1% penicillin/streptomycin, and 20 ng/ml VEGF. After 2 days, the EBs were washed with PBS and endothelial induction medium was replenished. After 4 days in suspension, the EBs were transferred to adherent culture dishes with continual exposure to endothelial induction medium.
3.3.8 Scaffold fabrication and cross-linking
Three-dimensional highly-porous scaffolds approximately 2 mm in thickness were fabricated from two types of porcine-derived collagen (Geistlich Biomaterials, Wolhusen, Switzerland) using a freeze-drying technique [33]: 1) type I collagen that contained a small amount of type III collagen; and 2) cartilage-derived collagen which initially included type II collagen with a smaller percentage of type I collagen. The successive proprietary treatments of the cartilage-derived collagen were found to degrade certain epitopes for select type II collagen antibodies. Briefly, a 1% collagen solution was blended in 0.05 M acetic acid (pH 3.2) at 15,000 rpm in a blender with the temperature maintained at 4ºC to prevent denaturation of the collagen fibers. The blended slurry was frozen using a temperature ramping protocol from room temperature to -15ºC in 30 min. After 240 min at -15ºC, the ice phase was sublimated under vacuum (200 mTorr) at -5ºC for a period of 17 hours. Morphometric analysis of the pore structure performed as previously reported indicated a pore diameter of ~180 µm [121].
43
The collagen scaffold sheets were sterilized and cross-linked by dehydrothermal (DHT) treatment at 105ºC and 1 mm Hg for 24 hours [33, 122]. Disks, 8 mm in diameter, were cut from the porous sheets and further cross-linked by treatment with a carbodiimide solution [123, 124]. Matrices were immersed in a solution containing 1-ethyl-3-(3-dimethylaminopropyl) carbodiimide hydrochloride (EDAC; Sigma Chemical Co.) and N-hydroxysuccinimide (NHS; Sigma) with a molar ratio of 1:1:5 EDAC:NHS:carboxylic acid. Scaffolds were immersed in the solutions (1 mL/scaffold) for 30 minutes. EDAC and NHS concentrations were calculated based on a mean scaffold mass of 1.25 mg and 1.2 mM carboxylic acid groups per gram of collagen [123, 125].
3.3.9 Environmental scanning electron microscopy
Environmental Scanning Electron Microscopy (ESEM) was used to examine scaffold pore architecture and morphology. Scaffolds were mounted on glass slides carbon tape, and examined under environmental scanning electron microscopy (ESEM) (FEI/Philips XL30 FEG ESEM) in low-vacuum conditions with an accelerating voltage of 12-15 kV.
3.3.10 Collagen scaffold culture
Scaffolds were pre-wetted by first soaking in 100% reagent alcohol (Fisher Scientific) for 1 day on a rocker until no air bubbles were seen in the scaffolds. The scaffolds were then transferred to 95%, 90%, 75%, and 50% reagent alcohol each for 30 min on a rocker, and then rinsed 3 times in sterile water before soaking in PBS for at least 1 hour. Before cell seeding, sterile filter paper was used to remove excess liquid.
A 20 µL cell suspension of 1 x 10⁶ cells was pipetted onto one side of the scaffold. After 30 min, the scaffolds were carefully flipped over and an additional 1 x 10⁶ cells were added to the opposite side, for a total of 2 x 10⁶ cells per scaffold. Cell-seeded matrices were placed in 12-well plates coated with 1.5 ml of 2% (w/v) agarose to prevent the cell attachment to the culture dish, and incubated at 37°C in 5% CO2. Differentiation medium was added to each sample (1 mL/well) 30 min post-seeding. Medium was changed every 2-3 days until the cultures were terminated at 7 and 14 days. As controls, non-cell-seeded scaffolds were cultured in parallel under the same conditions. The diameters of the cell-seeded scaffolds and unseeded controls were measured every 2-3 days using circular templates.
3.3.11 Analysis of DNA and glycosaminoglycan content
DNA and sulfated-glycosaminoglycan (GAG) content of cell pellets (n = 6) and scaffold constructs (n = 6) from chondrogenic differentiation was analyzed. The samples were first washed in PBS and stored at -20°C until assayed. After lyophilization, pellets were digested overnight with Proteinase K (100µg/ml; Sigma) in Tris-HCl-buffer (50 mM Tris, 1mM CaCl2, pH 8.0) at 60°C.
44
Fluorometric quantification of DNA content in the digests was performed using a Quant-iT PicoGreen dsDNA Assay Kit (Invitrogen). Aliquots of pellet digest were diluted 1:10 in Tris-EDTA buffer (10mM Tris, 1 mM EDTA, pH 8.0, Gibco) and processed according to the kit protocol with fluorescence reading at 485nm/535nm for 1.0s against a lambda DNA standard on a microplate reader (Wallac Victor2 1420 Multilabel Counter, PerkinElmer Life and Analytical Sciences, Inc., Wellesley, MA).
The GAG content of the matrices was determined by the dimethylmethylene blue (DMMB) dye assay [126]. Aliquots of scaffold digest were diluted 1:10 in Tris-EDTA buffer and diluted further 1:10 in DMMB dye and the absorbance at 530 nm measured with the same microplate reader. GAG content was derived by comparison of the absorbance measurements with a standard curve obtained using chondroitin-6-sulfate from shark cartilage (Sigma).
3.3.12 Immunocytochemistry
For monolayer culture of cells in control, cardiac, neural, and endothelial media, the media was removed and the cells were washed three times in PBS and fixed in 4% paraformaldehyde for 10 min at room temperature. After washing with PBS, they were then permeabilized in 0.05% Triton-X 100 (Sigma) for 5 min at 4ºC. The cells were again washed in PBS followed by quenching of endogenous peroxidase activity with a peroxidase blocking reagent (Envision Plus+ System-HRP (AEC), Dako, Carpinteria, CA). Non-specific binding was blocked by protein block serum-free (Dako). Sections were incubated with primary antibodies overnight at 4ºC in a humidified chamber. Monoclonal anti-actin, α-smooth muscle antibody (Sigma-Aldrich) was used at a dilution of 1:200. Monoclonal anti-alpha-actinin (sarcomeric) (Sigma-Aldrich) was used at a dilution of 1:100. Monoclonal cardiac myosin heavy chain (Abcam) was used at a dilution of 1:200. Monoclonal cardiac Troponin I antibody (Abcam, Cambridge, MA) was used at a dilution of 1:200. Monoclonal neuronal class III β-tubulin antibody (Covance, Princeton, NJ) was used at a dilution of 1:2000. Polyclonal von Willebrand Factor antibody, (Abcam) was used at a dilution of 1:400. Negative controls were incubated with mouse IgG2a, mouse IgG2b, mouse IgG1 or rabbit IgG fraction (Dako) at the same dilution instead of the primary antibody. Labeling was detected by incubation with Labeled Polymer-HRP anti-mouse or anti-rabbit (Dako) followed by AEC+ Substrate-Chromogen (Dako). Mayer’s hematoxylin (Sigma) was used as a counterstain. Coverslips were immediately affixed using faramount aqueous mounting medium (Dako).
3.3.13 Histology and immunohistochemistry
Pellet samples (n = 3) and scaffold constructs (n = 7) from chondrogenic differentiation, as well as scaffold constructs from cardiac (n = 6), neural (n = 6), and endothelial (n = 6) differentiation were washed three times in PBS and fixed in 4% paraformaldehyde for 3 hours prior to dehydration and embedding in paraffin for microtomy. Sections 6-µm thick were

45
mounted on glass slides and stained with hematoxylin and eosin (H&E) or Safranin-O using standard histological techniques.
Immunohistochemical staining of pellets and scaffolds was performed using the Envision Plus+ System-HRP (AEC) kit (Dako) with a Dako Autostainer. Deparaffinized and rehydrated sections were digested for 40 minutes in 0.1% protease XIV (Sigma), followed by quenching of endogenous peroxidase activity with a peroxidase blocking reagent (Dako). Non-specific binding was blocked by protein block serum-free (Dako). The primary antibodies were applied for 45 minutes. Monoclonal anti-actin, α-smooth muscle antibody (Sigma-Aldrich) was used at a dilution of 1:200. Monoclonal cardiac Troponin I antibody (Abcam) was used at a dilution of 1:200. Monoclonal cardiac myosin heavy chain (Abcam) was used at a dilution of 1:200. Monoclonal neuronal class III β-tubulin antibody (Covance) was used at a dilution of 1:2000. Polyclonal von Willebrand Factor antibody, (Abcam) was used at a dilution of 1:400. Negative controls were incubated with mouse IgG2a, mouse IgG2b, mouse IgG1 or rabbit IgG fraction (Dako) at the same dilution instead of the primary antibody. Labeling was detected by incubation with Labeled Polymer-HRP anti-mouse or anti-rabbit (Dako) followed by AEC+ Substrate-Chromogen (Dako). Mayer’s hematoxylin (Sigma) was used as a counterstain. Coverslips were immediately affixed using faramount aqueous mounting medium (Dako).
3.3.14 Immunofluorescence
Immunofluorescent evaluation was used on some monolayer cultures and scaffold sections for better visualization of staining. These samples were washed 3 times in PBS before non-specific blocking with 10% donkey serum with 0.3% Triton X-100 for 2 hours. Primary antibodies were diluted in 5% donkey serum and applied for 2 hours at room temperature. Secondary detections used were monoclonal mouse anti-rhodamine (Jackson Immunoresearch, West Grove, PA; red) and monoclonal rabbit anti-fluorescein (Jackson Immunoresearch; green) diluted to 1:100 in 5% donkey serum and applied for 2 hours. After two washes with 0.3% Triton X-100 for 5 min each, DAPI was applied for 30 min. Coverslips were affixed using faramount aqueous mounting medium (Dako) and slides were immediately imaged.
3.3.15 Western blot
At the end of the culture period, cells were washed in PBS, trypsinized, and placed in CelLytic MT lysis buffer (Sigma) for 15 min on a shaker at 150 rpm. The lysed cells were then centrifuged to pellet the cell debris. The protein-containing supernatant collected and stored at -20°C.
A standard curve relating optical density to protein content was first obtained through serial dilutions of a bovine serum albumin (BSA) stock solution in distilled water (1 mg/mL) and added to Bio-Rad protein assay dye (Bio-Rad, Hercules, CA). For each sample of isolated proteins, 100 µL of the supernatant was added to 700 µL distilled deionized water and 200 µL
46
dye. The solution was mixed via a pipette and incubated at room temperature for 30 min and then transferred into a cuvette. Each cuvette was placed into a SmartSpec 3000 spectrophotometer (Bio-Rad) and read at 595 nm. The optical density readings were then converted into protein concentration using the standard curve.
3.3.16 Statistics
Data are reported as mean ± standard deviation. Statistical significance was determined by analysis of variance (ANOVA) and Fisher’s protected least squares differences (PLSD) post-hoc testing with a significance criterion of p < 0.05 using StatView (SAS Institute, Cary, NC).
3.4 Results
3.4.1 MSC differentiation assays for chondrogenesis, osteogenesis, and adipogenesis
Adherent cells from bone marrow aspirate were cultured in chrondrogenic, osteogenic, and adipogenic media as described. Passage 3 MSCs cultured as micromass pellets in chondrogenic media formed well-defined condensed tissue-filled cell pellets of spherical shape, approximately 1 mm in diameter, at the end of 14 days. All the MSC-pellets (n = 10) formed well-defined condensed tissue-filled cell pellets of spherical shape, approximately 1 mm in diameter, at the end of 14 days. Furthermore, MSCs formed tissue that stained with Safranin-O for sulfated-GAG (Figure 3-1A,B) and immunohistochemically for type II collagen (Figure 3-1C,D). Many of the cells in these constructs were rounded and resided in lacunae (Figure 3-1B,D), which are morphologic characteristics of chondrocytes.

47
Figure 3-1 MSC differentiation assays (A,B) SafO stain and (C,D) type II collagen for chondrogenesis, (E) Von Kossa stain for osteogenesis [118], (F) Oil red stain for adipogenesis [118].
Previous work in our lab by Kinner et al., investigated the pluripotency of MSCs via osteogenic and adipogenic differentiation [118]. All cultures treated with osteogenic medium resulted in the deposition of mineral as assessed by von Kossa stain (Figure 3-1E). The amount of mineral deposited decreased with increasing passage number. Cultures treated with adipogenic medium resulted in differentiation of fat cells containing fat vacuoles could be seen (Figure 3-1F). Deposition of mineral was minimal in these cultures. Cells that were cultured in complete medium did not show positive staining for either marker.
3.4.2 MSC and ECC pellet culture for chondrogenesis
As a comparative study, ECCs were investigated for chondrogenesis. When cultured as micromass, ECCs formed a loose aggregate of cells with no indication of contraction, condensation, or ECM synthesis. H&E staining of the MSC pellets showed dispersed nuclei amidst newly synthesized tissue whereas ECC pellets contained almost all cells with no tissue formation (Figure 3-2A,E). In contrast, the ECC-pellets did not stain with Safranin-O or type II collagen (Figure 3-2F,H), indicating an absence of chondrogenesis.
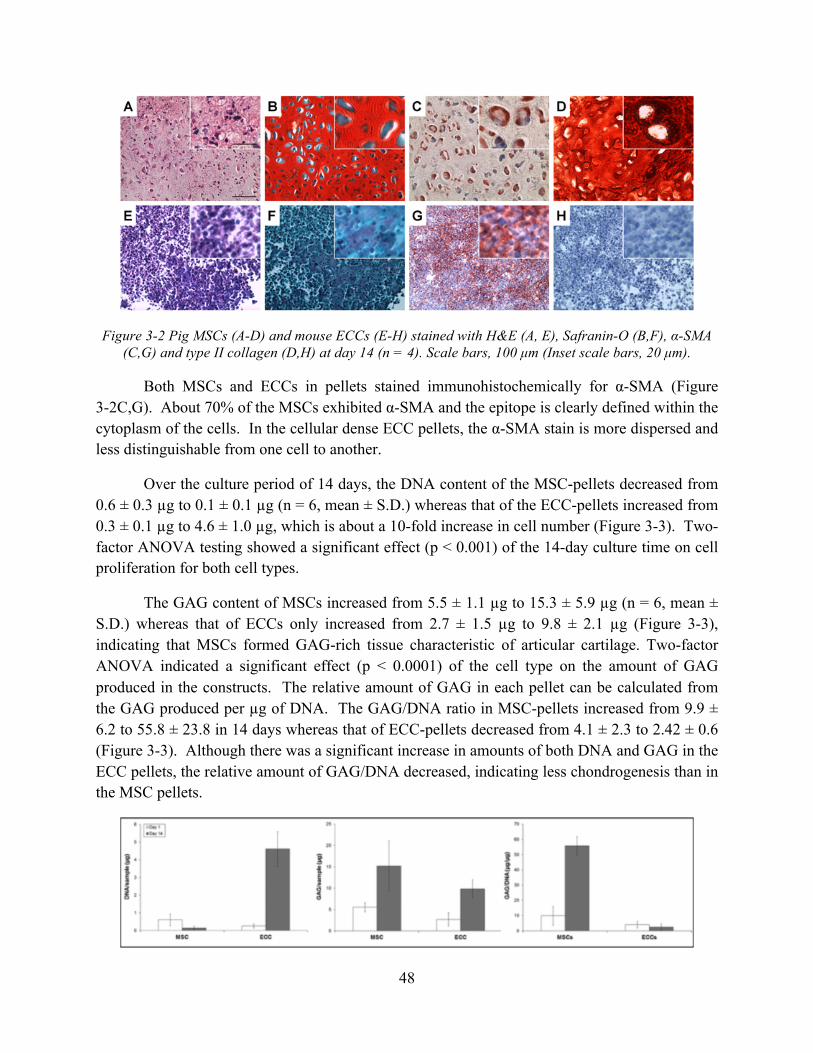
48
Figure 3-2 Pig MSCs (A-D) and mouse ECCs (E-H) stained with H&E (A, E), Safranin-O (B,F), α-SMA (C,G) and type II collagen (D,H) at day 14 (n = 4). Scale bars, 100 µm (Inset scale bars, 20 µm).
Both MSCs and ECCs in pellets stained immunohistochemically for α-SMA (Figure 3-2C,G). About 70% of the MSCs exhibited α-SMA and the epitope is clearly defined within the cytoplasm of the cells. In the cellular dense ECC pellets, the α-SMA stain is more dispersed and less distinguishable from one cell to another.
Over the culture period of 14 days, the DNA content of the MSC-pellets decreased from 0.6 ± 0.3 µg to 0.1 ± 0.1 µg (n = 6, mean ± S.D.) whereas that of the ECC-pellets increased from 0.3 ± 0.1 µg to 4.6 ± 1.0 µg, which is about a 10-fold increase in cell number (Figure 3-3). Two-factor ANOVA testing showed a significant effect (p < 0.001) of the 14-day culture time on cell proliferation for both cell types.
The GAG content of MSCs increased from 5.5 ± 1.1 µg to 15.3 ± 5.9 µg (n = 6, mean ± S.D.) whereas that of ECCs only increased from 2.7 ± 1.5 µg to 9.8 ± 2.1 µg (Figure 3-3), indicating that MSCs formed GAG-rich tissue characteristic of articular cartilage. Two-factor ANOVA indicated a significant effect (p < 0.0001) of the cell type on the amount of GAG produced in the constructs. The relative amount of GAG in each pellet can be calculated from the GAG produced per µg of DNA. The GAG/DNA ratio in MSC-pellets increased from 9.9 ± 6.2 to 55.8 ± 23.8 in 14 days whereas that of ECC-pellets decreased from 4.1 ± 2.3 to 2.42 ± 0.6 (Figure 3-3). Although there was a significant increase in amounts of both DNA and GAG in the ECC pellets, the relative amount of GAG/DNA decreased, indicating less chondrogenesis than in the MSC pellets.
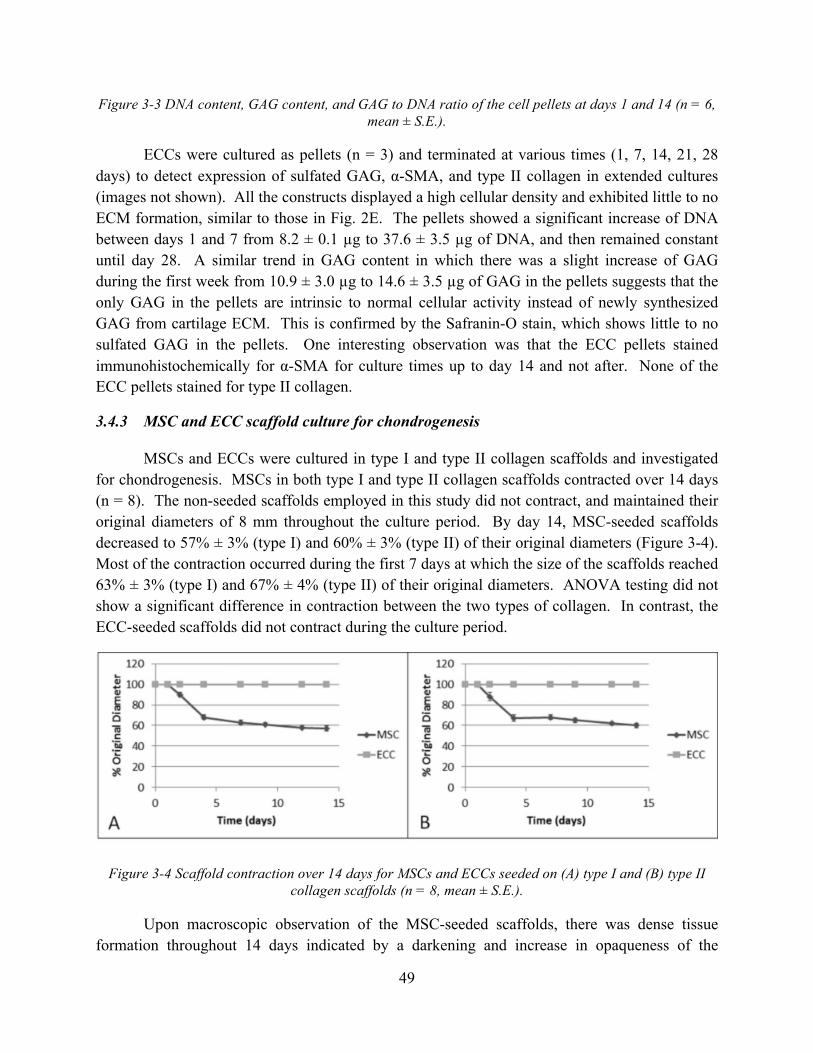
49
Figure 3-3 DNA content, GAG content, and GAG to DNA ratio of the cell pellets at days 1 and 14 (n = 6, mean ± S.E.).
ECCs were cultured as pellets (n = 3) and terminated at various times (1, 7, 14, 21, 28 days) to detect expression of sulfated GAG, α-SMA, and type II collagen in extended cultures (images not shown). All the constructs displayed a high cellular density and exhibited little to no ECM formation, similar to those in Fig. 2E. The pellets showed a significant increase of DNA between days 1 and 7 from 8.2 ± 0.1 µg to 37.6 ± 3.5 µg of DNA, and then remained constant until day 28. A similar trend in GAG content in which there was a slight increase of GAG during the first week from 10.9 ± 3.0 µg to 14.6 ± 3.5 µg of GAG in the pellets suggests that the only GAG in the pellets are intrinsic to normal cellular activity instead of newly synthesized GAG from cartilage ECM. This is confirmed by the Safranin-O stain, which shows little to no sulfated GAG in the pellets. One interesting observation was that the ECC pellets stained immunohistochemically for α-SMA for culture times up to day 14 and not after. None of the ECC pellets stained for type II collagen.
3.4.3 MSC and ECC scaffold culture for chondrogenesis
MSCs and ECCs were cultured in type I and type II collagen scaffolds and investigated for chondrogenesis. MSCs in both type I and type II collagen scaffolds contracted over 14 days (n = 8). The non-seeded scaffolds employed in this study did not contract, and maintained their original diameters of 8 mm throughout the culture period. By day 14, MSC-seeded scaffolds decreased to 57% ± 3% (type I) and 60% ± 3% (type II) of their original diameters (Figure 3-4). Most of the contraction occurred during the first 7 days at which the size of the scaffolds reached 63% ± 3% (type I) and 67% ± 4% (type II) of their original diameters. ANOVA testing did not show a significant difference in contraction between the two types of collagen. In contrast, the ECC-seeded scaffolds did not contract during the culture period.
Figure 3-4 Scaffold contraction over 14 days for MSCs and ECCs seeded on (A) type I and (B) type II collagen scaffolds (n = 8, mean ± S.E.).
Upon macroscopic observation of the MSC-seeded scaffolds, there was dense tissue formation throughout 14 days indicated by a darkening and increase in opaqueness of the
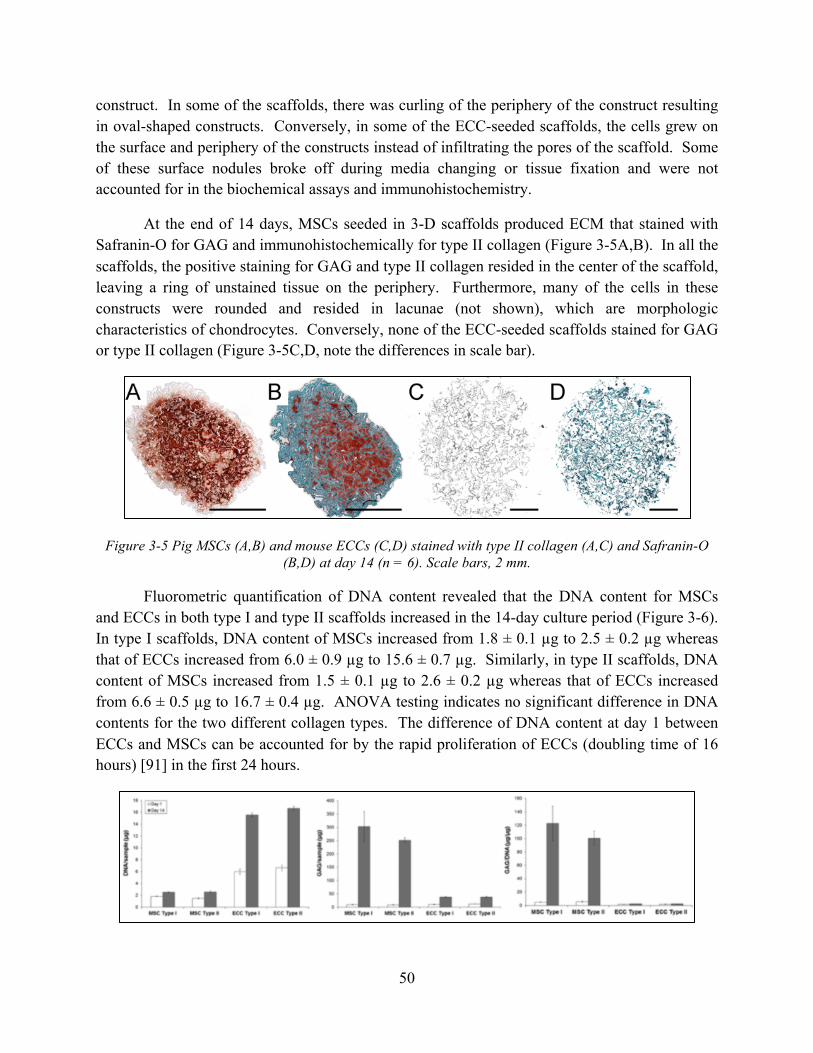
50
construct. In some of the scaffolds, there was curling of the periphery of the construct resulting in oval-shaped constructs. Conversely, in some of the ECC-seeded scaffolds, the cells grew on the surface and periphery of the constructs instead of infiltrating the pores of the scaffold. Some of these surface nodules broke off during media changing or tissue fixation and were not accounted for in the biochemical assays and immunohistochemistry.
At the end of 14 days, MSCs seeded in 3-D scaffolds produced ECM that stained with Safranin-O for GAG and immunohistochemically for type II collagen (Figure 3-5A,B). In all the scaffolds, the positive staining for GAG and type II collagen resided in the center of the scaffold, leaving a ring of unstained tissue on the periphery. Furthermore, many of the cells in these constructs were rounded and resided in lacunae (not shown), which are morphologic characteristics of chondrocytes. Conversely, none of the ECC-seeded scaffolds stained for GAG or type II collagen (Figure 3-5C,D, note the differences in scale bar).
Figure 3-5 Pig MSCs (A,B) and mouse ECCs (C,D) stained with type II collagen (A,C) and Safranin-O (B,D) at day 14 (n = 6). Scale bars, 2 mm.
Fluorometric quantification of DNA content revealed that the DNA content for MSCs and ECCs in both type I and type II scaffolds increased in the 14-day culture period (Figure 3-6). In type I scaffolds, DNA content of MSCs increased from 1.8 ± 0.1 µg to 2.5 ± 0.2 µg whereas that of ECCs increased from 6.0 ± 0.9 µg to 15.6 ± 0.7 µg. Similarly, in type II scaffolds, DNA content of MSCs increased from 1.5 ± 0.1 µg to 2.6 ± 0.2 µg whereas that of ECCs increased from 6.6 ± 0.5 µg to 16.7 ± 0.4 µg. ANOVA testing indicates no significant difference in DNA contents for the two different collagen types. The difference of DNA content at day 1 between ECCs and MSCs can be accounted for by the rapid proliferation of ECCs (doubling time of 16 hours) [91] in the first 24 hours.
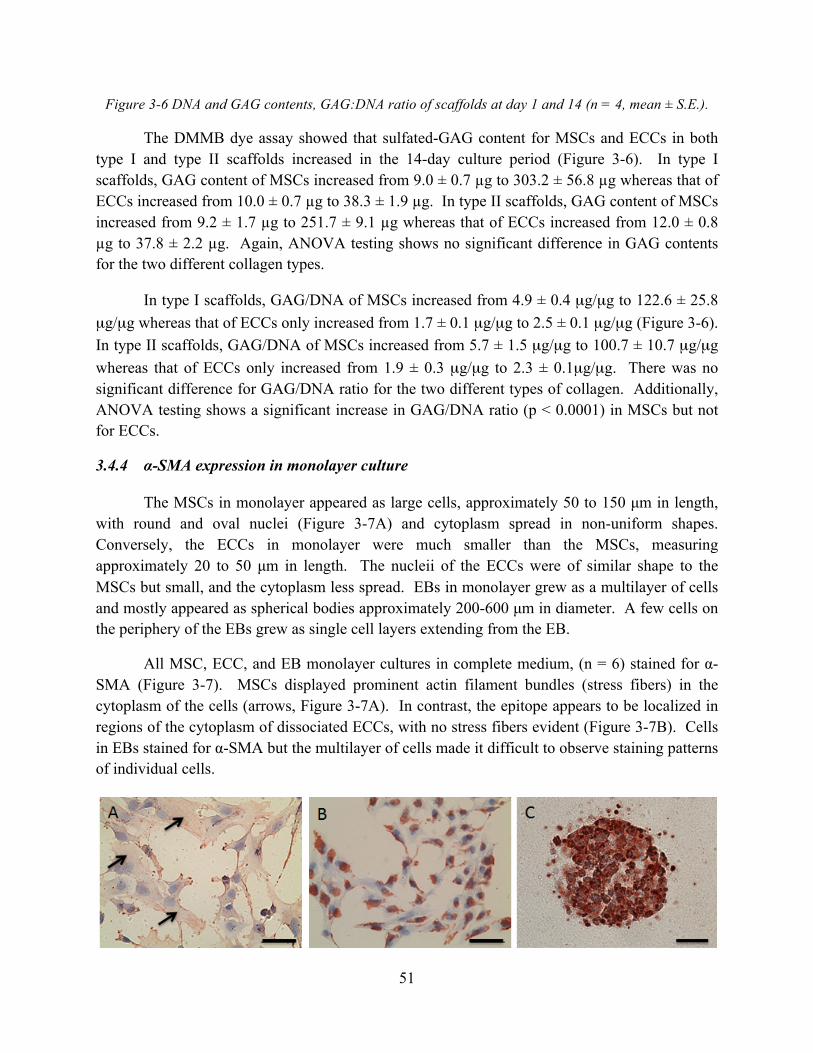
51
Figure 3-6 DNA and GAG contents, GAG:DNA ratio of scaffolds at day 1 and 14 (n = 4, mean ± S.E.).
The DMMB dye assay showed that sulfated-GAG content for MSCs and ECCs in both type I and type II scaffolds increased in the 14-day culture period (Figure 3-6). In type I scaffolds, GAG content of MSCs increased from 9.0 ± 0.7 µg to 303.2 ± 56.8 µg whereas that of ECCs increased from 10.0 ± 0.7 µg to 38.3 ± 1.9 µg. In type II scaffolds, GAG content of MSCs increased from 9.2 ± 1.7 µg to 251.7 ± 9.1 µg whereas that of ECCs increased from 12.0 ± 0.8 µg to 37.8 ± 2.2 µg. Again, ANOVA testing shows no significant difference in GAG contents for the two different collagen types.
In type I scaffolds, GAG/DNA of MSCs increased from 4.9 ± 0.4 µg/µg to 122.6 ± 25.8 µg/µg whereas that of ECCs only increased from 1.7 ± 0.1 µg/µg to 2.5 ± 0.1 µg/µg (Figure 3-6). In type II scaffolds, GAG/DNA of MSCs increased from 5.7 ± 1.5 µg/µg to 100.7 ± 10.7 µg/µg whereas that of ECCs only increased from 1.9 ± 0.3 µg/µg to 2.3 ± 0.1µg/µg. There was no significant difference for GAG/DNA ratio for the two different types of collagen. Additionally, ANOVA testing shows a significant increase in GAG/DNA ratio (p < 0.0001) in MSCs but not for ECCs.
3.4.4 α-SMA expression in monolayer culture
The MSCs in monolayer appeared as large cells, approximately 50 to 150 µm in length, with round and oval nuclei (Figure 3-7A) and cytoplasm spread in non-uniform shapes. Conversely, the ECCs in monolayer were much smaller than the MSCs, measuring approximately 20 to 50 µm in length. The nucleii of the ECCs were of similar shape to the MSCs but small, and the cytoplasm less spread. EBs in monolayer grew as a multilayer of cells and mostly appeared as spherical bodies approximately 200-600 µm in diameter. A few cells on the periphery of the EBs grew as single cell layers extending from the EB.
All MSC, ECC, and EB monolayer cultures in complete medium, (n = 6) stained for α-SMA (Figure 3-7). MSCs displayed prominent actin filament bundles (stress fibers) in the cytoplasm of the cells (arrows, Figure 3-7A). In contrast, the epitope appears to be localized in regions of the cytoplasm of dissociated ECCs, with no stress fibers evident (Figure 3-7B). Cells in EBs stained for α-SMA but the multilayer of cells made it difficult to observe staining patterns of individual cells.
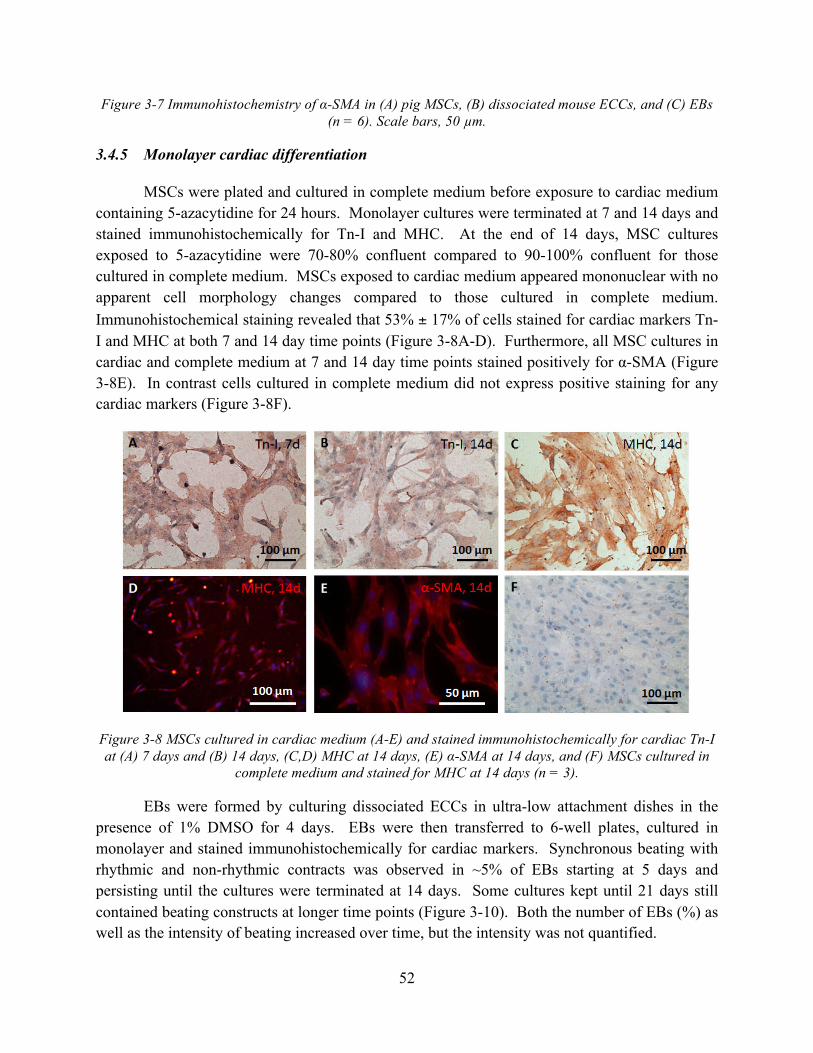
52
Figure 3-7 Immunohistochemistry of α-SMA in (A) pig MSCs, (B) dissociated mouse ECCs, and (C) EBs (n = 6). Scale bars, 50 µm.
3.4.5 Monolayer cardiac differentiation
MSCs were plated and cultured in complete medium before exposure to cardiac medium containing 5-azacytidine for 24 hours. Monolayer cultures were terminated at 7 and 14 days and stained immunohistochemically for Tn-I and MHC. At the end of 14 days, MSC cultures exposed to 5-azacytidine were 70-80% confluent compared to 90-100% confluent for those cultured in complete medium. MSCs exposed to cardiac medium appeared mononuclear with no apparent cell morphology changes compared to those cultured in complete medium. Immunohistochemical staining revealed that 53% ± 17% of cells stained for cardiac markers Tn-I and MHC at both 7 and 14 day time points (Figure 3-8A-D). Furthermore, all MSC cultures in cardiac and complete medium at 7 and 14 day time points stained positively for α-SMA (Figure 3-8E). In contrast cells cultured in complete medium did not express positive staining for any cardiac markers (Figure 3-8F).
Figure 3-8 MSCs cultured in cardiac medium (A-E) and stained immunohistochemically for cardiac Tn-I at (A) 7 days and (B) 14 days, (C,D) MHC at 14 days, (E) α-SMA at 14 days, and (F) MSCs cultured in
complete medium and stained for MHC at 14 days (n = 3).
EBs were formed by culturing dissociated ECCs in ultra-low attachment dishes in the presence of 1% DMSO for 4 days. EBs were then transferred to 6-well plates, cultured in monolayer and stained immunohistochemically for cardiac markers. Synchronous beating with rhythmic and non-rhythmic contracts was observed in ~5% of EBs starting at 5 days and persisting until the cultures were terminated at 14 days. Some cultures kept until 21 days still contained beating constructs at longer time points (Figure 3-10). Both the number of EBs (%) as well as the intensity of beating increased over time, but the intensity was not quantified.
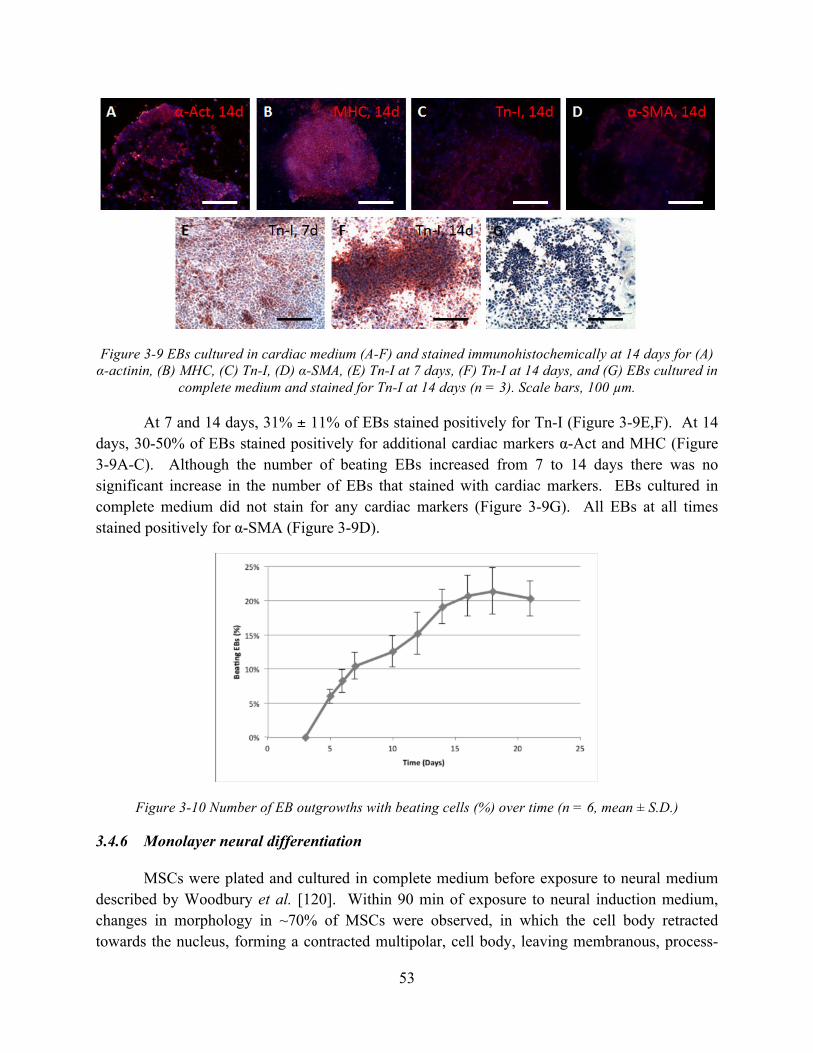
53
Figure 3-9 EBs cultured in cardiac medium (A-F) and stained immunohistochemically at 14 days for (A) α-actinin, (B) MHC, (C) Tn-I, (D) α-SMA, (E) Tn-I at 7 days, (F) Tn-I at 14 days, and (G) EBs cultured in
complete medium and stained for Tn-I at 14 days (n = 3). Scale bars, 100 µm.
At 7 and 14 days, 31% ± 11% of EBs stained positively for Tn-I (Figure 3-9E,F). At 14 days, 30-50% of EBs stained positively for additional cardiac markers α-Act and MHC (Figure 3-9A-C). Although the number of beating EBs increased from 7 to 14 days there was no significant increase in the number of EBs that stained with cardiac markers. EBs cultured in complete medium did not stain for any cardiac markers (Figure 3-9G). All EBs at all times stained positively for α-SMA (Figure 3-9D).
Figure 3-10 Number of EB outgrowths with beating cells (%) over time (n = 6, mean ± S.D.)
3.4.6 Monolayer neural differentiation
MSCs were plated and cultured in complete medium before exposure to neural medium described by Woodbury et al. [120]. Within 90 min of exposure to neural induction medium, changes in morphology in ~70% of MSCs were observed, in which the cell body retracted towards the nucleus, forming a contracted multipolar, cell body, leaving membranous, process-

54
like extensions peripherally. Over the subsequent 2 hours, cell bodies became increasingly spherical, exhibiting a typical neuronal perikaryal appearance.
Immunohistochemical staining of the cells revealed that about 29% ± 8% of the cells stained positively for TUJ1, a marker for immature neurons (Figure 3-11A). Positive staining was also observed at longer time points up to 7 days, but cultures contained many dead cells. All cells, whether displaying neuronal or MSC morphology stained positively for α-SMA (Figure 3-11B).
Figure 3-11 MSCs cultured in neural medium and stained immunohistochemically for (A) TUJ1 and (B) α-SMA at 1 day (n = 4). Scale bars, 50 µm.
EBs were formed by culturing dissociated ECCs in ultra-low attachment dishes in the presence of 10-7 M RA for 4 days. EBs (100 – 200 µm in diameter) were then transferred to 6-well plates and cultured in monolayer. Detection of immunohistochemical staining for TUJ1 was observed as early as 2 days in monolayer culture and continued until the cultures were terminated at 14 days (Figure 3-12). At early time points, the pattern of staining for TUJ1 was the most intense on the periphery of the EBs (Figure 3-12A) and at later time points, neuron-like extensions were found homogenously throughout the EBs (Figure 3-12B,C). At 14 days, 75% ± 16% of EB cultures had positive staining for TUJ1. In contrast, undifferentiated EBs did not stain for TUJ1 (Figure 3-12D). Western blot data confirms low levels of neural nitric oxide synthase (N-Nos) expression in EBs cultured in complete medium while induction of the neuronal phenotype resulted in a dramatic increase in N-Nos expression (Figure 3-13).

55
Figure 3-12 EBs cultured in in neural medium and stained immunohistochemically for TUJ1 at (A) 2 days, (B) 7 days, (C) 14 days, and (D) EBs cultured in complete medium did not stain for TUJ1 for time
points up until 14 days. Scale bar, 100 µm.
Figure 3-13 Western blot analysis confirms expression of N-Nos for EBs exposed to 10-7 M RA compared to those cultured in complete medium.
3.4.7 Monolayer endothelial differentiation
MSCs were plated and cultured in complete medium before exposure to endothelial medium containing 50 ng/ml VEGF described by Oswald et al. [127]. Monolayer cultures were terminated at 7 and 14 days and stained immunohistochemically for vWF. After 14 days of culture, the cultures were confluent and consisted of a monolayer of spindle-shaped cells. Staining for vWF was chosen for the basal characterization of endothelial-like cells. At 7 days staining for vWF was not observed in any monolayer cultures. At 14 days, very few cells (<1%) showed positive staining for vWF (Figure 3-14). MSCs cultured in complete medium showed no specific staining for vWF.
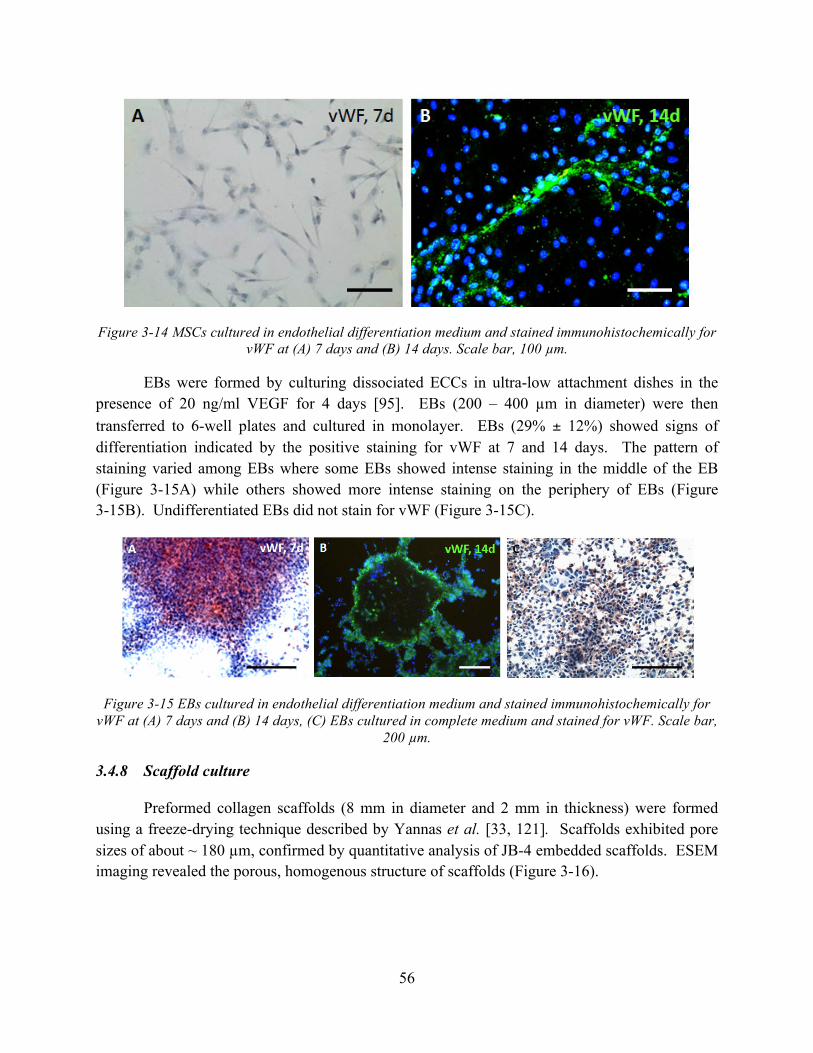
56
Figure 3-14 MSCs cultured in endothelial differentiation medium and stained immunohistochemically for vWF at (A) 7 days and (B) 14 days. Scale bar, 100 µm.
EBs were formed by culturing dissociated ECCs in ultra-low attachment dishes in the presence of 20 ng/ml VEGF for 4 days [95]. EBs (200 – 400 µm in diameter) were then transferred to 6-well plates and cultured in monolayer. EBs (29% ± 12%) showed signs of differentiation indicated by the positive staining for vWF at 7 and 14 days. The pattern of staining varied among EBs where some EBs showed intense staining in the middle of the EB (Figure 3-15A) while others showed more intense staining on the periphery of EBs (Figure 3-15B). Undifferentiated EBs did not stain for vWF (Figure 3-15C).
Figure 3-15 EBs cultured in endothelial differentiation medium and stained immunohistochemically for vWF at (A) 7 days and (B) 14 days, (C) EBs cultured in complete medium and stained for vWF. Scale bar,
200 µm.
3.4.8 Scaffold culture
Preformed collagen scaffolds (8 mm in diameter and 2 mm in thickness) were formed using a freeze-drying technique described by Yannas et al. [33, 121]. Scaffolds exhibited pore sizes of about ~ 180 µm, confirmed by quantitative analysis of JB-4 embedded scaffolds. ESEM imaging revealed the porous, homogenous structure of scaffolds (Figure 3-16).
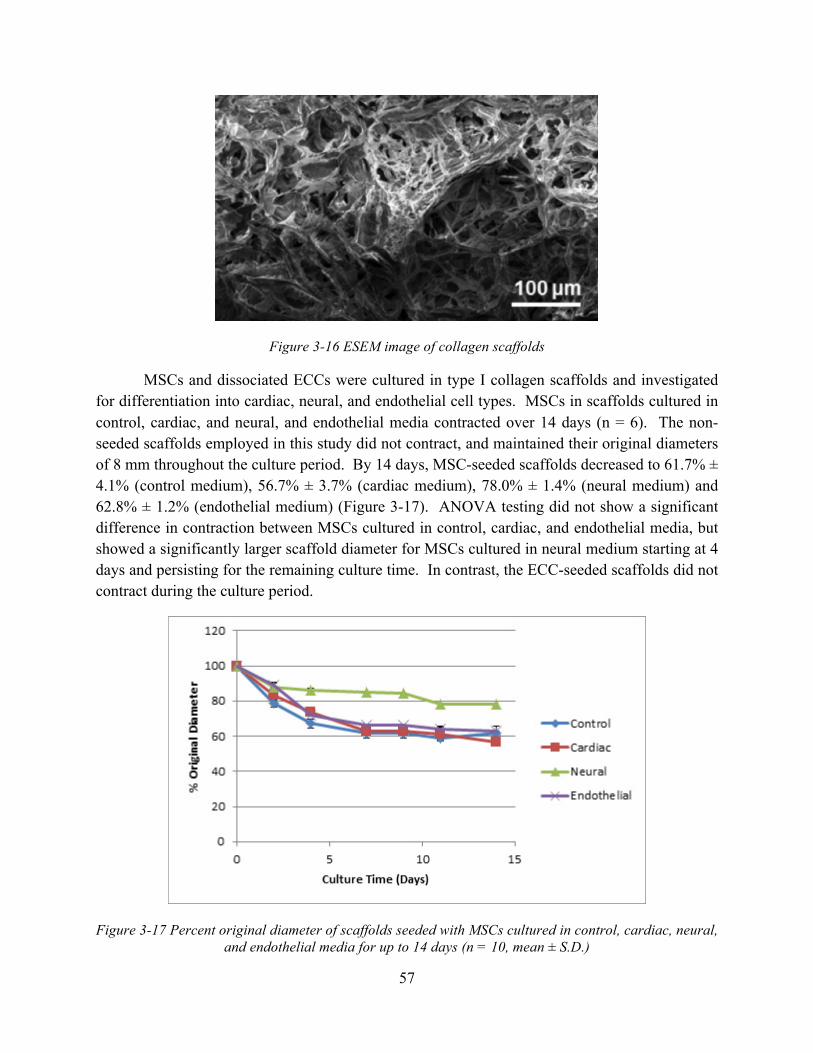
57
Figure 3-16 ESEM image of collagen scaffolds
MSCs and dissociated ECCs were cultured in type I collagen scaffolds and investigated for differentiation into cardiac, neural, and endothelial cell types. MSCs in scaffolds cultured in control, cardiac, and neural, and endothelial media contracted over 14 days (n = 6). The non-seeded scaffolds employed in this study did not contract, and maintained their original diameters of 8 mm throughout the culture period. By 14 days, MSC-seeded scaffolds decreased to 61.7% ± 4.1% (control medium), 56.7% ± 3.7% (cardiac medium), 78.0% ± 1.4% (neural medium) and 62.8% ± 1.2% (endothelial medium) (Figure 3-17). ANOVA testing did not show a significant difference in contraction between MSCs cultured in control, cardiac, and endothelial media, but showed a significantly larger scaffold diameter for MSCs cultured in neural medium starting at 4 days and persisting for the remaining culture time. In contrast, the ECC-seeded scaffolds did not contract during the culture period.
Figure 3-17 Percent original diameter of scaffolds seeded with MSCs cultured in control, cardiac, neural, and endothelial media for up to 14 days (n = 10, mean ± S.D.)
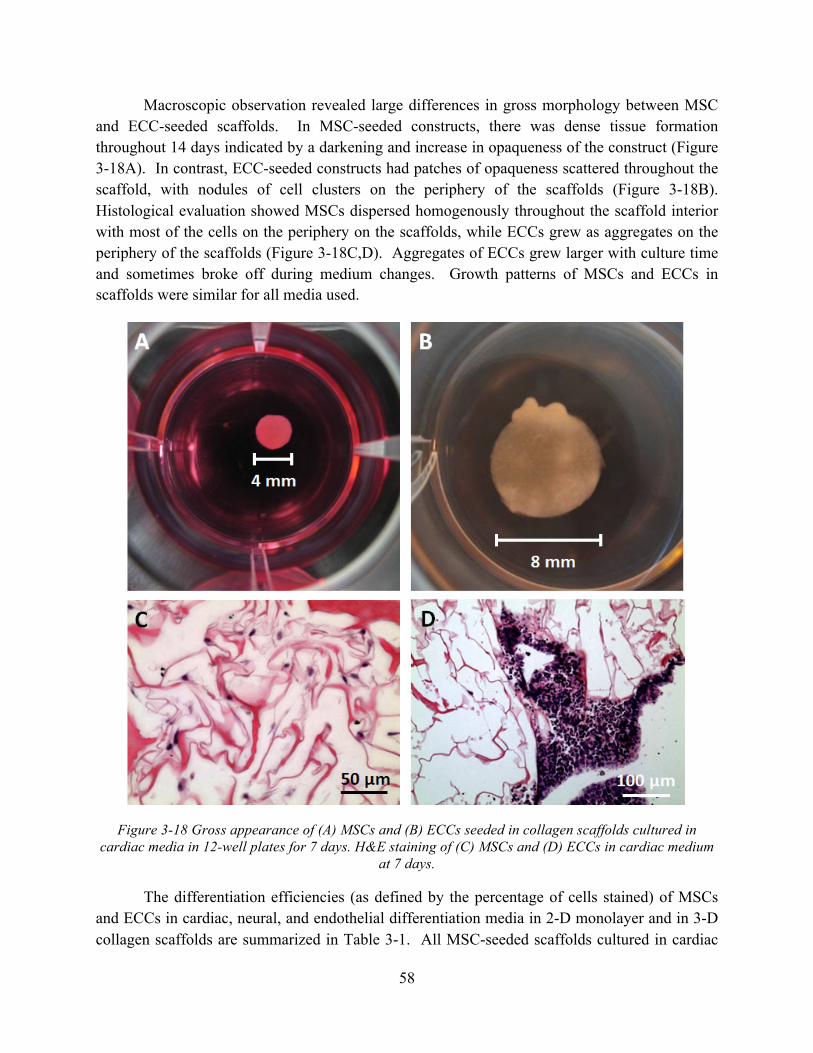
58
Macroscopic observation revealed large differences in gross morphology between MSC and ECC-seeded scaffolds. In MSC-seeded constructs, there was dense tissue formation throughout 14 days indicated by a darkening and increase in opaqueness of the construct (Figure 3-18A). In contrast, ECC-seeded constructs had patches of opaqueness scattered throughout the scaffold, with nodules of cell clusters on the periphery of the scaffolds (Figure 3-18B). Histological evaluation showed MSCs dispersed homogenously throughout the scaffold interior with most of the cells on the periphery on the scaffolds, while ECCs grew as aggregates on the periphery of the scaffolds (Figure 3-18C,D). Aggregates of ECCs grew larger with culture time and sometimes broke off during medium changes. Growth patterns of MSCs and ECCs in scaffolds were similar for all media used.
Figure 3-18 Gross appearance of (A) MSCs and (B) ECCs seeded in collagen scaffolds cultured in cardiac media in 12-well plates for 7 days. H&E staining of (C) MSCs and (D) ECCs in cardiac medium
at 7 days.
The differentiation efficiencies (as defined by the percentage of cells stained) of MSCs and ECCs in cardiac, neural, and endothelial differentiation media in 2-D monolayer and in 3-D collagen scaffolds are summarized in Table 3-1. All MSC-seeded scaffolds cultured in cardiac

59
medium formed tissue, mostly on the periphery of the scaffold along with colonies of cells. Approximately 43% ± 15% of MSCs showed signs of cardiac differentiation, indicated by positive staining for MHC at 7 and 14 days (Figure 3-19A). MSCs in the scaffold appeared to be attached to collagen struts. Cell morphology was difficult to distinguish in the scaffold structure. In neural medium, MSCs mostly appeared as individual cells dispersed in the scaffold or colonies residing in pores of the scaffold. MSCs did not stain for TUJ1 at any time point (Figure 3-19B). In endothelial medium, MSCs appeared as individual cells residing in the pores of the scaffold. The cells did not stain for vWF at 7 or 14 days (Figure 3-19C).
Table 3-1 Differentiation efficiency of MSCs and ECCs in cardiac, neural, and endothelial differentiation media (% stained cells) (n = 3, mean ± S.D.)
MSCs ECCs Monolayer Scaffold Monolayer Scaffold Cardiac 53% ± 17% 43% ± 15% 31% ± 11% 5% ± 2% Neural 29% ± 8% 0% ± 0% 75% ± 16% 5% ± 3% Endothelial 1% ± 1% 0% ± 0% 29% ± 12% 0% ± 0%
ECCs cultured in cardiac medium formed EB-like structures on the periphery and interior of the scaffolds in ECC-seeded constructs and appeared to be bounded by the collagen struts. Most ECCs grew as colonies and very few isolated ECCs were identified in the scaffold. Very few of the ECC colonies (5% ± 2%) stained for MHC at 7 and 14 days (Figure 3-19D). Beating colonies were not observed in scaffold constructs.
ECCs cultured in neural medium formed on the periphery of scaffolds and 5% ± 3% of cells stained positively for TUJ1 at 7 days (Figure 3-19E). Dissociated cells found in the interior of the scaffold did not display neural markers. Furthermore, scaffold struts were not identified in immunofluorescent images because TUJ1 staining was concentrated in areas of EB formation within or outside of scaffold pores.
In endothelial medium, ECCs were clustered on the periphery of the scaffolds similar to EB-like formation in cardiac and neural media. These cells did not stain for vWF at any time point (Figure 3-19F).
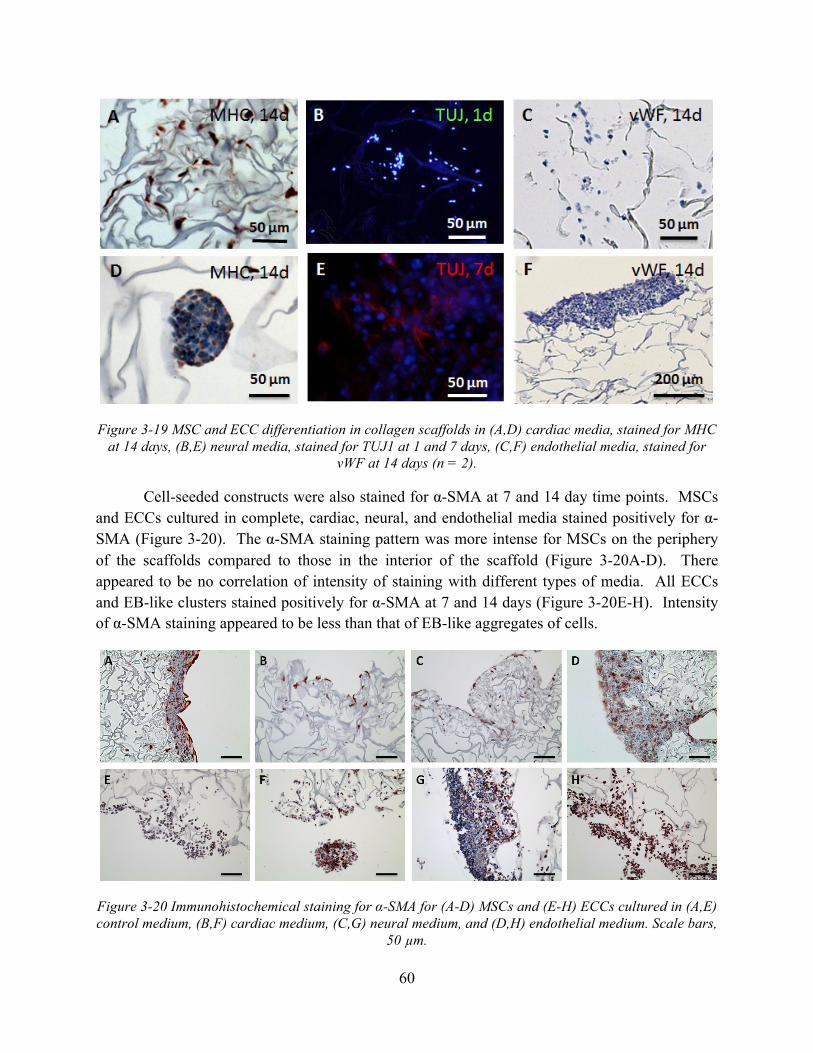
60
Figure 3-19 MSC and ECC differentiation in collagen scaffolds in (A,D) cardiac media, stained for MHC at 14 days, (B,E) neural media, stained for TUJ1 at 1 and 7 days, (C,F) endothelial media, stained for
vWF at 14 days (n = 2).
Cell-seeded constructs were also stained for α-SMA at 7 and 14 day time points. MSCs and ECCs cultured in complete, cardiac, neural, and endothelial media stained positively for α-SMA (Figure 3-20). The α-SMA staining pattern was more intense for MSCs on the periphery of the scaffolds compared to those in the interior of the scaffold (Figure 3-20A-D). There appeared to be no correlation of intensity of staining with different types of media. All ECCs and EB-like clusters stained positively for α-SMA at 7 and 14 days (Figure 3-20E-H). Intensity of α-SMA staining appeared to be less than that of EB-like aggregates of cells.
Figure 3-20 Immunohistochemical staining for α-SMA for (A-D) MSCs and (E-H) ECCs cultured in (A,E) control medium, (B,F) cardiac medium, (C,G) neural medium, and (D,H) endothelial medium. Scale bars,
50 µm.

61
3.5 Discussion
3.5.1 Comparison of MSCs and ECCs for chondrogenesis
MSCs and ECCs were compared for their relative potential for chondrogenesis. This is the first report of an embryonic stem cell type expressing α-SMA [128]. One prior study using the same antibody employed in the present work did not detect α-SMA in undifferentiated P19 ECCs [129]. Investigations using other antibodies to the α-SMA isoform also did not detect α-SMA in undifferentiated ESCs [129] or in P19 ECCs [111, 130]. The negative prior findings of α-SMA in P19 ECCs may be due to differences in the specificity and sensitivity of the various antibody preparations or to the environmental conditions under which the cells were prepared and grown. A more comprehensive investigation of the actin isoforms expressed by the various embryonic stem cell types would be instructive.
Previous work demonstrated that MSCs (and articular chondrocytes) which express α-SMA—using the same antibody employed in the current work—can contract [110, 131], and that the α-SMA-expressing cells on the periphery of pellets and scaffolds appeared to be responsible for contracture of the constructs and attendant chondrogenesis [116]. A notable finding of the present study was that despite their expression of α-SMA, ECCs in pellets and on scaffolds did not result in contracture of the constructs and no cartilagenous tissue was formed, in contrast to the contracture of and chondrogenesis in the scaffolds seeded with the α-SMA-expressing MSCs. In our monolayer cultures, MSCs displayed prominent stress fibers highlighted by the α-SMA stain as previously reported [109] whereas ECCs exhibited α-SMA in localized areas of the cytoplasm. Thus, although both cell types contain α-SMA, only MSCs display morphological attributes of contractile cells. The α-SMA-expressing ECCs may not have contracted due to the absence of actin unit polymerization or the absence of complementary myosin molecules [128].
No dimensional change in the non-cell-seeded scaffolds was observed with time in culture. In comparison, non-seeded collagen scaffolds employed in prior work were reported to decrease in diameter by 10-20% (type I collagen) [132] or swell up to 13% (type II collagen) [133]. The difference in behavior among the non-cell-seeded scaffolds in this and prior work may be related to the addition of GAG to the slurry, which was not done in the present work but which was part of the protocol for the fabrication of scaffolds in the previous investigations.
Type II collagen scaffolds were used to mimic the extracellular environment of articular cartilage. In previous studies in our lab, type II collagen facilitated chondrogenic differentiation and GAG production of MSCs. However, the type of collagen (type I vs. type II) did not appear to have an effect on ECC or MSC proliferation, scaffold contraction or histological staining.
In many experiments using embryonic-derived cells, the cells first aggregate to form EBs during culture in drug-supplemented media. EBs begin as suspended cell aggregates which then develop into three-dimensional cystic bodies that comprise of three germ lineages [134]. In this
62
study, cells were seeded on scaffolds not as EBs but as a highly dense cell suspension (5 x 10⁴ cells/µl) and in some cultures, EB-like structures were found to be growing on the surface and periphery of the scaffolds. In recent unpublished data, EBs were cultured on scaffolds but they were too large to infiltrate the scaffolds and grew as nodules on the surface of the scaffolds. In other experiments, EBs were cultured in type I collagen hydrogels and contraction was still not observed.
In the pellet study, centrifuging the ECCs (10 min at 1500 rpm) may have simulated EB formation. However, EBs naturally develop in culture, usually over a period of 4 days, allowing cell-cell adhesions and ECM formation. Thus it is unlikely that centrifuging ECCs would generate functional EBs. Even though the ECCs in pellet cultures demonstrated rapid cell proliferation in 14 days, the aggregates were likely undeveloped EBs that could not sustain molecular transport and did not possess the structure of naturally-developed EBs.
Our studies showed that MSCs demonstrated proliferation in scaffolds (Figure 3-5) but not in pellet cultures (Figure 3-2). This discrepancy is perhaps due to the smaller volume of the pellets compared to that of scaffolds, which constricts cell movement and proliferation. In addition, the high centrifugation force needed to create the pellets confines the cells into much smaller areas to inhibit proliferation. Conversely, the large volume of porous scaffolds allowed MSCs to migrate throughout and populate the scaffold, allowing for an increase in DNA content in scaffolds compared to that in pellets.
There have been few studies about α-SMA-expression of undifferentiated ESCs and ECCs. The observations in this study may explain the absence of a contractile scar in fetal wound healing. Studies have shown that fetal skin placed on adult nude mice cutaneously and adult skin placed into the fetal environment both healed accompanied with scar formation [135]. The process of scar formation is attributed to α-SMA-expressing myofibroblasts that generate contractile forces and mediate contraction of wounds. In our studies we found that although ECCs express α-SMA, they do not contract. Pluripotent ECCs and ESCs have the potential to develop into contractile smooth muscle cells or cardiomyocytes when cultured in appropriate media, but very little progress has been done in elucidating embryonic contractility. Understanding the embryonic environment and development and in particular the behavior of ESCs elucidate mechanisms of fetal wound healing. Furthermore, recent discoveries have proposed various methods for blocking contraction to promote scarless wound healing [136, 137].
In conclusion, MSCs appear to be superior over ECCs for cartilage regeneration under particular culture conditions. Even though both MSCs and ECCs express α-SMA, only MSCs exhibit condensation and contraction necessary for cartilage histogenesis. Histology verified that only MSCs exhibited sulfated GAG and collagen type II formation. The α-SMA-expressing ECCs may not have contracted due to the absence of actin unit polymerization or the absence of
63
myosin molecules. These observations may explain the absence of a contractile scar in fetal wound healing.
3.5.2 Comparison of MSCs and ECCs for cardiac, neural, and endothelial differentiation in monolayer and 3-D collagen scaffolds
Type I collagen is the primary ECM component in cardiac tissue and scaffolds made from collagen have been employed in tissue engineering applications for their biocompatibility, large surface area for delivery and localization of high cell densities, and favorable in vivo response. Three-dimensional scaffolds serve as an analog of the extracellular matrix, acting as a physical support structure and as an insoluble regulator of biological activity that affects cell processes such as migration, contraction, proliferation, and differentiation, and have become more routine for in vitro investigations of histogenesis [121, 138]. When sutured onto an infarcted cardiac wall, collagen scaffolds have been shown to elicit a neovascularization response at the implantation site [28]. Furthermore, they are effective carriers of stem cells and growth factors to an infarct site. In this chapter, MSCs and ECCs were compared for their relative potential to differentiate into cardiac-, neural-, and endothelial-like cells in monolayer and in type I collagen scaffolds.
The porous type I collagen scaffolds employed in this particular study were engineered to have an average pore size of ~180 µm in diameter, and a compressive modulus of 800-1400 Pa due to dehydrothermal (DHT) and light EDAC cross-linking [139]. Scaffolds with these mechanical properties and pore structure were shown to be successful in dermal [124], peripheral nerve [140], and spinal cord regeneration. Pores must to be large enough to allow cell migration into the structure, where cells eventually become bound to ligands expressed on the scaffold, but small enough to establish a sufficiently high specific surface for a minimal ligand density required for efficient binding of a critical number of cells to the scaffold [121]. Since MSCs range from 50-100 µm, a scaffold pore size of ~180 µm was chosen as a balance between adequate cell migration and specific surface area for ligand expression. DHT was used to sterilize and cross-link the scaffold, giving it more robust mechanical properties compared to non-cross-linked scaffolds. It has been shown that collagen exposed to severe dehydration had moduli of elasticity, swelling ratios, and resistance to bacterial collagenase similar to those cross-linked with glutaraldehyde (GTA), a much more cytotoxic method of cross-linking [141]. Furthermore, theoretical calculations based on amino acid composition indicate that approximately seven times as many amino acid residues are capable of forming cross-links using DHT as compared to GTA crosslinking. EDAC was used to further cross-link the scaffolds, a procedure that has been shown to provide a nine-fold increase in the apparent compressive modulus over the minimal DHT cross-linking [124].
There was a decrease in diameter of collagen scaffolds seeded with MSCs when cultured in any medium (cardiac, neural, endothelial, and control), but not in scaffolds seeded with ECCs. This is consistent with the observation in the previous section, in which a decrease in diameter

64
for MSCs but not ECCs was observed, when seeded as pellets and in 3-D collagen scaffolds for chrondrogenic differentiation. It is likely that the decrease in diameter of the MSC-seeded scaffolds resulted principally from cell contraction rather than degradation from cell synthesis of matrix metalloproteinases (MMPs). Non-cell-seeded scaffolds did not change in diameter. Comparison of cell-seeded scaffolds at 1 and 7 days revealed that scaffold struts were still present at 7 days, with most of the cells (MSCs and ECCs) residing on the surface and periphery of the scaffold. In addition, the pores appeared smaller on the periphery of the scaffold compared to those in the center of the scaffold and those in non-cell-seeded scaffolds. This observation further indicates that the change in diameter was principally due to contraction, since contraction proceeds from the periphery of the scaffold.
ECCs express the integrins necessary to attach to gelatin, collagen, and laminin, and are functionally implicated in the process of ECC myogenesis, neurogenesis, and vasculogenesis. Specifically, ECCs exposed to RA express αvβ1 and αvβ3, which have ligands for RGD in gelatin (denatured collagen) [142-144]. ECCs have also been shown to differentiate into functional neurons while cultured on collagen-coated substrates [145]. ECM can compensate for loss of growth associated protein-43 (GAP-43) with respect to neurite extension in P19 ECCs are consistent with the ability of certain primary neurons from the GAP-43 homozygous mouse to extend neurites normally on laminin substrates [146]. Thus, the lack of contraction in ECC-seeded collagen scaffolds is likely due to factors.
ECCs may not have contracted the scaffold for various reasons. First, the scaffold may have been too stiff (800-1400 Pa) to allow for ECC contraction. Second, the pore size of the scaffolds (~180 µm diameter) may have been too large compared to ECCs (~10 µm diameter), preventing adequate cell attachment and migration. Third, although ECCs express α-SMA, they may lack the complementary myosin molecules or actin filament polymerization necessary for contraction to occur. Future studies seeding ECCs in more compliant substrates, scaffolds with smaller pores, or substrates of different chemical composition may elucidate the lack of diameter change for ECC-seeded porous collagen scaffolds.
MSC cardiac differentiation
Studies on MSCs for treatment of myocardial infarction vary widely. MSCs have been reported to transdifferentiate into cardiomyocyte-like cells exhibiting cardiac markers such as desmin, cardiac troponin T, and connexin43 [9], increase capillary density in the myocardium by transdifferentiating into endothelial cells and forming vascular structures [52], and improve myocardial function by restoring stroke volume, decreasing left ventricular end-diastolic pressure and increasing left ventricular maximum dP/dt [52]. On the other hand other studies report the lack of colocalization of MSCs with cardiac muscle–specific proteins [147]. Some studies claim that although MSC delivery into an infarcted myocardium was safe and produced a local but not a functional effect, there was no dose-dependent effect and the effect of MSCs on infarct reduction may result from transient residence and subsequent paracrine effects [148].
65
A variety of culture conditions have been investigated to optimize expression of cardiomyogenic phenotype of MSCs, including variations in FBS and 5-azacytidine concentration, addition of growth factors such as b-FGF and the cell density at which the MSCs are plated. It is found that a concentration of 10 µM 5-azacytidine, presence of bFGF, combined with a higher cell density (50,000 cells/dish) allow faster confluency (within 6 days) and subsequently faster myogenesis [106].
In our monolayer studies, both MSCs and EBs displayed evidence for cardiac differentiation, indicated by the positive staining by MSCs for cardiac markers Tn-I and MHC and by EBs for α-Act, Tn-I, and MHC. About 5% of EBs demonstrated beating in monolayer cultures starting at 5 days, increasing to about 20% within 14 days. MSC differentiation into cardiac phenotype was regulated by the compound 5-azacytidine, an analogue of cytidine, causes hypomethylation of some cytosine in DNA which may be involved in activating phenotype-specific genes [61]. However, the exact mechanism that 5-azacytidine acts upon MSCs to produce cardiomyocyte-like cells is largely unknown. Although MSCs exposed to 5-azacytidine have been shown to display beating in monolayer [60, 61, 66], MSCs employed in this study did not. This observation can be due to the lack of screening and subcloning of spontaneously beating cells to purify the culture and enhance the number of spontaneously beating cells. Other studies have shown that enhancing the contraction of spontaneously beating cells can be stimulated by temporarily exposing the cells acetylcholine solution [61]. Furthermore, our MSC cardiac cultures were terminated at 14 days and a longer culture time may reveal myotube-like structures and spontaneous beating. Future studies should focus on other cardiac differentiating agents [94] or sub-cloning MSCs to obtain a more purified MSC population.
In scaffolds, MSCs showed signs of cardiac differentiation, indicated by the positive staining for MHC. About the same percentage of cells (30-50%) in monolayer and in scaffolds stained positively for MHC, but it is difficult to tell from a qualitative evaluation such as immunohistochemistry. Future work with RT-PCR or western blot would provide a semi-quantitative analysis to compare cardiac differentiation in monolayer and a collagen scaffold.
MSC neural differentiation
MSC neural differentiation was characterized by morphological changes and immunohistochemical staining of neuronal class III β-Tubulin (TUJ1), a marker used to identify immature neurons. Within 90 min of exposure to neural induction medium containing DMSO, changes in cell morphology was observed in some MSCs in monolayer in which the retraction of the cytoplasm left behind long processes, resembling neurites. Furthermore, about 30% of these neural-like cells stained for TUJ1. In contrast, neural differentiation was not observed when MSCs were cultured in scaffolds. Cell morphology was difficult to observe in thin paraffin sections of cell-seeded scaffolds.
66
Neural differentiation of MSCs has been previously reported [149], but has been a controversial issue and questioned by many [150, 151]. Researchers argue that differentiation toward a neuronal lineage is a gradual process involving specific genetic events and cannot be achieved within hours of neural induction [152]. Studies have also reported the apparent contraction of the cell body and rapid change in cell morphology, and attribute this behavior to the collapse of the F-actin in cytoskeleton leaving neurite-like processes rather than true differentiation [153]. This behavior is even accompanied by rapid expression of some neural and glial markers such as nestin, neurofilament (NF), neuron-specific enolase (NSE), and neuronal nuclei (NeuN). However, these markers are sometimes expressed naturally by MSCs and other stem cell types [152]. Moreover, other cell types such as rat dermal fibroblasts exposed to cytotoxic chemicals such as DMSO or butylated hydroxyanisole (BHA) exhibited the same behavior. For the purposes of this study, MSC neural differentiation was characterized by morphological changes and immunohistochemical staining of TUJ1, but subsequent chapters in this thesis only consider the differentiation of ECCs because of the controversy regarding neural differentiation of MSCs. Further study on molecular signaling and gene expression is required to verify the ability of MSCs to transdifferentiate into neuronal lineages.
MSC endothelial differentiation
In our studies, very few MSCs cultured in endothelial differentiation medium showed signs of endothelial differentiation indicated by positive staining of vWF (<1%) in monolayer (Figure 3-14), and no signs of endothelial differentiation was detected in scaffolds (Figure 3-19). Furthermore, these cultures lacked morphological changes associated with endothelial differentiation such as tube-like capillary networks [106], spindle-like morphology, and cobble-stone-like morphology [117] usually seen after 12 days in culture [154]. Previous studies have shown that MSCs can differentiate into endothelial cells when cultured on a laminin gel-coated substrate, with differentiation medium containing high concentrations of VEGF and IGF-I [127, 154]. These cells expressed CD31, vWF, Tie2, VCAM1, VE-cadherin and VEGF receptors (VEGFR2, FLT1), detected by flow cytometry, and stain immunohistochemically for VEGFR2 and vWF, confirming endothelial differentiation. It’s been shown that the combination of VEGF and IGF-I enhances endothelial differentiation whereas the absence of IGF-I can lead to development of granulation [154, 155]. Future studies investigating various growth factors for endothelial differentiation would be helpful in determining its optimum culture conditions.
Transdifferentiation of MSCs into endothelial-like cells has also been shown to have beneficial effects in vivo by enhancing angiogenesis and vascular density in ischemic hearts [103, 147]. Furthermore, co-injection of MSCs with VEGF into infarcted hearts increased previous cell engraftment and resulted in more improvement of cardiac function than those injected with MSCs or VEGF alone. It is hypothesized that VEGF acts like a protectant of MSCs from culture-induce cellular stress and improves their viability in ischemic myocardium [31]. In the context of in vivo studies, 2-D and 3-D in vitro environments are insufficient to provide biochemical cues necessary for MSC transdifferentiation into endothelial cells.
67
ECC cardiac differentiation
ECCs cultured as EBs in monolayer differentiated into beating cardiomyocyte-like cells, neural cells, and vascular endothelial cells, confirmed by staining for cardiac markers MHC and Tn-I, neural marker TUJ1, and mature endothelial marker vWF. Dissociated ECCs seeded in collagen scaffolds differentiated into cardiomyocyte-like cells and neural cells, but beating of cardiac EBs and endothelial differentiation was not observed. Differentiation of ECCs into cardiac, neural, and endothelial lineages in monolayer have been reported [90, 91, 95, 97, 107, 156] but this is first reported study of ECCs cultured in collagen scaffolds. Aggregates of ECCs formed EB-like structures (50-100 µm diameter, as in Figure 3-19D) that were much smaller than ones that formed in monolayer (200-400 µm diameter, as in Figure 3-9F). The difference in EB size is likely due to pore size constraint (~180 µm), limiting EB growth and perhaps differentiation. Studies have shown that both dissociated ESCs as well as ESCs grown in EBs can differentiate into various cell types. Furthermore, most of the EBs in our study grew on the periphery of the scaffold, which broke off during medium changes. Other studies have shown that pre-differentiated ESCs seeded on fibronectin-coated PLGA scaffolds (200-500 µm diameter pores) infiltrated the center of the scaffolds better and showed more differentiation than undifferentiated cells [157].
ECC neural differentiation
The neural differentiation efficiency of ECCs cultured in monolayer (75% ± 16% TUJ1-stained cells) was much higher than that in collagen scaffolds (5% ± 3% TUJ1-stained cells). In scaffolds, most of the EB-like aggregates were attached to the periphery of the scaffolds, suggesting that EB formation prior to seeding in scaffolds increases efficiency but is not necessary for neural differentiation. Very little is known about the mechanism of differentiation when ECCs are exposed to RA. Dose-dependent studies found that fibroblast-like cells grew in cultures with higher concentrations of RA (more than 5 x 10⁻⁸ M), whereas colonies formed at lower concentration of RA were composed of cells with embryonal morphology [91]. It’s also been shown that a 48-hour exposure to RA is adequate to ensure neuronal differentiation. Furthermore, EBs exposed to DMSO and RA differentiated into neuronal cells whereas exposure to DMSO alone produced cardiomyocytes, and exposure to RA alone produces neurons. One interpretation of this data could be that each agent acts by “inducing” uncommitted embryonal cells to differentiate along a limited number of developmental pathways [90]. The ectoderm is the first germ layer to form embryonically, and differentiation into the nervous system components including the spine, peripheral nerves, and brain, could explain the early commitment of ECCs to the neuronal lineage despite the short exposure time to RA, and the observation that DMSO does not inhibit the formation of neurons. In long-term cultures exposed to RA, neuronal processes differentiated into axons and dendrites, which formed synapses [158].
Although collagen is not the primary ECM component for neurons, it has not been shown to inhibit neuronal [159] or endothelial differentiation [160]. Neuronal ECM is primary

68
composed of glycoproteins, hyaluronan, and proteoglycans [161]. Endothelial ECM is primary composed of laminin and collagen IV [162]. However collagen was chosen as a substrate for 3-D culture to serve as a comparative material for cardiac, neural and endothelial differentiation.
ECC endothelial differentiation
Endothelial differentiation of EBs induced by exposure to VEGF was shown in monolayer (Figure 3-15A,B) but not in scaffolds (Figure 3-19F). Evidence of endothelial tube-like structures characteristic of vasculogenesis were not identifed in monolayer even though vWF staining was evident. Future studies to investigate a range of EB seeding densities, longer culture times (up to 21 or 28 days), and an optimized endothelial differentiation medium would help define the conditions at which endothelial structures form. The absence of EB formation necessary for some types of differentiation may explain the lack of endothelial differentiation in scaffolds in which a pore size of 180 µm may limit the formation and growth of EBs. Previous work showed that ESCs are capable of differentiating into endothelial cells in scaffolds (pore size ~250-500 µm) in the presence of insulin-like growth factor (IGF)-1 [89]. Furthermore, exposure to DMSO during EB formation is a critical step for the formation of mesoderm which is capable of differentiating into endothelial cells [95].
In conclusion, monolayer culture of MSCs and ECCs appear to be superior over culture in 3-D collagen scaffolds for cardiac, neural, and endothelial differentiation. Even though sponge-like scaffolds have superior attributes such as a large surface area and ligands for cell binding, the pore size investigated in this study (~180 µm diameter) was too small to incorporate aggregates of ECCs. The work from this study points to the need for injectable hydrogels to incorporate the ECCs for cell delivery.
3.6 Summary
MSCs and ECCs were evaluated for their potential to differentiate into cardiac, neural, and endothelial cells in monolayer and in collagen scaffolds. MSCs were shown to differentiate into cardiomyocyte-like cells in both monolayer and scaffolds with similar differentiation efficiencies. Neural differentiation of MSCs was reported in monolayer but the area of research has been highly debated due to the use of cytotoxic agents to produce morphological changes similar to neurites. Endothelial differentiation of MSCs in monolayer was very low (<1%) and not observed at all in scaffold cultures. Although ECCs cultured as EBs in monolayer were shown to differentiate into beating cardiomyocyte-like structures, neural cells with extending neurites, and vascular capillary-like structures, ECCs in collagen scaffolds produced smaller EBs with decreased differentiation efficiency for all three cell types. Furthermore, no spontaneous beating of ECCs in scaffolds was observed. Future work should investigate the effect of pore size on EB aggregation and differentiation; in particular a larger pore size (250-500 µm diameter) would better accommodate proliferating and assembling EBs (200-600 µm diameter). Although scaffolds are promising as vehicles for cell delivery in tissue engineering applications

69
and have been used successfully in MSCs for chondrogenic differentiation, EBs might be better delivered through an injectable gel system that allows for prior formation of EBs before encapsulation. Due to the limitations of scaffolds and potential benefits of injectable gels, the next two chapters of this thesis discuss the characterization of injectable gel systems and the successful differentiation of EBs incorporated in gels into cardiac, neural, and endothelial cells.

70
71
Chapter 4 Injectable biopolymer gels for cardiac tissue engineering
4.1 Introduction
Injectable biopolymer gels are promising vehicles for the minimally invasive delivery of cells, growth factors and cytokines to an infarct site after a myocardial infarction. Injectable gels are liquids which can be injected through a syringe into a tissue, and undergo a gelation or polymerization reaction in vivo. The hydrogel can form via ionic interactions or covalent bonding of the molecules in the liquid precursor. By curing the hydrogel directly at the site of interest, the precursor solution can diffuse into the adjacent tissue, leading to enhanced adhesion of the scaffold to the tissue without requiring glue or sutures. Hydrogels are water swellable, yet water insoluble, cross-linked networks that exhibit high water contents and tissue-like elastic properties. These attributes make them ideal candidates as scaffolds for growing cells and tissues.
4.1.1 Injectable gels for cardiac tissue engineering
Injectable gels have been used for cardiac tissue engineering applications since 2004 [163]. They offer a potentially less invasive and more effective tissue-engineering approach for myocardial reconstruction, compared to external scaffold patches, which require surgically invasive procedures to be fixed onto the epicardial surface and have thickness limitations due to the lack of a vascular bed. Furthermore, the ability of injectable biopolymers to deform with the dynamically loaded myocardial environment and to align their matrix with the injured region may provide better incorporation of implanted cells to the host tissue [164].
The injection of biopolymer gels into infarcted myocardium has improved cardiac function as well as stimulated angiogenesis. Acellular hyaluronic acid hydrogels injected into an infarcted myocardium significantly increased the wall thickness infarct regions compared with the control infarct [165]. Furthermore, infarcted myocardium injected with hydrogels with a higher stiffness (40 kPa) had a smaller infarct area, reductions in normalized end-diastolic and end-systolic volumes and better functional outcomes compared to the control infarct group as well as myocardium injected with hydrogels with a lower stiffness (8 kPa). Fibrin, collagen type I and Matrigel injected into an infarcted heart yielded significantly higher levels of capillary formation 5 weeks post-treatment [164]. Interestingly, the collagen biopolymer significantly enhanced infiltration of myofibroblasts into the infarct area when compared with the control group, which highlights the potential clinical benefit of biopolymers as injectable scaffolds or cell delivery vehicles to increase cardiac function after infarction.
4.1.2 Biopolymers to be investigated
Many design characteristics have been considered when designing and tailoring an injectable material for tissue engineering applications (highlighted in Table 4-1) [164, 165].

72
Naturally occurring biopolymers are generally regarded as having favorable biodegradation products compared to some synthetic polymers as the monomeric degradation products are typically amino acids or saccharide units [166]. The ability of injectable biopolymers to deform with the dynamically loaded myocardial environment and to align their matrix with the injured region may provide better incorporation of implanted cells to the host tissue than compared with sponge-like scaffolds [26].
The incorporation of biocompatible covalent cross-linkers into hydrogels allows control over mechanical and rheological properties of the material, such as gelation time, modulus, and degradation rate. Furthermore, the cell response to the hydrogel is imperative; in vitro cultures to investigate cell viability, proliferation, contraction, and differentiation would provide some insight into in vivo cell behavior and assist in the judicious selection of a set of hydrogels for cardiac tissue engineering applications.
Table 4-1 Design characteristics for gels for cardiac tissue engineering
Design characteristic Rationale Biocompatible -‐ Non-‐cytotoxic polymer, cross-‐linking agent, degraded
components Injectable -‐ Minimally invasive delivery (e.g. cells, growth factors)
Covalent cross-‐linking in vivo -‐ Serve as solid scaffold -‐ Controlled release of therapeutic agents
Rheologically tunable -‐ Modulate gel time and storage modulus Mechanically tunable -‐ Modulate stiffness to support cardiac tissue
Control of degradation -‐ Modulate degradation rate and half-‐life Cell response (in vitro):
-‐ Viability -‐ Proliferation -‐ Contraction -‐ Differentiation
-‐ Non-‐cytotoxic and allow for cell proliferation -‐ Accommodate changes in gel size based on cell
contraction -‐ Allow differentiation into cell components of cardiac
tissue
Many polymers have been investigated for usage as injectable hydrogels. Collagen’s superior biocompatibility and nearly ubiquitous bioactivity have made it one of the most extensively investigated biomaterial scaffolds for tissue engineering. Furthermore, collagens comprise the majority of proteins in connective tissue such as skin, bone, cartilage, and tendons, and thus is a popular candidate as a ECM substitute, particularly for cardiac tissue in which type I collagen is the primary ECM constituent [138]. However, the effectiveness of collagen-based tissue engineered materials has been severely limited by their lack of mechanical strength and has motivated many researchers to investigate various methods of cross-linking collagen [37, 167]. Physical treatments such as ultraviolet (UV) and γ-irradiation and dehydrothermal treatments are not practical because of their limited use in cellular tissues. Chemical treatments

73
with aldehydes are often used to preserve and stiffen tissues but these treatments are highly cytotoxic. In vivo, tissues are naturally cross-linked by enzymes such as lysyl oxidase. However, the use of these enzymes for bulk changes in mechanical properties in cultured tissue mimics is cost prohibitive.
A small molecule called genipin has been recently been investigated as a covalent cross-linker. Genipin is the active compound found in Gardenia Jasminoides fruit extract and cross-links collagen through nucleophilic attack via primary amine groups on lysine and arginine residues on the C3 atom of genipin, resulting in a gel strength comparable to that cross-linked by glutaraldehyde, but is 10,000-fold less cytotoxic [38, 168]. Genipin may cross-link collagen in a variety of different mechanisms, including reacting with amino groups within a tropocollagen molecule (intrahelical cross-links), between adjacent tropocollagen molecules (interhelical cross-links), and between collagen microfibrils (intermicrofibrillar cross-links). In addition to an increase in mechanical strength of collagen, genipin cross-linking is associated with an unique color change in which opaque collagen turns blue, and the cross-links emit fluorescence at 630 nm when excited at 590 nm.
Collagen cross-linked with genipin used drug delivery and tissue engineering applications were found to increase the stiffness of the gel construct and modulate drug release [169]. Although its non-cytotoxic properties have been cited, in vitro studies have shown that cell (fibroblast) viability is compromised at genipin concentrations greater than 5 mM when using a diffusion model [39]. When used in vivo to fix tissues, genipin elicited a significantly smaller inflammatory response than glutaraldehyde [41, 170]. Furthermore, genipin-fixed decellularized porcine heart valves were shown to attenuate the inflammatory host reaction [171]. Few studies have been conducted on cell-incorporated collagen-genipin gels for tissue engineering purposes. There have been no reports that characterize the kinetic profile or half-life of collagen-genipin gels to investigate its resistance to enzymatic degradation.
Although genipin is an attractive cross-linker for collagen, its cytotoxicity at high concentrations (5 mM) limits its usage to small concentrations [39]. Transglutaminase (TGase), a ubiquitous enzyme with a role in blood clotting, has also been investigated for cross-linking collagen gels [43]. TGases are able to covalently attach primary amine containing compounds to peptide-bound glutamine, facilitating modification of the physical, chemical and biological properties of proteins [44]. Specifically, TGase catalyzes the formation of a covalent bond between the ε-amino group of a lysine residue and a γ-carboxamide group of glutamine, creating intramolecular covalent links within and between polymers. It has been mainly used in the food industry in processing meats and fish but has recently been utilized in the biomedical field. TGase has been used to cross-link gelatin matrices to increase their strength [45], and also to incorporate cell adhesion factors within the gel matrix, enhancing cell proliferation [46].
Two sources of TGase have been identified: mammalian (from guinea pig liver, GTGase) and microbial (from Streptoverticillium, MTGase). A difference in evolution pathways resulted

74
in a vast difference in amino acid sequence and activity between the two TGases [172, 173]. It has been suggested that the difference in the number of lysine residues targeted by GTGase and MTGase may be responsible for the difference in the polymerization between Ca2+-dependent GTGase- and Ca2+-independent MTGase-catalyzed systems [174]. Use of GTGases is impractical because of the high cost of extraction and purification and thus, mainly MTGases have been used for biomedical engineering purposes [175].
Gelatin is a derivative of collagen containing single strands of collagen instead of the tropohelix of collagen, and has many similar properties including cell adhesion. Compared to the mechanically weak collagen, gelatin is even weaker and relies on cross-linkers to boost its mechanical stiffness. Gelatin-based hydrogels contain arginine–glycine–aspartic acid (RGD) peptide sequences that serve as the ligands for the integrins of many cell types; RGD sequences which are not accessible to cells in type I collagen are revealed with collagen is converted into gelatin. Gtn-HPA gels have recently been investigated as a mechanically and rheologically tunable hydrogel due to their biocompatibility, biodegradability, and mechanical strength. Gtn-HPA gels are formed through the oxidative coupling of phenol moiety, which was catalyzed by H2O2 and HRP, a cross-linking method which has been studied in hyaluronic acid-tyramine gels [47]. The H2O2 and HRP determined the hydrogel stiffness and the gelation rate of the hydrogel, respectively. Studies have shown that a decrease in proliferation rate for cells incorporated in Gtn-HPA gels was observed with increasing stiffness given a specific range of stiffnesses [176]. There have been few studies on cell behavior and differentiation incorporated in gels.
Cardiac jelly has been seen as the target gel material for tissue engineering. In fact, a few researchers have attempted to produce a gelatinous cardiac jelly-like substance to serve as a delivery vehicle for cells and growth factors. Cardiac jelly is a homogenous network of collagen fibrils and fine filaments as well as elastin in which embryonic cardiac development and looping occurs. The presence of glycosaminoglycans gives cardiac jelly a gel-like appearance as well as controls the degree degree of hydration. In this particular study, the properties of biopolymer gel systems investigated were compared to that of cardiac jelly as the low end for a range of target moduli.
4.2 Objective, hypothesis, and rationale
The objective of the work presented in this chapter was to evaluate three mechanically tunable injectable biopolymer hydrogel systems for the application of cardiac tissue engineering. Specifically, the three biopolymer systems with their cross-linker concentrations are:
Gel system Polymer and concentration Cross-‐linker Cross-‐linker concentration 1. Collagen-‐genipin Collagen (0.2 wt%) Genipin 0-‐2 mM Gen 2. Collagen-‐TGase Collagen (0.2 wt%) TGase 0-‐100 µg/ml TGase 3. Gtn-‐HPA Gtn-‐HPA (2 wt%) H2O2 0.85-‐1.7 mM H2O2
75
The collagen-based gels and Gtn-HPA gel were used at different polymer concentrations due to limitations of the polymer source. Because of the collagen isolation methods, the soluble collagen stock solution had a maximum concentration of 0.5-0.6 wt% (BD Biosciences). Furthermore, pilot studies shows that Gtn-HPA gels with less than 1 wt% polymer concentration do not gel. The cross-linker concentrations were chosen to provide a range of moduli over one order of magnitude based on previous literature.
The gels were evaluated based on mechanical properties (compressive modulus), rheological behavior (gel time and shear storage modulus G’), resistance to enzymatic degradation, swelling ratio, and cell behavior when incorporated in the gel, including cell viability, morphology, proliferation, and contraction. These metrics provide a comparative overview of gel properties for the judicial selection of an optimum gel type (gel system with a particular cross-linker concentration) for tissue engineering applications. Cardiac jelly, which as a modulus on the range of 1-30 Pa, served as a comparative benchmark.
The hypothesis was that the material properties of the hydrogels could be enhanced with an increasing concentration of cross-linker. Specifically, an increase in cross-linker concentration would increase the stiffness, storage modulus, and resistance to degradation of the material. Conversely, a higher degree of cross-linking would decrease the swelling ratio of the polymer and reduce cell proliferation.
This study enabled a comparison of three hydrogel systems based on design characteristics important for tissue engineering purposes. The results relate to the judicious selection of a gel system for cardiac tissue engineering since MSCs and ECCs have the necessary integrins to attach to both gelatin and collagen. Furthermore, because 3-D culture in degradable ECM analogs better mimic relevant tissue structure than 2-D culture, studies in 3-D culture may provide better insight into designing biopolymer gels for in vivo applications [177]. This study is the first to characterize the lasting effect of genipin cross-linker in collagen gels. Finally, it is the first study on the kinetic profile and half-life for collagen-genipin gels and the first study on half-life of Gtn-HPA gels when exposed to collagenase.
4.3 Materials and methods
4.3.1 Collagen-genipin gels
Ice cold 1x PBS, 5x PBS, and 1N NaOH and 3.91 mg/ml acid solubilized rat tail collagen (BD Biosciences) were combined in that order to obtain 2 mg/ml collagen solutions at pH 7.5 with 1x ionic strength. For gels containing genipin, genipin powder (Wako) was mixed with 5x PBS immediately before use to create a stock solution. The appropriate amount of genipin stock solution was used in place of the 5x PBS in the collagen solution to obtain the desired genipin concentration (0-1mM). Thermal gelation of the collagen solutions was induced by warming to 37°C in an incubator.
76
4.3.2 Collagen-transglutaminase gels
Ice cold 1x PBS, 5x PBS, and 1N NaOH and 3.91 mg/ml acid solubilized rat tail collagen (BD Biosciences) were combined in that order to obtain 2 mg/ml collagen solutions at pH 7.5 with 1x ionic strength. For gels containing TGase, two forms of microbial TGase (ACTIVA TI; Ajinomoto, Tokyo, Japan) from Streptomyces mobaraense were used: unpurified and purified. For unpurifed TGase, the protein was used as is, directly from the manufacturer (99% maltodextrin and 1% TGase). For purified TGase, the protein was purified using S Sepharose Fast Flow column. Briefly, 3 g of crude TGase was dissolved in buffer A (20 mM phosphate and 2 mM ethylenediaminetetraacetic acid, pH 6.0) and then mixed with 3 mL of preequilibrated S Sepharose FF beads. After incubation at 4°C overnight with occasional vortexing, the protein solution and bead mixture were batch loaded into a column. After washing with 4 volumes of buffer A, TGase was eluted with buffer B (buffer A with 800 mM NaCl). Protein concentration was monitored by the method of Bradford (Bio-Rad, Hercules, CA), utilizing bovine serum albumin as a standard.
The appropriate amount of TGase stock solution was used in place of the 5x PBS in the collagen solution to obtain the desired TGase concentration (0-100 µg/mL). Thermal gelation of the collagen solutions was induced by warming to 37°C in an incubator.
4.3.3 Gelatin-hydroxyphenylpropionic acid hydrogels
Gelatin conjugated with HPA was provided by the Institute of Bioengineering and Nanotechnology (Singapore). Briefly, Gtn-HPA conjugates were synthesized by a general carbodiimide/active ester-mediated coupling reaction [176, 178, 179]. The percentage of amine groups of gelatin introduced with HPA (i.e. degree of conjugation) was determined by the conventional 2,4,6-trinitrobenzene sulfonic acid (TNBS) method [180] to be 90%.
The Gtn-HPA conjugates are cross-linked by the enzymatic oxidative reaction of HPA moieties using HRP (Wako Pure Chemical Industries) and H2O2 (Wako Pure Chemical Industries). Lyophilized Gtn–HPA was dissolved in PBS at a concentration of 2 wt%. A volume of 8.3 µl of HRP was added to 0.5 mL of Gtn-HPA solution to give a final concentration of 1 unit/ml. Cross-linking was initiated by adding various amounts of 70 mM H2O2 solution to give final concentrations of 0.85, 1.0, 1.2, and 1.7 mM. Thermal gelation of the Gtn-HPA solutions was induced by warming to 37°C in an incubator for 1 hour.
4.3.4 Rheology testing
Rheological measurements of hydrogels were performed with a TA instruments AR-G2 rheometer using parallel plate geometry (20 mm diameter) to apply a constant stress at 0.1 Pa at a frequency of 1 rad/s. These conditions were chosen to be in the linear viscoelastic regime of the gelled materials and did not interfere with the gelation process. The bottom plate was held at 8°C before the materials were tested at 37°C to prevent premature gelation. A layer of silicone

77
oil was also applied during the experiment to prevent evaporation. All measurements were taken at 37°C in the oscillation mode with a constant strain of 1% and frequency of 1 Hz.
4.3.5 Unconfined compression testing
Unconfined compression tests were performed using a Zwick/Roell Z2.5 static materials tester (Zwick GmbH & Co., Ulm, Germany) with integrated testing software (testXpert, Zwick). Soluble gel volumes of 1 mL were cast in 24-well plates to create samples 16 mm in diameter and 3-4 mm in thickness. Collagen-genipin gels were left to cross-link for 72 hours before compression testing. Gtn-HPA gels were gelled for 1 hour before compression testing. Both Collagen-genipin gels and Gtn-HPA gels were swelled in PBS for 1 hour before compression testing.
Mechanical tests were performed at a constant strain rate of 0.5%/s to a maximum strain of 15% using a 20 N load cell (Part No. BTC-LC0020N.P01, Zwick) sampling at a frequency of 2 Hz. For some samples, Teflon sheets were placed above and below the samples to account for adhesion. The diameter of the samples at the start of the testing was measured using digital calipers. The compressive modulus was determined by the slope of the true stress-strain curve within the linear regime of the material (~0-15%).
The Mooney-Rivlin model was used to characterize hyperelastic material behavior of Gtn-HPA gels. For uniaxial loading, the nominal stress (f) – stretch (λ) behavior for the neo-Hookean/Gaussian model is given by:
! = 2!!" ! −1!!
and, for the Mooney-Rivlin model, is given by [181]:
! = 2 !!" +!!"! ! −
1!!
Mooney plots were made, which graphs the quantity of reduced stress !!! !
!! as a
function of !!
. A Mooney-Rivlin material yields a plot with a straight line with non-zero slope in the small to moderate stretch range. The coefficients C10 and C01 are empirically determined material constants and shear modulus µ can be calculated using:
! = 2 !!" + !!!
4.3.6 Absorbance and fluorescence measurements of collagen-genipin gels
Absorbance and fluorescence measurements of collagen-genipin gels were taken using a Perkins-Elmer Wallac 1420 spectrophotometer (Waltham, MA) at 595 nm (absorbance) or
78
excitation 595 nm, emission 630 nm (fluorescence). Collagen solutions were plated into 96 well plates (120 µL/well) and placed in a 37°C incubator (n = 12 independent wells). At regular time intervals, the plates were taken out of the incubator and measured. Well plates were kept covered and at 100% RH to reduce evaporation. The plates were allowed to cool to RT for 20 min to avoid the effects of temperature variation on the fluorescence intensity.
4.3.7 Enzymatic degradation
Collagen-genipin gels and Gtn-HPA gels (0.5 mL each) of varying cross-link densities (0-1 mM genipin and 0.85-1.7 mM H2O2) were cast in 2-ml cryotubes for 1 hour using the same protocol as described above (n = 3). Collagen-genipin gels were also incubated for 24 hours (n = 3) to investigate long-term reactivity of genipin. The gels were transferred from the cryotubes into 24-well plates and swollen in PBS for 1 hour. The gels were then exposed to 0.1 wt.% (163 U/mg) collagenase I (Gibco) on a shaker table (150 rpm); control gels were exposed to PBS instead of collagenase. After 30, 60, 90, or 120 min, the collagenase was removed and the gels were washed with PBS on a shaker table for 20 min. The remaining gel samples were collected, lyophilized overnight, and weighed. The dry weights of the gels were compared to the weights of control gels; data are reported as weight remaining (%).
Linear or polynomial regression lines were fit to the data to achieve an R2 > 0.95. Half-life values were calculated as the amount of time required to enzymatically degrade the gel to 50% of its original mass.
4.3.8 Swelling ratio
Collagen-genipin and Gtn-HPA gels (1 mL, 16-mm diam., 3-4-mm thick) of varying cross-link densities (0-1 mM genipin and 0.85-1.7 mM H2O2) were cast in 24-well plates for 1 or 7 days and then swollen in PBS for 24 hours at RT. The disks were scooped up using tweezers and weighed immediately afterwards to obtain the swollen weight. After lyophilization, the disks were weighed to obtain the dry weight. The swelling ratio was calculated using the following equation:
!"#$$%&' !"#$% = !!!!
where Ws is the swollen weight and Wd is the dry weight.
4.3.9 Environmental scanning electron microscopy
Collagen-genipin and Gtn-HPA gels of varying cross-link densities (0-1 mM genipin and 0.85-1.7 mM H2O2) were cast in 24-well plates. After 1 hour, gel samples were fixed in 4% paraformaldehyde and 2% glutaradehyde in a buffered solution for an hour at room temperature. After three 10-min washes in PBS and two 10-min washes in ddH2O, the samples were then dehydrated for 15 min in a series of graded ethanol of 50, 75, 90, 95, 100, 100, 100%
79
concentration respectively. Dehydrated specimens were then critical point dried from ethanol in CO2 (Autosamdri – 815, Tousimis (Rockville, MD)). The dried gels were mounted on aluminum stubs using carbon tape, and examined under environmental scanning electron microscopy (ESEM) (FEI/Philips XL30 FEG ESEM) in low-vacuum conditions with an accelerating voltage of 12-15 kV.
4.3.10 Isolation and culture of MSCs
Bone marrow aspirates were taken from the iliac crest of adult female Yorkshire swine (45 kg) and transferred to sterile tubes containing cold phosphate-buffered saline (PBS)/1 mM ethylenediamine tetraacetic acid (EDTA). Cell isolation technique was based on the protocol originally established by Friedenstein et al. [112] and recently expanded by others [98, 113]. Briefly, the marrow and adherent bone trabeculae were minced and vortexed to disperse the marrow cells. The mixture was strained through a 70-µm nylon mesh filter to remove remaining bone and debris, and the cell suspension was centrifuged at 1500 rpm for 10 min. Cells were resuspended, loaded onto a Ficoll-Histopaque gradient, and again centrifuged at 1500 rpm for 30 min. The cells at the interface (1.073 g/mL) were collected and resuspended in PBS followed by three washes in PBS. The cells were counted and their viability was assessed using a trypan blue exclusion test. They were then plated into 25-cm2 flasks at a density of 400,000 cells per cm2.
Medium was first changed after 48 hours to remove most of the nonadherent hematopoietic cells. After 10 days, the remaining adherent cells were detached and collected using 0.05% trypsin and 0.52 mM ethylenediaminetetraacetic acid (EDTA) for 5 min and then subcultured; cells were replated at 5000 cells/cm2. Cells were cultured in complete medium consisting of low-glucose Dulbecco’s modified Eagle’s medium (LG-DMEM, Invitrogen) containing 10% fetal bovine serum (FBS, Invitrogen), 100 U/ml penicillin and 100 µg/ml streptomycin (Invitrogen). Complete medium was supplemented with 10 ng/mL fibroblast growth factor (FGF)-2 (R&D Systems) which has been reported to promote MSC proliferation and maintain the cells in an undifferentiated state [114]. Medium was changed every 2-3 days. Cells were used for experiments when the flask reached 80% confluence.
4.3.11 Culture of ECCs
ECCs were thawed and expanded in 150-cm2 flasks in complete medium consisting of Minimum Essential Medium (MEM)-Alpha (Gibco), 7.5% newborn calf serum (Sigma), 2.5% fetal calf serum (Sigma), 1% penicillin/streptomycin (Invitrogen). They were subcultured 1:10 every 2-3 days until ready to use.
4.3.12 Cell-incorporated gels
MSCS and ECCs were incorporated in collagen-genipin and collagen-TGase gels at a concentration of 2 x 10⁵ cells per gel containing various concentrations of genipin (0-1 mM) and TGase (0-100 µg/mL). Complete medium (DMEM-LG, 10% FBS, 1% penicillin-streptomycin)

80
was pre-warmed in 24-well plates prior to gel plating. Gel solution (0.5 mL) containing cells was carefully added to each well to ensure the gel settled to the bottom of the well. This plating technique was done to simulate an environment where the genipin could leach out of the system and react with the surrounding environment (i.e., in the case of myocardial tissue). Media were replaced at 4 hours, 24 hours, and every 48 hours thereafter.
To incorporate cells in Gtn-HPA gels, a solution of Gtn-HPA containing cells was cast in a cryotube mold to prevent gel adhesion to the well-plates. Cryotube molds were cut from 2-mL cryotubes using a bandsaw (Figure 4-1). These open-ended tubes were autoclaved before UV-irradiated parafilm was wrapped around one end of the cryotube to create a mold. A gel solution of 300 µL created a gel of 9.5 mm in diameter and 3 mm in thickness.
Figure 4-1 Cryotube molds for cell-seeded Gtn-HPA gels
Lyophilized Gtn–HPA was dissolved in PBS at a concentration of 4 wt%. Equal volumes of Gtn-HPA solution and cell suspension were combined to create a solution of 2 wt% Gtn-HPA with cells. HRP was added to give a final concentration of 1 U/mL. Cross-linking was initiated by adding various amounts of H2O2 solution to give final concentrations of 1.0 and 1.7 mM. Thermal gelation of the Gtn-HPA solutions was induced by warming to 37°C in an incubator. After 20 min, medium was carefully added to the gel in the molds, and after another 20 min, the parafilm was removed from the molds and the cell-incorporated gels were transferred to agarose-coated well plates filled with medium. Medium was changed every 2-3 days. Gel diameters were measured using a circular template with each media change.
4.3.13 Rheological behavior of cell-incorporated gels
Rheological measurements of pre-formed MSC- and ECC-incorporated collagen-genipin gels at 1 and 6 days (n = 4) post-casting were performed with a TA instruments AR-G2 rheometer using parallel plate geometry. Samples at 1 day were approximately 8 mm in diameter and were tested using a 20 mm diameter parallel plate set-up. Samples at 6 days were approximately 5 mm in diameter (collagen-only gels) were tested using an 8-mm diameter parallel plate set-up. A constant stress of 0.1 Pa was applied at a frequency of 1 Hz. Sandpaper
81
was used on the platens to prevent slippage during experimentation. All measurements were taken at 37°C in the oscillation mode.
4.3.14 Cell viability
To measure cell viability, a Live/Dead® Viability/Cytotoxicity Assay (Molecular Probes, Inc.) was used. Cell-seeded gels were incubated in a LG-DMEM solution containing 4 µM ethidium homodimer (EthD-1) and 2 µM calcein AM for 45 min. The gels were then transferred onto glass microscope slides and viewed under a fluorescent microscope. Three random sections of each gel were measured, totaling 500-1500 cells/gel. Dead cells stained with EthD-1 (ex/em ~495 nm/~635 nm) and live cells stained with calcein AM (ex/em ~495 nm/~515 nm) were counted using Image J software (NIH, Bethesda, MD) and cell viability was expressed as a percentage.
4.3.15 Cell proliferation
Fluorometric quantification of DNA content in the digests was performed using a Quant-iT PicoGreen dsDNA Assay Kit (Invitrogen, Carlsbad, CA). The samples were first washed in PBS and stored at -20°C until assayed. After lyophilization, pellets were digested overnight with Proteinase K (100 µg/mL; Sigma) in Tris-HCl-buffer (50 mM Tris, 1mM CaCl2, pH 8.0) at 60°C. Aliquots of pellet digest were diluted 1:10 in Tris-EDTA buffer (TE, 10 mM Tris, 1 mM EDTA, pH 8.0) and processed according to the kit protocol with fluorescence read at 485 nm/535 nm for 1.0 s against a lambda DNA standard on a microplate reader (Wallac Victor2 1420 Multilabel Counter, PerkinElmer Life and Analytical Sciences, Inc., Wellesley, MA).
4.3.16 Statistics
Data are reported as mean ± standard error of the mean (SEM). Statistical significance was determined by analysis of variance (ANOVA) and Fisher’s PLSD post-hoc testing with a significance criterion of p < 0.05 using StatView (SAS Institute, Cary, NC).
4.4 Results
4.4.1 Rheological Behavior
The formation of collagen-genipin, collagen-TGase, and Gtn–HPA hydrogels was studied using oscillatory rheometry, which measures the storage (G’) and loss moduli (G”) of the material as a function of shear strain. Rheological methods have been often employed to study the viscoelastic behavior of materials and G’ is commonly used as an indication of stiffness of a given viscoelastic material. The principal metrics derived from the rheological testing for collagen-genipin, collagen-TGase, and Gtn-HPA gels were: G’ at 5 min; and gel point, which was defined as the time at which G’ and G” crossover, and was employed to evaluate the gelation rate of hydrogel.

82
Collagen-genipin gels
The G’ values for collagen-genipin gels were recorded at 5 and 25 min (Figure 4-2A; n = 3), depicting the modulus dependency on the time of gelation. At 5 min, G’ of collagen-only gels were 16.0 ± 0.5 Pa and that of collagen-1.0 mM genipin gels were 22.0 ± 2.4 Pa. At 25 min, G’ of collagen-only gels were 20.8 ± 0.9 Pa and that of collagen-1.0 mM genipin gels were 45.0 ± 6.0 Pa, depicting a linear dependence of G’ on the concentration of genipin [168]. The long-term modulus of collagen-genipin gels was determined by rheological testing of pre-formed samples. The modulus of collagen-genipin gels increased with time and the time required for G’ to reach a plateau was dependent on the amount of genipin, with 1 mM genipin gels saturating within the first 24 hours, and the 0.5 mM genipin gels saturating around 48 hours. Collagen gels cross-linked with 0.25 mM genipin appeared to continue to increase in modulus through 72 hours. The 72-hour modulus for the gels cross-linked with all the genipin concentrations was approximately 230 Pa, compared to approximately 30 Pa for the non-cross-linked gel.
The gel point of for collagen-only gel was 51 seconds. There was an 8% decrease in the gel time for the gels cross-linked with 1.0 mM genipin. One-factor ANOVA showed no significant effect of genipin concentration on gel point (p = 0.22; power = 0.682) (Figure 4-2B).
Figure 4-2 Rheological behavior of collagen-genipin gels: (A) shear storage modulus G’; and (B) gel time (n = 3, mean ± S.D.)
Collagen-TGase gels
The addition of TGase (5-100 µg/mL, both unpurified and purified) to collagen did not affect modulus values. Gel time was prolonged with an increasing concentration of TGase and high concentrations of TGase (100 µg/mL) prevented gel formation upon warming to 37°C. Furthermore, there was poor reproducibility for rheological characterization of collagen-TGase gels and thus, no rheological data was presented on collagen-TGase gels.
Gtn-HPA gels
Figure 4-3A shows the effects of H2O2 concentration on storage modulus. It was found that modulus was tunable by H2O2 concentration when an aqueous solution of Gtn-HPA

83
conjugate (2 wt%) was utilized. Modulus increased from 450 Pa to 1720 Pa with an increasing H2O2 concentration from 0.85 mM to 1.7 mM suggesting higher cross-linking density was achieved when H2O2 concentration increased.
The gel point of Gtn-HPA gels with different H2O2 concentrations remained at around 28-35 seconds (Figure 4-3B), indicating that gelation rate was relatively independent of H2O2 concentration, given a concentration of HRP (1 U/mL). In addition, the time required for modulus to reach plateau increased with the increase of H2O2 concentration.
Figure 4-3 Rheological behavior of Gtn-HPA gels: (A) shear storage modulus G’; and (B) gel time (n = 3, mean ± S.D.)
4.4.2 Compression testing
Unconfined uniaxial compression testing was used as another method to evaluate mechanical stiffness of hydrogels. Only collagen-genipin and Gtn-HPA gels were tested because TGase did not have an effect on rheological properties of collagen-TGase gels. Multiple compression tests on one particular collagen-genipin gel sample revealed that the effect of repeated testing was minimal.
Collagen-genipin gels
Collagen-genipin gels displayed both elastic and plastic behavior, demonstrated by a difference in the nominal and true stress-strain plots (Figure 4-4). Upon loading, the nominal and true stress-strain curves diverged around 5%, indicating that material contains both elastic and plastic components. For the purposes of this study, collagen-genipin gels were assumed to be elastic and the compression modulus was calculated from the linear regime of the true stress-strain curve (0-15%), which yielded an R2 value of greater than 0.97.

84
Figure 4-4 Typical nominal and true stress/strain curves for collagen-based gels
To determine the effect of strain rate, collagen-genipin gels were compressed at strain rates of 10%/s and 1%/s (Figure 4-5). The modulus of collagen-only gels compressed at 10%/s strain rate was about 2.8-fold higher than gels compressed at 1%/s. With the addition of genipin, the difference in strain rate decreased so that the modulus of collagen gels with 1.0 mM genipin compressed at 10%/s strain rate was about 1.4-fold higher than gels compressed at 1%/s. For collagen-genipin gels tested at 10%/s strain rate, the modulus was approximated from the initial linear regime of the true stress-strain curve (0-7%).
Figure 4-5 Typical effect of strain rate (10%/s vs. 1%/s) on collagen-0.25 mM genipin gels (n = 3)

85
Figure 4-6A shows the typical true stress-strain curves (loading and unloading) for collagen-genipin gels for various concentrations of genipin. Upon loading, the stress increases linearly with strain, reaching a maximum compressive stress at 15% strain of approximately 10 ± 3 Pa (for collagen-only gels) and 50 ± 10 Pa (for collagen gels with 1.0 mM genipin). Upon unloading, there may be competing forces between the collagen fibers and the movement of liquid, which is characteristic of poroelastic or viscoelastic materials, and results in significant hysteresis.
An increase in compressive modulus of collagen-genipin gels was observed with an increased concentration of genipin (Figure 4-6B). At a 1%/s strain rate, collagen-genipin gels ranged from a compressive modulus of 100 ± 10 Pa (collagen-only gels) to 420 ± 40 Pa (collagen gels with 1.0 mM genipin). At 10%/s strain rate, collagen-genipin gels ranged from a compressive modulus of 280 ± 30 Pa (collagen-only gels) to 440 ± 60 Pa (collagen gels with 1.0 mM genipin). Two-factor ANOVA revealed a significant effect of strain rate (p < 0.001; power = 1.0) and genipin concentration (p < 0.001; power = 1.0) on compression modulus. There was not a significant difference in modulus between collagen gels with 0.25 and 0.5 mM genipin.
Figure 4-6 Collagen-genipin compression results: (A) Typical loading and unloading curve (collagen with 0.25 mM genipin), and (B) compression modulus for various concentrations of genipin for 10%/s
and 1%/s strain rates (n = 3, mean ± S.D.)
Gtn-HPA gels
Initial compression testing showed that a difference in strain rate of one magnitude (0.1%/s and 1%/s) did not have a significant effect on the material behavior and compression moduli of Gtn-HPA gels (data not shown). Thus, all Gtn-HPA gels were tested at a strain rate of 0.5%/s. Compressed Gtn-HPA gels displayed hyperelastic behavior in which the loading curve exponentially increased with increasing strain. Furthermore, a divergence in nominal and true stress-strain curves indicated a non-linear component of material behavior acting in the gel (Figure 4-7). Thus, the moduli of Gtn-HPA gels were evaluated using two methods. First, the compression modulus was calculated as the slope of the linear regime (0-15%) of the true stress-

86
strain curve. Second, the shear modulus was calculated using a Mooney-Rivlin analysis for hyperelastic materials.
Figure 4-7 Typical nominal and true stress/strain curves for Gtn-HPA gels
First, the compression modulus was calculated as the slope of the linear regime (0-15%) of the true stress-strain curve. Figure 4-8A shows the typical true stress-strain curve for Gtn-HPA gels for 0.85-1.7 mM H2O2. Upon initial loading (0-15%), the stress increased linearly with strain, and then continued to increase exponentially, reaching a maximum compressive stress at 40% strain of approximately 1400 ± 200 Pa (0.85 mM H2O2) and 3200 ± 400 Pa (1.7 mM H2O2). Hysteresis was present but minimal.
An increasing compressive modulus of Gtn-HPA gels was observed with an increasing concentration of H2O2 (Figure 4-8B). The lowest concentration of H2O2 tested (0.85 mM) resulted in a modulus of 2000 ± 600 Pa, with the highest concentration of H2O2 tested (3 mM) resulting in a modulus of 7600 Pa, with a linear dependence of modulus on H2O2. One-factor ANOVA indicated that H2O2 concentration had a significant effect on the compressive modulus (p < 0.001; power = 0.972).

87
Figure 4-8 Gtn-HPA compression testing: (A) typical true stress-strain curve, and (B) compression moduli for 0.85 – 3.0 mM H2O2 (n = 3, mean ± S.D.)
A second method of characterizing hyperelastic material behavior of Gtn-HPA gels was used, known as Mooney-Rivlin analysis. A non-zero linear slope from 1.0 to 1.5 inverse stretch on the Mooney plot (reduced stress vs. inverse stretch) was used as an indicator that the material was a Mooney-Rivlin material (Figure 4-9A). The vertical curve at 1.0 inverse stretch indicated initial zeroing of force during compression testing. Subsequently, shear modulus can be calculated from the coefficients C10 and C01 (Figure 4-9B). Shear modulus was found to range from 300 ± 100 Pa (0.85 mM H2O2) to 2400 Pa (3.0 mM H2O2).
Figure 4-9 Mooney-Rivlin characterization of Gtn-HPA gels: (A) Mooney plot; (B) shear modulus, G (n = 3, mean ± S.D.)
4.4.3 Environmental scanning electron microscopy
Critical point drying was used to retain the architecture of a hydrated gel. Collagen gels exhibited fibrillar network of collagen fibers with diameter of about 75 nm (Figure 4-10). ESEM imaging revealed that pore size decreased with increasing genipin concentration.

88
Figure 4-10 ESEM images of collagen-genipin gels
Critical point drying was used to process Gtn-HPA gels prior to ESEM imaging. Unlike Collagen-genipin gels, which remained sponge-like after critical point processing, Gtn-HPA gels turned brittle in nature with the dehydration steps. Upon ESEM imaging, Gtn-HPA gels exhibited a less porous structure compared to that of Collagen-genipin gels for all concentrations of H2O2 (Figure 4-11). There were minimal differences among pore morphology and architecture for various concentrations of H2O2. High resolution imaging (above 5000x) was not effective to visualize individual gelatin fibers using ESEM.
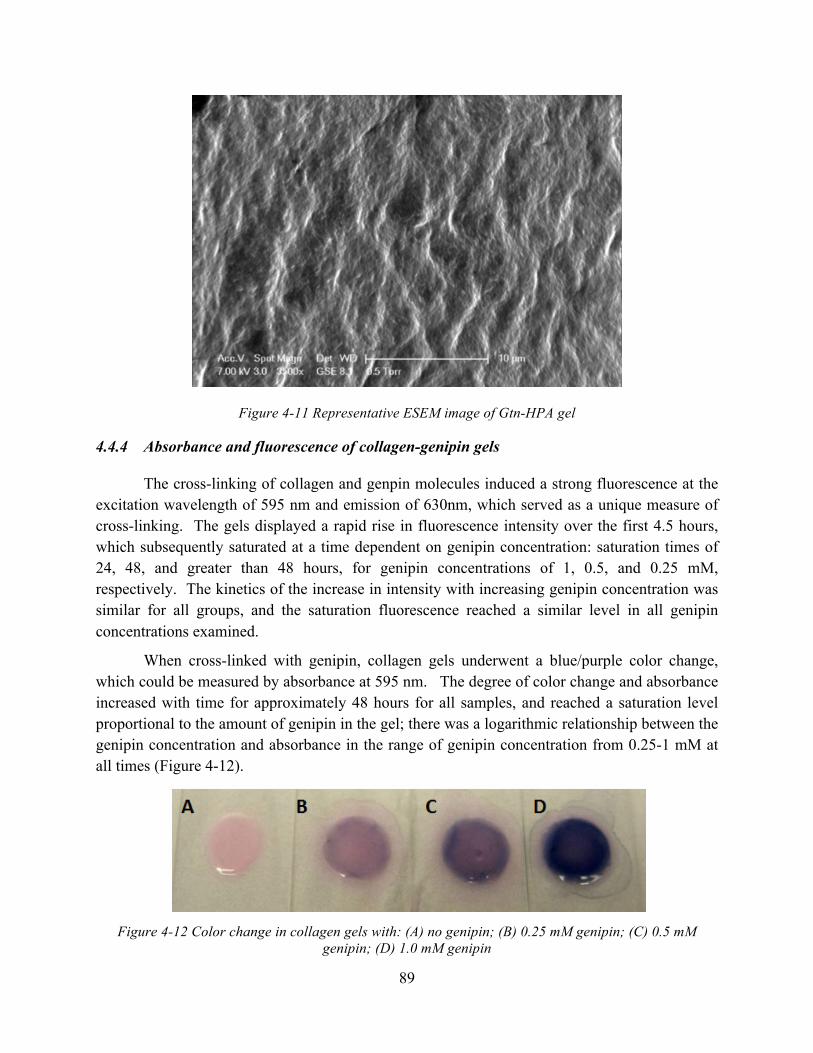
89
Figure 4-11 Representative ESEM image of Gtn-HPA gel
4.4.4 Absorbance and fluorescence of collagen-genipin gels
The cross-linking of collagen and genpin molecules induced a strong fluorescence at the excitation wavelength of 595 nm and emission of 630nm, which served as a unique measure of cross-linking. The gels displayed a rapid rise in fluorescence intensity over the first 4.5 hours, which subsequently saturated at a time dependent on genipin concentration: saturation times of 24, 48, and greater than 48 hours, for genipin concentrations of 1, 0.5, and 0.25 mM, respectively. The kinetics of the increase in intensity with increasing genipin concentration was similar for all groups, and the saturation fluorescence reached a similar level in all genipin concentrations examined.
When cross-linked with genipin, collagen gels underwent a blue/purple color change, which could be measured by absorbance at 595 nm. The degree of color change and absorbance increased with time for approximately 48 hours for all samples, and reached a saturation level proportional to the amount of genipin in the gel; there was a logarithmic relationship between the genipin concentration and absorbance in the range of genipin concentration from 0.25-1 mM at all times (Figure 4-12).
Figure 4-12 Color change in collagen gels with: (A) no genipin; (B) 0.25 mM genipin; (C) 0.5 mM
genipin; (D) 1.0 mM genipin

90
To further elucidate the reaction kinetics of the genipin cross-linked collagen gels, an assay was used to detect genipin released to medium. DMEM-based cell medium containing amino acids was incubated in equal volume with collagen-genipin gels. The medium reacted with free genipin within the gels leading to an intense blue/purple color and an increase in absorbance at 595 nm, but little change in fluorescence of the media. At each time point, the difference in absorbance before and after removing the medium from on top of the gels was measured. The difference in absorption represented the amount of genipin reacting with the media. After 196 hours no further genipin could be removed from the gels at all genipin concentrations measured.
4.4.5 Enzymatic degradation
A 3-D degradation model was used to investigate the collagen-genipin and Gtn-HPA gels resistance to degradation and cross-linking. Pilot studies employing a 1-D degradation model in which gels were incubated in cryotubes and only the top surface of the gel was exposed to collagenase were unreliable because the collagenase tended to seep between the gel and the side of the cryotube, especially for more cross-linked (and more compact) gels. The gels were exposed to 0.1wt% collagenase I (163 U/ml), a concentration chosen so that measurable differences can be seen for various concentrations of cross-linker within a few hours. A higher weight remaining (%) is interpreted as a more cross-linked gel with a more robust resistance to degradation.
Collagen-genipin gels
Collagen-genipin gels were incubated for 1 and 24 hours, known as “maturation time.” Gels containing genipin matured for 24 hours for a given genipin concentration showed greater resistance to degradation than those matured for 1 hour (Figure 4-13). There was no difference between collagen-only gels matured for 1 and 24 hours. However, in gels containing genipin, the increased resistance to degradation to be observed after 60 minutes of exposure to collagenase (Figure 4-13) Furthermore, an increase in genipin concentration increased the gel’s resistance to degradation, reflected in a higher weight remaining.
Figure 4-13 Weight remaining (%) of Collagen-genipin gels at various degradation times for different concentrations of genipin (mM) (n = 3, mean ± S.D.)

91
Figure 4-14 Weight remaining (%) of collagen-genipin gels at various degradation times for different concentrations of genipin (n = 3, mean ± S.D.)
Half-life calculations (Figure 4-15) showed that collagen-genipin gels matured for 1 hour exhibited half-life times from 23.3 ± 7.2 min for collagen-only gels to 89.5 ± 10.7 min for collagen-1.0 mM genipin gels. Collagen-genipin gels matured for 24 hours exhibited half-life times up to 260 ± 40 min for collagen-1.0 mM genipin gels. ANOVA testing revealed a significant effect of maturation time (p < 0.001; power = 1.0) and genipin concentration (p < 0.001; power = 1.0) on half-life. Table 4-2 summarizes weight remaining and half-life times for collagen-genipin gels.
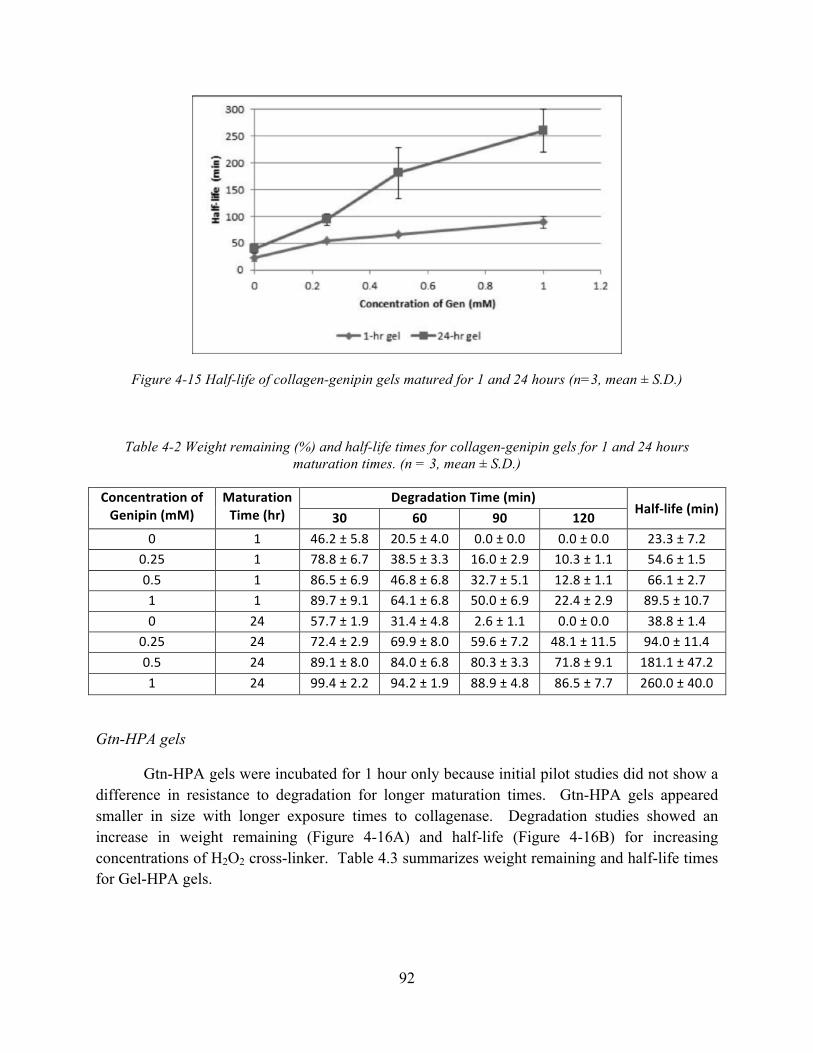
92
Figure 4-15 Half-life of collagen-genipin gels matured for 1 and 24 hours (n=3, mean ± S.D.)
Table 4-2 Weight remaining (%) and half-life times for collagen-genipin gels for 1 and 24 hours maturation times. (n = 3, mean ± S.D.)
Concentration of Genipin (mM)
Maturation Time (hr)
Degradation Time (min) Half-‐life (min)
30 60 90 120 0 1 46.2 ± 5.8 20.5 ± 4.0 0.0 ± 0.0 0.0 ± 0.0 23.3 ± 7.2
0.25 1 78.8 ± 6.7 38.5 ± 3.3 16.0 ± 2.9 10.3 ± 1.1 54.6 ± 1.5 0.5 1 86.5 ± 6.9 46.8 ± 6.8 32.7 ± 5.1 12.8 ± 1.1 66.1 ± 2.7 1 1 89.7 ± 9.1 64.1 ± 6.8 50.0 ± 6.9 22.4 ± 2.9 89.5 ± 10.7 0 24 57.7 ± 1.9 31.4 ± 4.8 2.6 ± 1.1 0.0 ± 0.0 38.8 ± 1.4
0.25 24 72.4 ± 2.9 69.9 ± 8.0 59.6 ± 7.2 48.1 ± 11.5 94.0 ± 11.4 0.5 24 89.1 ± 8.0 84.0 ± 6.8 80.3 ± 3.3 71.8 ± 9.1 181.1 ± 47.2 1 24 99.4 ± 2.2 94.2 ± 1.9 88.9 ± 4.8 86.5 ± 7.7 260.0 ± 40.0
Gtn-HPA gels
Gtn-HPA gels were incubated for 1 hour only because initial pilot studies did not show a difference in resistance to degradation for longer maturation times. Gtn-HPA gels appeared smaller in size with longer exposure times to collagenase. Degradation studies showed an increase in weight remaining (Figure 4-16A) and half-life (Figure 4-16B) for increasing concentrations of H2O2 cross-linker. Table 4.3 summarizes weight remaining and half-life times for Gel-HPA gels.

93
Figure 4-16 Enzymatic degradation of Gtn-HPA gels for various concentrations of H2O2: (A) Weight remaining (%); and (B) Half-life (n = 3, mean ± S.D.)
Table 4-3 Weight remaining (%) and half-life times for Gtn-HPA gels. (n = 3, mean ± S.D.)
Concentration of H2O2 (mM)
Degradation time (min) Half-‐life (min)
30 60 90 120 0.85 38.6 ± 12.1 15.1 ± 6.3 1.2 ± 0.5 0.0 ± 0.0 18.8 ± 4.3 1.0 43.0 ± 11.0 22.3 ± 3.8 7.1 ± 1.5 1.2 ± 1.0 16.7 ± 1.3 1.2 48.1 ± 13.5 23.6 ± 9.4 11.1 ± 6.9 5.0 ± 2.2 36.9 ± 2.7 1.7 64.3 ± 1.4 49.0 ± 3.8 45.4 ± 3.0 14.2 ± 5.5 57.6 ± 2.9
4.4.6 Swelling ratio
The swelling ratio of collagen-genipin gels formed with different concentrations of genipin is shown in (Figure 4-17A). The swelling ratio of collage-only gels is 77.2 ± 1.5 and 89.7 ± 22.8 at 1 and 7 days, respectively. With the addition of 0.25 mM genipin, the swelling ratio increases to 109.6 ± 17.4 and 117.6 ± 9.2 at 1 and 7 days, respectively. With the further addition of genipin, the swelling ratio decreases, indicating that the swelling capacity was reduced due to more cross-links. There was no statistical difference of swelling ratio between 1 and 7 days. Two-factor ANOVA testing revealed a significant effect of genipin concentration (p < 0.001; power = 1.0) on swelling ratio but not maturation time (p = 0.349; power = 0.873). The decrease in swelling ratio was consistent with a decrease in pore size seen in ESEM images.
The swelling ratio of Gtn-HPA gels formed with different concentrations of H2O2 is shown in (Figure 4-17B). The swelling ratio of Gtn-HPA gels ranges from 27.6 ± 0.5 (0.85 mM H2O2) to 17.7 (3 mM H2O2), decreasing with an increasing concentration of H2O2.
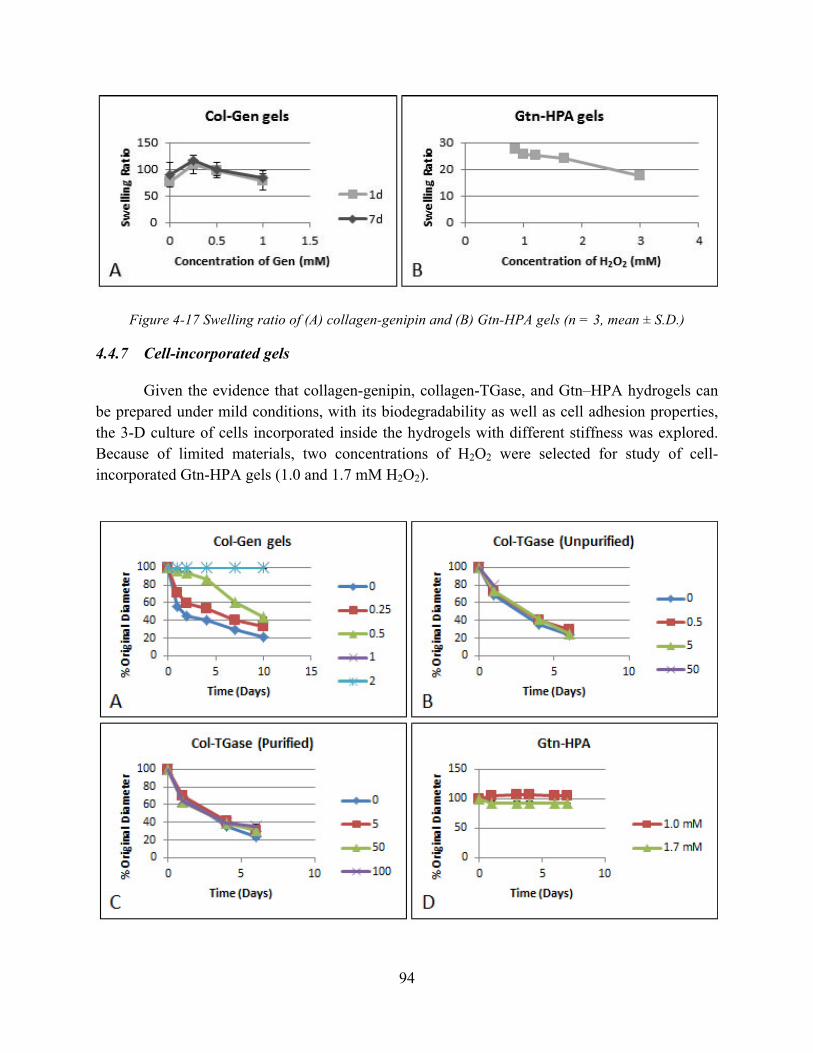
94
Figure 4-17 Swelling ratio of (A) collagen-genipin and (B) Gtn-HPA gels (n = 3, mean ± S.D.)
4.4.7 Cell-incorporated gels
Given the evidence that collagen-genipin, collagen-TGase, and Gtn–HPA hydrogels can be prepared under mild conditions, with its biodegradability as well as cell adhesion properties, the 3-D culture of cells incorporated inside the hydrogels with different stiffness was explored. Because of limited materials, two concentrations of H2O2 were selected for study of cell-incorporated Gtn-HPA gels (1.0 and 1.7 mM H2O2).

95
Figure 4-18 Contraction data for MSCs incorporated in (A) collagen-genipin gels (0-2mM genipin); (B) collagen-TGase (unpurified) gels (0-50 mg/ml TGase); (C) collagen-TGase (purified) gels (0-100 µg/ml
TGase); and (D) Gtn-HPA gels (1.0 and 1.7 mM H2O2) (n = 3, mean ± S.D.)
MSCs in collagen-genipin gels contracted over 10 days (n = 8). The non-cell-incorporated gels employed in this study did not contract, and maintained their original diameters of 16 mm throughout the culture period. By day 10, MSC-seeded collagen-genipin gels decreased to 21.9 ± 0.6% (collagen-only), 33.1 ± 0.5% (collagen-0.25 mM genipin), and 43.8 ± 0.6% (collagen-0.5 mM genipin). In contrast, MSCs seeded in collagen gels with 1 mM and 2 mM genipin gels did not contract (Figure 4-18A). Most of the contraction occurred during the first 4 days at which the size of the scaffolds reached 40.3 ± 0.7% (collagen-only), 53.1 ± 0.7% (collagen-0.25 mM genipin), and 86.6 ± 0.4% (collagen-0.5 mM genipin) of their original diameters.
Calcein AM was used to stain live MSCs incorporated in gels. MSCs in the complaint collagen-only gels were elongated with filopodia-rich morphology (Figure 4-19A). With the addition of 0.25mM genipin, cells in general appeared less elongated with a more rounded morphology (Figure 4-19B). With an addition of 0.5mM or more genipin, all the cells appeared rounded (Figure 4-19C). The change in cell morphology demonstrates an increase in stiffness with the addition of genipin.
Figure 4-19 MSCs in collagen-genipin gels at day 7: (A) collagen-only; (B) collagen-0.25mM genipin; (C) collagen-0.5mM genipin (n = 3)
TGase has been shown to increase stiffness of gelatin and collagen gels. However, MSCs seeded in collagen-TGase gels with different concentrations of TGase (unpurified and purified) did not exhibit a difference in contraction in the 6 days of culture time compared with collagen-only gels (Figure 4-20B,C). Upon gel casting (37°C for 1 hour), gels containing up to 5 mg/ml of unpurified TGase formed a semi-solid gel. High concentrations of unpurified TGase (50 mg/ml) seemed to prevent collagen gel formation. Gels cross-linked with 5-100 µg/ml purified TGase did not seem to exhibit a difference in contraction profile compared with collagen-only gels. ANOVA testing showed no significant difference with the addition of unpurified or purified TGase. MSCs appeared elongated with filopodia-rich morphology in all gels, regardless of TGase concentration (Figure 4-20).

96
Figure 4-20 MSCs in collagen-TGase (purified) gels at day 7: (A) collagen-only; (B) collagen-5 µg/ml TGase; (C) collagen-50 µg/ml TGase; (D) collagen-100 µg/ml TGase (n = 3)
MSCs incorporated in Gtn-HPA gels did not contract the gel in the 7 days of culture (Figure 4-21D). Instead, Gtn-HPA gels swelled to 107 ± 3% of its original 9.5 mm diameter (1.0 mM H2O2) or shrunk to 92.6 ± 2.6% of its original diameter (1.7 mM H2O2) immediately after gel casting, and maintained the diameter change for the entire culture period. The diameter change was likely due to a difference in swelling ratio of less cross-linked gel (1.0 mM H2O2) compared to a more cross-linked gel (1.7 mM H2O2). Despite the lack of contraction of the MSC-seeded Gtn-HPA gels, there was a difference in cell morphology. MSCs seeded in the compliant Gtn-HPA gels appeared elongated with filopodia-rich morphology (Figure 4-21A), whereas MSCs seeded in the stiffer Gtn-HPA gels appeared more rounded (Figure 4-21B).
Figure 4-21 MSCs in Gtn-HPA gels at day 7: (A) 1.0 mM H2O2 and (B) 1.7 mM H2O2 (n = 3)
4.4.8 Rheological behavior of cell-incorporated gels
Rheology was used to determine the stiffness of cell-incorporated collagen-genipin gels at 1 and 6 days for three genipin concentrations: 0, 0.25, and 0.5 mM. At 1 day, MSC-seeded gels had contracted to 8.6 ± 0.05 mm (collagen-only), 11.1 ± 0.08 mm (collagen-0.25mM genipin), and 14.9 ± 0.1 mm (collagen-0.5 mM genipin) in diameter. The modulus of MSC-seeded gels at 1 day were 109.6 ± 11.7 Pa (collagen-only), 119.7 ± 19.7 Pa (collagen-0.25 mM genipin), and 80.98 ± 22.2 Pa (collagen-0.5 mM genipin) (Figure 4-22). At 6 days, MSC-seeded gels contracted further to 4.5 ± 0.08 mm (collagen-only), 6.2 ± 0.09 mm (collagen-0.25 mM

97
genipin), and 9.3 ± 0.1 mm (collagen-0.5 mM genipin). The constructs appeared more opaque, indicating contraction and tissue formation. The modulus of the constructs at 6 days increased to 190.5 ± 19.7 Pa (collagen-only), 176.6 ± 29.3 Pa (collagen-0.25 mM genipin), and 192.6 ± 10.6 Pa (collagen-0.5 mM genipin). ANOVA testing showed a significant effect of culture time on modulus (p < 0.001; power = 1.0), but no significant effect of genipin concentration on modulus.
Figure 4-22 Storage modulus for MSCs and ECCs at for various concentrations of genipin at 1 and 6 days (n = 4, mean ± S.D.)
Conversely, ECCs did not contract the gel and remained at 15.5 mm in diameter for the entire culture period. At 1 day, the moduli of ECC-seeded gels were 68.6 ± 4.6 Pa (collagen-only), 143.0 ± 16.6 Pa (collagen-0.25 mM genipin), and 128.6 ± 27.4 Pa (collagen-0.5 mM genipin). At 6 days, the moduli of ECC-seeded gels were 106.03 ± 30.3 Pa (collagen-only), 118.2 ± 31.3 (collagen-0.25 mM genipin), and 128.8 ± 10.6 Pa (collagen-0.5 mM genipin). ANOVA testing showed a significant effect of genipin concentration between collagen-only and collagen-0.25 mM genipin on modulus, but no significant effect on the increase in genipin concentration from 0.25 to 0.5 mM, nor the culture time on modulus.
4.4.9 Cell viability
Collagen-genipin, collagen-TGase, and Gtn-HPA gels were evaluated for cell viability when MSCs were incorporated in gels. MSCs adhered and began spreading within 4 hours on all three gels. In collagen-genipin gels, significant cell death was seen even after 1 day in collagen gels with 0.5 mM genipin (Figure 4-23A). Monolayer studies in which MSCs were exposed to genipin revealed that the presence of genipin was interfering with cell viability (not shown). It

98
was hypothesized that the genipin was cross-linking the amino acids in the medium, making them unavailable as cell nutrients. Subsequent cell-incorporated collagen-genipin studies showed that removing excess genipin through media change increased cell viability significantly (Figure 4-23B). The viabilities of the incorporated cells, calculated from counts of the number of living and dead cells stained using fluorescent dye, were 92.9 ± 2.8% (collagen-only), 87.1 ± 7.6% (0.25 mM genipin), 96.8 ± 1.2% (0.5 mM genipin), 23.5 ± 7.8 (1.0 mM genipin), and 0.0 ± 0.0% (2.0 mM genipin) after 10 days in culture.
Figure 4-23 Cell viability for MSCs incorporated collagen-genipin gels (0-2 mM genipin) (A) before and (B) after excess genipin was removed (n = 3, mean ± S.D.)
The cell viabilities of MSCs incorporated in collagen gels with various concentrations of unpurified TGase (0.5-5 mg/ml) were 89.4 ± 13.0% (collagen-only), 80.9 ± 9.2% (0.5 mg/ml TGase), 80.2 ± 0.4% (5 mg/ml TGase), and 58.6 ± 14.5% (50 mg/ml TGase) at 6 days (Figure 4-24A). MSCs exhibited higher cell viabilities in collagen gels with various concentrations of purified TGase: 94.9 ± 2.6% (collagen-only), 80.4 ± 4.6% (5 µg/ml TGase), 76.8 ± 6.9% (50 µg/ml TGase), and 87.6 ± 11.2% (100 µg/ml TGase) at 6 days (Figure 4-24B).

99
Figure 4-24 Cell viability for MSCs incorporated in (A) collagen-TGase (unpurified) gels (0-50 mg/ml TGase); (B) collgen-TGase (purified) gels (0-100 µg/ml TGase); and (C) Gtn-HPA gels (1.0 and 1.7 mM
H2O2) (n = 3, mean ± S.D.)
The cell viabilities of MSCs incorporated in Gtn-HPA gels were 96.2 ± 3.9% (1.0 mM H2O2) and 98.9 ± 0.8% (1.7 H2O2) at 7 days (Figure 4-24C). Considering the well-known toxicity of H2O2, viability would be expected to decrease if a higher concentration of H2O2 was to be used. However, there was no significant reduction in the viability of mammalian cells exposed to the gelation of Gtn-HPA gels using 1 unit/ml HRP and up to 1.7 mM H2O2.
4.4.10 Cell proliferation
Proliferation studies on MSC-incorporated collagen-genipin gels show that there was a significant increase in DNA content for MSCs incorporated in collagen-only and collagen-0.25 mM genipin gels. Specifically, DNA content increased from 0.053 ± 0.006 µg to 0.278 ± 0.028 µg (a 5-fold increase) for collagen-only gels and increased from 0.057 ± 0.011 µg to 0.383 ± 0.022 µg (a 7-fold increase) for collagen-0.25 mM genipin gels (Figure 4-25A). For genipin concentrations 0.5 mM or greater, DNA content levels were maintained or decreased from 1 to 7 days.
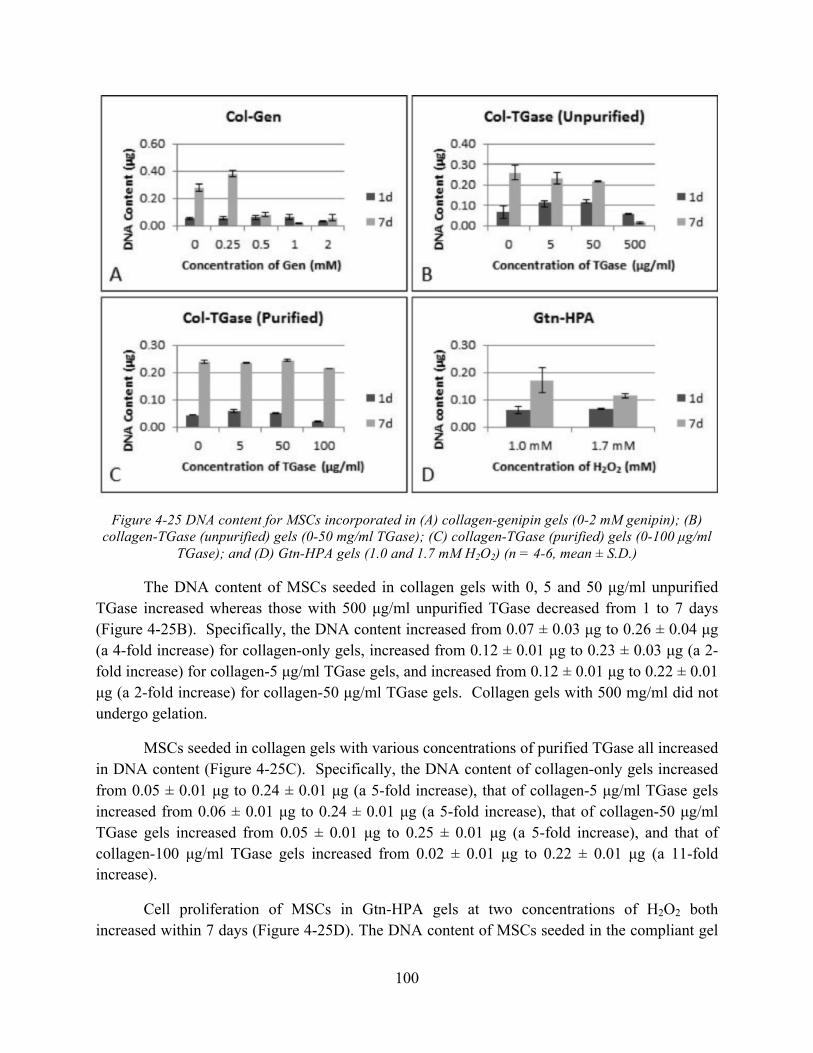
100
Figure 4-25 DNA content for MSCs incorporated in (A) collagen-genipin gels (0-2 mM genipin); (B)
collagen-TGase (unpurified) gels (0-50 mg/ml TGase); (C) collagen-TGase (purified) gels (0-100 µg/ml TGase); and (D) Gtn-HPA gels (1.0 and 1.7 mM H2O2) (n = 4-6, mean ± S.D.)
The DNA content of MSCs seeded in collagen gels with 0, 5 and 50 µg/ml unpurified TGase increased whereas those with 500 µg/ml unpurified TGase decreased from 1 to 7 days (Figure 4-25B). Specifically, the DNA content increased from 0.07 ± 0.03 µg to 0.26 ± 0.04 µg (a 4-fold increase) for collagen-only gels, increased from 0.12 ± 0.01 µg to 0.23 ± 0.03 µg (a 2-fold increase) for collagen-5 µg/ml TGase gels, and increased from 0.12 ± 0.01 µg to 0.22 ± 0.01 µg (a 2-fold increase) for collagen-50 µg/ml TGase gels. Collagen gels with 500 mg/ml did not undergo gelation.
MSCs seeded in collagen gels with various concentrations of purified TGase all increased in DNA content (Figure 4-25C). Specifically, the DNA content of collagen-only gels increased from 0.05 ± 0.01 µg to 0.24 ± 0.01 µg (a 5-fold increase), that of collagen-5 µg/ml TGase gels increased from 0.06 ± 0.01 µg to 0.24 ± 0.01 µg (a 5-fold increase), that of collagen-50 µg/ml TGase gels increased from 0.05 ± 0.01 µg to 0.25 ± 0.01 µg (a 5-fold increase), and that of collagen-100 µg/ml TGase gels increased from 0.02 ± 0.01 µg to 0.22 ± 0.01 µg (a 11-fold increase).
Cell proliferation of MSCs in Gtn-HPA gels at two concentrations of H2O2 both increased within 7 days (Figure 4-25D). The DNA content of MSCs seeded in the compliant gel

101
(1.0 mM H2O2) increased from 0.06 ± 0.01 µg to 0.17 ± 0.05 µg (a 2.8-fold increase), and those seeded in the stiffer gel (1.7 mM H2O2) increased from 0.07 ± 0.00 µg to 0.12 ± 0.01 µg (a 1.5-fold increase) (p < 0.001; power = 1.0).
4.5 Discussion
Injectable biopolymer gels are promising ECM analogs for the minimally invasive delivery of cells, growth factors, and cytokines for cardiac tissue engineering applications. In this chapter, three hydrogel systems (collagen-genipin, collagen-TGase, and Gtn-HPA gels) were investigated and evaluated based on various metrics and design criteria. With cardiac jelly as a target lower limit in the range of mechanical properties, due to its function in embryonic cardiac development, we have characterized these gels based on rheological and mechanical behavior (gel time and modulus), resistance to enzymatic degradation (kinetic profile and half-life), and cellular response (viability, proliferation, and contraction). All three gel systems have been reported to have the novel capability to covalently form cross-links in situ, which make them ideal candidates as injectable materials for tissue engineering and drug delivery applications.
Although the same methodologies and metrics were used to evaluate the three gel systems, comparisons across the gels are difficult and carefully made primarily due to the differences in polymer concentration. Collagen-genipin and collagen-TGase were used with a collagen concentration of 0.2 wt% while Gtn-HPA gels were used with a gelatin concentration of 2 wt%, a 10-fold difference. There were two major reasons for this: first, maximum concentration of stock collagen is approximately 0.5-0.6 wt%, depending on the manufacturer, due to the limitations of acid-solubilized collagen isolation methods. All reported studies that employ type I soluble collagen use a collagen concentration of 0.2-0.3 wt%. Secondly, pilot studies with Gtn-HPA gels revealed that gelatin concentrations of less than 1 wt% do not form a stable gel. Thus, there is an one magnitude difference between collagen-based gels and Gtn-HPA gels, and this difference must be carefully considered when evaluating and comparing these gel systems.
4.5.1 Collagen-genipin gels
Collagen-genipin cross-linking
Acid solubilized collagen is a thermogelling material which undergoes a sol-gel transition upon warming above 4°C, when brought to physiologic pH and ionic strength, to form a fibrillar gel network [168, 182]. The reaction kinetics are temperature-dependent, occurring on the order of seconds to minutes close to 37°C [183]. The telopeptide regions among triple helices play an important role in the formation and stabilization of the collagen fibrils [184]. Collagen has approximately 90 amine groups per collagen molecule, dispersed throughout the triple helical and telopeptide regions [185]. These primary amine groups provide cross-linking sites for genipin.
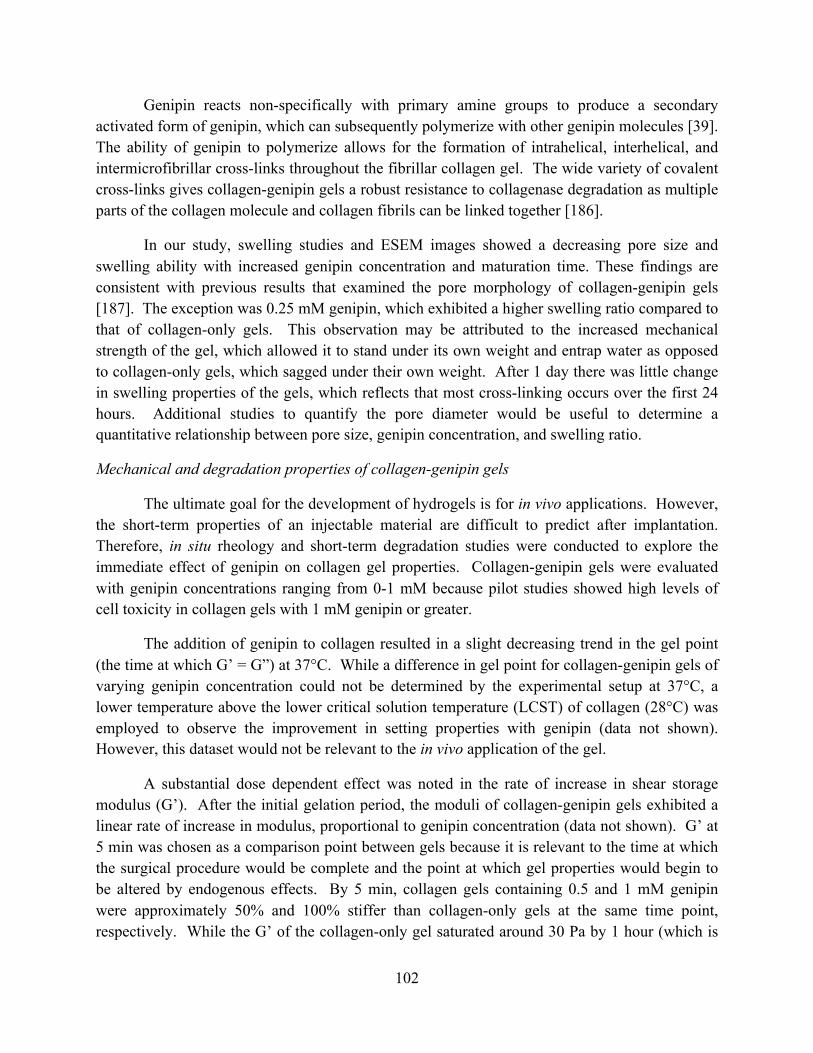
102
Genipin reacts non-specifically with primary amine groups to produce a secondary activated form of genipin, which can subsequently polymerize with other genipin molecules [39]. The ability of genipin to polymerize allows for the formation of intrahelical, interhelical, and intermicrofibrillar cross-links throughout the fibrillar collagen gel. The wide variety of covalent cross-links gives collagen-genipin gels a robust resistance to collagenase degradation as multiple parts of the collagen molecule and collagen fibrils can be linked together [186].
In our study, swelling studies and ESEM images showed a decreasing pore size and swelling ability with increased genipin concentration and maturation time. These findings are consistent with previous results that examined the pore morphology of collagen-genipin gels [187]. The exception was 0.25 mM genipin, which exhibited a higher swelling ratio compared to that of collagen-only gels. This observation may be attributed to the increased mechanical strength of the gel, which allowed it to stand under its own weight and entrap water as opposed to collagen-only gels, which sagged under their own weight. After 1 day there was little change in swelling properties of the gels, which reflects that most cross-linking occurs over the first 24 hours. Additional studies to quantify the pore diameter would be useful to determine a quantitative relationship between pore size, genipin concentration, and swelling ratio.
Mechanical and degradation properties of collagen-genipin gels
The ultimate goal for the development of hydrogels is for in vivo applications. However, the short-term properties of an injectable material are difficult to predict after implantation. Therefore, in situ rheology and short-term degradation studies were conducted to explore the immediate effect of genipin on collagen gel properties. Collagen-genipin gels were evaluated with genipin concentrations ranging from 0-1 mM because pilot studies showed high levels of cell toxicity in collagen gels with 1 mM genipin or greater.
The addition of genipin to collagen resulted in a slight decreasing trend in the gel point (the time at which G’ = G”) at 37°C. While a difference in gel point for collagen-genipin gels of varying genipin concentration could not be determined by the experimental setup at 37°C, a lower temperature above the lower critical solution temperature (LCST) of collagen (28°C) was employed to observe the improvement in setting properties with genipin (data not shown). However, this dataset would not be relevant to the in vivo application of the gel.
A substantial dose dependent effect was noted in the rate of increase in shear storage modulus (G’). After the initial gelation period, the moduli of collagen-genipin gels exhibited a linear rate of increase in modulus, proportional to genipin concentration (data not shown). G’ at 5 min was chosen as a comparison point between gels because it is relevant to the time at which the surgical procedure would be complete and the point at which gel properties would begin to be altered by endogenous effects. By 5 min, collagen gels containing 0.5 and 1 mM genipin were approximately 50% and 100% stiffer than collagen-only gels at the same time point, respectively. While the G’ of the collagen-only gel saturated around 30 Pa by 1 hour (which is
103
consistent with reported findings [188]), the G’ of collagen-genipin gels (0.25-1 mM genipin) continued to increase with time, indicating the persistence of cross-linking reactions. The saturation of G’ as determined by rheological testing of pre-formed gel samples, indicated that all collagen-genipin gels (0.25-1 mM genipin) reached a similar modulus at 72 hours, but the time to reach the final modulus was dependent on genipin concentration. The incubation time or time allowed for cross-linking to occur is known as “maturation time.” In addition to the increase in G’, the time effect of genipin cross-linking was also observed through a color change and an increased resistance to enzymatic degradation. Collagen-genipin gels appeared a more intense color of blue for higher concentrations of genipin and for longer maturation times.
Initial stress-strain curves of collagen-genipin gels obtained during unconfined compression testing showed evidence of adhesion between the sample and the platens, indicated by the sharp decrease in slope upon the unloading curve. Adhesion was accounted for in future experiments by placing Teflon sheets between the sample and the platens. The resulting stress-strain profiles of the collagen-genipin gels did not appear significantly different when samples were placed on Teflon sheets. Future work should explore other methods of accounting for adhesion, such as using mineral oil to lubricate the platens.
For an incompressible material (Poisson’s ratio ν = 0.5), the compressive modulus (E) is equal to three times the storage modulus (G). In our studies, we found that E was equal to about 2-fold the G’, suggesting that collagen-genipin gels cannot be characterized as completely incompressible material. Furthermore, the divergence of nominal and true stress-strain curves and the presence of hysteresis indicate that collagen-genipin gels cannot be characterized as a purely elastic material. Further characterization of collagen-genipin gels as a poroelastic or viscoelastic material would provide more insight to its material behavior. Specifically, collagen-genipin gel behavior can be fit to viscoelastic models such as the Maxwell model or the standard linear solid model, and the material constants viscoelasticity (η) and spring constant (k) can be determined. Furthermore, poroelastic models such as the Biot model can be used to account for the movement of liquid throughout the collagen fibrils. Finally, some models developed specifically to account for the elasticity of collagen, developed by MacKintosh [189] and Morse [190] have been proposed to describe chemically cross-linked networks or sterically entangled networks of semi-flexible polymers. These additional analyses would provide a more accurate material characterization of collagen-genipin gels.
Standardized degradation assays provide simple metrics to predict an important in vivo property of the gel: its persistence to provide a provisional stroma for cardiomyocytes and angiogenesis at the infarct site. They also provide a reliable high-throughput method for comparing the extent of cross-linking in collagen gels with respect to both genipin concentration and maturation time [168]. The collagenase concentration (0.1 wt%, 163 U/mg) was chosen to provide an accelerated assay for gel degradation, in order to compare the effect of genipin concentration on gel robustness. Furthermore, this collagenase concentration allowed a kinetic profile to be established for Gtn-HPA gels, allowing comparison across gel types.

104
The collagenase concentration used in our studies was much higher than the concentration of matrix metalloproteinases (MMPs) that would be found in an inflamed body setting, and in particular myocardial infarction. MMPs degrade ECM and contribute to adverse myocardial remodeling with ischemia and reperfusion. MMP plasma profiling revealed baseline levels of 670 ng/mL MMP-2 and 150 ng/mL MMP-9 in cardiac tissue, increasing to 760 ng/mL MMP-2 and 650 ng/mL MMP-9 after cardiac arrest [191]. MMP-2 and MMP-9 degrade gelatins, collagens, and various other substrates [192]. Given the constantly changing in vivo dynamics and variables affecting degradation rate, including the beating of cardiac muscle, cellular infiltration, and blood flow, it is particularly difficult to create an in vitro assay to predict the persistence of the gel in vivo. Current investigations of collagen-genipin gels in a rat model would provide additional insight into gel behavior in an inflamed tissue setting.
Three-dimensional enzymatic degradation experiments were conducted at maturation times of 1 and 24 hours and for degradation times of 30-120 min to establish a kinetic profile for gel degradation, from which a half-life was obtained as a comparative metric for each gel. A significant increase in the resistance to degradation was observed with a small addition of genipin (0.25 mM) even after a maturation time of only 1 hour. The resistance to degradation increased with genipin concentration and maturation time.
Overall, genipin has a more substantial impact on the degradation properties of the collagen gel compared to its impact on the gel’s mechanical properties [168]. Since genipin has the ability to form cross-links of multiple lengths, it is possible that the combination of short- and long-range cross-links provide more substantial degradation resistance of the gels but contributes less to its stiffness because that is more dependent on the number of shorter links opposing collagen fiber motion.
Cellular response to collagen-genipin gels
Our studies showed that genipin is well tolerated in many stem cell types at concentrations capable of producing robust gels. MSCs and ECCs have the potential to provide therapeutic benefit after myocardial infarcts by stimulating endogenous progenitor cell migration and proliferation, reducing inflammation, stimulating angiogenesis, and replacing lost cell populations [32]. In our studies, MSCs were capable of being incorporated within the gels, surviving the gelation process, and remaining viable for 10 days within the gel. It is important to note that the medium was changed shortly after (4 hours) initial gelation. The practical correlation of changing medium is that the constantly changing in vivo environment would remove excess genipin molecules. Substantial numbers of MSCs (80%) survived at genipin for concentrations up to 0.5 mM.
It has been reported that fibroblasts experienced 50% cell death when exposed to 5 mM genipin for 24 hours [39]. However, a different methodology was used in which the cells were first incorporated in a 0.2 wt% collagen gel and then exposed to a 5 mM genipin solution that
105
slowly diffused through the collagen concentration. In our studies, when cells are in contact with genipin in the collagen gel initially, there is some cell death within the first 24 hours due to genipin cross-linking amines in medium so that cells have fewer nutrients. Genipin molecules cross-link primary amines in both collagen and cell culture medium.
The profile of the change in diameter of MSC-incorporated gels provides an indication of the mechanical stiffness of collagen-genipin gels since stiffer gels resist cell contraction and MMP degradation [193]. Two metrics can be derived from the diameter profile: 1) the initial rate of diameter decrease from the first 3 days in culture, and 2) the diameter at the end of the culture period (terminal diameter). We observed a lower initial rate of decrease in diameter and a higher terminal diameter with higher concentrations of genipin. However, these metrics are confounded by cell viability and thus cell number, which decrease with increasing genipin concentrations. MSC-incorporated collagen gels with 1-2 mM genipin did not change in diameter because of high cell toxicity, and thus at moderate concentrations of genipin (0.25-0.5 mM), cell toxicity and cell number are likely to affect diameter change as well. Thus the diameter change is likely due to a combination of cell contraction and gel degradability. Additional studies to understand and isolate the effects of gel contraction and gel degradability can be derived from encapsulating MSCs in a non-degrading gel such as agarose or silicone.
The morphology of MSCs at genipin concentrations of 0.25 mM was similar to the control collagen gels, exhibiting an elongated spindle-like shape similar to that of fibroblasts. Preliminary experiments of ECC-incorporated collagen-genipin gels showed that ECCs were more tolerant of higher genipin concentrations and 80% of cells were viable in collagen gels containing up to 0.5 mM genipin (data not shown). One possible explanation for this observation is the culture of ECCs as EBs, in which cell-cell contact is increased and individual cells have less exposure to genipin. An increase in MSC proliferation in collagen-only and collagen-0.25 mM genipin gels compared to collagen gels with 0.5-2 mM genipin, is correlated with a higher cell viability and a greater extent of diameter decrease. This provides insight into the potential application of collagen-genipin gels for cardiac tissue engineering. Collagen gels populated with cardiomyocytes contracted significantly to achieve a certain mechanical strength [194]. Increasing the gel stiffness with genipin cross-linking could assist in cardiac differentiation or support cardiomyocyte beating.
In addition to its cross-linking capabilities, the genipin molecule has been found to be a therapeutic agent itself. At concentrations above 25 µg/mL (0.11 mM), genipin has been found to inhibit fibroblast differentiation into myofibroblasts during wound healing and decrease their expression of collagen I, α-smooth muscle actin, and TGF-β [195]. Similar effects have been noted with hepatic stellate cells [196, 197]. Additionally, genipin has known anti-inflammatory properties [198]. Together these properties make genipin not only a cross-linking agent for collagen but a therapeutic agent itself.

106
4.5.2 Collagen-transglutaminase gels
Although there have been many reported studies on the use of TGase as an effective cross-linker for gelatin [45, 46, 199, 200] and collagen [43, 44, 201], increasing the mechanical properties and resistance to degradation of the resulting gels, TGase was found to be an ineffective cross-linker in our studies. Microbial TGase (ACTIVA TI) was obtained from Ajinomoto Food Ingredients LLC, a manufacturer that supplies many researchers with an unpurified protein mixture (99% maltodextrin and 1% TGase). Similar to many studies, TGase was purified using a column filled with rigid, highly cross-linked, and porous agarose beads that sorts a protein mixture by size exclusion; purified TGase was confirmed using a Bradford assay. Both unpurified and purified versions of TGase were used to cross-link collagen, but rheological studies revealed no immediate effect of either source of TGase as an effective cross-linker. Additional rheological studies performed on pre-formed gels matured for 72 hours revealed that there was a minimal increase of modulus with the addition of TGase compared to collagen-only gels, but the effect was not significant (p = 0.384; power = 0.588). MSCs cultured in collagen-TGase gels (0-100 µg/mL TGase) for 7 days showed no difference in the diameter profiles among different TGase concentrations compared to collagen-only gels.
Future work investigating TGase as a cross-linker needs to take into consideration a number of factors. First, TGase must be adequately processed and purified before usage as a cross-linker. Purification via column was used in our studies, but future work exploring other purification means, such as gel filtration affinity chromatography, should be investigated. Second, future work needs to have an in-depth investigation on the physiologic conditions (such as temperature and pH) of collagen-TGase thermo-gelling. Previous studies have shown that although 37°C is the optimum temperature for TGase activity, TGase has been shown to express appreciable activity from 10-70°C. Furthermore, the enzyme showed optimum activity around the pH range of 5–8 [201]. Finally, mammalian TGase can be investigated as another source of TGase [174]. Because of diverging evolutionary pathways, mammalian and microbial TGases are structurally and functionally different and thus their attending cross-linking behaviors would likely be different [173].
4.5.3 Gelatin-hydroxyphenylpropionic acid gels
Gtn-HPA cross-linking
Gtn–HPA hydrogels were formed using the oxidative coupling of HPA moieties catalyzed by H2O2 and HRP in which H2O2 controls the number of cross-links formed and HRP modulates the cross-linking rate. Phenols cross-link through either a more common C–C linkage between the ortho-carbons of the aromatic ring or a C–O linkage between the ortho-carbon and the phenolic oxygen [202]. Swelling studies showed an approximate 17% decrease in swelling ability corresponding with an increase in 1.0 mM of H2O2 cross-linker (p < 0.001; power = 1.0). ESEM imaging was used to characterize the pore structure and investigate the correlation
107
between gel morphology and decreasing swelling ratio. However we found ESEM imaging difficult for Gtn-HPA gels because of their incompatibility with the critical point drying process. There have been no reported studies that characterize Gtn-HPA pore structure and gel morphology using ESEM. However, SEM imaging of hyaluronic acid (HA)-tyramine (Tyr) gels that were cross-linked using the same HRP/H2O2 oxidative coupling system showed a decreasing pore diameter with increasing H2O2 concentration [47]. Although other studies have reported successful processing and ESEM/SEM imaging of gelatin gels [203, 204], the HPA moiety of Gtn-HPA gels may be incompatible with critical point drying and other processing techniques. Future ESEM imaging of Gtn-HPA gels could focus on imaging the gels in a humidified, low-pressure environment to prevent dehydration of the gels.
Mechanical and degradation properties of Gtn-HPA gels
Gtn-HPA gels were evaluated at H2O2 concentrations ranging from 0.85-1.7 mM because preliminary data showed that G’ values of an order of magnitude can be obtained at that H2O2 concentration range. G’ found from rheological studies showed that our results correlated well with those reported in literature [179]. All Gtn-HPA gels had a gel point around 30 seconds and the addition of H2O2 resulted in a slight decreasing trend in the gel point at 37°C but ANOVA testing did not show a significant effect (p = 0.392; power = 0.98). The kinetic profile depicting G’ vs. time revealed that G’ reached saturation values after approximately 30-60 s for all concentrations of H2O2 tested. A substantial dose-dependent effect of H2O2 was noted with the increase of the plateau value of G’, which ranged from 450 Pa with 0.85 mM H2O2 to 1700 Pa with 1.7 mM H2O2.
The G’ values obtained from rheological testing correlated well with the G values obtained from Mooney-Rivlin analysis of compression testing data (Figure 4-26). Mooney-Rivlin analysis was applied to characterize Gtn-HPA gels because of the gels’ hyperelastic behavior revealed from the true stress-strain curves. Furthermore, compressive modulus E was found to be approximately three times the values for G, which is characteristic for an incompressible material (ν = 0.5). The high degree of correlation between E, G, and G’ provides a clear, robust understanding of the material behavior of Gtn-HPA gels. Future analyses of Gtn-HPA material behavior can use poroelastic and viscoelastic models to characterize additional aspects of the material.
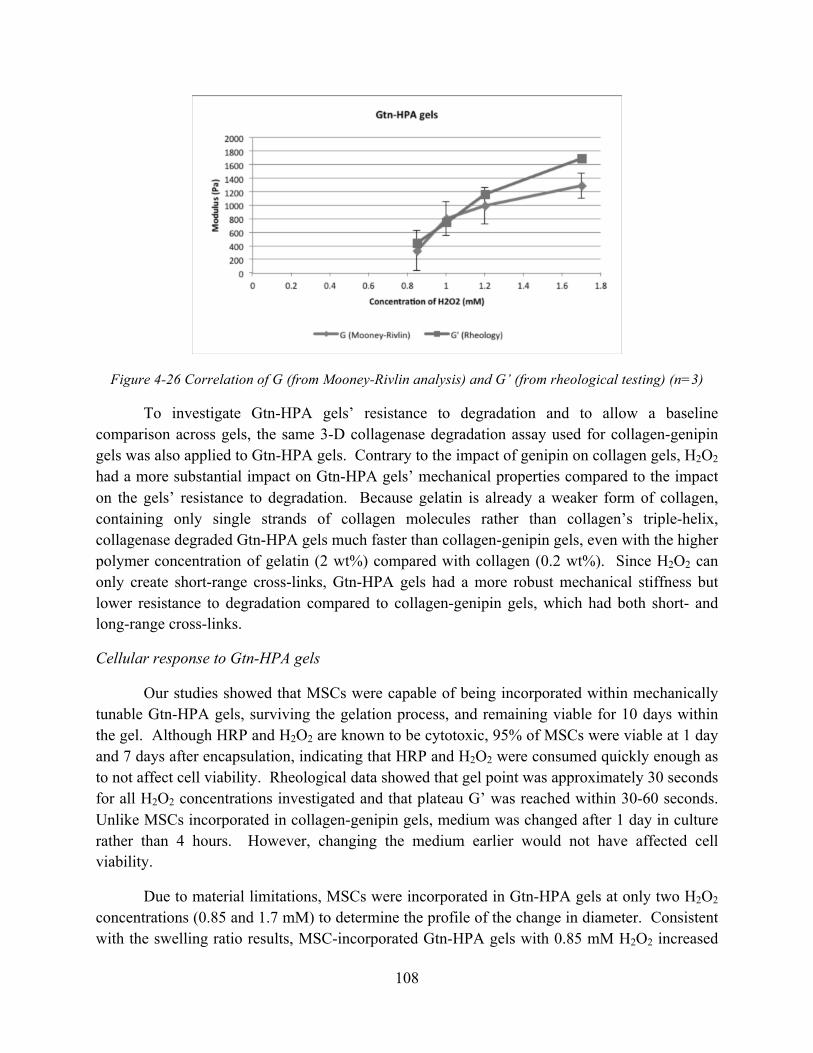
108
Figure 4-26 Correlation of G (from Mooney-Rivlin analysis) and G’ (from rheological testing) (n=3)
To investigate Gtn-HPA gels’ resistance to degradation and to allow a baseline comparison across gels, the same 3-D collagenase degradation assay used for collagen-genipin gels was also applied to Gtn-HPA gels. Contrary to the impact of genipin on collagen gels, H2O2 had a more substantial impact on Gtn-HPA gels’ mechanical properties compared to the impact on the gels’ resistance to degradation. Because gelatin is already a weaker form of collagen, containing only single strands of collagen molecules rather than collagen’s triple-helix, collagenase degraded Gtn-HPA gels much faster than collagen-genipin gels, even with the higher polymer concentration of gelatin (2 wt%) compared with collagen (0.2 wt%). Since H2O2 can only create short-range cross-links, Gtn-HPA gels had a more robust mechanical stiffness but lower resistance to degradation compared to collagen-genipin gels, which had both short- and long-range cross-links.
Cellular response to Gtn-HPA gels
Our studies showed that MSCs were capable of being incorporated within mechanically tunable Gtn-HPA gels, surviving the gelation process, and remaining viable for 10 days within the gel. Although HRP and H2O2 are known to be cytotoxic, 95% of MSCs were viable at 1 day and 7 days after encapsulation, indicating that HRP and H2O2 were consumed quickly enough as to not affect cell viability. Rheological data showed that gel point was approximately 30 seconds for all H2O2 concentrations investigated and that plateau G’ was reached within 30-60 seconds. Unlike MSCs incorporated in collagen-genipin gels, medium was changed after 1 day in culture rather than 4 hours. However, changing the medium earlier would not have affected cell viability.
Due to material limitations, MSCs were incorporated in Gtn-HPA gels at only two H2O2 concentrations (0.85 and 1.7 mM) to determine the profile of the change in diameter. Consistent with the swelling ratio results, MSC-incorporated Gtn-HPA gels with 0.85 mM H2O2 increased
109
to 105% of its original diameter within 1 day of gelation and stayed constant, and gels with 1.7 mM H2O2 a decreased to about 93% of its original diameter and stayed constant. There are a few possible explanations for this behavior. First, Gtn-HPA gels are much stiffer than collagen-genipin gels, with G = 450 Pa and E = 2000 Pa at the lowest concentration of H2O2 (0.85 mM), which may be stiff enough prevent cell contraction or gel degradation. Studies have shown that cells incorporated in stiffer gels experience lower proliferation levels [177], which could also explain the minimal change in diameter. Furthermore, MSCs in Gtn-HPA gels with 0.85 mM H2O2 displayed elongated spindle-like morphology whereas those in gels with 1.7 mM H2O2 displayed a rounded morphology, indicating a higher degree cell spreading in a more compliant gel. The cells may be attempting to migrate or contract and not being able to because of the high gel stiffness. Additional investigations should focus on the extent of actin expression and bundling, which is an indication of cell contractility, which typically occurs in stiffer 3-D matrices [205]. A second explanation for the lack of change in diameter is the presence of gelatin as opposed to collagen. Although gelatin and collagen are similar in material components, they are structurally different. However, studies have shown that stem cells can contract in gelatin scaffolds as well as secrete gelatin-degrading MMPs in particular conditions [206]. Studying the diameter profile of MSC-incorporated gels at a lower polymer concentration would elucidate whether the Gtn or stiffness is affecting the lack of change in diameter.
Studies using 2-D cultures have shown that the mechanical properties of ECM influence cell migration, spreading, proliferation, and differentiation; however, cell behavior in 3-D cultures remains under-explored. Proliferation analyses showed that MSC-incorporated gels exhibited higher levels of proliferation in more compliant (Gtn-HPA gels with 1.0 mM H2O2) than in stiffer (Gtn-HPA gels with 1.7 mM H2O2) gels. Reported studies have indicated that cells incorporated in 3-D gels exhibit different morphology and proliferation behavior compared to those cultured on 2-D substrates. Specifically, cells cultured in 3-D (primary myoblasts) exhibited greater proliferation in stiffer gels and differentiation was greatest in softer, degrading gels [177]. Furthermore, both primary myoblast proliferation and differentiation increased with the stiffness of the adhesion substrate in the 2-D culture, while proliferation was low in stiffer, non-degrading gels in 3-D culture and the cells exhibited minimal differentiation in either type of gel. Another study showed that the proliferation of smooth muscle cells did not depend on the initial ECM mechanical properties in 3-D, in contrast to previous results on 2-D substrates [205]. The study of cell behavior in a 3-D culture provides insight into in vivo cellular behavior and highlights the importance of studying the mechanical role of cell-matrix interactions in tunable 3-D environments.
4.6 Overview of hydrogels
The results from this chapter can be summarized in a materials characterization matrix which compares the three mechanically-tunable injectable gels and collagen scaffolds that were cross-linked using dehydrothermal (DHT) and 1-ethyl-3-(3-dimethylaminopropyl) carbodiimide

110
(EDAC) (Figure 4-27). The metrics used for comparison of mechanical behavior are E, G’, and and gel time obtained from rheological testing, their swelling ratio. Their resistance to degradation was characterized by the percent of gel remaining at 90 min as well as the half-life derived from the kinetic profile. Cell behavior while incorporated in the gels was characterized by their viability at 7 days and the change in diameter at 7 days as a percentage of the original diameter.
Figure 4-27 Materials characterization chart comparing (1) collagen scaffolds cross-linked with DHT and EDAC; (2) collagen-genipin gels; (3) collagen-TGase gels; (4) Gtn-HPA gels
4.7 Summary
Three mechanically-tunable injectable biopolymer hydrogel systems capable of forming covalent cross-links in situ were investigated: Col-Gen, Col-TGase, and Gtn-HPA gels. Of the three gel systems, collagen gel without any cross-linkers was found to be the closest to the benchmark material of cardiac jelly on the basis of mechanical and degradation properties. Each gel system was characterized in terms of mechanical and rheological behavior, resistance to

111
enzymatic degradation, and cell response when incorporated in the gels. First, genipin was found to be an effective cross-linker in which 0.25 mM genipin increases compression modulus (E) 2-fold and plateau shear storage modulus (G’) 3-fold compared to those of collagen-only gels, while maintaining cell viability and proliferation at genipin concentrations up to 0.25 mM. Second, contrary to published studies, TGase was found not to be an effective cross-linker of collagen and further investigations were recommended regarding the purification of TGase and the particular gelling conditions. Finally, Gtn-HPA gels modulated with oxidative coupling of HRP and H2O2 showed a range of E and G’ while maintaining high cell viability and proliferation. The results from this chapter provide a comprehensive overview of hydrogel properties for the judicious selection of select gels for incorporating differentiating ECCs in the next chapter.

112
113
Chapter 5 Differentiation of MSCs and ECCs into cardiac, neural and endothelial cells separately and simultaneously in biopolymer gels
5.1 Introduction
Previous work has shown that pluripotent P19 ECCs can differentiate into cardiac, neural, and vascular endothelial lineages in separate culture conditions in monolayer (see Chapter 3). The purpose of this chapter is two fold: first, to investigate the differentiation potential of ECCs incorporated into select biopolymer gels; second, to investigate the potential for simultaneous differentiation of one EB into multiple cell types while incorporated into select biopolymer gels. The simultaneous differentiation process occurs naturally in vivo in many organs and tissue types, including bone marrow, renal tissue, and cardiac tissue. Bone marrow-derived MSCs have been well characterized and can differentiate into osteoblasts, chondrocytes, and adipocytes, depending on local microenvironmental cues. In the kidney, two progenitor cells from the ureteric bud and the metanephrogenic mesenchyme differentiate into more than 26 different cell types in the adult kidney [207]. Finally, of great relevance to this study is the cardiac progenitor cell, which has been shown to differentiate into cardiomyocytes, smooth muscle cells, as well as CD31-expressing endothelial cells [30, 208].
P19 ECCs have been used as a valuable cell line for developmental and differentiation studies. They are pluripotent stem cells derived from the undifferentiated embryonic components of germ cell tumors that arise spontaneously or are experimentally induced by transfer of cells from the epiblast to extrauterine sites in a C3H/He mouse [106]. ECCs are easier to culture than ESCs for the study of tissue and organ development because they can sustain an undifferentiated cell state indefinitely without a feeder-cell layer and have the ability to incorporate and express ectopic genes [107]. Furthermore, the culture of highly proliferative, undifferentiated embryonal cells without a feeder-cell layer is a great advantage in studying embryonic development while conserving costly materials and resources normally required for ESC culture.
In monolayer, ECCs have been shown to grow continuously in serum-supplemented media and their differentiation can be controlled by various nontoxic drugs [92]. RA induces the development of neurons, astroglia, and microglia [91]. ECCs cultured in low-attachment culture dishes spontaneously form EBs, which can differentiate into cardiac and skeletal muscle in the presence of dimethyl sulfoxide (DMSO) [90]. Furthermore, ECCs exposed to VEGF display capillary-like networks including PECAM-1-positive cells [95]. Recently, ECCs have been shown to exhibit gene expression patterns characteristic of mesoderm formation and also display elongation morphogenesis with a distinct axis orientation as in the embryo [108]. Collectively these findings commend P19 ECCs as a candidate cell type for cardiac regeneration, given the

114
same challenge as with the implementation of ESCs, that the cells would have to be differentiated in vitro prior to implantation in order to obviate the formation of teratomas. For this in vitro study, ECCs were principally selected as a comparative control embryonic stem cell type based on the fact that they are an embryonic stem cell type which can be grown without a feeder layer.
Very little research has been done to study simultaneous differentiation of embryonic cells into various cell types. There are two main motivations for conducting this study. First, it provides insight into understanding fundamental cellular behavior. Although in vitro culture allows us to manipulate and study cells outside the body, it does not capture the dynamic in vivo environment involving cell-cell and cell-matrix contact, as well as biochemical, mechanical, and other cues. Culturing ECCs in mixed media conditions allows us to begin to investigate the development of cell types and expression of markers over time in an EB. Furthermore, immunohistochemical methods allow visualization of spatial distribution of cell types within one EB.
The second motivation is a therapeutic one: by simultaneously differentiating one EB into multiple cell types, we attempt to have a better representation of the cell types that exist in cardiac tissue. Cardiac tissue is a highly metabolic tissue that relies on vascularization and innervation to conduct electrical signals that synchronize the complex beating pattern of the heart. Cardiac tissue developed ex vivo requires endothelial and neural components in addition to cardiomyocytes to provide a vascularized and innervated tissue that can be incorporated into the native tissue. No studies have been done to address innervated cardiac tissue even though the nervous system is an important component of cardiac tissue. Although ESCs and ECCs face the same problem of potential teratoma formation when implanted, cell types such as induced pluripotent stem (iPS) cells are a potential cell type for cell therapy. Simultaneous differentiation of EBs could also provide insights on the feasibility for implanting iPS cells that could differentiate into multiple cell types.
5.2 Objective, hypothesis, and rationale
The objective of the work presented in this chapter was to investigate simultaneous differentiation of P19 ECCs cultured as EBs into cardiomyocytes, neural cells, and endothelial cells in different gel types. Specifically, EBs were cultured in four gel types:
1. Collagen (0.2 wt%) with no cross-linkers: “Col-only” 2. Collagen (0.2 wt%) with 0.25 mM genipin: “Col-Gen” 3. Gtn-HPA (2 wt%) with 1.0 mM H2O2, or Gtn-HPA-compliant: “Gtn-HPA-comp” 4. Gtn-HPA (2 wt%) with 1.7 mM H2O2, or Gtn-HPA-stiff: “Gtn-HPA-stiff”
The hypothesis was that ECCs cultured in mixed medium conditions can differentiate into more than one cell type, exhibiting markers of three dominant cell types in cardiac tissue: cardiomyocytes, neural cells, and vascular endothelial cells. Furthermore, the gel type (in terms

115
of gel type and stiffness), differentiation medium, and culture time have an effect on the differentiation behavior of the EBs.
Very few studies have been done to investigate the capability of simultaneously differentiating ECCs into the various cellular components of myocardium. Simultaneously differentiating one cell type into these three components of cardiac tissue allows for naturally forming 3-D organization of vascular and neural networks. Furthermore, simultaneous differentiation would be experimentally easier than using co-cultures of different cell types or recombining differentiated cells from three separate culture dishes. Results from this study provide a basis for understanding simultaneous differentiation behavior in EBs.
Gel types were principally selected based on their mechanical and rheological behavior, as well as their effects on cell viability and proliferation (results from Chapter 4). Specifically, gels were selected based on an approximate 3-fold difference between their plateau shear storage modulus G’ values. There is a 3-fold difference in G’ between Col-only (30 Pa) and collagen gels with 0.25 mM genipin (90 Pa). Similarly, there is a 3-fold difference in G’ between Gtn-HPA gels with 1.0 mM H2O2 (750 Pa) and 1.7 mM H2O2 (1700 Pa). Furthermore, cells cultured in these four gel types all had cell viabilities of above 80% and had an increase in cell number in 7 days, which is critical in selecting a non-toxic gel that supports cell viability and growth. Finally, ECCs have integrins that allow the cells to attach to both gelatin and collagen, making these materials ideal biopolymers for ECC incorporation [142-144].
The results from this study provide a basis for using pre-differentiated ECCs incorporated in an injectable biopolymer gel for cardiac tissue engineering. The rationale for differentiating ECCs before implantation is to create a differentiated construct containing cardiomyocytes with spatially distributed supporting neural and endothelial networks. This strategy is used with the knowledge that implantation of undifferentiated ECCs have the potential of teratoma formation, and that cell sorting and subculturing methods must be used to obtain a purified differentiated cell population.
Cardiac jelly is seen the target gel material for encapsulating embryonic cells because it is the natural environment for which embryonic cardiac development takes place. This gelatinous non-cellular material resides between the endothelial lining and the myocardial layer of the heart in very young embryos, later serving as a substratum for cardiac mesenchyme [209]. A review of literature regarding the properties of cardiac jelly revealed its compliant nature (1-10 Pa) and deterioration of modulus with enzymatic degradation [22, 23]. Similar to the previous chapter, the four gel types investigated in this chapter are compared to the benchmark material of cardiac jelly.
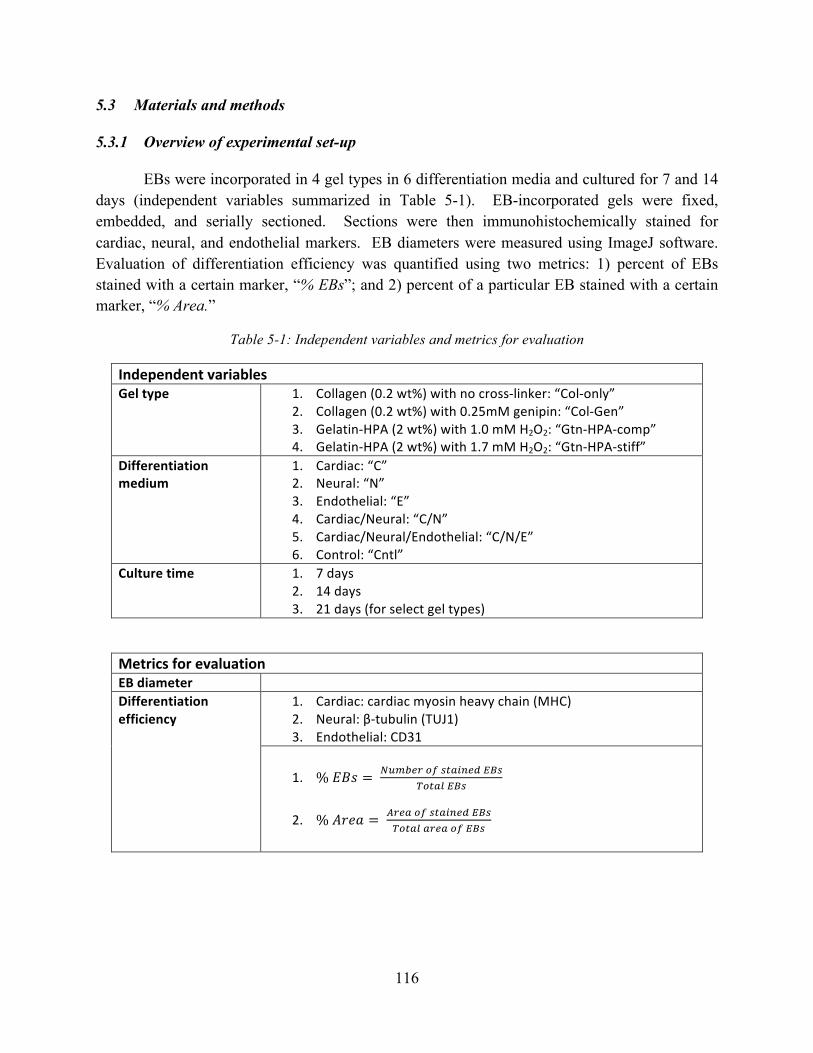
116
5.3 Materials and methods
5.3.1 Overview of experimental set-up
EBs were incorporated in 4 gel types in 6 differentiation media and cultured for 7 and 14 days (independent variables summarized in Table 5-1). EB-incorporated gels were fixed, embedded, and serially sectioned. Sections were then immunohistochemically stained for cardiac, neural, and endothelial markers. EB diameters were measured using ImageJ software. Evaluation of differentiation efficiency was quantified using two metrics: 1) percent of EBs stained with a certain marker, “% EBs”; and 2) percent of a particular EB stained with a certain marker, “% Area.”
Table 5-1: Independent variables and metrics for evaluation
Independent variables Gel type 1. Collagen (0.2 wt%) with no cross-‐linker: “Col-‐only”
2. Collagen (0.2 wt%) with 0.25mM genipin: “Col-‐Gen” 3. Gelatin-‐HPA (2 wt%) with 1.0 mM H2O2: “Gtn-‐HPA-‐comp” 4. Gelatin-‐HPA (2 wt%) with 1.7 mM H2O2: “Gtn-‐HPA-‐stiff”
Differentiation medium
1. Cardiac: “C” 2. Neural: “N” 3. Endothelial: “E” 4. Cardiac/Neural: “C/N” 5. Cardiac/Neural/Endothelial: “C/N/E” 6. Control: “Cntl”
Culture time 1. 7 days 2. 14 days 3. 21 days (for select gel types)
Metrics for evaluation EB diameter Differentiation efficiency
1. Cardiac: cardiac myosin heavy chain (MHC) 2. Neural: β-‐tubulin (TUJ1) 3. Endothelial: CD31
1. % !"# = !"#$%& !" !"#$%&' !"#
!"#$% !"#
2. % !"#$ = !"#$ !" !"#$%&' !"#!"#$% !"#! !" !"#
117
5.3.2 Culture of P19 embryonic carcinoma cells
P19 ECCs, obtained from American Type Culture Collection (ATCC), were thawed and expanded in T-25 flask in complete medium consisting of Minimum Essential Medium (MEM)-Alpha (Gibco), 7.5% newborn calf serum (Sigma), 2.5% fetal calf serum (Sigma), 1% penicillin/streptomycin (Invitrogen). They were subcultured 1:10 every 2-3 days until ready to use.
5.3.3 Differentiation medium
ECCs were cultured in various differentiation media summarized in Table 5-2.
Cardiac Differentiation
To induce cardiac differentiation in ECCs, 1 x 10⁶ cells were cultured in suspension in 100-mm ultra-low attachment culture dishes (Sigma-Aldrich) in cardiac induction medium consisting of MEM-Alpha, 10% FBS, 1% penicillin/streptomycin, and 1% DMSO (Sigma-Aldrich). After 2 days, the EBs were washed with PBS and cardiac induction medium was replenished. After 4 days in suspension, the EBs were transferred to adherent culture dishes with post-induction medium consisting of MEM-Alpha, 10% FBS, 1% penicillin/streptomycin and cultured up to 21 days.
Neural Differentiation
To induce neural differentiation in ECCs, 1 x 10⁶ cells were cultured in suspension in 100-mm ultra-low attachment culture dishes (Sigma-Aldrich) in neural induction medium consisting of MEM-Alpha, 10% FBS, 1% penicillin/streptomycin, and 10-7 µM RA. After 2 days, the EBs were washed with PBS and neural induction medium was replenished. After 4 days in suspension, the EBs were transferred to adherent culture dishes with continual exposure to neural induction medium.
Endothelial Differentiation
To induce endothelial differentiation in ECCs, 1 x 10⁶ cells were cultured in suspension in 100-mm ultra-low attachment culture dishes (Sigma-Aldrich) in endothelial induction medium consisting of MEM-Alpha, 10% FBS, 1% penicillin/streptomycin, and 20 ng/ml VEGF. After 2 days, the EBs were washed with PBS and endothelial induction medium was replenished. After 4 days in suspension, the EBs were transferred to adherent culture dishes with continual exposure to endothelial induction medium.
Mixed Medium Conditions
ECCs were cultured in various mixed media conditions. In general, 1 x 10⁶ ECCs were cultured in suspension in 100-mm ultra-low attachment culture dishes (Sigma-Aldrich) for 4
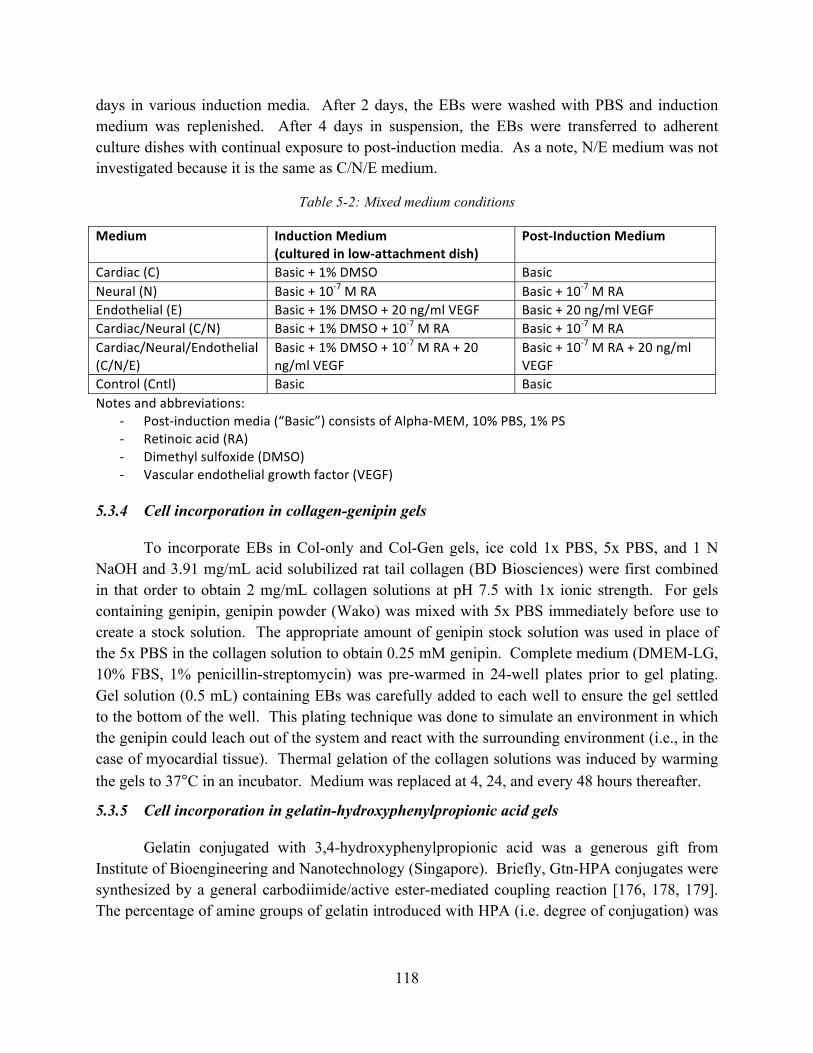
118
days in various induction media. After 2 days, the EBs were washed with PBS and induction medium was replenished. After 4 days in suspension, the EBs were transferred to adherent culture dishes with continual exposure to post-induction media. As a note, N/E medium was not investigated because it is the same as C/N/E medium.
Table 5-2: Mixed medium conditions
Medium Induction Medium (cultured in low-‐attachment dish)
Post-‐Induction Medium
Cardiac (C) Basic + 1% DMSO Basic Neural (N) Basic + 10-‐7 M RA Basic + 10-‐7 M RA Endothelial (E) Basic + 1% DMSO + 20 ng/ml VEGF Basic + 20 ng/ml VEGF Cardiac/Neural (C/N) Basic + 1% DMSO + 10-‐7 M RA Basic + 10-‐7 M RA Cardiac/Neural/Endothelial (C/N/E)
Basic + 1% DMSO + 10-‐7 M RA + 20 ng/ml VEGF
Basic + 10-‐7 M RA + 20 ng/ml VEGF
Control (Cntl) Basic Basic Notes and abbreviations:
-‐ Post-‐induction media (“Basic”) consists of Alpha-‐MEM, 10% PBS, 1% PS -‐ Retinoic acid (RA) -‐ Dimethyl sulfoxide (DMSO) -‐ Vascular endothelial growth factor (VEGF)
5.3.4 Cell incorporation in collagen-genipin gels
To incorporate EBs in Col-only and Col-Gen gels, ice cold 1x PBS, 5x PBS, and 1 N NaOH and 3.91 mg/mL acid solubilized rat tail collagen (BD Biosciences) were first combined in that order to obtain 2 mg/mL collagen solutions at pH 7.5 with 1x ionic strength. For gels containing genipin, genipin powder (Wako) was mixed with 5x PBS immediately before use to create a stock solution. The appropriate amount of genipin stock solution was used in place of the 5x PBS in the collagen solution to obtain 0.25 mM genipin. Complete medium (DMEM-LG, 10% FBS, 1% penicillin-streptomycin) was pre-warmed in 24-well plates prior to gel plating. Gel solution (0.5 mL) containing EBs was carefully added to each well to ensure the gel settled to the bottom of the well. This plating technique was done to simulate an environment in which the genipin could leach out of the system and react with the surrounding environment (i.e., in the case of myocardial tissue). Thermal gelation of the collagen solutions was induced by warming the gels to 37°C in an incubator. Medium was replaced at 4, 24, and every 48 hours thereafter.
5.3.5 Cell incorporation in gelatin-hydroxyphenylpropionic acid gels
Gelatin conjugated with 3,4-hydroxyphenylpropionic acid was a generous gift from Institute of Bioengineering and Nanotechnology (Singapore). Briefly, Gtn-HPA conjugates were synthesized by a general carbodiimide/active ester-mediated coupling reaction [176, 178, 179]. The percentage of amine groups of gelatin introduced with HPA (i.e. degree of conjugation) was

119
determined by the conventional 2,4,6-trinitrobenzene sulfonic acid (TNBS) method [180] to be 90%.
The Gtn-HPA conjugates are cross-linked by the enzymatic oxidative reaction of HPA moieties using HRP and H2O2 (Wako Pure Chemical Industries). Lyophilized Gtn–HPA was dissolved in PBS at a concentration of 4 wt%. Equal volumes of Gtn-HPA solution and cell suspension were combined to create a solution of 2 wt% Gtn-HPA with cells. A volume of 8.3 µL of HRP was added to 0.5 mL of Gtn-HPA solution to give a final concentration of 1 unit/mL. Cross-linking was initiated by adding various amounts of 70 mM H2O2 solution to give final concentrations of 1.0 and 1.7 mM. The solution of Gtn-HPA containing cells was cast in a cryotube mold to prevent gel adhesion to the well-plates. Cryotube molds were cut from 2-ml cryotubes using a band saw. These open-ended tubes were autoclaved before UV-irradiated parafilm was wrapped around one end of the cryotube to create a mold. A gel solution of 300 µl created a gel of 9.5 mm in diameter and 3 mm in thickness. Thermal gelation of the Gtn-HPA solutions was induced by warming the gels to 37°C in an incubator for 1 hour.
After 20 min, medium was carefully added to the gel in the molds, and after another 20 min, the parafilm was removed from the molds and the cell-incorporated gels were transferred to agarose-coated well plates filled with medium. Medium was changed every 2-3 days. Gel diameters were measured using a circular template with each medium change.
5.3.6 Immunohistochemistry and immunofluorescence
Cell-incorporated gels were fixed prior to sectioning and staining. Col-only (n = 3) and Col-Gen (n = 3) samples were washed three times in PBS and fixed in 4% paraformaldehyde for 3 hours prior to dehydration and embedding in paraffin for microtomy (6 µm). Gtn-HPA gel samples (n = 3) were washed three times in PBS and fixed in 4% paraformaldehyde for 3 hours prior to embedding in 12.5% sucrose overnight, followed by a final overnight immersion in 25% sucrose. Gtn-HPA gels samples were embedded in Tissue-Tek (Sakura, Zoeterwoude, the Netherlands) for cryosectioning (20 µm). All collagen- and gelatin-based gels were mounted on glass slides and stained with hematoxylin and eosin (H&E) or immunohistochemically using standard histological techniques. Three representative sections were taken from each sample and stained for cardiac, neural, and endothelial markers.
Immunohistochemical staining of cell-seeded gels was performed using the Envision Plus+ System-HRP (AEC) kit (Dako) with a Dako Autostainer. Deparaffinized and rehydrated sections were digested for 40 minutes in 0.1% protease XIV (Sigma), followed by quenching of endogenous peroxidase activity with a peroxidase blocking reagent (Dako). Non-specific binding was blocked by protein block serum-free (Dako). The primary antibodies were applied for 45 minutes. Monoclonal cardiac myosin heavy chain (Abcam) was used at a dilution of 1:200. CD31 antibody, (Abcam) was used at a dilution of 1:400. Negative controls were incubated with mouse IgG2a or rabbit IgG fraction (Dako) at the same dilution instead of the

120
primary antibody. Labeling was detected by incubation with Labeled Polymer-HRP anti-mouse or anti-rabbit (Dako) followed by AEC+ Substrate-Chromogen (Dako). Mayer’s hematoxylin (Sigma) was used as a counterstain. Coverslips were immediately affixed using faramount aqueous mounting medium (Dako).
Immunofluorescent evaluation was used for better visualization of TUJ1 staining. Samples were washed 3 times in PBS before non-specific blocking with 10% donkey serum with 0.3% Triton X-100 for 2 hours. Monoclonal TUJ1 antibodies (both anti-mouse and anti-rabbit versions; Covance) was diluted in 5% donkey serum (1:2000) and applied for 2 hours at room temperature. Secondary detections used were monoclonal mouse anti-rhodamine (Jackson Immunoresearch; red) and monoclonal rabbit anti-fluorescein (Jackson Immunoresearch; green) diluted to 1:100 in 5% donkey serum and applied for 2 hours. After two washes with 0.3% Triton X-100 for 5 min each, DAPI was applied for 30 min. Coverslips were affixed using faramount aqueous mounting medium (Dako) and slides were imaged immediately.
EB diameters were measured using ImageJ software. The diameter of each EB was measured and recorded. If the EB was elliptical in shape, the semi-major (!) and semi-minor (!) axes were measured and average diameter (!) was calculated using the following equation:
! = !! + !!
2
Two metrics were used to evaluate differentiation efficiency. The first metric “% !"#” was defined as the fraction of positively stained EBs in which an EB with any amount of staining was counted:
% !"# = !"#$%& !" !"#$%&' !"#
!"#$% !"#
The criteria for counting a particular EB as positively stained was defined as an EB with any amount, even trace amounts, of staining visible using histomorphometry methods. For example, Figure 5-1A depicts an EB with no MHC staining whereas Figure 5-1B depicts an EB with trace amounts of staining (arrows) and Figure 5-1C depicts an EB with ample amount of staining both in terms of intensity and area. EBs shown in Figure 5-1B,C were counted as positively stained EBs.

121
Figure 5-1 Sample images of EBs stained with MHC that would (A) not be counted as a positive stain; and (B, C) would be counted as a positive stain.
The second metric “% !"#$” was defined as the fraction of positively stained area in an EB that contains positive staining (EBs that did not contain staining were omitted):
% !"#$ = !"#$ !" !"#$%&' !"!"#$% !"#! !" !"
Area calculations were performed by ImageJ analysis. First, the background of each image was smoothed using a rolling ball algorithm (radius of curvature, ρ = 50 px). Then a color deconvolution tool was used to split the RGB image corresponding to its vector colors (hematoxylin and AEC) using built-in vectors, before the image was converted into binary, keeping threshold levels constant for all processed images. The metrics “!"#$!"#” and “!"#$!"#$%&'()*+” were defined as the total number of black pixels in the AEC and Hematoxylin binary images respectively. The metric “% !"#$” was calculated using the following equation:
% !"#$ = !"#$!"#
!"#$!"# + !"#$!"#$%&'()*+
A similar process was applied for calculating “% !"#$” for immunofluorescence images. Images for the DAPI and rhodamine were taken at consistent exposure times for all samples. Each image was converted to binary, keeping threshold levels constant, and the number of black pixels was counted to obtain values for “!"#$!"#$” and “!"!"!"#!” and “% !"#$” was calculated using the following equation:
% !"#$ = !"#$!"#!
!"#$!"#! + !"#$!"#$
Figure 5-2 depicts sample images with typical “% !"#$” values for EBs stained with TUJ1.

122
Figure 5-2 Sample images of EBs stained with TUJ1 that would have typical % Area stained values of (A) 5%, (B) 20%, and (C) 40%.
5.3.7 Statistics
Data are reported as mean ± standard deviation (S.D.). Statistical significance was determined by 3-factor analysis of variance (ANOVA) (for the effects of gel type, differentiation medium, and culture time) and Fisher’s PLSD post-hoc testing with a significance criterion of p < 0.05 using StatView (SAS Institute, Cary, NC). The same statistics software was also used to determine whether there is a correlation between “% !"#$” of various cell types.
5.4 Results
EBs were formed from dissociated ECCs in in low-attachment dishes, and then incorporated in gels, which allowed EB differentiation to occur in the 3-D gel environment. EBs were cultured in 4 gel types in 6 differentiation media for 2 culture times and stained for cardiac (MHC), neural (TUJ1), and endothelial (CD31) markers. Histomorphometry was utilized as the main evaluative method for differentiation efficiency for various reasons: (1) it allowed visualization of the spatial distribution of various cell types within one EB, and (2) it depicted uniformity and staining patterns of gel type, differentiation medium, and culture time effects on differentiation. Paraffin-embedding and cryofreezing methodologies were used instead of plastic-embedded samples to ensure antibody penetration into the cell-incorporated gel samples. However, one disadvantage of using these methodologies is the artifacts from sectioning which caused some sample loss during sectioning.
EBs ranged from 300 to 600 µm in diameter. Three-factor ANOVA showed was no significant difference of gel type, differentiation medium, or culture time on EB size (Figure 5-3).
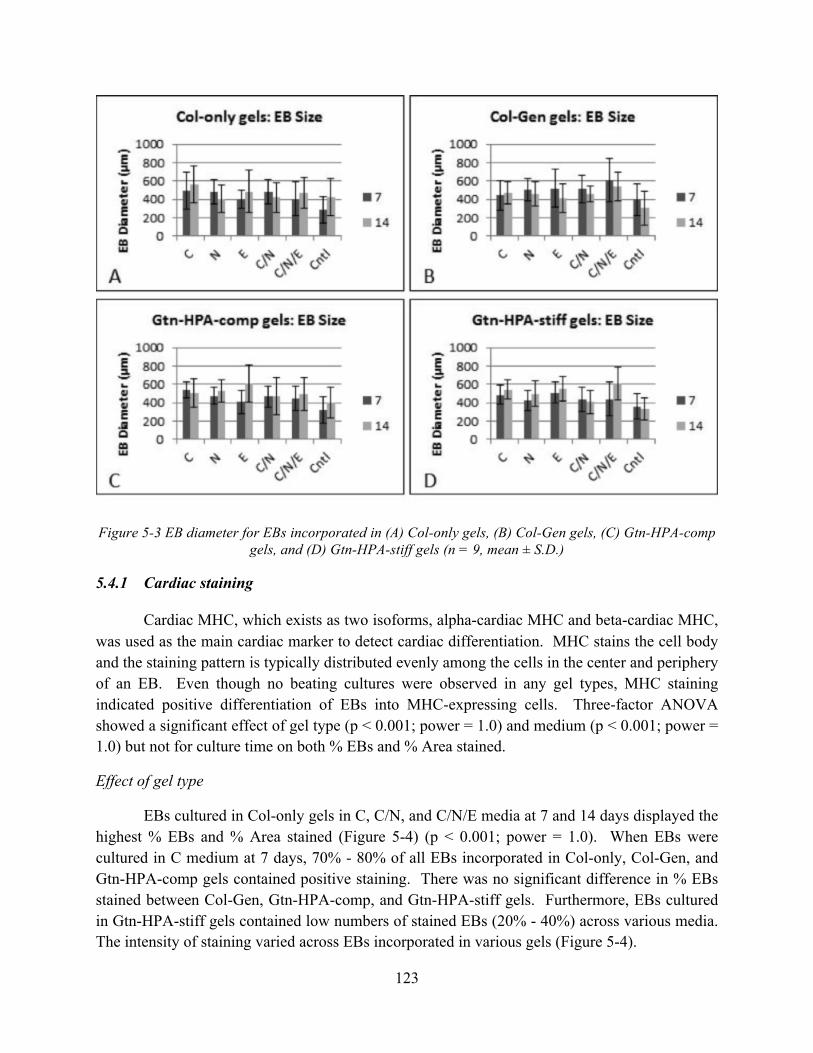
123
Figure 5-3 EB diameter for EBs incorporated in (A) Col-only gels, (B) Col-Gen gels, (C) Gtn-HPA-comp gels, and (D) Gtn-HPA-stiff gels (n = 9, mean ± S.D.)
5.4.1 Cardiac staining
Cardiac MHC, which exists as two isoforms, alpha-cardiac MHC and beta-cardiac MHC, was used as the main cardiac marker to detect cardiac differentiation. MHC stains the cell body and the staining pattern is typically distributed evenly among the cells in the center and periphery of an EB. Even though no beating cultures were observed in any gel types, MHC staining indicated positive differentiation of EBs into MHC-expressing cells. Three-factor ANOVA showed a significant effect of gel type (p < 0.001; power = 1.0) and medium (p < 0.001; power = 1.0) but not for culture time on both % EBs and % Area stained.
Effect of gel type
EBs cultured in Col-only gels in C, C/N, and C/N/E media at 7 and 14 days displayed the highest % EBs and % Area stained (Figure 5-4) (p < 0.001; power = 1.0). When EBs were cultured in C medium at 7 days, 70% - 80% of all EBs incorporated in Col-only, Col-Gen, and Gtn-HPA-comp gels contained positive staining. There was no significant difference in % EBs stained between Col-Gen, Gtn-HPA-comp, and Gtn-HPA-stiff gels. Furthermore, EBs cultured in Gtn-HPA-stiff gels contained low numbers of stained EBs (20% - 40%) across various media. The intensity of staining varied across EBs incorporated in various gels (Figure 5-4).

124
Figure 5-4 MHC expression of EBs cultured in C medium at 14 days in various gel types: (A) Col-only, (B) Col-Gen, (C), Gtn-HPA-comp, and (D) Gtn-HPA-stiff gels.
When cultured in C/N medium, % EBs stained were highest at 70% - 80% when EBs were incorporated in Col-only gels (p < 0.001; power = 1.0). There was no significant difference between % EBs when EBs were cultured in Gtn-HPA-comp and Gtn-HPA-stiff gels. In C/N/E medium, % EBs stained was again highest at ~70% when EBs incorporated in Col-only gels (p < 0.001; power = 1.0) and there was no significant difference in gel type for the other three gels.

125
Figure 5-5 MHC expression (% EBs stained) for EBs incorporated in various gel types cultured in (A) N, (B) C/N, (C) C/N/E, and (D) Cntl media for 7 and 14 days (n = 3, mean ± S.D.).
Gel type also had a significant effect on % Area stained (Figure 5-6). In C medium, EBs in Col-only gels at 14 days displayed more MHC+ staining (82.4% ± 9%) than EBs cultured in other gels (32% ± 17% in Col-Gen gels; 45% ± 11% in Gtn-HPA-comp gels; 26% ± 5% in Gtn-HPA-stiff gels). In C/N medium, EBs in Col-only and Col-Gen gels at 14 days displayed more MHC staining than EBs cultured in other gels.
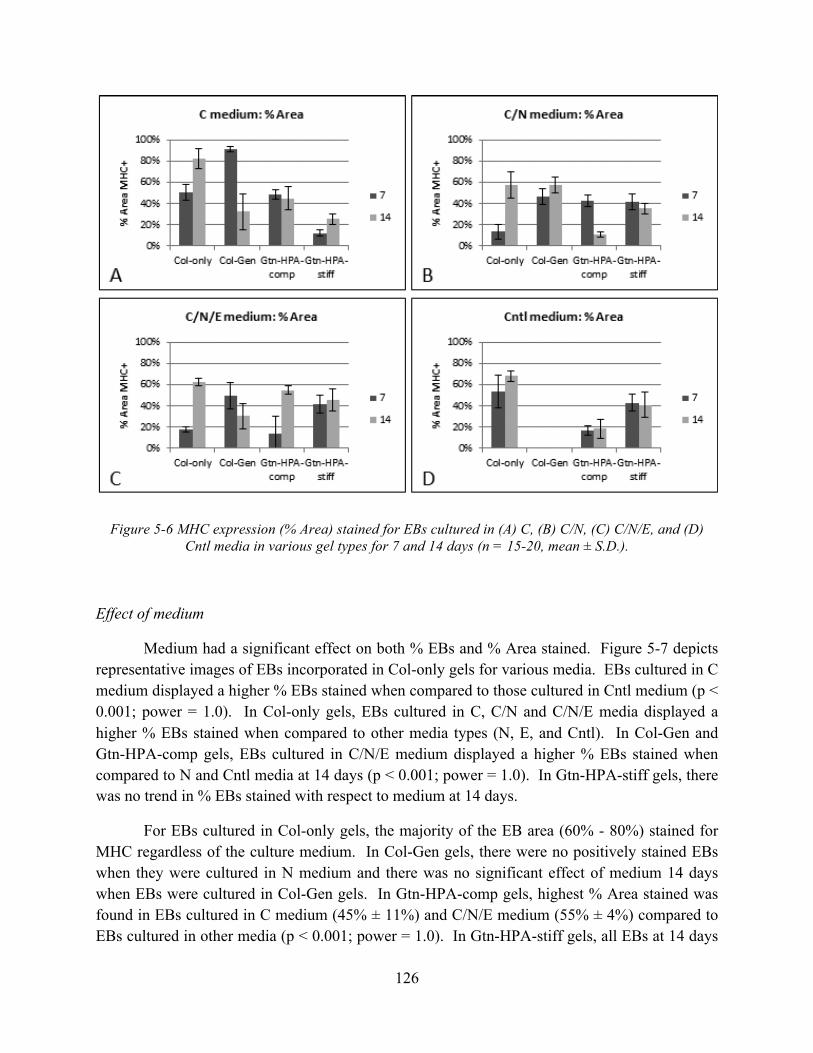
126
Figure 5-6 MHC expression (% Area) stained for EBs cultured in (A) C, (B) C/N, (C) C/N/E, and (D) Cntl media in various gel types for 7 and 14 days (n = 15-20, mean ± S.D.).
Effect of medium
Medium had a significant effect on both % EBs and % Area stained. Figure 5-7 depicts representative images of EBs incorporated in Col-only gels for various media. EBs cultured in C medium displayed a higher % EBs stained when compared to those cultured in Cntl medium (p < 0.001; power = 1.0). In Col-only gels, EBs cultured in C, C/N and C/N/E media displayed a higher % EBs stained when compared to other media types (N, E, and Cntl). In Col-Gen and Gtn-HPA-comp gels, EBs cultured in C/N/E medium displayed a higher % EBs stained when compared to N and Cntl media at 14 days (p < 0.001; power = 1.0). In Gtn-HPA-stiff gels, there was no trend in % EBs stained with respect to medium at 14 days.
For EBs cultured in Col-only gels, the majority of the EB area (60% - 80%) stained for MHC regardless of the culture medium. In Col-Gen gels, there were no positively stained EBs when they were cultured in N medium and there was no significant effect of medium 14 days when EBs were cultured in Col-Gen gels. In Gtn-HPA-comp gels, highest % Area stained was found in EBs cultured in C medium (45% ± 11%) and C/N/E medium (55% ± 4%) compared to EBs cultured in other media (p < 0.001; power = 1.0). In Gtn-HPA-stiff gels, all EBs at 14 days

127
contained 25% - 40% of area stained and there was no significant effect of medium on % Area stained.
Figure 5-7 MHC expression of EBs incorporated in Col-only gels at 14 days cultured in (A) C, (B) N, (C) E, (D) C/N, (E) C/N/E, and (F) Cntl media
Effect of culture time
Culture time was shown not to have a significant effect on % EBs and % Area stained (p < 0439; power = 0.682). The intensity of staining typically increased with culture time (Figure 5-8) but this observation was not quantified. In some EB-incorporated gel samples, there was a decrease in % EBs or % Area stained with time. This observation could be due to staining artifacts, loss of some sample during the staining process, or protein degradation over time.

128
Figure 5-8 MHC expression of EBs incorporated in Col-only gels, cultured in C medium at (A) 7 and (B) 14 days
5.4.2 Neural staining
EBs were cultured 4 gel types in 6 differentiation media for 7 and 14 days and stained for TUJ1 using immunofluorescence. TUJ1 has been well characterized and is highly reactive to neuron class III β-tubulin and does not identify β-tubulin found in glial cells. TUJ1 staining was observed as early as 4 days in medium containing RA (N, C/N, and C/N/E medium) and staining patterns occur mostly in the center of EBs and tend to cluster in the same region of an EB. Over 14 days in culture, neurite processes extend from the body of individual cells and intense TUJ1 staining is evident. Three-factor ANOVA revealed significant effects of gel type (p = 0.016; power = 0.942), medium (p < 0.001; power = 1.0) and culture time (p < 0.0291; power = 0.585) on % EBs stained with TUJ1. Furthermore, three-factor ANOVA revealed significant effects of gel type (p = 0.002; power = 0.987), differentiation medium (p < 0.001; power = 1.0) and culture time (p < 0.001; power = 1.0) on % Area stained with TUJ1.
Effect of gel type
Gel type had a significant effect on % EBs and % Area stained with TUJ1. TUJ1-expressing EBs were observed in all four gel types, to varying degrees (Figure 5-9). At 14 days, more TUJ1-expressing EBs were observed in collagen-based gels compared to gelatin-based gels (p < 0.001; power = 0.983) but the % Area stained did not vary significantly across the four gel types.

129
Figure 5-9 TUJ1 expression of EBs cultured in N medium at 14 days in various gel types: (A) Col-only, (B) Col-Gen, (C), Gtn-HPA-comp, and (D) Gtn-HPA-stiff gels.
In general, EBs incorporated in Col-only gels consistently displayed higher % EBs stained across all differentiation media compared to those cultured in other gel types (Figure 5-10). In N medium, EBs cultured in collagen-based gels (Col-only and Col-Gen) displayed a higher % EBs stained than those cultured in gelatin-based gels (Gtn-HPA-comp and Gtn-HPA-stiff) at both 7 and 14 days culture times (Figure 5-10A). Specifically at 14 days, 77% ± 6% of EBs in Col-only gels and 78% ± 13% of EBs in Col-Gen gels contained positive staining for TUJ1, compared to 41% ± 8% of EBs in Gtn-HPA-comp gels and 27% ± 7% of EBs in Gtn-HPA-stiff gels (p < 0.001; power = 0.992). Furthermore, there was no significant increase in the % EBs stained in collagen-based gels from 7 to 14 days, whereas EBs cultured in gelatin-based gels increased in % EBs stained: 19% ± 3% to 41% ± 8% for Gtn-HPA-comp gels and 16% ± 4% to 27% ± 7% for Gtn-HPA-stiff gels.
In C/N medium, the gel type had little effect on % EBs stained (Figure 5-10B). There was a significantly higher % EBs stained for EBs incorporated in Gtn-HPA-stiff gels compared to those incorporated in Col-Gen gels (p < 0.001; power = 0.938). However, there was no significant difference in % EBs stained between Col-only and Col-Gen gels, as well as Gtn-HPA-comp and Gtn-HPA-stiff gels. In Col-only gels, 82% ± 20% of EBs at 7 days stained for
130
TUJ1 compared to 58% ± 20% of EBs at 14 days. In Col-Gen gels, 53% ± 12% of EBs at 7 days stained for TUJ1 compared to 60% ± 9% of EBs at 14 days. There was no significant difference in % EBs stained for Gtn-HPA-comp gels at 7 or 14 days compared to Gtn-HPA-stiff gels. In Gtn-HPA-comp gels, 80% ± 13% of EBs at 7 days stained for TUJ1 compared to 68% ± 19% of EBs at 14 days. In Gtn-HPA-stiff gels, 90% ± 10% of EBs stained for TUJ1 compared to 95% ± 5% at 14 days.
For EBs cultured in C/N/E medium, there was no overall trend for % EBs stained with respect to gel type and culture time. EBs cultured in Gtn-HPA-stiff gels at 7 days had a significantly lower % EBs stained (31% ± 3%) than those cultured in other gel types (50% ± 5% in Col-only gels; 60% ± 9% in Col-Gen gels; 57% ± 15% in Gtn-HPA-comp gels) (p < 0.001; power = 1.0) (Figure 5-10C). At 14 days, 75% ± 16% EBs in Col-only gels, 45% ± 5% EBs in Col-Gen gels, 16% ± 2% EBs in Gtn-HPA-comp gels and 26% ± 6% EBs in Gtn-HPA-stiff gels stained for TUJ1.
For EBs cultured in Cntl medium, only those incorporated in collagen-based gels contained positive staining for TUJ1 (Figure 5-10D): 8% ± 1% at 7 days to 6% ± 11% at 14 days (Col-only gels) compared to 17% ± 6% at 7 days to 17% ± 4% at 14 days (Col-Gen gels). No staining was observed in EBs incorporated in gelatin-based gels.
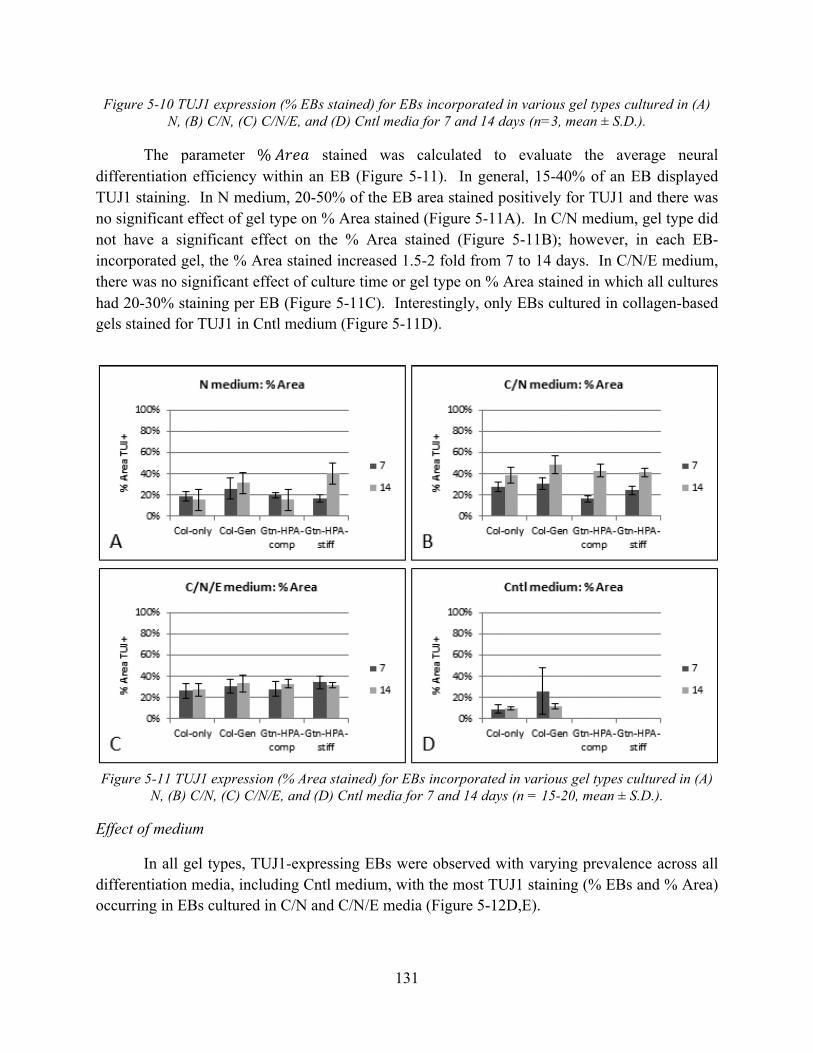
131
Figure 5-10 TUJ1 expression (% EBs stained) for EBs incorporated in various gel types cultured in (A) N, (B) C/N, (C) C/N/E, and (D) Cntl media for 7 and 14 days (n=3, mean ± S.D.).
The parameter % !"#$ stained was calculated to evaluate the average neural differentiation efficiency within an EB (Figure 5-11). In general, 15-40% of an EB displayed TUJ1 staining. In N medium, 20-50% of the EB area stained positively for TUJ1 and there was no significant effect of gel type on % Area stained (Figure 5-11A). In C/N medium, gel type did not have a significant effect on the % Area stained (Figure 5-11B); however, in each EB-incorporated gel, the % Area stained increased 1.5-2 fold from 7 to 14 days. In C/N/E medium, there was no significant effect of culture time or gel type on % Area stained in which all cultures had 20-30% staining per EB (Figure 5-11C). Interestingly, only EBs cultured in collagen-based gels stained for TUJ1 in Cntl medium (Figure 5-11D).
Figure 5-11 TUJ1 expression (% Area stained) for EBs incorporated in various gel types cultured in (A)
N, (B) C/N, (C) C/N/E, and (D) Cntl media for 7 and 14 days (n = 15-20, mean ± S.D.).
Effect of medium
In all gel types, TUJ1-expressing EBs were observed with varying prevalence across all differentiation media, including Cntl medium, with the most TUJ1 staining (% EBs and % Area) occurring in EBs cultured in C/N and C/N/E media (Figure 5-12D,E).
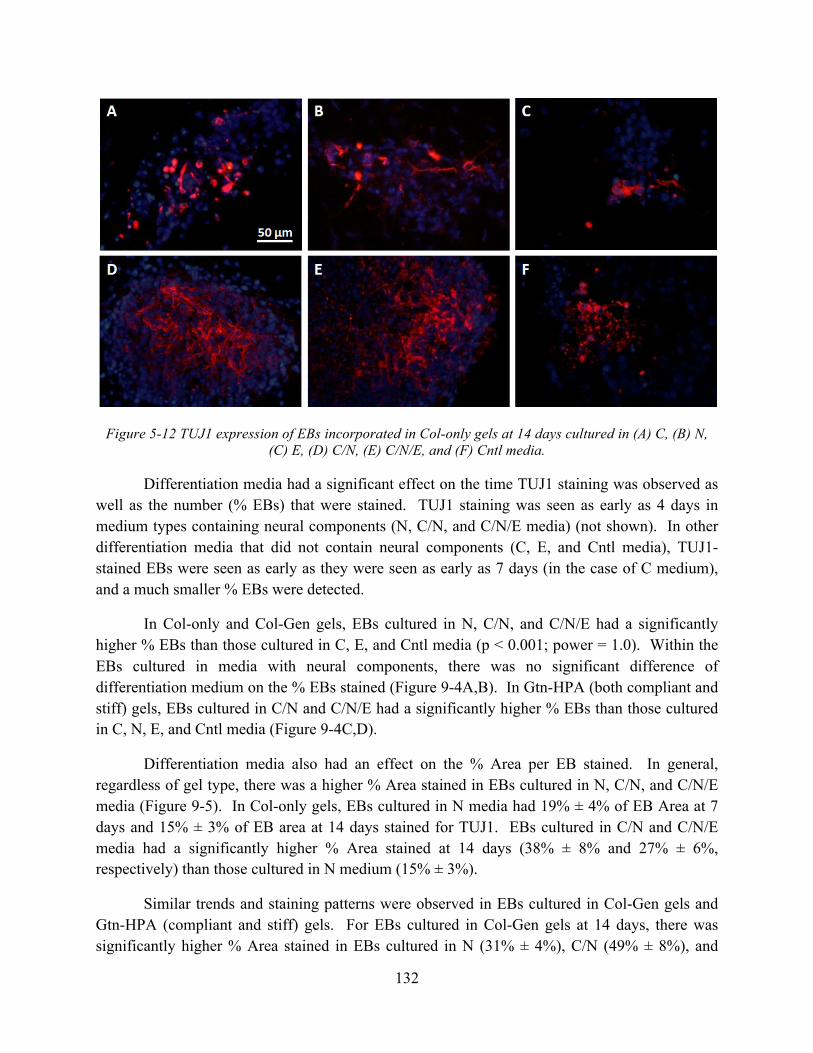
132
Figure 5-12 TUJ1 expression of EBs incorporated in Col-only gels at 14 days cultured in (A) C, (B) N, (C) E, (D) C/N, (E) C/N/E, and (F) Cntl media.
Differentiation media had a significant effect on the time TUJ1 staining was observed as well as the number (% EBs) that were stained. TUJ1 staining was seen as early as 4 days in medium types containing neural components (N, C/N, and C/N/E media) (not shown). In other differentiation media that did not contain neural components (C, E, and Cntl media), TUJ1-stained EBs were seen as early as they were seen as early as 7 days (in the case of C medium), and a much smaller % EBs were detected.
In Col-only and Col-Gen gels, EBs cultured in N, C/N, and C/N/E had a significantly higher % EBs than those cultured in C, E, and Cntl media (p < 0.001; power = 1.0). Within the EBs cultured in media with neural components, there was no significant difference of differentiation medium on the % EBs stained (Figure 9-4A,B). In Gtn-HPA (both compliant and stiff) gels, EBs cultured in C/N and C/N/E had a significantly higher % EBs than those cultured in C, N, E, and Cntl media (Figure 9-4C,D).
Differentiation media also had an effect on the % Area per EB stained. In general, regardless of gel type, there was a higher % Area stained in EBs cultured in N, C/N, and C/N/E media (Figure 9-5). In Col-only gels, EBs cultured in N media had 19% ± 4% of EB Area at 7 days and 15% ± 3% of EB area at 14 days stained for TUJ1. EBs cultured in C/N and C/N/E media had a significantly higher % Area stained at 14 days (38% ± 8% and 27% ± 6%, respectively) than those cultured in N medium (15% ± 3%).
Similar trends and staining patterns were observed in EBs cultured in Col-Gen gels and Gtn-HPA (compliant and stiff) gels. For EBs cultured in Col-Gen gels at 14 days, there was significantly higher % Area stained in EBs cultured in N (31% ± 4%), C/N (49% ± 8%), and
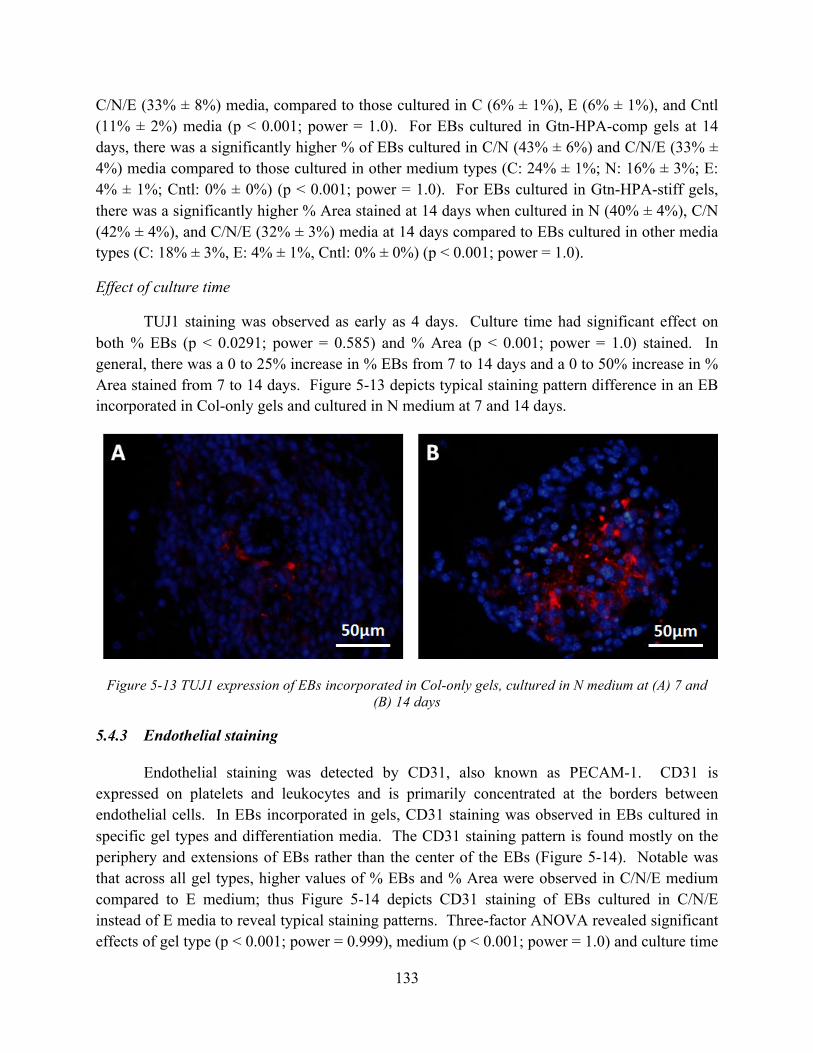
133
C/N/E (33% ± 8%) media, compared to those cultured in C (6% ± 1%), E (6% ± 1%), and Cntl (11% ± 2%) media (p < 0.001; power = 1.0). For EBs cultured in Gtn-HPA-comp gels at 14 days, there was a significantly higher % of EBs cultured in C/N (43% ± 6%) and C/N/E (33% ± 4%) media compared to those cultured in other medium types (C: 24% ± 1%; N: 16% ± 3%; E: 4% ± 1%; Cntl: 0% ± 0%) (p < 0.001; power = 1.0). For EBs cultured in Gtn-HPA-stiff gels, there was a significantly higher % Area stained at 14 days when cultured in N (40% ± 4%), C/N (42% ± 4%), and C/N/E (32% ± 3%) media at 14 days compared to EBs cultured in other media types (C: 18% ± 3%, E: 4% ± 1%, Cntl: 0% ± 0%) (p < 0.001; power = 1.0).
Effect of culture time
TUJ1 staining was observed as early as 4 days. Culture time had significant effect on both % EBs (p < 0.0291; power = 0.585) and % Area (p < 0.001; power = 1.0) stained. In general, there was a 0 to 25% increase in % EBs from 7 to 14 days and a 0 to 50% increase in % Area stained from 7 to 14 days. Figure 5-13 depicts typical staining pattern difference in an EB incorporated in Col-only gels and cultured in N medium at 7 and 14 days.
Figure 5-13 TUJ1 expression of EBs incorporated in Col-only gels, cultured in N medium at (A) 7 and (B) 14 days
5.4.3 Endothelial staining
Endothelial staining was detected by CD31, also known as PECAM-1. CD31 is expressed on platelets and leukocytes and is primarily concentrated at the borders between endothelial cells. In EBs incorporated in gels, CD31 staining was observed in EBs cultured in specific gel types and differentiation media. The CD31 staining pattern is found mostly on the periphery and extensions of EBs rather than the center of the EBs (Figure 5-14). Notable was that across all gel types, higher values of % EBs and % Area were observed in C/N/E medium compared to E medium; thus Figure 5-14 depicts CD31 staining of EBs cultured in C/N/E instead of E media to reveal typical staining patterns. Three-factor ANOVA revealed significant effects of gel type (p < 0.001; power = 0.999), medium (p < 0.001; power = 1.0) and culture time
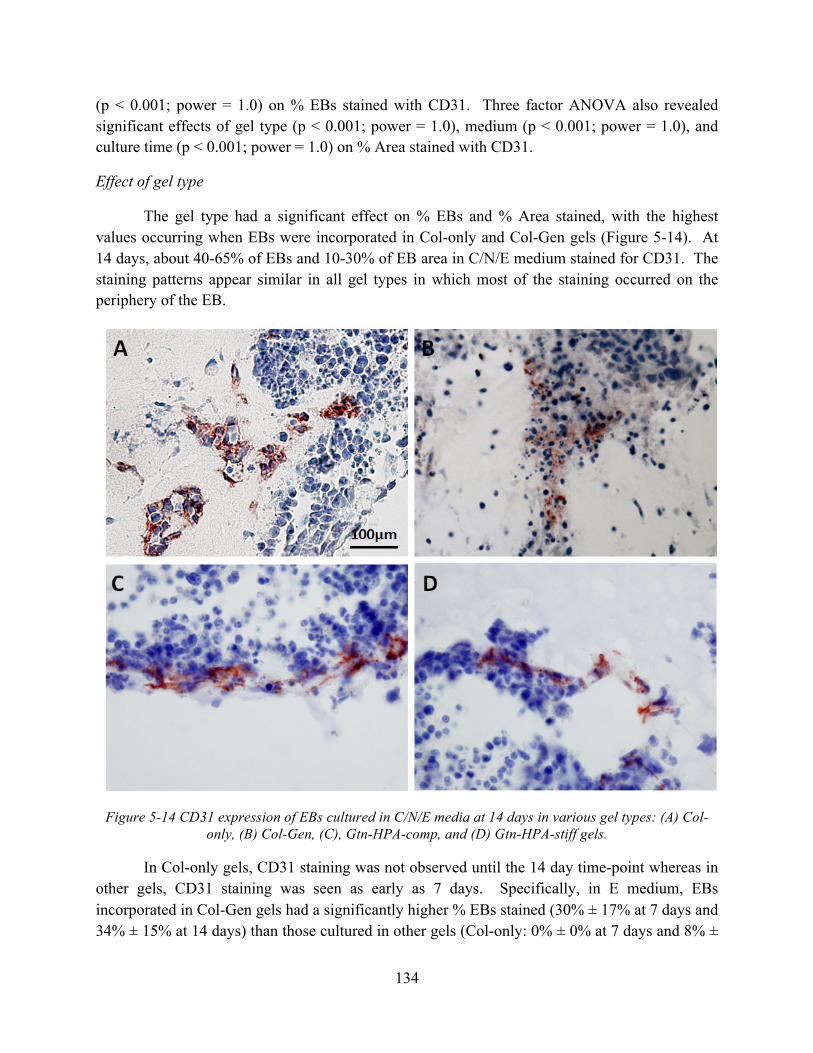
134
(p < 0.001; power = 1.0) on % EBs stained with CD31. Three factor ANOVA also revealed significant effects of gel type (p < 0.001; power = 1.0), medium (p < 0.001; power = 1.0), and culture time (p < 0.001; power = 1.0) on % Area stained with CD31.
Effect of gel type
The gel type had a significant effect on % EBs and % Area stained, with the highest values occurring when EBs were incorporated in Col-only and Col-Gen gels (Figure 5-14). At 14 days, about 40-65% of EBs and 10-30% of EB area in C/N/E medium stained for CD31. The staining patterns appear similar in all gel types in which most of the staining occurred on the periphery of the EB.
Figure 5-14 CD31 expression of EBs cultured in C/N/E media at 14 days in various gel types: (A) Col-only, (B) Col-Gen, (C), Gtn-HPA-comp, and (D) Gtn-HPA-stiff gels.
In Col-only gels, CD31 staining was not observed until the 14 day time-point whereas in other gels, CD31 staining was seen as early as 7 days. Specifically, in E medium, EBs incorporated in Col-Gen gels had a significantly higher % EBs stained (30% ± 17% at 7 days and 34% ± 15% at 14 days) than those cultured in other gels (Col-only: 0% ± 0% at 7 days and 8% ±
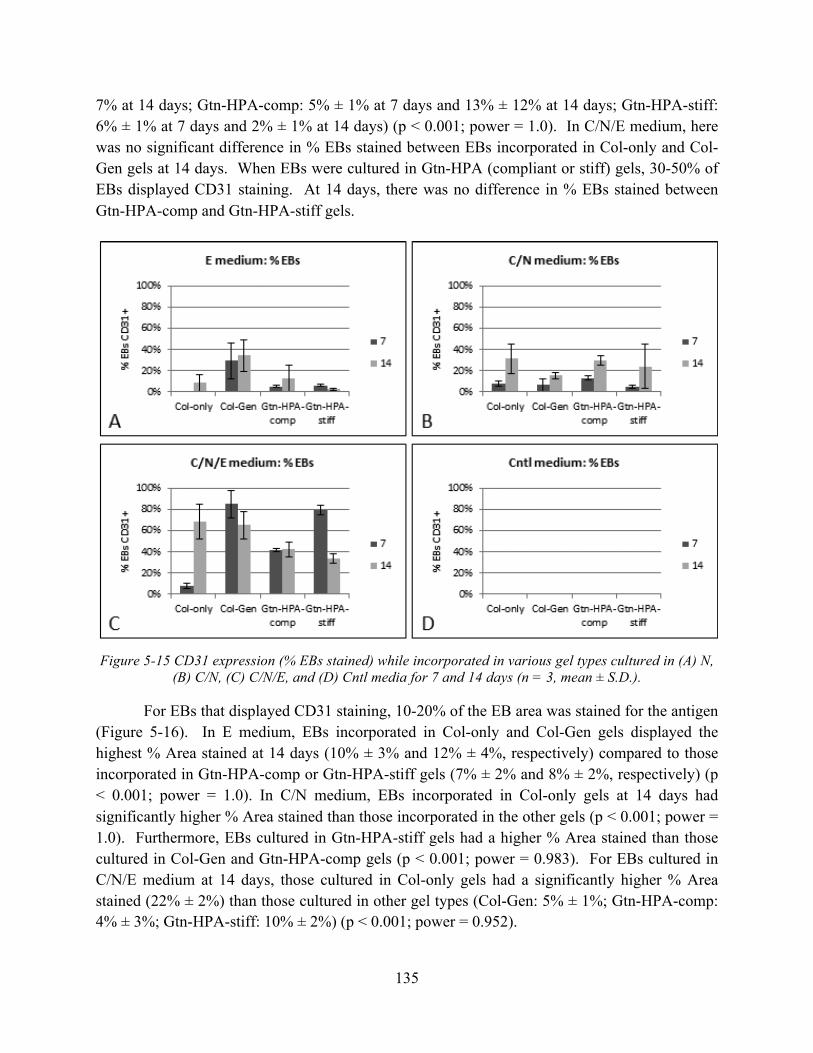
135
7% at 14 days; Gtn-HPA-comp: 5% ± 1% at 7 days and 13% ± 12% at 14 days; Gtn-HPA-stiff: 6% ± 1% at 7 days and 2% ± 1% at 14 days) (p < 0.001; power = 1.0). In C/N/E medium, here was no significant difference in % EBs stained between EBs incorporated in Col-only and Col-Gen gels at 14 days. When EBs were cultured in Gtn-HPA (compliant or stiff) gels, 30-50% of EBs displayed CD31 staining. At 14 days, there was no difference in % EBs stained between Gtn-HPA-comp and Gtn-HPA-stiff gels.
Figure 5-15 CD31 expression (% EBs stained) while incorporated in various gel types cultured in (A) N,
(B) C/N, (C) C/N/E, and (D) Cntl media for 7 and 14 days (n = 3, mean ± S.D.).
For EBs that displayed CD31 staining, 10-20% of the EB area was stained for the antigen (Figure 5-16). In E medium, EBs incorporated in Col-only and Col-Gen gels displayed the highest % Area stained at 14 days (10% ± 3% and 12% ± 4%, respectively) compared to those incorporated in Gtn-HPA-comp or Gtn-HPA-stiff gels (7% ± 2% and 8% ± 2%, respectively) (p < 0.001; power = 1.0). In C/N medium, EBs incorporated in Col-only gels at 14 days had significantly higher % Area stained than those incorporated in the other gels (p < 0.001; power = 1.0). Furthermore, EBs cultured in Gtn-HPA-stiff gels had a higher % Area stained than those cultured in Col-Gen and Gtn-HPA-comp gels (p < 0.001; power = 0.983). For EBs cultured in C/N/E medium at 14 days, those cultured in Col-only gels had a significantly higher % Area stained (22% ± 2%) than those cultured in other gel types (Col-Gen: 5% ± 1%; Gtn-HPA-comp: 4% ± 3%; Gtn-HPA-stiff: 10% ± 2%) (p < 0.001; power = 0.952).
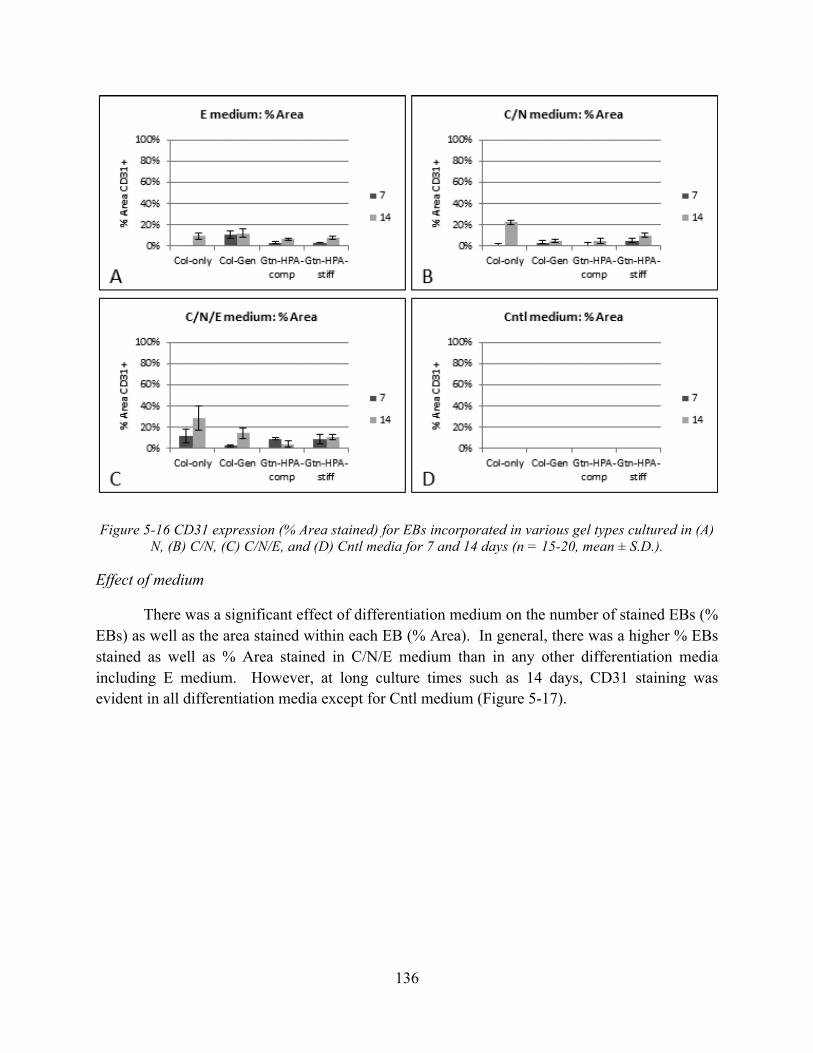
136
Figure 5-16 CD31 expression (% Area stained) for EBs incorporated in various gel types cultured in (A) N, (B) C/N, (C) C/N/E, and (D) Cntl media for 7 and 14 days (n = 15-20, mean ± S.D.).
Effect of medium
There was a significant effect of differentiation medium on the number of stained EBs (% EBs) as well as the area stained within each EB (% Area). In general, there was a higher % EBs stained as well as % Area stained in C/N/E medium than in any other differentiation media including E medium. However, at long culture times such as 14 days, CD31 staining was evident in all differentiation media except for Cntl medium (Figure 5-17).

137
Figure 5-17 CD31 expression of EBs incorporated in Col-only gels at 14 days cultured in (A) C, (B) N, (C) E, (D) C/N, (E) C/N/E, and (F) Cntl media.
When EBs were incorporated in Col-only gels, there was a significant increase in the % EBs stained from 7 to 14 days across all differentiation media (p < 0.001; power = 0.827). Specifically in Col-only gels, EBs cultured in N, C/N and C/N/E had positive staining at 7 days. In particular, EBs cultured in C/N/E medium at 14 days had the highest % EBs stained (68% ± 16%) compared to the rest of the differentiation media (p < 0.001; power = 1.0). Notably, EBs cultured in E medium had no significant increase in % EBs than those cultured in C or Cntl media.
For EBs cultured in Col-Gen gels, the highest % EBs stained occurred in C/N/E and E media (65% ± 13% and 34% ± 15%, respectively at 14 days) compared to those cultured in other gel types (p < 0.001; power = 1.0). Similar to the EBs cultured in Col-Gen gel, there was a higher % EBs stained when cultured in C/N/E medium than those cultured in E medium.
For EBs incorporated in Gtn-HPA-comp gels, there was little difference in % EBs cultured in N, E, C/N, and C/N/E media at 14 days. No CD31 staining was observed in C and Cntl media. When EBs were incorporated in Gtn-HPA-stiff gels, there was no significant difference in % EBs stained between non-control media conditions at 14 days.
In general, the highest % Area stained occurred in C/N/E medium regardless of the gel type. In Col-only gels, EBs cultured in N, C/N and C/N/E media, had the highest % Area stained compared to the rest of the differentiation media. EBs incorporated in Col-Gen gels, there was a significantly higher % Area stained at 14 days in EBs cultured in E and C/N/E media (p < 0.001; power = 1.0). In Gtn-HPA (compliant and stiff) gels, there was no difference in % Area stained for EBs that had an indication for CD31 staining.
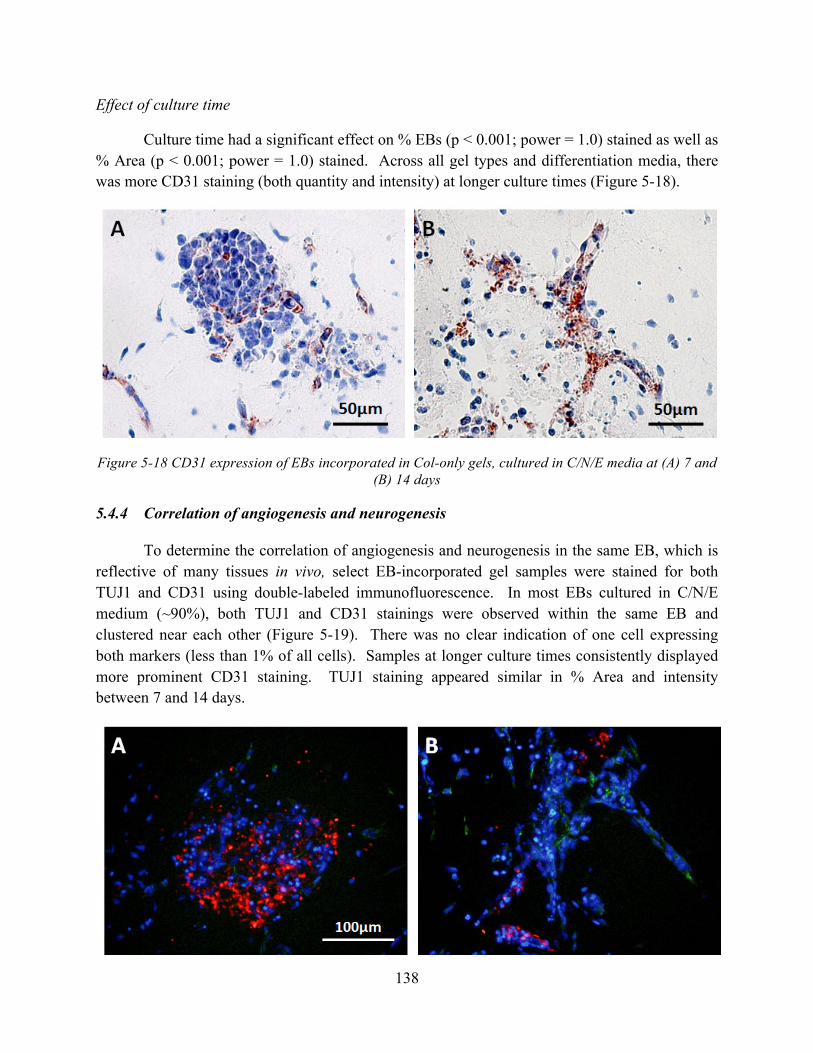
138
Effect of culture time
Culture time had a significant effect on % EBs (p < 0.001; power = 1.0) stained as well as % Area (p < 0.001; power = 1.0) stained. Across all gel types and differentiation media, there was more CD31 staining (both quantity and intensity) at longer culture times (Figure 5-18).
Figure 5-18 CD31 expression of EBs incorporated in Col-only gels, cultured in C/N/E media at (A) 7 and (B) 14 days
5.4.4 Correlation of angiogenesis and neurogenesis
To determine the correlation of angiogenesis and neurogenesis in the same EB, which is reflective of many tissues in vivo, select EB-incorporated gel samples were stained for both TUJ1 and CD31 using double-labeled immunofluorescence. In most EBs cultured in C/N/E medium (~90%), both TUJ1 and CD31 stainings were observed within the same EB and clustered near each other (Figure 5-19). There was no clear indication of one cell expressing both markers (less than 1% of all cells). Samples at longer culture times consistently displayed more prominent CD31 staining. TUJ1 staining appeared similar in % Area and intensity between 7 and 14 days.
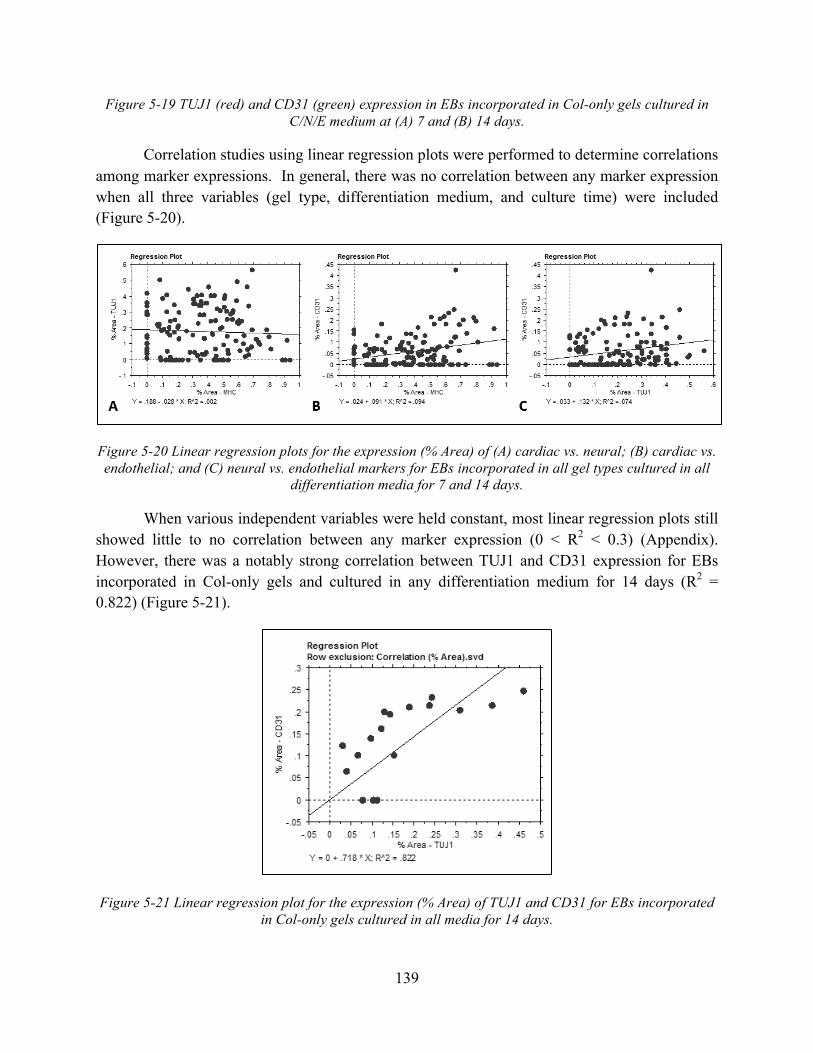
139
Figure 5-19 TUJ1 (red) and CD31 (green) expression in EBs incorporated in Col-only gels cultured in C/N/E medium at (A) 7 and (B) 14 days.
Correlation studies using linear regression plots were performed to determine correlations among marker expressions. In general, there was no correlation between any marker expression when all three variables (gel type, differentiation medium, and culture time) were included (Figure 5-20).
Figure 5-20 Linear regression plots for the expression (% Area) of (A) cardiac vs. neural; (B) cardiac vs. endothelial; and (C) neural vs. endothelial markers for EBs incorporated in all gel types cultured in all
differentiation media for 7 and 14 days.
When various independent variables were held constant, most linear regression plots still showed little to no correlation between any marker expression (0 < R2 < 0.3) (Appendix). However, there was a notably strong correlation between TUJ1 and CD31 expression for EBs incorporated in Col-only gels and cultured in any differentiation medium for 14 days (R2 = 0.822) (Figure 5-21).
Figure 5-21 Linear regression plot for the expression (% Area) of TUJ1 and CD31 for EBs incorporated in Col-only gels cultured in all media for 14 days.

140
5.5 Discussion
The simultaneous differentiation of totipotent ESCs cultured as EBs allow the reconstruction of various cell types within one aggregate of cells. This study investigated the simultaneous differentiation of pluripotent P19 ECCs, a pluripotent derivative ESCs, into cardiac, neural, and endothelial cells within one EB while incorporated in various gel types. This study provided some insight into fundamental cellular behavior, as well as began to investigate simultaneously differentiated EBs as a cellular therapy approach. Injectable gels are an attractive material for the minimally invasive delivery of cells and growth factors into an injured heart. The simultaneous differentiation of one EB into multiple cell types would potentially provide the spatial distribution of neural and endothelial networks necessary to support a dense aggregate of beating cells. Studies have already shown that endothelial-cardiac myocyte interactions play a key role in regulating cardiac function and that endothelial cells promote cardiomyocyte survival and enhance spatial organization in a 3-D configuration [210]. In this chapter, the simultaneous differentiation of EBs incorporated in various gel types was shown to be possible, evaluated primarily using histomorphometry methods to visualize the staining patterns and distribution of cell types within the EB. Furthermore, EBs cultured in various gel types were shown to support differentiation into cardiomyocytes, neural cells, and endothelial cells, identified by immunohistochemical staining for cardiac MHC, TUJ1, and CD31, respectively.
Four gel types used to incorporate EBs were selected based on capability for covalent cross-linking in vivo, gelation properties, mechanical and rheological properties, and cell viability. Both Col-Gen and Gtn-HPA systems have been shown to undergo covalent cross-linking in situ under similar gelation times (30 s for Col-only and Col-Gen gels, 45 s for Gtn-HPA gels). For each pair of Col-based gels and Gtn-HPA gels, cross-linker concentrations were selected to produce gels of three-fold difference in shear storage modulus G’. Col-only and Col-Gen gels (G’ = 30 Pa and 90 Pa, respectively) were selected primarily because their stiffnesses were on the order of magnitude of that of cardiac jelly (E = 1-30 Pa) [22, 23]. Cross-linker concentrations of 1.0 and 1.7 mM H2O2 were chosen to produce Gtn-HPA gels with G’ of 750 Pa and 1700 Pa, respectively. Although Gtn-HPA gels are much stiffer than that of cardiac jelly, they have been of interest because of their capability for in situ cross-linking and potential for applications in tissue engineering. Furthermore, all gels at the chosen cross-linking concentrations are non-cytotoxic with cell viability > 80% for cell encapsulation at 7 days.
Histomorphometry was used as the primary means of evaluating differentiation because it allowed visualization of staining patterns and spatial distribution of various markers. EB-incorporated gel samples were fixed and dehydrated for paraffin-embedding (for collagen-based gels) or cryo-preservation (for gelatin-HPA gels) before standard immunohistochemical staining. The paraffin-embedding process was not compatible with Gtn-HPA gels and resulted in brittle samples that disintegrated during the dehydration process, and thus cryo-preservation was used. One disadvantage of using sections from the paraffin-embedding and cryo-preservation

141
processes is the potential loss of parts of the samples due to the rigorous washing process while using the Dako autostainer. However, the alternative of embedding samples in plastic would prevent adequate penetration of antibodies to the samples, and thus paraffin-embedding and cryo-reservation methods were chosen.
The metrics “% EBs” and “% Area” have been reported in literature as means to quantify cardiac differentiation efficiency in EBs, and thus were used as the primary metrics to evaluate cardiac, neural, and endothelial differentiation. Zhang et al, used % EBs as a metric to calculate the fraction of beating EBs formed from various induced pluripotent stem cells after 30 days of differentiation [211]. Jasmin et al, quantified number of beating EBs and the number of cells in each EB that was expressing troponin T, a cardiac marker [156]. Furthermore, Nussbaum et al, quantified cardiac differentiation by tracing areas that stained for sarcomeric actin to calculate % area expressing the cardiac marker [212].
Effect of gel type
The four gel types investigated in this study ranged from compression moduli of 100 Pa (Col-only gels) to 4000 Pa (Gtn-HPA-stiff gels). Many thermogelling systems have been reported including poly(ethylene glycol)/poly(propylene glycol) triblock copolymer (Poloxamer®), poly(ethylene glycol)/poly(butylene glycol) di- and tri-block copolymers, poly(ethylene glycol)/poly(lactic acid-co-glycolic acid) triblock and graft copolymers, chitosan/glycerol phosphate, polyphosphazene, and poly(ethylene glycol)/poly(caprolactone) triblock copolymers, ranging from 100-10,000 Pa in the sol state, depending on the concentration of the polymer [213]. However, most of these materials were investigated for drug delivery and not for cell delivery and thus there is very little reported literature on cellular response to 3-D incorporation. Although the gel moduli can be designed to be higher than 4000 Pa, this thesis investigates gels with moduli ranging from 100-4000 Pa with the knowledge that the higher stiffness impedes cellular functions such as migration and proliferation in the range of 500-5500 Pa [205].
Three-factor ANOVA revealed significant effect of gel type on cardiac, neural, and endothelial differentiation for both % EBs and % Area stained. In general, EBs cultured in Col-only gels had the highest % EBs and % Area for any given marker expression. Specifically, EBs cultured in Col-only gels displayed the highest expression levels for MHC. EBs cultured in Col-only and Col-Gen gels displayed the highest expression levels for TUJ1 and CD31 compared to those cultured in Gtn-HPA gels, and there was no significant difference of neural and endothelial marker expression between the two gel types.
One explanation for this differentiation behavior and staining pattern is the greater degree of stem cell differentiation when incorporated in more compliant matrices. Studies have shown that substrate stiffness has a significant impact on stem cell differentiation in which 2-D culture of cells on stiffer matrices (25-40 kPa) differentiate into cells of stiffer tissues such as
142
osteoblasts, while cells cultured on more compliant matrices (1 kPa) differentiate into cells of more compliant tissues such as neurons [214]. Furthermore, higher gel mechanical properties (13-45 kPa) increased mouse primary myoblast adhesion, proliferation, and adhesion in a 2-D cell culture model, than compared to more compliant mechanical properties [177]. Few studies have been conducted to determine whether this trend still exists for 3-D incorporation of cells. In our study, cardiac differentiation efficiency seemed to be affected in the range of 30-1700 Pa with the greatest degree of differentiation occurring in Col-only gels (G’ = 30 Pa). Although no sponatenous beating EBs was found in any culture, cardiac MHC staining was identified in many cultures and was used as a marker for cardiac differentiation.
Spontaneous contraction of ECCs incorporated in gels has not been reported. Other researchers cultured ECCs in cardiac differentiation medium in polyethylene glycol gels with a similar range of moduli (300-4000 Pa) did not observe beating [16]. Although beating in ESC-differentiated cardiomyocytes in gel cultures has been shown [215], the ESC-derived cardiomyocytes exhibited less contraction amplitude and synchronization in comparison to neonatal rat cardiomyocytes.
The lack of beating in ECC cultures could be due to a number of different factors including a difference in conditions required for differentiation and beating, non-ideal gel stiffness, and the lack of anchoring. During embryonic development, differentiation of ESCs into cardiac progenitor cells and cardiomyocytes occurs earlier in cardiogenesis compared to the first onset of spontaneous beating. This observation suggests that the conditions required for differentiation may be different than the conditions required for beating. Furthermore, cardiogenesis takes place in cardiac jelly, a dynamic material that changes in stiffness and presence during cardiac development. By the time spontaneous beating occurs during cardiogenesis, most of the cardiac jelly has been replaced by a more robust and stiff cardiac muscle. A second explanation for the lack of beating is the non-ideal gel stiffness. Although ESC-derived cardiomyocytes have been shown to beat in 3-D cultures, the gel conditions and mechanical properties were not well characterized and thus the parameters to sustain cardiac beating are unknown [215]. Many 2-D studies have shown that substrate stiffness has a significant effect on cell differentiation [216] but very few studies have been conducted to elucidate the effect of 3-D culture conditions required for spontaneous beating. Finally, the lack of beating can be due to a lack of cell anchoring. Studies have shown that when beating cardiac myocyte multilayers cultured as sheets ceased to pulsate when they were lifted from a supporting 2-D scaffold. However, when the multilayers were reattached to the culture dish the pulsatile amplitude increased again [217]. This indicates that a supporting scaffold is needed for cell anchoring. Future studies including culturing the EBs on and in a wider range of stiffnesses would elucidate the effect of stiffness on spontaneous beating. Specifically, beating EBs should be first cultured in monolayer on tissue culture plastic and then a layer of collagen gel can be placed over the beating EBs. The beating clusters can be evaluated based on duration and amplitude of beating, compared to a non-gel-coated EB control.
143
In future studies on spontaneous beating of ECCs, drugs and exercise can be used to induce. Specifically, epinephrine, a hormone and a neurotransmitter, which acts by binding to adrenergic receptors to increase heart rate, can be introduced to the EB-incorporated gels. Furthermore, it’s been shown that electrical and mechanical exercise can be used to start and stabilize a regular beating rhythm [3].
The relatively low level of proliferation observed in 3-D cultures agrees with similar studies of cells incorporated in collagen gels [218]; however, the lack of dependence on stiffness is somewhat surprising given that both intrinsic mechanical cues and applied mechanical forces have previously been shown to regulate 2-D cell proliferation in a variety of cell types [219]. Cell spreading in 3-D also correlated with changes in ECM mechanics, in which smooth muscle cells cultured in stiffer, more tightly cross-linked gels displayed a less spread-out phenotype. This observation is likely more directly related to the extent of cross-linking in the gels, rather than the mechanical properties per se, but nevertheless suggests that correlations between cell shape and proliferation in 2-D cultures may not extend to 3-D.
A similar trend for neural differentiation was found for EBs stained for TUJ1: EBs cultured in the more compliant Col-only and Col-Gen gels had a higher % EBs than those cultured in Gtn-HPA gels. However, there was no effect of gel type on % Area stained. Previous studies have shown that 3-D culture of neural stem cells (NSCs) in compliant alginate hydrogels (E = 300 Pa) have higher levels of TUJ1 expression, measured by quantitative real-time polymerase chain reaction, compared to those cultured in stiffer hydrogels (E = 3 kPa) [220]. Furthermore evidence has shown that 2-D culture of MSCs on matrices (E = 0.1-1 kPa) displayed a neuronal phenotype within 24 hours [214]. Other studies have shown that adult neural stem cells cultured in serum-free neuronal differentiation medium displayed a peak level of TUJ1 on synthetic hydrogels with stiffnesses of 500 Pa, near the physiological stiffness of brain tissue [221]. Furthermore, under mixed differentiation conditions with serum, compliant gels (E = 100–500 Pa) yielded differentiation into neurons, whereas stiffer gels (E = 1-10 kPa) promoted glial cultures. We show that neural differentiation can occur in Gtn-HPA gels of stiffnesses up to 1700 Pa, but experience a less efficient differentiation compared to those of more compliant collagen gels.
Regarding endothelial differentiation, EBs cultured in the most compliant gels, Col-only gels, in medium containing VEGF had the highest % EBs and % Area compared to EBs cultured in other gel types. Very few studies have directly investigated the direct effect of hydrogel modulus on endothelial differentiation. One study has shown that the incorporation of an RGD peptide in dextran-based hydrogels (which increased the swelling ratio and effectively decreased the elastic modulus) either decreased or maintained the expression of endothelial marker KDR/Flk-1 as compared to the cells incorporated in the hydrogel without this epitope [222]. Because there is a confounding effect of the epitope presence and attending change in stiffness (ranging from 1-5 kPa), further studies to isolate each effect would be helpful in determining the

144
effects of each factor. Additionally, studies that elucidate the effect of moduli on endothelial marker expression would shed light on the optimum gel types for endothelial differentiation.
Effect of differentiation medium
Three-factor ANOVA revealed a significant effect of differentiation medium on % EBs and % Area stained for cardiac, neural, and endothelial differentiation. Expression for cardiac MHC (% EBs and % Area) was highest when EBs were cultured medium containing DMSO (C, C/N, and C/N/E media), a DNA-methylating agent. DMSO has been widely used as a myogenic agent, and has been shown to upregulate early and late cardiac genes to induce spontaneous beating in a pluripotent mouse cell line (P19CL6) in 15% of cells [223]. Furthemore, DMSO has been shown to activate essential cardiogenic transcription factors such as GATA-4 and Nkx-2.5 [97]. However, the mechanisms responsible for triggering these genes in the embryo are still unknown, with respect to the mechanism of action of DMSO for cardiomyogenic differentiation in P19 cells. Our simultaneous differentiation studies show that the addition of other factors such as RA and VEGF does not have an effect on the potency of DMSO as a myogenic agent. Additional studies have shown that genetically engineered ESCs treated with RA contained approximately twice as many cells as the non-treated flasks, as well as undetectable levels of Oct-4 expression, suggesting that RA may promote cardiac differentiation and/or survival [224].
The expression for TUJ1 (% EBs and % Area) was highest when EBs were cultured in the presence of RA (N, C/N, and C/N/E media). RA is a well-defined physiologically relevant morphogen and P19 ECCs have been found to efficiently differentiate (> 95%) into neurons [91, 94]. The effects of aggregation (EB formation) has also been found to have a significant effect on neural differentiation due to extra-EB and may result from inside-outside interactions similar to those hypothesized in other mammalian developmental processes. In both cross-linking extents of Gtn-HPA gels, neural differentiation was highest in C/N media at both 7 and 14 days, compared to EBs cultured in other differentiation media, including those cultured in C/N/E medium. This suggests that the presence of VEGF in Gtn-HPA gel culture, and to some extent Col-Gen gels, had a negative effect on neural differentiation efficiency. This could be due to the large VEGF molecule (38 kDa) interfering with the EB formation, or limiting cell access to RA, a small molecule. Additional studies should be done to elucidate the effect of large molecules in neural differentiation. For example, including a different similarly-sized growth factor such as phenolic glycolipid-1 (PGL-1, 35 kDa) in the neural culture medium could determine wither the presence of a large growth factor would have an effect of neural differentiation. Another study that investigates the presence of VEGF at different concentrations could determine whether VEGF is interfering with neural differentiation. Interestingly, the presence of VEGF did not affect the % Area of stained within an EB, only the % EBs stained.
The expression of CD31 (% EBs and % Area) was highest when EBs were cultured in C/N/E medium, even compared to those cultured in E medium, indicating that the presence of RA is beneficial in endothelial differentiation. This is the first reported study of P19 EB
145
endothelial expression when cultured in RA, DMSO, and VEGF. The presence of DMSO during EB formation has already been shown to have a significant effect on the expression of CD31 when in monolayer [95], but no studies have been conducted to elucideate the concurrent effect of VEGF and RA. This suggests that RA further enhances endothelial differentiation when used in conjuncture with VEGF and DMSO. Studies have shown that EBs cultured in the presence of RA for an early time point (up to 7 days) differentiate into spontaneously contracting smooth muscle cells [225]. Very few studies have investigated neural and endothelial co-cultures; however there was one group found that neural stem cells (NSCs) cultured with human endothelial cells showed stable expression of multiple endothelial markers and the capacity to form capillary networks [226].
Similar to the endothelial differentiation staining patterns found in monolayer, the formation of endothelial tube-like structures was not identified in any gel or differentiation medium at any time point. EB seeding density was not a factor taken into account in this particular study and EBs were more or less distributed homogenously throughout the gel. A higher seeding density maintained at longer culture times may allow the formation of tube-like structures seen in reported studies [95].
Studies on the effect of RA in endothelial differentiation are inconclusive. One study indicates that there is increased angiogenesis and VEGF production in acute promyelocytic leukemia (APL) and that RA therapy inhibits VEGF production and suppresses angiogenesis [227]. Furthermore, other researchers have shown that RA inhibits angiogenesis and induces apoptosis in squamous cell carcinoma {Liaudet-Coopman, 1997 #572}. In another study, researchers developed a mixed ester of hyaluronan with butyric acid and RA (HBR) that acted as a cardiogenic/vasculogenic agent [228]. HBR remarkably enhanced VEGF gene expression and the secretion of the angiogenic, mitogenic, and antiapoptotic factors VEGF and HGF, priming stem cell differentiation into endothelial cells. The increase in CD31 expression in EBs cultured in mixed medium conditions in all gel types compared to those cultured in endothelial medium alone, indicates that RA promotes angiogenesis. Future studies using RT-PCR and other markers for endothelial cells are needed to confirm this hypothesis.
Effect of culture time
Culture time had no significant effect on % EBs and % Area stained for cardiac differentiation, but it did for neural and endothelial differentiation. Typically, embryonic stem cells cultured as EBs typically exhibit signs of cardiac differentiation (spontaneous beating and immunohistochemical staining for cardiac markers such as myosin heavy chain, α-actinin, and troponins) starting at day 4-5 in monolayer culture and reached a maximum at day 21, which was also found to be true for our monolayer cultures [211] [229]. In our study, 7 days in culture was the earliest time point to be investigated and thus the effect of culture time was not elucidated. Future studies that stain for cardiac markers beginning at day 2 would reveal an effect of culture time on cardiac differentiation.
146
Studies have shown that EBs cultured in the presence of RA exhibit TUJ1 staining for neurons starting as early as 3 days post-EB formation [87]. Furthermore, preliminary studies in our lab showed prominent and extensive staining of TUJ1 as early as 4 days in monolayer culture (Chapter 3). This observation could be supported by the fact that the ectoderm, which gives rise to the nervous system (spine, peripheral nerves, and brain), is the first germ layer to develop in embryo. In 3-D culture of EBs, there was either no change or a slight increase in the % EBs stained with TUJ1 whereas there was a slight increase in % Area stained in most EBs from 7 to 14 days, suggesting that most of the potential for TUJ1 staining had been saturated at the 7 day time point.
In our studies, endothelial differentiation in EBs was seen as early as 7 days in 2-D monolayer as well as 3-D culture, and % EBs increased from 7 to 14 days in most gel types. However, the extensiveness of CD31 staining only increased from 7 to 14 days in Col-only gels and not in other gel type, suggesting that the Col-only gel properties were conducive to supporting an extensive vascular network. In literature, endothelial differentiation as identified by flow cytometry and RT-PCR of PECAM-1 expression was detected as early as 5 days and increased in the 14-day culture time [95].
Collagen-genipin gels
Collagen has been used as injectable gels suitable for tissue engineering applications because of their bioactivity and ubiquitous presence in the human body. As previously described, cross-linking collagen with 0.25 mM genipin has increased its shear storage modulus 3-fold from 30 Pa to 90 Pa, providing it with increased mechanical stability and resistance to enzymatic degradation without compromising cell viability. In this chapter, simultaneous differentiation of EBs into cardiac, neural, and endothelial lineages in both Col-only and Col-Gen gels has been demonstrated. Comparing Col-only and Col-Gen gels, the gel type (p < 0.001; power = 1.0) and the differentiation medium (p < 0.001; power = 1.0) had a significant effect on the % EBs stained with MHC, whereas the culture time did not (p = 0.3019; power = 0.167). Furthermore, the gel type (p < 0.001; power = 1.0) and differentiation medium (p < 0.001; power = 1.0) had a significant effect on the % Area stained, whereas the culture time did not (p = 0.1371; power = 0.300). At 14 days, EBs cultured in Col-only gels exhibit a higher % EBs and % Area compared to those cultured in Col-Gen gels. This is the first study that has compared cardiac differentiation of EBs incorporated in Col-only and Col-Gen gels. A few explanations are proposed for the difference in cardiac differentiation between Col-only and Col-Gen gels: the lower cell viability in Col-Gen gels (80% at 7 d) compared to that in Col-only gels (90% at 7 d), or the presence of genipin and its attending higher stiffness interfering with cardiac differentiation.
There have been various researchers studying neural differentiation of various cell types in various hydrogel materials but very few studies have investigated the effect of modulus or the presence of a genipin cross-linker on a neural differentiation in 3-D culture. Neural

147
differentiation of neural precursor cells have been shown in collagen gels (3 mg/ml) [159, 230]. Mouse ESCs have been differentiated down neural lineages in fibrin scaffolds and the conditions for differentiation have been optimized in terms of concentrations of fibrinogen, thrombin, and aprotinin (protease inhibitor) [231]. In our cultures, we found that the differentiation medium had a significant effect on the % EBs stained with TUJ1 (p < 0.001; power = 1.0) whereas gel type (p = 0.0051; power = 0.835) and culture time (p = 0.2300; power = 0.210) did not. Furthermore, the differentiation medium had a significant effect on the % Area stained with TUJ1 (p < 0.001; power = 1.0) whereas gel type (p = 0.130; power = 0.719) and culture time (p = 0.514; power = 0.486) did not. In general, EBs cultured in Col-only gels as opposed to Col-Gen gels had more EBs stained with TUJ1. Furthermore, the EBs cultured in medium containing RA had a higher % EBs and % Area stained than those that were not. Culture time did not seem to have an effect on either differentiation efficiency metric, probably because neural differentiation occurs as early as 4 days in monolayer and our earliest time point for 3-D cultures was 7 days. Additional studies accounting for earlier time points would elucidate the effect of culture time on % EBs and % Area stained.
For endothelial differentiation, all three factors: gel type (p < 0.001; power = 0.995), differentiation medium (p < 0.001; power = 1.0), and culture time (p < 0.001; power = 1.0) had a significant effect on % EBs stained with CD31. Similarly, there was a significant effect of gel type (p < 0.001; power = 1.0), differentiation medium (p < 0.001; power = 1.0), and culture time (p < 0.001; power = 1.0) on the % Area stained with CD31. Endothelial differentiation was found to be the most prominent in Col-only gels in C/N/E medium. Furthermore, there was a significantly earlier expression of CD31 in Col-Gen gels when compared to that of Col-only gels. Genipin seemed to have a positive effect of endothelial differentiation when cultured in C/N/E medium.
There have been many studies on cell signaling of signal-releasing cells, known as paracrine signaling. Many of these studies have revolved around pericytes, vascular cells that are found around blood capillaries that are functional and critical contributors to tumor angiogenesis and therefore as potential new targets for antiangiogenic therapies. They have been found to expresses a chondroitin sulfate proteoglycan surface marker known as neuron-glial 2 (NG2) [232]. NG2 has historically been found on immature neural cells capable of differentiating into either glia or neurons. Studies have shown that NG2 knockout mice are viable, but when pathological angiogenesis is induced in the adult mouse, such as ischemic angiogenesis in the mouse retina in response to hypoxia of bFGF-induced angiogenesisin the cornea, neovascularization is substantially reduced [233]. The highest density of pericytes in the body is found in vessels of neural tissues, such as the brain and the retinas. Endothelial cells in the brain form a continuous endothelium with complex, tight junctions, and they interact with astrocytic pedicels and with numerous pericytes to create the blood-brain barrier (BBB), which protects brain cells from potentially toxic blood-derived factors [234, 235]. Pericytes have a complex ontogeny, because they can develop from various cells, as a function of their location in

148
the embryo. For example, pericytes can develop from the neurocrest in the forebrain and cardiac tracts [236, 237].
Numerous studies point to a neuroprotective role for VEGF [238]. For instance, mice homozygous for a VEGF-A allele lacking the hypoxia response element developed a motor neuron disease similar to amyotrophic lateral sclerosis. In vitro studies found that VEGF protected motor neurons under stress conditions by stimulating axon outgrowth in explant cultures, and promotes the survival, proliferation and migration of Schwann cells, astrocytes and microglia. Furthermore, in vivo studies have demonstrated that VEGF-1 is required for migration of facial motor neurons [239]. VEGF might have two roles in nervous-system development and neuroprotection: first, as a direct neurotrophic agent; and second, as an angiogenic factor stimulating endothelial cells to provide adequate perfusion and neurotrophic factors.
VEGF also plays an important role in embryonic development of the neurocrest [238]. The notochord has a key role in patterning the axial vasculature in chicks and mice by secreting bone morphogenetic protein (BMP) inhibitors, noggin and chordin, which define an avascular region around the developing notochord [240]. Later, secretion of VEGF from the neural tube is involved in recruiting somite-derived angioblasts to form the perineural vascular plexus, which will encase the neural tube at midgestation [241]. From there, angiogenic sprouting within the neural tube will occur and is dependent upon Shh signals from the ventral neural tube and neighboring tissues [242].
Endothelial cells regulate stem cells in the nervous system during organogenesis [238]. Proliferating endothelial and neural precursors are closely associated, and endothelial-derived soluble factors regulate neuro-genesis [243]. Given their close proximity, cross-talk between proliferating endothelial and neuronal progenitors is likely to involve more than just secreted factors. Juxtacrine signalling molecules, such as Notch, which are essential for cell fate choice in progenitors of both neuronal and vascular lineages, are obvious candidates. Endothelial cells are therefore likely to have a key role in providing a niche for regulating neural stem-cell activity.
Cardiac jelly
Cardiac jelly has been seen as the target material to support EB differentiation in terms of mechanical properties. Cardiac jelly is a homogenous network of collagen fibrils and fine filaments as well as elastin in which embryonic cardiac development and looping occurs. The presence of glycosaminoglycans gives cardiac jelly a gel-like appearance as well as controls the degree degree of hydration. Cardiac jelly is populated by several types of proteins that participate in paracrine cell-cell communication, and proteins that promote cell migration and tissue remodeling [209]. There have been two studies that characterized the rheological and mechanical behavior of cardiac jelly. First, Zamir, et al, used microindentation to apply forces (~10-100 nN) on the cardiac jelly sample and measure the displacement of the tip [22]. The

149
material constant C for cardiac jelly was determined by empirically fitting results from the model with only FJ to average force-displacement data from several experiments and found to be 3 Pa, which can be converted to a shear modulus of 6 Pa. A second study by Butcher, et al, used a custom-built mesomechanical testing system in which cardiac jelly was placed in an isotonic bath and positioned to the tip of a micropipette and a small vacuum pressure was applied and the aspirated tissue length was measured simultaneously [23]. Nonlinear cardiac jelly loading curve (pressure vs. stretch ratio) was modeled and curve fit by Newton-Gaussian interation. The effective modulus of cardiac jelly ranged from 0.15-3.6 Pa, which is on the same order of magnitude as that found by Zamir, et al. Furthermore, Butcher, et al found that the modulus of cardiac jelly decreases 10-fold (from 1 Pa to 0.1 Pa) after exposure to collagenase II (300 U/ml) for 6 hours.
Cardiac jelly is significant in this study because it is the model gel in which cardiac development to occur. In embryonic development, cardiac looping and attenuating cardiac differentiation occurs in the cardiac jelly and thus cardiac jelly provides an ideal environment for cardiac differentiation of embryonic stem cells to take place. Col-only gels are the most similar to cardiac jelly rheological and degradative properties, which could explain the higher differentiation efficiency for all three differentiation, compared to that in Col-Gen gels. Furthermore, studies have shown that neural differentiation takes place in softer matrices.
Although Col-only gels most closely resemble cardiac jelly with respect to rheological and degradative properties, there are limitations of using Col-only gels for cardiac tissue engineering. As the most compliant material investigated in this study, Col-only gels were the most difficult to handle and thus provided motivation for the investigation of cross-linkers to bolster its mechanical properties. Furthermore, cardiac jelly is a dynamic material, changing in composition and mechanical properties during embryonic development. The originally gelatinous cardiac jelly at HH17 becomes significantly more rigid by HH25 (approximately 11-12 days) in chick embryology [244]. Thus, Col-only gels are considered as a biomaterial scaffold capable of encapsulating and delivery cells for cardiac regeneration, with the caveat of weak mechanical properties. This chapter provides a starting point for investigating differentiating EBs in injectable gels of various chemical compositions and stiffnesses. The results help identify select gel types to be investigated in vivo.
Gelatin-HPA gels
Gelatin-HPA gels have recently been developed and explored as an injectable biopolymer gel that has the capability of in situ covalent cross-linking. This highly porous and biodegradable material has been shown to be non-cytotoxic to both MSCs and P19 ECCs, and support hMSC differentiation into myocytes and neurons in 2-D culture [179] and differentiation into neurons in 3-D culture [176]. In this study we investigated the 3-D culture and differentiation of an embryonic stem cell type, P19 EBs, in Gtn-HPA gels at two cross-linking
150
concentrations: 1.0 mM H2O2 (Gtn-HPA-comp) and 1.7 mM H2O2 (Gtn-HPA-stiff), which had a 3-fold difference in shear storage modulus, G’.
When comparing Gtn-HPA-comp vs. Gtn-HPA-stiff gels, there was a significant effect of differentiation medium (p = 0.0226; power = 0.634) and culture time (p = 0.003; power = 0.990) on % EBs stained with MHC, whereas gel type (p = 0.1194; power = 0.326) did not. Furthermore, there was a significant effect of gel type (p < 0.001; power = 0.999) and differentiation medium (p < 0.001; power = 0.999) on the % Area stained with MHC whereas culture time (p = 0.0079; power = 0.785) did not. This signifies that that although the % EBs stained with MHC did not change from 7 to 14 days, there was a significant increase in the area stained. Furthermore, gel type only had a significant effect on the % Area stained and not the % EBs stained.
There was a significant effect of differentiation medium on the % EBs stained (p < 0.001; power = 1.0) whereas the gel type (p = 0.1906; power = 0.241) and the culture time (p = 0.694; power = 0.429) did not. Furthermore, there was a significant effect of gel type (p = 0.0015; power = 0.930), differentiation medium (p < 0.001; power = 1.0); and culture time (p < 0.001; power = 1.0) on the % Area stained with TUJ1. EBs cultured in RA had an increased % EBs and % Area compared to those that did not. Furthermore, gel type and culture time only had a significant effect on the % Area stained and not the % EBs. This indicates that EBs were already expressing minimal TUJ1 at 7 days, which only creased with culture time. Also, in general, there seemed to be a higher % Area stained with TUJ1 in Gtn-HPA-stiff gels. This is surprising because EBs cultured in neural medium tend to express more TUJ1 in more compliant matrices than those cultured in stiffer matrices. A larger samples size and a broader range of stiffnesses for Gtn-HPA gels would elucidate the effect of stiffness on TUJ1 expression.
There was a significant effect of differentiation medium (p < 0.001; power = 1.0) and culture time (p = 0.0041; power = 0.855) on the % EBs stained with CD31, but not gel type (p = 0.3006; power = 0.167). Furthermore, there was a significant effect of differentiation medium (p < 0.001; power = 1.0) and culture time (p < 0.001; power = 1.0) on % Area stained with CD31, but gel type (p = 0.0010; power = 0.946) did not.
2-D monolayer vs. 3-D gel cultures
In Chapter 1, we showed that P19 EBs cultured in monolayer in C, N, and E differentiation media differentiated into cardiac, neural, and endothelial cells with 30-50%, 90%, and 20% differentiation efficiency (% EBs stained), respectively. In this chapter, we investigated the effects of 3-D hydrogel culture on the differentiation efficiency. In general, EBs cultured in 3-D biopolymer gels (Col-only, Col-Gen, Gtn-HPA-comp, and Gtn-HPA-stiff) had equal or higher amounts of cardiac, neural, and endothelial differentiation (evaluated by % EBs stained), compared to those in 2-D culture. One major difference between monolayer and 3-D cultures was that beating CMs were not observed in any 3-D culture when they were in
151
monolayer culture. Previous studies have shown that few CMs derived from ESCs show beating in 3-D gel cultures and when they do, the amplitude of contraction is much less than neonatal CMs [215]. Further studies on the characterization of gel material (e.g. stiffness) as well as optimum medium would elucidate the optimum conditions for ESC-derived CMs in gel culture. Furthermore, the difference in stem cell type could explain the lack of beating; only ESC-derived CMs have been shown to beat in 3-D culture whereas P19 ECCs have not.
EBs in monolayer exhibited different sizes depending on the differentiation medium. EBs cultured in medium containing DMSO tended to be larger (~400 µm in diameter) than those cultured in medium containing RA (~200 µm in diameter), although no formal quantification was conducted. For EBs cultured in gels, there was no effect of gel type, differentiation medium, or culture time on EB diameter, which ranged from 300-600 µm. Future studies focusing on more rigourous measurement of EB diameters in monolayer would reveal differences, if any, between EB diameter when cultured in monolayer and gel cultures.
Correlation of angiogenesis and neurogenesis
There was a meaningful correlation between TUJ1 and CD31 expression in EBs incorporated in Col-only gels (R2
= 0.822). Paracrine signaling and the correlation of neurogenesis and angiogenesis is evident in vivo and integral to the survival of many adult and fetal tissues, including myocardium. For example, it’s been shown that VEGF has a neuroprotective role in stress conditions and is involved in the embryonic development of neurocrest (Coultas 2005). Furthermore, neuron-glial-2 knock-out mice experience reduced angiogenesis (Ozerdem 2004). Finally, it’s been observed that endothelial cells interact with astrocytes to create the blood-brain barrier (Cleaver 2003).
It is interesting to note that the correlation between neurogenesis and angiogenesis was only observed in Col-only gels, the gel type with the most compliant mechanical properties, suggesting that gels mimicking cardiac jelly may provide the most suitable environment for cell differentiation. Further studies exploring gels of similar moduli would elucidate the effect of the polymer itself on differentiation efficiency.
5.6 Summary
We investigated differentiation and simultaneous differentiation of P19 EBs into cardiac, neural, and endothelial cell types while incorporated in two types of hydrogels that are capable of forming cross-links in vivo: collagen-based gels cross-linked with genipin and two gelatin-based gels cross-linked with HRP and H2O2. We found that EBs cultured in Col-only and Col-Gen gels had the highest differentiation efficiency in terms of the percentage of EBs stained and the area per EB stained for all three cell types. Staining with MHC indicated cardiac differentiation but no beating was observed in any culture. Furthermore, angiogenesis and neurogenesis was observed within the same EB; notably, extensive neural and vascular endothelial networks were found at higher densities in the same areas of an EB. Our study contributes to the understanding

152
of fundamental cellular behavior and the development of simultaneously differentiated EBs for cellular therapy. In summary, a lightly cross-linked gel (collagen with 0.25 mM genipin) would allow differentiation of incorporated cells, as well as maintain mechanical robustness when injected.
153
Chapter 6 In vivo feasibility of biopolymer gels
6.1 Introduction
Cardiac tissue engineering is a continuously improving engineering research field with the overall goal of overcoming the obstacles to prolonging patients' life after myocardial infarction. It comprises a biomaterial based “vehicle,” either a porous scaffold or dense patch, made of either natural or synthetic polymeric materials, to aid transportation of cells into the infarcted cardiac tissue. Many different cell types have been suggested for cell therapy and myocardial tissue engineering, including autologous adult and embryonic stem cells. Biomaterials investigated for this specific tissue engineering application need to be biocompatible with native cardiomyocytes, but also other cell types in the cardiac wall such as endothelial and smooth muscle cells. Furthermore, the biomaterials must have particular mechanical properties matching those of native myocardium, so that the delivered donor cells integrate and remain intact in vivo. Although much research is being carried out, many questions still remain unanswered requiring further research efforts.
Many in vitro and in vivo experiments have been done to evaluate various tissue engineering methods for cardiac regeneration. In vitro experiments provide a relatively inexpensive and simplistic method to evaluate cellular, mechanical, and degradative behavior given strictly limited conditions, but are insufficient in predicting in vivo behavior. In vivo experiments allow the evaluation of tissue engineering therapies over a period of time and provide relevance to humans.
The porcine animal model (45-50 kg) is ideal for studying cardiac injuries, in particular myocardial infarctions. Swine heart is similar to the human heart in coronary vessel anatomy and in sparse pre-existing collaterals and, therefore, porcine heart models have gained interest in preclinical myocardial research. In addition, extensive studies have shown that swine develop heart lesions similar to those in humans. They demonstrate intimal hyperplasia, necrosis, calcification, associated thrombus and ischemia induced dysfunction. The heart rate and developed pressures for the swine heart are similar to the human heart; therefore, conclusions drawn from the swine heart model for cardiac tissue engineering are likely to be clinically relevant in humans. Pigs are better for creating models of ischemic myocardium because they do not have pre-formed collateral blood vessels like dogs. Therefore, decreasing blood flow during exsanguination and explantation would more closely mimic that of the human heart.
The swine animal model has been used in a variety of cardiac tissue engineering studies. Watanabe et al., have found that FGF-2 administered with heparin in swine myocardium was the most effective method of enhancing angiogenesis as compared to FGF-2 alone, FGF-2 plus heparin sulfate, or FGF-2 coated heparin agarose beads [245].
154
6.2 Objective, hypothesis, and rationale
The objective of this chapter was to investigate the in vivo feasibility of select gels using two different studies. The first study evaluated the persistence of an injected gel in excised cardiac issue. The second study investigated two methods of creating an infarct in a pilot swine animal model: by ligating the LAD for to occlude blood flow, or by delivering a gelfoam material through a catheter to the LAD to occlude blood flow. The findings from this study provide a starting point to conduct a full animal study to test the injectable gels in vivo.
The first hypothesis is that collagen gels stained with trypan blue would be readily visible in cardiac tissue, both after fixation and after tissue embedding. Trypan blue was chosen as a stain because initial studies showed that it did not interfere with the gelation or injection processes. Visualization of the gel in cardiac tissue was important to determine the persistence of the injected gel. In an in vivo environment, many forces affect the degradability of an implanted scaffold, such as the pressure from the heart rate, blood flow, movement of the myocardium in the pericardial sac, and shear forces from pericardial fluid motion. Before implanting a scaffold in beating cardiac tissue, an ex vivo study to visualize the gel in cardiac tissue would be helpful.
The second hypothesis is that an MI can be created by an gelfoam occlusion delivered via catheter to the left anterior descending (LAD) artery that is accessed through the carotid artery. Furthermore, this method of producing an infarct is much easier than performing an open chest surgery, which can result in high mortality rates during surgery as well as adhesion during healing. Studies have shown that MIs can be induced in a variety of ways, including cryofreezing an area of the left ventricle, occluding the LAD for a certain amount of time, usually 60 seconds, or placing a polymer clot in the LAD to occlude blood flow. The results from this pilot study would provide a valid starting point for a full animal study to evaluate the injectable gels in vivo.
6.3 Methods and materials
6.3.1 Gel injections into ex vivo cardiac tissue
The in vivo feasibility of biopolymer gels was investigated by injecting collagen with genipin into an excised heart. The animal had been sacrificed and the heart was excised 1 hour after euthanization. The excised heart was immediately placed in PBS warmed to 37°C. A solution of collagen (0.2 wt%) with genipin (0.25-0.5 mM), mixed with 1% trypan blue (Gibco) was prepared and kept on ice until use. The gel was injected 25 times in volumes of 50 µL through a 23-gauge needle into various locations in the LV-free wall. The tissue was then incubated in PBS at 37°C for 1 hour.
155
6.3.2 Histological analysis
Cardiac tissue containing injections of collagen-genipin gel was fixed in 10% formalin for 48 hours and then processed for cryosectioning or paraffin-sectioning. For cryosections, the tissue samples were transferred to 12.5% sucrose for 24 hours, then 25% sucrose for another 24 hours before embedding in Tissue Tek O.C.T. freezing medium (Sakura Finetek, Torrance, CA), and cryosectioned into 30-µm slices. For paraffin-embedding, the tissue samples were serially dehydrated and embedded in paraffin before sectioning (6 µm). Representative sections were stained with H&E.
6.3.3 Pilot animal study
One female swine was used as a pilot animal to test two methods of inducing an MI and to obtain bone marrow-derived MSCs. The animal (40 kg) was anesthetized with IM Telazol (4-6 mg/kg) and Xylazine (2 mg/kg), intubated, and mechanically ventilated with 100% oxygen throughout the operation. Anesthesia was maintained with isoflurane (1-2%). The chest, neck, and bilateral groins were prepped and draped in a sterile fashion.
Marrow aspiration
Bone marrow aspirates were obtained from the left posterior iliac crest of the pigs at the surgical procedure for the induction of the infarct. After skin incision, penetration of the cortical bone was performed using a Jamshidi-Needle, 8 gauge x 10 cm long, for bone marrow aspiration. From each iliac crest, 1-3 mL of bone marrow will be aspirated into a 10 mL syringe already containing 5 mL of heparin (10 U/mL).
Method 1: Induction of the infarct via ligation of the LAD
Induction of the infarct can be conducted one of two ways: through ligation of the LAD or placing a Gelfoam occlusion in the LAD. In the first method, the animal was anesthetized with IM Telazol (4-6 mg/kg) and Xylazine (2 mg/kg), intubated, and mechanically ventilated with 100% oxygen throughout the operation. Anesthesia was maintained with isoflurane (1-2%). The chest, neck, and bilateral groins was prepped and draped in a sterile fashion. The femoral vein and artery was cannulated for IV access and blood pressure monitoring and KEG was continuously monitored using Powerlab software. Repeat transthoracic echocardiography was performed. The chest was opened through a left anteromedial thoracotomy with possible excision of 10 cm portion of the left third rib for exposure and the heart was suspended in a pericardial cradle. A tygon catheter (0.06 in inner diameter) was placed in the apex of the left ventricle, sutured and place, and used for LV pressure and blood gas monitoring. Furthermore, pH probes were placed on the apex and posterior ventricular for continuous pH monitoring intraoperatively. After stabilization, pH readings were recorded and probes removed. The left anterior descending (LAD) coronary artery was dissected free just distal to the first diagonal branch and isolated with a vessel loop. A brief occlusion of the coronary artery was performed to
156
identify the region to be rendered ischemic. A 15-minute stabilization period was allowed prior to baseline recordings of hemodynamics and regional cardiac function.
Lidocaine (2 mg/kg IV bolus, then 0.5 mg/min IV) was started and continued until the time of reperfusion. A 60-minute occlusion of the LAD was used to produce myocardial infarction. At the end of 60 minutes and after baseline recordings, the snare was released and reperfusion was visually confirmed. The chest was closed and a single mediastinal tube (18F) was placed to reestablish a negative intrapleural pressure and evacuate any remaining blood or irrigation solution. The inhaled anesthetic was then turned off, the animal extubated when appropriate, and allowed to recover. The chest tube was removed when there was no visible air leak or blood accumulation.
Method 2: Induction of the infarct via carotid artery
In the second method, the femoral vein and artery were cannulated for IV access, blood pressure was monitored using a percutaneous seldinger technique and the EKG was continuously monitored using Powerlab software. The animal was positioned under a C-arm and EKG leads and a pulse-oximeter was placed on the animal for initial monitoring. Both the right and left groin area were prepped using betadine and draped with sterile drapes. A right 6F femoral sheath was placed and secured using the Seldinger technique. At this point the arterial blood pressure was monitored through the sheath.
The carotid artery was accessed via a cut down and cannulated using a micropuncture kit for coronary angiography access and a 6F sheath is inserted as described in the literature [246-248]. A wire was then used to access the left coronary circulation and the LAD coronary artery was identified using angiography. A delivery of Gelfoam collagen, saline, and contrast (0.75 mL) and an embolic coil to the distal LAD occluded the vessel. A defibrillator and IV lidocaine was available at this point in the event of ventricular fibrillation. Coronary angiography was used to confirm occlusion of the vessel based on the appearance of “no-reflow.” At this point, the procedure was complete and all cannulae was removed with appropriate hemostasis. Once the animal was able to breathe on its own, it was extubated, femoral lines were removed, and it was prepared for recovery by giving appropriate doses of pain medication at regular intervals
6.4 Results
6.4.1 Gel injections into ex vivo cardiac tissue
Collagen-genipin gels (0.25-0.5 mM genipin) mixed with trypan blue appeared bright blue and gelled within 30 s upon warming to 37°, which is similar to the gelation process for non-stained gels (Figure 6-1A). Chilled solutions of Col-Gen gels were injected into various locations in the LV-free wall (Figure 6-1B, arrow). Immediately after injection, and before and after fixation in 10% formalin, the stained gels were visible in various locations in cardiac tissue (Figure 6-1C).

157
H&E staining of paraffin-embedded or cryo-sectioned samples did not reveal definitive areas with trypan blue-stained Col-Gen gels (Figure 6-1D,E). Additional samples in which holes were created in cardiac tissue using biopsy punches and filled with Col-Gen gels showed the evidence of the gel in the hole but not stained with trypan blue (not shown).
Figure 6-1 Col-Gen gels injected into ex vivo cardiac tissue: (A) Col-Gen gels dyed with trypan blue; (B) Gross view of cardiac muscle; (C) Gross view of fixed cardiac tissue; (D) H&E stained paraffin-
embedded section; (C) H&E stained cryosection.
6.4.2 Animal study
One pilot animal study was used to investigate two methods of creating an infarct through occlusion of the LAD coronary artery: through open heart surgery (Figure 6-2) and through a catheter delivery of a Gelfoam occlusion (Figure 6-3). Although both methods of infarct creation were successful, there were numerous problems associated with each method, which are discussed in the next section.

158
Figure 6-2 Induction of myocardial infarct in swine through ligation of the LAD coronary artery: (A) the third left rib was marked for left anteromedial thoracotomy; (B) cauterizers were used to cut through
muscle; (C) clamps were used to expose heart.
Figure 6-3 Induction of myocardial infarct in swine through occlusion of LAD coronary artery via Gelfoam delivery through catheter: (A) femoral vein and artery were cannulated; (B) animal was
positioned under a C-arm to identify the LAD coronary artery; (C) a delivery of Gelfoam, saline, and contrast was used to occlude the vessel
6.5 Discussion
6.5.1 Gel injections into ex vivo cardiac tissue
Trypan blue was chosen as a stain because initial studies showed that it did not interfere with the gelation or injection processes. The stain was visible immediately after injection, and before and after fixation in 10% formalin, but not in H&E stains of paraffin-embedded or cryosectioned samples. A few reasons could explain the lack of visibility. First, visualization of the trypan blue staining was difficult in the unstained sections. Furthermore, the sections were relatively thin: 6 µm for paraffin-embedded sections and 30 µm for cryosections. Second, the eosin staining might have masked the faint trypan blue staining. This observation was confirmed by pilot studies of H&E-stained collagen gels with trypan blue injected into a hole created by biopsy punch. Even though the collagen gel was clearly visible in stained sections, the gel stained pink with eosin instead of blue with trypan blue. Higher concentrations of trypan blue were tested but were shown to interfere with the gelation of the collagen gels. Future experiments should investigate the visualization of fluorescently labeled gels.
159
6.5.2 Methods of infarct creation
Two different methods of infarct creation in swine were investigated: ligation of the LAD through open heart surgery and occlusion of the LAD through a catheter delivery of Gelfoam collagen. Although both methods were successful in creating an infarct, various problems were encountered with each method.
With the LAD coronary artery ligation through open heart surgery, the surgical team first faced challenges accessing the heart and the LAD coronary artery. Even though clamps were used to pry back the ribs, only part of the heart and LAD coronary artery were visible during surgery. Furthermore, cauterization is an extremely invasive surgical method, with attending adhesion during healing, which could prevent re-access to the heart for scaffold placement or make it difficult to inject hydrogels into the cardiac muscle. Furthermore, this method of infarct creation has a 40% mortality rate in swine and is observed with a high rate of and life-threatening infections [13, 249, 250].
In the second method of infarct creation, the LAD coronary artery was occluded through a catheter delivery of Gelfoam. Swine that underwent this minimally invasive method of infarct creation have been observed with a lower mortality rate and infection compared to those that had open heart surgery [246]. Some of the challenges that the surgical team faced included the accurate positioning to get the catheter in the LAD artery, accidental infarct creation by maneuvering the catheter to the LAD artery, and accurate placement and mobilization of the Gelfoam collagen. In our pilot study, an infarct was inadvertently created during maneuvering the catheter to the correct position in the LAD coronary artery.
Future studies should focus on the development and refinement of surgical methodology to create a reproducible infarct in swine, by first focusing on the catheter delivery of Gelfoam.
6.5.3 Animal study
The following section describes the methodology for a swine animal study to evaluate pre-formed scaffolds and/or injectable gels in vivo, including pre-formed scaffold placement, hydrogel injection, functional evaluation, and eventual sacrifice of the animal.
Implantation surgery
Five weeks after angio-occlusion of the left circumflex, the same pig will be anesthetized with IM Telazol (4-6 mg/kg) and Xylazine (2 mg/kg), intubated, and mechanically ventilated with 100% oxygen throughout the operation. Anesthesia will be maintained with isoflurane (1-2%). The chest, neck, and bilateral groins will be prepped and draped in a sterile fashion. The femoral vein and artery will be cannulated for IV access and blood pressure monitoring and EKG will be continuously monitored using Powerlab software. Repeat transthoracic echocardiography will be performed in the manner described in the next section. The chest will
160
be opened through a left anteromedial thoracotomy with possible excision of 10 cm portion of the left third rib for exposure. Scar in the distribution of the circumflex artery will be identified and pH probes will be placed in the scar and posterior ventricular for continuous pH monitoring intraoperatively. After stabilization, pH readings will be recorded and probes removed. The collagen scaffold (+/- embedded cells) will then be placed on the scar and sutured in place to maintain contact using 5-0 absorbable suture in an interrupted fashion. The chest wall will be closed in standard fashion. The pig will be weaned from the ventilator and extubated for recovery with a predefined pain control regimen.
Injectable hydrogel delivery
Swine will be anesthetized with IM Telazol (4-6 mg/kg) and Xylazine (2 mg/kg), intubated, and mechanically ventilated with 100% oxygen throughout the operation. Anesthesia will be maintained with isoflurane (1-2%). The chest, neck, and bilateral groins will be prepped and draped in a sterile fashion. The femoral vein and artery will be cannulated for IV access and blood pressure monitoring and EKG will be continuously monitored using Powerlab software. A single injection of solubilized hydrogel (~100 µL) will be made directly into the LV free wall through a 30 gauge needle. The needle will be held at an angle to ensure injection into the free wall to reduce the possibility of injecting into the lumen. Injection will be confirmed by a lightening of the myocardium at the location of injection. The pig will be weaned from the ventilator and extubated for recovery with a predefined pain control regimen.
Sacrifice
Six weeks after the implantation procedure, the pig will be brought back to the operating room for a final operation. Preparation for the operation will be the same. The chest wall will be opened again through the prior incision. pH probes will be placed within the area of the scaffold and unaffected area as in previous operations. The pH data will be recorded, the probes removed and at this time the animal will be sacrificed. The heart will be excised and the area of interest will be prepared for histopathological evaluation.
Functional Evaluations: Echocardiography
Functional and structural cardiac assessment will be performed using transthoracic echocardiography: at the time of induction of the infarct; at the time of implantation of the scaffold, 5 weeks after induction of the infarct; and at sacrifice. A commercially available system (Vivid-I, General Electrics) with a 1.8-3.9 mHz phase array transducer will be used. The transducer will be placed on the chest wall and upper abdomen for image acquisition. Measurements will include standard linear dimensions of each heart chamber and pulsed and continuous wave trans-valvular Doppler imaging. Color speckled imaging from the parasternal and apical views will be recorded. Subsequent off-line analysis (EchoPac, Version 6.5) will be performed to determine left ventricular ejection fraction, end diastolic/systolic volumes (LVEDV/LVESV), left atrial volume, diastolic tissue velocities, and strain (radial,

161
circumferential, and longitudinal). Right ventricular assessment will include a measurement of fractional area change and tissue velocity.
6.6 Summary
We investigated the in vivo feasibility of collagen gels cross-linked with genipin. First, we found that stained collagen gels are visible when injected directly into ex vivo cardiac tissue, before and after fixation in 10% formalin, but not visible after H&E staining. Furthermore, we found two methods successful for creating an infarct in a swine animal model: ligating the LAD coronary artery through open heart surgery, and occlusion of the LAD coronary artery through a catheter delivery of Gelfoam collagen. Furthermore, we suggest methodology for the placement of pre-formed scaffolds, injectable hydrogels, as well as functional evaluation and eventual sacrifice of the animal. The results from this chapter provide a basis for an in vivo study to evaluate the effectiveness of pre-formed scaffolds and injectable hydrogels in a swine animal model.

162
163
Chapter 7 Limitations and future work
The work presented in this thesis shows significant promise for the use of simultaneously differentiated stem cells incorporated in various injectable biopolymer gels in cardiac tissue engineering. The following discussion describes various limitations to the work presented and identifies potential areas of research for further developing cell-incorporated gels in tissue engineering applications.
• Two limitations associated with the use of P19 ECCs for tissue engineering purposes were: 1) the inconsistent differentiation efficiency of EBs, and 2) the potential of ECCs to form teratomas.
o Differentiation efficiency quantified by % EBs and % Area per EB stained resulted in a wide range of differentiation efficiencies that made comparisons between groups challenging.
o Although embryonic cell types are attractive cell types for cell therapy, purification of differentiated cell populations must be conducted before the usage of these cells in in vivo applications.
• Another potential limitation was that MSCs were obtained from only one swine and two goats. For future developments, it is advantageous to use cells from multiple animals from different species to present more robust findings so that differences between experimental groups would not be exaggerated or muted, as is the potential case when using one animal.
Although the findings of this thesis demonstrates the potential of using certain cell-incorporated gels as minimally invasive delivery vehicles to deliver various cell populations for the enhancement of cardiac regeneration, below is a list of potential areas for the further development of cell-incorporated scaffolds or gels for cardiac tissue engineering:
• Collagen scaffold culture: o Culture of ECCs in collagen scaffolds of larger pore sizes o Semi-quantitative analysis such as RT-PCR or Western blot to compare
differentiation efficiency in monolayer, collagen scaffold, and injectable gels o Studies on MSCs’ ability to transdifferentiate into neural lineages using
molecular signaling and gene expression • Injectable gel characterization:
o Mechanical characterization: § Quantification of pore diameter to determine a relationship between
pore size, cross-linker concentration, and swelling ratio. § Other methods of accounting for adhesion during compression testing
such using mineral oil
164
§ A more accurate material characterization of collagen-genipin and Gtn-HPA gels as poroelastic or viscoelastic materials:
• Viscoelastic models: Maxwell model or the standard linear solid model and determine material constants viscoelasticity (η) and spring constant (k)
• Poroelastic models: Biot model to account for the movement of liquid throughout the collagen fibrils
• Models to account for the elasticity of collagen: developed by MacKintosh [189] and Morse [190] to describe chemically cross-linked networks or sterically entangled networks of semi-flexible polymers
o Imaging: § ESEM imaging of collagen-genipin and Gtn-HPA gels in a humidified,
low-pressure environment to prevent dehydration of the gels o Resistance to degradation:
§ A study to understand and isolate the effects of gel contraction and gel degradability by encapsulating MSCs in a non-degrading gel such as agarose or silicone.
§ A subcutaneous study to investigate collagen-genipin gels in a rat model to provide additional insight into gel behavior in vivo
o Cell behavior: § A study of the change in diameter profile of MSC-incorporated Gtn-
HPA gels at a lower polymer concentration to elucidate whether the Gtn material or stiffness is affecting the lack of change in diameter.
o TGase as a cross-linker: § Adequate processing and purification of TGase before usage as a
cross-linker. § Investigation on the physiologic conditions (such as temperature and
pH) of Col-TGase thermo-gelling. § Investigation of mammalian TGase as another source of TGase [174].
• Co-differentiation studies: o Optimization of differentiation medium to achieve highest differentiation
efficiency § Selection of sub populations of differentiated cells § Sub-cloning MSCs to obtain a more purified MSC population [94]
o Culture of EBs in a wider range of stiffnesses to elucidate the effect of stiffness on spontaneous beating, and cardiac, neural and endothelial marker expression

165
o Culture of EBs at earlier time points (before 7 days) to reveal an effect of culture time on cardiac, neural, and endothelial differentiation in terms of % EBs and % Area stained
o A larger sample size and a broader range of stiffnesses for Gtn-HPA gels to elucidate the effect of stiffness on TUJ1 expression
• In vivo evaluation o Evaluation of the cell-incorporated gels in an in vivo model. Chapter 6
describes a swine animal model for testing.

166

167
Chapter 8 Conclusions
This thesis supports several conclusions. First, ECCs cultured in collagen scaffolds produced smaller EBs with decreased differentiation efficiency into cardiac, neural, and endothelial lineages compared to those cultured in monolayer. Second, investigation of ECCs in a well-defined chondrogenesis assay for MSCs revealed that under particular culture conditions, MSCs appear to be superior over ECCs for cartilage regeneration. This thesis describes the first report of α-SMA expression of an embryonic stem cell type. Even though both MSCs and ECCs express α-SMA, only MSCs exhibit condensation and contraction necessary for cartilage histogenesis.
Characterization of injectable gels revealed that collagen gels without genipin were found to be the closest match to the benchmark material of cardiac jelly on the basis of mechanical and degradation properties. However, as the most compliant material investigated in this study, collagen-only gels were the most difficult to handle and thus provided motivation for the investigation of cross-linkers to bolster its mechanical properties.
Genipin is an effective cross-linker of collagen in which 0.25 mM genipin increases compression modulus (E) 2-fold and plateau shear storage modulus (G’) 3-fold compared to those of non-cross-linked collagen gels, while maintaining cell viability and allowing cell proliferation. Furthermore, maturation time and genipin cross-linker concentration had a significant effect on the gel’s resistance to enzymatic degradation. The gelation properties including gel time and modulus of the Gtn-HPA gel system can be modulated by HRP and H2O2. Furthermore, H2O2 cross-linker concentration was found to have a significant effect on the gels’ resistance to enzymatic degradation.
ECCs cultured as EBs were incorporated in select gel types including collagen-only gels, collagen cross-linked with 0.25 mM genipin, and Gtn-HPA gels of two stiffnesses. It was found that EBs cultured in mixed medium conditions can express cardiac, neural, and endothelial markers in all gel types. Specifically, EBs cultured collagen gels without genipin displayed the highest differentiation efficiency for cardiac markers compared to those cultured in collagen-genipin gels and Gtn-HPA gels. Furthermore, EBs cultured in collagen gels without any cross-linker and those with 0.25 mM genipin displayed the highest differentiation efficiency for neural and endothelial markers compared to those cultured in Gtn-HPA gels. Notable findings included: the increased expression of neural and endothelial markers in EBs cultured in in mixed medium conditions compared to those cultured in neural or endothelial differentiation medium alone, and the correlation between angiogenic and neurogenic differentiation in the EBs in the non-cross-linked collagen gels for all media. Collectively, these findings show promise in using collagen gels cross-linked with 0.25 mM genipin, incorporated with EBs, for cellular therapy in cardiac tissue engineering applications.

168
Future work should focus on optimization of mixed medium conditions to yield better differentiated (more mature) cardiac, neural, and endothelial constructs. Furthermore, an in vivo investigation of these EB-incorporated gels would reveal the persistence of the gel and its possible integration with native cardiac tissue.
169
Chapter 9 Appendix
The following appendices include additional results that supplement the main text of the thesis and current protocols used in this thesis work.
9.1 Cell culture protocols
9.1.1 Freezing cells
Materials:
• Complete Medium • DMSO (Dimethyl sulfoxide) • Sterile Filter • Pipettes • Sterile cryogenic tubes
Methods:
1. Determine amount of medium needed (1 mL per 2 x 10⁶ cells) 2. Prepare solution of 10% DMSO in complete medium.
a. Sterilize the medium + DMSO solution by filtering through 0.45 µm sterile filter, or by autoclaving DMSO prior to adding it to the medium.
3. Adjust cell concentration to 2 x 10⁶ cells/mL of complete medium + DMSO solution. 4. Store in cryogenic tubes (3 mL per 5 mL tube, 1 mL per 2 mL tube) in the -20°C freezer
for 2-4 hours (longer time in this range is preferable), then transfer to -70°C for storage.
9.1.2 Thawing cells
Materials:
• Complete medium • Tissue culture flasks • Aspirating pipettes • Vacuum suction • Flame • Sterile pipettes • Pipette Aid • 15 ml tubes
Methods:
170
1. Place cells directly into a 37°C water bath. Agitate gingerly while cells thaw for 40-60 seconds.
2. When defrosted minimally (see liquid around outer edges) add a drop of complete medium.
3. Wait a minute and add another drop of medium. Repeat until tube is full. This insures that the cells thaw into the medium.
4. Transfer the cells to a 50 ml tube and wash them clean of medium+DMSO for 10 minutes in the centrifuge.
5. Count the cells, and resuspend at the proper concentration. Cells should be cultured at least 3-4 days before being used for experimentation (or before changing medium, depending on when they attach).
9.1.3 Changing media
Materials:
• Complete Medium • Pipettes • Flame • Vacuum Pipettes • Vacuum setup
Methods:
1. Remove the medium from the culture dishes or flasks using the glass vacuum pipettes (use long pipettes for flasks, short pipettes for well plates). Make sure to use a new pipette for each sample from different animals. You can also remove media with the plastic sterile pipettes if you have only a few samples and empty the spent media into a beaker or bottle – clean with bleach afterwards.
2. Replace the media according to the type of culture dish you are using.* You can use the same pipette as long as you do not touch the flasks. If you think you might have contaminated it at all, use a new one. Be sure to switch pipettes for samples from different animals.
3. Quickly flame caps and lids before putting them back on to ensure they remain sterile.
*Amounts of media to add to dishes
• 75 cm2 flasks – 15 ml • 25 cm2 flasks – 5 ml • 6 well plate – 2 ml per well (less if using agarose-coated plates)

171
Amounts can change depending on type of cells and desired culture conditions. If you are changing media for someone and you do not know how much they added, draw up the medium in the flask with a plastic pipette to measure it first.
9.1.4 Passaging cells
Materials:
• Complete medium • Trypsin • PBS (Phosphate-buffered saline) • Glass pipettes • Vacuum setup • Sterile plastic pipettes • Centrifuge tubes • Tube holders • Tissue culture flasks
Methods:
1. Warm the medium, trypsin, and PBS in 37°C water bath. 2. Remove medium from flasks with vacuum pipette (change pipettes for different animals). 3. Rinse with PBS (enough to cover bottom of flask, ~ 10 ml for 75 cm2 flask).
Trypsin will not detach the cells if it has come into contact with the medium. 4. Remove PBS and add trypsin (0.5 ml per well of 6 well plate, 2 ml for 25 cm2 flask, 5 ml
for 75 cm2 flask). 5. Place in incubator for 5 minutes (unless otherwise instructed). 6. Remove from incubator and tap on the sides of the flask to loosen the cells. Check under
microscope to ensure the cells are no longer attached. If they are, return them to the incubator and check each minute until they are unattached.
7. Once the cells are floating, return to the hood and add complete medium to inactivate the trypsin (1.5 ml per well of 6 well plate, 3 ml for 25 cm2 flask, 10 ml for 75 cm2 flask).
8. Using a sterile plastic pipette, transfer the medium/trypsin/cell suspension to a centrifuge tube. At this point you can combine the contents of the flasks if they are from the same sample.
9. Balance the tubes and centrifuge at 1500 rpm for 10 minutes. 10. Once you have the cell pellet at the bottom of the tube, draw off the medium with the
vacuum pipette (be sure not to suck up the cells!!!). 11. Resuspend and count the cells (see Cell Counting protocol, 9.1.5). While counting,
centrifuge the cell suspension a second time to ensure all trypsin has been removed.

172
12. Decant medium from second centrifugation and resuspend at desired seeding density. Transfer to culture flasks and add complete medium to bring the flasks up to final volume.
9.1.5 Counting cells
Adapted from Current Protocols in Cell Biology Online 2001 John Wiley & Sons, Inc.
Materials:
• Complete medium • Pipette Aid • 70% ethanol • Trypan Blue • Micropipetters • Calculator • Cell counting slide • Pipette tips • Cell counter
Methods:
1. Clean surface of hemacytometer and coverslip with 70% alcohol.
2. (Optional) Wet edge of coverslip slightly with tap water and press over grooves on hemacytometer. The coverslip should rest evenly over the silver counting area.
3. Beginning with a cell pellet, suspend the cells in a known amount of complete medium
4. Collect a 100 µl sample from the cell suspension and dilute with trypan blue (1:2 dilution if few cells are expected, 1:5 or 1:10 if a large number is expected).
5. Mix well, and collect 15 µl of suspension in a micropipette tip.
6. Load the cell suspension into the hemacytometer, allowing it to be drawn under the coverslip by capillary action. Load just enough cell suspension to reach the edges of the silvered surface. Do not overfill as this may change the volume and make the count inaccurate.
7. Place hemacytometer (Figure 9-1) on microscope stage, remove yellow glass filter, and view with standard 10x objective.
8. Count cells in each of the four corner and central squares (clear cells are viable, stained cells are dead). Count cells that lie on the top and left lines but not those on the bottom or right lines of each square in order to avoid counting the same cells twice for adjacent squares. Repeat counts for other counting chamber. A maximum cell count of 20 to 50 cells per 1x1-mm square is recommended. When a count of living cells is complete, count the number of dead cells in order to report viability.

173
9. Calculate total cell number from the following:
! =!!!!×!×10!×!
T = Total number of cells in suspension
NC = Number of cells counted.
NS = Number of squares counted.
D = Dilution factor
V = Volume of media used to suspend cell pellet.
The number 104 is the volume correction factor for the hemacytometer: each square is 1x1 mm and the depth is 0.1 mm.
10. Begin preparing samples for culturing and/or protein extraction
Figure 9-1 Hemacytometer

174
9.2 Scaffold fabrication protocols
9.2.1 Collagen slurry preparation
For collagen (porcine I/III) slurry (1%)
Materials:
• HCl (6N) • Biogide Powder • dH2O • ice
Equipment:
• 1 Beaker (250mL) • 1 Stir bar • Pipette • Micropipette • pH-meter • Spatula • Blender
Methods:
Be sure to clean equipment before use
1. Prepare 200ml HCl solution at 0.001N a. Add 50ul of 6N HCl to 3ml dH20 to make 0.1N HCl b. Add 2ml of 0.1N HCl to 198ml dH2O to make 0.001N HCl c. Stir d. Adjust pH=3 in adding drops 6N HCl
2. Add progressively 2g Biogide collagen powder while stirring a. Add 100ul 6N HCl to adjust pH=3
3. Blend at 15,000 rpm for 90 min (Turn on blender an hour in advance or add ice to expedite cooling to 4°C) Remove stir bar
4. Add 50ul 6N HCl to adjust pH=3 5. Blend at 15,000rpm for 90 min (same as #3) 6. Place in four 50ml tubes 7. Spin at 1500 rpm for 20 min to degas 8. Remove bubbles on top with spatula 9. Store in fridge (4°C)

175
10. Pour 16 mL in plastic mold
9.2.2 Virteous freeze-drying “ramp” protocol
1. The ramp program used for freeze-drying a collagen slurry consists of a hold at 20°C for 5 minutes, ramp down to -40°C over 65 minutes (fastest cooling time when actual time is set for 15min), and held at -40°C for a minimum of 60 min (set time for this step is longer than 60 minutes)
Auto set program reads: Step 1 T = 20 t = 5 Hold
Step 2 T = -15 t = 15 Ramp
Step 3 T = -40 t = 165 Hold
2. Press auto switch off, turn on heater and freezer switches, and set temperature to -15°C 3. Make sure chamber release button is off and turn on the vacuum. Press door shut while
vacuum is being pulled until a sufficient seal is produced 4. Once vacuum is below 200 mTorr (~ 30 min), set the temp to 0°C. Leave overnight or at
least 12 hours for sublimation 5. Set temp to 20°C and turn off freeze button 6. When freezer is at 20°C, turn off the heat, vacuum, and condenser buttons. Release the
chamber and drain the condenser chamber. After defrosting, chamber and condenser should be wiped dry.
9.2.3 Dehydrothermal treatment
To physically cross-link and sterilize scaffolds
1. Place scaffolds in aluminum foil bags (do not seal completely) 2. Place foil bags in a furnace of 105ºC and apply 1 mm Hg vacuum for 24 h
Use biopsy punches to cut 8 mm diameter disks (or any other diameter) of collagen scaffolds
9.2.4 Cross-linking collagen scaffolds by carbodiimide treatment
Summary:
“Contrary to the use of bifunctional reagents like GA (gluteraldehyde), [carboxylic acid activation] methods do not result in the incorporation of cross-linking agents in the material…Cross-linking using [EDAC] involves the activation of the carboxylic acid groups of
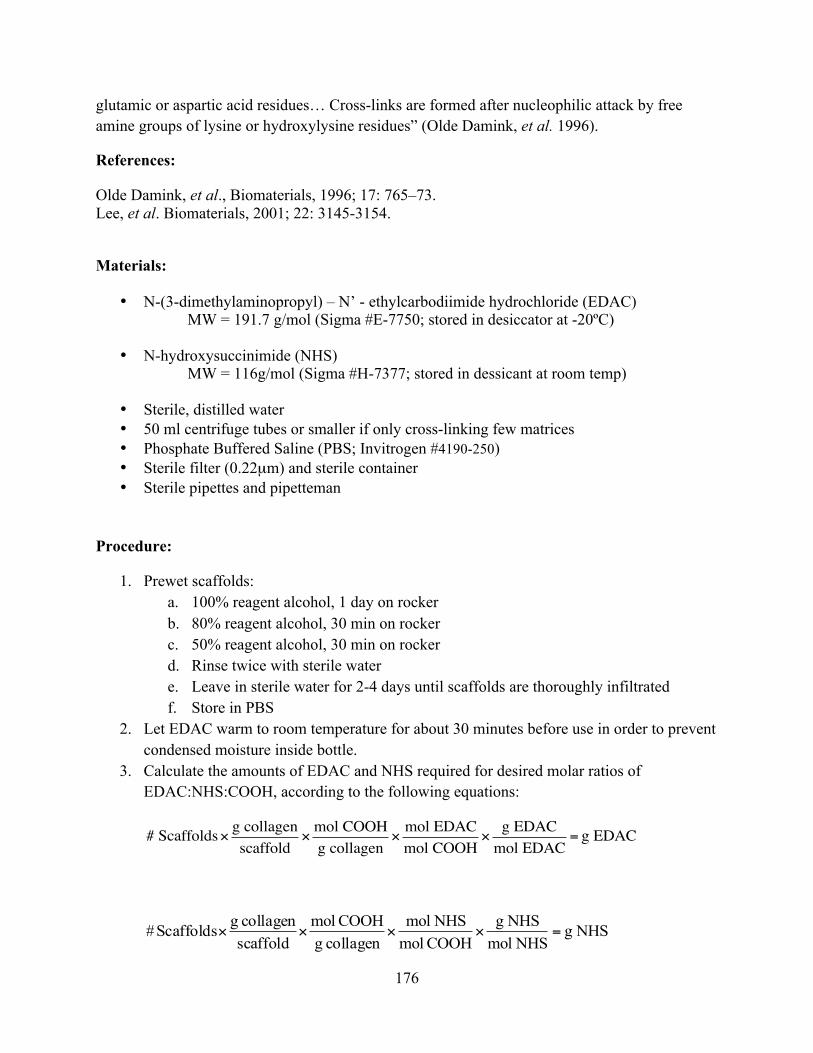
176
glutamic or aspartic acid residues… Cross-links are formed after nucleophilic attack by free amine groups of lysine or hydroxylysine residues” (Olde Damink, et al. 1996).
References:
Olde Damink, et al., Biomaterials, 1996; 17: 765–73. Lee, et al. Biomaterials, 2001; 22: 3145-3154.
Materials:
• N-(3-dimethylaminopropyl) – N’ - ethylcarbodiimide hydrochloride (EDAC) MW = 191.7 g/mol (Sigma #E-7750; stored in desiccator at -20ºC)
• N-hydroxysuccinimide (NHS) MW = 116g/mol (Sigma #H-7377; stored in dessicant at room temp)
• Sterile, distilled water • 50 ml centrifuge tubes or smaller if only cross-linking few matrices • Phosphate Buffered Saline (PBS; Invitrogen #4190-250) • Sterile filter (0.22µm) and sterile container • Sterile pipettes and pipetteman
Procedure:
1. Prewet scaffolds: a. 100% reagent alcohol, 1 day on rocker b. 80% reagent alcohol, 30 min on rocker c. 50% reagent alcohol, 30 min on rocker d. Rinse twice with sterile water e. Leave in sterile water for 2-4 days until scaffolds are thoroughly infiltrated f. Store in PBS
2. Let EDAC warm to room temperature for about 30 minutes before use in order to prevent condensed moisture inside bottle.
3. Calculate the amounts of EDAC and NHS required for desired molar ratios of EDAC:NHS:COOH, according to the following equations:
# Scaffolds! g collagenscaffold
!mol COOHg collagen
!mol EDACmol COOH
!g EDAC
mol EDAC= g EDAC
NHS gNHS mol
NHS gCOOH molNHS mol
collagen gCOOH mol
scaffoldcollagen gScaffolds # =××××

177
Notes: We make the assumptions that the scaffolds are primarily collagen (i.e., the mass of other components is negligible), and that there are 1.2mmol COOH per mole of collagen (see Olde Damink). Typical values for mass of 8mm scaffolds is 2-3 mg.
Typical calculations for molar ratios of 5:2:1 would be as follows:
EDAC 0.115gEDAC mol
EDAC 191.7g
COOH mol 1
EDAC mol 5
collagen g
COOH 0.0012mol
scaffold
collagen 0.002gscaffolds 50 =××××
NHS 0.0278gNHSC mol
NHS 116g
COOH mol 1
NHS mol 2
collagen g
COOH 0.0012mol
scaffold
collagen 0.002gscaffolds 50 =××××
Notes: The amounts of EDAC and NHS required are frequently very small and difficult to weigh out, especially when only a small number of scaffolds are required. It is often easier to weigh out a larger amount of the chemicals, dissolve in dH2O, and dilute to the desired concentration.
4. Dissolve EDAC and NHS in dH2O. The final volumes should be 1ml solution per scaffold.
5. Sterile filter EDAC/NHS solutions into sterile containers.
6. Transfer hydrated matrices to EDAC/NHS solutions. Hydrated scaffolds will retain a small volume of water within the pores, which will cause the final concentration of the EDAC/NHS solution to be very slightly diluted. If this is a concern, hydrate the scaffolds in half of the final volume (i.e. 0.5ml dH2O per scaffold), prepare the EDAC/NHS solution at 2X the final desired concentration, and add the solution directly to the water in which the scaffolds being hydrated.
7. Pipette solution over matrices to ensure good mixture.
8. Cross-link at room temperature for desired time (usually 30 minutes).
9. After cross-linking, transfer matrices to 50ml centrifuge tubes. Rinse matrices in sterile PBS. Pipette out PBS and put fresh PBS and allow removal of residual NHS/EDAC solution by rocking for about 1 hour.

178
10. Remove PBS and rinse in sterile dH20 for 10 minutes twice.
11. Store matrices in sterile dH20 at 4°C for up to one week (effects of longer storage unknown, usually used within 1 days of cross-linking).

179
9.3 Cell-seeded collagen scaffold protocols
9.3.1 Agarose coating of well-plates
Agarose coating prevents cells from attaching and growing on the bottom of well-plates Each well of 12-well plates is to be coated with 1.5 ml of liquid agarose. Prepare 10-15 ml more solution than you will need.
Materials:
Seaplaque agarose (#50100, Cambrex)
Distilled water
Protocol:
1. Choose a flask that is ~5x the volume of the solution. (ex. 500 ml flask for 100 ml
solution)
2. Add agarose powder to room temperature distilled water (Use 1 g Seaplaque agarose per
25 ml of distilled water (i.e. 4% Agarose) )
3. Cover top of flask (loosely) with aluminum foil and swirl solution to mix
4. Autoclave solution (added water to autoclave bin) and set to Liquid #2
5. After autoclave cycle is done (need to open door 1” for 10 min) remove flask and cool
the solution to 50°C-60°C (keep solution sterile)
6. In sterile hood, coat the 12-well plates with 1.5 ml of the liquid agarose for each well.
This should be done rather quickly as the agarose will solidify as it cools. If the agarose
solidifies within the flask, microwave briefly to re-melt.
7. Place well-plates in a sterile bag
8. Place the bag in a cold room overnight. Do not use the plates after more than 1 day in the
cold room because the agarose will crack.
9. Warm the plates 1-2 hour in the incubator prior to use
10. Change agarose-coated well plates every two weeks because the agarose breaks down.
11. Clean flask of excess agarose solution by adding cold water – swirling around – and
pouring onto paper filter to keep agarose gel from going down the drain.

180
9.3.2 Seeding collagen scaffolds
1. Place scaffold on agarose-coated well-plate 2. Use sterilized filter paper and tweezers to blot the scaffold and remove excess moisture 3. Add 20 µl of cell suspension to one side of the scaffold 4. Wait 30 minutes 5. Flip scaffold over and add 20 µl of cell suspension to the other side of the scaffold 6. Wait 30 minutes 7. Add media and incubate at 37ºC 8. Change media every 2-3 days
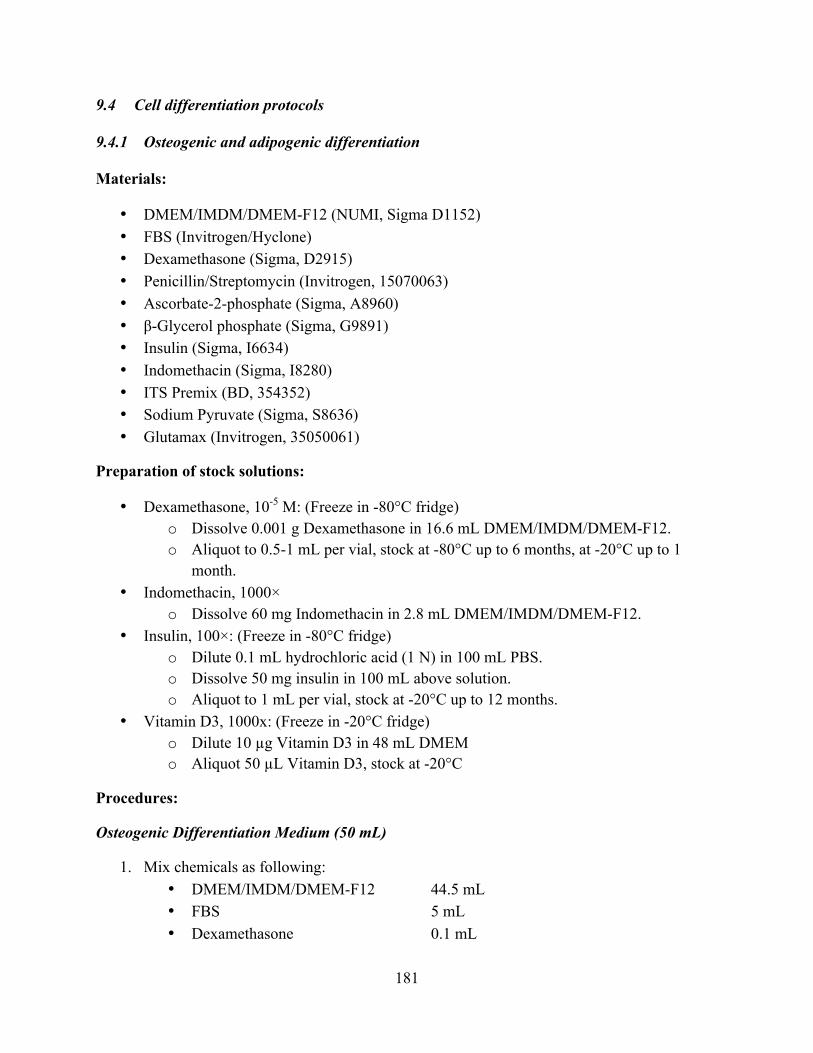
181
9.4 Cell differentiation protocols
9.4.1 Osteogenic and adipogenic differentiation
Materials:
• DMEM/IMDM/DMEM-F12 (NUMI, Sigma D1152) • FBS (Invitrogen/Hyclone) • Dexamethasone (Sigma, D2915) • Penicillin/Streptomycin (Invitrogen, 15070063) • Ascorbate-2-phosphate (Sigma, A8960) • β-Glycerol phosphate (Sigma, G9891) • Insulin (Sigma, I6634) • Indomethacin (Sigma, I8280) • ITS Premix (BD, 354352) • Sodium Pyruvate (Sigma, S8636) • Glutamax (Invitrogen, 35050061)
Preparation of stock solutions:
• Dexamethasone, 10-5 M: (Freeze in -80°C fridge) o Dissolve 0.001 g Dexamethasone in 16.6 mL DMEM/IMDM/DMEM-F12. o Aliquot to 0.5-1 mL per vial, stock at -80°C up to 6 months, at -20°C up to 1
month. • Indomethacin, 1000×
o Dissolve 60 mg Indomethacin in 2.8 mL DMEM/IMDM/DMEM-F12. • Insulin, 100×: (Freeze in -80°C fridge)
o Dilute 0.1 mL hydrochloric acid (1 N) in 100 mL PBS. o Dissolve 50 mg insulin in 100 mL above solution. o Aliquot to 1 mL per vial, stock at -20°C up to 12 months.
• Vitamin D3, 1000x: (Freeze in -20°C fridge) o Dilute 10 µg Vitamin D3 in 48 mL DMEM o Aliquot 50 µL Vitamin D3, stock at -20°C
Procedures:
Osteogenic Differentiation Medium (50 mL)
1. Mix chemicals as following: • DMEM/IMDM/DMEM-F12 44.5 mL • FBS 5 mL • Dexamethasone 0.1 mL

182
• Ascorbate-2-phosphate 5 mg • β-Glycerol phosphate 216 mg • Vitamin D3 50 µL
2. Filter with syringe filter, store at 4°C up to 1 week.
Adipogenic Differentiation Medium (50 mL)
1. Mix chemicals as following • DMEM/IMDM/DMEM-F12 43.4 mL • FBS 5 mL • Dexamethasone 0.5 mL • Indomethacin 0.05 mL • Insulin 0.5 mL • 3-Isobutyl-methyl xanthine 0.5mL
2. Filter with syringe filter, store at 4°C up to 1 week.
9.4.2 Chondrogenic differentiation
(Modified protocol from Jakob et. al, J Cell Biochem 2001;81(2):368- 77)
J-base medium:
• 500 ml HG-DMEM (full bottle) • 5.3 ml MEM Nonessential Amino Acids (NEAA) • 5.3 ml HEPES Buffer • 5.3 ml PSG (penicillin, streptomycin and glutamate)
* J-base medium is the base medium used for making both expansion and serum-free medium
SF-base:
• J-base medium (515 mL) • ITS +1 (Sigma) (5 mL) • BSA (7.5%) (Invitrogen) (9 mL)
3-D Chondrogenic Medium:
• SF-base (535 mL) • TGF-β1 (240-B-002) (R&D Systems) (10 ng/mL)
o Add 10µl stock per 1ml media • Dexamethasone (Sigma) (100 nM)
o Add 10 µl stock per 1 ml media

183
• L-Ascorbic acid 2-phosphate (Wako) (0.1 mM) o Add 10µl stock per 1 ml media
Reconstitution of Growth Factors:
TFG-β1 (R&D 240-B-002-CF, Recombinant Human)
“Purified recombinant human TGF-β1 is an extremely hydrophobic protein that adheres strongly to surfaces. To ensure recovery, lyophilized samples should be reconstituted with sterile 4mM HCl containing 1mg/ml BSA to a final TGF-β1 concentration of no less than 1µg/ml.
For 10 µg of TGF-β1:
• Make 0.1N HCl (add 0.5ml of stock 12.1N HCl to 60.5ml dH2O) • Make desired amt. of 4mM HCl (ex. 0.5ml of 0.1N HCl to 12ml dH2O) • Add 166.5ul of (7.5% g/ml) BSA solution to 12.3 ml 4mM HCl. • Vortex and sterile filter into a 15 ml Falcon tube. • Add 1 ml of the above solution to the TGF vial and vortex. • Put in 15 ml Falcon tube • Rinse vial with more solution • 10ml of 4mM HCL+BSA to 10µg TGF-β1 for stock concentration of 1µg/ml. • Aliquot in sterile microtubes and store at -70°C up to 3 months. Avoid
repeated freezing.
Supplements:
Dexamethasone (Dex: Sigma, water soluble)
There is ~65mg dexamethasone per gram of powder; MW of dexamethasone = 392.5g/mol
• Make 10-3 M dexamethasone stock solution. Store for 1 year at -20°C. o Add 6.03mg Dex. powder to 1ml of 100% ethanol.
• Make 10-5 M dexamethasone stock solution in low-glucose (LG) DMEM. o Add 20µl of 10-3 M Dex. stock to 1.98ml LG-DMEM.
• Aliquot and store at -20°C.
L-Ascorbic acid 2-Phosphate
10µl of a 1/100 dilution of ascorbate 2-phosphate (MW = 289.54g/mol)
• Add 37.5 mg ascorbate 2-phosphate + 10 ml Tyrodes solution (Sigma) • Filter sterilize 0.22µm and store at -20°C in 2 ml aliquots

184
9.4.3 Pellet assay for chondrogenic differentiation
1. Make serum-free medium (add supplement right before you need it)
2. Count cells
a. Pipet 1.2x10⁶ cells total for six tubes of pellets with 200,000 cells/tube into a
15mL tube
b. Spin down at 1500 rpm for 10 minutes
c. (At this time, thaw the supplements to make chondrogenic media)
d. Remove media
e. Resuspend cells in 3mL (to be safe, use 3.25mL)
3. For each individual, 6 aliquots of 2x10⁵ cells in 0.5mL media are transferred into 15ml
conical polypropylene tubes (BD Falcon)
4. Spin at 1500 rpm (375g) for 10 minutes and culture at 37°C in 5% CO2
*(Make sure the caps are loosened!!)
5. Save the 1st pellet
a. Wash in PBS (spin down) and freeze for DNA/GAG.
6. Media is changed three times a week: M, W, F, M, W, F (end)
7. After 14 days of chondrogenic differentiation
a. Wash 2 pellets with PBS and freeze for DNA/GAG and Type II Collagen Assay.
b. Fix 3 pellets for 3 hours in 1ml of 4% paraformaldehyde.
i. Following dehydration, three pellets of each animal are embedded in
paraffin (17 days in tissue processor) and serially sectioned at 6µm.
ii. Stain with H&E and SafO.
9.4.4 Cardiac, neural, and endothelial differentiation
1. P19 cells in culture are washed and detached using trypsin/EDTA (add 1 mL of trypsin to
a 5 mL flask -> 5 mL trypsin to T-75) using standard procedure
2. Resuspend the cells in our cardiac medium or induction medium (alpha-MEM with 10%
fetal calf serum +/- 0.5% DMSO) at 105 cells/mL (total 5 mL)

185
3. Plate the cells in non-treated culture Petri plates (bacterial grade) at 20 mL cell
suspension/plate
4. Cells will adhere to each other and form small aggregates
5. After 2 days collect the aggregates with gentle centrifugation and wash them 2x with
complete medium. (You may have to use PBS/1 mM EDTA to detach the aggregates, or
gentle shaking may suffice.)
6. Transfer the aggregates to bacterial plates containing complete medium (cardiac or
induction medium?) as in 2.
7. Continue the culture for 3 days in the presence of absence of DMSO
8. Transfer the cell suspension (aggregates) to tissue culture grade Petri plates (as in 5).
9. In absence of DMSO, the plated aggregates will remain as undifferentiated ECCs along
with small number of embryonic endodermal cells.
10. In the presence of DMSO, aggregates (all ECCs) plated onto tissue culture plates will
differentiate into cardiac myocytes, demonstrating rhythmic contraction (we hope).
11. By 10-12 days the amount of contracting myocytes should increase. Some areas should
develop bipolar myoblasts that may fuse into non-contracting myotubes, but that can
develop spontaneous twitching activity (by day 14).
12. Feed them every three days.
Expansion media:
• Pig and Goat MSCs: LG-DMEM, 10% FBS, 1% PS
LG-DMEM 450 mL
FBS 45 mL
PS 5 mL
• P19 Mouse ECCs: Alpha-MEM, 7.5% NCS, 2.5% FBS, 1% PS
Alpha-MEM 450 mL
NCS 37.5 mL
FBS 12.5 mL
PS 5 mL

186
Cardiac differentiation
• Pig, Goat MSCs, and P19 Mouse ECCs Cardiac Induction Media: Expansion media, 10 µM 5-azacytidine
For 10 µM 5-azacytidine
Expansion media 100 mL 200 mL 350 mL
1 mM 5-aza 1 mL 2 mL 3.5 mL
For 2 µM 5-azacytidine:
Expansion media 100 mL 200 mL
1 mM 5-aza 0.2 mL 0.4 mL
• P19 Mouse ECC Cardiac Post-Induction Media: Alpha-MEM, 10% FBS, 1% PS Alpha MEM
Alpha-MEM: 450 mL
FBS 45 mL
PS 5 mL
• P19 Mouse ECC Cardiac Induction Media (for EB Formation): Post-Induction Media + 1% DMSO
Post-Induction media 39.2 mL 49 mL
PS 400 µL 500 µL
DMSO 400 µL 500 µL
Neural differentiation
• Pig and Goat MSC Neural Pre-induction Media (first 24 hour): Expansion media + 1 mM BME
Expansion Media 100 mL 500 mL

187
BME (Stored at RT) 7 µL 35 µL
• Pig and Goat MSC Neural Induction Media: LG-DMEM, 1% PS, 1 mM BME
LG-DMEM 495 mL or 100 mL
PS 5 mL or 1 mL
BME (Stored at RT) 35 µL or 7 µL
• Pig and Goat MSC Neural Media (Woodbury et al., 2000)
LG-DMEM 20 mL
2% DMSO (sterile filter prior to use) 0.4 mL
200 µM Butylated hydroxyanisole 20 µL
10 µM Forskolin 20 µL
1 µM Hydrocortisone 20 µL
5 µg/mL insulin 50 µL
25 mM KCl 300 µL
2 mM Valproic acid 200 µL
• P19 Mouse ECC Neural Induction Media (for EB-formation and monolayer afterwards): Post-Induction Media + 10-7 M RA
Post-Induction Media 100 mL 50 mL
RA (10-2 M, in -20ºC) 1 µL 0.5 µL
Endothelial Differentiation
• Pig and Goat MSC Endothelial Induction Media: LG-DMEM, 2% PBS, 1% PS, 50 ng/mL VEGF
LG-DMEM 485 mL

188
PBS 10 mL
PS 5 mL
VEGF (for 50 ng/mL) 2.5 mL (entire 25 µg bottle)
(add 5 µL of stock (10 µg/mL, -80ºC) to every 1 mL of media)
• P19 Mouse ECC Endothelial Induction Media: post-induction media + 20 ng/mL of VEGF + 1% DMSO
Post-induction media 49.4 mL
DMSO 500 µL
VEGF (for 20 ng/mL): 100 µL
(add 2 µL of stock (10 µg/mL, -80ºC) to every 1 mL of media)

189
9.5 Hydrogel preparation protocols
9.5.1 Collagen-genipin gels
1. Put NaOH, collagen stock, and PBS on ice 3. Add 1 M NaOH to 1x PBS in a falcon tube that can contain total volume 4. Add media 5. Add collagen stock 6. Put on ice 7. Remove media from EBs, wash with PBS, and resuspend EBs in 1.5 ml media 8. Add 1.5 ml cell suspension to collagen mixture and quickly pipet 0.5 ml into each well of
24-well plates (should have 60 wells) 9. Place in 37°C incubator for 1-2 hours to allow gelation 10. For 24-well plates, loosen the gel by running a spatula or flat tweezers along the walls of
the well. Add 0.5 – 1 ml media. 11. Incubate at 37°C
Reagents used to prepare 2 mg/mL collagen-genipin gels
Final Genipin concentration 0 mM 0.25 mM 0.5 mM 1 mM 2 mM Pre-cell volume 12.5 ml 12.5 ml 12.5 ml 12.5 ml 12.5 ml PBS (5x) 1.74 ml 1.3 ml 1.085 ml 0.87 ml 0 ml Media 3.58 ml 3.58 ml 3.58 ml 3.58 ml 3.58 ml Genipin in 5x PBS (16.85 mM, 3.805 mg/ml)
0 ml 0.217 ml 0.434 ml 0.867 ml 1.73 ml
1 N NaOH 0.149 ml 0.149 ml 0.149 ml 0.149 ml 0.149 ml Collagen stock (3.75 mg/ml) 6.93 ml 6.93 ml 6.93 ml 6.93 ml 6.93 ml Cell suspension (2.6 x 10⁶ cells per 0.5 ml)
0.5 ml 0.5 ml 0.5 ml 0.5 ml 0.5 ml
Total volume 13 ml 13 ml 13 ml 13 ml 13 ml
9.5.2 Collagen-transglutaminase gels
1. Put NaOH, collagen stock, and PBS on ice 2. Add 1 M NaOH to 1x PBS in a falcon tube that can contain total volume 3. Add media 4. Add collagen stock 5. Put on ice 6. Remove media from EBs, wash with PBS, and resuspend EBs in 1.5 ml media 7. Add 1.5 ml cell suspension to collagen mixture and quickly pipet 0.5 ml into each well of
24-well plates (should have 60 wells) 8. Place in 37°C incubator for 1-2 hours to allow gelation
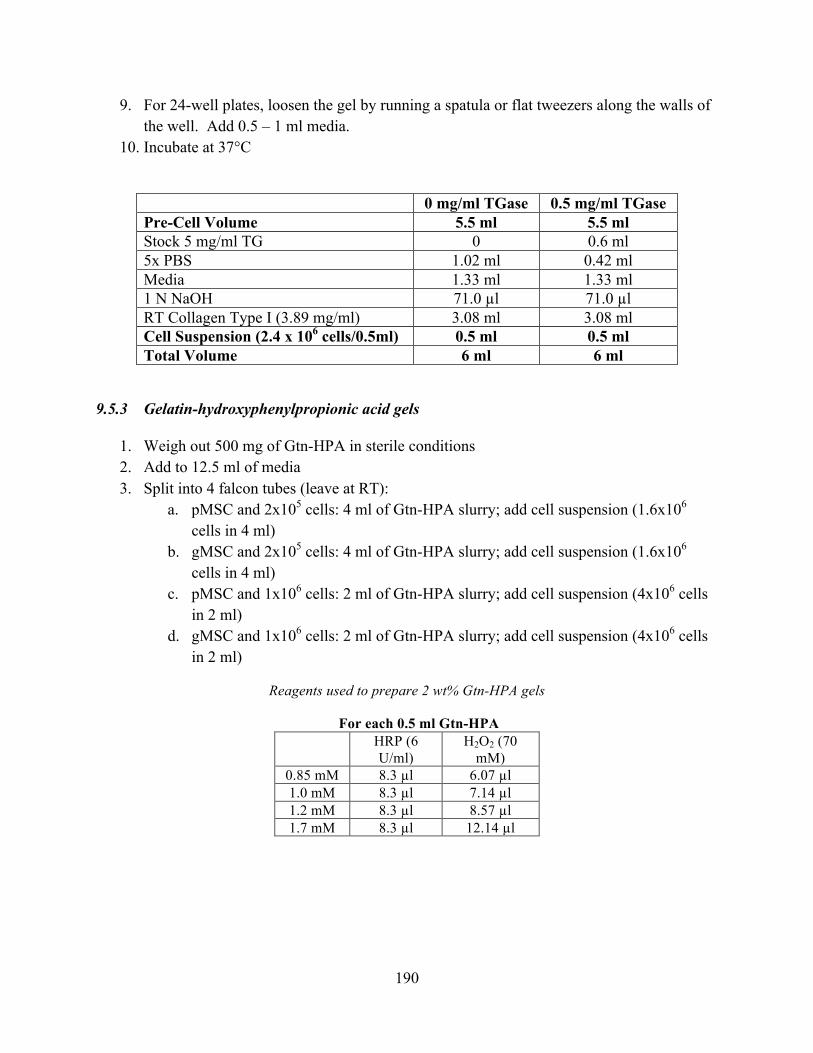
190
9. For 24-well plates, loosen the gel by running a spatula or flat tweezers along the walls of the well. Add 0.5 – 1 ml media.
10. Incubate at 37°C
0 mg/ml TGase 0.5 mg/ml TGase Pre-Cell Volume 5.5 ml 5.5 ml Stock 5 mg/ml TG 0 0.6 ml 5x PBS 1.02 ml 0.42 ml Media 1.33 ml 1.33 ml 1 N NaOH 71.0 µl 71.0 µl RT Collagen Type I (3.89 mg/ml) 3.08 ml 3.08 ml Cell Suspension (2.4 x 10⁶ cells/0.5ml) 0.5 ml 0.5 ml Total Volume 6 ml 6 ml
9.5.3 Gelatin-hydroxyphenylpropionic acid gels
1. Weigh out 500 mg of Gtn-HPA in sterile conditions 2. Add to 12.5 ml of media 3. Split into 4 falcon tubes (leave at RT):
a. pMSC and 2x10⁵ cells: 4 ml of Gtn-HPA slurry; add cell suspension (1.6x10⁶ cells in 4 ml)
b. gMSC and 2x10⁵ cells: 4 ml of Gtn-HPA slurry; add cell suspension (1.6x10⁶ cells in 4 ml)
c. pMSC and 1x10⁶ cells: 2 ml of Gtn-HPA slurry; add cell suspension (4x10⁶ cells in 2 ml)
d. gMSC and 1x10⁶ cells: 2 ml of Gtn-HPA slurry; add cell suspension (4x10⁶ cells in 2 ml)
Reagents used to prepare 2 wt% Gtn-HPA gels
For each 0.5 ml Gtn-HPA HRP (6
U/ml) H2O2 (70
mM) 0.85 mM 8.3 µl 6.07 µl 1.0 mM 8.3 µl 7.14 µl 1.2 mM 8.3 µl 8.57 µl 1.7 mM 8.3 µl 12.14 µl

191
9.6 Sample preparation for staining protocols
9.6.1 Tissue processing and paraffin-embedding
1. Fix samples in 4% paraformaldehyde for 3 hours 2. Label plastic cassettes with pencil and line the cassettes with sponges 3. Transfer samples to labeled cassettes and put them in a beaker of 70% ethanol 4. Transfer samples to tissue processor for serial dehydration (17 hour cycle) 5. Transfer samples to paraffin embedder and embed in metal or plastic molds
9.6.2 OCT embedding and cryosectioning
OCT Embedding
1. Create molds for samples using Al foil a. Use eraser mold as base, and wrap Al foil around base b. Leave flaps of Al foil out c. Label the bottom of the mold d. Remove eraser
2. OCT embedding is done in R3-318 (Code: 2-4-3), Kaplan lab, Angela and Marsha 3. Arrange molds in order, name down, want molds to stand flat 4. Fill with OCT compound (enough to cover the sample)
a. Want to fill the molds as smoothly as possible, so start from the corner to avoid bubbles
b. Fill all the molds at the same time 5. Get dry ice
a. Pick up gloves and box from 318 on top of the fridge b. Dry ice from the basement (Maverick) – turn left when you exit the elevator, first
door c. -80°C freezer, Number 17 d. Get a few shovelfuls
6. Pour dry ice into red container (also on top of the fridge) 7. Get 2 methylbutane
a. Need key (from Angela or Marsha), and black carrier b. Bring both to the fridge at the end of the hall (past elevators) and retrieve 2
methylbutane from the fridge c. Pour 2 methylbutane into grey metal container on top of dry ice d. Can use thermometer in 4°C fridge top shelf e. Want the 2 methylbutane to be about -20°C to -30°C
8. OCT embedding a. Make a hole in the dry ice and place the mold with OCT in the hole. Wait until
the edges turn white (sign that it’s starting to freeze)

192
b. Move the sample from 25% sucrose into the methylbutane and leave it in there for about 15 seconds (watch the clock), and then move the mold onto the counter.
c. Use the scoop to move the sample (now opaque) onto kimwipe and blot dry d. Use another tweezers (don’t want to contaminate/mix methylbutane and OCT) to
place the sample in the OCT-filled mold, and push all the way down to the bottom e. Move the sample onto the dry ice and fold one side of Al foil over and bury in dry
ice f. After you’re done with the next sample completely cover the first sample in Al
foil and bury in dry ice in the corner 9. After all done, put container of methylbutane to the side, will miraculously evaporate on
its own 10. Bury all the samples in dry ice in the corner of the red bin and wait 15-30 min before
going back to collect them and freezing in a box (-20°C)
Cryosectioning
1. Turn on cryostat at least 1-2 hours before use 2. Cut 25 slides per sample; must freeze slides when storing 3. Put samples in machine to equilibrate for 30 min 4. Buttons
a. Kept next to the sink b. Wash them in the sink and dry with paper towels c. Put OCT on each one and wait a few minutes to freeze
5. Attach samples to buttons a. Put OCT on the button and on the back of the sample and press the sample into
the button b. Push down to make sure the sample really stays
6. Attach sample to cryostat mount a. Can use the level to turn the angle of the sample
7. Aim for 15µm sections, but ok to go up to 20-40µm sections 8. Get close to the sample, then cut away extra OCT and make the resulting sample shaped
like a diamond 9. Make sure the guard is down when you’re cutting the extra OCT away so you don’t cut
yourself 10. When picking up sections, use tweezers and just place it onto the glass slide (keep it in
the cryostat because the sample will melt/curl at room temperature 11. Use microscope to view the sample and make sure you’re getting the correct sections 12. Tricks
a. Keep glass and metal plate clean using 95% EtOH and kimwipes to wipe down the areas
b. Put dry ice on top of the sample to cool the sample so the sample and OCT

193
13. When cleaning up, brush OCT shavings into try and empty into the trashcan 14. Use the vacuum to suck up remaining shavings
a. May need to turn vacuum down and the back up because sometimes it just stops working
15. Remove filter of vacuum and place in -20°C when you’re done
Staining
1. Allow slides to warm up to room temperature 2. Let it sit in tap water for 5 min 3. Stain 4. If the section is peeling off the slide, try baking it on the slidewarmer for 15 min

194
9.7 Staining protocols
9.7.1 Hematoxylin and eosin (H&E) staining
For formalin-fixed, paraffin-embedded specimens
Solutions:
Hematoxylin
Gills Hematoxylin Solution or Mayer Hematoxylin Solution
Filter 200mL of stock solution into staining dish
Acid Alcohol
Hydrochloric acid ----------------------------------- 0.5 mL
80% EtOH ------------------------------------------- 100 mL
Eosin
Eosin Y Solution, Aqueous
Procedure:
1. Deparaffinize and rehydrate:
Xylene 2 x 5 min
100% EtOH 2 x 3 min
95% EtOH 2 x 2 min
80% EtOH 1 min
Wash in running tap water 5 min
(Use bucket of water to transfer slides from hood to sink)
2. Stain in hematoxylin for 3 minutes
(Hematoxylin must be filtered.)
3. Wash in running tap water for 5 minutes 4. Decolorize by a few quick dips in the acid alcohol. 5. Rinse in running tap water for 5 minutes. 6. Eosin for 60 seconds.

195
7. Dehydrate:
100% EtOH 2 x 3 min
Xylene 2 x 3 min
8. Cover with Cytoseal and coverslip.
9.7.2 Safranin O staining
Description
Safranin-O is a cationic dye that binds to sulfated glycosaminoglycans (chondroitin 6-sulfate or keratin sulfate) staining pink (Rosenburg, JBJS 53-A(1) 1971). Fast green acts as a light counterstain. Hematoxylin stains cell nuclei dark purple. This protocol is for formalin fixed, paraffin embedded specimens.
Solutions
• Safranin-O: 0.2% w/v. Add 1 ml acetic acid per 100 ml dH2O. o Example: 0.2 g Saf-O + 1ml acetic acid + 100 ml dH2O.
• Fast Green Stock Solution: 0.2g Fast green + 1 ml acetic acid + 100 ml dH2O • Fast Green Working Solution: 1:500 dilution of stock solution in dH2O. • 0.5% Acetic Acid: 1 ml acetic acid in 200 ml dH2O.
Other Materials
• Cytoseal 60 (Cat# 18006, Electron Microscopy Sciences)
• Gill’s Hematoxylin Cat# ?????
Protocol
1. Deparaffinize and Rehydrate
Xylene (or substitute) 2 x 5 min.
100% EtOH 2 x 3 min.
95% EtOH 2 x 2min.
80% EtOH 1 min.
Wash in tap water 5 min.
2. Hematoxylin, 3 min. Note: be sure to filter hematoxylin!

196
3. Wash in tap water for 5 min. 4. Fast green – 3 quick dips. 5. 0.5% acetic acid – 3 quick dips. 6. Safranin-O – 30 minutes 7. Dehydrate
95% EtOH a few quick dips
100% EtOH 2 x 3 min.
Xylene (or substitute) 2 x 3 min.
8. Coverslip with Cytoseal
9.7.3 Masson’s trichrome staining
Description: This method is used for the detection of collagen fibers in tissues such as skin, heart, etc. on formalin-fixed, paraffin-embedded sections, and may be used for frozen sections as well. The collagen fibers will be stained blue and the nuclei will be stained black and the background is stained red.
Fixation: 10% formalin.
Section: paraffin sections at 4-6 µm.
Solutions and Reagents:
(Note: most of the following solutions can be purchased premade from Sigma)
Weigert's Iron Hematoxylin Solution:
Stock Solution A:
Hematoxylin ----------------------------- 1 g
95% Alcohol ----------------------------- 100 ml
Stock Solution B:
29% Ferric chloride in water --------- 4 ml
Distilled water ----------------------------- 95 ml
Hydrochloric acid, concentrated ---- 1ml / 25% v/v

197
Weigert's Iron Hematoxylin Working Solution:
Mix equal parts of stock solution A and B. This working solution is stable for 3 months
Biebrich Scarlet-Acid Fuchsin Solution:
Biebrich scarlet, 1% aqueous --------- 90 ml
Acid fuchsin, 1% aqueous --------------10 ml
Acetic acid, glacial ------------------------ 1 ml
Phosphomolybdic-Phosphotungstic Acid Solution:
5% Phosphomolybdic acid ------------- 25 ml
5% Phosphotungstic acid --------------- 25 ml
Aniline Blue Solution:
Aniline blue --------------------------------- 2.5 g
Acetic acid, glacial ------------------------ 2 ml
Distilled water ----------------------------- 100 ml
1% Acetic Acid Solution:
Acetic acid, glacial ----------------------- 1 ml
Distilled water ------------------------------ 99 ml
Method:
1. Deparaffinize and rehydrate as usual: a. Xylenes (2 x 5 minutes) b. 100% Ethanol (2 x 3 minutes)

198
c. 95% Ethanol (2 x 2 minutes) d. 80% Ethanol (2 x 1 minutes)
2. Wash in cold running tap water for 5 minutes. 3. Stain in Weigert’s Hematoxylin working solution for 10 minutes. 4. Rinse in warm running tap water for 10 minutes. 5. Stain in Biebrich scarlet-acid fuchsin for 5 minutes. (Solution can be reused) 6. Wash in cold running tap water for 5 minutes. 7. Differentiate in phosphomolybdic-phosphotungstic acid for 20 minutes. 8. Transfer slides directly (without rinse) to aniline blue for 20 minutes. 9. Differentiate in 1% acetic acid for 2 quick dips 10. Dehydrate:
a. 2 dips in 95% Ethanol (2X) b. 100% Ethanol (2 x 1 minute) c. Xylenes (2 x 1 minute)
11. Mount with resinous mounting medium.
Results:
Collagen à Blue
Nuclei à Black
Muscle, Cytoplasm à Red
9.7.4 Immunohistochemical monolayer staining
For cells grown in well plates or chamber slides.
Solutions
Tris-Buffered Saline (TBS) Stored at RT in packets
1 package (Dako, S3001) to 1L dH2O Stored at 4 ºC in soln.
1 package (Dako, S1968) to 5L dH2O

199
Used for Diluting the antibody/horse serum/ and rinsing the slides.
Wash Buffer with Tween 20 Stored at 4 ºC
(Dako Cytomation, S3006, 1000ml)
500ml of x10 in 4500ml dH2O
Used for washing the slides in the autostainer. If you do not use wash buffer
with Tween your slides will not get washed properly and will show a very
high background stain.
Triton-X 100 Stored at RT
0.05% Triton-X 100 in PBS:
5uL in 10mL of PBS
Dissolve by warming to 37°C and shaking
0.1% (w/v) Protease XIV (only for paraffin-embedded samples)
10mg Protease (Sigma P5174) Stored at -20ºC
10mL TBS
Peroxidase Blocking Reagent Stored at 4 ºC
(Dakocytomation, Envision Plus+ System-HRP (AEC) K4005)
Used for blocking endogenous peroxidase in tissues.
0.03% hydrogen peroxide containing sodium azide.
Ready to use.
Protein Block Serum-Free Stored at 4ºC
(Dakocytomation, Protein Block Serum-Free X-0909)

200
Ready to use.
Primary Antibody (anti-β-tubulin (TUJ1)) (Covance MRB-435P) Stored at -20 ºC
Rabbit monoclonal, Isotype: IgG1
Concentration: 1 mg/mL, use a 1:2000 dilution
6 µL Primary Antibody in 12 mL Antibody Diluent
For negative control, use “Negative Control Rabbit Immunoglobin (Dako X0903)”
For secondary antibody, use “Fluorescein (FITC) Anti-rabbit”
Primary Antibody (anti-β-tubulin (TUJ1)) (Covance MMS-435P) Stored at -20 ºC
Mouse monoclonal, Isotype: IgG2a
Concentration: 1 mg/mL, use a 1:500 dilution
10 µL Primary Antibody in 5 mL Antibody Diluent
For negative control, use “Negative Control Mouse IgG2a Immunoglobin (Dako X0943)”
For secondary antibody, use “Rhodamine (TRITC) Anti-mouse”
Primary Antibody (von Willebrand Factor antibody) (abcam ab6994) Stored at 4°C
Rabbit polyclonal
Concentration: 7.8 mg/mL, use a 1:400 dilution
30 µL Primary Antibody in 12 mL Antibody Diluent
For negative control, use “Negative Control Rabbit Immunoglobin (Dako X0903)”
For secondary antibody, use “Fluorescein (FITC) Anti-rabbit”
Primary Antibody (anti-cardiac troponin I [284 (19C7]) (abcam 19615) Stored at -20 ºC
Mouse monoclonal, Isotype: IgG2b
Concentration: 3.2 mg/mL, use a 1:200 dilution (suggested) but 1:800 works just as well
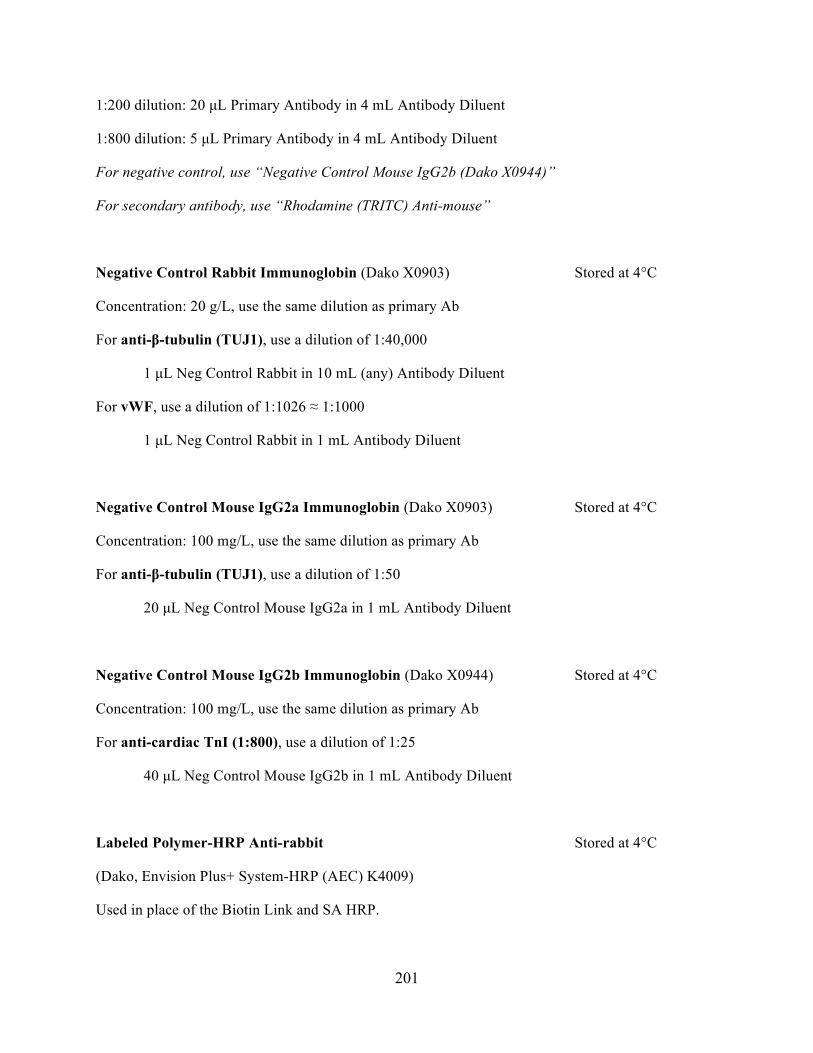
201
1:200 dilution: 20 µL Primary Antibody in 4 mL Antibody Diluent
1:800 dilution: 5 µL Primary Antibody in 4 mL Antibody Diluent
For negative control, use “Negative Control Mouse IgG2b (Dako X0944)”
For secondary antibody, use “Rhodamine (TRITC) Anti-mouse”
Negative Control Rabbit Immunoglobin (Dako X0903) Stored at 4°C
Concentration: 20 g/L, use the same dilution as primary Ab
For anti-β-tubulin (TUJ1), use a dilution of 1:40,000
1 µL Neg Control Rabbit in 10 mL (any) Antibody Diluent
For vWF, use a dilution of 1:1026 ≈ 1:1000
1 µL Neg Control Rabbit in 1 mL Antibody Diluent
Negative Control Mouse IgG2a Immunoglobin (Dako X0903) Stored at 4°C
Concentration: 100 mg/L, use the same dilution as primary Ab
For anti-β-tubulin (TUJ1), use a dilution of 1:50
20 µL Neg Control Mouse IgG2a in 1 mL Antibody Diluent
Negative Control Mouse IgG2b Immunoglobin (Dako X0944) Stored at 4°C
Concentration: 100 mg/L, use the same dilution as primary Ab
For anti-cardiac TnI (1:800), use a dilution of 1:25
40 µL Neg Control Mouse IgG2b in 1 mL Antibody Diluent
Labeled Polymer-HRP Anti-rabbit Stored at 4°C
(Dako, Envision Plus+ System-HRP (AEC) K4009)
Used in place of the Biotin Link and SA HRP.

202
Peroxidase labeled polymer conjugated to goat anti-rabbit immunoglobulins in Tris-HCl buffer containing stabilizing.
Ready to use.
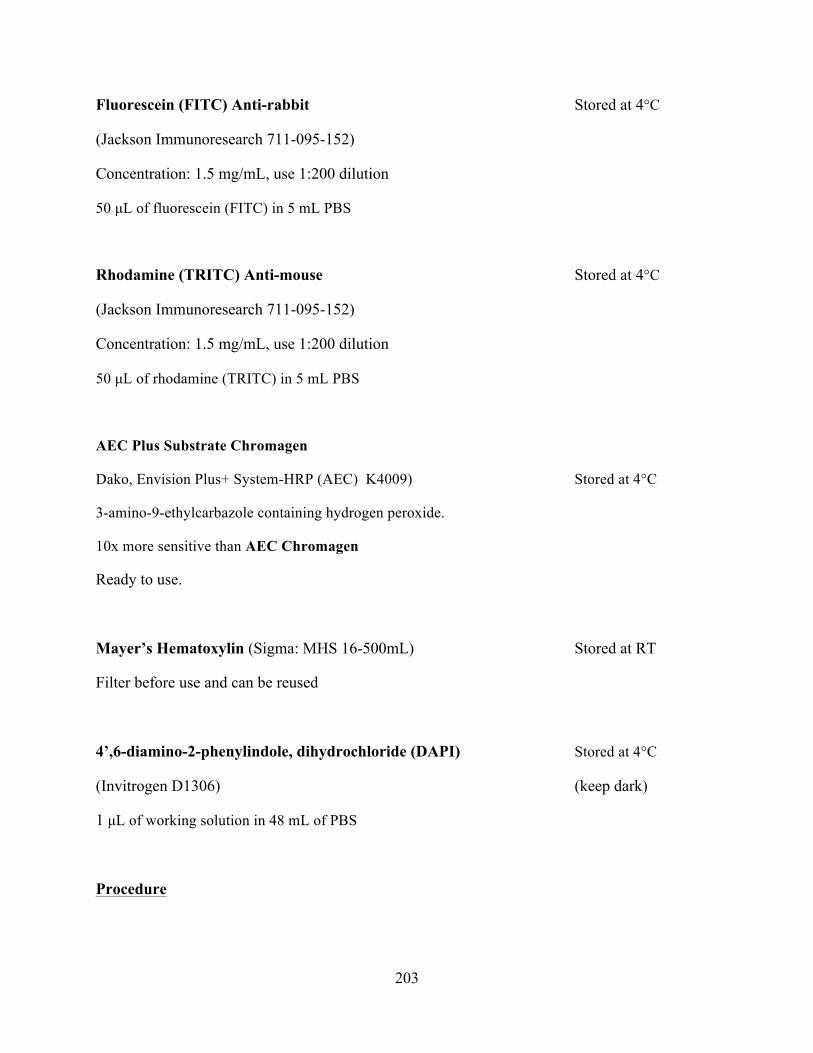
203
Fluorescein (FITC) Anti-rabbit Stored at 4°C
(Jackson Immunoresearch 711-095-152)
Concentration: 1.5 mg/mL, use 1:200 dilution
50 µL of fluorescein (FITC) in 5 mL PBS
Rhodamine (TRITC) Anti-mouse Stored at 4°C
(Jackson Immunoresearch 711-095-152)
Concentration: 1.5 mg/mL, use 1:200 dilution
50 µL of rhodamine (TRITC) in 5 mL PBS
AEC Plus Substrate Chromagen
Dako, Envision Plus+ System-HRP (AEC) K4009) Stored at 4°C
3-amino-9-ethylcarbazole containing hydrogen peroxide.
10x more sensitive than AEC Chromagen
Ready to use.
Mayer’s Hematoxylin (Sigma: MHS 16-500mL) Stored at RT
Filter before use and can be reused
4’,6-diamino-2-phenylindole, dihydrochloride (DAPI) Stored at 4°C
(Invitrogen D1306) (keep dark)
1 µL of working solution in 48 mL of PBS
Procedure

204
o For 2-well chamber slides, use 500uL per well. For 6-well plates, use 1 mL per well. Use enough paraformaldehyde to cover the slides during fixing. Use enough paraformaldehyde to cover the slides during fixing.
1. Fix cells in 4% paraformaldehyde for 10 minutes at room temperature. 2. Wash in PBS for 5 minutes at room temperature. 3. Permeabilize monolayers in 0.05% Triton-X 100 for 5 minutes at 4ºC. 4. Wash in PBS for 5 minutes at room temperature. 5. Block endogenous peroxidase with Peroxidase Blocking Reagent for 10 minutes at room
temperature. 6. Rinse with Dako wash buffer. 7. Pretreatment Protein Block Serum-Free for 10 minutes at room temperature. Do not
rinse. 8. Incubate with primary Ab (anti-β-tubulin or others) or negative control rabbit for 45
minutes at room temperature in a humidified chamber. 9. Rinse with Dako wash buffer (TBS +Tween). 10. Incubate with labeled Polymer-HRP anti-rabbit for 30 minutes at room temperature.
(For IF, incubate with fluorescein (FITC) diluted in PBS and incubate at room temperature for 30-60 min)
11. Rinse with Dako wash buffer. 12. For ICC only: apply AEC Plus and let stand for 10 minutes at room temperature. 13. Rinse with Dako wash buffer. Keep wet in TBS. 14. Counterstain
a. For ICC: Mayer’s hematoxylin for 1.5 minutes. Then rinse in tap water for 3 min. b. For IF: Incubate sections in DAPI solution in dark for 30 minutes at room temp.
15. Coverslip slides with faramount aqueous mounting medium, immediately photograph the positive and negative slides.
9.7.5 Immunohistochemical section staining
The materials used for immunohistochemical staining are the same as those used for monolayer staining.
1. Put paraffin sections on slide warmer 2. Deparaffinize and rehydrate paraffin section via the following baths
• Xylene 2 x 5 minutes • 100% alcohol 2 x 3 minutes • 95% alcohol 2x 2 minutes • 80% alcohol 1 minute • Rinse in tap water
3. Mix Tris and EDTA and DI water and check pH (usually doesn’t need adjustment).
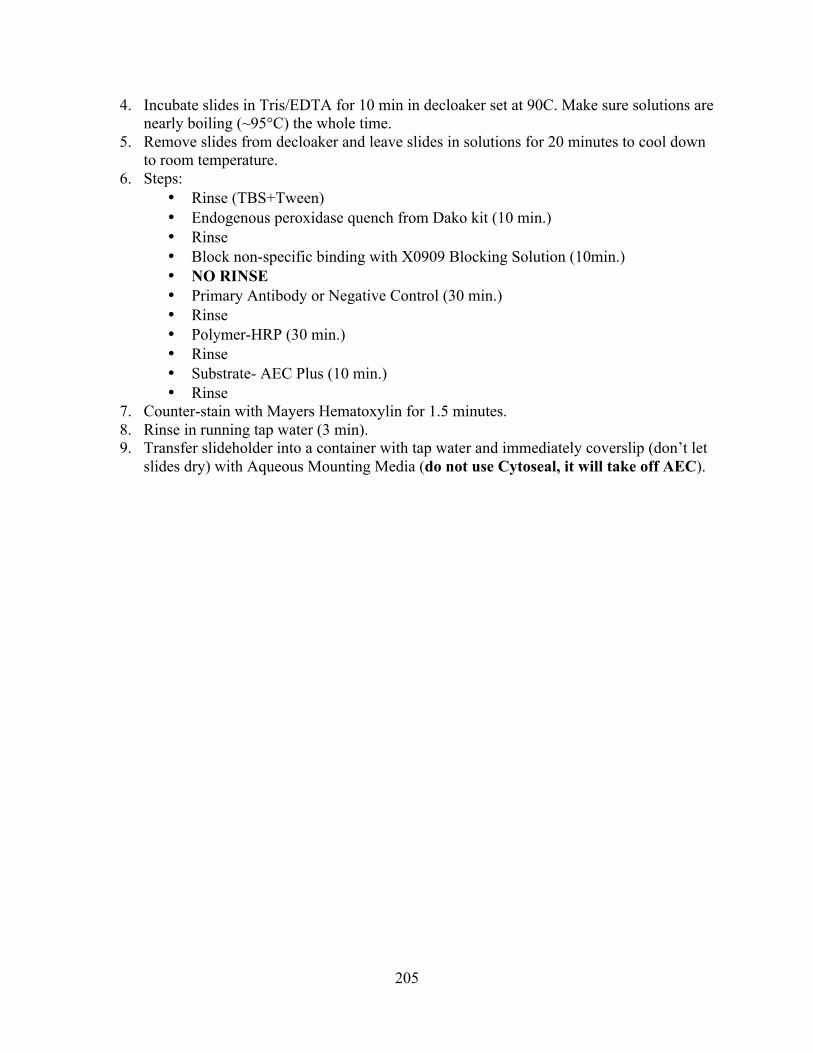
205
4. Incubate slides in Tris/EDTA for 10 min in decloaker set at 90C. Make sure solutions are nearly boiling (~95°C) the whole time.
5. Remove slides from decloaker and leave slides in solutions for 20 minutes to cool down to room temperature.
6. Steps: • Rinse (TBS+Tween) • Endogenous peroxidase quench from Dako kit (10 min.) • Rinse • Block non-specific binding with X0909 Blocking Solution (10min.) • NO RINSE • Primary Antibody or Negative Control (30 min.) • Rinse • Polymer-HRP (30 min.) • Rinse • Substrate- AEC Plus (10 min.) • Rinse
7. Counter-stain with Mayers Hematoxylin for 1.5 minutes. 8. Rinse in running tap water (3 min). 9. Transfer slideholder into a container with tap water and immediately coverslip (don’t let
slides dry) with Aqueous Mounting Media (do not use Cytoseal, it will take off AEC).

206
9.8 Hydrogel characterization protocols
9.8.1 Critical point drying
The critical point dryer used was in the Whitehead Institute (Room 447) in the Keck Imaging Facility.
1. Serially dehydrate samples (make sure you use pure 100% EtOH and not the reagent alcohols we use for dehydrating/rehydrating paraffin-embedded samples):
o 15 min in each: o 50%, o 75%, o 90%, o 95%, o 100% (x3) o Store samples in 100% EtOH until critical point drying
2. Autosamdri – 815 o Sample drying at critical point o Tousimis (Rockville, MD)
3. Turn on machine (back right of the machine) 5 minutes to let everything warm up 4. Turn on CO2 (turn right – clockwise to turn open) 5. Sample holder:
o Different sample holders in drawers under the machine o Largest sample holder is about 10-12mm diameter (cage) but can only do one
sample at a time o I used the 6-mm sample holder which can hold 12 samples at a time (put it under
100% EtOH at all times so samples don’t dry) o Make sure you label which samples goes where o Screw the two layers together, and put lid on and screw o Place the entire sample holder in 50-ml conical tube
6. Add dried ethanol via transfer pipets (ethanol with sieve beads in it – to keep it from absorbing water) to the chamber and then drop the sample holder in the chamber
7. Top off the chamber with dried ethanol 8. Critical point dryer is a semi-automated system:
o “Cool” system to 0°C, then you’ll hear a click (~ 3 min) § To start, push “cool” then T will go to 0°C (and eventually -15°C) § Remember CO2 tank should be on before you start “Cool”
o “Fill” (~ 4 min) § Need to click manually, then everything else is on its own § Watch the bubble go across the window of the chamber (then you know
it’s completely filled)
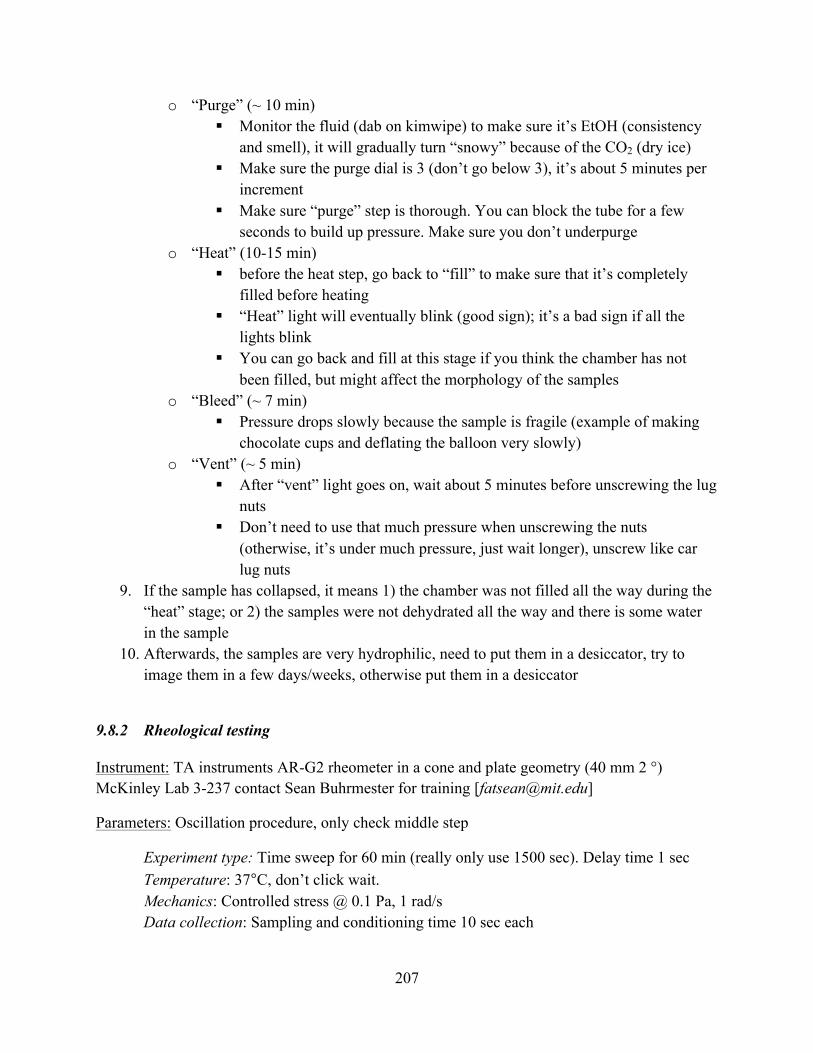
207
o “Purge” (~ 10 min) § Monitor the fluid (dab on kimwipe) to make sure it’s EtOH (consistency
and smell), it will gradually turn “snowy” because of the CO2 (dry ice) § Make sure the purge dial is 3 (don’t go below 3), it’s about 5 minutes per
increment § Make sure “purge” step is thorough. You can block the tube for a few
seconds to build up pressure. Make sure you don’t underpurge o “Heat” (10-15 min)
§ before the heat step, go back to “fill” to make sure that it’s completely filled before heating
§ “Heat” light will eventually blink (good sign); it’s a bad sign if all the lights blink
§ You can go back and fill at this stage if you think the chamber has not been filled, but might affect the morphology of the samples
o “Bleed” (~ 7 min) § Pressure drops slowly because the sample is fragile (example of making
chocolate cups and deflating the balloon very slowly) o “Vent” (~ 5 min)
§ After “vent” light goes on, wait about 5 minutes before unscrewing the lug nuts
§ Don’t need to use that much pressure when unscrewing the nuts (otherwise, it’s under much pressure, just wait longer), unscrew like car lug nuts
9. If the sample has collapsed, it means 1) the chamber was not filled all the way during the “heat” stage; or 2) the samples were not dehydrated all the way and there is some water in the sample
10. Afterwards, the samples are very hydrophilic, need to put them in a desiccator, try to image them in a few days/weeks, otherwise put them in a desiccator
9.8.2 Rheological testing
Instrument: TA instruments AR-G2 rheometer in a cone and plate geometry (40 mm 2 °) McKinley Lab 3-237 contact Sean Buhrmester for training [[email protected]]
Parameters: Oscillation procedure, only check middle step
Experiment type: Time sweep for 60 min (really only use 1500 sec). Delay time 1 sec Temperature: 37°C, don’t click wait. Mechanics: Controlled stress @ 0.1 Pa, 1 rad/s Data collection: Sampling and conditioning time 10 sec each

208
Procedure:
1. Calibrate instrument, follow instructions on the sheet on top of the computer. *Make sample during rotational mapping to save time. Use 1.5 ml centrifuge tubes and make 0.7 ml.
2. Keep collagen in refrigerator to keep it cold. There is no easy source of ice nearby. 3. Change the bottom plate temperature to 8°C to prevent gelation
3.) Pipette 640 µl onto the center of the stage (marked as slightly in front of the circle on the lower platen). Make sure there are no bubbles (remove with pipette).
4.) Use the instrument control tab to lower the geometry to 500 µm, 100 µm, and finally 54 µm. Sample must be even around the entire geometry and must come right up to the edge without overflowing.
5.) Start the run and wait 150 sec before applying light mineral oil, dropwise around the edge of the geometry to prevent evaporation. The oil will spread so not much is needed.
6.) Data is automatically saved at every point to the file you specified. Data file automatically opens with the TA Analysis program. Right click on the file name on the left-hand panel and click export to text. The txt file will be in the same folder as the data file. *To get the full data set you must close and reopen it at the end of the run!
7.) At the end of the run, press the stop button. Raise the geometry and clean it with a kimwipe. Wipe the stage clean with a kimwipe.
8.) Turn the temperature back to 8°C, recalibrate geometry inertia and rotational mapping before the next sample.
9.) Sample analysis: open txt file in excel.
Gelation time (G’=G” or delta =45). Plot delta vs time, zoom in on x-axis and make y-axis between 45-46. The gel point will now be the intersection of the line on the x-axis.
Modulus at a specific time: Read directly from text file. It is a little easier to put all data on the same sheet because all of the rows will be at essential the same time (+/- a few sec discrepancy per run).
For an unknown sample:
1.) Determine the linear viscoelastic regime (LVR) of the material.
Allow material to gel in the machine

209
Perform a stress sweep from 0.01-10 Pa 6 pts/decade @ 1 rad/s
Want a stress that is in the linear range of the modulus vs. stress plot
2.) Determine frequency dependence of modulus
Frequency sweep at a controlled stress determined in 1.)
1 rad/s – 100 rad/s
3.) Determine if stress affects the gel procedure (i.e. prevents gelation)
Within the LVR find the stress at which the gel point no longer changes
9.8.3 Compression testing
1. Allow samples to equilibrate in 1x PBS overnight before testing 2. Bring samples (1 mL gels in 24-well plates) to Zwick/Roell Z2.5 static materials tester
(Zwick GmbH & Co., Ulm, Germany) in Dr. Socrate’s lab in Building E25 3. Use 20 N load cell 4. Using testing software (testXpert, Zwick) on computer to set up testing parameters
a. “Machine” -> “Crosshead” -> “LE Reference” to set zero displacement b. “Approach” to 0.01 N to zero force c. Then move load cell up to 106 µm d. Make sure head is at least 1 mm above e. Select “compression” testing f. Select “LE check” box g. Select “No pre-load” h. Use “Step definition” to define sequence of testing (e.g. nominal strain 15%;
speed 1%/s, etc.…) i. To save, go to “Export interfaces” and select “Excel”
5. Place sample on platens 6. Use kimwipe to wick away excess fluid 7. Bring load cell down to sample so that the normal force is just positive (0.001 N) 8. Measure diameter of the samples at the start of the testing was measured using digital
calipers. 9. Run test 10. Put sample back in hydrated 24-well plate
9.8.4 Enzymatic degradation studies
The protocol is the same for collagen-genipin and Gtn-HPA gels:
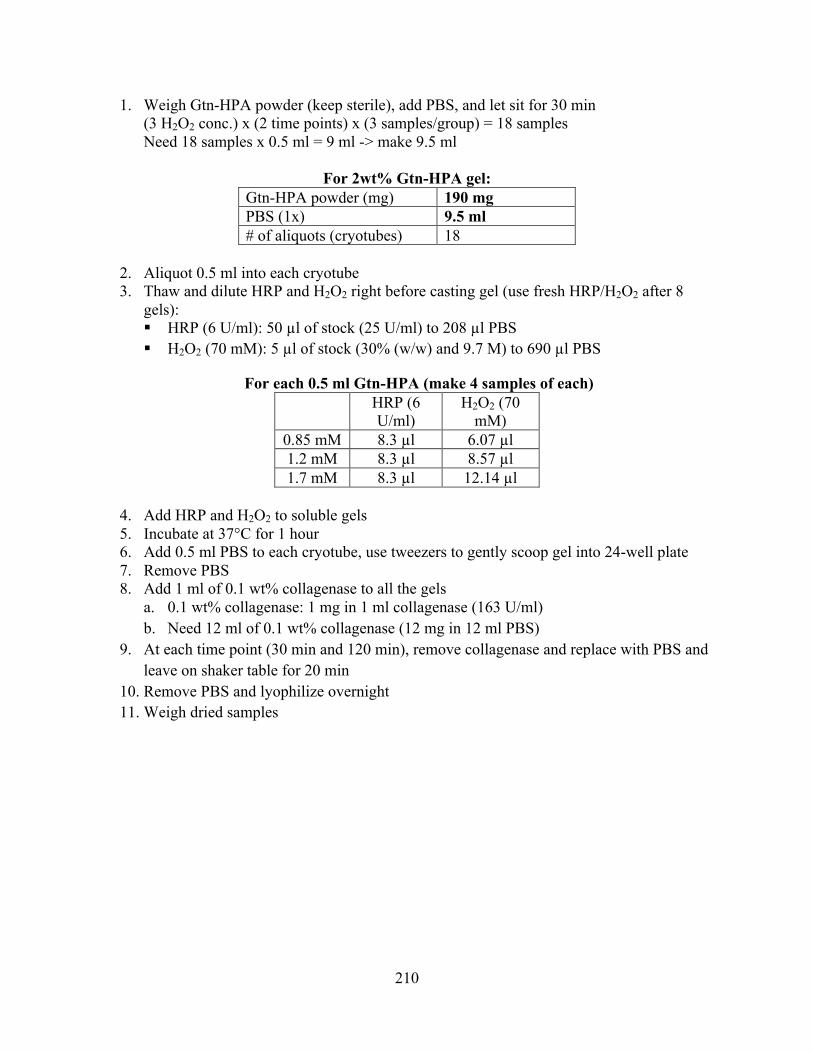
210
1. Weigh Gtn-HPA powder (keep sterile), add PBS, and let sit for 30 min (3 H2O2 conc.) x (2 time points) x (3 samples/group) = 18 samples Need 18 samples x 0.5 ml = 9 ml -> make 9.5 ml
For 2wt% Gtn-HPA gel:
Gtn-HPA powder (mg) 190 mg PBS (1x) 9.5 ml # of aliquots (cryotubes) 18
2. Aliquot 0.5 ml into each cryotube 3. Thaw and dilute HRP and H2O2 right before casting gel (use fresh HRP/H2O2 after 8
gels): § HRP (6 U/ml): 50 µl of stock (25 U/ml) to 208 µl PBS § H2O2 (70 mM): 5 µl of stock (30% (w/w) and 9.7 M) to 690 µl PBS
For each 0.5 ml Gtn-HPA (make 4 samples of each) HRP (6
U/ml) H2O2 (70
mM) 0.85 mM 8.3 µl 6.07 µl 1.2 mM 8.3 µl 8.57 µl 1.7 mM 8.3 µl 12.14 µl
4. Add HRP and H2O2 to soluble gels 5. Incubate at 37°C for 1 hour 6. Add 0.5 ml PBS to each cryotube, use tweezers to gently scoop gel into 24-well plate 7. Remove PBS 8. Add 1 ml of 0.1 wt% collagenase to all the gels
a. 0.1 wt% collagenase: 1 mg in 1 ml collagenase (163 U/ml) b. Need 12 ml of 0.1 wt% collagenase (12 mg in 12 ml PBS)
9. At each time point (30 min and 120 min), remove collagenase and replace with PBS and leave on shaker table for 20 min
10. Remove PBS and lyophilize overnight 11. Weigh dried samples

211
9.9 Biochemical assay protocols
9.9.1 Proteinase K digestion
Lyophilize samples prior to digestion
- Place samples for at least 6 hours in the freezer dryer
Proteinase K digestion
Tris-HCl buffer (1L)—keep at room temperature
1. 0.05M UltraPure Tris—6.1g/L (MW=121.14g/mol, Invitrogen, Cat #15504-020)
2. 1mM CaCl2 dihydrate—0.147g/L (MW=147.02g/mol, Sigma (Fluka), Cat #21097)
3. Dissolve above salts in 900 ml distilled water
4. Adjust pH to 8.0 with 1N NaOH
5. Bring to IL with distilled water
For 100 mL solution, use 500ug/ml proteinase K solution:
100 ml Tris-HCl buffer
50 mg proteinase K powder (Sigma, Cat# P-6556, keep at -20C)
1. Sterile filter proteinase K solution & keep left over solution at 4C
2. Add 1ml of proteinase K solution per sample
3. Vortex before putting in water bath (at 60°C)& once again before leaving it overnight
4. Place samples in water bath at 60°C for 12-24 hours
5. After digestion, keep digested samples at -20C until used for biochemical analysis
9.9.2 Dimethylmethylene blue assay for sulfated glycosaminoglycans
Solutions Needed:
Color Reagent
For 500ml of DMMB dye solution, mix the following:
Ø 425 ml dH2O
Ø 1.52 g glycine (From Sigma, Cat# G-8898)
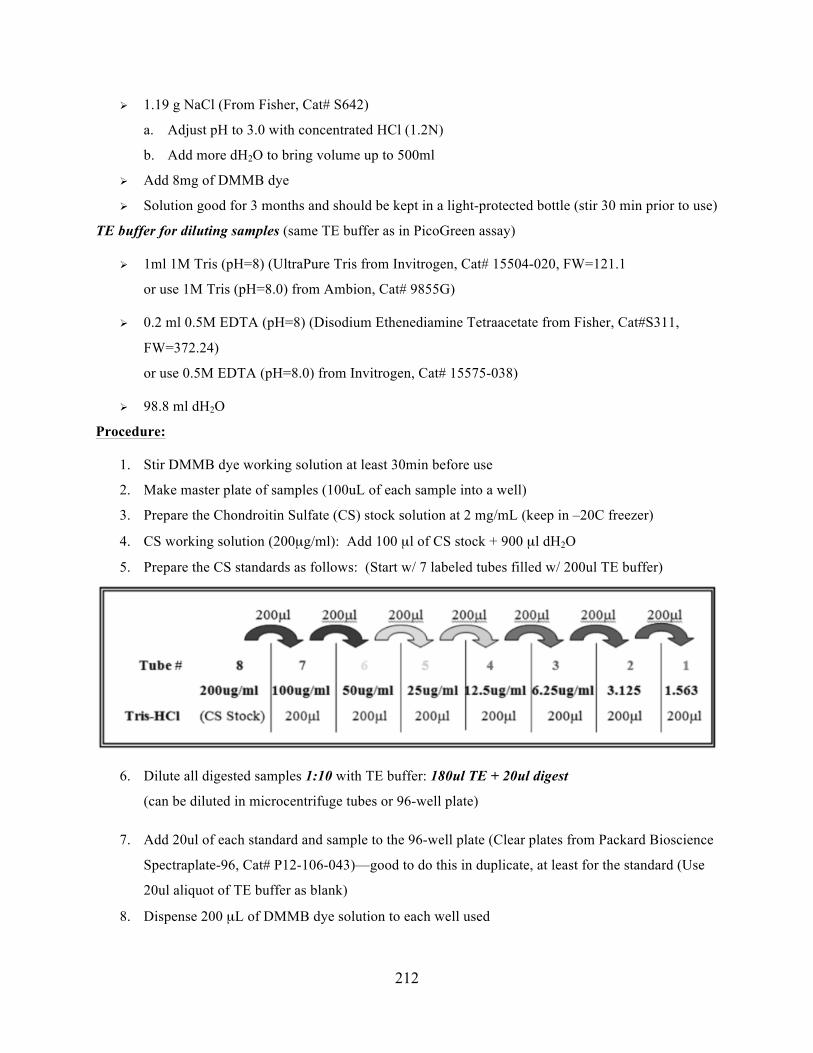
212
Ø 1.19 g NaCl (From Fisher, Cat# S642)
a. Adjust pH to 3.0 with concentrated HCl (1.2N)
b. Add more dH2O to bring volume up to 500ml
Ø Add 8mg of DMMB dye
Ø Solution good for 3 months and should be kept in a light-protected bottle (stir 30 min prior to use)
TE buffer for diluting samples (same TE buffer as in PicoGreen assay)
Ø 1ml 1M Tris (pH=8) (UltraPure Tris from Invitrogen, Cat# 15504-020, FW=121.1
or use 1M Tris (pH=8.0) from Ambion, Cat# 9855G)
Ø 0.2 ml 0.5M EDTA (pH=8) (Disodium Ethenediamine Tetraacetate from Fisher, Cat#S311,
FW=372.24)
or use 0.5M EDTA (pH=8.0) from Invitrogen, Cat# 15575-038)
Ø 98.8 ml dH2O
Procedure:
1. Stir DMMB dye working solution at least 30min before use
2. Make master plate of samples (100uL of each sample into a well)
3. Prepare the Chondroitin Sulfate (CS) stock solution at 2 mg/mL (keep in –20C freezer)
4. CS working solution (200µg/ml): Add 100 µl of CS stock + 900 µl dH2O
5. Prepare the CS standards as follows: (Start w/ 7 labeled tubes filled w/ 200ul TE buffer)
6. Dilute all digested samples 1:10 with TE buffer: 180ul TE + 20ul digest
(can be diluted in microcentrifuge tubes or 96-well plate)
7. Add 20ul of each standard and sample to the 96-well plate (Clear plates from Packard Bioscience
Spectraplate-96, Cat# P12-106-043)—good to do this in duplicate, at least for the standard (Use
20ul aliquot of TE buffer as blank)
8. Dispense 200 µL of DMMB dye solution to each well used

213
9. Take reading at 530 nm—Protocol is already assigned on computer program for microplate
reader under GAG Assay—“GAG-DMMB Assay protocol (530nm-1s)”
The microplate reader is a WALLAC VICTOR2 1420 Multilabel Counter, a subsidiary of Perkin
Elmer Life Sciences.
* If sample reading is outside the standard curve range (or at the extremes of the standard curve),
it is recommended that another dilution and reading of the sample be performed—the ideal is to
have the reading land on the mid-range of the standard curve (usually a 2nd order polynomial is the
best fit curve for this standard)
9.9.3 PicoGreen dsDNA quantitation assay
Materials Needed:
Quant-iT PicoGreen dsDNA Assay Kit (From Molecular Probes Cat#P7589) contains:
• PicoGreen dye reagent (1mL solution in DMSO)—light sensitive (keep covered)
• 20X TE (25mL of 200mM Tris-HCl, 20mM EDTA, pH 7.5)
• Lambda DNA standard (1mL of 100 mg/mL in TE)
TE buffer for diluting samples:
214
• 1ml 1M Tris (pH=8) (UltraPure Tris from Invitrogen, Cat#15504-020, FW=121.1
o or use 1M Tris (pH=8.0) from Ambion, Cat#9855G)
• 0.2 ml 0.5M EDTA (pH=8) (Disodium Ethenediamine Tetraacetate from Fisher,
Cat#S311, FW=372.24)
o or use 0.5M EDTA (pH=8.0) from Invitrogen, Cat#15575-038)
• 98.8 ml dH2O
96-well plate—Black Isoplate (From Wallac, Cat # 1450-571)
96-well plate – clear (for master plate), not HB (high binding)
Notes:
o 1 cell has 7-10 picograms of DNA
Procedure:
1. Turn on plate reader, then computer (takes a few minutes)
2. Warm samples in 37ºC water bath
3. Assay Buffer Preparation: Add 25ml (20X TE) + 500 ml sterile, distilled, DNase-free
water (or use pre-made TE buffer from own stock)
4. DNA standard working solution (2µg/ml):
Add 294 µl of TE buffer + 6 µl DNA stock (100 µg/mL)
Or: 2.94 mL of TE buffer + 60 µl DNA stock
Or: 5.88 mL of TE buffer + 120 µl DNA stock
5. Prepare master plate: 100uL of each sample
6. Dilute all digested samples 1:10 with TE buffer (not from kit): 180 µl TE + 20 µl digest
(can be diluted in microcentrifuge tubes or 96-well plate)
7. Prepare DNA standards in a 96-deep well plate for about 10 assays (keep in the fridge at
4˚C)
Standard No. Standards (ng/ml) TE buffer (µ l) DNA (std-2µg/ml), µ l S8 1000 0 1000
S7 750 250 750 S6 500 500 500
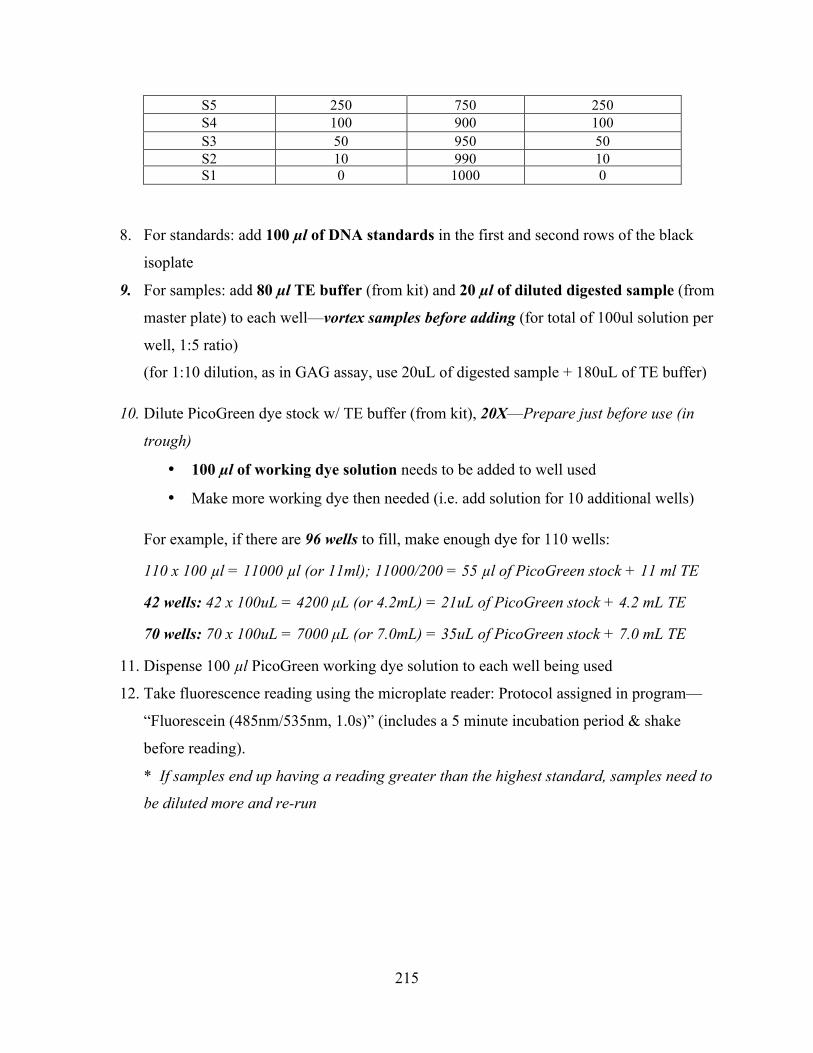
215
S5 250 750 250 S4 100 900 100 S3 50 950 50 S2 10 990 10 S1
0 1000 0
8. For standards: add 100 µl of DNA standards in the first and second rows of the black
isoplate
9. For samples: add 80 µl TE buffer (from kit) and 20 µl of diluted digested sample (from
master plate) to each well—vortex samples before adding (for total of 100ul solution per
well, 1:5 ratio)
(for 1:10 dilution, as in GAG assay, use 20uL of digested sample + 180uL of TE buffer)
10. Dilute PicoGreen dye stock w/ TE buffer (from kit), 20X—Prepare just before use (in
trough)
• 100 µl of working dye solution needs to be added to well used
• Make more working dye then needed (i.e. add solution for 10 additional wells)
For example, if there are 96 wells to fill, make enough dye for 110 wells:
110 x 100 µl = 11000 µl (or 11ml); 11000/200 = 55 µl of PicoGreen stock + 11 ml TE
42 wells: 42 x 100uL = 4200 µL (or 4.2mL) = 21uL of PicoGreen stock + 4.2 mL TE
70 wells: 70 x 100uL = 7000 µL (or 7.0mL) = 35uL of PicoGreen stock + 7.0 mL TE
11. Dispense 100 µl PicoGreen working dye solution to each well being used
12. Take fluorescence reading using the microplate reader: Protocol assigned in program—
“Fluorescein (485nm/535nm, 1.0s)” (includes a 5 minute incubation period & shake
before reading).
* If samples end up having a reading greater than the highest standard, samples need to
be diluted more and re-run

216
9.9.4 Live/Dead staining for cell viability
1. Prepare 4 µM EthD/2 µM Calcein AM in 15ml DMEM (30ul EthD + 30ul Calcein AM in 15ml DMEM)
2. Replace media with staining media 3. Incubate for 1 hour. 4. Remove staining media and replace with 1x PBS. Incubate for 30 min 5. Image to quantify cell viability.

217
9.10 Supplemental results
The following graphs depict the same information that were presented in Chapter 5 regarding simultaneous differentiation, but plotted with different axes. Specifically, these graphs show differentiation efficiency (% EBs and % Area) as a function of differentiation medium over time, for various gel types.
Figure 9-2 MHC expression (% EBs stained) for EBs incorporated in (A) collagen-only, (B) collagen-genipin, (C) Gtn-HPA-comp, and (D) Gtn-HPA-stiff gels cultured in various media for 7 and 14 days (n =
3, mean ± S.D.).
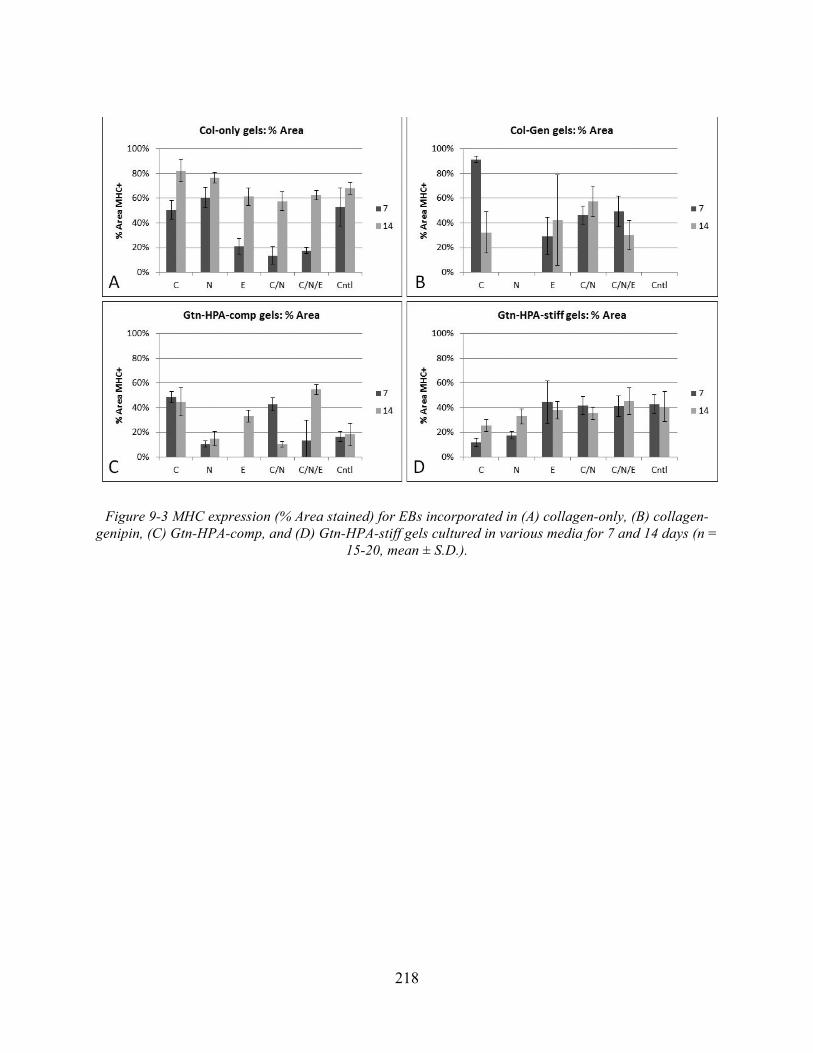
218
Figure 9-3 MHC expression (% Area stained) for EBs incorporated in (A) collagen-only, (B) collagen-genipin, (C) Gtn-HPA-comp, and (D) Gtn-HPA-stiff gels cultured in various media for 7 and 14 days (n =
15-20, mean ± S.D.).

219
Figure 9-4 TUJ1 expression (% EBs stained) for EBs incorporated in (A) collagen-only, (B) collagen-genipin, (C) Gtn-HPA-comp, and (D) Gtn-HPA-stiff gels cultured in various media for 7 and 14 days (n =
3, mean ± S.D.).

220
Figure 9-5 TUJ1 expression (% Area stained) for EBs incorporated in (A) collagen-only, (B) collagen-genipin, (C) Gtn-HPA-comp, and (D) Gtn-HPA-stiff gels cultured in various media for 7 and 14 days (n =
15=20, mean ± S.D.).

221
Figure 9-6 CD31 expression (% EB stained) for EBs incorporated in (A) collagen-only, (B) collagen-
genipin, (C) Gtn-HPA-comp, and (D) Gtn-HPA-stiff gels cultured in various media for 7 and 14 days (n = 3, mean ± S.D.).
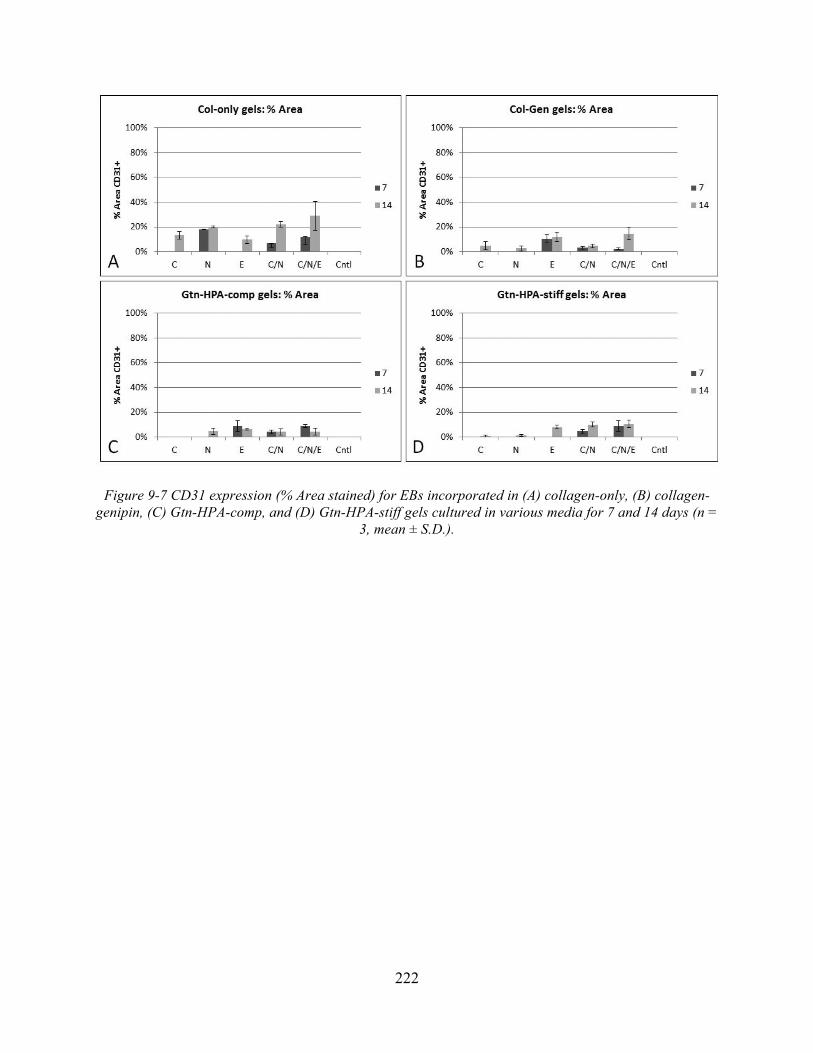
222
Figure 9-7 CD31 expression (% Area stained) for EBs incorporated in (A) collagen-only, (B) collagen-genipin, (C) Gtn-HPA-comp, and (D) Gtn-HPA-stiff gels cultured in various media for 7 and 14 days (n =
3, mean ± S.D.).

223
Figure 9-8 Linear regression plots for the expression (% Area stained) of (A) cardiac vs. neural; (B) cardiac vs. endothelial; (C) neural vs. endothelial markers of EBs cultured in collagen-only gels in all
differentiation media for all culture times
Figure 9-9 Linear regression plots for the expression (% Area stained) of (A) cardiac vs. neural; (B) cardiac vs. endothelial; (C) neural vs. endothelial markers of EBs cultured in collagen-only gels in all
differentiation media for 14 days
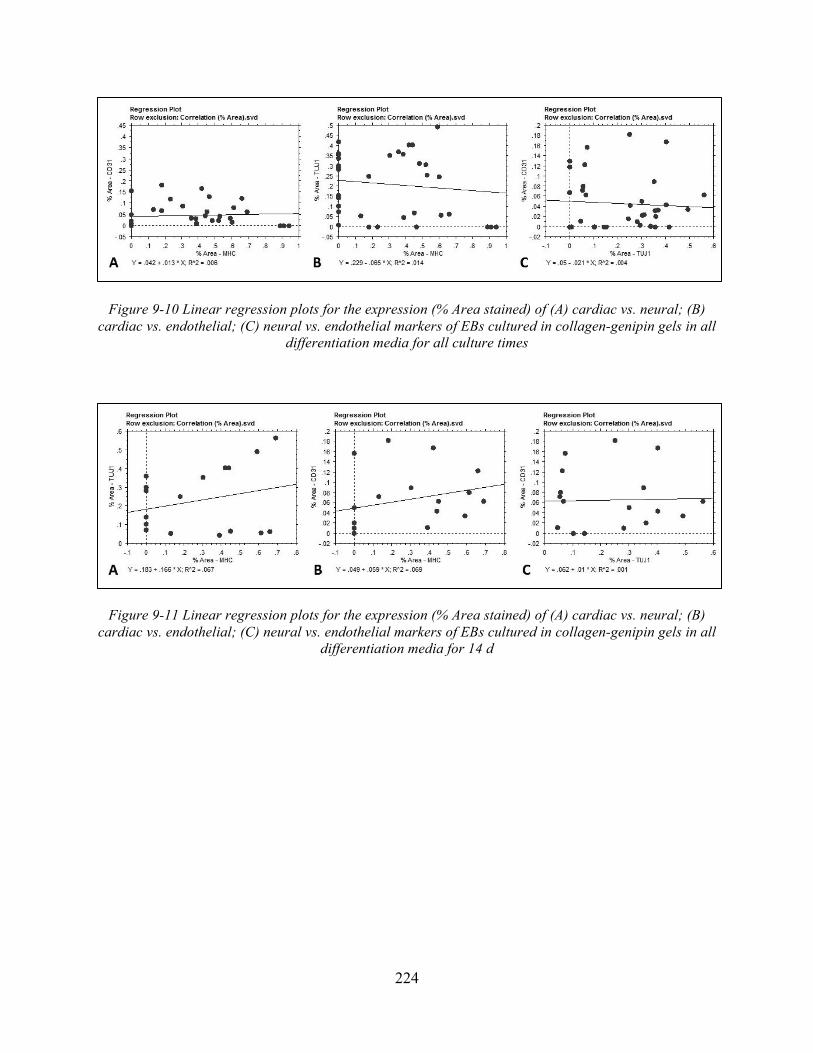
224
Figure 9-10 Linear regression plots for the expression (% Area stained) of (A) cardiac vs. neural; (B) cardiac vs. endothelial; (C) neural vs. endothelial markers of EBs cultured in collagen-genipin gels in all
differentiation media for all culture times
Figure 9-11 Linear regression plots for the expression (% Area stained) of (A) cardiac vs. neural; (B) cardiac vs. endothelial; (C) neural vs. endothelial markers of EBs cultured in collagen-genipin gels in all
differentiation media for 14 d

225
Figure 9-12 Linear regression plots for the expression (% Area stained) of (A) cardiac vs. neural; (B) cardiac vs. endothelial; (C) neural vs. endothelial markers of EBs cultured in Gtn-HPA-comp gels in all
differentiation media for all culture times
Figure 9-13 Linear regression plots for the expression (% Area stained) of (A) cardiac vs. neural; (B) cardiac vs. endothelial; (C) neural vs. endothelial markers of EBs cultured in Gtn-HPA-comp gels in all
differentiation media for 14 d
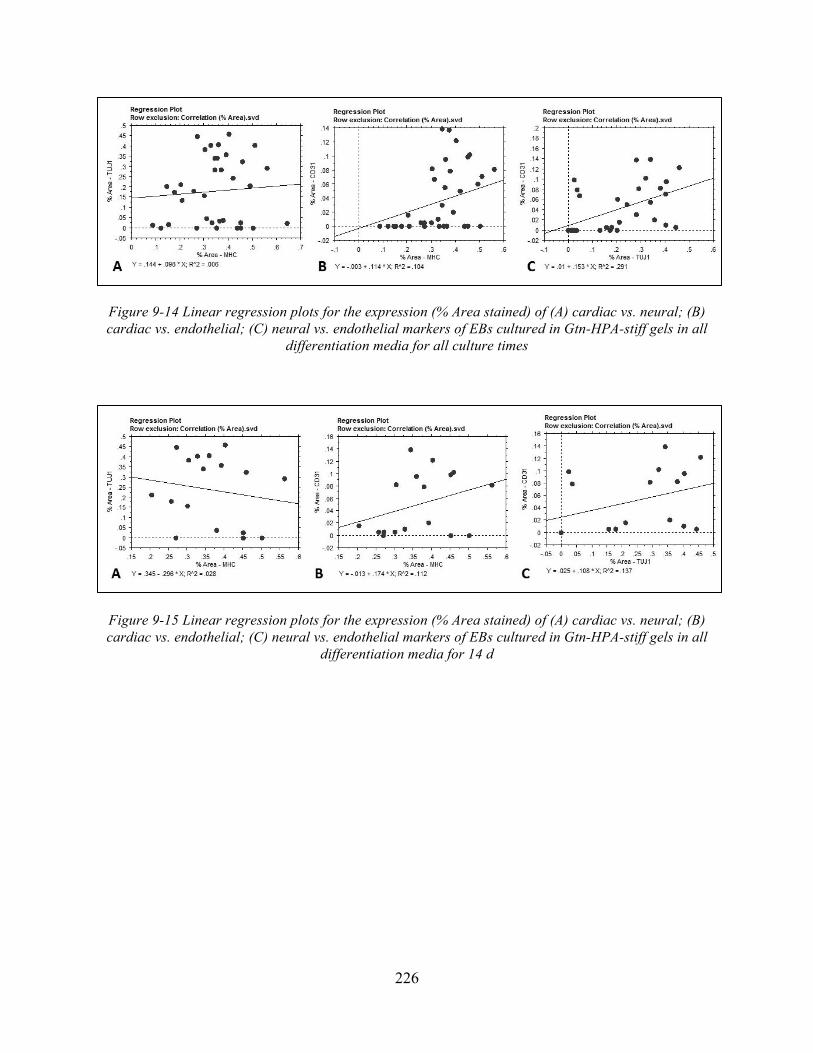
226
Figure 9-14 Linear regression plots for the expression (% Area stained) of (A) cardiac vs. neural; (B) cardiac vs. endothelial; (C) neural vs. endothelial markers of EBs cultured in Gtn-HPA-stiff gels in all
differentiation media for all culture times
Figure 9-15 Linear regression plots for the expression (% Area stained) of (A) cardiac vs. neural; (B) cardiac vs. endothelial; (C) neural vs. endothelial markers of EBs cultured in Gtn-HPA-stiff gels in all
differentiation media for 14 d

227
Figure 9-16 Linear regression plots for the expression of cardiac and neural markers (% Area stained) of EBs incorporated in all gels, cultured in (A) C; (B) N; (C) E; (D) C/N; (E) C/N/E, and (F) Cntl media, for
14 days.

228
Figure 9-17 Linear regression plots for the expression of cardiac and endothelial markers (% Area stained) of EBs incorporated in all gels, cultured in (A) C; (B) N; (C) E; (D) C/N; (E) C/N/E, and (F)
Cntl media, for 14 days.

229
Figure 9-18 Linear regression plots for the expression of neural and endothelial markers (% Area stained) of EBs incorporated in all gels, cultured in (A) C; (B) N; (C) E; (D) C/N; (E) C/N/E, and (F)
Cntl media, for 14 days.

230

231
Chapter 10 References
1. Schmelter, M., et al., Embryonic stem cells utilize reactive oxygen species as transducers of mechanical strain-induced cardiovascular differentiation. FASEB, 2006. 20(8): p. 1182-1184.
2. Vandenburgh, H.H., et al., Response of Neonatal Rat Cardiomyocytes to Repetitive Mechanical Stimulation In Vitro. NYAS, 1995. 752: p. 19-29.
3. Radisic, M., et al., Functional assembly of engineered myocardium by electrical stimulation of cardiac myocytes cultured on scaffolds. PNAS, 2004. 101(52): p. 18129-18134.
4. Ott, H.C., et al., Perfusion-decellularized matrix: using nature's platform to engineer a bioartificial heart. Nat Med, 2008. 14(2): p. 213-221.
5. Menasche, P., Embryonic Stem Cells Pace the Heart. Nat Biotech, 2004. 22(10): p. 1237-1238. 6. Kehat, I., et al., Electromechanical integration of cardiomyocytes derived from human embryonic
stem cells. Nat Biotech, 2004. 22(10): p. 1282-1289. 7. Zammaretti, P. and M. Jaconi, Cardiac tissue engineering: regeneration of the wounded heart.
Curr Op Biotech, 2004. 15: p. 430-434. 8. Orlic, D., et al., Bone marrow cells regenerate infarcted myocardium. Nature, 2001. 410(6829):
p. 701-705. 9. Minguell, J.J. and A. Erices, Mesenchymal Stem Cells and the Treatment of Cardiac Disease. Exp
Bio Med, 2006. 231(1): p. 39-49. 10. Pittenger, M.F. and B.J. Martin, Mesenchymal Stem Cells and Their Potential as Cardiac
Therapeutics. Circ Res, 2004. 95(1): p. 9-20. 11. Kocher, A.A., et al., Neovascularization of ischemic myocardium by human bone-marrow-
derived angioblasts prevents cardiomyocyte apoptosis, reduces remodeling and improves cardiac function. Nat Med, 2001. 7(4): p. 430-436.
12. Alvarez-Dolado, M., et al., Fusion of bone-marrow-derived cells with Purkinje neurons, cardiomyocytes and hepatocytes. Nature, 2003. 425(6961): p. 968-973.
13. Shake, J.G., et al., Mesenchymal stem cell implantation in a swine myocardial infarct model: engraftment and functional effects. Ann Thorac Surg, 2002. 73(6): p. 1919-1926.
14. Nakamura, A. and F.J. Manasek, An experimental study of the relation of cardiac jelly to the shape of the early chick embryonic heart. Journal of Embryology and Experimental Morphology, 1981. 65(1): p. 235-256.
15. Liaudet-Coopman, E.D., G.J. Berchem, and A. Wellstein, In vivo inhibition of angiogenesis and induction of apoptosis by retinoic acid in squamous cell carcinoma. Clinical Cancer Research, 1997. 3(2): p. 179-184.
16. Kraehenbuehl, T.P., et al., Three-dimensional extracellular matrix-directed cardioprogenitor differentiation: Systematic modulation of a synthetic cell-responsive PEG-hydrogel. Biomaterials, 2008. 29(18): p. 2757-2766.
17. Aikawa, E., et al., Human Semilunar Cardiac Valve Remodeling by Activated Cells From Fetus to Adult: Implications for Postnatal Adaptation, Pathology, and Tissue Engineering. Circulation, 2006. 113(10): p. 1344-1352.
18. Yettram, A. and C. Vinson, Orthotropic elastic moduli for left ventricular mechanical behaviour. Medical and Biological Engineering and Computing, 1979. 17(1): p. 25-30.
19. Caroll, E.P., et al., Myocardial stiffness and reparative fibrosis following coronary embolisation in the rat. Cardiovascular Research, 1989. 23(8): p. 655-661.
20. Laflamme, M.A. and C.E. Murry, Regenerating the heart. Nature Biotech, 2005. 23(7): p. 845-856.
21. Speiser, B., et al., The extracellular matrix in human cardiac tissue. Part II: Vimentin, laminin, and fibronectin. Cardioscience, 1992. 3(1): p. 41-9.

232
22. Zamir, E.A. and L.A. Taber, On the Effects of Residual Stress in Microindentation Tests of Soft Tissue Structures. Journal of Biomechanical Engineering, 2004. 126(2): p. 276-283.
23. Butcher, J.T., et al., Transitions in Early Embryonic Atrioventricular Valvular Function Correspond With Changes in Cushion Biomechanics That Are Predictable by Tissue Composition. Circulation Research, 2007. 100(10): p. 1503-1511.
24. Flanagan, T.C., et al., A collagen-glycosaminoglycan co-culture model for heart valve tissue engineering applications. Biomaterials, 2006. 27(10): p. 2233-2246.
25. Costa, K.D., E.J. Lee, and J.W. Holmes, Creating Alignment and Anisotropy in Engineered Heart Tissue: Role of Boundary Conditions in a Model Three-Dimensional Culture System. Tissue Engineering, 2003. 9(4): p. 567-577.
26. Ou, L., et al., Intracardiac injection of matrigel induces stem cell recruitment and improves cardiac functions in a rat myocardial infarction model. Journal of Cellular and Molecular Medicine, 2010: p. no-no.
27. Pak, H.-N., et al., Mesenchymal Stem Cell Injection Induces Cardiac Nerve Sprouting and Increased Tenascin Expression in a Swine Model of Myocardial Infarction. J Cardiovasc Electrophysiol, 2003. 14(8): p. 841-848.
28. Xiang, Z., et al., Collagen-GAG Scaffolds Grafted onto Myocardial Infarcts in a Rat Model: A Delivery Vehicle for Mesenchymal Stem Cells. Tiss Eng, 2006. 12(9): p. 2467-2478.
29. Reinecke, H., et al., Survival, Integration, and Differentiation of Cardiomyocyte Grafts : A Study in Normal and Injured Rat Hearts. Circulation, 1999. 100(2): p. 193-202.
30. Dawn, B. and R. Bolli, Cardiac Progenitor Cells. Circulation Research, 2005. 97(11): p. 1080-1082.
31. Pons, J., et al., VEGF improves survival of mesenchymal stem cells in infarcted hearts. Biochemical and Biophysical Research Communications, 2008. 376(2): p. 419-422.
32. Gersh, B.J., et al., Cardiac Cell Repair Therapy: A Clinical Perspective. Mayo Clinic Proceedings, 2009. 84(10): p. 876-892.
33. Yannas, I.V., et al., Synthesis and characterization of a model extracellular matrix that induces partial regeneration of adult mammalian skin. PNAS, 1989. 86(3): p. 933-937.
34. Chamberlain, L.J., et al., Near-terminus axonal structure and function following rat sciatic nerve regeneration through a collagen-GAG matrix in a ten-millimeter gap. J Neurosci Res, 2000. 60(5): p. 666-677.
35. Zimmermann, W.-H., et al., Cardiac Grafting of Engineered Heart Tissue in Syngenic Rats. Circulation, 2002. 106(90121): p. I-151-157.
36. Zimmermann, W., et al., Three-dimensional engineered heart tissue from neonatal rat cardiac myocytes. Biotech Bioeng, 2000. 68(1): p. 106-114.
37. Chevallay, B. and D. Herbage, Collagen-based biomaterials as 3D scaffold for cell cultures: applications for tissue engineering and gene therapy. Med Bio Eng Comput, 2000. 38(2): p. 211-218.
38. Jin, J., M. Song, and D.J. Hourston, Novel Chitosan-Based Films Cross-Linked by Genipin with Improved Physical Properties. Biomacromolecules, 2003. 5(1): p. 162-168.
39. Sundararaghavan, H.G., et al., Genipin-induced changes in collagen gels: Correlation of mechanical properties to fluorescence. Journal of Biomedical Materials Research Part A, 2008. 87A(2): p. 308-320.
40. Sung, H.-W., et al., Crosslinking of biological tissues using genipin and/or carbodiimide. Journal of Biomedical Materials Research Part A, 2003. 64A(3): p. 427-438.
41. Liang, H.-C., et al., Genipin-crosslinked gelatin microspheres as a drug carrier for intramuscular administration: In vitro and in vivo studies. Journal of Biomedical Materials Research Part A, 2003. 65A(2): p. 271-282.
42. Nickerson, M.T., et al., Kinetic and mechanistic considerations in the gelation of genipin-crosslinked gelatin. International Journal of Biological Macromolecules, 2006. 39(4-5): p. 298-302.
233
43. Orban, J.M., et al., Crosslinking of collagen gels by transglutaminase. Journal of Biomedical Materials Research Part A, 2004. 68A(4): p. 756-762.
44. Chau, D.Y.S., et al., The cellular response to transglutaminase-cross-linked collagen. Biomaterials, 2005. 26(33): p. 6518-6529.
45. Broderick, E.P., et al., Enzymatic stabilization of gelatin-based scaffolds. Journal of Biomedical Materials Research Part B: Applied Biomaterials, 2005. 72B(1): p. 37-42.
46. Ito, A., et al., Transglutaminase-mediated gelatin matrices incorporating cell adhesion factors as a biomaterial for tissue engineering. Journal of Bioscience and Bioengineering, 2003. 95(2): p. 196-199.
47. Lee, F., J.E. Chung, and M. Kurisawa, An injectable enzymatically crosslinked hyaluronic acid-tyramine hydrogel system with independent tuning of mechanical strength and gelation rate. Soft Matter, 2008. 4(4): p. 880-887.
48. Ogushi, Y., S. Sakai, and K. Kawakami, Synthesis of enzymatically-gellable carboxymethylcellulose for biomedical applications. Journal of Bioscience and Bioengineering, 2007. 104(1): p. 30-33.
49. Sakai, S., et al., An injectable, in situ enzymatically gellable, gelatin derivative for drug delivery and tissue engineering. Biomaterials, 2009. 30(20): p. 3371-3377.
50. Jin, R., et al., Chondrogenesis in injectable enzymatically crosslinked heparin/dextran hydrogels. Journal of Controlled Release, 2011. 152(1): p. 186-195.
51. Hamdi, H., et al., Cell Delivery: Intramyocardial Injections or Epicardial Deposition? A Head-to-Head Comparison. Ann Thorac Surg, 2009. 87(4): p. 1196-1203.
52. Nagaya, N., et al., Intravenous administration of mesenchymal stem cells improves cardiac function in rats with acute myocardial infarction through angiogenesis and myogenesis. Am J Physiol Heart Circ Physiol, 2004. 287(6): p. H2670-2676.
53. Caplan, A.I., What's in a Name? Tissue Engineering Part A, 2010. 16(8): p. 2415-2417. 54. Fukuhara, S., et al., Direct cell-cell interaction of cardiomyocytes is key for bone marrow stromal
cells to go into cardiac lineage in vitro. Cardiovasc Surg, 2003. 125(6): p. 1470-1480. 55. Devine, S.M., et al., Mesenchymal stem cells are capable of homing to the bone marrow of non-
human primates following systemic infusion. Exp Hematol, 2001. 29(2): p. 244-255. 56. Toma, C., et al., Human Mesenchymal Stem Cells Differentiate to a Cardiomyocyte Phenotype in
the Adult Murine Heart. Circulation, 2002. 105(1): p. 93-98. 57. Bittira, B., et al., In vitro preprogramming of marrow stromal cells for myocardial regeneration.
Ann Thorac Surg, 2002. 74(4): p. 1154-1160. 58. Xu, W., et al., Mesenchymal Stem Cells from Adult Human Bone Marrow Differentiate into a
Cardiomyocyte Phenotype In Vitro. Exp Bio Med, 2004. 229(7): p. 623-631. 59. Antonitsis, P., et al., In vitro cardiomyogenic differentiation of adult human bone marrow
mesenchymal stem cells. The role of 5-azacytidine. Interact CardioVasc Thorac Surg, 2007. 6(5): p. 593-597.
60. Makino, S., et al., Cardiomyocytes can be generated from marrow stromal cells in vitro. J Clin Invest, 1999. 103: p. 697-705.
61. Wakitani, S., T. Saito, and A.I. Caplan, Myogenic cells derived from rat bone marrow mesenchymal stem cells exposed to 5-azacytidine. Muscle and Nerve, 1995. 18(12): p. 1417-1426.
62. Shim, W.S.N., et al., Ex vivo differentiation of human adult bone marrow stem cells into cardiomyocyte-like cells. Biochem Biophys Res Comm, 2004. 324(2): p. 481-488.
63. Min, J.-Y., et al., Significant improvement of heart function by cotransplantation of human mesenchymal stem cells and fetal cardiomyocytes in postinfarcted pigs. Ann Thorac Surg, 2002. 74(5): p. 1568-1575.
64. Cheng, F., et al., Induced differentiation of human cord blood mesenchymal stem/progenitor cells into cardiomyocyte-like cells in vitro. Journal of Huazhong University of Science and Technology -- Medical Sciences, 2003. 23(2): p. 154-157.
234
65. Erices, A.A., et al., Human Cord Blood-Derived Mesenchymal Stem Cells Home and Survive in the Marrow of Immunodeficient Mice After Systemic Infusion. Cell Transplantation, 2003. 12: p. 555-561.
66. Fukuda, K., Application of mesenchymal stem cells for the regeneration of cardiomyocyte and its use for cell transplantation therapy. Human Cell, 2003. 16(3): p. 83-94.
67. Mangi, A.A., et al., Mesenchymal stem cells modified with Akt prevent remodeling and restore performance of infarcted hearts. Nat Med, 2003. 9(9): p. 1195-1201.
68. Rangappa, S., et al., Cardiomyocyte-mediated contact programs human mesenchymal stem cells to express cardiogenic phenotype. Journal of Thoracic and Cardiovascular Surgery, 2003. 126(1): p. 124-132.
69. Liu, J., et al., Autologous stem cell transplantation for myocardial repair. Am J Physiol Heart Circ Physiol, 2004. 287(2): p. H501-511.
70. Potapova, I., et al., Human Mesenchymal Stem Cells as a Gene Delivery System to Create Cardiac Pacemakers. Circ Res, 2004. 94(7): p. 952-959.
71. Vanelli, P., et al., Cardiac precursors in human bone marrow and cord blood : in vitro cell cardiogenesis. Ital Heart J, 2004. 5(5): p. 384-8.
72. Hirata, Y., et al., Human umbilical cord blood cells improve cardiac function after myocardial infarction. Biochemical and Biophysical Research Communications, 2005. 327(2): p. 609-614.
73. Heng, B.C., et al., Strategies for directing the differentiation of stem cells into the cardiomyogenic lineage in vitro. Cardiovasc Res, 2004. 62(1): p. 34-42.
74. Holt, E., et al., Electrical stimulation of adult rat cardiomyocytes in culture improves contractile properties and is associated with altered calcium handling. Basic Res Cardiol, 1997. 92(5): p. 289-298.
75. Xia, Y., et al., Electrical stimulation of neonatal cardiomyocytes results in the sequential activation of nuclear genes governing mitochondrial proliferation and differentiation. PNAS, 1997. 94(21): p. 11399-11404.
76. Chen, M.Q., et al. Cardiac differentiation of embryonic stem cells with point-source electrical stimulation. in Eng Med Bio Soc: 30th Annual International Conference of the IEEE. 2008.
77. Decker, M.L., et al., Regulation of adult cardiocyte growth: effects of active and passive mechanical loading. Am J Physiol Heart Circ Physiol, 1997. 272(6): p. H2902-2918.
78. Ruwhof, C., et al., Cyclic stretch induces the release of growth promoting factors from cultured neonatal cardiomyocytes and cardiac fibroblasts. Mol Cell Biochem, 2000. 208(1): p. 89-98.
79. Müller-Ehmsen, J., et al., Survival and Development of Neonatal Rat Cardiomyocytes Transplanted into Adult Myocardium. J Mol Cell Cardiol, 2002. 34(2): p. 107-116.
80. Zhang, M., et al., Cardiomyocyte Grafting for Cardiac Repair: Graft Cell Death and Anti-Death Strategies. J Mol Cell Cardiol, 2001. 33(5): p. 907-921.
81. Leor, J., et al., Bioengineered Cardiac Grafts : A New Approach to Repair the Infarcted Myocardium? Circulation, 2000. 102(90003): p. III-56-61.
82. ClinicalTrials.gov. Safety Study of Adult Mesenchymal Stem Cells (MSC) to Treat Acute Myocardial Infarction. 2005 [cited 2009 3-18].
83. ClinicalTrials.gov. Combined CABG and Stem-Cell Transplantation for Heart Failure. 2007 [cited 2009 Mar 18].
84. ClinicalTrials.gov. Prospective Randomized Study of Mesenchymal Stem Cell Therapy in Patients Undergoing Cardiac Surgery (PROMETHEUS). 2008.
85. Griffith, L.G. and G. Naughton, Tissue Engineering--Current Challenges and Expanding Opportunities. Science, 2002. 295(5557): p. 1009-1014.
86. Bjorklund, L.M., et al., Embryonic stem cells develop into functional dopaminergic neurons after transplantation in a Parkinson rat model. PNAS, 2002. 99(4): p. 2344-2349.
87. Wichterle, H., et al., Directed Differentiation of Embryonic Stem Cells into Motor Neurons. Cell, 2002. 110(3): p. 385-397.
235
88. Fraichard, A., et al., In vitro differentiation of embryonic stem cells into glial cells and functional neurons. J Cell Sci, 1995. 108(10): p. 3181-3188.
89. Levenberg, S., et al., Endothelial cells derived from human embryonic stem cells. PNAS, 2002. 99(7): p. 4391-4396.
90. McBurney, M., et al., Control of muscle and neuronal differentiation in a cultured embryonal carcinoma cell line. Nature, 1982. 299(5879): p. 165-167.
91. Jones-Villeneuve, E.M.V., et al., Retinoic Acid Induces Embryonal Carcinoma Cells to Differentiate into Neurons and Glial Cells. J Cell Bio, 1982. 94(2): p. 253-262.
92. McBurney, M.W., P19 embryonal carcinoma cells. Int. J. Dev. Biol., 1993. 37: p. 135 - 140. 93. Choi, S.-C., et al., 5-azacytidine induces cardiac differentiation of P19 embryonic stem cells. Exp
Molec Med, 2004. 36(6): p. 515-523. 94. Paquin, J., et al., Oxytocin induces differentiation of P19 embryonic stem cells to cardiomyocytes.
PNAS, 2002. 99(14): p. 9550-9555. 95. Choi, S.-C., et al., P19 Embryonal carcinoma cells: a new model for the study of endothelial cell
differentiation. Biotech Letters, 2008. 30(7): p. 1169-1175. 96. Amit, M., et al., Feeder Layer- and Serum-Free Culture of Human Embryonic Stem Cells.
Biology of Reproduction, 2004. 70(3): p. 837-845. 97. Skerjanc, I.S., Cardiac and Skeletal Muscle Development in P19 Embryonal Carcinoma Cells.
Trends Cardiovasc Med, 1999. 9(5): p. 139-143. 98. Pittenger, M.F., et al., Multilineage Potential of Adult Human Mesenchymal Stem Cells. Science,
1999. 284(5411): p. 143-147. 99. Javazon, E.H., K.J. Beggs, and A.W. Flake, Mesenchymal stem cells: paradoxes of passaging.
Experimental Hematology, 2004. 32(5): p. 414-425. 100. Prockop, D.J., Repair of Tissues by Adult Stem/Progenitor Cells (MSCs): Controversies, Myths,
and Changing Paradigms. Mol Ther, 2009. 17(6): p. 939-946. 101. Dawn, B. and R. Bolli, Bone marrow cells for cardiac regeneration: the quest for the protagonist
continues. Cardiovasc Res, 2005. 65(2): p. 293-295. 102. Hatzistergos, K.E., et al., Bone Marrow Mesenchymal Stem Cells Stimulate Cardiac Stem Cell
Proliferation and Differentiation. Circ Res, 2010. 107(7): p. 913-922. 103. Tang, Y.L., et al., Autologous mesenchymal stem cell transplantation induce VEGF and
neovascularization in ischemic myocardium. Regulatory Peptides, 2004. 117(1): p. 3-10. 104. McCulloch, C.A., et al., Osteogenic progenitor cells in rat bone marrow stromal populations
exhibit self-renewal in culture. Blood, 1991. 77(9): p. 1906-1911. 105. Tanaka, H., et al., Actions of bFGF on mitogenic activity and lineage expression in rat
osteoprogenitor cells: effect of age. Molecular and Cellular Endocrinology, 1999. 150(1-2): p. 1-10.
106. Boheler, K.R., et al., Differentiation of Pluripotent Embryonic Stem Cells Into Cardiomyocytes. Circ Res, 2002. 91(3): p. 189-201.
107. van der Heyden, M.A.G. and L.H.K. Defize, Twenty one years of P19 cells: what an embryonal carcinoma cell line taught us about cardiomyocyte differentiation. Cardiovascular Research, 2003. 58(2): p. 292-302.
108. Marikawa, Y., et al., Aggregated P19 mouse embryonal carcinoma cells as a simple in vitro model to study the molecular regulations of mesoderm formation and axial elongation morphogenesis. genesis, 2009. 47(2): p. 93-106.
109. Cai, D., et al., Lapine and Canine Bone Marrow Stromal Cells Contain Smooth Muscle Actin and Contract a Collagen-Glycosaminoglycan Matrix. Tissue Engineering, 2001. 7(6 %R doi:10.1089/107632701753337762): p. 829-841.
110. Kinner, B., J.M. Zaleskas, and M. Spector, Regulation of Smooth Muscle Actin Expression and Contraction in Adult Human Mesenchymal Stem Cells. Exp Cell Res, 2002. 278(1): p. 72-83.
111. Rudnicki, M.A., et al., Smooth muscle actin expression during P19 embryonal carcinoma differentiation in cell culture. Journal of Cellular Physiology, 1990. 142(1): p. 89-98.

236
112. Friedenstein, A., et al., Precursors for fibroblasts in different populations of hematopoietic cells as detected by the in vitro colony assay method. Exp Hematol, 1974. 2(2): p. 83-92.
113. Haynesworth, S.E., et al., Characterization of cells with osteogenic potential from human marrow. Bone, 1992. 13(1): p. 81-88.
114. Solchaga, L.A., et al., FGF-2 enhances the mitotic and chondrogenic potentials of human adult bone marrow-derived mesenchymal stem cells. Journal of Cellular Physiology, 2005. 203(2): p. 398-409.
115. Prockop, D.J., Marrow Stromal Cells as Stem Cells for Nonhematopoietic Tissues. Science, 1997. 276(5309): p. 71-74.
116. Johnstone, B., et al., In Vitro Chondrogenesis of Bone Marrow-Derived Mesenchymal Progenitor Cells. Exp Cell Res, 1998. 238(1): p. 265-272.
117. Jakob, M., et al., Specific growth factors during the expansion and redifferentiation of adult human articular chondrocytes enhance chondrogenesis and cartilaginous tissue formation in vitro. Journal of Cellular Biochemistry, 2001. 81(2): p. 368-377.
118. Kinner, B. and M. Spector, Smooth muscle actin expression by human articular chondrocytes and their contraction of a collagen-glycosaminoglycan matrix in vitro. Journal of Orthopaedic Research, 2001. 19(2): p. 233-241.
119. Bruder, S.P., N. Jaiswal, and S.E. Haynesworth, Growth kinetics, self-renewal, and the osteogenic potential of purified human mesenchymal stem cells during extensive subcultivation and following cryopreservation. Journal of Cellular Biochemistry, 1997. 64(2): p. 278-294.
120. Woodbury, D., et al., Adult rat and human bone marrow stromal cells differentiate into neurons. J Neurosci Res, 2000. 61(4): p. 364-370.
121. O'Brien, F.J., et al., Influence of freezing rate on pore structure in freeze-dried collagen-GAG scaffolds. Biomaterials, 2004. 25(6): p. 1077-1086.
122. Weadock, K.S., et al., Physical crosslinking of collagen fibers: Comparison of ultraviolet irradiation and dehydrothermal treatment. J Biomed Mat Res, 1995. 29(11): p. 1373-1379.
123. Olde Damink, L.H.H., et al., Cross-linking of dermal sheep collagen using a water-soluble carbodiimide. Biomaterials, 1996. 17(8): p. 765-773.
124. Lee, C.R., A.J. Grodzinsky, and M. Spector, The effects of cross-linking of collagen-glycosaminoglycan scaffolds on compressive stiffness, chondrocyte-mediated contraction, proliferation and biosynthesis. Biomaterials, 2001. 22(23): p. 3145-3154.
125. Vickers, S.M., L.S. Squitieri, and M. Spector, Effects of Cross-linking Type II Collagen-GAG Scaffolds on Chondrogenesis In Vitro: Dynamic Pore Reduction Promotes Cartilage Formation. Tiss Eng, 2006. 12(5): p. 1345-1355.
126. Farndale, R.W., D.J. Buttle, and A.J. Barrett, Improved quantitation and discrimination of sulphated glycosaminoglycans by use of dimethylmethylene blue. Biochimica et Biophysica Acta (BBA) - General Subjects, 1986. 883(2): p. 173-177.
127. Oswald, J., et al., Mesenchymal Stem Cells Can Be Differentiated Into Endothelial Cells In Vitro. Stem Cells, 2004. 22(3): p. 377-384.
128. Ng, K.K., H.S. Thatte, and M. Spector, Chondrogenic differentiation of adult mesenchymal stem cells and embryonic cells in collagen scaffolds. Journal of Biomedical Materials Research Part A, 2011. 99A(2): p. 275-282.
129. Yamashita, J., et al., Flk1-positive cells derived from embryonic stem cells serve as vascular progenitors. Nature, 2000. 408(6808): p. 92-96.
130. Suzuki, T., et al., Preferential Differentiation of P19 Mouse Embryonal Carcinoma Cells Into Smooth Muscle Cells : Use of Retinoic Acid and Antisense Against the Central Nervous System–Specific POU Transcription Factor Brn-2. Circ Res, 1996. 78(3): p. 395-404.
131. Awad, H.A., et al., In vitro characterization of mesenchymal stem cell-seeded collagen scaffolds for tendon repair: Effects of initial seeding density on contraction kinetics. Journal of Biomedical Materials Research, 2000. 51(2): p. 233-240.
237
132. Lee, C.R., et al., Articular Cartilage Chondrocytes in Type I and Type II Collagen-GAG Matrices Exhibit Contractile Behavior in Vitro. Tissue Engineering, 2000. 6(5): p. 555-565.
133. Vickers, S.M., T. Gotterbarm, and M. Spector, Cross-linking affects cellular condensation and chondrogenesis in type II collagen-GAG scaffolds seeded with bone marrow-derived mesenchymal stem cells. Journal of Orthopaedic Research, 2010. 28(9): p. 1184-1192.
134. Sachlos, E. and D.T. Auguste, Embryoid body morphology influences diffusive transport of inductive biochemicals: A strategy for stem cell differentiation. Biomaterials, 2008. 29(34): p. 4471-4480.
135. Lorenz, H.P., et al., Scarless wound repair: a human fetal skin model. Development, 1992. 114(1): p. 253-259.
136. Martinez-Ferrer, M., et al., Dermal Transforming Growth Factor-[beta] Responsiveness Mediates Wound Contraction and Epithelial Closure. The American journal of pathology, 2010. 176(1): p. 98-107.
137. Metcalfe, A.D. and M.W.J. Ferguson, Bioengineering skin using mechanisms of regeneration and repair. Biomaterials, 2007. 28(34): p. 5100-5113.
138. Glowacki, J. and S. Mizuno, Collagen scaffolds for tissue engineering. Biopolymers, 2008. 89(5): p. 338-344.
139. Pfeiffer, E., et al., The effects of glycosaminoglycan content on the compressive modulusof cartilage engineered in type II collagen scaffolds. Osteoarthritis and Cartilage, 2008. 16: p. 1237-1244.
140. Chamberlain, L.J., et al., Early peripheral nerve healing in collagen and silicone tube implants: Myofibroblasts and the cellular response. Biomaterials, 1998. 19(15): p. 1393-1403.
141. Weadock, K., R.M. Olson, and F.H. Silver, Evaluation of Collagen Crosslinking Techniques. Artificial Cells, Blood Substitutes and Biotechnology, 1983. 11(4): p. 293-318.
142. Dedhar, S., K. Robertson, and V. Gray, Induction of expression of the alpha v beta 1 and alpha v beta 3 integrin heterodimers during retinoic acid-induced neuronal differentiation of murine embryonal carcinoma cells. Journal of Biological Chemistry, 1991. 266(32): p. 21846-21852.
143. Davis, G.E., Affinity of integrins for damaged extracellular matrix: αvβ3 binds to denatured collagen type I through RGD sites. Biochemical and Biophysical Research Communications, 1992. 182(3): p. 1025-1031.
144. Hidai, C., et al., Cloning and characterization of developmental endothelial locus-1: An embryonic endothelial cell protein that binds the αvβ3 integrin receptor. Genes & Development, 1998. 12(1): p. 21-33.
145. Finley, M., N. Kulkarni, and J. Huettner, Synapse formation and establishment of neuronal polarity by P19 embryonic carcinoma cells and embryonic stem cells. The Journal of Neuroscience, 1996. 16(3): p. 1056-1065.
146. Mani, S., J. Schaefer, and K.F. Meiri, Targeted disruption of GAP-43 in P19 embryonal carcinoma cells inhibits neuronal differentiation: As well as acquisition of the morphological phenotype. Brain Research, 2000. 853(2): p. 384-395.
147. Silva, G.V., et al., Mesenchymal Stem Cells Differentiate into an Endothelial Phenotype, Enhance Vascular Density, and Improve Heart Function in a Canine Chronic Ischemia Model. Circulation, 2005. 111(2): p. 150-156.
148. Hashemi, S.M., et al., A placebo controlled, dose-ranging, safety study of allogenic mesenchymal stem cells injected by endomyocardial delivery after an acute myocardial infarction. European Heart Journal, 2008. 29(2): p. 251-259.
149. Krampera, M., et al., Induction of neural-like differentiation in human mesenchymal stem cells derived from bone marrow, fat, spleen and thymus. Bone, 2007. 40(2): p. 382-390.
150. Bossolasco, P., et al., Neuro-glial differentiation of human bone marrow stem cells in vitro. Experimental Neurology, 2005. 193(2): p. 312-325.
151. Sanchez-Ramos, J., et al., Adult Bone Marrow Stromal Cells Differentiate into Neural Cells in Vitro. Exp Neuro, 2000. 164(2): p. 247-256.

238
152. Lu, P., A. Blesch, and M.H. Tuszynski, Induction of bone marrow stromal cells to neurons: Differentiation, transdifferentiation, or artifact? Journal of Neuroscience Research, 2004. 77(2): p. 174-191.
153. Neuhuber, B., et al., Reevaluation of in vitro differentiation protocols for bone marrow stromal cells: Disruption of actin cytoskeleton induces rapid morphological changes and mimics neuronal phenotype. Journal of Neuroscience Research, 2004. 77(2): p. 192-204.
154. Jazayeri, M., et al., Molecular and ultrastructural characterization of endothelial cells differentiated from human bone marrow mesenchymal stem cells. Cell Biology International, 2008. 32(10): p. 1183-1192.
155. Tögel, F., et al., Vasculotropic, paracrine actions of infused mesenchymal stem cells are important to the recovery from acute kidney injury. American Journal of Physiology - Renal Physiology, 2007. 292(5): p. F1626-F1635.
156. Jasmin, et al., Induction of cardiac differentiation in P19 cells. Stem Cells and Development, 2009.
157. Levenberg, S., et al., Differentiation of human embryonic stem cells on three-dimensional polymer scaffolds. Proceedings of the National Academy of Sciences, 2003. 100(22): p. 12741-12746.
158. McBurney, M., et al., Differentiation and maturation of embryonal carcinoma-derived neurons in cell culture. The Journal of Neuroscience, 1988. 8(3): p. 1063-1073.
159. Ma, W., et al., CNS stem and progenitor cell differentiation into functional neuronal circuits in three-dimensional collagen gels. Experimental Neurology, 2004. 190(2): p. 276-288.
160. Battista, S., et al., The effect of matrix composition of 3D constructs on embryonic stem cell differentiation. Biomaterials, 2005. 26(31): p. 6194-6207.
161. Lander, C., H. Zhang, and S. Hockfield, Neurons Produce a Neuronal Cell Surface-Associated Chondroitin Sulfate Proteoglycan. The Journal of Neuroscience, 1998. 18(1): p. 174-183.
162. Madri, J.A., B.M. Pratt, and A.M. Tucker, Phenotypic modulation of endothelial cells by transforming growth factor-beta depends upon the composition and organization of the extracellular matrix. The Journal of Cell Biology, 1988. 106(4): p. 1375-1384.
163. Christman, K.L., et al., Fibrin Glue Alone and Skeletal Myoblasts in a Fibrin Scaffold Preserve Cardiac Function after Myocardial Infarction. Tissue Engineering, 2004. 10(3-4): p. 403-409.
164. Huang, N.F., et al., Injectable Biopolymers Enhance Angiogenesis after Myocardial Infarction. Tissue Engineering, 2005. 11(11-12): p. 1860-1866.
165. Ifkovits, J.L., et al., Injectable hydrogel properties influence infarct expansion and extent of postinfarction left ventricular remodeling in an ovine model. Proceedings of the National Academy of Sciences, 2010. 107(25): p. 11507-11512.
166. Ifkovits, J.L. and J.A. Burdick, Review: Photopolymerizable and Degradable Biomaterials for Tissue Engineering Applications. Tissue Engineering, 2007. 13(10): p. 2369-2385.
167. Gutowska, A., B. Jeong, and M. Jasionowski, Injectable gels for tissue engineering. The Anatomical Record, 2001. 263(4): p. 342-349.
168. Macaya, D., K.K. Ng, and M. Spector, Injectable Collagen–Genipin Gel for the Treatment of Spinal Cord Injury: In Vitro Studies. Advanced Functional Materials, 2011: p. n/a-n/a.
169. Chen, M.-C., et al., A novel drug-eluting stent spray-coated with multi-layers of collagen and sirolimus. Journal of Controlled Release, 2005. 108(1): p. 178-189.
170. Chang, Y., et al., Reconstruction of the right ventricular outflow tract with a bovine jugular vein graft fixed with a naturally occurring crosslinking agent (genipin) in a canine model. J Thorac Cardiovasc Surg, 2001. 122(6): p. 1208-1218.
171. Somers, P., et al., Genipin Blues: An Alternative Non-Toxic Crosslinker for Heart Valves? Journal of Heart Valve Disease, 2008. 17(6): p. 682-8.
172. Kanaji, T., et al., Primary structure of microbial transglutaminase from Streptoverticillium sp. strain s-8112. Journal of Biological Chemistry, 1993. 268(16): p. 11565-11572.

239
173. Matsumura, Y., D.S. Lee, and T. Mori, Molecular weight distributions of [alpha]-lactalbumin polymers formed by mammalian and microbial transglutaminases. Food Hydrocolloids, 2000. 14(1): p. 49-59.
174. Lee, D.-S., et al., Identification of the ε-(γ-Glutamyl)lysine Cross-Linking Sites in α-Lactalbumin Polymerized by Mammalian and Microbial Transglutaminases. Journal of Agricultural and Food Chemistry, 2002. 50(25): p. 7412-7419.
175. Zhang, G., et al., Effects of Ca2+ and Sulfhydryl Reductant on the Polymerization of Soybean Glycinin Catalyzed by Mammalian and Microbial Transglutaminases. Journal of Agricultural and Food Chemistry, 2002. 51(1): p. 236-243.
176. Wang, L.-S., et al., Injectable biodegradable hydrogels with tunable mechanical properties for the stimulation of neurogenesic differentiation of human mesenchymal stem cells in 3D culture. Biomaterials, 2010. 31(6): p. 1148-1157.
177. Boontheekul, T., et al., Regulating Myoblast Phenotype Through Controlled Gel Stiffness and Degradation. Tissue Engineering, 2007. 13(7): p. 1431-1442.
178. Hu, M., et al., Cell immobilization in gelatin-hydroxyphenylpropionic acid hydrogel fibers. Biomaterials, 2009. 30(21): p. 3523-3531.
179. Wang, L.-S., et al., The role of stiffness of gelatin-hydroxyphenylpropionic acid hydrogels formed by enzyme-mediated crosslinking on the differentiation of human mesenchymal stem cell. Biomaterials, 2010. 31(33): p. 8608-8616.
180. Snyder, S.L. and P.Z. Sobocinski, An improved 2,4,6-trinitrobenzenesulfonic acid method for the determination of amines. Analytical Biochemistry, 1975. 64(1): p. 284-288.
181. Boyce, M.C. and E.M. Arruda, Constitutive models of rubber elasticity : A review. Rubber Chemistry and Technology, 2000. 73(3): p. 504-523.
182. Forgacs, G., et al., Assembly of Collagen Matrices as a Phase Transition Revealed by Structural and Rheologic Studies. Biophysical journal, 2003. 84(2): p. 1272-1280.
183. Palmer, M.P., et al., Injection temperature significantly affects in vitro and in vivo performance of collagen-platelet scaffolds. Journal of Orthopaedic Research, 2009. 27(7): p. 964-971.
184. Sato, K., et al., Possible Involvement of Aminotelopeptide in Self-assembly and Thermal Stability of Collagen I as Revealed by Its Removal with Proteases. Journal of Biological Chemistry, 2000. 275(33): p. 25870-25875.
185. Pieper, J.S., et al., Development of tailor-made collagen-glycosaminoglycan matrices: EDC/NHS crosslinking, and ultrastructural aspects. Biomaterials, 2000. 21(6): p. 581-593.
186. Ma, L., et al., Enhanced biological stability of collagen porous scaffolds by using amino acids as novel cross-linking bridges. Biomaterials, 2004. 25(15): p. 2997-3004.
187. Yan, L.-P., et al., Genipin-cross-linked collagen/chitosan biomimetic scaffolds for articular cartilage tissue engineering applications. Journal of Biomedical Materials Research Part A, 2010. 95A(2): p. 465-475.
188. Yang, Y.-l., L.M. Leone, and L.J. Kaufman, Elastic Moduli of Collagen Gels Can Be Predicted from Two-Dimensional Confocal Microscopy. Biophysical journal, 2009. 97(7): p. 2051-2060.
189. MacKintosh, F.C., J. Käs, and P.A. Janmey, Elasticity of Semiflexible Biopolymer Networks. Physical Review Letters, 1995. 75(24): p. 4425.
190. Morse, D.C., Viscoelasticity of Concentrated Isotropic Solutions of Semiflexible Polymers. 1. Model and Stress Tensor. Macromolecules, 1998. 31(20): p. 7030-7043.
191. Spinale, F.G., et al., Dynamic Changes in Matrix Metalloprotienase Activity Within the Human Myocardial Interstitium During Myocardial Arrest and Reperfusion. Circulation, 2008. 118(14 suppl 1): p. S16-S23.
192. Creemers, E.E.J.M., et al., Matrix Metalloproteinase Inhibition After Myocardial Infarction. Circulation Research, 2001. 89(3): p. 201-210.
193. Desmoulière, A., C. Chaponnier, and G. Gabbiani, Perspective Article: Tissue repair, contraction, and the myofibroblast. Wound Repair and Regeneration, 2005. 13(1): p. 7-12.

240
194. Feng, Z., T. Matsumoto, and T. Nakamura, Measurements of the mechanical properties of contracted collagen gels populated with rat fibroblasts or cardiomyocytes. Journal of Artificial Organs, 2003. 6(3): p. 192-196.
195. Kitano, A., et al., Genipin Suppresses Subconjunctival Fibroblast Migration, Proliferation and Myofibroblast Transdifferentiation. Ophthalmic Research, 2006. 38(6): p. 355-360.
196. Imanishi, Y., et al., Suppression of Rat Stellate Cell Activation and Liver Fibrosis by a Japanese Herbal Medicine, Inchinko-to (TJ135). Comparative Hepatology, 2004. 3(Suppl 1): p. S11.
197. Imanishi, Y., et al., Herb medicine Inchin-ko-to (TJ-135) regulates PDGF-BB-dependent signaling pathways of hepatic stellate cells in primary culture and attenuates development of liver fibrosis induced by thioacetamide administration in rats. Journal of Hepatology, 2004. 41(2): p. 242-250.
198. Koo, H.-J., et al., Anti-inflammatory evaluation of gardenia extract, geniposide and genipin. Journal of Ethnopharmacology, 2006. 103(3): p. 496-500.
199. Barbetta, A., et al., Enzymatic Cross-Linking versus Radical Polymerization in the Preparation of Gelatin PolyHIPEs and Their Performance as Scaffolds in the Culture of Hepatocytes. Biomacromolecules, 2006. 7(11): p. 3059-3068.
200. Kuwahara, K., et al., Cell Delivery Using an Injectable and Adhesive Transglutaminase–Gelatin Gel. Tissue Engineering Part C: Methods, 2010. 16(4): p. 609-618.
201. Chen, R.-N., H.-O. Ho, and M.-T. Sheu, Characterization of collagen matrices crosslinked using microbial transglutaminase. Biomaterials, 2005. 26(20): p. 4229-4235.
202. Oudgenoeg, G., et al., Peroxidase-Mediated Cross-Linking of a Tyrosine-Containing Peptide with Ferulic Acid. Journal of Agricultural and Food Chemistry, 2001. 49(5): p. 2503-2510.
203. Van Vlierberghe, S., et al., Porous Gelatin Hydrogels: 1. Cryogenic Formation and Structure Analysis. Biomacromolecules, 2007. 8(2): p. 331-337.
204. Landers, R., et al., Rapid prototyping of scaffolds derived from thermoreversible hydrogels and tailored for applications in tissue engineering. Biomaterials, 2002. 23(23): p. 4437-4447.
205. Peyton, S.R., et al., The effects of matrix stiffness and RhoA on the phenotypic plasticity of smooth muscle cells in a 3-D biosynthetic hydrogel system. Biomaterials, 2008. 29(17): p. 2597-2607.
206. Awad, H.A., et al., Chondrogenic differentiation of adipose-derived adult stem cells in agarose, alginate, and gelatin scaffolds. Biomaterials, 2004. 25(16): p. 3211-3222.
207. Al-Awqati, Q. and J.A. Oliver, Stem cells in the kidney. Kidney Int, 2002. 61(2): p. 387-395. 208. Beltrami, A.P., et al., Adult Cardiac Stem Cells Are Multipotent and Support Myocardial
Regeneration. Cell, 2003. 114(6): p. 763-776. 209. Loumes, L., Dynamic Role of the Cardiac Jelly. 2009. 210. Narmoneva, D.A., et al., Endothelial Cells Promote Cardiac Myocyte Survival and Spatial
Reorganization: Implications for Cardiac Regeneration. Circulation, 2004. 110(8): p. 962-968. 211. Zhang, J., et al., Functional Cardiomyocytes Derived From Human Induced Pluripotent Stem
Cells. Circ Res, 2009. 104(4): p. e30-41. 212. Nussbaum, J., et al., Transplantation of undifferentiated murine embryonic stem cells in the
heart: teratoma formation and immune response. The FASEB Journal, 2007. 21(7): p. 1345-1357.
213. Lee, J., et al., Injectable gel: Poly(ethylene glycol)–sebacic acid polyester. Polymer, 2006. 47(11): p. 3760-3766.
214. Engler, A.J., et al., Matrix Elasticity Directs Stem Cell Lineage Specification. Cell, 2006. 126(4): p. 677-689.
215. Shapira-Schweitzer, K., et al., A photopolymerizable hydrogel for 3-D culture of human embryonic stem cell-derived cardiomyocytes and rat neonatal cardiac cells. Journal of Molecular and Cellular Cardiology, 2009. 46(2): p. 213-224.
216. Berry, M.F., et al., Mesenchymal stem cell injection after myocardial infarction improves myocardial compliance. Am J Physiol Heart Circ Physiol, 2006. 290(6): p. H2196-2203.

241
217. Shimizu, T., et al., Two-Dimensional Manipulation of Cardiac Myocyte Sheets Utilizing Temperature-Responsive Culture Dishes Augments the Pulsatile Amplitude. Tissue Engineering, 2001. 7(2): p. 141-151.
218. Stegemann, J.P. and R.M. Nerem, Altered response of vascular smooth muscle cells to exogenous biochemical stimulation in two- and three-dimensional culture. Experimental Cell Research, 2003. 283(2): p. 146-155.
219. Peyton, S., et al., The emergence of ECM mechanics and cytoskeletal tension as important regulators of cell function. Cell Biochemistry and Biophysics, 2007. 47(2): p. 300-320.
220. Banerjee, A., et al., The influence of hydrogel modulus on the proliferation and differentiation of encapsulated neural stem cells. Biomaterials, 2009. 30(27): p. 4695-4699.
221. Saha, K., et al., Substrate Modulus Directs Neural Stem Cell Behavior. Biophysical journal, 2008. 95(9): p. 4426-4438.
222. Ferreira, L.S., et al., Bioactive hydrogel scaffolds for controllable vascular differentiation of human embryonic stem cells. Biomaterials, 2007. 28(17): p. 2706-2717.
223. Nakamura, T., et al., A Wnt- and β-catenin-dependent pathway for mammalian cardiac myogenesis. Proceedings of the National Academy of Sciences, 2003. 100(10): p. 5834-5839.
224. Zandstra, P.W., et al., Scalable Production of Embryonic Stem Cell-Derived Cardiomyocytes. Tissue Engineering, 2003. 9(4): p. 767-778.
225. Drab, M., et al., From totipotent embryonic stem cells to spontaneously contracting smooth muscle cells: a retinoic acid and db-cAMP in vitro differentiation model. The FASEB Journal, 1997. 11(11): p. 905-915.
226. Wurmser, A.E., et al., Cell fusion-independent differentiation of neural stem cells to the endothelial lineage. Nature, 2004. 430(6997): p. 350-356.
227. Kini, A.R., et al., Angiogenesis in acute promyelocytic leukemia: induction by vascular endothelial growth factor and inhibition by all-trans retinoic acid. Blood, 2001. 97(12): p. 3919-3924.
228. Ventura, C., et al., Hyaluronan Mixed Esters of Butyric and Retinoic Acid Drive Cardiac and Endothelial Fate in Term Placenta Human Mesenchymal Stem Cells and Enhance Cardiac Repair in Infarcted Rat Hearts. Journal of Biological Chemistry, 2007. 282(19): p. 14243-14252.
229. Mauritz, C., et al., Generation of Functional Murine Cardiac Myocytes From Induced Pluripotent Stem Cells. Circulation, 2008. 118(5): p. 507-517.
230. O'Connor, S.M., et al., Primary neural precursor cell expansion, differentiation and cytosolic Ca2+ response in three-dimensional collagen gel. Journal of Neuroscience Methods, 2000. 102(2): p. 187-195.
231. Willerth, S.M., et al., Optimization of fibrin scaffolds for differentiation of murine embryonic stem cells into neural lineage cells. Biomaterials, 2006. 27(36): p. 5990-6003.
232. Bergers, G. and S. Song, The role of pericytes in blood-vessel formation and maintenance. Neuro-Oncology, 2005. 7(4): p. 452-464.
233. Ozerdem, U. and W.B. Stallcup, Pathological angiogenesis is reduced by targeting pericytes via the NG2 proteoglycan. Angiogenesis, 2004. 7(3): p. 269-276.
234. Ballabh, P., A. Braun, and M. Nedergaard, The blood-brain barrier: an overview: Structure, regulation, and clinical implications. Neurobiology of Disease, 2004. 16(1): p. 1-13.
235. Cleaver, O. and D.A. Melton, Endothelial signaling during development. Nat Med, 2003. 9(6): p. 661-668.
236. Etchevers, H.C., G. Couly, and N.M. Le Douarin, Morphogenesis of the Branchial Vascular Sector. Trends in Cardiovascular Medicine, 2002. 12(7): p. 299-304.
237. Bergwerff, M., et al., Neural Crest Cell Contribution to the Developing Circulatory System : Implications for Vascular Morphology? Circulation Research, 1998. 82(2): p. 221-231.
238. Coultas, L., K. Chawengsaksophak, and J. Rossant, Endothelial cells and VEGF in vascular development. Nature, 2005. 438(7070): p. 937-945.
242
239. Schwarz, Q., et al., Vascular endothelial growth factor controls neuronal migration and cooperates with Sema3A to pattern distinct compartments of the facial nerve. Genes & Development, 2004. 18(22): p. 2822-2834.
240. Reese, D.E., C.E. Hall, and T. Mikawa, Negative Regulation of Midline Vascular Development by the Notochord. Developmental Cell, 2004. 6(5): p. 699-708.
241. Hogan, K.A., et al., The neural tube patterns vessels developmentally using the VEGF signaling pathway. Development, 2004. 131(7): p. 1503-1513.
242. Nagase, T., et al., Angiogenesis within the developing mouse neural tube is dependent on sonic hedgehog signaling: possible roles of motor neurons. Genes to Cells, 2005. 10(6): p. 595-604.
243. Greenberg, D.A. and K. Jin, From angiogenesis to neuropathology. Nature, 2005. 438(7070): p. 954-959.
244. Butcher, J.T. and R.R. Markwald, Valvulogenesis: the moving target. Philosophical Transactions of the Royal Society B: Biological Sciences, 2007. 362(1484): p. 1489-1503.
245. Watanabe, E., et al., Effect of basic fibroblast growth factor on angiogenesis in the infarcted porcine heart. Basic Research in Cardiology, 1998. 93(1): p. 30-37.
246. Sun, J.P., et al., Alterations of Regional Myocardial Function in a Swine Model of Myocardial Infarction Assessed by Echocardiographic 2-Dimensional Strain Imaging. J Am Soc Echocardio, 2007. 20(5): p. 498-504.
247. Sakaguchi, G., et al., A pig model of chronic heart failure by intracoronary embolization with gelatin sponge. Ann Thorac Surg, 2003. 75(6): p. 1942-1947.
248. Charles, C.J., et al., Myocardial infarction with and without reperfusion in sheep: early cardiac and neurohumoral changes. Clin. Sci., 2000. 98(6): p. 703-711.
249. Moelker, A.D., et al., Intracoronary delivery of umbilical cord blood derived unrestricted somatic stem cells is not suitable to improve LV function after myocardial infarction in swine. J Molec Cell Cardio, 2007. 42(4): p. 735-745.
250. Ikonen, T.S., et al., Ligation of Ameroid-Stenosed Coronary Artery Leads to Reproducible Myocardial Infarction—A Pilot Study in a Porcine Model. Journal of Surgical Research, 2007. 142(1): p. 195-201.
Copyright © 2022 FDOKUMEN