Gelatin-Based Emulsion Gels for Diffusion-Controlled Release Applications
33
Cited as: Thakur G, Naqvi MA, Rousseau D, Pal K, Mitra A, Basak A. Gelatin-based emulsion gels for diffusion-controlled release applications, Journal of Biomaterials Science: Polymer Edition 23: 645–661(2012) Gelatin-based emulsion gels for diffusion-controlled release applications Goutam Thakur a , Muhammad Ali Naqvi b , Dérick Rousseau b* , Kunal Pal c , Analava Mitra a , Amit Basak d a School of Medical Science and Technology, Indian Institute of Technology Kharagpur, Kharagpur, India-721302 b Department of Chemistry & Biology, Ryerson University, Toronto, Ontario, Canada, M5B 2K3 c Department of Biotechnology & Medical Engineering, National Institute of Technology- Rourkela, Orissa, India- 769008 d Department of Chemistry, Indian Institute of Technology-Kharagpur, Kharagpur, India-721302 * Corresponding Author: Dérick Rousseau Dept. of Chemistry and Biology, Ryerson University, Toronto, Ontario, Canada M5B 2K3 Email: [email protected] Short title: Gelatin emulsion gels for controlled release
-
Upload
independent -
Category
Documents
-
view
1 -
download
0
Transcript of Gelatin-Based Emulsion Gels for Diffusion-Controlled Release Applications

Cited as: Thakur G, Naqvi MA, Rousseau D, Pal K, Mitra A, Basak A. Gelatin-based
emulsion gels for diffusion-controlled release applications, Journal of Biomaterials
Science: Polymer Edition 23: 645–661(2012)
Gelatin-based emulsion gels for diffusion-controlled release applications
Goutam Thakura, Muhammad Ali Naqvi
b, Dérick Rousseau
b*, Kunal Pal
c, Analava Mitra
a, Amit Basak
d
a School of Medical Science and Technology, Indian Institute of Technology Kharagpur, Kharagpur, India-721302
b Department of Chemistry & Biology, Ryerson University, Toronto, Ontario, Canada, M5B 2K3
c Department of Biotechnology & Medical Engineering, National Institute of Technology- Rourkela, Orissa, India-
769008
d Department of Chemistry, Indian Institute of Technology-Kharagpur, Kharagpur, India-721302
* Corresponding Author: Dérick Rousseau
Dept. of Chemistry and Biology, Ryerson University, Toronto, Ontario, Canada M5B 2K3
Email: [email protected]
Short title: Gelatin emulsion gels for controlled release

Abstract: Emulsion gels are now emerging as a new class of biomaterials for controlled release
applications. Novel food-grade emulsion gels consisting of indomethacin-loaded vegetable oil droplets
dispersed within genipin-crosslinked gelatin-based hydrogels were characterized for their physical and
drug release properties. Varying the weight ratio of the aqueous and oil phases between 5:1 and 5:5 was
used to modulate construct swelling and drug release. The dispersed oil droplets generally became larger,
more polydispersed and aggregated with an increase in oil fraction. Crosslinking with genipin increased
the puncture strength of the gels vs. their uncrosslinked counterparts and was necessary to prevent
breakdown. Swelling of the emulsion gels demonstrated Fickian behaviour at all gelatin: oil ratios.
Indomethacin release followed Fickian diffusion at higher oil fractions only, demonstrating coupled
Fickian and Super-Case II transport at lower oil ratios (5:1, 5:2 and 5:3). Overall, the introduction of a
dispersed oil phase within a hydrogel was exploited for the release of hydrophobic bioactive compounds,
with tailoring of composition used to significantly alter release kinetics.
Keywords: Gelatin, emulsion gel, genipin, swelling, drug release
1. Introduction
Emulsion gels (EGs) consist of an oil-in-water (O/W) emulsion stabilized by a highly viscous or gelled
polymer matrix. Though their development dates to the 1980s when they were studied as texture
modifiers in processed foods, they have emerged as a new class of biomaterials for controlled release
applications [1-6]. O/W emulsions have been extensively studied as delivery systems for hydrophobic
drugs [7-10]. Compositionally, they consist of a dispersed oil phase usually stabilized with emulsifiers
such as phospholipids, small synthetic surfactants (e.g., polysorbates) or biopolymers present within a
continuous aqueous phase [11-14].
Given its nontoxic, noncarcinogenic and biodegradable nature, gelatin has been extensively used
in the development of controlled drug delivery systems. It is generally produced by the thermal
denaturation of bovine, porcine or fish collagen, which results in the breakdown of its triple helix
structure to random coils [15, 16]. Gelatin readily dissolves in warm water (> 35 ºC) and gels at
temperatures of ≤ 30 ºC, depending on its bloom strength and pH pretreatment (basic vs. acidic) [17].
Gelatin networks are thus thermoreversible, comprising junction zones of associated helices stabilized
through hydrogen bonding. However, gelatin gels are also inherently weak at low protein concentration,
which limits their applicability as constructs for controlled release. Chemical crosslinks are often used to
form a firmer network with improved mechanical and thermal properties [18, 19]. Examples of
crosslinking agents include formaldehyde [20], glutaraldehyde [21] and genipin [22], a naturally-
occurring, self-polymerizing crosslinker derived from fruits of Gardenia jasmonoides Ellis. It has gained
attention given its negligible cytotoxicity when compared with either glutaraldehyde or formaldehyde
(~10000x less), with no compromise in gel strength [23].
There have been limited instances of EGs used for drug delivery. Mhando and Po [24] examined
the controlled release of anaesthetics from liquid-solid EGs. Joseph and Venkataram [25] developed
alginate-gelatin and pectin-gelatin coacervates with carnauba wax inclusions for the release of
indomethacin, where the wax was essential for diffusion-controlled release. Jizomoto et al. [26]

encapsulated lipophilic drugs in gelatin-acacia microcapsules that incorporated drug-loaded oil droplets.
These capsules disintegrated within the gastrointestinal tract, releasing their content. Finally, Deveda et
al. [27] developed topical EGs to treat fungal diseases.
In this study, genipin-crosslinked gelatin-based EGs were developed and their microstructure,
swelling and mechanical properties evaluated in response to changes in gelatin:oil ratio. The release of the
non-steroidal anti-inflammatory drug indomethacin from the EGs was determined and modelled. Release
matrices that prevent direct contact of drug crystals with the gastrointestinal mucosa have been shown to
minimize potential side effects. Given Idn’s low solubility in water, a key advantage of EGs was the
possibility of increasing its concentration compared to crystal dispersions within hydrogels.
2. Materials and Methods
2.1. Materials
Porcine gelatin (Type A; bloom strength 300), polysorbate 80 (polyoxyethylene derivative of sorbitan
monooleate), indomethacin (Idn) (99 % TLC; MW: 357.8 g/mol) and glycine were obtained from Sigma-
Aldrich (St. Louis, MS, USA). Sunflower oil (acid value < 0.2 %) was obtained at a local grocery store
and used without further purification. Genipin was purchased from Challenge Bioproducts (Taiwan,
PRC). Both polysorbate 80 and gelatin are water-soluble whereas Idn is oil-soluble, though it does
contain one ionizable group. At 0.26 mg/ml, Idn’s pH-dependent solubility in water at pH 6 is minimal
[28].
2.2. Emulsion gel (EG) preparation
The EG aqueous phase consisted of a 10 % (w/w) gelatin solution prepared by dissolving the gelatin
powder in deionized water at 60 ºC for 10 min at pH 6. The gelatin solution contained 1 % (w/v)
polysorbate 80 to help emulsify the oil phase within the EG continuous phase [29]. The dispersed oil
phase consisted of either sunflower oil (as a control) or 1 % (w/w) Idn dissolved in sunflower oil for EG
release evaluation. Final EG compositions are shown in Tab. 1. Coarse mixtures were prepared by

magnetic stirring of all pre-mixed ingredients on a stirring hotplate at 60 ºC. The aqueous and oil phases
were mixed for 5 minutes and then homogenized at 60 ºC in a 2-stage valve homogenizer (APV 1000,
APV, Albertslund, Denmark) at 5000/500 psi for 10 min. The homogenized samples were poured into
Petri dishes and set at 5 ºC to allow the gelatin to undergo its sol-gel transition.
2.3. Crosslinking
A genipin solution [10 ml at 0.4 % (w/w)] was poured over the EGs set in the Petri dishes and kept 24 h
at 25 oC to permit crosslinking of the gelatin polymers [30]. Afterwards, the genipin solution was drained
and a glycine solution [10 ml at 1 % (w/w)] was poured onto the crosslinked networks and stored for 24 h
to interact with unreacted genipin. The EGs were then repeatedly washed with DI water and kept at room
temperature. Though the gelatin concentration varied from 8.3 % (w/w) in the 5:1 construct to 5 % (w/w)
in the 5:5 construct, given the contact time and genipin concentration used, all available gelatin junction
points were assumed to be crosslinked.
The Flory-Rehner theory has been extensively used to characterize the swelling-dependent
crosslinking of a hydrogel [31]. Peppas and Merrill [32] proposed a modified version to calculate the
polymer-average molecular weight and crosslinking density of a hydrogel prepared in water, which was
modified for the swelling of a hydrogel prepared in any solvent [33]:
r
s
r
s
n
c
c
rsss
a
pOH
bs
v
v
v
v
M
M
Mv
Vvvvv
K
K
v
v
I
V
,2
,2
3/1
,2
,21,2
2
,21,2,2
22
,21
2
211ln
104
(1)
where nM is the MW of the polymer without crosslinking, cM is the number-average polymer MW
between two adjacent crosslinks, v is the specific volume of the hydrogel prior to swelling, 1V is the
molar volume of the solvent (water; 18 mL mol-1
), sv ,2 is the polymer volume fraction in the swollen state
determined as roughly the inverse of the equilibrium swelling ratio, rv ,2 is the polymer volume fraction
in the relaxed state (the state of the polymer immediately after crosslinking but before swelling), I is the
ionic strength, aK and bK are the dissociation constants for the acidic and basic moieties on the
polymer, and 1 is the Flory-Huggins parameter describing the polymer-solvent interaction [34, 35].
Using cM , the crosslink density q , was determined from [36]:
c
n
M
Mq (2)
The parameter sv ,2 was determined from the volume-swelling ratio vq [37]:
v
sq
1,2 (3)
The volume-swelling ratio was calculated as [37]:
1
211
w
v
qq (4)
where 2 and 1 are the densities of the polymer network and solvent, respectively. The weight-
swelling ratio wq was determined from:
0m
mq s
w (5)
where m0 and ms are the mass of the unswollen gel and the mass of the swollen gel at equilibrium,
respectively. As the dispersed oil phase was deemed an ‘inert’ filler, its mass contribution was not taken
into account when calculating q and cM . The parameters used to estimate crosslink density are shown in
Tab. 2.
2.4. Microstructure
Emulsion gel microstructure was assessed using an upright Zeiss LSM-510 confocal laser scanning
microscope (CLSM) (Zeiss Inc., Toronto, ON, Canada) at a magnification of 100x (10x objective). As
genipin-crosslinked gelatin autofluoresces when excited at 488 nm [22], no dye was needed to analyze the
continuous phase [39]. In separate experiments, EGs were made with the lipophilic stain Fluorol Yellow
088 (0.5 % w/v) to accentuate the dispersed oil phase. Images shown are representative of the
microstructures evaluated.
Image analysis of the micrographs was performed with ImageJ v1.43 [40]. Any irregular
illumination in the confocal micrographs was removed by image subtraction. Thresholding was
performed using Otsu’s determinant method [41], which ensured no missed mesh outlines or artefacts
present in the middle of voids. Feret’s diameter was used to characterize oil droplet size.
2.5. Mechanical properties
The EGs’ mechanical properties were measured using a puncture probe (D = 6.3 mm) mated to a Texture
Analyzer (TA-XT2i Texture Analyzer, Texture Technologies Corp, NY, USA). The instrument was
calibrated with a 5 kg load cell. The puncture probe was driven through the EGs at 0.1 mm/sec and force-
displacement graphs were recorded. The load at yield point and the corresponding displacement of the
sample EGs were measured and then converted to puncture strength (PS) [42]:
A
FstrengthPuncture (6)
where F is the load applied to puncture and A is the cross sectional area of the probe (A =πr2 where r is
the radius of the probe).
2.6. Swelling
The EGs were cut into disks (D = 25 mm; h = 3.4 mm) and dipped into a beaker containing 50 ml of DI
water. Discs were removed from the water, blotted dry and weighed at 30 min intervals for 24 h. The
swelling index (SI) was calculated as per Yao et al. [30]:
0
0 )(
m
mmSI t (7)
where mt is the mass of the swollen gel at time t and m0 is the initial gel mass. Equilibrium water content
(EWC) (%) was determined for samples swelled 24 h.
2.7. Modelling EG swelling
Fick’s second law in a cylindrical coordinate system was used to describe water transport in the EGs (Eq.
8) [43]. The axial mass transfer was explained using concentration-dependent diffusivities, where Cw is
the mass concentration of water within the matrix, z is the axial coordinate discretized along the axis into
50 intervals, t represents time and Dw is the diffusion coefficient of water in the EG at time t.
z
CD
zt
C ww
w
(8)
Since it was assumed that the diffusion coefficient depends on solvent concentration, the Fujita model of
free volume was used to model solvent ingress kinetics (Eq. 9) [44].
eqw
wweqww
C
CDD
,
, 1exp (9)
Here, Dw,eq is the diffusion coefficient of water (the solvent) in the fully swollen EG, βw is a dimensionless
structural parameter related to the rate of biopolymer relaxation and Cw,eq is the water concentration in the
fully swollen EG. Equations were integrated using a Finite difference scheme in Athena Visual Studio
modelling software v.14 (Athena Visual Software, Inc, 2009, Evanston, IL, USA). Shown below are the
initial and boundary conditions.
Initial conditions:
0;0 wCt
Boundary conditions:
1;1
0;0
w
w
Cx
x
Cx
The model is only concerned with imbibed water and hence its concentration and change in concentration
is zero at t = 0 and x = 0. The cylindrical co-ordinate system in Athena Visual Studio considers only a
single plane of the cylinder to integrate the diffusion model equation according to a Finite Difference
scheme. In this case, the cylinder is assumed to uptake the water via rearrangement in axial structure only,
given that the EGs’ diameter is ca. an order of magnitude larger than its height. Sink conditions are
assumed to exist at the surface. To circumvent complications due to growing boundary conditions, the
moving front was normalized mathematically in the model (x = 1, Cw = 1) [45]. Decomposition and/or
contraction of the EGs were ignored in the model.
2.8. In-vitro drug release
Idn-loaded EGs cut into discs (D = 25 mm; h = 3.4 mm) were immersed in a beaker containing 50 ml of
DI water stirred at 100 rpm using a magnetic stirrer at 25 ºC (Fig. 1). Beakers were covered with
aluminium foil to prevent evaporative losses. Dissolution media aliquots were withdrawn at 1 h intervals
for 24 h, and replaced with fresh media to maintain sink conditions. Samples were analyzed at 317 nm by
UV-vis spectroscopy (Lambda 20, Perkin-Elmer, ON, Canada).
2.9. Drug release kinetics
Idn release profiles from the EGs were modelled with either the power law equation or Weibull function
given the two-stage release observed in some constructs. The classic method to deal with release curves is
based on the power law [46]:
pn
pt tk
M
M
(10)
where MM t is the fractional solute release normalized with respect to the equilibrium conditions, kp
is a kinetic constant related to the diffusion coefficient and np is the diffusional exponent related to
Fickian (np = 0.5) or Case II (np = 1.0) transport [47-50]. With np < 0.5, pseudo-Fickian diffusion
behaviour occurs, where sorption curves resemble Fickian curves, but with a slower approach to
equilibrium [51]. Finally, np > 1 implies that solvent (or drug) transport rate accelerates as equilibrium is
approached (Super-Case II transport). The power law relationship is only applicable at MM t ≤ 0.6 for
swelling-responsive hydrogels with one-dimensional transport and an appropriate geometry [52]. Where
MM t > 0.6, the Weibull function was used [53]:
wnwtkt e
M
M
1
(11)
where kw approximates polymer relaxation and nw describes the mode of transport as per the power law
model [54-56]. Given that the 5:4 and 5:5 gelatin:oil EGs clearly demonstrated power law dependence,
only the 5:1, 5:2 and 5:3 constructs were modelled with Eq. 11.
2.10. Data analysis
All experiments were based on triplicate de novo constructs each characterized at least 3 times. All
results are reported as arithmetic means ± standard deviation. Analyses of variance (ANOVA) and post-
hoc tests were performed and statistical differences were considered significant at p < 0.05.
3. Results and Discussion
3.1. EG structure & characterization
The top row (I) of Fig. 2 shows the EGs’ continuous gelatin gel phase whereas the lower row (II)
illustrates the microstructure of the dispersed oil phase. In the 5:1 construct, individual droplets were
evenly distributed within a closely-spaced gelatin network. With an increase in oil volume fraction, oil
droplets (row II) generally became larger, more polydispersed and aggregated while the gelatin network
became sparser and more heterogeneous.
The oil droplet counts per unit volume increased from the 5:1 to 5:3 EGs only to decrease for the
5:4 and 5:5 constructs (Tab. 3) (p < 0.05). This decline was accompanied by a transition from unimodal
(5:1, 5:2 and 5:3 EGs) to bimodal droplet size distributions (5:4 and 5:5 EGs) (Fig. 3), with the

coalescence of smaller droplets likely causing bimodality. The majority of droplets in the 5:1-5:3
constructs were 50 - 80 µm in diameter with a shift towards droplets > 100 µm in the 5:4 and 5:5
constructs (Tab. 3).
With an increase in oil fraction, there was a ~20 % increase in the MW between crosslinks cM
and corresponding ~20 % decrease in the crosslink density q of the gelatin fraction (p < 0.05) (Tab. 4),
suggesting similar q and cM values for all constructs. The changes in q and cM were likely attributable
to genipin mass transfer limitations given the presence of the dispersed oil phase or perhaps genipin
partitioning between the oil and aqueous phases.
The numerous molecular interactions and processing parameters dictated EG microstructure. In
the aqueous phase, there were obvious interactions between the gelatin and genipin that led to the
crosslinking of the available primary amine groups on the polymer. Also possible were interactions
between the polymer and surfactant. In solution, polysorbate 80-bovine serum albumin (BSA) interactions
have been observed [57], where favourable binding was due to van der Waals interactions and/or the
formation of hydrogen bonds between the hydroxyl and/or polyoxyethylene (POE) groups of the
polysorbate and the amino and carboxy groups of the protein. Though little homology exists between
gelatin and BSA, such interactions nonetheless point to a possible influence of the surfactant on gelatin
solubilization and thus hydration.
During homogenization, both the polysorbate 80 and gelatin partitioned towards the newly-
generated oil/water interface. Though gelatin is surface-active [58], the polysorbate 80 out-competed it
for adsorption to the interface [59], suggesting that emulsification was dominated by the surfactant. As
well, Hoffman et al. [57] showed that entropic effects reduced protein-surfactant binding with a
temperature increase from 5 to 55 ºC, further supporting this hypothesis. In parallel, the hydration of the
POE groups on the polysorbate was affected by temperature. Through computer simulation, Tasaki [60]
found weakened hydrogen bonding of POE with water at 100 °C, suggesting less favourable solubility
than at 27 °C. As homogenization was performed at 60 oC, the POE groups were partially dehydrated,
leading to less efficient emulsification.
During EG gelation, the gelatin sol evolved into a viscoelastic solid. Network elasticity arose
from local junction zones connected by a mesh of entangled flexible polymers, which were then stabilized
predominantly by hydrogen bonding, along with other secondary forces in a co-operative interchain
fashion. Gelation was likely unaffected by the surfactant now present at the interface nor the oil phase
which acted as an ‘inert’ filler. Gelatin’s presence was important for the prevention of oil droplet
coalescence as control emulsions sans gelatin rapidly sedimented.
Overall, insufficient polysorbate 80 to emulsify, and gelatin to effectively ‘kinetically-trap’ the
dispersed oil phase, resulted in larger droplets in the 5:4 and 5:5 constructs. For the 5:1- 5:3 EGs, droplet
sizes were similarly small and droplet counts higher, suggesting more efficient homogenization.
3.2. Mechanical properties
For all EGs, there was a decrease in puncture strength (PS) with a decrease in gelatin fraction (Fig. 4)
[61]. Genipin crosslinking led to increases in PS of ~500% for each of the EGs vis-à-vis their native
counterparts (p < 0.05) [15, 23, 62, 63]. A genipin-crosslinked 10 % (w/w) gelatin hydrogel used as
control had a PS strength of ~0.38 MPa.
EGs may be construed as particle-filled gels. A key characteristic defining the properties of such
gels is whether the dispersed particles (i.e., the oil droplets) are bound to the gel matrix and impact gel
strength [64]. Interactions between the dispersed oil droplets and surrounding gel matrix will strongly
depend on the surface properties of the droplets, which depend on the nature and concentration of the
surfactant(s) present at the oil-water interface [65]. Sala et al. [64] observed that in 4 % (w/w) gelatin
EGs, emulsion droplets stabilized with 2 % (w/w) polysorbate 20 were not bound to the matrix and only
induced a slight decrease in fracture strength. Given the similarity with the present EGs, polysorbate 80-
stabilized droplets had little chemical affinity with the surrounding gelatin. The presence of the dispersed
oil droplet phase primarily decreased gel strength due to the reduction in gelatin concentration from ~8 %
in the 5:1 gel to ~5 % in the 5:5 gel.
3.3. EG Swelling
Water uptake in the crosslinked EGs was monitored until equilibrium was reached. Greater swelling
occurred in the EGs with more gelatin, with the 5:1 construct swelling ~40 % after 24 h compared to ~27
% for the 5:5 construct (p < 0.05) (Tab. 5; Fig. 5).
The diffusion coefficient of water into the EGs (Dw,eq) and the diffusivity (w) were obtained from
model fitting to the experimental swelling data of genipin-crosslinked EGs (Tab. 6) (R2 values > 0.97).
All values of Dw,eq were two orders of magnitude lower than the self-diffusion coefficient of water at 20
ºC (2 × 10⁻⁵
cm2∙s
-1) [66], slightly increasing as a function of gelatin:oil ratio, though not in a statistically
significant manner (p > 0.05). Fang et al. [67] examined drug release from chitosan/gelatin hybrid
membranes and also found diffusion coefficients in the 10-7
cm2∙s
-1 range. Similarly, Tokuyama and Kato
[6] found a release rate in the 10-7
cm2∙s
-1 range for Idn-loaded thermosensitive polymeric organogels. All
w values were similar, suggesting no mechanistic differences in swelling between the constructs.
3.4. Drug release
Though the initial drug load was identical in all EGs (1 %), cumulative Idn release % values
ranged from ~25% for the 5:1 EG to ~10% for the 5:5 construct (Fig. 6). Plateau cumulative drug release
values were reached after ~19 hours for the 5:1 and 5:2 EGs and within ~13 hrs for the 5:5 construct.
Release from all EGs was similar in the first few hours, but began to diverge after ~5 hrs. The release data
revealed the presence of two ‘clusters’– the 5:1, 5:2 and 5:3 ratios vs. the 5:4 and 5:5 ratios (Fig. 6).Drug
release from the EGs with gelatin:oil ratios of 5:4 and 5:5 modelled using Eq. 10 yielded np and kp values
of ~0.4 for both constructs, demonstrating their similar modes of release and diffusive properties (Tab. 7).
Power law modelling of the 5:1 – 5:3 EGs revealed Fickian (np = 0.4-0.45) or pseudo-Fickian (np = 0.28)
behaviour, with gradually increasing kp values as the oil fraction increased. After a quasi-equilibrium
reached after ~11 hr, these constructs demonstrated a piggybacked, late-stage non-Fickian release
mechanism mediating drug release. With the onset of this second mode, Idn release initially accelerated
only to tend towards an asymptote. The Weibull function was used to model the release profile segments
representing the second mode [53], where kw approximates polymer relaxation and nw describes the mode
of transport as per the power law model [68]. Based on this approach, Super-Case II behaviour was
observed in the 5:1 – 5:3 EGs, with nk decreasing from ~2.4 to ~1.3 with a gradually higher oil fraction.
With the 5:4 and 5:5 constructs, np = nw = 1, and so Fickian release was evident.
Idn release from the EGs may in part be explained by the free volume theory of diffusion [44]
that states that a small molecule such as Idn should find little resistance to transport through a relaxed
matrix subjected to swelling-induced water absorption and compound desorption. A complicating factor
impacting release was the presence of Idn-loaded oil droplets that led to two-stage drug transport. Such
release has not been observed in other hydrogel systems containing Idn [28, 69], but has been observed in
EGs shaped into films [70], where hydrogel erosion was the second mechanism responsible for drug
release. Though not tested, it is unlikely that hydrogel breakdown or erosion occurred as the gelatin in all
EGs was deemed highly crosslinked.
Idn is a weakly ionizable acidic drug (pKa = 4.5) drug with limited aqueous solubility (0.72
mg/ml at pH 7.0) [28]. With the gelatin gel at pH ~6, Idn was partly ionized and partially dissolved in the
gelatin gel. As well, the solubility of lipophilic drugs in gelatin solutions increases when compared with
their corresponding aqueous solubility [71]. As a result, during EG preparation at 60°C, some Idn
partitioned into the continuous phase, and initial release was partly based on Idn present in the gelatin
network.
The divergence of the 5:1-5:3 EG release patterns at ~11 hr may be explained by the differences
in dispersed phase surface-to-volume ratio and the diffusional path length through the continuous phase.
Microstructurally, the 5:5 EG consisted of 49% oil and only 5% gelatin compared to 16% oil and 8.3%
gelatin for the 5:1 EG. As per the microscopy images (Fig. 2), the 5:1 construct consisted of a
homogeneous network of finely-dispersed oil droplets clearly separated by the gelatin network whereas
the 5:5 EG network consisted of much larger, flocculated droplets within a sparser gelatin network. Thus,
the diffusional path length for the 5:5 EG was shorter, which in essence allowed a shorter ‘response time’
to changes in chemical potential.
4. Conclusions
The EGs with the highest gelatin fraction and smallest oil fraction were firmer, swelled more and showed
more extensive drug release. However, release patterns were highly dependent on the ratio between the
aqueous and oil phases, with significant deviation from Fickian release at lower oil fractions. These
results demonstrated that the introduction of a dispersed oil phase within a hydrogel may be effectively
exploited for the release of hydrophobic bioactive compounds, with tailoring of composition used to alter
release kinetics from simple Fickian release towards dual-mode (or perhaps another form of) release.
Finally, given that food-grade ingredients were used, release and delivery applications for
pharmaceuticals as well as food ingredients (e.g., nutraceuticals) may be considered.
Acknowledgements
Financial assistance from the Natural Sciences and Engineering Research Council of Canada (NSERC)
and the Advanced Food and Materials Network (AFMNet) are gratefully acknowledged. The first author
acknowledges financial support from Indian Institute of Technology-Kharagpur for the completion of his
Ph.D. research work. Roomana Aafaqi, Shane Hodge, Tu Tran, Dr. Misael Miranda and Dr. Supratim
Ghosh at Ryerson University and Shubhadeep Banerjee of IIT Kharagpur are acknowledged for their
technical assistance.
References
1. D.Gulsen and A.Chauhan, Int. J. Pharm. 292, 95(2005).
2. C.Holtze, K.Landfester and M.Antonietti, Macromol. Mater. Eng. 290, 1025(2005)
3. H.Chen, D.Mou , D.Du, X. Chang , D. Zhu, J. Liu, H. Xu, and X. Yang, Int. J. Pharm. 341,
78(2007).
4. K.I.Shingel, M.P.Faure, L.Azoulay, C.Roberge and R.J Deckelbaum, J. Tissue Eng. Regen. Med.
2, 383(2008).
5. K.I. Shingel, C. Roberge, O. Zabeida, M. Robert, and J.E. Klemberg-Sapieha, J. Mater. Sci:
Mater. Med, 20, 681(2009).
6. H. Tokuyama, and Y. Kato, Colloids Surf. B. 67 ̧92 (2008).
7. M.L.Gou, X.Y. Li, M.Dai, C.Y. Gong, X.H. Wang, Y. Xie, H.X. Deng, L.J. Chen, X. Zhao, Z.Y.
Qian, and Y.Q. Wei, Int. J. Pharm. 359, 228(2008).
8. C.J.H. Porter, C.W. Pouton, J.F. Cuine and W.N. Charman, Adv. Drug. Deliv. Rev. 60, 673(2008).
9. W. Sila-on, N. Vardhanabhuti, B. Ongpipattanakul and P. Kulvanich, AAPS Pharm. Sci. Tech. 9,
684(2008).
10. J. Frelichowska, M.A. Bolzinger, J. Pelletier, J.P.Valour, and Y. Chevalier, Int. J. Pharm. 371,
56(2009).
11. R.A. Yost and J.E. Kinsella, J. Food Sci. 57, 892(1992).
12. R. Cortesi, E. Esposito, G. Luca and C. Nastruzzi, Biomaterials. 23, 2283(2002).
13. E. Dickinson and Y. Yamamoto, J. Food Sci. 61, 811(2006).
14. J. Chen, and E. Dickinson, J. Texture Stud. 29, 285(2007).
15. A. Bigi, S. Panzavolta and K. Rubini, Biomaterials. 25, 5675(2004).
16. K.Pal, A.K. Banthia and D.K. Majumdar, J. Biomat. Appl. 21, 75(2006).
17. M. Usta, D.L. Piech, R.K. MacCrone and W.B. Hillig, Biomaterials. 24, 165(2003).
18. A.A. Apostolov, D. Boneva, E. Vassileva, J.E. Mark and S. Fakirov, J. Appl. Polym. Sci. 76,
2041(2000).
19. B.S. Chiou, R.J. Avena-Bustillos, P.J. Bechtel, H. Jafri, R. Narayan, S.H. Imam, M. Glenn and
W.J. Orts, Eur. Poly. J. 44, 3748(2008).
20. C.H. Yao, J.S. Sun, F. Lin, C. Liao and C. Huang, Mater. Chem. Phys. 45, 6(1996).
21. Y.Z. Zhang, J. Venugopal, Z.M. Huang, C.T. Lim and S. Ramakrishna, Polymer. 47, 2911(
2006).
22. H. Chen, W. Ouyang, B. Lawuyi and S. Prakash, Biomacromolecules. 7, 2091(2006).
23. J. Jin, M. Song and D.J. Hourston, Biomacromolecules. 5, 162(2004).
24. J.R. Mhando and A.L.W. Po, Int. J. Pharm (Amst). 62, 249(1990a).
25. I. Joseph and S. Venkataram, Int. J. Pharm. 126, 161(1995).
26. H. Jizomoto, E. Kanaoka, K. Sugita and K. Hirano, Pharm. Res. 10, 1115(1993).
27. P. Deveda, A. Jain, N. Vyas, H. Khambete and S.Jain, Int. J. Pharm. Pharmaceut. Sci. 2,
104(2010).
28. K. Morimoto, A. Nagayasu, S. Fukanoki, K. Morisaka, S.H. Hyon and Y.Ikada, Pharm Res. 6,
338(1989).
29. J.P. Hsu and A.Nacu, J. Colloid Interface Sci. 259, 374(2003).
30. C.H. Yao, B.S. Liu, C.J. Chang, S.H. Hsu and Y.S. Chen, Mater. Chem. Phys. 83, 204(2004).
31. P. J. Flory and J. J. Rehner Jr., Chem. Phys. 11, 521(1943).
32. N.A. Peppas and E.W. Merrill, J. Biomed. Mater. Res. 11, 423(1977).
33. L. Brannon-Peppas and N. A. Peppas, J. Controlled Release. 16, 319(1991).
34. C. M.Ofner III and W. A. Bubnis, Pharm. Res. 13, 1821(1996).
35. N. A. Peppas, P. Bures, W. Leobandung and H.Ichikawa, Eur. J. Pharm. Biopharm. 50, 27(2000).
36. S.Rajvaidya, R.Bajpai and A. K Bajpai, J. Appl. Polym. Sci. 101, 2581(2006).
37. T.Çaykara and Ö.Kantoğlu, Polym. Adv. Technol. 15, 134(2004).
38. A. W.Kenchington and A. G. Ward, Biochem. J. 58, 202(1954).
39. F.L. Mi, Biomacromolecules. 6, 975(2005).
40. M.D. Abramoff, P.J. Magelhaes and S.J. Ram, Biophotonics Int., 11, 36(2004).
41. N.Otsu, IEEE. T. Syst. Man. Cyb. 9, 62(1979).
42. S.Sungthongjeen, P. Sriamornsak and S. Puttipipatkhachorn, Euro. J. Pharm. Biopharm. 69,
255(2008).
43. J. Siepmann, H. Kranz, R. Bodmeier and N.A. Peppas, Pharm. Res. 16, 1748(1999).
44. H.Fujita, Textile Res. J. 22, 823(1952).
45. J., Crank, The mathematics of diffusion, 2nd
Ed., Oxford University Press, New York (1975).
46. T. Alfrey, E.F.Gurnee and W.G. Lloyd, J. Polym. Sci. Pol. Sym. 12, 249(1966).
47. C.S. Brazel and N.A. Peppas, Polymer. 40, 3383(1999a).
48. C.S. Brazel and N.A. Peppas, Biomaterials. 20, 721(1999b).
49. P. Ritger and N. Peppas, J. Controlled Release, 5, 23(1987a).
50. P. Ritger and N.Peppas, J. Controlled Release. 5, 37(1987b).
51. K.Y. Lee and D.J. Mooney, Chem. Rev. 101, 1869(2001).
52. K. Mequanint, A. Patel and D.Bezuidenhout, Biomacromolecules. 7, 883(2006).
53. V. Papadopoulou, K. Kosmidis, M. Vlachou and P.Macherasa, Int. J. Pharm. 309, 44(2006).
54. H. B. Hopfenberg, J. Membr. Sci. 3, 215(1978).
55. G. F. Billovits and C.J. Durning, Chem. Eng. Commun. 82, 21(1989).
56. M.C. Moran, A.A.Pais, C.C. Ramalho, A. M. G. Miguel and B. Lindma, Langmuir. 25,
10263(2009).
57. C. Hoffmann, A. Blume, I. Miller and P.Garidel, Eur. Biophys. J. 38, 557(2009).
58. A.G. Gaonkar, Food Hydrocolloids, 5, 329(1991).
59. J. Chen and E. Dickinson, Colloid Surf. A., 101, 77(1995).
60. K.Tasaki, J. Am. Chem. Soc. 118, 8459(1990).
61. S.B. Lee, Y.H. Km, S.H. Chong and Y.M. Hong, Biomaterials. 26, 1961(2005).
62. A. Bigi, G. Cojzzi, S. Panzavolta, N. Roveri and K.Rubini, Biomaterials. 23, 4827(2002).
63. D. Hellio and M.Djabourov, Macromol. Symp. 241, 23(2006).
64. G.Sala, F.Van de Velde, M.A.Cohen Stuart and G.A. Van Aken, Food Hydrocolloids. 21,
977(2007).
65. E.Dickinson and J. Chen, J. Dispers. Sci. Technol. 20,197(1999).
66. Y.P. Syrnikov, J. Struct. Chem. 11, 698 (1971).
67. Y-E. Fang, Q. Cheng and X.-B. Lu, J. Appl. Polym. Sci., 68, 1751(1998).
68. O.M.Tanchak and C.J. Barrett, Chem. Mater.16, 2734 (2004).
69. H.Byun, B.Hong, S.Y.Nam, S.Y.Jung, J.W.Rhim, S.B.Lee and G. Y. Moon, Macromol. Res., 16,
189 (2008).
70. J.R.Mhando, and A.L.W. Po, Int. J. Pharm. 59, 165(1990b).
71. P. Kallinteri and S.G. Antimisiaris, Int. J. Pharm. 221, 219 (2001).
Figure legend:
Fig. 1: In-vitro drug release set-up.
Fig. 2: EG continuous (I) and dispersed phase (II) microstructure as a function of the gelatin phase: oil
phase ratio(5:1 to 5:5). Size bar represents 20µm.
Fig. 3: Normalized oil droplet distributions in the EGs based on CLSM image analysis (n = 3).
Fig. 4: Puncture strength of native and crosslinked gelatin-based EGs as a function of composition (n =
3). GG: Gelatin gel without added oil phase.
Fig. 5: Swelling of EGs as a function of time and composition. Parameter estimates related to swelling are
based on Fujita’s concentration-dependent diffusivities model (—).
Fig. 6: Experimental indomethacin release curves modelled using a combination of a power law and the
Weibull function to obtain kinetic parameters describing drug release.
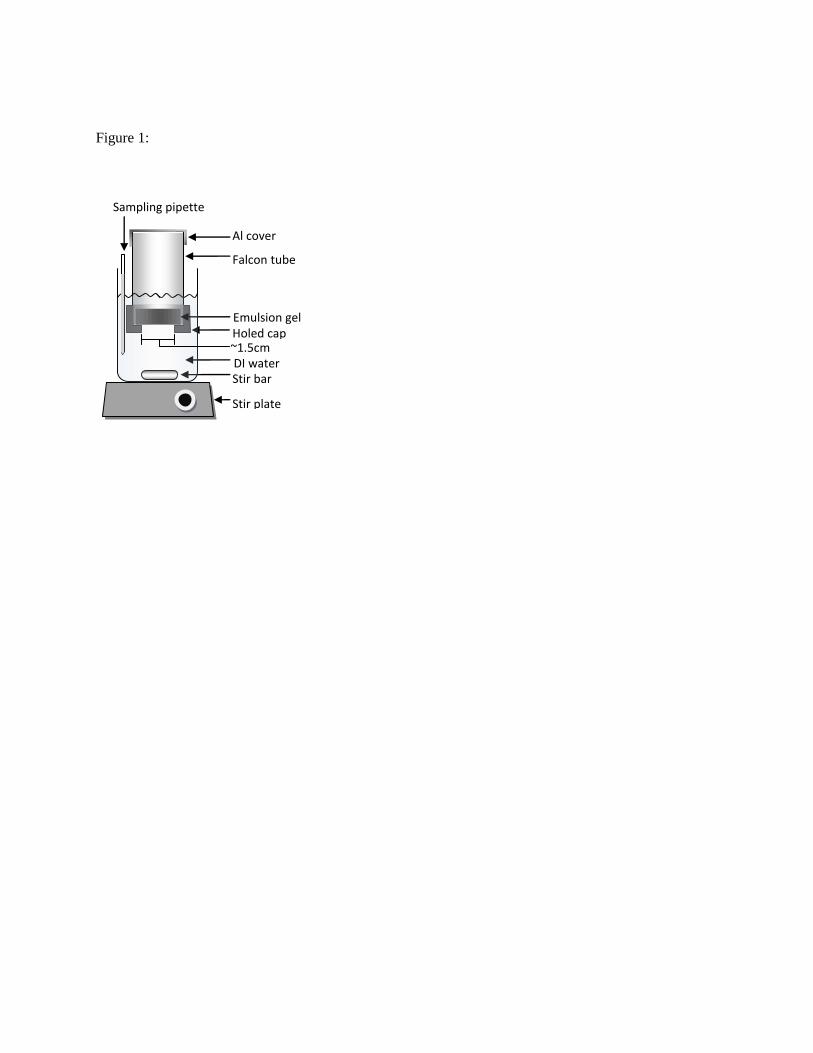
Figure 1:
Falcon tube
Holed cap
DI water Stir bar
Stir plate
~1.5cm
Al cover
Sampling pipette
Emulsion gel
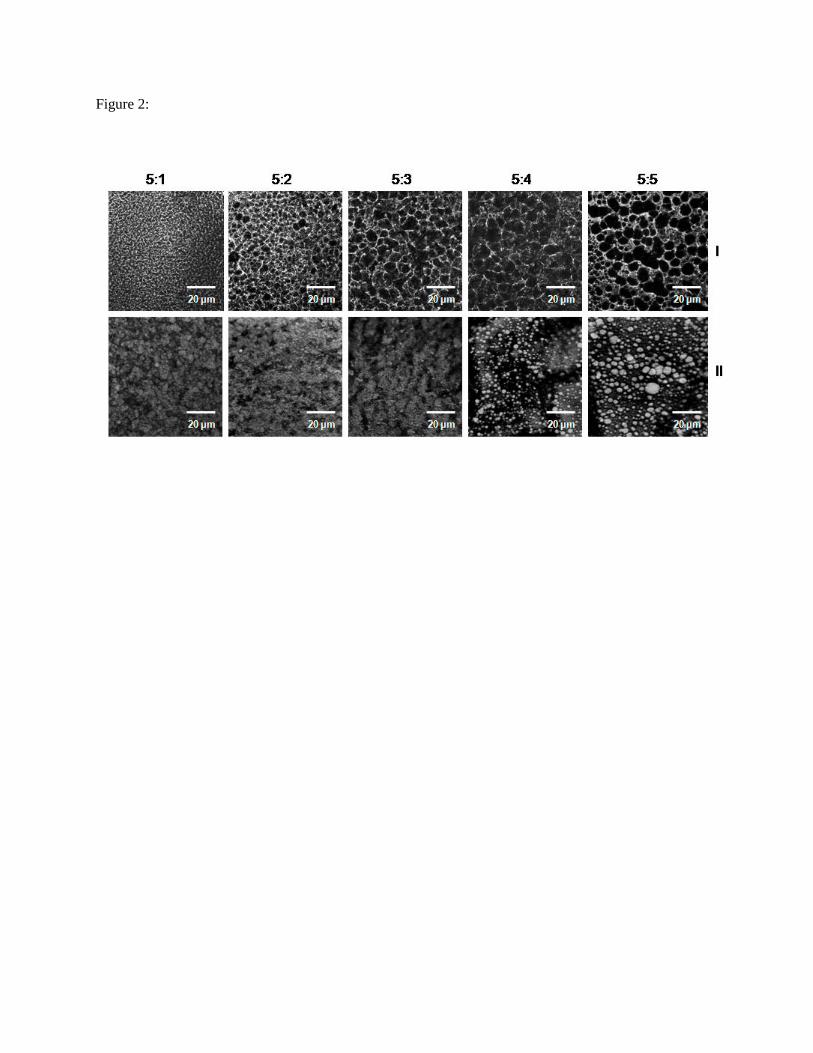
Figure 2:
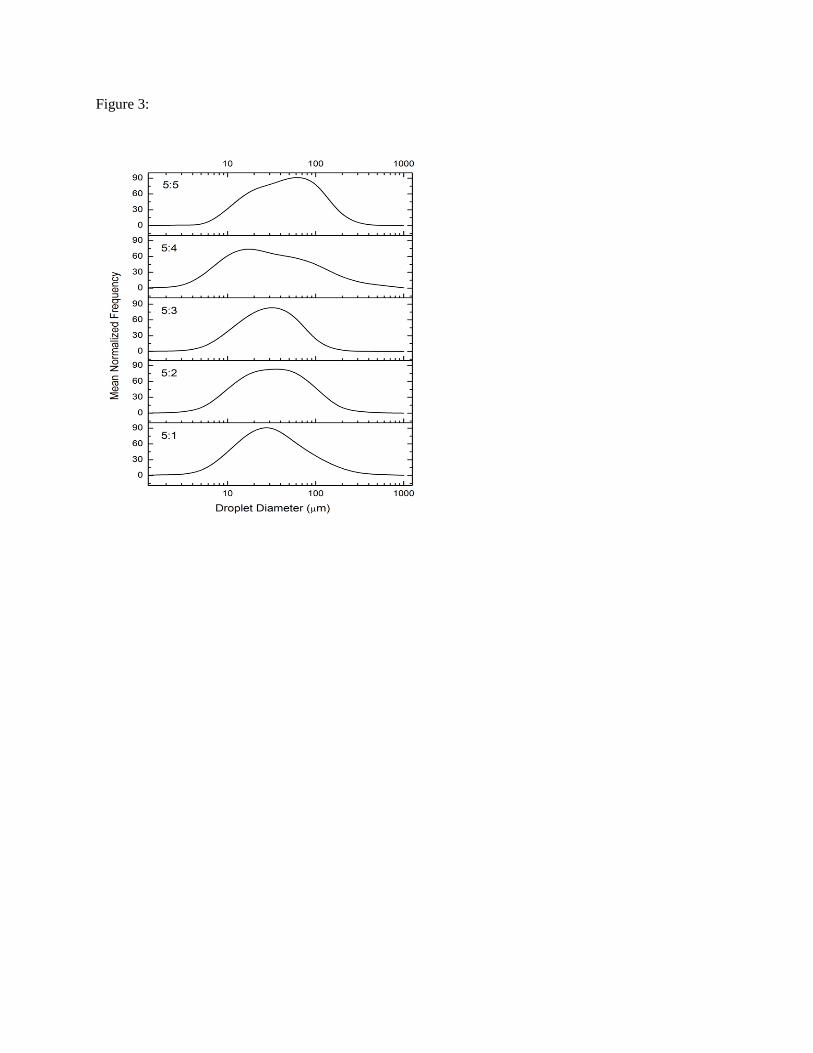
Figure 3:
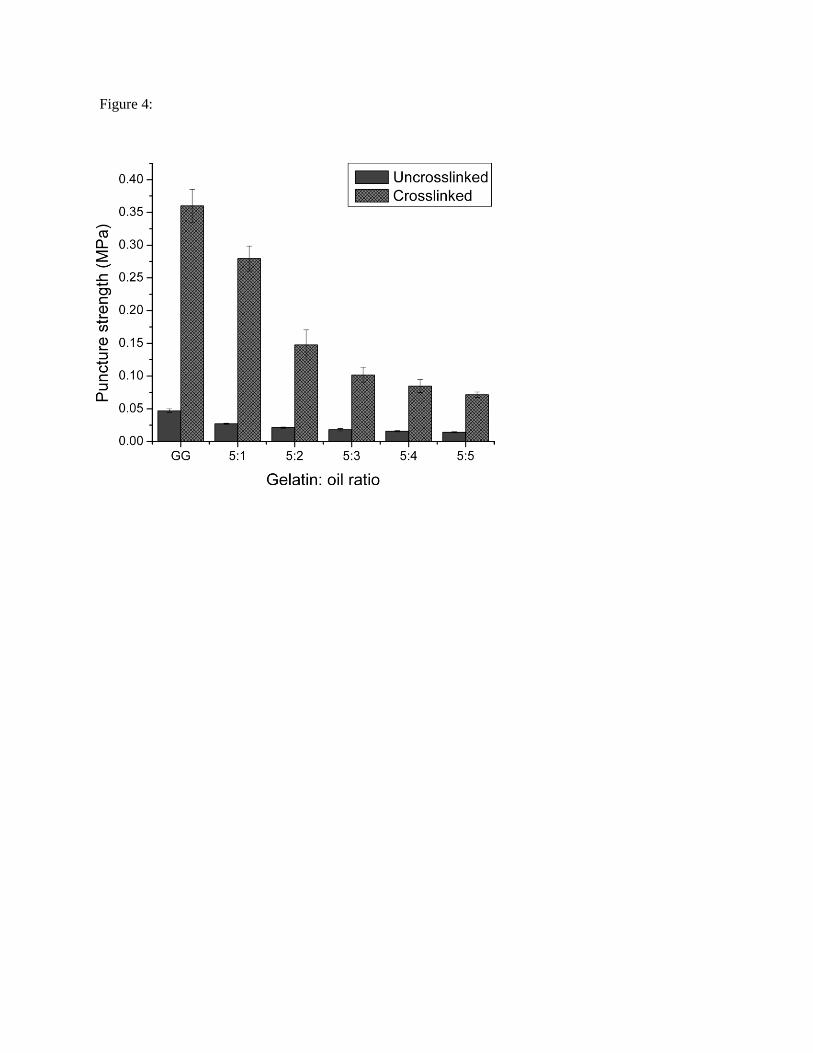
Figure 4:
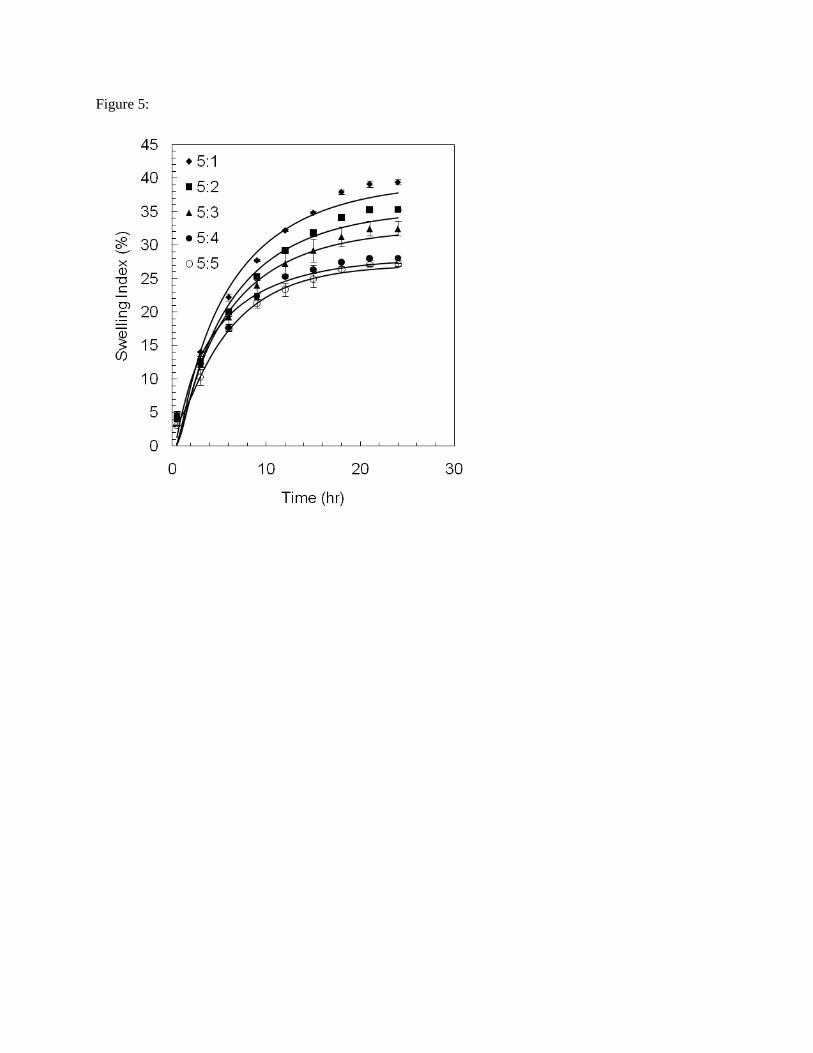
Figure 5:
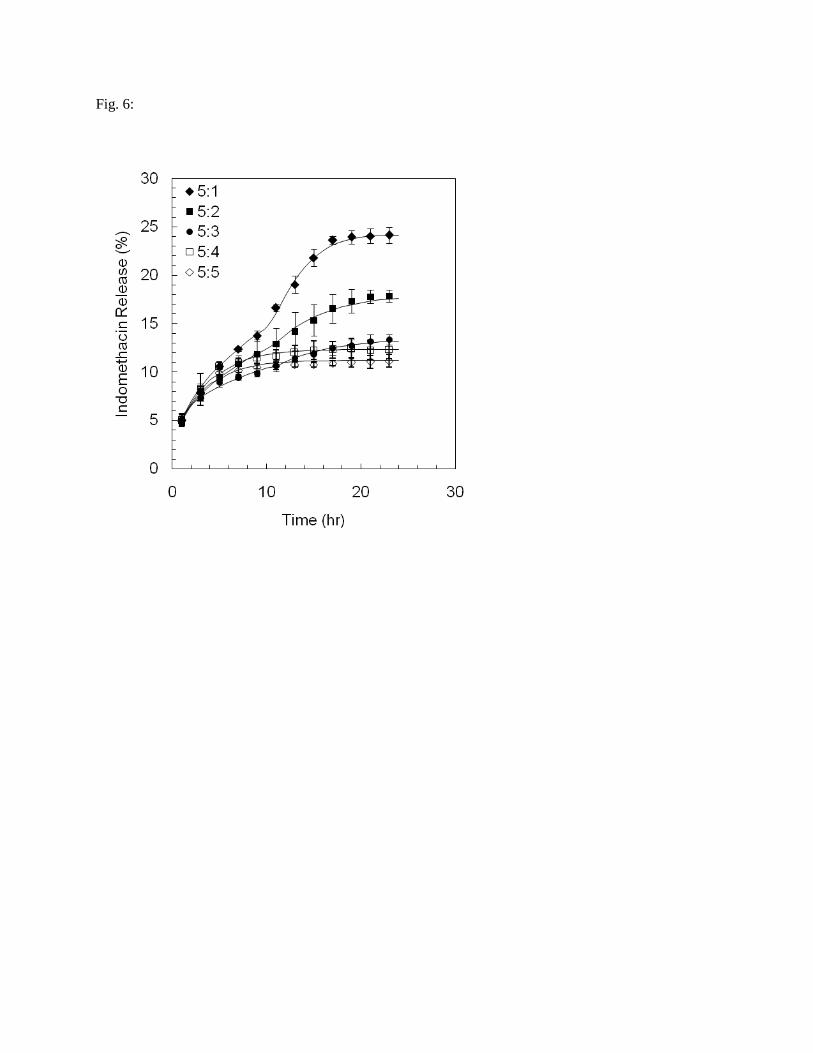
Fig. 6:
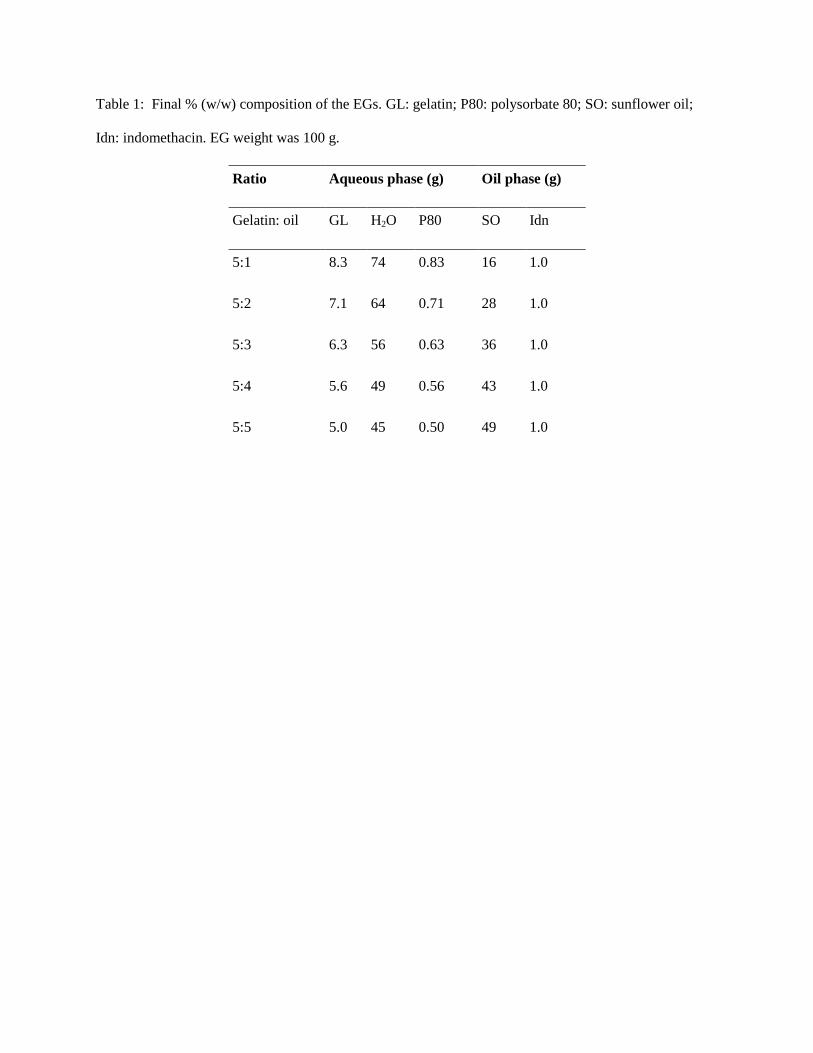
Table 1: Final % (w/w) composition of the EGs. GL: gelatin; P80: polysorbate 80; SO: sunflower oil;
Idn: indomethacin. EG weight was 100 g.
Ratio Aqueous phase (g) Oil phase (g)
Gelatin: oil GL H2O P80 SO Idn
5:1 8.3 74 0.83 16 1.0
5:2 7.1 64 0.71 28 1.0
5:3 6.3 56 0.63 36 1.0
5:4 5.6 49 0.56 43 1.0
5:5 5.0 45 0.50 49 1.0
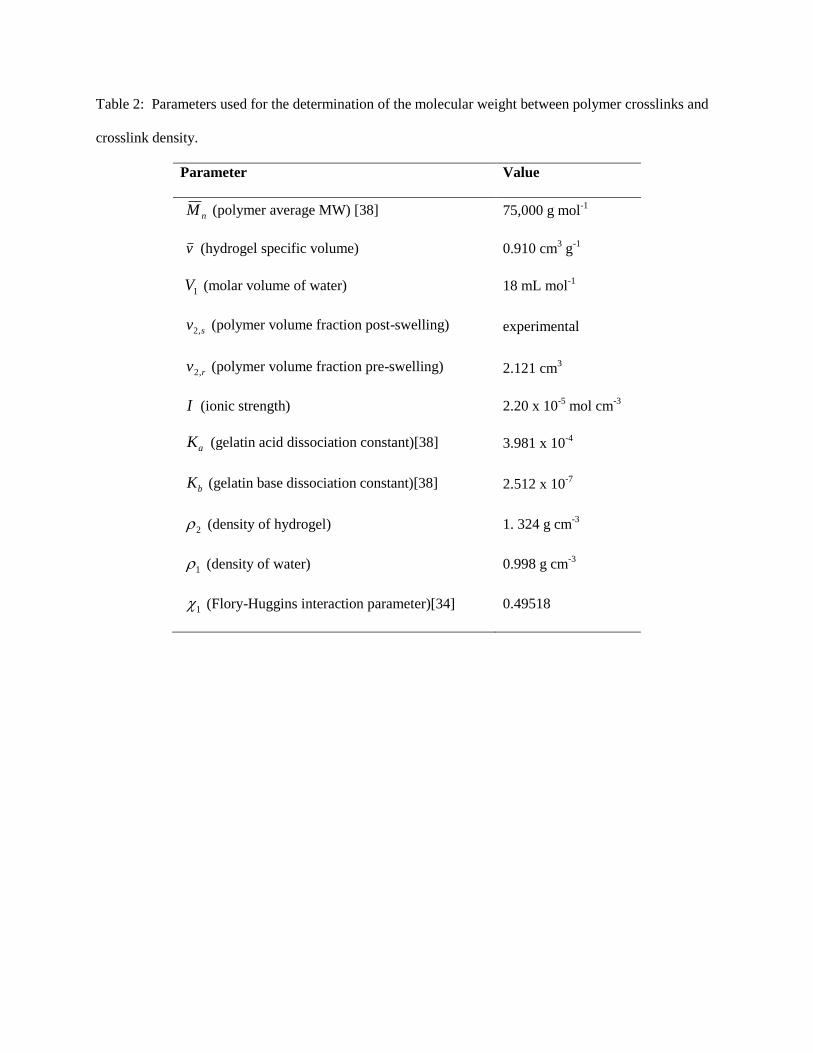
Table 2: Parameters used for the determination of the molecular weight between polymer crosslinks and
crosslink density.
Parameter Value
nM (polymer average MW) [38] 75,000 g mol-1
v (hydrogel specific volume) 0.910 cm3 g
-1
1V (molar volume of water) 18 mL mol-1
sv ,2 (polymer volume fraction post-swelling) experimental
rv ,2 (polymer volume fraction pre-swelling) 2.121 cm3
I (ionic strength) 2.20 x 10⁻⁵
mol cm-3
aK (gelatin acid dissociation constant)[38] 3.981 x 10⁻⁴
bK (gelatin base dissociation constant)[38] 2.512 x 10⁻⁷
2 (density of hydrogel) 1. 324 g cm-3
1 (density of water) 0.998 g cm-3
1 (Flory-Huggins interaction parameter)[34] 0.49518
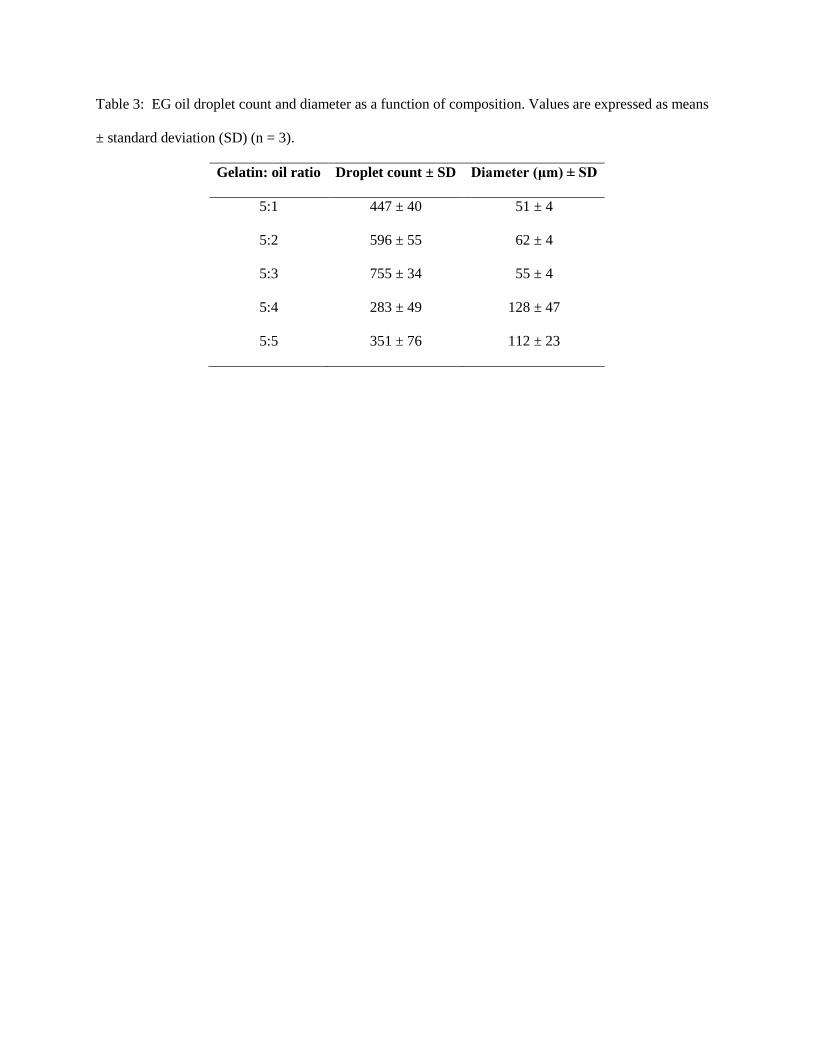
Table 3: EG oil droplet count and diameter as a function of composition. Values are expressed as means
± standard deviation (SD) (n = 3).
Gelatin: oil ratio Droplet count ± SD Diameter (μm) ± SD
5:1 447 ± 40 51 ± 4
5:2 596 ± 55 62 ± 4
5:3 755 ± 34 55 ± 4
5:4 283 ± 49 128 ± 47
5:5 351 ± 76 112 ± 23
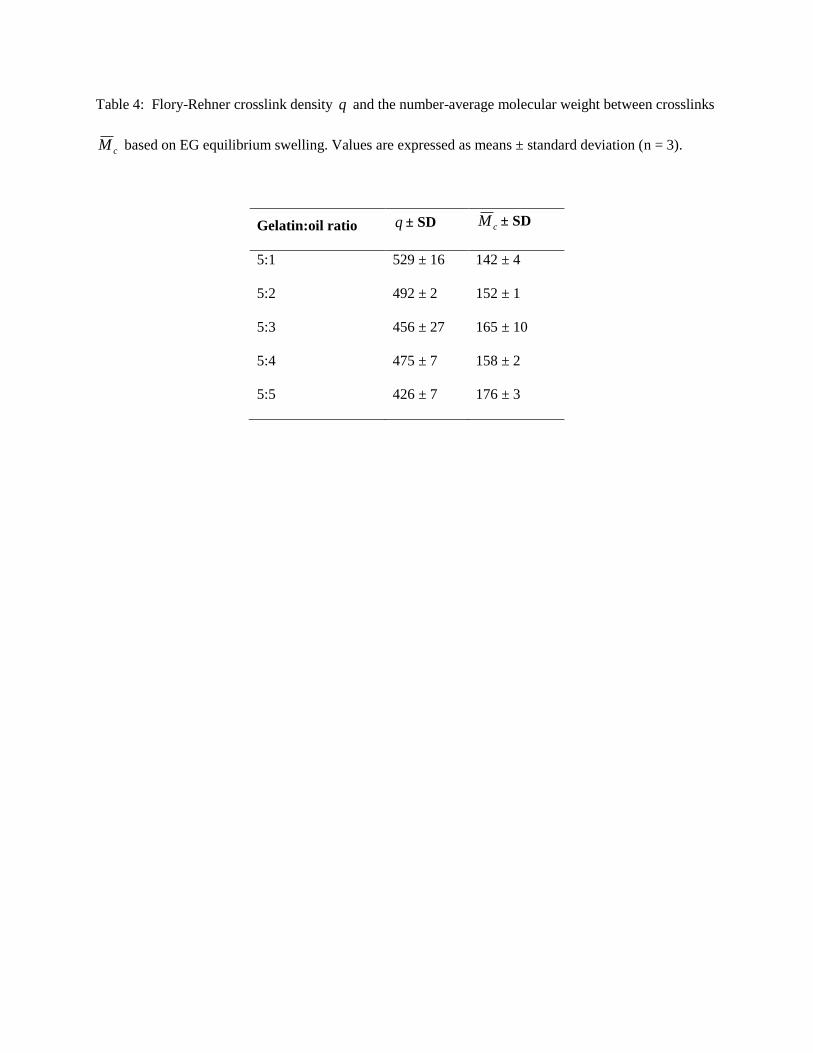
Table 4: Flory-Rehner crosslink density q and the number-average molecular weight between crosslinks
cM based on EG equilibrium swelling. Values are expressed as means ± standard deviation (n = 3).
Gelatin:oil ratio q ± SD cM ± SD
5:1 529 ± 16 142 ± 4
5:2 492 ± 2 152 ± 1
5:3 456 ± 27 165 ± 10
5:4 475 ± 7 158 ± 2
5:5 426 ± 7 176 ± 3
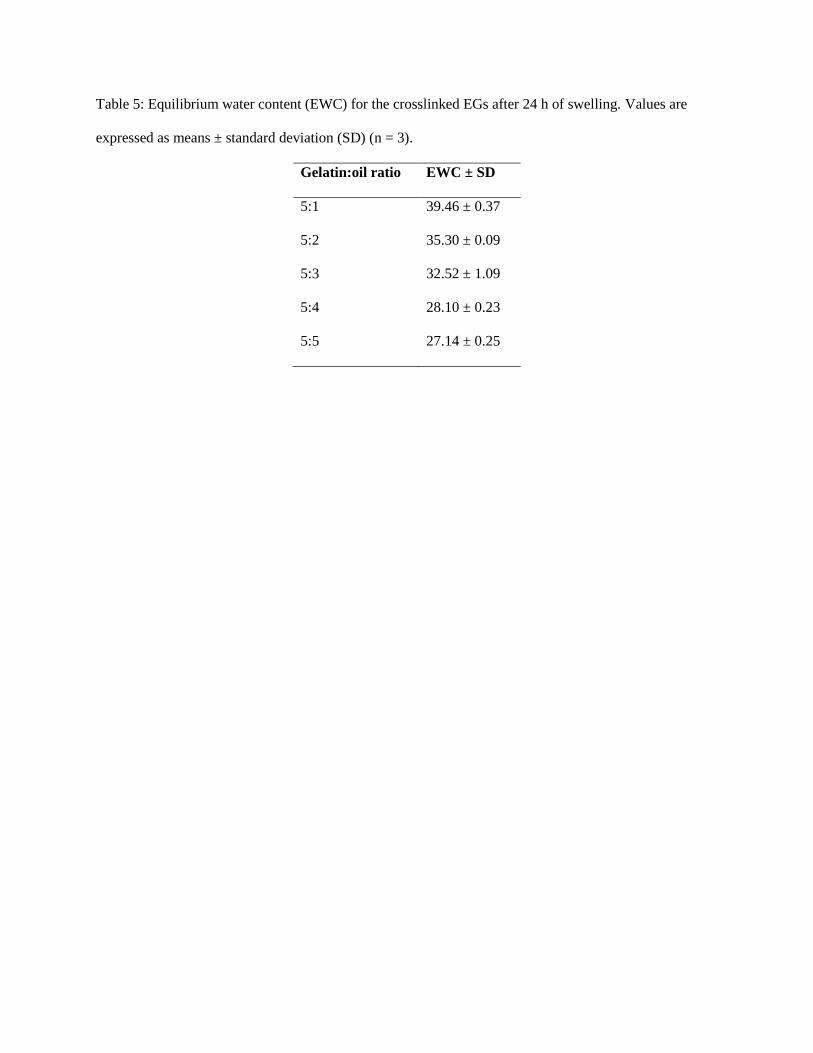
Table 5: Equilibrium water content (EWC) for the crosslinked EGs after 24 h of swelling. Values are
expressed as means ± standard deviation (SD) (n = 3).
Gelatin:oil ratio EWC ± SD
5:1 39.46 ± 0.37
5:2 35.30 ± 0.09
5:3 32.52 ± 1.09
5:4 28.10 ± 0.23
5:5 27.14 ± 0.25
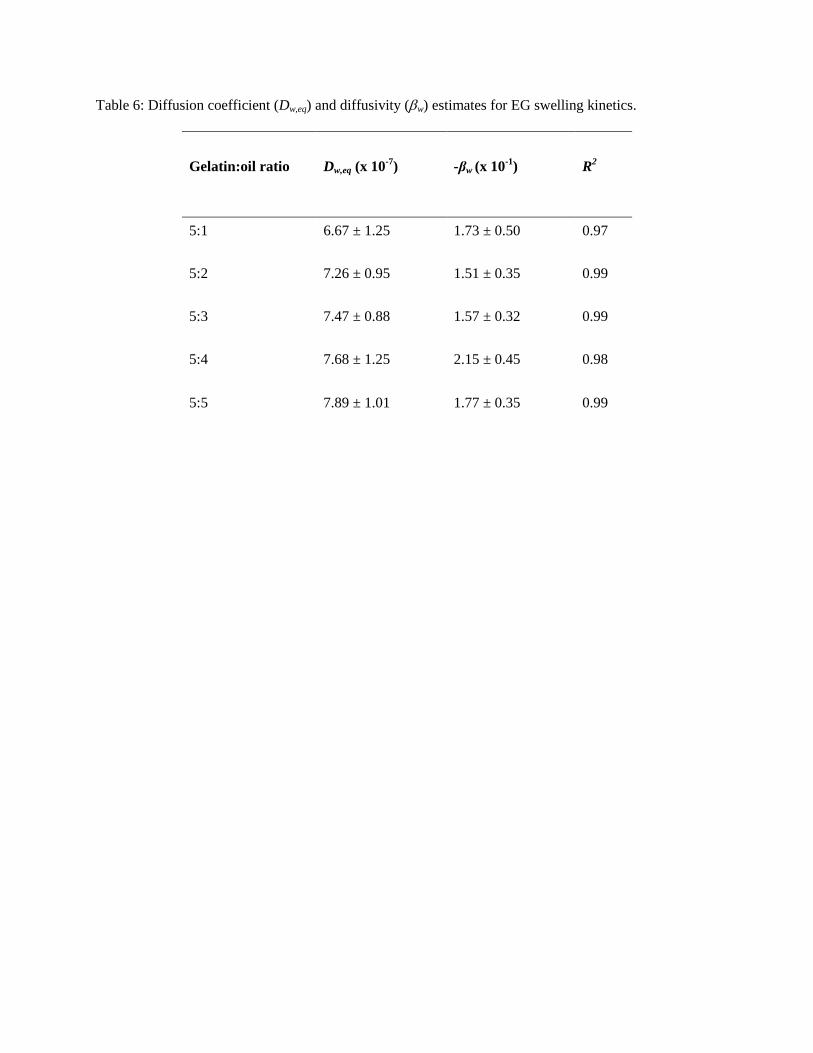
Table 6: Diffusion coefficient (Dw,eq) and diffusivity (w) estimates for EG swelling kinetics.
Gelatin:oil ratio Dw,eq (x 10-7
) -βw (x 10-1
) R2
5:1 6.67 ± 1.25 1.73 ± 0.50 0.97
5:2 7.26 ± 0.95 1.51 ± 0.35 0.99
5:3 7.47 ± 0.88 1.57 ± 0.32 0.99
5:4 7.68 ± 1.25 2.15 ± 0.45 0.98
5:5 7.89 ± 1.01 1.77 ± 0.35 0.99
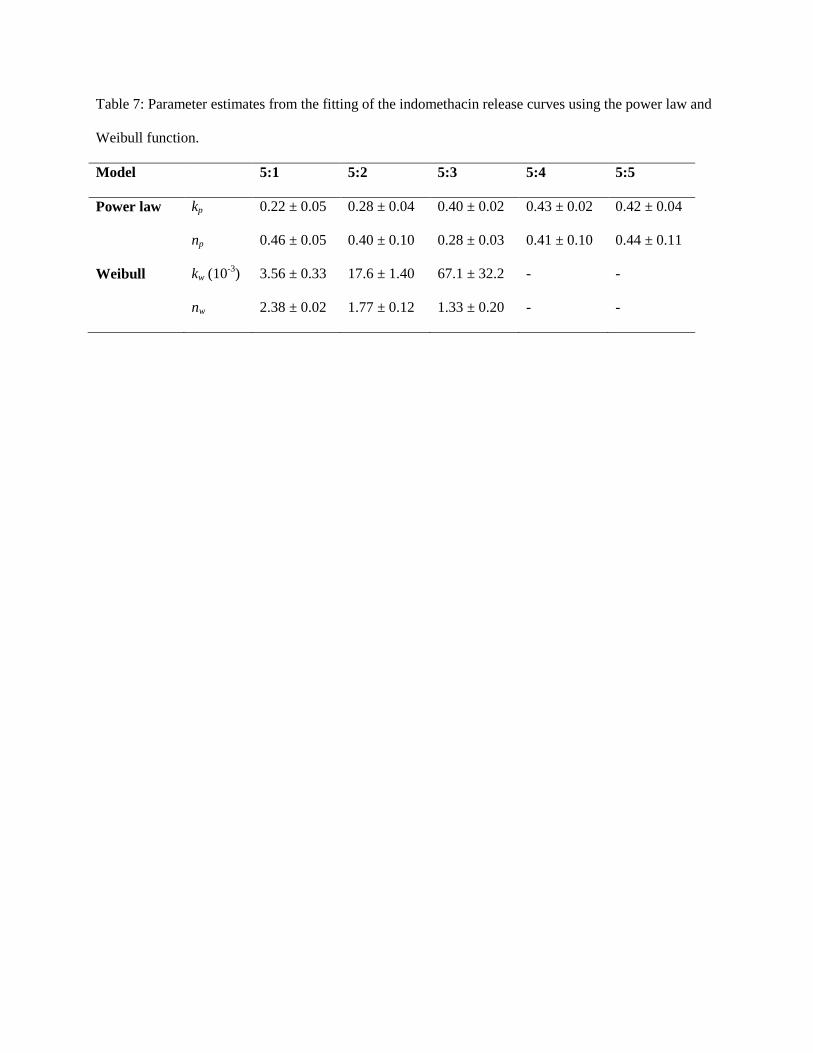
Table 7: Parameter estimates from the fitting of the indomethacin release curves using the power law and
Weibull function.
Model 5:1 5:2 5:3 5:4 5:5
Power law kp 0.22 ± 0.05 0.28 ± 0.04 0.40 ± 0.02 0.43 ± 0.02 0.42 ± 0.04
np 0.46 ± 0.05 0.40 ± 0.10 0.28 ± 0.03 0.41 ± 0.10 0.44 ± 0.11
Weibull kw (10-3
) 3.56 ± 0.33 17.6 ± 1.40 67.1 ± 32.2 - -
nw 2.38 ± 0.02 1.77 ± 0.12 1.33 ± 0.20 - -