Rheology of thermo-reversible fish protein isolate gels
10
Rheology of thermo-reversible fish protein isolate gels Tom Brenner a, * , Taco Nicolai b , Ragnar Johannsson a a Matis, Biotechnology Division, Gylfaflot 5, 112 Reykjavik, Iceland b Polymeres, Colloids, Interfaces, UMR CNRS, Université du Maine, 72085 Le Mans Cedex 9, France article info Article history: Received 13 February 2009 Accepted 26 April 2009 Keywords: Fish protein isolate Thermo-reversible gels Rheology Strain hardening Power-law creep abstract Fish protein isolates (FPI) from cod muscle were studied at pH 9 and 11. Thermo-reversible gels, stable at and below room temperature could be produced at both pH values. Application of low shear stress to the gels led to an initial elastic response followed by a power-law deformation (creep) at both pH. Above a critical shear stress gels fractured and flowed regularly with a viscosity of about 0.05 Pa s. Strain–stress curves were recorded using both flow and oscillatory measurements. For all systems strain hardening was observed followed by fracture. Fracture occurred at approximately the same defor- mation, but the amplitude of strain hardening and the yield stress decreased with decreasing rate of the stress ramp. Results obtained from oscillatory shear at 1 or 0.1 Hz were close to those obtained with con- tinuous shear during the fastest stress ramps. The structure of the gels was investigated using confocal laser scanning microscopy and turbidity measurements. Ó 2009 Elsevier Ltd. All rights reserved. 1. Introduction Fish muscle proteins can be isolated by solubilising at extreme pH. The protein can be precipitated at the iso-electric point, which yields a heterogeneous suspension with a protein content close to 200 g/L. Such suspensions of fish protein isolate (FPI) have been shown to undergo heat-induced irreversible gelation after addition of salt (Choi & Park, 2002; Kim, Park, & Choi, 2003; Kristinsson & Liang, 2006; Kristinsson, Theodore, Demir, & Ingadottir, 2005; Thawornchinsombut & Park, 2007; Undeland, Kelleher, & Hultin, 2002; Yongsawatdigul & Park, 2004). Recently, we have shown (Brenner, Johannsson, & Nicolai, 2008) that non-precipitated FPI solutions extracted from cod muscle at pH 11 form homogeneous gels at room temperature if their pH is lowered to between about 9.5 and 8.5 and if the protein concentra- tion is above about 6 g/L. These gels melt when heated above about 25 °C, but are reformed when cooled at the same temperature. Thermo-reversible gels can also be formed at pH 11 for C > 15 g/ L, but only if they are preheated above 30 °C. An advantage of these thermo-reversible gels is that they may be processed at higher temperatures as liquids after which gelation may be induced when desired by cooling. The dynamic mechanical properties in the linear regime have been reported in a previous work (Brenner et al., 2008) for FPI gels formed at pH 9 and 8.5 without preheating. At high frequencies (f), the storage (G 0 ) and loss (G 00 ) shear moduli are almost frequency independent with G 0 >> G 00 , but they decrease weakly at lower fre- quencies. For a given frequency, both G 0 and G 00 increase with decreasing temperature and increasing concentration. Here we report on the effect of preheating on the linear dy- namic mechanical properties of FPI gels at pH 9 and pH 11. In addi- tion, we have studied the non-linear rheology using both continuous shear and large amplitude oscillatory shear. Non-linear rheology of food systems is important for sensory attributes (Montejano, Hamann, & Lanier, 1985; vanVliet & Walstra, 1995), as well as the design of manufacturing processes. We determined complete stress–strain curves and creep measurements, which have rarely been reported for food systems. 2. Materials and methods 2.1. Sample preparation Cod white muscle tissue was homogenized at pH 11, followed by centrifugation at 15000g for 10 min. The supernatant was sep- arated over gauze. During this procedure the temperature was kept below 10 °C. Fresh cod was either used directly or frozen at 18 °C and thawed prior to sample preparation. No effect of freezing on the rheology was observed. Cod caught near Iceland’s shores, as well as near France, was used in the study. No difference in results presented here was found, but preparing protein solutions with concentrations above 20 g/L was easier using cod caught near Ice- land, independent of time of year. FPI at pH 11 was found to be sta- ble during storage at 4 °C for about 1 day, after which precipitation was usually observed. 0963-9969/$ - see front matter Ó 2009 Elsevier Ltd. All rights reserved. doi:10.1016/j.foodres.2009.04.020 * Corresponding author. Tel.: + 354 4225131; fax: +354 4225002. E-mail address: [email protected] (T. Brenner). Food Research International 42 (2009) 915–924 Contents lists available at ScienceDirect Food Research International journal homepage: www.elsevier.com/locate/foodres
-
Upload
independent -
Category
Documents
-
view
0 -
download
0
Transcript of Rheology of thermo-reversible fish protein isolate gels

Food Research International 42 (2009) 915–924
Contents lists available at ScienceDirect
Food Research International
journal homepage: www.elsevier .com/ locate / foodres
Rheology of thermo-reversible fish protein isolate gels
Tom Brenner a,*, Taco Nicolai b, Ragnar Johannsson a
a Matis, Biotechnology Division, Gylfaflot 5, 112 Reykjavik, Icelandb Polymeres, Colloids, Interfaces, UMR CNRS, Université du Maine, 72085 Le Mans Cedex 9, France
a r t i c l e i n f o
Article history:Received 13 February 2009Accepted 26 April 2009
Keywords:Fish protein isolateThermo-reversible gelsRheologyStrain hardeningPower-law creep
0963-9969/$ - see front matter � 2009 Elsevier Ltd. Adoi:10.1016/j.foodres.2009.04.020
* Corresponding author. Tel.: + 354 4225131; fax: +E-mail address: [email protected] (T. Brenner).
a b s t r a c t
Fish protein isolates (FPI) from cod muscle were studied at pH 9 and 11. Thermo-reversible gels, stable atand below room temperature could be produced at both pH values. Application of low shear stress to thegels led to an initial elastic response followed by a power-law deformation (creep) at both pH. Above acritical shear stress gels fractured and flowed regularly with a viscosity of about 0.05 Pa s.
Strain–stress curves were recorded using both flow and oscillatory measurements. For all systemsstrain hardening was observed followed by fracture. Fracture occurred at approximately the same defor-mation, but the amplitude of strain hardening and the yield stress decreased with decreasing rate of thestress ramp. Results obtained from oscillatory shear at 1 or 0.1 Hz were close to those obtained with con-tinuous shear during the fastest stress ramps.
The structure of the gels was investigated using confocal laser scanning microscopy and turbiditymeasurements.
� 2009 Elsevier Ltd. All rights reserved.
1. Introduction
Fish muscle proteins can be isolated by solubilising at extremepH. The protein can be precipitated at the iso-electric point, whichyields a heterogeneous suspension with a protein content close to200 g/L. Such suspensions of fish protein isolate (FPI) have beenshown to undergo heat-induced irreversible gelation after additionof salt (Choi & Park, 2002; Kim, Park, & Choi, 2003; Kristinsson &Liang, 2006; Kristinsson, Theodore, Demir, & Ingadottir, 2005;Thawornchinsombut & Park, 2007; Undeland, Kelleher, & Hultin,2002; Yongsawatdigul & Park, 2004).
Recently, we have shown (Brenner, Johannsson, & Nicolai, 2008)that non-precipitated FPI solutions extracted from cod muscle atpH 11 form homogeneous gels at room temperature if their pH islowered to between about 9.5 and 8.5 and if the protein concentra-tion is above about 6 g/L. These gels melt when heated above about25 �C, but are reformed when cooled at the same temperature.Thermo-reversible gels can also be formed at pH 11 for C > 15 g/L, but only if they are preheated above 30 �C. An advantage of thesethermo-reversible gels is that they may be processed at highertemperatures as liquids after which gelation may be induced whendesired by cooling.
The dynamic mechanical properties in the linear regime havebeen reported in a previous work (Brenner et al., 2008) for FPI gelsformed at pH 9 and 8.5 without preheating. At high frequencies (f),the storage (G0) and loss (G00) shear moduli are almost frequency
ll rights reserved.
354 4225002.
independent with G0 >> G00, but they decrease weakly at lower fre-quencies. For a given frequency, both G0 and G0 0 increase withdecreasing temperature and increasing concentration.
Here we report on the effect of preheating on the linear dy-namic mechanical properties of FPI gels at pH 9 and pH 11. In addi-tion, we have studied the non-linear rheology using bothcontinuous shear and large amplitude oscillatory shear. Non-linearrheology of food systems is important for sensory attributes(Montejano, Hamann, & Lanier, 1985; vanVliet & Walstra, 1995),as well as the design of manufacturing processes. We determinedcomplete stress–strain curves and creep measurements, whichhave rarely been reported for food systems.
2. Materials and methods
2.1. Sample preparation
Cod white muscle tissue was homogenized at pH 11, followedby centrifugation at 15000g for 10 min. The supernatant was sep-arated over gauze. During this procedure the temperature was keptbelow 10 �C. Fresh cod was either used directly or frozen at �18 �Cand thawed prior to sample preparation. No effect of freezing onthe rheology was observed. Cod caught near Iceland’s shores, aswell as near France, was used in the study. No difference in resultspresented here was found, but preparing protein solutions withconcentrations above 20 g/L was easier using cod caught near Ice-land, independent of time of year. FPI at pH 11 was found to be sta-ble during storage at 4 �C for about 1 day, after which precipitationwas usually observed.

916 T. Brenner et al. / Food Research International 42 (2009) 915–924
The composition of the FPI obtained in this manner has beenpreviously reported (Brenner et al., 2008). Protein concentrationwas determined by measuring the absorption at pH 12 and at awavelength k = 289 nm. The previously reported (Brenner et al.,2008) extinction coefficient (0.71 L g�1 cm�1) was used after cor-recting for the effect of turbidity.
Freshly prepared FPI solutions were loaded into the rheometerat a given heating temperature. After a given heating time the solu-tion was cooled to 5 �C at a rate of 15 �C/min leading to gelation.Gels at pH 9 were also obtained by lowering the pH of the solutionfrom 11 to 9 at 20 �C while vigorously stirring before loading intothe rheometer.
2.2. Rheology
Flow measurements were done on an AR-G2 stress-controlledrheometer (TA Instruments, New Castle, Delaware, USA) usingcone-plate geometry (diameter 60 mm, angle 1�). Oscillatory shearmeasurements were done with the aforementioned rheometer andset-up, as well as using a StressTech stress-controlled rheometer(Reologica, Lund, Sweden) with a couette geometry with innerand outer diameters of 25 and 27 mm, respectively. A thin layerof paraffin oil was added to prevent evaporation. Measurementswere done at 5 �C unless otherwise indicated.
2.3. Confocal microscopy and turbidity
Confocal scanning light microscopy (CSLM) images were ob-tained using a Leica TCS-SP2 microscope (Leica Microsystems Hei-delberg, Germany). The water-immersion objective lens used wasHCx PL APO 63x NA = 1.2, and its specified theoretical resolutionin the x–y plane was 0.3 lm. The turbidity of FPI solution was mea-sured using a spectrophotometer Varian Cary-50 Bio (Les Ullis,France).
3. Results
3.1. Low amplitude oscillatory shear measurements
The FPI gels were studied at 5 �C, which is the typical tempera-ture for chilled food products and gives higher shear moduli thanat room temperature. Fig. 1 shows the frequency dependence of
f (Hz)10-4 10-3 10-2 10-1 100
G',
G''
(Pa)
10-1
100
101
102
Before preheatingAfter preheating
Fig. 1. Frequency dependence of G0 (filled symbols) and G0 0 (open symbols) for FPIgels at pH 9 (C = 25 g/L, 5 �C) before and after preheating at 60 �C for 3 min.
G0 and G0 0 of FPI gels (C = 25 g/L) at pH 9 both before and after pre-heating at 60 �C for 3 min. The effect of heating time on the fre-quency dependence of G0 and G0 0 was found to be insignificantbeyond 3 min at 30 �C or higher. The frequency dependence wasweak in the high frequency regime and the values before and afterpreheating were close. Before preheating the shear moduli de-creased at lower frequencies and G00 was larger than G0 forf < 0.01 Hz, and the curves tended towards the limiting behaviourfor liquids (G0 / f2, G00 / f) at the very lowest frequencies close tof = 10�4 Hz. After preheating, G0 and G00 showed much weaker fre-quency dependence of both moduli in the low-frequency regimeand G0 > G00 down to at least 10�4 Hz.
Fig. 2 shows the frequency dependence of G0 for FPI heated for3 min at different temperatures. Preheating at 30 �C already ledto much weaker frequency dependence. Increasing the heatingtemperature from 30 �C to 40 �C led to even weaker frequencydependence, but further increase in the range 40–80 �C had onlya weak effect on the frequency dependence.
G0 of the sample preheated at 80 �C was significantly lower thanat lower temperatures, see Fig. 2. We already noted in earlier work(Brenner et al., 2008) that the high frequency shear modulus G00 de-fined as G0 at f = 1 Hz was only weakly affected by preheating, withthe caveat that preheating did not lead to extensive hydrolysis. Iso-lation of fish proteins at extreme pH does not deactivate proteasesendogenous to the muscle that cause protein degradation (Brenneret al., 2008; Choi & Park, 2002; Kim et al., 2003; Thawornchinsom-but & Park, 2007), especially above 50 �C (Lanier, 2000). In general,we found degradation to be noticeable if the heating time exceededseveral hours at 30 �C, about 30 min at 50 �C and a few minutes at80 �C.
At pH 9.5–11 FPI did not readily form gels unless first heated forseveral minutes above 30 �C and subsequently cooled down againbelow 25 �C. Preheating of FPI at pH 11 led to gels for C > 15 g/Lwith G00 at 5 �C in the range 8–30 Pa for C = 25 g/L and 2–10 Pafor C = 20 g/L. The variance of G00 between different sample prepa-rations was stronger than any effect of the heating temperature orheating time, see below. The frequency dependence of elastic mod-uli of gels at pH 11 formed after preheating is even weaker than forgels formed after preheating at pH 9, see Fig. 3. As at pH 9, the ef-fect of heating-time beyond 3 min and heating temperature be-yond 30 �C on G0 and G0 0 is very weak unless it leads tosignificant hydrolysis. As mentioned earlier, at pH 11 FPI solutions
f (Hz)
10-3 10-2 10-1 100
G' (
Pa)
100
101
102
Before preheating
30°C
40°C
60°C
80°C
Fig. 2. Frequency dependence of G0 for FPI gels at pH 9 (C = 25 g/L, 5 �C) preheatedfor 3 min at different temperatures indicated in the figure.

f (Hz)10-4 10-3 10-2 10-1 100
G',
G''
(Pa)
10-4
10-3
10-2
10-1
100
101
102
Non-preheated
30°C
60°C
Fig. 3. Frequency dependence of G0 (filled symbols) and G0 0 (open symbols) for FPIgels at pH 11 (C = 25 g/L, 5 �C) before and after preheating for 3 min at 30 �C or60 �C.
t (s)101 102 103 104
γ
10-1
100
101
0.5Pa
1Pa
2Pa
3Pa
3.5Pa
4Paa
t (s)
101 102 103
γ
10-1
100
101
6.5Pa
13Pa
23Pa
40Pa
b
t (s)101 102 103
γ/γ 0-1
10-1
100
101
pH 11
pH 9
C
Fig. 4. Strain as a function of time at different applied stresses indicated in thefigures for preheated gels at pH 11 (C = 20 g/L, G0 = 5 Pa) (a) and at pH 9 (C = 20 g/L,G0 = 40 Pa) (b). (c) shows the same data in a different representation. The solid linesin (c) have a slope of 0.3.
T. Brenner et al. / Food Research International 42 (2009) 915–924 917
kept at 20 �C did not gel when cooled, but they did gel after severalhours of preheating at 25 �C.
3.2. Continuous shear flow
3.2.1. Creep measurementsThe strain of FPI gels was recorded as a function of time (t) at
constant applied stress (r) at T = 5 �C. Fig. 4a shows the time-dependence of c for gels at pH 9 and 11 preheated for 5 min at30 �C. After applying stress the systems deform initially very rap-idly to c0 followed by slow creep. c0 increased linearly with r:r = G0 � c0, with G0 close to the high frequency shear modulusðG00Þ obtained from low amplitude oscillatory shear. The initial ra-pid deformation was followed by an increase of the deformationthat was weaker than linear with time. After cessation of the stressthe initial deformation was recovered immediately and part of thesubsequent slow deformation was also recovered slowly.
At both pH, the time-dependent increase of the strain at differ-ent stresses could be described by a power-law, see Fig. 4:
cðtÞ ¼ c0ð1þ ðt=sÞaÞ ð1Þ
Above a critical strain of about 1.5 the systems started to flow, prob-ably caused by large scale fracture of the gel. Fracture was more dif-ficult to discern at pH 9 than at pH 11, compare Fig. 4a and b, as thedeviation from the power-law creep was weaker. The power-lawcreep is observed more readily in Fig. 4c, where (c(t)/c0 � 1) is plot-ted as a function of time. Using this representation, we obtainedwithin the experimental error master-curves for individual samplesmeasured at different stresses. For the data shown in Fig. 4, thepower-law exponent a was close at both pH 0.3, but the character-istic times s differed significantly (5000 s and 5 s at pH 11 and 9,respectively). Creep measurements of different preparations couldnot be represented by a single master-curve at each pH. Thepower-law exponent a was in the range 0.3–0.4 for pH 11, and avariance was found also in the characteristic time s (1000–5000 s). Greater variance of both parameters was found for pH 9,with a in the range 0.3–0.7 and s in the range 1–25 s. Of course,for high values of a, any deviation towards a steady-state flowmay strongly influence the apparent power-law observed beforefracture. While we observed upward deviations from the power-law and fracture for both pH, we observed downward deviations
and a plateau only for pH 9. Samples at pH 11 which did not fracturefollowed power-law creep up to 105 s.
For r > 5 Pa at pH 11 and for r > 40 Pa at pH 9 the systemsshown in Fig. 4 immediately fractured and flowed with a constantflow rate. We may define a yield stress as the lowest stress at

918 T. Brenner et al. / Food Research International 42 (2009) 915–924
which the systems flow immediately. Similar behaviour was foundfor all gels with yield stresses that increased with increasing G00, seebelow.
3.2.2. Stress rampsThe deformation was recorded as a function of applied stress
that was increased linearly with time at different rates (dr/dt).Strain–stress curves of a system at pH 11 (C = 20 g/L, G00 ¼ 4:8 Pa)are shown in Fig. 5a. In order to show more clearly the non-linearbehaviour the same data are shown in Fig. 5b in terms of the in-verse of the compliance, or an effective shear modulus, G � r/cas function of r. At small deformations and in the absence of signif-icant creep, i.e. for fast rates, G should be a constant G0 close to G00.Results obtained for gels with different G00 were found to be close ifthey were compared at the same initial flow rates: dc/dt = (dr/dt)/G0.
At all rates the systems fractured at approximately the samedeformation (cf � 1.5), but the stress at fracture (rf) increased withincreasing rate. Before fracture the strain increased less than the
σ (Pa)
10-1 100 101
γ
10-1
100
101
0.5 s-1
0.25 s-1
0.1 s-1
0.05 s-1
0.005 s-1
0.0005 s-1
a
σ (Pa) 10-1 100 101
G=σ
/γ (P
a)
100
101
b
Fig. 5. Strain–stress curves of FPI gels at pH 11 (C = 20 g/L, G0 = 4.8 Pa, 5 �C) areshown in (a). The open symbols indicate flow measurements at different initial flowrates (dc/dt = (dr/dt)/G0) indicated in the figure, while the filled symbols indicateoscillatory measurements at f = 1 Hz. The solid line represents c ¼ a=G00. A differentrepresentation of the same data is shown in (b): G = r/c versus r.
stress, which is usually called strain hardening. Strain hardeningcaused the maximum (Gmax) of G as a function of r seen inFig. 5b. The amplitude of strain hardening (Gmax/G0) decreasedwith decreasing flow rates, because the effect of creep becamemore important leading to weak shear softening before shear hard-ening became significant. Notice that for dc/dt < 0.005 s�1 theamplitude was less than unity, because the initial strain softeningdue to creep became more important than the subsequent strainhardening. The increase of rf (defined as the stress at Gmax) withincreasing shear rate can be explained by the combination ofincreasing shear hardening and decreasing effect of creep. Strain–stress curves of gels at pH 9 were similar to those at pH 11, seeFig. 6.
At both pH strongly sheared samples slowly gelled again aftercessation of the stress. The linear rheological properties of thesegels were similar, but their yield stress was lower. This indicatesthat broken cross-links reformed, but that the network had moredefects. Strongly sheared gels could be fully regenerated by heatingfor a short time above 30 �C. Repeated measurements after reheat-ing gave the same yield stress within the experimental error.
When the applied stress was larger than the yield stress, thesystems at both pH flowed rapidly ð _c > 100 s�1Þ with a viscosityof about 0.05 Pa s. The flow rate was subsequently reduced in stepsand the stress was measured at each flow rate as a function of time.With decreasing flow rate the stress decreased towards an averagevalue close to rf and then remained constant, see Fig. 7. Howeverthe stress fluctuated significantly around the average value as indi-cated by the error bars in Fig. 7. These results can be explained by adynamic equilibrium between breaking and formation of bonds. Ifthe stress increases above rf bond breaking dominates causing anincrease of the shear rate while if it is lower bond formation dom-inates causing a decrease of the shear rate. The fluctuation withtime occurs, because the dynamics of bond breaking and formationare relatively slow. On time scales longer than a few hours the sys-tem evolved irreversibly at a given flow.
3.3. Large amplitude oscillatory shear
The strain response of the system to imposed sinusoidal stressbecame increasingly non-sinusoidal with increasing stress or strainbeyond the linear regime. However, maximum stress–maximum
σ (Pa)100 101
γ
10-1
100
101
0.25 s-1
0.012 s-1
0.005 s-1
Fig. 6. Strain–stress curves for FPI gels at pH 9 (C = 17 g/L, G0 = 11 Pa). The opensymbols indicate flow measurements at different initial flow rates (dc/dt = (dr/dt)/G0) indicated in the figure, while the filled symbols indicate oscillatory measure-ments at f = 1 Hz. The solid line represents c ¼ a=G00.

Shear rate (s-1)10-4 10-3 10-2 10-1 100 101 102 103
η(P
a s)
10-2
10-1
100
101
102
103
104
Shear rate (s-1)10-4 10-3 10-2 10-1 100 101 102 103
σ(P
a)
10-1
100
101
a
b
Fig. 7. (a). Steady-state viscosities as a function of the shear rate for FPI gels at pH11 (open symbols) and pH 9 (filled symbols) (C = 20 g/L, 5 �C). Error bars areindicated in the figure (b). The same data as in Fig. 7a, given as the measured shearstress as a function of the shear rate. Error bars are indicated in the figure. Thehorizontal lines represent estimates of the yield stress of each sheared system; forpH 9, rf = 13 Pa and for pH 11, rf = 0.7 Pa.
γ0.1 1
G'/G
' 0
0.9
1.0
1.1
1.2
1.3
1.4
1.5
30°C
50°C
70°C
Fig. 8. Normalized elastic modulus as a function of the strain for FPI gels at pH 11after preheating for 10 min at different temperatures indicated in the figure(C = 25 g/L, 5 �C).
γ0.1 1
G'/G
' 0
1.0
1.2
1.4
1.6
20°C
30°C
40°C
60°C
Fig. 9. Normalized elastic modulus as a function of the strain for FPI gels at pH 9after preheating for 10 min at temperatures indicated in the figure (C = 25 g/L, 5 �C).
T. Brenner et al. / Food Research International 42 (2009) 915–924 919
strain curves obtained using oscillation with frequencies of 1 Hz or0.1 Hz coincided with stress–strain curves obtained using continu-ous shear measurements at the highest rates accessible experi-mentally, see e.g. Figs. 5 and 6. The calculated values of G0 wereclose to G derived from continuous shear measurements up to frac-ture, which is expected since G0 >> G00. The advantage of using oscil-latory shear over continuous shear is that creep can be neglected atthe frequencies used here.
Gels produced at both pH values showed linear dependence ofthe stress on the strain at moderate strains (up to �0.1 for pH 9and �0.3 for pH 11), followed by strain hardening up to fracture.Fig. 8 shows normalized values of the storage modulus G0=G00 of gelsprepared after preheating at different temperatures of FPI at pH 11.The strain (cf) and stress (rf) at fracture were defined as the valueswhere G0 ¼ G0max. These measurements were done at 1 Hz, butresults obtained at 0.1 Hz were the same within the experimentalerror. No significant effect was observed of the preheating temper-ature or of the preheating time. The stress at fracture obtained inthis way is equal to the yield stress above which the systems flowimmediately during constant application of stress.
Fig. 9 shows G0=G00 as a function of strain for FPI gel produced atpH 9 (C = 25 g/L) without preheating and after preheating for10 min at different temperatures. Non-preheated gels fracturedat strains in the range 0.3–0.4 and showed only weak strain hard-ening. Gels preheated at 30 �C showed reproducible results of G0=G00versus c with strain hardening behaviour similar to that observedat pH 11. G0max=G00 values were in the range 1.5–1.7 and cf was inthe range 0.75–0.85, independent of the heating time. Gels pre-heated at 40 �C or higher often showed fracture at small strainswith no strain hardening, as illustrated in Fig. 9. However, some-times they exhibited strain hardening resembling that of gels pre-heated at 30 �C. We emphasize that the difference in behaviourwas caused by the heating temperature and not by the heatingtime.
We have previously reported that for gels formed at pH 9 with-out preheating G00 increased strongly with increasing protein con-centration in the concentration range 6–25 g/L (Brenner et al.,
920 T. Brenner et al. / Food Research International 42 (2009) 915–924
2008). As noted above, G00 was only slightly affected by preheatingso that the concentration range at which we could measure gelsusing rheology was not changed after preheating. Gels at C = 6 g/L showed no strain hardening and broke at very low stresses, whilefor C = 8 g/L we observed sometimes strain hardening andsometimes immediate fracture. Gels in the concentration range10–25 g/L exhibited always strain hardening behaviour afterpreheating at 30 �C.
Fig. 10a shows the strain dependence of G0 for gels in the con-centration range 8–25 g/L at pH 9, and Fig. 10b shows the samedata after normalisation with G00. The preheating temperature forthis experiment was chosen as 30 �C because, as noted above, atthis temperature gels showed the most reproducible and strongeststrain hardening. The strain dependence of G0=G00 was similar for allconcentrations, but the variance of G0max=G00 and cf was larger atlower concentrations. For all concentrations, cf was in the range0.5–1.1 and G0max=G00 in the range 1.3–2.0.
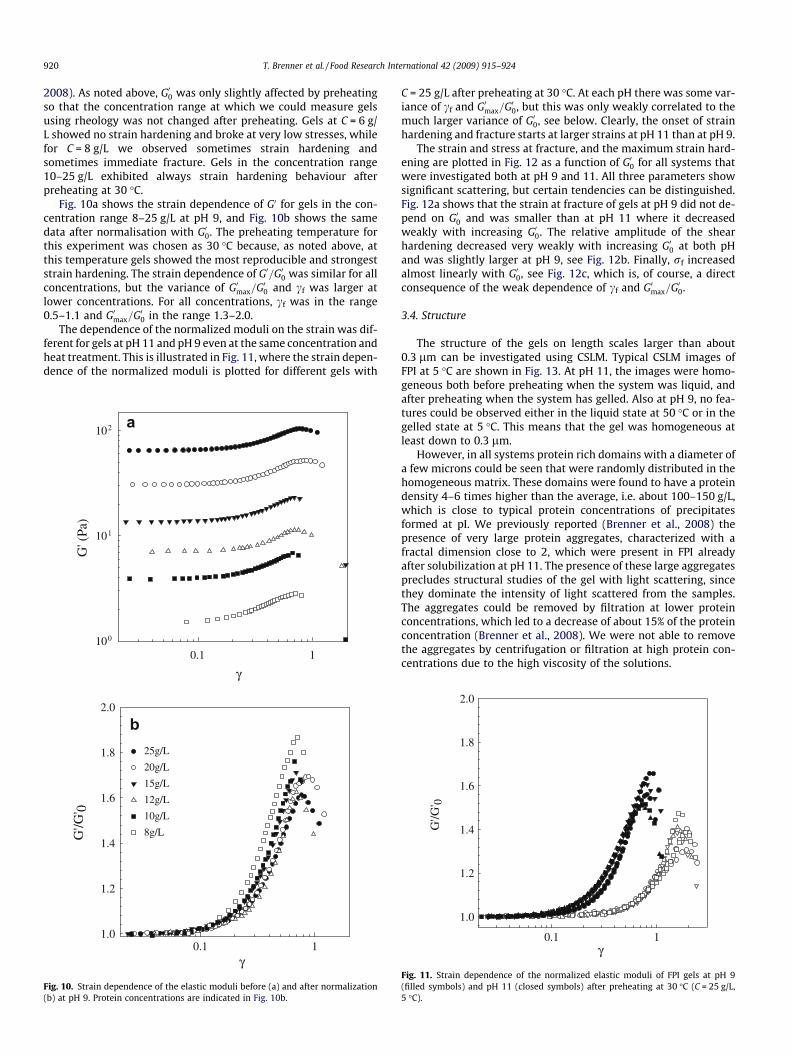
The dependence of the normalized moduli on the strain was dif-ferent for gels at pH 11 and pH 9 even at the same concentration andheat treatment. This is illustrated in Fig. 11, where the strain depen-dence of the normalized moduli is plotted for different gels with
γ0.1 1
G' (
Pa)
100
101
102 a
γ0.1 1
G'/G
' 0
1.0
1.2
1.4
1.6
1.8
2.0
25g/L
20g/L
15g/L
12g/L
10g/L
8g/L
b
Fig. 10. Strain dependence of the elastic moduli before (a) and after normalization(b) at pH 9. Protein concentrations are indicated in Fig. 10b.
C = 25 g/L after preheating at 30 �C. At each pH there was some var-iance of cf and G0max=G00, but this was only weakly correlated to themuch larger variance of G00, see below. Clearly, the onset of strainhardening and fracture starts at larger strains at pH 11 than at pH 9.
The strain and stress at fracture, and the maximum strain hard-ening are plotted in Fig. 12 as a function of G00 for all systems thatwere investigated both at pH 9 and 11. All three parameters showsignificant scattering, but certain tendencies can be distinguished.Fig. 12a shows that the strain at fracture of gels at pH 9 did not de-pend on G00 and was smaller than at pH 11 where it decreasedweakly with increasing G00. The relative amplitude of the shearhardening decreased very weakly with increasing G00 at both pHand was slightly larger at pH 9, see Fig. 12b. Finally, rf increasedalmost linearly with G00, see Fig. 12c, which is, of course, a directconsequence of the weak dependence of cf and G0max=G00.
3.4. Structure
The structure of the gels on length scales larger than about0.3 lm can be investigated using CSLM. Typical CSLM images ofFPI at 5 �C are shown in Fig. 13. At pH 11, the images were homo-geneous both before preheating when the system was liquid, andafter preheating when the system has gelled. Also at pH 9, no fea-tures could be observed either in the liquid state at 50 �C or in thegelled state at 5 �C. This means that the gel was homogeneous atleast down to 0.3 lm.
However, in all systems protein rich domains with a diameter ofa few microns could be seen that were randomly distributed in thehomogeneous matrix. These domains were found to have a proteindensity 4–6 times higher than the average, i.e. about 100–150 g/L,which is close to typical protein concentrations of precipitatesformed at pI. We previously reported (Brenner et al., 2008) thepresence of very large protein aggregates, characterized with afractal dimension close to 2, which were present in FPI alreadyafter solubilization at pH 11. The presence of these large aggregatesprecludes structural studies of the gel with light scattering, sincethey dominate the intensity of light scattered from the samples.The aggregates could be removed by filtration at lower proteinconcentrations, which led to a decrease of about 15% of the proteinconcentration (Brenner et al., 2008). We were not able to removethe aggregates by centrifugation or filtration at high protein con-centrations due to the high viscosity of the solutions.
γ0.1 1
G'/G
' 0
1.0
1.2
1.4
1.6
1.8
2.0
Fig. 11. Strain dependence of the normalized elastic moduli of FPI gels at pH 9(filled symbols) and pH 11 (closed symbols) after preheating at 30 �C (C = 25 g/L,5 �C).

G'0 (Pa)100 101 102
γ f
0.0
0.5
1.0
1.5
2.0
2.5
3.0a
G'0 (Pa)100 101 102
G' m
ax/G
' 0
1.0
1.2
1.4
1.6
1.8
2.0
2.2
b
G'0 (Pa)100 101 102
σ f
100
101
102 c
Fig. 12. Fracture strain cf (a), normalized elastic modulus G0m=G00 (b) and stress rf (c)as a function of G00. Filled symbols: pH 9, open symbols: pH 11.
T. Brenner et al. / Food Research International 42 (2009) 915–924 921
Interestingly, protein poor domains appeared at both pH after awaiting time that fluctuated strongly between different samples,but was typically 1–4 days at 5 �C. The protein poor domains were
spherical with a radius of a few microns and also randomly distrib-uted in the homogeneous matrix. The protein concentration inthese domains was typically 25–50% of the average protein con-centration, i.e. 5–10 g/L. We speculate that the protein poor do-mains are caused by the slow phase separation of the system.
Although CSLM showed no difference between the liquid andthe gelled state on length scales larger than 0.3 lm, turbidity mea-surements showed that the gel structure did change. Unheated FPIsolutions (C = 25 g/L) at pH 9 and pH 11 were inserted in the spec-trophotometer. The solutions were subsequently heated at 50 �C;cooled to 5 �C; and finally heated again to 50 �C. The turbidity dur-ing this heat treatment is plotted in Fig. 14. At both pH gelationleads to an increase of the turbidity which is reversed by meltingat higher temperatures. At all temperatures the turbidity is higherat pH 9 than at pH 11. These results imply that the system is morehomogeneous at pH 11, probably because electrostatic repulsion ismore important. They also imply that cross-linking leads to an in-creased heterogeneity, as might be expected. Unfortunately, asmentioned above, the presence of the large protein aggregates ren-dered a more detailed investigation of the structure using lightscattering impossible.
4. Discussions
FPI solutions gel when the pH is decreased to below 9.5, i.e.when the charge density of the proteins is lowered. This suggeststhat cross-linking is made possible by reduced electrostatic repul-sion. Homogeneous gels are formed only in a narrow pH range be-tween 9.5 and 8.5. At even lower pH the system becomes rapidlyheterogeneous and visible protein flocs are formed. Even at pH 9gels become increasingly heterogeneous over a period of days,showing that the system is basically unstable at all values of thepH where cross-linking occurs.
We speculate that homogeneous gels are formed only whenelectrostatic repulsion is low enough to allow cross-linking, but stillimportant enough to inhibit rapid densification, and the contribu-tion of attractive opposite-charge interactions facilitates gel forma-tion at an intermediate pH range, i.e. 8.5–9.5. The evolution of thegels with time shows that the bonds are to some extent reversible,which may also explain the decrease of G0 and G00 with decreasingfrequency at low frequencies. Preliminary measurements showedthat adding salt to FPI solutions caused a lowering of the pH wherethe gels were formed. However, it also reduced the pH range inwhich homogeneous gels could be formed. The effect of adding saltindicates that opposite charges might be involved in the cross-links.On the other hand, the gel strength increased with decreasing tem-perature indicating possible involvement of hydrogen bonds.
Heating FPI solutions above about 30 �C modifies at least someof the proteins in the mixture. As a consequence, gels are formed atall pH up to at least 11, when FPI solutions are cooled below about25 �C. Bonding in this case is probably caused by a temperaturereversible conformational transition of some proteins, becausethe gels melt again when heated above 25 �C. One could imaginethat gelation induced by lowering the pH was caused by the sameconformational transition. However, the frequency dependence ofG0 and G00 was not the same at low frequencies before and after pre-heating, demonstrating the effect of heating even at lower pH.After fracture the bonds reformed slowly, demonstrating theirreversibility even at 5 �C, but gels formed from highly sheared sys-tems had a lower yield stress. Gels with the original higher yieldstress were formed only after reheating the sheared systems above30 �C. We note here that currently 2 processing plants in Icelandtake advantage of an isolation process from fish cut-offs, similarto that reported herein. The thermo-reversible gelation described,as well as the ability of gels to reform at rest after fracture, allow

Fig. 13. CSLM images of FPI. (a) pH 11 at 5 �C before preheating, (b) pH 11 at 5 �C after preheating, (c) pH 11 after 4 days at 5 �C, (d) pH 9 at 50 �C, (e) pH 9 at 5 �C afterpreheating and (f) pH 9 after 1 day at 5 �C. The width of the images represents in all cases 160 lm. Large protein aggregates are visible as white spots, while the arrowsindicate protein poor domains in (c) and (f).
time (arbitrary units)
τ (c
m-1
)
10-1
100
101
5°C 50°C5°C
50°C
pH 9
pH 11
Fig. 14. Turbidity at a wavelength of 633 nm for FPI solutions (C = 25 g/L) at pH 9and 11. Unheated samples were first measured at 5 �C, then heated to 50 �C, cooledto 5 �C and finally heated again to 50 �C.
922 T. Brenner et al. / Food Research International 42 (2009) 915–924
for use of the FPI in solutions injected back into fish fillets. The in-jected FPI is allowed to gel in situ in the fillet, and increases theweight of the fillet. No problems of FPI ‘‘dripping” after injectionhave been observed.
At low applied stresses the systems crept with a strain that in-creased more weakly than linearly with the time, but did not reacha plateau. At pH 11, and some of the samples at pH 9, the straincould be fitted to a power-law with an exponent close to 1/3,which is, interestingly, also observed for metals (Nabarro, 2004).We could not identify a stress below which no creep occurred,though for pH 9 it was observed in one instance that creep totallystagnated after 1 day. Macroscopically the gels showed no flowwhen the vials were left tilted overnight even though they showedlarge deformation.
When the applied stress exceeded a certain value, the gels frac-tured and started to flow. In a small range of applied stresses the
flow started only after a period of creep that increased rapidly withdecreasing stress. Apparently, in this range the tension in the sys-tem accumulated with time until it led to fracture. Remarkably,fracture occurred at approximately the same deformation indepen-dent of the time it took to reach this deformation.
Creep measurements on food related systems and aqueous gelsin general are rare, but recently, Caton and Baravian (2008) studiedcreep of several food products. They observed similar behaviour tothat reported here, i.e. a fast elastic response, followed by a power-law creep and finally fracture leading to regular flow. They alsofound that the duration after which the systems fractured in-creased with decreasing applied stress, but that the deformationat fracture was approximately constant. They made the interestingobservation that the time of fracture increased exponentially withdecreasing stress. They also noted that for the lowest stress in theirpresented data, no fracture was observed within a time one orderof magnitude longer than that calculated with the (empirical)exponential relation of stress and time-to-fracture. Their interpre-tation was that ‘‘. . .there exists a minimal stress necessary to fluid-ize the material. This minimal stress defines a critical stress belowwhich flow seems forbidden. . .there seems to exist a critical stressbelow which the material will never experience apparent or trueflow”. Our observations of a plateau reached during applicationof low stresses to FPI gels at pH 9 lead to the same conclusion.We could not find such a plateau during creep measurements atpH 11. It was observed for both pH, however, that fractured sys-tems reformed under application of low stresses. In these cases ref-ormation under shear was indicated by a very sharp decrease indeformation rate, after which the deformation rate kept decreas-ing, indicating that true flow cannot be reached at these stresses.
Creep accounts for the dependence of strain–stress curves onthe rate of the stress ramp. Slow stress ramps allow for more creepand thus fracture will occur at lower stress. A dependence on therate of the stress ramp has been observed before for protein gels,e.g. whey protein gels (Lowe, Foegeding, & Daubert, 2003), emul-sion filled whey protein gels (Sala, van Vliet, Cohen Stuart, vanAken, & van de Velde, 2008) and gelatin gels (Bot, vanAmerongen,Groot, Hoekstra, & Agterof, 1996), but was not shown experimen-tally to be related to creep.

T. Brenner et al. / Food Research International 42 (2009) 915–924 923
Shear hardening has also been observed for other protein gels.For gelatin gels, strain hardening was reported at strains exceeding0.5 in shearing experiments and 0.1 in compression experiments(Bot et al., 1996; Groot, Bot, & Agterof, 1996). For whey protein iso-lates, strain-softening followed by strain hardening above strainsof about 1 (Lowe et al., 2003) as well as monotonous strain harden-ing above strains of 0.1 (Li, Errington, & Foegeding, 1999) havebeen reported. Gels of bovine serum-albumin (Hagiwara, Kumagai,& Matsunaga, 1997) and b-lactoglobulin (Pouzot, Nicolai, Benyahia,& Durand, 2006) strain-harden to various extents depending on to-tal protein concentration (and therefore elastic modulus) beforefracture. Observations of the dependence of strain at fracture (cf)on gel strength have been reported for several food systems andprotein gels in particular. cf was found to be roughly a constantup to G0 = 100 Pa and decreased less strongly than linearly withincreasing G0 above 100 Pa for gels of b-lactoglobulin at neutralpH (Pouzot et al., 2006). Conversely, a monotonous decrease of cf
with increasing protein concentrations (and therefore G0) wasfound for gelatin gels (Bot et al., 1996) and gels of whey proteinmixtures (Foegeding, 1992; Li et al., 1999; Lowe et al., 2003), atleast up to protein concentrations of 15%.
For globular protein gels it was shown by scattering techniquesthat they are self-similar below the gel’s correlation length and arecharacterized by a single fractal dimension at certain conditions ofpH and ionic strength (Nicolai, 2007). Therefore strain hardening ofb-lactoglobulin gels could be described with the model proposedby Gisler, Ball, and Weitz (1999) for strain hardening of fractal gels.This was done by Pouzot et al. (2006) who also showed structuralresults from strain hardening analysis and light scattering pre-dicted correctly concentration dependence of the linear regimeelastic modulus of b-lactoglobulin gels. The same strain hardeningmodel of fractal gels could also be used to describe the shear hard-ening of FPI gels observed in this study, but we were not able toestablish whether FPI gels had a self-similar structure.
As was noted above, the reversible increase of turbidity duringcooling at both pH indicates a reversible gelation mechanism is atwork, which we had previously deduced from a reversible increaseof the elastic modulus during cooling. Reversible aggregation ofpurified codmyosin at pH 6–8 and a high salt concentration waspreviously deduced from a reversible increase of both turbidityand scattered light intensity during cooling of preheated cod myo-sin solutions (Brenner, Johannsson, & Nicolai, 2009). Such thermo-reversible aggregation of myosin may be related to, or explain inpart, the gelation we observe for FPI. At pH 11, the turbidity at5 �C is higher after preheating than before preheating, which weexpect since gel formation was observed using rheology only afterpreheating. At pH 9, the turbidity is very similar at 5 �C before andafter heating, which suggests a similar structure is formed in bothcases. The different rheology of gels at pH 9 before and after pre-heating suggests that preheating promotes stronger bond forma-tion without modifying structure significantly. As mentionedabove, the lower turbidity at pH 11 compared to at pH 9 is proba-bly caused by the stronger electrostatic repulsion at pH 11. Thismight also explain why the gel strength decreases much more rap-idly with decreasing protein concentration at pH 11.
5. Summary
Gelation of FPI solutions obtained by dissolving fish muscle pro-teins at pH 11 can be induced either by decreasing the pH to belowpH 9.5 or by preheating above 30 �C. Although preheating is not re-quired for gelation below pH 9.5, it leads to gels with a weaker lowfrequency dependence of the shear moduli. Duration and temper-ature of heating have very little influence on the rheological prop-erties of the gels beyond 3 min and 40 �C, respectively. FPI gels
melted above about 25 �C and reformed rapidly after cooling to be-low about the same temperature.
At low constant shear stresses, the gels showed slow power-lawcreep, while above a certain stress the gel fractured leading to flow.Strongly sheared systems were macroscopically homogeneous liq-uids with relatively low viscosity, but slowly gelled again after ces-sation of the stress, as well as under low stresses below theminimal stress needed to fluidize the system. The stress at fracturedecreased when the stress ramp was slower, while the strain atfracture was independent of the rate of stress increase. Oscillatorystress at 1 Hz yielded results that were close to those obtainedwith the fastest stress ramps available experimentally.
Gels showed similar strain hardening patterns independent ofpreheating temperature at pH 11. The strain hardening of gels pro-duced at pH 9 depended on the temperature. It was always foundfor gels preheated at 30 �C, but preheating at higher temperaturesmost often led to gels that fractured at low stresses and with veryweak or no strain hardening.
The strain at fracture varied weakly with the elastic shear mod-ulus of the gels, but it was systematically larger at pH 11 than at pH9 even when the latter was preheated to 30 �C. The amplitude ofshear hardening also depended only weakly on the elastic modulusof the gels, implying that the stress at fracture increased almostlinearly with G00.
FPI solutions were homogeneous at length scales above 0.3 lmboth in the liquid and in the gel state, but contained micron sizedprotein aggregates. Turbidity measurements showed that the gelstructure on smaller length scales was more homogeneous at pH11 than at pH 9 and that gelation increased the heterogeneity.
Acknowledgements
We thank Lazhar Benyahia for critical reading of the manuscriptand stimulating discussions on creep behaviour. The AVS R&D fundof the Ministry of Fisheries in Iceland, The Icelandic TechnologyDevelopment Fund, the Icelandic Research Center Student Fundand Jules Verne’s Research fund are acknowledged for financialsupport of this work.
References
Bot, A., vanAmerongen, I. A., Groot, R. D., Hoekstra, N. L., & Agterof, W. G. M. (1996).Effect of deformation rate on the stress–strain curves of gelatin gels. Journal DeChimie Physique Et De Physico-Chimie Biologique, 93(5), 837–849.
Brenner, T., Johannsson, R., & Nicolai, T. (2008). Characterisation and thermo-reversible gelation of cod muscle protein isolates. Food Chemistry. doi:10.1016/j.foodchem.2008.11.046.
Brenner, T., Johannsson, R., & Nicolai, T. (2009). Characterization of fish myosinaggregates using static and dynamic light scattering. Food Hydrocolloids, 23(2),296–305.
Caton, F., & Baravian, C. (2008). Plastic behavior of some yield stress fluids: fromcreep to long-time yield. Rheologica Acta, 47(5–6), 601–607.
Choi, Y. J., & Park, J. W. (2002). Acid-aided protein recovery from enzyme-rich Pacificwhiting. Journal of Food Science, 67(8), 2962–2967.
Foegeding, E. A. (1992). Rheological properties of whey protein isolate gelsdetermined by torsional fracture and stress–relaxation. Journal of TextureStudies, 23(3), 337–348.
Gisler, T., Ball, R., & Weitz, D. A. (1999). Strain hardening of fractal colloidal gels.Physical Review Letters, 82(5), 1064–1067.
Groot, R. D., Bot, A., & Agterof, W. G. M. (1996). Molecular theory of strain hardeningof a polymer gel: Application to gelatin. Journal of Chemical Physics, 104(22),9202–9219.
Hagiwara, T., Kumagai, H., & Matsunaga, T. (1997). Fractal analysis of the elasticityof BSA and beta-lactoglobulin gels. Journal of Agricultural and Food Chemistry,45(10), 3807–3812.
Kim, Y. S., Park, J. W., & Choi, Y. J. (2003). New approaches for the effective recoveryof fish proteins and their physicochemical characteristics. Fisheries Science,69(6), 1231–1239.
Kristinsson, H. G., & Liang, Y. (2006). Effect of pH-shift processing and surimiprocessing on Atlantic croaker (Micropogonias undulates) muscle proteins.Journal of Food Science, 71(5), C304–C312.
Kristinsson, H. G., Theodore, A. E., Demir, N., & Ingadottir, B. (2005). A comparativestudy between acid- and alkali-aided processing and surimi processing for the

924 T. Brenner et al. / Food Research International 42 (2009) 915–924
recovery of proteins from channel catfish muscle. Journal of Food Science, 70(4),C298–C306.
Lanier, T. C. (2000). Surimi: Gelation chemistry. In J. W. Park (Ed.), Surimi and surimiseafood (pp. 237–265). New York: Marcel Dekker.
Li, H., Errington, A. D., & Foegeding, E. A. (1999). Isostrength comparison of large-strain (fracture) rheological properties of egg white and whey protein gels.Journal of Food Science, 64(5), 893–898.
Lowe, L. L., Foegeding, E. A., & Daubert, C. R. (2003). Rheological properties of fine-stranded whey protein isolate gels. Food Hydrocolloids, 17(4), 515–522.
Montejano, J. G., Hamann, D. D., & Lanier, T. C. (1985). Comparison of torsionalfailure and texture profile characteristics of selected heat-induced protein gels.Journal of Texture Studies, 16(4), 403–424.
Nabarro, F. R. N. (2004). Do we have an acceptable model of power-law creep?Materials Science and Engineering a-Structural Materials Properties Microstructureand Processing, 387, 659–664.
Nicolai, T. (2007). Structure of self-assembled globular proteins. In E. Dickenson &M. Leser (Eds.), Food colloids. Interactions, microstructure and processing(pp. 35–56). Cambridge: The Royal Society of Chemistry.
Pouzot, M., Nicolai, T., Benyahia, L., & Durand, D. (2006). Strain hardening andfracture of heat-set fractal globular protein gels. Journal of Colloid and InterfaceScience, 293(2), 376–383.
Sala, G., van Vliet, T., Cohen Stuart, M. A., van Aken, G. A., & van de Velde, F. (2008).Deformation and fracture of emulsion-filled gels. Effect of oil content anddeformation speed. Food Hydrocolloids. doi:10.1016/j.foodhyd.2008.11.016.
Thawornchinsombut, S., & Park, J. W. (2007). Effect of NaCl on gelationcharacteristics of acid- and alkali-treated Pacific whiting fish protein isolates.Journal of Food Biochemistry, 31(4), 427–455.
Undeland, I., Kelleher, S. D., & Hultin, H. O. (2002). Recovery of functionalproteins from herring (Clupea harengus) light muscle by an acid or alkalinesolubilization process. Journal of Agricultural and Food Chemistry, 50(25),7371–7379.
vanVliet, T., & Walstra, P. (1995). Large deformation and fracture behaviour of gels.Faraday Discussions, 101, 359–370.
Yongsawatdigul, J., & Park, J. W. (2004). Effects of alkali and acid solubilization ongelation characteristics of rockfish muscle proteins. Journal of Food Science,69(7), C499–C505.