Phase behaviour of a wheat protein isolate
10
Phase behaviour of a wheat protein isolate Adeline Boire, Paul Menut, * Marie-H´ el` ene Morel and Christian Sanchez We investigated the liquid–liquid phase separation of wheat storage proteins with molecular weight (MW) ranging from 25 kg mol 1 to 300 kg mol 1 . We characterized the onset of the phase separation upon a temperature decrease by turbidity. The protein compositions at equilibrium after temperature quenches were additionally determined by size-exclusion-high performance liquid chromatography. We found that wheat proteins can be classified into two classes according to their phase behaviour. The partition of the proteins between the two phases depends on their MW above a critical size of 45 kg mol 1 . For those high MW proteins, we observed that the behaviour is similar to the one of neutral, linear polymers. Their partition and critical parameters are well described by Flory–Huggins theory. Proteins below 45 kg mol 1 , namely a-, b-and g-gliadins, have similar interaction potentials under the physico- chemical conditions tested. Their phase diagrams, characterized by a low value of critical volume fraction, are characteristic of long-range interactions. Wheat protein behaviour can resultantly be rationalized in a much simpler way than expected from their complex composition. I. Introduction The phase behaviour of a protein is a key determinant of its functions and dysfunctions. One of the most studied examples is the liquid–liquid phase separation of lens proteins that induces the opacication of the ocular in certain forms of cataracts. 1–3 The occurrence of liquid–liquid phase separation in protein solution has been attributed to short-range protein–protein attractions. A change in the solvent variables (e.g. temperature, pH, pressure, ionic strength, and protein concentration) or a change in the protein properties, by mutation, for example, can change the interaction equilibrium and induce a phase separa- tion of the system with a protein-rich and a protein-poor phases. A simple way to tune the interaction properties is obtained through temperature changes. The resulting well-known T F phase diagram, where T is the temperature and F is the protein volume fraction, relates the state of the solution (e.g. liquid, solid, and two-phase coexistence) to the solvent quality. The shape and position of the phase diagram boundaries depend on the protein interaction potential, whose depth and range depend on the properties of the proteins and of the solvent. 4–7 Recently, there have been major advances in the realm of phase transition studies of proteins and colloids due to advances in experimental and computational methods. 4,5,7–15 It has provided new knowledge on the interaction properties of animal proteins, e.g. lysozyme, 10,12,16 lens protein 3,17,18 and monoclonal antibody. 19–21 Unfortunately, experimental studies on plant proteins have not been renewed in a similar way, despite their special interest to food research and food industries for developing alternative sustainable sources of dietary protein. Determining the nature of the interactions that dictate their structure and functionality would enlarge their technological end-uses. Plant storage proteins constitute a large and heterogeneous mixture of proteins, even in a single variety of plant. 22,23 This diversity arises from the evolution of their genes through the ages in relation to their primary role of nutrient storage. In contrast to animal proteins whose gene sequence was highly conserved throughout the ages to allow proper biological function, several phenomena have occurred to promote polymorphism in plant storage proteins. 22 In particular, successive additions in their genes contributed to increase the polydispersity preventing their crystallization and favouring high packing fractions within grains. Plant storage proteins are far from colloidal models like lysozyme or BSA. Here, we study wheat storage proteins. They have the exceptional ability to form upon hydration and shear a dense viscoelastic matrix. This matrix is also called gluten. It confers to wheat the properties to be processed into an innite range of food products with widely contrasted textures (e.g. leaved bread, pasta, and pastries). 24,25 Two main biochemical groups are dened in those proteins: gliadins and glutenins. Gliadins are monomeric proteins with MW ranging from 25 to 75 kg mol 1 and pI ranging from 5 to 8. 26–28 They represent about 45% of wheat storage proteins. Gliadins consist of highly polymorphic polypeptides divided into four groups: a, b, g and u according to their decreasing mobility during frac- tionation by gel electrophoresis under acidic conditions and in order of increasing MW. 29 Glutenins are polymeric proteins whose MW can reach several thousands of kg mol 1 . 30,31 They are formed by a combination of several sub- units through intermolecular disulphide bonds and weak UMR IATE, UM2-CIRAD-INRA-SupAgro, 2 pl Pierre Viala, 34070 Montpellier, France. E-mail: [email protected]; Fax: +334 67 63 54 09; Tel: +334 99 61 30 18 Cite this: Soft Matter, 2013, 9, 11417 Received 28th May 2013 Accepted 11th October 2013 DOI: 10.1039/c3sm51489g www.rsc.org/softmatter This journal is ª The Royal Society of Chemistry 2013 Soft Matter , 2013, 9, 11417–11426 | 11417 Soft Matter PAPER
-
Upload
univ-montpellier -
Category
Documents
-
view
2 -
download
0
Transcript of Phase behaviour of a wheat protein isolate

Soft Matter
PAPER
UMR IATE, UM2-CIRAD-INRA-SupAgro, 2 pl
E-mail: [email protected]; Fax: +334
Cite this: Soft Matter, 2013, 9, 11417
Received 28th May 2013Accepted 11th October 2013
DOI: 10.1039/c3sm51489g
www.rsc.org/softmatter
This journal is ª The Royal Society of
Phase behaviour of a wheat protein isolate
Adeline Boire, Paul Menut,* Marie-Helene Morel and Christian Sanchez
We investigated the liquid–liquid phase separation of wheat storage proteins with molecular weight (MW)
ranging from 25 kg mol�1 to 300 kg mol�1. We characterized the onset of the phase separation upon a
temperature decrease by turbidity. The protein compositions at equilibrium after temperature quenches
were additionally determined by size-exclusion-high performance liquid chromatography. We found
that wheat proteins can be classified into two classes according to their phase behaviour. The partition
of the proteins between the two phases depends on their MW above a critical size of 45 kg mol�1. For
those high MW proteins, we observed that the behaviour is similar to the one of neutral, linear
polymers. Their partition and critical parameters are well described by Flory–Huggins theory. Proteins
below 45 kg mol�1, namely a-, b-and g-gliadins, have similar interaction potentials under the physico-
chemical conditions tested. Their phase diagrams, characterized by a low value of critical volume
fraction, are characteristic of long-range interactions. Wheat protein behaviour can resultantly be
rationalized in a much simpler way than expected from their complex composition.
I. Introduction
The phase behaviour of a protein is a key determinant of itsfunctions and dysfunctions. One of themost studied examples isthe liquid–liquid phase separation of lens proteins that inducesthe opacication of the ocular in certain forms of cataracts.1–3
The occurrence of liquid–liquid phase separation in proteinsolution has been attributed to short-range protein–proteinattractions. A change in the solvent variables (e.g. temperature,pH, pressure, ionic strength, and protein concentration) or achange in the protein properties, by mutation, for example, canchange the interaction equilibrium and induce a phase separa-tion of the system with a protein-rich and a protein-poor phases.A simple way to tune the interaction properties is obtainedthrough temperature changes. The resulting well-known T � F
phase diagram, where T is the temperature and F is the proteinvolume fraction, relates the state of the solution (e.g.liquid, solid, and two-phase coexistence) to the solvent quality.The shape and position of the phase diagram boundariesdepend on the protein interaction potential, whose depth andrange depend on the properties of the proteins and of thesolvent.4–7 Recently, there have been major advances in therealm of phase transition studies of proteins and colloids due toadvances in experimental and computational methods.4,5,7–15 Ithas provided new knowledge on the interaction properties ofanimal proteins, e.g. lysozyme,10,12,16 lens protein3,17,18 andmonoclonal antibody.19–21
Unfortunately, experimental studies on plant proteins havenot been renewed in a similar way, despite their special interest
Pierre Viala, 34070 Montpellier, France.
67 63 54 09; Tel: +334 99 61 30 18
Chemistry 2013
to food research and food industries for developing alternativesustainable sources of dietary protein. Determining the nature ofthe interactions that dictate their structure and functionalitywould enlarge their technological end-uses. Plant storage proteinsconstitute a large and heterogeneous mixture of proteins, even ina single variety of plant.22,23 This diversity arises from the evolutionof their genes through the ages in relation to their primary role ofnutrient storage. In contrast to animal proteins whose genesequence was highly conserved throughout the ages to allowproper biological function, several phenomena have occurred topromote polymorphism in plant storage proteins.22 In particular,successive additions in their genes contributed to increase thepolydispersity preventing their crystallization and favouring highpacking fractions within grains. Plant storage proteins are farfrom colloidal models like lysozyme or BSA.
Here, we study wheat storage proteins. They have theexceptional ability to form upon hydration and shear a denseviscoelastic matrix. This matrix is also called gluten. It confersto wheat the properties to be processed into an innite rangeof food products with widely contrasted textures (e.g. leavedbread, pasta, and pastries).24,25 Two main biochemical groupsare dened in those proteins: gliadins and glutenins. Gliadinsare monomeric proteins with MW ranging from 25 to 75 kgmol�1 and pI ranging from 5 to 8.26–28 They represent about45% of wheat storage proteins. Gliadins consist of highlypolymorphic polypeptides divided into four groups: a, b, gand u according to their decreasing mobility during frac-tionation by gel electrophoresis under acidic conditionsand in order of increasing MW.29 Glutenins are polymericproteins whose MW can reach several thousands of kgmol�1.30,31 They are formed by a combination of several sub-units through intermolecular disulphide bonds and weak
Soft Matter, 2013, 9, 11417–11426 | 11417
Soft Matter Paper
interactions. Wheat proteins constitute a multicomponentsystem, characterized by a large MW polydispersity. Bothgliadins and glutenins are sharing a similar amino acidcomposition with large repeated apolar sequences. It givesrise to their characteristic insolubility in water and solubilityin an ethanol–water mixture and to a continuum of MW andphysico-chemical properties (pI, charge density, and proteinsolubility), which render their isolation to be a difficult task.
So far, two attempts to study the effect of temperature onwheat protein phase separation have been reported in the liter-ature. In 1925, Dill and Alsberg studied the appearance ofturbidity as a function of temperature and ethanol–water ratio fora mix of wheat proteins up to F ¼ 0.0832. Plotting their cloudtemperatures as a function of the protein volume fraction gives aconcave relationship, which was shied to upper or lowertemperatures when the ethanol–water ratio changed. Forty yearslater, Meredith studied the effect of salt on the phase boundariesof wheat our acidic extract, assumed to include gliadins.33 Heobtained a phase diagram characterized by several maxima,which concluded to be associated with the presence of severalprotein species in the extract. Based onOsborne's classication ofwheat protein according to their differential solubility, it is likelythat their acidic extract included a mixture of gliadin and glu-tenin. To the best of our knowledge, these two pioneer studieshave not been renewed, besides current biochemical methodsnow allow a precise identication of their different classes. Weaim in this paper to investigate the phase behaviour of thoseproteins starting from gliadin/glutenin blends.
Knowing the phase behaviour of these proteins can provide aframework to probe the protein organization under physiolog-ical conditions during wheat seed development. It can also beused to better understand the parameters that drive theirsolubility and their assembly during technological processes.
In this article, we investigated the liquid–liquid phase separa-tion of a wheat protein isolate.We developed an original extractionprocedure to enrich the classical ethanol–water extract of wheatprotein in gliadins. The phase diagram of this system was estab-lished by two complementary methods. First, the binodal wasdetermined using turbidity assessment as done in the previousstudies.32,33 Then the protein compositions at equilibrium weredetermined aer temperature quenches in the two-phase region ofthe phase diagram. The protein MW and concentration of the twophases were determined. From these experimental data, we ana-lysed the partition of the proteins between the upper phase (Fupper)and the lower phase (Flower) as a function of their MWs. We evi-denced a critical MW separating two main classes of proteins withsignicantly different phase behaviour. For proteins below 45 kgmol�1, their partition is MW-independent. For proteins above45 kg mol�1, the partition depends greatly on the MW and is wellpredicted by the Flory–Huggins theory.
II. Materials and methodsA. Isolation of wheat storage proteins
We developed a reproducible extraction procedure to obtainlarge quantities of wheat protein isolate with MW below 300 kgmol�1 from a pure variety of wheat (cv. Haussman).
11418 | Soft Matter, 2013, 9, 11417–11426
Preparation of defatted wheat our. Wheat grains (cv.Haussman, 2010 harvest) were milled on a Buhler laboratorymill (MLU 202, Buhler, Switzerland) according to an approvedmethod of the American Association of Cereal Chemists (2000)method 26-31.01. The yield of our obtained from the grainwas 67%.
The protein content (N � 5.7) of the our, determined usingthe Kjeldahl method, was 9.8% dry basis (�0.2).34 The lipidcontent determined using an accelerated solvent-extraction(ASE) system was 1.00% dry basis (�0.01). A preliminarydefatting step was included to reduce lipid contamination:35–37
we used dimethyl chloride which does not affect proteinproperties.38–40
Flour was gently stirred using a magnetic stir bar withdimethyl chloride (500 g our in 1 L of solvent) for half an hourat room temperature. The slurry was then ltered through aBuchner funnel. The procedure was repeated three times andthen the remaining solvent was allowed to evaporate overnightunder a fume hood. The residual lipid content was less than0.03% dry basis (�0.01). This defatting step did not affect theour protein composition as determined by SE-HPLC andSDS-PAGE electrophoresis (data not shown).
Isolation of the low MW storage proteins. Flour (37.5 g in a250 mL centrifuge tube) was dispersed in 150 mL of 0.4 M saltsolution at room temperature using a rotary shaker (60 rpm,30 min). The dispersion was centrifuged 10 minutes at 6000 � gat 20 �C. The sediment was twice re-suspended manually in thesame solution, stirred and centrifuged as above. The procedureremoved 74% of the our metabolic proteins which arenot involved in the gluten structure. The pellet was thenre-suspended manually with 200 mL of an ethanol–water solu-tion to reach 55% ethanol–water ratio to solubilize wheatstorage proteins. The dispersion was stirred and centrifuged.
The 55% ethanol–water solution contains both gliadins andglutenins. As will be detailed later, we found that gliadins andglutenins can be further fractionated by phase separation at lowtemperature. A solution enriched in gliadin (up to 82%) wasobtained from the ethanol–water solution aer one nightresting at 4 �C and centrifugation at 2 �C for 10 minutes at20 000 � g. The sediment which mainly included gluteninaggregates was discarded. The enriched gliadin supernatantwas concentrated using a vacuum evaporator at 35 �C, dialyzedagainst distilled water and freeze-dried. Powders were ground(<250 mm), pooled and stored under vacuum in opaque bags at�28 �C. The protein composition of this extract is rich in glia-dins (82%), depleted in glutenins (8%) and in metabolicproteins (10%).
B. Biochemical characterization of wheat storage proteins
Size Exclusion (SE) HPLC. The composition of wheatproteins was assessed by Size-Exclusion-HPLC (SE-HPLC).41
The SE-HPLC apparatus (Waters model Alliance) wascontrolled by the Millenium soware (Waters) and equippedwith a TSK G4000-SWXL (TosoHaas) size exclusion analyticalcolumn (7.5 � 300 mm) and a TSK G3000-SW (TosoHaas) guardcolumn (7.5� 75mm). The columns were eluted at 20 �C (�2 �C)
This journal is ª The Royal Society of Chemistry 2013
Paper Soft Matter
with 0.1 M sodium phosphate buffer (pH 6.9) containing 0.1%SDS. The ow rate was 0.7 mL min�1. Protein absorbancewas recorded at 214 nm. Peak areas were corrected from theSDS-phosphate buffer contribution.
The elution time of every prole was converted into MWbased on the elution peaks of eight model proteins. This cali-bration showed a power law relationship between the elutiontime and the MW. The SE-HPLC prole of wheat proteins isusually divided into 5 fractions, corresponding to differentMWs as shown in Fig. 1 in continuous line for the ourHaussmann.41 Fractions F1 (excluded volume) and F2 corre-spond to glutenins, polymeric proteins with a MW respectivelyabove 1000 kg mol�1 and comprised between 70 kg mol�1 and1000 kg mol�1. Fractions F3 and F4 correspond to gliadins.Finally, fraction F5 corresponds to monomeric metabolicproteins: albumins and globulins, whose MWs are below 25 kgmol�1. The compositions of the ethanol–water extractbefore and aer cold precipitation are shown in large-dashedline and in dashed line respectively, the later being the nalisolate in Fig. 1.
MW characterization by deconvolution. We developed amethod for the deconvolution of the wheat protein SE-HPLCspectra, which provides quantication of protein present as afunction of their MW in the wheat protein isolate. We decon-voluted the spectrum in a sum of Gaussian peaks, whose width(or standard deviation) depends on their residence time.Commercial soware typically deconvolutes spectra in a sum ofGaussian with constant standard deviation. However, weobserved on model proteins of known MW that the standarddeviation follows a power law decrease with elution time.Therefore, using the solver function of Microso Excel, we usedthis model to deconvolute our SE-HPLC spectra.
The positions of nine peaks were determined directly fromeach spectrum by calculating the second derivative, in whichthey correspond to minima. The column aging induced a slightchange in peak positions and they were determined indepen-dently for each spectrum. The other peak positions were
Fig. 1 SE-HPLC profiles of SDS-soluble proteins of the cv. Haussman flour (fullline), the ethanol–water extract (large dashed line) and the gliadin isolateobtained after centrifugation at 2 �C (short dashed line). Spectra are plotted as afunction of MWof proteins eluted at 20 �C in 0.1 M sodium phosphate buffer (pH6.9) containing 0.1% SDS. The MW range effectively separated by the column iscomprised between 10 and 1000 kg mol�1.
This journal is ª The Royal Society of Chemistry 2013
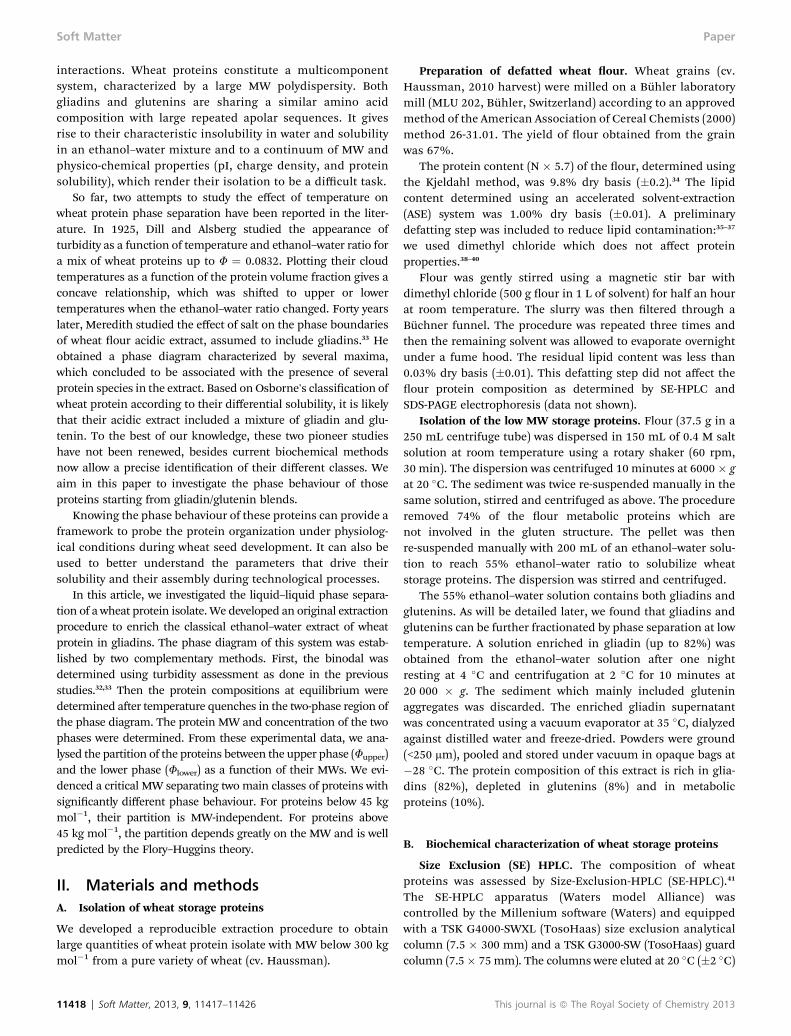
determined by the solver by best tting (in Microso Excel), themacro being guided by an initial value every 0.5 minute. Thecoefficients of determination characterizing the discrepancybetween the original spectrum and the one calculated as thesum of the Gaussian peaks were always higher than 0.996, thevery good consistency being illustrated in Fig. 2.
SE-HPLC spectra were deconvoluted in a set of 17 peaksrepresenting the different proteins of the mixture, based ontheir MW. The number of peaks is the smallest that enable agood tting of the spectra. For comparison, proteins from F3 toF5 peaks can be separated by sodium dodecyl sulfate poly-acrylamide gel electrophoresis (SDS-PAGE) into 18 bands.
We dened 5 groups associating different peaks to simplifythe rst step of the analysis of the results:
- group 1, glutenins with MWs > 70 kg mol�1
- group 2, u-gliadins with 55 < MWs < 70 kg mol�1
- group 3, u-gliadins with 45 < MWs < 55 kg mol�1
- group 4, a-, b- & g-gliadins with 35 < MWs < 45 kg mol�1
- group 5, a-, b- & g-gliadins with 25 < MWs < 35 kg mol�1.These groups were dened to create MW groups whilst
taking into account their biochemical classication. Thecorrespondence to the biochemical classication is shown inFig. 2. Proteins with MWs lower than 25 kg mol�1 were notincluded as they are metabolic proteins not involved in thegluten structure.
C. Phase diagram of wheat protein isolates
Two complementary methods were used to determine the phasediagram of the gliadin isolate. First, we determined the binodalby detecting the temperature of phase separation as revealed bya change in dispersion turbidity. Then, we determined theequilibrium protein composition on the phase diagram toassess the specic behaviour of each type of proteins for thesolvent.
Protein dispersions. Protein powder was dissolved intoethanol–water solution 55% v/v, maximum solubility conditionof these proteins, using magnetic stirrer to reach 10 g L�1.Residual undissolved solids were removed by centrifugation. The
Fig. 2 Deconvolution of the SE-HPLC profile of the gliadin isolate, in a sum ofGaussian (dotted curves). The sum of those Gaussians (red dashed lines) super-imposed well the original spectrum (R2 > 0.996). Classical biochemical classifica-tion and MW groups 1 to 5 used in this article are indicated.
Soft Matter, 2013, 9, 11417–11426 | 11419
Fig. 3 Temperature dependence of the relative transmitted light at 600 nm ofprotein dispersions at several protein volume fractions: A: below 0.04 and B:above 0.04. The dashed line represents the cloud point determination.
Soft Matter Paper
dispersions were then ltered on a 0.22 mm Nylon lter(Magna), before concentration by dialysis against a 10%(w/v) polyethylene glycol 20 000 (Sigma Aldrich) dissolvedinto 55% v/v ethanol–water solution, NaCl 0.5 mM. Dialysiswas conducted in tubes with a cut-off of 12 kDa (Spec-trapore), in opaque containers at 20 �C until the proteinconcentration reaches 250 g L�1.
Protein concentrations were determined by UV absorp-tion spectroscopy. We determined a specic absorbancecoefficient (A280 nm, 1 cm) of 0.570 L g�1 cm�1. As ourproteins have very similar amino-acid composition, weassumed that they have a similar specic absorbance.Further dilutions were made using 55% v/v ethanol–watersolution, 0.5 mM NaCl.
The concentration c (in g L�1) was converted into volumefraction F using partial specic volume v. It usually varies in anarrow range from 0.7 to 0.75 mL mg�1 as determined for 13proteins.42 We used 0.76 mL mg�1 as determined on crudegliadins in 70% v/v ethanol–water solution.43
Binodal determination by turbidity measurement.Turbidity measurements were performed on a PharmaciaBiotech Ultrospec 2000 spectrophotometer (Biochrom Ltd.Cambridge, England) at a wavelength of 600 nm into 1 mLcuvette (path length of 1 cm) with temperature controlled by acryostat. The temperature was decreased from 20.0 �C(�0.1 �C) by steps of 0.3 �C. Transmitted light was recordedaer temperature stabilization once it decreased by less than0.1 units per minute. Cloud points were dened as thetemperature corresponding to a 50% reduction in the originaltransmittance of the solution.
Determination of the protein composition in biphasicsystems at equilibrium.We determined the equilibrium proteincompositions aer phase separation by quenching the disper-sion to a temperature below the cloud point by cooled centri-fugation. The phase separation was studied for Fs of 0.004,0.02, 0.025, 0.05, 0.08 and 0.16 at the following temperatures12 �C, 9 �C, 7 �C, 5 �C, 3 �C, 0 �C and �3 �C.
The experiments were done as follows:1. 50 mL of protein dispersion at the given F were placed in a
200 mL conical bottom-sealed pipette tip.2. The bottom-sealed pipette tip was inserted into 2 mL
Eppendorf centrifuge tubes. Eppendorf tubes were lled with55% v/v ethanol–water solution to improve the temperaturetransfer within the tips.
3. The system tip/Eppendorf tube was centrifuged at onetemperature for 10 min at 10 000g in a pre-cooled centrifugemachine.
4. Bottom-sealed pipette tips were taken in picture. Thevolumes of the protein-poor and the protein-rich phases werethen determined according to a calibration curve establishedwith known volumes of water.
5. Protein composition and concentration of the protein-poor phase were determined aer the phase separation bySE-HPLC analysis as described previously.
6. F of the protein-rich phase was calculated using thevolume of both phases and the total content of protein in theinitial dispersion.
11420 | Soft Matter, 2013, 9, 11417–11426
Every experimental data have been repeated two or threetimes.
III. ResultsA. Cloud point curves of wheat proteins
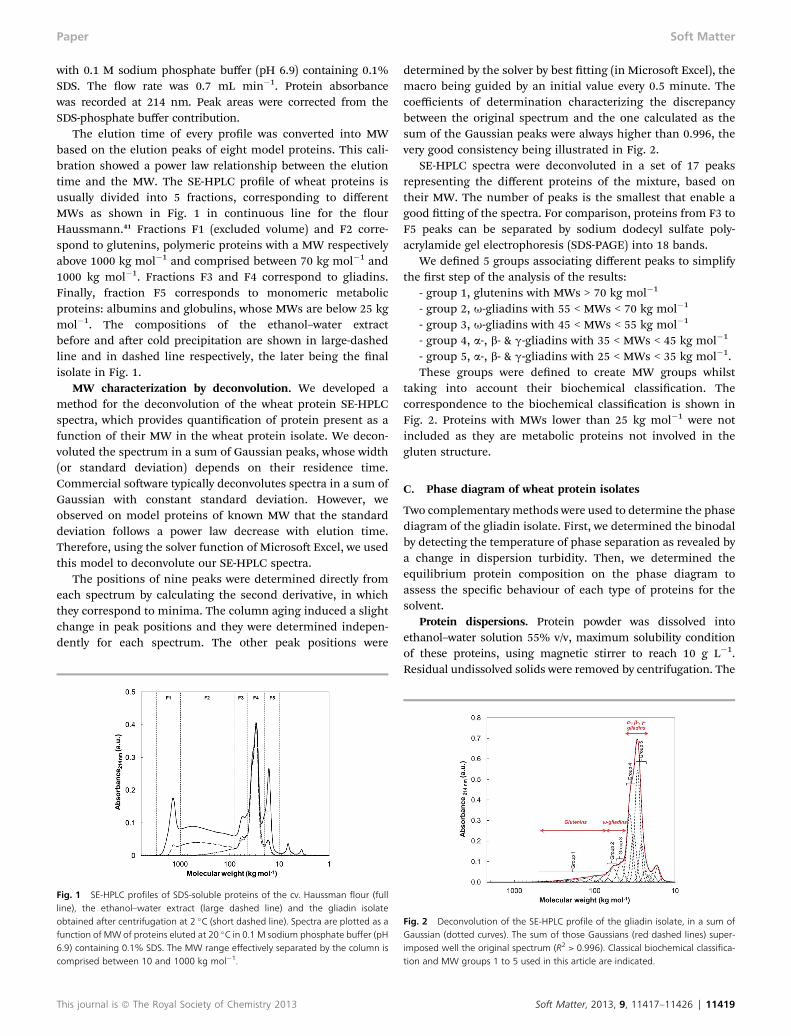
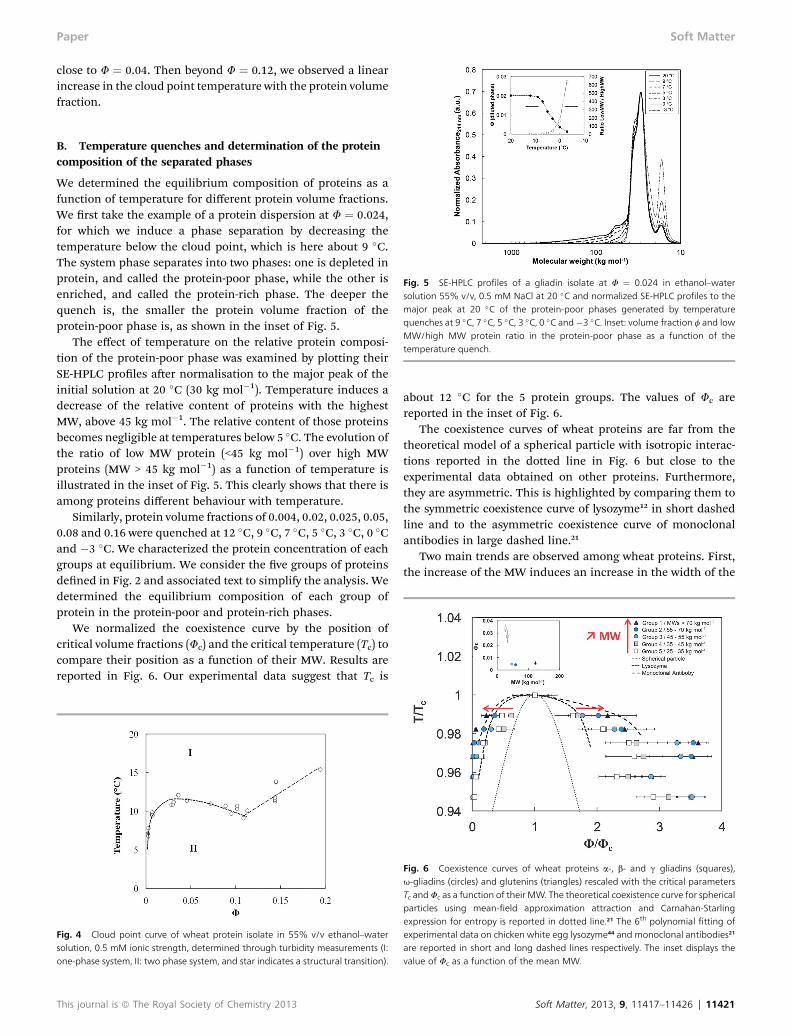
The onset of phase separation into two phases was marked bythe decrease of the transmitted intensity due to light scattering.All samples show a decrease in transmission while decreasingthe temperature. The shape and the steepness of this decreasedepend on F.
While the steepness was very sharp at low protein volumefraction (F ¼ 0.002), it became broader when F increases up to0.04. Then, the steepness increases again above F ¼ 0.04 toreach the sharpest drop above 0.12, as shown in Fig. 3.
The cloud points were determined from these turbiditycurves, considering a 50% decrease in light transmission(dashed line in Fig. 3). Below 0.04, the cloud point increasedwith volume fraction, while between 0.04 and 0.12, it decreasedwith volume fraction. Finally, above 0.12, the cloud pointtemperature increased again with protein volume fraction. Weplotted the cloud point temperatures as a function ofF in Fig. 4.This curve delimits two regions: a one-phase region (I) and atwo-phase region (II). For volume fractions below 0.12, aconcave relationship was observed, with a critical volume frac-tion, upper point of the cloud point curve, at a volume fraction
This journal is ª The Royal Society of Chemistry 2013
Paper Soft Matter
close to F ¼ 0.04. Then beyond F ¼ 0.12, we observed a linearincrease in the cloud point temperature with the protein volumefraction.
Fig. 5 SE-HPLC profiles of a gliadin isolate at F ¼ 0.024 in ethanol–watersolution 55% v/v, 0.5 mM NaCl at 20 �C and normalized SE-HPLC profiles to themajor peak at 20 �C of the protein-poor phases generated by temperaturequenches at 9 �C, 7 �C, 5 �C, 3 �C, 0 �C and�3 �C. Inset: volume fraction f and lowMW/high MW protein ratio in the protein-poor phase as a function of thetemperature quench.
B. Temperature quenches and determination of the proteincomposition of the separated phases
We determined the equilibrium composition of proteins as afunction of temperature for different protein volume fractions.We rst take the example of a protein dispersion at F ¼ 0.024,for which we induce a phase separation by decreasing thetemperature below the cloud point, which is here about 9 �C.The system phase separates into two phases: one is depleted inprotein, and called the protein-poor phase, while the other isenriched, and called the protein-rich phase. The deeper thequench is, the smaller the protein volume fraction of theprotein-poor phase is, as shown in the inset of Fig. 5.
The effect of temperature on the relative protein composi-tion of the protein-poor phase was examined by plotting theirSE-HPLC proles aer normalisation to the major peak of theinitial solution at 20 �C (30 kg mol�1). Temperature induces adecrease of the relative content of proteins with the highestMW, above 45 kg mol�1. The relative content of those proteinsbecomes negligible at temperatures below 5 �C. The evolution ofthe ratio of low MW protein (<45 kg mol�1) over high MWproteins (MW > 45 kg mol�1) as a function of temperature isillustrated in the inset of Fig. 5. This clearly shows that there isamong proteins different behaviour with temperature.
Similarly, protein volume fractions of 0.004, 0.02, 0.025, 0.05,0.08 and 0.16 were quenched at 12 �C, 9 �C, 7 �C, 5 �C, 3 �C, 0 �Cand �3 �C. We characterized the protein concentration of eachgroups at equilibrium. We consider the ve groups of proteinsdened in Fig. 2 and associated text to simplify the analysis. Wedetermined the equilibrium composition of each group ofprotein in the protein-poor and protein-rich phases.
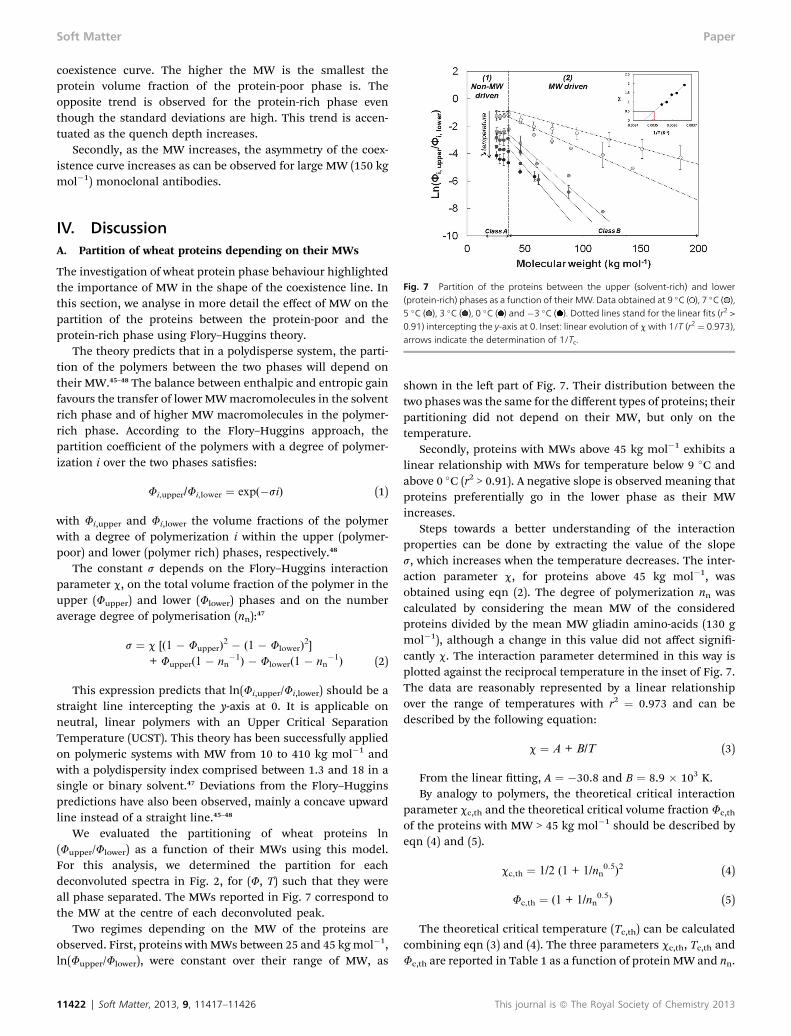
We normalized the coexistence curve by the position ofcritical volume fractions (Fc) and the critical temperature (Tc) tocompare their position as a function of their MW. Results arereported in Fig. 6. Our experimental data suggest that Tc is
Fig. 4 Cloud point curve of wheat protein isolate in 55% v/v ethanol–watersolution, 0.5 mM ionic strength, determined through turbidity measurements (I:one-phase system, II: two phase system, and star indicates a structural transition).
This journal is ª The Royal Society of Chemistry 2013
about 12 �C for the 5 protein groups. The values of Fc arereported in the inset of Fig. 6.
The coexistence curves of wheat proteins are far from thetheoretical model of a spherical particle with isotropic interac-tions reported in the dotted line in Fig. 6 but close to theexperimental data obtained on other proteins. Furthermore,they are asymmetric. This is highlighted by comparing them tothe symmetric coexistence curve of lysozyme12 in short dashedline and to the asymmetric coexistence curve of monoclonalantibodies in large dashed line.21
Two main trends are observed among wheat proteins. First,the increase of the MW induces an increase in the width of the
Fig. 6 Coexistence curves of wheat proteins a-, b- and g gliadins (squares),u-gliadins (circles) and glutenins (triangles) rescaled with the critical parametersTc andFc as a function of their MW. The theoretical coexistence curve for sphericalparticles using mean-field approximation attraction and Carnahan-Starlingexpression for entropy is reported in dotted line.21 The 6th polynomial fitting ofexperimental data on chicken white egg lysozyme44 and monoclonal antibodies21
are reported in short and long dashed lines respectively. The inset displays thevalue of Fc as a function of the mean MW.
Soft Matter, 2013, 9, 11417–11426 | 11421
Soft Matter Paper
coexistence curve. The higher the MW is the smallest theprotein volume fraction of the protein-poor phase is. Theopposite trend is observed for the protein-rich phase eventhough the standard deviations are high. This trend is accen-tuated as the quench depth increases.
Secondly, as the MW increases, the asymmetry of the coex-istence curve increases as can be observed for large MW (150 kgmol�1) monoclonal antibodies.
Fig. 7 Partition of the proteins between the upper (solvent-rich) and lower(protein-rich) phases as a function of their MW. Data obtained at 9 �C ( ), 7 �C ( ),5 �C ( ), 3 �C ( ), 0 �C ( ) and �3 �C ( ). Dotted lines stand for the linear fits (r2 >0.91) intercepting the y-axis at 0. Inset: linear evolution of cwith 1/T (r2 ¼ 0.973),arrows indicate the determination of 1/Tc.
IV. DiscussionA. Partition of wheat proteins depending on their MWs
The investigation of wheat protein phase behaviour highlightedthe importance of MW in the shape of the coexistence line. Inthis section, we analyse in more detail the effect of MW on thepartition of the proteins between the protein-poor and theprotein-rich phase using Flory–Huggins theory.
The theory predicts that in a polydisperse system, the parti-tion of the polymers between the two phases will depend ontheir MW.45–48 The balance between enthalpic and entropic gainfavours the transfer of lower MWmacromolecules in the solventrich phase and of higher MW macromolecules in the polymer-rich phase. According to the Flory–Huggins approach, thepartition coefficient of the polymers with a degree of polymer-ization i over the two phases satises:
Fi,upper/Fi,lower ¼ exp(�si) (1)
with Fi,upper and Fi,lower the volume fractions of the polymerwith a degree of polymerization i within the upper (polymer-poor) and lower (polymer rich) phases, respectively.48
The constant s depends on the Flory–Huggins interactionparameter c, on the total volume fraction of the polymer in theupper (Fupper) and lower (Flower) phases and on the numberaverage degree of polymerisation (nn):47
s ¼ c [(1 � Fupper)2 � (1 � Flower)
2]
+ Fupper(1 � nn�1) � Flower(1 � nn
�1) (2)
This expression predicts that ln(Fi,upper/Fi,lower) should be astraight line intercepting the y-axis at 0. It is applicable onneutral, linear polymers with an Upper Critical SeparationTemperature (UCST). This theory has been successfully appliedon polymeric systems with MW from 10 to 410 kg mol�1 andwith a polydispersity index comprised between 1.3 and 18 in asingle or binary solvent.47 Deviations from the Flory–Hugginspredictions have also been observed, mainly a concave upwardline instead of a straight line.45–48
We evaluated the partitioning of wheat proteins ln(Fupper/Flower) as a function of their MWs using this model.For this analysis, we determined the partition for eachdeconvoluted spectra in Fig. 2, for (F, T) such that they wereall phase separated. The MWs reported in Fig. 7 correspond tothe MW at the centre of each deconvoluted peak.
Two regimes depending on the MW of the proteins areobserved. First, proteins withMWs between 25 and 45 kgmol�1,ln(Fupper/Flower), were constant over their range of MW, as
11422 | Soft Matter, 2013, 9, 11417–11426
shown in the le part of Fig. 7. Their distribution between thetwo phases was the same for the different types of proteins; theirpartitioning did not depend on their MW, but only on thetemperature.
Secondly, proteins with MWs above 45 kg mol�1 exhibits alinear relationship with MWs for temperature below 9 �C andabove 0 �C (r2 > 0.91). A negative slope is observed meaning thatproteins preferentially go in the lower phase as their MWincreases.
Steps towards a better understanding of the interactionproperties can be done by extracting the value of the slopes, which increases when the temperature decreases. The inter-action parameter c, for proteins above 45 kg mol�1, wasobtained using eqn (2). The degree of polymerization nn wascalculated by considering the mean MW of the consideredproteins divided by the mean MW gliadin amino-acids (130 gmol�1), although a change in this value did not affect signi-cantly c. The interaction parameter determined in this way isplotted against the reciprocal temperature in the inset of Fig. 7.The data are reasonably represented by a linear relationshipover the range of temperatures with r2 ¼ 0.973 and can bedescribed by the following equation:
c ¼ A + B/T (3)
From the linear tting, A ¼ �30.8 and B ¼ 8.9 � 103 K.By analogy to polymers, the theoretical critical interaction
parameter cc,th and the theoretical critical volume fraction Fc,th
of the proteins with MW > 45 kg mol�1 should be described byeqn (4) and (5).
cc,th ¼ 1/2 (1 + 1/nn0.5)2 (4)
Fc,th ¼ (1 + 1/nn0.5) (5)
The theoretical critical temperature (Tc,th) can be calculatedcombining eqn (3) and (4). The three parameters cc,th, Tc,th andFc,th are reported in Table 1 as a function of protein MW and nn.
This journal is ª The Royal Society of Chemistry 2013

Table 1 Calculation of the theoretical critical point for wheat proteins with 45 <MW < 200 kg mol�1
Proteingroups
Mean MW(kg mol�1) Mean nn cc,th Tc,th (�C) Fc,th
Group 1 184 1417 0.527 11.83 0.001151 1163 0.530 11.81 0.002123 943 0.533 11.78 0.00295 729 0.538 11.73 0.003
Group 2 57 442 0.549 11.63 0.005Group 3 46 355 0.554 11.58 0.006
Fig. 8 Phase boundaries of LMW-gliadins (squares) compared to the liquid–liquid (circles) and liquid–solid (triangles) coexistence curves of lysozyme in 20mM HEPES buffer at pH ¼ 7.8, 200 mM NaCl. The dashed line is the phenome-nological asymptotic expression given by eqn (6) that fits our experimental dataof the protein-poor phase. Dotted curves are guide to the eye.
Paper Soft Matter
The calculated cc,th decreases with MW and are comprisedbetween 0.527 and 0.554, giving rise to a very small range ofTcrit,th between 11.6 and 11.8 �C. These theoretical values are ingood agreement with our experimental data.
The calculated Fc,th also decreases with MW and arecomprised between 0.006 and 0.001. The experimental Fc areequal to 0.001, 0.005 and 0.006 for groups 1, 2 and 3 respectivelywhich is the order of magnitude of the prediction. We estimatedFc for group 1 by dividing its experimental Fc (see the inset ofFig. 6) by four making the assumption that it is the sum of thefour MW contributions.
The good agreement of our results with eqn (1) and with theprediction of the critical parameters by Flory–Huggins theorysuggests that the behaviour of these proteins is similar to thatof neutral linear polymers. This is consistent with the lowionized amino acid content of wheat proteins, about 10%,implying a low charge density over the entire pH.49 For glu-tenins, built by the assembly of several subunits, the sug-gested linearity is not obvious because different structuralmodels, linear or branched, have been proposed.50,51 Gluteninsubunits divide into two categories: low MW between (30 to70 kg mol�1) and high MW (from 100 to 160 kg mol�1).50,51
They form polymers, whose size range from the dimeric topolymeric forms with MWs reaching thousands of kgmol�1.30,31 Glutenins studied here are below 200 kg mol�1 andare certainly dimers or trimers of LMW subunits that shouldbe linear according to our results.
Extending the MW range of this study could help to char-acterize higher MW glutenins and to understand the polymer-ization mechanisms that lead to the polymeric fraction of wheatproteins. From our data, the q-temperature, for which c ¼ 0.5and Fc,th ¼ 0, is about 12.1 �C. This is very close to the experi-mental Tc of the other groups of proteins. If the prediction isstill valid for higher MW, increasing the MW range of the studyshould have only a slight effect on Tc of the new coexistencecurves. Fc will tend towards smaller value whereas it is alreadylow in the range of MW investigated. The sensibility of theconcentration determination and the temperature quenchesshould be adjusted in a narrow range to perform theseexperiments.
Using eqn (4) and (5), it is possible to determine the MWlimit above which the proteins are insoluble under any (T, F)conditions. It is the MW or the nn for which cc,th equals to 0.5and Fc,th ¼ 0. In our system, the nn is equal to 50 000, itcorresponds to a MW of about 6500 kg mol�1. Above this MW,
This journal is ª The Royal Society of Chemistry 2013
wheat proteins will not be soluble in 55% v/v ethanol–watersolution, NaCl 0.5 mM. This explains why part of wheat glu-tenins remains insoluble aer solubilisation in ethanol–watersolution, 36% during our extraction process. This insolubility isone of the major problems for studying wheat protein.25
B. Phase behaviour of proteins below the critical MW
The partition of wheat proteins below 45 kg mol�1, corre-sponding to a-, b- and g-gliadins, is not dependent on the MW.Their coexistence curves in Fig. 6 are very similar. This suggeststhat they display a similar phase behaviour under the condi-tions tested. We treat them as one single class of proteins andplot their phase diagram in Fig. 8 and call them lowMW-gliadin(LMW-gliadins) in the following text.
The shape and position of the phase boundary are indicativeof their interaction properties. Critical parameters Fc and Tcdepend on the range and depth of interaction, respectively.Because a-, b- and g-gliadins have a similar phase diagram, wecan hypothesize that they have a very similar range and depth ofinteractions under the solvent conditions tested.
For comparison, we plot the experimental points of lysozymein Fig. 8, under physical chemical conditions such that thecritical temperature is similar to the one of LMW-gliadins.Under these conditions, the glass transition of lysozymere-enter into the liquid–liquid phase coexistence at high F,triangles in Fig. 8. Both the width and Fc of the liquid–liquidcoexistence curve of LMW-gliadins are smaller than the ones oflysozyme. A comparison with results obtained with Monte-Carlosimulation5 suggests that the range of interactions ofLMW-gliadin is higher than the one of lysozyme under theseconditions.
The Fc of LMW-gliadins (z0.06) is also lower than thoseobtained for lysozyme under other conditions (for 20 < Ionic
Soft Matter, 2013, 9, 11417–11426 | 11423
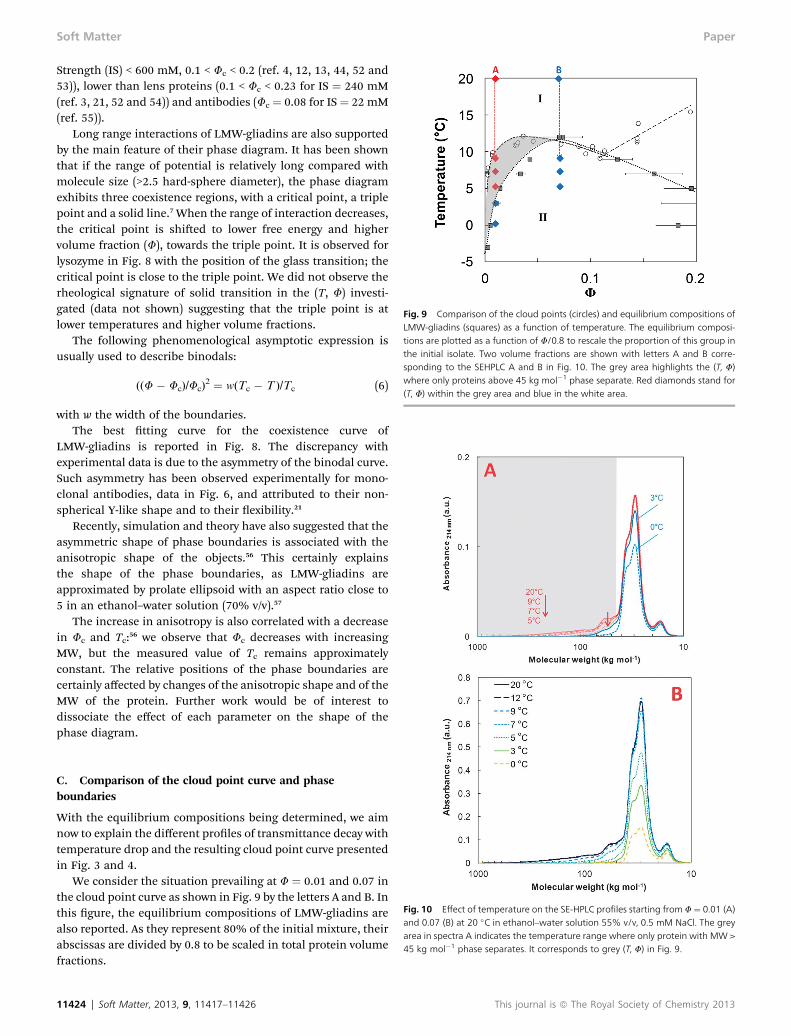
Fig. 9 Comparison of the cloud points (circles) and equilibrium compositions ofLMW-gliadins (squares) as a function of temperature. The equilibrium composi-tions are plotted as a function of F/0.8 to rescale the proportion of this group inthe initial isolate. Two volume fractions are shown with letters A and B corre-sponding to the SEHPLC A and B in Fig. 10. The grey area highlights the (T, F)where only proteins above 45 kg mol�1 phase separate. Red diamonds stand for(T, F) within the grey area and blue in the white area.
Soft Matter Paper
Strength (IS) < 600 mM, 0.1 < Fc < 0.2 (ref. 4, 12, 13, 44, 52 and53)), lower than lens proteins (0.1 < Fc < 0.23 for IS ¼ 240 mM(ref. 3, 21, 52 and 54)) and antibodies (Fc ¼ 0.08 for IS ¼ 22 mM(ref. 55)).
Long range interactions of LMW-gliadins are also supportedby the main feature of their phase diagram. It has been shownthat if the range of potential is relatively long compared withmolecule size (>2.5 hard-sphere diameter), the phase diagramexhibits three coexistence regions, with a critical point, a triplepoint and a solid line.7 When the range of interaction decreases,the critical point is shied to lower free energy and highervolume fraction (F), towards the triple point. It is observed forlysozyme in Fig. 8 with the position of the glass transition; thecritical point is close to the triple point. We did not observe therheological signature of solid transition in the (T, F) investi-gated (data not shown) suggesting that the triple point is atlower temperatures and higher volume fractions.
The following phenomenological asymptotic expression isusually used to describe binodals:
((F � Fc)/Fc)2 ¼ w(Tc � T )/Tc (6)
with w the width of the boundaries.The best tting curve for the coexistence curve of
LMW-gliadins is reported in Fig. 8. The discrepancy withexperimental data is due to the asymmetry of the binodal curve.Such asymmetry has been observed experimentally for mono-clonal antibodies, data in Fig. 6, and attributed to their non-spherical Y-like shape and to their exibility.21
Recently, simulation and theory have also suggested that theasymmetric shape of phase boundaries is associated with theanisotropic shape of the objects.56 This certainly explainsthe shape of the phase boundaries, as LMW-gliadins areapproximated by prolate ellipsoid with an aspect ratio close to5 in an ethanol–water solution (70% v/v).57
The increase in anisotropy is also correlated with a decreasein Fc and Tc:56 we observe that Fc decreases with increasingMW, but the measured value of Tc remains approximatelyconstant. The relative positions of the phase boundaries arecertainly affected by changes of the anisotropic shape and of theMW of the protein. Further work would be of interest todissociate the effect of each parameter on the shape of thephase diagram.
Fig. 10 Effect of temperature on the SE-HPLC profiles starting from F ¼ 0.01 (A)and 0.07 (B) at 20 �C in ethanol–water solution 55% v/v, 0.5 mM NaCl. The greyarea in spectra A indicates the temperature range where only protein with MW >45 kg mol�1 phase separates. It corresponds to grey (T, F) in Fig. 9.
C. Comparison of the cloud point curve and phaseboundaries
With the equilibrium compositions being determined, we aimnow to explain the different proles of transmittance decay withtemperature drop and the resulting cloud point curve presentedin Fig. 3 and 4.
We consider the situation prevailing at F ¼ 0.01 and 0.07 inthe cloud point curve as shown in Fig. 9 by the letters A and B. Inthis gure, the equilibrium compositions of LMW-gliadins arealso reported. As they represent 80% of the initial mixture, theirabscissas are divided by 0.8 to be scaled in total protein volumefractions.
11424 | Soft Matter, 2013, 9, 11417–11426 This journal is ª The Royal Society of Chemistry 2013

Paper Soft Matter
At 20 �C, all proteins are soluble for A and B. If dispersionA is quenched at 9 �C, there is a phase separation as predictedby the cloud point curve. The composition of the supernatantis shown in SE-HPLC spectra of Fig. 10. Only proteins of MWhigher than 45 kg mol�1 undergo a phase separation;proteins with MW lower than 45 kg mol�1 are not affectedby the phase separation. Quenches at 7 and 5 �C lead to thesame results: LMW-gliadins are still in a single-phase. Incontrast, when temperature is decreased down to 3 �C, theystart to phase separate as shown by the decrease of the mainpeak. At 0 �C, their concentration is further decreased in thesupernatant.
The effect of temperature is different for F ¼ 0.07. A quenchin this (T, F) area induces the phase separation of all groups ofthe proteins at any quench depth. It is illustrated in Fig. 10B.
Therefore, depending on the (T, F) investigated, differentprotein groups are susceptible to phase separate. In particular,in the grey area of Fig. 9 only proteins with MW higher than45 kg mol�1 phase separate.
The measured turbidity is therefore generated by differentphase separation events that have their own (T, F) specicities.As the total F is increased, the number of protein speciesprompted to undergo a phase separation increases. Thiscorresponds to an increase of the broadness of the trans-mittance decays in Fig. 3. This is consistent with observationsmade on polymeric systems where the broadness of theturbidity curve is related to polydispersity. A sharp drop of thetransmitted light is observed for a monomeric system whereas abroader turbidity curve is observed for polydisperse or multi-modal polymer systems.58,59
For F > 0.12, the cloud point temperature increases againwith increasing F as observed by Dill and Alsberg in 1925. Thisincrease of the cloud point for high F is associated with astructural transition that might be either an equilibriumphenomenon such as a liquid–solid transition or a non-equi-librium phenomenon such as gelation or aggregation. We didnot investigate this area in this article.
V. Conclusion
In the present work, we established the phase diagram of anisolate of wheat storage proteins to investigate their interac-tion properties. First, the cloud point temperatures weredetermined. Secondly, the compositions at equilibrium werecharacterized in each phase, aer phase separation. Weshowed that the partition of wheat proteins was highlydependent on their MW. In particular, we identied a criticalsize at 45 kg mol�1, above which the MW has a predominanteffect. For those high MW proteins, we found good agreementof the experimental data with the prediction of the proteinpartition and of the critical parameters by Flory–Hugginstheory. This suggests that the behaviour of these proteins issimilar to that of neutral linear polymers. For protein with lowMW, below 45 kg mol�1, we observed that a-, b- and g-gliadinshave similar interaction potentials under the physico-chem-ical conditions tested. Their low value of Fc suggests long-range interactions.
This journal is ª The Royal Society of Chemistry 2013
This offers a new perspective to look at those proteins,beyond the biochemical classication which does not properlydifferentiate their phase behaviour under the conditions tested.
Despite the complexity of wheat proteins, this approachgreatly simplies the system. It shows that depending on theMW, the driving forces for the phase behaviour of the proteinsare different.
Acknowledgements
We would like to thank the reviewers for the relevance of theircomments that helped us to improve the content of our paperand Emanuela Zaccarelli for helpful discussion.
Notes and references
1 T. Tanaka, C. Ishimoto and L. T. Chylack, Science, 1977, 197,1010–1012.
2 C. Ishimoto, P. W. Goalwin, S. T. Sun, I. Nishio andT. Tanaka, Proc. Natl. Acad. Sci. U. S. A., 1979, 76, 4414–4416.
3 J. A. Thomson, P. Schurtenberger, G. M. Thurston andG. B. Benedek, Proc. Natl. Acad. Sci. U. S. A., 1987, 84,7079–7083.
4 M. L. Broide, T. M. Tominc and M. D. Saxowsky, Phys. Rev. E:Stat. Phys., Plasmas, Fluids, Relat. Interdiscip. Top., 1996, 53,6325–6335.
5 A. Lomakin, N. Asherie and G. B. Benedek, J. Chem. Phys.,1996, 104, 1646–1656.
6 R. Piazza, Curr. Opin. Colloid Interface Sci., 2000, 5, 38–43.7 J. F. Lutsko and G. Nicolis, J. Chem. Phys., 2005, 122, 244907.8 M. G. Noro and D. Frenkel, J. Chem. Phys., 2000, 113, 2941–2944.
9 E. Bianchi, J. Largo, P. Tartaglia, E. Zaccarelli andF. Sciortino, Phys. Rev. Lett., 2006, 97, 168301.
10 F. Cardinaux, T. Gibaud, A. Stradner and P. Schurtenberger,Phys. Rev. Lett., 2007, 99, 118301.
11 N. Dorsaz, G. M. Thurston, A. Stradner, P. Schurtenbergerand G. Foffi, So Matter, 2011, 7, 1763–1776.
12 T. Gibaud, F. Cardinaux, J. Bergenholtz, A. Stradner andP. Schurtenberger, So Matter, 2011, 7, 857–860.
13 C. Goegelein, G. Naegele, R. Tuinier, T. Gibaud, A. Stradnerand P. Schurtenberger, J. Chem. Phys., 2008, 129, 85102.
14 N. Kern and D. Frenkel, J. Chem. Phys., 2003, 118, 9882–9889.15 N. E. Valadez-Perez, A. L. Benavides, E. Schoell-Paschinger
and R. Castaneda-Priego, J. Chem. Phys., 2012, 137, 84905.16 C. Ishimoto and T. Tanaka, Phys. Rev. Lett., 1977, 39, 474.17 G. M. Thurston, J. Chem. Phys., 2006, 124, 134909–134910.18 B. M. Fine, J. Pande, A. Lomakin, O. O. Ogun and
G. B. Benedek, Phys. Rev. Lett., 1995, 74, 198–201.19 T. Ahamed, B. N. A. Esteban, M. Ottens, G. W. K. van Dedem,
L. A. M. van der Wielen, M. A. T. Bisschops, A. Lee, C. Phamand J. Thommes, Biophys. J., 2007, 93, 610–619.
20 H. Nishi, M. Miyajima, H. Nakagami, M. Noda, S. Uchiyamaand K. Fukui, Pharm. Res., 2010, 27, 1348–1360.
21 Y. Wang, A. Lomakin, R. F. Latypov and G. B. Benedek, Proc.Natl. Acad. Sci. U. S. A., 2011, 108, 16606–16611.
Soft Matter, 2013, 9, 11417–11426 | 11425
Soft Matter Paper
22 P. R. Shewry, Biol. Rev. Cambridge Philos. Soc., 1995, 70, 375–426.
23 P. R. Shewry, J. A. Napier and A. S. Tatham, Plant Cell, 1995,7, 945–956.
24 P. R. Shewry, N. G. Halford, P. S. Belton and A. S. Tatham,Philos. Trans. R. Soc., B, 2002, 357, 133–142.
25 C. W. Wrigley, Nature, 1996, 381, 738–739.26 P. Feillet, Le grain de ble, composition et utilisation, Editions
Quae, 2000, pp. 57–68.27 P. R. Shewry, J. M. Field, A. J. Faulks, S. Parmar, B. J. Miin,
M. D. Dietler, E. J. L. Lew and D. D. Kasarda, Biochim.Biophys. Acta, 1984, 788, 23–34.
28 P. R. Shewry and N. G. Halford, J. Exp. Bot., 2002, 53, 947–958.
29 J. H. Woychik, J. A. Boundy and R. J. Dimler, Arch. Biochem.Biophys., 1961, 94, 477–482.
30 F. R. Huebner and J. S. Wall, Cereal Chem., 1976, 53, 258–269.31 W. S. Veraverbeke and J. A. Delcour, Crit. Rev. Food Sci. Nutr.,
2002, 42, 179–208.32 D. B. Dill and C. L. Alsberg, J. Biol. Chem., 1925, 65, 279–304.33 P. Meredith, Cereal Chem., 1965, 42, 64–71.34 R. Tkachuk, Cereal Chem., 1966, 43, 223–225.35 J. A. Bietz and J. S. Wall, Cereal Chem., 1972, 49, 416–430.36 M. R. Booth and J. A. Ewart, Biochim. Biophys. Acta, 1969, 181,
226–233.37 H. Wieser, W. Seilmeier and H. D. Belitz, J. Cereal Sci., 1994,
19, 149–155.38 A. Grassberger, P. Schieberle and P. Koehler, Eur. Food Res.
Technol., 2003, 216, 204–211.39 F. MacRitchie and P. W. Gras, Cereal Chem., 1973, 50(3), 292–
302.40 J. Rouille, J. M. Bonny, G. Della Valle, A. F. Devaux and
J. P. Renou, J. Agric. Food Chem., 2005, 53, 3986–3994.41 M. H. Morel, P. Dehlon, J. C. Autran, J. P. Leygue and
C. Bar-L'Helgouac'h, Cereal Chem., 2000, 77, 685–691.42 Y. Harpaz, M. Gerstein and C. Chothia, Structure, 1994, 2,
641–649.
11426 | Soft Matter, 2013, 9, 11417–11426
43 Z. Zhang and M. G. Scanlon, J. Cereal Sci., 2011, 54, 181–186.44 V. G. Taratuta, A. Holschbach, G. M. Thurston,
D. Blankschtein and G. B. Benedek, J. Phys. Chem., 1990,94, 2140–2144.
45 V. J. W. Breitenbach and B. A. Wolf, Die MakromolekulareChemie, 1967, 108, 263–280.
46 A. I. Norman, B. A. Manvilla, E. L. Frank, J. N. Niamke,G. D. Smith and S. C. Greer, Macromolecules, 2008, 41,997–1008.
47 R. S. Shresth, R. C. McDonald and S. C. Greer, J. Chem. Phys.,2002, 117, 9037–9049.
48 G. ten Brinke and I. Szleifer,Macromolecules, 1995, 28, 5434–5439.
49 J. A. D. Ewart, J. Sci. Food Agric., 1967, 18, 111–116.50 A. Graveland, P. Bosveld, W. J. Lichtendonk, J. P. Marseille,
J. H. E. Moonen and A. Scheepstra, J. Cereal Sci., 1985, 3,1–16.
51 M. P. Lindsay and J. H. Skerritt, Trends Food Sci. Technol.,1999, 10, 247–253.
52 C. R. Berland, G. M. Thurston, M. Kondo, M. L. Broide,J. Pande, O. Ogun and G. B. Benedek, Proc. Natl. Acad. Sci.U. S. A., 1992, 89, 1214–1218.
53 D. N. Petsev, X. X. Wu, O. Galkin and P. G. Vekilov, J. Phys.Chem. B, 2003, 107, 3921–3926.
54 C. W. Liu, A. Lomakin, G. M. Thurston, D. Hayden, A. Pande,J. Pande, O. Ogun, N. Asherie and G. B. Benedek, J. Phys.Chem., 1995, 99, 454–461.
55 B. D. Mason, J. Zhang-van Enk, L. Zhang, R. L. Remmele Jrand J. Zhang, Biophys. J., 2010, 99, 3792–3800.
56 E. Meneses-Juarez, S. Varga, P. Orea and G. Odriozola, SoMatter, 2013, 9, 5277–5284.
57 N. H. Thomson, M. J. Miles, Y. Popineau, J. Harries,P. Shewry and A. S. Tatham, Biochim. Biophys. Acta, ProteinStruct. Mol. Enzymol., 1999, 1430, 359–366.
58 A. R. Imre, T. Kraska and L. V. Yelash, Phys. Chem. Chem.Phys., 2002, 4, 992–1001.
59 A. Stammer and B. A. Wolf, Polymer, 1998, 39, 2065–2067.
This journal is ª The Royal Society of Chemistry 2013