Genetic Diversity Analysis of Domesticated Wheat (Triticum aestivum L.) and Wild Wheat (Aegilops...
14
Genetic Diversity Analysis of Domesticated Wheat (Triticum aestivum L.) and Wild Wheat (Aegilops species) Nader R. Abdelsalam 1 and Reham M. Abd El-Azeem 2 Agricultural Botany Department, Faculty of Agriculture, Saba Basha, Alexandria University, Egypt, 2 Department of Environmental Biotechnology, Institute of Genetic Engineering and Biotechnology, University of Minufiya Genetic diversity is one of the key factors for improvement many crop plants including wheat. Plant breeders rely on the availability of genetic diversity during selection in cultivar development. The efficiency of genetic gain by selection can be improved if the patterns of genetic diversity within a population of breeding lines are known. Genetic similarity and or distance estimates among genotypes are helpful in the selection of parents to be used in a breeding program (Van Becelaere et al. 2005). Varieties developed with wider genetic base may be helpful in enhancing the yield under various agro-climatic conditions (Asif et al., 2005). Wild relatives of common wheat, in which the genus Aegilops is one of them, have become an important genetic resource of both resistance to various diseases and tolerance against abiotic factors (Nelson et al. 1995). Genus Aegilops L. (Poaceae) is one of the wheat relatives that is capable of making different complexes with each other and with Triticum L. (Bor 1970). The wild species of Triticeae family, especially the genus Aegilops L. are valuable sources of genetic variation for wheat improvement since they possess the genetic background of all the cultivated wheat having still unidentified important characters such as resistance to different biotic and abiotic stresses (Zaharieva et al., 2004). Aegilops is the source of several disease resistance genes that are of agronomic importance and have been successfully introgressed into wheat (Bariana and McIntosh, 1993). Genus Aegilops L. has been the most intensively studied group of grasses, especially since it is closely related to the cultivated wheat. The genus Aegilops contains 22 species comprising both diploids and polyploids that originated from center of origin (Van Slageren, 1994). The wild relatives of bread wheat, T. aestivum L., is a hexaploid (2n 5 6x 5 42; genome) that are considered as potential sources of useful alleles for bread wheat improvement. Common bread wheat (Triticum aestivum) is a case of a major crop that was most probably formed by hybridization in farmers’ fields. Consequently, studying the genetic diversity of the genetic resources from such species may provide significant information regarding their potential for breeding purposes. Genetic diversity can be assessed from pedigree analysis, morphological traits or using molecular markers (Pejic et al. 1998). However, diversity estimates based on pedigree analysis have generally been found inflated and unrealistic (Fufa et al. 2005). Genetic diversity estimates based on morphological traits, on the other hand, suffer from the drawback that such traits are limited in number and are influenced by the environment (Maric et al. 2004).
Transcript of Genetic Diversity Analysis of Domesticated Wheat (Triticum aestivum L.) and Wild Wheat (Aegilops...

Genetic Diversity Analysis of Domesticated Wheat (Triticum aestivum L.) and
Wild Wheat (Aegilops species)
Nader R. Abdelsalam1 and Reham M. Abd El-Azeem
2
Agricultural Botany Department, Faculty of Agriculture, Saba Basha, Alexandria University,
Egypt, 2Department of Environmental Biotechnology, Institute of Genetic Engineering and
Biotechnology, University of Minufiya
Genetic diversity is one of the key factors for improvement many crop plants
including wheat. Plant breeders rely on the availability of genetic diversity during
selection in cultivar development. The efficiency of genetic gain by selection can be
improved if the patterns of genetic diversity within a population of breeding lines are
known. Genetic similarity and or distance estimates among genotypes are helpful in the
selection of parents to be used in a breeding program (Van Becelaere et al. 2005).
Varieties developed with wider genetic base may be helpful in enhancing the yield under
various agro-climatic conditions (Asif et al., 2005).
Wild relatives of common wheat, in which the genus Aegilops is one of them, have
become an important genetic resource of both resistance to various diseases and tolerance
against abiotic factors (Nelson et al. 1995). Genus Aegilops L. (Poaceae) is one of the
wheat relatives that is capable of making different complexes with each other and with
Triticum L. (Bor 1970). The wild species of Triticeae family, especially the genus
Aegilops L. are valuable sources of genetic variation for wheat improvement since they
possess the genetic background of all the cultivated wheat having still unidentified
important characters such as resistance to different biotic and abiotic stresses (Zaharieva
et al., 2004).
Aegilops is the source of several disease resistance genes that are of agronomic
importance and have been successfully introgressed into wheat (Bariana and McIntosh,
1993). Genus Aegilops L. has been the most intensively studied group of grasses,
especially since it is closely related to the cultivated wheat. The genus Aegilops contains
22 species comprising both diploids and polyploids that originated from center of origin
(Van Slageren, 1994). The wild relatives of bread wheat, T. aestivum L., is a hexaploid
(2n 5 6x 5 42; genome) that are considered as potential sources of useful alleles for bread
wheat improvement. Common bread wheat (Triticum aestivum) is a case of a major crop
that was most probably formed by hybridization in farmers’ fields. Consequently,
studying the genetic diversity of the genetic resources from such species may provide
significant information regarding their potential for breeding purposes.
Genetic diversity can be assessed from pedigree analysis, morphological traits or
using molecular markers (Pejic et al. 1998). However, diversity estimates based on
pedigree analysis have generally been found inflated and unrealistic (Fufa et al. 2005).
Genetic diversity estimates based on morphological traits, on the other hand, suffer from
the drawback that such traits are limited in number and are influenced by the environment
(Maric et al. 2004).
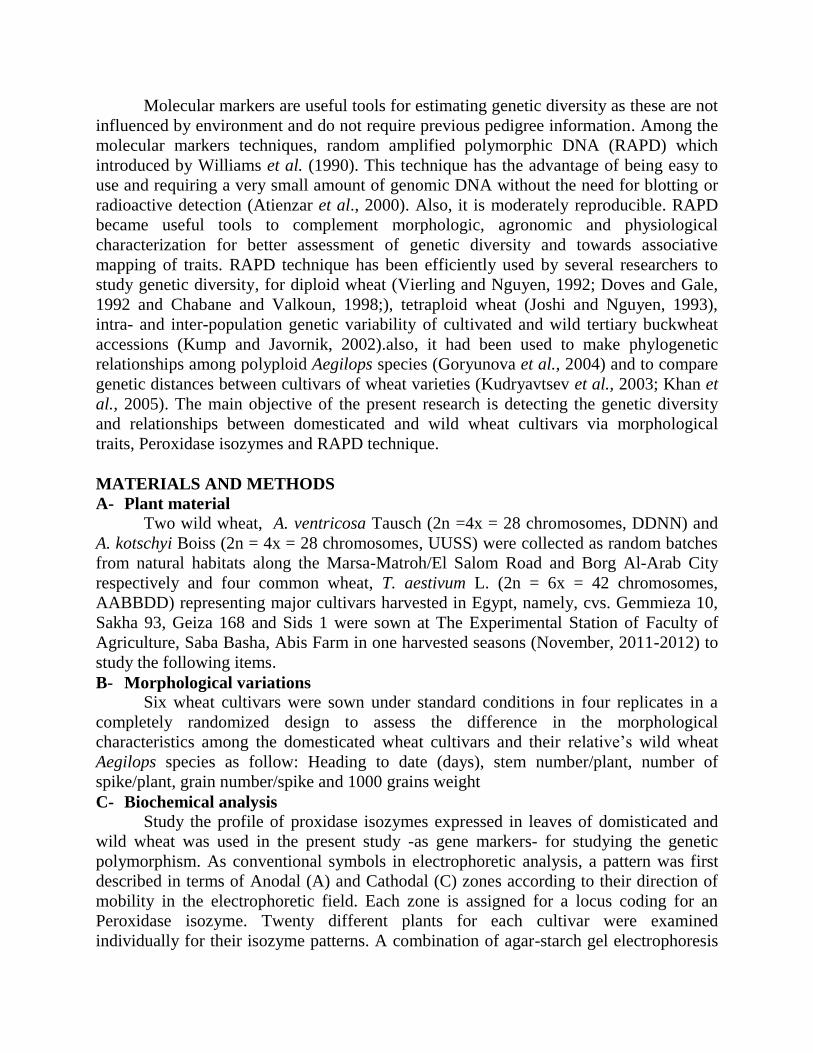
Molecular markers are useful tools for estimating genetic diversity as these are not
influenced by environment and do not require previous pedigree information. Among the
molecular markers techniques, random amplified polymorphic DNA (RAPD) which
introduced by Williams et al. (1990). This technique has the advantage of being easy to
use and requiring a very small amount of genomic DNA without the need for blotting or
radioactive detection (Atienzar et al., 2000). Also, it is moderately reproducible. RAPD
became useful tools to complement morphologic, agronomic and physiological
characterization for better assessment of genetic diversity and towards associative
mapping of traits. RAPD technique has been efficiently used by several researchers to
study genetic diversity, for diploid wheat (Vierling and Nguyen, 1992; Doves and Gale,
1992 and Chabane and Valkoun, 1998;), tetraploid wheat (Joshi and Nguyen, 1993),
intra- and inter-population genetic variability of cultivated and wild tertiary buckwheat
accessions (Kump and Javornik, 2002).also, it had been used to make phylogenetic
relationships among polyploid Aegilops species (Goryunova et al., 2004) and to compare
genetic distances between cultivars of wheat varieties (Kudryavtsev et al., 2003; Khan et
al., 2005). The main objective of the present research is detecting the genetic diversity
and relationships between domesticated and wild wheat cultivars via morphological
traits, Peroxidase isozymes and RAPD technique.
MATERIALS AND METHODS
A- Plant material
Two wild wheat, A. ventricosa Tausch (2n =4x = 28 chromosomes, DDNN) and
A. kotschyi Boiss (2n = 4x = 28 chromosomes, UUSS) were collected as random batches
from natural habitats along the Marsa-Matroh/El Salom Road and Borg Al-Arab City
respectively and four common wheat, T. aestivum L. (2n = 6x = 42 chromosomes,
AABBDD) representing major cultivars harvested in Egypt, namely, cvs. Gemmieza 10,
Sakha 93, Geiza 168 and Sids 1 were sown at The Experimental Station of Faculty of
Agriculture, Saba Basha, Abis Farm in one harvested seasons (November, 2011-2012) to
study the following items.
B- Morphological variations
Six wheat cultivars were sown under standard conditions in four replicates in a
completely randomized design to assess the difference in the morphological
characteristics among the domesticated wheat cultivars and their relative’s wild wheat
Aegilops species as follow: Heading to date (days), stem number/plant, number of
spike/plant, grain number/spike and 1000 grains weight
C- Biochemical analysis Study the profile of proxidase isozymes expressed in leaves of domisticated and
wild wheat was used in the present study -as gene markers- for studying the genetic
polymorphism. As conventional symbols in electrophoretic analysis, a pattern was first
described in terms of Anodal (A) and Cathodal (C) zones according to their direction of
mobility in the electrophoretic field. Each zone is assigned for a locus coding for an
Peroxidase isozyme. Twenty different plants for each cultivar were examined
individually for their isozyme patterns. A combination of agar-starch gel electrophoresis

and enzyme activity attaining was used to screen for polymorphisms of peroxidase. The
laboratory methods were performing according to Jonathan and Norman (1989).
D- DNA extraction
Genomic DNA was isolated through DNA isolation kit (Gene JETTM
, plant
genomic DNA purification mini kit. Fermentas) and DNA was quantified by Gene
quant at absorbance of 260/280nm. The quality was further checked on 0.1% agarose
gel.
E- RAPD analysis
Random amplified polymorphic DNA (RAPD), has been developed, in which
DNA is amplified using fourteen (10 mer) RAPD primers (Williams et al. 1990). The
PCR operon primers used for RAPDs are listed in Table (1). These primers were selected
from the Operon kits (Operon Technologies Inc., Alabameda CA). RAPD-PCR analysis
was performed according to the method of Williames et al. (1990). The polymerase chain
reaction mixture (25 µl) consisted of 0.8 U of Taq DNA polymerase; 25 pmol dNTPs; 25
pmol of primer and 50 ng of genomic DNA. PCR amplification was performed in a
Biometra T1 gradient thermalcycler for 40 cycles after initial denaturation for 3 min at
94°C. Each cycle consisted of denaturation at 94°C for 1 min; annealing at 36°C for 1
min; extension at 72°C for 2 min and final extension at 72°C for 10 min (Soliman et al.,
2003). Amplification products were separated on 1.5% agarose gels at 100 volts for 1.30
hrs with 1 x TBE buffer. To detect ethidium bromide/DNA complex, agarose gels were
examined on ultraviolet transilluminator (302 nm wavelength) and photographed. Using
100 pb DNA ladder (V-gene Biotechnology Limited, shiqao, P. R. China), the lengths of
the different DNA fragments were determined. The reproducible DNA fragments from
two runs were scored for their presence (1) or absence (0) for each genome.
F- Data analysis Data matrices were entered into the NTSYS program (Numerical Taxonomic and
Multivariate Analysis System) software package, version 2.1, Applied Biostatistics Inc.
(Rohlf 2000). Similarity coefficients were used to construct dendrograms using the
UPGMA (unweighted pair group method with arithmetic average) and the SAHN
(Sequential Agglomerative Hierarchical Nested clustering) routine in the NTSYS.
RESULT AND DISCUSSION
A- Morphological variations
Results in Table 2 indicated high significant variations among the wild and
domesticated wheat cultivars in the morphological characteristics. The four domesticated
wheat cultivars was faster in heading to date compared with the wild species with range
20 to 31 days in average. Sakha 93 was as the earliest one of heading date in average
50.32 days, followed by Gemmieza 10, Geiza 163 and Sids 1 in average 55.05, 58.29 and
61.30 (days), while wild wheat species were the lasted in average 72.00 and 81.16 (days),
for Aegilops kotschyi and Aegilops ventricosa respectively.
Concerning the stem number/plant, the wild wheat species showed high values in
compare with the other four domesticated cultivars in mean value reached to 12.00 stem
in average, on the contrary, it was 3.00 for the domesticated wheat

Logically, the number of spike per plant is related to stem number per plant. The
wild wheat showed high number of spike per plant (8 in average) compare with the wheat
(2.5 in averages) On the other hand, the domesticated wheat cultivars significantly
exceeded the two wild species in the grain number/spike, and 1000 grain weight
characteristics as shown in Table 2.
A number of researchers implied sets of morphological characters to establish
genetic relationships between wild wheat tribes and cropping wheat cultivars such as
Abdelsalam, (2010) who pointed to significant genetic distance between domesticated
wheat cultivars and the two different wild species (A. ventricosa and A. kotschyi)
especially in 50% time to heading. The author calculated the similarities among the
wild/domesticated wheat cultivars based on their agro-morphological traits. Branlared et
al. (1984) addressed 78 different varieties of bread wheat attempting to classify by three
major criteria which involved pedigree, 26 agronomic and morphological characters and
characterization of grain gliadine. Our data are consonant to the results of Hamada (1996)
which assessed 13 Aegilops and 3 wild Triticum originally Turkish species by using
morphological, pathological, qualitative and agricultural traits. As it was determined by
the author, plant height might vary from 16.6 (Aegilops juvenalis) to 112.0 cm (Aegilops
mutica), while spike length - from 2.4 (Aegilops ovata) to 23.3 cm (Aegilops mutica).
Our result is agreed with Karagoz. et al. (2006) studied agro-morphological traits
of certain wild Aegilops and Triticum species. In this study 112 populations of wild wheat
and 12 populations of cultivated wheat were compared to demonstrate evident agro-
morphological variations across the populations examined. Singh (1994) used 12 yield
parameters and 5 morphological traits of spring wheat to evaluate genetic divergence
among 19 durum wheat genotypes. These genotypes were subsequently classified into 7
separate clusters revealing high level of genetic divergence independent of original
harvesting place.
B- Biochemical genetic analysis
The zymogram and photograph showing mobility pattern of peroxidase isozymes
are illustrated in Figure (1). From this data it can be conducted that the peroxidase
patterns in the two wild and the four domesticated wheat plants leaves showed two kinds
of banding profiles. First, it was evident that all plants expressed the Px.A2, Px.C2, and
Px.C4, and the four domesticated plants exhibited the same banding profile containing
these three loci. Indicated that, these three common loci were consistently monomorphic
expressed.
Second, the two wild types Ae. ventricosa and Ae. kotschyi displayed extra three
common loci (Px.A1, Px.C1, and Px.C3). The banding pattern activity of Ae. Ventricosa
displayed a unique marker band at Px.C5 locus indicating that (Px.A1, Px.C1, Px.C3 and
Px.C5) loci are polymorphic specifically to the wild wheat.
The confirmation of obtaining limited number of polymorphic isozyme marker in
wheat had been shown by Hart et al. (1983) who indicated that, within Triceae several
amphiploids, and especially the hexaploid wheats, often produce complex electrophoretic
patterns that are complex electrophoertic patterns that are difficult to interpret because of
the presence of multi locus isozymes.
Peroxidase iso-enzyme assay was implied as most appropriate technique for the
evaluation of Aegilops ventricosa Tausch. Assessed and classified peroxidase patterns
were ascribed to different phenotypes under control of four genetic loci Tanksley et al.
(1983). Two out of detected iso-enzyme bands shifted, as a rule, to the cathode, while the
resting bands migrated in anodic direction. Zhang et al. (1993) surveyed isozymes in two
hundred and sixty eight accessions of wild barley from diverse eco-geographical zones of
Israel and Iran. This study revealed highly polymorphic iso-enzymes as within each
population and across wild barley populations.
C- Molecular studies
Fourteen, RAPD-PCR primers were used in screening the diversity between different
genomic-DNA of wild and domesticated wheat. For each primer-DNA combination, the
amplification was repeated at least twice. As shown in Table 4 & 5 and Figure 3, the
number of reproducible bands/primer varied between 18 for primer OPC-12 and 56 for
primer OPH-11 with a total of 550 bands.
The results in Table (5) clearly indicated that in all studied wheats, 397(72%) of
the 550 fragments were polymorphic and 153(28%) were monomorphic. In the
meantime, all used primers generated 51 specific markers (Table 4 and 5).
The largest number of these markers was specific for wild wheat, Ae. ventricoas
and Ae. Kotchyi (20 and 12 markers, in respect). Furthermore, two specific large markers
(1801 and 2332pb) were observed in the two wild types. Also, two specific markers (280
& 987 pb) were reported for domesticated wheat Sakha 93. While, Geiza 168 showed 5
specific marker (209, 311, 578, 873 & 2510 pb) and finally Sids 1 and Gemmeiza 10
exhibited 6 specific marker ranged from (400 to 1108 pb).
Manifesto et al. (2001) found some specific RAPD marker while examining
genetic diversity in spring wheat cultivars grown in the Yaqui Valley of Mexico and the
Punjab of Pakistan. Also, Sajida Bibi et al. (2009) indicated many specific RAPD
markers among commercially grown lines of wheat in Pakistan. Due to different obtained
data from the studied cultivars using RAPD marker further studies will be necessary to
identify the genetic constitutions of specific markers.
Molecular markers provide a good estimate of genetic diversity since they are
independent of confounding effects by environmental factors (Powell et al. 1996). This
will led to identify their interrelation especially with the biotic and abiotic stress in order
to enhance the domistecated wheat strcuture. Hoping to use them as gene constructs for
improving these cultivars using their relateives of wild wheat.
D- Genetic similarity and Dendogram Genetic similarity values generated from RAPD marker varied between 0.31 and
0. 89 with an average of 0.6. Dendrogram based on similarity values (Table 6) from
RAPD was constructed to reveal similarities between the six different wild and
domesticated wheat. The dendrogram (Figure 2) demonstrated that the six wheat cultivars
fall into two main groups. The first one was divided into two clusters containing Ae.
ventricoas and Ae. Kotchyi wild types with genetic similarity of (57%). The second one
divided into two subclusterss. According to similarity, the first one contained Gemmeiza
10 and the second continue Geiza 168, Sakha 93 and Sids 1 in similarity from 79 to 89%.

These results are in agrement with results obtained by Guadagnuolo et al. (2001-
A) who indicated that similarity matrices clearly sepearated wild species of wheats
obtained from Switzerland, Austeria and England from cultivated ones. In the maintime,
Naghavi et al. (2009) reported a genetic similarity value of 0.67 in wheat based on RAPD
markers. While, Basel (2012) obtained (GS) values from RAPD marker in Syrian wheat
varied between 0.769 and 0.989 with an average of 0.888.
For the molecular markers employed in the present study, the fourteen different
RAPD primers had generated a high level of polymorphism and consequently large
number of genomic-specific markers than that of isozymes assay. The results of
Guadagnuolo et al. (2001-A) confirmed that only two among 22 enzyme systems tested
provided marker useful for differentiating closely related and essential autogamous
species of wheat.
The random nature of the random amplified polymorphic DNAs (RAPDs) analysis
complements isozyme variation. Where, it only reflects differences in protein-coding
genes, which are probably eliminated during the introgression process if they do not
confer adaptative advantages (Guadagnuolo et al. 2001-B).
The dendrogram generated by isozymes only are poor in its discrimination of
population's similarity than RAPD. These differences might be based on the kind of
information provided by each type of markers. RAPD can detect diversity in both coding
and non-coding regions of the genome. Where, small repeated random sequence
mutations may be accumulated in non-coding sequences and then diversity can be beter
revealed by RAPD than isozymes (Heun et al.(1994); Lanner-Herrera et al. (1996);
Nybom and Bartish (2000) and Hemeida and Hassan (2001).
Furthermore, an additional factor affecting genetic diversity assayed by different
marker techniques is the number of markers used in the analysis (Smith et al.1992).
Demeke, et al. (1996) indicated that RAPD marker analysis provides virtually unlimited
number of markers to compare individual genotypes. Generally, most
variability/taxonomic affinity studies in wheat focused mainly on morphology and
nuclear DNA diversity (Basel, 2012). In most cases, parental selection for developing a
wheat pure line or a hybrid is carried out according to performance of the parents and
complementation for important agronomic traits. Yet, genetic diversity among parents is
critical derive transgressive segregant from a cross (Rharrabti et al. 2001).
Finally, the high resolution, polymorphism and reproducibility of RAPD-PCR
assays shown in this study, could provides a simple, rapid and cost-effective system to
the researchers to assess the genetic diversity and its utilization in breeding programs.
RAPD markers based fingerprinting could be used to characterize large number of wild
wheat and cultivars. Research can be pursued to look for marker association with
important traits/genes/QTLs in wheat. This technology could also be used for testing the
purity of genetic stocks.

SUMMARY Diversity of four domesticated wheat cultivars (Sids 1, Sakha 93, Giza 168 and
Gemmeiza 10 and two wild wheat (Aegilops ventricosa and Aegilops Kotchyi) were
analyzed by morphological, biochemical and molecular analysis. Five morphological
characteristics i.e. Heading to date (days), stem number/plant, number of spike/plant,
grain number/spike and 1000 grains weight (g) were calculated to show the difference
among wheat cultivars and their relatives Aegilops species. High significant variations
among the wild and domesticated wheat cultivars in were observed. The four
domesticated wheat cultivars was faster in heading to date compared with the wild
species with range 20 to 31 days in average. Biochemical analysis for peroxidase
isozymes profile exhibited three marker bands (PxA1, PxC1 and PxC3) for the wild type
cultivars, also Ae. ventricosa expressed unique marker band at Px5c locus. Fourteen (10
mer) RAPD-PCR were used to detect the genetic diversity. In Total of 550 amplified
fragments, 51 DNA specific markers were detected. The number of reproducible
bands/primer varied between 18 for primer OPC-12 and 56 for primer OPH-11 with a
total of 550 bands. The largest number of these markers was specific for wild wheat, Ae.
ventricoas and Ae. Kotchyi (20 and 12 markers, in respect). Furthermore, two specific
large markers (1801 and 2332pb) were observed in the two wild types. Also, two specific
markers (280 & 987 pb) were reported for domesticated wheat Sakha 93. While, Geiza
168 showed 5 specific marker (209, 311, 578, 873 & 2510 pb) and finally Sids 1 and
Gemmeiza 10 exhibited 6 specific marker ranged from (400 to 1108 pb).High similarity
between the two wild wheat types was recorded. The four domesticated wheat cultivars
were clustered in one group.
REFERENCE
Abdelsalam, N. R. (2010). Specific properties of hybridisation among common wheat
(Triticum aestivum L.) and wild wheat species Aegilops under experimental field
conditions, J. App. Sci. Res., 6(12): 2068-2073.
Asif, M., M. Rahman and Y. Zafar (2005). DNA fingerprinting studies of some wheat
(Triticum aestivum L.) genotypes using random amplified polymorphic DNA
(RAPD) analysis. Pakistan J.Bot., 37(2): 271-277.
Atienzar, F., A. Evenden, A. Jha, D. Savva and M. Depledge (2000). Optimized RAPD
analysis generates high-quality genomic DNA profiles at high annealing
temperatures. Biotechniques, 28: 52–5
Bariana, H.S. and R.A. Mcintosh (1993). Cytogenetic studies in wheat XIV. Location of
rust resistance genes in VPM1 and their genetic linkage with other disease
resistance genes in chromosome 2A. Genome, 36 (3): 476-482.
Basel, S. (2012). Biochemical and genetic variation of some Syrian wheat varieties using
NIR, RAPD and AFLPs techniques. J.Plant Biol. Res., 1(1): 1-11
Bor, N. L. (1970). Gramineae. In: Rechinger, K. H. (ed.) Flora Iranica: Vol. 70. Graz,
Austria: Akademische Druk-Und Verlagsanstalt. Wien.
Branlared G. and A. Chevalet (1984). Diversity of bread wheats cultivated in France.
Agronomie 4:933-938.
Chabane, K. and J. Valkoun. (1998). Standardization of RAPD marker techniques to
determine the diversity of diploid wheat: Triticum urartu. Pp. 155-158, in A. A.
Jaradat (Ed.) Triticeae III. Science Publishers, Inc., Enfield, NH, USA. Pp 478.
Demeke, T.A. Laroche and D.A. Gaudet. (1996). ADNA marker for the Bt-10 common
bunt resistance gene in wheat. Genome, 39: 51-55.
Devos, K. M. and M. D. Gale. (1992). The use of random amplified polymorphic DNA
markers in wheat. Theor. Appl. Genet. 84: 567- 572.
Fufa, H., P.S. Baenziger, B.S. Beecher, I. Dweikat, R.A. Graybosch and K. M. Eskridge
(2005). Comparison of phenotypic and molecular markerbased classifications of
hard red winter wheat cultivars. Euphytica,.145(1-2): 133-146
Goryunova, S.V., E.Z. Kochieva , N.N. Chikida and V.A. Pukhalskyi. (2004).
Phylogenetic relationships and intraspecific variation of D-genome Aegilops L. as
revealed by RAPD analysis. Russian Journal of Genetics. 40 (50): 515–523.
Guadagnuolo R., D. Savova-Bianchi and F. Felber (2001). Specific genetic markers for
wheat, spelt, and four wild relatives: comparison of isozymes, RAPDs, and wheat
microsatellites. Genome, 44(4): 610-621.
Guadagnuolo R., D. Savova-Bianchi, J. Keller-Senften·and F.Felber (2001). Search for
evidence of introgression of wheat (Triticum aestivum L.) traits into sea barley
(Hordeum marinum s.str.Huds.) and bearded wheatgrass (Elymus caninus L.) in
central and northern Europe, using isozymes, RAPD and microsatellite markers.
TAG, 2-3, 191-196.
Hamada A.A. (1996). Genetical analyses of diallel cross in bread wheat under different
environmental conditions in Egypt. Ind. J. genet. Plant Breed, 56:34-48.
Hart, G.E. (1983). Genetic and evoluotion of multilocus isozymes in hexaploid wheat.
Curr. Top. Boil. Med. Res. 10: 365-380
Hemeida, A. Alaa and Hassan Th. Mohamed (2001). Genetic diversity in five Acacia
species as revealed by isozyme and RAPD markers. J. Adv. Agric. Res. 6: 777-
796.
Heun, M., and B. Friebe. (1990). Introgression of powdery mildew resistance from rye
into wheat. Phytopathology 80:242–245.
Jonathan, F.W. and F.W. Norman (1989). Isozymes in plant biology: Visualization and
interpretation of plant isozymes. Chapter 1: 5-45.
Joshi, C.P. and H.T. Nguyen (1993). Application of the random amplified polymorphic
DNA technique for the detection of polymorphism among wild and cultivated
tetraploid wheats. Genome. 36: 602-609.
Karagoz. A., Planali. N. and T. Polat (2006). Agro-Morphological Characterization of
Some Wild Wheat Aegilops L. and Triticum L. Species Turk J Agric For. 30: 387-
398
Khan, I.A, F.S. Awan, A. Ahmad, Y. Fu and A. Iqbal (2005). Genetic diversity of
Pakistan wheat germplasm as revealed by RAPD markers. Genetic Resources and
Crop Evolution. 52: 239–244.
Kudryavtsev, A.M, S.P. Martynov, M. Broggio and V.A. Pukhalskiy (2003). Relevance
of RAPD analysis for revealing phylogenetic relationships between cultivars of

durum wheat Triticum durum Desf. Russian Journal of Genetics. 39 (9): 1043–
1051.
Kump, B. and B. Javornik (2002). Genetic diversity and relationships among cultivated
and wild accessions of tartary buckwheat (Fagopyrum tataricum Gaertn.) as
revealed by RAPD markers. Genetic Resources and Crop Evolution. 49: 565–572.
Lanner-Herrera, C., M. Gustafeson, A.S. Filt, T. Bryngelsson (1996) Diversity in natural
populations of wild Brassica oleracea as estimated by isozyme and RAPD
analysis. Genetic Resources and Crop Evolution (43): 1 , 13-23,
Manifesto, M.M., A.R. Schlatter, H.E. Hopp, E.Y. Suárez and J. Dubcovsky (2001).
Quantitative evaluation of genetic diversity in wheatgermplasm using molecular
markers. Crop Sci., 41: 682-690.
Maric, S., S. Bolaric, J. Marcic, I. Pejic and V. Kozumplink (2004). Genetic diversity of
hexaploid wheat cultivars estimated by RAPD markers, morphological traits and
coefficients of parentage. Plant Breeding. 123(4): 366-369.
Naghavi. M.R, M. Malaki, H. Alizadeh, M. Pirseiedi and M. Mardi (2009). An
assessment of genetic diversity in wild diploid wheat Triticum boeoticum from
West of Iran using RAPD, AFLP and SSR markers. J. Agric. Sci. Techno. 11(14):
585-598.
Nelson, J.C., M.S. Sorrels, A.E.Van Deynze, L.U. Yun Hal, M. Atkinson, M. Bbernard
and P. Leroy (1995). Molecular mapping of wheat major genes and
rearrangements in homeologous groups 4, 5 and 7. Genetics, 141: 721–726.
Nybom, H. and I. Bartish (2000). Effects of life history traits and sampling strategies on
genetic diversity estimates obtained with RAPD markers in plants. Perspectives in
Plant Ecology, Evolution and Systematics, 3 (2): 93-114.
Pejic, I., P. Ajmone-Marsan, M. Morgante, V. Kozumplicl, P. Castiglioni, G. Taramino,
and M. Motto, (1998). Comparative analysis of genetic similarity among maize
inbred lines detected by RFLPs, RAPDs, SSRs and AFLPs. TAG, 97(8): 1248-
1255.
Powell, W., M. Morgante, C. Andre, M. Hanafey, J. Vogel, S. Tingey, and A. Rafalski
(1996). The Comparison of RFLP, RAPD, AFLP and SSR (Microsatellite)
Markers for Germplasm Analysis. Mol. Breed. 2: 225–238
Rharrabti. Y, D. Villegas, L.E. García del Moral, N. Aparicio. S. Elhani. and C. Royo
(2001). Environmental and genetic determination of protein content and grain
yield in durum wheat under Mediterranean conditions. Plant Breed. 120(5): 381-
388
Rohlf, F.J. (2000). On the use of shape spaces to compare morphometric method.
Hystrix, Italian J. Mammology (n.s.),11(1): 8-24.
Sajida Bibi, M.U., A. Imtiaz, A. Khan, and M.H. Naqvi (2009). Study of genetic diversity
in wheat (Triticum Aestivuml.) using random amplified polymorphic DNA
(RAPD) markers. Pak. J. Bot., 41(3): 1023-1027
Siugh, P.K. (1994). Genetic diversity in durum wheat germplasm. Ann. Agric. Res.
15:418-422.
Smith, O.S., and J.S.C. Smith (1992). Measurement of genetic diversity among hybrids:
A comparison of isozymic, RFLP, pedigree, and heterosis data. Medica 37, 53–60
Soliman, S.S., A. A. Bahy and M.M. Mohamed (2003). Genetic comparisons of Egyptian
date palm cultivars (Phoenix dactylifera L.) by RAPD-PCR. African Journal of
Biotechnology, 2: 86-86.
Tanksley, S.D. and T.J. Orton (1983). Isozymes in plant genetics and breeding (Part A).
Elsevier Science Publishers B.V., Amsterdam.
Van Becelaere, G., E. L. Lumbbers, A. H. Paterson and P.W. Chee (2005). Pedigree-vs.
DNA marker-based genetic similarity estimates in cotton. Crop Science, 45(6):
2281-2287.
Van Slageren, M.W. (1994). Wild Wheats: a monograph of Aegilops L. and
Amblyopyrum (Jaub. & Spach) Eig (Poaceae). Wageningen Agricultural
University Papers 94–97, Wageningen, the Netherlands.
Vierling, R.A. and H.T. Nguyen (1992). Use of RAPD markers to determine the genetic
diversity of diploid wheat genotypes. TAG. 84: 835-838.
Williams, J.K., A.R. Kubelik, K.J. Livak, J.A. Rafalski and S.V. Tingey (1990) DNA
polymorphisms amplified by arbitrary primers are useful as genetic markers.
Nucleic Acids Res., 18: 6531-6535.
Zaharieva M., J.M. Prosperi, P. Monneveux (2004). Ecological distribution and species
diversity of Aegilops L. genus in Bulgaria. Biodivers. Conserv. 13: 2319-2337.
Zhang, Q.F., M.A.S. Mariif and A. Kleinhofs (1993). Comparative diversity analysis of
RELPs and isozymes within and among populations of Hordeum vulgare spp.
spontaneum. Genetics, 134: 909-916.
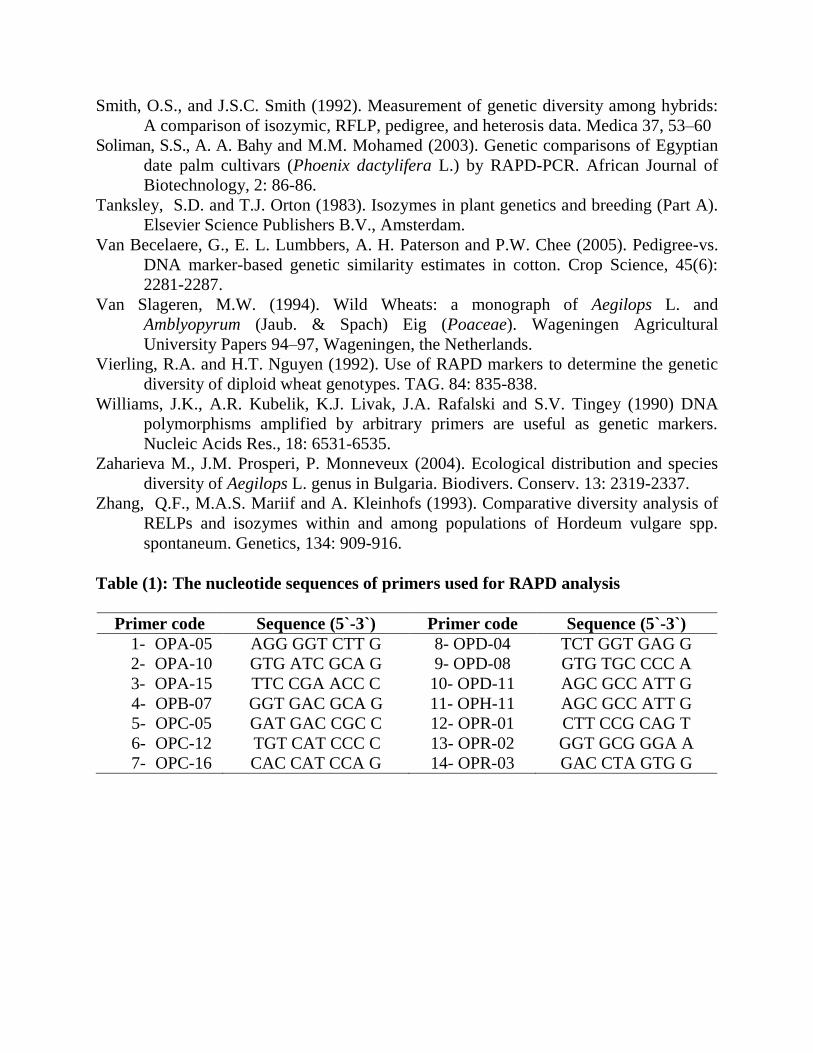
Table (1): The nucleotide sequences of primers used for RAPD analysis
Primer code Sequence (5`-3`) Primer code Sequence (5`-3`)
1- OPA-05 AGG GGT CTT G 8- OPD-04 TCT GGT GAG G
2- OPA-10 GTG ATC GCA G 9- OPD-08 GTG TGC CCC A
3- OPA-15 TTC CGA ACC C 10- OPD-11 AGC GCC ATT G
4- OPB-07 GGT GAC GCA G 11- OPH-11 AGC GCC ATT G
5- OPC-05 GAT GAC CGC C 12- OPR-01 CTT CCG CAG T
6- OPC-12 TGT CAT CCC C 13- OPR-02 GGT GCG GGA A
7- OPC-16 CAC CAT CCA G 14- OPR-03 GAC CTA GTG G
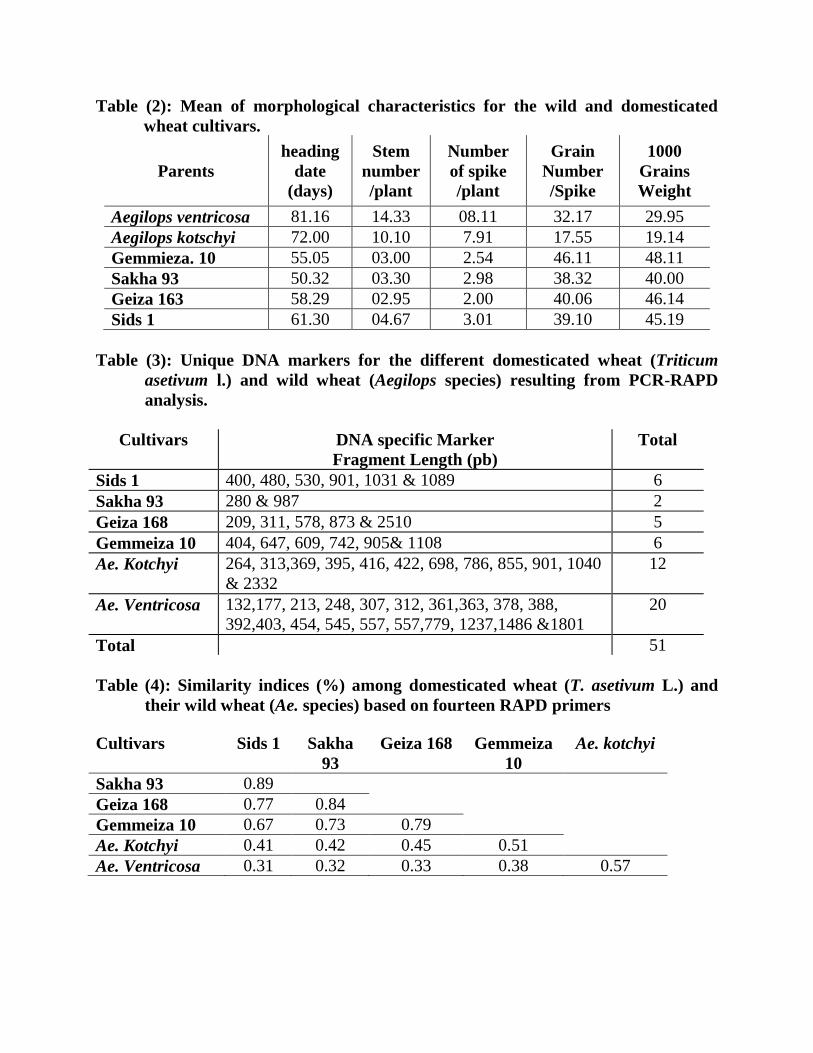
Table (2): Mean of morphological characteristics for the wild and domesticated
wheat cultivars.
Parents
heading
date
(days)
Stem
number
/plant
Number
of spike
/plant
Grain
Number
/Spike
1000
Grains
Weight
Aegilops ventricosa 81.16 14.33 08.11 32.17 29.95
Aegilops kotschyi 72.00 10.10 7.91 17.55 19.14
Gemmieza. 10 55.05 03.00 2.54 46.11 48.11
Sakha 93 50.32 03.30 2.98 38.32 40.00
Geiza 163 58.29 02.95 2.00 40.06 46.14
Sids 1 61.30 04.67 3.01 39.10 45.19
Table (3): Unique DNA markers for the different domesticated wheat (Triticum
asetivum l.) and wild wheat (Aegilops species) resulting from PCR-RAPD
analysis.
Cultivars DNA specific Marker
Fragment Length (pb)
Total
Sids 1 400, 480, 530, 901, 1031 & 1089 6
Sakha 93 280 & 987 2
Geiza 168 209, 311, 578, 873 & 2510 5
Gemmeiza 10 404, 647, 609, 742, 905& 1108 6
Ae. Kotchyi 264, 313,369, 395, 416, 422, 698, 786, 855, 901, 1040
& 2332
12
Ae. Ventricosa 132,177, 213, 248, 307, 312, 361,363, 378, 388,
392,403, 454, 545, 557, 557,779, 1237,1486 &1801
20
Total 51
Table (4): Similarity indices (%) among domesticated wheat (T. asetivum L.) and
their wild wheat (Ae. species) based on fourteen RAPD primers
Cultivars Sids 1 Sakha
93
Geiza 168 Gemmeiza
10
Ae. kotchyi
Sakha 93 0.89
Geiza 168 0.77 0.84
Gemmeiza 10 0.67 0.73 0.79
Ae. Kotchyi 0.41 0.42 0.45 0.51
Ae. Ventricosa 0.31 0.32 0.33 0.38 0.57
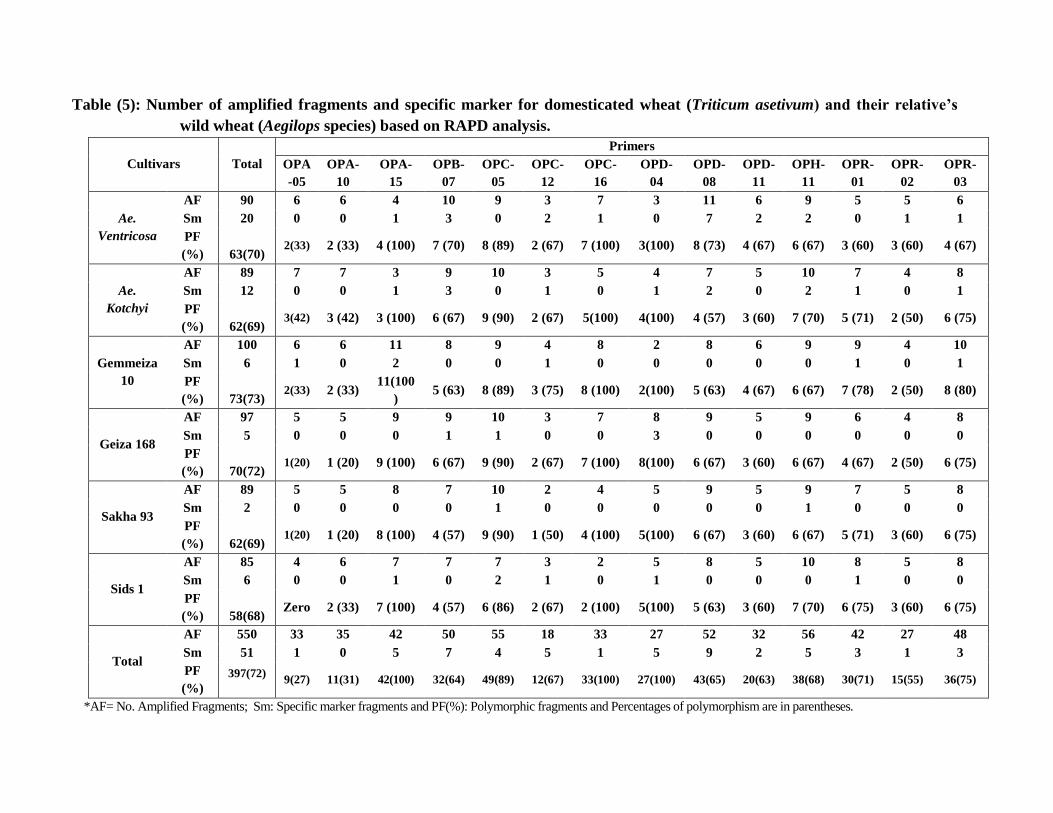
Table (5): Number of amplified fragments and specific marker for domesticated wheat (Triticum asetivum) and their relative’s
wild wheat (Aegilops species) based on RAPD analysis.
Cultivars Total
Primers
OPA
-05
OPA-
10
OPA-
15
OPB-
07
OPC-
05
OPC-
12
OPC-
16
OPD-
04
OPD-
08
OPD-
11
OPH-
11
OPR-
01
OPR-
02
OPR-
03
Ae.
Ventricosa
AF 90 6 6 4 10 9 3 7 3 11 6 9 5 5 6
Sm 20 0 0 1 3 0 2 1 0 7 2 2 0 1 1
PF
(%) 63(70) 2(33) 2 (33) 4 (100) 7 (70) 8 (89) 2 (67) 7 (100) 3(100) 8 (73) 4 (67) 6 (67) 3 (60) 3 (60) 4 (67)
Ae.
Kotchyi
AF 89 7 7 3 9 10 3 5 4 7 5 10 7 4 8
Sm 12 0 0 1 3 0 1 0 1 2 0 2 1 0 1
PF
(%) 62(69) 3(42) 3 (42) 3 (100) 6 (67) 9 (90) 2 (67) 5(100) 4(100) 4 (57) 3 (60) 7 (70) 5 (71) 2 (50) 6 (75)
Gemmeiza
10
AF 100 6 6 11 8 9 4 8 2 8 6 9 9 4 10
Sm 6 1 0 2 0 0 1 0 0 0 0 0 1 0 1
PF
(%) 73(73) 2(33) 2 (33)
11(100
) 5 (63) 8 (89) 3 (75) 8 (100) 2(100) 5 (63) 4 (67) 6 (67) 7 (78) 2 (50) 8 (80)
Geiza 168
AF 97 5 5 9 9 10 3 7 8 9 5 9 6 4 8
Sm 5 0 0 0 1 1 0 0 3 0 0 0 0 0 0
PF
(%) 70(72) 1(20) 1 (20) 9 (100) 6 (67) 9 (90) 2 (67) 7 (100) 8(100) 6 (67) 3 (60) 6 (67) 4 (67) 2 (50) 6 (75)
Sakha 93
AF 89 5 5 8 7 10 2 4 5 9 5 9 7 5 8
Sm 2 0 0 0 0 1 0 0 0 0 0 1 0 0 0
PF
(%) 62(69) 1(20) 1 (20) 8 (100) 4 (57) 9 (90) 1 (50) 4 (100) 5(100) 6 (67) 3 (60) 6 (67) 5 (71) 3 (60) 6 (75)
Sids 1
AF 85 4 6 7 7 7 3 2 5 8 5 10 8 5 8
Sm 6 0 0 1 0 2 1 0 1 0 0 0 1 0 0
PF
(%) 58(68) Zero 2 (33) 7 (100) 4 (57) 6 (86) 2 (67) 2 (100) 5(100) 5 (63) 3 (60) 7 (70) 6 (75) 3 (60) 6 (75)
Total
AF 550 33 35 42 50 55 18 33 27 52 32 56 42 27 48
Sm 51 1 0 5 7 4 5 1 5 9 2 5 3 1 3
PF
(%)
397(72)
9(27) 11(31) 42(100) 32(64) 49(89) 12(67) 33(100) 27(100) 43(65) 20(63) 38(68) 30(71) 15(55) 36(75)
*AF= No. Amplified Fragments; Sm: Specific marker fragments and PF(%): Polymorphic fragments and Percentages of polymorphism are in parentheses.
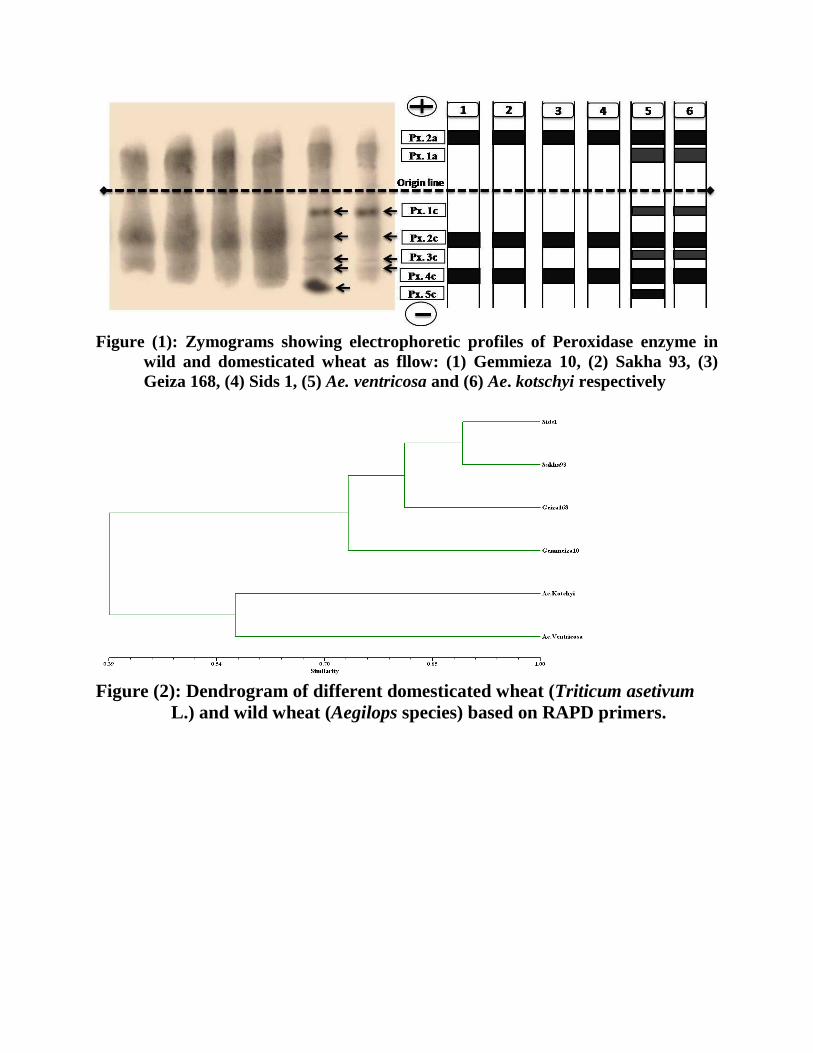
Figure (1): Zymograms showing electrophoretic profiles of Peroxidase enzyme in
wild and domesticated wheat as fllow: (1) Gemmieza 10, (2) Sakha 93, (3)
Geiza 168, (4) Sids 1, (5) Ae. ventricosa and (6) Ae. kotschyi respectively
Figure (2): Dendrogram of different domesticated wheat (Triticum asetivum
L.) and wild wheat (Aegilops species) based on RAPD primers.
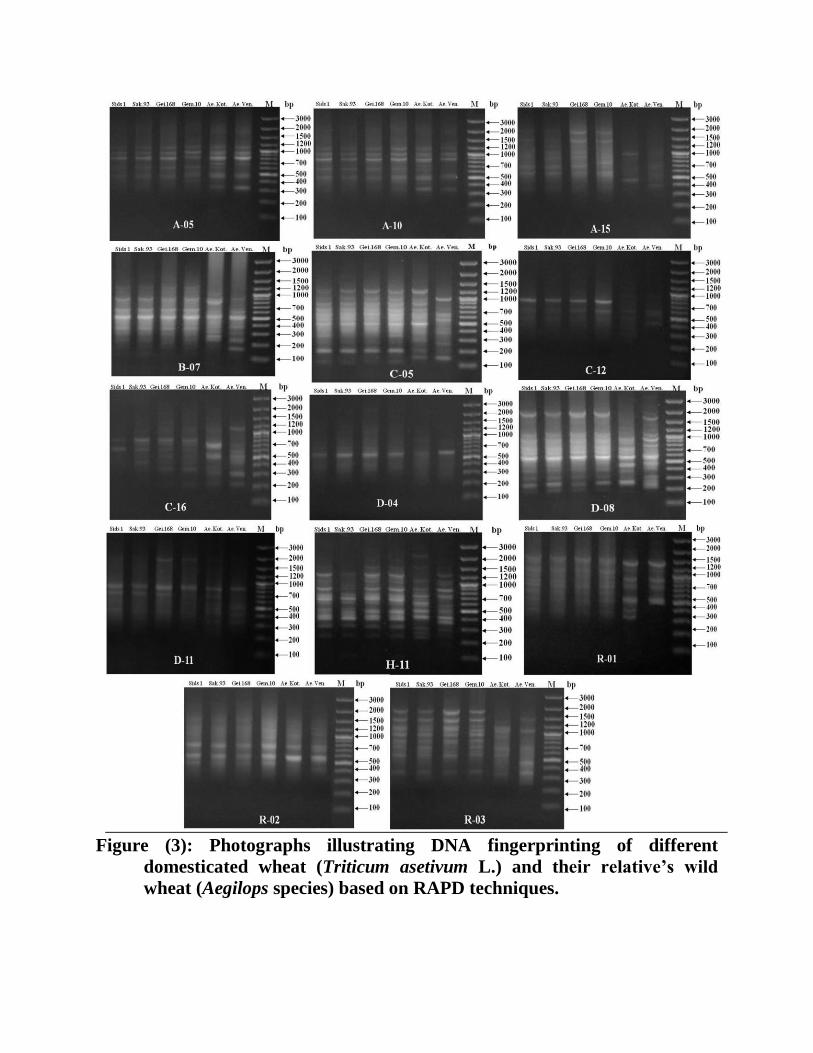
Figure (3): Photographs illustrating DNA fingerprinting of different
domesticated wheat (Triticum asetivum L.) and their relative’s wild
wheat (Aegilops species) based on RAPD techniques.