Physical Mapping of Wheat and Rye Expressed Sequence Tag–Simple Sequence Repeats on Wheat...
11
Reproduced from Crop Science. Published by Crop Science Society of America. All copyrights reserved. The Plant Genome [A Supplement to Crop Science] January 2007 No. 1 S-3 Abstract Six hundred and seventy two loci belonging to 275 expressed sequence tag–simple sequence repeats [EST–SSRs, including 93 wheat ( Triticum aestivum L.) and 182 rye (Secale cereale L.) EST–SSRs] were physically mapped on 21 wheat chromosomes. The mapping involved two approaches, the wet-lab approach involving use of deletion stocks and the in silico approach involving matching with ESTs that were previously mapped. The number of loci per EST–SSR mapped using the in silico approach was almost double the number of loci mapped using the wet-lab approach (using deletion stocks). The distribution of loci on the three subgenomes, on the seven homoeologous groups and on the 21 individual chromosomes was nonrandom (P << 0.01). Long arms had disproportionately (relative to the difference in DNA content) higher number of loci, with more loci mapped to the distal regions of chromosome arms. A fairly high proportion of EST–SSRs had multiple loci, which were largely (81%) homoeoloci. Rye EST–SSRs showed a high level of transferability (≈77%) to the wheat genome. Putative functions were assigned to 216 SSR-containing ESTs through homology searches against the protein database. As many as 104 SSR-containing ESTs (a subset of the above ESTs) were also mapped to the 12 rice chromosomes, which corresponded with the known homology between wheat and rice chromosomes. These physical maps of EST–SSRs should prove useful for comparative genomics, gene tagging, fine mapping, and cloning of genes and QTLs. Abbreviations: DT, ditelosomic; EST, expressed sequence tag; NT, nullisomic– tetrasomic; SSR, simple sequence repeat. Dna-based molecular markers, particularly SSRs, have been developed and mapped on chromosomes in a variety of crop plants. In bread wheat, genetic and physical mapping of SSRs has been an ongoing exercise, and, to date, ≈2450 SSRs (1 SSR 1.63 cM −1 ) have been genetically mapped (for details see Torada et al., 2006) and ≈1320 SSRs (62 SSRs chromosome −1 ) have been physically mapped (for details see Goyal et al., 2005). With a genome size of ≈16 000 Mbp, it is evident that despite concerted efforts, the density of mapped SSRs in bread wheat remains relatively low and continued efforts are needed to increase the density of these SSRs on available genetic and physical maps. In recent years, emphasis has also shiſted from genomic SSRs to EST–SSRs due to the availability of very large databases of ESTs from all of the cereals including bread wheat. Consequently, the number of EST–SSRs in cereals now includes 43 598 from bread wheat (Peng and Lapitan, 2005), 16 917 from rice and 184 from rye (La Rota et al., 2005; Hackauf and Weh- ling, 2002). e genetic mapping of these EST–SSRs is difficult due to a low level of polymorphism, as a result of their conserved nature. Physical mapping of these EST–SSRs in wheat is equally difficult due to the occur- rence of homoeoloci exhibiting no polymorphism. is Physical Mapping of Wheat and Rye Expressed Sequence Tag–Simple Sequence Repeats on Wheat Chromosomes Amita Mohan, Aakash Goyal, Ravinder Singh, Harindra S. Balyan, and Pushpendra K. Gupta* Molecular Biology Lab., Dep. of Genetics and Plant Breeding, Ch. Charan Singh Univ., Meerut- 250 004 (U.P.), India. Received 11 June 2006. *Corresponding author ([email protected]). Published in Crop Sci 47(S1) (2007). Published 6 Dec. 2006. doi:10.2135/cropsci2006-06-0376tpg © Crop Science Society of America 677 S. Segoe Rd., Madison, WI 53711 USA Ge ome The Ge ome The Original Research
Transcript of Physical Mapping of Wheat and Rye Expressed Sequence Tag–Simple Sequence Repeats on Wheat...
Repro
duced
from
Cro
pS
cie
nce.
Publis
hed
by
Cro
pS
cie
nce
Socie
tyof
Am
erica.
All
copyrights
reserv
ed.
The Plant Genome [A Supplement to Crop Science] January 2007 No. 1 S-3
AbstractSix hundred and seventy two loci belonging to 275 expressed sequence tag–simple sequence repeats [EST–SSRs, including 93 wheat (Triticum aestivum L.) and 182 rye (Secale cereale L.) EST–SSRs] were physically mapped on 21 wheat chromosomes. The mapping involved two approaches, the wet-lab approach involving use of deletion stocks and the in silico approach involving matching with ESTs that were previously mapped. The number of loci per EST–SSR mapped using the in silico approach was almost double the number of loci mapped using the wet-lab approach (using deletion stocks). The distribution of loci on the three subgenomes, on the seven homoeologous groups and on the 21 individual chromosomes was nonrandom (P << 0.01). Long arms had disproportionately (relative to the difference in DNA content) higher number of loci, with more loci mapped to the distal regions of chromosome arms. A fairly high proportion of EST–SSRs had multiple loci, which were largely (81%) homoeoloci. Rye EST–SSRs showed a high level of transferability (≈77%) to the wheat genome. Putative functions were assigned to 216 SSR-containing ESTs through homology searches against the protein database. As many as 104 SSR-containing ESTs (a subset of the above ESTs) were also mapped to the 12 rice chromosomes, which corresponded with the known homology between wheat and rice chromosomes. These physical maps of EST–SSRs should prove useful for comparative genomics, gene tagging, fi ne mapping, and cloning of genes and QTLs.
Abbreviations: DT, ditelosomic; EST, expressed sequence tag; NT, nullisomic–tetrasomic; SSR, simple sequence repeat.
Dna-based molecular markers, particularly SSRs, have been developed and mapped on chromosomes in a variety of crop plants. In bread wheat, genetic and physical mapping of SSRs has been an ongoing exercise, and, to date, ≈2450 SSRs (1 SSR 1.63 cM−1) have been genetically mapped (for details see Torada et al., 2006) and ≈1320 SSRs (62 SSRs chromosome−1) have been physically mapped (for details see Goyal et al., 2005). With a genome size of ≈16 000 Mbp, it is evident that despite concerted eff orts, the density of mapped SSRs in bread wheat remains relatively low and continued eff orts are needed to increase the density of these SSRs on available genetic and physical maps.
In recent years, emphasis has also shift ed from genomic SSRs to EST–SSRs due to the availability of very large databases of ESTs from all of the cereals including bread wheat. Consequently, the number of EST–SSRs in cereals now includes 43 598 from bread wheat (Peng and Lapitan, 2005), 16 917 from rice and 184 from rye (La Rota et al., 2005; Hackauf and Weh-ling, 2002). Th e genetic mapping of these EST–SSRs is diffi cult due to a low level of polymorphism, as a result of their conserved nature. Physical mapping of these EST–SSRs in wheat is equally diffi cult due to the occur-rence of homoeoloci exhibiting no polymorphism. Th is
Physical Mapping of Wheat and Rye Expressed Sequence Tag–Simple Sequence Repeats on Wheat ChromosomesAmita Mohan, Aakash Goyal, Ravinder Singh, Harindra S. Balyan, and Pushpendra K. Gupta*
Molecular Biology Lab., Dep. of Genetics and Plant Breeding, Ch. Charan Singh Univ., Meerut- 250 004 (U.P.), India. Received 11 June 2006. *Corresponding author ([email protected]).
Published in Crop Sci 47(S1) (2007). Published 6 Dec. 2006.doi:10.2135/cropsci2006-06-0376tpg© Crop Science Society of America677 S. Segoe Rd., Madison, WI 53711 USA
Ge ome
The
Ge ome
The
Original Research
Repro
duced
from
Cro
pS
cie
nce.
Publis
hed
by
Cro
pS
cie
nce
Socie
tyof
Am
erica.
All
copyrights
reserv
ed.
S-4 The Plant Genome [A Supplement to Crop Science] January 2007 No. 1
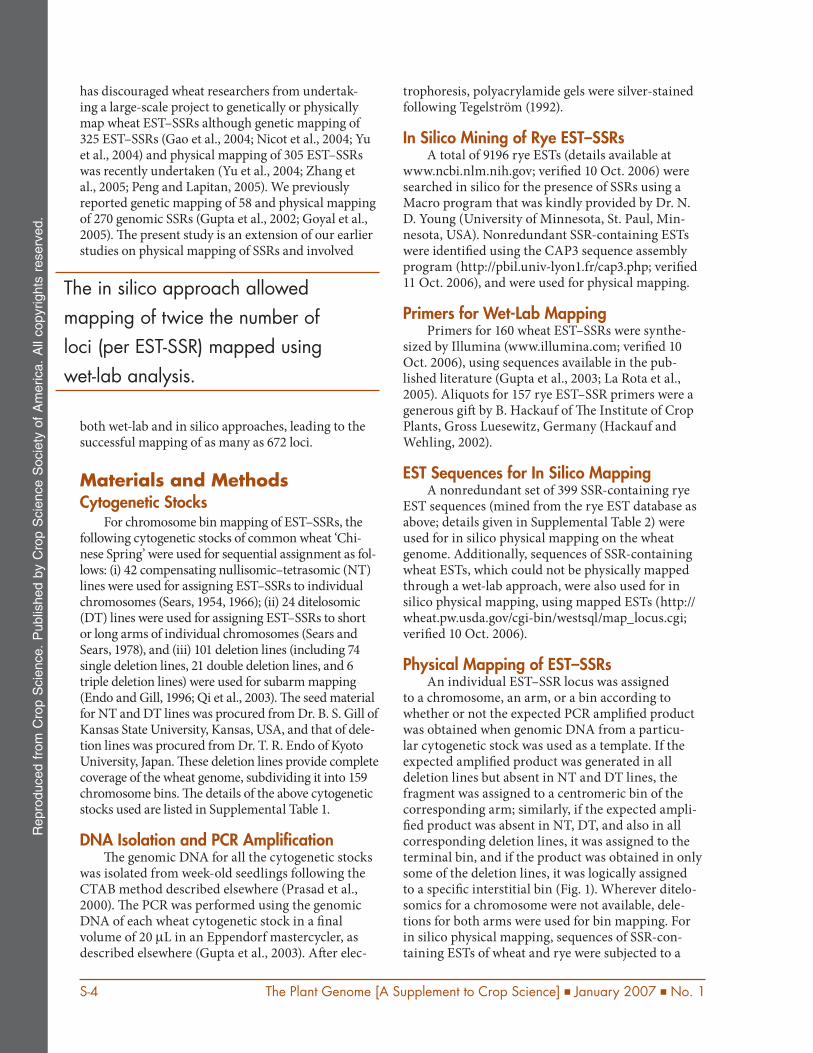
The in silico approach allowed
mapping of twice the number of
loci (per EST-SSR) mapped using
wet-lab analysis.
has discouraged wheat researchers from undertak-ing a large-scale project to genetically or physically map wheat EST–SSRs although genetic mapping of 325 EST–SSRs (Gao et al., 2004; Nicot et al., 2004; Yu et al., 2004) and physical mapping of 305 EST–SSRs was recently undertaken (Yu et al., 2004; Zhang et al., 2005; Peng and Lapitan, 2005). We previously reported genetic mapping of 58 and physical mapping of 270 genomic SSRs (Gupta et al., 2002; Goyal et al., 2005). Th e present study is an extension of our earlier studies on physical mapping of SSRs and involved
both wet-lab and in silico approaches, leading to the successful mapping of as many as 672 loci.
Materials and MethodsCytogenetic Stocks
For chromosome bin mapping of EST–SSRs, the following cytogenetic stocks of common wheat ‘Chi-nese Spring’ were used for sequential assignment as fol-lows: (i) 42 compensating nullisomic–tetrasomic (NT) lines were used for assigning EST–SSRs to individual chromosomes (Sears, 1954, 1966); (ii) 24 ditelosomic (DT) lines were used for assigning EST–SSRs to short or long arms of individual chromosomes (Sears and Sears, 1978), and (iii) 101 deletion lines (including 74 single deletion lines, 21 double deletion lines, and 6 triple deletion lines) were used for subarm mapping (Endo and Gill, 1996; Qi et al., 2003). Th e seed material for NT and DT lines was procured from Dr. B. S. Gill of Kansas State University, Kansas, USA, and that of dele-tion lines was procured from Dr. T. R. Endo of Kyoto University, Japan. Th ese deletion lines provide complete coverage of the wheat genome, subdividing it into 159 chromosome bins. Th e details of the above cyto genetic stocks used are listed in Supplemental Table 1.
DNA Isolation and PCR Amplifi cationTh e genomic DNA for all the cytogenetic stocks
was isolated from week-old seedlings following the CTAB method described elsewhere (Prasad et al., 2000). Th e PCR was performed using the genomic DNA of each wheat cytogenetic stock in a fi nal volume of 20 μL in an Eppendorf mastercycler, as described elsewhere (Gupta et al., 2003). Aft er elec-
trophoresis, polyacrylamide gels were silver-stained following Tegelström (1992).
In Silico Mining of Rye EST–SSRsA total of 9196 rye ESTs (details available at
www.ncbi.nlm.nih.gov; verifi ed 10 Oct. 2006) were searched in silico for the presence of SSRs using a Macro program that was kindly provided by Dr. N. D. Young (University of Minnesota, St. Paul, Min-nesota, USA). Nonredundant SSR-containing ESTs were identifi ed using the CAP3 sequence assembly program (http://pbil.univ-lyon1.fr/cap3.php; verifi ed 11 Oct. 2006), and were used for physical mapping.
Primers for Wet-Lab MappingPrimers for 160 wheat EST–SSRs were synthe-
sized by Illumina (www.illumina.com; verifi ed 10 Oct. 2006), using sequences available in the pub-lished literature (Gupta et al., 2003; La Rota et al., 2005). Aliquots for 157 rye EST–SSR primers were a generous gift by B. Hackauf of Th e Institute of Crop Plants, Gross Luesewitz, Germany (Hackauf and Wehling, 2002).
EST Sequences for In Silico MappingA nonredundant set of 399 SSR-containing rye
EST sequences (mined from the rye EST database as above; details given in Supplemental Table 2) were used for in silico physical mapping on the wheat genome. Additionally, sequences of SSR-containing wheat ESTs, which could not be physically mapped through a wet-lab approach, were also used for in silico physical mapping, using mapped ESTs (http://wheat.pw.usda.gov/cgi-bin/westsql/map_locus.cgi; verifi ed 10 Oct. 2006).
Physical Mapping of EST–SSRsAn individual EST–SSR locus was assigned
to a chromosome, an arm, or a bin according to whether or not the expected PCR amplifi ed product was obtained when genomic DNA from a particu-lar cytogenetic stock was used as a template. If the expected amplifi ed product was generated in all deletion lines but absent in NT and DT lines, the fragment was assigned to a centromeric bin of the corresponding arm; similarly, if the expected ampli-fi ed product was absent in NT, DT, and also in all corresponding deletion lines, it was assigned to the terminal bin, and if the product was obtained in only some of the deletion lines, it was logically assigned to a specifi c interstitial bin (Fig. 1). Wherever ditelo-somics for a chromosome were not available, dele-tions for both arms were used for bin mapping. For in silico physical mapping, sequences of SSR-con-taining ESTs of wheat and rye were subjected to a
Repro
duced
from
Cro
pS
cie
nce.
Publis
hed
by
Cro
pS
cie
nce
Socie
tyof
Am
erica.
All
copyrights
reserv
ed.
Mohan et al.: Mapping of EST–SSRs on Wheat Chromosomes S-5
BLASTN search against the GrainGenes database of wheat EST sequences that were bin mapped earlier using deletion stocks of Chinese Spring (http://wheat.pw.usda.gov/cgi-bin/westsql/map_locus.cgi; verifi ed 10 Oct. 2006). Optimized BLASTN search parameters [cut-off E (expectation) value of ≤ e−15] and bit score 100 were used. Only the top hit from the BLASTN results were assigned to specifi c bins of wheat chromosomes.
Alignment of SSR-containing ESTs to the Rice Genome and Mapping onto Rice Chromosomes
Th e SSR-containing ESTs that were mapped during the present study were also used for BLASTN homology search with the rice whole genome sequence available at Gramene (www.gramene.org; verifi ed 21 Nov. 2006). Th e signifi cant matches were determined using a cut-off E value of 10−15. Using this approach, SSR-containing ESTs were placed onto the rice chromosomes with the help of KaryoView soft ware available at Gramene (www.gramene.org/Oryza_sativa/karyoview; verifi ed 10 Oct. 2006).
Assignment of Putative Functions to SSR-containing ESTs
Th e SSR-containing ESTs were subjected to BLASTX analysis against the nonredundant protein database for assigning putative functions at a cut-off E value of 10−15 (www.ncbi.nlm.nih.gov/BLAST; veri-fi ed 10 Oct. 2006).
Statistical Tests for Random Distribution of Mapped Loci
On the basis of physical size (in micrometers) and DNA contents of chromosomes and chromosome arms (as given in Gill et al., 1991; Furuta and Nishikawa, 1991), the expected number of EST–SSR loci was esti-mated under the assumption of random distribution among chromosomes or chromosome arms, among the three subgenomes, and seven homoeologous groups. Th e expected number of EST–SSR loci on the rice chromosomes was estimated on the basis of size (Mb) of each rice chromosome (www.Gramene.org/Oryza_sativa; verifi ed 10 Oct. 2006) assuming ran-dom distribution of loci. Th e χ2 test for goodness-of-fi t was used for testing the random distribution of EST–SSR loci among chromosomes, chromosomes arms, the three subgenomes, the seven homoeologous groups of wheat and among 12 rice chromosomes. Independence of the distribution of loci in the three subgenomes vs.
the seven homoeologous groups was tested using 3 × 7 contingency table for χ2 test of independence.
Results and DiscussionPhysical Mapping of EST–SSRs
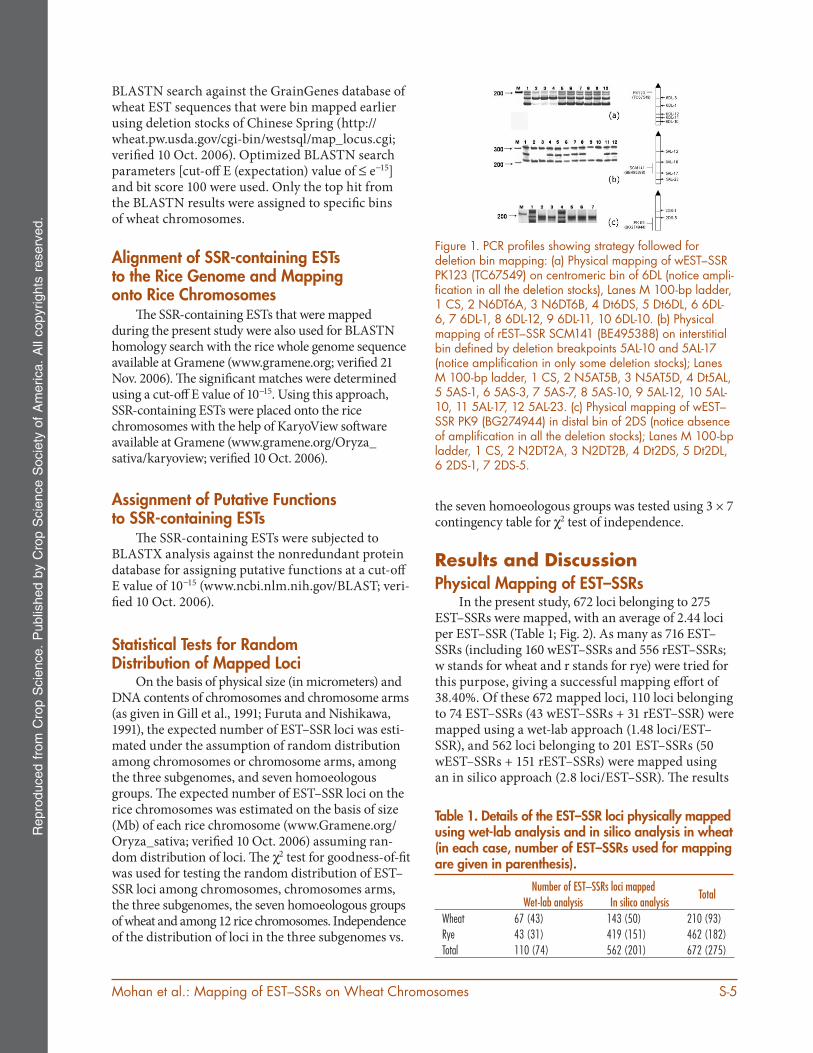
In the present study, 672 loci belonging to 275 EST–SSRs were mapped, with an average of 2.44 loci per EST–SSR (Table 1; Fig. 2). As many as 716 EST–SSRs (including 160 wEST–SSRs and 556 rEST–SSRs; w stands for wheat and r stands for rye) were tried for this purpose, giving a successful mapping eff ort of 38.40%. Of these 672 mapped loci, 110 loci belonging to 74 EST–SSRs (43 wEST–SSRs + 31 rEST–SSR) were mapped using a wet-lab approach (1.48 loci/EST–SSR), and 562 loci belonging to 201 EST–SSRs (50 wEST–SSRs + 151 rEST–SSRs) were mapped using an in silico approach (2.8 loci/EST–SSR). Th e results
Table 1. Details of the EST–SSR loci physically mapped using wet-lab analysis and in silico analysis in wheat (in each case, number of EST–SSRs used for mapping are given in parenthesis).
Number of EST–SSRs loci mappedTotal
Wet-lab analysis In silico analysis
Wheat 67 (43) 143 (50) 210 (93)Rye 43 (31) 419 (151) 462 (182)Total 110 (74) 562 (201) 672 (275)
Figure 1. PCR profi les showing strategy followed for deletion bin mapping: (a) Physical mapping of wEST–SSR PK123 (TC67549) on centromeric bin of 6DL (notice ampli-fi cation in all the deletion stocks), Lanes M 100-bp ladder, 1 CS, 2 N6DT6A, 3 N6DT6B, 4 Dt6DS, 5 Dt6DL, 6 6DL-6, 7 6DL-1, 8 6DL-12, 9 6DL-11, 10 6DL-10. (b) Physical mapping of rEST–SSR SCM141 (BE495388) on interstitial bin defi ned by deletion breakpoints 5AL-10 and 5AL-17 (notice amplifi cation in only some deletion stocks); Lanes M 100-bp ladder, 1 CS, 2 N5AT5B, 3 N5AT5D, 4 Dt5AL, 5 5AS-1, 6 5AS-3, 7 5AS-7, 8 5AS-10, 9 5AL-12, 10 5AL-10, 11 5AL-17, 12 5AL-23. (c) Physical mapping of wEST–SSR PK9 (BG274944) in distal bin of 2DS (notice absence of amplifi cation in all the deletion stocks); Lanes M 100-bp ladder, 1 CS, 2 N2DT2A, 3 N2DT2B, 4 Dt2DS, 5 Dt2DL, 6 2DS-1, 7 2DS-5.
Repro
duced
from
Cro
pS
cie
nce.
Publis
hed
by
Cro
pS
cie
nce
Socie
tyof
Am
erica.
All
copyrights
reserv
ed.
S-6 The Plant Genome [A Supplement to Crop Science] January 2007 No. 1
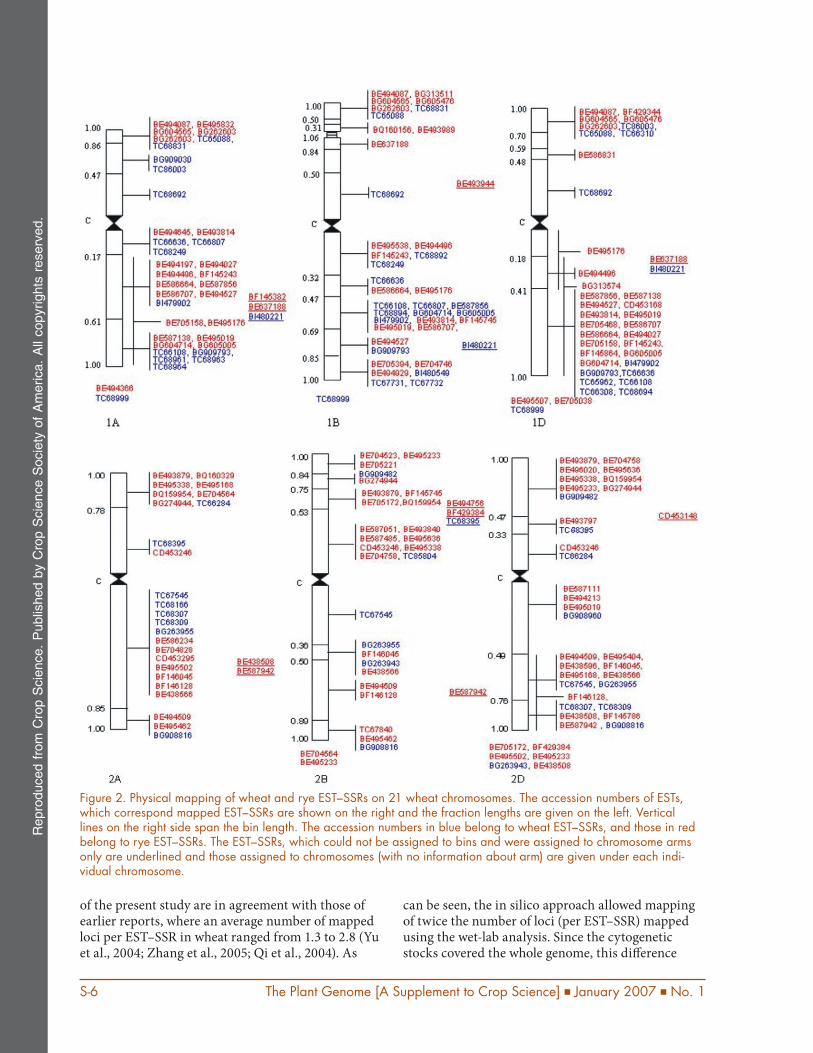
of the present study are in agreement with those of earlier reports, where an average number of mapped loci per EST–SSR in wheat ranged from 1.3 to 2.8 (Yu et al., 2004; Zhang et al., 2005; Qi et al., 2004). As
can be seen, the in silico approach allowed mapping of twice the number of loci (per EST–SSR) mapped using the wet-lab analysis. Since the cytogenetic stocks covered the whole genome, this diff erence
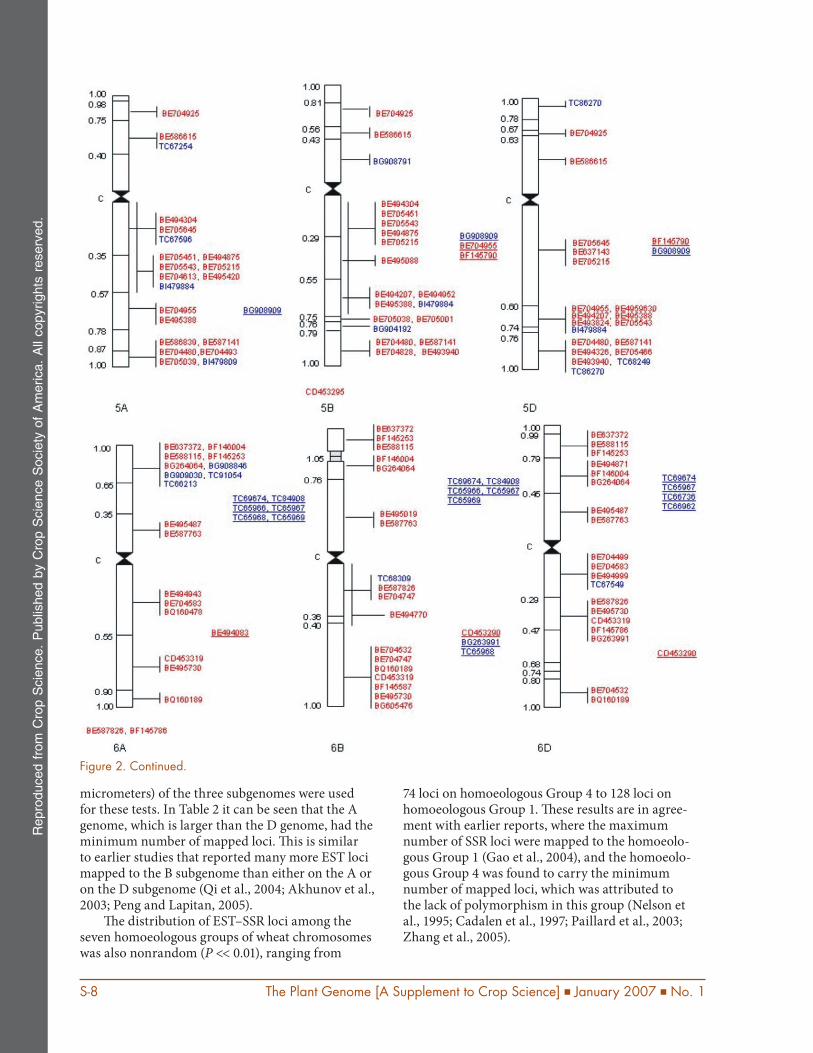
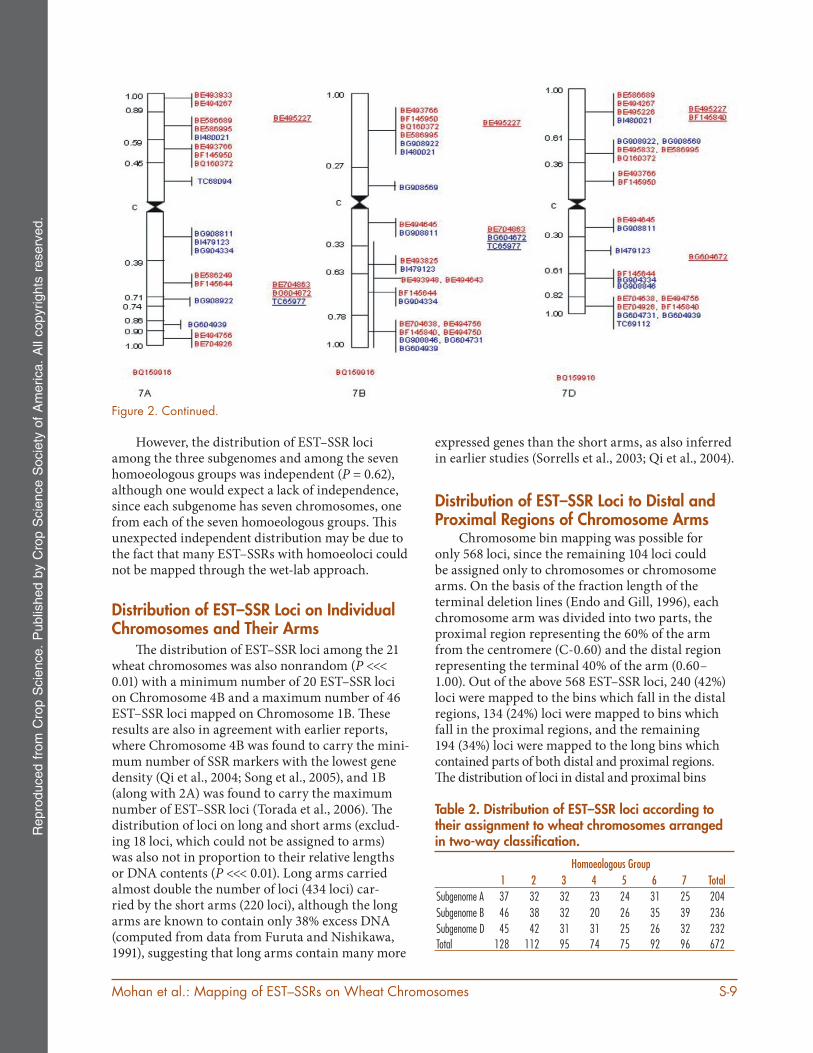
Figure 2. Physical mapping of wheat and rye EST–SSRs on 21 wheat chromosomes. The accession numbers of ESTs, which correspond mapped EST–SSRs are shown on the right and the fraction lengths are given on the left. Vertical lines on the right side span the bin length. The accession numbers in blue belong to wheat EST–SSRs, and those in red belong to rye EST–SSRs. The EST–SSRs, which could not be assigned to bins and were assigned to chromosome arms only are underlined and those assigned to chromosomes (with no information about arm) are given under each indi-vidual chromosome.
Repro
duced
from
Cro
pS
cie
nce.
Publis
hed
by
Cro
pS
cie
nce
Socie
tyof
Am
erica.
All
copyrights
reserv
ed.
Mohan et al.: Mapping of EST–SSRs on Wheat Chromosomes S-7
between numbers of mapped loci could not be due to incomplete coverage of the genome by the cytoge-netic stocks. Instead, this may be due to the failure to map, through the wet-lab approach, the homoeoloci that lacked polymorphism since the expected prod-uct will be visible in all NT, DT, and deletion stocks. Instead, the in silico approach will allow mapping of such homoeoloci, since the EST sequence will match with more than one mapped sequence.
Distribution of EST–SSR Loci among Subgenomes and Homoeologous Groups
Th e distribution of loci in the three subge-nomes (Table 2), when tested for randomness using their lengths in micrometers (Gill et al., 1991), were statistically signifi cant (P << 0.01), suggest-ing a nonrandom distribution. Similar results were obtained when DNA contents (instead of length in
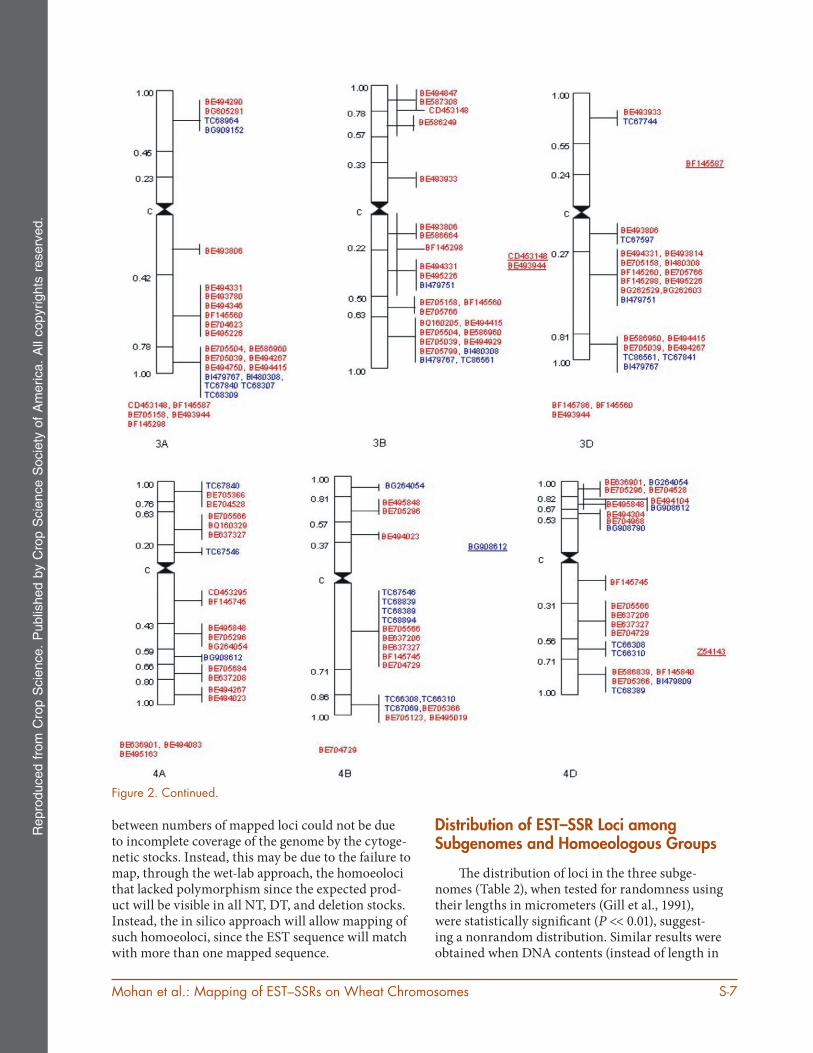
Figure 2. Continued.
Repro
duced
from
Cro
pS
cie
nce.
Publis
hed
by
Cro
pS
cie
nce
Socie
tyof
Am
erica.
All
copyrights
reserv
ed.
S-8 The Plant Genome [A Supplement to Crop Science] January 2007 No. 1
micrometers) of the three subgenomes were used for these tests. In Table 2 it can be seen that the A genome, which is larger than the D genome, had the minimum number of mapped loci. Th is is similar to earlier studies that reported many more EST loci mapped to the B subgenome than either on the A or on the D subgenome (Qi et al., 2004; Akhunov et al., 2003; Peng and Lapitan, 2005).
Th e distribution of EST–SSR loci among the seven homoeologous groups of wheat chromosomes was also nonrandom (P << 0.01), ranging from
74 loci on homoeologous Group 4 to 128 loci on homoeologous Group 1. Th ese results are in agree-ment with earlier reports, where the maximum number of SSR loci were mapped to the homoeolo-gous Group 1 (Gao et al., 2004), and the homoeolo-gous Group 4 was found to carry the minimum number of mapped loci, which was attributed to the lack of polymorphism in this group (Nelson et al., 1995; Cadalen et al., 1997; Paillard et al., 2003; Zhang et al., 2005).
Figure 2. Continued.
Repro
duced
from
Cro
pS
cie
nce.
Publis
hed
by
Cro
pS
cie
nce
Socie
tyof
Am
erica.
All
copyrights
reserv
ed.
Mohan et al.: Mapping of EST–SSRs on Wheat Chromosomes S-9
However, the distribution of EST–SSR loci among the three subgenomes and among the seven homoeologous groups was independent (P = 0.62), although one would expect a lack of independence, since each subgenome has seven chromosomes, one from each of the seven homoeologous groups. Th is unexpected independent distribution may be due to the fact that many EST–SSRs with homoeoloci could not be mapped through the wet-lab approach.
Distribution of EST–SSR Loci on Individual Chromosomes and Their Arms
Th e distribution of EST–SSR loci among the 21 wheat chromosomes was also nonrandom (P <<< 0.01) with a minimum number of 20 EST–SSR loci on Chromosome 4B and a maximum number of 46 EST–SSR loci mapped on Chromosome 1B. Th ese results are also in agreement with earlier reports, where Chromosome 4B was found to carry the mini-mum number of SSR markers with the lowest gene density (Qi et al., 2004; Song et al., 2005), and 1B (along with 2A) was found to carry the maximum number of EST–SSR loci (Torada et al., 2006). Th e distribution of loci on long and short arms (exclud-ing 18 loci, which could not be assigned to arms) was also not in proportion to their relative lengths or DNA contents (P <<< 0.01). Long arms carried almost double the number of loci (434 loci) car-ried by the short arms (220 loci), although the long arms are known to contain only 38% excess DNA (computed from data from Furuta and Nishikawa, 1991), suggesting that long arms contain many more
expressed genes than the short arms, as also inferred in earlier studies (Sorrells et al., 2003; Qi et al., 2004).
Distribution of EST–SSR Loci to Distal and Proximal Regions of Chromosome Arms
Chromosome bin mapping was possible for only 568 loci, since the remaining 104 loci could be assigned only to chromosomes or chromosome arms. On the basis of the fraction length of the terminal deletion lines (Endo and Gill, 1996), each chromosome arm was divided into two parts, the proximal region representing the 60% of the arm from the centromere (C-0.60) and the distal region representing the terminal 40% of the arm (0.60–1.00). Out of the above 568 EST–SSR loci, 240 (42%) loci were mapped to the bins which fall in the distal regions, 134 (24%) loci were mapped to bins which fall in the proximal regions, and the remaining 194 (34%) loci were mapped to the long bins which contained parts of both distal and proximal regions. Th e distribution of loci in distal and proximal bins
Figure 2. Continued.
Table 2. Distribution of EST–SSR loci according to their assignment to wheat chromosomes arranged in two-way classifi cation.
Homoeologous Group
1 2 3 4 5 6 7 TotalSubgenome A 37 32 32 23 24 31 25 204
Subgenome B 46 38 32 20 26 35 39 236Subgenome D 45 42 31 31 25 26 32 232Total 128 112 95 74 75 92 96 672
Repro
duced
from
Cro
pS
cie
nce.
Publis
hed
by
Cro
pS
cie
nce
Socie
tyof
Am
erica.
All
copyrights
reserv
ed.
S-10 The Plant Genome [A Supplement to Crop Science] January 2007 No. 1
deviated signifi cantly from the distribution expected on the basis of the relative lengths of these bins (P << 0.01). Th e present study, therefore, suggests that more EST–SSR loci tend to map to the distal regions, which are also the regions of recombination hot spots. Th e preferential localization of the EST–SSRs in the recom-bination hot spots enhances their value as markers, since these would facilitate fi ne mapping of genes and QTLs. In earlier studies, EST–density was shown to be positively related with the recombination rate (Akhu-nov et al., 2003) and was found to increase with increas-ing relative physical distance from the centromere to the end of a chromosome (Qi et al., 2004).
EST–SSRs Detecting Multiple Loci (Homoeologous and Nonhomoeologous)
Of the 275 mapped EST–SSRs, 178 (64%) detected multiple loci, and each of the remaining 97 detected only a single locus. Of the 178 EST–SSRs with multiple loci, 144 (81%) detected multiple homoeoloci, the remaining 34 (19%) detected mul-tiple loci on nonhomoeologous chromosomes, which might represent duplications. Th is is in agreement with an estimated 25 to 30% gene duplications reported for the wheat genome (Anderson et al., 1992). In view of the known fact that ESTs gener-ally represent unique single loci (Qi et al., 2004), the occurrence of EST–SSRs with multiple loci is signifi -cant and may be attributed to the conserved nature of EST–SSRs, which seem to occur as homoeoloci in the three related subgenomes.
Transferability of Rye EST–SSRs to WheatOut of 157 SSR-containing rye ESTs that were
used to study transferability between the two spe-cies, 121 (77%) gave amplifi cation products in Chi-nese Spring, indicating a high rate of transferability. Th e level of transferability between wheat and rye in the present study is comparable to earlier reports of transferability of EST–SSRs in cereals (Gao et al., 2003; Khlestkina et al., 2004; Zhang et al., 2005), but it is higher than the level of transferability (25%) of genomic SSRs (Korzun et al., 2001; Kuleung et al., 2004). Th is may also be attributed to the conserved nature of EST–SSRs among closely related species.
Distribution and Localization of Mapped EST–SSRs on Rice Chromosomes
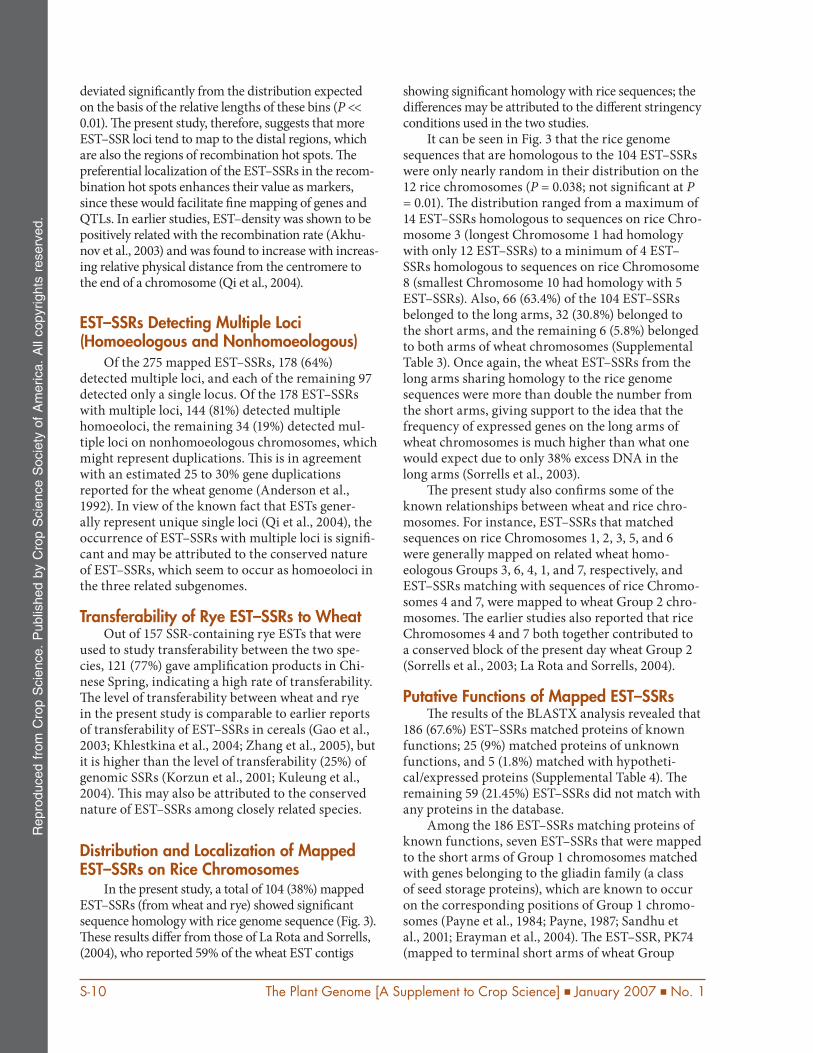
In the present study, a total of 104 (38%) mapped EST–SSRs (from wheat and rye) showed signifi cant sequence homology with rice genome sequence (Fig. 3). Th ese results diff er from those of La Rota and Sorrells, (2004), who reported 59% of the wheat EST contigs
showing signifi cant homology with rice sequences; the diff erences may be attributed to the diff erent stringency conditions used in the two studies.
It can be seen in Fig. 3 that the rice genome sequences that are homologous to the 104 EST–SSRs were only nearly random in their distribution on the 12 rice chromosomes (P = 0.038; not signifi cant at P = 0.01). Th e distribution ranged from a maximum of 14 EST–SSRs homologous to sequences on rice Chro-mosome 3 (longest Chromosome 1 had homology with only 12 EST–SSRs) to a minimum of 4 EST–SSRs homologous to sequences on rice Chromosome 8 (smallest Chromosome 10 had homology with 5 EST–SSRs). Also, 66 (63.4%) of the 104 EST–SSRs belonged to the long arms, 32 (30.8%) belonged to the short arms, and the remaining 6 (5.8%) belonged to both arms of wheat chromosomes (Supplemental Table 3). Once again, the wheat EST–SSRs from the long arms sharing homology to the rice genome sequences were more than double the number from the short arms, giving support to the idea that the frequency of expressed genes on the long arms of wheat chromosomes is much higher than what one would expect due to only 38% excess DNA in the long arms (Sorrells et al., 2003).
Th e present study also confi rms some of the known relationships between wheat and rice chro-mosomes. For instance, EST–SSRs that matched sequences on rice Chromosomes 1, 2, 3, 5, and 6 were generally mapped on related wheat homo-eologous Groups 3, 6, 4, 1, and 7, respectively, and EST–SSRs matching with sequences of rice Chromo-somes 4 and 7, were mapped to wheat Group 2 chro-mosomes. Th e earlier studies also reported that rice Chromosomes 4 and 7 both together contributed to a conserved block of the present day wheat Group 2 (Sorrells et al., 2003; La Rota and Sorrells, 2004).
Putative Functions of Mapped EST–SSRsTh e results of the BLASTX analysis revealed that
186 (67.6%) EST–SSRs matched proteins of known functions; 25 (9%) matched proteins of unknown functions, and 5 (1.8%) matched with hypotheti-cal/expressed proteins (Supplemental Table 4). Th e remaining 59 (21.45%) EST–SSRs did not match with any proteins in the database.
Among the 186 EST–SSRs matching proteins of known functions, seven EST–SSRs that were mapped to the short arms of Group 1 chromosomes matched with genes belonging to the gliadin family (a class of seed storage proteins), which are known to occur on the corresponding positions of Group 1 chromo-somes (Payne et al., 1984; Payne, 1987; Sandhu et al., 2001; Erayman et al., 2004). Th e EST–SSR, PK74 (mapped to terminal short arms of wheat Group
Repro
duced
from
Cro
pS
cie
nce.
Publis
hed
by
Cro
pS
cie
nce
Socie
tyof
Am
erica.
All
copyrights
reserv
ed.
Mohan et al.: Mapping of EST–SSRs on Wheat Chromosomes S-11
1) matched glutenin, confi rming the known map-ping positions of the corresponding genes (Sandhu et al., 2001; Erayman et al., 2004). Th is is also in agreement with the report that the genes coding for both gliadins and glutenins occur in the gene-rich region (GRR) 1S 0.8; 48 such GRRs were reported in the wheat genome (Erayman et al., 2004). However, EST–SSR PK82 that was physically mapped to 6AS matched with a Dof DNA binding protein (a mul-tigene family encoding transcription factors), the genes for which were earlier mapped to 1BS (Gao et al., 2004) and 5A/5B (Ravel et al., 2006), so that the present study suggests an additional locus on 6AS for this gene family. Another EST–SSR mapping to Chromosome 4A matched an ice recrystallization inhibition protein, encoded by gene TaRI-1 with unknown position on the wheat genome (Tremblay et al., 2005). Th us the mapping of the SSR-contain-ing EST (SCM178) belonging to a gene coding for ice recrystallization inhibition protein on wheat Chromosome 4A is reported for the fi rst time in the present study.
EST–SSRs for Cereal BreedingEST–derived SSR markers are a novel source of
markers from the transcribed regions of the genome and increase the repertoire of perfect markers for studies related to germplasm evaluation, fi ne map-ping of genes or QTLs, marker-assisted selection in
plant breeding, and for positional cloning of genes or QTLs (Gupta and Rustgi, 2004). Th e transferability and physical mapping of rEST–SSRs to wheat will also help in further elucidating the relationships between the wheat and rye genomes and make them a valuable source for comparative genomics research. Because of their higher level of transferability, EST–SSRs may also be used for gene introgression from related wild species, which are an important source of both biotic and abiotic resistance genes.
AcknowledgmentsFinancial support for this study, provided by Department of Atomic
Energy-Board of Research in Nuclear Science (DAE-BRNS) and
Department of Biotechnology (DBT), Government of India, and the
award of SRF to RS by CSIR are gratefully acknowledged. Th e award
of a position of INSA-Senior Scientist to PKG by Indian National
Science Academy (INSA), New Delhi, is also acknowledged. Th anks
are also due to Dr. B. Hackauf for providing the primer aliquots of
rye EST–SSRs, to Dr. B. S. Gill for providing the nullitetrasomic and
ditelosomic lines, and to Dr. T. R. Endo for providing deletion lines.
ReferencesAkhunov, E.D., A.R. Akhunova, A.M. Linkiewicz, J. Dubcovsky, D. Hum-
mel, G.R. Lazo, C. Shiaoman, O.D. Anderson, J. David, L. Qi, B.
Echalier, B.S. Gill, Mift ahudin, J.P. Gustafson, M. La Rota, M.E.
Sorrells, D. Zhang, H.T. Nguyen, V. Kalavacharla, K. Hossain, S.F.
Kianian, J. Peng, N.L.V. Lapitan, E.J. Wennerlind, V. Nduati, J.A.
Anderson, D. Sidhu, K.S. Gill, P.E. McGuire, C.O. Qualset, and J.
Dvorak. 2003. Synteny perturbations between wheat homoeologous
chromosomes caused by locus duplications and deletions correlate
Figure 3. Rice chromosomes showing physical positions of SSR-containing ESTs, mapped through homology search.
Repro
duced
from
Cro
pS
cie
nce.
Publis
hed
by
Cro
pS
cie
nce
Socie
tyof
Am
erica.
All
copyrights
reserv
ed.
S-12 The Plant Genome [A Supplement to Crop Science] January 2007 No. 1
with recombination rates. Proc. Natl. Acad. Sci. USA
100:10 836–10 841.
Anderson, J.A., Y. Ogihara, M.E. Sorrells, and S.D. Tanksley. 1992.
Development of a chromosomal arm map for wheat based on
RFLP markers. Th eor. Appl. Genet. 83:1035–1043.
Cadalen, T., C. Boeuf, S. Bernard, and M. Bernard. 1997. An inter-
varietal molecular marker map in Triticum aestivum L. Em.
Th ell. and comparison with a map from wide cross. Th eor. Appl.
Genet. 94:367–377.
Endo, T.R., and B.S. Gill. 1996. Th e deletion stocks of common wheat.
J. Hered. 87:295–307.
Erayman, M., D. Sandhu, D. Sidhu, M. Dilbirligi, P.S. Baenziger, and
K.S. Gill. 2004. Demarcating the gene-rich regions of the wheat
genome. Nucleic Acids Res. 32:3546–3565.
Furuta, T., and K. Nishikawa. 1991. Variation in nuclear and indi-
vidual chromosomal DNA content and its role in evolution of
plants. p. 71–85. In P.K. Gupta and T. Tsuchiya (ed.) Chromo-
some engineering in plants: Genetics, breeding, evolution. Part
A. Elsevier, Amsterdam.
Gao, L., J. Tang, H. Li, and J. Jia. 2003. Analysis of microsatellites
in major crops assessed by computational and experimental
approaches. Mol. Breed. 12:245–261.
Gao, L.F., R.L. Jing, N.X. Huo, Y. Li, X.P. Li, R.H. Zhou, X.P. Chang,
J.F. Tang, Z.Y. Ma, and J.Z. Jia. 2004. One hundred and one
new microsatellite loci derived from ESTs (EST–SSRs) in bread
wheat. Th eor. Appl. Genet. 108:1392–1400.
Gill, B.S., B. Friebe, and T.R. Endo. 1991. Standard karyotype and
nomenclature system for description of chromosome bands and
structural aberrations in wheat (Triticum aestivum). Genome
34:830–839.
Goyal, A., R. Bandopadhyay, P. Sourdille, T.R. Endo, H.S. Balyan, and
P.K. Gupta. 2005. Physical molecular maps of wheat chromo-
somes. Funct. Integr. Genom. 5:260–263.
Gupta, P.K., H.S. Balyan, K.J. Edwards, P. Isaac, V. Korzun, M. Röder,
M.-F. Gautier, P. Joudrier, A.R. Schlatter, J. Dubcovsky, R.C.
De la Pena, M. Khairallah, G. Penner, M.J. Hayden, P. Sharp, B.
Keller, R.C.C. Wang, J.P. Hardouin, P. Jack, and P. Leroy. 2002.
Genetic mapping of 66 new microsatellite (SSR) loci in bread
wheat. Th eor. Appl. Genet. 105:413–422.
Gupta, P.K., and S. Rustgi. 2004. Molecular markers from the tran-
scribed/expressed region of the genome in higher plants. Funct.
Integr. Genom. 4:139–162.
Gupta, P.K., S. Rustgi, S. Sharma, R. Singh, N. Kumar, and H.S. Balyan.
2003. Transferable EST–SSR markers for the study of polymor-
phism and genetic diversity in bread wheat. Mol. Gen. Genom.
270:315–323.
Hackauf, B., and P. Wehling. 2002. Identifi cation of microsatellite
polymorphisms in an expressed portion of the rye genome. Plant
Breed. 121:17–25.
Khlestkina, E.K., M.H.M. Th an, E.G. Pestsova, M.S. Röder, S.V.
Malyshev, V. Korzun, and A. Börner. 2004. Mapping of 99 new
microsatellite-derived loci in rye (Secale cereale L.) including 39
expressed sequence tags. Th eor. Appl. Genet. 109:725–732.
Korzun, V., S. Malyshev, A.V. Voylokov, and A. Börner. 2001. A genetic
map of rye (Secale cereale L.) combining RFLP, isozyme, protein,
microsatellite and gene loci. Th eor. Appl. Genet. 102:709–717.
Kuleung, C., P.S. Baenziger, and I. Dweikat. 2004. Transferability of
SSR markers among wheat, rye and triticale. Th eor. Appl. Genet.
108:1147–1150.
La Rota, M., R.V. Kantety, J.-K. Yu, and M.E. Sorrells. 2005. Nonrandom
distribution and frequencies of genomic and EST–derived microsat-
ellite markers in rice, wheat, and barley. BMC Genomics 6:23–30.
La Rota, M., and M.E. Sorrells. 2004. Comparative DNA sequence analy-
sis of mapped wheat ESTs reveals the complexity of genome rela-
tionships between rice and wheat. Funct. Integr. Genom. 4:34–46.
Nelson, J.C., M.E. Sorrells, A.E. Van Deynze, Y.H. Lu, M. Atkinson, M.
Bernard, P. Leroy, J.D. Faris, and J.A. Anderson. 1995. Molecular
mapping of wheat: Major genes and rearrangements in homoeol-
ogous groups 4, 5, and 7. Genetics 141:721–731.
Nicot, N., V. Chiquet, B. Gandon, L. Amilhat, F. Legeai, P. Leroy, M.
Bernard, and P. Sourdille. 2004. Study of simple sequence repeat
(SSR) markers from wheat expressed sequence tags (ESTs).
Th eor. Appl. Genet. 109:800–805.
Paillard, S., T. Schnurbusch, M. Winzeler, M. Messmer, P. Sourdille, O.
Abderhalden, B. Keller, and G. Schachermayr. 2003. An integra-
tive genetic linkage map of winter wheat (Triticum aestivum L.).
Th eor. Appl. Genet. 107:1235–1242.
Payne, P.I. 1987. Genetics of wheat storage proteins and the eff ect
of allelic variation on bread-making quality. Annu. Rev. Plant
Physiol. 38:141–153.
Payne, P.I., L.M. Holt, E.A. Jackson, and C.N. Law. 1984. Wheat stor-
age proteins: Th eir genetics and their potential for manipula-
tion by plant breeding. Philos. Trans. R. Soc. Lond. B Biol. Sci.
304:359–371.
Peng, J.H., and N.L.V. Lapitan. 2005. Characterization of EST–derived
microsatellites in the wheat genome and development of eSSR
markers. Funct. Integr. Genom. 5:80–96.
Prasad, M., R.K. Varshney, J.K. Roy, H.S. Balyan, and P.K. Gupta. 2000.
Th e use of microsatellites for detecting DNA polymorphism,
genotype identifi cation and genetic diversity in wheat. Th eor.
Appl. Genet. 100:584–592.
Qi, L.L., B. Echalier, S. Chao, G.R. Lazo, G.E. Butler, O.D. Anderson,
E.D. Akhunov, J. Dvorak, A.M. Linkiewicz, A. Ratnasiri, J.
Dubcovsky, C.E. Bermudez-Kandianis, R.A. Greene, R. Kantety,
C.M. La Rota, J.D. Munkvold, S.F. Sorrells, M.E. Sorrells, M.
Dilbirligi, D. Sidhu, M. Erayman, H.S. Randhawa, D. Sandhu,
S.N. Bondareva, K.S. Gill, A.A. Mahmoud, X.-F. Ma, Mift ahudin,
J.P. Gustafson, E.J. Conley, V. Nduati, J.L. Gonzalez-Hernan-
dez, J.A. Anderson, J.H. Peng, N.L.V. Lapitan, K.G. Hossain,
V. Kalavacharla, S.F. Kianian, M.S. Pathan, D.S. Zhang, H.T.
Nguyen, D.-W. Choi, R.D. Fenton, T.J. Close, P.E. McGuire, C.O.
Qualset, and B.S. Gill. 2004. A chromosome bin map of 16,000
expressed sequence tag loci and distribution of genes among the
three genomes of polyploidy wheat. Genetics 168:701–712.
Qi, L., B. Echalier, B. Friebe, and B.S. Gill. 2003. Molecular character-
ization of a set of wheat deletion stocks for use in chromosome
bin mapping of ESTs. Funct. Integr. Genom. 3:39–55.
Ravel, C., I.J. Nagy, P. Martre, P. Sourdille, M. Dardevet, F. Balfourier,
C. Pont, S. Giancola, S. Praud, and G. Charmet. 2006. Single
nucleotide polymorphism, genetic mapping, and expression of
genes coding for the DOF wheat prolamin-box binding factor.
Funct. Integr. Genomics doi10.1007/s10142-006-0022-7.
Sandhu, D., J.A. Champoux, S.N. Bondareva, and K.S. Gill. 2001. Iden-
tifi cation and physical localization of useful genes and markers
to a major gene-rich region on wheat group 1S chromosomes.
Genetics 157:1735–1747.
Sears, E.R. 1954. Th e aneuploids of common wheat. Missouri Agric.
Exp. Stn. Res. Bull. 572:1–59.
Sears, E.R. 1966. Nullisomic-tetrasomic combinations in hexaploid wheat.
p. 29–45. In R. Rilly and K.R. Lewis (ed.) Chromosome manipula-
tions and plant genetics. Oliver and Boyd, Edinburgh, U.K.
Sears, E.R., and L.S. Sears. 1978. Th e telocentric chromosomes of
common wheat. p. 389–407. In S. Ramanujam (ed.) Proc. 5th
Int. Wheat Genetics Symp. Indian Society of Genetics and Plant
Breeding, New Delhi.
Song, Q.J., J.R. Shi, S. Singh, E.W. Fickus, J.M. Costa, J. Lewis, B.S. Gill, R.
Ward, and P.B. Cregan. 2005. Development and mapping of micro-
satellite (SSR) markers in wheat. Th eor. Appl. Genet. 110:550–560.
Sorrells, M.E., M. La Rota, C.E. Bermudez-Kandianis, R.A. Greene,
R. Kantety, J.D. Munkvold, Mift ahudin, A. Mahmoud, X. Ma,
Repro
duced
from
Cro
pS
cie
nce.
Publis
hed
by
Cro
pS
cie
nce
Socie
tyof
Am
erica.
All
copyrights
reserv
ed.
Mohan et al.: Mapping of EST–SSRs on Wheat Chromosomes S-13
P.J. Gustafson, L.L. Qi, B. Echalier, B.S. Gill, D.E. Matthews, G.R.
Lazo, S. Chao, O.D. Anderson, H. Edwards, A.M. Linkiewicz, J.
Dubcovsky, E.D. Akhunov, J. Dvorak, D. Zhang, H.T. Nguyen, J.
Peng, N.L.V. Lapitan, J.L. Gonzalez-Hernandez, J.A. Anderson,
K. Hossain, V. Kalavacharla, S.F. Kianian, D.-W. Choi, T.J. Close,
M. Dilbirligi, K.S. Gill, C. Steber, M.K. Walker-Simmons, P.E.
McGuire, and C.O. Qualset. 2003. Comparative DNA sequence
analysis of wheat and rice genomes. Genome Res. 13:1818–1827.
Tegelström, H. 1992. Detection of mitochondrial DNA fragments. p.
89–114. In R. Hoelzel (ed.) Th e molecular analysis of popula-
tions: A practical approach. IRL Books, Oxford Univ. Press.
Torada, A., M. Koike, K. Mochida, and Y. Ogihara. 2006. SSR-based
linkage map with new markers using an intraspecifi c population
of common wheat. Th eor. Appl. Genet. 112:1042–1051.
Tremblay, K., F. Ouellet, J. Fournier, J. Danyluk, and F. Sarhan. 2005.
Molecular characterization and origin of novel bipartite cold-
regulated ice recrystallization inhibition proteins from cereals.
Plant Cell Physiol. 46:884–891.
Yu, J.-K., M. La Rota, R.V. Kantety, and M.E. Sorrells. 2004. EST
derived SSR markers for comparative mapping in wheat and rice.
Mol. Genet. Genom. 271:742–751.
Zhang, L.Y., M. Bernard, P. Leroy, C. Feuillet, and P. Sourdille. 2005.
High transferability of bread wheat EST–derived SSRs to other
cereals. Th eor. Appl. Genet. 111:677–687.