Quantitative evaluation of wheat against volunteer rye in Iran
10
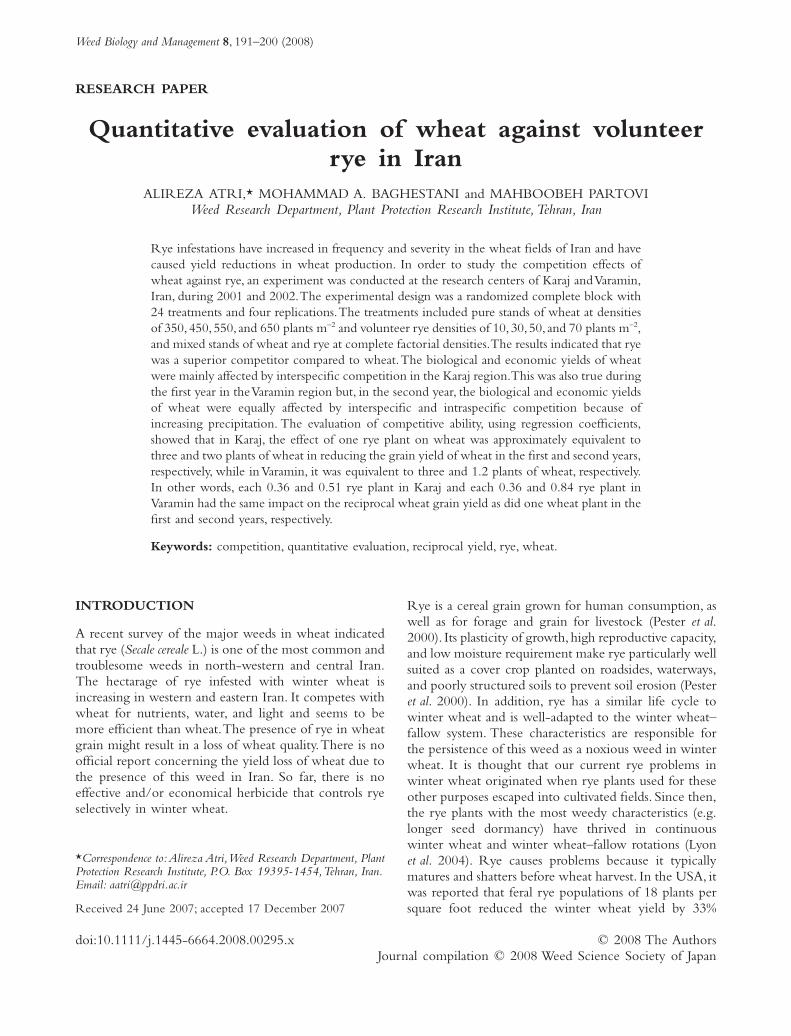
RESEARCH PAPER Quantitative evaluation of wheat against volunteer rye in Iran ALIREZA ATRI,* MOHAMMAD A. BAGHESTANI and MAHBOOBEH PARTOVI Weed Research Department, Plant Protection Research Institute,Tehran, Iran Rye infestations have increased in frequency and severity in the wheat fields of Iran and have caused yield reductions in wheat production. In order to study the competition effects of wheat against rye, an experiment was conducted at the research centers of Karaj andVaramin, Iran, during 2001 and 2002.The experimental design was a randomized complete block with 24 treatments and four replications.The treatments included pure stands of wheat at densities of 350, 450, 550, and 650 plants m -2 and volunteer rye densities of 10, 30, 50, and 70 plants m -2 , and mixed stands of wheat and rye at complete factorial densities.The results indicated that rye was a superior competitor compared to wheat.The biological and economic yields of wheat were mainly affected by interspecific competition in the Karaj region.This was also true during the first year in theVaramin region but, in the second year, the biological and economic yields of wheat were equally affected by interspecific and intraspecific competition because of increasing precipitation.The evaluation of competitive ability, using regression coefficients, showed that in Karaj,the effect of one rye plant on wheat was approximately equivalent to three and two plants of wheat in reducing the grain yield of wheat in the first and second years, respectively, while inVaramin, it was equivalent to three and 1.2 plants of wheat, respectively. In other words, each 0.36 and 0.51 rye plant in Karaj and each 0.36 and 0.84 rye plant in Varamin had the same impact on the reciprocal wheat grain yield as did one wheat plant in the first and second years, respectively. Keywords: competition, quantitative evaluation, reciprocal yield, rye, wheat. INTRODUCTION A recent survey of the major weeds in wheat indicated that rye (Secale cereale L.) is one of the most common and troublesome weeds in north-western and central Iran. The hectarage of rye infested with winter wheat is increasing in western and eastern Iran. It competes with wheat for nutrients, water, and light and seems to be more efficient than wheat.The presence of rye in wheat grain might result in a loss of wheat quality.There is no official report concerning the yield loss of wheat due to the presence of this weed in Iran. So far, there is no effective and/or economical herbicide that controls rye selectively in winter wheat. Rye is a cereal grain grown for human consumption, as well as for forage and grain for livestock (Pester et al. 2000).Its plasticity of growth,high reproductive capacity, and low moisture requirement make rye particularly well suited as a cover crop planted on roadsides, waterways, and poorly structured soils to prevent soil erosion (Pester et al. 2000). In addition, rye has a similar life cycle to winter wheat and is well-adapted to the winter wheat– fallow system. These characteristics are responsible for the persistence of this weed as a noxious weed in winter wheat. It is thought that our current rye problems in winter wheat originated when rye plants used for these other purposes escaped into cultivated fields. Since then, the rye plants with the most weedy characteristics (e.g. longer seed dormancy) have thrived in continuous winter wheat and winter wheat–fallow rotations (Lyon et al. 2004). Rye causes problems because it typically matures and shatters before wheat harvest. In the USA, it was reported that feral rye populations of 18 plants per square foot reduced the winter wheat yield by 33% *Correspondence to: Alireza Atri,Weed Research Department, Plant Protection Research Institute, P.O. Box 19395-1454,Tehran, Iran. Email: [email protected] Received 24 June 2007; accepted 17 December 2007 Weed Biology and Management 8, 191–200 (2008) © 2008 The Authors Journal compilation © 2008 Weed Science Society of Japan doi:10.1111/j.1445-6664.2008.00295.x
Transcript of Quantitative evaluation of wheat against volunteer rye in Iran
RESEARCH PAPER
Quantitative evaluation of wheat against volunteerrye in Iran
ALIREZA ATRI,* MOHAMMAD A. BAGHESTANI and MAHBOOBEH PARTOVIWeed Research Department, Plant Protection Research Institute, Tehran, Iran
Rye infestations have increased in frequency and severity in the wheat fields of Iran and havecaused yield reductions in wheat production. In order to study the competition effects ofwheat against rye, an experiment was conducted at the research centers of Karaj andVaramin,Iran, during 2001 and 2002.The experimental design was a randomized complete block with24 treatments and four replications.The treatments included pure stands of wheat at densitiesof 350, 450, 550, and 650 plants m-2 and volunteer rye densities of 10, 30, 50, and 70 plants m-2,and mixed stands of wheat and rye at complete factorial densities.The results indicated that ryewas a superior competitor compared to wheat.The biological and economic yields of wheatwere mainly affected by interspecific competition in the Karaj region.This was also true duringthe first year in theVaramin region but, in the second year, the biological and economic yieldsof wheat were equally affected by interspecific and intraspecific competition because ofincreasing precipitation. The evaluation of competitive ability, using regression coefficients,showed that in Karaj, the effect of one rye plant on wheat was approximately equivalent tothree and two plants of wheat in reducing the grain yield of wheat in the first and second years,respectively, while in Varamin, it was equivalent to three and 1.2 plants of wheat, respectively.In other words, each 0.36 and 0.51 rye plant in Karaj and each 0.36 and 0.84 rye plant inVaramin had the same impact on the reciprocal wheat grain yield as did one wheat plant in thefirst and second years, respectively.
Keywords: competition, quantitative evaluation, reciprocal yield, rye, wheat.
INTRODUCTION
A recent survey of the major weeds in wheat indicatedthat rye (Secale cereale L.) is one of the most common andtroublesome weeds in north-western and central Iran.The hectarage of rye infested with winter wheat isincreasing in western and eastern Iran. It competes withwheat for nutrients, water, and light and seems to bemore efficient than wheat.The presence of rye in wheatgrain might result in a loss of wheat quality.There is noofficial report concerning the yield loss of wheat due tothe presence of this weed in Iran. So far, there is noeffective and/or economical herbicide that controls ryeselectively in winter wheat.
Rye is a cereal grain grown for human consumption, aswell as for forage and grain for livestock (Pester et al.2000). Its plasticity of growth,high reproductive capacity,and low moisture requirement make rye particularly wellsuited as a cover crop planted on roadsides, waterways,and poorly structured soils to prevent soil erosion (Pesteret al. 2000). In addition, rye has a similar life cycle towinter wheat and is well-adapted to the winter wheat–fallow system. These characteristics are responsible forthe persistence of this weed as a noxious weed in winterwheat. It is thought that our current rye problems inwinter wheat originated when rye plants used for theseother purposes escaped into cultivated fields. Since then,the rye plants with the most weedy characteristics (e.g.longer seed dormancy) have thrived in continuouswinter wheat and winter wheat–fallow rotations (Lyonet al. 2004). Rye causes problems because it typicallymatures and shatters before wheat harvest. In the USA, itwas reported that feral rye populations of 18 plants persquare foot reduced the winter wheat yield by 33%
*Correspondence to:Alireza Atri,Weed Research Department, PlantProtection Research Institute, P.O. Box 19395-1454,Tehran, Iran.Email: [email protected]
Received 24 June 2007; accepted 17 December 2007
Weed Biology and Management 8, 191–200 (2008)
© 2008 The AuthorsJournal compilation © 2008 Weed Science Society of Japan
doi:10.1111/j.1445-6664.2008.00295.x
when removed in February and by 69% when allowed toremain until harvest in July (Lyon et al. 2004). In north-eastern Colorado, winter wheat yields were reduced by14% with feral rye populations as low as five plants persquare foot (Lyon et al. 2004).A single plant of this weedproduces 500–800 seeds; thus, even a low population ofthis weed in the crop dramatically increases the soil seedbank and causes a severe yield loss in wheat fields(Anderson 2004). Feral rye reduced the wheat yield byas much as 92% and represented �73% contaminationin harvested wheat (Stump & Westra 2000). Recentresearch on the longevity of rye seeds in the soil found<20% of feral rye seeds were still alive 1 year after depo-sition into the soil, with <5% of seeds being viable after2 years (Lyon et al. 2004).
Preventative methods are a critical part of an integratedweed management control system for feral rye. Elimi-nating the potential seed sources for rye establishment isa top priority. Planting clean seeds, destroying any feralrye before it produces seeds, and thoroughly cleaningcombines before moving between fields can eliminatethe seed sources. Feral rye is best controlled in winterwheat rotations that include late spring-planted crops,such as corn, grain sorghum, sunflower, or proso millet(Lyon et al. 2004). If a crop rotation is planned with latespring-planted crops following winter wheat, feral ryeusually will not be a problem unless it is not controlledprior to planting the late spring-planted crop and/orduring the following fallow period. With late spring-planted crops, tillage and/or herbicides can be used tocontrol feral rye before planting. Manual weeding is acommon practise for rye control in winter wheat in Iran.Cultural practises, such as an increased planting density,delayed planting date, and nitrogen placement within thesoil profile have been used to reduce competitive effectson the crop (Pester et al. 2000).Although other research-ers have identified rye as a serious weed problem inwinter wheat, there is some limited information con-cerning rye competition with winter wheat and its effecton wheat production economics (Pester et al. 2000).Theobjective of this paper is to evaluate and quantify thecompetition between rye and winter wheat.
MATERIALS AND METHODS
The study was conducted atVaramin and Karaj ResearchStations during 2001 and 2002.The soil was sandy clayloam with a pH of 6.5 and 0.5% organic matter. Theexperimental design was a randomized complete blockdesign with four replications. The interaction betweenwheat and rye was assessed using a bivariate factorialdesign (Snaydon 1991). The treatments included pure
stands of wheat (cv. Mahdavi; Ministry of Agriculture,Karaj, Iran) at densities of 350, 450, 550, and650 plant m-2 and volunteer rye densities of 10, 30, 50,and 70 plant m-2 and all combinations of densitiesbetween the two competing plants consisted of 350:10,350:30, 350:50, 350:70, 450:10, 450:30, 450:50, 450:70,550:10, 550:30, 550:50, 550:70, 650:10, 650:30, 650:50,and 650:70 (wheat : rye densities m-2).All of the weeds,except rye, were controlled by manual weeding. Thetarget rye densities were attained by manual seedingusing the weight of 1000 grains and the percentage ofgermination and vitality of the seeds.The rye seed wasobtained from naturally occurring weedy populations inwinter wheat fields. The plots consisted of four rows,4.2 m long and 60 cm apart, in both years of the experi-ment. The plot width encompassed four 60 cm wideraised beds separated by furrows.The harvesting area wasconfined to the middle of each plot and a 30 cm bufferwas not harvested at each end. There were two borderrows on each side of the plots.The data were collectedfrom the center of each plot. Furrow irrigation wassupplied throughout the growing season between thebeds on a schedule adequate to provide normal cropgrowth.All fertilizer treatments were broadcast when thefield was mowed, in accordance with soil test recom-mendations for grain yields of 6000 kg ha-1.The winterwheat grain yields were determined by manually har-vesting all the plants within a 2 m2 quadrat.The biomassand grain data were analyzed using the reciprocal yieldmodel (Wright 1981; Spitters 1983) of the form:
W a b N b Nw w ww w wr r− = + +1
0 (1)
and
W b N b Nr r rr r rw w− = + +1
0a , (2)
where Ww-1 and Wr
-1 are the reciprocal of the averageyield per plant yields (g plant-1) for wheat and rye,respectively, and Nw and Nr are the density of wheat andrye per unit area, respectively.The intercepts, aw0 and ar0,estimate the reciprocal of the virtual maximum yield ofisolated individual plants for wheat and rye, respectively.The parameters, bww and brr, measure the intraspecificcompetition between the plants, while the interspecificcompetition is estimated by bwr and brw.The parameters’values can be used to drive the indices for the relativecompetitive ability of the weeds by dividing the intraspe-cific competition by the interspecific competition (bww/bwr). If the ratio exceeds unity, it means that theintraspecific competition between the plants is morethan the interspecific competition.
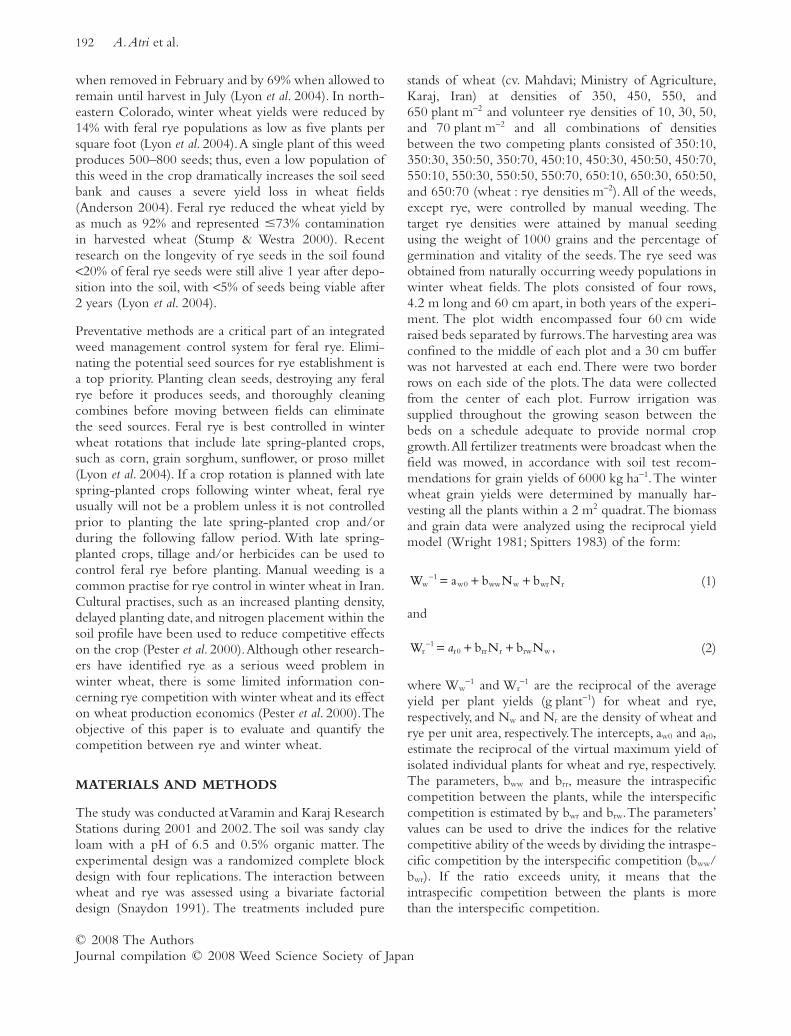
192 A.Atri et al.
© 2008 The AuthorsJournal compilation © 2008 Weed Science Society of Japan
Tab
le1.
Res
ults
ofth
eec
onom
ican
dbi
olog
ical
indi
vidu
alpl
ant
yiel
dof
whe
at,u
sing
the
reci
proc
alyi
eld
mod
el†
inth
eVa
ram
inre
gion
Dep
ende
ntva
riab
le(w
-1)
Inve
rse
max
imum
plan
tw
eigh
tin
no-c
ompe
titio
nsit
uatio
n(a
10)
Intr
aspe
cific
com
petit
ion
(b11
)(m
2 /g.
n)
Inte
rspe
cific
com
petit
ion
(b12
)(m
2 /g.
n)
Max
imum
plan
tw
eigh
tin
no-c
ompe
titio
nsit
uatio
n(a
10-1
)
Rel
ativ
eco
mpe
titiv
eab
ility
(b11
/b12
)
1st
year
2nd
year
1st
year
2nd
year
1st
year
2nd
year
1st
year
2nd
year
1st
year
2nd
year
Rec
ipro
cal
indi
vidu
alpl
ant
wei
ght
ofth
eec
onom
icyi
eld
0.06
73‡
(0.0
527)
§0.
3064
**(0
.068
8)0.
0016
0**
(0.0
0001
)0.
0009
**(0
.000
1)0.
0044
*(0
.000
4)0.
0010
§(0
.000
6)14
.86
3.26
0.36
0.9
Rec
ipro
cal
indi
vidu
alpl
ant
wei
ght
ofth
ebi
olog
ical
yiel
d
0.11
81**
(0.0
137)
0.09
77**
(0.0
256)
0.00
060*
*(0
.000
01)
0.00
04**
(0.0
001)
0.00
15**
(0.0
001)
0.00
04§
(0.0
002)
8.47
10.2
40.
401.
0
†W
w-1
=a 1
0+
b 11N
w+
b 12N
r;‡
not
signi
fican
t;§
the
valu
esin
pare
nthe
ses
indi
cate
the
stan
dard
erro
rof
the
mea
n;*
and
**,a
signi
fican
tdi
ffere
nce
at5%
and
1%pr
obab
ility
,res
pect
ivel
y.g.
n,gr
am.n
umbe
r.
Tab
le2.
Res
ults
ofth
eec
onom
ican
dbi
olog
ical
indi
vidu
alpl
ant
yiel
dof
whe
at,u
sing
the
reci
proc
alyi
eld
mod
el†
inth
eK
araj
regi
on
Dep
ende
ntva
riab
le(w
–1)
Inve
rse
max
imum
plan
tw
eigh
tin
no-c
ompe
titio
nsit
uatio
n(a
10)
Intr
aspe
cific
com
petit
ion
(b11
)(m
2 /g.
n)
Inte
rspe
cific
com
petit
ion
(b12
)(m
2 /g.
n)
Max
imum
plan
tw
eigh
tin
no-c
ompe
titio
nsit
uatio
n(a
10–1
)
Rel
ativ
eco
mpe
titiv
eab
ility
(b11
/b12
)
1st
year
2nd
year
1st
year
2nd
year
1st
year
2nd
year
1st
year
2nd
year
1st
year
2nd
year
Rec
ipro
cal
indi
vidu
alpl
ant
wei
ght
ofth
eec
onom
icyi
eld
0.20
47*
-0.2
566§
0.00
31**
0.00
34**
0.00
86**
0.00
67**
4.89
–0.
360.
51(0
.094
2)‡
(0.1
603)
(0.0
002)
(0.0
003)
(0.0
008)
(0.0
013)
Rec
ipro
cal
indi
vidu
alpl
ant
wei
ght
ofth
ebi
olog
ical
yiel
d
0.06
16§
0.05
61§
0.00
14**
0.00
11**
0.00
33**
0.00
19**
16.2
317
.80.
420.
58(0
.034
3)(0
.072
3)(0
.000
1)(0
.000
1)(0
.000
3)(0
.000
6)
†W
w-1
=a 1
0+
b 11N
w+
b 12
Nr;
‡th
eva
lues
inpa
rent
hese
sin
dica
teth
est
anda
rder
ror
ofth
em
ean;
§no
tsig
nific
ant;
*an
d**
,asig
nific
ant
diffe
renc
eat
5%an
d1%
prob
abili
ty,r
espe
ctiv
ely.
g.n,
gram
.num
ber.
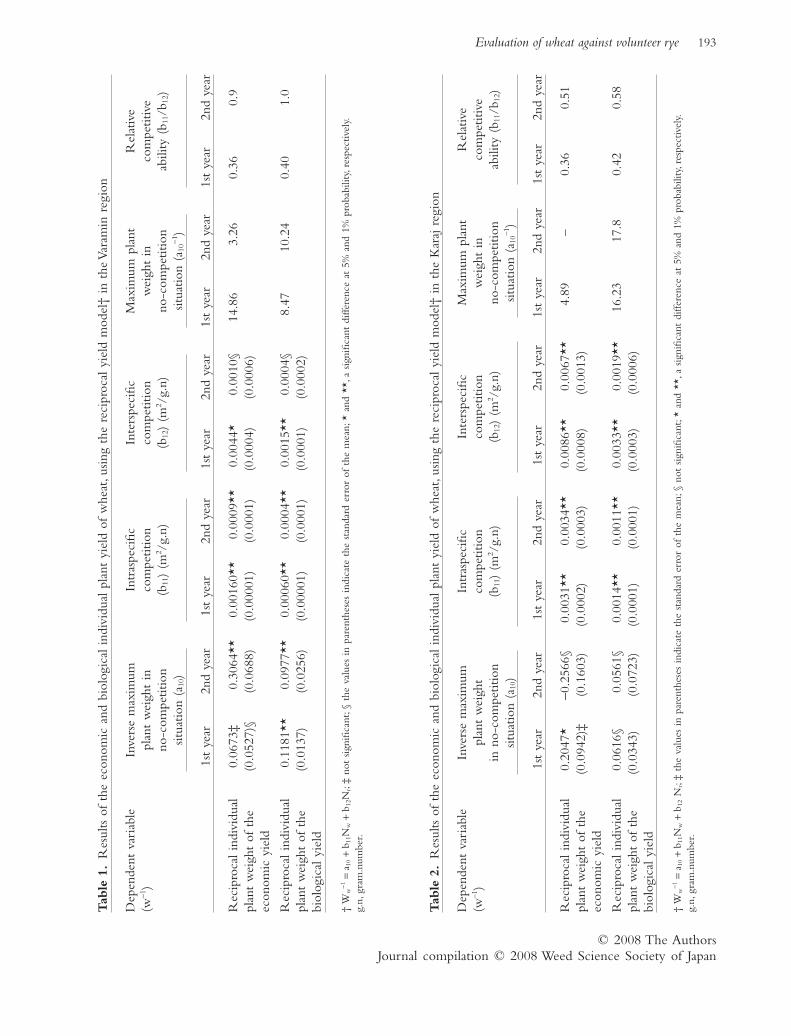
Evaluation of wheat against volunteer rye 193
© 2008 The AuthorsJournal compilation © 2008 Weed Science Society of Japan
RESULTS AND DISCUSSION
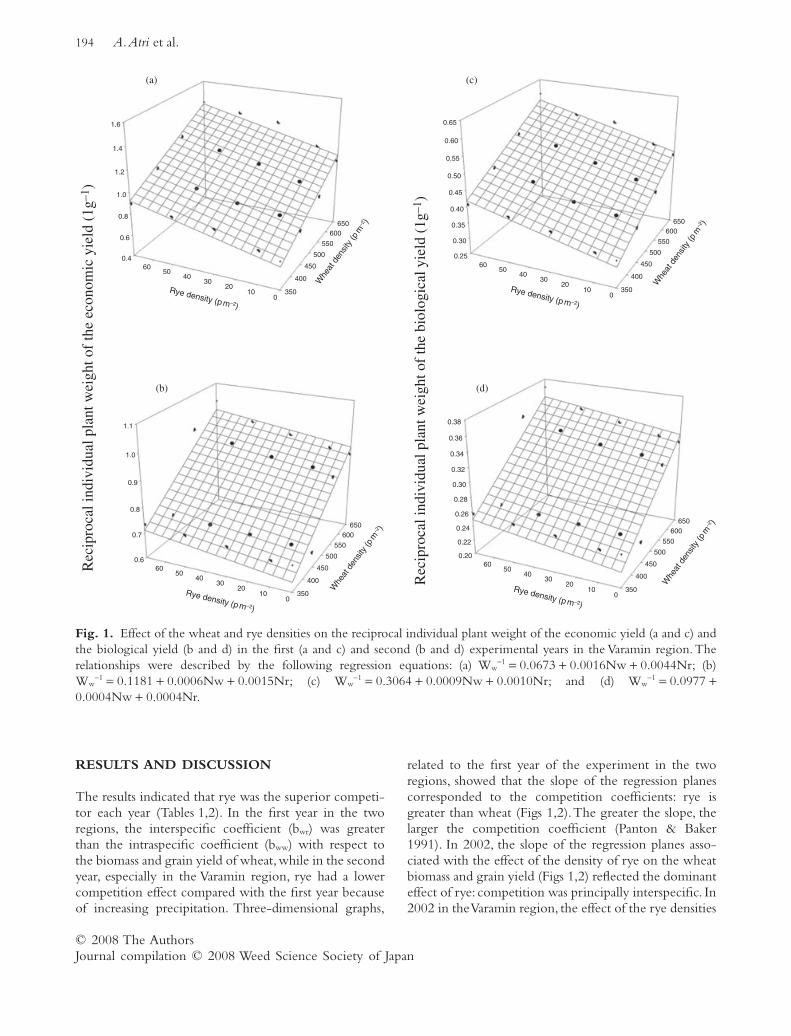
The results indicated that rye was the superior competi-tor each year (Tables 1,2). In the first year in the tworegions, the interspecific coefficient (bwr) was greaterthan the intraspecific coefficient (bww) with respect tothe biomass and grain yield of wheat,while in the secondyear, especially in the Varamin region, rye had a lowercompetition effect compared with the first year becauseof increasing precipitation. Three-dimensional graphs,
related to the first year of the experiment in the tworegions, showed that the slope of the regression planescorresponded to the competition coefficients: rye isgreater than wheat (Figs 1,2).The greater the slope, thelarger the competition coefficient (Panton & Baker1991). In 2002, the slope of the regression planes asso-ciated with the effect of the density of rye on the wheatbiomass and grain yield (Figs 1,2) reflected the dominanteffect of rye: competition was principally interspecific. In2002 in theVaramin region, the effect of the rye densities
Rec
ipro
cal i
ndiv
idua
l pla
nt w
eigh
t of
the
econ
omic
yie
ld (
1g–1
)
Rec
ipro
cal i
ndiv
idua
l pla
nt w
eigh
t of
the
biol
ogic
al y
ield
(1g
–1)
0.25
0.30
0.35
0.40
0.45
0.50
0.55
0.60
0.65
350
400
450
500
550
600650
010
2030
4050
60
0.20
0.22
0.24
0.26
0.28
0.30
0.32
0.34
0.36
0.38
350
400
450
500
550
600650
010
2030
4050
60
0.4
0.6
0.8
1.0
1.2
1.4
1.6
350
400
450
500
550
600650
010
2030
4050
60
Whe
at d
ensit
y (p
m–2 )
Whe
at d
ensit
y (p
m–2 )
Rye density (p m–2)
Whe
at d
ensit
y (p
m–2 )
Rye density (p m–2)
Whe
at d
ensit
y (p
m–2 )
Rye density (p m–2)
Rye density (p m–2)
0.6
0.7
0.8
0.9
1.0
1.1
350
400
450
500
550
600650
010
2030
4050
60
(a) (c)
(b) (d)
Fig. 1. Effect of the wheat and rye densities on the reciprocal individual plant weight of the economic yield (a and c) andthe biological yield (b and d) in the first (a and c) and second (b and d) experimental years in the Varamin region.Therelationships were described by the following regression equations: (a) Ww
-1 = 0.0673 + 0.0016Nw + 0.0044Nr; (b)Ww
-1 = 0.1181 + 0.0006Nw + 0.0015Nr; (c) Ww-1 = 0.3064 + 0.0009Nw + 0.0010Nr; and (d) Ww
-1 = 0.0977 +0.0004Nw + 0.0004Nr.
194 A.Atri et al.
© 2008 The AuthorsJournal compilation © 2008 Weed Science Society of Japan
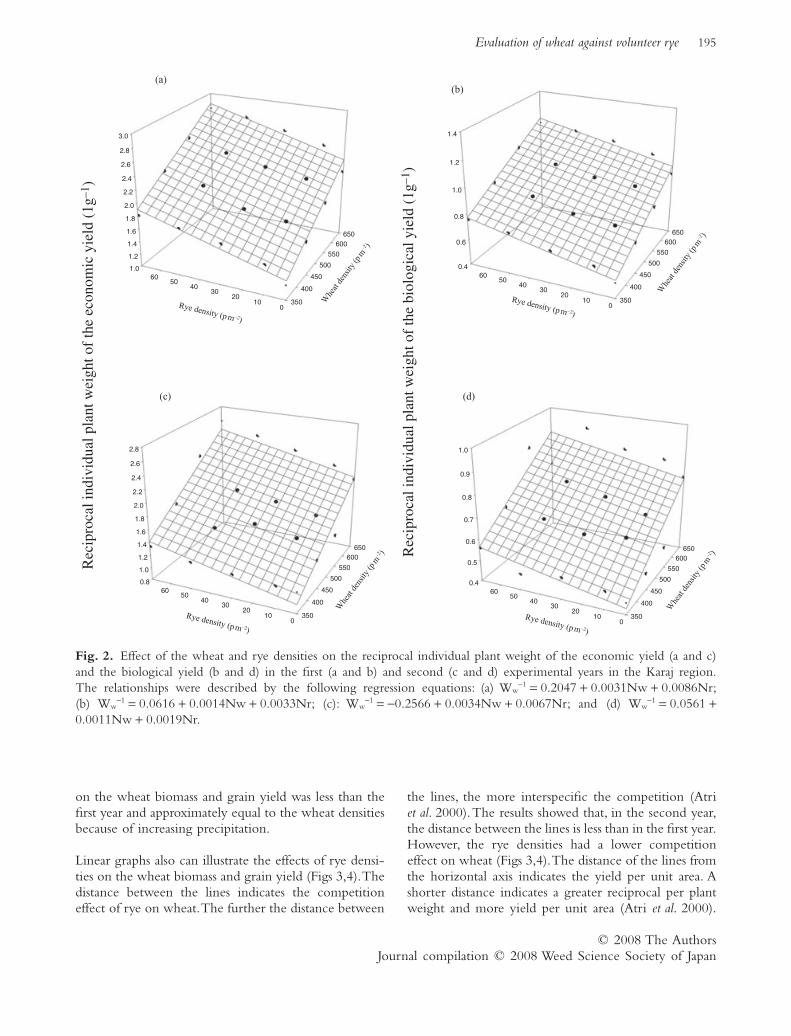
on the wheat biomass and grain yield was less than thefirst year and approximately equal to the wheat densitiesbecause of increasing precipitation.
Linear graphs also can illustrate the effects of rye densi-ties on the wheat biomass and grain yield (Figs 3,4).Thedistance between the lines indicates the competitioneffect of rye on wheat.The further the distance between
the lines, the more interspecific the competition (Atriet al. 2000).The results showed that, in the second year,the distance between the lines is less than in the first year.However, the rye densities had a lower competitioneffect on wheat (Figs 3,4).The distance of the lines fromthe horizontal axis indicates the yield per unit area. Ashorter distance indicates a greater reciprocal per plantweight and more yield per unit area (Atri et al. 2000).
1.0
1.2
1.4
1.6
1.8
2.0
2.2
2.4
2.6
2.8
3.0
350
400
450
500
550
600650
010
2030
4050
60
0.4
0.6
0.8
1.0
1.2
1.4
350
400
450
500
550
600650
010
2030
4050
60
0.8
1.0
1.2
1.4
1.6
1.8
2.0
2.2
2.4
2.6
2.8
350
400
450
500
550
600650
010
2030
4050
600.4
0.5
0.6
0.7
0.8
0.9
1.0
350
400
450
500
550
600650
010
2030
4050
60
(a)(b)
(c) (d)
Whe
at d
ensit
y (p
m–2 )
Whe
at d
ensit
y (p
m–2 )
Rye density (p m–2)
Rye density (p m–2)
Whe
at d
ensit
y (p
m–2 )
Rye density (p m–2)
Whe
at d
ensit
y (p
m–2 )
Rye density (p m–2)
Rec
ipro
cal i
ndiv
idua
l pla
nt w
eigh
t of
the
econ
omic
yie
ld (
1g–1
)
Rec
ipro
cal i
ndiv
idua
l pla
nt w
eigh
t of
the
biol
ogic
al y
ield
(1g
–1)
Fig. 2. Effect of the wheat and rye densities on the reciprocal individual plant weight of the economic yield (a and c)and the biological yield (b and d) in the first (a and b) and second (c and d) experimental years in the Karaj region.The relationships were described by the following regression equations: (a) Ww
-1 = 0.2047 + 0.0031Nw + 0.0086Nr;(b) Ww
-1 = 0.0616 + 0.0014Nw + 0.0033Nr; (c): Ww-1 = -0.2566 + 0.0034Nw + 0.0067Nr; and (d) Ww
-1 = 0.0561 +0.0011Nw + 0.0019Nr.
Evaluation of wheat against volunteer rye 195
© 2008 The AuthorsJournal compilation © 2008 Weed Science Society of Japan

0.0
0.5
1.0
1.5
2.0
2.5
3.0
350 650550450
(d)
Rec
ipro
cal i
ndiv
idua
l pla
nt w
eigh
t of t
he e
cono
mic
yie
ld (
1 g–1
)
0.0
0.5
1.0
1.5
2.0
2.5
3.0
350 650550450
(c)
Rec
ipro
cal i
ndiv
idua
l pla
nt w
eigh
t of t
he e
cono
mic
yie
ld (
1 g–1
)
Wheat density (m2) Wheat density (m2)
0.0
0.2
0.4
0.6
0.8
1.0
1.2
1.4
1.6
350 650550450
(b)
Rec
ipro
cal i
ndiv
idua
l pla
nt w
eigh
t of t
he e
cono
mic
yie
ld (
1 g–1
)
Wheat density (m2)
0.0
0.2
0.4
0.6
0.8
1.0
1.2
1.4
1.6
350 650550450
(a)
Rec
ipro
cal i
ndiv
idua
l pla
nt w
eigh
t of t
he e
cono
mic
yie
ld (
1 g–1
)
Wheat density (m2)
Fig. 3. Reciprocal individual weight of the economic yield of wheat atVaramin (a and b) and Karaj (c and d) in differentdensities of rye in 2000 and 2001, respectively. (�), 0 plants m-2; (�), 10 plants m-2; (�), 30 plants m-2; (�), 50 plants m-2;(�), 70 plants m-2.
196 A.Atri et al.
© 2008 The AuthorsJournal compilation © 2008 Weed Science Society of Japan

350
0.0
0.2
0.4
0.6
0.8
1.0
1.2
1.4
650550450
(c)
Rec
ipro
cal i
ndiv
idua
l pla
nt w
eigh
t of t
he b
iolo
gica
l yie
ld (1
g–1
)
Wheat density (m2)
0.0
0.2
0.4
0.6
0.8
1.0
1.2
1.4
350 650550450
(d)
Rec
ipro
cal i
ndiv
idua
l pla
nt w
eigh
t of t
he b
iolo
gica
l yie
ld (1
g–1
)
Wheat density (m2)
0.0
0.1
0.2
0.3
0.4
0.5
0.6
0.7
350 650550450
(b)
Rec
ipro
cal i
ndiv
idua
l pla
nt w
eigh
t of t
he b
iolo
gica
l yie
ld (1
g–1
) Wheat density (m2)
0.0
0.1
0.2
0.3
0.4
0.5
0.6
0.7
350 650550450
(a)R
ecip
roca
l ind
ivid
ual p
lant
wei
ght o
f the
bio
logi
cal y
ield
(1 g
–1)
Wheat density (m2)
Fig. 4. Reciprocal individual weight of the biological yield of wheat atVaramin (a and b) and Karaj (c and d) in differentdensities of rye in 2000 and 2001, respectively. (�), 0 plants m-2; (�), 10 plants m-2; (�), 30 plants m-2; (�), 50 plants m-2;(�), 70 plants m-2.
Evaluation of wheat against volunteer rye 197
© 2008 The AuthorsJournal compilation © 2008 Weed Science Society of Japan
The intercept predicted the reciprocal of the virtualmaximum yield of isolated individual plants (Spitters1983; Kropff & Lotz 1993).Therefore, a smaller interceptindicates a larger potential maximum yield per plant.Intercept values significantly different from zero wereobtained during 2001 in Karaj for the grain yield onlyand in 2002 inVaramin for the wheat biomass and grainyield (Tables 1,2).
No significant negative intercept was measured during2002 for the wheat grain yield in Karaj (Table 2).A zeroor negative intercept is biologically irrational and canprobably be attributed to random error (Panton & Baker1991). Other researchers have reported insignificantnegative intercepts, which were probably the result ofattempting to estimate values outside the range of den-sities on the regression equation (Rejmanek et al. 1989;Roush et al. 1989; Panton & Baker 1991).The evaluationof competitive ability, using regression coefficients,showed that the effect of one rye plant during 2001 and2002 in Karaj was approximately equivalent to three andtwo wheat plants in reducing the grain yield of wheatand 2.35 and 1.7 wheat plants in reducing the biomassyield of wheat, respectively. This means that each 0.36and 0.51 rye plant had the same impact on the reciprocalwheat grain yield and each 0.42 and 0.58 rye plant hadthe same impact on the reciprocal wheat biomass yield asdid one wheat plant (Table 2). InVaramin, the competi-tive ability of rye for the wheat grain yield during 2001and 2002 was 3.0 and 1.1 wheat plants and, for the wheatbiomass yield, it was 2.5 and 1.0 wheat plant, respectively,indicating that each 0.36 and 0.84 rye plant had the
equivalent effect on the grain yield of wheat and each0.4 and 1.0 rye plant had the equivalent effect on thebiomass yield of wheat as did one wheat plant (Table 1).This difference was related to higher precipitation in2002. Some researchers have reported that rye has ahigher tolerance to drought compared to wheat (Barnes& Putnam 1987), which might be why the competitiveability of rye was greater in the first year than in thesecond year.
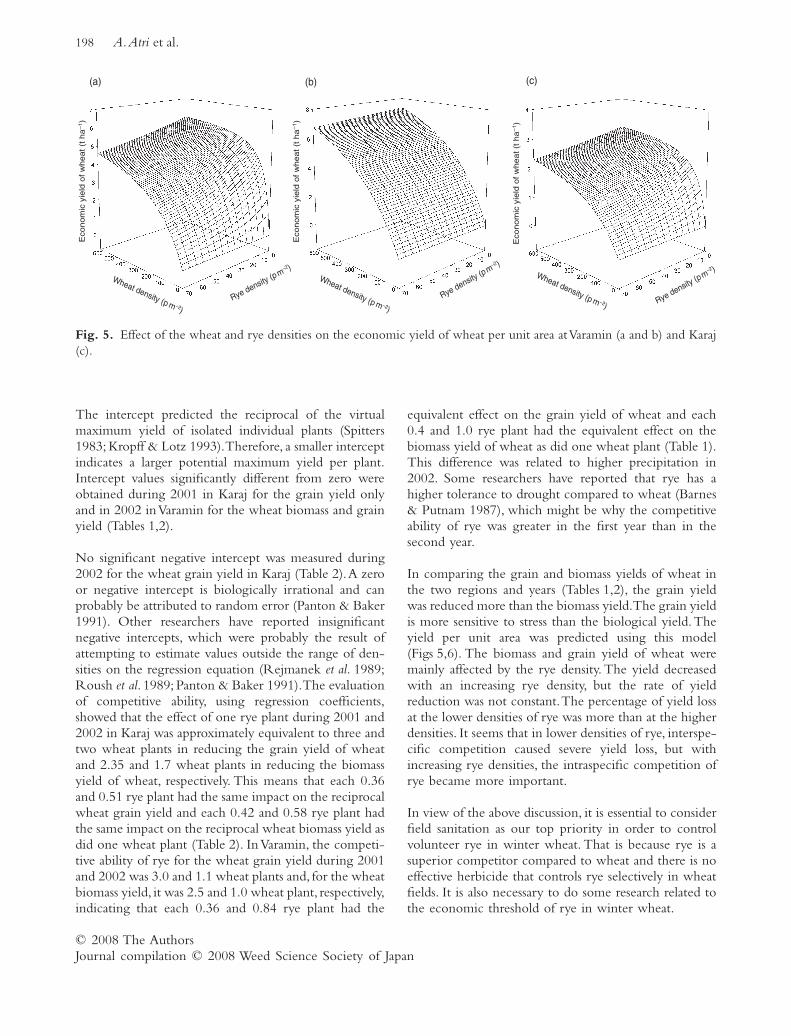
In comparing the grain and biomass yields of wheat inthe two regions and years (Tables 1,2), the grain yieldwas reduced more than the biomass yield.The grain yieldis more sensitive to stress than the biological yield.Theyield per unit area was predicted using this model(Figs 5,6). The biomass and grain yield of wheat weremainly affected by the rye density. The yield decreasedwith an increasing rye density, but the rate of yieldreduction was not constant.The percentage of yield lossat the lower densities of rye was more than at the higherdensities. It seems that in lower densities of rye, interspe-cific competition caused severe yield loss, but withincreasing rye densities, the intraspecific competition ofrye became more important.
In view of the above discussion, it is essential to considerfield sanitation as our top priority in order to controlvolunteer rye in winter wheat. That is because rye is asuperior competitor compared to wheat and there is noeffective herbicide that controls rye selectively in wheatfields. It is also necessary to do some research related tothe economic threshold of rye in winter wheat.
(a)E
con
om
ic y
ield
of
wh
ea
t (t
ha
–1)
Wheat density (p m –2)Rye density (p m
–2 )
(b)
Eco
no
mic
yie
ld o
f w
he
at
(t h
a–1)
Wheat density (p m –2)
Rye density (p m–2 )
(c)
Eco
no
mic
yie
ld o
f w
he
at
(t h
a–
1)
Wheat density (p m –2) Rye density (p m–2 )
Fig. 5. Effect of the wheat and rye densities on the economic yield of wheat per unit area atVaramin (a and b) and Karaj(c).
198 A.Atri et al.
© 2008 The AuthorsJournal compilation © 2008 Weed Science Society of Japan

ACKNOWLEDGMENTS
The financial support for this survey was provided by thePlant Protection Research Institute, Tehran, Iran. Theauthors thank the internal and external reviewers fortheir helpful comments.
REFERENCES
Anderson R.L. 2004. Control Strategies for Jointed Goat Grass,VolunteerRye and Downy Brome. [Cited 10 October 2003.] Available fromURL: http://www.akron.ars.usda.gov/fs_control.html.
Atri A., Javanshir A., Moghaddam M. and Shakiba M. 2000. [Study ofcompetition in maize (Zea mays L.) and bean (Phaseolus vulgaris L.)
Bio
logic
al y
ield
of w
heat (t
ha
–1)
Wheat density (p m –2)Rye density (p m
–2 )
(a)
Bio
logic
al y
ield
of w
heat (t
ha
–1)
Wheat density (p m –2)
Wheat density (p m –2)
Wheat density (p m –2)
Rye density (p m–2 )
Rye density (p m–2 )
Rye density (p m–2 )
(b)B
iolo
gic
al y
ield
of w
heat (t
ha
–1)
(c)
Bio
logic
al y
ield
of w
heat (t
ha
–1)
(d)
Fig. 6. Effect of the wheat and rye densities on the biological yield of wheat per unit area atVaramin (a and b) and Karaj(c and d) in the first (a and c) and second (b and d) experimental years.
Evaluation of wheat against volunteer rye 199
© 2008 The AuthorsJournal compilation © 2008 Weed Science Society of Japan
intercropping by reciprocal yield model.] Tabriz Agric. Sci. J. 9,97–107 (in Persian with English abstract).
Barnes J.P. and Putnam A.R. 1987. Role of benzoxazinones inallelopathy by rye (Secale cereale L.). J. Chem. Ecol. 13, 889–906.
Kropff M.J. and Lotz L.A.P. 1993. Empirical models for crop–weedcompetition. In: Modeling Crop–Weed Interaction (ed. by Kropff M.J.and Van Laar H.H.). CAB International/The International RiceResearch Institute, Wallingford, UK, 9–24.
Lyon D.J., Klein R.N. and Wicks G.A. 2004. Rye Control in WinterWheat. [Cited 10 January 2003.] Available from URL: http://jgg.unl.edu/grasses/rye/ordinary.htm.
Panton D.J. and Baker J.B. 1991. Reciprocal yield analysis of red rice(Oryza sativa) competition in cultivated rice. Weed Sci. 39, 42–47.
Pester T.A., Westra P., Anderson R.L., Lyon D.J., Miller S.D., StahlmanP.W. et al. 2000. Secale cereale interference and economic thresholds inwinter Triticum aestivum. Weed Sci. 48, 720–727.
Rejmanek M., Robinson G.R. and Rejmankova E. 1989. Weed–cropcompetition; Experimental designs and models for data analysis. WeedSci. 37, 276–284.
Roush M.I., Radosevich S.R., Wagner R.G., Maxwell B.D. andPeterson T.D. 1989. A comparison of methods for measuring effectsof density and proportion in plant competition experiments. WeedSci. 37, 267–275.
Snaydon R.W. 1991. Replacement and additive designs for competitionstudies. J. Appl. Ecol. 28, 930–946.
Spitters C.J.T. 1983. An alternative approach to the analysis of mixedcropping experiments. 1. Estimation of competition effect. Neth. J.Agric. Sci. 31, 1–11.
Stump W.L. and Westra P. 2000. The seed bank dynamics of feral rye(Secale cereale). Weed Technol. 14, 7–14.
Wright A.T. 1981. The analysis of yield–density relationship in binarymixture using inverse polynomials. J. Agric. Sci. Camb. 96, 561–567.
200 A.Atri et al.
© 2008 The AuthorsJournal compilation © 2008 Weed Science Society of Japan