Level I & II Volunteer Field Guides - Hillsborough County ...
96
-
Upload
khangminh22 -
Category
Documents
-
view
3 -
download
0
Transcript of Level I & II Volunteer Field Guides - Hillsborough County ...

������������������� ������������

2
ACKNOWLEDGMENTS
This manual draws on the experience of many outstanding citizen monitoring , stewardship andeducation programs. Hillsborough County Stream-Waterwatch gratefully acknowledges thefollowing organizations for their advice and use of materials:
City of Tampa Advanced Wastewater Treatment PlantEPA Office of WaterFlorida Department of Environmental ProtectionGeorgia Adopt-A-StreamHillsborough River Greenways Task ForceHillsborough Community CollegeHillsborough County Public Works Stormwater Management DivisionHillsborough County Environmental Protection CommissionSave our Streams, Izaak Walton League of America
The preparation of this manual was supported through a grant from the Florida Game and FreshWater Fish Commission’s Advisory Council on Environmental Education and the SouthwestFlorida Water Management District. The project is a joint effort by the County of Hillsboroughand Hillsborough Community College.

3
LEVEL I FIELD GUIDE
TABLE OF CONTENTS
Page
Introduction 4
I. Identify a Stream Segment to Adopt 5
II. Name Your Project 5
III. Conduct a Watershed Walk 5
IV. Visual Survey 9
V. Litter Pick up 10
VI. Send Results 11
Appendices
Understanding Your Watershed 14
Land Use and Water Quality 16
Glossary of Stream Related Terms 19
Think Safety! 21
Who to Call 22
Soil Classification 23
Stream Flow 28
Unusual Colors and Odors in Waters 36
Evaluation of Stream Conditions 37
Forms 40

4
INTRODUCTION
Hillsborough County Stream-Waterwatch is a program developed by HillsboroughCommunity College and the Hillsborough County Department of Public Works StormwaterManagement Division. The program was originally funded by a grant from the Florida Gameand Freshwater Commission’s Advisory Council on Environmental Education. The programcurrently receives funding from the Southwest Florida Water Management District and isdesigned to promote citizen involvement in learning about and protecting streams, rivers, andlakes. Stream-Waterwatch gives volunteers the tools to understand and then start protecting theirwater resources. It's a unique "hands-on" approach that brings citizens and government togetherto manage and protect our water resources.
This manual describes how to start a Stream-Waterwatch project including how to find astream segment to adopt, and how to conduct a visual assessment and watershed walk. Thismanual covers Stream-Waterwatch Level I activities. Levels II and III involve biologicalmonitoring, chemical testing, and/or habitat enhancement activities, in addition to Level Iactivities. Training workshops are required for Level I and Level II biological monitoring andchemical testing.
LEVEL I
Level I is the starting point for new volunteers and Stream-Waterwatch projects. Volunteers regularly evaluate a streamsegment, pick up litter, and report results to HillsboroughCounty Stream-Waterwatch. Stream-Waterwatch projects arelong term protection efforts. Volunteers commit to adopt astream or river section for at least one year. Follow steps Ithrough XI outlined in this manual to complete a one year Stream-Waterwatch project.
Level I activities include:
· finding a stream site/segment for adoption· conducting an initial watershed walk· visual assessments of water quality and physical habitat at one site four times a
year· regular litter pick ups
These activities help protect streams because:
A watershed walk provides a record of potential impacts to water quality such as pipe effluent, eroding stream banks, illegal dumps and surrounding land uses. Regular visual assessments atone site can provide important clues to the overall health of your stream or river. Documenting

5
changes in water quality and habitat are important to understanding water qualitytrends. Volunteers evaluate water color, clarity, streambank and stream bed habitat. Litterpicks ups remove hazards and pollutants to aquatic life as well as improve an area forrecreation. And finally, sharing the results of your project with others helps everyoneunderstand that these are our streams, and we all have to work to protect them.
Volunteers help improve water quality, one stream at a time, by regularly recordingstream conditions, notifying authorities if problems arise, removing litter, and telling others inthe community about their findings. Understanding local water quality conditions is the first steptoward protecting our water resources.
I. IDENTIFY A STREAM SEGMENT TO ADOPT
Find a stream (or river) segment to adopt. Many groups adopt between a ½ and 1 milesegment of stream. When choosing a stream, think of your goals. Do you want to learn moreabout a section of stream that flows by your school or home? Volunteers may want to study thequality of the local drinking water source. Comparing the effect of land use on water quality canbe interesting (sample upstream and downstream of a farm, an urban area, etc.). Also,topographical or county maps are good sources of water resource information.
Generally, however, follow these guidelines:
� Select a stream meaningful to you or your group.� Select a stream that has easy, safe and legal access. � Select a project that you can have fun with!
II. NAME YOUR PROJECT
Think of a name for your group or project. Your project name will help identify you as anestablished effort to protect a local stream. As an example, the Environmental TechnologyStudents at HCC adopted a site on English Creek and call their project the "English Creek WaterQuality Team."
III. CONDUCT A WATERSHED WALK(based in part on work done by Georgia Adopt-A-Stream)
Start your Level I project with a Watershed Walk. A watershed walk involves creating arecord of land uses and potential impacts on your adopted stream. Runoff from different land

6
Figure 1 Cross section of a watershed
uses, pipes discharging into the water, natural springs flowing into the stream, highwaycrossings, and other impacts can all have significant effects on a stream. A thick stand of forestadjacent to a stream may filter pollutants running over land, provide shade, and hold soil in place.A highway or a parking lot near the stream may collect oil and gasoline that runs into the streamwhen it rains. A pipe may discharge wastes from a nearby city or industry, or a stormwater pipemay directly route runoff into a stream.
What Is a Watershed?
A watershed includes the entire area drained by a certain stream or river. Hills andmountains determine which direction water flows, a drop of rain falling on one side of a hill mayeventually find it's way to your stream. If the drop of rain falls on the other side of the hill, it willfollow a different path to a different stream or river (Figure 1). Looking at a topographical mapwill help you determine what area makes up your watershed.
Water draining into your stream may carry with it soil, fertilizer from lawns and fields,oil and gas from parking lots and roads, or anything the water comes in contact with. Streamsdrain water from land in the surrounding area, so every activity on the land can have an impacton your stream. A natural area of vegetation next to the stream helps keep these pollutants out of
7
the water. See the appendices for more detail.
Equipment List
� topo map of area surrounding stream� Pen or pencil� Boots/waders or old tennis shoes� Camera� watershed walk survey and summary form
WHERE TO START
Before the watershed walk:
� Read the watershed information in the Appendix.
� Read "Think Safety" in the Appendix.
� Obtain the topographical map of your area. Find the stream you plan to walk or canoe andmark the beginning and end points of the study segment, usually ½ to 1 mile. Study themap before the walk and note important features along the way. The location of crossingroads, feeder streams, electric power lines, or dams can be used for navigation and asreference points. Also, note the surrounding land area--will you expect to find urban,residential, or rural areas or a combination?
� Review the Watershed Walk Survey and Summary Form.
� You must have permission of landowners if you walk across private property. The countyplanning commission office will have a list of property owners along the chosen sectionof stream. The office will have tax maps showing all property lines and the lot number foreach property. Make a list of each lot number, then look up the property in the tax booksto obtain a full name and address for the owners. You can prepare an announcement totake or mail to all the property owners. Tell them who you are, what your group is doing,and why you are doing it. Make sure to provide a phone number of someone to contact incase they have any questions. If possible, hand deliver the announcements. This gives youthe opportunity to introduce yourself to the property owners, and provide them withadditional information. If they are not at home, leave the announcement on the outside ofthe mailbox. You'll likely discover that many of the property owners will be veryinterested in learning more or in helping in the effort. You
may want to include a Stream Water-Watch brochure or flyer with the announcement
If you canoe your section, you may not need to contact all the property owners. Please just usecommon sense, don't walk across private land and be sure not to leave anything behind.

8
In urban areas, it may be not be practical to contact all landowners adjacent to a streamsegment. In this case, your watershed walk may actually be a drive. Visit several sites where thestream crosses a road. Use caution when getting in and out of your car, especially on bridges.Other vehicles may not see you.
During the walk:
� Assign tasks to the team members such as taking notes, marking map, and wading in thestream.
� Walk or canoe a length of stream to assess what may be influencing your adopted section.Start at the upstream portion. As you proceed downstream, mark the significant featureson the map (you may want to cover the map with plastic and use a wax pencil). Thesefeatures may include the location of erosion, runoff, livestock wading, sewer pipes, stormdrains or land use along the stream that is likely to cause problems. Use your bestjudgement as to what may be significant. If unsure, make a note and ask later. Make asketch of the details, showing North and approximate distances along the stream.
� Complete the Watershed Walk Survey Form.
After the walk:
� On the basis of the Watershed Walk Survey Form, notes and map details, you should beable to do the Watershed Summary. The Summary should reflect the actual conditions inthe stream at the time of observation.
� Select one or more sites for quarterly visual assessments. Place the location of theselection(s) on the stream map.
Select Site(s) for Quarterly Visual Assessments
Consider these criteria to select one or more sites to conduct quarterly visual assessments:
1. Physical Accessibility: There is ease reaching the stream site. The stream site is easy and safeto reach.
2. Legal Accessibility: There are NO trespass problems or safety problems.

9
IV. VISUAL SURVEY
A great deal of information can be gained by simply observing your stream at sitesselected during your watershed walk. The idea is to record a set of observations every time youvisit your stream site(s). In this way, both short and long term changes can be documented. Visityour stream site(s) quarterly or once every three months. Set dates now so your group canplan accordingly. For example, plan to do a visual survey the last Saturday in February, May,August and November.
Equipment List:clipboardpencilVisual Survey Formtape measureyardstickthermometer
Optional:tree or shrub identification guidecameraleaf presssunscreeninsect repellenthip waders or bootsrubber ball or orange
Follow these directions to complete the Visual Survey Form:
1. Look at the amount and speed of the water. How high is the stream? (hint-look for high watermarks on the streambank) Is the water flowing slower or faster compared with your last visit?Use your best judgement to estimate high, normal, or low flow. Stream flow can be calculatedflow by measuring the cross section of a stream segment and then taking a velocity measurement(see appendix on Stream Flow for details). Record.
2. Observe where the water is flowing, if there are rocky areas where the water moves quickly,these areas are called riffles. They provide good habitat for macro invertebrates and fish. Doesthe water slow down in some spots and form pools? Pools provide a place for fish to rest andfeed. Estimate the number of pools and riffles in your section of stream. Record.
3. Look at the stream depth and width. Riffles will be shallow, pools will be deeper. Measure orestimate the depth at the center of the stream and the width of an average section of the stream.Record.

10
4. Water color and odor are associated with specific conditions--some naturally occurring andsome influenced by human activity. Brown or muddy water may indicate sedimentation in yourstream. In Florida many streams are clear, but naturally tea-colored due to decaying leaves andplants. Very green water may indicate excessive algae growing in the water. Learn to recognize"normal" water colors and odors in your stream. Refer to the "Evaluation of Stream Conditions"chart in the Appendix. Record the colors and odors that best describe your stream site.
5. Fish and aquatic insects need certain conditions in a stream to survive. One critical condition iscalled habitat--the availability of good places to search for food, hide from predators, andreproduce. The bed of the stream can tell you a lot about habitat available for aquatic life. Rocksand vegetation provide good habitat while sediment covers the places to hide and lay eggs. Use Chart B in the Appendix to rank the stream bed and sediment deposits and record on streamassessment survey form. For a quantitative method, see "Soil Classification" in the Appendix.
6. Stream banks function as a part of the whole stream system. Streambank stability describeshow well soil and vegetation are held in place. If stream banks are unstable, soil will erode intothe stream during a rain. The amount and type of vegetation on stream banks is also veryimportant. Vegetation holds soil in place and prevents erosion on stream banks. Trees and largeshrubs can provide shade for the stream, many types of fish and insects need cooler water tosurvive. You can record both left and right stream banks (facing downstream) or the generalcondition.
7. Algae are simple plants without roots or leaves. They are naturally present in streams, riversand lakes. Algae are found growing on rocks or logs, floating in clumps, or in long strands. Theymay be green, brown, or reddish. Sometimes, however, algae grow out of control when excessivenutrients are present. Nutrients like nitrogen and phosphorus are found in waste water, animalwastes, and fertilizers. Fertilizers from lawns, golf courses, and cropland may run into streams.The nutrients are food for algae, and the more they get, the more they multiply. Excessive algaein a stream can cause oxygen levels to drop when algae decompose. Low oxygen levels make itimpossible for fish and other organisms to live. Record the appearance and location of algae.
8. Finally, note general observations--did you see any wildlife? Are there human activities in thearea that impact the stream? How about litter? Write down anything about the area that you thinkis important.
V. LITTER PICK UP
Litter can harm aquatic life. Cans can rust, batteries can leak acid into water, and plasticcan cut or tangle fish or birds. Litter also can impair the recreational use of streams for peopleand is just plain ugly. Regular litter pick ups will help improve the water quality in your stream.
Bring a trash bag(s) with you during your quarterly visual surveys and pick up litter. Oneperson may do this while others complete the visual survey. You may want to plan a day to pick

11
up litter on your ½ to 1 mile stream segment. If you have large items, talk to the city or countyabout getting some assistance from the public works or fire department. You may want to weargloves to protect your hands from broken glass or sharp objects.
VI. SEND RESULTS
Send a copy of your Watershed Walk Survey and Summary, your quarterly visual surveyswith the Level I Activity Summary to Hillsborough County Stream-Waterwatch each quarter.You efforts are important, don't keep the results to yourself! Also, we know your group is activeonly when we regularly receive your results.
Complete a new Level I Activity Summary each quarter. The Activity Summary is arecord of your group's activities each quarter and for the entire year. Make a copy of the ActivitySummary. Send the copy to Hillsborough County Stream-Waterwatch no later than March 31.June 30, September 30 and December 31. Keep the original for your records.
Feel free to send a copy of your results to anyone else interested in the health of yourstream. Your local newspaper may want to run a story about your group and your findings. Your group may want to send your results to everyone in your watershed, including private homes andbusinesses. Public outreach is probably the most important Stream-Waterwatch activity. This isa chance to share with others in the community information about your project, the condition ofyour stream, and your dedication to protecting local water resources. Many groups will beinterested in learning about local streams through an article or presentation.
One way to keep the public informed is to make available the water quality results thatyour group finds. This can be accomplished by installing a sign that identifies your group and thesection of stream or river that you’ve adopted. We have signs available for installation at yoursite upon request. By sharing the results of your group’s findings the local community willbecome aware of your group’s efforts and outcomes regarding the water quality in their area.
IF YOU WANT TO LEARN MORE ABOUT YOUR STREAM OR IMPROVE THEHABITAT...
Consider participating in Stream-Waterwatch Level II or III. Level II involves choosingeither biological monitoring, chemical monitoring, or a habitat improvement project. Youconduct these activities in addition to your Level I project. Level III involves two or more of theLevel II activities, plus Level I participation. You can greatly increase your understanding of thechemical and biological forces at work in your stream or actively improve a section of stream.Flip through the Level II and III manual and see if you are interested. If you are, sign up for aworkshop or contact Stream-Waterwatch for more details.

12
FOR QUESTIONS REGARDING STREAM -WATERWATCH TRAINING CONTACT:
Erik Garwell, Ph.DChemical Training CoordinatorEmail: [email protected]
Pamela Vergara, Ph.D., P.E.Stream Waterwatch Coordinator1206 N. Park RoadPlant City, FL, 33566(813) 757-2186Email: [email protected]

13
APPENDICES
14
UNDERSTANDING YOUR WATERSHED: THE VITAL LINK BETWEEN LANDUSES AND WATER QUALITY
by Larry LeBeouf, Save Our Streams
Over the last decade, significant achievements have been made in the protection andenhancement of water quality. However, most of the significant reductions in pollution havecentered around decreasing the amount of toxics from factory discharge pipes through waterconservation, better technology and stricter legislation. However, our rivers continue to bepolluted even with these improvements due to runoff pollution from the land. When you want toprotect a particular river from pollution you cannot simply consider the pollution problemsimmediately in your river. You must ask yourself the question, where did this pollution comefrom? In order to learn where the pollution originates from, so that you can undertake solutions,you must be familiar with your watershed. By defining the area of your watershed, mapping it toshow possible pollution sources, and reporting these sources to local and state authorities you canfinally put an end to the pollution that has claimed so many of our streams and rivers.
What Is A Watershed?
It comes in many shapes and sizes. It may be nearly flat or hilly or rocky; it may even bein your own backyard. What is it? It's a watershed, an area of land from which water drains into agiven point, usually a larger body of water. Smaller watersheds make up larger watersheds,creating a series of watersheds, known as a drainage basin, which may encompass several states.What happens in these smaller watersheds, whether good or bad, affects the larger watershedsdownstream. The Mississippi River watershed, for example, drains about 1,243,000 square miles,carrying agricultural pesticides, city runoff and other pollutants into the Gulf of Mexico.
Defining Your Watershed:
Defining the area which makes up your watershed is important because all land uses in aparticular watershed affect the water quality of streams that drain the land. Since water runsdownhill, the lay of the land determines the size of your watershed. By locating the area slopingdown to your stream you can determine what land practices may affect your stream's waterquality. Topographic maps from your local office of the U.S. Geological Survey (USGS) can beused to map out your watershed's drainage pattern and to pinpoint possible pollution problems.
For example, if your watershed consists primarily of farms, your stream may suffer frompesticide and fertilizer pollution when it rains. If factories are also present in your watershed,toxic pollution may be contaminating your river. If large, paved areas, such as shopping malls ordense housing developments, exist in your watershed, oil from parking lots and urban runoff mayharm stream life.
There are two types of pollution sources in your watershed: point sources and nonpoint
15
sources. Point sources consist of pollutants which originate from a clearly identifiable source andmove through a conduit, such as a factory discharge pipe. Nonpoint sources consist of runofffrom the land, which may contain pesticides, fertilizers, metals, manure, road salt and otherpollutants. Sources of these nonpoint pollutants include farms, lawns, paved urban areas,construction sites, timber harvesting operations, landfills and home septic systems.
Mapping Your Watershed:
Mapping your watershed will aid you in determining what possible pollution sources maybe affecting your river. To understand what pollution problems are present in your watershed andare affecting the water quality of your river, draw a sketch of your watershed using USGStopographic maps to determine the size of your watershed, then identify locations of differentland uses and point and nonpoint sources of pollution. This will help determine where pollutionsources are located and what potential pollution problems exist. If you notice a pollution problemin your stream, you will be able to pinpoint possible causes using your watershed map.
Improving Water Quality In Your Watershed
Rainfall and other water that does not evaporate or soak into the soil becomes surfacerunoff and drains into various bodies of water. If a great deal of rain falls over a short period oftime, however, it might cut gullies and carry off topsoil vital to farms, ranches and crops. Excesswater may also cause flooding, which damages property and highways and can even destroyspawning beds for fish. High sediment levels in streams can clog stream channels, smother fishand destroy aquatic life.
Nonpoint sources of pollution can be abated by implementing soil and water conservationpractices and adding flood prevention measures can reduce damage. For instance, grass, trees,bushes, shrubs and even weeds can help hold soil in place. Planting stream banks with stabilizingvegetation can reduce problems caused by erosion and slow down flood waters. Application ofBest Management Practices (BMPs) such as terraces, strip-cropping and improved pasturepractices, can be used on farms to make more water soak into the soil and to reduce the potentialfor erosion.

16
LAND USE AND WATER QUALITY
Urbanization
The urbanization of land concentrates people, and the pollutants that result from their lifestyles,in areas that are largely covered with impervious surfaces--buildings, driveways, roads,sidewalks, and parking lots. This combination of people, pollutants, and pavement producesurban runoff that can carry a greater pollutant load than municipal sewage.
The amount of pollutants carried in urban runoff with stormwater or snow melt is influenced bytraffic density, littering, fertilizer and pesticide use, construction site practices, animal wastes,soil characteristics, topography of the area, percentage of impervious surfaces, atmosphericdeposition, and amount of precipitation.
Pollutants transported in urban storm sewer systems to nearby waters include nutrients, bacteria,litter, soil, toxic chemicals, and organic (oxygen-consuming) materials.
Construction sites
Construction activities can harm nearby waters in three ways. The first occurs when natural landcover is disturbed during excavation and grading operations. Soil stripped of its protectivevegetation can be easily washed into nearby surface waters. Second, stormwater runoff oftencarries materials used on the site, such as oil, grease, paints, glues preservatives, acids, cleaningsolutions, and solvents, into nearby lakes or streams. And third, inadequate planning--failure todesign and construct projects with water quality factors in mind, such as peak runoff and flowrouting--can accelerate runoff.
Septic Systems
Many homes are not connected to municipal wastewater treatment systems and rely on septictanks and field lines for sewage treatment. If they are well designed, installed, and maintained,septic systems will safely treat wastewater for 20 to 50 years. Improper design, installation, oroperation of septic systems or holding tanks can lead to pollution of surface or groundwater bybacteria, nutrients, and household toxic chemicals. A recent U.S. Environmental ProtectionAgency (EPA) report stated that most waterborne diseases are probably caused by old or poorlydesigned and operated septic systems.
Septic systems use natural decomposition to treat wastes. Holding tanks do not treat wastes, butsimply contain them on site. Both septic systems and holding tanks must be periodically pumpedout or cleaned. Care must be taken in disposing of the materials removed in this cleaning. Solidscleaned out of septic systems can be land-spread since they are partially treated, but continuousspreading on a single site of land should be avoided. Wastes removed from holding tanks needadditional treatment since they generally have not undergone much decomposition.

17
Croplands
Stormwater and snow melt runoff from croplands can carry sediments, nutrients, bacteria, andorganic contaminants into nearby lakes and streams. Nitrates and pesticides can seep fromagricultural lands and contaminate underlying groundwater supplies. By volume, sediment is thepollutant entering waters in the largest quantity. Cropland erosion is the most significant sourceof sediment. Good water quality and soil erosion management practices by individual landmanagers is the key to stopping valuable soil loss. This also protects water quality by preventingthe movement of sediment and other pollutants from croplands to waters.
Livestock Operations
Animal feedlots are defined as lots and buildings used to confine animals for feeding, breeding,raising, or holding purposes. This definition includes open ranges used for feeding and raisingpoultry, but does not include pastures. Poor or inadequate feedlot management can allowstormwater runoff to carry pollutants from accumulating manure into surface and groundwaters.Feedlots can create significant pollution problems. Pollutants coming from animal feedlotsinclude nutrients, oxygen-demanding materials, and pathogens that may affect humans andanimals. High nitrate levels in groundwater have been associated with improper storage ofanimal manure.
Fertilizers
Nitrogen, phosphorus, and potassium are the three primary nutrients applied to crops, gardens,and lawns as fertilizers. Phosphorus and nitrogen entering water bodies in runoff from overfertilized areas can cause nuisance conditions, such as heavy algal blooms and excessive weedgrowth, making lakes unsuitable for swimming, waterskiing, and other uses. The presence ofnitrates in rural well water presents a risk to infants under six months old whose formula isprepared with nitrate-contaminated water. Young infants lack the ability to handle high levels ofnitrate and may develop methemoglobinemia (blue-baby syndrome), a disease impairingthe ability of blood to carry oxygen throughout the body. Studies have indicated that nitrogen infertilizers and manures is a probable source of elevated nitrate concentrations in ruralgroundwater supplies.
Pesticides
Pesticides are used to control undesirable plants or animals. They include herbicides,insecticides, fungicides, and rodenticide. Pesticides are used on agricultural lands, on urban andsuburban lawns and gardens, as aquatic nuisance controls in lakes, and in forest management.Pesticide application can lead to groundwater contamination. Surface waters can be contaminatedby drift from pesticide spraying and by runoff from pesticide-treated soil. Both surface and

18
groundwaters are vulnerable to contamination by stormwater runoff flowing from storage,mixing, loading, and spray-tank cleaning areas.
Mining Activities
Mining activities can cause dramatic changes in surrounding watersheds. Lakes, streams, andgroundwater can be polluted by sediment, tailings, dust, chemicals, and wastes from open pit,strip, and underground mines. Regulations to control mining activities have been instituted atboth U.S. Federal and state levels.
Forest Practices
Waters in forested areas usually are of very high quality, so pollution, when it does occur, islikely to harm a valuable and relatively sensitive ecosystem. Forestry activities that can transferpollutants from land to water are road construction, clearing land for fire breaks, stacking andloading operations during harvest, mechanical site preparation, controlled burning for sitepreparation, and application of pesticides and herbicides. Many large forested areas are managedby the U.S. Forest Service and state agencies. These agencies have authority to protect waterquality by regulating forestry practices on public lands. Establishing effective forest managementpractices on private land is the primary concern for continued water quality protection fromforestry activities.
SOURCE: Tennessee Valley Authority, Teacher/Student Water quality Monitoring Network FallWorkshop Teacher Guide, TVA, Norris, Tennessee, 1992.

19
GLOSSARY OF STREAM RELATED TERMS
Acid rain - rain with a pH of less than 5.6; results from atmospheric moisture mixing withsulphur and nitrogen oxides emitted from burning fossil fuels; causes damage to buildings, carfinishes, crops, forests, and aquatic life.
Algae - simple plants which do not grow true roots, stems, or leaves and live mainly in waterproviding food for the food chain.
Algal bloom - a heavy growth of algae in and on a body of water as a result of high nitrate andphosphate concentrations from farm fertilizers and detergents.
Best management practices - an engineered structure or management activity, or combinationof these, that eliminates or reduces an adverse environmental effect of pollutants.
Clearcutting - felling and removing all trees in a forest area.Cobble stone - 2-10 inch size stones where aquatic insects are commonly found.Culvert - a closed passageway (such as a pipe) under roadways and embankments which drains
surface water.Effluent - an out-flowing branch of a main stream or lake; waste material (i.e. liquid industrial
refuse, sewage) discharged into the environment.Erosion - the wearing away of land by wind or water.Fish kill - the sudden death of fish due to the introduction of pollutants or the reduction of
dissolved oxygen concentration in a water body.Floodplain - a low area of land, surrounding streams or rivers, which holds the overflow of
water during a flood.Flow - the direction of movement of a stream or river.Groundwater - a supply of fresh water under the earth's surface which forms a natural reservoir.Leaching - the process where material in the soil (such as nutrients, pesticides, chemicals) are
washed into lower layers of soil or are dissolved and carried away by water.Nonpoint source pollution - pollution that cannot be traced to a specific point, but rather from
many individual places (e.g., urban and agricultural runoff).Nutrient - substance which is necessary for growth of all living things (i.e. phosphorous,
nitrogen and carbon).Nutrients - substances such as fertilizer; phosphorous and nitrogen compounds which enhances
the growth of plants and animals.Pesticide - a chemical that kills insects and rodents. Pesticides can poison aquatic life when they
reach surface waters through runoff.Point source pollution - a type of pollution that can be tracked down to a specific source such as
a factory discharge pipe.Pollutant - something that makes land, water and air dirty and unhealthful.Riffle - shallow area of a stream or river with a fast moving current bubbling over rocks.Runoff- water, including rain and snow, which is not absorbed into the ground -instead it flows
across the land and eventually runs into streams and rivers. Runoff can pick up pollutants fromthe air and land, carrying them into the stream.
Sediment - soil, sand, and materials washed from land into waterways. Other pollutants mayattach to sediment and be carried into stream.

20
Sedimentation - when soil particles (sediment) settle to the bottom of a waterway.Septic tank - a domestic wastewater treatment system into which wastes are piped directly from
the home; bacteria decompose the organic waste, sludge settles to the bottom of the tank, andthe treated effluent flows out into the ground through drainage pipes.
Slumping - sections of soil on a streambank that have come loose and slipped into the stream.Stagnation - when there is little water movement and pollutants are trapped in the same area for
a long period of time.Surface water - precipitation which does not soak into the ground or return to the atmosphere by
evaporation or transpiration, and is stored in streams, lakes, wetlands, and reservoirs.Toxic substances - poisonous matter (either chemical or natural) which causes sickness, disease
and/or death to plants or animals.Undercutting - a type of erosion which occurs when fine soils are swept away by the action of
the stream, especially around curves. The result is an unstable overhanging bank.Water cycle - the cycle of the earth's water supply from the atmosphere to the earth and backwhich includes precipitation, transpiration, evaporation, runoff, infiltration, and storage in waterbodies and groundwater.Watershed - land area from which water drains to a particular water body.Watertable - the upper level of groundwater.Waterway - a natural or man-made place for water to run through (such as river, stream, creek,
or channel).Wetland - an area of land that is regularly wet or flooded, such as march or swamp.

21
THINK SAFETY!
To ensure a fun and educational trip to your stream, please keep these simple precautions inmind:
� Always visit a site with at least one other person, then someone can go for help if oneperson is unable to.
� Never sample if a stream or river is flooding, or even one day after a heavy rain. Fastmoving water is very dangerous. Also, avoid steep stream banks as access points. Wear alife jacket if near deep water.
� When sampling, avoid touching your mouth and eyes and be sure and wash hands beforeeating. If a waterbody is polluted or water quality is unknown, wear plastic gloves andrubber boots.
� Know the location of the nearest available phone or take a portable phone with you. Havean emergency plan ready if you are taking a group out--who will go for help, does anyoneknow CPR, does anyone have allergies?
� Don't go near the water if there is a strong chemical smell, a fish kill, or other dangerousconditions. Leave immediately and report the condition to appropriate authorities.
� Watch out for snakes, alligators, and snapping turtles. Hit the ground and trees with astick as you walk to your site to scare snakes and other creatures away. Leave them aloneand they will leave you alone.
� Look out for broken glass, poison ivy, ticks, bees, fire ants, and other hazards. Bring afirst aid kit.
� Be aware of road hazards, both driving to the site and while conducting activities.Vehicles may not see you getting in and out of your car, bridges are narrow--make sureyou have enough room to walk or go around to streambank, if under a bridge watch forobjects knocked off the road from overhead.

22
WHO TO CALL
FOR LOCAL STREAM QUALITY PROBLEMS
Sewer spills or leaks, overflowing manholes:Report to city or county public works, engineering or utilities department:274-8084
Leaking Underground Storage Tanks:Report immediately to fire department: 911
Game & Fresh Water Fish Commission/ Wildlife Alert - Reporting Wildlife violations: 1-800-282-8002
Poison Control: 253-4444
Florida Department of Environmental Protection: 744-6100
Hillsborough Environmental Protection Commission: 272-5960
Hillsborough River Greenways Task Force: 276-8417
Hillsborough County Public Works Dept.: (813) 272-5912 ext. 3616
23
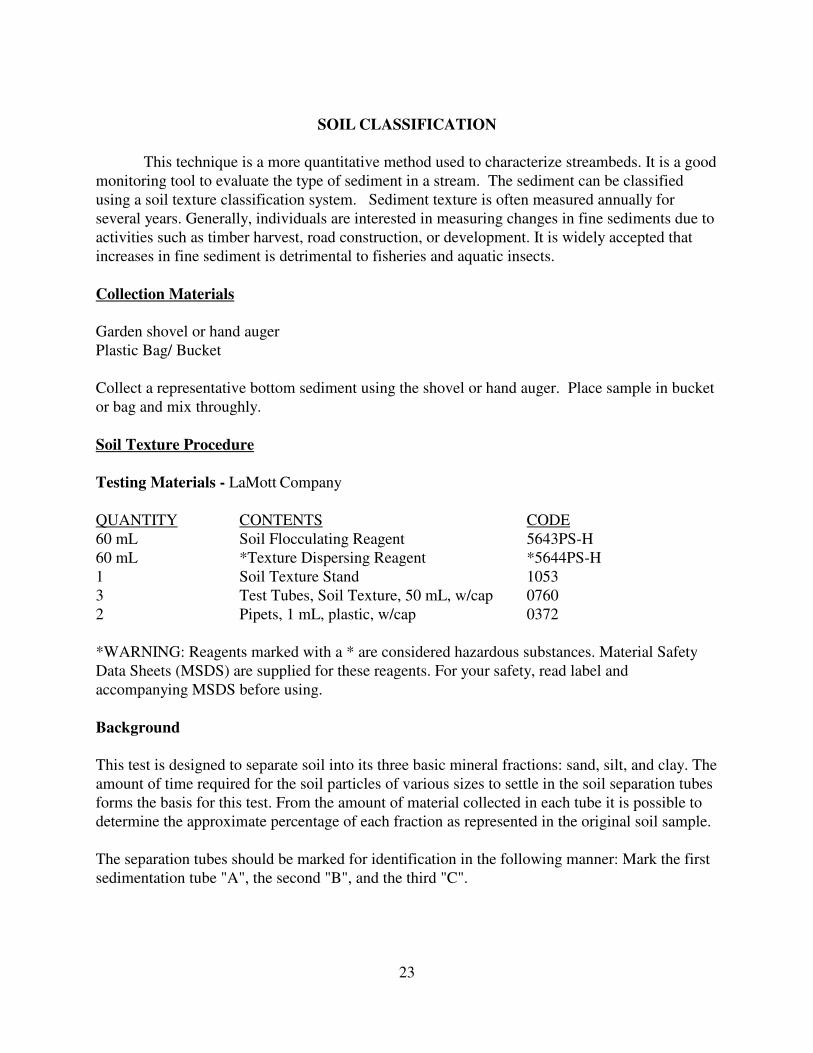
SOIL CLASSIFICATION
This technique is a more quantitative method used to characterize streambeds. It is a goodmonitoring tool to evaluate the type of sediment in a stream. The sediment can be classifiedusing a soil texture classification system. Sediment texture is often measured annually forseveral years. Generally, individuals are interested in measuring changes in fine sediments due toactivities such as timber harvest, road construction, or development. It is widely accepted thatincreases in fine sediment is detrimental to fisheries and aquatic insects.
Collection Materials
Garden shovel or hand augerPlastic Bag/ Bucket
Collect a representative bottom sediment using the shovel or hand auger. Place sample in bucketor bag and mix throughly.
Soil Texture Procedure
Testing Materials - LaMott Company
QUANTITY CONTENTS CODE60 mL Soil Flocculating Reagent 5643PS-H60 mL *Texture Dispersing Reagent *5644PS-H1 Soil Texture Stand 10533 Test Tubes, Soil Texture, 50 mL, w/cap 07602 Pipets, 1 mL, plastic, w/cap 0372
*WARNING: Reagents marked with a * are considered hazardous substances. Material SafetyData Sheets (MSDS) are supplied for these reagents. For your safety, read label andaccompanying MSDS before using.
Background
This test is designed to separate soil into its three basic mineral fractions: sand, silt, and clay. Theamount of time required for the soil particles of various sizes to settle in the soil separation tubesforms the basis for this test. From the amount of material collected in each tube it is possible todetermine the approximate percentage of each fraction as represented in the original soil sample.
The separation tubes should be marked for identification in the following manner: Mark the firstsedimentation tube "A", the second "B", and the third "C".

24
PROCEDURE
1. Place the three Soil Separation Tubes in the rack.
2. Add the soil sample to Soil Separation Tube "A" until it is even with line 15.NOTE: Gently tap the bottom of the tube on a firm surface to pack the soil and eliminate airspaces.
3. Use the pipes (0372) to add 1 mL of *Texture Dispersing Reagent (5644PS) to the sample inSoil Separation Tube "A". Dilute to line 45 with tap water.
4. Cap and gently shake for two minutes, making sure all the soil sample is thoroughly mixedwith water.
The sample is now ready for separation. The separation is accomplished by allowing apredetermined time for each fraction to settle out of the solution. Be sure that you continue togently shake the separation tube up to the time of the first separation (Step 5).
5. Place Soil Separation Tube "A" in the rack. Allow to stand undisturbed for exactly 30 seconds.
6. Carefully pour off all the solution into Soil Separation Tube "B". Return Tube "A" to the rack.Allow Tube "B" to stand undisturbed for 30 minutes.
7. Carefully pour off the solution from Soil Separation Tube "B" into Soil Separation Tube "C".Return Tube "B" to the rack.
8. Add I mL of Soil Flocculation Reagent (5643PS) to Soil Separation Tube "C". Cap and gentlyshake for one minute.
9. Place the Soil Separation Tube "C" in the rack and allow to stand until all the clay insuspension settles. This may require up to 24 hours.
NOTE: Unless there is further use of the clay sample for air drying and study as described later, itis not necessary to wait for the Suspension to settle.
Due to the colloidal nature of clay in solution and its tendency to swell and form a gel, theportion of clay remaining in Tube "C" is not used to determine the clay fraction present in thesoil. The clay fraction is calculated by adding the sand and silt fractions and subtracting this totalfrom the initial volume of soil used for the separation.

25
EXAMPLE:
Tube "A" Sand 2 Initial Volume 15
Tube "B" Silt +8 Total "A" & "B" -10
Total "A" & "B" 10 Clay 5
10. Read Soil Separation Tube "A" at top of soil level. To calculate percentage sand in the soil,divide reading by 15. Multiply by 100. Record as % sand.
11. Read Soil Separation Tube "B" at top of soil level. To calculate percentage silt in the soil,divide reading by 15. Multiply by 100. Record as % silt.
12. Calculate volume of clay as shown above. To calculate percent clay in the soil, divide valueby 15. Multiply by 100. Record as % clay.
CALCULATION
EXAMPLE: Soil Separation Tube "A" reads 2. Soil Separation Tube "B" reads 8.
Percent Sand = Reading A x 100 = 2 x 100 = 13%Total Volume 15
Percent Silt = Reading B x 100 = 8 x 100 = 53%Total Volume 15
Percent Clay = Calculated Volume x 100 = 5 x 100 = 33%Total Volume 15
Since the scientific basis of the test is the particle size and its mass, as related to its settling timewhen dispersed in solution, the following table is included for reference.
Soil Particle Diameter in mm
Very Course Sand 2.0 - 1.0Course Sand 1.0 - 0.5Medium Sand 0.5 - 0.25Fine Sand 0.25 - 0.10Very Fine Sand 0.10 - 0.05Silt 0.05 - 0.002Clay Less than 0.002

26
INTERPRETATION
Sandy soil is described as soil material that contains 85% or more sand. Silt soil isdescribed as soil material that contains 80% or more silt and less than 12% clay. Clay soil isdescribed as soil material that contains 40% or more clay, less than 45% sand and less than 40%silt.
Figure 2. USDA textural classification chart.
To further describe the various graduations possible under each general soil textureclassification mentioned above, additional terms have been applied. Some examples of these areloamy sand, sandy loam, silty clay loam, sandy clay or a silty clay. Soil texture classification canbe determined through the use of the U.S. Department of Agriculture Textural ClassificationChart as shown in Figure 2 .
Once the three textural classes for a soil have been determined it may be of further interest toplace the material from each Soil Separation Tube in individual piles on a piece of paper. Allowsufficient time for air drying. Now it is possible to determine the feel of the various texturalclasses. This experience will be helpful when you are in the field.
The following statements give the more obvious characteristics of a textural class based on itsfeel when rubbed between the fingers.
Sand is loose and single grained and will fall apart after being squeezed when dry. When sand is

27
wet it will form a cast that falls apart after being squeezed.
Sandy loam contains mostly sand, but also some silt and clay. Individual sand grains can be feltand seen.
Silt loam has a moderate amount of the very find grains of sand, is fine-textured and containsonly a small amount of clay. A dry sample feels smooth and silky like flour or talcum powder.
Clay loam is a fine-textured soil that after working breaks up into clods or lumps that are hard tobreak when dry. A wet cast forms a smooth smear and is sticky when squeezed.
WATER SEDIMENTATION TEST
These tubes may also be used as sedimentation tubes for the study of turbid waters.1. Fill tubes to the 50 mL mark with sample water. Cap and place in theplastic rack. Leave undisturbed until the solid material has settled.
CALCULATION:
Each 0.5 mL collected is equivalent to 1% of the total volume.
28
STREAM FLOW
( from EPA Volunteer Stream Monitoring: A Methods Manual)
What is stream flow and why is it important?
Stream flow, or discharge, is the volume of water that moves over a designated point over a fixedperiod of time. It is often expressed as cubic feet per second (ft3/sec).
The flow of a stream is directly related to the amount of water moving off the watershed into thestream channel. It is affected by weather, increasing during rainstorms and decreasing during dryperiods. It also changes during different seasons of the year, decreasing during the summer monthswhen evaporation rates are high and shoreline vegetation is actively growing and removing waterfrom the ground. August and September are usually the months of lowest flow for most streams andrivers in most of the country.
Water withdrawals for irrigation purposes can seriously deplete water flow, as can industrialwater withdrawals. Dams used for electric power generation, particularly facilities designed toproduce power during periods of peak need, often block the flow of a stream and later release it ina surge.
Flow is a function of water volume and velocity. It is important because of its impact on waterquality and on the living organisms and habitats in the stream. Large, swiftly flowing rivers canreceive pollution discharges and be little affected, whereas small streams have less capacity to diluteand degrade wastes.
Stream velocity, which increases as the volume of the water in the stream increases, determinesthe kinds of organisms that can live in the stream (some need fast-flowing areas; others need quietpools). It also affects the amount of silt and sediment carried by the stream. Sediment introduced toquiet, slow-flowing streams will settle quickly to the stream bottom. Fast moving streams will keepsediment suspended longer in the water column. Lastly, fast moving streams generally have higherlevels of dissolved oxygen than slow streams because they are better aerated.
This Appendix describes one method for estimating flow in a specific area or reach of a stream.It is adapted from techniques used by several volunteer monitoring programs and uses a float (anobject such as an orange, ping-pong ball, orange, etc.) to measure stream velocity. Calculating flowinvolves solving an equation that examines the relationship among several variables including streamcross-sectional area, stream length, and water velocity. One way to measure flow is to solve thefollowing equation:

29
Flow = A L C
T
where:
A = Average cross-sectional area of the stream (stream width multiplied by average water depth).L = Length of the stream reach measured (usually 20 ft.)C = A coefficient or correction factor (0.8 for rocky-bottom streams or 0.9 for muddy-bottom
streams). This allows you to correct for the fact that water at the surface travels faster than nearthe stream bottom due to resistance from gravel, cobble, etc. Multiplying the surface velocityby a correction coefficient decreases the value and gives a better measure of the stream's overallvelocity.
T = Time, in seconds, for the float to travel the length of L
How to Measure and Calculate Stream Flow
TASK 1 Prepare before leaving for the sampling site
Refer to the Level I Appendix for details on safety considerations. In addition to the standardsampling equipment and apparel (rubber boots or waders), when measuring and calculating flow,include the following equipment:
· Ball of heavy-duty string, four stakes, and a hammer to drive the stakes into the ground. The stringwill be stretched across the width of the stream perpendicular to shore at two locations. Thestakes are to anchor the string on each bank to form a transect line.
· Tape measure (at least 20 feet)
· Waterproof yardstick or other implement to measure water depth· Twist ties (to mark off intervals on the string of the transect line)· An orange and a fishing net (to scoop the orange out of the stream)· Stopwatch (or watch with a second hand)· Calculator (optional)
TASK 2 Select a stretch of stream
The stream stretch chosen for the measurement of discharge should be straight (no bends), atleast 6 inches deep, and should not contain an area of slow water such as a pool. Unobstructed rifflesor runs are ideal. The length that you select will be equal to L in solving the flow equation. Twenty

30
Figure 3. A diagram of a 20 foot transect.
feet is a standard length used by many programs. Measure your length and mark the upper and lowerend by running a transect line across the stream perpendicular to the shore using the string and stakes(Figure 3). The string should be taut and near the water surface. The upstream transect is Transect#1 and the downstream one is Transect #2.
TASK 3 Calculate the averagecross sectional area
Cross-sectional area (A in theformula) is the product of streamwidth multiplied by average waterdepth. To calculate the averagecross-sectional area for the studystream reach, volunteers shoulddetermine the cross-sectional areafor each transect, add the resultstogether, and then divide by 2 todetermine the average cross-sectional area for the stream reach.
To measure cross-sectional area:
1. Determine the average depth along the transect by marking off equal intervals along the stringwith the twist ties. The intervals can be one-fourth, one-half, and three-fourths of the distance acrossthe stream. Measure the water's depth at each interval point (Figure 4). To calculate average depthfor each transect, divide the total of the three depth measurements by 4. (You divide by 4 instead of3 because you need to account for the � depths that occur at the shores ) In the sample calculationshown, the average depth of Transect #l is 0.575 feet and the average depth of Transect #2 is 0.625feet.
2. Determine the width of each transect by measuring the distance from shoreline to shoreline.Simply add together all the interval widths for each transect to determine its width. In the examplegiven (Figure 4), the width of Transect #l is 8 feet and the width of Transect #2 is 10 feet.

31
Figure 4. A cross-section view to measure streamwidth and depth.
Example Determining Average Cross-Sectional Area (A)
Transect #1 (upstream) Transect #2 (downstream)
Interval Depth Interval DepthWidth Width(feet) (feet) (feet) (feet)
A to B = 2.0 1.0 (at B) A to B= 2.5 1.1 (at B)
B to C = 2.0 0.8 (at C) B to C= 2.5 1.0 (at C)
C to D = 2.0 0.5 (at D) C to D= 2.5 0.4 (at D)
D to E = 2.0 0.0 (shoreline) D to E= 2.5 0.0 (shoreline)
Totals 8.0 2.3 10.0 2.5
Average depth = 2.3/4 = 0.575 feet Average depth = 2.5/4 = 0.625 feetCross-sectional area of Transect #1 Cross-sectional area of Transect #2= Total width X Average depth = Total width X Average depth= 8ft X 0.575 = 10.0ft X 0.625= 4.60 ft2 = 6.25 ft2
Average area = (Cross-sectional area of Transect #1 + Cross-sectional area of Transect #2) /2 = (4.60ft2 + 6.25 ft2) /2 = 5.42 ft2
3. Calculate the cross-sectional area of each transect by multiplying width times average depth. Theexample shows that the average cross-sectional area of Transect #l is 4.60 square feet and theaverage cross-sectional area of Transect #2 is 6.25 square feet.

32
4. To determine the average cross sectional area of the entire stream reach (A in the formula), addtogether the average cross-sectional area of each transect and then divide by 2. The average cross-sectional area for the stream reach depicted in Figure 4 is 5.42 square feet.
Task 4 Measure travel time
Volunteers should time with a stopwatch how long it takes for an orange (or some other object) tofloat from the upstream to the downstream transect. An orange is a good object to use because it hasenough buoyancy to float just below the water surface. It is at this position that maximum velocitytypically occurs.
The volunteer who lets the orange go at the upstream transect should position it so it flows into thefastest current. The clock stops when the orange passes fully under the downstream transect line.Once under the transect line, the orange can be scooped out of the water with the fishing net. This"time of travel" measurement should be conducted at least three times and the results averaged—themore trials you do, the more accurate your results will be. The averaged results are equal to T in theformula. It is a good idea to float the orange at different distances from the bank to get variousvelocity estimates. You should discard any float trials if the object gets hung up in the stream (bycobbles, roots, debris, etc.)
Task 5 Calculate flow
Recall that flow can be calculated using the equation:
Flow = ALC
T
Continuing the example in Fig. 5.6. say the average time of travel for the orange between Transect#1 and #2 is 15 seconds and the stream had a rocky bottom. The calculation of flow would be:
A = 5.42ft2
L = 20 ft
C =0.8 (coefficient for a rocky-bottom stream)
T = 15 seconds

33
Flow =(5.42 ft ) (20 ft) (0.8) = 86.72 ft3
1 5 sec. 15 sec
Flow = 5.78 ft3/sec.
Task 6 Record flow on the data form
On the following page is a form volunteers can use to calculate flow of a stream.
References
Adopt-A-Stream Foundation. Field Guide: Watershed Inventory and Stream Monitoring Methods,by Tom Murdoch and Martha Cheo. 1996.
Everett, WA. Mitchell, M.K., and W. Stapp. Field Manual for Water Quality Monitoring. 5thEdition. Thompson Shore Printers.
Missouri Stream Teams. Volunteer Water Quality Monitoring. Missouri Department of NaturalResources, P.O. Box 176. Jefferson City, MO 65102.

34
DATA FORM FOR CALCULATING FLOW
Solving the equation: Flow = ALC T
Where:A = Average cross-sectional area of the stream. L = Length of the stream reach measured (usually20 ft.).C = A coefficient or correction factor (0.8 for rocky-bottom streams or 0.9 for muddy-bottom streams). T = Time, in seconds, for the float to travel the length of L.
A: Average Cross-Sectional Area
Transect #1 (upstream) Transect #2 (downstream)
Interval Depth Interval DepthWidth Width(feet) (feet) (feet) (feet)
Ato B = ____ ____ (at B) A to B = ____ ____ (at B)
B to C = ____ ____ (at C) B to C = ____ ____ (at C)
C to D = ____ ____ (at D) C to D = ____ ____ (at D)
D to E = ____ ____ (shoreline) D to E = ____ ____ (shoreline)
Totals _____ _____ /4 Totals _____ _____ /4
= Avg. depth ______ ft = Avg. depth ______ ft
Cross-sectional area of Transect #1Cross-sectional area of Transect #2= Total width (ft) X Avg. depth (ft) = Total width (ft) X Avg. depth (ft)
_____ X _____ = _____ft2 _____ X _____ = _____ft2
(Cross-sectional area of Transect #1 + Cross-sectional area of Transect #2) ÷ 2 =
Average Cross-sectional area = (______ ft2 + _______ft2) ÷ 2 = ________ft2
C: Coefficient________
L: Length of Stream Reach ___________ ft

35
T:Travel Time of Float (sec.) Trial #1 _____sec
Trial #2 _____sec
Trial #3 _____sec
Total time= _____ sec
T = Average time = Total time/3 = ______ sec
Flow = ALC = Average Cross-sectional Area x Length x C = ________ ft3/sec T Average time
36
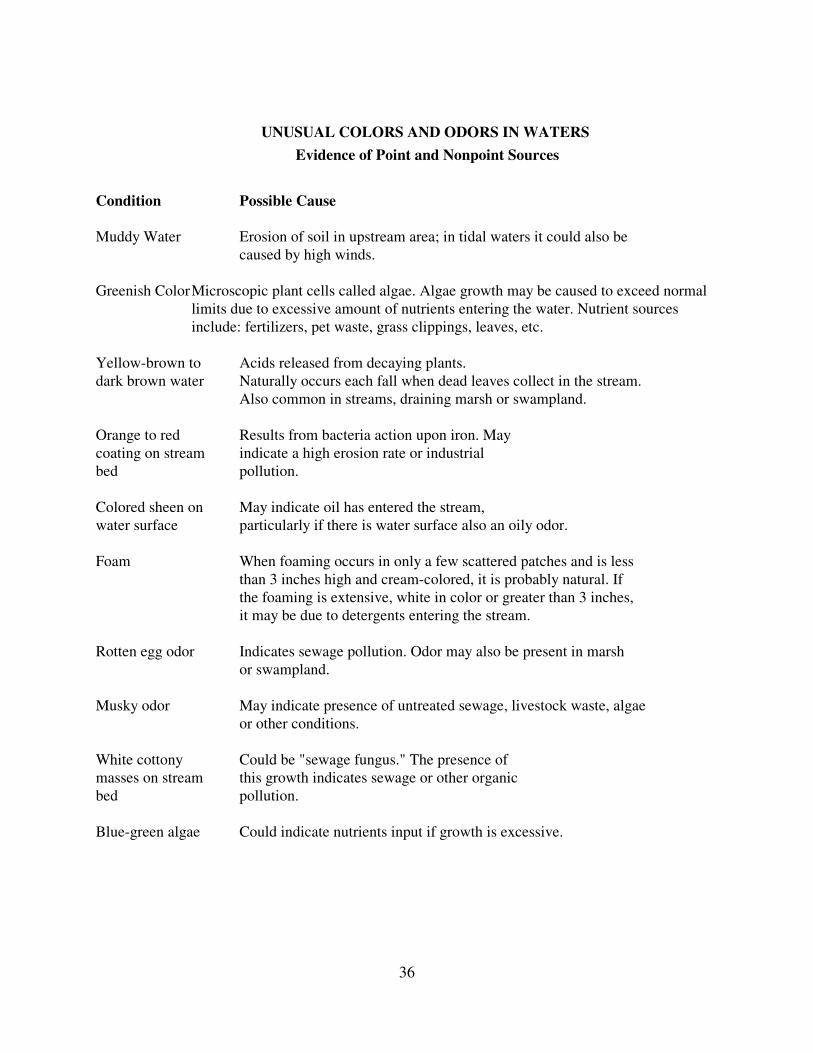
UNUSUAL COLORS AND ODORS IN WATERS Evidence of Point and Nonpoint Sources
Condition Possible Cause
Muddy Water Erosion of soil in upstream area; in tidal waters it could also becaused by high winds.
Greenish ColorMicroscopic plant cells called algae. Algae growth may be caused to exceed normallimits due to excessive amount of nutrients entering the water. Nutrient sourcesinclude: fertilizers, pet waste, grass clippings, leaves, etc.
Yellow-brown to Acids released from decaying plants.dark brown water Naturally occurs each fall when dead leaves collect in the stream.
Also common in streams, draining marsh or swampland.
Orange to red Results from bacteria action upon iron. Maycoating on stream indicate a high erosion rate or industrialbed pollution.
Colored sheen on May indicate oil has entered the stream,water surface particularly if there is water surface also an oily odor.
Foam When foaming occurs in only a few scattered patches and is lessthan 3 inches high and cream-colored, it is probably natural. If the foaming is extensive, white in color or greater than 3 inches, it may be due to detergents entering the stream.
Rotten egg odor Indicates sewage pollution. Odor may also be present in marsh or swampland.
Musky odor May indicate presence of untreated sewage, livestock waste, algaeor other conditions.
White cottony Could be "sewage fungus." The presence ofmasses on stream this growth indicates sewage or other organicbed pollution.
Blue-green algae Could indicate nutrients input if growth is excessive.

37
Evaluation of Stream Conditions
Observable Condition Likely Causes For Further Investigation
Sediment: the stream bottom is almostcompletely covered with deposition andthere may be moving sand bars.Sedimentation may be associated withbrown stream color during high now.
Mud, silt, or sand on the stream bottommay result from surface runoff fromconstruction sites or exposed soils,channel alterations, or bankundercutting and slumping.
Examine upstream areas for developmentactivities with inadequate sedimentcontrol, streambank modification, orseverely undercut or slumping streambanks. Unpaved roads can also be asignificant source of sediment.
Aquatic Weeds: covering the watersurface or stream bottom, especially inpond or slow moving areas withsunlight.
This may be a difficult problem toassess because aquatic plants can beindicators of a high quality habitat, suchas a wetland, or a shallow, muddybackwater. Sometimes, however, theyare a symptom of excessive nutrients,especially when there are longstreamers present.
Examine upstream areas for sources ofnutrients such as sewage, heavilyfertilized areas (i.e. golf courses orcroplands), car washes, livestock areas,or washwater discharges from foodprocessing industries.
Algae: floating or attached tiny plantswhich can color the water green,resemble seaweed when affixed to thestream bottom, form a surface scum, orhave an oil-like appearance.
Algal growth indicates an upstreamnutrient source.
Examine upstream areas for sources ofnutrients (see above).
Foam or Bubble: floating on the watersurface.
When foaming occurs in only a few,scattered patches and is less than 3inches high and cream colored it isprobably natural. If the foaming isextensive, white in color or greater than3 inches, it may be due to detergents orsurfactants entering the stream. Whitefoam can also be caused by fertilizerleachate.
Examine upstream areas for industrial,municipal, or residential wastewatersources, or other sources of nutrients.
Bank Stains or Dry Weather DischargesFrom Pipes: stains may be observed onstream banks . (which would indicate aspill, leachate, or a sporadic discharge)or below pipes (which suggests anintermittent or periodic discharge). Dryweather flow may be discharged frompipes protruding from the sreambank orfrom storm sewer pipes (normally largeand composed of concrete).
Bank stains and mats of dried materials,especially below pipes, are likely toindicate sporadic discharges of oil,organic wastes, or the discharges ofwashwaters or process wastes. Dryweather flow from storm sewer pipeswould suggest washwaters from pavedareas or direct connections tocommercial or industrial drains. Flowfrom other pipes along the streambanks may be non-contact cooling water(legal with a permit) or washwaters orprocess wastewaters from nearbyactivities.
Examine the stain or discharge and itstexture. Is it familiar? Stains anddischarges from pipes along the streambanks are likely to result from nearby oradjacent activities. However, dryweather flows discharged from stormsewers can come from remotelocations. The procedure for locating thesource of such discharges is to followthe storm sewer. Continue looking orlistening for flow in curbside inlets orstorm sewer manholes until you find thedischarge source or identify the activitywhich is discharging.
Leaking or Surcharging Sanitary Sewersor Manholes: white to grey muskysmelling discharges from a joint or acrack in a plies (normally-cast iron) or asewer manhole. Sewage may be seengushing from a manhole top. Grey mattymaterial draped on or deposited near amanhole may indicate past overflows.
Sanitary sewers and manholes can Gilor clog over the course of time and leakor surcharge from manholes .
Report immediately to the local publicworks department.
Dingy White or Grey (or even Brownstained) Cotton-like Tufts: hair-likegrowths which are attached to thestream bottom or objects in the stream.
This growth is probably Sphaerotilus, asheath or iron bacterium, which thriveson organic matter. When a continuingabundance of organic wastes isavailable they grow in colonies whichresemble dingy cotton. This could alsobe sulphur bacteria.
Look for nearby wastewater dischargesor sources of nutrients and organicwastes such as food processing plants.
Red Mats: on the stream bottom, whichappear to be shimmering with thecurrent and disappear when disturbed.(Not to be confused with iron bacteria).
These are colonies of aquatic,segmented worms called sludge wormsor aquatic worms. These individualsresemble small earthworms and arealso an indication of heavy organicwaste loads
Examine upstream areas for sources oforganic wastes.
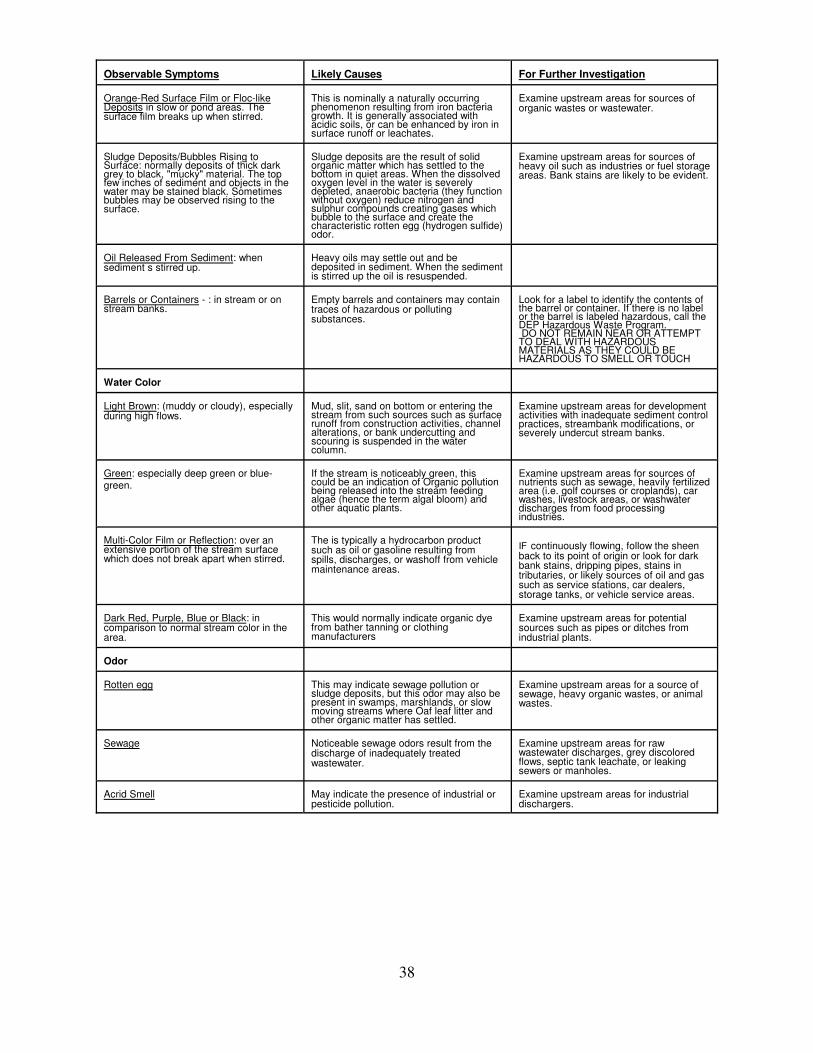
38
Observable Symptoms Likely Causes For Further Investigation
Orange-Red Surface Film or Floc-likeDeposits in slow or pond areas. Thesurface film breaks up when stirred.
This is nominally a naturally occurringphenomenon resulting from iron bacteriagrowth. It is generally associated withacidic soils, or can be enhanced by iron insurface runoff or leachates.
Examine upstream areas for sources oforganic wastes or wastewater.
Sludge Deposits/Bubbles Rising toSurface: normally deposits of thick darkgrey to black, "mucky" material. The topfew inches of sediment and objects in thewater may be stained black. Sometimesbubbles may be observed rising to thesurface.
Sludge deposits are the result of solidorganic matter which has settled to thebottom in quiet areas. When the dissolvedoxygen level in the water is severelydepleted, anaerobic bacteria (they functionwithout oxygen) reduce nitrogen andsulphur compounds creating gases whichbubble to the surface and create thecharacteristic rotten egg (hydrogen sulfide)odor.
Examine upstream areas for sources ofheavy oil such as industries or fuel storageareas. Bank stains are likely to be evident.
Oil Released From Sediment: whensediment s stirred up.
Heavy oils may settle out and bedeposited in sediment. When the sedimentis stirred up the oil is resuspended.
Barrels or Containers - : in stream or onstream banks.
Empty barrels and containers may containtraces of hazardous or pollutingsubstances.
Look for a label to identify the contents ofthe barrel or container. If there is no labelor the barrel is labeled hazardous, call theDEP Hazardous Waste Program. DO NOT REMAIN NEAR OR ATTEMPTTO DEAL WITH HAZARDOUSMATERIALS AS THEY COULD BEHAZARDOUS TO SMELL OR TOUCH
Water Color
Light Brown: (muddy or cloudy), especiallyduring high flows.
Mud, slit, sand on bottom or entering thestream from such sources such as surfacerunoff from construction activities, channelalterations, or bank undercutting andscouring is suspended in the watercolumn.
Examine upstream areas for developmentactivities with inadequate sediment controlpractices, streambank modifications, orseverely undercut stream banks.
Green: especially deep green or blue-green.
If the stream is noticeably green, thiscould be an indication of Organic pollutionbeing released into the stream feedingalgae (hence the term algal bloom) andother aquatic plants.
Examine upstream areas for sources ofnutrients such as sewage, heavily fertilizedarea (i.e. golf courses or croplands), carwashes, livestock areas, or washwaterdischarges from food processingindustries.
Multi-Color Film or Reflection: over anextensive portion of the stream surfacewhich does not break apart when stirred.
The is typically a hydrocarbon productsuch as oil or gasoline resulting fromspills, discharges, or washoff from vehiclemaintenance areas.
IF continuously flowing, follow the sheenback to its point of origin or look for darkbank stains, dripping pipes, stains intributaries, or likely sources of oil and gassuch as service stations, car dealers,storage tanks, or vehicle service areas.
Dark Red, Purple, Blue or Black: incomparison to normal stream color in thearea.
This would normally indicate organic dyefrom bather tanning or clothingmanufacturers
Examine upstream areas for potentialsources such as pipes or ditches fromindustrial plants.
Odor
Rotten egg This may indicate sewage pollution orsludge deposits, but this odor may also bepresent in swamps, marshlands, or slowmoving streams where Oaf leaf litter andother organic matter has settled.
Examine upstream areas for a source ofsewage, heavy organic wastes, or animalwastes.
Sewage Noticeable sewage odors result from thedischarge of inadequately treatedwastewater.
Examine upstream areas for rawwastewater discharges, grey discoloredflows, septic tank leachate, or leakingsewers or manholes.
Acrid Smell May indicate the presence of industrial orpesticide pollution.
Examine upstream areas for industrialdischargers.
39
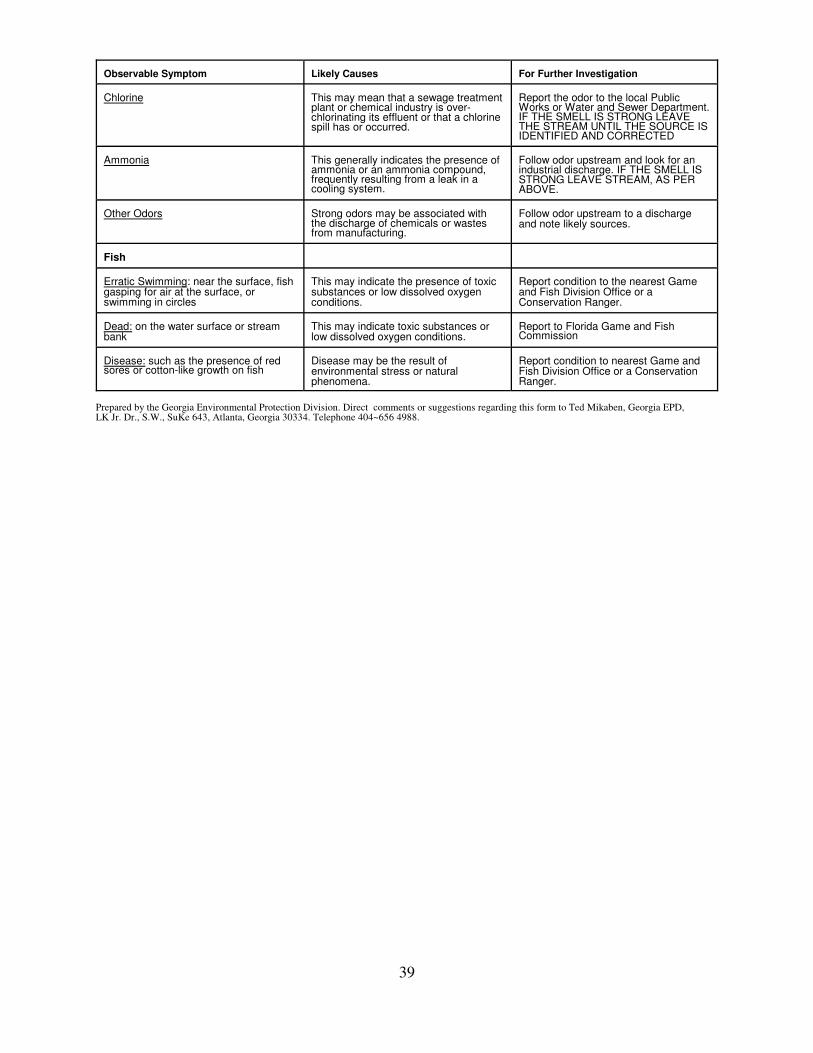
Observable Symptom Likely Causes For Further Investigation
Chlorine This may mean that a sewage treatmentplant or chemical industry is over-chlorinating its effluent or that a chlorinespill has or occurred.
Report the odor to the local PublicWorks or Water and Sewer Department.IF THE SMELL IS STRONG LEAVETHE STREAM UNTIL THE SOURCE ISIDENTIFIED AND CORRECTED
Ammonia This generally indicates the presence ofammonia or an ammonia compound,frequently resulting from a leak in acooling system.
Follow odor upstream and look for anindustrial discharge. IF THE SMELL ISSTRONG LEAVE STREAM, AS PERABOVE.
Other Odors Strong odors may be associated withthe discharge of chemicals or wastesfrom manufacturing.
Follow odor upstream to a dischargeand note likely sources.
Fish
Erratic Swimming: near the surface, fishgasping for air at the surface, orswimming in circles
This may indicate the presence of toxicsubstances or low dissolved oxygenconditions.
Report condition to the nearest Gameand Fish Division Office or aConservation Ranger.
Dead: on the water surface or streambank
This may indicate toxic substances orlow dissolved oxygen conditions.
Report to Florida Game and FishCommission
Disease: such as the presence of redsores or cotton-like growth on fish
Disease may be the result ofenvironmental stress or naturalphenomena.
Report condition to nearest Game andFish Division Office or a ConservationRanger.
Prepared by the Georgia Environmental Protection Division. Direct comments or suggestions regarding this form to Ted Mikaben, Georgia EPD, LK Jr. Dr., S.W., SuKe 643, Atlanta, Georgia 30334. Telephone 404~656 4988.

40
Group:____________________________________Stream site:________________________________Date:_____________________________________Quarter:___________________________________Form Completed by:_________________________Phone:____________________________________
Send, e-mail, or fax a copy to Hillsborough County Stream-Waterwatch (HCC StreamWaterwatch) 1206 N. Park Road, Plant City , FL 33566; [email protected], fax: (813) 757-2148. each quarter, before March 31, June 30,September 30 and December 31. Attach latest results from Watershed Walk or Visual Survey.
Activity Date Completed
Watershed Walk (one per year)
Visual Surveys (one per quarter)
1st Quarter
2nd Quarter
3rd Quarter
4th Quarter
Litter Pick Ups (one per quarter)
1st Quarter
2nd Quarter
3rd Quarter
4th Quarter
Other? Please describe
Comments:____________________________________________________________________

41
HILLSBOROUGH COUNTY STREAM WATERWATCHWATERSHED WALK SURVEY FORM
Stream Name:______________________________________Date:________________________
Stream Segment. Include a map with starting and ending points: a road crossing, a county park,another stream.
GroupLeader:__________________________Phone:___________________________________
Participants:____________________________________________________________________
Date of last rainfall:_____________ Water flow � high � normal � low
Weather conditions:__________________Air temperature:______________________________
Water temperature:______________
AFTER THE WATERSHED WALK: SUMMARY
In each of the five areas listed below, comment on:
1. Overall conditions,2. Any conditions that warrant particular attention, or3. Any conditions in which you noticed a major change along the length of your segment.
LAND USE:___________________________________________________________________
BANK CONDITIONS:___________________________________________________________
SURFACE WATER AND WATER CLARITY:_______________________________________
STREAM BED:________________________________________________________________
HUMAN IMPACTS:___________________________________________________________
OVERALL ASSESSMENT (from Chart A):� EXCELLENT � GOOD/FAIR � POOR
42
HILLSBOROUGH COUNTY STREAM WATERWATCH
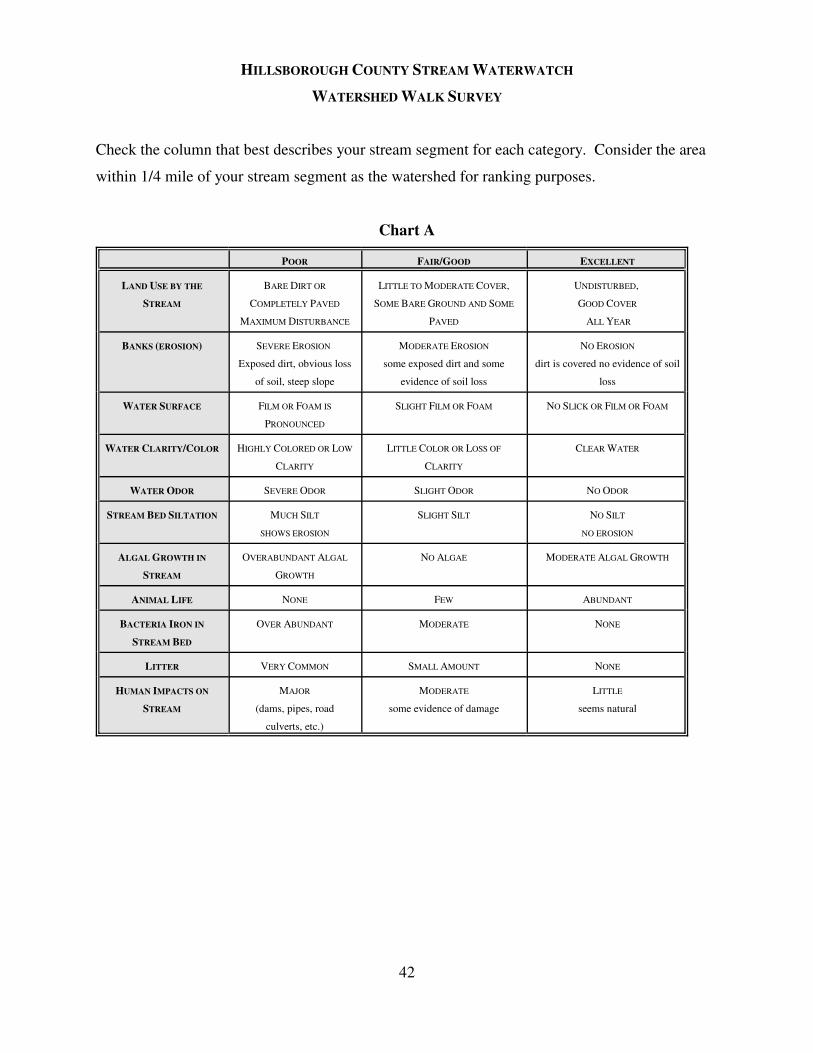
WATERSHED WALK SURVEY
Check the column that best describes your stream segment for each category. Consider the area
within 1/4 mile of your stream segment as the watershed for ranking purposes.
Chart A
POOR FAIR/GOOD EXCELLENT
LAND USE BY THE
STREAM
BARE DIRT OR
COMPLETELY PAVED
MAXIMUM DISTURBANCE
LITTLE TO MODERATE COVER,
SOME BARE GROUND AND SOME
PAVED
UNDISTURBED,
GOOD COVER
ALL YEAR
BANKS (EROSION) SEVERE EROSION
Exposed dirt, obvious loss
of soil, steep slope
MODERATE EROSION
some exposed dirt and some
evidence of soil loss
NO EROSION
dirt is covered no evidence of soil
loss
WATER SURFACE FILM OR FOAM IS
PRONOUNCED
SLIGHT FILM OR FOAM NO SLICK OR FILM OR FOAM
WATER CLARITY/COLOR HIGHLY COLORED OR LOW
CLARITY
LITTLE COLOR OR LOSS OF
CLARITY
CLEAR WATER
WATER ODOR SEVERE ODOR SLIGHT ODOR NO ODOR
STREAM BED SILTATION MUCH SILT
SHOWS EROSION
SLIGHT SILT NO SILT
NO EROSION
ALGAL GROWTH IN
STREAM
OVERABUNDANT ALGAL
GROWTH
NO ALGAE MODERATE ALGAL GROWTH
ANIMAL LIFE NONE FEW ABUNDANT
BACTERIA IRON IN
STREAM BED
OVER ABUNDANT MODERATE NONE
LITTER VERY COMMON SMALL AMOUNT NONE
HUMAN IMPACTS ON
STREAM
MAJOR
(dams, pipes, road
culverts, etc.)
MODERATE
some evidence of damage
LITTLE
seems natural

43
HILLSBOROUGH COUNTY STREAMWATERWATCH
Visual Survey
Use this form to record important information about the health of your stream. By keepingaccurate and consistent records of your observations, you can document current conditions andchanges in water quality and habitat.Name of Stream Location
Individual or Group Members Present
Date CountyWeather Conditions� clear� cloudy � rain � rain within last 24 to 48 hours?Visual Survey
Water Flow � high � normal � low � measured _______ cfsNumber of pools _______Number of riffles_____Stream Width_____ft. Stream Depth______ft.USDA Texture Classification_____________% Sand_______% Silt________%Clay________Water Appearance� clear � milky/gray � none � rotten egg� muddy � green � natural � sewage� oily � brown � gasoline or oil � chemical� foamy � black � chlorine � other________� scum � other ________Habitat Description Excellent Good Fair Poor(use Chart B) Stream Bed � � � �
Sediment Deposits � � � �
Streambank Stability � � � �
Streambank Cover � � � �
Algae Appearance: Algae Located:� light green � not present� dark green � in spots� brown coated � attached� matted on stream bed � everywhere� hairy
� Other Observations? Wildlife?___________________________________________________� Evidence of Pollution? How much/what kind?______________________________________� Litter or Trash in area? How much/what kind?______________________________________

44
Chart B
Habitat Excellent Good Fair PoorDescription
Stream Bed More than 50% 50% to 30% rocks, 30% to 10% rocks, Less than 10%rocks, logs, logs, vegetation, or logs, vegetation, or rocks, logs,vegetation, undercut banks. undercut banks. vegetation, orundercut banks or Adequate habitat Less than desirable undercut banks.other stable habitat. for fish and aquatic habitat for fish and Obvious lack ofinsects. habitat for fish and aquatic insects. Habitats for fish and
aquatic insects. aquatic insects.
Sediment Little or no Some sediment Moderate sediment Heavy deposits ofDeposits sediment deposits. deposits, mostly in deposits. 30% to sediment. More
Less than 5% of pools. 5% to 30%50% of stream bed than 50% ofstream bed has of stream bed has has sediment. stream bed hassediment. sediment. sediment.
Streambank Stable. No Moderately stable. Moderately Unstable. 60%toStability evidence of Only small areas of unstable. Up to 100% of banks
erosion. erosion. 60% of banks have have evidence ofevidence of erosion. erosion.
Streambank More than 80% of 80% to 50% of 50% to 25% of Less than 25% ofCover streambank covered streambank covered streambank covered streambank
with vegetation, with vegetation, with vegetation, covered withrocks and other rocks and other rocks and other vegetation, rocksstable material. stable material. stable material. and other stable
material.

45
Complete the following questions to help you structure your program. This form must be completedand returned to register your adopted site with Hillsborough County Stream Waterwatch.
Name of Adopted Site Date
Location of Stream/River Segment
Initiating Organization
Lead Coordinator
Mailing Address Zip Code
Phone Number(s) Fax
Street Address (if different from mailing address)
What is the name of your adopted project?

Level II Field GuideBiological and Chemical Monitoring

2
ACKNOWLEDGMENTS
This manual draws on the experience of many outstanding citizen monitoring , stewardship andeducation programs. Hillsborough County Stream-Waterwatch gratefully acknowledges thefollowing organizations for their advice and use of materials:
City of Tampa Advanced Wastewater Treatment PlantEPA Office of WaterFlorida Department of Environmental ProtectionGeorgia Adopt-A-StreamHillsborough River Greenways Task ForceHillsborough Community CollegeHillsborough County Public Works Stormwater Management DivisionHillsborough County Environmental Protection CommissionSave our Streams, Izaak Walton League of America
The preparation of this manual was supported through a grant from the Florida Game and FreshWater Fish Commission’s Advisory Council on Environmental Education and the SouthwestFlorida Water Management District. The project is a joint effort by the County of Hillsboroughand Hillsborough Community College.

3
LEVEL II FIELD GUIDETABLE OF CONTENTS
Page
Introduction 4Quality Assurance Certification 4Biological Monitoring 5Physical/Chemical Tests 9Habitat Enhancement 11
Appendices Some Background on Aquatic Insects 17The Aquatic Realm 19Rapid Bioassessment Procedure 24Stream Insects and Crustaceans (Save our Streams) 26Speed Key for use with Stream Insects and Crustaceans 28Why Are Chemical Tests Important? 30
Temperature 30pH 31Dissolved Oxygen (DO) 32Turbidity 35
Clarity using a Secchi Disk 37Transparency Tube 38
Nutrients- Nitrate and Phosphate 39Alkalinity 40Salinity 40Measuring Rainfall 41
Water Quality Criteria For the State of Florida 42EPC Water Monitoring Stations Hillsborough County 44EPC Tributary Stations 45Selected data for Tributary Stations 46How to Make a Kick Seine 51
Forms 52

4
INTRODUCTION
Hillsborough County Stream-Waterwatch encourages volunteers to learn about waterquality conditions of local streams, rivers and lakes. This manual describes methods tofurther evaluate water quality and more opportunities to protect and improve water quality.
Level I emphasizes watershed walks and visual surveys as evaluation tools. Levels IIand III focuses on biological and chemical monitoring of water quality and habitat. Likewise,Level I volunteers help improve water quality by cleaning up litter in and around theiradopted stream. In Levels II and III, volunteers can choose a habitat enhancement project toimprove water quality. In all levels, gathering and sharing information about the adoptedstream, and reporting problems when noticed, helps protect water quality.
The difference between Levels II and III is one of increasing activity. Level IIvolunteers choose one of the activities below, in addition to the Level I activities. Level IIIvolunteers choose two or more of the activities below, in addition to Level I activities.
· Biological Monitoring 4 times a year (quarterly)· Physical/Chemical Monitoring 12 times a year (monthly)· Habitat Enhancement one time project (arranged with Hillsborough County)
Biological and Chemical Monitoring require training. Training workshops are availablethrough the Hillsborough County Stream-Waterwatch at the Regional Environmental TrainingCenter at HCC’s Plant City Campus. Training will include an overview of the program,monitoring techniques and quality assurance tests.
These activities help protect water quality and streams because:
Regular monitoring provides specific information about the health of your local stream. Bothlong-term trends and immediate changes in water quality can be documented. Biologicalmonitoring will detect changes in water quality and habitat and provides an indication ofoverall stream health. Chemical monitoring, however, provides specific information aboutwater quality parameters that are important to aquatic life--such as dissolved oxygen and pH.Habitat enhancement projects improve streambanks or the streambed. Habitat enhancementprojects may stop a streambank from eroding, and therefore decrease the amount of sedimententering a stream or improve in-stream habitat for fish to feed, hide and lay eggs.
Quality Assurance Certification
If volunteers wish to ensure their data is of the highest quality, volunteers can become qualityassurance (QA/QC) certified. Quality assured volunteer data will be used by various local

5
and state assessments of water quality conditions. Quality assurance certification will be apart of every chemical and biological training workshop. Water quality data collected onstreams, rivers and lakes has many informational purposes. However, a permanent record ofonly data collected by quality assured volunteers will be kept.
Chemical Certification
� Volunteer's methods and test kits must achieve results within 10% of those obtainedby a certified trainer.
� Volunteers and their test kits must be QA/QC certified annually.
� Volunteers must sample once a month for one year and send results to HillsboroughCounty Stream-Waterwatch.
Biological Certification
� Volunteers must demonstrate the ability to collect a macro invertebrate sample to acertified trainer.
� Volunteers must identify, with 90%accuracy, not less than 20 macroinvertebrates andcorrectly calculate the SOS Index forwater quality.
� Volunteers must be QA/QC certifiedannually.
� Volunteers must sample once everythree months for one year and sendresults to Hillsborough CountyStream-Waterwatch.
BIOLOGICAL MONITORING(based on the Save Our Streams program Izaak Walton League of America)
Biological monitoring involves identifying and counting macro invertebrates. Thepurpose of biological monitoring is to quickly assess both water quality and habitat. Theabundance and diversity of macro invertebrates found is an indication of overall streamquality.
Macro invertebrates are aquatic insects, crayfish, and snails that live in various stream

6
habitats and are used as indicators of stream quality. Macro invertebrates are present duringall kinds of stream conditions--from drought to floods. These insects and crustaceans areimpacted by all the stresses that occur in a stream environment, both man-made and naturallyoccurring. Follow steps one through three to complete a biological sample of your stream.
1. Find a sampling location in your stream. Macro invertebrates can be found in many kindsof habitats--places like riffles (where shallow water flows quickly over rocks), packs ofleaves, roots hanging into the water, old wood or logs, or the stream bed. If present, riffleareas will have the most macro invertebrates. If you have a stream with riffles, followstep 2a below. If your stream has a muddy or sandy bottom (and no riffles), you willsample using the method in step 2b below. Sample the same stretch of stream each time, toensure consistency (for example 50 yard stretch). Sample every three months, approximatelyonce each season (spring, summer, fall, and winter).
Equipment List: Optional:D-frame net or kick seine preservation jars or baby food jarssorting pan rubbing alcohol, for preservation,forceps bucket with screen bottompencils and clipboard (for muddy bottom sampling)hand lensBiological SurveySOS Macro invertebrate guiderubber waders or old tennis shoesrubber gloves
2. Sampling Methodology
a) For streams with riffles:
In this "rocky bottom" method, you will sample two different habitats--riffles and leafpacks.First, identify three riffle areas. Collect macro invertebrates in all three riffles with a kickseine, sampling a 2 x 2 foot area (the kick seines are usually 3 x 3 feet). Look for an areawhere the water is 3 to 12 inches deep. Place the kick seine downstream and firmly wedgethe seine into the stream bed. Gently rub any loose debris off rocks and sticks so that youcatch everything in the seine. When you have "washed off" all the rocks in a 2 x 2 foot area,kick the stream bed with your feet. Push rocks around, shuffle your feet so that you reallykick up the stream bed. Now gently lift the seine, being careful not to lose any of the macroinvertebrates you have caught. Take the seine to an area where you can look it over or wash thecontents into a bucket. Now look for decayed (old, dead) packs of leaves next to rocks or logs oron the stream bed. Add 4 handfuls of decayed leaves to your sample. The total area of stream youwill sample is 16 square feet.
b) For muddy bottom streams:
In this method, you will sample three different habitats, using a D-frame (or dip) net. The

7
habitats are: vegetated margins, wood debris with organic matter, and sand/rock/gravelstream bed (or substrate). In this method you will scoop the stream a total of 14 times or 14square feet. Each scoop involves a quick forward motion of one foot. To maintain consistency,collect the following numbers of scoops from each habitat each time you sample:
- 7 scoops from vegetated margins- 4 scoops from woody debris with organic matter- 3 scoops from sand/rock/gravel or coarsest area of the stream bed
As you collect your scoops, place the contents of the net into a bucket. Separate thesamples collected from the rocky stream bed and vegetated margin or woody debris samples.Keep water in the bucket to keep the organisms alive. Note descriptions below of each muddybottom habitat and collection tips:
Vegetated margins
This habitat is the area along the bank and the edge of the waterbody consisting ofoverhanging bank vegetation, plants living along the shoreline. and submerged root mats.Vegetated margins may be home to a diverse assemblage of dragonflies, damselflies, and otherorganisms. Move the dip-net quickly in a bottom-to-surface motion, jabbing at the bank to loosenorganisms. Each scoop of the net should cover one foot of submerged (under water) area.
Woody debris with organic matter
Woody debris consists of dead or living trees, roots, limbs, sticks, leafpacks, cypressknees and other submerged organic matter. It is a very important habitat in slow moving streamsand rivers. The wood helps trap organic particles that serve as a food source for the organismsand provides shelter from predators, such as fish.
To collect woody debris, approach the area from downstream and hold the net under thesection of wood you wish to sample, such as a submerged log. Rub the surface of the log for atotal surface area of one square foot. It is also good to dislodge some of the bark as organismsmay be hiding underneath. You can also collect sticks, leaf litter, and rub roots attached tosubmerged logs. Be sure to thoroughly examine any small sticks you collect with your net before discarding them. There may be caddisflies, stoneflies, riffle beetles, and midges attachedto the bark.
Sand/rock/gravel stream bed
In slow moving streams, the stream bottom is generally composed of only sand or mudbecause the velocity of the water is not fast enough to transport large rocks. Sample the coarsestarea of the stream bed--gravel or sand may be all you can find. Sometimes, you may find a gravelbar located at a bend in the river. The stream bed can be sampled by moving the net forward(upstream) with a jabbing motion to dislodge the first few inches of gravel, sand, or rocks. Youmay want to gently wash the gravel in your screen bottom bucket and then discard gravel in thewater.
If you have large rocks (greater than two inches diameter) you should also kick the

8
bottom upstream of the net to dislodge any burrowing organisms. Remember to disturb only onefoot upstream of the net for each scoop.
Each time you sample you should sweep the mesh bottom of the D-Frame net back andforth through the water (not allowing water to run over the top of the net) to rinse fine silt fromthe net. This will avoid a large amount of sediment and silt from collecting in the pan, which willcloud your sample.
3. Place macro invertebrates in a white sorting pan or plastic sheet. Separate creatures that looksimilar into groups. Use the SOS identification guide to record the types and numbers of eachkind of insect. As you sort through your collection, remember that each stream will have differenttypes and numbers of macro invertebrates. Calculate a score for your stream using the index onthe survey form. Use the table below to interpret your results.
If you find: You may have:
Variety of macro invertebrates, lots of each kind Healthy stream
Little variety, with many of each kind Water enriched withorganic matter
A variety of macro invertebrates, but a few of each kind, Toxic pollutionor No macro invertebrates but the stream appears clean
Few macro invertebrates and the stream bed is covered Poor habitat fromwith sediment sedimentation

9
PHYSICAL/CHEMICAL TESTS
Physical/Chemical testing allows information to be gathered about specific water qualitycharacteristics. A variety of water quality tests can be run on fresh water--including temperature,dissolved oxygen, pH, turbidity, water clarity, phosphorus, nitrogen, chlorine, total dissolvedsolids, and many others. Hillsborough County Stream-Waterwatch recommends that five coremeasurements be taken when doing physical/chemical testing--temperature, dissolved oxygen,pH, turbidity/clarity and salinity (if necessary). Phosphorus, nitrogen and alkalinity may beadded as interest and equipment allows. See "Why Chemical Testing is Important" in theAppendix for detailed descriptions of each water quality characteristic.
If you choose to conduct chemical testing as an activity, plan on sampling regularly--atleast once a month at the same time and the same location. Regular monitoring helps assure thatyour information can be compared over time. Water quality and environmental conditions canchange throughout the day so monitoring at approximately the same time of day is important.Also, chemical testing during or immediately after a rain may produce very different results thanduring dry conditions. Therefore, it is very important to record weather conditions. If conditionsare unsafe for any reason including high water or slippery rocks, DO NOT SAMPLE.
Equipment List:
� Water testing kit with dissolved oxygen, pH, temperature, turbidity tube or Secchi disk� rubber gloves� safety glasses� container to bring back waste chemicals (old milk jug) � bucket with rope (if sampling off a bridge or in deep water) � Physical/Chemical Stream Survey Form� pencil � first aid kit
Optional
� refractometer (for salinity measurement)
Detailed instructions on each chemical test are available with the kit and are listed in theAppendix, however a few recommendations are listed below.
1. Measure air and water temperature in the shade, avoid direct sunlight.
2. Rinse glass tubes or containers twice with stream water before running a test.
3. Collect water for tests approximately midstream, one foot below surface. If water is less thanone foot deep, collect approximately one-third of the way below surface.

10
4. Read values on titrators (small syringe) at the plunger tip.
Safety Notes: Read all instructions before you begin and note all precautions. Keep all equipmentand chemicals out of the reach of small children. In the event of an accident or suspected poisoning,immediately call the Poison Control Center (listed on the inside cover of most telephone books).Avoid contact between chemicals and skin, eyes, nose or mouth. Wear safety goggles or glasses, andrubber gloves, when handling chemicals. After use, tightly close all chemical containers. Be carefulnot to switch caps.

11
HABITAT ENHANCEMENT(from Protecting Community Streams: A Guidebook for Local Governments in Georgia, Atlanta RegionalCommission, 1994)
Stream habitat enhancement projects directly improve the health of streams by improvingthe adjacent (riparian), stream bank or stream bed habitat. All three of these areas functiontogether to make up a stream ecosystem.
Stream habitat enhancement projects can be complicated. Check with your local Soil andWater Conservation Service, Cooperative Extension Service, the Fish and Wildlife Service, ora private consultant to be sure your efforts will yield the results you seek. Also, a Corps ofEngineers permit may be needed before any material is placed in a stream or adjacent wetlands.Small projects are usually exempt.
Stream habitat enhancement projects may occur on private property, with permission oflandowners, or on public property, in cooperation with the local or state agency responsible forproperty management. Habitat enhancement projects involve three major activities:
· riparian reforestation· streambank stabilization· stream bed restoration
Riparian Reforestation
The contribution of trees and woody understory vegetation to the maintenance of streamhealth cannot be overstated. Stream side forested areas not only provide habitat, shade, andforage for both aquatic and land based species, but their ability to filter pollutants and rainfallprovides a buffer - a last line of defense - from watershed runoff. Restoring Stream side areasis one of the most cost-effective steps one can take to protect stream health. The objective shouldbe to replicate or mimic the natural ecosystem as much as possible, therefore a mix of young andolder native plant and tree species are preferred. Follow these steps to conduct a riparianreforestation project:
1. Evaluate current water quality conditions -- take "before" pictures and/or conductphysical/chemical, biological or visual assessments.
2. Choose a site(s) that needs additional vegetation to protect water quality from stormwaterrunoff.
3. Purchase a variety of plants that will tolerate wet conditions.
4. Plant trees, shrubs and grasses in the area immediately adjacent to your stream. Plant enoughso that the vegetation will actually protect the stream--filter pollutants in stormwater, stopssediment from entering water, etc.
5. Water after planting and as needed.

12
6. Check each week for four to six weeks to ensure that plants are healthy.
7. Once plants are well established, evaluate water quality improvement -- take "after" photographand/or compare with initial water quality tests.
Streambank Stabilization
If you have an eroding or collapsing streambank, you need to first determine the cause of theproblem. Streambank erosion occurs for a number of reasons, including increased streamvelocity, obstacles in the stream, floating debris, wave action, and direct rainfall. Streambankfailure occurs when a large section of streambank collapses into the stream channel. Among thecauses of streambank failure are down cutting of the stream bed and undercutting of the bank,increased load on the top of the bank, and internal pressure from uneven water absorption.
Selection of an appropriate bank stabilization method requires careful analysis of each site.No single method is appropriate in all situations. Technical advice will often be needed. Consult theSoil and Water Conservation Commission's "Guidelines for Streambank Restoration".
One technique to stabilize stream banks is called soil stabilization or soil bioengineering,which involves using vegetation as the structural control to stabilize banks. Planting of woodyvegetation, such as willows. (either as individual live cuttings or in bundles of cuttings), grow intadense network of protective vegetation. See Figures 1 through 3. The vegetation's root structureprovides resistance to the sliding and shear displacement forces involved in slope erosion. Insome cases, a solely vegetative approach may be all that is needed. In others, conditions such asexcessive stream velocities or poor soil conditions may require a combination of vegetative andstructural elements (such as stone walls or bulkheads).
Figure 1. Examples of soilbioengineering techniques, willowcuttings.
Figure 2. Examples of soilbioengineering techniques, livefascines or wattles.

13
Stream bed Restoration
Prior to any stream bed restoration, upstream conditions should be assessed. Withoutcorrective measures or retrofitting upstream, stormwater flows could quickly destroy any streambed restoration work. If the stream is in equilibrium, or if appropriate corrective measures arein place, stream bed restoration can recreate the habitat conditions needed to support aquatic life.Several goals may be accomplished when restoring a stream bed, including:
� Replacement of pools and riffles� Velocity control� Restoration of the stream gradient and normal flow channel� Removal of major stream obstructions� Restoration of suitable channel patterns such as:
meandering -- repetitive bendsirregular -- more or less straight braided -- stream separates and rejoins around islands
� Restoration of substrate (removal of sediment and replacement with gravel andcobbles, as appropriate)
Some of these techniques permit the stream water flows to work to restore healthierstream bed conditions; others require excavation and physical realignment of the stream channel.Three basic techniques include deflectors, in-stream boulders and drop structures.
Figure 3. Examples of soil bioengineering techniques, branch packings.
Deflectors can easily be constructed of common, local materials such as cobbles, boulders andlogs and are adaptable to a variety of conditions and stream sizes. They are sited in the channel

14
with the intent of deflecting the current into a narrower channel. Deflectors can use thestreamflow for a variety of purposes, including deepening channels, developing downstreampools, enhancing pool riffle ratios and assisting in the restoration of meander patterns withchannelized reaches. There are several deflector designs. Figure 4 (left) shows a simple double"wing deflector" that consists of rock structures on each bank deflecting the streamflow to acentral channel. Single deflectors along one bank are also used as shown in Figure 4 (center).Deflectors can be offset on opposite banks of a stream to imitate meanders, as shown in Figure4 (right). (Pennsylvania DER, 1986). A third type of deflector is the V-type, which is placed inthe middle of the channels with the point of the "V" pointing upstream deflecting water towardsboth banks. This type of deflector helps re-establish riffles and pools downstream. An underpassdeflector is a log placed across a small stream several inches off the bottom. Water is deflectedunder the log which helps remove sediment deposits and restore pools. (Gore, Ed. 1985)(Kumble, 1990).
Figure 4. Double wing, Single and Offset deflectors.
Drop structures include a number of variations such as weirs, check dams, sills and plunges.They can serve a variety of functions in stream bed restoration depending upon their design,including: slowing streamflow; deepening existing pools; and creating new pools upstream anddownstream. Structures with notches can be used to control heavy stormwater flows and can helpre-establish deep pools immediately downstream. Drop structures can be made of concrete, logsor boulders. Log or boulder structures can be used to replicate small falls or rapids. Single logdams across a stream bed are simple and effective in restoring plunge pools (Figure 5). The K-dam is a variant of the single log dam, so named by adding downstream bracing. In some areas,especially headwater areas, reintroducing beavers has been effective in restoring habitat. Theirdams function as drop structures in headwaters and on small streams.

15
Figure 5. Log drop structure. Figure 6. Upstream “V” boulder placement.
Boulder placement is a third in-channel treatment that can assist stream bed restoration.Boulders can be used to reduce velocity, restore pools and riffles, restore meanders, providecover and protect eroded banks by deflecting flow. Boulders can be placed randomly or in apattern. Placing them in a "V"pointed upstream produces eddies that replicate riffles as well asrestores downstream pools (Figure 6). Combined with placement of cobbles and gravel, boulderplacement can also help restore the stream substrate.
Excavation and fill may also be necessary to restore the stream gradient, the normal flowchannel and the stream channel pattern, including meanders and braids, where appropriate.Channel pattern restoration should be combined with streambank restoration and re-vegetation.
Streams that have been severely degraded by large amounts of sediment or heavystormwater flows may require greater restoration work. Sediment may have to be removedmechanically and replaced with gravel and cobbles to replicate the original stream bed. Majordebris accumulation that is obstructing flows may also need removal.
Additional references:Guidelines for Streambank Restoration. Georgia Soil and Water ConservationCommission. 1994.A Georgia Guide to Controlling EROSION with Vegetation. Georgia Soil and WaterConservation Commission. 1994.Protecting Community Streams: A Guidebook for Local Governments in Georgia.Atlanta Regional Commission. 1994.Gore, James A., editor. The Restoration of Rivers and Streams. 1985.Barnett, John L. Stream Restoration Along the Greenways in Boulder, Colorado. 1991.Commonwealth of Pennsylvania, Department of Environmental Resources. AStreambank Stabilization and Management Guide for Pennsylvania Landowners. 1986.

16
APPENDICES
17
SOME BACKGROUND ON AQUATIC INSECTS
To understand and identify aquatic insects, one must start with how all animals areclassified. The most general category is first, with the species level being the mostspecific. Volunteers will learn to identify aquatic insects to the order level. A stonefly isclassified as an example.
Kingdom Animal (all animals)Phylum ArthropodaClass Insecta (all insects)Order Plecoptera (all stoneflies)
Life Stages of InsectsIdentifying insects is complicated because of the different stages they pass throughduring their development. The changes that occur from the egg stage to the adult areoften dramatic. The incredible change of a caterpillar into a butterfly is well known. Mostaquatic insects experience similar changes. The process of changing form during the lifecycle is called metamorphosis. Three types of metamorphosis are possible: ametabolous,incomplete, and complete.
Ametabolous Metamorphosis This type of metamorphosis means without change andrefers to the lack of change between the immature and adult stages. It's found only in afew very primitive orders of insects that have no wings as adults. Some species aresemiaquatic.
Incomplete Metamorphosis. Insects with incomplete metamorphosis pass through three distinct stages: egg, nymph, and adult.The time required to complete each stage varies widely. Normally the greatest amount of time isspent in the nymphal stage. In most cases, the entire cycle requires one year to complete, althoughthis also varies with different species. Nymphs often look similar to their adult stage. As nymphsmature, the adult wings begin developing in stiff pouch-like structures on the thorax called wingpads. This is an obvious and unique characteristic of insects with incomplete metamorphosis. Thewing pads on fully mature nymphs will be quite dark, almost black, in color. The orders of aquaticinsects with incomplete metamorphosis include:Mayflies (Order Ephemeroptera)Dragonflies and Damselfies (Order Odonata)Stoneflies (Order Plecoptera)Water Bugs (Order Hemiptera)

18
Complete Metamorphosis
Insects with complete metamorphosis pass through four distinct stages: egg, larva, pupa, andadult. The addition of the pupal stage separates insects with complete metamorphosis from thosewith incomplete metamorphosis. While the length of time needed to complete each stage againvaries widely, the entire cycle usually takes one year. Most of the cycle is generally spent in thelarval stage. Unlike nymphs, larvae bear little resemblance to the adults and show nodevelopment of wing pads. It is during the pupal stage that the wing pads and other adult featuresdevelop. The orders of aquatic insects:
Dobsonflies and Alderflies (Order Megaloptera)Caddisflies (Order Trichoptera)Aquatic Moths (Order Lepidoptera)Aquatic Flies (Order Diptera)Aquatic Beetles (Order Coleoptera)
Growth and Development
The growth of insects occurs in a series of stages called instars. The exoskeleton of insects must beperiodically shed in order for growth to continue. The process of shedding the old exoskeleton iscalled molting. When the old exoskeleton is cast aside, a new, slightly larger one is presentunderneath. The old empty exoskeleton is often referred to as a shuck. Except for mayflies, moltingstops once the insect reaches the winged adult stage. Most insects molt five or six times during theirdevelopment. Mayflies, stoneflies, dragonflies, and damselfies, however, may molt 15-30 timesbefore reaching their adult stage.
Recognizing the insects's stage and degree of development can help the angler determine what insectto imitate. Mature nymphs and larvae often become more active in the water as they move toemergence or pupation sites. This increased activity makes them more available to fish and, thus,makes them more important to imitate. Looking for and imitating the most mature insects willnominally produce the best fishing.
One of the most vulnerable periods in the insect's life cycle is during emergence from immature tothe adult stage. At the time of emergence, mature nymphs or pupae typically crawl out of the wateror swim to the water's surface. Those that emerge in the surface film must break through the surfacetension, and that can take from several seconds to over a minute. Thus during emergence, the insectsare no longer protected by the shelter of the lake of stream bottom. Fish readily take advantage ofthe insects' vulnerability and often feed selectively on emerging nymphs or pupae. The angler whorecognizes this activity will find fast fishing by imitating the shape and action of the natural. Adultinsects often rest on the water's surface after emerging from the nymphal or pupal shuck. Then, aftermating, most aquatic insects return to the water to lay their eggs. Insects resting or laying eggs onthe surface provide fish with many easy meals.
Source: An Angler's Guide to Aquatic Insects and their Imitations, Hafele and Roederer.

19
THE AQUATIC REALM
In order to understand the environment and the animal life subsisting in that environment, it isnecessary to understand the physical and chemical characteristics of the medium in which aquaticlife exists
Water
Water is a highly complex medium, about 800 times more dense than air. Successful locomotion,or the ability to remain in a particular area, is dependent on the development of effective streamliningin the organism. Species present in moving water must present a low profile or smooth contour.Many of the forms have developed structures allowing them to adhere to the surface of the substrate,while other form have developed burrowing habits.
Animals living in water must have available oxygen for their existence. Aquatic forms are able toextract oxygen dissolved in the water. The amount of oxygen dissolved in the water is directlyrelated to the temperature of the water, cold water retaining a higher amount of dissolved oxygen.
Although pure water is highly transparent, we are not working with "pure" water in any aquatichabitat. Silt or clay particles, algal blooms and decaying vegetation reduce the penetration of lightwaves through the water.
The penetration of light through water is important for the process of photosynthesis in plants, whichadds dissolved oxygen to the water. In highly turbid waters, photosynthetic activity may be restrictedto only the upper strata of water.
The dissolving capabilities of water are such that it has been termed the universal solvent. As waterfalls as rain and runs along the ground, it collects numerous substances. Water falling as raincollects both oxygen and carbon dioxide from the atmosphere. Air contains nearly 21% oxygen byvolume, but water contains about one-twentieth that of air. Carbon dioxide has a much highersolubility in water, therefore, rain water is slightly acidic.
Freshwater Habitats
Fresh waters, in the form of habitable lakes and rivers, comprise an almost negligible portion of theavailable surface waters of the earth. The seas and oceans cover approximately 75% of the earth'ssurface. Freshwater occupies about 0.01%, but harbors about 41% of the fish species.

20
Running Water (The Lotic Environment)
As water drains off a watershed, a natural progression of flowing water habitats develop. Smallrivulets join to form small brooks that may be seasonally intermittent in their flow. These join largerstreams that eventually combine to form rivers and river systems.
Rapidly moving shallow water is usually highly oxygenated. The scouring action of the water resultsin a substrate that is typically composed of rocks and cobble of varying texture.
Temperatures of brooks in forested areas will result in lower water temperatures. The canopy alsoeffectively limits the amount of light reaching the water.
Of utmost importance in structuring an aquatic community is its productivity, its capacity to producefood for its component species. In high gradient streams, there is little opportunity for rooted plantsto develop. As the gradient of the stream diminishes, there is a greater opportunity for bioticdiversification, and the food base is consequently enhanced.
The lower reaches of streams possess a greater variety of habitats. As streams increase in size,currents become more sluggish, depth increases, bottom materials become finer and watercorrespondingly becomes more turbid.
INDICATORS OF POLLUTION
The concept of aquatic organisms being "useful" indicators of environmental condition, andparticularly of the degree of pollution of water with organic wastes, has a long history.
The term "pollution" does not have the same meaning to everyone. We have to understand that thereis natural pollution and man-made pollution.
In an environment devoid of human occupation and influence, certain situations will occur. Rainwater flowing across the land and draining into a stream will carry humus extracts, organicparticulate matter and inorganic salts leached from the soil. Fecal material from wild animals willfind their way into the stream. Animals drinking from the stream will add bacteria and dead animalswill be found decaying in the water or near the shore.
Whether the origin of the pollution is natural or from a sewer outlet, the stimulatory effect uponorganisms in the stream will be the same. Man-made pollution occurs in such volume that thestream is incapable of recovering from the effects.
Effects of Pollution on Biological Environment
The entry of pollutants changes the stream bottom, the physical and chemical properties of the waterand the competitive relationships of organisms. Organic material undergoes decomposition, utilizingthe dissolved oxygen in the water. The dissolved oxygen content in a badly polluted zone can bereduced to zero, destroying all animal life depending on dissolved oxygen for survival.

21
As the pollutant moves downstream from the source, decomposition continues. The pollutant isdiluted with clean water, but the effects continue to be deleterious on animal life. If the source ofpollution is eliminated, the stream will eventually clean up, but if the source of pollution continues,then the zone of degradations continues to expand.
In addition to removing the dissolved oxygen content from the water, pollutants also cover thestream with sludge. The presence of solid materials in the water reduces the amount of sunlightavailable for the continuous growth of plankton populations necessary in the animal food chain.
Significance of Biological Populations (see Appendix on Stream Insects and Crustaceans)
Group One Taxa: pollution sensitive organisms found in good quality water
Group Two Taxa: Somewhat pollution tolerant organisms can be in good or fair quality water.
Group Three Taxa: Pollution tolerant organisms can be in any quality of water.
The presence of Group Three Taxa and the absence of Group One Taxa does not prove that pollutionexists in a particular area. As in agricultural land, certain bottom types are more productive thanother types, which means dissolved oxygen is being used at a faster rate. This is the reason forreferring to biological populations as being "indicators" of pollution.
AQUATIC ANIMALS
Our study will focus on the aquatic animals which live in or the bottom materials, attached to rocksand swimming freely in or on the surface of the water. Terrestrial insects falling into the water donot reflect the quality of the water.
Animal Groups to Be Considered
OLIGOCHAETA: aquatic earthworms (sludgeworms)
HIRUDINEA: leeches
MOLLUSCA: snails and clams
ARTHROPODA: insects
The identification of aquatic forms collected will be to the Order level. Although the identificationof aquatic animals to the species level is important in a scientific study, the gross identification ofthe forms will provide the information desired.

22
The arthropods (insects and crustaceans) are the most common form encountered in the aquaticenvironment.
Crustacea - crabs, lobster, shrimp, crayfish
Diploda - millipedes
Chilopoda - centipedes
Xiphosura - horseshoe crabs
Arachinida - spiders, scorpions
Insecta - insects
Ephemeroptera: mayflies
Odonata: dragonflies and damselflies
Plecoptera: stoneflies
Coleoptera: beetles
Trichoptera: caddisflies
Diptera: flies, mosquitoes
AQUATIC EARTHWORMS
Aquatic earthworms are commonly found in areas with muddy bottoms. Their presence does notimply the area is polluted. Their presence, though, in large numbers, and the absence of otheraquatic forms does indicate a highly productive area, which could be caused by pollution.
Sludge worms, another form of aquatic earthworms, are very common in areas polluted by sewage.
LEECHES
The presence of leeches does not imply pollution. They are occasionally found in a variety of aquatichabitats. They are pollution tolerant organisms, and can be in any quality of water.
SNAILS AND CLAMS
These forms are quickly affected by the presence of pollution. They are highly sensitive to variousforms of chemical pollution, but not necessarily killed by the pollution. Some species are placed in

23
Group Two Taxa and some are placed in Group Three Taxa.
INSECTS
Ephemeroptera
Mayflies are often common around ponds and streams, the immature forms (nymphs) found in avariety of habitats. Some are streamlined in their structure and are active, whereas, other forms areburrowing in habit. The aquatic stage requires a year or more to develop.
The nymphs are very sensitive to pollution. They require a high level of dissolved oxygen in thewater to exist. They are placed in Group One Taxa.
The species of mayflies exhibit a wide range of ecological habitat preferences. Some species arefound only in lakes, some in shallow, rapid streams with sandy bottoms and some species occur onthe underside of stones.
Odonata
The adult dragonflies and damselflies are usually found near or around water. The immature stagesare aquatic, and all stages are predacious, feeding on insects and other organisms.
They are placed in Group Two Taxa, being somewhat pollution tolerant and can exist in good or fairquality water. They are found on rocks and other substrate materials.
Plecoptera
Stoneflies are small, somewhat flattened, soft-bodied forms found near streams or rocky lake shores.They are often found under stones in streams.
They are placed in Group One Taxa, being pollution sensitive organisms found in good qualitywater.
Coleoptera
The beetles are the largest order of insects. Many species are aquatic or semi-aquatic, and are foundin a wide variety of ecological habitats. Members of this Order are placed in both Group One Taxaand in Group Two Taxa.
Neuroptera
Alderflies and dobsonflies are usually found under stones in streams. The aquatic forms are

24
predacious, feeding on small aquatic insects.
They are placed in both Group One and Group Two Taxa.
Trichoptera
The caddisfly larvae occur in lakes, ponds and streams. Some are case makers, others construct netsunder water and a few are free living. The free-living larvae are generally predacious.
The members of this Order are highly sensitive to pollution and are found only in good quality water.They are placed in Group One Taxa.
Diptera
The members of this Order constitute the largest order of insects. Its members are abundant almosteverywhere. This Order includes mosquitoes, midges (no-see-ums), horse flies, blow flies and lice.A large proportion live in water (i.e. streams, ponds, lakes, temporary puddles, brackish water andalkaline water.
The majority of the members of this Order are highly tolerant to pollution and are placed in GroupThree Taxa.
RAPID BIOASSESSMENT PROCEDURE
Studies determining the biological health of a stream by assessing the quantity and qualityof macroinvertebrate populations have been conducted for many years. Historically, these studiescovered varying periods of time. many of the past studies covered periods of time ranging from oneto ten years. Although these past benthic studies were very important, they were very expensive andrequired large commitments of time by scientists.
As populations grew and expanded, the adverse affects of growth on natural resources, suchas streams, dramatically increased. Intensive agricultural practices, increased use of fertilizers andpesticides, uncontrolled garbage disposal, increased numbers of parking lots which created increasedwater runoff, and many other factors placed unnatural biological stresses on streams.
Rapid population and industrial growth, the expense associated with benthic studies and thelack of qualified personnel made it impossible to conduct scientific studies on the large number ofstreams affected.
Past scientific studies have demonstrated that certain macroinvertebrates were indicators ofwater quality. Certain forms were known to survive only in water with high levels of dissolved oxy-gen, while other organisms were capable of surviving in badly polluted waters.
In the mid-1980's, the Rapid Bioassessment Procedures for use in wadeable streams, 3 feet
25
or less in depth, were developed. Biomonitoring utilizes biological organisms to indicateenvironmental stress. The U.S. Department of Environmental Protection developed the protocols.The Florida Department of Environmental Protection adapted the protocols for use in Florida,developing the Stream Condition Index (SCI).
The reliability of the protocols depends on adequate sampling being employed and the correctidentification of the macroinvertebrates to the ORDER level.
Collecting macroinvertebrates from the stream selected for study will be conducted everythree months in approximately the same area, approximately a 50-yard stretch, for consistency. TheD-frame dip net will be employed to collect macroinvertebrates from different ecologicalenvironments within the study sample area. The specific sampling methodology employed will bedependent on the specific stream habitat.
Review the BIOLOGICAL MONITORING SECTION in the Level II training manual forspecific sampling methodology.

26

27

28
Speed Key for use with the IzaacWalton Stream Insects & Crustaceans ID Sheet
Snails (6, 23, 24) have single spiral shellsClams (18) have 2 hard shells that close together
Crayfish (8) look like tiny lobstersSowbugs (9) and Scuds (10) have long antennae and more than 6 legs
Aquatic worms (19) are legless, pink when alive, and can "tie themselves in knots"Leeches (22) are legless and have a distinct sucker at each end
Everything else is an insect; 97% of these can be correctly identified by the following;
1. No legs, or legs look fleshy, without joints (14, 15, 20, 21) True Fly larvae
2. Legs long and sprawly, lower lip is folded beneath the head (13, 17)Damselfly and Dragonfly nymphs
3. Two long straight tails, 2 claws per foot (1) Stonefly nymphs
4. Three long straight tails (some with 2), 1 claw per foot (5) Mayfly nymphs
5. Somewhat caterpillar-like, with a single pair of hooks on the back end (2);may be in a stick or stone case Caddisfly larvae
6. Sides of body with pointed, fleshy projections (7, 11, 12)
Heligrammite, Alderfly, and Fishily larvae
7. Body hard of soft, usually cylindrical (16) Beetle larvae
8. Body round or oval, brown (3) Water Penny (a beetle larvae)
9. Small, resembling a black spider, moves very slowly (4). Riffle Beetle adults
This Key by: Dr. Fred Sherberger, Fembank Science Center 156 Heaton Park Dr. NE, Atlanta GA 30307-1398Voice Mail 404-378-4314, ext. 323; FAX 404-370-1336 e-mail. [email protected]
Stream Study Home Page Internet Address
http://www.people.virginia.edu/~sos-iwla/Stream-Study/StreamStudyHomePage/StreamStudy.HTML

29
WHY ARE CHEMICAL TESTS IMPORTANT? (based in part on the Citizen Monitoring Handbook, published by the LaMotte Company)
This section describes some chemical and physical tests you can conduct and whythey are important. Physical/Chemical testing should be conducted at least once a monthbecause this type of testing measures the exact sample of water taken, which can varyweekly, daily or even hourly. A basic set of tests includes temperature, dissolved oxygen,pH, and turbidity or clarity. Advanced tests include total alkalinity, ortho-phosphate,nitrate and chlorophyll (a).
TEMPERATURE
Water temperature is one factor in determining which species may or may not bepresent in the system. Temperature affects feeding, reproduction, and the metabolism ofaquatic animals. A week or two of high temperatures may make a stream unsuitable forsensitive aquatic organisms, even though temperatures are within tolerable levelsthroughout the rest of the year. Not only do different species have different requirements,but optimum habitat temperatures may change for each stage of life. Fish larvae and eggsusually have narrower temperature requirements than adult fish.
Measuring Temperature
A thermometer protected by a plastic or metal case should be used to measuretemperature in the field. Record air temperature by placing the dry thermometer in theshade until it stabilizes. Record the temperature of the air before measuring watertemperature. To measure water temperature, submerge the thermometer in a sample ofwater large enough that it will not be affected by the temperature of the thermometer itselfor hold directly in the stream. Record temperature when reading stabilizes.
Significant Levels
Temperature preferences among species vary widely, but all species can tolerateslow, seasonal changes better than rapid changes. Thermal stress and shock can occurwhen water temperatures change more than 1° to 2°C in 24 hours.
Many biological processes are affected by water temperature. Temperaturedifferences between surface and bottom waters help produce the vertical water currentswhich move nutrients and oxygen throughout the water column.

30
What Measured Levels May Indicate
Water temperature may be increased by discharges of water used for cooling purposes(by industrial or utility plants) or by runoff from heated surfaces such as roads, roofs andparking lots. Cold underground water sources, snow melt and the shade provided byoverhanging vegetation can lower water temperatures.
pH
The pH test is one of the most common analyses in water testing. An indication of thesample's acidity, pH is actually a measurement of the activity of hydrogen ions in the sample.pH measurements are on a scale from 0 to 14, with 7.0 considered neutral. Solutions with apH below 7.0 are considered acids, those between 7.0 and 14.0 are designated bases.
The pH scale is logarithmic, so every one-unit change in pH actually represents a ten-fold change in acidity. In other words, pH 6 is ten times more acidic than pH 7; pH 5 is onehundred times more acidic than pH 7.
pH Measurement Technique (HACH kit, wide range 4-10))
1. Fill test tube to the 5 mL line of the glass tube.
2. Add 6 drops of the pH indicator (holding indicator bottle vertical). Cap and gently invertthe sample several times to ensure mixing.
3. Use the color comparator box to determine pH. Read pH to the nearest .5 unit. *Hint -Hold a piece of white paper behind the comparator to differentiate colors more easily*
Significant Levels
A range of pH 6.5 to pH 8.2 is optimal for most aquatic organisms. Rapidly growingalgae or submerged aquatic vegetation remove carbon dioxide (C02) from the water duringphotosynthesis. This can result in a significant increase in pH levels. Low or high pH caneffect egg hatching, kill sources of food for fish and insects, or make water impossible for anyaquatic life to survive. Hillsborough County streams will have pH ranges of 6.0 to 8.6.

31
pH values of some common substances:
0.5 battery acid2.0 lemon juice5.9 rain water7.0 distilled water8.0 salt water11.2 ammonia12.9 bleach
DISSOLVED OXYGEN
Like land organisms, aquatic animals need dissolved oxygen (DO) to live. Fish,invertebrates, plants and aerobic bacteria all require oxygen for respiration.
Sources of Dissolved Oxygen
Oxygen dissolves readily into water from the atmosphere at the surface until thewater is "saturated" (see below). Once dissolved in water, the oxygen diffuses very slowly,and distribution depends on the movement of aerated water by turbulence and currentscaused by wind, water flow and thermal upwelling. Oxygen is produced by aquatic plants,algae and phytoplankton as a by-product of photosynthesis.
Dissolved Oxygen Capacity of Water
The dissolved oxygen capacity of water is limited by the temperature and salinityof the water and the atmospheric pressure (which corresponds with altitude). These factorsdetermine the highest amount of oxygen dissolved in water that is possible.
Temperature Effect
As water temperature changes, the highest potential dissolved oxygen levelchanges. Table 1 shows the amount of dissolved oxygen at 100% saturation as afunction of temperature.

32
TABLE 1 Solubility of Dissolved Oxygen in Water
Temperature Solubility Temperature Solubility Degrees ����C mg/L (ppm)* Degrees ����C mg/L(ppm)*
0 14.6 16 10.0 1 14.2 17 9.8 2 13.8 18 9.6 3 13.5 19 9.4 4 13.1 20 9.2 5 12.8 21 9.0 6 12.5 22 8.9 7 12.2 23 8.7 8 11.9 24 8.69 11.6 25 8.410 11.3 26 8.211 11.1 27 8.112 10.9 28 7.913 10.6 29 7.814 10.4 30 7.715 10.2
* 100% saturation
As can be seen from Table 1:
Lower temperature = Higher potential dissolved oxygen level
Higher temperature = Lower potential dissolved oxygen level
The temperature effect is compounded by the fact that living organisms increasetheir activity in warm water, requiring more oxygen to support their metabolism.Critically low oxygen levels often occur during the warmer summer months whendecreased capacity and increased oxygen demand, caused by respiring algae ordecaying organic material, coincide.
Altitude
Oxygen is more easily dissolved into water at low altitudes than at high altitude.
Dissolved or Suspended Solids (salt)
Oxygen is more easily dissolved into water which has low levels of dissolved orsuspended solids. Therefore salt water tends to have lower concentrations of dissolvedoxygen than fresh water.

33
Significant Levels
The amount of oxygen required varies according to species and stage of life.DO levels below 3 ppm are stressful to most aquatic organisms. DO levels below 2 or1 ppm will not support fish; levels of 5 to 6 ppm are usually required for growth andactivity. Fish and invertebrates that can move will leave areas with low dissolvedoxygen and concentrate in areas with higher levels.
What Measured Levels May Indicate
A low dissolved oxygen level indicates a demand on the oxygen in the system.Pollutants, including inadequately treated sewage as well as decaying natural organicmaterial, can cause such a demand. Organic materials accumulate in bottom sedimentsand support microorganisms (including bacteria) which consume oxygen as they breakdown the materials. Some wastes and pollutants produce direct chemical demands onany oxygen in the water. In ponds or impoundments, dense populations of active fishcan deplete dissolved oxygen levels. In areas of dense algae, DO levels may drop atnight or during cloudy weather due to the net consumption of dissolved oxygen byaquatic plant respiration.
High dissolved oxygen levels can be found where stream turbulence or choppyconditions increase natural aeration by increasing the water surface area and trappingair under cascading water. On sunny days, high dissolved oxygen levels occur in areasof dense algae or submerged aquatic vegetation growth due to photosynthesis. In theseareas, watch for the lowest DO levels before sunrise each morning and highest levelsjust after noon.
DO Measurement Technique
Dissolved Oxygen - LaMotte Company
1. Carefully collect the water sample into the glass water sampling bottle, avoidingtrapping air bubbles or bubbling air into the sample (which may add dissolved oxygen).*ADD THE REAGENTS HOLDING THE BOTTLES VERTICAL*
2. Add the next two reagents in quick succession. Add 8 drops of Manganous SulfateSolution and 8 drops of Alkaline Potassium Iodide Azide to the sample. Cap the sampleand invert several times. Wait until the precipitate settles below the neck of the bottlebefore proceeding.
3. Next, use the 1.0 gram spoon to add one measure of Sulfamic Acid Powder. Cap andgently shake until the precipitate dissolves. The solution is now "fixed" and may range incolor from yellow to orange brown.* Fixed Solution - Contact between the water sample and the atmosphere will not affectthe test result because the dissolved oxygen has been bound into solution and no moreoxygen will dissolve into the sample and no dissolved oxygen can be lost from the sample.

34
4. Place 20 mL of the fixed sample into the glass titration tube.
5. Fill the titrator (small syringe) with Sodium Thiosulfate, 0.025 N. Make sure no bubblesare in the titrator. Place the titrator into the hole in the cap of the glass titration vial.
6. While gently shaking the tube, slowly add Sodium Thiosulfate from the titrator into thesample. Continue one drop at a time until the solution turns a pale straw color (very faintyellow). *Hint-High light intensity degrades Sodium Thiosulfate- keep bottle out ofthe sun for long periods of time.
7. Remove the titrator cap and syringe CAREFULLY so as not to lose any of the SodiumThiosulfate (you will continue titrating in step 9).
8. Add 8 drops of Starch Solution to the titration vial that is holding the sample. Thesample will turn dark blue.
9. Continue titrating with Sodium Thiosulfate ONE DROP AT A TIME until the solutionturns from blue to clear.
10. Read the amount of dissolved oxygen in your sample directly from the syringe (directreading titrator). Tick marks are in 0.2 ppm. Use the tip of the syringe plunger fordissolved oxygen value.
TURBIDITY
What is turbidity and why is it important?
Turbidity is a measure of water clarity—how much the material suspended in waterdecreases the passage of light through the water. Suspended materials include soil particles(clay, silt, and sand), algae, plankton, microbes, and other substances. These materials aretypically in the size range of 0.004 mm (clay) to 1.0 mm (sand). Turbidity can affect thecolor of the water. Higher turbidity increases water temperatures because suspendedparticles absorb more heat. This, in turn, reduces the concentration of dissolved oxygen(DO) because warm water holds less DO than cold. Higher turbidity also reduces theamount of light penetrating the water, which reduces photosynthesis and the production ofDO. Suspended materials can clog fish gills, reducing resistance to disease in fish,lowering growth rates, and affecting egg and larval development. As the particles settle,they can blanket the stream bottom, especially in slower waters, and smother fish eggs andbenthic macro invertebrates. Sources of turbidity include:
� Soil erosion � Waste discharge� Urban runoff � Eroding stream banks � Large numbers of bottom feeders (such as carp), which stir up bottom sediment.

35
� Excessive algal growth.
Sampling and equipment considerations
Turbidity can be useful as an indicator of the effects of runoff from construction,agricultural practices, logging activity, discharges, and other sources. Turbidity oftenincreases sharply during a rainfall, especially in developed watersheds, which typicallyhave relatively high proportions of impervious surfaces. The flow of stormwater runofffrom impervious surfaces rapidly increases stream velocity, which increases the erosionrates of stream banks and channels. Turbidity can also rise sharply during dry weather ifearth-disturbing activities are occurring in or near a stream without erosion controlpractices in place.
Regular monitoring of turbidity can help detect trends that might indicateincreasing erosion in developing watersheds. However, turbidity is closely related tostream flow and velocity and should be correlated with these factors. Comparisons of thechange in turbidity over time, therefore, should be made at the same point at the sameflow. Turbidity is not a measurement of the amount of suspended solids present or the rateof sedimentation of a steam since it measures only the amount of light that is scattered bysuspended particles.
Turbidity is generally measured by using a turbidity meter. Volunteer programsmay also take samples to a lab for analysis. Another approach is to measure transparency(an integrated measure of light scattering and absorption) instead of turbidity. Waterclarity/transparency can be measured using a Secchi disk or transparency tube. The Secchidisk can only be used in deep, slow moving rivers; the transparency tube, a comparativelynew development, is gaining acceptance in programs around the country but is not yet inwide use (see Using a Secchi Disk or Transparency Tube).
A turbidity meter consists of a light source that illuminates a water sample and aphotoelectric cell that measures the intensity of light scattered at a 90° angle by theparticles in the sample. It measures turbidity in nephelometric turbidity units or NTUs.Meters can measure turbidity over a wide range—from O to 1000 NTUs. A clear mountainstream might have a turbidity of around 1 NTU, whereas a large river like the Mississippimight have a dry-weather turbidity of around 10 NTUs. These values can jump intohundreds of NTU during runoff events. Therefore, the turbidity meter to be used should bereliable over the range in which you will be working. Meters of this quality cost about$800. Many meters in this price range are designed for field or lab use.
Using a Secchi Disk or Transparency Tube
Secchi Disk
A Secchi disk is a black and white disk that is lowered by hand into the water tothe depth at which it vanishes from sight (Figure 7). The distance to vanishing is then

36
Figure 7 Using a Sechhi disk to measuretransparency. The disk is lowered until it is nolonger visible. That point is the Secchi diskdepth.
recorded. The clearer the water, the greater the distance. Secchi disks are simple to use andinexpensive. For river monitoring they have limited use, however, because in most casesthe river bottom will be visible and the disk will not reach a vanishing point. Deeper,slower moving rivers are the most appropriate places for Secchi disk measurementalthough the current might require that the disk be extra-weighted so it does not sway and make measurement difficult. Secchi disks costabout $50 and can be homemade.
The line attached to the Secchidisk must be marked according to unitsdesignated by the volunteer program, inwaterproof ink. Many programs requirevolunteers to measure to the nearest 1/10meter. Meter intervals can be tagged(e.g., with duct tape) for ease of use.
To measure water clarity with a Secchidisk:
� Check to make sure that theSecchi disk is securely attached tothe measured line.
� Lower the Secchi disk into thewater, keeping your back towardthe sun to block glare.
� Lower the disk until it disappearsfrom view. Lower it one third of ameter and then slowly raise thedisk until it just reappears. Movethe disk up and down until theexact vanishing point is found.
� Attach a clothespin to the line atthe point where the line enters thewater. Record the measurementon your datasheet. Repeating the measurement will provide you with a quality control check.
The key to consistent results is to follow standard sampling procedures and, if possible,have the same individual take the reading at the same site throughout the season.

37
Transparency Tube
Pioneered by Australia's Department of Conservation, the transparency tube is aclear, narrow plastic tube marked in units with a dark pattern painted on the bottom. Wateris poured into the tube until the pattern disappears (Figure 8). Some U.S. volunteer
Figure 8. Using a transparency tube. (A) Prepare the transparency tube to takea reading. Place the tube on a white surface and look down vertically down thetube to see the wave pattern at the bottom. (B) Slowly pour the water sampleinto the tube stopping intermittently to see if the wave pattern has disappeared.
monitoring programs (e.g., the Tennessee Valley Authority (TVA) Clean Water Initiativeand the Minnesota Pollution Control Agency (MPCA)) are testing the transparency tube instreams and rivers. MPCA uses tubes marked in centimeters, and has found tube readingsto relate fairly well to lab measurements of turbidity and total suspended solids (althoughthey do not recommend the transparency tube for applications where precise and accuratemeasurement is required or in highly colored waters).
The TVA and MPCA recommend the following sampling considerations:
� Collect the sample in a bottle or bucket in mid-stream and mid-depth if possible.Avoid stagnant water and sample as far from the shoreline as is safe. Avoidcollecting sediment from the bottom of the stream.
� Face upstream as you fill the bottle or bucket. � Take readings in open but shaded conditions. Avoid direct sunlight by turning your
back to the sun. � Carefully stir or swish the water in the bucket or bottle until it is homogeneous,

38
taking care not to produce air bubbles (these will scatter light and affect themeasurement). Then pour the water slowly in the tube while looking down the tube.Measure the depth of the water column in the tube when the symbol just disappears.
NUTRIENTS����Nitrate and Phosphate
Eutrophication
The addition of phosphorus, nitrogen and other nutrients to a body of water resultsin increased plant growth. Over time, dead plant material builds up and, combined withsediments, fills in lakes and reservoirs. When excess nutrients and sediment are added, thespeed of this natural process is increased significantly.
Plants, especially algae, are very efficient users of phosphorus and nitrogen. By thetime an algae bloom is observed, the nutrients may no longer be measurable but maycontinue to impact the ecosystem. By sampling upstream from areas of algae blooms, thesource of excess nutrients may be identified. Algae blooms will usually be found in lakesand reservoirs. If excessive algae are found in streams, the nutrient content is probably veryhigh. The macro invertebrate population will reflect a high input of nutrients--you will findlittle variety of macro invertebrates but many of one or two kinds.
High flow rates in streams may prevent the establishment of floating aquatic plants andalgae despite the presence of high levels of nutrients. As the summer progresses and flow ratesdrop, once rapidly flowing streams can become choked with algae. Wide, slow moving andtidal areas downstream may exhibit algae blooms weeks earlier.
Sources of Nutrients
Nitrogen and phosphorus enter water from human and animal waste, decomposingorganic matter and fertilizer runoff. Phosphates also are found in some industrial effluents,detergent wastewater from homes, and natural deposits.
Measuring Nitrate
Nitrogen occurs in natural waters as nitrate (NO3), nitrite (NO2), ammonia (NH3) andorganically bound nitrogen. Nitrate test results are expressed as "nitrate nitrogen" (NO3-N),meaning "nitrogen that was in the form of nitrate." Some test kits and the literature expresslevels only as nitrate (NO3). Both expressions refer to the same chemical and concentrations,but use different units of measure:
Nitrate Nitrogen ppm x 4.4 = Nitrate ppm
Significant Levels
Unpolluted waters generally have a nitrate-nitrogen level below 1 ppm. Nitrate-nitrogenlevels above 10 ppm (44 ppm nitrate) are considered unsafe for drinking water.

39
Phosphorus
Phosphorus occurs in natural waters in the form of phosphates - orthophosphates,polyphosphates and organically bound phosphates. Simple phosphate test kits measure reactivephosphorus (primarily orthophosphate) which is the form of phosphate applied as fertilizer toagricultural and residential lands.
Organically bound phosphates in water come from plant and animal matter and wastes.Organically bound phosphates and polyphosphates cannot be measured directly. They mustfirst be broken down or "digested" by adding an acid and oxidizer and boiling the sample. Afterthe digested sample cools, an orthophosphate test is performed to measure total phosphorus.Results are expressed as phosphate (P04).
Significant Levels
Total phosphorus levels higher than 0.03 ppm contribute to increased plant growth(eutrophication). Total phosphorus levels above 0.1 ppm may stimulate plant growthsufficiently to surpass natural eutrophication rates.
ALKALINITY
Alkalinity of water is its acid neutralizing capacity. It is the sum of all the bases foundin a sample including carbonate, bicarbonate, and hydroxide content. The alkalinity, andtherefore buffering capacity, of natural waters will vary with local soils.
SALINITY
Salinity can be referred to as the total amount of soluble salts in water or soils. Thereis a constant ratio between the six major elements (chlorine, sodium, magnesium, sulfur,calcium, and potassium) and the three minor elements (bromine, strontium, and boron) inmarine water. Therefore, if the concentration of one element is known, the others can becalculated for salt water environments. In some fresh water locations, with minimal salts, thismay not hold true.
Freshwater contains few salts, drinking water usually has a salinity of less than .5 ppt,while sea water averages 35 ppt. Since seawater enters the Bay and its tributaries through theBay’s mouth, the salinity is highest at that point and diminishes as it approaches the headwatersof creeks and other freshwater sources.
SIGNIFICANCE
During times of low rainfall or low freshwater runoff, salinity increases, potentiallyhaving an adverse effect on the flora and fauna. Conversely, when storm events createincreased freshwater runoff, salinity decreases also with potentially adverse effects. With the

40
addition of salt to water osmotic pressure increases, reflected by the increased amount of ionsin the water, conductivity increases. Water density increases with increased salinity. Theeffects of density may result in a majority of functional changes such as feeding, movement,and dispersal differences. Increased salinity results in boiling point elevation and freezing pointdepression, which can produce temperature differences in shallow systems.
There are several procedures for measuring salinity. A hydrometer can be used tomeasure water density. Additionally, chlorinity can be determined using the Knudsen titrationprocedure. Also, salinity can be determined rapidly by using the principals of the refraction oflight using a hand held refractometer.
Measurement of Salinity
Materials
Water collection bottles, plastic pipette, refractometer.
Procedure
In the field collect water in the collection bottles. Take care to collect water from belowthe surface. Surface water may be diluted by rainwater. Using the plastic pipette, take a dropand apply it to the refractometer. Slide the tab back on the instrument, hold it to the light andlook through. The salinity reading will show up as a line through the gauge. The reading willbe in parts per thousands (ppt). Record the salinity on the data sheet.
MEASURING RAINFALL
Placement of Rain Gauge:
The rain gauge should stand far enough from trees, hills, overhead power lines andother obstructions to minimize interference with sampling. (Natural and manmade obstructionsmay cause turbulence and/or contamination, i.e. bird droppings, which can result innonrepresentative samples.) Specifically, there must be no obstruction above a 45 degree anglefrom the top of the gauge. (This means that a tree 30 feet tall should be at least 30 feet away.)
Installation of Rain Gauge:
The gauge should be installed so that the opening is parallel to the ground and at least1 m (3 feet) above the ground.
Reporting Rainfall Amount:
Record the amount of rainfall and empty the gauge after each rain. During heavy stormevents the gauge may need to be emptied frequently because it measures only 5.5 inches or 140millimeters (mm).The gauge should be read and emptied after it stops raining so that

41
evaporation does not cause false readings especially during hot weather. Record the weeklyaccumulations of rain in mm in the space provided on the data collection form.
WATER QUALITY CRITERIA FOR THE STATE OF FLORIDA
Waters in the state of Florida are classified by use. For example, most streams, riversand lakes are designated as Class III (either fresh or marine): Recreation, Propagation andMaintenance of a Healthy, Well-Balanced Population of Fish and Wildlife. Otherclassifications include Class I: Potable Water Supply, Class II: Shellfish Propagation orHarvesting, Class IV: Agriculture Water Supplies and Class V: Navigation, Utility, andIndustrial Use. Different protection levels are assigned to different uses. Thus as an example,Classes I-IV may have stricter requirements for dissolved oxygen than Class V water whichis classified as Navigation, Utility and Industrial Use.
There are numerous criteria for specific chemicals and metals. Several parameters arelisted below for Class III waters.
Class III Fresh Marine
DissolvedOxygen(mg/L)
Shall not be less than 5.0.Normal daily and fluctuationsabove these levels shall bemaintained.
Shall not be less than 5.0 in 24-hourperiod and shall never be less than 4.0. Normal daily and fluctuations abovethese levels shall be maintained.
pH Shall not vary more than one unit above or below natural background ofpredominately fresh waters and coastal waters or more than .2 unit aboveor below natural background of open waters provided that the pH is notlowered to less than 6 units in fresh waters or less than 6.5 units in marinewaters or raised above 8.5 units.
Turbidity(NTU)
< 29 above natural background conditions
Nutrients In no case shall nutrient concentrations of a body of water be altered so asto cause an imbalance in natural populations of aquatic flora or fauna.
Source: Department of Environmental Regulation 17-302, Surface Water Quality Standards

42

43
HILLSBOROUGH COUNTY ENVIRONMENTAL PROTECTION COMMISSIONWATER QUALITY MONITORING STATIONS
STATION NUMBER LOCATION
2 Hillsborough River at Platt St.74 Alafia River at U.S. 41101 Double Branch Creek at Hillsborough Ave.102 Channel "A"at Hillsborough Avenue103 Rocky Creek at Hillsborough Avenue104 Sweetwater Creek at Memorial Highway105 Hillsborough River at Rowlett Park Drive106 Hillsborough River at Fowler Avenue107 Baker Creek at Thonotosassa - Plant City Road.108 Hillsborough River at U.S. 301109 Palm River at U.S. 41110 Palm River at U.S. 60111 Turkey Creek at U.S. 60112 Little Manatee River at U.S. 41113 Little Manatee River at U.S. 301114 Alafia River at Bell Shoals Road115 North Prong of Alafia River, upstream of the confluence116 South Prong of Alafia River, upstream of the confluence118 Lake Thonotosassa at mouth of Flint Creek120 Cypress Creek at S.R. 581129 Little Manatee River at S.R. 674132 Bullfrog Creek at Symmes Road133 Delaney Creek at U.S. 41135 Middle of Lake Thonotosassa136 Cockroach Bay137 Hillsborough River at Columbus Avenue138 Delaney Creek at 36th Avenue and 54th Street139 South Prong of Alafia River at Bethlehem Road140 Little Manatee River at S.R. 579141 Rocky Creek at Waters Avenue142 Sweetwater Creek at Anderson Rd.143 Blackwater Creek at U.S. 39144 Bullfrog Creek at U.S. 41145 Trout Creek at S.R. 581146 Tampa By-Pass Canal at Fowler Avenue147 Tampa By-Pass Canal at M.L. King Blvd.148 Flint Creek at U.S. 301149 Mill Creek at 1-4150 Mill Creek at Alexander St.151 Turkey Creek at Durant Rd.

44
EPC of Hillsborough County SAMPLING STATIONS AND DATA
Sarnpling Stations
The table on page 45 lists the location of each sampling station while Figure 11 -1 on page 44locates the corresponding stations on a map of Hillsborough County.
Annual Averages
The1997 annual averages for the Tampa Bay stations are presented in the following tables for each water quality parameter measured.
The unit of measure for each parameter is as follows:
Biochemical Oxygen Demand (mg/l) Nitrogen, Ammonia (mg/l)Chlorophyll a (ug/l) Nitrogen, Kjeldahl (mg/l)Chlorophyll b (ug/l) Nitrogen, Nitrate (mg/l)Chlorophyll c (ug/l) Nitrogen, Nitrite (mg/l)Chlorophyll, Total (ug/l) Nitrogen, Organic (mg/l)Coliform, Fecal (colonies/100 ml sample) Oxygen, Dissolved (mg/l)Coliform, Total (colonies/100 ml sample) Phosphate, Dissolved Ortho (mg/l)Color (Platinum-Cobalt Units)) Phosphate, Total (mg/l)Conductivity (micromhos/cm) Salinity (parts per thousand)Depth, Bottom (feet) Solids, Suspended (mg/l)Depth, Sample (feet) Temperature, Air (degrees C)Effective Light Penetration (inches) Temperature, Water (degrees C)Fluoride (mg/l) Turbidity (NTU)Metals: Pb, Fe (ug/l)
Ca, Mg, Na, K (mg/l)
All information presented in this section is taken from “Surface Water Quality 1995-1997" compiled by the Environmental ProtectionCommission for Hillsborough County. For more information please contact, the Environmental Protection Commission ofHillsborough County 1900 9th Avenue Tampa, FL 33605. (813) 272-5960.

45
TRIBUTARY STATIONS1997 ANNUAL AVERAGES - PHYSICAL
STATION DEPTH DEPTH COLOR TURBIDITY SECCHI TEMP.WAT T EMP.WAT TEMP.WAT TEMP.AIRBoftom Sample Top Middle Bottomfeet feet Pt-CO NTU inches degrees C degrees C degrees C degrees C
2 9.1 4.5 14.3 3.3 53 24.2 25.3 25.3 23.074 10.8 5.4 19.9 7.5 47 23.8 24.1 24.3 26.6101 3.3 1.6 80.7 5.8 31 24.0 23.2 23.9 24.9102 5.8 2.8 21.9 6.4 37 23.6 23.7 23.7 24.6103 3.3 1.6 35.3 3.7 37 25.1 23.7 25.5 24.1104 6.6 3.3 26.6 4.8 47 22.9 24.4 25.1 23.7105 7.6 3.8 62.3 3.7 37 23.2 23.4 23.5 26.6106 5.2 2.6 63.9 2.2 46 21.5 22.5 21.2 29.5107 2.8 1.4 66.7 7.0 26 22.8 31.1108 6.5 3.2 57.2 3.2 50 22.3 22.3 22.3 30.7109 10.1 5.1 13.0 4.9 60 24.5 24.9 24.8 25.7110 16.3 8.1 13.5 11.9 38 25.9 25.0 24.8 30.0111 1.1 0.5 58.9 9.3 12 22.0 30.5112 9.4 4.7 55.2 4.2 51 24.2 24.2 24.2 28.3113 2.3 1.2 74.8 3.6 23 17.5 21.6 17.5 26.9114 6.1 3.1 40.3 3.7 55 22.0 22.0 22.0 24.3115 2.9 1.5 43.2 6.7 31 20.8 21.9 20.8 30.5116 2.3 1.2 57.6 2.9 26 17.3 22.5 17.2 30.5118 4.3 2.1 32.0 15.9 19 23.7 25.0 22.7 30.3120 3.9 2.0 125.9 3.4 35 20.7 21.0 20.7 27.9129 1.7 0.8 100.1 2.8 20 21.5 29.0132 2.2 1.1 48.8 3.6 27 21.4 25.8133 1.8 0.9 49.6 3.6 21 23.6 23.7135 12.6 6.3 32.8 12.0 20 24.9 24.4 23.7 30.4136 1.1 0.5 23.2 6.6 13 25.4 28.5137 12.0 6.0 47.3 4.2 47 23.5 23.9 24.4 22.8138 1.7 0.8 52.2 3.3 20 21.6 24.0139 1.9 0.9 25.0 3.8 22 19.4 22.8 19.4 29.6140 2.3 1.1 70.2 3.8 23 22.8 21.9 22.8 28.4141 4.3 2.2 38.9 1.9 49 22.5 23.7 22.4 26.1142 1.5 0.7 36.8 1.8 18 22.2 27.7143 1.4 0.7 73.9 4.5 15 21.4 30.1144 6.5 3.3 33.3 8.2 38 23.2 23.2 23.8 27.2145 1.8 0.9 111.3 4.3 18 14.1 20.4 14.1 29.2146 6.4 3.1 65.0 7.3 25 24.3 23.5 22.5 29.8147 18.3 9.2 31.8 5.0 37 25.3 24.6 23.7 28.7148 5.7 2.9 65.0 9.7 22 22.1 22.2 21.6 30.1149 1.4 0.7 22.9 6.8 17 28.1 29.9150 1.4 0.7 17.4 4.5 16 30.4 30.4151 1.6 0.8 41.8 3.3 20 18.1 22.6 31.1

46
TRIBUTARY STATIONS1997 ANNUAL AVERAGES - PHYSICAL- Continued
STATION CONb.T COND.M COND. B PH.T PH.M PH.B DO.T DOM DO.B SAL.T SAL. M SAL. B
umhos umhos umhos mg/I mg/I mg/I ppt ppt ppt2 27584 38892 41083 7.5 7T 7.7 5.2 4.4 3.7 16.9 24.8 26.374 28697 35975 39683 7.7 7.8 7.8 5.6 4.9 4.3 17.7 22.8 25.3101 11594 18809 12132 7.2 7.4 7.2 3.1 4.4 4.4 8.1 12.3 8.6102 29998 32817 36742 7.6 7.6 7.6 5.2 4.2 3.7 18.7 20.6 23.3103 8545 15530 16000 7.2 7.3 7.1 4.3 4.5 3.2 4.9 10.0 9.5104 11562 25156 32617 7.3 7.3 7.3 4.3 3.3 2.2 6.6 15.6 20.3105 4623 5213 5490 7.4 7.3 7.2 6.1 5.2 4.7 4.0 4.7 4.9106 316 333 313 7.2 7.2 7.1 5.2 5.0 4.9107 420 7.0 3.0108 348 346 346 7.5 7.5 7.5 6.5 6.5 6.6109 35209 38333 41142 7.8 7.8 7.7 5.4 4.5 3.6 22.3 24.4 26.3110 33633 38583 40842 7.8 7.6 7.4 5.0 2.9 1.8 21.1 24.6 26.2111 339 7.3 7.0112 19121 19423 19942 7.3 7.3 7.3 5.1 5.0 5.0 12.5 12.6 13.0113 210 381 225 6.2 7.0 6.3 8.1 7.5 8.4114 570 571 571 7.1 7.1 7.1 6.6 6.6 6.6115 814 700 814 5.9 7.3 6.0 7.4 7.8 7.4116 363 355 363 7.4 7.6 7.4 8.0 7.9 7.9118 418 1092 420 9.1 9.3 8.9 11.2 10.8 9.8120 290 334 292 6.8 7.0 6.8 3.2 3.2 3.3129 393 7.0 6.8132 482 7.2 7.6133 9635 7.1 3.3 8.4135 451 451 467 9.4 9.3 8.5 10.9 9.4 4.9136 38233 7.8 6.2 25.7137 16623 21148 29041 7.3 7.3 7.3 4.7 4.3 3.7 12.1 15.7 20.0138 714 7.3 4.2 1.0139 510 486 510 7.4 7.7 7.3 7.4 7.4 7.8140 284 436 284 6.7 7.1 6.7 7.1 7.7 7.0141 521 585 521 7.1 7.2 7.1 5.8 5.5 5.8142 289 6.7 3.1143 466 7.2 6.4144 16098 19047 28975 7.4 7.4 7.4 5.4 5.0 3.0 9.4 11.2 17.9145 186 313 188 7.0 7.0 7.1 7.8 5.8 7.9146 290 298 293 8.0 7.8 7.7 7.6 6.8 5.6147 545 550 589 8.2 7.9 7.4 8.3 6.9 3.3148 522 530 509 7.2 7.1 7.0 5.0 4.5 3.9149 488 7.3 3.6150 413 7.9 7.4151 449 7.5 6.8

47
TRIBUTARY STATIONS1997 ANNUAL AVERAGES - NUTRIENTS
STATION P.ORTHO P.TOTAL N.ORG N.KJEL NH3N N03.NO2 N.TOTALmg/I mg/l mg/l mg/l mg/l mg/l mg/l
2 0.19 0.23 0.67 0.75 0.09 0.044 0.8074 0.43 0.54 0.85 0.91 0.07 0.097 1.01101 0.11 0.18 0.96 1.07 0.11 0.044 1.12102 0.13 0.27 1.30 1.35 0.06 0.076 1.43103 0.12 0.20 0.89 0.99 0.10 0.186 1.18104 0.11 0.21 0.89 1.02 0.13 0.132 1.15105 0.19 0.27 0.92 1.00 0.09 0.098 1.10106 0.21 0.25 0.57 0.61 0.05 0.414 1.03107 0.44 0.64 0.84 0.94 0.10 0.160 1.10108 0.25 0.29 0.43 0.45 0.03 1.324 1.77109 0.26 0.36 1.00 1.05 0.05 0.035 1.09110 0.22 0.31 1.28 1.37 0.09 0.170 1.54111 0.59 0.93 0.91 0.95 0.04 2.513 3.46112 0.33 0.38 0.85 0.93 0.08 0.124 1.06113 0.38 0.44 0.62 0.66 0.04 0.802 1.46114 11.46 21.00 0.53 3.55 3.63 1.284 4.84115 14.41 21.53 1.34 4.42 3.08 0.910 5.33116 0.73 0.77 0.60 0.62 0.02 0.542 1.16118 0.10 0.36 2.94 2.95 0.02 0.038 2.99120 0.07 0.13 1.24 1.44 0.20 0.045 1.48129 0.63 0.64 0.72 0.75 0.04 0.178 0.93132 0.28 0.33 0.54 0.60 0.06 0.497 1.09133 0.49 0.55 1.09 1.41 0.32 1.144 2.56135 0.09 0.30 2.47 2.48 0.01 0.031 2.51136 0.23 0.35 1.16 1.21 0.05 0.028 1.24137 0.21 0.26 0.86 0.95 0.10 0.092 1.05138 0.46 0.51 0.85 0.99 0.14 0.592 1.58139 1.10 1.29 0.57 0.61 0.04 0.591 1.21140 0.45 0.54 0.66 0.71 0.05 0.986 1.70141 0.15 0.18 0.65 0.76 0.11 0.305 1.07142 0.06 0.10 0.55 0.60 0.05 0.065 0.66143 0.47 0.54 0.91 0.99 0.08 0.528 1.52144 0.30 0.42 0.94 1.06 0.12 0.287 1.34145 0.18 0.21 0.88 0.90 0.02 0.044 0.94146 0.21 0.31 0.96 0.99 0.03 0.029 1.02147 0.18 0.25 0.70 0.74 0.04 0.100 0.84148 0.30 0.47 1.95 2.26 0.31 0.187 2.45149 0.28 0.38 0.36 0.59 0.23 0.527 1.12150 0.21 0.28 0.21 0.39 0.18 0.551 0.94151 0.62 0.72 0.53 0.56 0.03 0.676 1.23

48
TRIBUTARY STATIONS1997 ANNUAL AVERAGES - BIOLOGICAL
STATION CHL.A CHL.B CHL.C CHL.T BOD.5 MF.COLI MFFECAL MRSTREPug/1 ug/1 ug/I ug/I Mg/I #/l 00ml #/100ml #/l 00ml
2 12.6 0.2 2.2 14.9 1.5 260 87 9174 19.0 0.2 4.2 23.4 1.9 72 29101 5.4 1.1 1.7 8.2 1.3 813 293 317102 51.3 0.4 11.4 62.9 4.4 250 63 95103 16.9 0.2 2.9 20.1 2.3 708 262 352104 18.7 0.5 2.8 21.9 2.6 2100 695 627105 22.7 1.8 3.0 27.0 2.4 953 340 20106 3.2 0.1 0.1 3.8 1.5 300 85107 8.0 1.1 0.5 9.6 1.8 1317 115 785108 4.0 0.2 0.2 5.6 1.0 575 122 302109 17.1 0.3 3.3 20.7 3.4 107 47 105110 44.6 6.3 7.6 56.9 5.0 133 83111 2.9 0.6 0.8 4.2 1.5 8225 2800 8150112 5.4 0.5 0.8 6.7 1.3 108 48113 0.9 0.1 0.2 2.1 1.1 1650 307 1075114 3.4 0.1 0.2 4.8 0.8 575 53 180115 1.3 0.5 3.2 4.9 0.7 1058 135116 1.3 0.7 0.9 2.8 0.7 458 102118 113.8 8.6 8.9 131.3 6.8 337 187120 1.3 0.7 0.9 2.9 2.3 1142 247129 0.6 0.2 0.5 1.3 0.9 658 58132 2.6 0.5 1.0 4.0 1.0 2200 880133 2.7 0.4 0.8 3.7 1.3 1533 725 1275135 103.9 5.9 7.6 117.4 5.6 60 48136 12.2 0.7 1.8 14.6 3.1 112 58137 11.5 0.6 2.5 14.6 2.5 312 143 227138 0.9 0.0 0.1 1.2 1.4 1525 758139 4.8 0.7 0.9 6.5 1.0 1308 223140 1.8 0.1 0.2 3.0 1.0 1592 400141 2.1 0.1 0.1 2.8 1.1 332 128 420142 3.1 0.6 0.6 4.4 1.2 725 175143 5.7 0.9 0.3 6.9 1.3 413 143144 14.1 0.9 4.8 19.3 1.9 1343 620145 3.3 0.5 0.8 4.6 1.4 407 187 418146 26.8 2.2 2.3 31.3 3.0 93 53 80147 32.7 3.4 3.5 39.5 3.0 237 155 302148 59.2 7.8 4.0 70.0 3.5 1258 347149 1.9 1.0 1.4 4,2 1.1 3083 225 1725150 1.9 0.8 0.9 3,6 0.9 5267 733 1692151 1.9 0.7 0.5 2.9 0.8 833 130

49

50
Group:____________________________________StreamSite:__________________________________________________________________________Date:______________________________________Quarter:___________________________________Form Completed by:_________________________Phone:_____________________________________
Send a copy to Hillsborough County Stream Waterwatch each quarter, before March 31, June 30,September 30 and December 31. (HCC Stream Waterwatch) 1206 N. Park Road Plant City, FL33566; e-mail [email protected] fax: (813) 757-2148. Attach latest results fromPhysical/Chemical or Biological Monitoring.
Activity Date Completed
Physical/Chemical Testing (once each month) January ________February ________March ________April ________ May ________June ________July ________ August ________September ________October ________November ________December ________
Biological Monitoring (once each quarter) 1st Quarter2nd Quarter3rd Quarter4th Quarter
____________________________________________________________________________
Habitat Enhancement Project (one time project)Riparian ReforestationStreambank StabilizationStream bed Restoration
Level I Activities Current _____yes _____noAre you a quality assured volunteer _____yes _____noComments:____________________________________________________________________

51
HILLSBOROUGH COUNTY STREAM-WATERWATCHBiological and Physical/Chemical Survey
Use this form to record important information about the health of your stream. By keepingaccurate and consistent records of your physical/chemical tests and data from your macroinvertebrate samples, you can document current conditions and changes in water quality.Name of Stream Location
Individual or Group Members Present QA/QC Certified VolunteerPresent?
Date County
Weather Conditions� clear� cloudy � rain � rain within last 24 to 48 hours?
Physical/Chemical Tests
Sample 1 Sample 2Basic Tests
Air Temp. _______ _______ (� C)Water Temp. _______ _______ (� C)pH _______ _______ (4-10)Dissolved Oxygen _______ _______ (mg/L)Turbidity _______ _______ (NTU)Clarity _______ _______ (m)Salinity _______ _______ (ppt)Rainfall _______ (mm)
Comments:____________________________________________________________________