GROWTH AND WHEAT PHYSIOLOGY, DEVELOPMENT
47
1 GROWTH AND WHEAT PHYSIOLOGY, DEVELOPMENT Edmundo Acevedo, Paola Silva and Herman Silva Laboratory of Soil-Plant-Water Relations. Faculty of Agronomy and Forestry Sciences. University of Chile. Casilla 1004. Santiago, Chile INTRODUCTION Wheat is a widely adapted crop it is grown from temperate irrigated to dry and high rainfall areas, and from warm humid to dry cold environments. Undoubtedly this wide adaptation has been possible due to the complex nature of its genome, which provides a fantastic plasticity to the crop. Wheat is a C 3 plant and as such it thrives in cool environments. Much has been written about its physiology, growth and development, which at present is reasonably well understood. In this chapter we will keep our presentation at the crop, plant and organ levels of organisation, aiming at providing physiological information that could be found useful for breeding and for agronomic purposes. We will move to the cellular level of organisation only in those cases where it is essential for explanation of physiological behaviour at other levels. We deal first with wheat development to examine later wheat photosynthesis and growth. We then analyse how the potential yield of wheat is conformed to end our discussion with the response of wheat to major abiotic stresses. WHEAT DEVELOPMENT Organ differentiation defines the various wheat stages of development. Physiologically the following stages are usually distinguished: germination, emergence, tillering, floral initiation or double ridges, terminal spikelet, first node or beginning of stem elongation, boot, spike emergence, anthesis and maturity. These stages may be grouped in germination to emergence (E); growth stage 1 (GS1) from emergence to double ridges; growth stage 2 (GS2) from double ridges to anthesis and growth stage 3 (GS3), to include the grain filling period, from anthesis to maturity (Figure 1). Physiological maturity is usually taken as the time when the flag leaf and spikes turn yellow (Hanft and Wych, 1982). The time span of each development phase depends essentially on genotype, temperature, daylength and sowing date. Table 1 shows typical time lapse values for the various stages in spring and winter type genotypes sown in May at 34° south latitude. Various environmental stresses particularly heat, but also water and salinity may shorten the wheat growth phases.
-
Upload
independent -
Category
Documents
-
view
0 -
download
0
Transcript of GROWTH AND WHEAT PHYSIOLOGY, DEVELOPMENT

1
GROWTH AND WHEAT PHYSIOLOGY, DEVELOPMENT
Edmundo Acevedo, Paola Silva and Herman Silva
Laboratory of Soil-Plant-Water Relations. Faculty of Agronomy and Forestry Sciences. University of Chile. Casilla 1004. Santiago, Chile
INTRODUCTION
Wheat is a widely adapted crop it is grown from temperate irrigated to dry and high rainfall areas, and from warm humid to dry cold environments. Undoubtedly this wide adaptation has been possible due to the complex nature of its genome, which provides a fantastic plasticity to the crop. Wheat is a C3 plant and as such it thrives in cool environments. Much has been written about its physiology, growth and development, which at present is reasonably well understood.
In this chapter we will keep our presentation at the crop, plant and organ levels
of organisation, aiming at providing physiological information that could be found useful for breeding and for agronomic purposes. We will move to the cellular level of organisation only in those cases where it is essential for explanation of physiological behaviour at other levels. We deal first with wheat development to examine later wheat photosynthesis and growth. We then analyse how the potential yield of wheat is conformed to end our discussion with the response of wheat to major abiotic stresses.
WHEAT DEVELOPMENT
Organ differentiation defines the various wheat stages of development. Physiologically the following stages are usually distinguished: germination, emergence, tillering, floral initiation or double ridges, terminal spikelet, first node or beginning of stem elongation, boot, spike emergence, anthesis and maturity. These stages may be grouped in germination to emergence (E); growth stage 1 (GS1) from emergence to double ridges; growth stage 2 (GS2) from double ridges to anthesis and growth stage 3 (GS3), to include the grain filling period, from anthesis to maturity (Figure 1). Physiological maturity is usually taken as the time when the flag leaf and spikes turn yellow (Hanft and Wych, 1982).
The time span of each development phase depends essentially on genotype,
temperature, daylength and sowing date. Table 1 shows typical time lapse values for the various stages in spring and winter type genotypes sown in May at 34° south latitude. Various environmental stresses particularly heat, but also water and salinity may shorten the wheat growth phases.

2
Germination to emergence (E) The minimum water content required in the grain for wheat germination is 35 to
45% by weight (Evans et al., 1975). Germination may occur between 4 and 37°C being optimal from 12 to 25°C. Seed size does not alter germination but affects growth, development and yield. Bigger seeds have several advantages when compared to smaller seeds, such as faster seedling growth, higher number of fertile tillers per plant and higher grain yield (Spilde, 1989). The advantage of bigger seeds is shown when the crop is grown under environmental stresses, particularly drought (Mian and Nafziger, 1994).
At the time that crop emergence occurs the seed embryo has three to four leaf
primordia and almost half of the leaf primordia already initiated (Baker and Gallagher, 1983a, 1983b; Hay and Kirby, 1991). During germination the seminal roots are the first to grow, followed by the coleoptile which protects the emergence of the first leaf. The length of the coleoptile limits sowing depth and its length changes with genotype increasing only lightly when seeds are sown deeper (Kirby, 1993). Semidwarf wheat has shorter coleptiles than tall wheat.
Emergence to double ridges (GS1)
Wheat tillers grow from the axils of the main shoot leaves. The potential number of tillers varies with genotype, particularly among flowering types, winter types having a bigger number. Semidwarf wheats usually have a high number of tillers. Bud differentiation into tillers and tiller appearance generally ends just before stem elongation starts (Baker and Gallagher, 1983b). Longneker et al. (1993) however suggest that tillering does not end at any specific wheat development stage but rather that it is controlled by a number of genetic and environmental factors.
Not all tillers produce spikes in wheat, many tillers abort before anthesis
(Gallagher and Biscoe, 1978). The number of productive tillers is dependent on genotype and environment and is strongly influenced by planting density (Table 2). Under potential conditions 1.5 fertile tillers per plant is a usual number.
Tillering has great agronomic importance in cereals since it may partially or
totally compensate the differences in plant number after crop establishment and may allow crop recovery from early frosts.
The duration of the vegetative stage (GS1) in wheat may vary from 60 to 150
days depending on sowing date and genotype. It depends on the rate of leaf appearance (phyllochron), and the time of occurrence of floral differentiation (double ridges), which are induced by photoperiod and vernalisation.
The phyllochron is defined as the interval between similar growth stages of two
successive leaves in the same culm. It has been used extensively to understand and describe cereal development. The phyllochron is strongly dependent on temperature (Rickman and Klepper, 1991), but severe water deficits (Cutforth et al., 1992), and
3
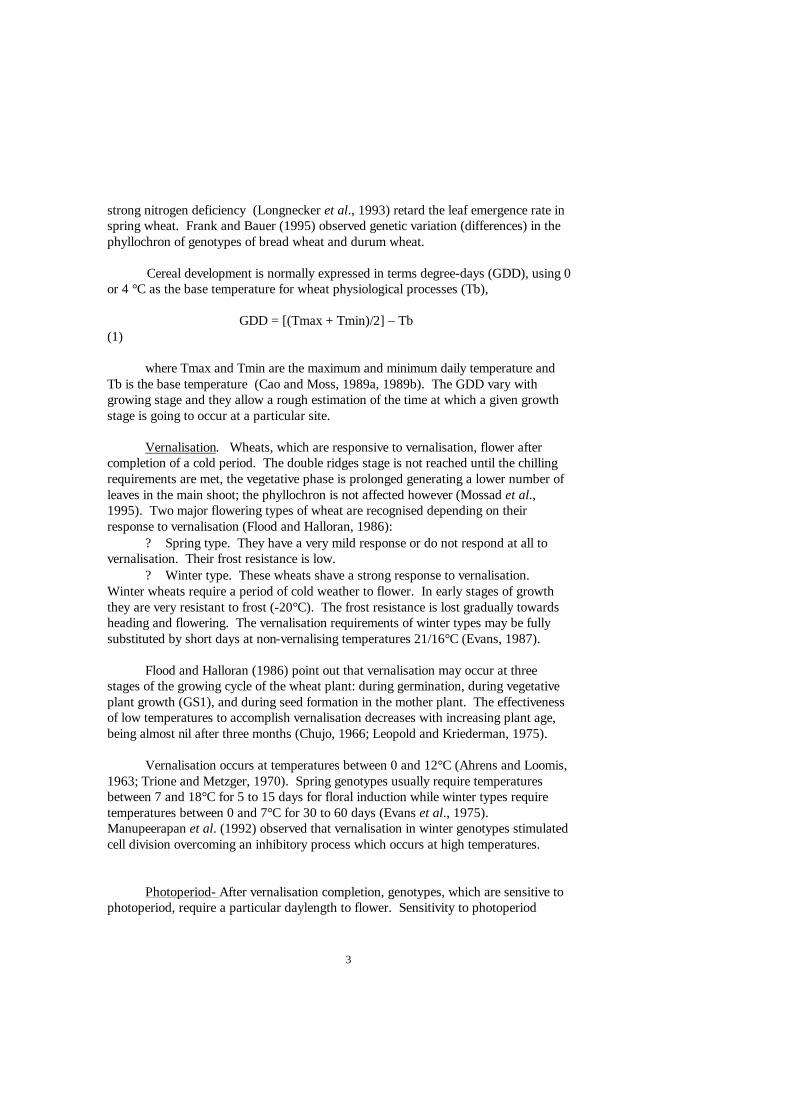
strong nitrogen deficiency (Longnecker et al., 1993) retard the leaf emergence rate in spring wheat. Frank and Bauer (1995) observed genetic variation (differences) in the phyllochron of genotypes of bread wheat and durum wheat.
Cereal development is normally expressed in terms degree-days (GDD), using 0
or 4 °C as the base temperature for wheat physiological processes (Tb), GDD = [(Tmax + Tmin)/2] – Tb
(1) where Tmax and Tmin are the maximum and minimum daily temperature and
Tb is the base temperature (Cao and Moss, 1989a, 1989b). The GDD vary with growing stage and they allow a rough estimation of the time at which a given growth stage is going to occur at a particular site.
Vernalisation. Wheats, which are responsive to vernalisation, flower after
completion of a cold period. The double ridges stage is not reached until the chilling requirements are met, the vegetative phase is prolonged generating a lower number of leaves in the main shoot; the phyllochron is not affected however (Mossad et al., 1995). Two major flowering types of wheat are recognised depending on their response to vernalisation (Flood and Halloran, 1986):
? Spring type. They have a very mild response or do not respond at all to vernalisation. Their frost resistance is low.
? Winter type. These wheats shave a strong response to vernalisation. Winter wheats require a period of cold weather to flower. In early stages of growth they are very resistant to frost (-20°C). The frost resistance is lost gradually towards heading and flowering. The vernalisation requirements of winter types may be fully substituted by short days at non-vernalising temperatures 21/16°C (Evans, 1987).
Flood and Halloran (1986) point out that vernalisation may occur at three
stages of the growing cycle of the wheat plant: during germination, during vegetative plant growth (GS1), and during seed formation in the mother plant. The effectiveness of low temperatures to accomplish vernalisation decreases with increasing plant age, being almost nil after three months (Chujo, 1966; Leopold and Kriederman, 1975).
Vernalisation occurs at temperatures between 0 and 12°C (Ahrens and Loomis,
1963; Trione and Metzger, 1970). Spring genotypes usually require temperatures between 7 and 18°C for 5 to 15 days for floral induction while winter types require temperatures between 0 and 7°C for 30 to 60 days (Evans et al., 1975). Manupeerapan et al. (1992) observed that vernalisation in winter genotypes stimulated cell division overcoming an inhibitory process which occurs at high temperatures.
Photoperiod- After vernalisation completion, genotypes, which are sensitive to
photoperiod, require a particular daylength to flower. Sensitivity to photoperiod

4
differs among genotypes. Most cultivated wheats however, are quantitative long day plants. They flower faster as the day length increases but they do not require a particular length of the day to induce flowering (Evans et al., 1975; Major and Kiniry, 1991).
Stefany (1993) observed a period of insensitivity to daylength in wheat, which
starts with germination. During this period the plant develops foliar primordia only. This may be considered as a juvenile phase, which is longer in winter wheat.
The photoperiod is sensed by mature leaves and not by apical meristems
(Barcello et al., 1992; Bernier et al., 1993). A single leaf is usually enough to sense the photoperiod for floral induction. Once the photoperiod insensitive period ends, floral induction starts and the reproductive stage begins (double ridges). The shorter the length of the day the longer is the inductive phase (Major, 1980; Boyd, 1986), the longer the phyllochron (Cao and Moss, 1989a, 1989b; Mossad et al., 1995), and the bigger is the flag leaf (Mossad et al., 1995). On the contrary, longer days advance floral induction (Evans et al., 1975).
The development of the inflorescence after induction occurs at a rate which is
also dependent on daylength in those genotypes sensitive to photoperiod (Stefany, 1993). The shorter the day, the longer is the phase from double ridges to terminal spikelet (Figure 2) increasing the period to terminal spikelet and the number of spikelets per spike. Changes in daylength after terminal spikelet have no effect on floret initiation nor anthesis date.
Wheat adaptation to a wide range of latitudes occurs at lower levels of
photoperiod sensitivity such that flowering is not retarded significantly if the day length is shorter than optimal (Santibañez, 1994).
Vernalisation and photoperiod constitute the basic processes of adaptation of
wheat to various environments. Its knowledge and genetic manipulation should continue to provide notable tools in terms of adaptation and yield.
Double ridges to anthesis (GS2)
Wheat plants have from 4 to 8 leaves in the main shoot when the growing apex changes from the vegetative to the reproductive stage. The length of the apex at this time is approximately 0.5 mm. The glume and lemma primordium stages follow. The floret primordia are found in the axil of each lemma. Temperatures above 30°C during floret formation cause complete sterility (Owen, 1971; Saini and Aspinal, 1982). Each spikelet has from 8 to 12 floret primordia in the central part of the spike. The basal and distal spikelets have from 6 to 8 florets. Less than half of these florets complete anthesis. The rest abort or are insufficiently developed before anthesis to be fertilised (Kirby, 1988; Kirby and Appleyard, 1987; Hay and Kirby, 1991).
Terminal spikelet. At this stage the growing apex is 4 mm in length with 7 to
Eliminado:

5
12 leaves in the main shoot. Spikelet number per spike is already determined at this stage, varying from 20 to 30 (Allison and Daynard, 1976; Kirby and Appleyard, 1984). Rahman et al. (1977) reported a positive correlation between the length of the vegetative phase and the number of spikelets per spike; lengthening the duration of the vegetative stage of the apex induces more spikelets per spike. However, the actual number of spikelets is determined by the length of the reproductive phase. Short days (8 hours) from double ridges to terminal spikelet initiation stimulate a large number of spikelets (Rawson, 1971; Rahman and Wilson, 1978).
Towards the end of this stage the apex, which was beneath the soil surface,
starts to grow faster and rise (Kirby and Appleyard, 1984). This stage is particularly sensitive to environmental stresses, particularly nitrogen and water (Wuest and Cassman, 1992a) therefore terminal spikelet is suggested as a stage where the second dose of nitrogen fertiliser should be applied (Biscoe, 1988) and as an indicator of the limit for using growth regulator herbicides (Kirby et al., 1989). One problem is that this stage is not easily detected without dissection of the plant. Masle (1984) and Kirby et al. (1985) point out, however, that terminal spikelet occurs in the field when the spike is at about 1 cm above the crown of the plant.
Spike growth. Once the terminal spikelet is formed, stem elongation starts and
the spike begins to grow. Spike growth occurs from the moment that the leaf prior to the flag leaf (penultimate leaf) appears up to 10 days past anthesis (Figure 3) (Kirby and Appleyard, 1984). Spike growth, slow in its early stages, increases greatly about the time the ligule of the flag leaf becomes visible (Krumm et al., 1990). Floret abortion starts in the boot stage and finishes at anthesis. Floret death occurs when the stem and peduncle are at maximum growth rate (Siddique et al., 1989). Floret death is probably, at least partially, due to competition for carbohydrates at this stage (Kirby, 1988). In the wheat crop there is a close relation between the number of kernels per unit area and the ratio between incoming radiation to the mean temperature above 4.5°C (the photothermal quotient) calculated for the 30 days preceding anthesis (Fischer, 1985a). Higher radiation increases the amount of photosynthates available for spike growth and lower temperatures prolong the period of spikelet growth and decrease competition for carbohydrates.
Meiosis in wheat, which originates the pollen in the anthers and the embryo sac
in the carpel, coincides with the boot stage (DC 41). This is a very sensitive stage to environmental stresses. In wheat and barley, meiosis starts in the middle of the spike continuing later above and below this zone (Zadoks et al., 1974).
Anthesis to physiological maturity (GS3)
The wheat spike contains only one spikelet per rachis node. Each spikelet has between three and six potentially fertile florets (Kirby and Appleyard, 1984), which are autopollinated in 96% of the cases (Martin et al., 1976). Anthesis begins in the central part of the spike and continues towards the basal and apical parts during a 3 to 5 day period (Peterson, 1965). The proximal florets of the central spikelet are fertilised 2 to
6
4 days earlier than the distal florets. These grains usually have a greater weight (Simmons and Crookston, 1979).
After floret fertilisation cellular division is rapid, during which period the endosperm cells and amiloplasts are formed. This period is known as the lag phase and lasts for about 20 to 30% of the grain filling period. After this period there is a phase of cell growth, and differentiation and starch deposition in the endosperm which corresponds to linear grain growth and takes from 50 to 70% of the grain filling period. The embryo is formed at the time of endosperm growth (Jones et al., 1985).
Quantification of wheat development There are several scales or development codes in wheat, which describe visible growth stages without the need of dissection of the plant. Among these, the most widely used are Haun’s scale (Haun, 1973), which is most useful to define vegetative growth stages. Feeke’s scale (Large, 1954) and Zadoks scale (Zadoks et al., 1974) provide a good description for both, vegetative and reproductive stages. Comparison among scales is usually complicated but a computational program was developed that allows conversion from one scale to the other (Harrell et al., 1993). Crop development stages are determined in representative plants in the field avoiding borders of plots and any interfering material. Zadoks scale is the most comprehensive and easiest to use. It describes all stages of the cereal growth cycle, incorporating characteristics not considered in other scales. It is based on a decimal code, which incorporates various aspects of plant development. The main growth stages are self-explanatory and are presented in Table 3. A second digit, values of 0 to 9, gives detail for each main growth stage using the position 5 for the middle value. Leaf numbers, for example, have decimal codes from 11 to 19 and the tillers in the main shoot from 21 to 29.
After emergence all development stages are based on observations on the main
shoot, usually the tallest and thickest. After stage 40 (39, flag leaf lingule is just visible and 41, early boot stage, spike is beginning to swell), the stages of main shoot and tillers become similar and the stages are determined by viewing the whole plant. Stages 70 to 93 are determined by the development stage of individual kernels or grain in the middle of average spikes (Table 3).
WHEAT GROWTH
The net CO2 assimilation at the tissue level constitutes the basis for growth.
Many factors affect the net assimilation of CO2, among other, the growth and development stage of the plant and environmental characteristics such as light, nitrogen, temperature, CO2 and water status.
Four main basic processes are involved in photosynthesis: a) a photochemical
process determining the quantum yield and depending on light intensity, b) a
7
biochemical process particularly linked to carboxylation, c) physico-chemical processes of CO2 transfer from the external air to the carboxylation sites and d) the photorespiration process in C3 plants.
At optimum temperature (20-250C) the maximum light saturated rates of photosynthesis (Amax) at the leaf level in bread wheat are between 15 to 25 (? moles CO2 m-2 s-1) (25-40 mg CO2 dm-2 h1). Ninety percent of the light saturation rate is reached at 1,000 ? moles quanta m-2 s-1 of photosynthetically active radiation (PAR). Wild relatives of wheat, however, may have substantially higher Amax than cultivated wheat (Austin, 1990).
Much attention has been given to the question on how to increase total photosynthetic yield. Of the two photosynthetic parameters, quantum yield (rate of photosynthetic assimilation/incident light intensity), and Amax, a much greater improvement in canopy photosynthesis could be theoretically achieved by increasing quantum yield. Unfortunately, the quantum yield of the photosynthetic process itself is very constant among genotypes (Austin, 1990). An improved discrimination of RUBISCO for CO2 with respect to O2 would increase the quantum yield of the overall process by decreasing photorespiration (normally 25% of the energy produced by photosynthesis) but not much variation in the discrimination of RUBISCO has been found between species (Sommersville, 1986; Loomis and Amthor, 1996). Some scope appears to exist for selecting genotypes with a reduced maintenance respiration, which normally uses 2 to 3% of the dry weight per day (Robson, 1982) but its effect on radiation use efficiency would be low (Loomis and Amthor, 1996). Amax varies significantly among species and cultivars. In wheat it has been known for some time that certain diploid ancestor species have higher Amax values than present advanced lines of bread and durum wheats (Dunstone et al., 1973), however little progress has been made with respect to yield increases by this approach.
Canopy photosynthesis Canopy photosynthesis is closely related to the photosynthetically active (400 to
700 ? m) absorbed radiation (PARA) by green tissue in the canopy (Fischer, 1983). PARA
can be calculated from the fraction of solar radiation at the top of the canopy, which is transmitted to the ground (I/I0) from the following relation:
PARA = Rs * 0.5 * 0.9 * (1- I/I0) (2)
where Rs refers to the total solar radiation (MJ m-2 d-1), the factor 0.5 refers to the fraction of total solar energy, which is photosynthetically active, (1- I/I0) is the fraction of total solar radiation flux, which is intercepted by the crop, and 0.9 * (1- I/I0) is the fraction of radiation absorbed by the crop allowing for a 6% albedo and for inactive radiation absorption (Loomis and Amthor, 1996).
I/I0 essentially changes as the crop LAI increases and it is not very dependent on other factors such as cloudiness or time of the day. It is measured with a PAR sensor since

8
the attenuation of Rs in the canopy differs from that of PAR. The relationship between I/I0
and LAI fits a negative exponential (similar to Beer Lambert law), such that:
I
_________ = e -K * LAI (3)
Io
where e is the base of the natural logarithm and K is known as the canopy extinction coefficient.
The canopy extinction coefficient K in wheat crops ranges from 0.3 to 0.7 and is highly dependent on leaf angle (low K for erect leaves). From equation 3 it can be calculated that 95% PAR interception requires a LAI as high as 7.5 for erect leaves but only a LAI of about 4.0 for more horizontal leaves.
The total canopy net photosynthesis is linearly related to PARA and so is crop growth rate (CGR, g m-2 d-1
) which is the net accumulation of dry weight, such that
CGR = RUE * PARA (4)
where RUE is the radiation use efficiency in g m-2 d-1.
Final yield is therefore the product of cumulative seasonal radiation absorption, RUE and the portion of total biomass that goes to yield (harvest index).
Potential radiation use efficiency in strong light depends on several factors:
adequate water to allow high stomatal conductance and transport of CO2 into leaves, leaf arrangement relatively vertical to the radiation beam, good leaf nutrition to support large photosynthetic capacity, an active Benson-Calvin cycle to incorporate CO2 and appropriate canopy ventilation supplying CO2 and dissipation of heat (dissipation of excess energy due to light saturation). Due to environmental constraints, a quantum requirement of 10 mol quanta/mol CO2 under light limited conditions may increase to 20 and 30 under field conditions with a decrease in RUE from 8.2 to 3.7 and 2.2 g DM MJ-1 PAR (Loomis and Amthor, 1996). Practical estimates of maximum RUE by these authors was 3.8 g DM MJ-1 that would occur with long cool days and moderate radiation (20 MJ m-2 d-1). Warm temperature, the small concentration of CO2 relative to O2, and light saturation limit attainment of a greater RUE.
Measured values of RUE in a wheat crop are close to 3.0 g DM MJ-1 PARA when roots are included (Fischer, 1983).
RUE varies as Amax changes. Increases in N of the canopy increase Amax and
9
RUE. Frost at night and temperatures below 15°C during daytime can reduce Amax. Water stress has a small effect on RUE but radiation intensity beyond a given value may reduce RUE. The RUE declines during grain filling probably due to sink limitation and/or leaf senescence (Fischer, 1983). Most studies show no difference in CGR between genotypes, even when Amax varies (Austin et al., 1986), but a higher CGR at anthesis was related to higher yield in Australian modern wheat cultivars (Karimi and Siddique, 1991) grown under water stress.
Potential yield
Yield potential defined as the yield of an adapted genotype grown under optimal
management and in the absence of biotic and abiotic stresses, has been found to be a very useful concept since usually progress in yield potential leads to progress in wheat yield in farmer’s fields, particularly if stresses are mild.
The yield of a wheat crop can be expressed as the product of two components,
GY = KNO * KW (5) where GY is grain yield in g m-2 KNO is the kernel number (m-2) and KW the kernel
weight (g). It follows from equation 5 that changes in wheat yield potential could be achieved
through changes in KNO and /or KW. Strong associations with yield have been found with KNO for sets of wheat genotypes (Austin et al., 1980, Slafer et al., 1990; Slafer et al., 1996). KNO is established in the period between 20 – 30 days before flowering and 10 days after anthesis. This period coincides with tiller and florets mortality along with the active growth of the stem (peduncle) and spike. Gains in KNO, however, do not translate directly in yield potential gain due to partial compensation by decreased KW. Slafer et al., (1996) argue that the lower KW observed with increased KNO is not only due to a lower amount of assimilates per grain but it is the result of an increased number of grains with a lower weight potential coming from more distal florets.
It is essential to understand kernel number variation to understand yield potential.
The yield components of wheat combine with each other to give a number of kernels per unit area. The product of plants m-2, spikes per plant, spikelets per spike, florets per spikelet, and grains per floret is KNO. Due to the compensation effects (Table 2), it is difficult however to isolate the effect of a given yield component on KNO.
A common observation is that the calculated grain production potential based on
the potential of each yield component is much higher than what is actually realised. Theoretical estimates of 180,000 grains m-2 based on yield components end up with realised KNO of only 18,000 m-2. It has been shown that competition for limited resources during the spike growth period, including light and nitrogen and hence photosynthates is the major cause of KNO potential loss.
10
Spike dry weight appears to be a major determinant of KNO. Competent floret number is closely related to spike dry weight (Fischer, 1983). In turn, spike dry weight can be expressed as a fraction of the product of spike growth period (DS, days), the crop growth rate during the period (CGR, g m-2 d-1) and the partitioning of assimilates to the spike during the spike growth period (Fs). Increasing any of these three components of spike dry weight should result in a higher spike dry weight and KNO (Fischer, 1985b).
DS is largely affected by temperature and photoperiod (see development this
chapter). CGR is linearly related to PARA (equation 4), and F is largely dependent on the number of competent florets in each spikelet, a factor that has a strong genotypic component. The number of kernels per competent floret is usually 1.0 but environmental stresses such as boron deficiency and severe water stress may induce sterility and reduce grain set.
Fischer (1985a) stated that the major environmental factors determining KNO
under potential growing conditions for wheat were solar radiation Rs and temperature (T). These factors can be summarised in the photothermal quotient PTQ, such that
PTQ = Rs / (T- 4.5) MJ m-2
d-1 C-1 (6)
where 4.5 is the base temperature for wheat growth. The numerator represents the positive association of Rs with CGR while the denominator represents the negative effects of high temperature that shortens the duration of the spike growth period. Indeed, Dhillon and Ortíz-Monasterio (1993) found a close positive association between PTQ calculated for the spike growth period (from 20 days prior to heading to 10 days after heading) and kernels m-2 studying three spring type wheat genotypes grown at ten dates of planting under optimum management. They concluded that genotypes maximised their yield when the PTQ value was highest between 20 days before and 10 days after heading and suggested that all genotypes should maximise their yield by flowering during the highest PTQ in the growing season. The PTQ concept should be valid for stress free conditions and a LAI of the crop that fully intercepts the incoming solar radiation, such that the linear relation between CGR and Rs (equation 4) holds.
The potential kernel weight is mostly dependent on genotype but it may be limited
to some extent by post anthesis assimilate supply. It should be emphasised, however, that potential grain yield is more limited by sink size (KNO) than by post anthesis assimilate supply, i.e., higher KNO always gives higher yield. High temperatures during grain filling may reduce the grain growth period by shortening the duration of photosynthetic tissue and in this case the source may become limiting. It has been suggested that wheat grain yield may be increased by increasing the kernel weight (Richards, 1996) searching ways to increase the grain filling rate.
Nitrogen is a major constituent of the photosynthetic apparatus. After water,
nitrogen is the major constraint to crop growth. Around 25 kg of N are usually required as fertiliser to produce a ton of wheat grain. Therefore, wheat yields are highly dependent on
11
nitrogen. Leaf area development is responsive to N and so is CGR and RUE. Recent reports indicate that the N concentration in the spike at anthesis correlates closely with KNO and hence grain yield (Abbate et al., 1995). This finding may be related to a higher availability of carbon for ear growth resulting in greater spike dry weight and floret fertility which in turn results in greater grain number and yield (Brooking and Kirby, 1981). The highest grain yield response to fertiliser N in wheat occurs when it is applied just prior to the initiation of stem extension (DC 30). Delaying N application beyond DC 32 reduces the grain yield response such that at DC 70 (kernels recently formed) and beyond, no wheat yield response is observed to N fertilisers but an increase in grain protein only (Mossedaq and Smith, 1994). Delaying N fertilisation through DC 30 not only increases grain yield but also decreases lodging and lowers fertiliser losses increasing N recovery (Brooking and Kirby, 1981; Wuest and Cassman, 1992a and 1992b). The benefit of split N applications in N use efficiency compared to preplanting application has been generally confirmed (Sowers et al., 1994).
There are genotypic differences in the response to nitrogen. In general, genotypes
with a higher yield potential have a higher N use efficiency (yield/N supply) as a result of higher N utilisation efficiency (yield/N uptake). But there is a negative association between genotype yield potential and protein content of the grain, a parameter that is important in grain quality. Nitrogen applications near anthesis increase the protein content of the grain.
Prospects for increasing yield potential of wheat.
It is clear that any increase in the yield potential of wheat will come from breeding.
Progress in breeding for yield potential is more likely to occur if specific characteristics are targeted as it has occurred in grain quality improvement and disease resistance breeding. Targeting the yield potential improvement requires an understanding of the physiological processes that may be genetically modified to improve the yield as shown in this chapter. Some of these are already being exploited such as flowering time to improve adaptation to particular regions and plant height which greatly influences yield potential (Table 4).
An interesting observation in several studies is that efforts to increase wheat grain
yield through breeding have not resulted in an increased biomass under potential growing conditions (Evans, 1993). {Note that usually there are genotypic differences in biomass when stresses such as drought are present, e.g., Sharma (1992)}. Grain yield, however, has been substantially increased at a mean rate of 0.9% per year over the last 30 years (Sayre et al., 1997). The increase in potential grain yield has come essentially from an increase in harvest index, and particularly from an increase in grain number per unit area (see above) rather than an increase in kernel weight. It appears that assimilate supply is not generally limiting yield potential except for the period of rapid spike growth, pointing to the partitioning of carbon to the reproductive structure as the main determinant of yield potential. Trimming of the leaf area to one half, for example, (Richards, 1996) at the beginning of the rapid grain growth period did not reduce grain yield (neither KNO nor KW) and plants compensated for the reduced leaf area by increasing stomatal conductance.

12
The wheat plant appears to have a photosynthetic system that is operating at a level below its potential. The crop can respond to an extra demand of photosynthates when required, say by an increased number of grains per unit area. Indeed, yield increases from bread wheat material released in the last 30 years has been found to be related to increases in grain number (Sayre et al., 1997) and with increased stomatal conductance and photosynthetic rate as well as reduced canopy temperature (Rees et al., 1993). It appears that the driving process is the increased KNO and that changes in leaf conductance, photosynthesis and temperature are a response to an increased demand for assimilates (Richards, 1996).
Grain number may be increased by: a) reducing the size of competing organs such as the peduncle and number of sterile tillers during spike growth; b) increasing the number of spikelets per spike; c) extending the duration of the interval between floral initiation and terminal spikelet by extending the duration of spike growth; or d) increasing floret survival by avoiding carbon, water and nutrient (particularly N) limitations (Abbate et al., 1995). Radiation use efficiency during the rapid spike growth period could also be increased by erect canopies with short leaves if grain demand for photosynthates is high (Araus et al., 1993).
WHEAT PHYSIOLOGY AND ABIOTIC STRESS
Abiotic stress includes any environmental conditions or combination that
negatively affects the expression of the genetic potential for growth, development and reproduction (Jones and Qualset, 1984).
The main strategy used in the past to deal with environmental stress has
been to alleviate the stress through irrigation, soil reclamation, fertiliser use and others. Economics as well as ecological limitations associated to these practices, however, have prompted the interest in searching for plant genetic resistance to environmental stresses. Abiotic environmental factors explain 71% of the reduction of potential yield of annual crops in the USA (Boyer, 1982). Wheat yields are depressed, among other factors, by drought, heat, low temperatures, low fertility especially nitrogen and soil salinity. We will briefly review the effect of these stresses on wheat growth, development and yield.
Water stress Water stress is of common and wide occurrence in nature. It occurs whenever water absorption by the crop is lower than the evaporative demand of the atmosphere. Two major processes are involved: a) water absorption by the crop which is controlled by root characteristics and soil physical properties and b) crop evapotranspiration which depends on atmospheric properties notably net radiation and vapour pressure deficit (vpd) and crop characteristics such as crop ground cover and stomatal conductance. Notwithstanding that wheat may experience water stress in any environment, it is a typical constraint in CIMMYT’s megaenvironment 4, which is a
13
dry temperate environment covering about 20% of the developing world area planted to wheat. The major features of this megaenvironment are presented in Table 5. Crop evapotranspiration and more precisely crop transpiration is positively and linearly related to grain yield in C3 and C4 plants, therefore water stress inevitably decreases yield. Figure 4 shows an ET-grain yield relation for wheat obtained from 178 crop-year database of irrigated and dryland wheat data from Bushland, TX. The ET-grain yield relationship was determined as linear, with a regression slope of 1.22 kg grain per m3 ET above the ET threshold of 208 mm required to initiate grain yield (Musick et al., 1994). In order to show the physiological effects of water stress in wheat, we will use the major developmental phases described earlier (Figure 1). Water stress may occur in any of these phases according to the environment where the crop is grown. The most critical phase for water deficit is GS2, when KNO is being determined.
Germination to emergence (E) Rainfed arid environments may present early drought in the growing season affecting wheat germination and crop establishment. Decreased seed reserves, low germination and high soil mechanical impedance may hamper crop establishment (Bouaziz and Hicks, 1990). Seed size, protein content and initial root and aerial biomass are correlated in wheat (Ries and Everson, 1973). Several authors have pointed out the positive effect of larger size on wheat germination and establishment (Singh, 1970; Ries and Everson, 1973; Hampton, 1981; Kalakanavar et al., 1989). The negative effects of early drought are also lower if wheat seeds are bigger in size (Mian and Nazfiger, 1994). The larger root mass in seedlings from bigger seeds may help to maintain a better water balance under early water stress if water is available deeper in the soil profile. Another seedling trait useful to improve crop establishment under current variable rainfall is coleoptile length. The major variation in the coleoptile length is genetical (ICARDA, 1987). Genotypes with long coleoptile allow sowings at greater soil depth avoiding a “false start” by rainfall events which are not of sufficient magnitude or frequent enough to assure the establishment of the crop. Early autumn planting has demonstrated clear advantages in rainfed Mediterranean environments (Acevedo et al., 1991a); the penalty in terms of crop yield associated with delayed planting is in the order of 1% yield loss per day. (Acevedo et al., 1998a). Deep early sowing is required in this case to avoid a “false start”. In soil that is dry at the beginning of the season, seeds should be planted at a depth that would not allow germination unless significant rainfall has occurred to wet the first 10 cm of soil.
Emergence to double ridges (GS1) Water stress during GS1 may increase the phyllochron of bread and durum wheat (Krenzer et al., 1991; Simane et al., 1993), but leaf expansion is most sensitive

14
to water stress (Acevedo et al., 1971) and leaf growth can be drastically reduced at leaf water potentials of -0.7 to -1.2 MPa (Eastham et al., 1984). Tillering is also very sensitive to water stress being almost halved if conditions are dry enough (Peterson et al., 1984; Rickman et al., 1983). As a result, leaf area index development is the most affected physiological process during this stage. Water deficit just before flower initiation may also decrease the number of spikelet primordia at this stage (Oosterhius and Cartwright, 1983).
Double ridges to anthesis (GS2) Wheat plant growth (roots, leaves, stems and ears) continues up to approximately 10 days after anthesis. GS2 is therefore a period of very active plant growth. It follows that mild to moderate water deficits during this period will decrease cell growth and leaf area with consequent decrease of photosynthesis per unit area. If the water deficit is more intense, net photosynthesis will decrease even more due to partial stomata closure (Acevedo, 1991a). Stomata start to close in wheat at leaf water potentials of -1.5 MPa (Kobata et al., 1992; Palta et al., 1994). Decreased leaf internal CO2 (Ci) has the effect of decreasing electron transport. Continued over-excitation of the light-harvesting system with no electron transport causes photoinhibition, damaging the system (Long et al., 1994). Maintenance of the plant’s water status and open stomata is therefore important not only for cooling but also for maintaining a high conductance for CO2, which keeps photosynthetic dark reactions going and electron transport functioning (Loomis and Amthor, 1996). Chlorophyll fluorescence is observed when light-harvesting exceeds the capacity of the dark reactions, consequently, fluorescence measurements are now used widely for detection of stress effects on crop (Seaton and Walker, 1990). Grain number decreases sharply when water stress occurs during the spike growth period (Hochman, 1982). Yield reduction is at a maximum when the water stress develops from 10 days before spike emergence. Water stress during this stage also decreases spikelets per spike of fertile tillers (Hochman, 1982; Moustafa et al., 1996) (Table 6) and causes death of the distal and basal florets of the spikes (Oosterhuis and Cartwright, 1983). As mentioned earlier in this chapter, Carbon and Nitrogen availability for spike growth are critical at this stage of development. Both are decreased by water stress.
Anthesis to maturity (GS3) Water deficit close to anthesis accelerates development (Simane et al., 1993); the accumulation of soluble carbohydrates in the stem occurring between anthesis and the linear phase of grain growth is decreased (Nicholas and Turner, 1993). The remobilization of pre-anthesis assimilates to the grain becomes very important as photosynthesis is decreased by water stress and total non-structural carbohydrates from wheat leaves and stems (particularly fructans and sucrose) significantly contribute to grain growth (Bidinger et al., 1977; Richards and Townley-Smith, 1987; Kiniry, 1993; Palta et al., 1994).
15
Water stress during grain filling does not affect the number of fertile tillers nor KNO; grain weight is, however, reduced (Hochman., 1982; Kobata et al., 1992) due to a shortening of the grain filling period resulting from accelerated senescence. Foliar application of dilute solutions of KH2PO4 (at a rate of 10 kg ha-1) may delay high temperature and terminal drought induced senescence increasing yield of wheat (Benbella and Paulsen, 1998). It has been consistently found that barley and tall bread wheats have higher drought resistance while semi-dwarf wheat are intermediate and durum wheats are most susceptible (Fischer and Maurer, 1978; Sojka et al., 1981). A similar yield trend under drought was found by Acevedo et al. (1988, 1990) who also pointed out that in their nurseries the 2 row barley’s had higher yields than the six row barley’s.
Water deficit and grain yield The yield of a dryland crop can be expressed as the product of transpiration (T), transpiration efficiency (TE) and harvest index (HI) (Passioura, 1977), such that, GY = T * TE * HI (7) where GY is grain yield. This identity has been widely used to identify traits that would increase grain yield of winter cereals under drought stress (Acevedo, 1987; Richards, 1987). Grain yield increases with transpiration (T). Those genotypes that keep their stomata open during water stress have higher yield under stress (Venora and Calcagno, 1991; Acevedo and Fereres, 1993). Gas exchange measurements indicate differences in TE. The difficulty of integrating instantaneous gas exchange measurements temporally and specially has limited its use in crop improvement program (Menendez and Hall, 1996). TE can be estimated at the plant level using carbon isotopic discrimination. The magnitude of the discrimination between atmospheric 13C and 12C in the photosynthetic process is linearly and negatively related to TE in wheat (Farquhar and Richards, 1984; Masle and Farquhar 1988; Condon and Richards, 1993 and positively and linearly correlated to grain yield (Condon et al., 1987; Sayre et al., 1995). The 13C discrimination provides an indirect measure of TE and it can be used in genetic improvement programs for limited rainfall environments (Farquhar and Richards 1984; Austin et al., 1990;; Acevedo, 1993). There is genetic variability in 13C discrimination in wheat hence high yielding, high TE lines can be found. It should be noted that TE is largely dependent on vpd, therefore, whenever comparisons are made they should be expressed on a vpd basis. In a crop situation where rains are frequent, water evaporation from the soil surface can be substantial, particularly if the crop cover is not complete and there is a

16
fraction of soil exposed to solar radiation. Values of soil water evaporation of 50% of ET or more are common, therefore, much can be done to increase grain yield in dryland crops by increasing water use efficiency through appropriate crop management practices (Harris et al., 1991; Acevedo et al., 1998b). Harvest index (HI). In dry environments this value is determined by the water transpìred during grain filling and the prevailing TE during that period (Passioura, 1977). If no water is left for transpiration after anthesis the best attainable yield is in the order of 10 - 15% of the biomass at anthesis.
Drought resistance Drought resistance is usually quantified by grain yield under drought. Wheat grain yield under drought, however, depends on yield potential as well as the phenology of the genotype (Acevedo, 1991b). The quantification of drought resistance has also been approached by a yield stability index across environments (Finlay and Wilkinson, 1963; Eberhart and Russell, 1966) as well as by drought susceptibility indexes (Fischer and Maurer, 1978). These indexes are highly dependent on yield potential and crop phenology which are characters with a high genotype x environment interaction (Acevedo, 1991b). To avoid these effects, Bidinger et al. (1987a, 1987b) proposed a drought resistance index (DRI), equivalent to the residual effect of yield under stress once the effects of yield potential, phenology, and experimental error had been removed. The DRI is a criterion to be used to select drought resistant genotypes or genotypic traits related to drought resistance that could be manipulated as independent genetic characters (Acevedo and Ceccarelli, 1989). Physiological and morphological characters that confer drought resistance can be classed according to their association to water absorption or water loss by the crop: a) morphological and physiological traits related to an increase in water absorption to include root growth, osmotic adjustment and related solutes, and membrane stability (Acevedo et al., 1998a); b) morphological and physiological traits related to a decrease in transpiration. Promising traits for genetic improvement related to a decreased transpiration include: leaf colour (van Oosterom and Acevedo, 1992), leaf movements, epicuticular waxes and trichomes on leaf surfaces (Upadhayaya and Furnes, 1994), stomatal behaviour (Venora and Calcagno, 1991), transpiration efficiency (Farquhar and Richards, 1984; Austin et al., 1990; Acevedo, 1993) and air to canopy temperature difference (Blum, 1988; Rees et al., 1993). Morgan and Condon (1986) demonstrated that segregating lines of bread wheat and durum wheat with a high capacity for osmotic adjustment had a yield advantage (11-17% in bread wheat and 7% in durum wheat) when compared to near isogenic lines without this character.

17
Heat stress High temperatures severely limit wheat yield. They accelerate plant development and specifically affect the floral organs, fruit formation, and as well, the functioning of the photosynthetic apparatus. Recognising the fundamental linkage between water and heat stresses in plants we will centre our attention on one of them, heat stress, and assume that the wheat plants do not suffer water shortages. For breeding purposes, however resistance to these two stresses usually has to be combined. Transpiration, a mechanism of heat avoidance is the primary agent for energy dissipation. A crop that maintains transpirational cooling may be a good heat avoider. The temperature of plant organs in the field may differ from that in the air by several degrees. This difference increases with a greater rate of transpiration. For wheat with no shortage of soil water the leaf to air temperature difference increases linearly with vapour pressure difference (Idso et al., 1984). If water shortage arises and stomata begin to close, leaf temperature rises and may exceed air temperature. Leaf photosynthesis is negatively affected as leaf temperature rises above 25°C in cool-grown wheat leaves but leaves acclimated to warm temperature start to show a similar decline as temperatures exceed 35°C. At 45°C leaf photosynthesis may be halved.
Heat stress decreases total above ground biomass and grain yield in wheat. For analysis purposes of heat stress effects we will use the development phases described above in this chapter. Temperature has a differential effect on each of these phases (Shpiler and Blum, 1986; O’Toole and Stockle, 1991). The most thermosensitive stage of wheat grain yield is GS2, when KNO is being determined.
Germination to emergence (E) From sowing to emergence, seedling mortality, and hence crop establishment,
is a problem when soil temperatures are high. Plant emergence and population establishment are the starting points of crop growth. In hot environments, however, the maximum soil temperature in the top centimetres may exceed maximum air temperature by 10-15°C if the soil surface is bare and dry and radiation intensity is high. Under such conditions, maximum soil temperature may reach 40 to 45°C with serious effects on seedling emergence. The initial plant population may fall below 100 plants/m2, considered to be deleterious to crop yield. Table 7 shows the average number of plant established in a nursery of bread wheat genotypes planted at increasing soil temperatures in the field. Significant differences in crop establishment, genotypes and genotype x environment interactions were found under heat stress by Acevedo et al. (1991b). Angus et al. (1981) also found that the effect of temperature on emergence varied
18
among wheat genotypes. If seedlings emerge satisfactorily, brief exposures to extreme soil temperatures may inhibit crown root growth and tiller initiation (Fischer, 1985b).
Emergence to double ridges (GS1) The sensitivity to high temperature increases as vegetative growth develops and tillering proceeds towards the end of GS1 (O’Toole and Stockle, 1991). The sensitivity to high temperature during this phase is expressed as decreased duration of GS1 (Shpiler and Blum, 1986) and reduced leaf area and growth. Reduction in total number of leaves and spike bearing tillers is also an effect of high temperature during this phase (Midmore et al., 1984). Table 8 from Acevedo et al. (1991b) exemplifies these effects. The phyllochron increases when the growth temperature increases (Cao and Moss, 1994) reducing the number of leaves.
Double ridges to anthesis (GS2) The presence of double ridges marks the beginning of the GS2 growth stage. By the end of this stage, the potential number of grains, KNO, has been determined. The GS2 stage is therefore critical in setting the extent to which the grain yield potential is realised. The main effect of heat stress after floral initiation is observed on KNO. The number of kernels per unit area decreases at a rate of 4% for each °C increase in mean temperature during the 30 days preceding anthesis (Fischer, 1985b). A similar value can be calculated from the data of Acevedo et al. (1991b) as shown in Table 7 for a mean seasonal temperature range from 12.2 to 27.5°C. The effect of temperature on grains per unit area may be attributed to a decreased number of fertile spikes or to fewer grains per ear. In a controlled experiment, Warrington et al. (1977) showed that wheat grown at 25°C during GS2 had only 40% of the kernel number in the main spike when compared with plants grown at 15°C during this period. Table 9 shows that spike number is also drastically reduced over this range of temperature. The decrease in duration of GS2 at high temperatures is affected by genotypic variation in photoperiod sensitivity, vernalisation response, and optimum temperature for spikelet formation (Blum, 1988). If genotypes are able to maintain high carbon exchange rates at high temperatures, the decrease in GS2 duration and spike weight is smaller (Blum, 1986). High temperatures affect the capacity of the chloroplast membranes for electron transport (Berry and Rawson, 1981). An increase in chlorophyll fluorescence at temperatures where CO2 fixation begins to be affected indicates heat damage of photosystem II (Seeman et al., 1984). It appears that selection for an improved photosynthetic process is possible when exposing wheat germplasm to heat in the field (Acevedo, unpublished data).

19
Anthesis to maturity (GS3) Heat stress during GS3 affects mainly assimilate availability, translocation of photosynthates to the grain, and starch synthesis and deposition in the developing grain. The net result is a lower kernel weight. Over the range of 12 to 26°C increase in mean temperature during grain filling, grain weight is reduced at a rate of 4 to 8%/°C (Wardlaw et al., 1980); Wiegand and Cuellar, 1981). Acevedo et al., (1991b) reported a mean reduction of 4% in grain weight per °C increase in mean temperature during grain filling (Table 10). Shortened grain-filling duration is partially offset by increased grain filling rate (Sofield et al., 1977) but the effects are much more complex. Hastened senescence on the other hand reduce assimilate supply to the grain. Also high temperature reduces final cell number in the endosperm, reducing grain weight. The results, however, are usually confounded with water stress. Heat stress tolerance has been related to membrane stability, increased compatible solutes, increased protein stability, and synthesis of heat shock proteins (HSP). Plant response to heat shock is characterised by a rapid production of a specific set of proteins for supra-optimal temperatures. This happens when plant cells are abruptly exposed to temperatures that are about 5-10°C above their normal physiological growth temperature. HSP’s synthesis is also induced by other stresses such as drought and salinity (El Madidi and Zivy, 1993). These proteins are presumably involved in repairing and/or protecting structures, which have been damaged by an increase in temperature or other stress. The presence of denatured proteins inside the cell is enough to induce the synthesis of HSP’s and they may have a “chaperon” role interacting with other proteins to protect their structure and conformation (Ellis, 1990). Genotypes having higher heat tolerance appear to synthesise HSP’s in a higher concentration.
Cold and freezing Most cultivated plants are sensitive to low temperatures showing negative effects in yield at around 12°C (Lyons, 1973). Light saturation at lower photosynthetic rates and photoinhibition are commonly observed phenomena at low temperatures (Powles et al., 1983) along with increased chlorophyll “a” fluorescence (Van Hasselt and Van Berlo, 1980; Greer et al., 1986). Prolonged exposure to light at low temperatures may produce severe and irreversible photoinhibition followed by chlorophyll destruction by photooxidation and finally death of the tissue (Bongi and Long, 1987). The major effect of cold damage is the decrease in photosynthesis. Further, the export of C from the leaf decreases and soluble carbohydrates accumulate (Pollock et al., 1983; Pollock, 1984). An advantage of sugar accumulation is that they protect the cells exposed to low temperatures (Koster and Lynch, 1992). After exposure to low temperatures it has been found that the RUBISCO activity increases (Leegood and Edward, 1996). Mild frosts do not usually affect green area but severe frosts can cause leaf
20
necrosis and death. The more advanced the stage of development the more susceptible are the plants and the greater can be the effect on yield. After stem elongation begins, the growing stems and spikes can be damaged and the culm killed, the only recovery being the production of new lower yielding tillers. Frost can be particularly damaging between flag leaf emergence and 10 days after anthesis. The damage appears as an erratic occurrence of aborted spikelets at the base, centre or tip of the spikes. It is also shown as sterile florets in parts of the entire spike. This is due to an initial supercooling of plant tissues and the later erratic spread of the freezing front through stems and ears. The damage during this period occurs at minimum screen temperatures below 0°C and tissue temperatures of around - 4°C (Harding et al., 1990) and is associated to radiative cooling in calm clear nights. No genetic resistance for this type the damage is usually found and the only way to deal with the problem is through escape at the flowering stage, either by earlier or later flowering. Earlier flowering may be a better strategy in environments where terminal heat stress and drought are common stresses.
Salinity Increases in agricultural productivity are closely related to irrigation. Irrigation practices, however, lead to increased soil salinity. Irrigation water may contain from 0.1 to 4 kg/m3 of salt which, considering 1.0 to 1.5 m of irrigation water applied annually, contributes from 1 to 60 metric tons of salt per hectare (Shannon, 1997). Soil salinity affects crop plants in three major ways: a) osmotic stress, decreasing water availability, b) ionic stress and c) changes in the cellular ionic balance (Kirst, 1989). Physiologically many processes are affected but notably these are reduced cell growth, decreased leaf area, biomass, and yield. Wheat has a moderate tolerance to salinity (Shannon, 1997).
Salinity effects on crop growth Soil salinity above 4.5 dS/m electrical conductivity of the saturation extract decreases the percent of plants established per unit area. At 8.8 dS/m the wheat plants emerged decreased to 50% (Francois et al., 1986). Soil salinity accelerates apex development and increases the phyllochron reducing the number of leaves in the main shoot (Maas and Grieve, 1986). It also decreases the number of spikelets in the main spike (Frank et al., 1987) and anticipates crop maturity. Soil salinity affects the normal development and viability of tillers; it also decreases the number of primary and secondary tillers. A salinity level of 7.5 dS/m eliminated the secondary tillers and reduced the number of primary tillers. Root growth is generally less affected and may be even stimulated by low to medium salinity levels (Ayers et al., 1952).

21
All phenological phases are accelerated under salinity stress in wheat (Grieve et al., 1994). Spike development is accelerated, decreasing the time to terminal spikelet and the crop cycle. The yield component most affected under salinity stress is the reduction of number of culms that bear ears (Maas et al., 1994). The toxicity to the plant caused by salinity stress is particularly evident after anthesis. It is characterised by early senescence and low kernel weight (Wyn Jones and Gorham, 1991) as well as abortion of distal spikelets (Grieve et al., 1992). Wheat yield is decreased by 50% at soil saturation extracts of 13 dS/m (Ayers and Wescot, 1976). Durum wheat has a higher sensitivity to salinity than bread wheat. The threshold at which grain yield starts to decrease with increasing soil salinity is 5.9 dS/m for durum wheat and 8.6 dS/m for bread wheat. Furthermore, durum wheat decreases its yield at a higher rate than bread wheat with increasing salinity (Maas and Grieve, 1986; Acevedo et al., 1998c). Durum wheat also has a lower genetic variability in biomass and yield when grown under salinity stress than bread wheat (Acevedo et al., 1998c). The higher salinity tolerance observed in bread wheat appears to be related to a lower Na? concentration, as well as to a lower Na? /K? ratio in the leaves (Table 11) The discrimination against Na? in the foliar tissue (Shah et al., 1987; Gorham et al., 1987) and in favour of K? ( Schachtman et al., 1991) is due to genes present in the D genome of hexaploid wheat which are not present in the tetraploid. The donor of the D genome to bread wheat is the diploid Triticum tauschii (Coss.) Schmal. (Syn. Aegilops squarrosa L.) (McFadden and Sears, 1946). Yield under stress depends on yield potential, stress resistance per se and the phenology of the genotype (Bidinger et al., 1987a,b; Acevedo, 1991a; Acevedo et al., 1998c). Some authors point out that selection for high yield potential could be the best strategy to increase wheat yields in salty soils due to the spatial heterogeneity in salt distribution in the soil, which would allow expression of the yield potential in some plants growing in areas with lower salinity (Richards et al., 1987). Acevedo et al. (1998c), however, found that many of the spring wheat genotypes reputed to have high yield under salinity stress also have salinity resistance per se. The true resistance had an important influence in the yield under salinity stress (Table 12). The salinity resistance per se found by Acevedo et al. (1998c) was negatively correlated to Na? concentration in the flag leaf. Ashraf and O’Leary (1996) and Chhipa and Lal (1995) also found a close correlation negative between wheat grain yield under salinity stress and Na? /K? ratio in the grains. Salama et al. (1994) also observed a lower Na? concentration in foliar tissue of tolerant as compared to sensitive wheat genotypes. It appears that there are at least two mechanisms of salt tolerance in wheat: a)

22
low Na? accumulation regulated at the root level, and b) ionic compartmentalisation (Schachtman and Munns, 1992). It may be that the first mechanism could be located at the level of the plasma membrane inducing a lower affinity for Na? uptake, while the second could be located in the tonoplast with a higher affinity for Na? uptake and isolation of Na? in the vacuole. Other mechanisms, such as osmotic adjustment, have been widely cited as responsible for salinity tolerance in wheat and other crops (Richards, 1954).
Concluding remarks Much is known about the physiology of wheat that can be of direct use by agronomist and breeders. The generation of potential grain yield in wheat is quite well understood as well as the avenues for improving the yield potential. The yield under stress is generally less understood but the available physiological knowledge should allow better and more rapid progress in the future. Important aspects of wheat physiology such as lodging resistance, the use of growth regulators for wheat growth, weed competition, soil mechanical impedance, nutrient toxicity’s/deficiencies were not discussed in this chapter. A priority was given to yield and yield forming processes, with the idea in mind that the application of these concepts would have a higher impact on wheat production around the world.
REFERENCES Abbate, P.E., Andrade, F.H. & Culot, J.P. 1995. The effect of radiation and
nitrogen on number of grains in wheat. J. Agric. Sci. Cambridge, 124: 351-360
Acevedo, E. 1987. Assessing crop and plant attributes for cereal improvements. In J.P. Srivastava, E. Porceddu, E. Acevedo and S. Varma, eds. Drought Tolerance in Winter Cereals, p. 303-320. Willey.
Acevedo, E. 1991a. Morphophysiological traits of adaptation of cereals to
Mediterranean environments. In E. Acevedo, E. Fereres, C. Giménez and J.P. Srivastava, eds. Improvement and management of winter cereals under temperature, drought and salinity stress, p. 85-96. Proceedings of the ICARDA-INIA Symposium. Córdoba, Spain.
Acevedo, E. 1991b. Improvement of winter cereal crops in Mediterranean
environments: use yield, morphological and physiological traits. . In E. Acevedo, A.P. Conesa, P. Monneveux and P. Srivastava, eds. Physiology Breeding of Winter Cereals for Stressed Mediterranean Environments, p. 273-305. INRA, France.
Acevedo, E. 1993. Potential of 13C discrimination as a selection in barley breeding.
p.399-417. In J. Ehleringer, A.E. Hall and G.D. Farquhar, eds. Stable Isotopes in Agriculture. Academic Press, USA.

23
Acevedo, E. & Ceccarelli, S. 1989. Role of physiologist -breeder in a breeding
program for drought resistance conditions. In F.W.G. Baker, ed. Drought Resistance in Cereals, p. 117-139. CAB International.
Acevedo, E. & Fereres, E. 1993. Resistance to abiotic stress. In M.D. Hayward, N.O.
Bosemark and I. Romagoza, eds. Plant Breeding Principles and Prospects, p. 406-421. Chapman and Hall. London, U.K.
Acevedo, E., Hsiao, T.C. & Henderson, D.W. 1971. Immediate and subsequent
growth responses of maize leaves to changes in water status. Plant Physiol., 48: 631-636.
Acevedo, E., Harris, H. & Cooper, P.J. M. 1991a. Crop architecture and water use
efficiency in Mediterranean environments. In H. Harris, P.J.M. Cooper and M. Pala, eds. Soil and Crop Management for Improved Water Use Efficiency in Rainfed Areas, p.106-118. ICARDA.
Acevedo, E., Nachit, M. & Ortiz-Ferrara, G. 1991b. Effects of heat stress on wheat
and possible selection tools for use in breeding for tolerance. In D.A Saunders, ed. Wheat for the Nontraditional Warm Areas, p. 401-421. Mexico, D.F.: CIMMYT.
Acevedo, E., Perez-Marco, P. & Van Oosterom, E. 1990. Physiology of yield of
wheat and barley in stressed rainfed Mediterranean environments. In S.K. Sinha, P.V. Sane, S.C. Bhargava and P.K. Agrawal, eds. Proceedings of the International Congress of Plant Physiology, p.117-126. New Delhi, India.
Acevedo, E., Silva, H. & Silva, P. 1998a . Tendencias actuales de la investigación de la resistencia al estrés hídrico de las plantas cultivadas. Boletín Técnico Estación Experimental Agronómica, 49 (1-2): 1-28. Acevedo, E., Silva, P. Silva, H. & Solar, B. 1998b. Wheat production in
Mediterranean environments. In E.H. Satorre and G.A. Slafer (eds.) Physiological-ecological approach to understand yield and its determining processes at the crop level of organization. Buenos Aires, Argentina (In press).
Acevedo, E., Silva, P., Pargas, R. & Mujeeb-Kazi, A. 1998c. Trigos harineros,
trigos duros y trigos sintéticos hexaploides en suelos salinos y no salinos. Revista de Investigación Agrícola (In press).
Ahrens, J.F. & Loomis, W.E. 1963. Floral induction and development in winter
wheat. Crop Sci., 3: 463-466. Allison, J.C.S. & Daynard, T.B. 1976. Effect of photoperiod on development and
24
number of spikelets of a temperature and some low-latitude wheats. Ann. Appl. Biol., 83: 93-102.
Angus, J.F., Cunningham, R.B., Moncur, M.W. & Mackenzie, D.H. 1981. Phasic
development in field crops. I. Thermal response in the seedling phase. Field Crops Research, 3: 365-378.
Araus, J.L., Reynolds, M.P. & Acevedo, E. 1993. Leaf posture, grain yield, leaf
structure and carbon isotope discrimination in wheat. Crop. Sci., 33: 1273-1279.
Ashraf, M. & O’Leary, J.W. 1996. Responses of some newly develop salt-tolerant
genotypes of spring wheat to salt stress: II. Water relation and photosynthetic capacity. Acta Bot. Neerlandica, 45: 29-39.
Austin, R.B. 1990. Prospects for genetically increasing the photosynthetic capacity of
crops. In Perspectives in Biochemical and Genetic Regulation of Photosynthesis, p. 305-409. (Allan R. Liss, Inc.).
Austin, R.B., Morgan, C.L. & Ford, M.A. 1986. Dry matter yields and
photosynthetic rates of diploid and hexaploid Triticum species. Ann. Bot., 57: 847-857.
Austin, R.B., Bingham, J., Blackwell, R.D., Evans, L.T., Ford, M.A., Morgan, C.I. & Taylor, M. 1980. Genetic improvements in winter wheat yields since 1900 and associated physiological changes. J. Agric. Sc. Cambridge, 94: 675- 689. Austin , R.B., Craufurd, P., Hall, A., Acevedo, E., Da Silveira, B. & Nugy, E.
1990. Carbon isotope discrimination as a mean of evaluating drought resistance in barley, rice and cowpeas. Bull. Soc. Bot. Fr. 137, Actualité Botaniques, 1: 21-30
Ayers, A.D., Brown, J.W. & Wadleigh, L. 1952. Salt tolerance on barley and wheat
in soil plots receiving several salinization regimes. Agron. J., 44: 307-310. Ayers, R. & Wescot, D. 1976. Water quality for agriculture. Food and Agriculture
Organization of the United Nations. Rome. 97p. Bagga, A.K. & Rawson, H.M. 1977. Contrasting responses of morphologically similar wheat cultivars to temperatures appropriate to warm temperate climates with hot summers. A study in controlled environments. Aust. J. Plant. Physiol., 4: 877-887. Baker, C.K. & Gallagher, J.N. 1983a. The development of winter wheat in the field.
25
Relation between apical development and plant morphology within and between seasons. J. Agric. Sci. Cambridge, 10: 327-335.
Baker, C.K. & Gallagher, J.N. 1983b. The development of winter wheat in the field.
The control of primordium initiation rate by temperature and photoperiod. J. Agric. Sci. Cambridge, 101: 337-344.
Barcelló, J., Nicolas, G., Sabater, B. & Sánchez, R. 1992. Fisiología Vegetal. E.
Pirámide, S.A., Madrid. 662 p. Benbella, M. & Paulsen, G.M. 1998. Efficacy of treatment for delaying senescence of wheat leaves: II Senescence and grain yield under field conditions. Agron. J., 90: 332-338. Bernier, G., Havelange, A., Housa, C., Petitjean, A. & Lejeune, P. 1993. Physiological signals that induce flowering. The Plant Cell , 5: 1147-1155. Berry, J.A. & Rawson, J.K. 1981. Response of macrophytes to temperature. In O.L.
Lange, P.S. Nobel, C.B. Osmond, and H. Ziegler, eds. Physiological Plant Ecology. I. Responses to Physical Environment. Springer-Verlag, Berlin. 278 p Bidinger, F.R., Musgrave, R.B. & Fischer, R.A. 1977. Contribution of stored pre- anthesis assimilates to grain yield in wheat and barley. Nature, 270: 431-433. Bidinger, F.R., Mahalakshmi, V. & Rao, G.D. 1987a. Assessment of drought
resistance in Pearl Millet (Pennisetum americanum (L. Leeke). I. Factors affecting yields under stress. Aust. J. Agric. Res., 38: 37-48.
Bidinger, F.R., Mahalakshmi, V. & Rao, G.D. 1987b. Assessment of drought
resistance in Pearl Millet (Pennisetum americanum (L. Leeke). II. Estimation of genotype response to stress. Aust. J. Agric. Res., 38: 49-59.
Biscoe, P.V. 1988. N-Sure, the selective N-fertilisation for wheat. In Knowledge-
Based Systems in Agriculture. Int. DLG-Congress for Computer Technology, p. 401- 413. Frankfurt, 19-22 June 1988. Deutsche Landwirtschafts-esellschaft: Frankfurt.
Blum, A. 1986. The effect of heat stress on wheat leaf and ear photosynthesis. J. Exper. Bot., 37: 111-118. Blum, A. 1988. Plant Breeding for Stress Environments. CRC. Press Inc. Florida,
USA. 223 pp. Bouaziz, A. & Hicks, D.R. 1990. Consumption of wheat seed reserves during and during and early growth as affected by soil water potential. Plant and Soil,

26
128: 161-165. Bongi, G. & Long, S.P. 1987. Light-dependent damage to photosynthesis in olive
leaves during chilling and high temperature stress. Plant Cell Environ., 10 : 241-249.
Boyd, W.J.R. 1986. Phasic development in barley. p. 187-191. In T.A. Williams &
G.S. Wratt, eds. Plant Breeding Symposium. Agronomy Society of New Zealand. Special Publications 5. New Zealand.
Boyer, J.S. 1982. Plant productivity and environment. Science, 218: 443-448. Brooking, I.R. & Kirby, E.J.M. 1981. Interrelationships between stem and ear
development in winter wheat: the effects of a Norin-10 dwarfing gene Gai/Rht2. J. Agric. Sci. Cambridge, 97: 373-381.
Byerlee, D. & Moya, P. 1993. Impacts of international Wheat breeding research in the developing world, 1966-1990. México, D.F.: CIMMYT. Cao, W. & Moss, D.N. 1989a. Temperature effect on leaf emergence and phyllochron
in wheat and barley. Crop Sci., 29: 1018-1021. Cao, W. & Moss, D.N. 1989b. Daylength effect on leaf emergence and phyllochron in
wheat and barley. Crop Sci., 29: 1021-1025. Cao, W. & Moss, D.N. 1994. Sensitivity of winter wheat phyllochron to environ-
mental changes. Agron. Journal, 86: 63-66. Condon, A.G. & Richards, R.A. 1993. Exploiting genetic variation in transpiration efficiency in wheat: An Agronomic view. p. 535-450. In J. Ehleringer, A.E. Hall and G.D. Farquhar, eds. Stable Isotopes in Agriculture. Academic Press, USA. Condon, A.G., Richards, R.A. & Farquhar, G.D. 1987. Carbon isotope
discrimination is positively correlated with grain yield and dry matter production in field-grown wheat. Crop Sci., 27: 996-1001.
Cutforth, H.W., Jame, Y.W. & Jefferson, P.G. 1992. Effect of temperature,
vernalisation and water stress on phyllochron and final main-stem number of HY320 and Neepawa spring wheats. Can. J. Plant Sci., 72: 1141-1151.
Chhipa, B.R. & Lal, P. 1995. Na/K ratios as the basis of salt tolerance in wheat. Aust. J. Agric Res., 46: 533-539.
27
Chujo, H. 1966. The effect of diurnal variation of temperature on vernalisation in wheat. Proc. Crop Sci. Soc. Japan, 35: 187-194. Dhillon, S.S. & Ortiz-Monasterio, J.I. 1993. Effect of date of sowing on the yield and yield components of spring wheat and their relationship with solar radiation and temperature at Ludhiana, Punjab, India. Wheat Special Report N°23ª. MéxicoD.F.: CIMMYT. Dunstone, R.L., Gifford, M. & Evans, L.T. 1973. Photosynthetic characteristics of
modern and primitive wheat species in relation to ontogeny and adaptation to light. Aust. J. Biol. Sci., 26: 295-307.
Eastham, J., Osterhuis, D.M. & Walker, S. 1984. Leaf water and turgor potential
threshold values for leaf growth of wheat. Agron. J., 76: 841-847. Eberhart, S. & Russell, W. 1966. Stability parameters for comparing varieties. Crop
Sci., 6: 36-40. EL Madidi S. & Zivy, M. 1993. Variabilité génétique des protéines de choc
thermique et thermo-tolérance chez le blé. Le progrès génétique passe-t-il par le repérage et l’inventaire des gènes?.. In H. Chlyah and Y. Demarly, eds. p. 173-181. Actualités Scientifiques.
Ellis, R.J. 1990. Molecular chaperones. Semin Cell Biologie: 1-72. Evans, L.T. 1987. Short day induction of inflorescence initiation in some winter wheat
varieties. Aust. J. Plant Physiol., 14: 277-286. Evans, L.T., Wardlaw, I.F. & Fischer, R.A. 1975. Wheat. In L.T. Evans,
eds. Crop Physiology, p. 101-149. Cambridge University Press. USA. Evans, L.T. 1993. Crop evolution, Adaptation and Yield. Cambridge University
Press. Cambridge. 500 p. Farquhar, G.D. & Richards, R.A. 1984. Isotopic composition of plant carbon
correlates with water-use efficiency of wheat genotypes. Aust. J. Plant Physiol., 11: 539-552.
Finlay, K.W. & Wilkinson, G.N. 1963. The analysis of adaptation in a plant-breeding
programme. Aust. J. Agric. Res., 14: 742-754. Fischer, R.A. 1983. Wheat. In Proceeding Symposium on Potential Productivity of
Field Crops under Different Environments, p.129-154. Sept. 1980, IRRI, Los Baños.

28
Fischer, R.A. 1985a. Number of kernels in wheat crops and the influence of solar
radiation and temperature. J. of Agric. Sc. Cambridge, 105: 447-461. Fischer, R.A. 1985b. Physiological limitation to producing wheat in semitropical and
tropical environments and possible selection criteria. In Proceeding of the International Symposium. Wheats for More Tropical Environments, p. 209-230. México. D.F.: CIMMYT.
Fischer, R. A. & Maurer, R. 1978. Drought resistance in spring wheat cultivars. I.
Grain yield responses. Aust. J. Agric. Res., 29: 897-912. Fischer, R A., Aguilar, I., Maurer, R. & Rivas, S. 1976. Density and row spacing
effects on irrigated short wheat at low latitude. J. Agric. Sci. Cambridge, 87: 137-147.
Flood, R.G. & Halloran, G.M. 1986. Genetics and physiology of vernalisation
response in wheat. Adv. Agron., 39: 87-125. Francois, L.E., Maas, E.V., Donovan, T. J. & Youngs, V.L. 1986. Effect of salinity
on grain yield and quality, vegetative growth, and germination of semi-dwarf and durum wheat. Agron. J., 78: 1053-1058.
Frank, A.B. & Bauer, A. 1995. Phyllochron differences in wheat, barley and
forage grasses. Crop Sci. 35: 19-23. Gallagher, J.N. & Biscoe, P.V. 1978. A physiological analysis of cereal yield. II.
Partitioning of dry matter. Agric. Prog., 53: 51-70. Gorham, J., Hardy, C., Wyn Jones, R., Joppa, L. & Law, C. 1987. Chromosomal
location of a K? / Na? discrimination in the genome of wheat. Planta, 180: 590-597.
Greer, D.H., Berry, J.A. & Björkman, O. 1986. Photoinhibition of photosynthesis in
intact bean leaves. Planta, 168: 253-260. Grieve, J., Lesch, S., Francois L. & Maas, E. 1992. Analysis of main spike yield
components in salt-stressed wheat. Crop Sci., 32: 697-703. Grieve, C.M., Francois, L.E. & Maas, E.V. 1994. Salinity affects the timing of
phasic development in spring wheat. Crop Sci., 34: 1544-1549. Hampton, J.G. 1981. The extent and significance of seed size variation in New Zealand wheats (Triticum aestivum L.). N.Z.L. Experimental Agricultural, 9: 179-184.
29
Hanft, J.M. & Wych, R.D. 1982. Visual indicators of physiological maturity of hard red spring wheat. Crop Sci., 22: 584-587 Harding, S.A., Guikema, J.A. & Paulsen, G.M. 1990. Photosynthetic decline from high temperature stress during maturation of wheat. I. Interaction with senescence processes. Plant Physiol., 92: 648-653. Harrel, D.M., Wilhelm, W.W. & McMaster, G.S. 1993. SCALES: A computer
program to convert among three developmental stage scales for wheat. Agron. J., 85: 758-763.
Harris, H., Cooper, P.J.M. and Pala, M. 1991. Soil and crop management for improved water Use efficiency. ICARDA. Aleppo, Syria. 352 p. Haun, J.R. 1973. Visual quantification of wheat development. Agron. J., 65: 116-117. Hay, R.K.M. & Kirby, E.J.M. 1991. Convergence and synchrony-A review of the coordination of development in wheat. Aust. J. Agric. Res., 42: 661-700.
Hochman, Z.V.I. 1982. Effect of water stress with phasic development on yield of wheat grown in a semi-arid environment. Field Crop Res. 5: 55-67. ICARDA. 1987. Cereal Improvement Program Annual Report. Idso, S.B., Reginate, R.J., Hatfield, J.I. & Pinter, P.J. Jr. 1984. Measuring yield reducing plant water potential depression in wheat by infrared thermometry. Irrigation Sc., 2: 205-212. Jones, R .J., Roessler, J. & Quattar, S. 1985. Thermal environment during endosperm cell division in maize :Effects on number of endosperm cells and starch granules. Crop Sci., 25: 830-834.
Jones, R.A. & Qualset, C.O. 1984. Breeding crops for environmental stress
tolerance. In G.B. Collins and J.G. Petolino, eds. Application of Genetic Engineering to Crop Improvement. p. 305-340. Nijhoff/Junk, Dordrecht.
Kalanakavar, R.M., Shashidhara, S.D. & Kulkarni, G.N. 1989. Effect of grading on quality of wheat seeds. Seed Res., 17(2): 182-185. Karimi, M.M. & Siddique, H.M. 1991. Crop growth and relative growth rate of old
and modern wheat cultivars. Aust. J. Agric. Res., 42: 13-22.

30
Kiniry, J.R. 1993. Nonstructural carbohydrate utilisation by wheat shaded during grain growth. Agron. J., 85: 844-849. Kirby, E.J.M. 1988. Analysis of leaf stem and ear growth in wheat from terminal
spikelet stage to anthesis. Field Crop Res., 18: 127-140. Kirby, E.J.M. 1993. Effect of sowing depth on seedling emergence, growth and
development in barley and wheat. Field Crops Res., 35: 101-111. Kirby, E.J.M. & M. Appleyard. 1984. Cereal development guide. Arable Unit,
National Agriculture Centre, Stoneleigh, Kenilworth. England. 95p. Kirby, E.J.M, & Appleyard, M. 1987. Development and structure of the wheat plant. In F.G.H. Lupton, ed. Wheat Breeding, p. 287-311. Chapman & Hall.
London. Kirby, E..J.M., Appleyard, M. & Fellowes, G. 1985. Variation in development
of wheat and barley in response to sowing date and variety. J. Agric. Sci., 104: 383-396.
Kirby, E.J.M., Siddique, K.H.M., Perry, M.W., Kaesehagen, D. & Stern, W.R.
1989. Variation in spikelet initiation and ear development of old and modern Australian wheat varieties. Field Crop Res., 20: 113-128.
Kirst, G.O. 1989. Salinity tolerance of eukariotic marine algae. Ann. Rev. Plant Physiol. Plant Mol. Biol., 40: 21-53. Kobata, T., Palta, J.A. & Turner, N.C. 1992. Rate of development of post anthesis water deficits and grain filling of spring wheat. Crop Sci., 32: 1238-1242. Koster, K.L. & Lynch, D.V. 1992. Solute accumulation and compartmentation during the cold acclimation of Puma rye. Plant Physiol., 98: 108-113. Krenzer, E.G., Nipp, T.L. & McNew, R.W. 1991. Winter wheat mainstem leaf appearance and tiller formation vs. moisture treatment. Agron. J., 83: 663-667. Krumm, M., Moazami, V. & Martin, P. 1990. Influence of potassium nutrition on
concentrations of water soluble carbohydrates, potassium, calcium, and magnesium and the osmotic potential in sap extracted from wheat (Triticum aestivum) ears during preanthesis development. Plant Soil, 124: 281-285.
Large, E.C. 1954. Growth stages in cereals. Illustration of the “Feekes” Scale. Plant
Pathol., 3: 128-129. Leegood M.C. & Edwards, G.E. 1996. Carbon metabolism and photorespiration :

31
Temperature dependence in relation to other environmental factors. In N.R. Baker, ed. Photosynthesis and the Environment. Advances in photosynthesis. Vol 5. Kluwer Academic Publ. Leopold, A.C. & Kriederman, P. 1975. Flowering. In Plant Growth and
Development, p. 271-301. Von Hoffmann Press. USA.
Lyons, J.M. 1973. Chilling injury in plants. Annu. Rev. Plant Physiol., 24: 445-451. Longnecker, N., Kirby, E.J.M. & Robson, A. 1993. Leaf emergence, tiller growth,
and apical development of nitrogen-deficient spring wheat. Crop Sci., 33: 154-160.
Loomis, R.S. & Amthor, J.S. 1996. Limits of yield revisited. In M.P. Reynolds, S.
Rajaram and A. McNab, eds. Increasing Yield Potential in Wheat: Breaking the Barriers, p. 76-89. México, D. F.: CIMMYT.
Long, S.P., Humphries, S. & Falkowski, P.G. 1994. Photo inhibition of
photosynthesis in nature. Ann. Rev. Plant Physiol. Plant Mol. Biol., 45: 633-664.
Maas, E. & Grieve, C. 1986. Salt tolerance of plants. Applied Agricultural Research,
1(1): 12-26 Maas, E.V., Lesch, S.M., Francois, L.E. & Grieve, C.M. 1994. Tiller developmen t in salt stressed wheat. Crop Sci., 34: 1594-1603. Major, D.J. 1980. Photoperiod response characteristics controlling flowering of nine
crop species. Can J. Plant Sci., 60: 777-784. Major, D.J. & Kiniry, J.R. 1991. Predicting daylength effects on phenological
processes. In T. Hodges, ed. Predicting crop phenology, p. 15-28. CRC Press, Boca Ratón, Florida.
Manupeerapan, T., Davidson, J.L., Pearson, C.J. & Christian, K.R. 1992.
Differences in flowering responses of wheat to temperature and photoperiod. Aust. J. Agric. Res., 43: 575-584.
Martin, J.H., Leonard, W.H. & Stamp, D.L. 1976. Principles of field crop Production. Macmillan, New York. pp.1118. Masle, J. 1984. Competition among tillers in winter wheat: consequences for growth
and development of the crop. In W. Day and R.K. Atkin, eds. Wheat growth and modelling. p. 33-54. Plenum Press. London.
32
Masle, J. & Farquhar, G.D. 1988. Effect of soil strength on the relation of water use efficiency carbon isotope discrimination and dry matter partitioning during early growth in sunflower. Aust. J. Plant Physiol., 17: 207-214.
McFadden, E.S. & Sears, E.R. 1946. The origin of Triticum spelta and its free-
threshing hexaploid relatives. J. Hered., 37: 81-89, 107-116. Menéndez, C.H. & Hall, A.E. 1996. Heritability of carbon isotope discrimination and correlations with harvest index in cowpea. Crop Sci., 36: 233-238. Mian, M.A.R. & Nafziger, E.D. 1994. Seed size and water potential effects on
germination and seedling growth of winter wheat. Crop Sci., 34: 169-171. Midmore, D.J., Cartwright, P.M. & Fischer, R.A. 1984. Wheat in tropical environments. II. Crop growth and grain yield. Field Crops Res., 8: 207-227. Morgan, J.M. 1983. Osmoregulation as a selection criterion for drought tolerance in wheat. Aust. J. Agric. Res., 34: 607-614. Morgan, J. & Condon, A.G. 1986. Water use, grain yield and osmoregulation in wheat. Aust J. Plant Physiol., 13: 523-532. Mossad, M., Ortiz-Ferrara, G., Mahalakshmi, V. & Fischer, R.A. 1995. Phyllochron response to vernalisation and photoperiod in spring wheat. Crop Sci., 35: 168-171. Mossedaq, F. & Smith, D.H. 1994. Timing nitrogen application to enhance spring wheat yields in a Mediterranean climate. Agron. J., 86: 221-226. Moustafa, M.A., Boersma, L. & Kronstad, W.E. 1996. Response of four spring wheat cultivars to drought stress. Crop Sci., 36: 982-986. Musick, J.T., Jones, O.R., Stewart, B. & Dusek, D.A. 1994. Water-yield relationship for irrigated and dryland wheat in the U.S. southern plains. Agron. J., 86: 980-986. Nicholas, M.E. & Turner, N.C. 1993. Use of chemical desiccants and senescin agents to select wheat lines maintaining stable grain size during post- anthesis drought Field Crop Res., 31: 155-171. 0’Toole, J.C. & Stockle, C.D. 1991. The role of conceptual and simulation modelling
in plants breeding. In E. Acevedo, E. Fereres, C. Gimenez and J.P. Srivastava, eds. Improvement and Management of winter Cereals under Temperature,
33
Drought and Salinity Stresses. National Institute for Agricultural Research, (INIA), Madrid, Spain.
Oosterhuis, D.M. & Cartwright, P.M. 1983. Spike Differentiation and floret survival in semidwarf spring wheat as affected by water stress and photoperiod. Crop Sci., 23: 711-716. Owen, P.C. 1971. Responses of a semi-dwarf wheat to temperatures representing a
tropical dry season. II. Extreme temperatures. Exp. Agric., 7: 43-47. Palta, J.A., Kobata, T., Turner, N.C. & Fillery, I.R. 1994. Remobilization of carbo and nitrogen in wheat as influenced by postanthesis water deficits. Crop Sci., 34: 118-124. Passioura, J.B. 1977. Grain yield harvest index and water use of wheat. J. Aust. Inst. Agric. Sci., 43: 117-120. Peterson, C.M., Klepper, B., Pumphrey, F.B. & Rickman, R.W. 1984. Restricted rooting decreases tillering and growth of winter wheat. Agron. J., 76: 861- 863. Peterson, R.F. 1965. Wheat: Botany, cultivation and utilisation. Leonard Hill, London, 448 pp. Pollock, C.J., Lloyd, E.J., Stodart, J. & Thomas, H.1983. Growth, photosynthesis,
and assimilates partitioning in Lolium tremulentum L. exposed to chilling temperatures. Plant Physiol., 59: 257-262.
Pollock, C.J. 1984. Sucrose accumulation and the initiation of fructan biosynthesis in Lolium tremulentum L. New Phytologist, 96: 527-534. Powles, S., Berry, B. & Björkman, O. 1983. Interaction between light and chilling
temperature on the inhibition of photosynthesis in chilling- sensitive plant. Plant Cell Environ., 6: 117-123.
Rahman, M.S., Wilson, J.H. & Aitken, V. 1977. Determination of spikelet number
in wheat II. Effect of varying light level on ear development. Aust. J. Agric. Res.,26: 575-581. Rahman, H.M. & Wilson, J.H. 1978. Determination of spikelet number in wheat. III Effect of varying temperature on ear development. Aust. J. Agric. Res., 28: 575-581. Rawson, H.M. 1971. An upper limit for spikelet number per ear in wheat as controlled by photoperiod. Aust. J. Agric. Res. 22: 537-546.
34
Rees, D., Sayre, K., Acevedo, E., Nava, E., Lu, Z., Zeiger, E. & Limon, A. 1993.
Canopy temperatures of wheat: relationship with yield and potential as a technique for early generation selection. Wheat Special Report N° 10. México, D.F.: CIMMYT.
Richards, L.A. 1954. Diagnosis and Improvement of Saline and Alkali Soils.
Agricultural Handbook N°60. U.S.D.A. 160p. Richards, R.A. 1987. Physiology and the breeding of winter-grown cereals of dry
areas, . In J.P. Srivastava, E. Porceddu, E. Acevedo and S. Varma, eds. Drought Tolerance in Winter Cereals, p. 133-150. Willey.
Richards, R. A. 1996. Increasing the yield potential of wheat: manipulating sources
and sinks. p. 134-149. In M.P. Reynolds, S. Rajaram, and A. McNab, eds. Increasing Yield Potential in Wheat: Breaking the Barriers. México, D.F.: CIMMYT.
Richards, R.A. & Townley-Smith, T.F. 1987. Variation in leaf area development and its effects and water use, yield and harvest index of droughted wheat. Aust. J. Agric. Res., 38: 983-992. Richards, R.A., Denett, C.W., Qualset, C.O., Epstein, E., Norlyn, J.D. &
Winslow, M.D. 1987. Variation for yield of grain and biomass in wheat, barley and triticale in salt affected field. Field Crop Res., 15: 277-287.
Rickman, R.W. & Klepper, E.L. 1991. Tillering in wheat. In T. Hodges,
ed. Predicting crop phenology, p. 73-83. CRC Press, Boca Ratón, Florida. Rickman, R.W., Klepper, B.L. & Peterson, C.M. 1983. Time distribution for describing appearance of specific culms of winter wheat. Agron. J., 75: 551-556. Ries, S.K. & Everson, E.H. 1973. Protein content and seed size relationships with seedlings vigor of wheat cultivars. Agron. J., 65: 884-886. Robson, M.J. 1982. The growth and carbon economy of selection line of Lolium
perenne cv. S23 with differing rates of dark respiration. Ann. Bot., 49: 321-329.
Salama, S., Trivedi, S., Busheva, M., Arafa, A.A., Garab, G. & Erdei, L. 1994.
Effects of NaCl salinity on growth, cation accumulation, chloropolast structure and function in wheat cultivars differing in salt tolerance. J. Plant Physiol., 144: 241-247.

35
Saini, H.S. & Aspinall, D. 1982. Abnormal sporogenesis in wheat (Triticum aestivum L.) induced by short periods of high temperature. Ann. Bot., 49: 835-846.
Santibañez, F. 1994. Crop requirements-temperate crops. In J. Griffith,
ed. Handbook of Agricultural Meteorology, p. 174 –188. Oxford University Press.
Sayre, K.D., Acevedo, E. & Austin, R.B. 1995. Carbon isotope discrimination and
grain yield of three bread wheat germplasm groups grown at different levels of water stress. Field Crop Res. 41: 45-54.
Sayre, K.D., Rajaram, S. & Fischer, R.A. 1997. Yield potential progress in short
bread wheats in northern Mexico. Crop. Sci., 37: 36-42.
Seeman, J.R., Berry, J.A. & Downton, W.J.S. 1984. Photosynthetic response and adaptation to high temperature in desert plants: A comparison of gas exchange and fluorescence methods for studies of thermal tolerance. Plant Physiol., 75: 364-368.
Seaton, G.R. & Walker, D.A. 1990. Chlorophyll fluorescence as a measure of photosynthetic carbon assimilation. Proc. Roy. Soc. Lond. B., 242: 29-35. Schachtman, D. & Munns, R. 1992. Sodium accumulation in leaves of Triticum
species that differ in salt tolerance. Aust. J. Plant Physiol., 19: 331-340. Schachtman, D., Munns, R. & Whitecross, M. 1991. Variation and sodium exclusion and salt tolerance in Triticum tauschii. Crop Sci., 31: 992-997. Shah, S., Gorham, J., Forster, B. & Wyn Jones, R. 1987. Salt tolerance in the
Triticeae: The attribute of the D genome to cation selectivity in hexaploid wheat. J. Exp. Bot., 38: 254-269.
Shannon, M.C. 1997. Adaptation of plants to salinity. Adv. Agron., 60: 75-120. Sharma, R.C. 1992. Analysis of phytomass yield in wheat. Agron. J., 84:926-929. Shpiler, L. & Blum, A. 1986. Differential reaction of wheat cultivars to hot
environments. Euphytica, 35: 483-492. Siddique, K.H.M., Kirby, E.J.M. & Perry, M.W. 1989. Ear:stem ratio in old and modern wheat varieties : Relationship with improvement in number of grains per ear and yield. Field Crops Res., 21: 59-78. Simane, B., Peacock, J.M. & Struik, P.C. 1993. Differences in development and growth rate among drought-resistant and susceptible cultivars of durum

36
wheat (Triticum turgidum L. var. durum). Plant and Soil, 157: 155-166. Simmons, S.R. & Crookston, R.K. 1979. Rate and duration of growth of kernels formed at specific florets in spikelets of spring wheat. Crop Sci., 19: 690-693. Singh, B.P. 1970. Influence of seed size on field germination and seedling growth
and yield of dwarf wheat. Madras Agric. J., 57(8): 449-452. Slafer, G.A. & Rawson, H.M. 1994. Sensitivity of wheat phasic development to major environmental factors: A re-examination of some assumptions made by physiologists and modellers. Aust. J. Plant Physiol., 21: 393-426. Slafer, G.A., Andrade F.H. & Satorre, E.H. 1990. Genetic improvement effects on
pre-anthesis physiological attributes related to wheat grain yield. Fields Crops Res., 23: 255-263.
Slafer, G.A., Calderini, D.F. & Miralles, D.J. 1996. Yield components and
compensation in wheat: opportunities for further increasing yield potential. In M.P. Reynolds, S. Rajaram and A. McNab, eds. Increasing Yield Potential in Wheat: Breaking the Barriers, p.101-133. México, D.F.: CIMMYT.
Sofield, I., Wardlaw , I.F., Evans, L.T. & Lee, S.Y. 1977. Nitrogen, phosphorus,
and water contents during grain development and maturation in wheat. Aust. J. Plant Physiol.,. 4: 799-810.
Sojka, R.E., Stolzy, L.H. & Fischer, R.A. 1981. Seasonal response of selected wheat
cultivars. Agron. J., 73: 838-844. Sommersville, C.R. 1986. Future prospects for genetic manipulation of RUBISCO.
Phil. Trans. Roy. Soc., Lond. B, 313: 459-469. Sowers, K.E., Pan, W.L., Miller, B.C. & Smith, J.L. 1994. Nitrogen use efficiency of split nitrogen applications in soft white winter wheat. Agron. J., 86: 942- 948. Spilde, L.A. 1989. Influence of seed size and test weight on several agronomic traits of barley and hard red spring wheat. J. Prod. Agric., 2: 169-172. Stapper, M. & Fischer, R.A. 1990. Genotype, sowing date and plant spacing
influence on high-yielding irrigated wheat in southern New South Wales. I. Phasic development, canopy growth and spike production. Aust. J. Agric. Res., 41: 997-1019.
Stefany, P. 1993. Vernalisation requirement and response to day length in guiding
development in wheat. Wheat Special Report N° 22, México, D.F.: CIMMYT
37
Trione, E.J. & Metzger, R.J. 1970. Wheat and barley vernalisation in a precise
temperature gradient. Crop Sci. 10: 390-392. Upadhayaya, M.K. & Furnes, N.H. 1994. Influence of light intensity and water
stress on leaf surface characteristics of Cynoglossum officinale, Centaurea spp. and Tragopogon spp. Can. J. Bot., 72: 1379-1386.
Van Hasselt, P.R. & Van Berlo, H. 1980. Photooxidative damage to the photosynthesis apparatus during chilling. Plant Physiol., 50: 52-56. Van Oosterom, E.J. & Acevedo, E. 1992. Adaptation of barley (Hodeum vulgare L.) to harsh Mediterranean environments. I. Morphological traits. Euphytica, 62: 1-14. Venora, G. & Calcagno, F. 1991. Study of stomatal parameters for selection of drought resistance varieties in Triticum durum Desf. Euphytica, 57: 275-283. Wardlaw, I.F., Sofield, I. & Cartwright, P.M. 1980. Factors limiting the rate of dry matter accumulation in the grain of wheat grown at high temperature. Aust. J.
Plant Physiol., 7: 87-400. Warrington, I.J., Dunstone, R.L. & Green, L.M. 1977. Temperature effects at
three developmental stages on the yield of the wheat ear. Austral. J. Agric. Res., 28: 11-27.
Wiegand, C.L. & Cuellar, J.A. 1981. Duration of grain filling and kernel weight of wheat as affected by temperature. Crop Sci., 21: 95-101. Wuest , S.B. & Cassman, K.G. 1992 a. Fertiliser – nitrogen use efficiency of
irrigated wheat: I. Uptake efficiency of preplant versus late-season application. Agron. J., 84: 682-688.
Wuest, S. B. & Cassman, K.G. 1992 b. Fertiliser-nitrogen use efficiency of irrigated
wheat: II. Partitioning efficiency of preplant versus late-season application. Agron. J., 84: 689-694.
Wyn Jones, R. & Gorham, J. 1991. Physiological effects of salinity: scope for genetic improvement. In E. Acevedo, E. Fereres, C. Giménez and J.P. Srivastava, eds. Improvement and management of winter cereals under temperature, drought and salinity stresses. Proceeding of the International Symposium, p. 177-201. October, 1987. ICARDA-INIA. Córdoba Spain. Zadoks, J.C., Chang, T.T. & Konzak, C.F. 1974. A decimal code for the growth
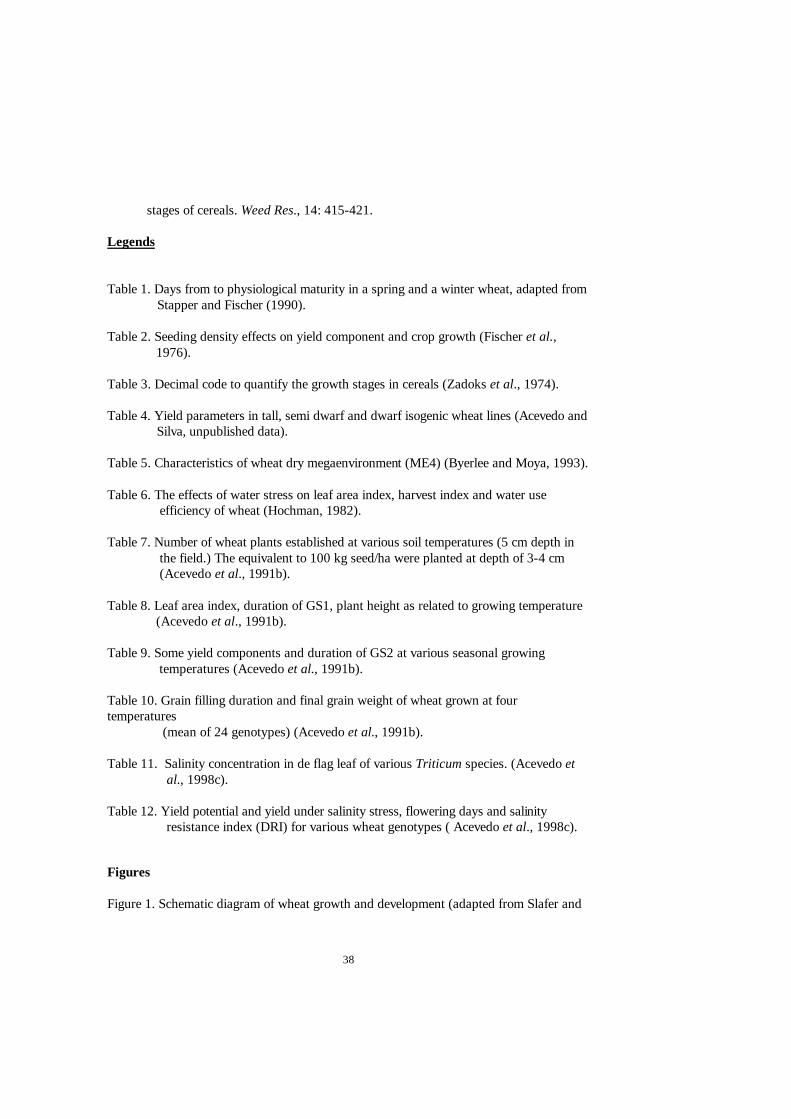
38
stages of cereals. Weed Res., 14: 415-421. Legends Table 1. Days from to physiological maturity in a spring and a winter wheat, adapted from
Stapper and Fischer (1990). Table 2. Seeding density effects on yield component and crop growth (Fischer et al., 1976). Table 3. Decimal code to quantify the growth stages in cereals (Zadoks et al., 1974). Table 4. Yield parameters in tall, semi dwarf and dwarf isogenic wheat lines (Acevedo and
Silva, unpublished data). Table 5. Characteristics of wheat dry megaenvironment (ME4) (Byerlee and Moya, 1993). Table 6. The effects of water stress on leaf area index, harvest index and water use efficiency of wheat (Hochman, 1982). Table 7. Number of wheat plants established at various soil temperatures (5 cm depth in the field.) The equivalent to 100 kg seed/ha were planted at depth of 3-4 cm (Acevedo et al., 1991b). Table 8. Leaf area index, duration of GS1, plant height as related to growing temperature (Acevedo et al., 1991b). Table 9. Some yield components and duration of GS2 at various seasonal growing temperatures (Acevedo et al., 1991b). Table 10. Grain filling duration and final grain weight of wheat grown at four temperatures (mean of 24 genotypes) (Acevedo et al., 1991b). Table 11. Salinity concentration in de flag leaf of various Triticum species. (Acevedo et al., 1998c). Table 12. Yield potential and yield under salinity stress, flowering days and salinity resistance index (DRI) for various wheat genotypes ( Acevedo et al., 1998c).
Figures
Figure 1. Schematic diagram of wheat growth and development (adapted from Slafer and
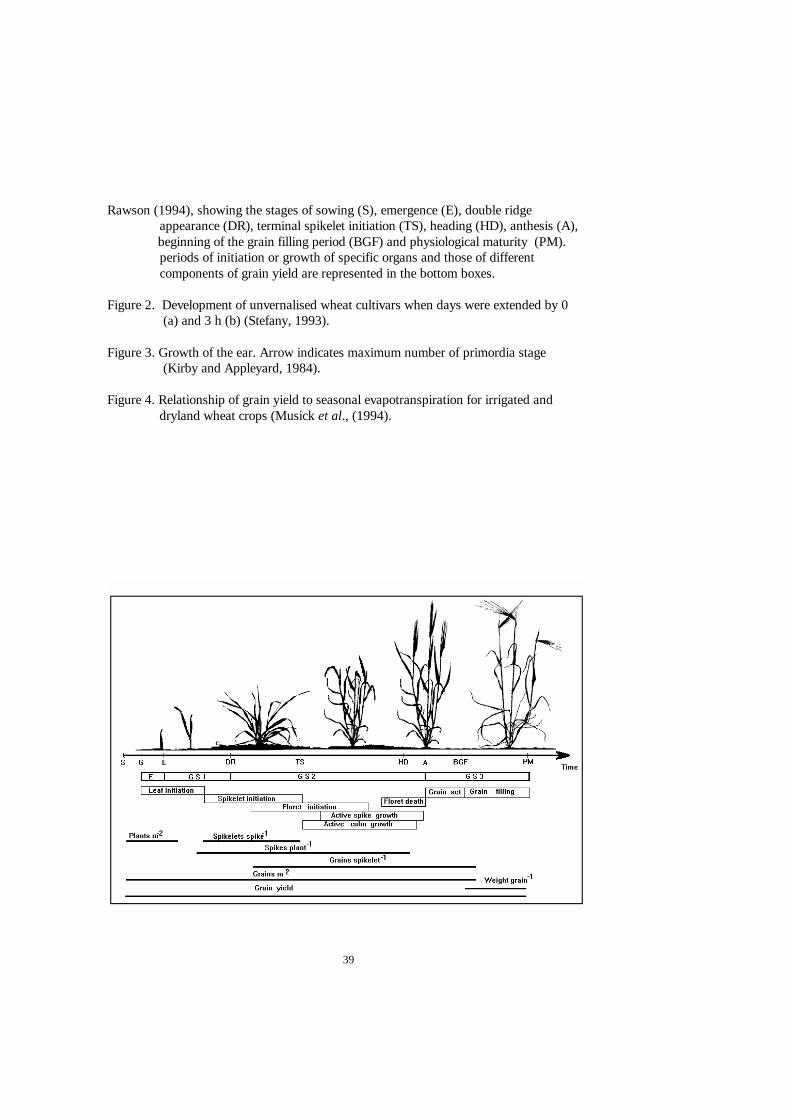
39
Rawson (1994), showing the stages of sowing (S), emergence (E), double ridge appearance (DR), terminal spikelet initiation (TS), heading (HD), anthesis (A),
beginning of the grain filling period (BGF) and physiological maturity (PM). periods of initiation or growth of specific organs and those of different components of grain yield are represented in the bottom boxes. Figure 2. Development of unvernalised wheat cultivars when days were extended by 0 (a) and 3 h (b) (Stefany, 1993). Figure 3. Growth of the ear. Arrow indicates maximum number of primordia stage (Kirby and Appleyard, 1984). Figure 4. Relationship of grain yield to seasonal evapotranspiration for irrigated and dryland wheat crops (Musick et al., (1994).
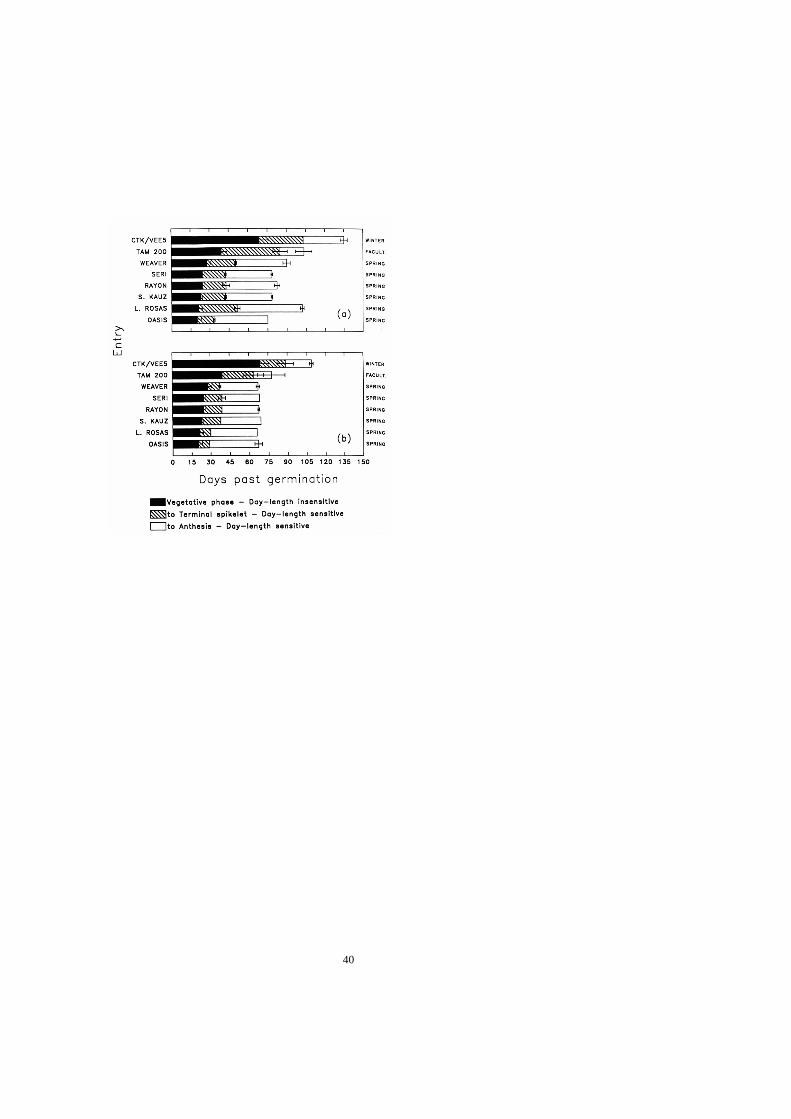
40

41

42
Table 1. Days from emergence to physiological maturity in a spring and winter wheat ( Adapted from Stapper and Fischer, 1990). Time (days) Development stage Spring 1 Winter 2 Emergence 0 0 Floral initiation (double ridges) 20 35 Terminal spikelet 45 60 First node 60 80 Heading 90 120 Anthesis 100 130 Physiological maturity 140 170 1 Yecora, low sensitivity to vernalization and moderate sensitivity to photoperiod 2 WW33G, high sensitivity to vernalization and moderate sensitivity to photoperiod. Table 2. Seeding density effects on yield components and crop growth (Fischer et al., 1976)
Component Seeding density (kg/ha) density kg ha-1
50,00 100.00 200.00 300.00 SE
Plant number m-2 120.00 200.00 350.00 480.00 -
Culm N° 46DAS, m-2 912,00 1088,00 1250,00 1446,00 35.00
Spikes/plant 7.60 5.40 3.60 3.00
-
Spikes N° m-2 403,00 440,00 465,00 458,00 8.00
Spikelets/spike 19.60 19.10 17.80 17.10 0.20
Grains/spikelet
2.17 2.03
2.04
2.08
-
Kernel N° 100 m-2 171,00 172,00 170,00 163,00 3.00
Kernel wt. mg 41.20 41.50 41.00 42.40
-
Grain dry wt g m-2 706,00 708,00 704,00 692,00 9.00
Total dry wt g m-2 15DAS 5.40 10,00 15.40 24.30 0.6
0 46DAS 200,00 244,00 207,00 318,00 9.00
944,00 1012,00 1013,00 1012,00 32.00

43
82DAS Maturity 1624,00 1627,00 1669,00 1643,00 30.00
Table 3. Decimal code to quantify the growth stages in cereals (Zadoks et al., 1974) Code Description Code Description
0 Germination 0.0 Dry seed 37 Flag leaf just visible 0.1 Start of imbibition 38 Flag leaf ligule just visible
0.2 Imbibition complete 4.0 Booting
0.3 Radicle emerged from seed 41 Flag leaf sheath extending
0.4 Coleoptile emerged from seed 43 Boots just visible swollen 0.5 Leaf just at coleoptile tip 45 Boots swollen 1.0 Seedling growth 47 Flag leaf sheath opening
10 First leaf through coleoptile 49 First awns visible 11 First leaf unfolded 5.0 Ear emergence
12 2 leaf unfolded 51 First spikelet of ear just visible
13 3 leaf unfolded 53 One-fourth of ear visible 14 4 leaf unfolded 55 One-half of ear emerged 15 5 leaf unfolded 57 Three-fourths of ear emerged 16 6 leaf unfolded 59 Emergence of ear completed 17 7 leaf unfolded 6.0 Flowering 18 8 leaf unfolded 61 Beginning of flowering 19 9 or more unfolded 65 Flowering half-way complete
2.0 Tillering 69 Flowering complete
20 Main shoot only 7.0 Milk development
21 Main shoot and 1 tiller 71 Seed water ripe
22 Main shoot and 2 tillers 73 Early milk An increase in the solids
23 Main shoot and 3 tillers 75 Medium milk of the liquid endosperm is
24 Main shoot and 4 tillers 77 Late milk notable when crushing
25 Main shoot and 5 tillers the seed between fingers
26 Main shoot and 6 tillers 8.0 Dough development
27 Main shoot and 7 tillers 83 Early dough Fingernail impression not held
28 Main shoot and 8 tillers 85 Soft dough (Fingernail impression held;
29 Main shoot and 9 or more tillers 87 Hard dough head losing chlorophyll)
3.0 Stem elongation 9.0 Ripening
30 Pseudostem erection (winter cereals only) 91 Seed hard (difficult to divide by thumbnail)
31 1st node detectable 92 Seed hard (can no longer be dented by thumbnail)
32 2nd node detectable 93 Seed loosening in daytime
33 3rd node detectable 94 Over-ripe; straw dead and collapsing
34 4th node detectable 95 Seed dormant
35 5th node detectable 96 Viable seed giving 50% germination
36 6th node detectable 97 Seed no dormant 37 Flag leaf just visible 98 Secondary dormancy induced 39 Flag leaf ligule just visible 99 Secondary dormancy lost
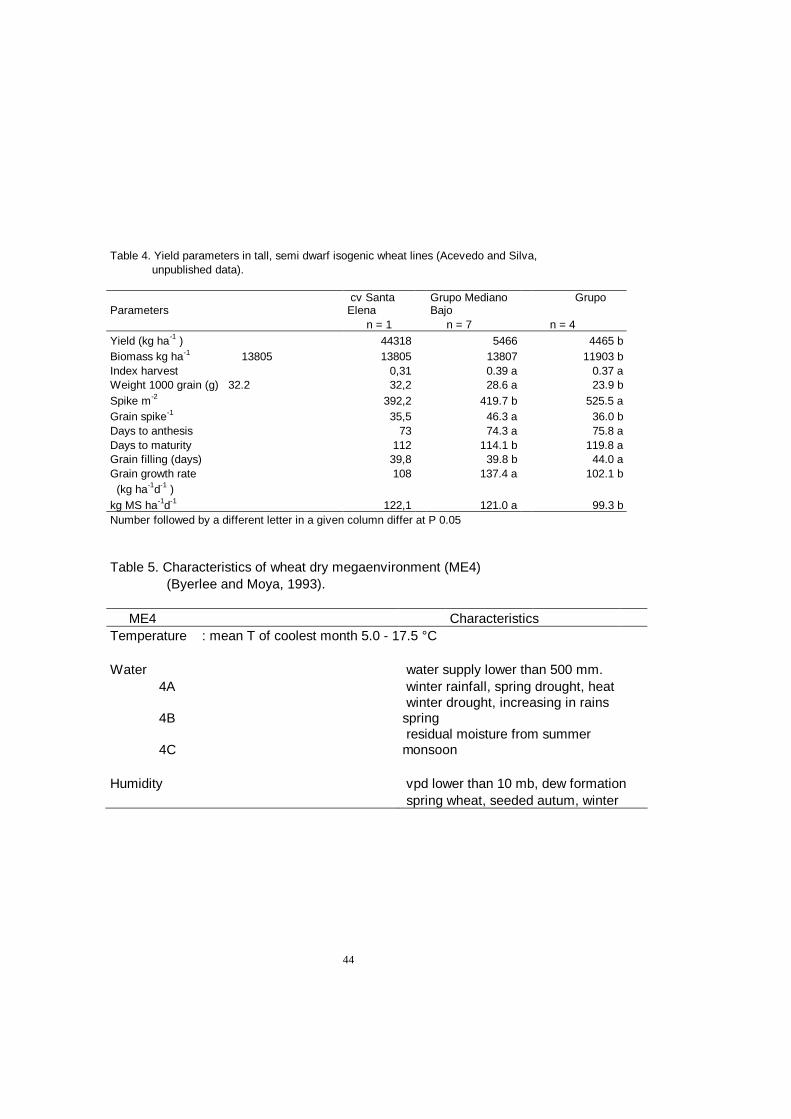
44
Table 4. Yield parameters in tall, semi dwarf isogenic wheat lines (Acevedo and Silva, unpublished data).
Parameters cv Santa Elena
Grupo Mediano Grupo Bajo
n = 1 n = 7 n = 4 Yield (kg ha-1 ) 44318 5466 4465 b Biomass kg ha-1 13805 13805 13807 11903 b Index harvest 0,31 0.39 a 0.37 a Weight 1000 grain (g) 32.2 32,2 28.6 a 23.9 b Spike m-2 392,2 419.7 b 525.5 a Grain spike-1 35,5 46.3 a 36.0 b Days to anthesis 73 74.3 a 75.8 a Days to maturity 112 114.1 b 119.8 a Grain filling (days) 39,8 39.8 b 44.0 a Grain growth rate 108 137.4 a 102.1 b (kg ha-1d-1 ) kg MS ha-1d-1 122,1 121.0 a 99.3 b Number followed by a different letter in a given column differ at P 0.05 Table 5. Characteristics of wheat dry megaenvironment (ME4) (Byerlee and Moya, 1993). ME4 Characteristics Temperature : mean T of coolest month 5.0 - 17.5 °C Water water supply lower than 500 mm. 4A winter rainfall, spring drought, heat
4B winter drought, increasing in rains spring
4C residual moisture from summer monsoon
Humidity vpd lower than 10 mb, dew formation spring wheat, seeded autum, winter

45
Table 6. Effect of water stress at various stages of growth on leaf area, yield (components) and water use efficiency of wheat. (After Hochman, 1982) Stress period Parameters Control Pre-anthesis Anthesis Grain filling LAI at booting 5.00 3.30 5.00 5.00 Fertile tillers m2 513.00 658.00 434.00 485.00 Grains per spike 32.70 13.00 27.10 31.40 1000 grain weight (g) 56.30 55.20 53.70 49.20 Grain yield (g m-2) 779.00 559.00 498.00 658.00 Harvest index 0.52 0.50 0.53 0.53 WUE (kg grain ha-1 16.80 14.60 12.40 15.20 mm ET-1 Table 7. Number of wheat plants established at various soil temperatures (5 cm depth) in the field. The equivalent to 100 kg . seed ha-1 were planted at a depth of 3-4 cm. (After Acevedo et al., 1991). Mean maximum soil N° of established temperature (°C) plants per m2 20.2 315.3 a 33.2 256.7 b 42.2 89.8 c Number followed by a different letter in a given column differ at P 0.05 Table 8. Leaf area index, duration of GS1, plant height as related to growing temperature. (Acevedo et al., 1991).
Mean seasonal Duration of GS1 Leaf area Plant height
temperature (°C) (days) index (cm) 12.2 55.9 a 5.0 a 82.9 a 20.7 22.1 b 2.7 b 57.6 b 23.9 20.4 b - 48.6 c 27.5 22.2 b 0.9 c - Number followed by a different letter in a given column differ at P 0.05

46
Table 9. Some yield components and duration of GS2 at various mean seasonal growing temperatures. (Acevedo et al., 1991).
Mean seasonal Duration of GS2
Kernel number Spike
temperature (°C) (days)
(grain m-2)x 102 m-2
12.2 73.8 91.0 a 349.2 a
20.7 48.9 55.1 b 292.9 b
23.9 32.4 37.6 c 163.2 c
27.5 38.5 35.0 c 145.6 c
Number followed by a different letter in a given column differ at P 0.05
Table 10. Grain filling duration and final grain weight of wheat grown at four temperatures (mean of 24 genotypes). (Acevedo et al., 1991). Crop growth mean
Grain filling mean
Grain filling
Final grain
Grain filling
temperature temperature duration wgt
(mg/kernel)
(°C) (°C) (days) (mg) per day 12.2 17.0 28.5 a 39.5 a 1.39 20.7 24.0 29.4 a 28.9 b 0.98 23.9 25.6 26.5 a 30.5 b 1.15 27.5 24.4 30.5 a 27.6 c 0.91 Number followed by a different letter in a given column differ at P 0.05

47
Table 11. Salinity parameters in the flag leaf of Triticum species.
Ion Sintetic Bread wheat Durum wheat Duro
Salinity resistant
group 1 (ppm) n = 9 n = 10 n = 11 n = 10 K+ 28497.8 a 20860.0 b 18534.8 b 22235.0 b Na+ 999.0 b 482.0 b 5803.7 a 436.0 b K+ / Na+ 67.7 a 43.2 a 3.8 b 74.3 a 1 Bread wheat genotype reputed to be resistant to soil salinity. Number followed by a different letter in a given column differ at P 0.05 Table 12. Potential yield and yield under salinity stress, date flowering and stress resistance index of wheat genotypes.
Genotype Yield under stress
Potential yield
Date flowering Stress
kg ha-1 kg ha-1 (DAE) resistance
Seri"3"//BUC"S" 2810 7840 74.0 1.47 Sakha 8 2613 7827 76.8 1.31 Karchia 65 2611 5362 71.1 1.64 Kauz 2593 7564 73.0 1.14 Shorowaki 2450 4368 77.8 2.22