Growth in elevated CO 2 enhances temperature response of photosynthesis in wheat
37
1 Growth in elevated CO 2 enhances temperature response of photosynthesis in wheat Aitor Alonso, Pilar Pérez and Rafael Martínez-Carrasco* Institute of Natural Resources and Agrobiology of Salamanca, CSIC, Apartado 257, E- 37071 Salamanca, Spain *correspondence: Rafael Martínez-Carrasco. Fax: +34 923 219 609; E-mail: [email protected]
Transcript of Growth in elevated CO 2 enhances temperature response of photosynthesis in wheat
1
Growth in elevated CO2 enhances temperature response of photosynthesis in
wheat
Aitor Alonso, Pilar Pérez and Rafael Martínez-Carrasco*
Institute of Natural Resources and Agrobiology of Salamanca, CSIC, Apartado 257, E-
37071 Salamanca, Spain
*correspondence: Rafael Martínez-Carrasco. Fax: +34 923 219 609; E-mail:

2
Abstract
The temperature dependence of C3 photosynthesis may be altered by the growth
environment. The effects of long-term growth in elevated CO2 on photosynthesis
temperature response have been investigated in wheat (Triticum aestivum L.) grown in
controlled chambers with 370 or 700 µmol mol-1 CO2 from sowing through to anthesis.
Gas exchange was measured in flag leaves at ear emergence, and the parameters of a
biochemical photosynthesis model were determined along with their temperature
responses. Elevated CO2 slightly decreased the CO2 compensation point and increased
the rate of respiration in the light and Rubisco Vcmax, although the latter effect was
reversed at 15 ºC. With elevated CO2, Jmax decreased in the 15 ºC-25 ºC temperature
range and increased at 30 ºC and 35 ºC. The temperature response (activation energy) of
Vcmax and Jmax increased with growth in elevated CO2. CO2 enrichment decreased the
RuBP-limited photosynthesis rates at lower temperatures and increased Rubisco- and
RuBP-limited rates at higher temperatures. The results show that the photosynthesis
temperature response is enhanced by growth in elevated CO2. We conclude that if
temperature acclimation and factors such as nutrients or water availability do not
modify or negate this enhancement, the effects of future increases in air CO2 on
photosynthetic electron transport and Rubisco kinetics may improve the photosynthetic
response of wheat to global warming.
Abbreviations: A, net rate of CO2 uptake; Ac, Rubisco limited rate of photosynthesis; Aj
RuBP limited rate of photosynthesis; Cc chloroplastic CO2 concentration; Ci,
intercellular CO2 concentration; Γ*, CO2 compensation point in the absence of dark
respiration; H, activation energy; J, electron transport rate; Jmax, potential rate of
electron transport; Kc, Rubisco Michaelis constant for CO2; Ko, Rubisco Michaelis

3
constant for O2; Q, photosynthetically active photon flux density; Q2, photosynthetically
active photon flux density absorbed by Photosystem II; θ, convexity parameter; R,
molar gas constant; Rd, mitochondrial respiration rate in the light; Tk, leaf absolute
temperature (K); τ, Rubisco specificity factor; Vcmax, maximum Rubisco rate of
carboxylation.
4
Introduction
Photosynthesis in C3 plants is affected by both short- and long-term changes in
atmospheric temperature and CO2 concentration. In C3 plants, carbon assimilation
increases with a rise in CO2 concentration, first, because the Km of the enzyme for CO2
is close to the current atmospheric concentration, so higher CO2 concentration increases
the velocity of carboxylation; and second, because CO2 competitively inhibits the
oxygenation reaction thus decreasing photorespiratory CO2 loss and increasing the
efficiency of net carbon uptake (Long et al. 2004). In the long term, the increase in
atmospheric CO2 predicted by climate change decreases Rubisco activity and amount,
often associated with decreased transcripts for the enzyme small subunit (Drake et al.
1997, Moore et al. 1999), although other studies show it is due to a lower nitrogen
status (Riviere-Rolland et al. 1996, Nakano et al. 1997, Farage et al. 1998, Geiger et al.
1999, Pérez et al. 2005). We have found additional effects of prolonged growth in
elevated CO2, such as a decrease in Rubisco specific activity with a high nitrogen
supply, which is probably due to increased levels of day-time Rubisco inhibitors (Pérez
et al. 2005). Few studies have addressed the changes in temperature dependence of the
maximum rate of carboxylation by Rubisco (Vcmax) and the potential rate of electron
transport (Jmax) under elevated CO2 concentrations. Regarding rice, there were increases
in both the absolute value of, and the temperature optimum for, the light-saturated
photosynthetic rate at growth CO2 caused by elevated CO2 in FACE conditions;
however, the temperature dependence (activation energy) of Vcmax was not affected by
growth CO2 (Borjigidai et al. 2006). In contrast, growth in field chambers under
elevated CO2 increased the temperature response of Rubisco-limited photosynthesis and
of both in vitro and in vivo Vcmax (Alonso et al. 2008). If a negative relationship exists
between Vcmax and Rubisco specificity for CO2 relative to O2 (τ; Spreitzer and Salvucci

5
2002, Zhu et al. 2004), this would then imply that elevated CO2 leads to a sharper
decrease in τ with temperature (Long 1991). However, further research is required,
since Rubisco might not strictly adhere to this assumed inverse relationship (Zhu et al.
2004).
Photosynthetic electron transport in loblolly pine trees decreases only with elevated
CO2 when low temperatures inhibit translocation (Hymus et al. 1999). There was a
significant decrease (20%) in photosynthetic electron transport (Hymus et al. 2001) in
nitrogen-deficient conditions, at which elevated CO2 induced a 42% decrease in Vcmax.
This decrease compares with an average reduction of 13% with growth in free air CO2
enrichment facilities (Long et al. 2004). In contrast, these authors found increases in
electron transport at elevated CO2 with a high nitrogen supply. Along with Rubisco
activity, elevated CO2 has also been observed to decrease Ribulose-1, 5-bisphosphate
(RuBP) regeneration in forest species (Medlyn et al. 1999). The potential rate of
electron transport (Jmax) increases exponentially with temperature, with deactivation
being observed beyond a point which may vary with growth temperature (Yamasaki et
al. 2002, Bernacchi et al. 2003). Except for one observation in which the activation
energy of Jmax is no different for leaves grown in ambient and elevated CO2 in rice
(Borjigidai et al. 2006), it is not known whether Jmax temperature response is modified
by elevated growth CO2.
The aim of this study was to investigate the effects of growth from germination at
twice the present atmospheric CO2 on photosynthesis temperature response in wheat,
using gas exchange analysis. We intended to gain further evidence that elevated growth
CO2 increases the activation energy of Vcmax (Alonso et al. 2008) and to explore
whether, in association with this, the inverse change occurs in τ. In addition,
modifications with growth CO2 in temperature responses of respiration in the light and

6
Jmax were investigated. Finally, a biochemical photosynthesis model (Farquhar et al.
1980) was used to assess the temperature dependence of Rubisco- and RuBP
regeneration-limited photosynthesis as a function of growth CO2.

7
Materials and Methods
Plant material
Spring wheat (Triticum aestivum L. cv. Alcalá) was sown in 16 l pots (35 seeds per
pot) containing perlite, and placed in a growth chamber with 350 µmol m-2 s-1 photon
flux density (fluorescent and incandescent lamps) with a 14-h photoperiod, 20 ºC/10 ºC
day/night temperatures and 60% relative humidity. The pots were watered twice a week,
being fed once a week with a nutrient solution (Israel et al. 1990) containing 4 mM
CaCl2, 1.5 mM MgSO4, 0.4 mM HNa2PO4, 0.94 mM H2NaPO4, 10.1 mM KNO3, 0.1
mM iron citrate and micronutrients (Hewitt 1966): 0.5 mM Mn SO4, 0.1 mM Cu SO4,
0.1 mM ZnSO4, 5.0 mM H3BO3, 10.0 mM NaCl and 0.05 mM Na2MoO4. The same
growth chamber was used for two successive crops so as to minimize chamber effects.
One of the crops was grown at ambient (370 µmol mol-1) CO2 and the other at elevated
(700 µmol mol-1) CO2 throughout the experiment. Elevated CO2 was obtained by
injecting pure gas mixed with the chamber air by fans. The CO2 concentration was
continuously monitored by an infrared gas analyzer which signal was transferred into a
proportional, integral, derivative controller regulating the opening time of the CO2
solenoid feed valve. As the chambers were in an isolated building with restricted access,
actual CO2 concentrations showed little variation and were very close to set values.
Photosynthetic parameters and temperature dependence functions
Farquhar et al. (1980) proposed that the rate of net photosynthesis is the minimum of
two factors, the Rubisco-limited rate of photosynthesis (Ac), and the RuBP-
regeneration-limited rate of photosynthesis (Aj):
A= min (Ac, Aj)-Rd (1)
where Rd is mitochondrial respiration in the light.

8
Using the CO2 concentration in the chloroplast (Cc) rather than the intercellular CO2
concentration (Ci), the Rubisco-limited photosynthesis is given by:
)KO(1KCCV)C*Γ(1A
occ
ccmaxcc
++−= (2)
where Vcmax is the maximum rate of carboxylation by Rubisco, Γ* is the CO2
compensation point in the absence of dark respiration, Kc and Ko are the Rubisco
Michaelis constants for CO2 and O2, respectively, and O is oxygen concentration. The
term (1-Γ*/Cc) accounts for the CO2 released through photorespiration. In turn, Γ* is
related to the Rubisco specificity for CO2 relative to O2 (τ):
τ=
O5.0*Γ (3)
The RuBP-limited photosynthesis rate is:
*10.5Γ4.5CJC)/C*Γ(1Aj
c
cc
+−= (4)
where J is the rate of electron transport. J is related to the absorbed irradiance, Q2, by:
θJ2-(Q2+Jmax)J+Q2 Jmax=0 (5)
with solution for J:
θ2JQθ4)JQ()JQ(
J max22
max2max2 −+−+= (6)
where θ is the curvature of the light response curve (taken to be 0.88), and Jmax the
maximum rate of electron transport. Q2 is related to incident irradiance Q:
2)f1(QabsQ2
−= (7)
where abs is the absorptance of leaves (assumed to be 0.8) and f (assumed to be 0.25)
corrects for the spectral quality of light (Humphries and Long 1995).
The temperature responses of the parameters Γ*, Rd, Vcmax and Jmax adjusted to a
reference temperature of 25 ºC are described by the Arrhenius function (von Caemmerer

9
2000; Medlyn et al. 2002):
⎟⎠⎞
⎜⎝⎛ −
=k
k25 R298T
298)H(Texp ParameterParameter (8)
where Parameter25 is the parameter value at 25 ºC, H is the activation energy, R the
molar gas constant (8.314 J mol-1 K-1) and Tk the leaf absolute temperature.
Gas exchange measurements and parameter estimations
Gas exchange measurements at differing CO2 concentrations and temperatures were
used to solve the photosynthesis model parameters and their temperature dependencies.
At ear emergence, six flag leaves from each growth CO2 concentration were measured
between 2 and 8 h after the start of photoperiod. Measurements were performed outside
the growth chamber, in a glasshouse under natural light and ambient air. Gas exchange
was recorded with an infrared gas analyzer (CIRAS-2, PP Systems, Hitchin, Herts., UK)
with differential operation in an open system, using a 1.7 cm2-window leaf chamber,
300 ml min-1 air flow rate, and 1500 µmol m-2 s-1 irradiance, except when stated
otherwise. Leaf temperature was controlled by the analyzer’s Peltier system.
Gas exchange between leaf chambers and the surrounding air can lead to erroneous
estimations of A and Ci (Jahnke and Krewitt 2002, Pons and Welschen 2002, Long and
Bernacchi 2003, Flexas et al. 2007b, Rodeghiero et al. 2007). A comparison of
homobaric and heterobaric plant species has shown that leakage between the leaf and
gasket surfaces is much larger than possible leakage through the leaf mesophyll (Flexas
et al. 2007b). Estimations of A and Ci were corrected for chamber leakage by using a
photosynthetically inactive leaf, as described by Flexas et al. (2007b). A leaf was killed
by immersion in boiling water, blotted and then enclosed in the assimilation chamber.
Apparent photosynthesis and transpiration were recorded at all measurement
temperatures following the same protocol used for A/Ci curves (see below).

10
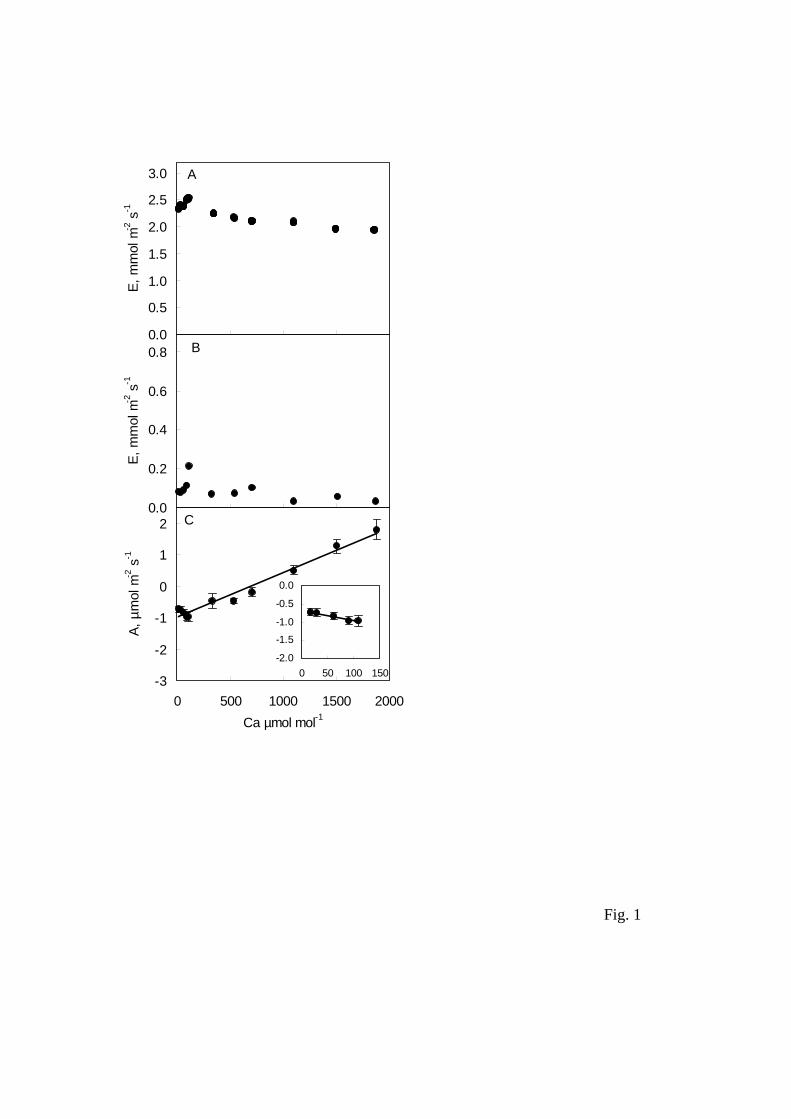
Temperature did not modify the recordings obtained. Partially wet dead leaves gave
significant apparent transpiration, as expected (Fig. 1A); however, when the dead leaf
was dry, water leakage (Fig. 1 B) was only small, in contrast with Rodeghiero et al.
(2007), and of no consequence for A and Ci determinations. For example, an apparent
transpiration rate of 0.2 mmol m-2 s-1 at an air CO2 concentration of 115 µmol mol-1
(Fig. 1 B) would cause relative changes of -1.0% in A and 1.6% in Ci; with 0.1 mmol m-
2 s-1 apparent transpiration rate at 12 µmol mol-1 CO2, the respective figures would be
0.1% and -1.5%. Moreover, CO2 response was similar with both wet and dry dead
leaves. Consequently, we made no correction for water diffusion. CO2 diffusion through
the gasket of the leaf chamber was dependent both on air CO2 concentration and the
order in which this was changed. Thus, on decreasing CO2 from 115 to 12 µmol mol-1
CO2, inward diffusion progressively decreased (Fig. 1C, inset), and on increasing air
CO2 concentration from 370 to 1800 µmol mol-1, outward diffusion increased (Fig 1C).
This was probably due to the change in CO2 gradient between the chamber and external
air. Leakage yielded apparent CO2 exchange rates from -0.96 µmol m-2 s-1 (with 115
µmol mol-1 CO2) to 1.8 µmol m-2 s-1 (with 1800 µmol mol-1 CO2). CO2 exchange of
living leaves was corrected by subtraction of the regressions of apparent photosynthesis
of dead leaves over air CO2 concentration. Ci values were then recalculated using the
manufacturer’s formulae (Flexas et al. 2007b).
From the corrected A/Ci curves, Cc (Ci - A/gm) was estimated using the mesophyll
conductance (gm) determined by nonlinear curve fitting of equations 2 and 4,
minimizing the sum of squared model deviations from the data (Sharkey et al. 2007;
http://www.blackwellpublishing.com/plantsci/pcecalculation/). An iterative, least
squares analysis procedure was followed to first determine Cc and gm with Rd and Γ*
values taken from Sharkey et al. (2007), then to convert the Ci-based Γ* values obtained

11
in this study (see below) into Cc-based Γ* (measured Rd is the same with Ci and Cc), and
finally re-calculate Cc with the Rd and Γ* values obtained. This assumes a constant gm
for the entire range of Ci, whereas Flexas et al. (2007a) have shown that gm declines
with increasing Ci. According to these authors, however, the use of a single gm value has
negligible effects on the parameterization of Vcmax and Jmax, except when gm is largely
reduced (e.g., under severe water stress).
At 5 ºC intervals from 15 to 35 ºC for leaf temperature, gas exchange was
successively measured with approximately 115, 90, 60, 24 and 12 µmol mol-1 air CO2
concentration, at two (200 and 1500 µmol m-2 s-1) rather than three light intensities, to
determine Rd and Γ* following the Laisk procedure (1977). Choosing more light
intensities would limit the accuracy of the Rd and Γ* assessment. The Laisk procedure
assumes that while photorespiration closely depends on light intensity, Rd does not
change with irradiance. Hence, the intersection of the A/Cc response lines at the two
light intensities represents Γ* when extrapolated to the Cc axis, and Rd when
extrapolated to the A axis (Laisk 1977, Bernacchi et al. 2001). Atkin et al. (2000) found
that Rd was inhibited by low irradiance at moderate-to-high temperatures (15°C–30°C),
however, higher irradiance had little additional effect on respiration at these
temperatures. In this work, therefore, the Laisk procedure was adopted and Γ* and the
Rd values obtained were used in model calculations. For this and subsequent
measurements, gas exchange parameters were recorded as soon as inlet air CO2
concentration was stable, but not necessarily steady-state (Long and Bernacchi 2003).
The maximum rate of carboxylation by Rubisco, Vcmax, at each measurement
temperature, was obtained from the response of A to Cc at low CO2 concentrations (12
to 115 µmol mol -1 CO2 in external air) and 1500 µmol m-2 s-1 irradiance by substituting
f for (Cc-Γ*)/(Cc +Kc (1+O/Ko)) in equation (2):

12
A=Vcmax· f – Rd (9)
and solving Vcmax as the slope of a linear function of f (Long and Bernacchi 2003).
Although it is satisfactory, the non-linear curve fitting of equation (2) with the utility
proposed by Sharkey et al. (2007) offers less precision than fitting a straight line. The
Cc-based Kc and Ko and the parameters describing their dependence on temperature
were taken from Bernacchi et al. (2002):
⎟⎠⎞
⎜⎝⎛
⋅⋅−
⋅=k
kc
298)298(99.80exp38.272K
TRT
(10)
⎟⎠⎞
⎜⎝⎛
⋅⋅−
⋅=k
ko
298)298(72.23exp82.165K
TRT
(11)
At each temperature, air CO2 concentration was subsequently increased from 12
µmol mol-1 to 370, 550, 700, 1100, 1500 and 1800 µmol mol-1 at 1500 µmol m-2 s-1
irradiance. From the A/Cc response curve at each measurement temperature, the light
and CO2 saturated photosynthesis rate, Amax, was estimated with the aid of
Photosynthesis Assistant software (http:// www.scientific.force9.co.uk) by fitting the
rectangular hyperbola:
RACCEACCE
maxc
maxc−
+⋅⋅⋅
=A (12)
where CE is carboxylation efficiency (the initial slope of the A/Cc response curve,
representing the increase in photosynthetic rate achieved per unit increase in CO2) and
R is respiratory processes (dark and light). Amax was used to determine Jmax by
rearranging equation (4):
*ΓC)*5.10)(4.5CR(AJ
c
cdmaxmax
−Γ++
= (13)
With the values for Rd, Γ*, Vcmax and Jmax obtained at each temperature, the
corresponding values at 25 ºC and activation energies were obtained by fitting equation

13
(8).
Statistical analyses
Photosynthesis parameters and their temperature dependence functions were
separately calculated for each leaf. The linear regressions for Γ∗, Rd and Vcmax (equation
9) estimations were fitted using an Excel (Microsoft) spreadsheet, and the temperature
dependence functions (equation 8) of the photosynthesis parameters were fitted by
nonlinear regression with GenStat 6.2 statistical software. The data from separate
calculations in each leaf were compared for growth CO2 effects in either a two-way
analysis (temperature and CO2; photosynthesis parameters, see Table 1) or one-way
analysis (CO2; temperature dependence parameters, see Table 2) of variance with no
blocking using GenStat 6.2.
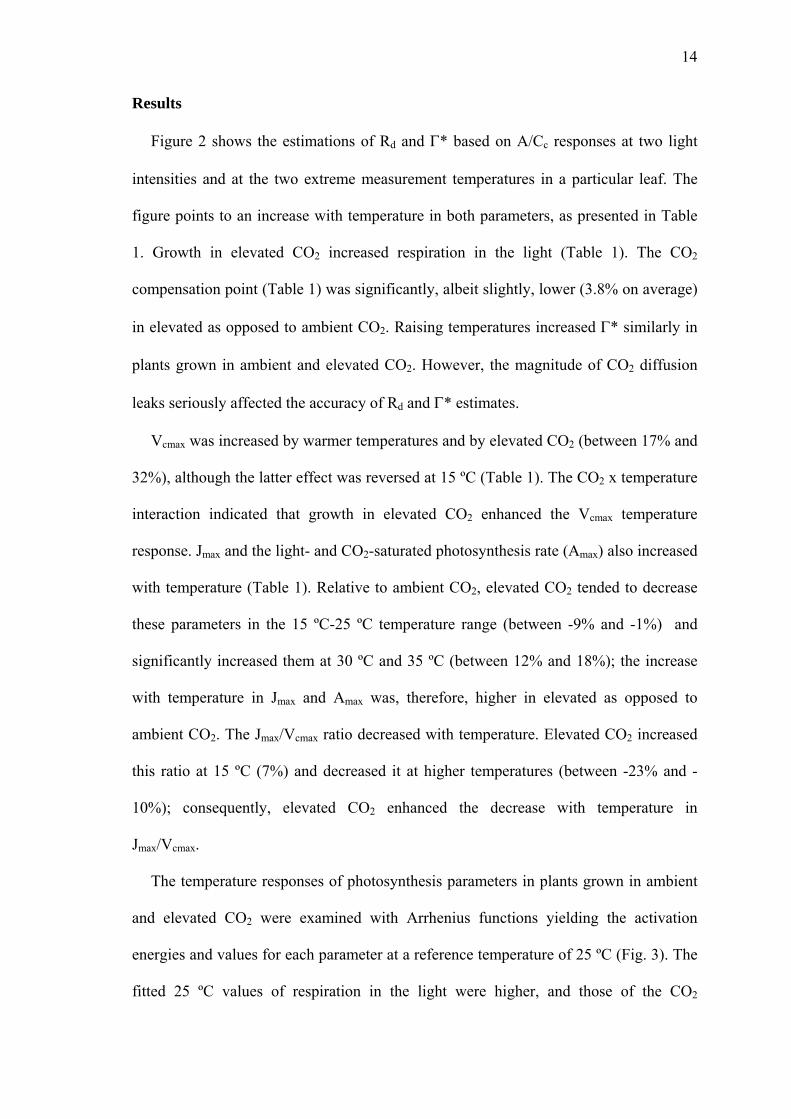
14
Results
Figure 2 shows the estimations of Rd and Γ* based on A/Cc responses at two light
intensities and at the two extreme measurement temperatures in a particular leaf. The
figure points to an increase with temperature in both parameters, as presented in Table
1. Growth in elevated CO2 increased respiration in the light (Table 1). The CO2
compensation point (Table 1) was significantly, albeit slightly, lower (3.8% on average)
in elevated as opposed to ambient CO2. Raising temperatures increased Γ* similarly in
plants grown in ambient and elevated CO2. However, the magnitude of CO2 diffusion
leaks seriously affected the accuracy of Rd and Γ* estimates.
Vcmax was increased by warmer temperatures and by elevated CO2 (between 17% and
32%), although the latter effect was reversed at 15 ºC (Table 1). The CO2 x temperature
interaction indicated that growth in elevated CO2 enhanced the Vcmax temperature
response. Jmax and the light- and CO2-saturated photosynthesis rate (Amax) also increased
with temperature (Table 1). Relative to ambient CO2, elevated CO2 tended to decrease
these parameters in the 15 ºC-25 ºC temperature range (between -9% and -1%) and
significantly increased them at 30 ºC and 35 ºC (between 12% and 18%); the increase
with temperature in Jmax and Amax was, therefore, higher in elevated as opposed to
ambient CO2. The Jmax/Vcmax ratio decreased with temperature. Elevated CO2 increased
this ratio at 15 ºC (7%) and decreased it at higher temperatures (between -23% and -
10%); consequently, elevated CO2 enhanced the decrease with temperature in
Jmax/Vcmax.
The temperature responses of photosynthesis parameters in plants grown in ambient
and elevated CO2 were examined with Arrhenius functions yielding the activation
energies and values for each parameter at a reference temperature of 25 ºC (Fig. 3). The
fitted 25 ºC values of respiration in the light were higher, and those of the CO2

15
compensation point were similar, in elevated as opposed to ambient CO2 (Table 2).
Vcmax at 25 ºC was higher in elevated as opposed to ambient CO2, while Jmax and Amax at
25 ºC did not significantly differ between CO2 concentrations. The slopes of the
Arrhenius functions (activation energies, H) for Rd and Γ* showed no significant
differences between CO2 concentrations (Table 2). At variance to this, the activation
energies corresponding to Vcmax, Jmax and Amax where higher in elevated as opposed to
ambient CO2, indicating that CO2 enrichment increased the temperature response of
these parameters.
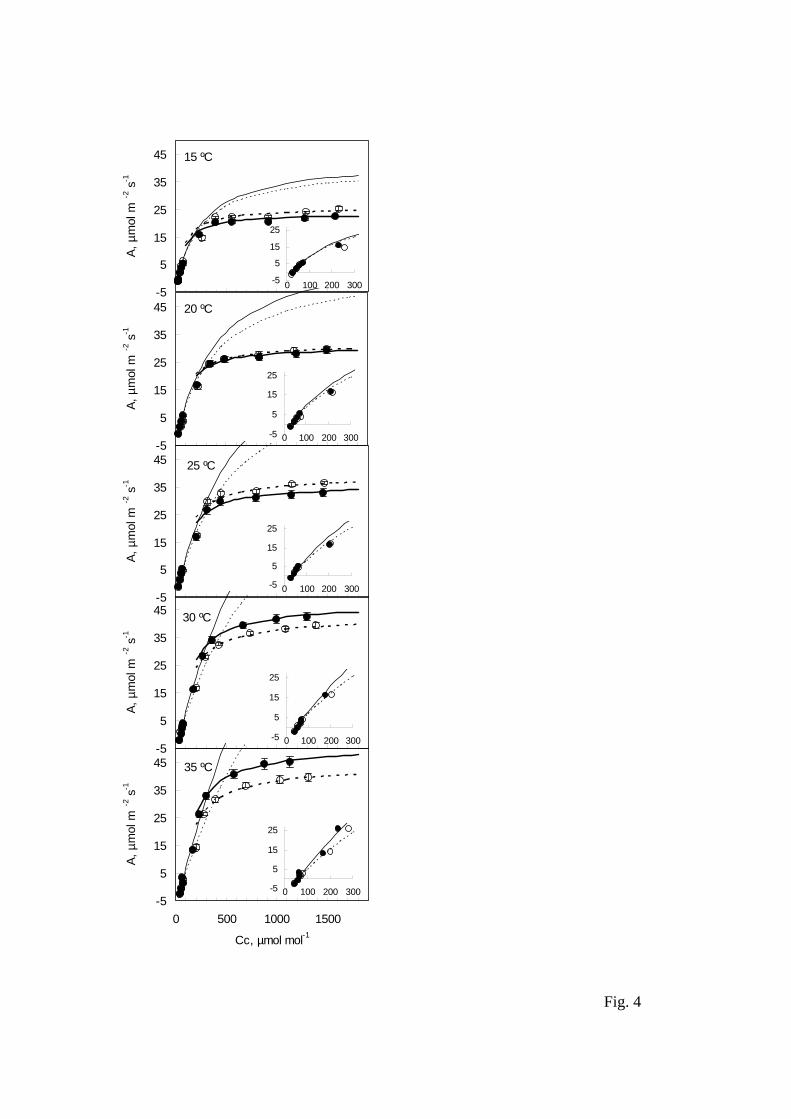
The calculated photosynthesis parameters were incorporated in the Farquhar et al.
(1980) photosynthesis model to examine the effect of growth CO2 concentration on
photosynthesis responses to chloroplastic CO2 and temperature (Fig. 4). Modeled curves
fitted well to experimental data, except for those values - at certain temperatures -
corresponding to the measurement at 370 µmol mol-1 air CO2. A change in Rubisco
activation state upon the sudden increase in CO2 concentration from 12 to 370 µmol
mol-1 CO2 could account for the divergence between model and measurement. The
transition from Rubisco-limited – at lower CO2 concentrations – to RuBP-limited
photosynthesis occurred at higher intercellular CO2 concentrations (275-375 µmol mol-
1) in plants grown in ambient as opposed to elevated CO2 (200-320 µmol mol-1 CO2)
and increased with temperature. Growth in elevated CO2 changed only slightly the CO2
response of Rubisco-limited photosynthesis rates at 15 ºC and increased it at warmer
temperatures. In turn, elevated CO2 decreased RuBP-limited photosynthesis response to
chloroplastic CO2 concentration in the 15-25 ºC range, but increased it with higher
temperatures.
To model the response of photosynthesis to temperature, measured Cc values were
used. As these varied with temperature and CO2 concentration used for measurement,

16
non-smooth curves were obtained (Fig. 5). Photosynthesis response to temperature was
negative at low air CO2 concentrations (Fig. 5) and became progressively positive as
CO2 increased, as may be expected from the increase in photorespiration with
temperature and the gradual inhibition of this process as CO2 increases (Long, 1991). A
steep increase in photosynthesis from 15 ºC to 30-35 ºC was observed at 1800 µmol
mol-1 air CO2 concentration (Fig. 5). Growth CO2 had little effect on photosynthesis
temperature response in the lower range of CO2 concentrations. At high Cc,
photosynthesis in elevated growth CO2 was lower at 15-25 ºC, and higher at 30-35 ºC,
than in ambient growth CO2, implying an enhanced photosynthesis response to
temperature in plants grown in elevated CO2; moreover, at 1800 µmol mol-1 Cc,
photosynthesis peaked at about 30 ºC in ambient CO2 plants, but at higher temperatures
in their elevated CO2 counterparts.
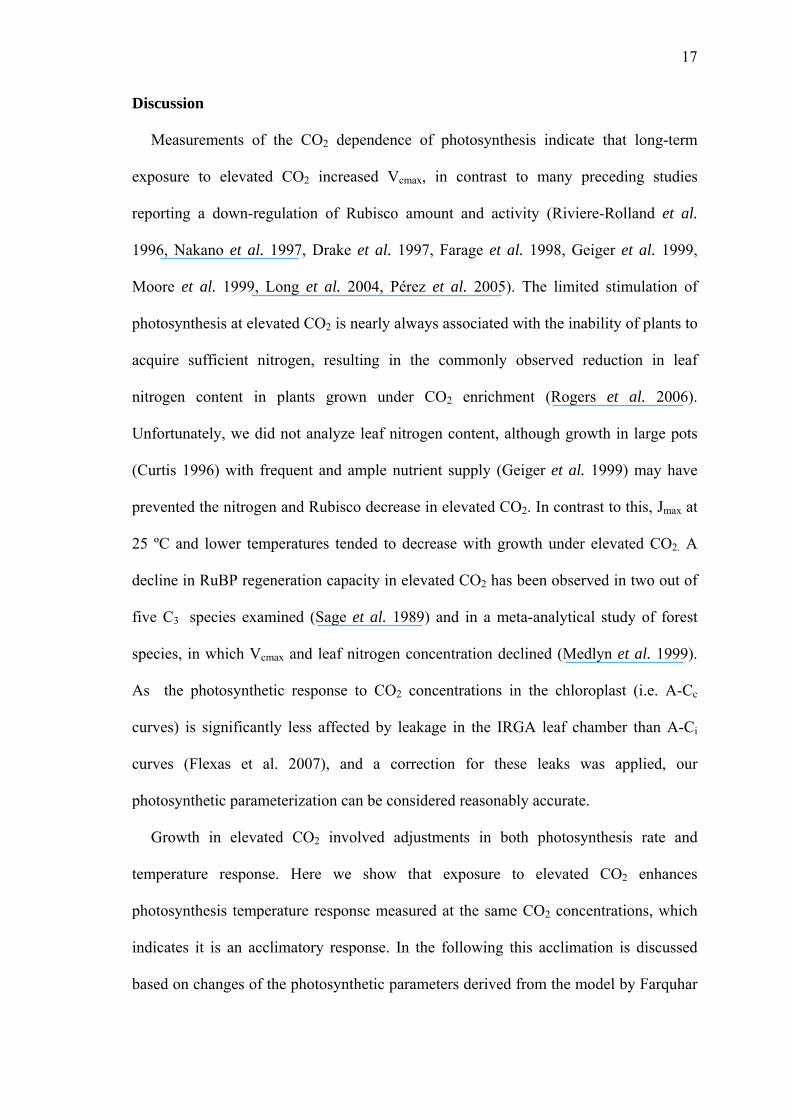
17
Discussion
Measurements of the CO2 dependence of photosynthesis indicate that long-term
exposure to elevated CO2 increased Vcmax, in contrast to many preceding studies
reporting a down-regulation of Rubisco amount and activity (Riviere-Rolland et al.
1996, Nakano et al. 1997, Drake et al. 1997, Farage et al. 1998, Geiger et al. 1999,
Moore et al. 1999, Long et al. 2004, Pérez et al. 2005). The limited stimulation of
photosynthesis at elevated CO2 is nearly always associated with the inability of plants to
acquire sufficient nitrogen, resulting in the commonly observed reduction in leaf
nitrogen content in plants grown under CO2 enrichment (Rogers et al. 2006).
Unfortunately, we did not analyze leaf nitrogen content, although growth in large pots
(Curtis 1996) with frequent and ample nutrient supply (Geiger et al. 1999) may have
prevented the nitrogen and Rubisco decrease in elevated CO2. In contrast to this, Jmax at
25 ºC and lower temperatures tended to decrease with growth under elevated CO2. A
decline in RuBP regeneration capacity in elevated CO2 has been observed in two out of
five C3 species examined (Sage et al. 1989) and in a meta-analytical study of forest
species, in which Vcmax and leaf nitrogen concentration declined (Medlyn et al. 1999).
As the photosynthetic response to CO2 concentrations in the chloroplast (i.e. A-Cc
curves) is significantly less affected by leakage in the IRGA leaf chamber than A-Ci
curves (Flexas et al. 2007), and a correction for these leaks was applied, our
photosynthetic parameterization can be considered reasonably accurate.
Growth in elevated CO2 involved adjustments in both photosynthesis rate and
temperature response. Here we show that exposure to elevated CO2 enhances
photosynthesis temperature response measured at the same CO2 concentrations, which
indicates it is an acclimatory response. In the following this acclimation is discussed
based on changes of the photosynthetic parameters derived from the model by Farquhar

18
et al. (1980). First, growth in elevated CO2 increased net photosynthesis temperature
response (equation 1) despite an increase in respiration in the light, in agreement with
Davey et al. (2004), and in contrast to the inhibition of respiration which has been
reported (for a review, see Drake et al. 1999, Wang and Curtis 2002). This respiration
enhancement in elevated growth CO2 was apparent despite limitations in day respiration
estimates caused by diffusion leaks in the IRGA leaf chamber (Flexas et al. 2007b). An
increase in respiration may be due to the higher leaf soluble carbohydrate content
usually found (Moore et al., 1999, Pérez et al. 2005) under elevated CO2. Indeed, Stitt
et al. (1999) have shown that an increased level of carbohydrate leads to an increased
level of glycolytic enzymes and, thence, to a stimulation of respiration. The increase in
Vcmax in elevated CO2 may be counterbalanced by increased respiration rates, resulting
in limited enhancement of Rubisco-limited photosynthesis.
Second, elevated CO2 altered RuBP-limited photosynthesis temperature response
through an increase in Jmax activation energy. The temperature dependence of electron
transport at the plastoquinone and water-oxidation sites is shown to be influenced by
growth temperature by the temperature at which the leaves developed (Yamasaki et al.
2002). Whether growth in elevated CO2 affects electron transport temperature
dependence at the same sites is worth investigating. Niinemets et al. (1999) have
suggested that a lower Jmax activation energy is associated with decreases in membrane
fluidity due to increased lipid saturation. However, elevated CO2 has been observed to
increase lipid saturation (Huang et al. 1999), and yet it increased the activation energy
for Jmax. Clearly, more work is needed to understand the reasons for this increased
temperature response.
Third, we have found that the known increase with temperature in Vcmax (von
Caemmerer, 2000) is enhanced by growth under air CO2 enrichment. This is consistent

19
with the in vivo and in vitro temperature responses of Rubisco activity in plants grown
in field chambers (Alonso et al. 2008). Deactivation of Rubisco activase may lead to
decreased Rubisco activation at high temperatures, although this is more likely at
temperatures higher than those examined in this study (Crafts-Brandner and Salvucci,
2000) and in plants acclimated to low than to high temperature (Way and Sage 2008).
Increases in Vcmax with temperature have been accounted for by the strong temperature
dependence of the catalytic opening and closure of the Rubisco active site (Zhu et al.
1998). Moreover, it has been suggested that higher temperatures loosen the catalytic site
of Rubisco thus facilitating the release of inhibitors (Schrader et al. 2006). Further
research is required to verify whether growth in elevated CO2 increases Vcmax
temperature response through an altered flexibility of the Rubisco active site’s outer
parts or the easier release of inhibitors.
Fourth, an inverse relationship between Rubisco rate of catalysis and specificity for
CO2 relative to O2 has been suggested (Zhu et al. 2004, Mitchell et al. 2005, Spreitzer et
al. 2005), as well as an association between increased catalysis and decreased affinity
(increased Km) for CO2 (Sage 2002). Contrary to this, and although inaccuracies in Rd
determination arising from chamber leaks (see above) also apply to gas exchange-based
Γ* measurements, a remarkable finding in our study is that the increase in Vcmax and its
temperature response under elevated growth CO2 was associated with slightly decreased
Γ* and thus with increased τ. Significant variability has been found in τ among closely
related C3 species; this variability was related to environmental factors, with a
comparatively high specificity factor being associated with an increase in the activation
energy of the transition state intermediates for oxygenation relative to carboxylation
(Galmés et al. 2005). The relationship between τ and Vcmax (τ = Vcmax Ko/Vomax Kc,
where Vomax is the maximum rate of oxygenation) suggests that the increase in � may

20
simply be a consequence of the increase in Vcmax with temperature, but we do not know
whether growth in elevated CO2 also changed other Rubisco kinetic parameters (Kc, Ko)
that were not estimated in the present study.
The temperature dependence of carboxylation by Rubisco is thought to be stable
among C3 plants (Badger et al. 1982, Brooks & Farquhar 1985). Our study indicates
that, within the same species, Vcmax shows variations in temperature dependence
induced by growth CO2 concentration. Similarly, changes in the temperature
dependence of the electron transport capacity in response to growth temperature have
been reported for a number of species (Yamori et al. 2005) including wheat (Yamasaki
et al. 2002). A conclusion of our work is that atmospheric CO2 can also cause these
changes. Rather than an alteration in the balance between RuBP regeneration and RuBP
carboxylation (Farquhar and von Caemmerer 1982), changes in the temperature
dependencies of Jmax and Vcmax could modify the temperature response of photosynthesis
in elevated growth CO2.
This study shows that growth in elevated CO2 has important additional effects on
electron transport capacity and on Rubisco kinetics that can improve photosynthesis
temperature response. If temperature acclimation and factors such as nutrient or water
availability do not modify or negate these effects, future increases in atmospheric CO2
may therefore positively affect photosynthesis adjustment to global warming in wheat.
Additionally, considerable research has been devoted to improving Rubisco properties
such as specificity (Chen and Spreitzer 1992, Zhu et al. 1998, Schlitter and Wildner
2000). Understanding the effects of elevated growth CO2 on these properties can offer
useful keys for this objective.

21
Acknowledgments
This work has been funded by the Spanish National Research and Development
Programme (Project BFI2003-01277). A. Alonso was the recipient of an I3P pre-
doctoral fellowship from the CSIC-European Social Fund.
22
Literature cited
Alonso A, Pérez P, Morcuende R, Martínez-Carrasco R (2008) Future CO2
concentrations, though not warmer temperatures, enhance wheat photosynthesis
temperature responses. Physiol Plant 132: 102-112.
Atkin OK, Evans JR, Ball MC, Lambers H, Pons TL (2000) Leaf respiration of snow
gum in the light and dark. Interactions between temperature and irradiance. Plant
Physiol 122: 915–923.
Badger MR, Bjorkman O, Armond PA (1982) An analysis of photosynthetic response
and adaptation to temperature in higher-plants - temperature-acclimation in the desert
evergreen Nerium-oleander L. Plant Cell Environ 5: 85-99.
Bernacchi CJ, Pimentel C, Long SP (2003) In vivo temperature response functions of
parameters required to model RuBP-limited photosynthesis. Plant Cell Environ 26:
1419–1430.
Bernacchi CJ, Portis AR, Nakano H, von Caemmerer S, Long SP (2002) Temperature
response of mesophyll conductance. Implications for the determination of rubisco
enzyme kinetics and for limitations to photosynthesis in vivo. Plant Physiol 130:
1992-1998.
Bernacchi CJ, Singsaas EL, Pimentel C, Portis AR, Long SP (2001) Improved
temperature response functions for models of Rubisco-limited photosynthesis. Plant
Cell Environ 24: 253–259.
Borjigidai A, Hikosaka K, Hirose T, Hasegawa T, Okada M, Kobayashi K (2006)
Seasonal changes in temperature dependence of photosynthetic rate in rice under a
Free-Air CO2 Enrichment. Ann Bot 97: 549–557.
Brooks A, Farquhar GD (1985) Effect of temperature on the CO2/O2 specificity of
ribulose-1,5-bisphosphate carboxylase oxygenase and the rate of respiration in the
23
light - estimates from gas-exchange measurements on spinach. Planta 165: 397-406.
Chen Z, Spreitzer RJ (1992) How various factors influence the CO2/O2 specificity of
ribulose-1,5-bisphosphate carboxylase oxygenase. Photosynthesis Research 31: 157-
164.
Curtis PS. (1996) A meta-analysis of leaf gas exchange and nitrogen in trees grown
under elevated carbon dioxide. Plant Cell Environ 19: 127–137.
Crafts-Brandner SJ, Salvucci ME. (2000) Rubisco activase constrains the
photosynthetic potential of leaves at high temperature and CO2. Proc Natl Acad Sci
USA 97: 13430–13435
Davey PA, Hunt S, Hymus GJ, DeLucia EH, Drake BG, Karnosky DF, Long SP (2004)
Respiratory oxygen uptake is not decreased by an instantaneous elevation of [CO2],
but is increased with long-term growth in the field at elevated [CO2]. Plant Physiol
134: 1-8.
Drake BG, Gonzalez-Meler MA, Long SP (1997) More efficient plants: A consequence
of rising atmospheric CO2? Annu Rev Plant Physiol Plant Mol Biol 48: 609–39.
Drake BG, Azcon-Bieto J, Berry J, Bunce J, Dijkstra, Farrar J, Gifford RM, Gonzalez-
Meler MA, Koch G, Lambers H, Siedow J, Wullschleger S (1999) Does elevated
atmospheric CO2 concentration inhibit mitochondrial respiration in green plants?
Plant Cell Environ 22: 649–657.
Farage P, McKee I, Long SP (1998) Does a low nitrogen supply necessarily lead to
acclimation of photosynthesis to elevated CO2? Plant Physiol 118: 573-580.
Farquhar GD, von Caemmerer S (1982) Modelling of photosynthetic responses to
environmental conditions. In Physiological Plant Ecology. II. Encyclopedia of Plant
Physiology, New Series, Vol. 12B (eds O.L. Lange, P.S. Nobel, C.B. Osmond and H.
Ziegler), pp. 548–577. Springer-Verlag, Berlin, Germany.

24
Farquhar GD, von Caemmerer S, Berry JA (1980) A biochemical model of
photosynthetic CO2 assimilation in leaves of C3 species. Planta 149: 78-90.
Flexas J, Diaz-Espejo A, Galmés J, Kaldenhoff R, MedranoH, Ribas-Carbó M (2007a)
Rapid variations of mesophyll conductance in response to changes in CO2
concentration around leaves. Plant Cell Environ 30: 1284–1298.
Flexas J, Díaz-Espejo A, Berry JA, Cifre J., Galmés J., Kaldenhoff R, Medrano H,
Ribas-Carbó M (2007b) Analysis of leakage in IRGA’s leaf chambers of open gas
exchange systems: quantification and its effects in photosynthesis parameterization. J
Exp Bot 58: 533–1543.
Geiger M, Haake V, Ludewig F, Sonnewald U, Stitt M (1999) The nitrate and
ammonium nitrate supply have a major influence on the response of photosynthesis,
carbon metabolism, nitrogen metabolism and growth to elevated carbon dioxide in
tobacco. Plant Cell Environ 22: 1177–1199.
Hewitt EJ (1966) Sand and water culture methods used in the study of plant nutrition.
Technical Communication No. 22, 2nd ed. Commonwealth Agricultural Bureau,
Farnham Royal, Bucks, pp 430–472.
Huang Y, Eglinton G, Ineson P, Bol R, Harkness DD (1999) The effects of nitrogen
fertilization and elevated CO2 on the lipid biosynthesis and carbon isotopic
discrimination in birch seedlings (Betula pendula). Plant and Soil 216: 35-45.
Humphries SW, Long SP (1995) WIMOVAC - A software package for modeling the
dynamics of plant leaf and canopy photosynthesis. Bioinformatics 11: 361-371.
Hymus GJ, Baker NR, Long SP (2001) Growth in elevated CO2 can both increase and
decrease photochemistry and photoinhibition of photosynthesis in a predictable
manner. Dactylis glomerata grown in two levels of nitrogen nutrition. Plant Physiol
127: 1204–1211.

25
Hymus GJ, Ellsworth DS, Baker NR, Long SP (1999) Does free-air carbon dioxide
enrichment affect photochemical energy use by evergreen trees in different seasons?
A chlorophyll fluorescence study of mature loblolly pine. Plant Physiol 120: 1183–
1191.
Israel DW, Rufty TW, Cure JD (1990) Nitrogen and phosphorus nutritional interactions
in a CO2 enriched environment. J Plant Nutr 13: 1419–1433.
Jahnke S, Krewitt M (2002) Atmospheric CO2 concentration may directly affect leaf
respiration measurement in tobacco, but not respiration itself. Plant Cell Environ 25:
641–651.
Laisk A (1977) Kinetics of photosynthesis and photorespiration in C3 plants. Nauka,
Moscow (in Russian).
Long SP (1991) Modification of the response of photosynthetic productivity to rising
temperature by atmospheric CO2 concentrations: has its importance been
underestimated? Plant Cell Environ 14: 729–739.
Long SP, Bernacchi CJ (2003) Gas exchange measurements, what can they tell us about
the underlying limitations to photosynthesis? Procedures and sources of error. J Exp
Bot 54: 2393- 2401.
Long SP, Ainsworth EH, Rogers A, Ort DR (2004) Rising atmospheric carbon dioxide:
Plants FACE the future. Annu Rev Plant Biol 55: 591-628.
Medlyn BE, Dreyer E, Ellsworth D, Forstreuter M, Harley PC, Kirschbaum MUF, Le
Roux X, Montpied P, Strassemeyer J, Walcroft A, Wang K, Loustau D (2002)
Temperature response of parameters of a biochemically based model of
photosynthesis. II. A review of experimental data. Plant Cell Environ 25: 1167–1179.
Medlyn BE, Badeck FW, De Pury DGG, Barton CVM, Broadmeadow M, Ceulemans
MR, De Angelis P, Forstreuter M, Jach ME, Kellomäki S, Laitat E, Marek M,

26
Philippot S, Rey A, Strassemeyer J, Laitinen K, Liozon R, Portier B, Roberntz P,
Wang K, Jstbid P (1999) Effects of elevated [CO2] on photosynthesis in European
forest species: a meta-analysis of model parameters Plant Cell Environ 22: 1475-
1495.
Mitchell RAC, Keys AJ, Madgwick PJ, Parry MAJ, Lawlor DW (2005) Adaptation of
photosynthesis in marama bean Tylosema esculentum (Burchell A. Schreiber) to a
high temperature, high radiation, drought-prone environment. Plant Physiol Biochem
43: 969–976.
Moore BD, Cheng SH, Sims D, Seemann JR (1999) The biochemical and molecular
basis for photosynthetic acclimation to elevated atmospheric CO2. Plant Cell Environ
22:567–82.
Nakano H, Makino A, Mae T (1997) The effect of elevated partial pressures of CO2 on
the relationship between photosynthetic capacity and N content in rice leaves. Plant
Physiol 115: 191-198.
Niinemets Ü, Oja V, Kull O (1999) Shape of leaf photosynthetic electron transport
versus temperature response curve is not constant along canopy light gradients in
temperate deciduous trees. Plant Cell Environ 22: 1497–1513.
Pérez P, Morcuende R, Martín del Molino I, Martínez-Carrasco R (2005) Diurnal
changes of Rubisco in response to elevated CO2, temperature and nitrogen in wheat
grown under temperature gradient tunnels. Environ Exp Bot 53: 13-27.
Pons TL, Welschen RAM (2002) Overestimation of respiration rates in commercially
available clamp-on leaf chambers. Complications with measurement of net
photosynthesis. Plant Cell Environ 25: 1367-1372.
Riviere-Rolland H, Contard P, Betsche T (1996) Adaptation of pea to elevated
atmospheric CO2: Rubisco, phosphoenolpyruvate carboxylase and chloroplast

27
phosphate translocator at different levels of nitrogen and phosphorus nutrition. Plant
Cell Environ 19: 109-117.
Rodeghiero M, Niinemets Ü, Cescatti A (2007) Major diffusion leaks of clamp-on leaf
cuvettes still unaccounted: how erroneous are the estimates of Farquhar et al. model
parameters? Plant Cell Environ 30: 1006–1022.
Rogers A, Gibon Y, Stitt M, Morgan PB, Bernacchi CJ, Ort DR, Long SP (2006)
Increased C availability at elevated carbon dioxide concentration improves N
assimilation in a legume. Plant Cell Environ. 29: 1651–1658.
Sage RF (2002) Variation in the kcat of Rubisco in C3 and C4 plants and some
implications for photosynthetic performance at high and low temperature. J Exp Bot
53: 609-620.
Sage RF, Sharkey TD, Seemann JR (1989) Acclimation of photosynthesis to elevated
CO2 in 5 C-3 species. Plant Physiol 89: 590-596.
Schlitter J, Wildner GF (2000) The kinetics of conformation change as determinant of
Rubisco’s specificity. Photosynth Res 65: 7-13.
Schrader SM, Kane HJ, Sharkey TD, von Caemmerer S (2006) High temperature
enhances inhibitor production but reduces fallover in tobacco Rubisco. Funct Plant
Biol 33: 921–929.
Sharkey TD, Bernacchi CJ, Farquhar GD, Singsaas EL (2007) Fitting photosynthetic
carbon dioxide response curves for C3 leaves. Plant Cell Environ 30: 1035–1040.
Spreitzer RJ, Salvucci ME (2002) RUBISCO: structure, regulatory interactions, and
possibilities for a better enzyme. Annu Rev Plant Biol 53: 449–475.
Spreitzer RJ, Peddi SR, Satagopan S (2005) Phylogenetic engineering at an interface
between large and small subunits imparts land-plant kinetic properties to algal
Rubisco. Proc Natl Acad Sci USA 102: 17225-17230.

28
Stitt M, Vonschaewen A, Willmitzer L (1991) Sink regulation of photosynthetic
metabolism in transgenic tobacco plants expressing yeast invertase in their cell-wall
involves a decrease of the calvin-cycle enzymes and an increase of glycolytic-
enzymes. Planta 183: 44-50.
von Caemmerer S (2000) Biochemical Models of Leaf Photosynthesis. CSIRO
Publishing, Collingwood, Australia
Wang XZ, Curtis P (2002) A meta-analytical test of elevated CO2 effects on plant
respiration. Plant Ecol 161: 251–261.
Way DA, Sage RF (2008) Thermal acclimation of photosynthesis in black spruce [Picea
mariana (Mill.) B.S.P.]. Plant Cell and Environment 31, 1250–1262.
Yamasaki T, Yamakawa T, Yamane Y, Koike H, Satoh K, Katoh S (2002) Temperature
acclimation of photosynthesis and related changes in photosystem II electron
transport in winter wheat. Plant Physiol 128: 1087-1097.
Yamori W, Noguchi K, Terashima I (2005) Temperature acclimation of photosynthesis
in spinach leaves: analyses of photosynthetic components and temperature
dependencies of photosynthetic partial reactions. Plant Cell Environ 28: 536–547.
Zhu X-G, Portis AR, Long SP (2004) Would transformation of C3 crop plants with
foreign Rubisco increase productivity? A computational analysis extrapolating from
kinetic properties to canopy photosynthesis. Plant Cell Environ 27: 155–165.
Zhu G, Jensen RG, Bohnert HJ, Wildner GF, Schlitter J (1998) Dependence of catalysis
and CO2/O2 specificity of Rubisco on the carboxy-terminus of the large subunit at
different temperatures. Photosynth Res 57: 71-79.
29
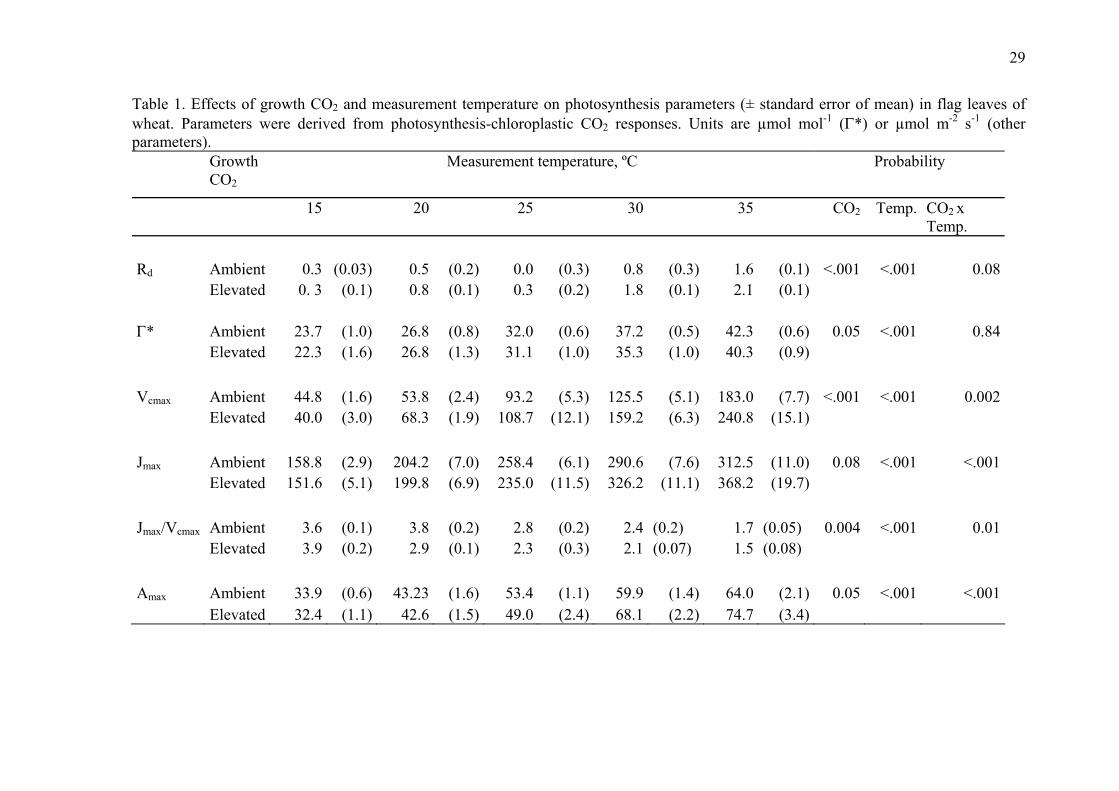
Table 1. Effects of growth CO2 and measurement temperature on photosynthesis parameters (± standard error of mean) in flag leaves of wheat. Parameters were derived from photosynthesis-chloroplastic CO2 responses. Units are µmol mol-1 (Γ*) or µmol m-2 s-1 (other parameters). Growth
CO2 Measurement temperature, ºC
Probability
15 20 25 30 35 CO2 Temp. CO2 x Temp.
Rd Ambient 0.3 (0.03) 0.5 (0.2) 0.0 (0.3) 0.8 (0.3) 1.6 (0.1) <.001 <.001 0.08 Elevated 0. 3 (0.1) 0.8 (0.1) 0.3 (0.2) 1.8 (0.1) 2.1 (0.1) Γ* Ambient 23.7 (1.0) 26.8 (0.8) 32.0 (0.6) 37.2 (0.5) 42.3 (0.6) 0.05 <.001 0.84 Elevated 22.3 (1.6) 26.8 (1.3) 31.1 (1.0) 35.3 (1.0) 40.3 (0.9) Vcmax Ambient 44.8 (1.6) 53.8 (2.4) 93.2 (5.3) 125.5 (5.1) 183.0 (7.7) <.001 <.001 0.002 Elevated 40.0 (3.0) 68.3 (1.9) 108.7 (12.1) 159.2 (6.3) 240.8 (15.1) Jmax Ambient 158.8 (2.9) 204.2 (7.0) 258.4 (6.1) 290.6 (7.6) 312.5 (11.0) 0.08 <.001 <.001 Elevated 151.6 (5.1) 199.8 (6.9) 235.0 (11.5) 326.2 (11.1) 368.2 (19.7) Jmax/Vcmax Ambient 3.6 (0.1) 3.8 (0.2) 2.8 (0.2) 2.4 (0.2) 1.7 (0.05) 0.004 <.001 0.01 Elevated 3.9 (0.2) 2.9 (0.1) 2.3 (0.3) 2.1 (0.07) 1.5 (0.08) Amax Ambient 33.9 (0.6) 43.23 (1.6) 53.4 (1.1) 59.9 (1.4) 64.0 (2.1) 0.05 <.001 <.001 Elevated 32.4 (1.1) 42.6 (1.5) 49.0 (2.4) 68.1 (2.2) 74.7 (3.4)
30
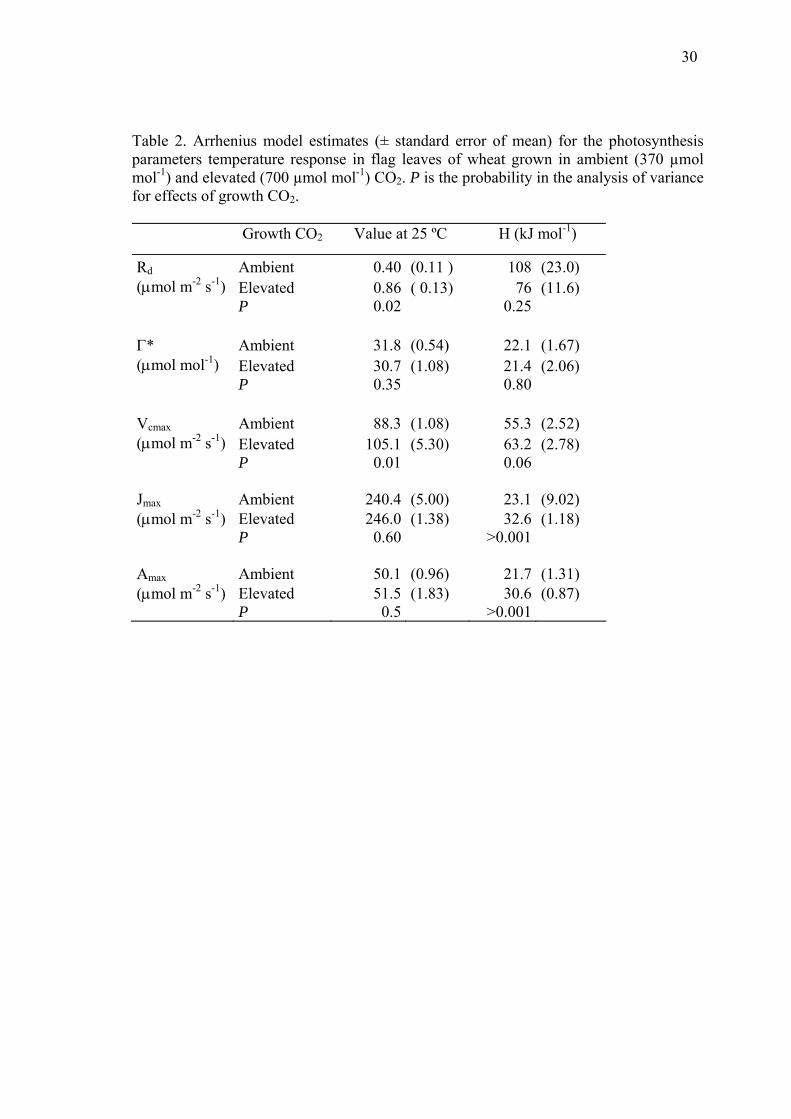
Table 2. Arrhenius model estimates (± standard error of mean) for the photosynthesis parameters temperature response in flag leaves of wheat grown in ambient (370 µmol mol-1) and elevated (700 µmol mol-1) CO2. P is the probability in the analysis of variance for effects of growth CO2.
Growth CO2 Value at 25 ºC H (kJ mol-1)
Rd Ambient 0.40 (0.11 ) 108 (23.0) (µmol m-2 s-1) Elevated 0.86 ( 0.13) 76 (11.6) P 0.02 0.25 Γ* Ambient 31.8 (0.54) 22.1 (1.67) (µmol mol-1) Elevated 30.7 (1.08) 21.4 (2.06) P 0.35 0.80 Vcmax Ambient 88.3 (1.08) 55.3 (2.52) (µmol m-2 s-1) Elevated 105.1 (5.30) 63.2 (2.78) P 0.01 0.06 Jmax Ambient 240.4 (5.00) 23.1 (9.02) (µmol m-2 s-1) Elevated 246.0 (1.38) 32.6 (1.18) P 0.60 >0.001 Amax Ambient 50.1 (0.96) 21.7 (1.31) (µmol m-2 s-1) Elevated 51.5 (1.83) 30.6 (0.87) P 0.5 >0.001

31
Figure legends
Fig. 1. The response of diffusion leak of water vapour (A, B) and CO2 (C) to air CO2
concentration (Ca) in a chamber containing a thermally killed leaf. The dead leaf was
partially wet in (A) and completely dry in (B).
Fig. 2. Photosynthesis chloroplastic CO2 response lines at 1500 (closed symbols) and
200 (open symbols) µmol m-2 s-1 irradiance used for calculations of Γ* and Rd at two
temperatures.
Fig 3. Arrhenius plots (Parameter=Parameter25·exp(H(Tk-298)/R·298·Tk)) for the
photosynthesis parameters determined in flag leaves of wheat grown in ambient (open
symbols and broken lines) and elevated (closed symbols and solid lines) CO2. H is the
activation energy (kJ mol-1) and Parameter25 the parameter value at 25 ºC (shown in
Table 2). The 25 ºC normalized x-axis is (Tk-298)/R·298·Tk, where R is the molar gas
constant and Tk the leaf absolute temperature. The parameters are: (A) respiration in the
light; (B) CO2 compensation point in the absence of dark respiration; (C) maximum
Rubisco-limited rate of carboxylation; (D) maximum rate of photosynthetic electron
transport; (E) light and CO2 saturated photosynthesis rate.
Fig. 4. Measured (symbols), modeled Rubisco-limited (thin lines), and modeled RuBP-
limited (thick lines) photosynthesis- chloroplastic CO2 (Cc) responses at several
temperatures in flag leaves of wheat grown in ambient (open symbols, dotted lines) and
elevated CO2 (closed symbols, solid lines). Insets show the initial parts of the A-Cc
responses. Each point is the mean ± standard error of six replicate leaves.
32
Fig. 5. Measured (symbols) and modeled (lines) photosynthesis temperature responses
at air CO2 concentrations corresponding to Rubisco-limited (90 µmol mol-1 CO2) and
RuBP-limited (700 and 1800 µmol mol-1 CO2) photosynthesis in flag leaves of wheat
grown in ambient (open symbols, broken lines) and elevated (closed symbols, solid
lines) CO2. For modelling, measured Cc values at each CO2 concentration and
temperature were used. Each point is the mean of six replicate leaves.
A
0.0
0.5
1.0
1.5
2.0
2.5
3.0
0 500 1000 1500 2000Ca µmol mol-1
E, m
mol
m-2
s-1
B
0.0
0.2
0.4
0.6
0.8
0 500 1000 1500 2000Ca µmol mol-1
E, m
mol
m-2
s-1
C
-3
-2
-1
0
1
2
0 500 1000 1500 2000Ca µmol mol-1
A, µ
mol
m-2
s-1
-2.0
-1.5
-1.0
-0.5
0.0
0 50 100 150
Fig. 1

35 ºC
-4
-2
0
2
4
6
8
0 20 40 60 80 100
Cc, µmol mol-1A,
µm
ol m
- 2 s
-1
Γ*
Rd
Rd= -1.90Γ*= 42.3
15 ºC
-4
-2
0
2
4
6
8
0 20 40 60 80 100
Cc, µmol mol-1
A, µ
mol
m -
2 s-1
Γ*
Rd
Rd= -0.71Γ*= 22.4
Fig. 2

0.0
0.5
1.0
1.5
2.0
2.5
-0.02 -0.01 0 0.01 0.02
Tk-298/R*298*Tk
Rd
0
10
20
30
40
-0.02 -0.01 0 0.01 0.02
Tk-298/R*298*Tk
Γ∗
0
100
200
-0.02 -0.01 0 0.01 0.02
Tk-298/R*298*Tk
Vcm
ax
0
100
200
300
400
-0.02 -0.01 0 0.01 0.02
Tk-298/R*298*Tk
Jmax
0
20
40
60
80
-0.02 -0.01 0 0.01 0.02
Tk-298/R*298*Tk
Amax
Fig. 3
15 ºC
-5
5
15
25
35
45
0 500 1000 1500
Ci, µmol mol-1
A, µ
mol
m -2
s-1
-5
5
15
25
0 100 200 300
20 ºC
-5
5
15
25
35
45
0 500 1000 1500
Ci, µmol mol-1
A, µ
mol
m -2
s-1
-5
5
15
25
0 100 200 300
25 ºC
-5
5
15
25
35
45
0 500 1000 1500
Ci, µmol mol-1
A, µ
mol
m -2
s-1
-5
5
15
25
0 100 200 300
30 ºC
-5
5
15
25
35
45
0 500 1000 1500
Ci, µmol mol-1
A, µ
mol
m -2
s-1
-5
5
15
25
0 100 200 300
35 ºC
-5
5
15
25
35
45
0 500 1000 1500
Cc, µmol mol-1
A, µ
mol
m -2
s-1
-5
5
15
25
0 100 200 300
Fig. 4

Ca 90 µmol mol -1
0
4
8
12
10 15 20 25 30 35 40
T ºC
A, µ
mol
m -2 s
-1
Ca 700 µmol mol -1
0
10
20
30
40
50
10 15 20 25 30 35 40
Temperature, ºC
A, µ
mol
m -2 s
-1
Ca 1800 µmol mol -1
0
10
20
30
40
50
10 15 20 25 30 35 40
Temperature, ºC
A, µ
mol
m -2 s
-1
Fig. 5