
Respiratory Physiology - Ho Medical: Anaesthesia
47
Dr Matthew Ho BSc(Med) MBBS(Hons) FANZCA Respiratory Physiology Control of Respiration Physiol-06A10/02B10/95B9 List the physiological factors which increase respiratory rate. Include a brief explanation of the mechanism by which each achieves this increase. Respiratory rate is measured in breaths per minute and is usually 12/15 bpm under normal circumstances in the resting adult. It is controlled by the respiratory centre in the medulla. The factors which increase respiratory rate can be classified as follows: 1. Chemical Factors (most important) a. Increased pCO2: i. The single most important factor in causing respiratory rate ii. Minute volume (TV x RR) increases 2L/min for every mmHg rise pCO2 iii. There are 2 sensors: 1. Central chemoreceptors: Located in the ventral surface of the medulla and responsible for 80% of response to CO2. CO2 diffuses into the CSF, where it dissociates to produce H+. The central chemoreceptors respond to reduced pH (the CSF has little buffering capacity for CO2 compared to the blood). The activation of the central chemoreceptors activation of respiratory control centre ↑RR proportional ↓pCO2 2. Peripheral chemoreceptors: located in the adventitia of vessels in the carotid body and the aortic arch. b. Decreased paO2 (hypoxia) i. The sensors are the peripheral chemoreceptors (type 1 glomus cells). ii. They are not as important as pCO2 in the control of ventilation. iii. There is only a significant increase in ventilation when pO2 drops below 60mmHg vagus nerve activation of respiratory control centre iv. There is synergistic effects of hypercapnoea and hypoxia c. Increased H+ (Acidosis) i. The sensors are the peripheral chemoreceptors in the carotid sinus only ii. Acidosis activates carotid sinus vagus stimulation of respiratory control centre. iii. In severe prolonged acidosis, the BBB becomes permeable to H and the central chemoreceptors can also respond to blood acidosis 2. Mechanical factors: a. Exercise (muscle and joint stretch receptors): mechanism of action is not completely understood, but stretch receptors in peripheral muscles and joints are thought to stimulate the respiratory control centre during and before exercise. b. Pathological lung conditions (J receptors): juxta-capillary receptors are located adjacent to alveolar walls and detect engorgement of pulmonary capillaries. They are stimulated in conditions like ARDS, pulmonary oedema vagus activation of respiratory control centre c. Irritant receptors: located in the nose, larynx, trachea, bronchi. Stimulated by noxious gas, smoke vagus respiratory control centre
-
Upload
khangminh22 -
Category
Documents
-
view
0 -
download
0
Transcript of Respiratory Physiology - Ho Medical: Anaesthesia

Dr Matthew Ho BSc(Med) MBBS(Hons) FANZCA
Respiratory Physiology
Control of Respiration
Physiol-06A10/02B10/95B9 List the physiological factors which increase respiratory rate. Include a brief explanation of the mechanism by which each achieves this increase.
Respiratory rate is measured in breaths per minute and is usually 12/15 bpm under normal circumstances in the resting adult. It is controlled by the respiratory centre in the medulla. The factors which increase respiratory rate can be classified as follows: 1. Chemical Factors (most important)
a. Increased pCO2: i. The single most important factor in causing respiratory rate
ii. Minute volume (TV x RR) increases 2L/min for every mmHg rise pCO2 iii. There are 2 sensors:
1. Central chemoreceptors: Located in the ventral surface of the medulla and responsible for 80% of response to CO2. CO2 diffuses into the CSF, where it dissociates to produce H+. The central chemoreceptors respond to reduced pH (the CSF has little buffering capacity for CO2 compared to the blood). The activation of the central chemoreceptors activation of respiratory control centre ↑RR proportional ↓pCO2
2. Peripheral chemoreceptors: located in the adventitia of vessels in the carotid body and the aortic arch.
b. Decreased paO2 (hypoxia)
i. The sensors are the peripheral chemoreceptors (type 1 glomus cells). ii. They are not as important as pCO2 in the control of ventilation.
iii. There is only a significant increase in ventilation when pO2 drops below 60mmHg vagus nerve activation of respiratory control centre
iv. There is synergistic effects of hypercapnoea and hypoxia c. Increased H+ (Acidosis)
i. The sensors are the peripheral chemoreceptors in the carotid sinus only ii. Acidosis activates carotid sinus vagus stimulation of respiratory control
centre. iii. In severe prolonged acidosis, the BBB becomes permeable to H and the central
chemoreceptors can also respond to blood acidosis
2. Mechanical factors: a. Exercise (muscle and joint stretch receptors): mechanism of action is not completely
understood, but stretch receptors in peripheral muscles and joints are thought to stimulate the respiratory control centre during and before exercise.
b. Pathological lung conditions (J receptors): juxta-capillary receptors are located adjacent to alveolar walls and detect engorgement of pulmonary capillaries. They are stimulated in conditions like ARDS, pulmonary oedema vagus activation of respiratory control centre
c. Irritant receptors: located in the nose, larynx, trachea, bronchi. Stimulated by noxious gas, smoke vagus respiratory control centre

Dr Matthew Ho BSc(Med) MBBS(Hons) FANZCA
d. Hypotension (baroreceptors): located in the carotid sinus. Hypotension ↓ stretch of
baroreceptors ↓ firing direct stimulation of respiratory control centre e. Pain and temperature: unknown mechanism. Noxious stimuli ↑ RR
3. Higher centres: a. Voluntary hyperventilation can override the involuntary reflexes described above
4. Patient factors: a. Age: RR increased in infants b. Pregnancy: RR increased during pregnancy

Dr Matthew Ho BSc(Med) MBBS(Hons) FANZCA
Mechanics of Breathing
Physiol-10B12 Describe the function of the muscles involved in ventilation.
1. The muscles of the chest wall and diaphragm are part of the effector system of respiratory
control. They can be divided into muscles required for inspiration and expiration. Muscle Supply Function
INSPIRATION: IP pressure ↓ (more negative) -5 to -7cmH2O ↓ intra-alveolar pressure 0 to -1cmH2O. This provides gradient for the inward movement of air.
Diaphragm Phrenic C3-5 Contraction: accounts for 70% inspiratory chest wall movement Abdominal contents moved down and anterior ↑ vertical dimension of thorax. Rib margins lifted ↑ transverse diameter ↑ Thorax dimensions ↓ pressure Normal breathing – diaphragm moves 1cm, Forceful inspiration 10cm Diaphragmatic paralysis – upward movement with inspiration (paradoxical).
External intercostals
Intercostal n. Connect adjacent ribs, sloping down and out. Contraction: ribs pulled up and outward bucket handle movement ↑ lateral and AP diameter.
Scalene Elevates Ribs 1-2. Laboured breathing only.
SCM Elevates sternum. Laboured breathing only.
Alae Nasi Flares nostrils
Head and neck Minor contribution in laboured breathing.
EXPIRATION: passive during quiet breathing, using potential elastic recoil from inspiratory work. Active during exercise and voluntary hyperventilation.
Abdominal wall Rectus abdominus, internal and external oblique, transverse abdominus: Contraction ↑ intra-abdominal pressure push diaphragm upwards. Non-ventilatory functions: defecation, posture, coughing and vomiting.
Internal intercostals
Connects adjacent ribs, sloping up and in. Contraction: ribs pulled down and in bucket handle movement ↓ lateral and AP diameter
OTHER MUSCLES
Pharynx Infrahyoid: tonic contraction elevation of larynx to prevent airway obstruction.

Dr Matthew Ho BSc(Med) MBBS(Hons) FANZCA
Physiol-08B13 Explain the concept of time constants and relate these to "fast" and "slow" alveoli.
1. Definition: a time constant is defined as the time taken for an exponential process to complete
at its initial rate. Mathematically it is the time taken for the exponential process to reach 63% of its completed phase.
2. Respiration:
a. The filling and emptying of alveoli is an exponential process and hence can be described in terms of time constants.
b. Time constant can be given by:
T = compliance x resistance
3. Fast and Slow alveoli:
a. Fast alveoli: i. Fill and empty quickly
ii. Have low resistance, low compliance and hence a quick time constant iii. Examples:
1. apex alveoli 2. pulmonary fibrosis
b. Slow alveoli: i. Fill and empty slowly
ii. Have high resistance, high compliance and hence a slow time constant iii. Examples:
1. Basal alveoli 2. COPD / asthma
4. Clinical relevance
a. Not really relevant in healthy lungs b. In diseases lungs (COPD, asthma), many alveoli are slow (long time constants). c. Slow alveoli may not complete their filling in the normal inspiration or their emptying at
normal expiration. Hence, in lungs with slow alveoli, the gas will redistribute from fast slow alveoli at the end of inspiration. This is exacerbated by tachypnoea. When RR is increased, a smaller proportion of alveoli participate in complete gas exchange ↓Ventilation (low V/W ratio for slow alveoli) ↓ compliance of lung
5. Clinical measurement
a. Best displayed on capnography b. At end expiration, slow alveoli have not completely emptied and at CO2 diffusion
continues to occur causing plateau phase III, and upstroke phase IV of the capnograph

Dr Matthew Ho BSc(Med) MBBS(Hons) FANZCA
Physiol-06B10/01B2/00A5/91 Describe the determinants of work of breathing in an adult human at rest. Explain how to minimise work of breathing.
1. Definition: work of breathing is defined as the product of pressure and volume changes. It is
measured in cm H20.mL or Joules. The work is carried out by the:
a. Diaphragm – contracts to ↑ vertical volume of thorax b. Ext. intercostals – contracts to ↑ lateral volume of thorax (bucket handle) c. ↑ thorax volume ↓ IP pressure gradient for air movement into lungs d. O2 consumption by muscles is 3mL/min (Resting)
𝐄𝐟𝐟𝐢𝐜𝐢𝐞𝐧𝐜𝐲 = 𝐔𝐬𝐞𝐟𝐮𝐥 𝐰𝐨𝐫𝐤
𝐎𝟐 𝐂𝐨𝐬𝐭=
𝟑𝟎𝟎𝐦𝐉/𝐛𝐫𝐞𝐚𝐭𝐡
𝟑𝟎𝟎𝟎𝐦𝐉/𝐛𝐫𝐞𝐚𝐭𝐡
Efficiency WOB = useful work / O2 cost
o 5-10% at rest (most lost as heat)
2. There are 2 types of work:
a. Elastic work (50%) – work to stretch elastic tissues, represented by triangle above the ∆P.∆V diagonal.
i. Lung tissue elastic work (50%) ii. Surface tension of alveoli (50%)
iii. Elastic work is performed during inspiration and stored as potential energy which allows expiration to occur passively (releasing energy as fibres are relaxed to original length). The remainder of energy (green) is dissipated as heat.
b. Resistance work (50%) – work to overcome tissue resistance: i. Airway resistance (80%)
1. Inspiration red area (bottom bulge) in graph 2. Expiration green area (upper bulge) in graph
ii. Viscous tissue resistance (20%)
3. Factors affecting (minimising) the work of breathing: a. Elastic factors:
i. Surfactant – reduces surface tension with the property of hysteresis b. Resistance factors: Pouiselle’s law, Reynolds’s number
i. Airway resistance is decreases in laminar flow, thus work of breathing is minimised with controlled breathing at low flows
ii. Lung volumes: breathing at FRC it advantageous as it is on the steepest part of the pressure/volume curve for maximum compliance
c. COPD: airway resistance is increased in this disease. Work is minimised by breathing
slowly at large volumes: i. High lung volumes reduce airway resistance (radial traction of airways
increase diameter) ii. Low RR helps with laminar flow
d. Restrictive lung disease (fibrosis): elastic work is increased: i. Breathing shallow more frequent breaths decreases elastic work
e. Optimising RR: i. ↑ RR ↑ flow ↑ fraction

Dr Matthew Ho BSc(Med) MBBS(Hons) FANZCA
ii. Delicate balance between minimising RR vs. controlling tidal volume so that
work occurs on the optimal part of the pressure vs. volume curve.

Dr Matthew Ho BSc(Med) MBBS(Hons) FANZCA
Physiol-03B13/99B3/98B8 Describe the factors that affect airways resistance.
1. Definition: airway resistance is created by the frictional resistance to air movement in the
airways of the respiratory system. It is governed by Ohm’s Law:
𝐀𝐖𝐑 = 𝐏𝐫𝐞𝐬𝐬𝐮𝐫𝐞𝐦𝐨𝐮𝐭𝐡 − 𝐏𝐫𝐞𝐬𝐬𝐮𝐫𝐞𝐚𝐥𝐯𝐞𝐨𝐥𝐢
𝐐
P = driving pressure gradient from mouth alveolar pressure Q = velocity of air (Lsec-1) Normal value = 2cmH20/L/sec
There are several major factors which influence airway resistance: 2. Type of air flow: laminar vs. turbulent
a. Reynold number predicts the type of air flow: Re = 2rvd / n Re > 2000 turbulent flow likely Re < 2000 laminar flow likely Therefore, turbulent flow occurs in larger radius airways, with fast air flow and high density gas. For example, turbulence occurs in the nose, pharynx and trachea especially during exercise (↑ RR ↑flow)
b. Laminar Flow: air flow occurs in concentric tubes parallel to walls of the airway. resistance governed by Pouiselle-Hagman formula
i. R = 8nL / ∏r4 ii. V = P x ∏r4/8nL
iii. Laminar flow is associated with lower resistance and occurs in the smaller airways of the lung (bronchioles). Here, it can be seen that resistance is proportional to viscosity of the gas, and tube length.
iv. In laminar flow, P = kV, so velocity of air is proportional to resistance c. Turbulent flow: airflow is disrupted, and eddies form which increases airway resistance.
This occurs in larger airways and during increased RR) i. P = kV2 so that high flows increase resistance to ma much greater extent
ii. Resistance is influenced by density rather than viscosity of gas
3. Radius of airways: is important in both laminar and turbulent flow. a. Especially in laminar flow, doubling radius decrease resistance by 16 fold b. Factors which reduce airway calibre (↓ radius) ↑ resistance
i. Drugs – muscurinics and adrenergic antagonists ii. Bronchomotor tone (SNS vs. PNS)
iii. Airway oedema iv. Bronchial secretions v. Dynamic compression of airways during forced expiration
vi. External obstruction
4. Anatomic site a. Maximal resistance occurs in medium sized airways b. Resistance is low in small airways because air flow is in series and velocity is very small
(very large cross sectional area) 5. Lung volume
a. Tends to decrease with increasing volume b. Due to high lung volumes increasing airway diameter via radial traction

Dr Matthew Ho BSc(Med) MBBS(Hons) FANZCA
EXTRA NOTES: 6. Measurement of airways resistance:
a. Constant volume body plethysmograph i. Principle:
1. Flows measured with patient breathing through pneumotachograph into the plethysmograph box ∆box P
2. Box pressure calibrated with alveolar pressure allows mouth-to-alveolar pressure gradient to be known for any flow rate.

Dr Matthew Ho BSc(Med) MBBS(Hons) FANZCA
Physiol-10B9/10A14/03A14/90 Describe the factors that affect respiratory system compliance.
1. Definition: compliance is defined as the change in volume per unit change in pressure.
𝐂𝐨𝐦𝐩𝐥𝐢𝐚𝐧𝐜𝐞 = ∆𝐕
∆𝐏
Usual value is 100mLs/cm H20 at rest in the normal human 2. Types
a. Lung compliance vs. chest wall compliance 𝟏
𝐓𝐨𝐭𝐚𝐥 𝐂𝐨𝐦𝐩𝐥𝐢𝐚𝐧𝐜𝐞=
𝟏
𝐥𝐮𝐧𝐠+
𝟏
𝐜𝐡𝐞𝐬𝐭 𝐰𝐚𝐥𝐥
i. Lung compliance: elastic recoil of pulmonary connective tissue and surface
tension
𝑻𝑷𝑷 (𝒓𝒆𝒄𝒐𝒊𝒍 𝒑𝒓𝒆𝒔𝒔𝒖𝒓𝒆) = 𝑨𝒍𝒗𝒆𝒐𝒍𝒂𝒓 𝑷 − 𝑰𝒏𝒕𝒓𝒂𝒑𝒍𝒆𝒖𝒓𝒂𝒍 𝑷
1. 200mL/cm H20 2. Decreases at higher values
ii. Chest wall compliance – 200mL/cm H20 b. Static vs. Dynamic: similar in normal individuals, but differ in airways disease.
i. Static compliance: measured at conditions of no airflow. It is measured by plotting various lung pressures at different lung volumes in a subject holding breath at these volumes.
ii. Dynamic compliance: measures compliance during quiet breathing using a spirometer.
1. Normal lungs: alveoli reach equilibrium pressure with mouth pressure at end inspiration similar values to static compliance
2. Airway obstruction: a proportion of ‘slow alveoli’ have incomplete equilibration of alveolar filling (volume change). Flow still occurs at end inspiration and pressure has not reached equilibrium with mouth, but airflow and volume change is measured at zero. Hence dynamic compliance is always less than static compliance. Discrepancy ↑ with ↑ frequency breathing.
c. Specific Compliance = static compliance / FRC
𝐒𝐩𝐞𝐜𝐢𝐟𝐢𝐜 𝐜𝐨𝐦𝐩𝐥𝐢𝐚𝐧𝐜𝐞 = 𝐒𝐭𝐚𝐭𝐢𝐜 𝐜𝐨𝐦𝐩𝐥𝐢𝐚𝐧𝐜𝐞
𝐅𝐑𝐂
i. Normal value = 0.05cmH20-1
3. Factors which influence compliance a. Physiological:
i. Surfactant: a substance produced by type II alveolar cells, composed mainly of phospholipid (dipalmitol phosphatidyl choline DPPC), other lipids, proteins and carbohydrates. Its amphipathic structure allows it to reduce surface tension in the alveoli. A reduction in tension ↑ compliance
ii. Lung volume: at FRC, compliance is maximal and tends to decrease at higher lung volumes.
iii. Lung size:

Dr Matthew Ho BSc(Med) MBBS(Hons) FANZCA
1. ↑ size ↑ compliance 2. Compliance reduced in small children 3. Corrected by specific compliance
iv. Pregnancy: ↑ intra-abdominal pressure ↓ compliance v. Gravity:
1. Apex: higher position on pressure/volume curve, alveoli already partially stretched, so ↓ compliance
2. Base: less IP pressure required to inflate lung, ↑ compliance 3. Supine:
b. Pathological
i. COPD: loss of elastic tissue ↑ compliance ii. Asthma: increase lung volumes ↓ compliance
iii. Restrictive lung disease: fibrotic tissue ↓ compliance iv. Alveolar oedema ↓ compliance
EXTRA: 4. Measuring compliance:
a. Components: i. oesophageal balloon – approximates IPP
ii. spirometer / plethysmograph

Dr Matthew Ho BSc(Med) MBBS(Hons) FANZCA
1991 Short notes on measurement of lung compliance and transpulmonary pressure.
1. Static compliance - measurement of V/ P with NO FLOW OF GAS a. Method: curve obtained by having the subject inspiring and expiring in a series of steps
at a given volume (with a spirometer) and measuring the intrapleural pressure (from oesophageal pressure). At each step, the subject holds a given lung volume while keeping glottis open, thus airway pressure = atmospheric pressure
b. Lung curve i. Y – axis = volume – fixed points like RV, FRC, TLC obtainable in cooperative
patient. Expressed as absolute values above RV or as % of VC ii. X-axis = pressure gradient across the lung
Transpulmonary pressure/recoil pressure of the lung = alveolar pressure – intrapleural pressure Since alveolar pressure = atmospheric pressure as glottis is open = 0 Transpulmonary pressure = 0 – (intrapleural pressure) positive, as the lung tries to recoil inwards
c. Chest Wall Curve i. Y – axis = volume as above
ii. X-axis = recoil pressure of the chest = pressure inside – pressure outside chest wall
▪ = intrapleural pressure – atmospheric pressure ▪ measured by complete relaxation of the chest ▪ mm and lung volume held constant by closing the glottis ▪ -ve values up to volume of 75% of TLC (i.e. tends to spring out)
FRC the recoil of the chest wall = recoil of lung = equilibrium Relaxation pressure of the lung and chest wall is the sum of the pressures for lung and chest wall measured separately
2. Dynamic compliance – measurement of V/P during NORMAL BREATHING a. Rate dependent – increase RR, decrease compliance b. Normally less than static compliance due to
i. Viscoelastic tissue resistance ii. Redistribution of gas from fast to slow alveoli
iii. Stress-relaxation iv. Displacement of pulmonary blood
3. Specific compliance: allows measurement of intrinsic elastic properties of a lung.
Specific compliance = compliance/FRC a. typical value = 0.05/cmH2O b. corrects for different lung sizes c. adult and neonate specific compliance are equal

Dr Matthew Ho BSc(Med) MBBS(Hons) FANZCA
Pulmonary Gas Volumes and Ventilation
Physiol-05B16 Explain the changes on Functional Residual Capacity (FRC) that take place with the administration of anaesthesia.
1. Definition: FRC is the volume of the lung after normal expiration.
FRC = RV + ERV
a. 2200mL in normal adults or 30mL/kg b. Also defined as the volume at which the tendency for the chest wall to spring out, is
balanced by the tendency of the lung to collapse. 2. Changes that occur during anaesthesia
a. Generally at least 15-20% ↓ FRC b. This occurs within minutes of induction and plateaus to a stable value throughout the
duration of anaesthesia. It can drop slowly over time c. May persist for several hours after waking d. Weak correlation with age e. Individual variation f. Depends on variables such as: co-morbidities, age, type of operation, length of
operation, type of anaesthetic agent used… 3. Mechanisms for changes:
a. Posture: i. Supine ↓ FRC by 0.5L (20%) due to:
1. Abdominal contents pushing diaphragm cephalad 2. AP compression of ribs due to gravity 3. Thoracic pooling of blood ↑ pulmonary blood flow
recruitment/distension ↓ lung compliance 4. Effect exacerbated by obesity, pregnancy
ii. Prone has least effect on FRC if patient positioned correctly with bollards against the chest/pelvis, free abdomen
iii. Head down - ↓ FRC iv. Head up - ↑ FRC
b. Muscle tone: the tone of the diaphragm tends to pull it downwards, away from the lung, and helps expand the lung to maintain FRC.
i. Reduced tone ↓ FRC: muscle relaxants have greater effect c. Ventilation:
i. Mechanical ventilation: 1. ↑ FRC if inadequate alveolar emptying gas trapping 2. ↓ FRC if ventilating at low lung volumes near RV low lung compliance
and airway closure with atelectasis ii. PEEP: ↑ lung volumes ↑ compliance ↑FRC
iii. O2: ongoing O2 for extended periods (> 4 hours) denitrogenation of alveoli absorption atelectasis ↓FRC
4. Factors to consider:
a. Age: weak correlation with degree of FRC change b. Co-morbidities: can exaggerate effect by reducing compliance

Dr Matthew Ho BSc(Med) MBBS(Hons) FANZCA
i. Chest wall compliance – scoliosis, ank spond
ii. Lung compliance – restrictive airways disease c. Surgery type: abdominal surgery decreases FRC more due to pressure on diaphragm d. Anaesthesia type: muscle relaxants produce more change in FRC e. Surgery length: ↑ tendency for atelectasis and O2 atelectasis to occur

Dr Matthew Ho BSc(Med) MBBS(Hons) FANZCA
Physiol-97B7 Explain the factors influencing the distribution of ventilation during the inhalation of 500ml of air from Functional Residual Capacity in the erect posture.
1. Definition:
a. FRC is the volume of the lung at which the tendency of the chest wall to spring out = tendency of lung to collapse. Usually 2200mL normal adult or 30mL/kg.
b. Tidal volume is the volume of air inspired during a normal breath. Usually 500mL or 7mL/kg
c. Ventilation during normal tidal volumes varies in different parts of the lung. 2. Factors influencing variation:
a. Gravity: the lung is influenced by the effects of gravity such that the characteristics of the alveoli in the base and apex differ markedly.
i. Apex – alveoli are under traction from the interstitium which keeps them open.
1. Large, more air filled 2. IP pressure = -10cm H2O 3. Expands on the flatter part of the compliance curve with minimal air
filling ii. Base – alveoli are compressed under the weight of the lung
1. Smaller, less air filled 2. IPP = -2.5cm H20 3. Expands on the steep favourable part of the compliance curve with good
air filling iii. Ventilation is significantly greater at the base. While the expanding pressures of
around 3cm H20 are the same at the apex and base, there is greater air filling of the base due to its greater compliance. Hence Vb > Va
b. Time constants: measures the time taken to fill an alveoli (to 63% of capacity). It can be measured by T = C x R. The variation in filling rate is characterised by the presence of:
i. Fast alveoli – eg at apex which fill quickly during normal ventilation ii. Slow alveoli – eg. At base, in COPD, which fill slowly and may not fill adequately
when filling time is reduced (↑ RR). Hence ventilation is reduced. c. Lung size: right lung is greater than left, hence ↑ compliance ventilates 53% vs. 47%

Dr Matthew Ho BSc(Med) MBBS(Hons) FANZCA
Physiol-03B11/96B7/95 Briefly describe the potential causes of a difference between measured end-tidal and arterial partial pressure of carbon dioxide.
1. Introduction:
a. End tidal CO2 is measured in expired gas at the mouth by capnograph (infrared absorption spectrophotometry) and displayed on a capnograph.
b. Arterial CO2 is measured by a CO2 sensitive (Severinghaus) electrode which measures pH after CO2 reacts with water.
c. It is normally assumed that ETCO2 = PACO2 = PaCO2 which is approximately the case in correctly measured healthy individuals.
d. Normal value PaCO2 = 38.3 +/- 7.5mmHg with measured ETCO2 usually 4-6mmHg lower. Usually, ETCO2 < PACO2 < PaCO2.
e. ETCO2 is different from mixed expired which is much lower due to dilution from anatomical dead space.
2. ETCO2 < PACO2. This is due to:
a. Patient factors: i. Alveolar dead space – ventilated alveoli which do not participate in gas
exchange (not perfused) and hence do NOT contain CO2. This space is small/none in normal lungs but occurs in West zone 1 lungs (positive pressure ventilation, COPD, PE). Mixing of this CO2-free gas with better perfused units dilutes CO2 and lowers ETCO2. In healthy individuals this may account for lower ETCO2 by 4-6mmHg.
ii. Phase III capnography – the presence of slow alveoli (COPD) with delayed emptying causes a slow rise in expired Co2 can failure to reach plateau.
b. Sampling factors: i. Machine –
1. Leaks, Occlusions in sampling lines 2. Water entrapment 3. Collision broadening – interference from other gases (N20) which
artificially raises ETCO2. ii. Sampling site
1. Error increased by length of line and distance from trachea 2. Pa CO2 - venous gas sample increases pCO2 by 5mmHg
3. PACO2 < PaCO2. This is due to:
a. Patient factors: i. V/Q mismatch where blood flowing through poorly ventilated alveoli ↑PaCO2.

Dr Matthew Ho BSc(Med) MBBS(Hons) FANZCA
Physiol-00B3/98A2/96B6 Draw an expiratory flow volume curve for a forced expiration from total lung capacity and FRC. Describe its characteristics in people with normal lungs, as well as those with obstructive and restrictive lung disease.
Flow volume curves are measured by closed circuit pneumotachograph with volume (L) on x-axis, and flow (L/sec) y axis. It requires a compliant subject taking a maximal inspiration to TLC (80mL/kg), and then a forced maximal expiration to RV (20mL/kg). 1. Components of graph:
a. Effort dependent flow (high lung volumes).
Flow = (PA – P mouth) / AWR
i. Flow at the start of expiration is high and effort dependent because:
1. ↑PA due to high lung volumes 2. At TLC, maximal energy stored as potential elastic energy
b. Effort independent flow (flow limitation) i. Downslope of flow curve at middle/low lung volumes until it reaches a plateau
of 0 when airways close at RV (20mL/kg). ii. Due to dynamic compression of airways. There is a gradient of airway pressure
from the alveolus (maximal) to the mouth (zero) which facilitates flow. During expiration, there is an ↑ IP pressure which compresses the alveolus and airways. As pressure drops along the airways, there is an “equal pressure point” where IP = Pairway. Beyond this point, compression of the airway occurs and resistance is ↑ causing flow limitation. This is particularly marked for airways distal to G11, which have no structure rigidity.
iii. Flow is described by the Starling resistor mechanism:
𝐅𝐥𝐨𝐰 = 𝐏𝐀 − 𝐈𝐏𝐏
𝐀𝐖𝐑
3. Different graphs
c. FRC – forced expiration from 30mL/kg. i. The upslope is less steep due to:
1. ↓ Pa (↓ lung volume) 2. ↓ compliance – FRC is on less favourable part of the curve 3. ↑AWR (less radial traction)
ii. The downslope is the same due to dynamic airway compression effects at the same volumes.
d. Obstructive lung disease i. Volumes: TLC increased (gas trapping and mechanism to ↓AWR)
ii. Upslope and peak flow decreased: due to ↑ airway resistance iii. Downslope decreased due to ↓ calibre of airways and onset of dynamic airway
compliance at higher volumes (↑IPP needed for expiration). iv. RV increased due to gas trapping
e. Restrictive lung disease i. Volumes: TLC decreased due to ↓ compliance
ii. Upslope similar, peak flow decreased due to less volume

Dr Matthew Ho BSc(Med) MBBS(Hons) FANZCA
iii. Downslope steeper/similar due to more rigid airways and traction of fibrotic
interstitium opposing dynamic compression iv. RV decreased due to fibrotic tissue resulting in smaller closing capacity.

Dr Matthew Ho BSc(Med) MBBS(Hons) FANZCA
1990 Write short notes on physiological dead space
1. Dead Space = space in the lungs occupied by atmospheric gas that has not exchanged with blood
in the pulmonary vessels (wasted ventilation).
2. Physiological dead space is part of the tidal volume which does not participate in gas exchange. Physiological dead space = anatomical dead space + alveolar dead space (space beyond the conducting airways which does not participate in gas exchange – usually less than 5ml)
a. Healthy adults, the anatomical and physiological dead space are similar. Alveolar dead space is increased by lack of effective perfusion of space to which gas is distributed at alveolar level (i.e. if gas is not distributed as in pleural effusion, pneumothorax, and CCF there is NO increase in alveolar Dead space)
i. hypotension – with head up tilt and raised airway pressures ii. artificial ventilation in the lateral position (preferentially to upper lung)
iii. pulmonary embolism – proportional to pulmonary circ occluded – arterial/end/tidal PCO2 gradient increased
iv. destruction of local vasculature v. kinking, clamping or blocking of pulmonary artery during thoracic surgery
b. VD/VT increases in: i. smokers
ii. upright posture iii. increased age iv. body height v. pulmonary hypoperfusion
c. Anaesthesia, whether spontaneous breathing or ventilation VD/VT = 0.3 – 0.35 d. ↑ physiological dead space can be counteracted by an increase in minute volume
3. Measurement: by Bohr’s Equation
a. Principle: all the expired CO2 comes from alveolar gas – thus dead space is that part of tidal ventilation that does not eliminate CO2
VT x FECO2 = VD x FICO2 + VAx FACO2 Since FICO2 = 0 (as nil CO2 is produced by the dead space)
VT. FECO2 = VA. FACO2 Since VT = VD + VA, then VA = VT – VD
VT. FECO2 = (VT-VD) FACO2 Rearranging gives,
VD/ VT = (FACO2– FECO2) / FACO2
Partial pressure of a gas is proportional to its concentration, thus the Bohr Equation becomes:
VD/ VT = (PACO2– PECO2) / PACO2

Dr Matthew Ho BSc(Med) MBBS(Hons) FANZCA
Ventilation Perfusion Inequalities
Physiol-07A9/02A3/95B1 Define 'Venous Admixture'. Briefly explain how venous admixture influences arterial 02 tension and how an increase in inspired 02 concentration may affect this.
1. Venous admixture – the theoretical amount of mixed venous blood that would have to be added
to pulmonary end capillary blood to account for the observed drop in PaO2 compared with end capillary PO2. It is a theoretical value which describes the shunts and V/Q mismatch effects quantitatively. E.g. End capillary PO2 = 100mmHg, PaO2 = 97mmHg
2. Sources of venous admixture:
a. Shunt: blood which is added to the arterial circulation without passing through ventilated alveoli.
i. Physiological – bronchial venous blood, thebesian veins draining to left heart ii. Pathological – VSD, bronchial obstruction, atelectasis
b. V/Q mismatch: blood passing through alveoli with V/Q < 1, so under ventilated and relative hypoxia
i. Physiological – base of lung ii. Pathological – COPD, pneumonia
3. Measuring effect on arterial O2 – the shunt equation
𝐐𝐬
𝐐𝐭=
𝐂𝐜𝐎𝟐 − 𝐂𝐚𝐎𝟐
𝐂𝐜𝐎𝟐 − 𝐂𝐯𝐎𝟐
CaO2 (ABG), CcO2 (=PAO2), CvO2 (pulmonary artery) a. Usually 2-3% b. Venous admixture decreases PaO2 and increases PaCO2, increase A-a gradient. In
normal circumstances, the ↑pCO2 stimulates ↑ ventilation which corrects CO2, but this does not correct O2. This is because of the O2Hb dissociation curve which is flat in the upper portions of the curve.
4. Increasing inspired O2 concentration
a. The effect depends on the proportion of venous admixture produced by shunting vs. V/Q mismatch. Unfortunately this is hard to measure.
b. Increasing FiO2 has a significant effect in correcting effect of venous admixture produced by V/Q mismatch.
c. Increasing FiO2 has a much less significant effect in correcting effect of venous admixture produced by true shunt (isoshunt diagram). This is due to the increased amount of dissolved O2 in blood, and the (small) increase in Hb saturation in the flat portion of the curve.
• 10% shunt requires FiO2 30% restore PaO2
• 20% shunt requires FiO2 57% restore PaO2
• 30% shunt requires FiO2 97% restore PaO2
• Beyond 30%, correction not really possible.

Dr Matthew Ho BSc(Med) MBBS(Hons) FANZCA
Physiol-97A7 Compare the effect on arterial blood C02 and 02 levels of ventilation/perfusion inequalities
1. Ventilation/perfusion inequality: the upright lung has regional differences in ventilation and
perfusion due to the effect of gravity on hydrostatic pressure in pulmonary vessels, and compression of alveoli.
V Q V/Q PAO2 PACO2
Apex 0.24 0.07 3.3 132 28
Base 0.82 1.29 0.67 89 42
The overall effect is that the V/Q segments mirror each other and the overall V/Q of the lung is near 1. However, the regional differences in V/Q do effect the O2.
2. Effect on PaO2: V/Q mismatch causes a drop in PaO2 compared to PAO2 (A-a gradient) for two
reasons.
a. More blood combines from the poorly ventilated, well perfused base which has ↓PO2. b. The shape of the O2 dissociation curve. The apical segments lie on the flat slope of the
curve such that high PAO2 do not significantly increase the O2 content of blood (Hb nearly all saturated). The basal segments lie on the steep slope of the curve such that there is a significant reduction in Hb binding due to ↓pO2. So the high PAO2 of the apices cannot compensate for the lower PAO2 at the base.
c. There is also little compensation for this hypoxia produces, as chemoreceptors only activate significantly when O2 < 60mmHg.
3. Effect on PaCO2: V/Q mismatch has no significant effect on PaCO2
a. The CO2 dissociation curve is linear compared to the O2. Thus, the apex, with low PACO2, is better able to compensate for the base which has high PACO2.
b. The chemoreceptors also sense any immediate ↑PaCO2 arising from V/Q mismatch and quickly ↑ ventilation to almost immediately normalise PaCO2. Due to the linear curve, ↑ ventilation produces proportional ↓ PaCO2.
4. Increasing FiO2 will correct hypoxia produced by shunt as this ↑PAO2 at the underventilated
bases. This does not work for hypoxia produced by shunting.

Dr Matthew Ho BSc(Med) MBBS(Hons) FANZCA
Gas transport in the Blood
Physiol-00A2 Briefly describe the factors that influence the partial pressure of oxygen in mixed venous blood.
1. Mixed venous blood is sampled from a pulmonary artery catheter and consists of venous blood
from the:
• IVC (Sa O2 = 77%, kidney high flow, low extraction)
• SVC (Sa O2 = 71%
• Coronary sinus (p O2 = 20mmHg, high O2extraction)
2. Normal values:
• pO2 = 40mmHg, sats = 75%
• pCO2 = 45mmHg
3. Factors determining O2 concentration can be summarised by the Fick equation:
VO2 = Q(CaO2 – CvO2)
𝐂𝐕𝐎𝟐 = 𝐂𝐚𝐎𝟐 − 𝐕𝐎𝟐
𝐐
CvO2 = partial pressure O2 mixed venous blood CaO2 = partial pressure O2 arterial blood Q = cardiac output VO2 = O2 extraction
a. CaO2 – positive correlation. As arterial O2 content rises, so does mixed venous O2
content. Factors which tend to do this are: a. ↑ Fi O2 – e.g. breathing 100% O2 b. A-a gradient – shunts and V/Q mismatch will ↓Pa O2 c. Diffusion limitation – will ↓Pa O2 At normal levels, this is not a huge factor in changing CaO2 due to the flat portion of the O2-Hb dissociation curve.
b. Q – a decrease cardiac output will ↓CvO2 as O2 extraction in tissues will increase c. VO2 – factors which increase metabolic rate will ↑ O2 extraction in tissues. This includes:
a. Exercise b. Disease states
4. Relationship between CvO2 and PvO2:
a. This is determined by the Hb O2 dissociation curve. In mixed venous blood, there is an ↑pCO2 and 2,3 DPG and ↓pH which shifts the curve to the right. This has the effect of increasing pO2 for any given CvO2.
b. Additionally, a reduced Hb will ↓ concentration O2 but not saturation.

Dr Matthew Ho BSc(Med) MBBS(Hons) FANZCA
Physiol-10A09/96A1 List the normal values for mixed venous blood gases and explain the physiological factors that may lead to a decrease in mixed venous blood oxygen saturation.
The question is the same as above, except it is asked for the SvO2. Similar structure except, adding: 1. Factors determining O2 concentration can be summarised by the Fick equation:
VO2 = Q(CaO2 – CvO2)
𝐂𝐕𝐎𝟐 = 𝐂𝐚𝐎𝟐 − 𝐕𝐎𝟐
𝐐
Also, flux equation CvO2 = (SvO2 x Hb x 1.34) + dissolved O2 (ignore, small) CaO2 = (SaO2 x Hb x 1.34)
𝐒𝐕𝐎𝟐 = 𝐒𝐚𝐎𝟐 − 𝐕𝐎𝟐
𝐐 𝐱 𝐇𝐛 𝐱 𝟏. 𝟑𝟒
a. CaO2 – positive correlation. As arterial O2 content rises, so does mixed venous O2
content. Factors which tend to do this are: a. ↑ FiO2 – e.g. breathing 100% O2 b. A-a gradient – shunts and V/Q mismatch will ↓PaO2 c. Diffusion limitation – will ↓PaO2 At normal levels, this is not a huge factor in changing CaO2 due to the flat portion of the O2-Hb dissociation curve.
b. Q – a decrease cardiac output will ↓CvO2 as O2 extraction in tissues will increase c. VO2 – factors which increase metabolic rate will ↑O2 extraction in tissues. This includes:
a. Exercise b. Disease states
d. Hb – if ↓ Hb (anaemia), there will be ↓SvO2

Dr Matthew Ho BSc(Med) MBBS(Hons) FANZCA
Physiol-07B10/1993 Discuss factors which affect the partial pressure of carbon dioxide in mixed venous blood.
1. Mixed venous blood is sampled by a pulmonary artery catheter and consists of:
a. IVC b. SVC c. Coronary sinus blood
2. Normal values are:
a. PCO2 = 46mmHg b. CCO2 = 52mL/dL (assuming SvO2 = 75%), 50mL/dL (assuming SvO2 = 97%)
3. Factors determining CO2 in mixed venous blood are the arterial CO2 content, and the production
of CO2 in metabolic tissues. This can be described by FICKs equation –
VO2 = Q(CaO2 – CvO2)
𝐂𝐕𝐎𝟐 = 𝐂𝐚𝐎𝟐 − 𝐕𝐎𝟐
𝐐
a. Arterial Content (CaCO2): mainly determined by alveolar ventilation. i. There is an inverse relationship with alveolar ventilation described by:
FiCO2 = VCO2 / VA ii. Usually PaCO2 is tightly controlled by chemoreceptors in the range 40 +/- 3
mmHg. b. Rate of production: CO2 is produced by oxidative phosphorylation
i. ↑ production in high metabolic states – fever, exercise, neoplasm ii. Production depends on metabolic substrate described by respiratory
quotient (CO2 production / O2 consumption) 1. CHO 1.0 2. Fat 0.7 3. Protein 0.81
c. Cardiac output - ↑CO causes ↓CVO2
4. Relationship between CO2 content and CO2 tension determined by CO2 transport in MV blood. a. CO2 is transported in 3 ways: bicarbonate (90%), carbamino compounds (5%) and
dissolved (5%). b. The CO2 dissociation curve expresses the relationship between CO2 content and
pCO2. c. It shifts left (and up) in venous blood due to ↓O2 – called the Haldane effect. This is
due to: i. ↑ ability of deoxy-Hb to form carbamino compounds with CO2 (70%)
ii. ↑ ability of deoxy-Hb to buffer H+ produced from CO2 + H2O HCO3 + H+ The Haldane effect accounts for 50% of increased CO2 tension in venous blood.

Dr Matthew Ho BSc(Med) MBBS(Hons) FANZCA
Physiol-05A12 Describe the physiological factors influencing the carbon dioxide tension in arterial blood.
1. CO2 tension can be measured directly from an arterial blood sample and is usually 40mmHg in
the normal adult. 2. Factors determining arterial CO2 content: this is determined by a balance of CO2 production in
metabolic tissue, and CO2 elimination in the lung.
CO2 arterial = CO2 production – CO2 elimination
a. CO2 production – occurs via oxidative phosphorylation in the mitochondria of tissues.
This involves the utilisation of energy substrates (carbohydrates, fat, protein) reduced substrates NADH, FADH2 donate electrons to reacts with O2 ATP + energy. CO2 production can be increased in:
a. Hypermetabolic states – exercise, fever, cancer, thyroid disease b. Alteration of substrates – different substrates produce different amounts of
CO2/O2 (respiratory quotient): ↓RQ ↑CO2 production i. Carbohydrate = 1
ii. Fat = 0.7 iii. Protein = 0.8 iv. Overall body = 0.8
b. CO2 elimination – occurs in the lungs as CO2 dissolved in mixed venous blood diffuses into the alveoli down its concentration gradient. ↑ elimination ↓PaCO2
a. ↑ Ventilation proportional ↓PaCO2: pCO2/760 = VCO2/VA b. V/Q mismatch and diffusion limitation can theoretically inhibit CO2
elimination but this does not occur due to fast diffusion coefficient of CO2, and compensation mechanism.
3. Relationship between CO2 content and pCO2 arterial blood - the way in which CO2 is transported
in blood affects relationship between pCO2 and Cco2. This can be described using the CO2 dissociation curve. This is linear is shape and shifts to the right (Haldane effect) in arterial blood (high O2) because:
a. oxygenated Hb has less capacity for carry CO2 in carbamino compounds b. oxygenated Hb has less buffering capacity of bicarbonate.
4. Ventilatory control of CO2 – this is important in the determination of CO2 tension as normal
mechanisms keep PaCO2 in the range 40 +/- 3mmHg. This is done by 2 main mechanisms: a. Central chemoreceptors – in the ventral medulla respond to ↑pCO2 ↑H+ in CSF
↑ ventilation to ↓PaCO2. Accounts for 80% of CO2 control. b. Peripheral chemoreceptors – in the carotid bodies and aortic bodies have a similar
but less important effect. c. Blunting of these mechanisms by opioids, inhalational anaesthetics will result in
↑PaCO2.

Dr Matthew Ho BSc(Med) MBBS(Hons) FANZCA
Physiol-99B5 Describe the ways in which CO2 is carried in the blood.
1. Carbon dioxide is a by-product of aerobic metabolism in mitochondria and is a non-polar, small
molecule easily able to diffuse across cell membranes in peripheral tissues, RBCs and the alveoli. It is carried in: a. Arterial blood – 48mL/dL at 40mmHg b. Venous blood – 52mL/dL at 46mmHg
2. It is transported in 3 different forms: Form Bicarbonate Carbamino compound Dissolved
% Arterial transport 90 5 5
% A-V difference 60 30 10
Equation CO2 + H20 H2CO3 H+ + HCO3
- CO2 + HbNH2 HbNHCOOH HbNHCOO- + H+
Henry’s law. CO2 dissolved = 0.0835 mL/dL/mmHg
Diagram Chloride shift, hamburger effect: the HCO3 diffuses out of the cell in exchange for Cl- into the cell via capnophorin channel (H+ cannot escape). Thus there is ↑ osm, water influx into cell ↑ cell volume as CO2 diffuses into RBC in venous blood ↑ venous haematocrit.
Notes 1st step facilitates bed carbonic anhydrase in RBC, and 2nd step is rapid (pKa = 6.1).
CO2 binds to terminal amino groups of blood proteins. This includes the 4 N-terminal groups of Hb.
CO2 is 20x more soluble than O2
3. The CO2 carriage in arterial and venous blood is well described by the CO2 dissociation curve
This shows a left and upward shift in venous blood, and an increased carrying capacity for CO2 when O2 drops 97% 75%. This is known as the Haldane effect. This is due to: a. DeoxyHb is 3.5 x more effective than oxyHb at forming carbamino compounds (70%) b. DeoxyHb is a better buffer than oxyHb at mopping up H+ produced from CO2 carriage as
bicarbonate (30% of effect).
Dr Matthew Ho BSc(Med) MBBS(Hons) FANZCA
Physiol-97A3 Describe the role of haemoglobin in the carriage of carbon dioxide in the blood.
1. Definitions:
a. CO2 is a product of anaerobic metabolism in mitochondrial tissues and must be transported from its site of production (tissues) to its site of excretion (lungs). This is done by its transport in blood in 3 different forms:
i. Dissolved CO2 (5%) ii. Carbamino compounds (5%)
iii. Bicarbonate (90%) b. Haemoglobin is an O2 carrying protein in blood, contained within erythrocytes. It is
of vital importance is the CO2 carriage as carbamino compounds and bicarbonate.
iii. Arterial: pCO2 = 40mmHg, CCO2 = 48mL/dL iv. Venous: pCO2 = 46mmHg, CCO2 = 52mL/dL
2. Bicarbonate
a. 90% of CO2 carriage in arterial blood b. 60% of A-V difference c. CO2 + H20 H2CO3 H+ + HCO3- d. The importance of Hb lies in its ability to buffer the H+ produced by carbonic acid. It
does so as H+ binds to the histidine moieties on Hb.
3. Carbamino compounds – CO2 binds to amine resides of proteins (including Hb) a. 5% of CO2 carriage in arterial blood b. 30% of A-V difference c. CO2 + Hb-NH HbNHCOOH HbNHCOO- + H+ d. The importance of Hb lies in its ability to bind CO2 via its 4 amine resides. It is the
most important protein in forming carbamino compounds due to its: i. High concentration (15g/dL vs. 7g/dL protein)
ii. Has 4 amino-groups per terminal
4. Haldane effect: this is the shifting of the CO2 dissociation curve up and left in deoxygenated venous blood. It accounts for 50% of the ↑CO2 carriage of venous blood. Hb is the protein which facilitates this due to:
a. DeoxyHb has an increased ability to form carbamino compounds with CO2 (70% Haldane effect)
b. DeoxyHb has an increased ability to buffer H+ produced by bicarbonate carriage of CO2.
5. Overall benefits: a. The Hb allows a greater change in CO2 carriage of arterial and venous blood (↑CO2
carrying capacity) for the same difference in CO2 tension. Without Hb Haldane effect, venous blood would only carry an extra 2mL/dL CO2 (50% of what is required).

Dr Matthew Ho BSc(Med) MBBS(Hons) FANZCA
Physiol-04B9 Describe how carbon dioxide is produced in the body. How does it move from the site of production to the pulmonary capillary?
1. CO2 is a gas produced in the body as a product of cell metabolism. It has a low MW (28), is
soluble in blood and must be transported from its site of production in cells, to the lung for excretion.
2. Production:
a. Site – produced in the mitochondria of cells by aerobic metabolism b. Process – the cells use energy substrates (carbohydrates, fatty acids, amino acids) in the
form of acetyl CoA enters the TCA cycle produces CO2 + reduced substrates (NADH, FADH, H+) enter electron transport chain (oxidative phosphorylation) combines with O2 ATP production and H20.
c. Amount of CO2 produced at rest 200mL/min and depends on: i. Metabolic state: increased in fever, infection, exercise, cancer
ii. Energy substrate: substrates have CO2 production: O2 consumption ratios (Resp quotient) –
1. Carbohydrate 1.0 2. Fat 0.7 3. Overall body 0.8
3. Diffusion into blood: CO2 produced accumulates in tissues and diffuses easily across cell
membranes down its concentration gradient into blood. a. Pa CO2 = 40mmHg b. PvCO2 = 45mmHg
4. Transport: CO2 is carried in 3 major ways a. Dissolved:
i. 5% of arterial CO2 transport, 10% of A-V difference ii. CO2 dissolves in blood according to Henry’s law, where its concentration is
proportional to PCO2. iii. 20x more soluble than O2
b. Bicarbonate: i. 90% of arterial CO2 transport, 60% of A-V difference
ii. CO2 + H20 H2CO3 HCO3- + H+
iii. Facilitated by carbonic anhydrase in RBC iv. Chloride shift / Hamburger effect – CO2 produces HCO3-, which diffuses out of cell in
exchange for Cl-. Overall there is increase of 1osm particle for every CO2, so water enters the cell and venous RCBs have more volume
c. Carbamino compounds: i. 5% of arterial CO2 carriage, 30% of A-V difference
ii. The terminal amino groups of proteins can bind to CO2. Hb is the most important as it exists in high concentrations, and has 4 binding site (one for each of its globin chains).
iii. CO2 + Hb-NH Hb-NHCOOH Hb-NHCOO- + H+ 5. Haldane effect – improves the venous carrying capacity of blood and accounts for the left shift of
the curve by deoxygenated blood. It is due to 2 factors:

Dr Matthew Ho BSc(Med) MBBS(Hons) FANZCA
a. Improved carbamino carriage (70%) – deoxygenated Hb has 3.5 times more affinity for CO2
than oxygenated Hb b. Improved bicarbonate buffering (30%) – deoxygenated Hb is a much better buffer, binding
H+ by its histidine groups. Overall, the Haldane effect accounts for 50% extra CO2 carriage of venous blood in addition to its extra carriage due to increased CO2 tension.

Dr Matthew Ho BSc(Med) MBBS(Hons) FANZCA
Physiol-99A3 Describe the factors that affect the transport of oxygen and carbon dioxide form the alveolus to the blood.
1. O2 is required for cellular aerobic metabolism and is derived from the atmosphere, inhaled by
the lungs into the alveolus, and transported via blood into the tissues. O2 diffuses from the alveolus to the capillary. CO2 is a product of aerobic metabolism is tissues and is transported via blood into the lungs for excretion. It diffuses from the pulmonary capillary into the alveolus.
2. Factors affecting transport (diffusion):
𝐃𝐢𝐟𝐟𝐮𝐬𝐢𝐨𝐧 = 𝐒𝐨𝐥 𝐱 𝐀 𝐱 ∆𝐏
√𝐌𝐖𝐱𝐓
3. Area :
a. The lung divides by 23 generations into small units for gas exchange – alveoli. This increases surface area to 80m2 and speeds diffusion.
b. Exercise can recruit more alveoli and ↑SA
4. Thickness – the alveolar membrane is very thin (3µm) and hence speeds diffusion. a. Disease states (fibrosis) can thicken membrane and slow diffusion
5. Solubility a. CO2 has a solubility constant 24 x O2, so it is more soluble
6. MW – both are small particles and diffuse quickly a. O2 has smaller MW (16) than CO2 (28) and hence its overall diffusing capacity if 1/20
that of CO2
7. Pressure gradient – the difference in partial pressures between the alveolus and the blood dictate the direction of diffusion.
a. O2
i. PAO2 = PiO2 – PaCO2/R = 100mmHg, PvO2 = 40mmHg, Gradient 60mmHg ii. O2 also combines with Hb Hb-O2. Hb is responsible for the majority of O2
carriage in the blood. This allows greater carriage of O2 with minimal effect on partial pressure, allowing maintenance of conc gradient in the membrane for further diffusion more O2 can be carried in blood.
iii. Under normal circumstances, O2 travels down concentration gradient from the alveolus into the blood, and its partial pressure equilibrates in 0.25sec. Since the blood transit time is 0.75 sec, O2 is perfusion limited.
b. CO2 i. PACO2 = PaCO2 = 40mmHg, PvCO2 = 46mmHg, gradient = 6mmHg
ii. CO2 is very soluble in blood, and rapidly diffuses across the membrane, so its concentration quickly equilibrates.
iii. CO2 diffusion is increased proportionally to ventilation (which reduces PACO2).
8. Diffusion limitation:
a. Under normal circumstances, O2 and CO2 are perfusion limited. i.e. diffusion is complete in the passage of blood through the alveolus. Under some circumstances,

Dr Matthew Ho BSc(Med) MBBS(Hons) FANZCA
O2 can be diffusion limited when its tension in blood does not reach tension in alveoli. This is due to:
i. ↓ transit time - ↑ CO / exercise ii. ↓ rate diffusion - ↑thickness, ↓ SA (lung disease)
iii. ↓ partial pressure gradient – altitude Because CO2 has much quicker diffusion, it is not affected by the above to any significant extent.

Dr Matthew Ho BSc(Med) MBBS(Hons) FANZCA
Physiol-03B12 Explain the difference between perfusion limitation and diffusion limitation in the transfer of gas between alveolus and pulmonary capillary. Outline the factors that determine whether gas transfer is perfusion or diffusion limited.
1. Introduction: the alveoli in the lung are units for gas transfer, and are necessary for the diffusion
of gases down their concentration gradient between the pulmonary capillaries and the alveoli.
2. Perfusion limitation: describes the situation where the amount of gas transferred between the alveolus and the capillary is dependent on the amount of blood flow through the capillary. Complete equilibration occurs between tension in the blood and alveolus.
a. E.g. N2O – very insoluble in blood, so most of the diffusion from alveolus blood causes a rise in partial pressure. It reaches equilibrium in < 0.2 sec. Further diffusion relies on more blood flow or provision of more air (to increase gradient).
b. CO2 and O2 are similar.
3. Diffusion limitation: describes the situation where rate of transfer of a gas across the membrane is dependent on the diffusion properties of the membrane. Incomplete gas exchange occurs and partial pressure does not equilibrate in the blood-alveolus.
a. E.g. CO – very soluble in blood (combines with Hb), so most of the diffusion from alveolus blood is absorbed and does not cause a raise in tension. The gradient is maintained. Because it is strictly diffusion limited, CO is used to measure gas transfer: D = VCO/PACO.
4. Factors determining perfusion vs. diffusion
a. rate of diffusion – FICKs Law
𝐃𝐢𝐟𝐟𝐮𝐬𝐢𝐨𝐧 = 𝐒𝐨𝐥 𝐱 𝐀 𝐱 ∆𝐏
√𝐌𝐖𝐱𝐓
Thus factors which ↓ rate of diffusion are:
• ↓SA (COPD)
• ↑ thickness (fibrosis)
• ↓ pressure gradient b. Solubility of gas in membrane vs. blood
i. ↑ solubility in barrier means faster diffusion perfusion limited (CO2) ii. ↑ solubility in blood means partial pressure gradient across the alveolus is
maintained diffusion limited (CO) c. Partial pressure gradient – as above d. Transit time of blood in alveolus – the usual time for transit in the alveolus is 0.75
sec. If gas equilibration occurs in this time perfusion limited. If transit time ↓ (↑CO) less time for diffusion diffusion limitation.
5. Specific important gases:
a. O2 i. Under usual circumstances is perfusion limited as partial pressure gradient =
100mmHg – 40mmHg, which equilibrates in 0.25 sec. ii. The transfer of O2 is also limited by combination with Hb – takes 0.2 sec.
This limits the rate of change in partial pressure and allows more O2 to be transferred into blood.

Dr Matthew Ho BSc(Med) MBBS(Hons) FANZCA
𝟏
𝐃=
𝟏
𝐃𝐌
+ 𝟏
𝐕. 𝛉
iii. In certain circumstances, O2 may be diffusion limited and incomplete
exchange occurs: 1. ↓ transit time - ↑ CO, TT = 0.25 sec 2. ↓ gradient – hypoxia, altitude 3. ↑ thickness, ↓ SA – disease
b. CO2 – under usual circumstances, perfusion limited due to high solubility and rapid transfer across membrane. Increasing CO2 out relies on ↑ ventilation remove alveolar air provide ↑ pressure gradient.

Dr Matthew Ho BSc(Med) MBBS(Hons) FANZCA
Physiol-04A11/95A1/91 What is 2,3, DPG? How is it produced in the red blood cell and how does it interact with haemoglobin? What is its relevance in altitude exposure, anaemia and stored blood?
1. 2,3 DPG is 2,3 diphosphoglycerate. It produced in RBC abundantly, as a side-product of glycolysis
(Embden-Meyerhof pathway). G-6-P 3-diphosphoglyceraldehyde 1,3 DPG 2,3 DPG 3 PG pyruvate Enzymes:
• 2,3 DPG mutase ↑ activity by alkalosis
• 2,3 DPG phosphatase ↓ activity by alkalosis 2. Factors affecting 2,3 DPG production:
↑ Production ↓ production
Alkalosis Exercise Chronic hypoxia Altitude Pregnancy Hyperthermia Hyperthyroidism, androgens, GH
Acidosis Hypothermia
3. Interaction with Hb:
a. HbA – in adults, 2,3DPG has a high affinity for the β-globin of Hb. It competes with O2 and causes displacement, conformational change in Hb, shifting the OHDC to the right and liberating O2. This contributes to the Bohr effect ↑P50. HbO2 + 2,3 DPG Hb-2,3DPG + O2
b. HbF – as foetal Hb has no beta globin chains, 2,3 DPG does not bind and hence has no effect on OHDC.
4. Clinical scenarios:
a. Altitude: i. Paucity of inspired O2 hypoxaemia ↑2,3 DPG.
ii. This helps with unloading of O2 in tissues iii. Occurs at expense of O2 loading in pulmonary capillaries hypoxic
ventilation response alkalosis shift curve left iv. Overall, effect of 2,3 DPG greater and curve right
b. Anaemia: i. Relative hypoxia despite normal saturations ↑ 2,3 DPG
ii. Shift curve right, P50 ↑ 4mmHg Helps with unloading of O2 in tissues c. Stored blood:
i. At cold temperature, and lack of glycolysis depletion of 2,3 DPG after 2 weeks shifts curve left less ability of blood to unload O2 in tissues. Levels are restored 48 hours post-transfusion.
ii. Constituents added to minimised this effect: 1. Dextrose glycolysis 2. adenine, phosphate ATP 3. citrate buffer acidosis

Dr Matthew Ho BSc(Med) MBBS(Hons) FANZCA
Physiol-02A1/96B5 Explain how oxygen supply of organs is maintained during isovolaemic haemodilution.
1. Isovolaemic haemodilution is the replacement of a portion of blood with an equal volume
portion of fluid which has no oxygen carrying capacity. Eg. Crystalloid, colloid. 2. Effect of isovolaemic haemodilution –
O2 flux = CO x CaO2
CaO2 = (Hb x sats x 1.34) + (0.03 x PaO2) So, in haemodilution, there is a drop in Hb concentration and therefore a drop in O2 flux. There is resulting tissue hypoxia, which if not compensated for, results in cell death.
3. Compensation – there are cardiovascular and respiratory mechanisms which work to maintain O2 perfusion. These can be described using the following equations:
Ficks: 𝐕𝐎𝟐 = 𝐐(𝐂𝐚𝐎𝟐 − 𝐂𝐯𝐎𝟐)
Pouiselle-Hagman: 𝐐 = 𝚫𝐏 𝐱 𝛑𝐫𝟒
𝟖𝛈𝐋
a. Cardiovascular compensations
i. Vessels – from Fick’s equation, ↑ tissue flow ↑O2 extraction. This occurs through:
1. Chemical autoregulation – products of metabolism ↓O2, ↑CO2, K, adenosine, H vessel dilatation ↑ flow (Pouiselle-Hagman)
2. Anaemia ↓ viscosity ↓ vessel resistance ↑ flow ii. Heart:
1. ↑ flow through tissues ↑ VR ↑ ventricular stretch ↑ SV ↑ CO (Starling’s mechanism)
2. Chemical vasodilatation tissues ↓SVR ↓MAP baroreceptor reflex ↑ HR to maintain CO
3. Bainbridge reflex: ↑ VR ↑ HR Since CO = HR x SV, above factors ↑CO ↑ overall O2 flux (from equation)
b. Respiratory compensation: i. Anaemia ↓CaO2 tissue hypoxia production of CO2, acidosis shifts
the O2 dissociation curve right (↑ P50 – Bohr effect) more O2 offloaded ↑ tissue O2 extraction (from Fick equation ↓CvO2 ↑ VO2)
ii. Peripheral chemoreceptors hypoxia stimulation of chemoreceptors ↑ ventilation ↑ MV. Only small ↑O2 due to flat O2 Hb dissociation curve.
4. Summary: since haemodilution results in ↓ O2 carrying capacity of blood, compensatory
mechanism operate to: a. ↑ cardiac output b. ↑ tissue perfusion c. ↑ tissue extraction of O2

Dr Matthew Ho BSc(Med) MBBS(Hons) FANZCA
Physiol-96B8 Briefly explain how an oxygen debt arises and how the body deals with it.
1. Oxygen is a gas required for aerobic metabolism in cells. O2 is metabolised with energy
substrates to produce ATP high energy phosphate bonds used for the production of energy. 2. Energy storage – under normal circumstances, there body contains storage of O2 (in the lungs,
dissolved blood, muscles in myoglobin) ATP and creatine phosphate. When there is increased O2 demand by tissues (exercise the best example):
a. ATP (1-2 sec vigorous exercise) and creatine phosphate (10 sec vigorous exercise) stores are used
3. Energy production – after a 10-30sec (or so) of exercise, ATP stores are used and more has to be
produced. a. Aerobic metabolism:
i. Carbohydrates, fatty acids and amino acids occurs glycolysis, beta oxidation produce more ATP (oxidative phosphorylation).
ii. O2 used from stores in myoglobin, Hb, dissolved in blood and lungs. iii. Glycogen used from muscles as carbohydrate substrate
Up to a point, this is sufficient to supply O2 demands of the working tissues. However, when demand for O2 and ATP exceeds the supply from the above, there is another process of producing ATP.
b. Anaerobic metabolism – diversion of glycolytic pathways to produce ATP + lactic acid. This lactic acid reduces pH and is carried away from skeletal muscle to the liver where it is metabolised back into pyruvate glycogen. This process requires oxygen.
4. Oxygen debt – thus, these processes use O2 through:
a. Use of ATP, creatine phosphate stores b. Use of O2 stores in haemoglobin and myoglobin, lungs and blood c. Use of muscle glycogen for aerobic glycolysis d. Use for metabolism of lactic acid. This is necessary as lactic acidosis impairs cell
metabolism. The O2 that is used must be replenished and it thus called the oxygen deficit.
5. Body’s mechanism to deal with oxygen deficit: When exercise is complete, O2 consumption is still raised in order to restore the O2 used in the above processes. The total O2 consumed in doing the above is called oxygen debt. It is seen on the graph as the area under the curve as O2 consumption falls to baseline levels after exercise and consists of 2 phases:
a. lactic acid oxygen debt (minutes) i. Replenish ATP, creatinine phosphate stores
ii. Replenish oxygenated myoglobin and haemoglobin b. Lactic acid oxygen debt (sprinting-hours to marathon-days)
i. Convert lactate pyruvate glycogen (Cori cycle – diverts at two irreversible steps)
ii. Restore glycogen via glycolysis The maximal O2 produced by aerobic metabolism is called VO2 max (high in trained athletes). Their oxygen debts are less.

Dr Matthew Ho BSc(Med) MBBS(Hons) FANZCA
Physiol-09A16 Outline the effects of acute exposure to air at an altitude where barometric pressure is 347mmHg. What compensatory mechanisms occur with gradual exposure to increasing altitude?
1. Acute exposure to attitude – involves subjecting an individual to altitude in a short period of
time which does not allow acclimatisation to the changed altitude. 2. Effect:
a. PP air = 347mmHg, so PiO2 = 0.21x(347-47mmHg) = 63mmHg b. PAO2 = PIO2 – PaCO2/R = 63mmHg – 50mmHg = 13mmHg c. Thus overall effect is profound hypoxaemia
3. Compensation: a. Hypoxia < 60mmHg significantly activates the peripheral chemoreceptors in the
aortic and carotid bodies stimulate respiratory centre ↑ ventilation (up to 5 fold).
i. ↑ MV ↓pCO2 alkalosis in CSF inhibits central chemoreceptors limits rapid rise in ventilation
ii. Over several days bicarbonate diffuses out of CSF and is then excreted in the kidneys ↓pH back to normal brakes to ventilation are removed and it increases again. Hence, there is a biphasic ↑ ventilation up to 5 fold.
4. Gradual exposure – slow ascent to altitude permits the body to undergo acclimatisation. This is
best seen by studying respiratory physiology of native inhabitants at high altitude. a. ↑ O2 uptake:
i. ↑ ventilation due to hypoxic drive (as above) ii. ↑ maximal work of breathing – due to ↓ density of altitude gas ↓
airways resistance in turbulent flow ↑ flow b. ↑ O2 transport:
i. Polycythaemia: hypoxia stimulates EPO physiological polycythaemia ↑ O2 carrying capacity despite ↓ sats. Hb 15 20.
ii. ↑ 2,3 DPG: hypoxia stimulates 2,3 DPG production from glycolysis shifts O2-Hb DC right unloading of O2 to tissues. Of course, the shift in dissociation curve is somewhat offset by the left shift of the curve caused by respiratory alkalosis. The overall effect is still shift right.
iii. ↑ formation capillaries in tissue ↑flow perfusion (Fick equation) c. ↑ O2 utilisation: mitochondria in cells contain ↑ oxidative enzymes
5. Deleterious acclimatisation: not all mechanisms are helpful. a. Hypoxic pulmonary vasoconstriction ↑Pulm capillary pressure pulmonary HTN
RV failure, cor pulmonale b. Shift right O2 dissociation curve ↓ loading of O2 in pulmonary capillaries c. Polycythaemia ↑ viscosity ↑ vessel resistance ↓ flow

Dr Matthew Ho BSc(Med) MBBS(Hons) FANZCA
Pulmonary Circulation
Physiol-05B9/97A2 Describe the gravity dependent processes which affect pulmonary blood flow. What changes take place when the pressure increases in the pulmonary vessels?
1. Pulmonary blood flow is influenced by modified Ohm’s law where Q = P/PVR. In the pulmonary
circulation, the RV pressure is 15mmHg, LV = 5mmHg, giving pressure gradient of 10mmHg which drives pulmonary blood flow. Normal values: Q = 5L/min = CO, P = 10mmHg, PVR = 2mmHg/L min
2. The action of gravity on the lung (in the upright position) results in a hydrostatic pressure
gradient from the base to the apex of the lung of approximately 10mmHg (this varies with lung height). This gradient means there is a roughly linear ↑ blood flow from apex base. 2/3 of this gradient is above the RV, and 1/3 below. Thus, the driving pressure of the pulmonary circulation is just high enough to pump blood to the apex of the lung. The lung can be classified into 4 zones (West zones):
a. Zone 1:
i. PA>Pa>Pv – alveolar pressure exceeds hydrostatic pressure, so the vessels are compressed no blood flow alveolar dead space
ii. Does not occur in normal lungs. iii. ↑PA – PEEP, COPD or ↓Pa – hypotension, PE
b. Zone 2: i. Pa>PA>Pv – gradient for blood flow is determined by difference between arterial
and alveolar pressure Starling resistor mechanism (flow dependent on forces outside lumen) flow is pulsatile and varies with hydrostatic pressure of systole (flow) and diastole (no flow).
ii. Occurs in the apex of normal lungs until 10cm above level of heart c. Zone 3:
i. Pa>Pv>PA – gradient for blood flow determined by AV pressure difference flow continuous
ii. Occurs in lung from 10cm above heart base iii. Low V/Q ratio venous admixture
d. Zone 4: i. Occurs when the weight of the lung compresses extra-alveolar vessels ↑
resistance ↓ flow. ii. This is worsened at low lung volumes (↓ volumes below critical opening
pressure compresses extra-alveolar capillaries)
3. Increasing pulmonary vascular pressure – the pulmonary circulation is low pressure and hence, sensitive to increases in pressure. ↑ pressure ↓ PVR ↑ flow.
a. Recruitment of closed capillaries occurs mainly zone 2 b. Distension of vessels occurs mainly zone 3 c. ↑ PAP (↑RV pressure ) ↑ flow zone 2 and 3 d. ↑ PVP (↑LA pressure) ↓ effect zone 2, ↓ flow zone 3 pulmonary oedema
4. Posture – the apex-base discrepancy is abolished if the patient lies supine. Instead blood flow is
greater posteriorly than anteriorly.
Dr Matthew Ho BSc(Med) MBBS(Hons) FANZCA
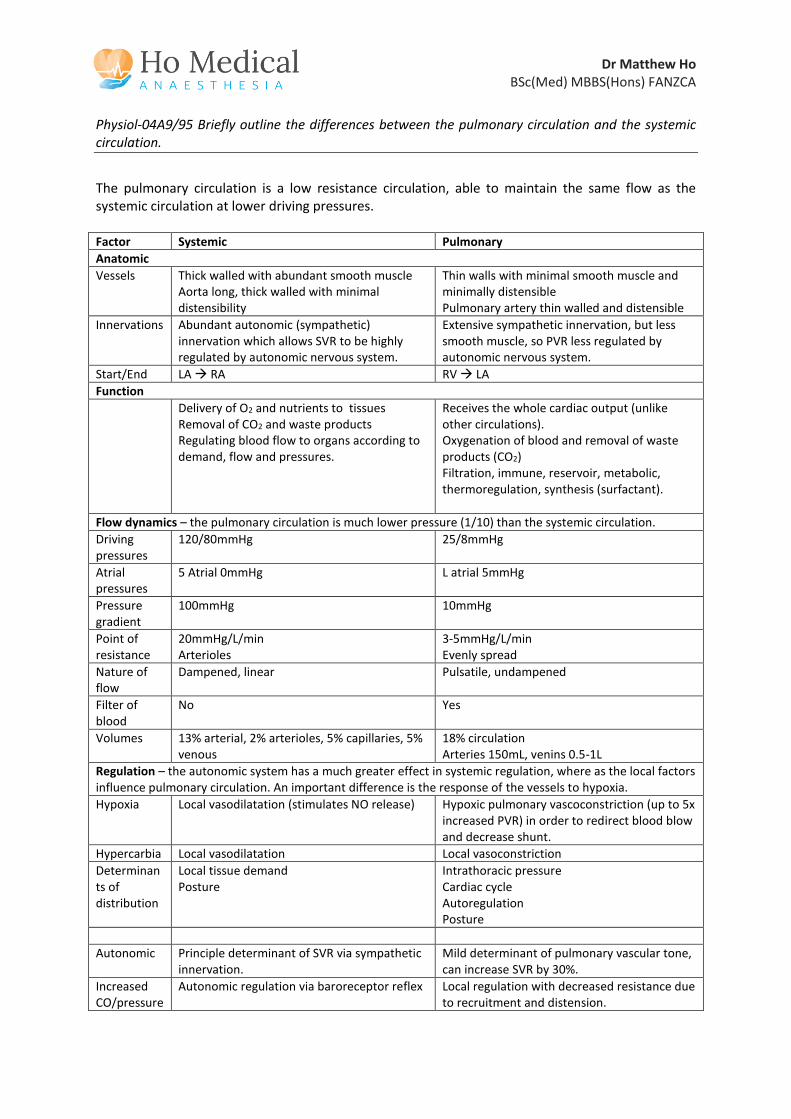
Physiol-04A9/95 Briefly outline the differences between the pulmonary circulation and the systemic circulation.
The pulmonary circulation is a low resistance circulation, able to maintain the same flow as the systemic circulation at lower driving pressures. Factor Systemic Pulmonary
Anatomic
Vessels Thick walled with abundant smooth muscle Aorta long, thick walled with minimal distensibility
Thin walls with minimal smooth muscle and minimally distensible Pulmonary artery thin walled and distensible
Innervations Abundant autonomic (sympathetic) innervation which allows SVR to be highly regulated by autonomic nervous system.
Extensive sympathetic innervation, but less smooth muscle, so PVR less regulated by autonomic nervous system.
Start/End LA RA RV LA
Function
Delivery of O2 and nutrients to tissues Removal of CO2 and waste products Regulating blood flow to organs according to demand, flow and pressures.
Receives the whole cardiac output (unlike other circulations). Oxygenation of blood and removal of waste products (CO2) Filtration, immune, reservoir, metabolic, thermoregulation, synthesis (surfactant).
Flow dynamics – the pulmonary circulation is much lower pressure (1/10) than the systemic circulation.
Driving pressures
120/80mmHg 25/8mmHg
Atrial pressures
5 Atrial 0mmHg L atrial 5mmHg
Pressure gradient
100mmHg 10mmHg
Point of resistance
20mmHg/L/min Arterioles
3-5mmHg/L/min Evenly spread
Nature of flow
Dampened, linear Pulsatile, undampened
Filter of blood
No Yes
Volumes 13% arterial, 2% arterioles, 5% capillaries, 5% venous
18% circulation Arteries 150mL, venins 0.5-1L
Regulation – the autonomic system has a much greater effect in systemic regulation, where as the local factors influence pulmonary circulation. An important difference is the response of the vessels to hypoxia.
Hypoxia Local vasodilatation (stimulates NO release) Hypoxic pulmonary vascoconstriction (up to 5x increased PVR) in order to redirect blood blow and decrease shunt.
Hypercarbia Local vasodilatation Local vasoconstriction
Determinants of distribution
Local tissue demand Posture
Intrathoracic pressure Cardiac cycle Autoregulation Posture
Autonomic Principle determinant of SVR via sympathetic innervation.
Mild determinant of pulmonary vascular tone, can increase SVR by 30%.
Increased CO/pressure
Autonomic regulation via baroreceptor reflex Local regulation with decreased resistance due to recruitment and distension.

Dr Matthew Ho BSc(Med) MBBS(Hons) FANZCA
Change in lung volume
Nil effect PVR increases at low and high lung volumes.
Change in posture
Hydrostatic pressure difference 170cmH20, but no significant change in flow from apex to base of body.
Hydrostatic pressure difference results in greatly altered flow between apex and base of lung.

Dr Matthew Ho BSc(Med) MBBS(Hons) FANZCA
Physiol-02A4/00A3 What is a normal value for pulmonary vascular resistance? Outline the physiological factors that influence pulmonary vascular resistance.
1. Pulmonary vascular resistance is the resistance of the vasculature within the pulmonary
circulation. a. Low pressure circulation (1/10 x systemic VR) b. Receives all of cardiac output
2. Calculating PVR: by modification of Ohms law, R = ∆P/Q
a. PVR = (PA – Pv)/CO (all measured with Swan-Ganz catheter) PA = 15mmHg (10-20mmHg), PV = 5mmHg (0-10mmHg) Q = 6L/min Therefore PVR = 1.7 (1-2) mmHg/L min (Wood’s units)
b. Because there is less dampening of pulsatile flow in the pulmonary circulation (vessel walls are thin), vascular impedance is a more accurate term.
3. Factors which affect PVR: Pouiselle / Hageman formula
𝐏𝐕𝐑 = 𝟖𝛈𝐋
𝛑𝐫𝟒
𝐏𝐕𝐑 = 𝑷𝑭⁄
a. Radius of vessel – most important factor, as power 4:
i. O2 tension – hypoxic pulmonary vasoconstriction. Hypoxaemia and ↓ ventilation causes constriction of pulmonary vessel thought to be due to tonic removal of NO (ERF).
ii. Lung volumes: 1. Low volumes – the weight of the lung and lack of radial traction
compresses alveolar vessels ↓ radius ↑ PVR 2. High lung volumes – the ↑ alveolar volume ↓calibre/compression
↑PVR 3. FRC represents the point at which PVR minimised
iii. Drugs which alter radius: 1. Volatile anaesthetics, NO, calcium channel antagonists, prostacyclins
relax smooth muscle ↓PVR 2. Histamine, 5HT, inotropes, PG constrict ↑ PVR
b. Pulmonary vascular pressure - ↑ cardiac output ↑ pressure ↓ pulmonary VR due to recruitment (low flow, zone 2) and distension (high flow, zone 3)
c. Blood viscosity - ↓ viscosity (anaemia) ↓ PVR

Dr Matthew Ho BSc(Med) MBBS(Hons) FANZCA
Other Respiratory Physiology
Physiol-08B15 Describe the changes that occur with ageing that can affect oxygen delivery to the tissue during moderate exercise.
1. Oxygen delivery to tissues by the systemic circulation is measured by oxygen flux. This is the product of cardiac output and oxygen content given by:
O2 flux = CO x [(Hb x sats x 1.34) + (0.003xPaO2)]
The normal max O2 flux = 1000mLO2/min. In general, O2 flux decreases with age and hence the delivery of O2 to tissues during exercise is impaired. The value in elderly people is 300-400mLO2/min.
2. Ageing confers decreased ability of all organ systems to maintain homeostasis and function. The systems most important in exercise contributing to O2 flux and the cardiac system (cardiac output) and respiratory system (Hb, PaO2, sats).
3. Cardiac factors – Cardiac output = SV x HR, where SV depends on preload, afterload and contractility. This generally decreases with age – 1%/year > 30 years.
a. Preload: ↓ ventricular compliance ↓ contractility via Starling’s mechanism b. Contractility: fibrosis of myocardium ↓ max SV c. Afterload: dependent on cardiac wall work and SVR
i. SVR - ↑ due to ↓ compliance of arteries ii. Valvular disease – pressure and volume loads ↑ work
d. ↓ maximal HR (220-age) e. Peripheral delivery: atherosclerosis ↓ blood flow f. Regulation – impaired sympathetic response during exercise
4. Respiratory factors: impaired ability of O2 uptake by lungs into blood.
VO2 = Q(CaO2 – CvO2)
𝐂𝐚𝐎𝟐 = 𝐂𝐕𝐎𝟐 + 𝐕𝐎𝟐
𝐐
a. Hb – generally ↓ with age ↓ O2 carrying capacity b. Pa O2 ↓ age = 100- (1/3 x age x mmHg)
i. ↓ lung volumes due to kyphosis ↓ TLC/VC ii. ↑ work of breathing: ↓ compliance
1. ↑ airway resistance 2. ↑ elastic resistance
iii. ↓ diffusion capacity due to ↑ thickness membrane, ↓ functional surface area of alveoli.
iv. Closing capacity ↑ age due to ↑ compliance of lung tissue (more easily squashed by gravity): 66 = FRC erect, 44 = FRC supine ↑ poorly ventilated alveoli ↑ V/Q mismatch hypoxaemia
Dr Matthew Ho BSc(Med) MBBS(Hons) FANZCA
Physiol-08A16 Discuss the physiological causes of early post-operative hypoxaemia.
1. Hypoxaemia is abnormally low oxygenation of arterial blood (as distinct from hypoxia which is abnormally low oxygenation of tissues). It is most easily measured in terms of oxygen tension which is normally 75-100mmHg. It is important because it leads to tissue hypoxia and alterations in tissue function. Reductions in O2 tension become especially important as O2 sats < 91% (60mmHg) as below this point, the slope of the O2 Hb dissociation curve becomes steeper, and further reductions rapidly reduce O2 concentration of blood.
2. The causes of hypoxaemia relate to decreased inspired oxygen, decreased ventilation and delivery to the alveolus, abnormal diffusion, V/Q mismatch and ↑ tissue extraction O2.
a. ↓ FiO2 – may be insufficient to meet metabolic demands of the patient.
𝐏𝐀𝐎𝟐 = 𝐅𝐢𝐎𝟐 − 𝐏𝐚𝐂𝐎𝟐
𝐑
b. Hypoventilation: results in ↑pCO2 and ↓pO2 as – (Bohr equation)
• Causes: o Pain o Drugs (opioids, anaesthetic drug washout, benzodiazepines, skeletal
muscle relaxants) o Trauma/wounds to chest wall
• Treated by increasing FiO2
c. Diffusion abnormalities – play very minor role in the normal lung as O2 is perfusion limited. In severely diseased lungs, membrane may be thickened (pulmonary fibrosis). Again, corrected by increasing FiO2 (increase concentration gradient)
d. V/Q abnormalities – a major cause. Treatment of underlying cause is essential as this will not necessarily be corrected by ↑FiO2.
1. Alveolar dead space: V/Q mismatch (West zone 1) – 1. PE 2. Hypotension 3. PP Ventilation
2. Shunt: V/Q scatter - perfusion without ventilation - 1. Infection 2. Atelectasis
e. ↑ tissue O2 demand/extraction – hypermetabolic states
1. Fever, sepsis 2. Hyperthyroidism, MH

Dr Matthew Ho BSc(Med) MBBS(Hons) FANZCA
Physiol-05A13 Describe the non-respiratory functions of the lung.
1. The non-respiratory functions of the lung can be divided into: Filtration, Immune/Defence, Reservoir, Metabolic, Thermoregulation.
2. Filtration – the lung receives the whole of the cardiac output and is well suited to filtering the blood. The capillaries act as a particulate filter:
a. Mechanical – as the capillaries have diameter 7mcm, particles smaller than 10mcm are filtered out of the circulation
b. Thrombus – the lung intrinsic fibrinolytic activity and filters out thrombi from the venous circulation. The importance of which is seen in the pathophysiology of strokes/arterial emboli from the venous circulation through R L shunts.
3. Immune/Defence: the surface area of the alveoli is 80m2, meaning a lot of the lung is exposed to
the environment, and hence the lung needs to play an important role in defence. a. Most larger particles (>40mcm) are removed in the upper airways by impaction, and
medium sized particles (8-15mcm) in the conducting airways by sedimentation. They are expelled by cough and mucocilliary transport.
b. Small particles (<10mcm) lodge in the alveoli, where they are ingested by alveolar macrophages, and removed via the circulation/lymphatics.
4. Reservoir:
a. Blood – the lung hold about 15-18% of the circulating volume (150mL arteries, 80mL capillaries, 600mLs veins).
i. SNS activation – the vessels constrict and can divert flow to other parts of the circulation in need
ii. ↑PA pressures ↑ volumes due to recruitment and distension b. Gas – the lung holds 1.2L as RV, and 2.4L FRC which is an important reservoir for O2
5. Thermoregulation: a. The lung uses 1-2% of O2 consumption b. In extremes of heat/cool, the lung becomes an important mechanism for regulating heat
loss through changes in MV. c. Most thermoregulation control actually occurs in upper airways:
i. Warms and humidifies inspired gas ii. Heat loss via latent heat of vaporisation (to evaporate water)
iii. Daily loss 400mL – heat loss 230kcal/day (12% basal heat loss)
6. Metabolism: a. Synthesis:
i. Use in lung – 1. Surfactant (DPPC) by type II alveolar cells 2. Elastin and collagen for structure 3. Mucopolysaccharides for mucous
ii. Use in circulation – 1. PGs 2. LTs 3. Kallikrein 4. Histamine
b. Conversion: ACE (pulmonary capillary endothelial cells) converts Ang I Ang II c. Metabolism:

Dr Matthew Ho BSc(Med) MBBS(Hons) FANZCA
i. PGs (PGE1/2, F2α)
ii. LTs iii. Bradykinin 80% iv. NA 30% v. ACh
vi. Drugs – propanolol, fentanyl, propofol, lignocaine, TCAs 7. Administration of drugs
a. Volatile anaesthetics b. Nebulisers

Dr Matthew Ho BSc(Med) MBBS(Hons) FANZCA
Physiol-04A12/01A8 What are the physiological consequences of decreasing functional residual capacity by one litre in an adult?
1. Functional residual capacity is the volume remaining in the lungs after normal expiration. It is
defined as: a. Residual volume + Expiratory reserve volume b. The equilibrium between the tendency of the chest wall to spring out, and the lung to
collapse in. It is measured by helium gas dilution, or by body plethysmography. Its usual value is 2.2L or 30mL/kg.
2. Causes of ↓ FRV:
a. Weight – obesity b. Height - ↓ height c. Position – supine (due to pressure of intra-abdominal contents on diaphragm) d. Muscle tone – diaphragm paralysis, inhalational anaesthesia e. Pregnancy
3. ↓ FRC by 1 L is significant as this drops FRC by 40-50%. The effects are:
a. ↓ O2 storage: i. ↓ effect of pre-oxygenation in induction / RSI
ii. ↓ buffering O2 levels ↑ breath-breath pO2 tension variation b. ↑AWR –
i. Increase relationship between volume and AWR (due to ↓ radius of airways when ↓ volume)
c. ↑ WOB:
i. When FRC < closing capacity, some dependent alveoli are closed (due to FRC falling below opening pressures). Work is required to open these airways.
ii. ↓ FRC ↓ lung volumes flatter part of the compliance curve ↓ compliance ↑ work
iii. ↑ resistance work due to ↑AWR (as above)
d. ↑ V/Q mismatch: as above, the closure of airways at the base of the lung causes atelectasis ↓ ventilation shunting blood arterial hypoxaemia
e. ↑ PVR: i. at low lung volumes ↓ radial traction of extra-alveolar vessels collapse by
gravity at base (West zone 4) ↑ PVR ↑ work R heart. 4. Note: functions FRC – BARROW V
a. Buffer O2 b. Avoid atelectasis c. Resistance (reduce PVR) d. Resistance (reduce AWR) e. O2 reservoir f. Work (↓ WOB) g. V/Q mismatch (minimise)

Dr Matthew Ho BSc(Med) MBBS(Hons) FANZCA
Physiol-01B1/98A1/96B3 Explain the effects of intermittent positive pressure ventilation on left ventricular output.
1. IPPV is used in the ventilation of patient under general anaesthesia with muscle relaxants.
Positive pressure is delivered through the airways via a ventilator during inspiration to move tidal volume. Pressure is realised during the expiratory phase, which is passive.
2. LV output is the volume of blood/unit time pumped by the L ventricle, and is dependent on the
following factors: a. Preload – LVEDV: by Starlings mechanism, the volume of blood entering the LV from the
pulmonary circulation stretches LV myocytes which assist in their contraction. b. Afterload – the sum of forces which oppose LV output
i. Ventricular wall tension = P x R/Thickness ii. SVR – determined by neural, local factors in peripheral vessels
iii. Outflow resistance – depends on relationship between ITP and outflow pressure. If ITP > outflow pressure, Starling resistor mechanism means ITP determines afterload.
c. Intrinsic contractility – not directly affected by IPPV d. HR – not directly affected by IPPV.
3. Effect of IPPV on LV output factors: a. ↓ LV preload: via ventricular interdependence –
i. ↑ ITP ↑ RV afterload ↓ delivery to LV ii. ↑ ITP ↑ RV afterload ↑ RV ESV push IV septum left ↓ LV preload
b. ↓LV afterload: i. ↑ ITP ↓ radius (due to septum shift), ↓ pressure gradient across wall, ↑
wall thickness (↓ stretch) ↓ systolic wall tension ii. ↑ ITP also ↑ outflow resistance (Starling resistor) ↑ LV afterload, but this
factor is smaller than the first, and overall afterload ↓. 4. LV output changes via phases of respiration
a. Inspiration: i. ↑ITP emptying of pulmonary blood reservoir into LV ↑ preload ↑ CO.
As this depletes, CO will decrease again. ii. ↑ ITP ↑RA pressure, ↑PVR ↑ RV afterload ↓ RV output ↓ LV
preload subsequent ↓ CO iii. ↑ ITP > LV outflow pressure ↑ resistance in systole ↑ LV afterload ↓
CO. b. Expiration:
i. ↓ ITP ↓ PVR (back to low point) ↑ capacitance ↑ pulmonary blood volume (RV empties into lung) ↓ LV preload further ↓CO
ii. ↓ ITP ↓ PVR ↓ RV afterload ↑ VR R ventricle ↑ RV output ↑ LV preload ↑ CO again to normal.
5. Clinical factors:
a. PEEP – higher pressures prevent CO returning to normal levels during expiration and exaggerate the reduction in LV output seen during inspiration.
b. Hypovolaemia - ↓ CV pressures cause prolonged VR that does not return to normal exaggerate ↓CO. Somewhat offset by ↑ fluid volumes

Dr Matthew Ho BSc(Med) MBBS(Hons) FANZCA
c. Heart failure – as IPPV/PEEP cause ↓ preload and afterload, this tends to be beneficial in
heart failure. d. Overall –
i. Normal hearts - ↓ CO, BP ii. Elderly/impaired LV function – no change or improvement