Bridging the gap between plant physiology and breeding Identifying traits to increase wheat yield...
146
Bridging the gap between plant physiology and breeding Identifying traits to increase wheat yield potential using systems approaches
Transcript of Bridging the gap between plant physiology and breeding Identifying traits to increase wheat yield...
Bridging the gap between plant physiology and breeding
Identifying traits to increase wheat yield potential
using systems approaches

Promotoren: dr. ir. R. Rabbinge hoogleraar in de theoretische productie-ecologie
dr. ir. H. van Keulen hoogleraar in de duurzame dierlijke productie
V?r>', 21'ZJ pbNo
Premchand Soebhaschander Bindraban
Bridging the gap between plant physiology and breeding
Identifying traits to increase wheat yield potential using
systems approaches
Proefschrift ter verkrijging van de graad van doctor
op gezag van de rector magnificus van de Landbouwuniversiteit te Wageningen,
dr. C.M. Karssen, in het openbaar te verdedigen op woensdag 8 oktober 1997
des namiddags te half twee in de Aula.
•ö>3
Bindraban, Prem S.
Bridging the gap between plant physiology and breeding. Identifying traits to increase
wheat yield potential using systems approaches.
Prem S. Bindraban.
Thesis Landbouwuniversiteit Wageningen. -With summary in Dutch.
ISBN: 90-5485-752-8
Cover design by Marion Westerman.
This thesis contains results of a collaborative research project of the Department of
Theoretical Production Ecology, Wageningen Agricultural University (TPE-WAU, the
Netherlands) and the International Maize and Wheat Improvement Center (CIMMYT,
Mexico). The project was financed by both institutes.
BIBLIOTHEEK LANDBOUWUNIVERSITEIT
WAGENINGEN

rJMo^lo^r* af
stellingen
1. De systeemanalytische benadering van gewasgroei is bij uitstek geschikt om plantenfysiologische kennis toepasbaar te maken voor de plantenveredeling om daarmee de efficiëntie van het veredelen te verbeteren. Dit proefschrift
De opbrengst van tarwe onder optimale teeltomstandigheden in de Yaqui vallei bij Obregon, Mexico, is sink gelimiteerd. Dit proefschrift
3. De huidige selectie-procedures van tarwe belemmeren de vooruitgang in de verhoging van de opbrengstpotentie.
Terwijl de beschrijving van de source capaciteit in huidige gewasgroei-simulatiemodellen ver gevorderd is, is die van de sink capaciteit, het transportsysteem en de terugkoppelingsmechanismen ontoereikend of zelfs afwezig. Analyses van planttype m.b.v. dergelijke modellen suggereren grote nauwkeurigheid, maar zijn onbetrouwbaar. Dit proefschrift
5. Recent cuts in financial support to agricultural development in developing countries are a frightening indication that the international community is neither serious about dealing with current food, poverty, and environmental problems, nor preparing to deal effectively with the much larger future problems. (IFPRI, 1995)
6. Integratie van allochtonen begint met de erkenning en ontwikkeling van de eigen identiteit.

7. Bij het uitgangspunt dat allochtonen zich de nonnen en waarden van autochtonen eigen moeten maken, blijft onvermeld dat het omgekeerde evenzeer noodzakelijk is voor het bevorderen van de participatie van allochtonen in de samenleving.
8. De veelal groots opgezette hindoestaanse religieuze en culturele activiteiten dienen met name om de normen en waarden binnen de hindoestaanse gemeenschap in Nederland in stand te houden, en moeten mede daarom gecontinueerd worden.
Kinderen uit gemengde huwelijken moeten volgens een éénduidige cultuur worden opgevoed.
10. Een sociaal-economisch vangnet geheel buiten familiaire kringen om bevordert de individualisering maar leidt tot groter isolement bij het wegvallen ervan.
11. Door zowel de rentestand laag, als de peso overgewaardeerd te houden, heeft de Mexicaanse bank de perfecte voorwaarden geschapen voor de vrije val van de peso in 1994.
Stellingen behorende bij het proefschrift Bridging the gap between plant physiology and breeding Identifying traits to increase wheat yield potential using systems approaches
Prem S. Bindraban Wageningen, 8 oktober 1997
Abstract
Part of the required increase in wheat production in currently high yielding wheat
producing regions, like in the (sub-)tropics (ME1), will have to be obtained primarily
by increased genetic wheat yield potential. Progress obtained by breeding to increase
yield potential was substantial in the past, but is currently declining. Support from
other disciplines to improve breeding efficiency is urgently needed. A systems
approach was applied to identify processes that determine wheat growth and yield, and
traits that need to be adapted to increase genetic yield potential for ME1 conditions.
Increasing biomass through leaf nitrogen affords little opportunity to obtain gains
under optimum management conditions. Growth analysis suggested the source
capacity of wheat to exceed yield at higher yield levels, while remobilization of stem
reserves was needed to supplement grain demand at lower yield levels. The latter
aspect was confirmed in an analysis of stem reserve dynamics. Despite sufficient
assimilate production, remobilization also occurred at higher yield levels, suggesting
other processes, like wasteful respiration and negative feedback on photosynthesis, to
become important. Also, higher amounts of residual reserves were found under higher
than under lower yield levels. These results indicate that wheat yields under optimum
conditions in ME1 are limited by sink capacity, as source capacity is abundant. Sink
capacity can be increased by increasing kernel number or weight. Kernel number is
determined between early booting and final anthesis, and depends on the duration and
the crop growth rate of this period and on the allocation to the spike. Required
adjustments to increase kernel number depend on environmental conditions.
Competition among kernels for carbohydrates limited their growth, in particular those
positioned further away from the rachis. This may be due to an inadequate transport
system. Without competition, yields were assessed to increase at least one ton per
hectare over a wide range of environmental conditions. It is concluded that increase in
wheat yield potential under ME1 conditions should be obtained by increased sink
capacity, which may be realized through the adaptation of the spike morphology.
Sufficient genetic variation of this trait is at hand to be incorporated in a breeding
program.
Keywords: wheat, yield potential, biomass, environmental conditions, source, sink, transport, leaf area index, leaf nitrogen content, canopy nitrogen profile, photosynthesis, stem reserves, kernel number, kernel weight, competition, spike morphology, breeding, physiology, systems approach.

Dankwoord Acknowledgement
Het verschil in levensstandaard tussen mensen op de wereld is schrikbarend, met excessieve welvaart aan de ene en mensonterende omstandigheden aan de andere kant. Meest schokkend is de wereldvoedselproblematiek, en zet ik me in voor verhoging van de voedselproductie vanuit een wetenschappelijke hoek. Het rationeel omgaan met een dergelijk omvangrijke en sentimentele kwestie vereist een grote inspanning. Die inspanning kan ik alleen leveren met mensen om me heen die me in velerlei opzichten steunen.
Allereerst wil ik mijn ouders bedanken voor hun onbeschrijvelijke inspanning om vanuit eenvoudige omstandigheden het voor al hun kinderen mogelijk te hebben gemaakt zich te ontplooien naar eigen ideeën en capaciteiten. Ma, met name jouw doorzettingsvermogen en vastbeslotenheid is formidabel en ik ben maar al te blij dat ik daar wat van heb overgeërfd. Pa, jouw relativerings- en aanpassingsvermogen maakt dat je hele goede afgewogen beslissingen kunt nemen. Vol moed probeer ik die eigenschappen te ontwikkelen en hoop ze ooit eigen te maken.
Evelyn, rust en motivatie voor mijn handelingen vind ik bij jou. Ondanks het gesleep over de aardbol, laat je je niet uit het veld slaan en zorg je er voor dat ons leven harmonieus verloopt. Daar hecht ik heel veel waarde aan. En dan het meest wonderbaarlijke in ons leven, Jalini en Neeraj. Twee lachebekken die heel wat vreugde in ons leven brengen en die zonder meer op hun eigen speciale wijze hebben bijgedragen aan de totstandkoming van dit proefschrift. Jalini, dit is nu papa zijn proefschrift! Neeraj, het is af. OOH JEEJ!
Dinder, Padma, Dharma, Usha, Paul, Biendia, Kiran, Devika, Shaam, Madan, Mila, Ashna, Nirul, Soerin, Nirmala, Jayvant, Vandana, Anand, Chitra, Madhuwi, Kajal, Geeta, Radjin, Shalini, Lelita, Chander, Jashvant, Vinesh, Sujata, Mila, Rohid, Greet, Roland, Jacqueline en Arjen, stuk voor stuk geven jullie mede inhoud aan ons leven, of we nu naast jullie zitten, of aan het andere eind van de wereld zijn. Lelita en Jacqueline, dank voor jullie inzet voor het behartigen van onze belangen in Nederland tijdens onze afwezigheid.
Naast sociaal-emotionele ontwikkeling, is mijn wetenschappelijke opvoeding zeer nauwkeurig begeleid in Wageningen, in het bijzonder door de hoogleraren dr. ir. R. Rabbinge en dr. ir. H. van Keulen. Rudy, jouw doortastend analytische vermogen en oog voor zowel de grote lijnen als de details heeft bijgedragen aan een vlot verloop van dit onderzoek. Je bent daarbij in staat de individuele ontwikkeling sterk te stimuleren, zowel op het wetenschappelijke vlak als daarbuiten.
Herman, jouw encyclopedische kennis omtrent allerhande landbouwkundige aspecten, in het bijzonder van de groei van tarwe, is uiterst bruikbaar geweest bij het ontwikkelen en uitwerking van hypothesen. Ondanks je overvolle agenda heb je eveneens enorm bijgedragen aan het leesbaar maken van het verhaal.
This thesis is the result of research conducted in a collaborative project between the Wageningen Agricultural University and the International Maize and Wheat Improvement Center (CIMMYT) in Mexico. These institutes have contributed both in financial and intellectual terms to its realization. I believe that it has been a fruitful collaboration. I am convinced that such collaborative projects are not only beneficial to the institutes involved, but more importantly, contribute most effectively to solve agricultural problems.
At CIMMYT I was directly supervised by dr. R.A. Fischer. Tony, it has been a privilege to draw upon your knowledge on wheat. Convincing the world leading wheat physiologist that some of the ideas I had were worthwhile investigating, forced me into a thorough analysis. I hope many more can draw upon your knowledge.
Conducting experiments is a speciality in itself and I can praise myself lucky to have been cared after by dr. K.D. Sayre. Ken, it was phenomenal to see how you were able to manage your (and my) trials in such a way that they really addressed the hypothesis. Undoubtedly, I would not have obtained the current quality of data without your supervision of the trials.
Juntar datos de campo con temperaturas por encima de 30 grados no es lo mâs agradable que se puede hacer en la vida. Sin embargo, el apoyo de Eugenio Perez Dorame rue indispensable para obtener la información usada en esta tesis. Eugenio, muchisimas gracias por tu ayuda, interés en el trabajo y tu paciencia.
Muchos mâs muchachos me han ayudado a juntar en el campo el montón de datos que se han usado en esta tesis. A Luis, Jesus, Sergio, Jaime, Saul, Leoardo, Manuel, Rodriguez, Isidro, Juanito, Milka, Alma, Maria, Arcelia, Manuel y muchos mâs, gracias por sus esfuerzos.
Ernesto Solis ejecutó un ensayo en Celaya con mucha precision. A Ernesto, y a tus ayudantes, muchas gracias por tanta dedicación.
La colaboracion con Pablo Abbate de Argentina resultó muy positiva. Pablo, gracias por tu apoyo, y espero que seguiremos colaborando en el future Que disfrutes tu vida con tu esposa Andrea y tu esperado hijo.
Attempting to bridge the gap between plant physiology and breeding requires excellent communication between scientists from both disciplines. Despite a substantial barrier due to different preferences for the communication language, I have learned a lot about breeding from dr. M. van Ginkel (somehow, the name still sounds Dutch to me). Maarten, je bereidheid om je te verdiepen in ideeën van anderen zal ertoe bijdragen dat
de efficiëntie van de veredeling versneld zal kunnen toenemen. Ik wens je veel sterkte toe met het veredelingsprogramma op het CIMMYT.
KeesJan Kleef heeft als student goede ondersteuning verleend bij de experimenten. Soeris Premchand heeft als NOP-per zijn gezin daarvoor zelfs een half jaar moeten missen. Keesjan en Soeris, bedankt voor jullie goede inzet. Laura Lazaro de Argentina nos acompafió en Obregon y trabajó durisimo para obtener los datos para su tesis. Laura, tu compania fue muy agrabable.
Es war sehr toll mit Rolf Buddendick und Günther Manske in Obregon zusammen zu wohnen. Rolf, danke, daß ich - zwar für Dich etwas langsam - mit Dir laufen durfte. Dank auch für den Weizen Mehl- Mahl- und Brot- Back (Bau?) -Unterricht. Günther, jetzt weiß ich, daß man im Leben ab und zu auch ein bißchen Ruhe braucht. Und Henning Müller zeigt Einem immer wieder was Spaß machen heißt.
Drs. Edmundo Acevedo, Ivan Ortiz-Monasterio, Matthew Reynolds, Ravi Singh, Sanjay Rajaram, George Varughese, Debbie Rees, Anne Elings, Greg Edmeades and many others at CIMMYT have been of great help in various ways and I would like to thank you all for doing so.
Empezar el trabajo cada dia con las alegres secretarias de CIMMYT Ie dió al trabajo un encanto especial. Isabel, Martha, Diana, Margarita, Maria-Elena, Arcelia y otras mâs, ustedes me nan ayudado muchisimo en arreglar millones de cositas. Y todo esto, siempre con una sonrisa formidable.
Vivir en México rue una experiencia grande. Un pais tan bonito, con grandes posibilidades y sus habitantes tan vitales. Many people have made our stay in Mexico even more comfortable, Ursula, Leon, Jakoba, Olaf, Anne, Martha, Julio, Scott, Jennifer, Debra, Harish, Sangeeta, Mike, Norma, Susan, Anita, Yves, Alka, Etienne, Thérèse, Delia, Paul, Melinda, Olivia, Ivan, all their children and many more that I have not even mentioned.
Terug in Nederland heb ik onder sociale en wetenschappelijke begeleiding van medewerkers van de vakgroep TPE en de afdeling ASK van het AB-DLO, plezierig aan mijn proefschrift kunnen werken. Allen van harte bedankt.
Many persons I have not mentioned, but they all have been important in one way or another to reach this point in my career in a pleasant way. Fortunately, the list is almost infinite...
Dit proefschrift is voor de twee belangrijkste begeleiders in mijn leven:

Soesila en Sahadew
Contents
Chapter 1 General introduction 1
Chapter 2 Impact of canopy nitrogen profile in wheat on growth 7
Chapter 3 Identifying major crop characteristics that determine
wheat growth and yield 33
Chapter 4 Dynamics of stem reserves in wheat under a wide range of N availability 55
Chapter 5 Determination of kernel number in wheat and its 67 manipulation
Chapter 6 Kernel growth in wheat:,carbohydrate availability,
competition among kernels and inherent growth potential 85
Chapter 7 General discussion 103
Summary 121
Samenvatting 125 References 129 Curriculum vitae 145
Chapter 1
General introduction
Background
World food production has more than doubled from 1960 to 1995 (FAO, 1995). Current world food production is sufficient to feed the entire world population (IFPRI, 1994), but unequal distribution and limited accessibility results in malnutrition and hunger for almost one billion people. At the recent world food summit in Rome, Italy, much emphasis was, therefore, put on improving accessibility (FAO, 1997). However, for the coming three to four decades, apart from this aspect of the world food problem, world food production should at least triple to meet growing demand (WRR, 1994). World wheat production, for instance, must increase at an annual rate of 3% (CIMMYT, 1995). Wheat yields have increased in most countries during the past three decades at a rate varying from 5 to 100 kg ha~ y~ (Slafer et al., 1994) with an average increase for the world of 45 kg ha~ y~ , or approximately 2% per year. A quarter of the world food production increase in the past resulted from expansion of agricultural land and the remainder from increase in yield per unit area (IFPRI, 1994). Yield increase was realized by the introduction of improved higher yielding and more pest- and disease resistant varieties, and improved agronomic practices, along with increased input of water and agro-chemicals. In contrast to the past decades, area expansion is not desired, as natural and fragile lands would have to be cultivated. Increase in food production will have to come from increased yield (Alexandratos, 1995). Moreover, food will have to be produced where it is most needed to increase food security through generation of income and employment (IFPRI, 1995). The biophysical production potential of the world was estimated to suffice for 10 to 40 billion people, depending on agricultural production system, consumption pattern and landarea for nature conservation (WRR, 1994). However, large differences among regions in production potential per capita demand specific regional attention and efforts.
Cereals are the most important component of the daily diet, with wheat as the biggest single commodity. This thesis is concerned with wheat. Average world wheat yields approximate 2.5 t ha" , but vary from less than 1 (FAO, 1995) up to 10 t ha" (LEI-CBS, 1996), strongly dependent on management conditions, crop characteristics and environmental potential. A substantial part of wheat production comes from regions with favourable soil and environmental conditions, where high yields are obtained under advanced agronomic practices. Based on environmental conditions and management practices such wheat producing regions in the (sub-)tropics are categorized

Chapter 1
by the International Maize and Wheat Improvement Centre (CIMMYT) as Mega Environment 1 (ME1) (Rajaram, 1995). Over forty percent of wheat in developing nations is produced in ME1 (CIMMYT, 1995). These regions are generally densely populated with limited land, such as the Indus Valley in Pakistan, the Ganges Valley in India, the Nile Valley in Egypt and the Yaqui Valley in Mexico. Obregon in Sonora state, Mexico and Ludhiana in Punjab state, India are typical locations for ME1. Yields have increased at rates of 50 to 100 kg ha~' y"1 in these regions during the past three decades (Bell and Fischer, 1994; Bhalla et al., 1990), and are approaching attainable yields in experimental fields (Aggarwal and Kalra, 1994; Sayre, 1996).
Estimates by various authors show that the contribution of genetic and management factors to the yield increase in the past were similar, i.e. around 50% (Slafer and Andrade, 1991; Slafer et al., 1994). Because of current advanced agronomic practices in ME1 regions, the contribution of cultivars with higher genetic yield potential to yield increase, is expected to become more important in the future.
Wheat breeders have attained substantial success in the sixties to eighties in increasing genetic wheat yield potential at a rate of 0.5 to 1% per year (Slafer and Andrade, 1991; Waddington et al., 1986), through selection of best genetic combinations on an empirical basis, directed to yield per se. However, as yield is a complex trait, it becomes increasingly difficult to maintain progress, and increase in genetic yield potential has indeed slowed down in the last decade (CIMMYT, 1995), despite the fact that yield potential improvement had been given highest priority among breeders (Byerlee, 1994). To be able to trace improved genetic combinations to further increase wheat yield potential on empirical basis, breeding programs would have to become progressively larger and costly; an unfeasible challenge in an era with decreasing resources. This breeding approach has not allowed exploitation of the physiological potentials of wheat. All means to accelerate or even sustain the rate of increase will, therefore, have to be explored to support breeding efforts.
Future challenges
The moderate increase in genetic yield potential in the last decade, necessitates identification of required changes in crop characteristics that will further increase yield potential. It is presumed that with better knowledge of crop physiology, deficiencies in cultivars and options for improvement may be identified, so that breeding targets can be defined more effectively. In general, the major question is whether the selection for a physiological trait will result in the desired performance. While numerous physiological traits can be changed through breeding, limited time and resources require at least empirical evidence or a theoretical basis for the traits to be adapted, to obtain the
General introduction
required progress before a breeding program is started (Rasmussen, 1984). The progress in breeding will be high when a target crop characteristic is
controlled by one or a few genes with high heritability, like flowering time or height, which have had major impact on yield potential (Richards, 1996). Hence, selection based on such physiological attributes could assist in obtaining genetic gains. The direct contribution of physiological knowledge to the improvement in crop productivity has, however, been fairly scant (Jackson et al., 1996). Yield and physiological processes such as photosynthesis, respiration, translocation, and transpiration are quantitative characteristics that are generally conditioned by many genes with small individual effects. Moreover, expression of physiological traits depends on the combination of genotype and environment, and may show considerable variation. The importance of physiological traits may not be evident at different locations or even at the same location, under different management practices. Recommendations for selection are often based on relations of single organ, plant or crop characteristics to yield. Such recommendations of a relative simple level of organization may be too weak to be effective. The optimum expression of many traits will differ from crop to crop, variety to variety, from one to another location, and even at one location among different management practices. Attempts of the plant breeder to change the genetic potential of a crop through particular traits is thus seriously hampered by environmental variation.
To address these problems, close collaboration between plant physiologists and breeders along with other specialists is considered essential to obtain a better understanding of physiological traits, their genetic basis, and their impact on crop performance and yield, depending on environmental conditions. A systems approach provides us with an alternative to overcome such problems through a more holistic view of the system. It facilitates integration of disciplinary knowledge. Complex crop physiological processes and their interactions can be studied using mechanistic crop growth simulation models. The impact of adaptations in traits on growth and yield can, for instance, be assessed in relation to environmental conditions. Approaches to add a genetic basis to the traits are being developed (X. Yin, 1997, Wageningen Agricultural University. Dept. of Plant Breeding and Dept. of Theoretical Production Ecology, pers. comm.).
Systems approach and crop growth simulation
Biological systems, such as crops, are a complex of the quantitative nature of numerous processes. The processes interact among each other and with environmental factors, and have their particular temporal behaviour. Classical physiology explores the mechanistic basis for crop behaviour through reductionistic techniques, by isolating each process.

Chapter 1
However, dynamic quantitative integration of those processes within their context and with their interactions is needed to improve our understanding of the system. Models are a convenient tool to aggregate a multitude of interactions and have been shown useful in various disciplines in agricultural production systems research (Ten Berge et al., 1997; Thiyagarajan et al., 1997; Rossing and Heong, 1997; Bastiaans et al., 1997). Though they have not yet been applied much in conjunction with breeding, some morpho-physiological traits identified through modelling exercises have been incorporated in an ideotype breeding program in rice (Aggarwal et al., 1997; Peng et al., 1994). The systems approach could be a promising tool to delineate recommendations to breeders to enhance breeding efficiency.
Research objective
The objective of the research described in this thesis is to identify crop characteristics that need to be adapted to increase wheat yield potential for ME1 conditions. Morpho-physiological information will be integrated using a systems approach, to improve the quantitative understanding of processes that determine wheat growth and yield for those particular growth conditions.
Thesis outline
The analysis described in this thesis is based primarily on data collected from experiments conducted near Obregon, Sonora state, Mexico, a typical site for MEL To address possible cultivar differences, four modern and one older cultivar were generally included in the analysis. However, cultivars were often grouped as growth processes were similar.
Increasing biomass could result in increased yield, provided the harvest index is not affected. Increase in biomass could be obtained through increased leaf N content (Kropff et al., 1994a) and/or through optimization of the distribution pattern of leaf N over the canopy similar to that of light (Field, 1983). These two options are tested in Chapter 2, using the crop growth simulation model SUCROS (Spitters et al., 1989), adapted for this purpose.
In Chapter 3, a simplified approach is applied to identify major crop characteristics that determine wheat growth and yield. Total crop biomass accumulation under a wide range of N application rates is computed with a simple algorithm, based on radiation use efficiency. The algorithm is used to identify the sources that supply grains with assimilates.
General introduction
It is generally accepted that the amount of stem reserves is the resultant of production and demand of carbohydrates (Schnyder, 1993). The contribution of stem reserves to yield varies considerably, mainly depending on post-anthesis conditions. The results of Chapter 3 suggest, in line with Yoshida (1972), that the contribution of reserves decreases with increasing yield level, as post-anthesis assimilate production can largely supply the required assimilates for grain growth. The analysis of stem reserve dynamics and the contribution of reserves to yield are described in Chapter 4.
Variation in wheat yield is often strongly associated with variation in kernel number per unit area, so that increasing kernel number has been argued to contribute to further increase wheat yield potential. In Chapter 5, factors causing variation in kernel number are identified and options to increase kernel number are discussed.
Kernel weight is considered to be fairly stable. However, substantial variation does occur under varying environmental conditions and large variation exists, associated with the position in the spike. The objective in Chapter 6 is to identify factors and to describe processes that determine growth of kernels in different positions in the spike, in relation to environmental conditions, for wheat grown under optimum management conditions.
In Chapter 7, options to further increase world wheat production are described. It is argued that improved wheat cultivars, with higher genetic yield potential are of crucial importance in realizing part of the required production increase. Application of physiological knowledge and systems approaches as means to identify promising crop characteristics that can assist breeders in their efforts to further increase wheat yield potential are described. Some remarks are made on the applicability of systems approaches as a mediator between physiologists and breeders. The factors identified to have major impact on crop growth and yield are discussed with options for breeders to further increase wheat yield potential.
Chapter L
Impact of canopy nitrogen profile
in wheat on growtha
Abstract
The impact of non-uniform canopy N distributions on growth was studied, as such distributions have been described to result in substantially higher canopy photosynthesis over short periods of time compared to a uniform distribution. Canopy N distribution profiles were observed in five spring wheat cultivars grown in the field under optimum management conditions at two planting dates. Leaf N was expressed both on weight and area basis and a curvi-linear relationship of maximum leaf photosynthesis (Am) with leaf N, established in this study, was used. The impact of canopy N profile on growth calculations was assessed with a crop growth simulation model SUCROS, adjusted for this purpose. Introduction of observed profiles did not result in general improvement of growth calculations compared to the standard version of SUCROS. A uniform canopy N profile with observed upper leaf N hardly altered the response, because photosynthesis deeper in the canopy is almost entirely determined by radiation intensity. A uniform profile based on average canopy leaf N could result in underestimations of growth. No major differences in response to the introduction of canopy N profiles became apparent among cultivars. Increase in biomass production through increased leaf N was found to depend strongly on the curvature of the Am-leaf N relationship. Responses appeared sensitive to changes in initial light use efficiency (e), but variation in e has not been found in literature to be associated to leaf N. These strong sensitivities imply that analyses of an extrapolative nature should be interpreted with great caution and reservation. It is deduced from the analysis that determination of total canopy LAI and upper leaf N suffices for growth estimation.
" Bindraban, P.S., 1997. Impact of canopy nitrogen profile in wheat on growth. Field Crops Research (accepted with revisions).
Chapter 2
Introduction
Canopy photosynthesis has been hypothesized to be maximized when leaf N distribution pattern within the canopy would be similar to that of light (Field, 1983; Goudriaan, 1995). Leaf N has indeed been observed to decline with depth in the crop canopy in various species (Field, 1983; Hirose and Werger, 1987; Pons et al., 1989). However, while most models do consider the impact of light distribution in the canopy on photosynthesis and growth, not many consider the impact of canopy N distribution. Studies on canopy N profile are generally limited to daily calculations or short periods of growth.
Substantial advantage in canopy photosynthesis of observed non-uniform canopy N profiles over uniform profiles for given average canopy leaf N has been reported (Hirose and Werger, 1987; Wright and Hammer, 1994; Anten et al., 1995; Connor et al., 1995), while further optimizing the canopy N profile to radiation regime results in minor increases only (Anten et al., 1995; Connor et al., 1995; Pons et al., 1989). The advantage has been shown to be larger in denser canopies, irrespective of the total amounts of canopy leaf N (Hirose and Werger; 1987), as the range in radiation intensity is too narrow to benefit from a non-uniform profile at low values of leaf area index (LAI) (Goudriaan, 1995). Although general conclusions of analyses on canopy N profile are comparable, remarkable differences in sensitivity are reported among studies, mainly as a result of differences in applied relations between leaf N and leaf photosynthesis.
Leaf photosynthesis at light saturation (Am) under nitrogen limited growth conditions and further optimum crop management are mainly affected by leaf N and temperature. Both linear (Van Keulen and Seligman, 1987) and curvi-linear (Evans, 1983) Am-leaf N relations have been reported with leaf N expressed both on weight and area basis. Kropff et al. (1994a, b) argue that leaf N should be expressed on a leaf area basis, because Am would depend on the amount of chlorophyll or Rubisco per unit leaf area. Connor et al. (1995) however, suggest to express leaf N on a weight basis, as leaves are the morphological units that intercept radiation and because they are the physiological units of nitrogen mobilization. The quantitative impact of temperature on photosynthesis in wheat is described only weakly (Versteeg and Van Keulen, 1986).
In this study the impact of canopy N profile on wheat growth is quantified for the entire growth period. Canopy N profiles of five spring wheat cultivars at two planting dates were observed with leaf N expressed both on weight and area basis. Two scientific devices to determine LAI and leaf N non-destructively were validated for this purpose. The relations of leaf N and temperature to leaf photosynthesis were established through field measurements. The impact of non-uniform canopy N profiles on total aboveground biomass was analysed with a crop growth simulation model SUCROS (Spitters et al.,
Canopy nitrogen profile
1989), adapted for this purpose. The impact of the introduction of canopy N profile on growth calculation, biomass increase through increased leaf N, cultivar differences and options to simplify crop growth models are discussed.
Materials and Methods
Experiments Data were collected over a two-year period, 1993/94 and 1994/95, referred to as cycle I and II, respectively, at the CIMMYT (Centra Internacional de Mejoramiento de Maiz Y Trigo) experimental site in the Yaqui Valley, Sonora state, Mexico (40 meters above sea level and 28°N and 109°W). In Exp. 2.1, four spring bread wheats, Bacanora, Oasis, Weaver (advanced line) and Baviacora, and one spring durum wheat Altar, widely varying in crop characteristics, were sown on Nov. 30 in both cycles. Crops were grown under optimal management conditions as described by Bindraban et al. (1997) for their Exp. 2.3. In Exp. 2.2, the same set of cultivars was planted under identical management conditions as in Exp. 2.1 on Jan. 18 and 17 in cycle I and II, respectively. In both Exps. 2.1 and 2.2, Altar was replaced in cycle II by the bread wheat cultivar Siete Cerros. In cycle II, the cultivars Siete Cerros and Bacanora were grown on a N depleted area at basal N application rates of 0 and 300 kg ha"1 (Exp. 2.3), while Siete Cerros and Baviacora were grown at 0 and 150 kg ha-1 (basal) (Exp. 2.4) in a non-N-depleted area. In Exp. 2.5, Bacanora and Baviacora were sown at an extremely late date (15 Feb.) in cycle II at a basal N application rate of 150 kg ha" .
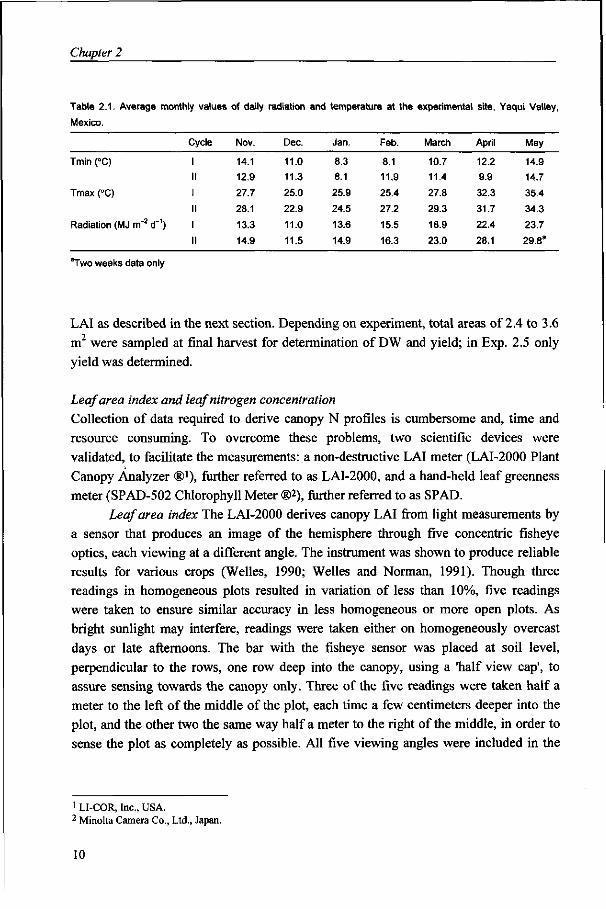
In all experiments the entries were sown in plots of eight rows, spaced at 20 cm, 5 to 6 m long. Experiments consisted of three replications, with two plots per cultivar in Exps. 2.1 and 2.2. Frequent irrigation ensured adequate water availability, while weeds were completely controlled. Pest and disease control was complete in Exps. 2.1 to 2.4, while diseases were not controlled in Exp. 2.5, but no disease pressure was observed in this crop. Soil characteristics, basal nutrient applications and additional general management practices are as described in Bindraban et al. (1997). Radiation and temperature conditions covering the growth period for all experiments in both cycles are given in Table 2.1.
Total aboveground dry weight Total aboveground dry weight (DW) during crop growth was determined by sampling 0.50 m long sections of the six central rows at ground level. Seven and six DW samples were taken during crop growth in Exps. 2.1 and 2.2, respectively, in both cycles, while two DW samples were taken in Exp. 2.3. These samples were also used to determine
Chapter 2
Table 2.1. Average monthly values of daily radiation and temperature at the experimental site, Yaqui Valley,
Mexico.
Tmin (°C)
Tmax (°C)
Radiation (MJ m"2 d"1)
Cycle
II
II
II
Nov.
14.1
12.9
27.7
28.1
13.3
14.9
Dec.
11.0
11.3
25.0
22.9
11.0
11.5
Jan.
8.3
8.1
25.9
24.5
13.6
14.9
Feb.
8.1
11.9
25.4
27.2
15.5
16.3
March
10.7
11.4
27.8
29.3
18.9
23.0
April
12.2
9.9
32.3
31.7
22.4
28.1
May
14.9
14.7
35.4
34.3
23.7
29.8a
''Two weeks data only
LAI as described in the next section. Depending on experiment, total areas of 2.4 to 3.6
m were sampled at fi:
yield was determined.
m2 were sampled at final harvest for determination of DW and yield; in Exp. 2.5 only
Leaf area index and leaf nitrogen concentration
Collection of data required to derive canopy N profiles is cumbersome and, time and
resource consuming. To overcome these problems, two scientific devices were
validated, to facilitate the measurements: a non-destructive LAI meter (LAI-2000 Plant
Canopy Analyzer ®'), further referred to as LAI-2000, and a hand-held leaf greenness
meter (SPAD-502 Chlorophyll Meter ®2), further referred to as SPAD.
Leaf area index The LAI-2000 derives canopy LAI from light measurements by
a sensor that produces an image of the hemisphere through five concentric fisheye
optics, each viewing at a different angle. The instrument was shown to produce reliable
results for various crops (Welles, 1990; Welles and Norman, 1991). Though three
readings in homogeneous plots resulted in variation of less than 10%, five readings
were taken to ensure similar accuracy in less homogeneous or more open plots. As
bright sunlight may interfere, readings were taken either on homogeneously overcast
days or late afternoons. The bar with the fisheye sensor was placed at soil level,
perpendicular to the rows, one row deep into the canopy, using a 'half view cap', to
assure sensing towards the canopy only. Three of the five readings were taken half a
meter to the left of the middle of the plot, each time a few centimeters deeper into the
plot, and the other two the same way half a meter to the right of the middle, in order to
sense the plot as completely as possible. All five viewing angles were included in the
1 LI-COR, Inc., USA. 2 Minolta Camera Co., Ltd., Japan.
10

Canopy nitrogen profile
calculation of total canopy LAI, as elimination of the largest angle hardly altered LAI
estimates, indicating the width of the plots to be sufficient.
The LAI-2000 was also validated for different depths in the canopy by placing
the sensing bar at different depths, marked with a thin rope. All leaves between the
ropes were destructively sampled for LAI determination.
Leaf area was destructively determined with a LI-1000 leaf area meter®3.
Readings of this meter showed a 99% correlation and regression coefficient of 1, with
leaf area of subsamples estimated as leaf length x maximum leaf width x 0.75.
Destructively determined LAIs were used to validate LAI-2000 readings, that were
taken within one or two days from DW sampling.
Leaf nitrogen concentration Leaf greenness ratings (LGR) with the SP AD have
shown close relations with leaf N in several crops (Peng et al., 1993; Wood et al.,
1992a, b). Regression coefficients appear variable and a relationship specific for the
wheat growth conditions in this study was established. Leaves were sampled near
anthesis at different depths within the canopy in Exps. 2.1 and 2.2 in cycle I and in
Exp. 2.1 in cycle II. Average LGRs of three readings taken near the top, middle and
base of a leaf showed highest correlations with leaf N (Kjeldahl) expressed on a weight
basis. Leaf dry weight, leaf length and width measurements were used to express leaf N
on an area basis.
Canopy nitrogen profiles
Canopy nitrogen profiles were established in the field by means of the LAI-2000 and
the SP AD without disturbing the canopy. Depending on crop height, measurements
were taken at three to six different depths, 10 to 20 cm apart. At each depth, five
readings with the LAI-2000 and ten SP AD readings on any part of leaves present at that
height, were taken. Measurements were taken six and four times throughout crop cycle I
in Exps. 2.1 and 2.2, respectively, in all five cultivars. Third order polynomial
regressions were fit to describe the decline in leaf N with canopy LAI from the top of
the canopy.
Photosynthesis
Photosynthesis was measured with a LI-6200 portable photosynthesis system®4, further
referred to as LI-6200, on three flag leaves per plot. Leaf greenness, and length and
width were measured on individual leaves, while the leaves were mixed for weight and
leaf N determination. Measurements were taken on clear days only, between 13.00 and
15.30 h. Air temperature at the time of sampling was recorded by the LI-6200.
Atmospheric C0 2 concentration was fairly stable between 350 and 370 ppm.
3 LI-COR, Inc., USA. 4 LI-COR, Inc., USA.
11
Chapter 2
Measurements were taken in all experiments in cycle II only, on the cultivars Bacanora,
Baviacora (not in Exp. 2.3) and Siete Cerros (not in Exps. 2.4 and 2.5).
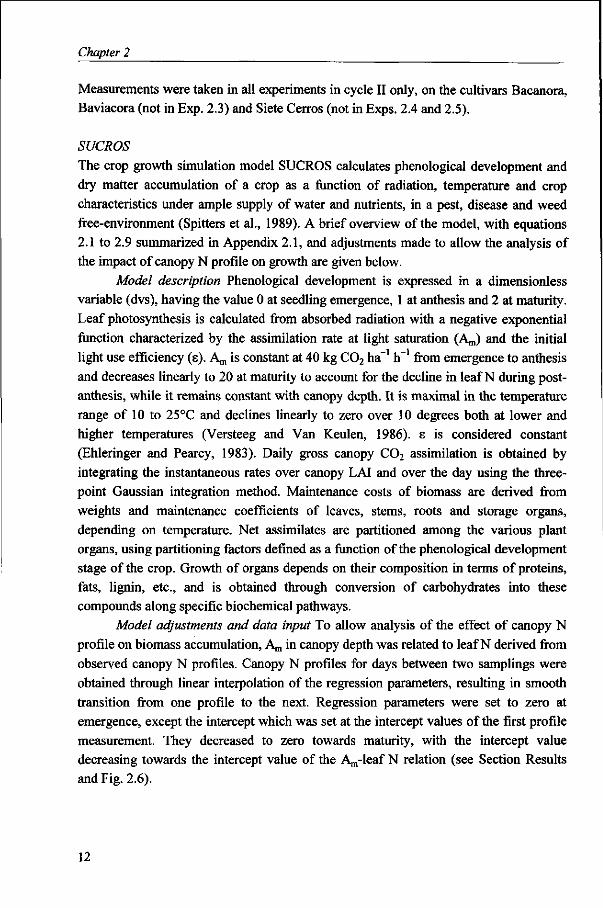
SUCROS
The crop growth simulation model SUCROS calculates phenological development and
dry matter accumulation of a crop as a function of radiation, temperature and crop
characteristics under ample supply of water and nutrients, in a pest, disease and weed
free-environment (Spitters et al., 1989). A brief overview of the model, with equations
2.1 to 2.9 summarized in Appendix 2.1, and adjustments made to allow the analysis of
the impact of canopy N profile on growth are given below.
Model description Phenological development is expressed in a dimensionless
variable (dvs), having the value 0 at seedling emergence, 1 at anthesis and 2 at maturity.
Leaf photosynthesis is calculated from absorbed radiation with a negative exponential
function characterized by the assimilation rate at light saturation (Am) and the initial
light use efficiency (e). Am is constant at 40 kg C0 2 ha-1 h_1 from emergence to anthesis
and decreases linearly to 20 at maturity to account for the decline in leaf N during post-
anthesis, while it remains constant with canopy depth. It is maximal in the temperature
range of 10 to 25°C and declines linearly to zero over 10 degrees both at lower and
higher temperatures (Versteeg and Van Keulen, 1986). E is considered constant
(Ehleringer and Pearcy, 1983). Daily gross canopy C0 2 assimilation is obtained by
integrating the instantaneous rates over canopy LAI and over the day using the three-
point Gaussian integration method. Maintenance costs of biomass are derived from
weights and maintenance coefficients of leaves, stems, roots and storage organs,
depending on temperature. Net assimilates are partitioned among the various plant
organs, using partitioning factors defined as a function of the phenological development
stage of the crop. Growth of organs depends on their composition in terms of proteins,
fats, lignin, etc., and is obtained through conversion of carbohydrates into these
compounds along specific biochemical pathways.
Model adjustments and data input To allow analysis of the effect of canopy N
profile on biomass accumulation, Am in canopy depth was related to leaf N derived from
observed canopy N profiles. Canopy N profiles for days between two samplings were
obtained through linear interpolation of the regression parameters, resulting in smooth
transition from one profile to the next. Regression parameters were set to zero at
emergence, except the intercept which was set at the intercept values of the first profile
measurement. They decreased to zero towards maturity, with the intercept value
decreasing towards the intercept value of the Am-leaf N relation (see Section Results
and Fig. 2.6).
12

Canopy nitrogen profile
As substantial error can occur in simulations due to incorrect simulation of ponderous crop growth processes, like phenological development (Porter et al., 1993) and LAI (Kropff et al., 1994b), observed phenological development and LAI were introduced as forcing functions to better focus on the relevant processes to be studied. Relationships of leaf N and temperature to Am as determined in this study (see Section Results), were introduced in the model.
Growth estimates The adapted version of SUCROS was used to determine the impact of canopy N profiles on growth in Exps. 2.1 and 2.2 in cycle I. Simulated total aboveground dry weight (ESDW) was compared to DW observed approximately three weeks before and one week after anthesis, and at maturity, with ESDW expressed as the percentage difference with DW. Simulation results of the adapted version of SUCROS, but with a uniform canopy N profile and the standard SUCROS-pattern of Am during the crop cycle were used as reference (SUCROS). The impact of canopy N profile was determined through introduction of observed profiles as forcing functions (Profile A). Simulations were also made, assuming a uniform profile with the intercept values of the profile description, representing upper leaf N (Profile B). Additionally, simulations were made for a uniform profile with average canopy N content, determined by dividing total nitrogen, obtained through integrated leaf N content over the canopy N profile, by LAI (Profile C). Leaf N in the profiles was expressed on both weight and area basis.
Results
Environmental growth conditions and biomass accumulation DW at maturity is presented in Table 2.2. DW was high in Exp. 2.1 under optimum management conditions with high LGRs in upper leaves. DW in Exp. 2.2 was reduced as a result of a shorter growth period due to higher temperatures and longer photoperiods, but LGRs of upper leaves remained high. The strongly N depleted soil resulted in extremely low DW without nitrogen application in Exp. 2.3. Plants consisted of a main stem only and spike and leaf size were strongly reduced. LGR values of upper leaves were low, even around anthesis. The soil in Exp. 2.4 was not N depleted, so that DW without nitrogen application reached 10 to 13 Mg ha-1. The canopy had a closed and green appearance with high LGRs of upper leaves. DW of 11 to 12 Mg ha~ was obtained with later planting in Exp. 2.5, because of a shorter growth period due to higher temperatures and longer photoperiods. The crop remained short, but leaves remained green, maintaining high LGRs in upper leaves.
13

Chapter 2
Table 2.2. Dry weights at maturity for all cultivars in all experiments.
Exp.
2.1
2.2
2.3
2.4
2.5
Cycle-
Treatment
I
II
I
II
ll-O
li-300
ll-O
11-150
II
Siete Cerros
17.2
13.8
2.7
15.4
Bacanora
19.4
18.4
15.3
15.2
2.7
15.9
10.4
15.7
11.2a
Oasis Weaver
17.7 20.7
15.6 18.5
13.0 16.6
12.6 15.1
Baviacora
19.8
19.2
17.2
16.1
12.7
15.7
12.0a
Altar
20.5
15.5
' Assessed from yield, assuming a HI of 0.40 (unpubl. data).
Leaf area index and leaf nitrogen concentration
Leaf area index LAI values measured by the LAI-2000 before anthesis strongly
correlate to destructively determined LAI (Fig. 2.1). However, the LAI-2000 appears
not capable to distinguish differences at high LAI values, i.e. at destructively
determined values exceeding about 7 to 8.
After anthesis, LAI-2000 values exceed destructively determined green leaf area
index (GLAI), as dead leaves are sensed also by the meter. As leaf death progresses in
the course of grain filling, overestimates increase progressively. Coefficients of
regressions forced through the origin for different dates of post-anthesis LAI-2000
measurements on destructively determined GLAI (Fig. 2.2A), represent relative
correction factors for those specific development stages. Such correction factors were
derived from various experiments and plotted against crop development stage in Fig.
2.2B. In cycle II the fraction dead leaves during grain filling was estimated visually also
(Fig. 2.2B). Fraction green LAI at maturity was based on destructive sampling for Exp.
2.1 in cycle I, while visual estimates were made in cycle II. The solid line was applied
to correct post-anthesis LAI-2000 readings to obtain GLAI.
LAI-2000 measurements at different depths within the canopy compared to
destructively determined LAI, similarly as total canopy LAI (data not shown).
14

Canopy nitrogen profile
10.0
8.0 •
6.0 •
A D 0 A 0
• • A
29 40 56 70 35 48 62
•2.1* -2.1 -2.1 -2.1 -2.2 -2.2 -2.2
10.0 •
8.0 •
6.0 •
4.0 •
2.0 •
0 0 •
B
D 33-2 .1* 0 52-2.1 A 67-2.1 • 29-2.2 • 42-2.2 A 58-2.2
*— 1
-fir."
1
A A O
. . ' A A
1
A ..- ' '
/ ^
...-''
1
0.0 2.0 4.0 6.0
Leaf Area Index LAI-2000 (m2 nrr2)
8.0
Figure 2.1. LAI measured with the LAI-2000 versus destructively determined LAI for all 5
cultivars in Exps. 2.1 and 2.2 at different dates after emergence (DAE) during pre-anthesis
for cycle I (A) and II (B). Solid line for perfect fit, dotted lines for 15% deviation. #: DAE-Exp.
15

Chapter 2
E E, x O) -a _c ai P
m <ü
—i
> "•e
to a> Q
8.0 T
6 . 0 -
2.0 4.0 6.0
Leaf Area Index LAI-2000 (m2 m2)
o o o CM
o o
c o ''S Q)
O O
1.0
0.8
t 0.6
0.4
0.2 -
0.0
o % . X. • ^ ~
0
• Exp. 2.1-1 • Exp. 2.2 - 1 o Exp. 2.1 -II o Exp. 2.2 - II A Exp. 2.3 - II + Exp. 2.1 - ll-eye
- x Exp. 2.2 - ll-eye x Exp. 2.3 - ll-eye - Exp. 2.4 - ll-eye
—Assumed 1
t
0
- i
+ ^ < A *
oX ' \
—1 1
B
+
1.0 1.2 1.4 1.6 1.8
Crop development stage (SUCROS)
2.0
Figure 2.2. LAI measured with the LAI-2000 versus destructively determined LAI for all 5
cultivars in Exp. 2.1, cycle I during post-anthesis. Regression coefficients of forced regressions
through the origin yield a relative correction factor (A). Correction factors as determined in
several experiments in both cycles I and II during post-anthesis crop development (B).
16
Canopy nitrogen profile
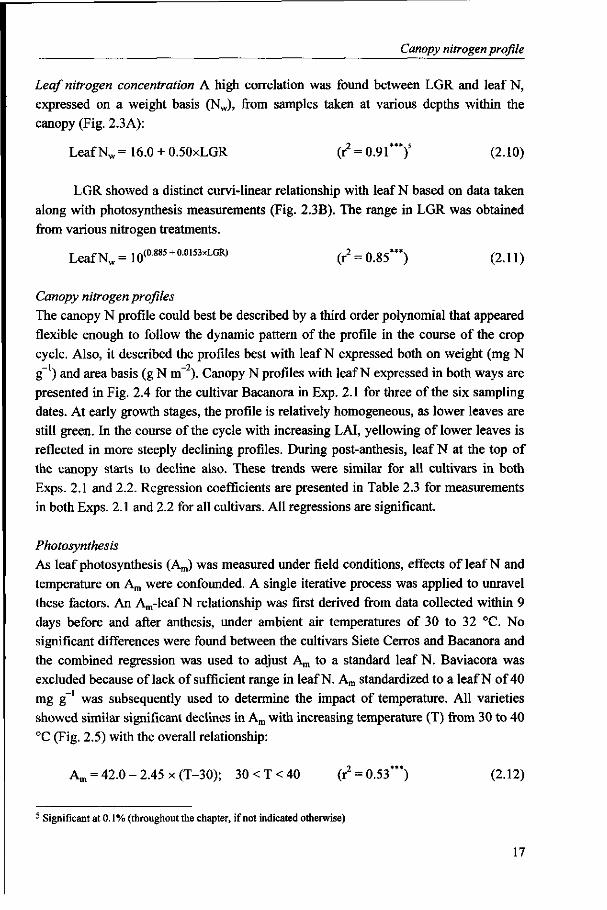
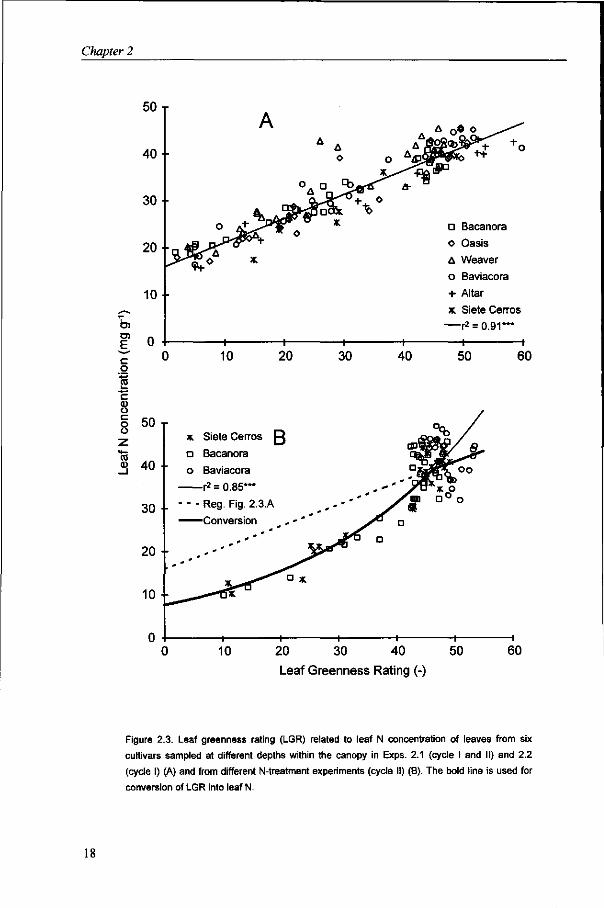
Leaf nitrogen concentration A high correlation was found between LGR and leaf N, expressed on a weight basis (Nw), from samples taken at various depths within the canopy (Fig. 2.3A):
Leaf Nw = 16.0 + 0.50xLGR (r2 = 0.91*")5 (2.10)
LGR showed a distinct curvi-linear relationship with leaf N based on data taken along with photosynthesis measurements (Fig. 2.3B). The range in LGR was obtained from various nitrogen treatments.
LeafNw= 10(0885 + 00153><LGR) (r2 = 0.85***) (2.11)
Canopy nitrogen profiles The canopy N profile could best be described by a third order polynomial that appeared flexible enough to follow the dynamic pattern of the profile in the course of the crop cycle. Also, it described the profiles best with leaf N expressed both on weight (mg N g_1) and area basis (g N m"2). Canopy N profiles with leaf N expressed in both ways are presented in Fig. 2.4 for the cultivar Bacanora in Exp. 2.1 for three of the six sampling dates. At early growth stages, the profile is relatively homogeneous, as lower leaves are still green. In the course of the cycle with increasing LAI, yellowing of lower leaves is reflected in more steeply declining profiles. During post-anthesis, leaf N at the top of the canopy starts to decline also. These trends were similar for all cultivars in both Exps. 2.1 and 2.2. Regression coefficients are presented in Table 2.3 for measurements in both Exps. 2.1 and 2.2 for all cultivars. All regressions are significant.
Photosynthesis As leaf photosynthesis (Am) was measured under field conditions, effects of leaf N and temperature on Am were confounded. A single iterative process was applied to unravel these factors. An Am-leaf N relationship was first derived from data collected within 9 days before and after anthesis, under ambient air temperatures of 30 to 32 °C. No significant differences were found between the cultivars Siete Cerros and Bacanora and the combined regression was used to adjust Am to a standard leaf N. Baviacora was excluded because of lack of sufficient range in leaf N. Am standardized to a leaf N of 40 mg g_1 was subsequently used to determine the impact of temperature. All varieties showed similar significant declines in Am with increasing temperature (T) from 30 to 40 °C (Fig. 2.5) with the overall relationship:
Am = 42.0 - 2.45 x (T-30); 30<T<40 (r2 = 0.53*") (2.12)
' Significant at 0.1% (throughout the chapter, if not indicated otherwise)
17
Chapter 2
o> E, c o
o u •
40-
30-
20-
10-
n •
o
1-
A
£4
1
o o
I 1
dps?* +o
a-
a Bacanora
o Oasis
A Weaver
o Baviacora
+ Altar
x. Siete Cerros
— r 2 = 0.91***
-1 1 1
10 20 30 40 50 60
c 0) o c o Ü
(0 CD
50 -,
4U •
30 •
20 •
10 •
0 •
* Siete Cerros ß
a Bacanora
o Baviacora
r2 = 0.85***
- - - Reg. Fig. 2.3.A
Conversion
» » " j
- ^^*--*tfx
1 1 h
Ä* * " l - j j
" ' / "
""s* > ^ D
Il D
5 3 H ° ° K°<à>
* O G ° o
1 1
10 20 30 40
Leaf Greenness Rating (-) 50 60
Figure 2.3. Leaf greenness rating (LGR) related to leaf N concentration of leaves from six
cultivars sampled at different depths within the canopy in Exps. 2.1 (cycle I and II) and 2.2
(cycle I) (A) and from different N-treatment experiments (cycle II) (B). The bold line is used for
conversion of LGR into leaf N.

Canopy nitrogen profile
Leaf N (g nr2)
0.0 0.5 1.0 1.5 2.0 2.5 3.0
Figure 2.4. Canopy N profiles of Bacanora at anthesis-43d (Q ), anthesis Q> and anthesis+34d i&) in Exp.
2.1 with leaf N expressed on a weight (A) and area basis (B).
This temperature relationship was used to adjust Am to a reference temperature of 30 °C.
These adjusted data were subsequently used to determine the impact of leaf N on Am at
this reference temperature. High correlations were found for Siete Cerros and Bacanora,
while the range in leaf N remained too narrow for Baviacora. The overall regression,
including all three cultivars, showed a curvi-linear relationship with nitrogen, either
expressed on weight (Leaf Nw; mg N g~') or on area basis (Leaf Na; g N m~ ) (Fig. 2.6).
Am = -52.10 + 58.18 x log(Leaf Nw)
Am = 25.59 + 46.43 x log(Leaf Na)
(r2 = 0.82*")
(r2 = 0.75***)
(2.13)
(2.14)
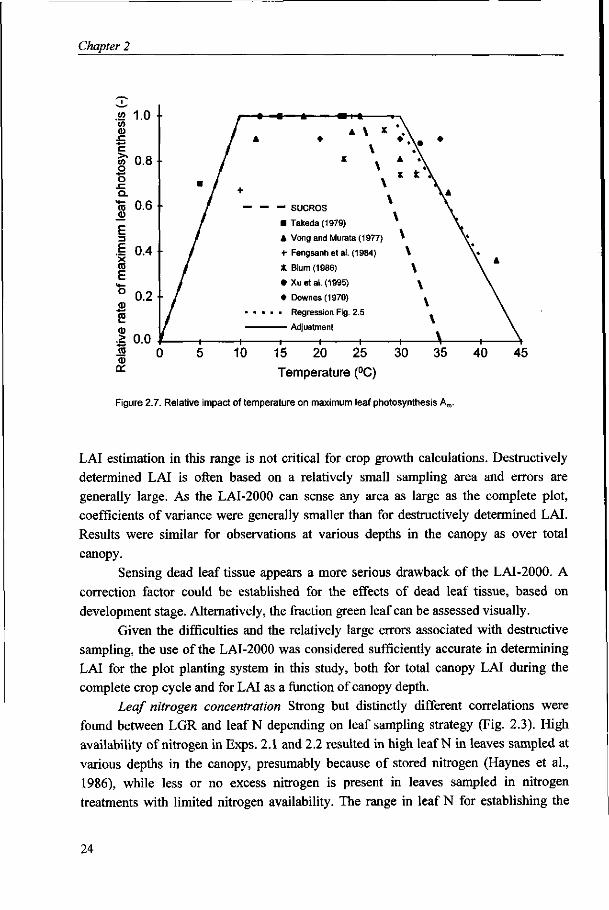
The Am-temperature relationship compares to SUCROS and results reported by other
authors (Downes, 1970; Vong and Murata, 1977; Takeda, 1979; Fengshan et al., 1984;
Blum, 1986; Xu et al., 1995) as given in Fig. 2.7. Am does decline linearly, but over a
wider temperature range than applied in SUCROS, from unity at 30 °C to zero at 45 °C.
19

Chapter 2
Table 2.3A. Regression coefficients of canopy N profiles observed in Exp. 2.1 with leaf N expressed on weight and
area basis.
Cultivar
Bacanora
Oasis
Weaver
Baviacora
Altar
DAEa
39
55
68
82
98
116
39
54
68
77
106
116
39
54
68
90
109
125
39
54
68
81
99
118
39
54
68
77
98
116
x3
-0.487
-0.066
-0.040
0.144
0.244
0.628
0.000
0.052
-0.297
0.259
0.317
0.652
-0.638
-0.167
0.113
0.259
0.247
0.637
-0.559
-0.027
0.033
0.203
0.266
0.636
-0.265
-0.216
0.064
0.130
0.245
0.331
Weight basis (mg N
X2
2.150
-0.732
-0.430
-2.261
-3.494
-7.392
-1.947
-1.083
1.167
-3.337
-4.294
-6.752
3.204
0.309
-1.335
-2.977
-3.303
-6.909
3.763
-0.406
-0.781
-2.842
-3.907
-7.019
1.953
0.584
-1.809
-2.220
-3.552
-4.426
X,
-3.329
2.200
0.512
5.281
8.707
18.734
1.193
-1.419
-1.756
6.509
9.982
12.455
-6.023
-2.089
-0.115
3.818
6.725
15.383
-7.563
0.179
0.009
5.638
9.900
14.915
-4.261
-1.129
3.664
4.689
7.996
8.650
g-1)
x„ 38.1
33.0
35.4
37.3
35.9
25.3
39.4
38.6
39.3
40.3
40.2
34.6
38.9
39.3
38.8
38.5
37.3
23.1
37.9
35.9
38.9
39.9
40.8
33.2
42.7
42.3
42.9
43.6
45.1
41.9
r2
0.65
0.86
0.97
0.96
0.97
0.95
0.43
0.97
0.88
0.80
0.95
0.92
0.93
0.86
0.93
0.97
0.88
0.92
0.55
0.86
0.93
0.98
0.89
0.94
0.77
0.85
0.93
0.90
0.97
0.97
x3
-0.0214
0.0114
0.0032
0.0040
0.0065
0.0354
0.0000
0.0128
0.0001
0.0101
0.0085
0.0333
-0.0210
0.0050
0.0015
0.0078
0.0061
0.0522
-0.0008
0.0042
0.0000
0.0043
0.0052
0.0346
-0.0190
0.0067
0.0058
0.0054
0.0051
0.0223
Area basis (g N m
X2
0.1093
-0.0901
-0.0095
-0.0256
-0.0549
-0.3527
-0.0748
-0.0570
0.0114
-0.0715
-0.0681
-0.2772
0.1327
-0.0135
0.0237
-0.0391
-0.0422
-0.4298
0.0358
-0.0108
0.0355
-0.0194
-0.0334
-0.3104
0.1377
-0.0384
-0.0354
-0.0254
-0.0277
-0.1891
x, -0.5874
-0.2087
-0.4165
-0.3566
-0.2636
0.5690
-0.4016
-0.5156
-0.4929
-0.3538
-0.3110
0.1068
-0.7037
-0.5254
-0.5900
-0.4676
-0.3642
0.5587
-0.5660
-0.4416
-0.5963
-0.4555
-0.4022
0.2606
-0.7243
-0.4443
-0.4509
-0.4846
-0.4763
-0.1300
-2) X0
2.67
2.32
2.49
2.66
2.53
1.81
2.76
2.71
2.75
2.85
2.83
2.43
2.72
2.75
2.74
2.75
2.66
1.57
2.65
2.53
2.76
2.89
2.90
2.35
2.99
2.96
3.05
3.14
3.20
2.96
r2
0.99
0.99
0.99
0.99
0.99
0.98
0.93
0.99
0.98
0.98
0.99
0.97
0.99
0.98
0.99
0.99
0.98
0.91
0.98
0.99
0.99
1.00
0.98
0.98
1.00
0.98
0.99
0.99
1.00
1.00
Days after emergence
Growth calculations by SUCROS
ESDW by SUCROS with LAI and development introduced as forcing function
generally differs less than 10% from DW in Exp. 2.1 throughout the cycle (Table 2.4A),
except for Baviacora. ESDW at maturity is similar to DW. ESDW in Exp. 2.2 is
substantially higher than DW during early growth, but is generally within 10% of DW
20

Canopy nitrogen profile
Table 2.3B
area basis.
Cultivar
Bacanora
Oasis
Weaver
Baviacora
Altar
Regression coefficients of canopy N profiles observed
DAEa
74
87
103
117
74
87
104
116
74
87
108
117
74
87
103
117
74
87
96
116
x3
0.292
0.139
0.316
0.667
0.109
0.128
0.501
0.823
0.238
-0.208
0.555
3.033
0.174
0.113
0.326
0.701
-0.058
-0.246
0.081
1.332
Weight basis (mg N
X2
-3.867
-2.429
-4.081
-6.692
-1.918
-2.253
-5.386
-6.072
-2.904
1.001
-5.702
-21.397
-2.373
-2.031
-4.168
-6.857
-0.418
0.887
-1.753
-10.567
X,
9.014
6.728
8.953
12.466
3.284
3.957
8.902
8.223
5.087
-2.324
9.793
30.834
4.660
4.824
8.697
10.974
1.021
-0.637
3.740
13.700
g"1)
X0
38.3
35.5
35.1
29.0
39.3
40.8
41.0
17.3
38.4
40.2
33.8
29.6
37.9
39.2
38.6
36.0
43.3
44.3
43.2
36.1
r2
0.91
0.93
0.95
0.82
0.93
0.95
0.89
0.43
0.91
0.95
0.87
0.83
0.90
0.96
0.93
0.95
0.89
0.99
0.97
0.85
in Exp. 2.2 with leaf N expressed on weight and
x3
0.0008
0.0050
0.0152
0.0357
0.0100
0.0102
0.0226
0.0447
0.0075
-0.0009
0.0223
0.1518
0.0019
0.0037
0.0123
0.0318
-0.0018
0.0008
0.0041
0.0665
Area basis (g N m
X2
0.0279
-0.0388
-0.1347
-0.3105
-0.0618
-0.0709
-0.1749
-0.3069
-0.0335
0.0317
-0.1808
-1.0184
0.0145
-0.0173
-0.1051
-0.2600
0.0442
0.0066
-0.0165
-0.4737
X,
-0.5672
-0.3035
-0.1229
0.2618
-0.3872
-0.3741
-0.2055
0.2380
-0.4431
-0.5571
-0.0863
1.1405
-0.5179
-0.4237
-0.2464
0.0139
-0.6111
-0.5099
-0.4815
0.2308
-2) X0
2.68
2.58
2.52
2.04
2.76
2.89
2.90
1.21
2.69
2.82
2.37
2.08
2.66
2.83
2.79
2.54
3.03
3.12
3.06
2.52
r2
0.99
0.99
0.99
0.91
0.99
0.99
0.98
0.58
0.99
0.99
0.94
0.92
0.98
1.00
0.99
0.97
0.99
1.00
0.99
0.92
a Days after emergence
at maturity (Table 2.4A).
ESDW for the three nitrogen profile scenarios expressed as percent deviation
from DW is also given in Table 2.4. ESDW with observed canopy N profile, expressed
both on weight and area basis (profile A), differs less than 5% from the SUCROS
estimated value for the bread wheats. Generally ESDW is slightly lower during the crop
cycle, while it is slightly higher at maturity, relative to SUCROS. For a uniform canopy
N profile, ESDW in both Exps. 2.1 and 2.2 is generally slightly higher relative to
SUCROS, using the intercept value (profile B), with stronger responses when leaf N is
expressed on area basis. ESDW is somewhat lower when using an average nitrogen
content (profile C), with comparable responses for leaf N expressed either on weight or
area basis. No major cultivar differences in response to the introduction of canopy N
profiles occur within the bread wheats. The durum wheat Altar tends to show a slightly
stronger response than the bread wheats.
21

Chapter 2
ç* ou •
'm CM
8 40
1> 30 'in a>
4—«
c
8 20 o Q.
M— 05 <D
i 10 3
E X
ro ^ 0
0 <D \ DQ-Op i 0 o
es ° T f t \ j : °
*°*D A > K • ogo \ ^ D«P
K Siete Cerros
a Bacanora
0 Baviacora
—r2=0.53***
1 1
^ \ i
0 ^ 0 0 o
1
25 30 35 Temperature (°C)
40
Figure 2.5. Impact of temperature on maximum leaf photosynthesis A^.
Discussion
ObservedDW vs. ESDW ESDW of SUCROS is very close to observed values for Exp. 2.1 with LAI and phenological development introduced as forcing function. Overestimates for Exp. 2.2, especially during early growth, also occurred in an analysis with a less comprehensive calculation algorithm, as described by Bindraban et al. (1997). In both analyses it remains unclear what causes the overestimates. This imperfection however, does not affect the conclusions of the analysis in this study.
Leaf area index and leaf nitrogen concentration Leaf area index LAI during pre-anthesis can be accurately determined by the LAI-2000 (Fig. 2.1). The resolution decreases at LAI values exceeding 7 to 8, presumably because light interception is virtually constant within this range. This also implies that accurate
22

Canopy nitrogen profile
60
40
20 CO sz
CM o O O)
J *
« 0 CU
c >> CO
o
X. Siete Cerros
0 Bacanora
0 Baviacora
—r2=0.82*"
30 45 Leaf N (mg g1)
—i 60
•S 60
E
8 45 1
30
15
B
0.0
x. Siete Cerros
0 Bacanora
0 Baviacora
—r2=0.75***
2.0 3.0
Leaf N (g rrr2)
-» 4.0
Figure 2.6. Maximum leaf photosynthesis Am as related to leaf N expressed on weight (A) and area
basis (B).
23
Chapter 2
'in 0)
JO c >. CO
o o x: Q.
H— (0
JU E £ X 03
E
>
1.0
0.8
0.6
0.4
0.2
no
• /
• 1
J A
+
1
^ A \ «
\ * s
\ \
— SUCROS • Takeda (1979)
A Vong and Murata (1977)
+• Fengsanh et al.
X. Blum (1986)
• Xu et al. (1995)
• Downes(1970)
. . . . . —i 1
(1984)
2.5
*\ A . \
«It X
\
\ \ \ \ \
—1
•
\ A
Y
V
^ —
\ A
—1 ^
SS o 10 15 20 25 30
Temperature (°C)
35 40 45
Figure 2.7. Relative impact of temperature on maximum leaf photosynthesis Am.
LAI estimation in this range is not critical for crop growth calculations. Destructively
determined LAI is often based on a relatively small sampling area and errors are
generally large. As the LAI-2000 can sense any area as large as the complete plot,
coefficients of variance were generally smaller than for destructively determined LAI.
Results were similar for observations at various depths in the canopy as over total
canopy.
Sensing dead leaf tissue appears a more serious drawback of the LAI-2000. A
correction factor could be established for the effects of dead leaf tissue, based on
development stage. Alternatively, the fraction green leaf can be assessed visually.
Given the difficulties and the relatively large errors associated with destructive
sampling, the use of the LAI-2000 was considered sufficiently accurate in determining
LAI for the plot planting system in this study, both for total canopy LAI during the
complete crop cycle and for LAI as a function of canopy depth.
Leaf nitrogen concentration Strong but distinctly different correlations were
found between LGR and leaf N depending on leaf sampling strategy (Fig. 2.3). High
availability of nitrogen in Exps. 2.1 and 2.2 resulted in high leaf N in leaves sampled at
various depths in the canopy, presumably because of stored nitrogen (Haynes et al.,
1986), while less or no excess nitrogen is present in leaves sampled in nitrogen
treatments with limited nitrogen availability. The range in leaf N for establishing the
24

Canopy nitrogen profile
Table 2.4A. Observed dry weight (DW) with standard deviation (STD) during cycle I of Exp. 2.1. Estimated dry
weight with SUCROS parameterization and with the profiles A, B and C (see text for explanation) for leaf N
expressed both on weight and area, basis is presented as percentage difference to observed DW. Statistical
difference of estimated to observed values is indicated as: ~ (0.1-0.05); * (0.05-0.01) and ** (<0.01)
EXP. 2.1
Pre-anthesis
Bacanora
Oasis
Weaver
Baviacora
Altar
Obs.
DW
(Mg ha
6.80
5.53
7.05
6.79
7.54
STD
DW
-1)
0.79
0.02
0.80
0.83
0.15
SUCROS
8.0
4.4
3.3
21.6"
1.2
A
Profile
B
Leaf N (mg g"
5.3
3.5
0.6
17.5"
2.2*
6.1
4.8
3.7
21 .1"
3.3"
C
C/a\
1) 3.4
1.2
-1.3
16.7"
0.9
A
Profile
B
Leaf N (mg m
5.9
4.8
0.4
18.5"
1.6"
11.4*
9.4
7.9
26.2"
6.9"
C
2) 2.3
1.1"
-1.9
14.9*
-0.8
Post-anthesis
Bacanora
Oasis
Weaver
Baviacora
Altar
11.57
9.46
13.86
12.09
12.19
1.08
1.62
1.92
0.76
1.09
2.9
14.0"
-2.0
8.0
-4.5
1.6
14.6"
-5.4
6.6*
-2.8
2.0
15.5"
-1.4
8.8
-1.9
-2.5
11.3
-8.6
2.7
-5.1
1.2
13.9"
-8.3
5.7"
-4.1
6.8
20.2
2.8
13.5
1.5
-4.8
9.1
-9.9
0.1
-7.6"
Maturity
Bacanora
Oasis
Weaver
Baviacora
Altar
19.36
17.74
20.67
19.82
20.55
0.40
0.62
1.26
1.08
0.69
0.6
- 3 . 1 '
-1.0
6.7
-1.9
2.9"
1.9
-0.1
11.9"
7.3"
0.8
1.6
1.4
11.5"
7.3"
-3.4"
-3.4
-5.8"
3.2
-0.1
3.7"
2.0
-1.9
11.7
7.0"
8.2"
6.8
7.2*
19.4"
13.3"
-4.9"
-4.9
-7.2"
2.0
-2.3
Am-N relationship was obtained from measurements in different nitrogen treatments and
not from various depths in the canopy. Conversion of LGR to leaf N applying equation
2.10 would result in overestimation of photosynthesis. The area between the two
regressions at lower LGR in Fig. 2.3B could be considered to result from excess
nitrogen in leaf tissue not contributing to photosynthetic activity. Therefore, the
relationship given by the bold line in Fig. 2.3B was applied for the conversion of LGR
to leaf N.
Canopy nitrogen profile
Canopy N profiles progress from nearly uniform during early growth stages, to strongly
non-uniform, while upper (flag) leaf N starts to decline after anthesis. The non-
uniformity has been reported for many crops (Hirose and Werger, 1987; Lemaire et al.,
1991; Shiraiwa and Sinclair, 1993; Wright and Hammer, 1994), but not many profile
dynamics throughout the cycle have been reported. Connor et al. (1995) report profiles
25

Chapter 2
Table 2.4B. Observed dry weight (DW) with standard deviation (STD) and estimated dry weights during growth
cycle I of Exp. 2.2 expressed as percentage difference to observed DW. For further explanation see legend Table
2.4A.
EXP. 2.2
Pre-anthesis
Bacanora
Oasis
Weaver
Baviacora
Altar
Obs.
DW
(Mg ha
7.76
5.98
6.58
7.41
7.98
STD
DW
-1)
0.31
1.11
0.41
0.45
0.41
SUCROS
13.2"
30.2
29.3"
26.3"
10.2"
A
Profile
B
Leaf N (mg g
13.3"
30.6
27.9"
25.1"
12.3"
12.8"
31.3
29.7
26.2"
13.0"
C
1) 9.9"
26.4
25.1
21.2"
10.1"
A
Profile
B
Leaf N (mg m
11.2"
30.7
27.0"
23.4"
11.4"
17.9"
36.7
35.0"
31.5"
16.9"
C
-2) 6.3"
24.5
22.8"
18.5"
7.2"
Post-anthesis
Bacanora
Oasis
Weaver
Baviacora
Altar
11.50
9.79
11.89
11.45
10.64
0.48
1.22
0.20
0.55
0.51
11.0"
12.0
9.5"
14.2"
6 .1 '
11.2"
13.8*
8.5"
14.2"
8.8"
10.7"
14.1
10.0"
15.0"
9.5"
7.0"
9.0
4.4"
8.9"
5.9*
9 . 1 "
13.7*
7.3"
12.2"
7.3"
16.2"
19.0"
15.0"
20 .1 "
13.5"
3.4"
7.0
2.0*
5.8*
2.5
Maturity
Bacanora
Oasis
Weaver
Baviacora
Altar
15.32
12.99
16.58
17.17
15.47
0.25
1.34
1.36
0.71
0.21
10.8"
-1.9
-9.6*
-3.7"
5.5"
13.2"
-0.3
-8.7*
-0.8
11.0"
11.9"
-0.7
-8.7*
-0.8
11.4"
6.0"
-6.3
-13.6
-8.2
4.8
12.8"
0.9
-8.8*
-1.4
10.8"
19.1"
5.2
-3.6
4.4
16.5"
4.0"
-6.8
-14.7
-9.9
3.1
for sunflower to become more uniform in the course of grain filling, due to nitrogen withdrawal from all leaf positions of the canopy. In this study, post-anthesis N uptake due to ample N availability during grain filling may have diminished N withdrawal from leaves. Also, the self destruction mechanism described by Sinclair and De Wit (1976) could be less relevant in wheat than in sunflower, due to differences in grain protein content. Connor et al. (1995) also observed a decline in leaf N in upper leaves during grain filling.
Goudriaan (1995) describes that the mechanism resulting in a non-uniform canopy N profile may partly be based on a feedback process where more illuminated leaves are stronger sinks for nitrogen than more shaded leaves. However, the decline in flag leaf N during post-anthesis is in contradiction with this process. He also argues that leaf death due to aging could simply be a feedforward process resulting in decreasing leaf N of leaves lower in the canopy. However, Lemaire et al. (1991) suggest that the effect of leaf age on leaf N distribution is rather insignificant compared to the effect of
26
Canopy nitrogen profile
light climate. Indeed has leaf life span been shown to decrease strongly with decreasing mean radiation and with increasing ratio of Infrared/Red (Rousseaux et al., 1996). Both these quantitative and qualitative changes in light occur inside the crop canopy leading to decreasing nitrogen concentration with increasing LAI. This mechanism could explain the stronger non-uniformity in canopy N profile in denser canopies reported by Hirose and Werger (1987) compared to more open canopies with low LAI (Field, 1983).
Canopy N profiles are generally described as a negative exponential function of cumulative LAI with an N allocation coefficient, in analogy with light extinction within the canopy (Anten et al., 1995; Goudriaan, 1995). This analogy results from the assumption that leaf N is linearly related to Am. Such a relation, however, appears not appropriate for the analysis of the impact of canopy N profiles on canopy photosynthesis, as discussed in the next section. For the purpose of this study, third order polynomials were found most suitable to describe canopy N profiles throughout the cycle for leaf N expressed both on weight and area basis. No biological relevance is claimed for the parameters and is not germane in this context.
Photosynthesis Am-N relationship The observed pattern of Am with leaf N agrees well with the curvilinear relationship reported by Evans (1983) for wheat grown in greenhouses. Both relations are unique irrespective of nutrient treatment and leaf age. Others have also reported unique relationships independent of leaf age (Araus and Tapia, 1987; Field, 1983) and N-treatment (Connor et al., 1993). Evans (1983) showed the curvi-linearity to result from a decreasing Rubisco activity with increasing leaf N as a result of reducing C02 availability at the carboxylation site. While non-linear relations have been found for many species (e.g. wheat: Araus and Tapia, 1987; sunflower: Connor et al., 1993; maize and sorghum: Muchow and Sinclair, 1994), linear relations have also been reported. The linear relations however are based on data of different species (Van Keulen and Seligman; 1987) or generally cover a limited range in leaf N (Hunt and Van der Poorten, 1985; Pons et al., 1989; Seemann et al., 1987; Takahashi et al., 1993).
The strong linear relations given by Anten et al. (1995) for four species result from measurements of Am on leaves at different levels within the canopy. Van Dijk and Groot (1987) reported photosynthesis measurements in barley grown at four different levels of nitrogen application. Indeed relations were linear for leaves in different positions within the canopy separate for each N level, while they were curvi-linear in the same dataset, for leaves in similar positions within the canopy, but grown under different N levels. At similar rate of photosynthesis, higher amounts of N are found in leaves lower in the canopy, with N decline in these leaves induced by absence of radiation (Lemaire et al., 1991; Rousseaux et al., 1996), than in leaves high in the canopy with leaf N driven by availability. Similar conclusions can de deduced from Fig.
27
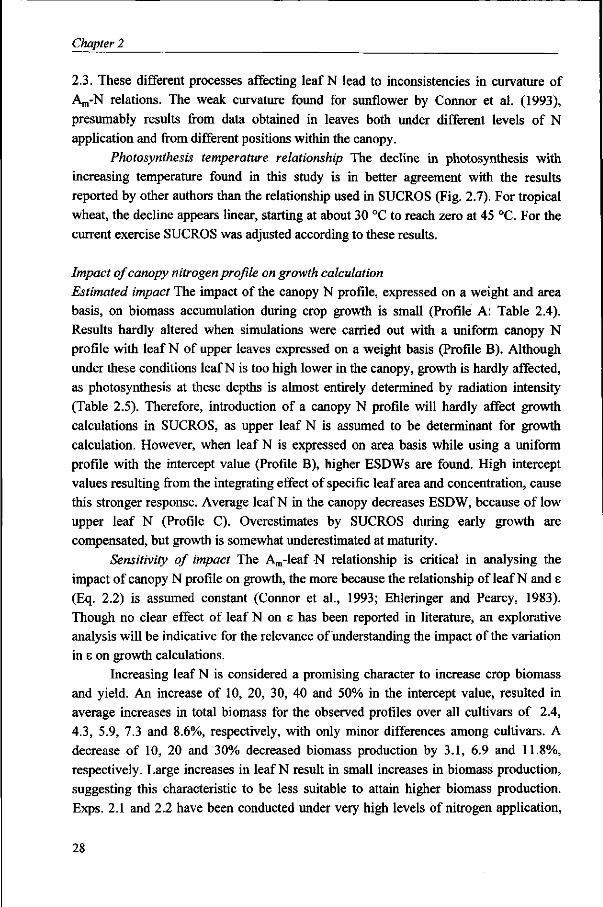
Chapter 2
2.3. These different processes affecting leaf N lead to inconsistencies in curvature of
Am-N relations. The weak curvature found for sunflower by Connor et al. (1993),
presumably results from data obtained in leaves both under different levels of N
application and from different positions within the canopy.
Photosynthesis temperature relationship The decline in photosynthesis with
increasing temperature found in this study is in better agreement with the results
reported by other authors than the relationship used in SUCROS (Fig. 2.7). For tropical
wheat, the decline appears linear, starting at about 30 °C to reach zero at 45 °C. For the
current exercise SUCROS was adjusted according to these results.
Impact of canopy nitrogen profile on growth calculation
Estimated impact The impact of the canopy N profile, expressed on a weight and area
basis, on biomass accumulation during crop growth is small (Profile A: Table 2.4).
Results hardly altered when simulations were carried out with a uniform canopy N
profile with leaf N of upper leaves expressed on a weight basis (Profile B). Although
under these conditions leaf N is too high lower in the canopy, growth is hardly affected,
as photosynthesis at these depths is almost entirely determined by radiation intensity
(Table 2.5). Therefore, introduction of a canopy N profile will hardly affect growth
calculations in SUCROS, as upper leaf N is assumed to be determinant for growth
calculation. However, when leaf N is expressed on area basis while using a uniform
profile with the intercept value (Profile B), higher ESDWs are found. High intercept
values resulting from the integrating effect of specific leaf area and concentration, cause
this stronger response. Average leaf N in the canopy decreases ESDW, because of low
upper leaf N (Profile C). Overestimates by SUCROS during early growth are
compensated, but growth is somewhat underestimated at maturity.
Sensitivity of impact The Am-leaf -N relationship is critical in analysing the
impact of canopy N profile on growth, the more because the relationship of leaf N and e
(Eq. 2.2) is assumed constant (Connor et al., 1993; Ehleringer and Pearcy, 1983).
Though no clear effect of leaf N on e has been reported in literature, an explorative
analysis will be indicative for the relevance of understanding the impact of the variation
in e on growth calculations.
Increasing leaf N is considered a promising character to increase crop biomass
and yield. An increase of 10, 20, 30, 40 and 50% in the intercept value, resulted in
average increases in total biomass for the observed profiles over all cultivars of 2.4,
4.3, 5.9, 7.3 and 8.6%, respectively, with only minor differences among cultivars. A
decrease of 10, 20 and 30% decreased biomass production by 3.1, 6.9 and 11.8%,
respectively. Large increases in leaf N result in small increases in biomass production,
suggesting this characteristic to be less suitable to attain higher biomass production.
Exps. 2.1 and 2.2 have been conducted under very high levels of nitrogen application,
28
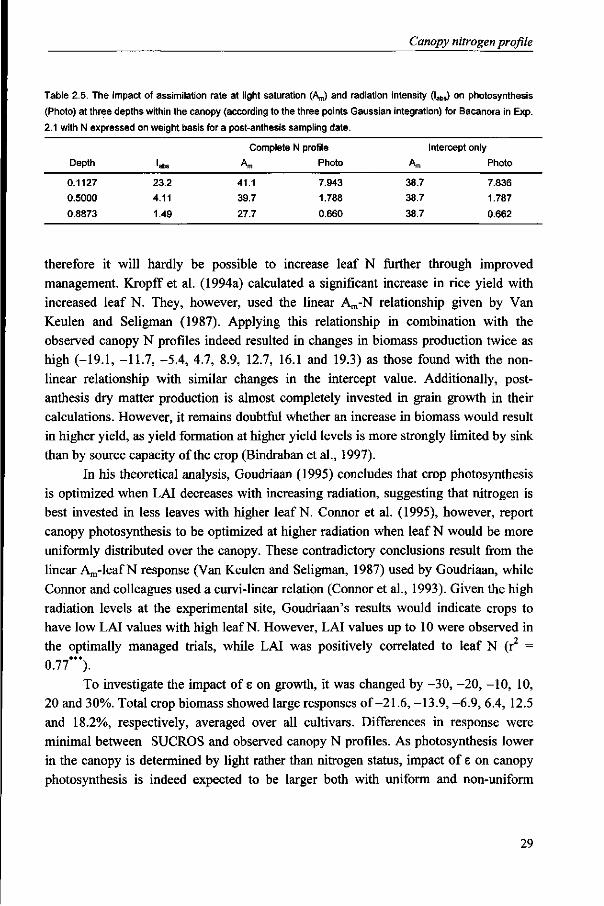
Canopy nitrogen profile
Table 2.5. The impact of assimilation rate at light saturation (Am) and radiation intensity (labs) on photosynthesis
(Photo) at three depths within the canopy (according to the three points Gaussian integration) for Bacanora in Exp.
2.1 with N expressed on weight basis for a post-anthesis sampling date.
Depth
0.1127
0.5000
0.8873
'abs
23.2
4.11
1.49
Complete N profile
A„
41.1
39.7
27.7
Photo
7.943
1.788
0.660
" m
38.7
38.7
38.7
Intercept only
Photo
7.836
1.787
0.662
therefore it will hardly be possible to increase leaf N further through improved
management. Kropff et al. (1994a) calculated a significant increase in rice yield with
increased leaf N. They, however, used the linear Am-N relationship given by Van
Keulen and Seligman (1987). Applying this relationship in combination with the
observed canopy N profiles indeed resulted in changes in biomass production twice as
high (-19.1, -11.7, -5.4, 4.7, 8.9, 12.7, 16.1 and 19.3) as those found with the non
linear relationship with similar changes in the intercept value. Additionally, post-
anthesis dry matter production is almost completely invested in grain growth in their
calculations. However, it remains doubtful whether an increase in biomass would result
in higher yield, as yield formation at higher yield levels is more strongly limited by sink
than by source capacity of the crop (Bindraban et al., 1997).
In his theoretical analysis, Goudriaan (1995) concludes that crop photosynthesis
is optimized when LAI decreases with increasing radiation, suggesting that nitrogen is
best invested in less leaves with higher leaf N. Connor et al. (1995), however, report
canopy photosynthesis to be optimized at higher radiation when leaf N would be more
uniformly distributed over the canopy. These contradictory conclusions result from the
linear Am-leaf N response (Van Keulen and Seligman, 1987) used by Goudriaan, while
Connor and colleagues used a curvi-linear relation (Connor et al., 1993). Given the high
radiation levels at the experimental site, Goudriaan's results would indicate crops to
have low LAI values with high leaf N. However, LAI values up to 10 were observed in
the optimally managed trials, while LAI was positively correlated to leaf N (r2 =
0.77***).
To investigate the impact of E on growth, it was changed by -30, -20, -10, 10,
20 and 30%. Total crop biomass showed large responses of-21.6, -13.9, -6.9, 6.4, 12.5
and 18.2%, respectively, averaged over all cultivars. Differences in response were
minimal between SUCROS and observed canopy N profiles. As photosynthesis lower
in the canopy is determined by light rather than nitrogen status, impact of e on canopy
photosynthesis is indeed expected to be larger both with uniform and non-uniform
29

Chapter 2
canopy N profiles. Such strong responses solicit clearer understanding of the variation in this parameter.
Cultivar differences The small overall response of the introduction of canopy N profiles, relative to SUCROS, causes differences in response among cultivars to be hard to detect, although the durum wheat Altar shows a somewhat stronger positive response than the bread wheats. Altar has higher LGRs than bread wheat cultivars under similar conditions. Rees et al. (1993) observed lower Am values for this durum cultivar than for the bread wheat cultivars Bacanora and Oasis. The Am-leaf N relationship derived from measurements in three bread wheat cultivars may not hold for durum wheat, resulting in overestimates in biomass production.
Conclusions
Canopy LAI and LAI at different canopy depths can be assessed satisfactorily for wheat with the LAI-2000. Calibration is required for the planting system and adjustments are needed to account for dead leaves. The leaf greenness meter (SPAD) estimates leaf N well, however, special attention should be paid to different fractions of leaf N.
Leaf N varies strongly over canopy depth and changes in the course of crop development. Canopy N profiles could best be described by third order polynômes. Negative exponential decline of leaf N with canopy depth in analogy to light extinction is only valid under the assumption that Am is linearly related to leaf N. However, the Am-leaf N relation strongly depends on leaf status. It appears curvi-linear with variation in leaf N induced by N availability and linear with variation in leaf N caused by light regime. Am decreases linearly with temperature in the range of 30 to 45 °C. The strong impact of both parameters Am and E on canopy photosynthesis and their unclear association with leaf N warrant a closer examination of these relations. Due to such strong sensitivities, analyses of an extrapolative nature should be interpreted with caution and reservation.
Introduction of non-uniform canopy N profiles hardly affects estimation results of biomass accumulation compared to uniform N profiles, as radiation within the canopy has a predominant effect on photosynthesis over leaf N. Underestimates could occur with average canopy leaf N, e.g. obtained through leaf sampling over the complete canopy. No strong argument has become apparent to express leaf N on an area basis. Leaf N of upper leaves expressed on a weight basis with a uniform profile along with total canopy LAI, suffices to realistically estimate biomass accumulation.
30
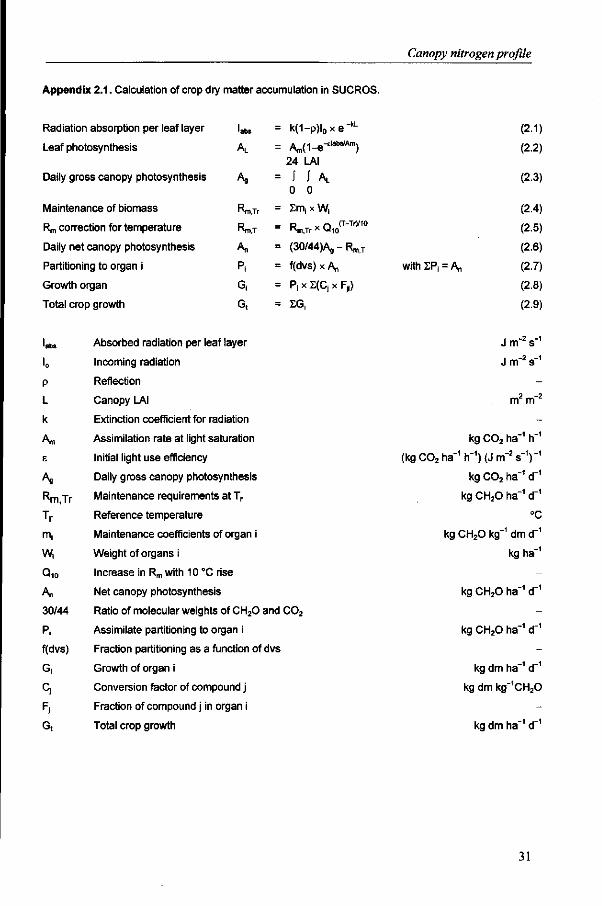
Canopy nitrogen profile
Appendix 2.1. Calculation of crop dry matter accumulation in SUCROS.
Radiation absorption per leaf layer
Leaf photosynthesis
Daily gross canopy photosynthesis
Maintenance of biomass
Rm correction for temperature
Daily net canopy photosynthesis
Partitioning to organ i
Growth organ
Total crop growth
'abs
I.
P
L
k
" m
8
Ag
Rm,Tr
Tr
m.
W i
Q10
A„ 30/44
Pi
f(dvs)
Gi
Ci
Fi
G,
'abs
AL
^
Rm.Tr
Rm.T
A„
Pi
Gi
Gt
Absorbed radiation per leaf layer
Incoming radiation
Reflection
Canopy LAI
Extinction coefficient for radiation
Assimilation rate at light saturation
Initial light use efficiency
Daily gross canopy photosynthesis
Maintenance requirements <
Reference temperature
Maintenance coefficients of
Weight of organs i
atTr
organ i
Increase in Rm with 10 °C rise
Net canopy photosynthesis
=
=
=
=
=
=
=
=
=
k(1-p)l0xe"kL
Am(l-e-*"*ls/Am) 24 LAI
J J \ 0 0
Sm, x W,
R x O (T-Tr)'10
(30/44)Ag-Rm,T
f(dvs) x A„
P, x £(Ci x Fj()
EGi
Ratio of molecular weights of CH20 and C02
Assimilate partitioning to organ i
Fraction partitioning as a function of dvs
Growth of organ i
Conversion factor of compound j
Fraction of compound j in organ i
Total crop growth
(2.1)
(2.2)
(2.3)
(2.4)
(2.5)
(2.6)
with EPi = A„ (2.7)
(2.8)
(2.9)
J m s
1 m - 2 o " 1
J m s -
2 - 2
m m -
kg C02 ha"1 h"1
(kg C02 ha"1 h"1) (J m"2 s"1)"1
kg C02 ha"1 d"1
kg CH20 ha"1 d"1
°C
kg CH20 kg"1 dm d"1
kg ha"1
-
kg CH20 ha"1 d"1
-
kg CH20 ha"1 d"1
-
kg dm ha"1 d"1
kg dm kg"1CH20
-
kg dm ha"1 d"1
31
Chapter 3
Identifying major crop characteristics
that determine wheat growth and yielda
Abstract
Numerous biotic and abiotic factors may affect growth and yield of crops, making their understanding difficult. However, depending on growth conditions, only a limited number may have a major quantitative impact. In this chapter, crop characteristics that determine growth and yield to a significant extent, are identified by a systems approach, using quantitative analysis as a tool. The analyses involve wheat (Triticum aestivum) crops grown in fields under full protection against pests and diseases with adequate water and nutrient supply, other than nitrogen, of which application varied in rate and timing. The results show that leaf area index and leaf N concentration, to a major extent, determine biomass accumulation through their respective effects on radiation interception and photosynthetic activity, while yield realization is a much more complex process. Estimated post-anthesis biomass accumulation suggests that at lower yield levels, reserves stored in the vegetative tissue may be a major relative contributor of assimilates during grain filling when current production of assimilates fails to meet grain demand. Grain demand on the other hand appears to set a limit to yield under favorable conditions, as kernel weight fails to respond to excess assimilate supply. Under-utilization of assimilates under potential crop growth conditions suggests further increase in yield to be possible through increased sink capacity. Leaf area index, leaf N concentration, reserve dynamics and sink capacity are quantitatively major factors that determine wheat growth and yield under optimum management and nitrogen limited conditions.
"P.S. Bindraban, K.D. Sayre, M. van Ginkel and R.A. Fischer, 1997. Identifying major crop characteristics that determine wheat growth and yield. Crop Science (accepted with revisions).

Chapter 3
Introduction
Crop growth and yield are difficult to understand, as they are affected by numerous biotic and abiotic factors. However, the impact of many of these factors and their interactions on growth and yield may hardly be of quantitative significance. Major crop growth processes that affect growth and yield need, therefore, be identified to create transparency in our understanding.
Crop growth has been shown to be strongly correlated to the amount of radiation intercepted with a rather stable radiation use efficiency (RUE) (Monteith, 1977; Gallagher and Biscoe, 1978; Kiniry et al., 1989). RUE, however, depends on species (Sinclair and Horie, 1989) and is affected by crop conditions, like water (Whitfield and Smith, 1989) and nitrogen (Sinclair and Horie, 1989) status. Though linearity between leaf N and leaf photosynthesis has been shown to persist at higher levels of nitrogen (Van Keulen and Seligman, 1987; Makino et al., 1988), linearity does not persist with RUE (Sinclair and Horie, 1989). RUE is positively correlated to leaf N concentration only at lower levels, while the relationship generally levels off at values exceeding 30 to 40 mg N g_1 dry matter (Sinclair and Horie, 1989). The analyses in this chapter refer to wheat crops (Triticum aestivum) grown in fields under full protection against pests and diseases with adequate water and nutrient supply, other than nitrogen, of which application varied in rate and timing. A large part of the variation in these crops would, therefore, be related to the combined effect of LAI and leaf N concentration, governing radiation interception and photosynthetic activity, respectively.
Grain growth is primarily supplied by assimilates produced during the post-anthesis phase. Under post-anthesis stress conditions, reserves, mainly stored in the stem, have been shown to be an important source as well (e.g. Bidinger et al., 1977; Kiniry, 1993; Blum et al., 1994). Total translocated amounts may vary from very low to almost 2 to 3 Mg ha-1 (Gallagher et al., 1975; Evans, 1993). As wheat has been reported to be a sink-limited crop (e.g. Borojevic, 1978; Thorne et al., 1979; Borghi et al., 1986), increased sink capacity could result in increased yield. However, whether sink capacity limits yield depends on crop and environmental conditions (Spiertz, 1974; Fischer and HilleRisLambers, 1978; Evans, 1993). Obviously, yield realization is a complex process, where the impact of translocated reserves and sink capacity might be significant.
To improve our quantitative understanding of wheat growth and yield processes, a simple algorithm was developed to compute total crop biomass accumulation. This algorithm was used to identify the sources that supply grains with assimilates. Factors that appear quantitatively important in affecting wheat growth and yield are identified and discussed.
34

Growth and yield
Materials and Methods
Two years of data from four independent experiments on the CIMMYT (Centra Internacional de Mejoramiento de Maiz y Trigo) experimental site in the Yaqui Valley, Sonora state, Mexico, at the CIANO (Centra de Investigaciones Agricolas de Noroeste) experimental station (40 meters above see level and 28°N and 109°W) were used in the analyses. The two cycles, 1993/94 and 1994/95 are referred to as cycle I and II, respectively. All experiments were sown during the optimum planting period for the Yaqui Valley which ranges from the middle of November till the middle of December, except a 'late planting' treatment, referred to as Exp. 3.5. Sowing, anthesis (50% spikes with minimally one flower) and maturity dates are summarized in Table 3.1. Bread wheat cultivars Siete Cerros, Genaro, Seri, Oasis, Bacanora, Baviacora and Weaver (advanced line) with widely varying ranges in agronomic characteristics were studied (Table 3.2). As not all cultivars were grown in all experiments, an overview is given in Table 3.3, with symbols that are used in Figs. 3.4, 3.5 and 3.6. Radiation and temperature conditions covering the growth period for all experiments in both cycles are given in Table 3.4.
Table 3.1. Timing of sowing and occurrence of anthesis and maturity of all experiments in both cycles in weeks.
Week 1 from Jan. 1s' to Jan. 7th.
Sowing
Anthesis
Maturity
Cycle
I
II
I
II
I
II
3.1
48
47
7-10
7-8
13-16
12-15
3.2
48
47
8
7-8
14-15
14-15
Experiment
3.3
48
48
9-10
8-9
16
15-16
3.4
48
48
9-10
8-9
16
15-16
3.5
3
3
14
13-14
19
18-19
The soil for all experiments was a coarse sandy clay, mixed montmorillonitic, Typic Caliciorthid (pH 7.7) (USDA Soil Taxonomy), low in organic matter (<10 mg g_1) and with adequate K fertility (K.D. Sayre, CIMMYT, unpubl. data). Before sowing, 17.5 kg P ha-1 as triple super phosphate was broadcast as a basal dressing and incorporated by disc harrow. Nitrogen, as urea, was applied according to the experimental setup.
In all experiments the entries were sown at 300 viable seeds m in plots of eight rows, spaced at 20 cm, and 5 to 6 m long. For all treatments, emergence took place
35

Chapter 3
Table 3.2. Characteristics of the cultivars used in the analyses.
Year of release
Kernels nT2 (*1000)
Kernel weight (mg)
Spikes m"2
Height (cm)
Pre-anthesis (d)
Leaf type
Siete Cerros
1966
18
33
400
98
75
v. lax
Genaro
1981
19
34
400
91
81
med.
Seri
1982
18
39
400
94
79
med.
Oasis
1986
20
36
500
67
71
lax
Bacanora
1988
21
33
450
87
80
erect
Baviacora
1992
17
44
350
102
80
v. lax
Weaver
Line3
22
34
550
77
86
erect
'1B4Y0B
within 7 to 9 days from sowing. Fifty-cm long sections of the six central rows were
harvested at ground level, to determine total aboveground dry weight (DW; kg ha - ) at
various times during crop growth. Pre-anthesis sampling is referred to as 'sampling a'
and sampling a week after anthesis as 'sampling b ' . Depending on experiment, total
areas of 2.4 to 3.6 m2 were sampled at final harvest, 'sampling c'. Biomass, yield and
yield components were determined.
In Exp. 3.1, nitrogen was applied as basal dressing at 0, 75, 150 and 300 kg ha" .
Sixteen bread wheat cultivars, including some advanced lines, were tested in cycle I. All
cultivars were harvested at maturity, but DW during crop growth was determined only
for the cultivars given in Table 3.3, approximately one week after anthesis (sampling b).
In cycle II, four bread wheat cultivars from the first cycle were tested and a complete
dataset was collected.
In Exp. 3.2, cultivars were tested with respect to their response to basal and
delayed nitrogen application at first node at a rate of 150 kg ha-1. DW was determined
around heading (sampling a).
In Exp. 3.3, yield potential of cultivars released over the past three decades in
Northern Mexico was determined under 'optimum management conditions' (K.D.
Sayre, CIMMYT, unpubl. data). This experiment was conducted for seven years but
data of cycles I and II only, were used for the analyses in this chapter, as datasets
required for the analysis were collected during these cycles only. Before planting, the
preceding leguminous cover crop, Sesbania spp. was incorporated, supplemented with
chicken manure. Based on chemical analyses, it was estimated that the leguminuous
crop supplied approximately 120 kg N ha" , and the chicken manure 150 kg N, 15 kg P
and 175 kg K. Additionally, 150 and 75 kg N ha"1, as urea, was applied as basal
application and at booting, respectively. Frequent irrigation ensured adequate water
availability. Pests, diseases and weeds were controlled. Plants were supported by
36
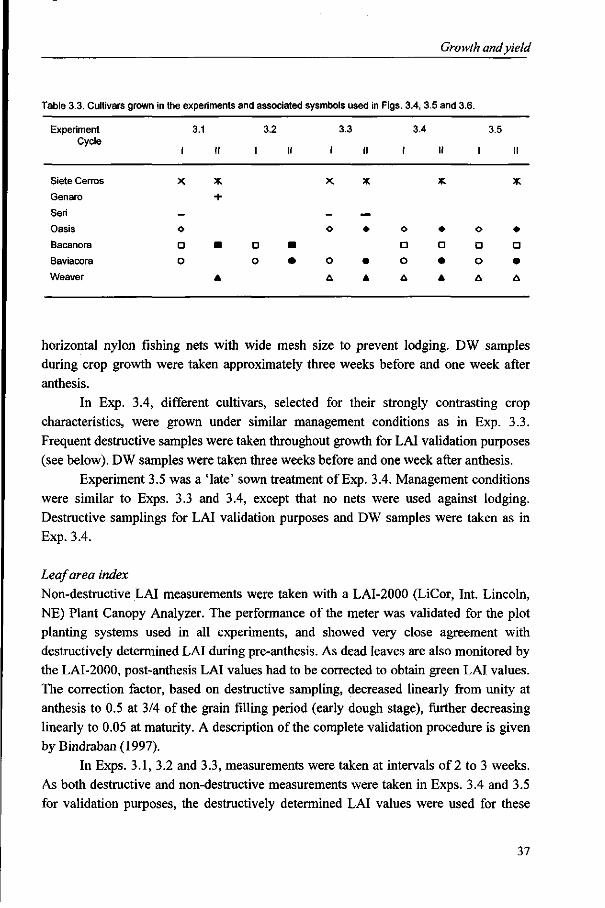
Growth and yield
Table 3.3. Cultivars grown in the experiments and associated sysmbols used in Figs. 3.4, 3.5 and 3.6.
Experiment Cycle
Siete Cerros
Genaro
Seri
Oasis
Bacanora
Baviacora
Weaver
1
X
— O
a o
3.1
II
X
+
•
A
3.2
I II
D • O •
I
X
-o
o A
3.3
II
X
— •
• A
I
O
a o A
3.4
II
X
•
a • A
3.5
I II
X
O •
a a o • A A
horizontal nylon fishing nets with wide mesh size to prevent lodging. DW samples during crop growth were taken approximately three weeks before and one week after anthesis.
In Exp. 3.4, different cultivars, selected for their strongly contrasting crop characteristics, were grown under similar management conditions as in Exp. 3.3. Frequent destructive samples were taken throughout growth for LAI validation purposes (see below). DW samples were taken three weeks before and one week after anthesis.
Experiment 3.5 was a 'late' sown treatment of Exp. 3.4. Management conditions were similar to Exps. 3.3 and 3.4, except that no nets were used against lodging. Destructive samplings for LAI validation purposes and DW samples were taken as in Exp. 3.4.
Leaf area index Non-destructive LAI measurements were taken with a LAI-2000 (LiCor, Int. Lincoln, NE) Plant Canopy Analyzer. The performance of the meter was validated for the plot planting systems used in all experiments, and showed very close agreement with destructively determined LAI during pre-anthesis. As dead leaves are also monitored by the LAI-2000, post-anthesis LAI values had to be corrected to obtain green LAI values. The correction factor, based on destructive sampling, decreased linearly from unity at anthesis to 0.5 at 3/4 of the grain filling period (early dough stage), further decreasing linearly to 0.05 at maturity. A description of the complete validation procedure is given by Bindraban (1997).
In Exps. 3.1, 3.2 and 3.3, measurements were taken at intervals of 2 to 3 weeks. As both destructive and non-destructive measurements were taken in Exps. 3.4 and 3.5 for validation purposes, the destructively determined LAI values were used for these
37
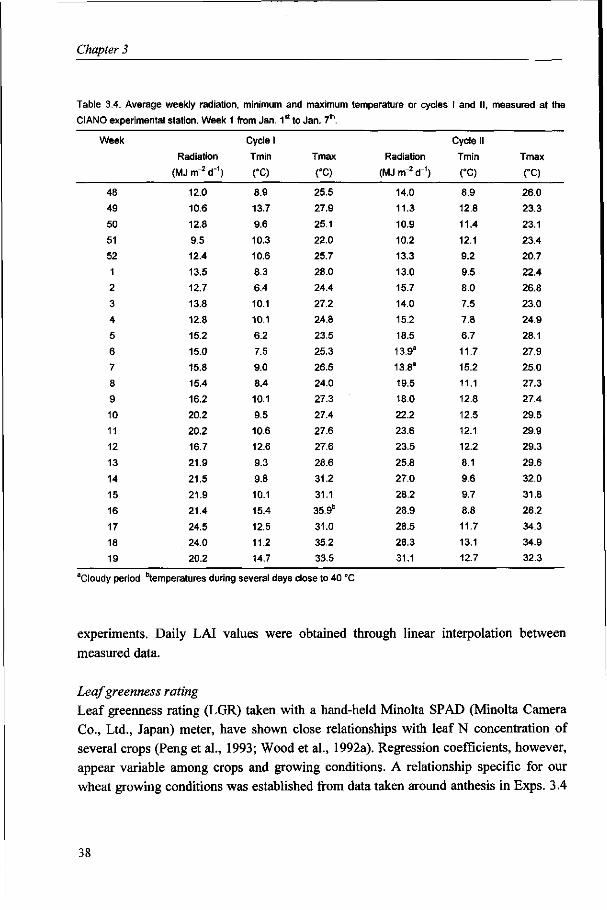
Chapter 3
Table 3.4. Average weekly radiation, minimum
CIANO experimental station. Week 1 from Jan. 1
Week
48
49
50
51
52
1
2
3
4
5
6
7
8
g
10
11
12
13
14
15
16
17
18
19
Radiation
(MJ m"2 d"1)
12.0
10.6
12.8
9.5
12.4
13.5
12.7
13.8
12.8
15.2
15.0
15.8
15.4
16.2
20.2
20.2
16.7
21.9
21.5
21.9
21.4
24.5
24.0
20.2
Cycle I
Tmin
(°C)
8.9
13.7
9.6
10.3
10.6
8.3
6.4
10.1
10.1
6.2
7.5
9.0
8.4
10.1
9.5
10.6
12.6
9.3
9.8
10.1
15.4
12.5
11.2
14.7
and maximum
^ t o J a n . / " .
Tmax
CO 25.5
27.9
25.1
22.0
25.7
28.0
24.4
27.2
24.8
23.5
25.3
26.5
24.0
27.3
27.4
27.6
27.6
28.6
31.2
31.1
35.9"
31.0
35.2
33.5
temperature or cycles
Radiation
(MJ m"2 d"1)
14.0
11.3
10.9
10.2
13.3
13.0
15.7
14.0
15.2
18.5
13.9a
13.8a
19.5
18.0
22.2
23.6
23.5
25.8
27.0
28.2
28.9
28.5
28.3
31.1
I and II,
Cycle II
Tmin
(°C)
8.9
12.8
11.4
12.1
9.2
9.5
8.0
7.5
7.8
6.7
11.7
15.2
11.1
12.8
12.5
12.1
12.2
8.1
9.6
9.7
8.8
11.7
13.1
12.7
measured at the
Tmax
(°C)
26.0
23.3
23.1
23.4
20.7
22.4
26.8
23.0
24.9
28.1
27.9
25.0
27.3
27.4
29.5
29.9
29.3
29.6
32.0
31.8
28.2
34.3
34.9
32.3
"Cloudy period temperatures during several days close to 40 °C
experiments. Daily LAI values were obtained through linear interpolation between measured data.
Leaf greenness rating Leaf greenness rating (LGR) taken with a hand-held Minolta SP AD (Minolta Camera Co., Ltd., Japan) meter, have shown close relationships with leaf N concentration of several crops (Peng et al., 1993; Wood et al., 1992a). Regression coefficients, however, appear variable among crops and growing conditions. A relationship specific for our wheat growing conditions was established from data taken around anthesis in Exps. 3.4
38

Growth and yield
and 3.5 in all cultivars. LGRs related to leaf N concentration (Leaf N: mg N g DM) according to:
Leaf N = 16 + 0.5 LGR (r2=0.9l"*)\
LGRs of the uppermost leaves were collected at regular intervals of 2 to 3 weeks. These LGRs were obtained by taking three readings near the top, middle and base of the leaf on four leaves per plot. LGR from emergence to the first measurement was assumed to be equal to the first measured rating for all treatments, while it declined practically to zero at maturity. Daily LGR of the upper leaves throughout the growing cycle was obtained through linear interpolation between measured ratings.
Growth estimation A calculation algorithm was developed to estimate biomass accumulation on a daily basis (G; g m~2 d"1). Daily intercepted photosynthetic active radiation (IPAR; MJ m-2
d"1) was calculated using exponential extinction of PAR with LAI. An extinction coefficient of 0.44 was applied (Van Heemst, 1988). RUE was calculated as the ratio between DW produced over the growing period and total PAR intercepted during that period, expressed as g MF1. As leaf N concentration affects RUE, a relative correction factor for leaf greenness (CFN; -) on RUE was introduced. DW was estimated (ESDW; kg ha-1) on a daily basis, where growth can be computed for any period during the crop cycle from day a to b:
a ESDW = 10 x EG = 10 x IPAR x RUE x CFN
b
Data from Exp. 3.1 were used for parameterization of RUE and CFN. LAI and LGRs were input to this calculation algorithm along with observed daily radiation data.
Yield realization Most of the assimilates required for grain growth are supplied by photosynthesis during grain filling, while translocation of reserves can be an important source under stress conditions. Due to the lag-phase in grain growth, total grain weight one week after anthesis generally does not exceed 10% of the final weight, while grains are still set during this first week (e.g. Fischer, 1985; Kirby, 1988). Moreover, assimilates are allocated to non-grain spike growth (Fischer and Stockman, 1986; Kirby, 1988) and are
Significant at 0.1% throughout the chapter
39
Chapter 3
stored as reserves in vegetative tissue during this period (Kiniry, 1993). The major part
of grain growth, therefore, commences a week after anthesis. The period from 7 days
after anthesis to maturity will be referred to as the 'yield realization phase', and
stretches phenologically roughly from complete anthesis to physiological maturity. To
determine to what extent yield originates from assimilates produced during the yield
realization phase, estimated biomass production by the algorithm during this phase was
related to 90% of the final yield, accounting for grain growth during the first week after
anthesis.
Results and Discussion
Environmental growth conditions
Wheat growth and yield are highly variable among years in the Yaqui Valley, even
under optimum management conditions at optimum planting dates (K.D. Sayre,
CIMMYT, unpubl. data), indicating a considerable impact of environmental factors. In
general, weather conditions were favourable in cycle I and yields (0.12 g g~ moisture)
under optimum management conditions (Exp. 3.3) reached 9.5 Mg ha-1 for the cultivars
in this experiment, compared to 7.5 and 8.3 Mg ha-1, respectively in the 1991/92 and
1992/93 cycle. Yields reached only 7.8 Mg ha" in cycle II. Over all experiments, yields
were generally lower in cycle II, but treatments showed similar trends in growth and
yield. No aberrant events, like frost damage or lodging affected these experiments.
Radiation was lower after February in cycle I than in cycle II (Table 3.4). Cycle
II showed a similar trend in radiation as the cycles 1991/92 and 1992/93 (data not
shown). A cloudy period of more than a week occurred during heading in February in
cycle II, coinciding with the kernel number per unit area (KNO) determination phase of
Exps. 3.1 to 3.4. This phase extends from about three weeks before to one week after
anthesis (Fischer, 1985; Fischer and Stockman, 1986; Kirby, 1988). Maximum
temperature showed similar trends in both cycles, however, with temperatures
exceeding 35 °C during several days in the middle of April in cycle I. This hot spell did
not affect Exps. 3.1 to 3.4, while the crop was in the grain filling phase in Exp. 3.5
(Table 3.1). Minimum temperature was relatively high during February and March in
cycle II, but remained relatively low during the latter part of the cycle, compared to
cycle I.
Leaf area index and leaf greenness rating
For both LAI and LGR, similar trends were found for all cultivars in both cycles.
Therefore, these characteristics have been presented in Fig. 3.1 for cultivar Bacanora in
cycle I only. LAI patterns during the crop cycle (Fig. 3.1 A) showed bell-shaped curves
40
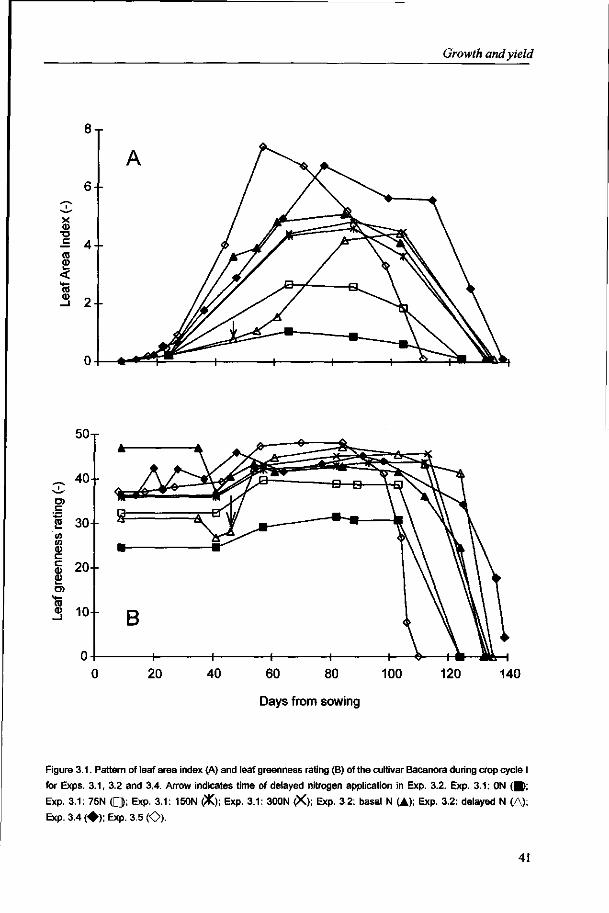
Growth and yield
x 0)
•D
_c (0
as a>
_ 4 0 -
O)
c 2 30 -(0 ta a> c c <u Q)
(0
a>
60 80
Days from sowing
140
Figure 3.1. Pattern of leaf area index (A) and leaf greenness rating (B) of the cultivar Bacanora during crop cycle I
for Exps. 3.1, 3.2 and 3.4. Arrow indicates time of delayed nitrogen application in Exp. 3.2. Exp. 3.1: ON (•) :
Exp. 3.1: 75N Q ; Exp. 3.1: 150N (X); Exp. 3.1: 300N (X); Exp. 3.2: basal N (A); Exp. 3.2: delayed N (A);
Exp. 3.4 ( • ) ; Exp. 3.5 (O).
41
Chapter 3
with exponential increase during the juvenile phase (detailed observations were taken in Exps. 3.4 and 3.5) and a rapid decline in the last weeks before maturity due to exponential increase in leaf senescence. Fastest LAI increase and highest LAI value were found with late planting (Exp. 3.5), due to the impact of temperature on leaf area growth and specific leaf area (data not shown). However, as leaf life span, expressed in degree days is fairly constant (Van Keulen and Seligman, 1987), LAI decline was also more rapid. In the late nitrogen application treatment of Exp. 3.2, LAI during early growth remained low at comparable values of the zero nitrogen treatment of Exp. 3.1, while it increased rapidly after application of nitrogen.
A similar fast increase was found in LGR in Exp. 3.2, after nitrogen application, where ratings exceeded those in Exp. 3.4 (Fig. 3.IB). Generally, an increase in LGR was found during the early growth stage for all treatments in our dataset. Leaf N concentrations generally decline from emergence onwards (e.g. Van Keulen and Seligman, 1987). In rice (Oryza sativa), Peng et al. (1993) show the impact of specific leaf weight on the relationship between LGR and leaf N concentration. No such impact was found in our dataset (data not shown). The increase in ratings during early growth stages could result from changing specific leaf weight of the uppermost leaves. The sharp decline in LGR before maturity may appear to contrast with generally smooth decline of leaf N towards maturity. However, the latter pattern relates to average canopy leaf N, while leaf greenness ratings of upper leaves only are used in our analysis. Flag leaves indeed maintained their greenness until very close to maturity.
Algorithm parameterization DW at maturity of all sixteen bread wheat cultivars of Exp. 3.1 grown in cycle I was highly correlated to PAR intercepted over the growing cycle (Fig. 3.2; r =0.97 ). However, the significant negative intercept of the regression suggests that growth was affected by an additional factor. A high correlation (r =0.89 ) was maintained when the zero nitrogen treatment was excluded, while the intercept became insignificantly different from zero. This suggests that RUE for the zero nitrogen treatment was different from that for the other treatments. RUE for the latter regression equals 2.5 g MF1. For cycle II a significantly different RUE of 2.2 g Mr1 (r2=0.78***) was found, based on four bread wheat cultivars (data not shown). This difference in RUE could not be related to any environmental factor, as described in the next section. No cultivar differences in RUE were found using Scheffés multiple comparison test.
RUE appeared to be linearly related to LGR (Fig. 3.3; r2=0.63***). However, RUE for the zero nitrogen treatment only, was significantly different from the three higher nitrogen treatments. Hence, extrapolation seems unjustified. Relative RUE was assumed to increase from zero to unity at LGRs of 8 to 32, to remain constant at higher ratings. This relationship, referred to as CFN, fits the data of both cycles (dotted line
42

Growth and yield
100 200 300 400 500 600 700
Cumulative intercepted radiation (MJ nrr2)
Figure 3.2. DW at maturity as related to intercepted radiation during the crop cycle for Exp. 3.1 of cycle I.
ON ( • ) , 75N (O), 150N (A ), 300N (O). Solid line for regression through all data (̂ =0.97™); dotted line
for regression excluding ON treatment (1^=0.89").
Fig. 3.3). These LGRs of 8 and 32, correspond to 20 and 32 mg N g~ DM, respectively, when applying the relationship found in this study. Sinclair and Horie (1989) have indeed shown RUE to level off at leaf N concentrations exceeding 30 to 40 mg N g~ DM, while it declines with decreasing leaf N to reach zero at concentrations close to 20 mg N g" DM.
The RUEs found in this study compare well with values reported for optimum management conditions (Kiniry et al., 1989; Whitfield and Smith, 1989). Although RUE is considered to be rather stable under such management, it is affected by several environmental factors. Stutterheim (1994) reports the fraction diffuse radiation to influence RUE, as diffuse radiation is more uniformly and efficiently distributed over the canopy. Impact of night (Bell et al., 1992) and of mean temperature (Andrade et al., 1993) on RUE has been reported also. However, RUE for all destructive samplings from all experiments, excluding the zero nitrogen treatment of Exp. 3.1, was not
43

Chapter 3
O >. Ü c 32 'o se CD CD (fl C
co
2 0)
.> 15 a> o:
1.2-r
1 .0 -
0.8 •-
0 . 6 -
0.4 ••
0.2 -
/
/
/
^L 15 25 35 45
Leaf greenness rating (-)
Figure 3.3. Impact of average leaf greenness rating over the growing season on relative radiation use
efficiency (RUE). RUE relative to 2.5 and 2.2. g MJ"1 for cycle I and II, respectively. Symbols as in Fig. 3.2.
Open symbols for cycle I, closed symbols for cycle II. Solid line for regression through all data ( ̂ =0.63"");
dotted line for assumed correction for leaf greenness (CFN). (For explanation of arrow see text.)
significantly correlated to any of the following factors: 1) fraction diffuse radiation,
calculated from the procedure described by Spitters et al. (1986), 2) total radiation, or 3)
temperature. Kiniry et al. (1989) also reported no impact of temperature and radiation
on RUE. Asrar et al. (1984) found RUE for wheat to decrease in the course of the
growth cycle, arguing that RUE needs to be monitored continuously to determine the
impact of environmental factors and crop conditions. However, no consistent decrease
in RUE in the course of the growth cycle was found in our dataset.
Estimation ofDW
The algorithm was applied to estimate crop growth for all cultivars, given in Table 3.3,
in all five experiments for both cycles. ESDWs relate to DW as given in Figs. 3.4 and
3.5 with all destructive biomass samples as described in the previous section, included
in the graphs. For instance, the thin arrow in Fig. 3.4 indicates DW around anthesis of
the four cultivars grown in the zero nitrogen treatment of Exp. 3.1 in cycle II. The thick
44
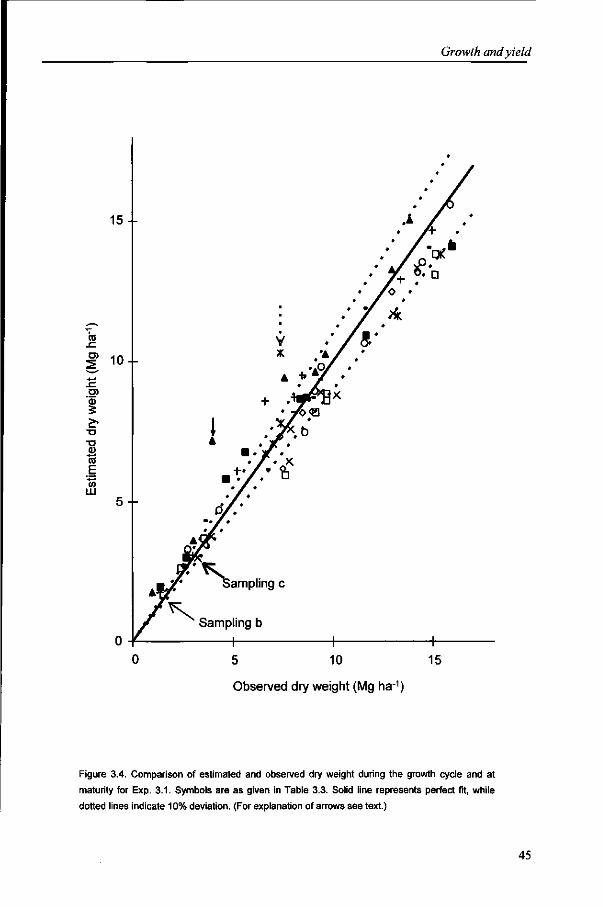
Growth and yield
'lo
ta
CD g
73 CU
CO
E
tu
10- -
5- -
Sampling c
Sampling b
H h 5 10 15
Observed dry weight (Mg ha-1)
Figure 3.4. Comparison of estimated and observed dry weight during the growth cycle and at
maturity for Exp. 3.1. Symbols are as given in Table 3.3. Solid line represents perfect fit, while
dotted lines indicate 10% deviation. (For explanation of arrows see text.)
45
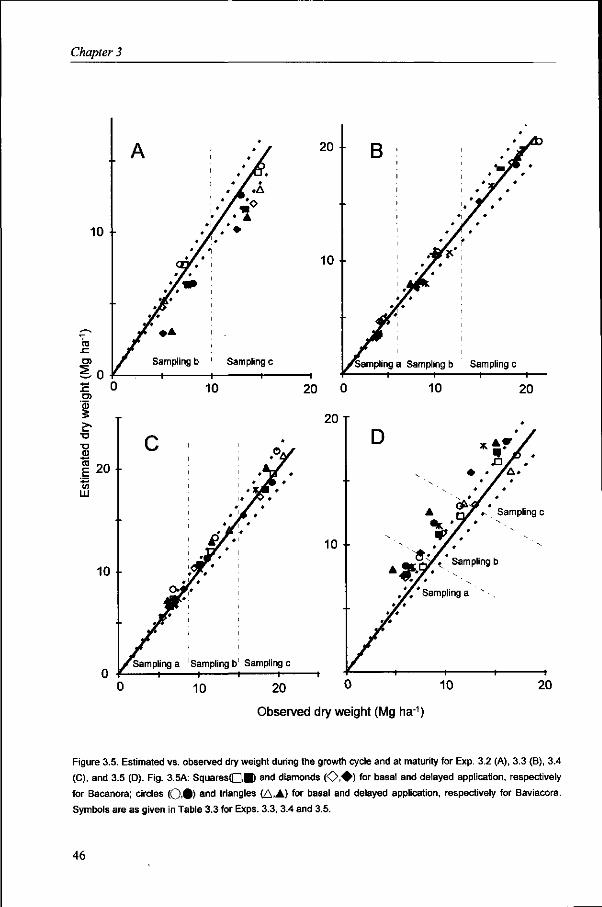
Chapter 3
10
.c o> ^ 0 £ 0 g>
'<D 3
<U
A
* • X *X *
•j£«
•
* x* • X
• yP * y*-j *
• X •
. / .A
* X * * X . *
*x *• *X * '
X# ^0
Sampling b ' Sampling c — I 1 1 1
20
10 ••
^Sampling a Sampling b Sampling c -i 1-
20 •• in
LU
Observed dry weight (Mg ha1)
Figure 3.5. Estimated vs. observed dry weight during the growth cycle and at maturity for Exp. 3.2 (A), 3.3 (B), 3.4
(C), and 3.5 (D). Fig. 3.5A: SquaresOB) and diamonds ( O , ^ ) for basal and delayed application, respectively
for Bacanora; circles (O.0) anc i triangles (A.A) for basal and delayed application, respectively for Baviacora.
Symbols are as given in Table 3.3 for Exps. 3.3, 3.4 and 3.5.
46
Growth and yield
arrow indicates the corresponding DW at maturity. It was not feasible to indicate the different periods of sampling in Fig. 3.4, as in the graphs of Fig. 3.5, because of overlap of data. A line of perfect fit is given to facilitate comparison, along with 10% deviation lines.
Generally, DW was slightly overestimated at lower levels of production, while it was underestimated at higher levels of production in Exp. 3.1 (Fig. 3.4). Severe overestimation, by 3 Mg ha-1, occurred at one sampling during crop growth for the cultivar Weaver (short vertical arrow Fig. 3.4). The observed DW of less than 4 Mg ha~' was more than 1.5 Mg ha-1 lower than the average of the other three cultivars in the same treatment, while Weaver was sampled more than a week later, because of its slow development. ESDW may be too high, but DW appears well below expectation. Explanation for the overestimated ESDW at maturity for Siete Cerros (dotted arrow) is given in the next section. As the algorithm was parameterized based on Exp. 3.1, these calibration results imply parameterization to be satisfactory.
ESDW for cycle II of Exp. 3.2 was below DW both at anthesis and maturity by an approximately similar magnitude (Fig. 3.5A). This underestimation in growth, therefore, must have occurred in the period before anthesis. For unclear reasons, LAI observed in cycle II was indeed lower than that observed in cycle I (data not shown), when DW at anthesis was estimated correctly.
DW was estimated well for both cycles of Exp. 3.3 (Fig. 3.5B). Observed biomass production during the growth cycle (samplings a and b) was much lower in cycle II than in cycle I, mainly due to earlier sampling.
DW was estimated reasonably well for both cycles of Exp. 3.4, with a slight overestimation throughout the growing cycle originating from the early growth phase (Fig. 3.5C).
DW was overestimated for the late planted crop in Exp. 3.5 for both cycles (Fig. 3.5D). Early growth was more strongly overestimated than in other experiments. RUE for these early growing periods was lower than corresponding values in other experiments. However, no other factor than LGR was found to affect RUE in our dataset. As no systematic overestimations occur during early growth in other experiments, the cause of this overestimation remains unexplained.
The algorithm appears capable of explaining to a major extent the growth of wheat under a wide range of nitrogen management practices. Though some overestimates occurred during early growth in some experiments, this algorithm was considered adequate to carry out an analysis of yield for both cycles as biomass production during the later part of the growth cycle is estimated satisfactorily.
47
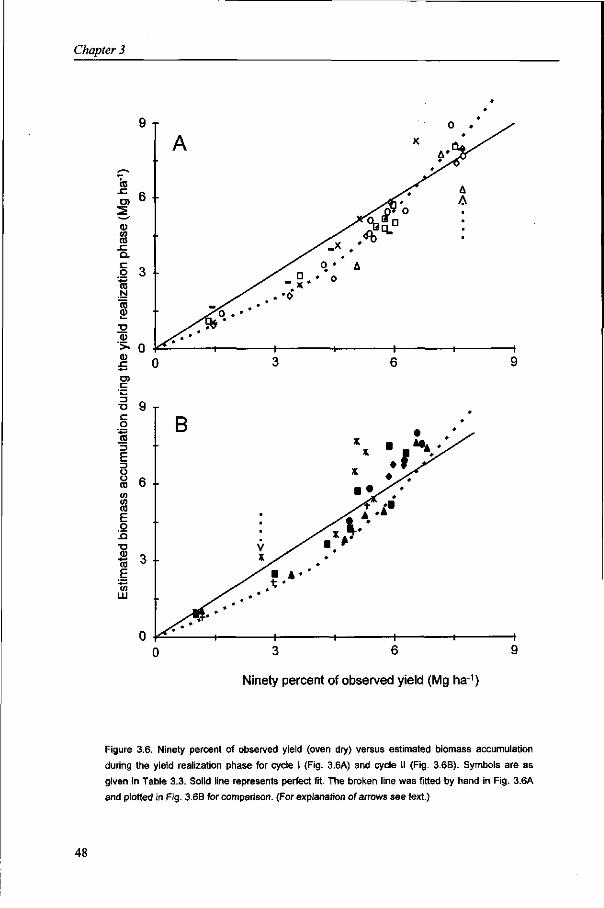
Chapter 3
-o a -, c o co 3 E 3 O co 6 •
co E o
T3
TS 3 • E •** co LU
0 •
B
JÊBk
* = h
•
V
•
• t
- t -
A • •
\ • . * • * V ^
, ' ' v ^ X - y* *y\
• y v
• * •
• *
1 1 1 1 3 6
Ninety percent of observed yield (Mg ha1)
Figure 3 .6 . Ninety percent of observed yield (oven dry) versus estimated biomass accumulation
during the yield realization phase for cycle I (Fig. 3.6A) and cycle II (Fig. 3 .6B). Symbols a re as
given in Tab le 3 .3. Solid line represents perfect fit. T h e broken line w a s fitted by hand in Fig. 3 .6A
and plotted in Fig. 3 .6B for comparison. (For explanation of arrows s e e text.)
48
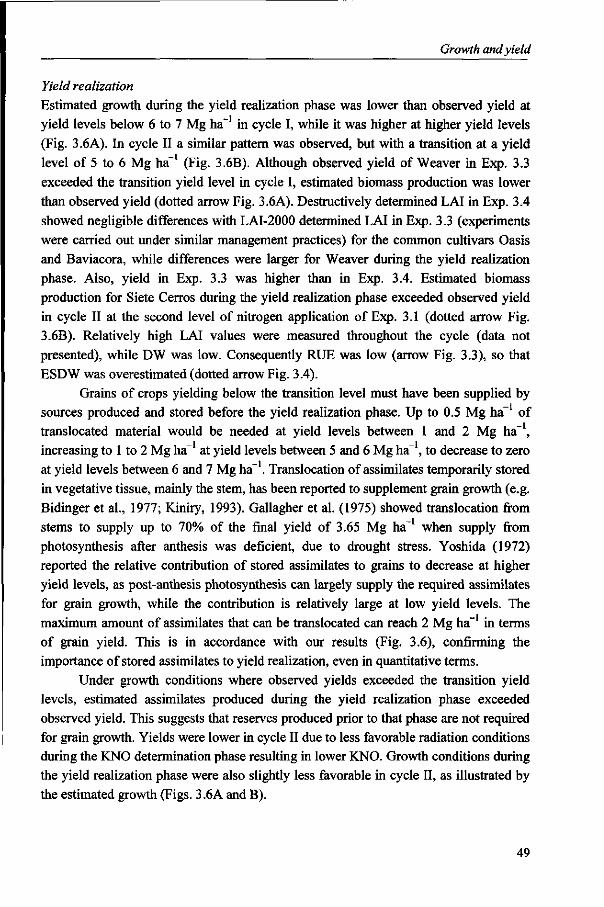
Growth and yield
Yield realization Estimated growth during the yield realization phase was lower than observed yield at yield levels below 6 to 7 Mg ha-1 in cycle I, while it was higher at higher yield levels (Fig. 3.6A). In cycle II a similar pattern was observed, but with a transition at a yield level of 5 to 6 Mg ha" (Fig. 3.6B). Although observed yield of Weaver in Exp. 3.3 exceeded the transition yield level in cycle I, estimated biomass production was lower than observed yield (dotted arrow Fig. 3.6A). Destructively determined LAI in Exp. 3.4 showed negligible differences with LAI-2000 determined LAI in Exp. 3.3 (experiments were carried out under similar management practices) for the common cultivars Oasis and Baviacora, while differences were larger for Weaver during the yield realization phase. Also, yield in Exp. 3.3 was higher than in Exp. 3.4. Estimated biomass production for Siete Cerros during the yield realization phase exceeded observed yield in cycle II at the second level of nitrogen application of Exp. 3.1 (dotted arrow Fig. 3.6B). Relatively high LAI values were measured throughout the cycle (data not presented), while DW was low. Consequently RUE was low (arrow Fig. 3.3), so that ESDW was overestimated (dotted arrow Fig. 3.4).
Grains of crops yielding below the transition level must have been supplied by sources produced and stored before the yield realization phase. Up to 0.5 Mg ha-1 of translocated material would be needed at yield levels between 1 and 2 Mg ha" , increasing to 1 to 2 Mg ha~ at yield levels between 5 and 6 Mg ha~ , to decrease to zero at yield levels between 6 and 7 Mg ha-1. Translocation of assimilates temporarily stored in vegetative tissue, mainly the stem, has been reported to supplement grain growth (e.g. Bidinger et al., 1977; Kiniry, 1993). Gallagher et al. (1975) showed translocation from stems to supply up to 70% of the final yield of 3.65 Mg ha" when supply from photosynthesis after anthesis was deficient, due to drought stress. Yoshida (1972) reported the relative contribution of stored assimilates to grains to decrease at higher yield levels, as post-anthesis photosynthesis can largely supply the required assimilates for grain growth, while the contribution is relatively large at low yield levels. The maximum amount of assimilates that can be translocated can reach 2 Mg ha-1 in terms of grain yield. This is in accordance with our results (Fig. 3.6), confirming the importance of stored assimilates to yield realization, even in quantitative terms.
Under growth conditions where observed yields exceeded the transition yield levels, estimated assimilates produced during the yield realization phase exceeded observed yield. This suggests that reserves produced prior to that phase are not required for grain growth. Yields were lower in cycle II due to less favorable radiation conditions during the KNO determination phase resulting in lower KNO. Growth conditions during the yield realization phase were also slightly less favorable in cycle II, as illustrated by the estimated growth (Figs. 3.6A and B).
49
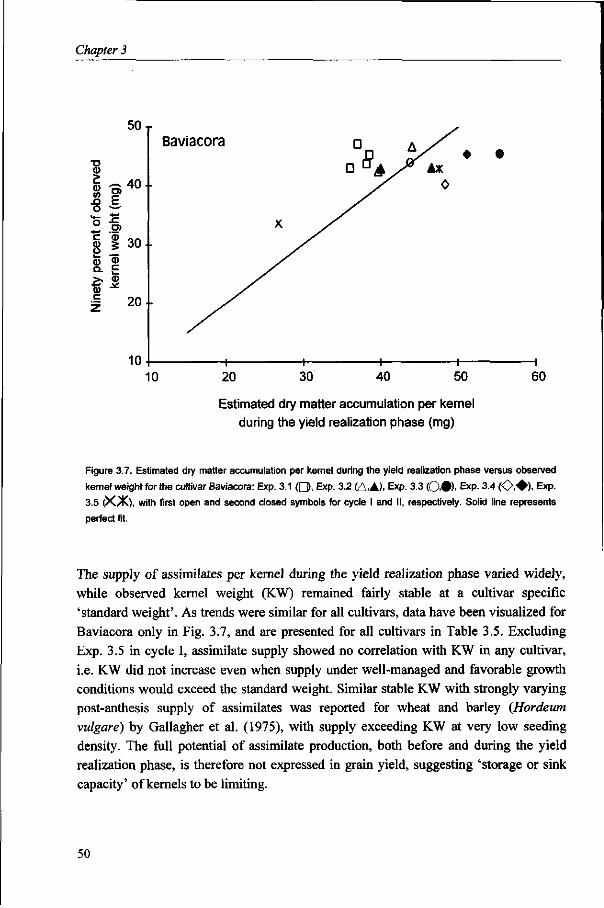
Chapter 3
50 r
T3
^ ~ 40 .o E o —̂
^ -s> *- ö) C '<D d> 5 H -o3 v o- E > . <D
TB * c Z
30--
20
10
Baviacora D
Ax
10 20 30 40 50 60
Estimated dry matter accumulation per kernel during the yield realization phase (mg)
Figure 3.7. Estimated dry matter accumulation per kernel during the yield realization phase versus observed
kernel weight for the cultivar Baviacora: Exp. 3.1 (Q, Exp. 3.2 (A,A). Exp. 3.3 ( 0 # ) . ExP- 3-4 ( O . ^ ) , Exp.
3.5 ( X X ) , with first open and second closed symbols for cycle I and II, respectively. Solid line represents
perfect fit.
The supply of assimilates per kernel during the yield realization phase varied widely, while observed kernel weight (KW) remained fairly stable at a cultivar specific 'standard weight'. As trends were similar for all cultivars, data have been visualized for Baviacora only in Fig. 3.7, and are presented for all cultivars in Table 3.5. Excluding Exp. 3.5 in cycle I, assimilate supply showed no correlation with KW in any cultivar, i.e. KW did not increase even when supply under well-managed and favorable growth conditions would exceed the standard weight. Similar stable KW with strongly varying post-anthesis supply of assimilates was reported for wheat and barley (Hordeum vulgare) by Gallagher et al. (1975), with supply exceeding KW at very low seeding density. The full potential of assimilate production, both before and during the yield realization phase, is therefore not expressed in grain yield, suggesting 'storage or sink capacity' of kernels to be limiting.
50
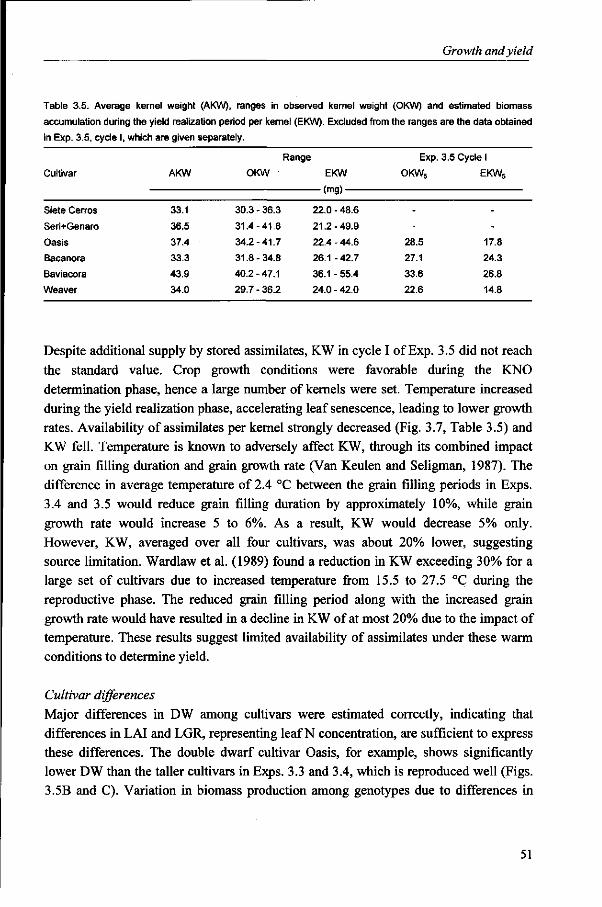
Growth and yield
Table 3.5. Average kernel weight (AKW), ranges in observed kernel weight (OKW) and estimated biomass
accumulation during the yield realization period per kernel (EKW). Excluded from the ranges are the data obtained
in Exp. 3.5, cycle I, which are given separately.
Cultivar
Siete Cerros
Seri+Genaro
Oasis
Bacanora
Baviacora
Weaver
AKW
33.1
36.5
37.4
33.3
43.9
34.0
OKW
30.3 - 36.3
31.4-41.8
34.2-41.7
31.8-34.8
40.2-47.1
29.7 - 36.2
3ange
EKW
(mg)
22.0 - 48.6
21.2-49.9
22.4 - 44.6
26.1 -42.7
36.1 - 55.4
24.0 - 42.0
Exp.
OKW6
--
28.5
27.1
33.6
22.6
3.5 Cycl e l
EKW5
--
17.8
24.3
26.8
14.8
Despite additional supply by stored assimilates, KW in cycle I of Exp. 3.5 did not reach
the standard value. Crop growth conditions were favorable during the KNO
determination phase, hence a large number of kernels were set. Temperature increased
during the yield realization phase, accelerating leaf senescence, leading to lower growth
rates. Availability of assimilates per kernel strongly decreased (Fig. 3.7, Table 3.5) and
KW fell. Temperature is known to adversely affect KW, through its combined impact
on grain filling duration and grain growth rate (Van Keulen and Seligman, 1987). The
difference in average temperature of 2.4 °C between the grain filling periods in Exps.
3.4 and 3.5 would reduce grain filling duration by approximately 10%, while grain
growth rate would increase 5 to 6%. As a result, KW would decrease 5% only.
However, KW, averaged over all four cultivars, was about 20% lower, suggesting
source limitation. Wardlaw et al. (1989) found a reduction in KW exceeding 30% for a
large set of cultivars due to increased temperature from 15.5 to 27.5 °C during the
reproductive phase. The reduced grain filling period along with the increased grain
growth rate would have resulted in a decline in KW of at most 20% due to the impact of
temperature. These results suggest limited availability of assimilates under these warm
conditions to determine yield.
Cultivar differences
Major differences in DW among cultivars were estimated correctly, indicating that
differences in LAI and LGR, representing leaf N concentration, are sufficient to express
these differences. The double dwarf cultivar Oasis, for example, shows significantly
lower DW than the taller cultivars in Exps. 3.3 and 3.4, which is reproduced well (Figs.
3.5B and C). Variation in biomass production among genotypes due to differences in
51

Chapter 3
RUE indeed appears negligible compared to variability in incident radiation and the fraction intercepted by the leaf canopy (Kiniry et al., 1989). More distinct were the low yield of the older cultivar Siete Cerros, although growth during the yield realization phase was not lower than that of the other cultivars (Figs. 3.6A and B). Sink capacity appeared to limit yield more strongly in Siete Cerros than in more recently released cultivars, as surplus assimilate production per kernel was highest (Table 3.5).
Sink-source balance As sink capacity may limit grain growth and yield, its quantitative understanding should receive major research attention. Sink capacity may be expressed as KNO multiplied by potential kernel weight (PKW). Strong associations between KNO and yield necessitate understanding of variation in KNO in quantifying sink capacity and explaining yield. Much effort is indeed put in this field (e.g. Abbate et al., 1995; Fischer, 1985). Kernels will attain their potential weight under unlimited supply of assimilates, e.g. after grain reduction (Fischer and HilleRisLambers, 1978). However, KW did not increase when availability of assimilates exceeded kernel weight by 20 to 50% (Fig. 3.7, Table 3.5). A review of the effects of manipulating source-sink relationships in wheat was given by Slafer and Savin (1994). Responses in KW of-10 to +30% were found under similar relative changes in source-sink ratio, suggesting genotype-environment interactions. Additional research is essential to improve our understanding of kernel growth.
Under a wide range of conditions the crop will be 'in balance' and produce a certain number of grains with a standard weight under the prevailing temperature conditions. Assimilation during the yield realization phase, supplemented by translocated reserves meets grain demand. However, under well managed conditions, the capacity of the grains to store the available assimilates may be limiting, leading to under-utilization of the source capacity. Wheat yield potential could, therefore, be further increased by increasing sink capacity through breeding. Further study is needed to identify in more detail the required changes to achieve such an increase. Although no mechanistic explanation is given to his work, Dençiç (1994) indeed reported yield potential to increase with increasing sink capacity through the increase in various yield components. Higher yields obtained in cultivars released more recently than Siete Cerros released in 1966, are due to differences in sink capacity.
On the other hand, the crop may fail to supply the grains set during the KNO determination phase under the prevailing crop and/or environmental conditions. The crop will then be out of 'balance' with this phase if crop and/or environmental conditions during the yield realization phase are unfavorable. This situation may occur in environments with terminal heat and/or water stress, like in Exp. 3.5 of cycle I (see also Wardlaw et al., 1989). Under such conditions, increased growth during the yield
52
Growth and yield
realization phase could be achieved through prolonged leaf life span, increasing assimilate availability (Van Keulen and Seligman, 1987). Again, further study is needed to explore this option.
53
Chapter 4
Dynamics of stem reserves in wheat under a
wide range of N availability3
Abstract
Wheat yield originates from assimilates produced during post-anthesis, supplemented by stem reserves. The contribution of reserves to yield varies considerably. Two hypotheses, derived from literature, state that the amount of stem reserves is the resultant of production of and demand for carbohydrates and that the contribution of reserves decreases with increasing yield level. Two field experiments were conducted at various N application rates to obtain a wide range in growth conditions and yield. A simple crop growth algorithm was applied to analyse the results and to test the two hypotheses. Stem reserve dynamics were determined by crop growth and demand by grains during the first part of grain filling, while other processes are likely to occur towards maturity. Remobilization of stem reserves, from a week after anthesis till maturity, increases with increasing yield up to 4.5 Mg ha~ , but the hypothesized subsequent decrease with further increasing yields is not always found. It is suggested that processes like wasteful respiration and negative feedback of reserve accumulation on photosynthesis could be of significant importance in affecting remobilization. Up to 400 kg ha-1 of residual reserves in the stem at maturity under optimum management conditions in combination with the possible occurrence of the above processes, suggest that yield is determined by storage or sink capacity of the kernels, rather than by source capacity of the crop.
" P.S. Bindraban, K.D. Sayre and J. Lopez-Cesati, 1997. Dynamics of stem reserves in wheat under a wide range of N availability. Field Crops Research (submitted).
Chapter 4
Introduction
Grain yield in wheat (Triticum aestivum) is supplied by assimilates produced during
post-anthesis, supplemented by reserve carbohydrates stored mainly in the stems. The
contribution of reserves to yield varies considerably, depending on environmental
conditions (Evans, 1993; Schnyder, 1993). Reserves are of particular importance when
post-anthesis stresses like disease infestation (Evans, 1993) or drought (Bidinger et al.,
1977) reduce assimilate supply (Kiniry, 1993). Yoshida (1972) and Bindraban et al.
(1997) also hypothesized that the contribution of reserves decreases with increasing
yield level, as at high yield levels post-anthesis assimilate production can largely supply
the required assimilates for grain growth. Reported total amounts of remobilized
reserves vary from less than 10% to up to 70% of final yield in relative, and up to 2.5
Mg ha-1 in absolute terms (Gallagher et al., 1975).
The importance of, and the large variation in reserve remobilization, necessitate
its systematic understanding. It is generally accepted that the amount of stem reserves is
the resultant of production of and demand for carbohydrates (Schnyder, 1993), and this
concept is applied in many crop growth simulation models (SIMTAG: Stapper, 1984;
CERES: Ritchie and Otter, 1985; SUCROS87: Spitters et al., 1989). Stem reserve
dynamics may be described in a balance calculation of crop growth and demand by
grains, starting a week after anthesis, as growth of non-grain tissue during the first week
(Fischer and Stockman, 1986; Kirby, 1988) complicate a simple balance calculation. In
this chapter, stem reserve dynamics are studied and the hypothesis that the contribution
of reserves decreases with increasing yield level is examined, on the basis of variation
in biomass and yield obtained in field experiments through a wide range of N
application rates.
Materials and Methods
Data were collected over a three-year period, 1993/94, 1994/95 and 1995/96, referred to
as cycle I, II and III, respectively, in two field experiments at the CIMMYT
experimental site near Obregon, Mexico (40 meter above sea level, 28°N and 109°W).
The soil in both experiments was a coarse sandy clay, mixed montmorillonitic, typic
Calciorthid (pH 7.7), low in organic matter (<10 mg g~ ) and with adequate K fertility.
Before sowing, 17.5 kg P ha - as triple super phosphate was broadcast as a basal
dressing and incorporated by disc harrow. Complete descriptions of both experiments
are given by Bindraban et al. (1997) for cycles I and II, and apply to cycle III also.
In Exp. 4.1, nitrogen was applied as basal application at 0, 75, 150 and 300 kg
ha~'. This experiment was conducted during all three cycles (Bindraban et al., 1997),
56
Stern reserve dynamics
but stem reserves were determined only for cultivars Bacanora and Siete Cerros in cycles II and III, and for cultivar Weaver in cycle III.
In Exp. 4.2, yield potential of cultivars with a wide range in crop characteristics was determined in all three cycles. Crops were grown under optimum management conditions, with nitrogen supplied to the crop by an incorporated leguminous cover crop, chicken manure and fertilizer. Estimated total nitrogen supply approximated 500 kg ha-1. Stem reserves were determined for the cultivars Bacanora and Weaver in all three cycles and for Siete Cerros in cycles II and III.
The entries were sown in the second half of November at 300 viable seeds m~2 in plots of eight rows, spaced at 20 cm, and 5-6 m long. Frequent irrigation ensured adequate water availability, while pests, diseases and weeds were controlled.
Fifty-cm long sections of the six central rows were harvested at ground level to determine total aboveground dry weight in the course of crop growth. In Exp. 4.1, dry weight samples were taken at 3, 20 and 30 days after anthesis in cycle II, and two weeks before and 7 and 15 days after anthesis in cycle III. In Exp. 4.2, dry weight samples were taken three weeks before, 7, 20 and 30 days after anthesis in cycles I and II and two weeks before and 15 days after anthesis in cycle III. In cycles I and II, two plots were planted per treatment in Exp. 4.2. Total areas of 2.4 and 3.6 m in Exps. 1 and 2, respectively, were sampled at final harvest. Biomass, yield and yield components were determined. Leaf area index (LAI) was determined non-destructively throughout the cycle with a LAI-2000 (LiCor, Int. Lincoln, NE) as described by Bindraban et al. (1997) and Bindraban (1997) in Exp. 4.1 in all cycles and in Exp. 4.2 in cycle III. LAI was destructively determined throughout growth in Exp. 4.2 in cycles I and II (Bindraban et al., 1997). Leaf greenness ratings, as estimator of leaf nitrogen content, were measured with a hand-held Minolta SPAD (Minolta Camera Co., Ltd., Japan) meter throughout growth in both experiments and all cycles (Bindraban et al., 1997; Bindraban, 1997).
From all dry matter samplings, subsamples were taken to determine stem weight after removing leaves and spikes. Water-soluble carbohydrates were extracted from ground stem material with water at 60 °C and concentrations were determined colorimetrically using the anthrone method (Morris, 1948).
To establish growth of kernels, five to six samples of at least five spikes were taken during grain filling, starting seven days after anthesis. Sigmoidal curves were regressed through the data to describe kernel growth (Darroch and Baker, 1990).
The dynamics of stem reserves during grain filling were described as the net balance of growth of the crop minus demand by the grains. Growth was quantified with the calculation algorithm described by Bindraban et al. (1997), with observed LAI and leaf greenness ratings introduced in the calculations. Demand by grains was obtained from
57
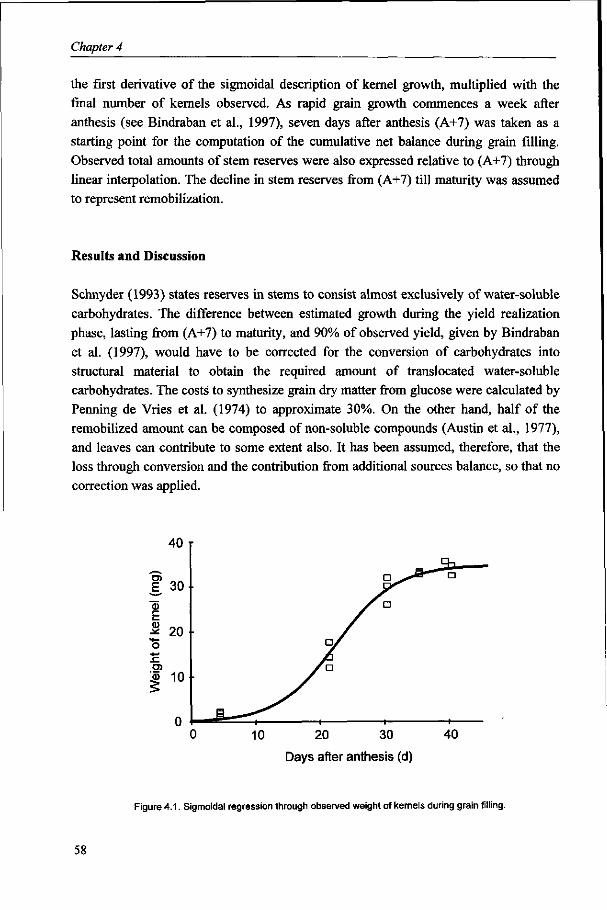
Chapter 4
the first derivative of the sigmoidal description of kernel growth, multiplied with the final number of kernels observed. As rapid grain growth commences a week after anthesis (see Bindraban et al., 1997), seven days after anthesis (A+7) was taken as a starting point for the computation of the cumulative net balance during grain filling. Observed total amounts of stem reserves were also expressed relative to (A+7) through linear interpolation. The decline in stem reserves from (A+7) till maturity was assumed to represent remobilization.
Results and Discussion
Schnyder (1993) states reserves in stems to consist almost exclusively of water-soluble carbohydrates. The difference between estimated growth during the yield realization phase, lasting from (A+7) to maturity, and 90% of observed yield, given by Bindraban et al. (1997), would have to be corrected for the conversion of carbohydrates into structural material to obtain the required amount of translocated water-soluble carbohydrates. The costs to synthesize grain dry matter from glucose were calculated by Penning de Vries et al. (1974) to approximate 30%. On the other hand, half of the remobilized amount can be composed of non-soluble compounds (Austin et al., 1977), and leaves can contribute to some extent also. It has been assumed, therefore, that the loss through conversion and the contribution from additional sources balance, so that no correction was applied.
Days after anthesis (d)
Figure 4.1. Sigmoidal regression through observed weight of kernels during grain filling.
58
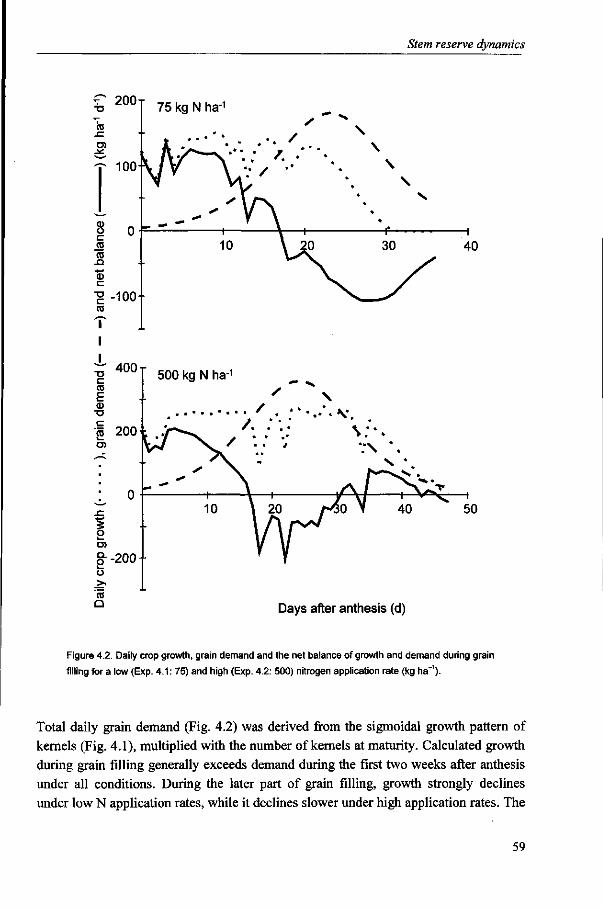
Stern reserve dynamics
2 0 0 T 75 kg N ha-1
Days after anthesis (d)
Figure 4.2. Daily crop growth, grain demand and the net balance of growth and demand during grain
filling fora low (Exp. 4.1: 75) and high (Exp. 4.2: 500) nitrogen application rate (kg ha-1).
Total daily grain demand (Fig. 4.2) was derived from the sigmoidal growth pattern of
kernels (Fig. 4.1), multiplied with the number of kernels at maturity. Calculated growth
during grain filling generally exceeds demand during the first two weeks after anthesis
under all conditions. During the later part of grain filling, growth strongly declines
under low N application rates, while it declines slower under high application rates. The
59
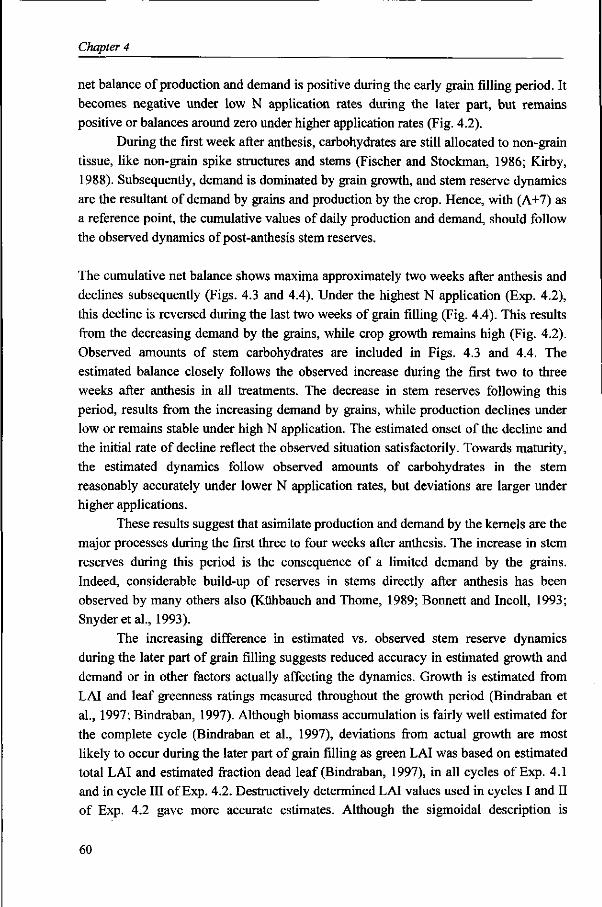
Chapter 4
net balance of production and demand is positive during the early grain filling period. It
becomes negative under low N application rates during the later part, but remains
positive or balances around zero under higher application rates (Fig. 4.2).
During the first week after anthesis, carbohydrates are still allocated to non-grain
tissue, like non-grain spike structures and stems (Fischer and Stockman, 1986; Kirby,
1988). Subsequently, demand is dominated by grain growth, and stem reserve dynamics
are the resultant of demand by grains and production by the crop. Hence, with (A+7) as
a reference point, the cumulative values of daily production and demand, should follow
the observed dynamics of post-anthesis stem reserves.
The cumulative net balance shows maxima approximately two weeks after anthesis and
declines subsequently (Figs. 4.3 and 4.4). Under the highest N application (Exp. 4.2),
this decline is reversed during the last two weeks of grain filling (Fig. 4.4). This results
from the decreasing demand by the grains, while crop growth remains high (Fig. 4.2).
Observed amounts of stem carbohydrates are included in Figs. 4.3 and 4.4. The
estimated balance closely follows the observed increase during the first two to three
weeks after anthesis in all treatments. The decrease in stem reserves following this
period, results from the increasing demand by grains, while production declines under
low or remains stable under high N application. The estimated onset of the decline and
the initial rate of decline reflect the observed situation satisfactorily. Towards maturity,
the estimated dynamics follow observed amounts of carbohydrates in the stem
reasonably accurately under lower N application rates, but deviations are larger under
higher applications.
These results suggest that asimilate production and demand by the kernels are the
major processes during the first three to four weeks after anthesis. The increase in stem
reserves during this period is the consequence of a limited demand by the grains.
Indeed, considerable build-up of reserves in stems directly after anthesis has been
observed by many others also (Kühbauch and Thome, 1989; Bonnett and Incoll, 1993;
Snyder et al., 1993).
The increasing difference in estimated vs. observed stem reserve dynamics
during the later part of grain filling suggests reduced accuracy in estimated growth and
demand or in other factors actually affecting the dynamics. Growth is estimated from
LAI and leaf greenness ratings measured throughout the growth period (Bindraban et
al., 1997; Bindraban, 1997). Although biomass accumulation is fairly well estimated for
the complete cycle (Bindraban et al., 1997), deviations from actual growth are most
likely to occur during the later part of grain filling as green LAI was based on estimated
total LAI and estimated fraction dead leaf (Bindraban, 1997), in all cycles of Exp. 4.1
and in cycle III of Exp. 4.2. Destructively determined LAI values used in cycles I and II
of Exp. 4.2 gave more accurate estimates. Although the sigmoidal description is
60
Stern reserve dynamics
Ol
500 0 kg N ha y
/ !/
1 —
r \ 75 kg N ha1
\ \
V \ \ ^
\ i
\
1 1 1
300 kg N ha1
-1500 10 20 30 40 o 10 20
Days after anthesis (d) 30 40
Figure 4.3. Calculated cumulative net balance of growth and demand, relative to (A+7) (Cycle II: — ; and
III: ) and observed amounts of stem reserves during grain filling (Cycle l l : | ; and III: A), for Bacanora at
all nitrogen application rates in Exp. 4.1. Bars indicate standard error of mean.
61

Chapter 4
T> c 03
E o» •o
"O c CO f"
o O)
o (1) o r co co x> 0)
z
^^^ T -
co .c m
.M
+
o •4-»
<u > - * - » co ?
1000
500
-500
ïï -1000
-1500
Days after anthesis (d)
Figure 4.4. Cumulative net balance (Cycle I: ; II: ; III: — — -
of stem reserves during grain filling for Bacanora in Exp. 4.2 (Cycle I: %\ II:
•) and observed amounts
• ; and III: A).
sufficiently precise for kernel growth (Darroch and Baker, 1990), demand on a daily
basis may not be representative, as peak demands near the inflexion point may be
overestimated (Fig. 4.2), while demand during the last days before maturity may be
overestimated also. Alternative descriptions, like the Gompertz curve (France and
Thornley, 1984) or a discontinuous curve with linear growth during the central part of
grain filling, altered the shape of the cumulative net-balance curve only slightly, while
the curves end at the same point because of unchanged total demand.
Remobilization, from (A+7) till maturity, in relation to 90% of observed yield is given
in Fig. 4.5. The difference between 90% observed yield and calculated growth during
the yield realization period as reported by Bindraban et al. (1997) for cycles I and II and
the calculated difference for cycle III (analysis not given, but similar to Bindraban et al.
(1997)) are included in the figure also. Significant quadratic regression was found for
Siete Cerros only (r = 0.67; p=0.007), while regressions were weak for Bacanora (r =
0.44; p = 0.10) and Weaver (r2 = 0.74; p = 0.12). The increase in remobilization up to
4.5 Mg ha-1 was highly significant for all cultivars, while the subsequent decrease was
significant for Siete Cerros only.
The increasing requirement for reserve remobilization with increasing yield at
lower yield levels for both observed and estimated required translocation, is presumably
62
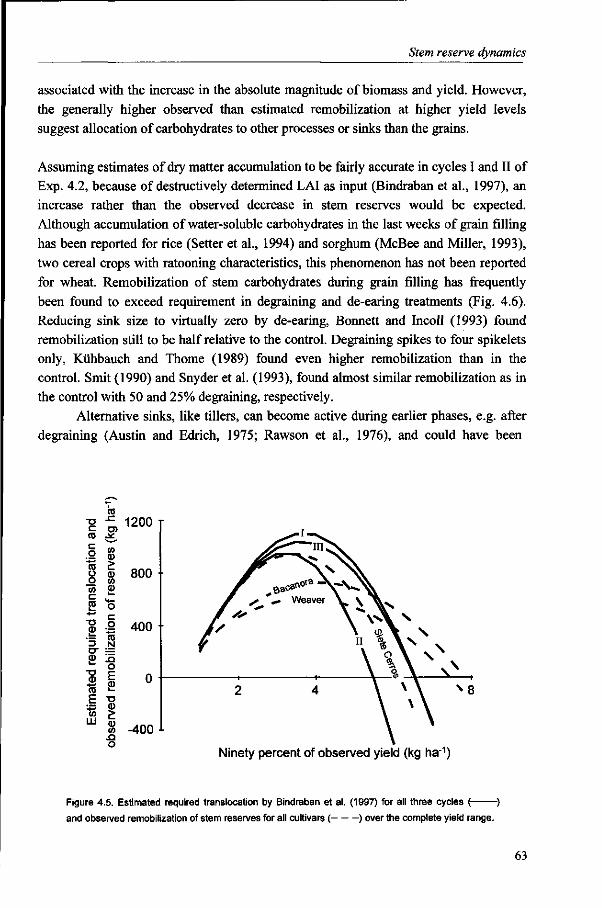
Stern reserve dynamics
associated with the increase in the absolute magnitude of biomass and yield. However, the generally higher observed than estimated remobilization at higher yield levels suggest allocation of carbohydrates to other processes or sinks than the grains.
Assuming estimates of dry matter accumulation to be fairly accurate in cycles I and II of Exp. 4.2, because of destructively determined LAI as input (Bindraban et al., 1997), an increase rather than the observed decrease in stem reserves would be expected. Although accumulation of water-soluble carbohydrates in the last weeks of grain filling has been reported for rice (Setter et al., 1994) and sorghum (McBee and Miller, 1993), two cereal crops with ratooning characteristics, this phenomenon has not been reported for wheat. Remobilization of stem carbohydrates during grain filling has frequently been found to exceed requirement in degraining and de-earing treatments (Fig. 4.6). Reducing sink size to virtually zero by de-earing, Bonnett and Incoll (1993) found remobilization still to be half relative to the control. Degraining spikes to four spikelets only, Kühbauch and Thome (1989) found even higher remobilization than in the control. Smit (1990) and Snyder et al. (1993), found almost similar remobilization as in the control with 50 and 25% degraining, respectively.
Alternative sinks, like tillers, can become active during earlier phases, e.g. after degraining (Austin and Edrich, 1975; Rawson et al., 1976), and could have been
•o l_ co c o co o o CO f -co
•4-»
o CD 3 a-Ï
en CD F co LU
CO sz U) .* CO CI)
CD en Ë o c o ni N
o E i _
•D a> e CD CO
o
1?00
800
400
n
-400
Ninety percent of observed yield (kg ha1)
Figure 4.5. Estimated required translocation by Bindraban et al. (1997) for all three cycles (
and observed remobilization of stem reserves for all cultivars ( ) over the complete yield range.
63
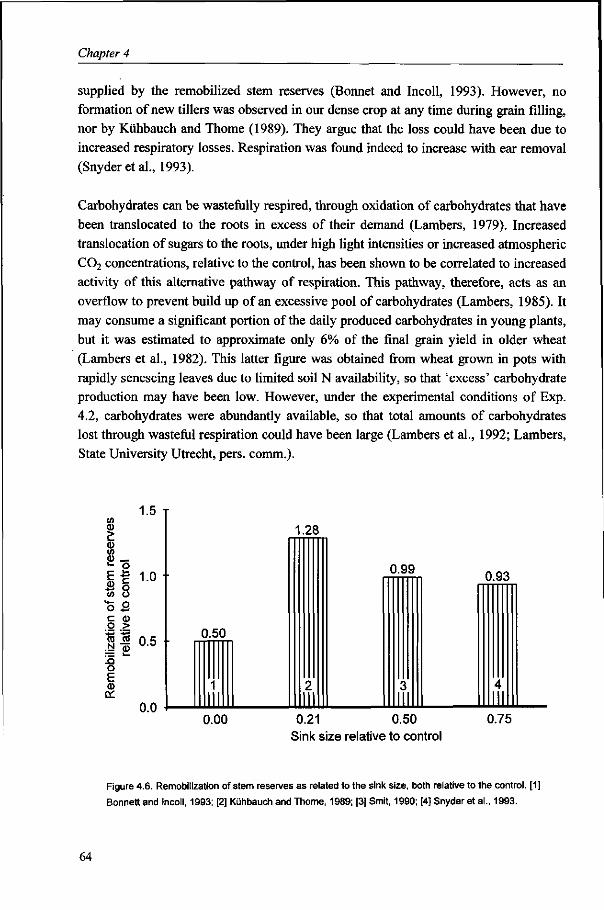
Chapter 4
supplied by the remobilized stem reserves (Bonnet and Incoll, 1993). However, no
formation of new tillers was observed in our dense crop at any time during grain filling,
nor by Kühbauch and Thome (1989). They argue that the loss could have been due to
increased respiratory losses. Respiration was found indeed to increase with ear removal
(Snyder et al., 1993).
Carbohydrates can be wastefully respired, through oxidation of carbohydrates that have
been translocated to the roots in excess of their demand (Lambers, 1979). Increased
translocation of sugars to the roots, under high light intensities or increased atmospheric
C0 2 concentrations, relative to the control, has been shown to be correlated to increased
activity of this alternative pathway of respiration. This pathway, therefore, acts as an
overflow to prevent build up of an excessive pool of carbohydrates (Lambers, 1985). It
may consume a significant portion of the daily produced carbohydrates in young plants,
but it was estimated to approximate only 6% of the final grain yield in older wheat
(Lambers et al., 1982). This latter figure was obtained from wheat grown in pots with
rapidly senescing leaves due to limited soil N availability, so that 'excess' carbohydrate
production may have been low. However, under the experimental conditions of Exp.
4.2, carbohydrates were abundantly available, so that total amounts of carbohydrates
lost through wasteful respiration could have been large (Lambers et al., 1992; Lambers,
State University Utrecht, pers. comm.).
1.5 in 0) ? d) (0
P — 9 E £ S o </> o t 5 2 c eu o > co ra N "Ö)
-Q O
F a> cc
1.0
0.5
0.0
1.28
0.50
0.99 0.93
0.00 0.21 0.50 Sink size relative to control
4 II
0.75
Figure 4.6. Remobilization of stem reserves as related to the sink size, both relative to the control. [1]
Bonnett and Incoll, 1993; [2] Kühbauch and Thome, 1989; [3] Smit, 1990; [4] Snyder et al., 1993.
64
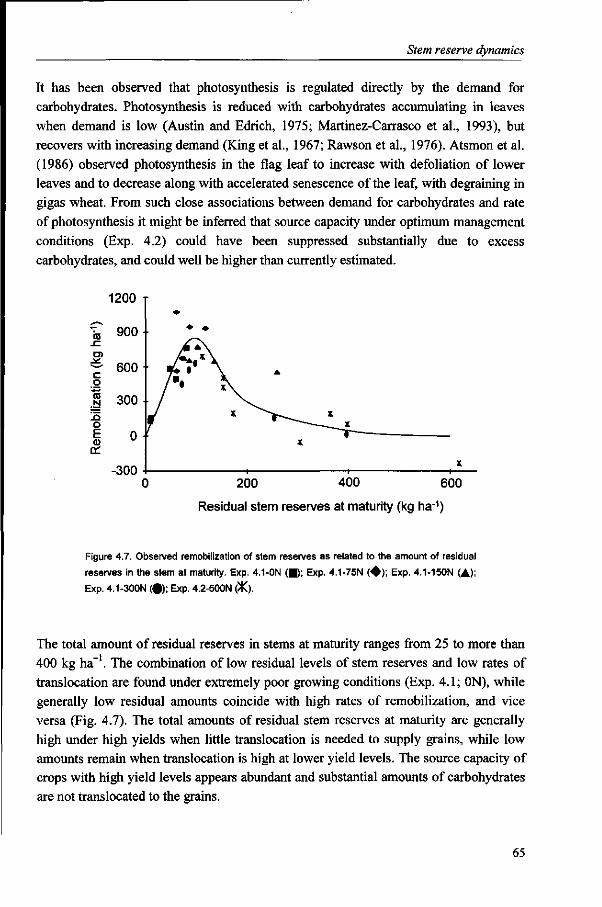
Stern reserve dynamics
It has been observed that photosynthesis is regulated directly by the demand for carbohydrates. Photosynthesis is reduced with carbohydrates accumulating in leaves when demand is low (Austin and Edrich, 1975; Martinez-Carrasco et al., 1993), but recovers with increasing demand (King et al., 1967; Rawson et al., 1976). Atsmon et al. (1986) observed photosynthesis in the flag leaf to increase with defoliation of lower leaves and to decrease along with accelerated senescence of the leaf, with degraining in gigas wheat. From such close associations between demand for carbohydrates and rate of photosynthesis it might be inferred that source capacity under optimum management conditions (Exp. 4.2) could have been suppressed substantially due to excess carbohydrates, and could well be higher than currently estimated.
-̂̂ <0 _tz D)
JUL
C O
TO N
!5 o E OL
1ÜUU
900
600
300
0
-300
•
• •
m * \ b. X \
1 ^ J X
1—
A
X
X - _ _ ) K
1 X
200 400 600
Residual stem reserves at maturity (kg ha1)
Figure 4.7. Observed remobilization of stem reserves as related to the amount of residual
reserves in the stem at maturity. Exp. 4.1-0N (•); Exp. 4.1-75N ( • ) ; Exp. 4.1-150N (A);
Exp. 4.1-300N (•) ; Exp. 4.2-500N (X).
The total amount of residual reserves in stems at maturity ranges from 25 to more than 400 kg ha-1. The combination of low residual levels of stem reserves and low rates of translocation are found under extremely poor growing conditions (Exp. 4.1; ON), while generally low residual amounts coincide with high rates of remobilization, and vice versa (Fig. 4.7). The total amounts of residual stem reserves at maturity are generally high under high yields when little translocation is needed to supply grains, while low amounts remain when translocation is high at lower yield levels. The source capacity of crops with high yield levels appears abundant and substantial amounts of carbohydrates are not translocated to the grains.
65
Chapter 5
Determination of kernel number in wheat
and its manipulation3
Abstract
Understanding variation in kernel number per area unit (KNO) is of major importance in understanding yield and in identifying opportunities to increase yield potential. Various variables have been used to analyse this yield component, such as photothermal quotient (PTQ) and biomass at anthesis, but the relations with KNO show considerable variation. More accurate relations are expected with paramters representing assimilate availability for floret and grain set in relation to crop and environmental conditions. Several field experiments with various spring wheat cultivars were conducted over three years in Mexico. Wide ranges in crop and environmental conditions were obtained by varying N application rates and timing and by different planting dates and locations. Crop development from emergence (DC 10) to physiological maturity (DC90) was divided in three phases, with the intermediate phase II ranging approximately from early booting (DC40) to final anthesis (DC70). PTQ during phase II failed to explain the variation in KNO. Biomass at anthesis explained a fair portion, but could not explain some deviant situations and the relation was strongly cultivar specific. Biomass accumulation during phase II more accurately explained the deviant situations, except one particular location, and cultivar differences became even more pronounced. At this location KNO was also well explained by non-grain spike weight at a week from anthesis, with a constant number of kernels per unit spike dry matter, while differences among cultivars tended to disappear. Factors that are identified to determine KNO are discussed.
"P.S. Bindraban, K.D. Sayre and E. Solis-Moya, 1997. Determination of kernel number in wheat and its manipulation. Field Crops Research (accepted with revisions).
Chapter 5
Introduction
Increase in wheat {Triticum aestivum) yield potential could be achieved through increased kernel number per unit area (KNO), as strong associations with yield have been found, not only for varying environmental conditions, but also for many sets of historical wheat cultivars (Austin et al., 1980; Slafer et al., 1990). Understanding variation in KNO is essential for explaining yield variability and for identifying options to further increase wheat yield potential.
Variation in KNO can be described in terms of yield components, i.e. plant density, spikes per plant, spikelets per spike, competent florets per spikelet and kernels per competent floret. Although initiation and rise to peak values of these components is reasonably well understood, their survival is so poorly understood that application of this so-called numerical approach to determine KNO becomes ineffective (Fischer, 1993, 1985, 1983). Availability of carbohydrates during the period of grain establishment and setting is generally considered the driving force for KNO determination (Spiertz and Van Keulen, 1980). An assimilate-based approach could provide a more effective alternative in understanding determination of KNO.
On the basis of shoot apex development, development of the wheat plant can be divided in several phases, depending on research objective (Kirby, 1988; Slafer et al., 1996). For the current study, three phases, most relevant for the determination of grain yield, are distinguished. Leaves, spikelets and tillers are initiated in the first phase, ending somewhere near terminal spikelet. At the end of this phase, potential number of florets largely exceeds one hundred thousand nf (Fischer, 1983).
During the second phase, ending a week after anthesis, floret maturation and death takes place, followed by ovule fertilization or grain set, resulting in final KNO at the end of this phase. Fischer and Stockman (1986) and Kirby (1988) have shown this important period in establishment of KNO to coincide with rapid ear and stem growth, concluding that floret death may be due partly to competition for resources between ear and stem. The most responsive period, in terms of KNO, to fluctuations in environmental conditions like solar radiation (Fischer, 1975; Savin and Slafer, 1991), carbon dioxide (Fischer and Aguilar, 1976) and temperature (Wardlaw, 1970), has been found over three weeks prior to anthesis, while some sensitivity is noticed till ten days after anthesis (Wardlaw, 1970). Using the photothermal quotient (PTQ: Nix, 1976), an integrative measure for radiation and temperature, Savin and Slafer (1991) and Ortiz-Monasterio et al. (1994) indeed showed this variable during the period from 20 days before to 10 days after anthesis and heading, respectively, to maximally explain variation in KNO. It is more appropriate to relate KNO to events during a specific
68
Kernel number
developmental period, rather than to a fixed time period, as KNO is strongly affected by the length of the phase (Fischer and Maurer, 1976; Fischer, 1983). Rapid spike growth roughly starts at early booting (DC40: Zadoks et al., 1974) and ends at final anthesis (DC70). These development stages delineate the KNO determination phase.
Finally, grain filling occurs in the third phase. An overview of these three phases is given in Fig. 5.1 with coinciding decimal codes according to Zadoks et al. (1974) and development stages as defined in the development procedure described in the following section. Bindraban et al. (1997) studied the importance of the third, grain filling, phase, while the significance of the second phase is subject of this chapter.
Variation in KNO is expected to relate more strongly to growth during phase II than to events before or after this phase. However, assessment of KNO in wheat growth simulation models, is often based on relationships with biomass at anthesis (SUCROS87: Spitters et al., 1989; SIMTAG: Stapper, 1984). This variable can be considered an integrative measure for crop and environmental conditions till anthesis, comprising the largest part of phase II. The relationships show considerable variation and appear cultivar specific (Spiertz and Van Keulen, 1980; Stapper, 1984). PTQ takes into consideration the environmental conditions radiation and temperature, while neglecting crop condition. Biomass accumulation during phase II and spike weight might be more promising alternatives, as they integrate crop and environmental conditions over the KNO determination period. High correlations of spike weight at or a
—2
week after anthesis (A+7) with KNO for yields up to 700 g m , have been shown by various authors (Brooking and Kirby, 1981; Fischer, 1983; Fischer, 1993). This chapter attempts to identify factors underlying variation in KNO for a range of wheat cultivars, crop and environmental conditions, by considering the above variables in the analysis. Measures to further increase wheat yield potential are discussed in relation to these conditions.
Materials and Methods
Various experiments were conducted over three years at the CIMMYT (Centro Internacional de Mejoramiento de Maiz y Trigo) experimental site in the Yaqui Valley, near Obregon, Mexico, at the CIANO (Centro de Investigaciones Agricolas de Noroeste) experimental station (40 meters above sea level and 28°N and 109°W). Soil characteristics and a complete description of experimental conditions and designs are given by Bindraban et al. (1997) for the cycles 1993/94 and 1994/95, referred to as cycle I and II, respectively, and were similar for the third cycle of 1995/96. One experiment was conducted near Celaya, Mexico at the CIFA (Centro de Investigaciones
69

Chapter 5
de Forestales y Agropecuarias) experimental station (1700 meters above sea level and 21°N and 101°W) in cycle III only. The soil at CIFA was a black vertisol with medium organic matter content (ca. 20 mg g ). Average monthly temperature and radiation data are given in Table 5.1 for all cycles and both locations.
Table 5.1. Average monthly temperatures and radiation for three cycles at Obregon, and one at Celaya (IMC).
Tmin
(°C)
Tmax
(°C)
Radiation
(MJ m"2d"1)
Cycle
I
II
III
MIC
I
II
III
IIIC
I
II
III
IIIC
Nov.
14.1
12.9
14.0
7.1
27.7
28.1
30.5
25.7
13.3
14.9
16.5a
18.3a
Dec.
11.0
11.3
8.6
4.7
25.0
22.9
26.0
23.2
11.0
11.5
14.7
16.1
Jan.
8.3
8.1
5.8
1.1
25.9
24.5
27.2
23.6
13.6
14.9
16.5
19.8
Feb.
8.1
11.9
10.3
3.1
25.4
27.2
28.3
25.3
15.5
16.3
18.6
21.0b
March
10.7
11.4
9.5
3.7
27.8
29.3
29.2
26.0
18.9
23.0
24.3
24.3
April
12.2
9.9
12.6
7.8
32.3
31.7
33.1
29.3
22.4
28.1
27.1
25.2
May
14.9
14.7
18.0
12.1
35.4
34.3
35.9
31.6
23.7
29.8a
28.4a
25.9
'Two weeks data only "Some days of estimated values from sunshine hour
An overview of the experiments with N application rate and timing, and cultivars grown, is given in Table 5.2. Cultivars grown were Siete Cerros, Oasis, Bacanora, Baviacora and Weaver. The wide range in characteristics of these cultivars is given by Bindraban et al. (1997). In Exp. 5.1, cultivar response to various basal nitrogen application rates was tested. In Exp. 5.2, cultivars were tested on their response to basal and delayed nitrogen application at first node. In cycle III, the delayed application was included as fifth treatment in Exp. 5.1. In Exps. 5.3 to 5.7, yield potential of various cultivars was determined under optimum management conditions. Nitrogen was supplied to the crop by an incorporated leguminous cover crop, chicken manure and fertilizer. At CIFA (Exp. 5.7) a fallow period, instead of a leguminous crop, preceeded the wheat crop. The estimated total nitrogen supply approximated 500 kg ha" . Exps. 5.1 to 5.4 were sown at 'optimum' planting dates for Obregon at the end of November. Exp. 5.5 was 'late' sown on January 18, 17 and 4 in cycle I, II and III, respectively. Exp. 5.6 was sown very late on February 2 in cycle III only. Exp. 5.7 was sown in cycle III only, on Nov. 8 , an optimum planting date in the cooler location near Celaya.
70
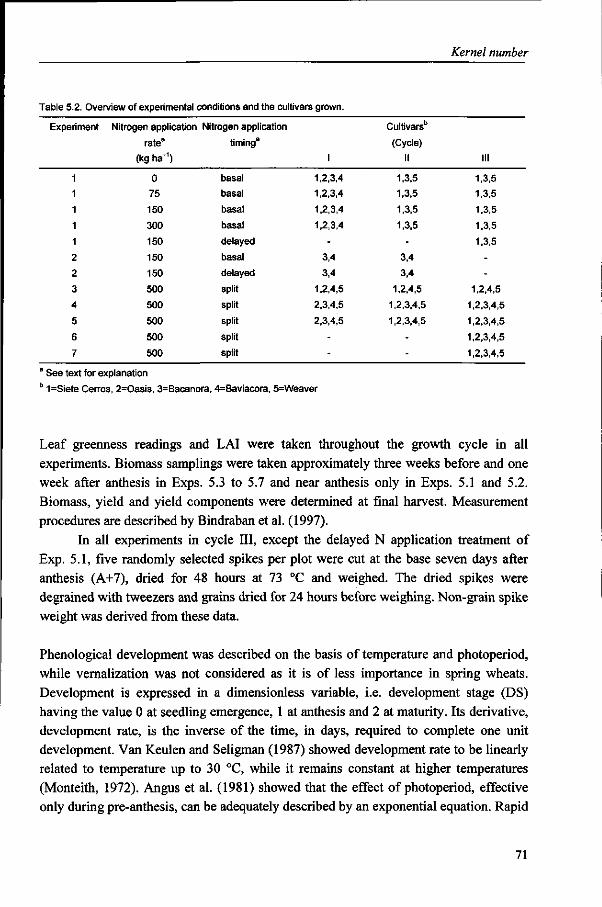
Kernel number
Table 5.2. Overview of experimental conditions and the cultivars grown.
Experiment
2
2
3
4
5
6
7
Nitrogen application Nitrogen application
ratea
(kg ha 1)
0
75
150
300
150
150
150
500
500
500
500
500
timing3
basal
basal
basal
basal
delayed
basal
delayed
split
split
split
split
split
I
1,2,3,4
1,2,3,4
1,2,3,4
1,2,3,4
-3,4
3,4
1,2,4,5
2,3,4,5
2,3,4,5
--
Cultivarsb
(Cycle)
II
1,3,5
1,3,5
1,3,5
1,3,5
-3,4
3,4
1,2,4,5
1,2,3,4,5
1,2,3,4,5
--
Ill
1,3,5
1,3,5
1,3,5
1,3,5
1,3,5
--
1,2,4,5
1,2,3,4,5
1,2,3,4,5
1,2,3,4,5
1,2,3,4,5
See text for explanation b 1=Siete Cerros, 2=Oasis, 3=Bacanora, 4=Baviacora, 5=Weaver
Leaf greenness readings and LAI were taken throughout the growth cycle in all
experiments. Biomass samplings were taken approximately three weeks before and one
week after anthesis in Exps. 5.3 to 5.7 and near anthesis only in Exps. 5.1 and 5.2.
Biomass, yield and yield components were determined at final harvest. Measurement
procedures are described by Bindraban et al. (1997).
In all experiments in cycle III, except the delayed N application treatment of
Exp. 5.1, five randomly selected spikes per plot were cut at the base seven days after
anthesis (A+7), dried for 48 hours at 73 °C and weighed. The dried spikes were
degrained with tweezers and grains dried for 24 hours before weighing. Non-grain spike
weight was derived from these data.
Phenological development was described on the basis of temperature and photoperiod,
while vernalization was not considered as it is of less importance in spring wheats.
Development is expressed in a dimensionless variable, i.e. development stage (DS)
having the value 0 at seedling emergence, 1 at anthesis and 2 at maturity. Its derivative,
development rate, is the inverse of the time, in days, required to complete one unit
development. Van Keulen and Seligman (1987) showed development rate to be linearly
related to temperature up to 30 °C, while it remains constant at higher temperatures
(Monteith, 1972). Angus et al. (1981) showed that the effect of photoperiod, effective
only during pre-anthesis, can be adequately described by an exponential equation. Rapid
71
Chapter 5
spike growth roughly starts at DS 0.7, while final anthesis coincides with DS 1.2 (Fig. 5.1). These development stages are used to delineate phase II. The calculation procedure of the phenological development is summarized below.
T<30°C T > 30 °C
0<DS<1 1<DS<2
where:
DRT
i
a
DRP
SO
SC
PD
DR
t
DS
DRT; = Ct; X T
DRTj = a, x 30
DRP, = l-e-sc><(PD-S0)
DRP 2=1
DRj = DRT; x DRPi
DS, = S DRj
Development rate at temperature T
Index for pre- or post- anthesis
Regression coefficients
Effect of photoperiod
Daylength at which development rate is zero
Photoperiod sensitivity parameter
Photoperiodic daylength
Development rate
days after emergence
Development stage
d-1
o C - l
h d-1
d
PTQ, biomass at anthesis, biomass accumulation during phase II, and non-grain spike weight one week after anthesis have all been correlated to KNO. Daily PTQ-values were calculated as described by Ortiz-Monasterio et al. (1994) and accumulated over phase II. In most experiments destructive biomass samples were taken shortly before and one week after anthesis. As growth rate during this period of three to four weeks can be assumed to be practically constant, linearly interpolated values were used to obtain biomass at anthesis. Bindraban et al. (1997) showed that crop growth under well irrigated conditions can essentially be quantified on the basis of LAI and leaf greenness readings. When only one destructive sampling was taken near anthesis, biomass at anthesis was estimated from observed biomass by correcting for the growth during the period from sampling till anthesis, derived from the algorithm described by Bindraban et al. (1997). The same algorithm was used to estimate biomass accumulation during phase II. As non-grain spike weight was determined in cycle III only, a dataset with biomass accumulation during phase II of cycle III only was separately analysed for a matching comparison.
72
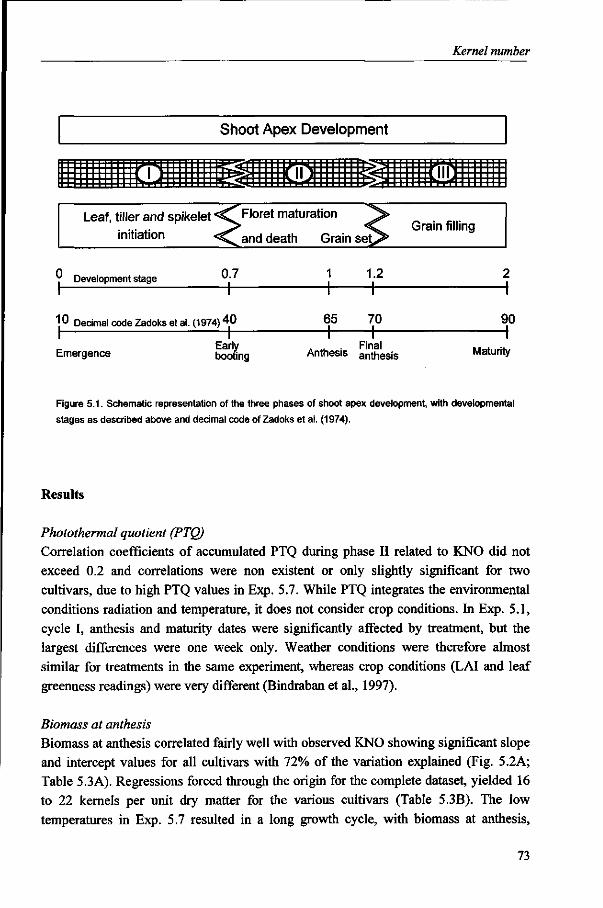
Kernel number
Shoot Apex Development
fmmm Leaf, tiller and spikelet «^Floret maturation
initiation < C and death Grain set Grain filling
Development stage 0.7
40
1 1.2 -h-70 +
1 90 1
Maturity
10 Decimal code Zadoks et al. (1974) 65
H-Emergence
Early booting
A u . • F i n a l
Anthesis anthesis
Figure 5.1. Schematic representation of the three phases of shoot apex development, with developmental
stages as described above and decimal code of Zadoks et al. (1974).
Results
Photothermal quotient (PTQ) Correlation coefficients of accumulated PTQ during phase II related to KNO did not exceed 0.2 and correlations were non existent or only slightly significant for two cultivars, due to high PTQ values in Exp. 5.7. While PTQ integrates the environmental conditions radiation and temperature, it does not consider crop conditions. In Exp. 5.1, cycle I, anthesis and maturity dates were significantly affected by treatment, but the largest differences were one week only. Weather conditions were therefore almost similar for treatments in the same experiment, whereas crop conditions (LAI and leaf greenness readings) were very different (Bindraban et al., 1997).
Biomass at anthesis Biomass at anthesis correlated fairly well with observed KNO showing significant slope and intercept values for all cultivars with 72% of the variation explained (Fig. 5.2A; Table 5.3A). Regressions forced through the origin for the complete dataset, yielded 16 to 22 kernels per unit dry matter for the various cultivars (Table 5.3B). The low temperatures in Exp. 5.7 resulted in a long growth cycle, with biomass at anthesis,
73

Chapter 5
A Siete Cerros r2 = 0.75 „ 0
o 30 o o
<D .Q
i 10 c c
Oasis r2= 0.60 * o
Bacanora « r2= 0.69A
0 500 1000 1500 2000 0 200 400 600 800 1000
Biomass at anthesis (g nrr2) Biomass accumulation phase II (g nrr2)
Figure 5.2. A: Biomass at anthesis as related to kernel number. B: Biomass accumulation during phase II as
related to kernel number. Exp. 5.1 (Q ; Exp. 5.2-Basal (A); Exp. 5.2-Delayed (A); Exp. 5.3(Q; Exp. 5.4 (O);
Exp. 5.5 (X); Exp. 5.6 (+); Exp. 5.7 (X)
74
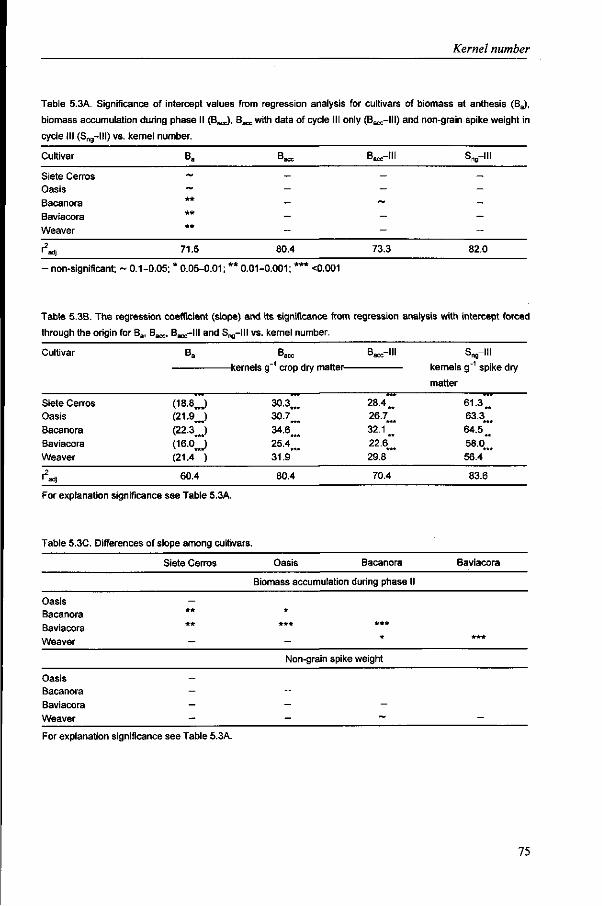
Kernel number
Table 5.3A. Significance of intercept values from regression analysis for cultivars of biomass at anthesis (Ba),
biomass accumulation during phase II (Bacc), B^ with data of cycle III only (Bacc-lll) and non-grain spike weight in
cycle III (Sn, ) vs. kernel number.
Cultivar Ba Bara,-ll
Siete Cerros Oasis Bacanora Baviacora
Weaver
r2. adj 71.5 80.4 73.3 82.0
• non-significant; ~ 0.1-0.05; 0.05-0.01; 0.01-0.001; <0.001
Table 5.3B. The regression coefficient (slope) and its significance from regression analysis with intercept forced
through the origin for Ba, BB I and S™—111 vs. kernel number.
Cultivar
-kernels g 1 crop dry matter-
Bacc-lll
28.4 „ 26.7
32.1
22.6
29.8
kernels
matter
s„g-m g~1 spike dry
61.3 63.3
64.5
58.0 56.4
Siete Cerros Oasis Bacanora
Baviacora
Weaver
(1 8-8 .J ( 2 1 . 9 J (22.3„_)
(21.4 )
30.3,, 30.7, 3 4 6 I 25A'i 31.9*
60.4 80.4 70.4 83.6
For explanation significance see Table 5.3A.
Table 5.3C. Differences of slope among cultivars.
Siete Cerros Oasis Bacanora Baviacora
Biomass accumulation during phase II
Oasis Bacanora Baviacora Weaver
Non-grain spike weight
Oasis Bacanora Baviacora Weaver
For explanation significance see Table 5.3A.
75
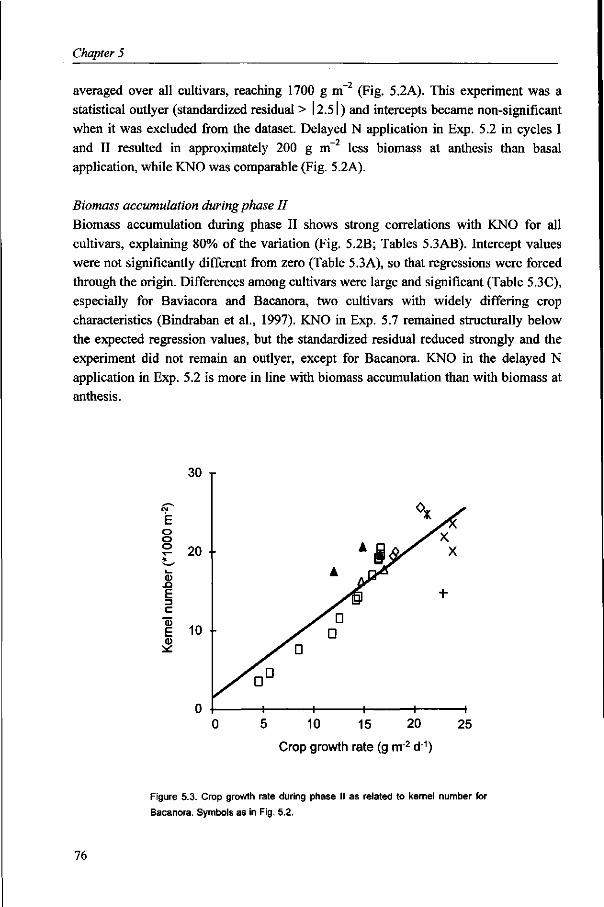
Chapter 5
averaged over all cultivars, reaching 1700 g m~ (Fig. 5.2A). This experiment was a statistical outlyer (standardized residual > 12.51 ) and intercepts became non-significant when it was excluded from the dataset. Delayed N application in Exp. 5.2 in cycles I and II resulted in approximately 200 g m~2 less biomass at anthesis than basal application, while KNO was comparable (Fig. 5.2A).
Biomass accumulation during phase II Biomass accumulation during phase II shows strong correlations with KNO for all cultivars, explaining 80% of the variation (Fig. 5.2B; Tables 5.3AB). Intercept values were not significantly different from zero (Table 5.3A), so that regressions were forced through the origin. Differences among cultivars were large and significant (Table 5.3C), especially for Baviacora and Bacanora, two cultivars with widely differing crop characteristics (Bindraban et al., 1997). KNO in Exp. 5.7 remained structurally below the expected regression values, but the standardized residual reduced strongly and the experiment did not remain an outlyer, except for Bacanora. KNO in the delayed N application in Exp. 5.2 is more in line with biomass accumulation than with biomass at anthesis.
30 T
o o o
0)
E 3 C
"03 c I
20 ••
10 -
5 10 15 20
Crop growth rate (g nr2 d_1)
25
Figure 5.3. Crop growth rate during phase II as related to kernel number for
Bacanora. Symbols as in Fig. 5.2.
76
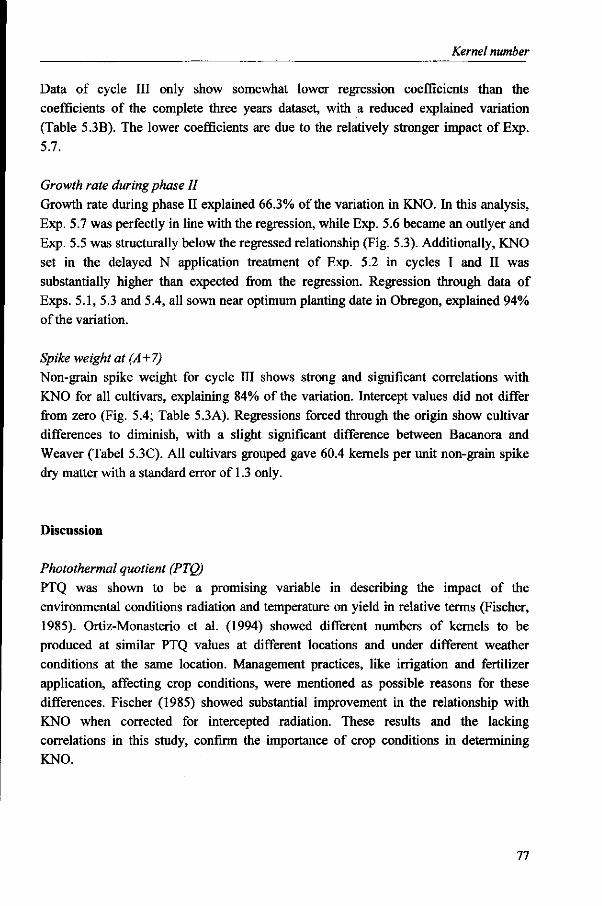
Kernel number
Data of cycle III only show somewhat lower regression coefficients than the
coefficients of the complete three years dataset, with a reduced explained variation
(Table 5.3B). The lower coefficients are due to the relatively stronger impact of Exp.
5.7.
Growth rate during phase II
Growth rate during phase II explained 66.3% of the variation in KNO. In this analysis,
Exp. 5.7 was perfectly in line with the regression, while Exp. 5.6 became an outlyer and
Exp. 5.5 was structurally below the regressed relationship (Fig. 5.3). Additionally, KNO
set in the delayed N application treatment of Exp. 5.2 in cycles I and II was
substantially higher than expected from the regression. Regression through data of
Exps. 5.1, 5.3 and 5.4, all sown near optimum planting date in Obregon, explained 94%
of the variation.
Spike weight at (A+7)
Non-grain spike weight for cycle III shows strong and significant correlations with
KNO for all cultivars, explaining 84% of the variation. Intercept values did not differ
from zero (Fig. 5.4; Table 5.3A). Regressions forced through the origin show cultivar
differences to diminish, with a slight significant difference between Bacanora and
Weaver (Tabel 5.3C). All cultivars grouped gave 60.4 kernels per unit non-grain spike
dry matter with a standard error of 1.3 only.
Discussion
Photothermal quotient (PTQ)
PTQ was shown to be a promising variable in describing the impact of the
environmental conditions radiation and temperature on yield in relative terms (Fischer,
1985). Ortiz-Monasterio et al. (1994) showed different numbers of kernels to be
produced at similar PTQ values at different locations and under different weather
conditions at the same location. Management practices, like irrigation and fertilizer
application, affecting crop conditions, were mentioned as possible reasons for these
differences. Fischer (1985) showed substantial improvement in the relationship with
KNO when corrected for intercepted radiation. These results and the lacking
correlations in this study, confirm the importance of crop conditions in determining
KNO.
77

Chapter 5
400 800 1200 0 250 500
Biomass accumulation phase II (g nr2) Non-grain spike weight at anthesis +7 (g nr2)
Figure 5.4. A. Biomass accumulation during phase II as related to kernel number for data of cycle III only. B. Non-
grain spike weight at anthesis + 7 as related to kernel number. Siete Cerros (X); Oasis (O); Bacanora (Q);
Baviacora (Q); Weaver (A). Exp. 5.7 distinguished by dark symbols.
Biomass at anthesis
Fischer (1983), Spiertz and Van Keulen (1980) and Stapper (1984) reported
approximately 20 kernels per unit crop dry matter, where their regressions passed
through the origin and significant differences occur among cultivars. Similar results
were found in our dataset, when excluding Exp. 5.7. The divergent behaviour of Exps.
5.7 and 5.2 are discussed in following sections.
Biomass accumulation during phase II
The stronger correlation of KNO with growth during phase II, compared to biomass at
anthesis, is in agreement with the general hypothesis that KNO is driven by availability
of carbohydrates during this phase. This is confirmed by the results of the delayed
nitrogen application in Exp. 5.2 in cycles I and II. While biomass at anthesis was lower
for delayed than for basal nitrogen application, growth during phase II and KNO were
similar in both treatements (Fig 5.2B). As anthesis dates for the two treatments were not
different, the environmental conditions were virtually similar, so that this result
underlines the importance of crop conditions during this phase. This effect was absent
78
Kernel number
_2
in cycle III, due to a small difference of approximately 50 g m only between the
treatments. The low KNO set per unit biomass accumulated during phase II in Exp. 5.7
suggests additional factors to be involved in KNO determination.
In Exp. 5.7, either the duration of phase II or the partitioning to the reproductive
organs could have caused the difference with the other experiments. The latter
possibility is discussed in subsequent sections. The duration of phase II averaged 45
days in Exp. 5.7 at Celaya and maximally 35 days at Obregon at optimum planting date.
Photoperiod during pre-anthesis hardly differed between the two locations, and the
lower temperature in Celaya caused the difference in growth duration. In their review
paper on development in wheat, Slafer and Rawson (1994) showed independent
development of different phenophases. It remains unclear, whether the difference of 10
days can be explained by such divergent response of the phases to temperature.
Growth rate during phase II
Crop growth rate during phase II is fairly well correlated with KNO, but with some
obvious deviations. Abbate et al. (1997) showed crop growth rate around anthesis to be
linearly related to KNO. Average temperature during phase II ranged from 15.5 to 17.6
°C in their dataset, while in ours it ranged from 14.3 to 21.5 °C, with Exps. 5.5 and 5.6
at the highest end, with 19.8 and 21.5 °C, respectively. As Exps. 5.5 and 5.6 fitted well
in the regression of biomass accumulation, but not in that of growth rate, the influence
of the duration of phase II becomes evident. High KNO in Exp. 5.2 was probably
associated, at least partly, with the prolonged duration of phase II, because of the
development of late tillers due to the delayed application of nitrogen (K.D. Sayre,
CIMMYT, unpubl. data).
Spike weight at (A + 7)
Strong significant regressions, with the intercept not different from zero, indicate non-
grain spike weight at (A+7) to be an important characteristic for determination of KNO.
Most remarkable are the data of Exp. 5.7, separately indicated in Fig. 5.4. While kernel
number per unit dry matter accumulation during phase II remained below average,
kernel number per unit spike dry matter was well in line with the regression. Spike dry
matter over biomass accumulation during phase II of approximately 0.4 in this
experiment and Exp. 5.6, was significantly lower than the 0.5 in Exps. 5.1 and 5.4. This
suggests that partitioning to the spike was reduced under the growth conditions of Exps.
5.6 and 5.7.
The constant number of kernels per unit spike dry matter over a wide range of
crop and environmental conditions, and cultivars, suggests this variable to be generally
applicable. The dataset is, however, too limited to allow firm conclusive statements.
Moreover, the largest datasets, i.e. those of Bacanora and Weaver did result in
79
Chapter 5
statistically different number of kernels per unit spike dry matter. Fischer and Stockman (1986) also observed little difference in this variable between tall and dwarf cultivars, but do refer to authors that had reported significant differences among cultivars.
An extensive summary by Abbate et al. (1997) shows a wide variation from 30 to more than 100 kernels per unit spike dry matter. Various reasons, such as sampling procedures, environmental conditions and field vs. pot experiments, were put forward to explain this wide variation. Often, spike weight at maturity is used, but that correlates poorly to non-grain spike weight a week after anthesis. Moreover, spike weight increases during the first week after anthesis, so that timing of sampling is important.
The promising possibility of a wide general applicability of this variable, merits further attention. Obviously, standardized procedures are needed to determine spike weight to reduce its apparent strong sensitivity.
Relevance of phases I and III for KNO, yield and crop growth period Biomass accumulation during phase I had hardly any impact on KNO. Low biomass accumulation during this phase in Exp. 5.2 did not depress KNO, while high biomass accumulation in Exp. 5.7 did not result in higher KNO. In both situations, KNO was more strongly correlated with biomass accumulation during phase II. Shading studies also indicate the relative insensitivity of yield formation to early growth and tillering (Fischer, 1975; Fischer and Aguilar, 1976). Grain filling during phase III under potential growth conditions was shown by Bindraban et al. (1997) not to be limited by the availability of carbohydrates. Fischer and Maurer (1976) and Fischer and Aguilar (1976) have postulated surplus photosynthetic capacity during grain filling, as increased KNO through cooling and C02 fertilization during phase II resulted in higher yields without noticeable effects of the treatments on post-anthesis crop conditions. Slafer et al. (1996), on the basis of the results of degraining treatments, reached similar conclusions. Stem reserves are important under lower yielding conditions, and especially under stress conditions during grain filling when they buffer low supply by leaves, but not under potential growth conditions (Bindraban et al., 1997). Shortening phase I will not notably reduce the pool of stem reserves, as the major part of storage occurs during phase II. Reduction in the length of the crop growth cycle can, therefore, best be achieved through shortening of phase I, without noticeable loss in KNO and yield, when full groundcover is assured at the initiation of phase II.
Factors determining KNO The results suggest that increasing yield through increased KNO is most likely achieved by greater emphasis on production and modified allocation of assimilates during phase II. Relevant measures to be taken depend, however, strongly on crop and environmental conditions. Crop growth rate during phase II explained 94% of the variation in KNO for
80
Kernel number
the experiments sown near the optimum planting date in Obregon. The duration of
phase II appears to be too short in the later plantings (Exps. 5.5 and 5.6), so that
extension of phase II might be a more appropriate measure under these warmer
conditions. Under the cooler conditions at Celaya (Exp. 5.7), increased partitioning
towards the spike appears most effective. These hypotheses illustrate the dependence on
crop and environmental conditions. Hence, kernel number can be described as:
KNO = Gn x Dn x ac x 60
where:
Gn Crop growth rate during phase II (g crop dm m~2 d-1)
Dn Duration of phase II (d)
a c (Cultivar specific) allocation coefficient to spike (g spike dm g"1 crop dm)
60 Kernel number per unit spike dry matter (number g~l spike dm)
Crop growth rate Higher daily growth rates for a crop with full ground cover
could be obtained through increased conversion efficiency of absorbed radiation (RUE).
In the early sixties, Loomis and Williams (1963) suggested that RUE could be almost
doubled, based on calculations of quantum yield. This option was suggested again more
than three decades later (Loomis and Amthor, 1996), however, without any tangible
evidence for its realization. Various authors have estimated the impact of increased leaf
nitrogen content or optimal distribution of leaf nitrogen over the canopy on crop growth
rate. While some suggested considerable possibilities for increases in crop growth rate
(e.g. Kropff et al., 1994a), others reported minor responses only (Bindraban, 1997),
partly due to differences in the assumed relations between leaf nitrogen and leaf
photosynthetic capacity (Bindraban, 1997). RUE over the entire growth period was not
different among the modern wheat cultivars used in this study (Bindraban et al., 1997)
and those of an historical set of wheat cultivars (Slafer et al., 1990). Green (1989)
reached similar conclusions for the entire growth period, but observed genetic
differences when considering pre- and post-anthesis periods separately. These genetic
differences during particular phases of crop development, and the lack of understanding
of the effects of leaf N on leaf photosynthetic characteristics (Bindraban, 1997) suggest
that RUE might possibly be improved during specific phases, such as phase II.
Duration Slafer et al. (1996) reason that increase in KNO could be achieved
through extension of phase II. Fischer and Stockman (1986) noted a tendency in dwarf
cultivars for an approximately two days longer floral initiation to anthesis interval.
Slafer et al. (1996) postulate that different phases can be independently manipulated in
length through photoperiod and temperature regimes. Moreover, wide variation in
duration of the different phases has been shown to exist among cultivars.
Chapter 5
Allocation Increased allocation of assimilates to spike growth might be the most
effective way of increasing KNO. Fischer and Stockman (1986) showed more kernels to
be set per unit dry matter at anthesis in dwarf than in tall cultivars. This phenomenon is
associated with increased partitioning of assimilates to spikes, as differences in KNO
per unit spike dry matter are small or absent. Allocation ratios derived by dividing spike
weight by biomass accumulation during phase II, show cultivar differences. The ratio of
0.54 for the cultivars Bacanora and Weaver is higher than the 0.41 for Baviacora and
Oasis, with Siete Cerros having an intermediate ratio of 0.48. Fischer and Stockman
(1986) argue the higher proportion of dry matter partitioned to the spike to be primarily
due to reduced competition from the growing stem, especially in the last two weeks
before anthesis. Alleviation of competition for assimilates from the stem to increase
KNO has been suggested by many authors. Moreover, Kropff et al. (1994a) assessed an
increase in yield of up to 10% in rice with lower positioning of the ear in the canopy as
it interferes less with radiation interception by leaves. Data of Van Ginkel et al. (1997),
of well-watered wheat lines and cultivars with large differences in peduncle extrusion,
indeed show a statistically significant increase in KNO with decreasing peduncle
extrusion.
Kernels per unit spike dry matter The consistent number of kernels per unit spike
dry matter over a wide range of cultivars, and crop and environmental conditions,
suggests the least scope for adjustment of this variable to increase KNO. Recently,
however, Abbate et al. (1997) found this variable to decline with increasing spike
weight. Abbate et al. (1995) suggest that it might be affected by the nitrogen content of
the spike, probably operating through the survival of differentiated flowers. As it
remains unclear why only a fraction of the potential number of florets develops into
grains, further research on this mechanism is needed.
Conclusions
KNO is strongest related to characteristics determined during phase II. The associations
suggest crop growth rate, duration of this phase and allocation of resources to the
reproductive spike to be most dominant. Shortening of phase I will practically not affect
KNO and yield, when full ground cover is reached at the initiation of phase II and is the
best means to shorten crop growth duration. Hence, further increase in yield through
increased KNO should be obtained through improvement in one or a combination of the
factors mentioned. Relevant measures strongly depend on crop growth and
environmental conditions. At optimum planting date in Obregon, crop growth rate
appears most limiting, while under delayed plantings, the strongly shortened duration of
82
Kernel number
phase II, due to high temperatures, appears limiting. Under cooler conditions at Celaya, allocation of resources to the spike might be limiting. These processes need further research, but they illustrate the importance of crop and environmental conditions.
83

Chapter 6
Kernel growth in wheat: carbohydrate availability,
competition among kernels and inherent growth potential3
Abstract
Kernel weight is a major yield component in wheat, and is considered to be fairly stable. However, substantial variation does exist, depending on the position of the kernel in the spike and on environmental conditions. Kernel weight is determined by the accumulation of carbohydrates, with temperature governing the various processes involved. Degraining treatments were done to identify factors and quantify processes that determine kernel growth. A distinction was made between (two) proximal kernels, positioned nearest to the rachis in the spikelet and (one to three) distal kernels, positioned further away. Responses to degraining were expressed relative to the weight of kernels in similar positions in control spikes. Four modern bread wheat cultivars were grown under optimum management conditions in the field in four different environments. Significant responses to degraining, averaged over all cultivars, ranged from 8 to 18% for proximal kernels and from 10 to 45% for distal kernels, depending on environment. Proximal kernels have priority access to carbohydrates over distal kernels. Even with abundant availability of carbohydrates, distal kernels fail to reach their intrinsic potential weight, while the limitation is stronger under limited carbohydrate supply. The differences in availability are probably due to differential transport systems. Priority access of proximal kernels indicates that their response to degraining was the result of increased availability of carbohydrates. Results of delayed degraining after anthesis suggest intrinsic growth potential or sink size of kernels to be affected through degraining during the cell division phase. The increase in sink capacity through increased kernel weight was assessed to exceed 1 Mg ha~ in all environments. It is reasoned that this increased capacity could be effectuated in increased yield through adaptation of the spike morphology.
"P.S. Bindraban, V. Premchand and R. Rabbinge, 1997. Kernel growth in wheat: carbohydrate availability, competition among kernels and inherent growth potential. Crop Science (submitted).

Chapter 6
Introduction
Grain yield in wheat (Triticum aestivum) can be expressed as the product of kernel weight and kernel number per unit area. Because of the strong association between kernel number per unit area and yield, with variation due to both agronomic (Fischer, 1993) and genetic (Austin et al., 1980) factors, much emphasis has been put on this component to further increase yield potential. Inferred from such strong associations, kernel weight is considered to be fairly stable. However, substantial variation in kernel weight does occur under varying environmental conditions (Bindraban et al., 1997) and large variation exists in the weight of individual kernels, associated with their position in the spike (Bremner and Rawson, 1978).
Much of the impact of environmental conditions can be related to the negative association of kernel weight with temperature (Ortiz Monasterio et al., 1994), but the causal relation underlying this association remains unclear. With increasing temperature, grain filling duration from anthesis to maturity (GFD10o) declines hyperbolically (Chowdhury and Wardlaw, 1978), while rate of grain growth during linear growth (GGR[) increases according to a Blackman response (Sofield et al., 1977). Kernel weight resulting from the interaction between these two factors would attain a maximum near 15 °C and decline steadily with increasing temperature. Chowdhury and Wardlaw (1978) indeed report such a pattern of kernel weight with temperature. However, as higher temperatures accelerate leaf senescence, limited carbohydrate availability could be an additional factor limiting kernel weight (Bindraban et al., 1997).
Variation in weight of kernels in different positions within the ear could result from differences in inherent growth potential of the kernels, determined by the number of cells per kernel (Brocklehurst, 1977). However, differential carbohydrate availability among kernels could affect kernel weight also (Bremner and Rawson, 1978).
Carbohydrate in the form of starch is the major component of kernels and its accumulation largely determines their final weight. While limited carbohydrate availability may limit kernel weight, it remains unclear why excess carbohydrate availability does not lead to higher kernel weights (Bindraban et al., 1997; Gallagher et al., 1975). Kernels can attain their maximum or potential weight after degraining treatments (Fischer and HilleRisLambers, 1978), but responses, as summarized by Slafer and Savin (1994), vary from slight reductions to significant increases up to 30%, effortlessly described to result from strong genotype by environment interaction.
While many processes have been identified that affect actual kernel weight, accumulation of carbohydrates eventually determines final weight, with temperature governing the various processes involved. The relations among these processes is vaguely understood. Improved quantitative understanding of kernel growth could reveal valuable options to increase kernel weight in relation to environmental conditions, in
86
Kernel growth
order to further increase wheat yield potential. The objective of this chapter is to
identify factors and quantify processes that determine growth of kernels in different
positions in the spike as affected by environmental conditions for wheat grown in the
field under optimum management conditions.
Materials and Methods
The results of an experiment with three different planting dates (Nov. 26 , Jan. 3rd and
Feb. 2nd) in the 1995/96 winter cycle at the CIMMYT experimental site in the Yaqui
Valley, Mexico, at the CIANO (Centra de Investigaciones Agricolas de Noroeste)
experimental station (40 meters above see level and 28°N and 109°W) and of an
experiment planted on Nov. 8th in the same cycle at the CIFA (Centro de
Investigaciones Forestales y Agropecuarias) experimental station (1700 meters above
sea level and 21°N and 101°W) near Celaya, Mexico, were used in the analyses. The
experiments are further considered as four Environments A, B, C and D for CIANO 1st,
2nd and 3rd planting and CIFA, respectively.
The soil at CIANO was a coarse sandy clay, mixed montmorillonitic, typic
Caliciorthid (pH 7.7), low in organic matter (<10 mg g"1) and with adequate K fertility.
At CIFA, the soil was a black vertisol with medium organic matter (<20 mg g_1). In all
experiments, 17.5 kg P ha'1 as triple super phosphate was broadcast as a basal dressing
before sowing and incorporated. At CIANO, the preceding leguminous cover crop,
Sesbania spp., was incorporated before planting, supplemented with chicken manure. At
CIFA, a fallow period preceded the wheat crop, and chicken manure was incorporated
before planting. Additionally, 150 and 75 kg N ha~ , as urea, was applied as basal
application and at booting, respectively. Frequent irrigation ensured adequate water
availability. Pests, diseases and weeds were controlled. Plants were supported by
horizontal nets to prevent lodging, except in the 3rd planting at CIANO.
Four modern, high-yielding, bread wheat cultivars, i.e. Oasis, Bacanora,
Baviacora and Weaver were grown (see Bindraban et al., 1997) in a complete block
design with three and four replications at CIANO and CIFA, respectively. The entries
were sown at 300 viable seeds m~2 in plots of eight rows, spaced at 20 cm, and 6 m
long. Radiation and temperature conditions for all environments are given in Table 6.1.
Leaf area index, leaf greenness, destructive biomass sampling during crop growth and
standard harvest data, were collected in all experiments to allow analysis of crop growth
and yield as described by Bindraban et al. (1997), to which reference is made for further
details.
87

Chapter 6
Table 6.1
' min
(°C)
' max
(°C)
Radiation
(MJ rrT2d~
Average monthly
Location
CIANO
CIFA
CIANO
CIFA
CIANO 1) CIFA
minimum and
Nov.
14.0
7.1
30.5
25.7
16.5a
18.3a
maximum
Dec.
8.6
4.7
26.0
23.2
14.7
16.1
temperatures and radiation at CIANO and CIFA.
Jan.
5.8
1.1
27.2
23.6
16.5
19.8
Feb.
10.3
3.1
28.3
25.3
18.6
21.0"
March
9.5
3.7
29.2
26.0
24.3
24.3
April
12.6
7.8
33.1
29.3
27.1
25.2
May
18.0
12.1
35.9
31.6
28.4a
25.9
aTwo weeks data only "Some days of estimated values from sunshine hour
Kernel growth for all cultivars in all environments was determined from randomly selected control spikes (C]), marked at anthesis, and sampled five times during grain filling. Two proximal kernels, positioned nearest to the rachis in the spikelets, and one to three apical kernels, positioned further away, were distinguished.
Responses of kernel weight to degraining at anthesis were determined through three treatments. In all treatments, degraining resulted in a reduction in grain number of approximately 80%. In Treatment a, entire spikelets were removed, except the four central ones. In Treatment b, eight central spikelets were left, and the apical kernels were removed with tweezers. In Treatment c, also eight spikelets were left but the ovules of the two proximal kernels were carefully removed using tweezers. Responses to delayed degraining were determined for Bacanora and Baviacora in Environments A, B and C through implementation of Treatments b and c at 9 to 12 and at 18 to 25 days after anthesis, depending on environment. Spikelets were carefully removed by cutting them with scissors, slightly away from the rachis, to prevent damage to this organ. Wounds dried within one to two days due to low relative humidity. Treated spikes were sampled at maturity with proximal and distal kernels distinguished in Treatment a, while Treatments b and c yielded proximal and distal kernels, respectively. Control spikes were randomly selected and marked at anthesis, and sampled at maturity. One set of control spikes was used to determine weight of kernels in similar positions to those in Treatment a and another set to those in Treatments b and c.
Additional spikes were degrained at anthesis to determine growth of kernels in Treatments b and c for Bacanora and Baviacora in Environments A, B and C. Treated spikes were sampled concurrently with control spikes C,, but no observations were taken on kernels in similar positions in these control spikes.
Kernel growth
At each sampling during grain filling and at maturity five spikes were cut at their base.
They were grouped per plot and dried in paper envelopes for 48 hours at 73 °C. Kernels
were removed with tweezers and counted, distinguishing proximal and distal kernels.
They were dried for another 24 hours and weighted with an analytical balance.
Sigmoidal regression analysis is applied to describe growth of kernels. Duration of
(GFD80) and growth rate (GGRg0) during the period when kernels increase from 10 to
90% of their final weight and the timing of 50% of their final weight are derived from
these sigmoidal regressions. Responses to degraining are expressed relative to the
weight of kernels in similar positions in control spikes. The four environments were
characterized by their average temperatures from anthesis to maturity (Table 6.2).
Separate statistical analyses for each environment indicated that the variation within
environments was similar for the four environments, excluding temperature effect. The
parameters were, therefore, analysed to test temperature effect as a split-plot, with
environment as major stratum along with blocking within this stratum combined to
obtain a higher residual degree of freedom. Cultivar and interaction effects were tested
against total residues. In figures, environmental means are given with their standard
error. Whenever missing, the standard errors were too small to be shown.
Results
Duration, timing and rate of growth of proximal and distal kernels
Grain filling duration increases linearly with decreasing temperature (Fig. 6.1). The
slope is however steeper for GFD)00 than for GFD80 for both proximal and distal
kernels. As a result, the initial and final stages of grain filling become progressively
longer with decreasing temperature. GFD80 is approximately three days longer for
proximal kernels than for distal kernels. Fifty percent of final kernel weight for all
kernels is reached at the same time, with the absolute difference of 0.8 d not being
significant.
Growth rates (GGR80) of kernels over the entire spike, averaged for all four
cultivars as given in Fig. 6.2 show higher values for proximal than for distal kernels,
except in Environment D. Growth rate of proximal kernels shows a Blackman response
with temperature, with a maximum rate of approximately 1.3 mg d~ approached at
temperatures exceeding approximately 20 °C. Growth rate of distal kernels increases
with temperature up to 22 °C reaching a maximum of approximately 1.2 mg d_1, but
declines at higher temperatures.
89
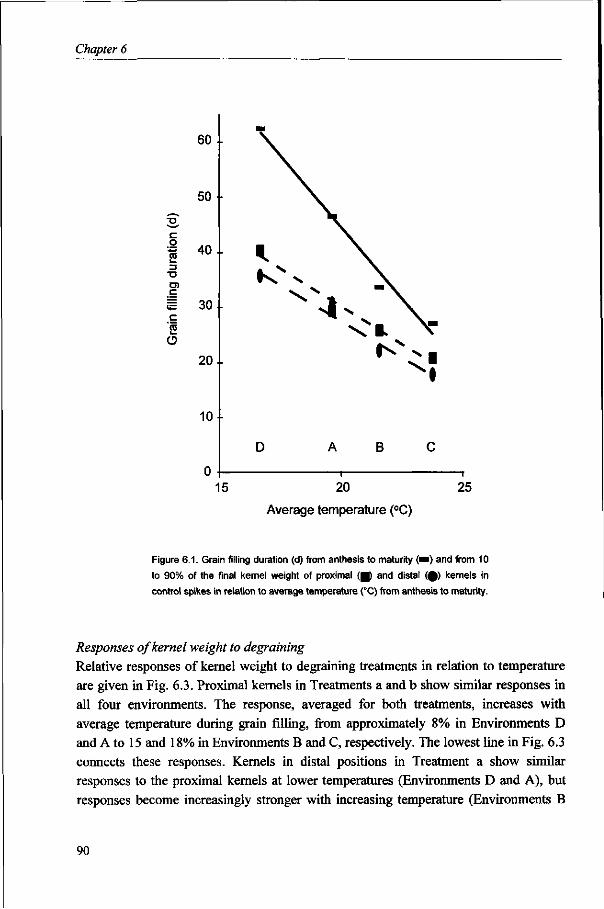
Chapter 6
60
50
I 40
Ç 'm 30 Ç k-
O 20
10
15 20
Average temperature (°C)
25
Figure 6.1. Grain filling duration (d) from anthesis to maturity 0") and from 10
to 90% of the final kernel weight of proximal ( | ) and distal (£) kernels in
control spikes in relation to average temperature (°C) from anthesis to maturity.
Responses of kernel weight to degraining Relative responses of kernel weight to degraining treatments in relation to temperature are given in Fig. 6.3. Proximal kernels in Treatments a and b show similar responses in all four environments. The response, averaged for both treatments, increases with average temperature during grain filling, from approximately 8% in Environments D and A to 15 and 18% in Environments B and C, respectively. The lowest line in Fig. 6.3 connects these responses. Kernels in distal positions in Treatment a show similar responses to the proximal kernels at lower temperatures (Environments D and A), but responses become increasingly stronger with increasing temperature (Environments B
90

Kernel growth
1.75
1.50
-o O) E. <D CO 1—
% o
1.25
eu c O)
1.00
0.75
D
15 20 Average temperature (°C)
25
Figure 6.2. Growth rate (mg d-1) of proximal (•) and distal (#) kernels in control
spikes averaged for all four cultivars over the entire, intact spike in relation to
average temperature (°C) from anthesis to maturity. The inset shows the same
relation for degrained spikes averaged for Bacanora and Baviacora for proximal
(•) and distal (Q) kernels.
and C). Responses of distal kernels in Treatment c exceed those of distal kernels in Treatment a over the entire temperature range, except under the highest temperature (Environment C) where they are similar. Hence, the response of distal kernels is much stronger in the absence of proximal kernels.
Growth rates were also obtained from degraining Treatments b and c for Bacanora and Baviacora in Environments A, B and C (Fig. 6.2, inset). These rates refer to kernels in central positions in the spike, averaged over these two cultivars only.
91
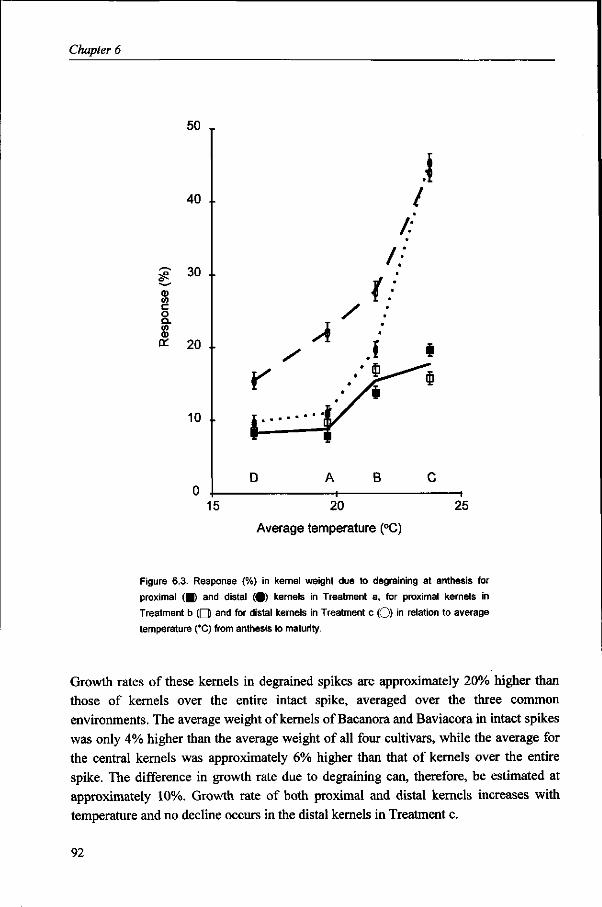
Chapter 6
CO c o Q. CO <D
en
50
40
30
20
10
r
D
/
À
*
A
è
1: f:
/ : m
A / 1 ^
B
i /
f:
i ""i
c 1
15 20
Average temperature (°C)
25
Figure 6.3. Response (%) in kernel weight due to degraining at anthesis for
proximal (•) and distal (0) kernels in Treatment a, for proximal kernels in
Treatment b O and for distal kernels in Treatment c (O) in relation to average
temperature (°C) from anthesis to maturity.
Growth rates of these kernels in degrained spikes are approximately 20% higher than
those of kernels over the entire intact spike, averaged over the three common
environments. The average weight of kernels of Bacanora and Baviacora in intact spikes
was only 4% higher than the average weight of all four cultivars, while the average for
the central kernels was approximately 6% higher than that of kernels over the entire
spike. The difference in growth rate due to degraining can, therefore, be estimated at
approximately 10%. Growth rate of both proximal and distal kernels increases with
temperature and no decline occurs in the distal kernels in Treatment c.
92
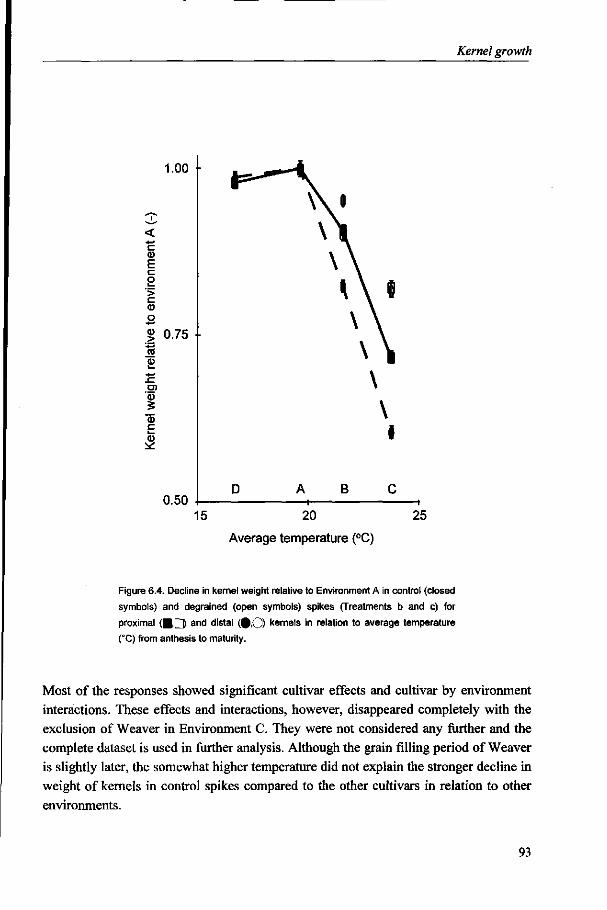
Kernel growth
1.00
c CD E c o u. '> C 0>
0) .> ra
O) '<D 3 <u c (1)
0.75
0.50 D
\
B
15 20
Average temperature (°C)
25
Figure 6.4. Decline in kernel weight relative to Environment A in control (closed
symbols) and degrained (open symbols) spikes (Treatments b and c) for
proximal ( H Q and distal (0,0) kernels in relation to average temperature
(°C) from anthesis to maturity.
Most of the responses showed significant cultivar effects and cultivar by environment
interactions. These effects and interactions, however, disappeared completely with the
exclusion of Weaver in Environment C. They were not considered any further and the
complete dataset is used in further analysis. Although the grain filling period of Weaver
is slightly later, the somewhat higher temperature did not explain the stronger decline in
weight of kernels in control spikes compared to the other cultivars in relation to other
environments.
93
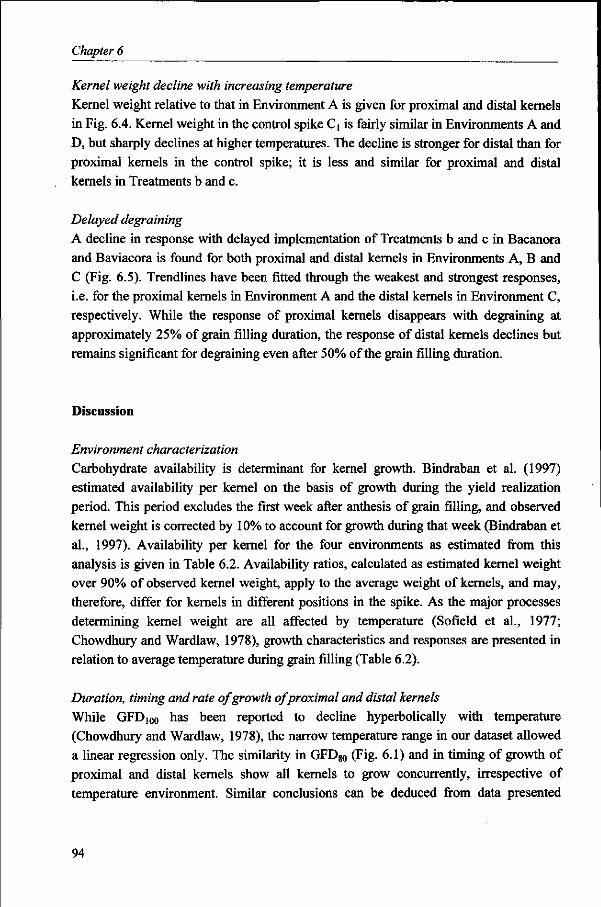
Chapter 6
Kernel weight decline with increasing temperature
Kernel weight relative to that in Environment A is given for proximal and distal kernels
in Fig. 6.4. Kernel weight in the control spike C] is fairly similar in Environments A and
D, but sharply declines at higher temperatures. The decline is stronger for distal than for
proximal kernels in the control spike; it is less and similar for proximal and distal
kernels in Treatments b and c.
Delayed degraining
A decline in response with delayed implementation of Treatments b and c in Bacanora
and Baviacora is found for both proximal and distal kernels in Environments A, B and
C (Fig. 6.5). Trendlines have been fitted through the weakest and strongest responses,
i.e. for the proximal kernels in Environment A and the distal kernels in Environment C,
respectively. While the response of proximal kernels disappears with degraining at
approximately 25% of grain filling duration, the response of distal kernels declines but
remains significant for degraining even after 50% of the grain filling duration.
Discussion
Environment characterization
Carbohydrate availability is determinant for kernel growth. Bindraban et al. (1997)
estimated availability per kernel on the basis of growth during the yield realization
period. This period excludes the first week after anthesis of grain filling, and observed
kernel weight is corrected by 10% to account for growth during that week (Bindraban et
al., 1997). Availability per kernel for the four environments as estimated from this
analysis is given in Table 6.2. Availability ratios, calculated as estimated kernel weight
over 90% of observed kernel weight, apply to the average weight of kernels, and may,
therefore, differ for kernels in different positions in the spike. As the major processes
determining kernel weight are all affected by temperature (Sofield et al., 1977;
Chowdhury and Wardlaw, 1978), growth characteristics and responses are presented in
relation to average temperature during grain filling (Table 6.2).
Duration, timing and rate of growth of proximal and distal kernels
While GFD,00 has been reported to decline hyperbolically with temperature
(Chowdhury and Wardlaw, 1978), the narrow temperature range in our dataset allowed
a linear regression only. The similarity in GFD80 (Fig. 6.1) and in timing of growth of
proximal and distal kernels show all kernels to grow concurrently, irrespective of
temperature environment. Similar conclusions can be deduced from data presented
94

Kernel growth
O 25 50 75
Relative time of degraining from anthesis to maturity (%)
Figure 6.5. Response (%) to delayed degraining for proximal (open symbols) and distal
(closed symbols) kernels in Environments A ( • , » . B (0>#) a n d c (A.A)- Timing of
degraining expressed as relative time during grain filling (%).
graphically by Sofield et al. (1977). The increasing difference between GFD80 and GFD10o with decreasing temperature is remarkable, where both the initial lag and the final ripening stage of the kernels become progressively longer from 5 to 14 days. Kernel growth rates calculated on the basis of GFD100 will, therefore, deviate from actual rates, due to an increasing fraction of grain filling duration being ineffective.
Growth rate of proximal kernels over the entire intact spike, shows a Blackman response to temperature. Sofield et al. (1977) report a similar response for kernels in central spikelets. Growth rate of distal kernels over the entire intact spike however, shows an optimum curve with temperature, suggesting an additional factor to be involved.
95

Chapter 6
Table 6.2. Estimated growth per kernel during the yield realization period (KWest), 90% of observed kernel weight
(90%KWobs), availability ratio (Ratio; see text), and average temperature during grain filling.
Environment
A
B
C
D
KW8S1
(mg)
37.1
26.0
20.7
43.2
90%KW o b s
(mg)
34.9
29.4
25.3
35.6
Ratio
(-) 1.06
0.88
0.82
1.21
Temperature
(°C)
19.8
21.6
23.8
16.9
Responses to degraining: general
Responses of kernel weight to the approximately 5-fold increase in carbohydrate
availability per kernel due to degraining cover a similar or even wider range (mainly at
the higher site) than given by Slafer and Savin (1994). The magnitude of the response
depends on environmental conditions and on the position of the kernel in the spikelet
(Fig. 6.2). Fischer and HilleRisLambers (1978) showed responses to increase with
increasing fraction kernel removal and to decrease with delayed implementation of the
treatment after anthesis (also Fig. 6.5). Hence, substantial variation in response may be
expected to result from differences in treatment. Slafer and Savin (1994), for instance,
report no response to 50% degraining (all spikelets removed along one side of the spike)
10 days after anthesis, while in this study responses of distal kernels in central spikelets
reached almost 50% with 80% degraining at anthesis.
Response and rate of grain filling in relation to position and temperature
Carbohydrate availability per kernel was increased to the same extent in all degraining
treatments. The discrepancy in response of distal kernels with (Treatment a) and without
(Treatment c) the presence of proximal kernels at lower temperatures (Environments D
and A), suggests competition among kernels in the spikelet for available carbohydrates.
The presence (Treatment a) or absence (Treatment b) of distal kernels however, appears
not to affect the growth of proximal kernels. Hence, distal kernels are limited in their
growth even with abundantly available carbohydrates in the presence of strongly
competing proximal kernels.
At higher temperatures (Environments B and C), an additional factor appears to
affect weight of kernels in distal positions under control conditions. As proximal kernels
are situated in more favourable positions, they are likely to suffer less from declining
supply in carbohydrates (Table 6.2) than distal kernels. Degraining under these higher
temperatures, does result in a stronger response of distal kernels (Treatment a) to
96
Kernel growth
increased availability of carbohydrates. Distal kernels in Treatment c show similar
stronger responses, presumably due to alleviated competition and source limitation.
Growth rate of both proximal and distal kernels increased by an estimated 10%
following degraining. Noticeable is the response of distal kernels that increases with
increasing temperature up to the highest temperature in degraining Treatment c (Fig.
6.2), through the combined effect of reduced competition and higher assimilate
availability.
Kernel weight, expressed relative to the weight of similar kernels in Environment
A, also reveals a stronger decline in distal than in proximal kernels, while the relative
decline is similar under degraining (Fig. 6.4). The decline in kernel weight with
temperature, determined according to the standard procedure of 1000 random kernels, is
the result of the combined effect of temperature on kernel growth rate and duration.
However, this effect does not explain the differential decline between proximal and
distal kernels. Reducing carbohydrate availability with increasing temperature due to
accelerated senescence of leaves intensifies kernel weight decline. The stronger decline
in kernel weight (Fig. 6.4) and rate of growth (Fig. 6.2) of distal compared to proximal
kernels is due to their weaker competitive power for limited carbohydrates, as no
differences are observed in decline between proximal and distal kernels in degraining
Treatments b and c, respectively. Sofield et al. (1977) and Rawson and Ruwali (1972)
found kernel weight and growth rate of distal kernels to decline much stronger with
declining illumination than kernels in proximal positions, in line with our results.
These results suggest strong competition among kernels for carbohydrates, with
priority access for proximal kernels. Distal kernels are limited in their growth, even
under abundant availability of carbohydrates and suffer strongest under limited source
availability. Hence, temperature affects kernel weight through its impact on both kernel
sink capacity (growth rate and duration) and carbohydrate availability.
Transport
Differential responses to degraining among kernels within a spikelet, as found in this
study, and among spikelets (central vs. top; see Bremner and Rawson, 1978; Radley and
Thorne, 1981), suggest differences in availability of carbohydrates. Proximal kernels are
supplied by principal vascular bundles from the rachilla, while distal kernels are
supplied by sub-vascular bundles, derived from the principal vascular bundles (Hanif
and Langer, 1972). The increased growth rate of distal kernels with removal of proximal
kernels, suggests the transport capacity in the rachilla per se not to be limiting.
Competition could, however, result from common transport bundles from the stem to
the rachilla, as each spikelet is supplied by one central vascular bundle (Whingwiri et
al., 1981). Zee and O'Brien (1971) observed vascular bundles to merge and form a
97
Chapter 6
plexus of vascular tissue at the nodes of the rachis from which new bundles arise, to
supply the spikelet and to continue to upper nodes. Such a common plexus of vascular
tissue could be the cause of competition among kernels. Under any condition, proximal
kernels would have priority access to carbohydrates, while distal kernels would
experience strong competition, especially under source-limited conditions.
It is important in this context, that the transport capacity from the stem to the
spike has been identified as a limiting factor under optimum growing conditions, where
large sink and source are guaranteed. Nâtrovâ and Nâtr (1993) in this respect, report the
number and size of vascular bundles, and especially the phloem cross-sectional area at 2
cm below the ear in the peduncle, to limit kernel weight per spike and consequently
wheat yield, under field conditions. Similar results were reported for oats {Avena sativa)
under controlled conditions (Housley and Peterson, 1982). No such association was
found in field situations, but it is unclear whether growth conditions were optimal
(Peterson et al., 1982).
Factors involved in the response to degraining
From the results presented, it cannot be concluded what causes the increase in weight of
proximal kernels following degraining, as their superior access to carbohydrates would
guarantee realization of their growth potential. An additional factor, next to
carbohydrate availability, might therefore be involved. The growth cycle of kernels can
roughly be distinguished in a cell division and a cell expansion phase. Cell division lasts
from anthesis till 2 to 3 weeks after anthesis, while expansion can start potentially
following cell formation (Brocklehurst, 1977; Nicolas et al., 1985; Natt and Höfrier,
1987). Strong correlations between cell number and final kernel weight for kernels in
different positions within the spike suggest cell weight to be fairly stable (Singh and
Jenner, 1982; Nicolas et al., 1985). The latter did show variation in cell weight due to
differences in number of starch granules, but only under severe drought stress.
Degraining within 2 to 3 weeks after anthesis could, therefore, affect cell division,
influencing the intrinsic growth potential or sink size of kernels. Despite abundant
carbohydrate availability after this period, e.g. due to degraining, kernel weight is not
likely to increase because of the stable cell weight, unless cell weight in the intact spike
was lower due to limited carbohydrate availability (Natt and Höfher, 1987).
Results of delayed degraining (Fig. 6.5) support this hypothesis. No response in
weight of proximal kernels was found to delayed degraining, despite the 5-fold increase
in carbohydrate availability and sufficient time left for kernels to grow. Distal kernels
maintain a positive response even at extreme delay of the treatment under the warmer
conditions of Environments B and C. These results suggest that increased kernel weight
in response to degraining within 2 to 3 weeks after anthesis may result from increased
intrinsic growth potential of kernels, subsequently well-supplied with carbohydrates. As
98
Kernel growth
proximal kernels have priority access to carbohydrates, increased kernel weight due to
degraining must result from increased kernel sink size. Distal kernels utilize increased
available carbohydrates, even if kernel sink size has been determined already.
Summarizing, it can be argued that the responses of proximal kernels in Fig. 6.3
represent primarily the impact of increase in intrinsic growth potential or kernel sink
size, while all stronger responses result from both increased kernel sink size and
increased availability of carbohydrates.
Responses to degraining within 2 to 3 weeks from anthesis have been argued to result
from modified supply of carbohydrates (Brocklehurst, 1977; Fischer and
HilleRisLambers, 1978). Although carbohydrate is available in excess in the wheat
plant during the first weeks after anthesis, when it accumulates as stem reserve (Kiniry,
1993), Fischer and HilleRisLambers (1978) argue that sensitivity to carbohydrate
supply may be well above these levels. Singh and Jenner (1982) however, have shown
the rate of cell division not to be related to concentration of sucrose, other soluble
sugars or amino acids in the developing kernel, so that cell division is likely to be
controlled by other factors.
Herzog (1982) showed the effects of degraining and early cytokinin application on
growth rate and cell number of grains to be similar, suggesting a similar physiological
basis. Degraining could, therefore, modify hormone availability in favour of the
remaining kernels to enhance cell division, resulting in higher intrinsic growth potential.
Morris et al., (1993) showed endosperm cell division in wheat, rice and maize to require
high cytokinin levels. Fischer and HilleRisLambers (1978) argue operation of
hormones, independent of carbohydrate availability to be inappropriate in annual plants,
as carbohydrates not finally incorporated into the seed, would be lost forever. However,
evolutionary survival strategies, to develop at least some kernels completely, may
overrule the strategy of maximum carbohydrate use. Support for this argument can be
derived from Fig. 6.4, where the decline in weight in distal kernels is stronger than in
proximal kernels with declining carbohydrate availability.
Consequences for breeding
Yield increase under optimum management and favourable environmental conditions
can be achieved through increased sink capacity (Bindraban et al., 1997). Strong
correlations between the number of kernels per unit area and yield suggest this yield
component to be most promising and it, therefore, receives much attention. However,
substantial responses of kernel weight to degraining imply feasible options to increase
sink capacity through increased kernel weight, in particular of distal kernels.
99
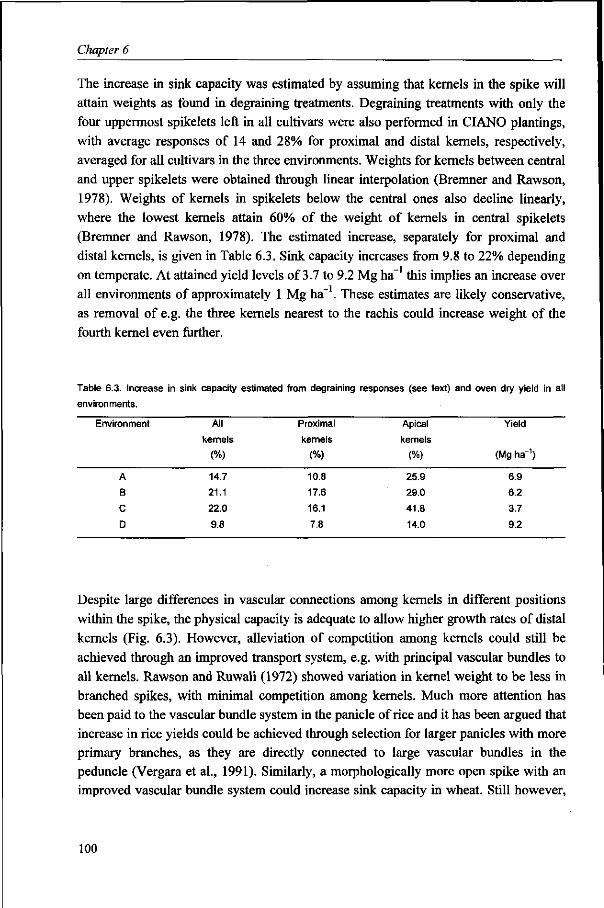
Chapter 6
The increase in sink capacity was estimated by assuming that kernels in the spike will attain weights as found in degraining treatments. Degraining treatments with only the four uppermost spikelets left in all cultivars were also performed in CIANO plantings, with average responses of 14 and 28% for proximal and distal kernels, respectively, averaged for all cultivars in the three environments. Weights for kernels between central and upper spikelets were obtained through linear interpolation (Bremner and Rawson, 1978). Weights of kernels in spikelets below the central ones also decline linearly, where the lowest kernels attain 60% of the weight of kernels in central spikelets (Bremner and Rawson, 1978). The estimated increase, separately for proximal and distal kernels, is given in Table 6.3. Sink capacity increases from 9.8 to 22% depending on temperate. At attained yield levels of 3.7 to 9.2 Mg ha" this implies an increase over all environments of approximately 1 Mg ha~ . These estimates are likely conservative, as removal of e.g. the three kernels nearest to the rachis could increase weight of the fourth kernel even further.
Table 6.3. Increase in sink capacity estimated from degraining responses (see text) and oven dry yield in all
environments.
Environment
A
B
C
D
All
kernels
(%)
14.7
21.1
22.0
9.8
Proximal
kernels
(%)
10.8
17.6
16.1
7.8
Apical
kernels
(%)
25.9
29.0
41.8
14.0
Yield
(Mg ha"1)
6.9
6.2
3.7
9.2
Despite large differences in vascular connections among kernels in different positions within the spike, the physical capacity is adequate to allow higher growth rates of distal kernels (Fig. 6.3). However, alleviation of competition among kernels could still be achieved through an improved transport system, e.g. with principal vascular bundles to all kernels. Rawson and Ruwali (1972) showed variation in kernel weight to be less in branched spikes, with minimal competition among kernels. Much more attention has been paid to the vascular bundle system in the panicle of rice and it has been argued that increase in rice yields could be achieved through selection for larger panicles with more primary branches, as they are directly connected to large vascular bundles in the peduncle (Vergara et al., 1991). Similarly, a morphologically more open spike with an improved vascular bundle system could increase sink capacity in wheat. Still however,
100
Kernel growth
further research is needed to increase our understanding of the vascular transport system and on the processes that determine intrinsic growth potential or sink size of kernels.
101
Chapter 7
General discussion: Identification of traits
to further increase wheat yield potential
Increasing wheat production
World food production in the coming four decades will have to at least triple to meet
future demand (WRR, 1995) and world wheat production has to increase at an annual
rate of 3% (CIMMYT, 1995). Various ways in which this could be realized are briefly
described as a background for the relevance of the research described in this thesis. One
way to contribute to solution of this problem is rapid improvement of yield potential of
wheat cultivars. Approaches to apply physiological knowledge to support breeding
programs are discussed with their specific possibilities and limitations. Results of the
research described in the preceding chapters are discussed followed by a final
recommendation to increase wheat yield potential.
Agricultural production area
Total suitable land for agricultural production exceeds current cultivated area (WRR,
1995), but expansion of the agricultural area is not desirable, as it would imply
reclamation of natural lands and further expansion into fragile marginal lands (IFPRI,
1994). It has been assessed that 40% of current agricultural land is productive to highly
productive, while the rest is marginal with low productivity and high erosion sensitivity
(Alexandratos, 1995). Moreover, irrigation-induced salinity problems due to poor
irrigation management and erosion lead to rapid deterioration of agricultural land
(Umali, 1993). However, reclamation of natural lands is often the only option for
survival for poor farmers or even poor countries (Spears, 1993; Tewari, 1994). It is
possible to cultivate currently unsuitable land, like acid and saline soils, with careful
management (Toledo et al., 1991) and adapted cultivars (Pandey et al., 1995). While
expansion of the agricultural area may still be possible, the largest portion of the
required increase in world food production will have to be realized through increased
yield per unit area. Yield increase of wheat in the past decades has resulted from both
103
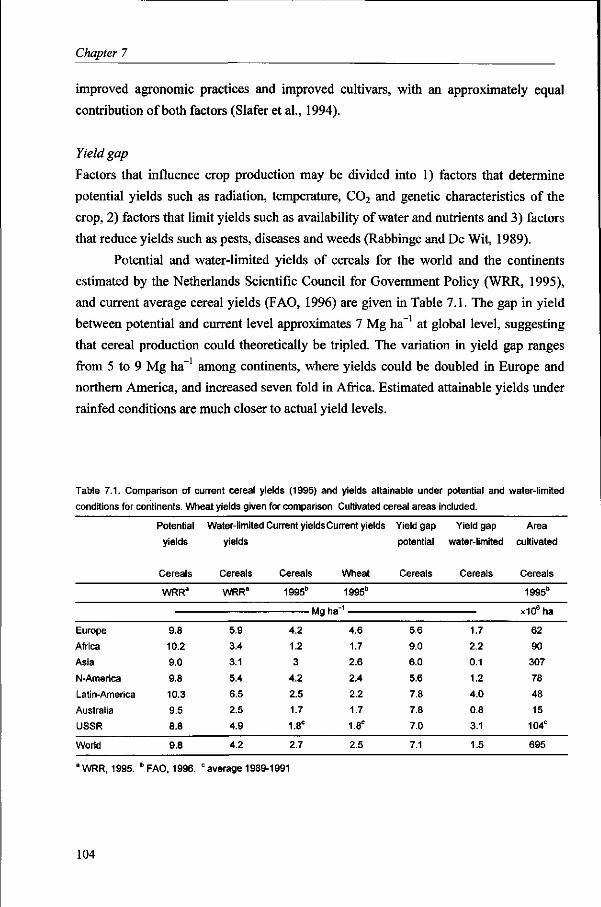
Chapter 7
improved agronomic practices and improved cultivars, with an approximately equal
contribution of both factors (Slafer et al., 1994).
Yield gap
Factors that influence crop production may be divided into 1) factors that determine
potential yields such as radiation, temperature, C02 and genetic characteristics of the
crop, 2) factors that limit yields such as availability of water and nutrients and 3) factors
that reduce yields such as pests, diseases and weeds (Rabbinge and De Wit, 1989).
Potential and water-limited yields of cereals for the world and the continents
estimated by the Netherlands Scientific Council for Government Policy (WRR, 1995),
and current average cereal yields (FAO, 1996) are given in Table 7.1. The gap in yield
between potential and current level approximates 7 Mg ha-1 at global level, suggesting
that cereal production could theoretically be tripled. The variation in yield gap ranges
from 5 to 9 Mg ha" among continents, where yields could be doubled in Europe and
northern America, and increased seven fold in Africa. Estimated attainable yields under
rainfed conditions are much closer to actual yield levels.
Table 7.1. Comparison of current cereal yields (1995) and yields attainable under potential and water-limited
conditions for continents. Wheat yields given for comparison. Cultivated cereal areas included.
Potential Water-limited Current yields Current yields Yield gap Yield gap Area
yields yields potential water-limited cultivated
Cereals Cereals Cereals Wheat Cereals Cereals Cereals
Europe
Africa
Asia
N-America
Latin-America
Australia
USSR
World
WRRa
9.8
10.2
9.0
9.8
10.3
9.5
8.8
9.8
WRRa
5.9
3.4
3.1
5.4
6.5
2.5
4.9
4.2
1995"
4.2
1.2
3
4.2
2.5
1.7
1.8°
2.7
1995"
1
4.6
1.7
2.6
2.4
2.2
1.7
1.8C
2.5
5.6
9.0
6.0
5.6
7.8
7.8
7.0
7.1
1.7
2.2
0.1
1.2
4.0
0.8
3.1
1.5
1995b
x106ha
62
90
307
78
48
15
104°
695
'WRR, 1995. DFAO, 1996. caverage 1989-1991
104

General discussion
At a smaller geographical scale, wheat yields under potential and water-limited
conditions were assessed by WRR (1992) for the twelve member states of the EC
(Table 7.2). The gap between current yield levels and wheat yield potential, varies over
the countries from 1 to 6 Mg ha"1 , while for water-limited yields, it subsides
completely for some countries and decreases to 2 Mg ha~ for the EC as a whole.
Aggarwal and Kalra (1994) assessed wheat yield potential for the Indian sub-continent
to range from 4 to 8 Mg ha-1, and the yield gap from 2 to 5 Mg ha~'. Smallest gaps
between potential and actual yield are found for irrigated regions (Bhalla et al., 1990).
A major proportion of the yield gap can be ascribed to the production factor
water. Based on water availability from major rivers in the world, it was assessed that
the irrigated area could be increased ten-fold (WRR, 1995; Penning de Vries et al.,
1996). Local scarcity, high costs involved in developing irrigation schemes and required
proper management hamper rapid expansion of the area under irrigation.
Table 7.2. Comparison of current wheat yields (1995) and yields attainable under potential and water-limited
conditions for the countries of the European Community (EC). Cereal yields given for comparison. Cultivated
wheat area included.
Potential Water-limited Current yields Current yields Yield gap Yield gap Area
yields yields potential water-limited cultivated
Wheat Wheat Cereals Wheat Wheat Wheat Wheat
Germany
France
Italy
Netherlands
Belgium
UK
Ireland
Denmark
Greece
Spain (1993)
Portugal
EC
WRRa
9.5
10.3
9.2
9.6
9.6
10.6
11.0
9.6
7.8
10.1
10.6
9.9
WRRa
8.4
8.4
7.2
8.1
8.2
8.8
9.8
6.8
6.2
4.4
5.5
7.2
1995b
6.1
6.5
4.7
8.1
6.7
7.0
6.7
6.1
3.7
1.7
1.9
5.0
1995"
6.9
6.5
3.2
8.8
7.0
7.7
8.3
7.1
2.4
2.4
3.6
5.5
2.6
3.8
6.0
0.8
2.6
2.9
2.7
2.5
5.4
7.7
7.0
4.5
1.5
1.9
4.0
-0.7
1.3
1.1
1.6
-0.4
3.8
1.9
1.9
1.8
1995b
x106ha
6.9
4.7
2.5
0.1
0.2
1.9
0.1
0.6
0.8
2.1
0.3
15.6
'WRR, 1992. " FAO, 1996.
105
Chapter 7
Over forty percent of the wheat in developing nations is produced in ME1 regions
(Rajaram, 1995). These regions in the (sub-)tropics are characterized as high yielding
environments with rapidly increasing yields, approaching attainable yield under high
external input management conditions, including irrigation. The difference in yield
between experimental and farmer fields is assessed at 2 Mg ha-1 (Aggarwal and Kalra,
1994; Sayre, 1996).
Yield increase in ME1 in the past decades has resulted from improved cultivars
and improved management practices, including increased application of agro-chemicals.
Due to insufficient knowledge, leading to sub-optimal management, utilization
efficiencies, in particular of nitrogen fertilizers, have generally declined (Ortiz-
Monasterio, 1996. CIMMYT, pers. comm.; Bhalla et al., 1990). Improved management
practices, like optimal planting date and optimal timing of nutrient and water
application, integrated pest management, appropriate crop rotations, etc., are feasible
(Aggarwal and Kalra, 1994; Sayre, 1996; Ten Berge et al., 1997). Due to the synergistic
interactions between production factors, such improved practices will result in declining
environmental load per unit product (Rabbinge, 1986; Wolf, 1986; De Wit, 1992; Van
Ittersum and Rabbinge, 1997). The utilization of N fertilizer for instance increases with
additional water or potassium (Van Keulen, 1986). De Ridder and Van Keulen (1990)
showed similar additive effects of application of straw and N fertilizer, due to
alleviation of other limitations. While further improvement of agronomic practices may
result in only marginal increases in actual wheat yields in ME1, this fine-tuning will
have a major impact on reducing environmental load.
Cultivar improvement
Yields approaching potential levels can be increased by improving the genetic yield
potential, as the environmental factors radiation, temperature and C02 are least
controllable. The greenhouse effect is assessed to have a favourable impact on global
food production, but expected regional changes in yield vary strongly, from substantial
increase to severe reductions (Rabbinge et al., 1993; Goudriaan and Zadoks, 1995; Wolf
and Van Diepen, 1995). This effect is not a reliable option in increasing food production
and security. Because of the small yield gap in ME1 regions, the contribution of genetic
yield potential to yield increase is expected to grow in the future. While breeders have
been successful in increasing the genetic yield potential in the past through intensive
selection of best genetic combinations, on an empirical basis, further increase has
become increasingly difficult and progress has declined in the last decade (CIMMYT,
106

General discussion
1995). This declining progress will have to be reversed and genetic improvement will
have to be realized even faster than in the past to meet future demand for wheat. This
necessitates a thorough understanding of morpho-physiological factors that determine
grain yield.
The role of physiology in breeding
In improving genotypes, plant breeders have aimed at obtaining plants with specific
characteristics, based on their perception of the impact of these characteristics on crop
performance. Almost all of the breeders time is spent, about equally, in the planning and
evaluation phases (Hunt, 1991). Designing desired genotypes in the planning phase
involves consideration of functional requirements (e.g. phenology, grain weight, kernel
number, yield, quality, lodging and disease resistance). In the evaluation phase, criteria
for selection need to be well identified to attain high selection efficiency. There is
general agreement among plant breeders and physiologists that physiological
knowledge can be applied to improve breeding efficiency. The contribution so far, has
been small to moderate, but both parties agree that it could be potentially larger in the
future (Jackson et al., 1996). Physiological knowledge can contribute to breeding
programs through identification of effective selection environments, and of desired
traits for introgression programs and indirect selection (Jackson et al., 1996). An
'empirical' and an 'ideotype' approach are distinguished to identify traits that may be
useful for obtaining genetic improvements. More recently, systems approaches, mainly
in the form of crop growth simulation models, have been used for the design of
genotypes (e.g. Dingkuhn et al., 1991; Kropff et al., 1994a; Habekotté, 1996).
Empirical approach
The empirical approach evaluates a set of genotypes for desired performance by
measurement of putatively useful traits in those genotypes. This approach is frequently
applied, and some examples are discussed.
Photosynthesis is a quantitative trait, but relatively few genes are involved and
heritability is assessed to be high (Rasmussen, 1984). Still, improvement of
photosynthesis is limited (Rasmussen, 1984; Evans, 1990). Photosynthesis
measurements on single leaves are not indicative for the entire crop throughout the
cycle and multiple measurements of canopy photosynthesis are impracticable in routine
107

Chapter 7
breeding. Rees et al. (1993) did report a positive relation between leaf photosynthesis
and yield, but it depended strongly on the timing of the measurement. Moreover, it
remains unclear whether that relation is causal, as no relation was found with growth
rate. Only rarely positive correlations between photosynthesis and yield potential have
been found, while selection for high photosynthesis has resulted in decreased yield in
various crops (Evans, 1990). These counter-intuitive effects of photosynthesis on yield
may stem from trade-off effects with other traits. Photosynthesis, for instance, is
negatively correlated to leaf size (Evans and Dunstone, 1970; Rees et al., 1993), which
could alter the radiation regime in the canopy and ultimately canopy photosynthesis.
Also, the positive relation of photosynthesis with respiration is likely to affect growth.
Balota et al. (1993) and Reynolds et al. (1994) reported strong correlations
between canopy temperature depression and yield, and argue that this trait could be
used as a selection criterion, as the measurements are rapid and robust. The relationship
is, however, not always found, as it depends on proper timing, and varies with
environmental conditions. The causality of the relationship is unclear, the trait is
associated with many other traits (Rees et al., 1993), and its quantitative impact on yield
is unknown.
This type of problems are common for various traits tested for selection purposes
or the measurement procedure may be too time- or resource consuming for routine
applications at this point in time.
Ideotype approach
In the 1960s, Donald (1968) argued that insufficient attention had been paid to the
processes governing growth and yield, and suggested a breeding approach based much
more explicitly on the design of plants or ideotypes for target environments, using
known principles of physiology and agronomy. He designed an ideotype for a small
grain cereal for favourable environments, with primarily morphological features, based
largely on considerations of individual traits studied in isolation from each other. These
suggestions resulted in considerable debate, but the approach was adopted by only a few
programs in the world because of a number of serious constraints (Hunt, 1991).
Rasmussen (1987) suggested improvements to this approach, considering correlations
between traits causing morpho-symmetry. It may, for example, be impossible to obtain
a large spike on a plant with small leaves, as proposed by Donald (1968). Based on his
knowledge, Rasmussen (1987) proposed an ideotype for barley for the Midwest United
States with desired changes in culm, leaf and head characteristics, related to currently
108

General discussion
existing genotypes. Preliminary results indicated that some characteristics afford little
opportunities for obtaining gains, while others show more promise (Rasmussen, 1991).
Systems approach
Systems approaches, and in particular mechanistic crop growth simulation models,
inherit strong capacities to integrate morpho-physiological traits and processes. Models
can be used to examine the quantitative impact of these traits and processes on crop
growth and yield in relation to environmental conditions. Crop growth and yield are
affected by numerous biotic and abiotic factors. However, the impact of many of these
factors and their interactions on growth and yield may hardly be important in
quantitative terms. The number of processes considered in an analysis depends on the
complexity of the system, but more importantly on the objective of the study. The
reliability of conclusions drawn from simulation models heavily relies on the validity of
the description of underlying processes.
Aggarwal et al. (1997) applied a systems approach in a quantitative population
genetic study, using the Monte Carlo technique, to assess the impact of modified traits
or sets of traits on yield. They used a model that was initially developed for the general
purpose of evaluating environmental conditions, like growing season, location and
climate (Kropff et al., 1994c). It was modified to include uptake and redistribution of N
within the plant. The random selection of parameters does not reflect genetic linkages
and pleiotropic effects (Rasmussen, 1987), as was recognized by the authors.
Accounting for such linkages during the process of parameter generation could improve
the analysis considerably. The analysis revealed that increasing sink capacity alone
would not lead to a yield increase as a simultaneous increase in the source is required. A
similar conclusion was drawn by Habekotté for oilseed rape (1996). However, better
utilization of abundantly available stem reserves, reduced negative feedback on
photosynthesis and reduced wasteful respiration could increase source availability with
increased demand for carbohydrates by the larger sink. Incorporation of such feedback
mechanisms and processes in the model would strongly improve the analysis.
Interestingly, their analysis revealed that selection for yield potential should be
performed under high (N) management conditions, as many lines with potentials higher
than the standard variety would be eliminated under current low N management
conditions. For maize, Banziger et al. (1997) did show positive genetic correlations
between grain yield under low (0 kg ha-1) and high (200 kg ha-1) N, but showed that
selection efficiency will increase in a low N selection environment when targeted N
109
Chapter 7
production environments have yields less than about 60% of those under high N. The
analysis of Aggarwal et al. (1997) indicates that selection efficiency for yield potential
will be highest under high N management, which is in line with results of Banziger et
al. (1997).
Attempts of plant breeders to increase the genetic potential of a crop is severely
hampered by the interactions of traits with strongly varying environmental conditions.
Rapid developments in molecular marker techniques open up opportunities to improve
selection efficiency, as that allows precise location of important quantitative trait loci
(QTL) (Kearsey and Poonsi, 1996). However, the marker aided selection technique has
not been proven to be very successful, partly due to QTL-environment interactions
(Tinker et al., 1996). The impact of environmental conditions should be minimized to
enable identification of true genetic traits. Eco-physiological crop models separate the
different processes that determine yield ability and explicitly account for environmental
effects on these processes. Currently, genetic parameters are determined with simulation
models for characteristics such as relative growth rate of leaves, rate of development
and partitioning of carbohydrates to the various plant organs. It is expected that the
QTLs, identified based on these genetic parameters, will be environment independent.
Therefore, the model-based systems approach can reduce difficulties encountered in
marker aided selection techniques. (X. Yin, 1997. Wageningen Agricultural University,
Dept. of Plant Breeding and Dept. of Theoretical Production Ecology, pers. comm.).
Future perspectives
Plant breeders have been successful in the past through selection of parents and
progenies mainly on visual characteristics. In general this was based on their intuition
and experience, and to some extent on mechanistic knowledge of the contribution of
traits to the desired performance. There are limits, however, to our grasp of a complex
and dynamic system, and assistance from various disciplines to improve or even sustain
breeding efficiency is needed.
Many suggestions of promising morpho-physiological traits have been made to
breeders, but their application in breeding programs has been minimal (Jackson et al.,
1996). In all the approaches described above, the suggestions are generally based on
limited numbers of genotypes, so that available genetic variation in the trait may be too
limited (Jackson et al., 1996). Quantitative impact assessments of adaptations of such
traits on desired performance are essential to consider the relative importance of the
trait, but have often lacked in the past (Loomis et al., 1979). Additionally, evaluation of
110
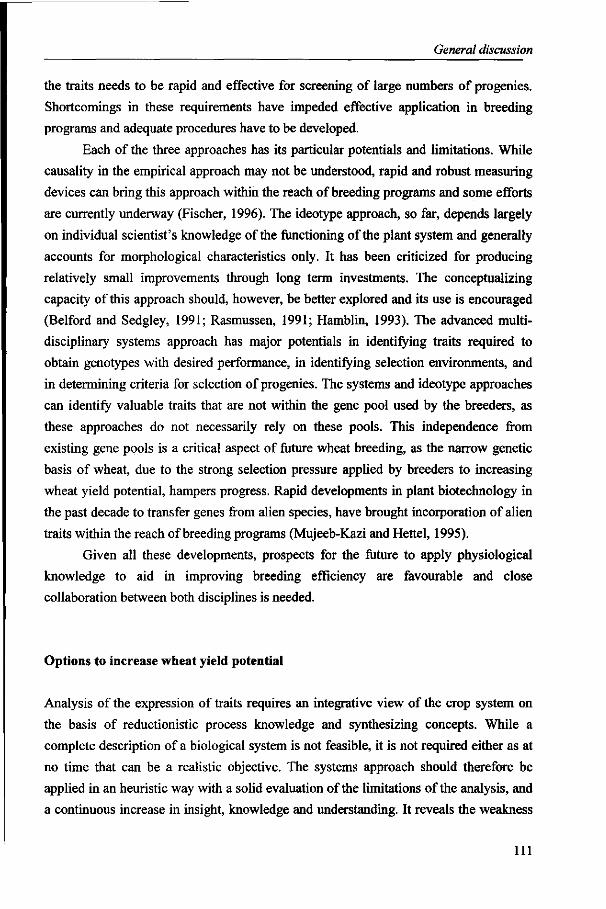
General discussion
the traits needs to be rapid and effective for screening of large numbers of progenies.
Shortcomings in these requirements have impeded effective application in breeding
programs and adequate procedures have to be developed.
Each of the three approaches has its particular potentials and limitations. While
causality in the empirical approach may not be understood, rapid and robust measuring
devices can bring this approach within the reach of breeding programs and some efforts
are currently underway (Fischer, 1996). The ideotype approach, so far, depends largely
on individual scientist's knowledge of the functioning of the plant system and generally
accounts for morphological characteristics only. It has been criticized for producing
relatively small improvements through long term investments. The conceptualizing
capacity of this approach should, however, be better explored and its use is encouraged
(Belford and Sedgley, 1991; Rasmussen, 1991; Hamblin, 1993). The advanced multi-
disciplinary systems approach has major potentials in identifying traits required to
obtain genotypes with desired performance, in identifying selection environments, and
in determining criteria for selection of progenies. The systems and ideotype approaches
can identify valuable traits that are not within the gene pool used by the breeders, as
these approaches do not necessarily rely on these pools. This independence from
existing gene pools is a critical aspect of future wheat breeding, as the narrow genetic
basis of wheat, due to the strong selection pressure applied by breeders to increasing
wheat yield potential, hampers progress. Rapid developments in plant biotechnology in
the past decade to transfer genes from alien species, have brought incorporation of alien
traits within the reach of breeding programs (Mujeeb-Kazi and Hettel, 1995).
Given all these developments, prospects for the future to apply physiological
knowledge to aid in improving breeding efficiency are favourable and close
collaboration between both disciplines is needed.
Options to increase wheat yield potential
Analysis of the expression of traits requires an integrative view of the crop system on
the basis of reductionistic process knowledge and synthesizing concepts. While a
complete description of a biological system is not feasible, it is not required either as at
no time that can be a realistic objective. The systems approach should therefore be
applied in an heuristic way with a solid evaluation of the limitations of the analysis, and
a continuous increase in insight, knowledge and understanding. It reveals the weakness
111
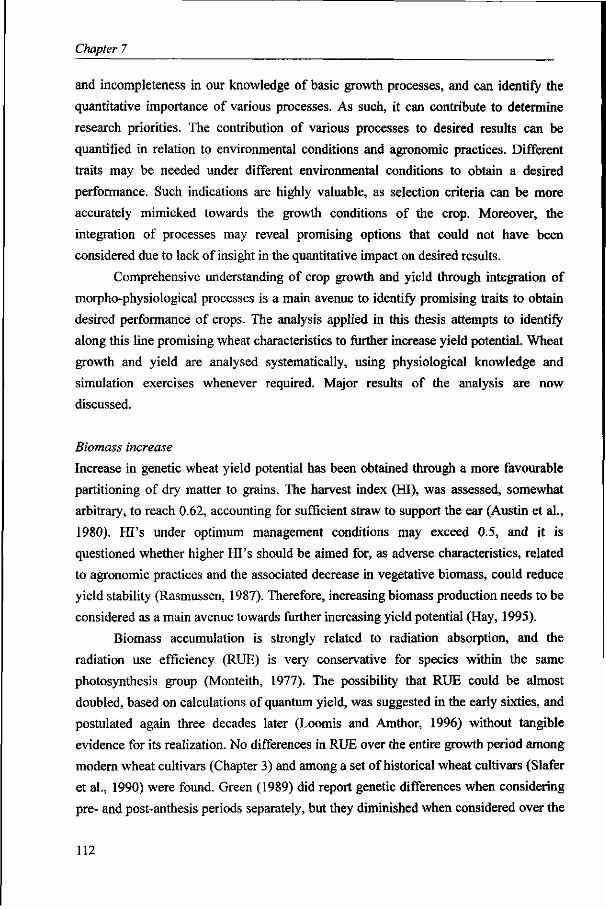
Chapter 7
and incompleteness in our knowledge of basic growth processes, and can identify the
quantitative importance of various processes. As such, it can contribute to determine
research priorities. The contribution of various processes to desired results can be
quantified in relation to environmental conditions and agronomic practices. Different
traits may be needed under different environmental conditions to obtain a desired
performance. Such indications are highly valuable, as selection criteria can be more
accurately mimicked towards the growth conditions of the crop. Moreover, the
integration of processes may reveal promising options that could not have been
considered due to lack of insight in the quantitative impact on desired results.
Comprehensive understanding of crop growth and yield through integration of
morpho-physiological processes is a main avenue to identify promising traits to obtain
desired performance of crops. The analysis applied in this thesis attempts to identify
along this line promising wheat characteristics to further increase yield potential. Wheat
growth and yield are analysed systematically, using physiological knowledge and
simulation exercises whenever required. Major results of the analysis are now
discussed.
Biomass increase
Increase in genetic wheat yield potential has been obtained through a more favourable
partitioning of dry matter to grains. The harvest index (HI), was assessed, somewhat
arbitrary, to reach 0.62, accounting for sufficient straw to support the ear (Austin et al.,
1980). Hi's under optimum management conditions may exceed 0.5, and it is
questioned whether higher Hi's should be aimed for, as adverse characteristics, related
to agronomic practices and the associated decrease in vegetative biomass, could reduce
yield stability (Rasmussen, 1987). Therefore, increasing biomass production needs to be
considered as a main avenue towards further increasing yield potential (Hay, 1995).
Biomass accumulation is strongly related to radiation absorption, and the
radiation use efficiency (RUE) is very conservative for species within the same
photosynthesis group (Monteith, 1977). The possibility that RUE could be almost
doubled, based on calculations of quantum yield, was suggested in the early sixties, and
postulated again three decades later (Loomis and Amthor, 1996) without tangible
evidence for its realization. No differences in RUE over the entire growth period among
modern wheat cultivars (Chapter 3) and among a set of historical wheat cultivars (Slafer
et al., 1990) were found. Green (1989) did report genetic differences when considering
pre- and post-anthesis periods separately, but they diminished when considered over the
112

General discussion
entire season, as pre- and post-anthesis RUE balanced each other. These results suggest
that genetic differences might be present during particular phases of crop growth.
Model calculations have suggested that biomass could be increased by increasing
leaf N content (Kropff et al., 1994a), but higher contents than currently attained under
optimum management conditions in wheat, are hardly feasible (Chapter 3), and even
then it is not likely to lead to higher biomass (Chapter 2). A vertical gradient in leaf N
over the canopy was also suggested to offer opportunities to further increase biomass
and yield (Dingkuhn et al., 1991). Canopy photosynthesis is maximized when the leaf N
distribution pattern within the canopy is similar to that of light, but further optimising
observed canopy N profiles to the light regime, does not reveal tangible increases in
biomass (e.g. Anten et al., 1995). Conflicting results from analyses of leaf N content on
growth partly have their basis in the applied relationship between leaf N and leaf
photosynthesis at light saturation (Chapter 2). Some gain in RUE could still be expected
from further optimising canopy N distribution, during particular phases of crop growth
(Dreccer, 1997), as still much is unclear on the effect of leaf N content on leaf
photosynthesis characteristics.
Harvest index
While Hi's are high at high latitudes, they hardly exceed 0.45 in modern spring wheats
cultivated in ME1 regions (Sayre et al., 1997). High temperatures, especially during the
later phases of crop growth, could cause these low Hi's (Dieseth, 1990). Hence, there
are ample opportunities to further increase yield through increased HI in ME1 regions.
Wheat has often been reported to be a sink-limited crop, but the results in
Chapter 3 showed this to depend on crop and environmental conditions. Under warm
grain filling conditions, post-anthesis assimilate production declines rapidly due to the
impact of temperature on photosynthesis and to accelerated leaf senescence. Insufficient
supply to grains, even when supplemented with stem reserves, limits yield. Under
cooler conditions, yield is limited by the storage or sink capacity of grains. The source
of the canopy exceeds yield and substantial amounts of stem reserves are left unutilized
at maturity (Chapters 3 and 4). Also, source capacity under sink limiting conditions may
be depressed through negative feedback on photosynthesis and substantial amounts of
carbohydrates may be lost through wasteful respiration (Chapter 4).
For optimum planting dates of wheat in Obregon, Mexico, a representative site
for ME1, yields are realized under relatively cool conditions (Chapter 3). The following
discussion therefore concentrates on sink limited yield conditions. Sink capacity can be
113
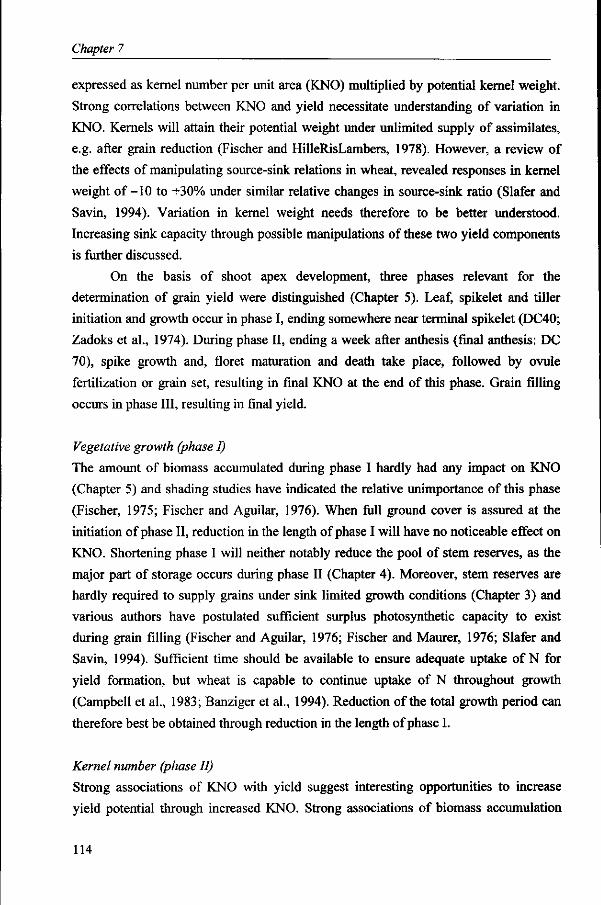
Chapter 7
expressed as kernel number per unit area (KNO) multiplied by potential kernel weight.
Strong correlations between KNO and yield necessitate understanding of variation in
KNO. Kernels will attain their potential weight under unlimited supply of assimilates,
e.g. after grain reduction (Fischer and HilleRisLambers, 1978). However, a review of
the effects of manipulating source-sink relations in wheat, revealed responses in kernel
weight o f -10 to +30% under similar relative changes in source-sink ratio (Slafer and
Savin, 1994). Variation in kernel weight needs therefore to be better understood.
Increasing sink capacity through possible manipulations of these two yield components
is further discussed.
On the basis of shoot apex development, three phases relevant for the
determination of grain yield were distinguished (Chapter 5). Leaf, spikelet and tiller
initiation and growth occur in phase I, ending somewhere near terminal spikelet (DC40;
Zadoks et al., 1974). During phase II, ending a week after anthesis (final anthesis: DC
70), spike growth and, floret maturation and death take place, followed by ovule
fertilization or grain set, resulting in final KNO at the end of this phase. Grain filling
occurs in phase III, resulting in final yield.
Vegetative growth (phase I)
The amount of biomass accumulated during phase I hardly had any impact on KNO
(Chapter 5) and shading studies have indicated the relative unimportance of this phase
(Fischer, 1975; Fischer and Aguilar, 1976). When full ground cover is assured at the
initiation of phase II, reduction in the length of phase I will have no noticeable effect on
KNO. Shortening phase I will neither notably reduce the pool of stem reserves, as the
major part of storage occurs during phase II (Chapter 4). Moreover, stem reserves are
hardly required to supply grains under sink limited growth conditions (Chapter 3) and
various authors have postulated sufficient surplus photosynthetic capacity to exist
during grain filling (Fischer and Aguilar, 1976; Fischer and Maurer, 1976; Slafer and
Savin, 1994). Sufficient time should be available to ensure adequate uptake of N for
yield formation, but wheat is capable to continue uptake of N throughout growth
(Campbell et al., 1983; Banziger et al., 1994). Reduction of the total growth period can
therefore best be obtained through reduction in the length of phase I.
Kernel number (phase II)
Strong associations of KNO with yield suggest interesting opportunities to increase
yield potential through increased KNO. Strong associations of biomass accumulation
114
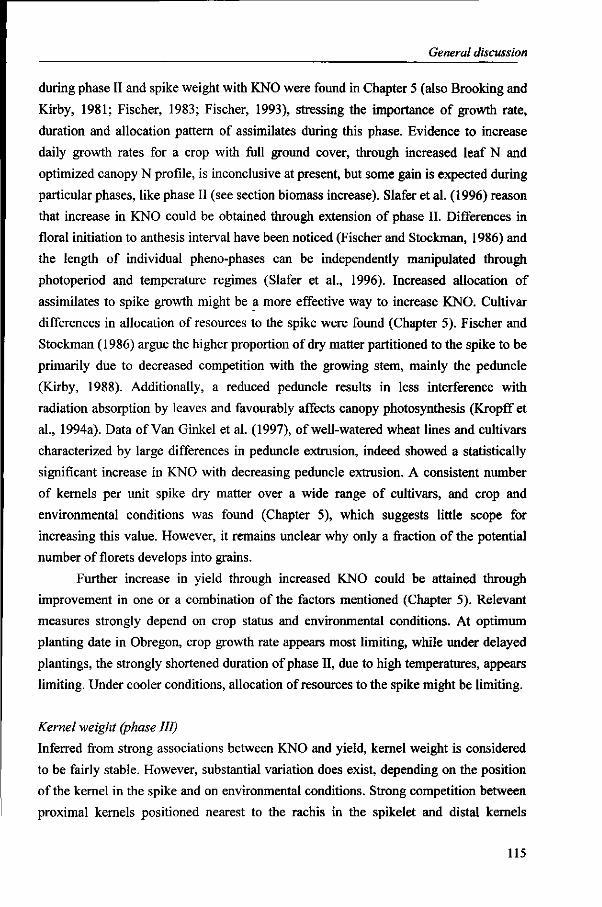
General discussion
during phase II and spike weight with KNO were found in Chapter 5 (also Brooking and
Kirby, 1981; Fischer, 1983; Fischer, 1993), stressing the importance of growth rate,
duration and allocation pattern of assimilates during this phase. Evidence to increase
daily growth rates for a crop with full ground cover, through increased leaf N and
optimized canopy N profile, is inconclusive at present, but some gain is expected during
particular phases, like phase II (see section biomass increase). Slafer et al. (1996) reason
that increase in KNO could be obtained through extension of phase II. Differences in
floral initiation to anthesis interval have been noticed (Fischer and Stockman, 1986) and
the length of individual pheno-phases can be independently manipulated through
photoperiod and temperature regimes (Slafer et al., 1996). Increased allocation of
assimilates to spike growth might be a more effective way to increase KNO. Cultivar
differences in allocation of resources to the spike were found (Chapter 5). Fischer and
Stockman (1986) argue the higher proportion of dry matter partitioned to the spike to be
primarily due to decreased competition with the growing stem, mainly the peduncle
(Kirby, 1988). Additionally, a reduced peduncle results in less interference with
radiation absorption by leaves and favourably affects canopy photosynthesis (Kropff et
al., 1994a). Data of Van Ginkel et al. (1997), of well-watered wheat lines and cultivars
characterized by large differences in peduncle extrusion, indeed showed a statistically
significant increase in KNO with decreasing peduncle extrusion. A consistent number
of kernels per unit spike dry matter over a wide range of cultivars, and crop and
environmental conditions was found (Chapter 5), which suggests little scope for
increasing this value. However, it remains unclear why only a fraction of the potential
number of florets develops into grains.
Further increase in yield through increased KNO could be attained through
improvement in one or a combination of the factors mentioned (Chapter 5). Relevant
measures strongly depend on crop status and environmental conditions. At optimum
planting date in Obregon, crop growth rate appears most limiting, while under delayed
plantings, the strongly shortened duration of phase II, due to high temperatures, appears
limiting. Under cooler conditions, allocation of resources to the spike might be limiting.
Kernel weight (phase III)
Inferred from strong associations between KNO and yield, kernel weight is considered
to be fairly stable. However, substantial variation does exist, depending on the position
of the kernel in the spike and on environmental conditions. Strong competition between
proximal kernels positioned nearest to the rachis in the spikelet and distal kernels
115

Chapter 7
positioned further away was found in Chapter 6. Proximal kernels have priority access
to carbohydrates over distal kernels which are limited in their growth, even with
abundant availability of carbohydrates, while the limitation is stronger under limited
carbohydrate supply. The differences in availability may result from a differential
transport system. Alleviation of competition among kernels was estimated
conservatively to increase sink capacity over a wide range of temperature environments
with at least one ton per hectare. This could be achieved through an improved transport
system, e.g. with principal vascular bundles to all kernels. Rawson and Ruwali (1972)
showed variation in kernel weight to be less in branched spikes, with minimal
competition among kernels. For rice it has been argued that increased yields might be
achieved through selection for larger panicles with more primary branches, as they are
directly connected to large vascular bundles in the peduncle (Vergara et al., 1991).
In the wheat breeding program at CIMMYT, wheat lines with strongly deviating
spike morphological characteristics were developed some years ago (Fischer, 1996).
These lines were not high yielding due to shrivelled grains and were discarded from
further use. Systems analysis indicated that the source capacity of these lines was too
small and limited kernel growth. This was confirmed by degraining treatments in 10
lines, as kernel weight increased on the average by 50%. Averaged for all 10 lines, the
total weight of the kernels per spike could increase 50% compared to the current high
yielding cultivars used in Chapter 6, while some lines could increase two-fold
(Bindraban, unpubl. data). These results suggest that these lines may have interesting
characteristics related to the transport system in the spikes. Therefore, a
morphologically more open spike is a proposed trait to increase sink capacity in wheat.
Final recommendation
The final recommendation of a morphologically more open spike structure is based on a
comprehensive systematic analysis of much known and newly generated physiological
information. The evidence that wheat is sink limited under optimum management
conditions in ME1 has been supported by analysis of various processes and the fact that
kernels are limited in their growth. No direct observations are available to explain the
cause of this growth limitation of kernels, but indirect results and substantial evidence
in literature indicate the capacity of the vascular transport system to be inadequate.
Results of degraining treatments in 10 lines with strongly deviating spike morphological
characteristics indicated that adaptation of the spike morphology is likely to enhance
kernel growth. It remains to be determined whether this is caused by improved transport
116

General discussion
characteristics. Genetic variability for this trait is present at CIMMYT and has also been
documented in literature. Adaptation of the spike morphology is not limited to a
genotype with specific characteristics, but is recommended for a wide range of modern,
high yielding genotypes. It is not known whether negative pleiotropic effects will
counterbalance the expected yield increase. Adverse genetic linkages and pleiotropic
effects can now be assessed with QTL-analysis, further clarifying the potential for
selection of this trait. Improving the allocation of carbohydrates to grains is not likely to
coincide with reduction in quality through decreased protein content. Nitrogen
accumulation in grains is independently controlled from carbohydrate accumulation
(Jenner, 1980), and protein content is not expected to decline under optimum
management conditions with adequate and timely N application. The physiological
basis is considered sufficient to apply the recommended selection trait in a breeding
program aiming to increase genetic yield potential for optimum managed growth
conditions in ME1.
Concluding remarks
Total world food production potential, on biophysical basis, is much larger than current
production. Options to realize the global potential will have to be defined on an eco-
regional basis, because of the enormous variation in production systems. Expansion of
agricultural land is feasible, but only with management and cultivars adapted to the
specific conditions. The large gap between current and potential yield levels is related,
to a substantial extent, to water availablity. While sufficient water is available to irrigate
vast areas, local scarcity, high costs involved in irrigation schemes and required proper
management have hampered rapid expansion of the irrigation area and the options and
constraints for such expansion should be given much more attention in the future.
Further increase in yield and reduction in environmental load require improvement of
current management practices. In favourable production regions, high yields are
obtained due to advanced management practices, and further increases require cultivars
with higher genetic yield potentials.
Various approaches are available to apply physiological knowledge to support
plant breeding, with the systems approach being most powerful. Crop growth simulation
models have proven effective in solving a number of problems. Current major crop
growth simulation models are source driven, while sink capacity, feedback mechanisms
117
Chapter 7
and transport processes need to be considered as well. At this point in time, modelling
exercises effectively aid in improving our quantitative insight in growth processes. To
further exploit the potentials of systems approaches in general and crop growth
simulation models in particular, in formulating recommendations to breeders to improve
breeding efficiency, further development of these models is imperative. When this
condition is not fulfilled, or when results of systems analyses are not discussed on the
basis of the understanding of the crop as a system and its simplified description in the
model, application of simulation models may not create the confidence that is urgently
needed in the dialogue between physiologists and breeders.
Wheat yield potential in ME1 regions can be increased through increased sink
capacity, as source availability is abundant under optimum management conditions.
Under late planting, when grain filling is pushed into warm conditions, source capacity
is likely to limit yield. For optimum growth conditions, it is recommended to increase
sink capacity by reducing competition among grains within the spike and spikelet
through an improved vascular transport system in the ear. Such an improvement could
be obtained with a morphologically more open spike structure. While research is still
needed to further improve our understanding of relevant morpho-physiological
processes, breeding for an open spike morphology can be initiated, because of sufficient
indications for the trait to be effective and available genetic variation.
118
Summary
World food production has to at least triple over the coming three to four decades to
meet growing demand. Increase in food production has been achieved in the past
through increase in agricultural area and increase in yield. Further increase in area is not
desirable, as it would imply further expansion into natural and fragile lands. The gap
between actual and attainable yield levels is large, so that yield increase through
improved agronomic practices has major possibilities and needs continued attention.
Further improvement of agronomic practices in regions with a small gap, will cause
marginal increases in yield only, while the contribution of genetic yield increase will
become more important. This situation occurs in major wheat producing regions in the
(sub-)tropics (ME1), subject of study in this thesis.
Substantial progress has been obtained in increasing genetic wheat yield
potential by plant breeders on an empirical basis. However, continuing progress
becomes increasingly difficult, so that support from other disciplines to accelerate or
even maintain progress is necessary. Physiological understanding of crop growth
becomes imperative. The systems approach is a powerful tool to integrate morpho-
physiological traits and processes in simulation models to assess their quantitative
impact on growth and yield in relation to environmental factors. While models have
been applied in various agricultural disciplines, they have been used only recently in
conjunction with breeding. This novel approach needs further development to aid in
improving breeding efficiency through a more solid scientific basis.
The objective of the research described in this thesis was to identify crop
characteristics that need to be adapted to increase wheat yield potential for ME1
conditions. Morpho-physiological information was integrated as much as possible, with
the aid of simulation models, to improve the quantitative understanding of processes
that determine crop growth and yield. Various experiments were carried out over three
years in the Yaqui Valley, near Obregon, in north-west Mexico, a typical ME1 location.
Increasing yield potential through increased biomass has often been proposed.
Some authors have assessed that this could be obtained through increased leaf nitrogen
content and/or optimized distribution of leaf nitrogen content over the canopy. In
Chapter 2, it was shown that gains are limited for these characteristics under optimum
conditions.
The aim in Chapter 3 was to identify the factors that determine wheat growth and
yield. Biomass accumulation is largely determined by radiation absorption and leaf
nitrogen content, while yield realization is a much more complex process. At high yield
levels, the capacity of the canopy to produce assimilates exceeded the final yield. At
lower yield levels, like under nitrogen limited growth conditions, the source capacity
121
Summary
was too small and demand by kernels had to be supplemented by reserves from the
stem. The kernel remained at a cultivar specific standard weight under these conditions.
Under extreme conditions, like heat stress, the total supply of carbohydrates became so
limited that even kernel weight decreased.
In Chapter 4, the results of the preceding chapter were verified by the analysis of
stem reserve dynamics. Production of carbohydrates was found to exceed the demand
by the grains during the first two weeks of grain filling, resulting in an increase in stem
reserves. Subsequently the amount of reserves declined towards maturity. At lower
yield levels the decline was in accordance with the deficit in carbohydrate production to
meet grain demand. At higher yield levels with sufficient production, remobilization of
reserves was still observed. This suggests additional processes, like wasteful respiration
and negative feedback on photosynthesis, to become important during the later part of
grain filling. Substantially higher amounts of residual stem reserves at maturity were
found at higher than at lower yield levels.
From the preceding chapters it can be inferred that the capacity of kernels is
insufficient to completely utilize carbohydrates produced under optimum management
conditions in ME1. Yield increase can therefore be attained through increased sink
capacity of the crop, composed of the number and weight of kernels.
In Chapter 5, crop development has been divided in three phases most relevant to
yield formation. Growth of vegetative organs takes place during the first phase. In the
second phase the spike grows and part of the developed flowers senesce at the end of
the phase setting the final kernel number. In the third stage, kernels are filled. The
number of kernels per unit area correlates strongly to yield, suggesting that yield
increase could be attained through increase in kernel number. It was shown that kernel
number is positively correlated with the growth rate of the crop during the second
phase, the length of this second phase and the allocation of carbohydrates to the spike.
Required adaptations to increase kernel number depend on environmental conditions.
It is unclear why the weight of kernels does not increase, despite the abundant
availability of carbohydrates at higher yield levels. Large variation is found particularly
among kernels within the ear. Degraining treatments described in Chapter 6 revealed
that kernels positioned further away from the rachis are severely limited in their growth
in the presence of kernels nearer to the rachis, even under abundant availability of
carbohydrates. This competition for carbohydrates was suggested to be caused by an
inadequate vascular transport system. Elimination of this problem was assessed to result
in an increase in sink capacity of at least one ton per hectare.
Chapter 7 starts by stressing the need to further increase genetic wheat yield
potential. Potentials of various approaches to utilize physiological knowledge to support
breeding efforts are discussed. The systems approach has the strongest potential, but
further improvement is needed for its more effective application. It is recommended, on
122
Summary
the basis of the research results presented, that the morphology of the spike is adapted to
increase wheat yield potential under ME1 conditions. Observations in lines with
strongly varying spike morphological characteristics suggest implementation of this
recommended to be effective. Sufficient genetic variation of this trait is at hand to be
incorporated in a breeding program.
123

Samenvatting
De wereldvoedselproductie moet minstens verdrievoudigen gedurende de komende drie tot vier decennia om aan de groeiende vraag te voldoen. Verhoging van de voedselproductie is tot nu toe gerealiseerd door zowel uitbreiding van het landbouwareaal als door verhoging van de opbrengst per hectare. Verdere uitbreiding van het areaal is niet gewenst, aangezien natuurlijke en fragiele gebieden in cultuur gebracht zouden moeten worden. Het verschil tussen gerealiseerde en haalbare opbrengsten is momenteel groot, zodat opbrengstverhoging door verbetering van teeltmaatregelen grote mogelijkheden biedt en voortgaande aandacht verdient. Daar waar het verschil klein is, zal de bijdrage van verhoogde opbrengstpotentie een belangrijkere rol spelen in de verhoging van de opbrengst. Dergelijke situaties doen zich voor in belangrijke tarwe producerende gebieden in de (sub-)tropen (MEI), en zijn het onderwerp van studie in dit proefschrift.
Goede resultaten bij het verhogen van de opbrengstpotentie van tarwe zijn in het verleden behaald door plantenveredelaars, veelal gebaseerd op empirische kennis. Echter, versnelling of zelfs handhaving van de vooruitgang wordt steeds moeilijker en veredelaars hebben behoefte aan ondersteuning om hun kruisings- en selectieprocedures effectiever te maken. Een goed begrip van de fysiologie van het gewas is daarbij nodig. De systeemanalytische benadering biedt krachtige mogelijkheden om een groot aantal kenmerken en processen te integreren en de kwantitatieve invloed ervan op de gewenste eigenschappen te bepalen in relatie tot omgevingsfactoren. Hoewel deze benadering in verschillende landbouwkundige disciplines is toegepast, wordt ze pas recentelijk gebruikt op het gebied van de plantenveredeling. Deze nieuwe benadering vereist verdere ontwikkeling om de efficiency in de veredeling te verbeteren op grond van een stevigere wetenschappelijke basis.
De doelstelling van het onderzoek beschreven in dit proefschrift is om te identificeren welke veranderingen in gewaskenmerken zouden kunnen leiden tot verhoging van de opbrengstpotentie van tarwe voor MEI condities. Morfo-fysiologische processen zijn daarbij zoveel mogelijk geïntegreerd in simulatiemodellen, om de vele processen inzichtelijk te maken en de kwantitatieve invloed van deze processen op groei en opbrengstvorming vast te stellen. Verschillende experimenten zijn uitgevoerd gedurende drie jaar, in de Yaqui vallei, bij de stad Obregon in noordwest Mexico, een typische MEI locatie.
Verhogen van de opbrengst via verhoging van de biomassa productie is vaak geopperd. Sommige onderzoekers hebben geschat dat hogere biomassaproducties gerealiseerd kunnen worden door verhoging van het stikstofgehalte van het blad en/of door optimalisatie van de verdeling van stikstof over de bladeren in het bladerdek. In
125

Samenvatting
Hoofdstuk 2 werd aangetoond dat veranderingen in deze kenmerken slechts tot geringe
productieverhoging zouden leiden onder optimale teeltomstandigheden.
Het doel van het in Hoofdstuk 3 beschreven onderzoek was om vast te stellen
welke factoren de groei en opbrengst van tarwe bepalen. De biomassaproductie wordt
vooral bepaald door de hoeveelheid geabsorbeerd licht en het stikstofgehalte van het
blad, terwijl de opbrengstvorming een veel complexer proces is. Bij hoge op
brengstniveaus bleek de capaciteit van het bladerdek, als producent van koolhydraten,
groter te zijn dan de uiteindelijke opbrengst. Bij lagere opbrengstniveaus, zoals onder
stikstofgelimiteerde omstandigheden, bleek deze capaciteit juist te klein en moesten de
tijdens de korrelvullingsfase geproduceerde koolhydraten aangevuld worden met re
serves uit de stengel om aan de vraag van de korrels te voldoen. Het korrelgewicht blijft
onder deze omstandigheden gehandhaafd op een cultivar specifieke waarde. Onder ex
treme omstandigheden, zoals hoge temperaturen, wordt het totale aanbod aan koolhy
draten zo beperkt dat zelfs het korrelgewicht daalt.
In Hoofstuk 4 zijn de aanwijzingen uit het vorige hoofdstuk geverifieerd door
analyse van de dynamiek van de stengelreserves. Het bleek dat de productie van kool
hydraten door het bladerdek de vraag door de korrels overtrof gedurende de eerste twee
weken van de korrelvulling, waardoor de hoeveelheid stengelreserves toenam. Vervol
gens vond er een afname van stengelreserves plaats. Bij lage opbrengstniveaus kwam de
afname overeen met het verschil tussen de productie door het bladerdek en de vraag van
de korrels. Echter, bij hoge opbrengstniveaus zijn stengelreserves niet nodig omdat het
bladerdek voldoende productiecapaciteit heeft, maar toch vond er een afname plaats.
Additionele processen, zoals verspillende ademhaling en negatieve terugkoppeling van
hoge reservegehalten op fotosynthese kunnen onder deze omstandigheden een belang
rijke rol spelen. Bij hogere opbrengstniveaus werden grotere hoeveelheden residuele
reserves gevonden dan bij lagere opbrengstniveaus.
Uit de Hoofdstukken 3 en 4 blijkt dat de opslagcapaciteit van de korrels, de
'sink', niet toereikend is om het productiepotentieel van het fotosynthetiserende blader
dek volledig te benutten. De opbrengstpotentie kan derhalve worden verhoogd door
vergroting van de sinkcapaciteit van het gewas, bepaald door het aantal korrels en het
gewicht van de korrels.
In Hoofdstuk 5 is de fenologische ontwikkeling van het gewas opgedeeld in drie
fasen die relevant zijn voor de opbrengstvorming. In de eerste fase vindt voornamelijk
groei van vegetatieve organen plaats. In de tweede fase groeit de aar en sterft een deel
van de aangelegde bloemen af, waarbij het uiteindelijke aantal korrels wordt bepaald. In
de derde fase worden de korrels gevuld. Het aantal korrels per oppervlakteeenheid is
sterk gecorreleerd aan de opbrengst, wat aangeeft dat opbrengstverhoging verkregen
kan worden door verhoging van het aantal korrels. Aangetoond wordt dat het aantal kor
rels gerelateerd is aan de groeisnelheid van het gewas gedurende de tweede fase, de
126

Samenvatting
lengte van die fase en de allocatie van koolhydraten naar de aar toe. Aanpassingen nodig om het aantal korrels te verhogen zijn afhankelijk van milieuomstandigheden.
Onduidelijk is waarom korrels niet groter worden bij hoge opbrengstniveaus, ondanks een overmaat aan koolhydraten. De variatie in korrelgewicht is met name groot tussen korrels binnen de aar. Ontkorrelingsproeven, beschreven in Hoofdstuk 6, lieten zien dat korrels die verder van de aarsteel afzitten sterk beperkt worden in hun groei door de aanwezigheid van korrels dichter bij de steel, zelfs bij een overmaat aan beschikbare koolhydraten. Deze onderlinge competitie lijkt zijn oorzaak te hebben in een inadequaat transportsysteem. Geschat is dat het opheffen van de competitie kan resulteren in een verhoging van de sinkcapaciteit van tenminste één ton per hectare.
In Hoofdstuk 7 wordt de noodzaak tot verhoging van de genetische opbrengstpotentie benadrukt. Vervolgens worden de mogelijke benaderingen besproken die we tot onze beschikking hebben om fysiologische kennis toe te passen om op ver-edelingsvraagstukken in te spelen. De systeemanalytische benadering biedt de beste mogelijkheden, maar verdere ontwikkeling is nodig om tot effectievere toepassing te komen. Er wordt aanbevolen, gebaseerd op de onderzoeksresultaten, om de morfologie van de aar aan te passen om de opbrengstpotentie van tarwe onder MEI condities te verhogen. Waarnemingen in tarwe-lijnen met een grote verscheidenheid in aarmorfolo-gie suggereren dat implementatie van deze aanbeveling effectief zal zijn. Voldoende genetische variatie van dit kenmerk is aanwezig om in veredelingsprogramma's opgenomen te worden.
127
References
Abbate, P.E., F.H. Andrade and J.P. Culot, 1995. The effects of radiation and nitrogen
on number of grains in wheat. J. of Agric. Sei. (Camb.) 124: 351-360.
Abbate, P.E., F.H. Andrade, J.P. Culot and P.S. Bindraban, 1997. Grain yield in wheat:
effects of radiation during spike growth period. Field Crops Res. (in press).
Aggarwal, P.K. and N. Kalra, 1994. Analyzing the limitations set by climatic factors,
genotype, and water and nitrogen availability on productivity of wheat. 2.
Climatically potential yields and management strategies. Field Crops Res. 38:
93-103.
Aggarwal, P.K., M.J. Kropff, K.G. Cassman and H.F.M. ten Berge, 1997. Simulating
genotype strategies for increasing rice yield potential in irrigated, tropical
environments. Field Crops Res. 51:5-17.
Aggarwal P.K., M.J. Kropff, P.S. Teng and G.S. Khush, 1997. The challenge of
integrating systems approach in plant breeding: opportuinities,
accomplishments and limitations. In: M.J. Kropff, P.S. Teng, P.K. Aggarwal, J.
Bouma, B.A.M. Bouman, J.W. Jones and H.H. van Laar (eds.). Applications of
systems approaches at the field level. Vol. 2. Systems approaches for
sustainable agricultural development. Kluwer Academic Publishers, The
Netherlands, pp. 1-23.
Alexandratos, N., 1995. World Agriculture: Towards 2010. FAO/John Wiley. 488 pp.
Andrade, F.H., S.A. Uhart and A. Cirilo, 1993. Temperature affects radiation use
efficiency in maize. Field Crops Res. 32: 17-25.
Angus, J.F., D.H. Mackenzie, R. Morton and CA. Schafer, 1981. Phasic devevelopment
in field crops II. Thermal and photoperiodic responses of spring wheat. Field
Crops Res. 4:269-283.
Anten, N.P.R., F. Schieving and M.J.A. Werger, 1995. Patterns of light and nitrogen
distribution in relation to whole canopy carbon gain in C3 and C4 mono- and
dicotyledonous species. Oecologia 101: 504-513.
Araus, J.L. and L. Tapia, 1987. Photosynthetic gas exchange characteristics of wheat
flag leaf blades and sheaths during grain filling. The case of a spring crop
grown under Mediterranean climate conditions. Plant Physiol. 85: 667-673.
Asrar, G., L.E. Hipps and E.T. Kanemasu, 1984. Assessing solar energy and water use
efficiencies in winter wheat: A case study. Agric. Forest Meteorol. 31: 47-58.
Atsmon, D., M.G. Bush and L.T. Evans, 1986. Effects of environmental conditions on
expression of the 'Gigas' characters in wheat. Aust. J. Plant Physiol. 13: 365-
379.
129

References
Austin, R.B. and J.A. Edrich, 1975. Effect of ear removal on photosynthesis,
carbohydrate accumulation and on the distribution of assimilated 14C in wheat.
Ann. Bot. 39: 141-152.
Austin, R.B., J.A. Edrich, M.A. Ford and R.D. Blackwell, 1977. The fate of the dry
matter, carbohydrates and C lost from the leaves and stems of wheat during
grain filling. Ann. Bot. 41: 1309-1321.
Austin, R.B., J. Bingham, R.D. Blackwell, L.T. Evans, M.A. Ford, C.L. Morgan and M.
Taylor, 1980. Genetic improvements in winter wheat yields since 1900 and
associated physiological changes. J. Agric. Sei. (Camb.) 94: 675-689.
Balota, M., I. Amani, M.P. Reynolds, R.A. Fischer and E. Acevedo, 1993. An
evaluation of membrane thermostability and canopy temperature depression as
screening traits for heat tolerance in wheat. Wheat Special Report No 20.,
Mexico, D.F.: CIMMYT.
Banziger, M., B. Feil and P. Stamp, 1994. Competition between nitrogen accumulation
and grain growth for carbohydrates during grain filling of wheat. Crop Sei. 34:
440-446.
Banziger, M., F.J. Betrân and H.R. Lafitte, 1997. Efficiency of high-nitrogen selection
environments for improving maize for low-nitrogen target environments. Crop
Sei. (in press).
Bastiaans, L., M.J. Kropff, N. Kempuchetty, A. Rajan and T.R. Migo, 1997. Can
simulation models help design rice varieties that are more competitive against
weeds? Field Crops Res. 51: 101-111.
Beiford, R.K. and R.H. Sedgley, 1991. Conclusions: Ideotypes and physiology:
Tailoring plants for increased production. Field Crops Res. 26: 221-226.
Bell, M.A. and R.A. Fischer, 1994. Using yield prediction models to assess yield gains -
a case study for wheat. Field Crops Res. 36: 161-166.
Bell, M.J., G.C. Wright and G.L. Hammer, 1992. Night temperature affects radiation-
use efficiency in peanut. Crop Sei. 32: 1329-1335.
Bhalla, G.S., G.K. Chadha, S.P. Kashyap and R.K. Sharma, 1990. Agricultural growth
and structural changes in the Punjab Economy: An input-output analysis. IFPRI
Research Report 82. 119 pp.
Bidinger, F., R.B. Musgrave and R.A. Fischer, 1977. Contribution of stored pre-anthesis
assimilate to grain yield in wheat and barley. Nature 270: 431-433.
Bindraban, P.S., 1997. Impact of canopy nitrogen profile in wheat on growth. Field
Crops Res. (in prep). Chapter 2.
Bindraban, P.S., K.D. Sayre, M. van Ginkel and R A. Fischer, 1997. Identifying major
crop characteristics that determine wheat growth and yield. Crop Sei. (in prep).
Chapter 3.
130

References
Blum, A., 1986. The effect of heat stress on wheat leaf and ear photosynthesis. J. Exp.
Bot. 37: 111-118.
Blum, A., B. Sinmena, J. Mayer, G. Golan and L. Shpiler, 1994. Stem reserve
mobilization supports wheat-grain filling under heat stress. Aust. J. Plant
Physiol. 21: 771-781.
Bonnett, G.D. and L.D. Incoll, 1993. Effects on the stem of winter barley of
manipulating the source and sink during grain-filling. 2. Changes in the
composition of water-soluble carbohydrates of internodes. J. Exp. Bot. 44: 83-
91.
Borghi, B., M. Corbellini, M. Cattaneo, M.E. Fornasari and L. Zucchelli, 1986.
Modification of the sink/source relationships in bread wheat and its influence
on grain yield and grain protein content. J. Agron. Crop Sei. 157: 245-254.
Borojevic, S., 1978. Determination of optimal LAI and effective LAD for different
wheat genotypes. In: S. Ramanujam (ed.). Proceedings of the Fifth International
Wheat Genetics Symposium. New Delhi, India, pp. 899-906.
Bremner, P.M. and H.M. Rawson, 1978. The weights of individual grains of the wheat
ear in relation to their growth potential, the supply of assimilate and interaction
between grains. Aust. J. Plant Physiol. 5: 61-72.
Brocklehurst, P.A., 1977. Factors controlling grain weight in wheat. Nature 266: 348-
349.
Brooking, LR. and E.J.M. Kirby, 1981. Interrelationships between stem and ear
development in winter wheat: the effects of a Norin 10 dwarfing gene,
Gai/RHt2. J. Agric. Sei. (Camb.) 97: 373-381.
Byerlee, D., 1994. Modern varieties, productivity, and sustainability: Recent experience
and emerging challenges. Mexico, D.F.: CIMMYT. 26 pp.
Campbell, CA., H.R. Davidson and T.N. McCaig, 1983. Disposition of nitrogen and
soluble sugars in Manitou spring wheat as influenced by N fertilizer,
temperature and duration and stage of moisture stress. Can. J. Plant Sei. 63: 73-
90.
Chowdhury S.I. and I.F. Wardlaw, 1978. The effect of temperature on kernel
development in cereals. Aust. J. Agric. Res. 29: 205-223.
CIMMYT, 1995. CIMMYT in 1994. Modern maize and wheat varieties: Vital to
sustainable agriculture and food security. Mexico, D.F.: CIMMYT. 24 pp.
Connor, D.J., A.J. Hall and V.O. Sadras, 1993. Effect of nitrogen content on the
photosynthetic characteristics of sunflower leaves. Aust. J. Plant Physiol. 20:
251-263.
Connor, D.J., V.O. Sadras and A.J. Hall, 1995. Canopy nitrogen distribution and the
photosynthetic performance of sunflower crops during grain filling - a
quantitative analysis. Oecologia 101: 274-281.
131
References
Darroch, B.A. and R.J. Baker, 1990. Grain filling in three spring wheat genotypes:
statistical analysis. Crop Sei. 30: 525-529.
Dençiç, S., 1994. Designing a wheat ideotype with increased sink capacity. Plant
Breeding-Zeitschrift fur Pflanzenzüchtung 112: 311-317.
De Ridder, N. and H. van Keulen, 1990. Some aspects of the role of organic matter in
sustainable intensified arable farming systems in the West-African semi-arid
tropics (SAT). Fert. Res. 26: 299-310.
De Wit, CT., 1992. Resource use efficiency in agriculture. Agr. Syst. 40: 125-151.
Dieseth, JA., 1990. Growth and development of bread wheat under high temperatures.
Ph.D.-thesis, Agricutural University of Norway, Dept. of Crop Science Âs-
NLH. 175 pp.
Dingkuhn, M., F.W.T. Penning de Vries, S.K. De Datta and H.H. van Laar, 1991.
Concepts for a new plant type for direct seeded flooded tropical rice. In: Direct
seeded flooded rice in the tropics. IRRI, Philippines, pp. 17-38.
Donald, CM., 1968. The breeding of crop ideotypes. Euphytica 17: 385-403.
Downes, R.W., 1970. Effect of light intensity and leaf temperature on photosynthesis
and transpiration in wheat and sorghum. Aust. J. Biol. Sei. 23: 775-782.
Dreccer, F., 1997. Optimization of vertical distribution of canopy nitrogen: An
alternative trait to increase yield potential in winter cereals. J. Crop Production
(in press).
Ehleringer, J. and R.W. Pearcy, 1983. Variation in quantum yield for C0 2 uptake
among C3 and C4 plants. Plant Physiol. 73: 555-559.
Evans, J.R., 1983. Nitrogen and photosynthesis in the flag leaf of wheat. Plant Physiol.
72: 297-302.
Evans, L.T., 1990. Assimilation, allocation, explanation, extrapolation. In: R. Rabbinge,
J. Goudriaan, H. van Keulen, F.W.T. Penning de Vries and H.H. van Laar
(eds.). Theoretical Production Ecology: reflections and prospects. Simulation
Monographs, Pudoc, Wageningen, The Netherlands, pp. 77-87.
Evans, L.T., 1993. Crop evolution, adaptation and yield. Cambridge University Press,
Great Britain. 500 pp.
Evans, L.T. and R.L. Dunstone, 1970. Some physiological aspects of evolution in
wheat. Aust. J. Biol. Sei. 23: 725-741.
FAO, 1995. The state of food and agriculture. Annual report on current developments
affecting world agriculture, including digital agricultural production statistics
for all countries in the world. FAO, Rome.
FAO, 1996. FAO yearbook. Production 1995. FAO Statistics Series No. 130. 235 pp.
FAO, 1997. World Food Summit, 1996. World Wide Web: www.fao.org.
Fengshan, H., Z. Ming and Z. Shongshan, 1984. Study on the causes for photosynthetic
decrease of wheat at the middle day (I). Acta Agronomica Sinica 10: 137-143.
132

References
Field, C , 1983. Allocating leaf nitrogen for the maximization of carbon gain: leafage
as a control on the allocation program. Oecologia 56: 341-347.
Fischer, R.A., 1975. Yield potential in a dwarf spring wheat and the effect of shading.
Crop Sei. 15: 607-613.
Fischer, R.A., 1983. Growth and yield of wheat. Proc. Symposium on Potential
Production of Food Crops under Different Environments. Sept 1980, IRRI, Los
Banos, Philippines, pp. 129-154.
Fischer, R.A., 1985. Number of kernels in wheat crops and the influence of solar
radiation and temperature. J. Agric. Sei. (Camb.) 105: 447-461.
Fischer, R.A., 1993. Irrigated spring wheat and timing and amount of nitrogen fertilizer.
2. Physiology of grain yield response. Field Crops Res. 33: 57-80.
Fischer, R.A., 1996. Wheat physiology at CIMMYT and raising the yield plateau. In:
M.P. Reynolds, S. Rajaram and A. McNab (eds.). Increasing yield potential in
wheat: Breaking the barriers. Mexico, D.F.: CIMMYT. pp. 195-202.
Fischer, R.A. and I. Aguilar, 1976. Yield potential in a dwarf spring wheat and the
effect of carbon dioxide fertilization. Agron. J. 68: 749-752.
Fischer, R.A. and R. Maurer, 1976. Crop temperature modification and yield potential
in a dwarf spring wheat. Aust. J. Agric. Res. 29: 443-458.
Fischer, R.A. and D. HilleRisLambers, 1978. Effect of environment and cultivar on
source limitation to grain weight in wheat. Aust. J. Agric. Res. 29: 443-458.
Fischer, R.A. and Y.M. Stockman, 1986. Increased kernel number in Norin 10-derived
dwarf wheat: evaluation of the cause. Aust. J. Plant Physiol. 13: 767-784.
France, J. and J.H.M. Thornley, 1984. Mathematical models in agriculture. Butterworth
and Co. (Publishers) Ltd., London. 335 pp.
Gallagher, J.N. and P.V. Biscoe, 1978. Radiation absorption, growth and yield of
cereals. J. Agric. Sei. (Camb.) 91: 47-60.
Gallagher, J.N., P.V. Biscoe and R.K. Scott, 1975. Barley and its environment. V.
Stability of grain weight. J. Appl. Ecol. 12: 319-336.
Goudriaan, J., 1995. Optimization of nitrogen distribution and of leaf area index for
maximum canopy assimilation rate. In: T.M. Thiyagarajan, H.F.M. ten Berge
and M.C.S. Wopereis (eds.). Nitrogen management studies in irrigated rice.
SARP Research Proceedings-May 1995. pp. 85-97.
Goudriaan, J. and J.C. Zadoks, 1995. Global climate change: modelling the potential
responses of agro-ecosystems with special reference to crop protection.
Environ. Pollut. 87: 215-224.
Green, CF. , 1989. Genotypic differences in the growth of Triticum aestivum in relation
to absorbed solar radiation. Field Crops Res. 19: 285-295.
133
References
Habekotté, B., 1996. Winter oilseed rape. Analysis of yield formation and crop type
design for higher yield potential. Ph.D-Thesis. Wageningen Agricultural
University, The Netherlands. 156 pp.
Hamblin, J., 1993. The ideotype concept: Useful or outdated? In: International Crop
Science I. D.R. Buxton, R. Shibles, R.A. Forsberg, B.L. Blad, K.H. Asay, G.M.
Paulsen and R.F. Wilson (eds.). Crop Science Society of America, Inc.
Madison, Wisconsin, USA. pp. 589-597.
Hanif, M. and R.H.M. Langer, 1972. The vascular system of the spikelet in wheat. Ann.
Bot. 36: 721-727.
Hay, R.K., 1995. Harvest index: a review of its use in plant breeding and crop
physiology. Ann. Appl. Biol. 126: 197-216.
Haynes, R.J., K.C. Cameron, K.M. Goh and R.P. Sherlock, 1986. Mineral nitrogen in
the plant-soil system. Academic press Inc. Orlando, USA. 481 pp.
Herzog, H., 1982. Relation of source and sink during grain filling period in wheat and
some aspects of its regulation. Physiol. Plantarum 56: 155-160.
Hirose, T. and M.J.A. Werger, 1987. Maximizing daily canopy photosynthesis with
respect to the leaf nitrogen allocation pattern in the canopy. Oecologia 72: 520-
526.
Housley, T.L. and D.M. Peterson, 1982. Oat stem vascular size in relation to kernel
number and weight. I. Controlled environment. Crop Sei. 22: 259-263.
Hunt, L.A., 1991. Designing improved plant types: a breeder's viewpoint. In: F.W.T.
Penning de Vries, P.S. Teng and K. Metselaar (eds.). Systems approaches for
agricultural development. Volume 2. Kluwer Academic Publishers. Dordrecht,
The Netherlands, pp. 3-17.
Hunt, L.A. and G. van der Poorten, 1985. Carbon dioxide exchange rates and leaf
nitrogen contents during aging of the flag leaf and penultimate leaves of five
spring-wheat cultivars. Can. J. Bot. 63: 1605-1609.
IFPRI, 1994. World food trends and future food security. Food Policy Report. The
International Food Policy Research Institute, Washington, D.C. 25p.
IFPRI, 1995. A 2020 vision for food, agriculture and the environment. The vision,
challenge, and recommended action. The International Food Policy Research
Institute, Washington, D.C. 50 pp.
Jackson, P., M. Robertson, M. Cooper and G.L. Hammer, 1996. The role of
physiological understanding in plant breeding; from a breeding perspective.
Field Crops Res. 49: 11-37.
Jenner, CF., 1980. Effects of shading or removing spikelets in wheat: testing
assumptions. Aust. J. Plant Physiol. 7:113-121.
Kearsey, M. and H.S. Poonsi, 1996. The genetical analysis of quantitative traits.
Chapman and Hall. London. 381 pp.
134
References
King, R.W., I.F. Wardlaw and L.T. Evans, 1967. Effect of assimilate utilization on
photosynthetic rate in wheat. Planta (Berl.) 77: 261-276.
Kiniry, J.R., 1993. Nonstructural carbohydrate utilization by wheat shaded during grain
growth. Agron. J. 85: 844-849.
Kiniry, J.R., C.A. Jones, J.C. O'Toole, R. Blanchet, M. Cabelguenne and D.A. Spanel,
1989. Radiation-use efficiency in biomass accumulation prior to grain-filling
for five grain-crop species. Field Crops Res. 20: 51-64.
Kirby, E.J.M., 1988. Analysis of leaf, stem and ear growth in wheat from terminal
spikelet stage to anthesis. Field Crops Res. 18: 127-140.
Kropff, M.J., K.G. Cassman and H.H. van Laar, 1994a. Quantitative understanding of
the irrigated rice ecosystem and yield potential. In: S.S. Virmani (ed.). Hybrid
rice technology: new developments and future prospects. IRRI, Los Banos,
Philippines, pp. 97-113.
Kropff, M.J., K.G. Cassman, S. Peng, R.B. Matthews and L.T. Setter, 1994b.
Quantitative understanding of yield potential. In: K.G. Cassman (ed.). Breaking
the yield barrier. Proceedings of a workshop on rice yield potential in favorable
environments. IRRI, Los Banos, Philippines, pp. 21-38.
Kropff, M.J., H.H. van Laar and R.B. Matthews (eds.), 1994c. ORYZA1: An
ecophysiological model for irrigated rice production. SARP research Proc.
IRRI, Los Banos, Philippines and AB-DLO, Wageningen. 110 pp.
Kühbauch, W. and U. Thome, 1989. Nonstructural carbohydrates of wheat stems as
influenced by sink-source manipulations. Plant Physiol. 134: 243-250.
Lambers, H., 1979. Efficiency of root respiration in relation to growth rate, morphology
and soil composition. Physiol. Plantarum 46 : 194-202.
Lambers, H., 1985. Respiration in intact plants and tissue: its regulation and dependence
on environmental factors, metabolism and invaded organisms. In: R. Douce and
D.A. Day (eds.). Encyclopaedia of Plant Physiology, New Series, Vol. 18.
Springer-Verslag, Berlin, pp. 418-473.
Lambers, H., R.J. Simpson, V.C. Beilharz and M.J. Dalling, 1982. Translocation and
utilization of carbon in wheat {Triticum aestivum). Physiol. Plantarum 56: 18-
22.
Lambers, H., A. van der Werf and H. Konings, 1992. Respiratory patterns in roots in
relation to their functioning. In: Y. Waisel, A. Eshel and K. Kafkaki (eds.).
Plant Roots. The Hidden Half. Marcel Dekker, Inc. New York. pp. 229-263.
LEI-CBS, 1996. Landbouwcijfers. Landbouw Economisch Instituut - Centraal Bureau
voor de Statistiek, 's Gravenhage, The Netherlands. 273 pp.
Lemaire, G., B. Onillon, G. Gosse, M. Chartier and J.M. Allirand, 1991. Nitrogen
distribution within a lucerne canopy during regrowth: relation with light
distribution. Ann. Bot. 68: 483-488.
135

References
Loomis, R.S. and W.A. Williams, 1963. Maximum crop productivity: An estimate. Crop Sei. 3: 67-72.
Loomis, R.S. and J.S. Amthor, 1996. Limits to yield revisited. In: MP . Reynolds, S.
Rajaram and A. McNab (eds.). Increasing yield potential in wheat: Breaking the
barriers. Mexico, D.F.: CIMMYT. pp. 76-89.
Loomis, R.S., R. Rabbinge and E. Ng, 1979. Explanatory models in crop physiology.
Ann. Rev. Plant Physiol. 30: 339-367.
Makino, A., T. Mae and K. Ohira, 1988. Differences between wheat and rice in the
enzymic properties of ribulose-l,5-bisphosphate carboxylase/oxygenase and the
relationship to photosynthetic gas exchange. Planta 174: 30-38.
Martinez-Carrasco, R., E. Cervantes, P. Perez, R. Morcuende and I.M.M. Del Molino,
1993. Effect of sink size on photosynthesis and carbohydrate content of leaves
of three spring wheat varieties. Physiol. Plantarum 89: 453-459.
McBee, G.G. and F.R. Miller, 1993. Stem carbohydrate and lignin concentrations in
sorghum hybrids at seven growth stages. Crop Sei. 33: 530-534.
Monteith, J.L., 1972. Solar radiation and productivity in tropical ecosystems. J. Appl.
Ecol. 9: 747-766.
Monteith, J.L., 1977. Climate and the efficiency of crop production in Britain. Philos. T.
Roy. Soc. of London 281: 277-294.
Morris, D.L., 1948. Quantitative determination of carbohydrates with Dreywood's
anthrone reagent. Science 107: 254-255.
Morris, R.O., D.G. Blevins, J.T. Dietrich, R.C. Durley, S.B. Gelvin, J. Gray, N.G.
Hommes, M. Kaminek, L.J. Mathews, R. Meilan, T.M. Reinbott and L.
Sayavedra-Soto, 1993. Cytokinins in plant pathogenic bacteria and developing
cereal grains. Aust. J. Plant Physiol. 20: 621-637.
Muchow, R.C. and T.R. Sinclair, 1994. Nitrogen response of leaf photosynthesis and
canopy radiation use efficiency in field-grown maize and sorghum. Crop Sei.
34: 721-727.
Mujeeb-Kazi, A. and G.P. Hertel (eds.). 1995. Utilizing wild grass biodiversity in wheat
improvement: 15 years of wide cross research at CIMMYT. CIMMYT
Research Report No. 2. Mexico, D.F.: CIMMYT. 140 pp.
Nâtrovâ, Z. and L. Nâtr, 1993. Limitation of kernel yield by the size of conducting
tissue in winter wheat varieties. Field Crops Res. 31: 121-130.
Natt, C. and W. Höfner, 1987. Influence of an exogenously changed source-sink
relationship on the number of endosperm cells and grain development in spring
wheat. Z. Pflanzenernähr. Bodenk. 150: 81-85.
Nicolas, M.E., R.M. Gleadow and M.J. Dalling, 1985. Effect of post-anthesis drought
on cell division and starch accumulation in developing wheat grains. Ann. Bot.
55: 433-444.
136
References
Nix, H.A., 1976. Climate and crop productivity in Australia. In: S. Yoshida (ed.).
Climate and Rice. International Rice Research Institute, Los Banos, Phillipines.
pp. 495-507.
Ortiz-Monasterio, J.I., S.S. Dhillon and R.A. Fischer, 1994. Date of sowing effects in
grain yield and yield components of spring wheat cultivars and their
relationship with radiation and temperature in Ludhiana, India. Field Crops Res.
37: 169-184.
Pandey, S., H. Ceballos and G. Granados, 1995. Registration of four tropical maize
populations with acid soil tolerance: SA-4, SA-5, SA-6, and SA-7. Crop Sei.
35: 1230-1231.
Peng, S.B., F.V. Garcia, R.C. Laza and K.G. Cassman, 1993. Adjustment for specific
leaf weight improves chlorophyll meter's estimate of rice leaf nitrogen
concentration. Agron. J. 85: 987-990.
Peng, S.B., G.S. Khush and K.G. Cassman, 1994. Evolution of the new plant ideotype
for increasing yield potential. In: K.G. Cassman (ed.). Breaking the yield
barrier. IRRI, Manila, Philippines, pp. 5-20.
Penning de Vries, F.W.T., A.H.M. Brunsting and H.H. van Laar, 1974. Products,
requirements and efficiency of biosynthesis: a quantitative approach. J. Theor.
Biol. 45: 339-377.
Penning de Vries, F.W.T., H. van Keulen and J.C. Luyten, 1996. The role of soil
science in estimating global food security in 2040. American Society of
Agronomy and Soil Science Society of America, Special Publication 45. pp. 17-
35.
Peterson, D.M., T.L. Housley and T.M. Luk, 1982. Oat stem vascular size in relation to
kernel number and weight. II. Field environment. Crop Sei. 22: 274-278.
Pons, T.L., T. Schieving, T. Hirose and M.J.A. Werger, 1989. Optimization of leaf
nitrogen allocation for canopy photosynthesis in Lysimachia vulgaris. In: H.
Lambers, M.L. Cambridge, H. Konings and T.L. Pons (eds.). Causes and
consequences of variation in growth rate and productivity of higher plants. SPB
Academic Publishing, The Hague, The Netherlands, pp. 175-186.
Porter, J.R., P.D. Jamieson and D.R. Wilson, 1993. Comparison of the wheat simulation
models AFRCWHEAT2, CERES-Wheat and SWHEAT for non-limiting
conditions of crop growth. Field Crops Res. 33: 131-157.
Rabbinge, R., 1986. The bridge function of crop ecology. Neth. J. Agr. Sei. 3: 329-251.
Rabbinge, R. and CT. de Wit, 1989. Systems, models and simulation. In: R. Rabbinge,
S.A. Ward and H.H. van Laar (eds.). Simulation and systems management in
crop protection. Simulation Monographs 32, Pudoc, Wgeningen, The
Netherlands, pp. 3-15.
137
References
Rabbinge, R., H.C. van Latensteijn and J. Goudriaan, 1993. Assessing the greenhouse
effect in agriculture. In: Environmental change and human health. Ciba
Foundation Symposium 175. John Wiley, Chichester, pp. 62-79.
Radley, M.E. and G.N. Thorne, 1981. Effects of decreasing the number of grains in ears
of cvs Hobbit and Maris Huntsman winter wheat. Ann. Appl. Biol. 98: 149-156.
Rajaram, S., 1995. Wheat germplasm improvement: Historical perspectives,
philosophy, objectives and missions. In: S. Rajaram and G.P. Hettel (eds.).
Wheat breeding at CIMMYT: Commemorating 50 years of research in Mexico
for global wheat improvement. Wheat special Report No. 29. Mexico, D.F.:
CIMMYT. 162 pp.
Rasmussen, D.C., 1984. Genetics and use of physiological variability in crop breeding.
In: M.B. Tesar (ed.). Physiological basis of crop growth and development.
Madison: American Society of Agronomy, pp. 291-321.
Rasmussen, D.C., 1987. An evaluation of ideotype breeding. Crop Sei. 27: 1140-1146.
Rasmussen, D.C., 1991. A plant breeder's experience with ideotype breeding. Field
Crops Res. 26: 191-200.
Rawson, H.M. and K.N. Ruwali, 1972. Ear branching as a means of increasing grain
uniformity in wheat. Aust. J. Agric. Res. 23: 551-559.
Rawson, H.M., R.M. Gifford and P.M. Bremner, 1976. Carbon dioxide exchange in
relation to sink demand in wheat. Planta (Berl.) 132: 19-23.
Rees, D., K. Sayre, E. Acevedo, T. Nava Sanchez, Z. Lu, E. Zeiger and A. Limon, 1993.
Canopy temperatures of wheat: relationship with yield and potential as a
technique for early generation selection. Wheat Special Report No. 10. Mexico,
D.F.: CIMMYT. 32 pp.
Reynolds, M.P., M. Balota, M.I.B. Delgado, I. Amani and R.A. Fischer, 1994.
Physiological and morphological traits associated with spring wheat yield under
hot, irrigated conditions. Aust. J. Plant Physiol. 21: 717-730.
Richards, R.A., 1996. Increasing yield potential of wheat: Manipulating sources and
sinks. In: M. Reynolds, S. Rajaram and A. McNab (eds.). Increasing yield
potential in wheat: Breaking the barriers. Mexico, D.F.: CIMMYT. pp. 134-
149.
Ritchie, J.T. and S. Otter, 1985. CERES-wheat: A user-oriented wheat yield model.
Preliminary documentation, AgRISTARS Publication No. YM-U3-04442-JSC-
18892.
Rossing, W.A.H. and K.L. Heong, 1997. Opportunities for using systems approaches in
pest management. Field Crops Res. 51: 83-100.
Rousseaux, M.C., A.J. Hall and R.A. Sanchez, 1996. Far-red enrichment and
photosynthetically active radiation level influence leaf senescence in field-
grown sunflower. Physiol. Plantarum 96: 217-224.
138
References
Savin, R. and G.A. Slafer, 1991. Shading effects on the yield of an Argentinian wheat cultivar. J. Agric. Sei. (Camb.) 166: 1-7.
Sayre, K.D., 1996. The role of crop management research at CIMMYT in addressing bread wheat yield potential issues. In: M. Reynolds, S. Rajaram and A. McNab (eds.). Increasing yield potential in wheat: Breaking the barriers. Mexico, D.F.: CIMMYT. pp. 203-207.
Sayre, K.D., S. Rajaram and R.A. Fischer, 1997. Yield potential progress in short bread wheats in Northwest Mexico. Crop Sei. 37: 36-42.
Schnyder, H., 1993. The role of carbohydrate storage and redistribution in the source-sink relations of wheat and barley during grain filling - A review. New Phytol. 123: 233-245.
Seemann, J.R., T.D. Sharkey, J. Wang and C.B. Osmond, 1987. Environmental effects on photosynthesis, nitrogen-use efficiency, and metabolite pools in leaves of sun and shade plants. Plant Physiol. 84: 796-802.
Setter, L.T., S. Peng, G.J.D. Kirk, S.S. Virmani, M.J. Kropffand K.G. Cassman, 1994. Physiological considerations and hybrid rice. In: K.G. Cassman (ed.). Breaking the yield barrier. Proceedings of a workshop on rice yield potential in favorable environments. IRRI, Los Bafios, Philippines, pp. 39-62.
Shiraiwa, T. and T.R. Sinclair, 1993. Distribution of nitrogen among leaves in soybean canopies. Crop Sei. 33: 804-808.
Sinclair, T.R. and CT. de Wit, 1976. Analysis of carbon and nitrogen limitations to soybean yield. Agron. J. 68: 319-324.
Sinclair, T.R. and T. Horie, 1989. Leaf nitrogen, photosynthesis, and crop radiation use efficiency: A review. Crop Sei. 29: 90-98.
Singh, B.K. and CF. Jenner, 1982. Association between concentration of organic nutrients in the grain, endosperm cell number and grain dry weight within the ear of wheat. Aust. J. Plant Physiol. 9: 83-95.
Slafer, G.A. and F.H. Andrade, 1991. Changes in physiological attributes of the dry matter economy of bread wheat {Triticum aestivum) through genetic improvement of grain yield potential at different regions of the world. A review. Euphytica 58: 37-49.
Slafer, G.A. and H.M. Rawson, 1994. Sensitivity of wheat phasic development to major environmental factors: A re-examination of some assumptions made by physiologists and modellers. Aust. J. Plant Physiol. 21: 393-426.
Slafer, G.A. and R. Savin, 1994. Source-sink relationships and grain mass at different positions within the spike in wheat. Field Crops Res. 37: 39-49.
Slafer, G.A., F.H. Andrade and E.H. Satorre, 1990. Genetic-improvement effects on pre-anthesis physiological attributes related to wheat grain yield. Field Crops Res. 23: 255-263.
139
References
Slafer, G.A., E.H. Satorre and F.H. Andrade, 1994. Increase in grain yield in bread
wheat from breeding and associated physiological changes. In: G.A. Slafer
(ed.). Genetic improvement of field crops. Marcel Dekker, Inc. New York. pp.
1-68.
Slafer, G.A., D.F. Calderini and D.J. Miralles, 1996. Yield components and
compensation in wheat: Opportunities for further increasing yield potential. In:
M.P. Reynolds, S. Rajaram and A. McNab (eds.). Increasing yield potential in
wheat: Breaking the barriers. Mexico, D.F.: CIMMYT. pp. 101-133.
Smit, A.B., 1990. Sink and source relationships in spring wheat. M.Sc.-thesis.
Wageningen Agricultural University, Dept. of Crop Science and Grassland
Husbandry. LUW-code: F350-654/150. Wageningen, The Netherlands. 55 pp.
Snyder, G.W., D.J. Sammons and R.C. Sicher, 1993. Spike removal effects on dry
matter production, assimilate distribution and grain yields of three soft red
winter wheat genotypes. Field Crops Res. 33: 1-11.
Sofield, I., L.T. Evans, M.G. Cook and I.F. Wardlaw, 1977. Factors influencing the rate
and duration of grain filling in wheat. Aust. J. Plant Physiol. 4: 785-797.
Spears, J., 1993. Forest policy research issues. FORSPA Technical Document No. GCP-
RAS-134-ASB. FAO Regional Office for Asia and the Pacific. Bangkok,
Thailand. 12 pp.
Spiertz, J.H.J., 1974. Grain growth and distribution of dry matter in the wheat plant as
influenced by temperature, light energy and ear size. Neth. J. Agric. Sei. 22:
207-220.
Spiertz, J.H.J, and H. van Keulen, 1980. Effects of nitrogen and water supply on growth
and grain yield of wheat. Proceedings of the Third International Wheat
Conference. May 22- June 3; 1980, Madrid, Spain.
Spitters, C.J.T., H.A.J.M. Toussaint and J. Goudriaan, 1986. Separating the diffuse and
direct component of global radiation and its implications for modeling canopy
photosynthesis. Part I: Components of incoming radiation. Agric. Forest
Meteorol. 38: 217-229.
Spitters, C.J.T., H. van Keulen and D.W.G. van Kraalingen, 1989. A simple and
universal crop growth simulator: SUCROS87. In: R. Rabbinge, S.A. Ward and
H.H. van Laar (eds.). Simulation and systems management in crop protection.
Simulation Monographs 32. Pudoc, Wageningen, The Netherlands, pp. 147-
181.
Stapper, M., 1984. Simulations assessing the productivity of wheat maturity types in a
Mediterranean climate. PhD-Thesis, University of New England, Armidale,
N.S.W. Australia. 313 pp.
140
References
Stutterheim, N.C., 1995. Towards higher nitrogen efficiency in European rice
cultivation; a case study for the Camargue, South of France. Ph.D.-Thesis,
Wageningen Agricultural University, the Netherlands. 94 pp.
Takahashi, T., N. Tsuchihashi and K. Nakaseko, 1993. Estimation of assimilation
activity by daily increase in water soluble sugar content in spring wheat canopy.
Jpn. J. Crop Sei. 62: 319-323.
Takeda, G., 1979. Ecological analysis of photosynthesis of barley and wheat. Jpn.
Agric.Res.Q. 13: 180-185.
Ten Berge, H.F.M., S. Qinghua, Z. Zhiming, K.S. Rao, J.J.M. Riethoven and X. Zhong,
1997. Numerical optimization of nitrogen application to rice. Part II. Field
evaluations. Field Crops Res. 51: 43-54.
Tewari, D.N., 1994. Forests and environment. International Book Distributors. Dehra
Dun. India. 307 pp.
Thiyagarajan, T.M., P. Stalin, A. Dobermann, K.G. Cassman and H.F.M. ten Berge,
1997. Soil N supply and plant N uptake by irrigated rice in Tamil Nadu. Field
Crops Res. 51:55-64.
Thorne, G.N., S.M. Thomas and I. Pearman, 1979. Effects of nitrogen nutrition on
physiological factors that control the yield of carbohydrates in the grain. In:
J.H.J. Spiertz and Th. Kramer (eds.). Crop Physiology and Cereal Breeding.
Proceedings of a Eucarpia Workshop. Pudoc, Wageningen, The Netherlands.
pp. 90-95.
Tinker, N.A., D.E. Mather, B.G. Rossnagel, K.J. Kasha, A. Kleinhofs, P.M. Haynes,
D.E. Falks, T. Ferguson, L.P. Shugar, W.G. Legge et al., 1996. Regions of the
genome that affect agronomic performance in two-row barley. Crop Sei. 36:
1053-1062.
Toledo, J.M., R.S. Zeigler, F. Torres, 1991. Sustainable utilization of poor acid soils of
tropical America. In: Soil constraints on sustainable plant production in the
tropics. Proceedings of the 24th International Symposium on Tropical
Agriculture Research, Kyoto, August 14-16, 1990. Tropical Agriculture
Research Series, No. 24. pp. 133-145.
Umali, D.L., 1993. Irrigation-induced salinity. A growing problem for development and
the environment. World Bank Technical Paper. 1993, No. 215. World Bank,
Washington, USA. 78 pp.
Van Dijk, W. and J.J.R. Groot, 1987. De relatie tussen stikstofgehalte en
fotosynthesesnelheid bij wintergerst {Hordeum vulgare). CABO-verslag nr. 74.
AB-DLO, Wageningen, The Netherlands. 54 pp.
Van Ginkel, M., D.S. Calhoun, G. Gebeyehu, A. Miranda, C. Tian-you, R. Pargas-Lara,
R.M. Trethowan, K. Sayre, J. Crossa and S. Rajaram, 1997. Plant traits related
141
References
to yield of wheat in early, late or continuous drough conditions. In: Proceedings
of the 5th International Wheat Conference, Ankara, Turkey, (in press).
Van Heemst, H.D.J., 1988. Plant data values required for simple crop growth simulation
models: review and bibliography. Simulation Report CABO-TT nr. 17.
Wageningen, The Netherlands. 100 pp.
Van Ittersum, M.K. and R. Rabbinge, 1997. Concepts in production ecology for
analysis and quantification of agricultural input-output combinations. Field
Crops Res. 52: 197-208.
Van Keulen, H., 1986. Crop yield and nutrient requirements. In: H. van Keulen and J.
Wolf (eds.). Modelling of agricultural production: weather, soils and crops.
Simulation Monographs. Pudoc, Wageningen, The Netherlands, pp. 155-181.
Van Keulen, H. and N.G. Seligman, 1987. Simulation of water use, nitrogen nutrition
and growth of a spring wheat crop. Simulation Monographs. Pudoc,
Wageningen. The Netherlands. 310 pp.
Vergara, B.S., B. Venkateswarlu, M. Janoria, J.K. Ahn, J.K. Kim and R.M. Visperas,
1991. Rationale for a low-tillering rice plant type with high-density grains. In:
Direct seeded flooded rice in the tropics. Selected papers from the International
Rice Research Conference, 27-31 Aug. 1990, Seoul, Korea. IRRI, Manila,
Philippines, pp. 39-53.
Versteeg, M.H. and H. van Keulen, 1986. Potential crop production prediction by some
simple calculation methods, as compared with computer simulation. Agr. Syst.
19: 249-272.
Vong, N.Q. and Y. Murata, 1977. Studies on the physiological characteristics of C3 and
C4 crop species I. The effects of air temperature on the apparent photosynthesis,
dark respiration, and nutrient absorption of some crops. Jpn. J. Crop Sei. 46: 45-
52.
Waddington, S.R., J.K. Ransom, M. Osmanzai, D.A. Saunders, 1986. Improvement in
the yield potential of bread wheat adapted to northwest Mexico. Crop Sei. 26:
698-703.
Wardlaw, I.F., 1970. The early stages of grain development in wheat: response to light
and temperature in a single variety. Aust. J. Biol. Sei. 23: 765-774.
Wardlaw, I.F., I.A. Dawson and P. Munibi, 1989. The tolerance of wheat to high
temperatures during reproductive growth. II: Grain development. Aust. J. Agric.
Res. 40: 15-24.
Welles, J.M., 1990. Some indirect methods of estimating canopy structure. Remote
Sensing Reviews 5: 31-43.
Welles, J.M. and J.M. Norman, 1991. Instrument for indirect measurement of canopy
architecture. Agron. J. 83: 818-825.
142

References
Whitfield, D.M. and C.J. Smith, 1989. Effects of irrigation and nitrogen on growth, light
interception and efficiency of light conversion in wheat. Field Crops Res. 20:
279-295.
Wolf, J., 1986. Reclamation. In: H. van Keulen and J. Wolf (eds.). Modelling of
agricultural production: weather, soils and crops. Simulation Monographs,
Pudoc, Wageningen, The Netherlands, pp. 309-325.
Wolf, J. and CA. van Diepen, 1995. Effects of climate change on grain maize yield
potential in the European Community. Climate Change 29: 299-331.
Wood, C.W., D.W. Reeves, R.R. Duffield and K.L. Edmiston, 1992a. Field chlorophyll
measurements for evaluation of corn nitrogen status. J. Plant Nutr. 15: 487-500.
Wood, C.W., P.W. Tracy, D.W. Reeves and K.L. Edmiston, 1992b. Determination of
cotton nitrogen status with a hand-held chlorophyll meter. J. Plant Nutr. 15:
1435-1448.
Whingwiri, E.E., J. Kuo and W.R. Stern, 1981. The vascular system in the rachis of a
wheat ear. Ann. Bot. 48: 189-201.
Wright, G.C. and G.L. Hammer, 1994. Distribution of nitrogen and radiation use
efficiency in peanut canopies. Aust. J. Agric. Res. 45: 565-574.
WRR, 1992. Ground for choices. Four perspectives for the rural areas in the European
Community. Netherlands Scientific Council for Government Policy. Reports to
the Government 42. Sdu Uitgeverij, 's Gravenhage. 144 pp.
WRR, 1995. Sustained risks: a lasting phenomenon. Netherlands Scientific Council for
Government Policy. Reports to the Government 44. Sdu Uitgeverij, 's
Gravenhage. 205 pp.
Xu, Q.A., A.Q. Paulsen, J.A. Guikema and G.M. Paulsen, 1995. Functional and
ultrastructural injury to photosynthesis in wheat by high temperature during
maturation. Environ. Exp. Bot. 35: 43-54.
Yoshida, S., 1972. Physiological aspects of grain yield. Ann. Rev. Plant Physiol. 23:
437-464.
Zadoks, J .C, T.T. Chang and CF. Konzak, 1974. A decimal code for the growth stages
of cereals. Weed Res. 14: 415-421.
Zee, S.Y. and T.P. O'Brien, 1971. Vascular transfer cells in the wheat spikelet. Aust. J.
Biol. Sei. 24: 35-49.
143
Curriculum vitae
Prem (Premchand Soebhaschander) Bindraban was born in Paramaribo, Surinam on October 9th, 1965 and came to the Netherlands in 1975. In 1983, he finished his secondary education (HAVO) in Schoonhoven and entered the Agricultural College at the Rijks Hogere Landbouwschool Deventer. In 1984, he passed the propaedeutic examination and also obtained VWO-certificates for physics and chemistry. The Ministry of Education then approved his entrance to the Wageningen Agricultural University (WAU). Major areas of education were on crop production, soil-fertility and -physics, and socio-economic aspects of agricultural production. In 1988 he visited Indonesia during eight months for his practical training. In 1990, he graduated in tropical crop science with strong emphasis on systems analytical approaches. After graduation he did an exploratory study on rice production in the undulating landscapes of West-Africa at the Winand Staring Center (SC-DLO). In 1991 he joined, on the Philippines, the collaborative project on Simulation and Systems Analysis in Rice Production (SARP) of the Center for Agrobiological Research (AB-DLO), the Department of Theoretical Production Ecology (TPE-WAU) and the International Rice Research Institute (IRRI) for transfer of knowledge on systems approaches to scientist in rice production in Asian countries. In 1992 he was assigned at AB-DLO to assess world food production potentials for the Dutch Scientific Council for Government Policy (WRR). In 1993 he assumed a four-year position to conduct his Ph.D. research (AIO), which is described in this thesis, at TPE-WAU in collaboration with the International Maize and Wheat Improvement Center (CIMMYT, Mexico). For three years (1993-1996) he was posted at CIMMYT. In 1997 he assumed a position as assistant professor on crop ecology at TPE-WAU.
145