Helminthosporium Blights of Wheat - CIMMYT Publications ...
389
-
Upload
khangminh22 -
Category
Documents
-
view
0 -
download
0
Transcript of Helminthosporium Blights of Wheat - CIMMYT Publications ...


Helminthosporium
Blights of Wheat:"
Spot Blotch and Tan Spot
Proceedings of an International
Workshop Held at CIMMYT
EI Batan, Mexico
E. Duveiller, H.J. Dubin, J. Reeves, and A. McNab, editors
9 • 14 February 1997
,CIMMYT
Sustain ableMaize and Wheat
Sys tems for the Poor
ti\\~
UCLUniversitécatholiquede Louvain
This international workshop was organized by CIMMYT incollaboration with the Unité Phytopathologie, Université Catoliquede Louvain (UCL), Louvain-Ia-Neuve, Belgium, and with support fromthe Belgian Administration of Development Cooperation (BADC).
CIMMYT is an internationally funded, nonprofit scientific research and training
organization. Headquartered h,1 Mexico, the Center works with agricultuql1 research
institutions worldwide to improve the productivity and sustainability of maize and wheat
systems for poor farmers in developing countries. It is one of 16 similar centers supported
by the Consultative Group on International Agricultural Research (CGIAR). The CGIAR
comprises over 50 partner countries, international and regional OJ:ganizations, and private
foundations. It is co-sponsored by the Food and Agriculture Organization (FAO) of the
United Nations, the International Bank for Reconstruction and Development (World Bank),
the United Nations Development Programme (UNDP), and the United Nations
Environment Programme (UNEP).
Financial support for CIMMYT's research agenda currently comes from many sources,
induding the governments of Australia, Austria, Belgium, Canada, China, Denmark,
France, Germany, India, Iran, Italy, Japan, the Republic of Korea, Mexico, the Netherlands,
Norway, the Philippines, Spain, Switzerland, Thailand, the United Kingdom, and the
United States, as well as the European Union, the Ford Foundation, the Inter-American
Development Bank, the Kellogg Foundation, the OPEC Fund for International
Development, the Rockefeller Foundation, the Sasakawa Africa Association, UNDP, and the
World Bank.
Correct citation: Duveiller, E., H.J. Dubin, J. ~eeves, and A. McNab, eds. 1998.
Helminthosporium Blights of Wheat: Spot Blotch and Tan Spot. Mexico, D.E: CIMMYT.
ISBN: 97D-648-'lOl-3
AGROVOC descriptors: Wheats; Triticum; Spring crops; Plant breeding; SeleCtion;
Inoculation methods; Molecular genetics; Helminthosporium; Bipolaris; Spots; Blotches;
Blights; Toxins; Plant diseases; Pathogens;Diagnosis; Disease control; Disease resistance;
Cropping systems; Trials; Research projects; Argentina; Australia; Bangladesh; Belgium;
Bolivia; Canada; China; Hungary; India; Mexico; Manitoba; Morocco; Nepal; Paraguay;
United Kingdom; Uruguay; Yemen; Asia; South Asia; Viet Nam; CIMMYT
AGRIS category codes: H20 Plant Diseases
F30 Plant Genetics and Breeding.
Dewey decimal classification: 663.1194
More information on CIMMYT is available over the Internet at http://www.cimmyt.mx orhttp://WWlv.cgiar.org
iii
Table of Contentsvii Foreword
1 Helminthosporium Diseases of Wheat: Summary of Group Discussions andRecommendationsE. Duveiller, M. van Ginkel, and J. Dubin
6 Evolution of the Nomenclature Used for Helminthosporium spp. Causing LeafBlight of WheatH. Maraite
10 Crop Management and Breeding for Control of Pyrenop1wra tritici-repentis CausingYellow Spot of Wheat in AustraliaR. Loughman, RoE. Wilson, J.E. Roake, G.J. Platz, R.G. Rees, and F.W. Ellison
18 Constraints on the Integrated Management of Spot Blotch of WheatY.R.Mehta
28 Components of the Tan Spot Disease CycleL. Francl
37 Leaf Blight Diseases and Associated Soilborne Fungal Pathogens of Wheat in Southand Southeast AsiaE.E. Saari
52 Foliar Blights of Wheat in India: Germplasm Improvement and Future Challengesfor Sustainable, High Yielding Wheat ProductionS. Nagarajan and J. Kumar
59 Distribution of Pathogens Causing Foliar Blight of Wheat in India andNeighboring CountriesR.V. Singh, A.K. Singh, and S.P. Singh
63 Occurrence and Significance of Spot Blotch in BangladeshKoB. Alam, S.P. Banu, and M.A. Shaheed
67 Disease Incidence and Yield Loss Due to Foliar Blight of Wheat in NepalK.K. Shrestha, R.D. Timila, B.N. Mahto, and H.P. Bimb
73 Tan Spot in Western CanadaM.R. Fernandez, R.M. DePauw, J.M. Clarke, R.P. Zentner, and B.G. McConkey
80. Diseases Caused by Bipolaris sorokiniana and Drechslera tritici-repentis in HungaryJ. Bakonyi, L Aponyi, and G. Fischl
88 Population Structure and Epidemiology of Bipolaris sorokiniana in the Rice-WheatCropping Pattern of NepalM. Ruckstuhl
107 Tan Spot in Central AsiaE.N. Postnikova and B.A. Khasanov

iv
114 Breeding for Foliar Blight Resistance in Heilongjiang Province, ChinaXiao Zhimin, Sun Lianfa, and Xin Wenli '
119 Incidence and Current Management of Spot Blotch of Wheat in ChinaChang Naitao and Wu Yousan
126 Spot Blotch and Tan Spot of Wheat in ParaguayL.Q. de Viedma and M.M. Kohli
134 Research on Pyrenophora tritici-repentis Tan Spot of Wheat in UruguayM. Dfaz de Ackermann and M.M. Kohli
142 Improving Control of Tan Spot Caused by Pyrenophora tritici-repentis in the MixtecaAlta of Oaxaca, MexicoL. Osorio A., I. Garcia A., F. Lopez E, and E. DuveiIIer
146 Importance of Spot Blotch Caused by Bipolaris sorokiniana in BoliviaJ. Toledo B. and E. Guzman A.
150 Major Foliar Diseases of Triticale in MoroccoA. EI Harrak, M. Mergoum, and E. Saadaoui
157 Effect of Crop Rotation and Straw Mulch Inoculation on Tan Spot and Root Rot inBread and Durum WheatN. Nsarellah and M. Mergoum
162 Breeding for Resistance to Spot Blotch in Wheat: Global PerspectiveM. van Ginkel and S. Rajaram
171 Evaluating Spot Blotch Resistance of Wheat: Improving Disease Assessment underControlled Conditions and in the FieldE. DuveiIler, I. Garcia, J. Franco, J. Toledo, J. Crossa, and F. Lopez
182 Results of the South Asia Regional Helminthosporium Leaf Blight and YieldExperiment, 1993-94H.J. Dubin, B. Arun, S.N. Begum, M. Bhatta,R. Dhari, L.B. Goel, A.K. Joshi,B.M. Khanna, P.K. Malaker, D.R. Pokhrel, M.M. Rahman, N.K. Saha, M.A.Shaheed, R.e. Sharma, A.K.Singh, R.M. Singh, R.V. Singh, M. Vargas, and P.e.Verma
188 Breeding for Resistance to Helminthosporium Blights in Nepal: Strategies andGenetic GainsM.R. Bhatta, D.R. Pokharel, R.N. Devkota, H.J. Dubin, A. Mudwari, H.P. Bimb,B.R. Thapa, B.P. Sah, and D. Bhandari
196 Resistance to Spot Blotch in Spring Wheat: Breeding and Genetic StudiesR. e. Sharma, H. J. Dubin, M. R. Bhatta, and D. R. Pokharel
197 Effect of Single D-Genome Chromosome Substitutions from Bread Wheat on SpotBlotch Resistance of Hexaploid TriticaleW.H. Pfeiffer, E. DuveiIler, A.J. Lukaszewski, M. Mergoum, and J. Crossa
202 Repeatability of Tan Spot Resistance Evaluation in WheatX. Zhang, S.D. Haley, and Y. Jin
v
206 New Approach for Clustering Breeding Genotypes Using Production Variables,Yield Losses, and a Double-Digit Disease ScaleJ. Franco, E. Ouveiller,J. Crossa, and I. Garcia
213 Screening Wheat for Bipolaris sorokiniana Resistance in VietnamT.O. Minh, T.O. Long, and T.T. Ngu
218 Tan Spot Resistance in Tetraploid and Hexaploid WheatH. Ma, G.R. Hughes, and Wenguang Cao
223 Novel Genetic Diversity for Stress Tolerance in the Triticeae: Strategic Avenues andApplied PotentialsA. Mujeeb-Kazi
230 Evaluating Southern Cone Wheat Germplasm for Spot Blotch and Tan SpotM.M. Kohli and M. Oiaz de Ackennann
241 Variation in Resistance to Bipolaris sorokiniana and Magnaporthe grisea in WheatPlants Regenerated through EmbryogenesisY.R.Mehta
246 Evaluating Spot Blotch Resistance Traits in Wheat and Related SpeciesChang Naitao, Jia Xianlu, Gao Zenggui, Wu Wui, Liu Weizhi, and Wu Yousan
253 In vitro Selection for Spot Blotch Resistance in WheatChang Naitao, Gao Zenggui, Jia Xianlu, Wu Wei, and Wu Youban
259 Identification and Inheritance of Resistance to Foliar Blight of WheatO. Singh, R.V. Singh, A.K. Singh, andB.N. Singh
263 Root Rot of Wheat: Inoculation and Screening Techniques, Yield Loss Assessment,and Germplasm EvaluationM. Mergoum, J.S. Quick, J. Hill, N. Nsarellah, M. Nachit, and W.H. Pfeiffer
277 Transformation Technologies Available for Enhancing Fungal Resistance in WheatS. Fennell, N. Bohorova, S. McLean, M. van Ginkel, S. Rajaram, and O.Hoisington
282 Molecular Analyses of Toxin(s) Produced by Pyrenoplwra tritici-repentisL.M. Ciuffetti, R.P. Tuori, and J.M. Gaventa
288 Role of Host Metabolism in Action of Necrosis Toxin from Pyrenoplwra triticirepentisJ.B. Rasmussen
293 Fungi Associated with Foliar Blight of Wheat in Warm AreasH. Maraite, T. Oi Zinno, H. Longree, V. Oaumerie, and E. Ouveiller
301 Characterization of the Pyrenoplwra tritici-repentis Necrosis Toxin and a FoldingPrecursorS.W. Meinhardt and H.P. Zhang
vi
302 Diversity of Pyrenophora tritici-repentis Isolates from Warm Wheat Growing Areas:Pathogenicity, Toxin Production, and RAPD AnalysisT. Di Zinno, H. Longree, and H. Maraite
312 Role of Root Exudates and Toxins in Susceptibility of Yemeni Wheat Varieties toCochlioboltts sativusA.A. Hassan and E. Hack
313 Characterization of Cochliobolus sativus Isolates from the UK and YemenE. Hack, K. Emami, and A.A. Hassan
314 A Xylanase Gene from Cochliobolus sativusK. Emami and E. Hack
322 Leaf Spot Diseases of Wheat in a Conservation Tillage StudyJ.M. Krupinsky, A.D. Halvorson, and A.L. Black
327 Control of Leaf Blights of Wheat by Elimination of the Inoculum SourceE.M. Reis, e.A. Medeiros, and R.T. Casa
333 Incidence and Severity of Leaf-Spotting Diseases of Spring Wheat in SouthernManitoba.J. Gilbert, S.M. Woods, and A. Tekauz
339 Tan Spot of Wheat in Argentina: Importance and Disease Management StrategiesJ.G.Annone
346 , Influence of Agronomic Practice on Foliar Blight, and Identificatien of AlternateHosts in the Rice-Wheat Cropping-SystemR.V. Singh, A.K. Singh, R. Ahmad, and S.P. Singh
349 Eval~ation of Tan Spot Research in MoroccoN. Nsarellah and N. Boulif
354 Controlling Leaf Spot of Wheat through Nutrient ManagementI. Hossain
359 Phytosanitary Effect of the Combined Application of Green Manure andAntagonistic Bacterium Bacillus subtilis on Bipolaris sorokinianaA.K. Nikonorova
364 Seed Pathology of Tan SpotG.C. Bergstrom and A.M.e. Schilder
369 Wheat Reaction to Kernel Infection by Pyrenophora tritici-repentis and Effect on theSubsequent CropM.R. Fernandez, J.M. Clarke, R.M. DePauw, and S.L. Fox
374 List of Participants

Foreword
Over the last 30 ye~rs, in developing countries, the outstanding advancesin wheat productivity attained by CIMMYT and its partners have contributedgreatly to the well-being of millions of people. As growing numbers offarmers have taken advantage of new, superior wheat varieties, wheat hasbeen introduced into warmer areas where it was not previously planted or hasbeen grown in increasingly complex, intensive farming systems in thedeveloping world's traditional wheat growing areas.
These changing circumstances for wheat production have brought newchallenges for farmers, including the increased incidence ofhelminthosporium blights of wheat: spot blotch, caused by Bipolarissorokiniana, and tan spot, caused by Pyrenophora tritici-repentis. In South Asia'sintensive rice-wheat cropping systems, particularly in the heaVily populatedeastern Gangetic Plains, spot blotch has become the major disease constraint.In reduced tillage cropping systems, tan spot is an increasingly importantconcern, as the pathogen survives on crop residues and alternate hosts. Tocomplicate matters, these diseases may occur together in the field, where theyare often very difficult to distinguish from one another. For this reason,-it isdesirable to study their incidence and control together.
The complexity of these nontraditional wheat diseases and of theconditions in which they occur makes it essential for us to seek a holisticapproach for their control. Such an approach includes breeding for durabledisease resistance; developing appropriate crop management practices,including nutrient applications; monitoring pathogen diversity; and applyingrecent advances in biotechnology to overcome disease losses. In addition,researchers need to develop a better understanding of the cropping systemsand the many interactions that can influence the spread of disease. Betterprotocols for ensuring the production of healthy seed are needed as well.
To strengthen research partnerships directed at reducing yield losses tothese diseases, and to foster a more holistic view of potential strategies fordisease control, CIMMYT organized an international workshop,
Helminthosporium Blights of Wheat, at its headquarters in Mexico from 9 to14 February, 1997. Sponsored by the Belgian Administration for DevelopmentCooperation and CIMMYT, in close collaboration with the University ofLouvain, Belgium, this workshop was an important component of a larger,collaborative research project on nonspecific foliar pathogens of wheat.
vii

viii
The meeting assembled key researchers from the national agriculturalresearch systems of developed and developing nations to review recentadvances in pathology and breeding for resistance to spot blotch and tanspot of wheat. Fifty-fo~ participants from 21 cou~tries attended theworkshop; participants represented most of the wheat-growing areas wheretan spot and spot blotch limit yields. The workshop enabled researchers tobring each other up to date on the global incidence of foliar blights causedby B. sorokiniana and P. tritici-repentis, particularly in South Asia's ricewheat system and under reduced tillage. Research results were presentedand discussed, future research collaborations defined, and networkingactivities strengthened, all with the goal of obtaining better disease control.
This proceedings documents the results of a unique opportunity forCIMMYf scientists and their colleagues to exchange information on thesetwo important diseases. The papers and workshop discussions presentedhere should provide a useful record for workshop participants. Theproceedings also should prove to be a valuable reference for scientists whocould not attend these meetings, researchers who work to reduce grainlosses in the warmer production areas of developing countries, and theircounterparts in.other parts of the world.
Sanjaya RajaramDirector
CIMMYT Wheat Program
1
Helminthosporium Diseases of Wheat:Summary of Group Discussions andRecommendations
E. Duveiller, M. van Ginkel, and J. DubinCIMMYT, Mexico, D.P., Mexico
Introduction
Four working groups were formed on
the last day of the conference tobrainstorm on the different topics raised
during the presentations. The topicsdiscussed were: pathogen variability,disease scoring, the effect of croppingpractices, and breeding methodologies
including breeding strategy andmultilocation testing. The final goalswere to reach an agreement on research
needs in relation to spot blotch and tanspot, harmonize research methodologies,and ultimately define a set of
recommendations for the coming years.The workshop gave scientists fromNARSs in regions whereHelminthosporium diseases of wheat are a
constraint a unique opportunity toexchange research ideas with other
scientists, and to update the informationon those diseases. This forum, attended
by scientists working on foliar blights in
21 countries, will help to refineCIMMYT's future strategy for better
control of these diseases in partnership
with NARSs and advanced researchcenters. A summary of group discussions
and final recommendations is presented.
Pathogen Variability
It was agreed that CIMMYT's
Helminthosporium Monitoring Nursery(HMN) should continue. Particular
attention must be given to the inclusionof differential entries and a core ofgenotypes maintained over years in order
to monitor pathogenicity changes. Thenursery should contain a maximum of 20entries with sources of resistance to both
Bipolaris sorokiniana and Pyrenophoratritici-repentis. Scoring time is importantfor comparing results among locations.Concerns were raised about how to
include results in a database formaximum global access.
A working group would be useful toexchange information on inoculation
methods since the standardization of
experimental conditions appears to limitextensive screening for spot blotch and
tan spot resistance under controlled
conditions. Information on growingconditions and inoculation techniques
needs to be more widely exchanged, and
conducting a "ring test" among severalscientists using the same methods was
proposed to evaluate trial repeatability
among laboratories.
2 E. Duveillar, M. van Glnkal, and J. Dubin
Globakstudies on pathogen
populations are needed to anticipatefuture breeding requirements because
pathogenic specialization may change
over time and across locations. CIMMYTplays an important role in catalyzingsample collections on a worldwide scale.
It is important that this effort continue
and a wide range of strains be studied.During the last five years, a global
collection of strains has been qlaintainedin Belgium and is easily accessible.
However, additional funding is requiredto continue research on strain diversity. Asmaller group of scientists showed
specific interest in analyzing the effect ofstorage conditions (using mineral oil orlyophilization) on strain variation and
pathogenicity.
Disease Scoring
It is desirable but not always easy toreach a consensus on scoring approach.
Various approaches were discussed.Lesion size may be useful in somesituations. The advantage of the double
digit scale is that the individualcomponents are used to produce an
index. This approach, extensively used bysome researchers, is quick and easy.
Percentage diseased leaf area can be used
as a parameter or to calculate the AUOPC(area under disease progress curve). It is
easy to teach, to manipulate
mathematically, and to analyze. This
scoring method is the most universally
applicable and particularly useful for
comparing epidemic severity across
locations and seasons, provided that
similar checks are used. On the otherhand, it is time consuming. The 00-99
. double digit scale. will ptopably. continue
to be used for rapid screening.
Wl\enadult headS~l'eevaluated; a
scale such as "lesion type" can be usedquite effectively, particularly under
controlled cooditions. Simple percentage
assessment and the 0-9 scale are probablythe most realistic methods but the
complication of black chaff in samples
may reqUire the grain to be directlyassessed.
Since spot blotch and tan spotdiseases may occur as a complex withinnurseries and across genotypes, it is
important to include differentialgenotypes in the nursery that may help to
determine which pathogen prevails ineach environment.
The most useful parameters forselection are yield with and withou,t
disease control (for tolerance/intoleranceevaluation), and grain weight. In someenvironments, however, tolerance may be
difficult to assess. The complicationcomes from the fact that highly
susceptible check lines may not respondwell to fungicide control and thus
confound tolerance estimates. It is
important to have appropriate checks incontrol plots and to be aware of
agronomic influences. It is most
important to include in the breeding
material check varieties that range in
maturity and height.
If any scoring adjustment in terms of
maturity is going to be made, disease
should be contrasted within differentmaturity categories. It would be useful to

Helminthosporlum Diseases of Wheet: Summery of Group Discussions and Recommendetlons 3
have a physiologically relevant growthstage scale that has some arithmeticrelationship with thermal time.
Tan spot toxins may be used fordisease scoring, but the problem with thisapproach is that the toxin has to beinfiltrated and there is no other approachat present. The necrosis toxin isqualitative and so gives only a plus-minusresponse; thus, it car. give a good idea ofone gene interaction. In expert hands and
with the appropriate equipment" 150inoculations by infiltration can beperformed per hour. At present, thechlorosis toxin appears to be important;however, addition'll information isneeded. Another suggestion is to makesome of these assays quantitative andprotoplast assays with electrolytesIeaI<ageshould-beCcmsicie~;d,~lthough
this may be quite intensive in terms ofresources.
Resistance genes are expected to betagged in the next 10 years. To beworthwhile, molecular screening shouldbe done simultaneously for several genes,In the case of tan spot, the necrosis toxinresistance gene should be tagged first,and then others that may be related toinfection frequency and other parameters.They can be useful if combined in thesame molecular screening.
Glasshouse evaluation and advancingthe material in a glasshouse are useful.Australia's infection type approach can i:>efollowed, but measuring the percentage of
diseased leaf area is also useful. If yourely on codes where leaf necrosis isimportant, a standardized way of
applying inoculum is needed. Also, in thegreenhouse, screening using the toxindirectly is feasible, or the pathogen can beinoculated on one leaf and toxininfiltration done on another leaf.
Effect of CroppingPractices
Cropping systems, crop rotations, andtillage conditions are so variable that oneof the first things to be done to measurethe effect of cropping practices on foliarblights is to standardize procedures forassessing the diseases. This includes, first,an evaluation of the seed status, forinstance, using the freezing blotter test.Once this is status is known, a fungicideseed treatment can be used. Disease
incidence is assessed bY:obsenrins-the _top two leaves. Disease severity shouldbe assessed whenever possible, butmembers of the discussion groupindicated that it is not feasible in somelocations.
Pathogen identification remainsimportant because clear and uniquesymptoms are not always caused by aparticular fungus. Root rot, caused by B.sorokiniana, should be evaluated onpulled plants at the soft dough stage,using Tinline's method published inCanada. At harvest time, evaluation canbe standardized by using the freezingblotter test to see if there is any carryoverof pathogen at the seed level. An
alternative would be to use trap cultivarsto help monitor conidia productionduring the season. Other crops can also
be used as traps and taken back to thegreenhouse for evaluation.

4 E. Duvelller, M. van Glnkel, and J. Dubin
Long term agronomic studies have
been conducted in some countries, butoften the pathologists have not been
involved in these trials. It is important to
quantify the impact of cropping practiceson di!!ease incidence. This does not
require additional resources or much
extra effort. These are ready-made trialsfor assessing foliar blights and the effects
of agronomic practice on disease.
Another approach is to look at
fertilizer effects; more research is neededto understand the'relationship betweensoil fertility and foliar blight
development using standardizedmethods. Conservation tillage studiesshould include assessment of disease
development to identify appropriatecropping-practices and to define - '--""
germplasm improvement needs under
these practices. Also, the effect of legumesor crucifers in some wheat-basedcropping systems needs to be evaluated,
as these crops may affect disease pressureand may playa significant role in localeconomies where foliar blights areincreasing. In general, the role of
alternative hosts in pathogen survivalshould be better understood. Biological
control should be considered, since there
are successful examples with take-all,caused by Gaumannomyces graminis.
Finally, the movement of infectedseed should be minimized, and nurseries
for spot blotch resistance screening
should be multiplied in a clean area.
Breeding Methodologies
Breeding strategyThe names of both diseases, spot
blotch and tan spot, and their causalpathogens are confusing to breeders, who
feel that names of diseases and pathogensshould be clarified and standardized.
The breeding strategy for spot blotchneeds to rely on the infusion of resistancefrom alien species such as Triticum tauschii(Ae. squarrosa) and Thinopyrumcurvifolium. Selection for spot blotchresistance must be combined with heat
tolerance. There is a need for testing atkey sites (at least 5-10) in order to identifysuitable parental material and to
exchange advanced~and segregating
materials wHhgood agronomic type and
high resistance levels.
Tan spot and leaf rust resistance needto be combined; however, a better
understanding of the relationshipbetween tan spot development and zerotillage is needed to make breeding for this
resistance more efficient. To developwheat populations with the desirablecharacters, the use of backcrosses and
multiple crosses will be mostadvantageous, as well as understandingthe correlation between greenhouse and
field testing.
MultllocatlontestlngShuttle breeding has been successful
at CIMMYT and at national centers. It
should continue to be emphasized, along
with the exchange of germplasm and
information on a regional and global

Helminthosporium Diseases of Wheat: Summary of Group Discussions and Racommendations 5
scale. Initiating a newsletter has been
proposed. The exchange of parental andsegregating materials not only from
CIMMYT but also from national
programs should be further encouraged.Key sites and key checks should be
identified based on the last HMN,already available at CIMMYT.
Recommendations of theWorking Groups
• A short note on the names andtaxonomy of pathogens causing spotblotch'and tan spot will be included
at the beginning of theseproceedings. The name B. sorokinianafor the spot blotch pathogen seems
appropriate, given that theanamorph plays the main role innature. Similarly, since theteleomorph is effective during the
disease cycle, P. tritici-repentis shouldbe used for tan spot.
• There is a need to develop a set of lOIS CIMMYT lines, plus others, inorder to monitor helminthosporiumblights. The HMN must continue at
key sites and emphasis should be puton accurate scoring.
• Assessment of diseased leaf area isthe most accurate way to evaluatedisease severity and should be
recommended.
• Developing a database on pathogensis becoming necessary, and globalstudies on pathogen virulence are
needed.
• Research on the effect of zero andreduced tillage on disease
development is needed.
• Integrated approaches to limitdisease spread need to be studied,
and more pathology studies of long
term trials have to be conducted tounderstand the effect of soil fertility
and cropping practice on foliarblights.
• Testing for foliar blight needs to bestandardized.
• Multilocation testing is critical. Moreeffort should be invested in testing
segregating material and sharing
earlier~generation material.
• Genetic marker studies should beencouraged to identify andunderstand the genetics of resistance
to spot blotch and tan spot.
• Human resource development andtraining are critical to increase thecapacity of NARSs to better controlfoliar blights of wheat.
It is proposed that a working group
on helminthosporium blights of wheat be
formed to further exchange informationon spot blotch and tan spot.
6
Evolution of the Nomenclature Used forHe/minfhosIJorium spp. Causing LeafBlight of Wheat
H. Maraite
Unite de Phytopathologie, Universite catholique de Louvain, Louvain-Ia-Neuve,
Belgium
AbstractThis paper reviews the evolution in nomenclature ofHelminthosporiurn sativurh
Pammel, King & Bakke to Cochliobolus sativus (Ito & Kurib.) Drechsler ex Dastur, anamorphBipolaris sorokiniana (Sacc.) Shoem., and ofH. tritici-repentis Drechsler to Pyrenophoratritici-repentis (Died.) Drechsler, anamorph Drechslera tritici-repentis (Died.) Shoem.
The names Helminthosporium sativumand Helminthosporium tritici-repentis arestill widely used for the fungi that causespot blotch and tan spot of wheat,respectively. This is despite the fact that
Shoemaker (1959) consideredHelminthosporium an illegitimateorthographic variant of Helmisporium 'Link ex S.P. Gray (meanwhile nomenrejiciendum) and in 1959 already proposedthe anamorph names actually
recommended for graminicolousHelminthosporium species, which includethe fungi associated with leaf blight of
wheat. This is due, on one hand, to adeep-rooted attachment of plant
pathologists to the name
Helminthosporium linked to importanttextbook diseases and, on the other hand,
to the difficulty and reluctance to follow
the never ending discussions ofsystematists and changes in taxonomy
and nomenclature. Meanwhile, however,
some of these changes have become
widely adopted and, in order to favor
mutual understanding, it is wise to reach
a consensus on using the same name forthe same organism. The aim of this paper
is to briefly explain the reasons behindthe numerous revisions and to unravelthe nomenclatural evolution in this groupof fungi for plant pathologists. Sivanesan(1987) and Alcorn (1988) provided useful
reviews of the taxonomy of thegraminicolous hyphomycetes placed inthe genus Helminthosporium and theirteleomorphs.
The graminicolous Helminthosporiumdiffer fundamentally from the species
type H. velutinum Link:S.F.Gray. Conidiaare singly formed through a pore at the
apex of the conidiophore, which resumes
growth by sympodial extension from thesub-apical region. This leads to a
geniculate conidiophore at the site ofconidiogenesis. A scar surrounds the pore
through which the conidium is produced.
For H. velutinum, the conidiophores are
straight or flexuous and produce conidia
through small pores in the walls of distaland intercalary cells. The conidia are
Evolution of the Nomenclature Used for He/mlnthosporium spp. Causing Leaf Blight of Wheat 7
formed laterally, often in verticels belowsepta, while the conidiophore is
elongating at the apex. Conidia bear a
conspicuously darkened hilum but there
are no corresponding scars on theconidiophore at the sites of conidium
production (Alcorn 1988). These
differences have justified the renaming ofthe graminicolous Helminthosporiumspecies.
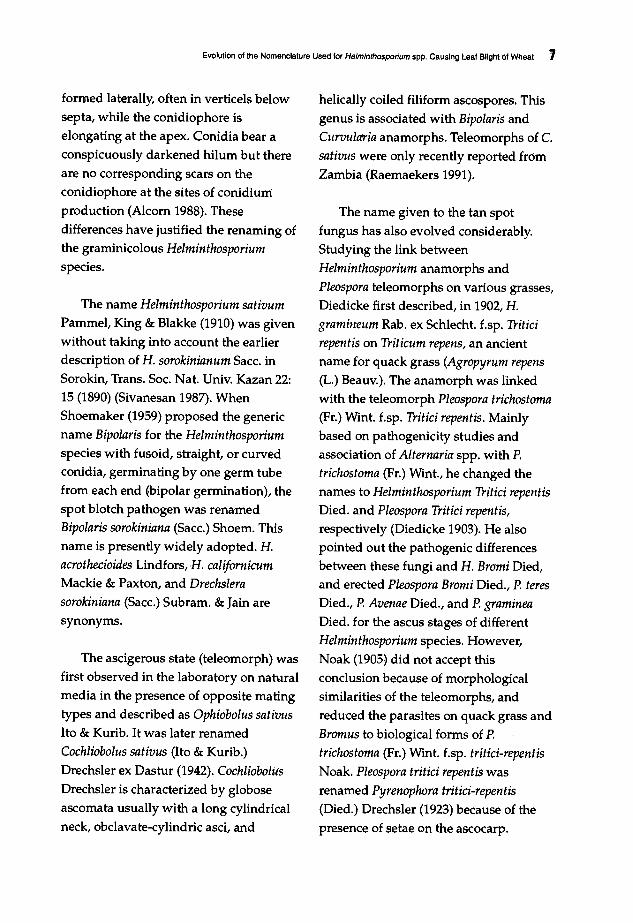
The name Helminthosporium sativumPammel, King & Blakke (1910) was given
without taking into account the earlierdescription of H. sorokinianum Sacco inSorokin, Trans. Soc. Nat. Univ. Kazan 22:
15 (1890) (Sivanesan 1987). WhenShoemaker (1959) proposed the genericname Bipolaris for the Helminthosporiumspecies with fusoid, straight, or curvedconidia, germinating by one germ tubefrom each end €bipolar germination), thespot blotch pathogen was renamedBipolaris sorokiniana (Sacc.) Shoem. This
name is presently widely adopted. H.acrothecioides Lindfors, H. californicumMackie & Paxton, and Drechslerasorokiniana (Sacc.) Subram. & Jain are
synonyms.
The ascigerous state (teleomorph) was
first observed in the laboratory on naturalmedia in the presence of opposite mating
types and described as Ophiobolus sativusIto & Kurib. It was later renamedCochliobolus sativus (Ito & Kurib.)
Drechsler ex Dastur (1942). CochliobolusDrechsler is characterized by globose
ascomata usually with a long cylindrical
neck, obclavate-cylindric asci, and
helically coiled filiform ascospores. This
genus is associated with Bipolaris andCurvularia anamorphs. Teleomorphs of C.
sativus were only recently reported fromZambia (Raemaekers 1991).
The name given to the tan spot
fungus has also evolved considerably.Studying the link between
Helminthosporium anamorphs andPleospora teleomorphs on various grasses,
Diedicke first described, in 1902, H.gramineum Rab. ex Schlecht. f.sp. 1hticirepentis on Triticum repens, an ancientname for quack grass (Agropyrum repens(L.) Beauv.). The anamorph was linked
with the teleomorph Pleospora trichostoma(Fr.) Wint. f.sp. Tritici repentis. Mainlybased on pathogenicity studies andassociatioh of Alternaria spp. with P.trichostoma (Fr.) Wint., he changed the
names to Helminthosporium Tritici repentisDied. and Pleospora Tritici repentis,respectively (Diedicke 1903). He alsopointed out the pathogenic differences
between these fungi and H. Bromi Died,and erected Pleospora Bromi Died., P. teresDied., P. Avenae Died., and P. gramineaDied. for the ascus stages of differentHelminthosporium species. However,
Noak (1905) did not ac€ept this
conclusion because of morphologiealsimilarities of the teleomorphs, and
reduced the parasites on quack grass andBromus to biological forms of P.
trichostoma (Fr.) Wint. f.sp. tritici-repentisNoak. Pleospora tritici repentis was
renamed Pyrenophora tritici-repentis(Died.) Drechsler (1923) because of the
presence of setae on the ascocarp.

8 H. Marall.
Wehmeyer questioned the exclusion by
Diedicke of all forms having aHelminthosporium state from Pleosporatrichostoma, the erection of the five
binomials for the ascus state of the .different species of Helminthosporium, and
the descriptions of Drechsler. Based on
morphological similarities of theascocarp, he reintroduced Pleosporatrichostoma (Fr.) Ces. & de Not.(Wehmeyer 1953) and later on Pyrenophoratrichostoma (Fr.) Fck. as the teleomorph of
the various species of Helminthosporiumon Bromus, Hordeum, Poa, Secale, andTriticum (Wehmeyer 1961). This name has
been widely used for the tan spot andyellow leaf spot pathogen of wheat(Wiese 1977; Hosford 1982). Nevertheless,this created confusion from the
phytopathological point of view becausethe different species of Helminthosporiumon the various hosts are associated withvery different diseases with regard topathogenicity, ecological requirements,and cultivar resistance, and because H.
tritici-repentis also has, per se, a wide hostrange (Shoemaker 1962).
In his description of H. tritici-repentis,Drechsler (1923) described the
subhyaline, straight-cylindrical conidia as
"most distinctive peculiarity '" the shapeof the basal segment ... remotelysuggestive of the horizontal aspects of the
head of a snake". Nisikado (1928)
associated leaf spots on wheat with H.tritici-vulgaris Nisikado; characterized by
conidia with uninflated, long-conicalbasal cell; H. tritici-repens being
considered to have inflated basal cells. Ito
(1930) proposed the generic name
Drechslera Ito for Helminthospodum species
with conidia germinating fraInevery celland renamed H. tritici-vulgaris as
Drechslera tritici-vulgaris (Nisikado) Ito.
However, the hyphomycete genusDrechslera Ito was not taken up until theindepth taxonomic studies of this group
by Shoemaker (1959, 1962). The latterconsidered the difference between H.
tritici-repentis and H. tritici-vulgaris as notconsistent and proposed Drechslera triticirepentis (Died.) Shoem. as the anamorphof Pyrenophora tritici-repentis. By this
simplification, Pyrenophora tritici-vulgarisDickson (1956) became the synonym of P.tritici-repentis.
Further. studies have been undertaken
during the last decades on the taxonomyof this group, taking other criteria intoaccount including the type of hilum, theconidial wall, and the known or unknown
teleomorph, but the terminologyproposed by Shoemaker for the abovegraminicolous Helminthosporium has notbeen changed (Sivanesan 1987; Alcorn1988).
The international code of botanicalnomenclature permits the different states
of fungi with pleomorphic life-cycles to
be given separate names; if a teleomorphis present, the name automatically refers
to that morph even if the anamorph isalso present (Hawksworth et al. 1995). The
correct names for helminthosporium leaf
blight of wheat are accordingly:
Cochliobolus sativus (Ito & Kurib.)Drechsler ex Dastur, anamorph Bipolarissorokiniana (Sacc.) Shoem., and
Evolution of the Nomencleture Used for He/minthosporium spp. Ceuslng Leef Blight of Wheet 9
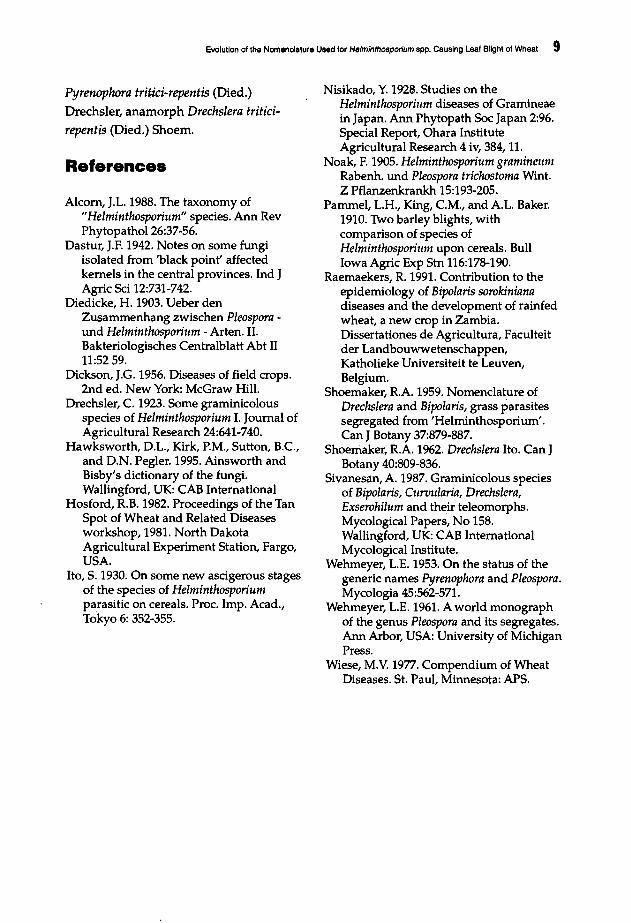
Pyrenophora tritici-repentis (Died.)
Drechsler, anamorph Drechslera tritid
repentis (Died.) Shoem.
Reference.
Alcorn, J.L. 1988. The taxonomy of"Helminthosporium" species. Ann RevPhytopathoI26:37-56.
Dastur, J.E 1942. Notes on some fungiisolated from 'black point' affectedkernels in the central provinces. Ind JAgric Sci 12:731-742.
Diedicke, H. 1903. Ueber denZusammenhang zwischen Pleospora und Helminthosporium - Arten. II.Bakteriologisches Centralblatt Abt II11:5259.
Dickson, J.G. 1956. Diseases of field crops.2nd ed. New York: McGraw Hill.
Drechsler, C. 1923. Some graminicolousspecies of Helminthosporium I. Journal ofAgricultural Research 24:641-740.
Hawksworth, D.L., Kirk, P.M., Sutton, B.C.,and D.N. Pegler. 1995. Ainsworth andBisby's dictionary of the fungi.Wallingford, UK: CAB International
Hosford, RB. 1982. Proceedings of the TanSpot of Wheat and Related Diseasesworkshop, 1981. North DakotaAgricultural Experiment Station, Fargo,USA
Ito, S. 1930. On some new ascigerous stagesof the species of Helminthosporiuntparasitic on cereals. Proc. Imp. Acad.,Tokyo 6: 352-355.
Nisikado, Y. 1928. Studies on theHelminthosporium diseases of Gramineaein Japan. Ann Phytopath Soc Japan 2:96.Special Report, Ohara InstituteAgricultural Research 4 iv, 384, 11.
Noak, E 1905. Helminthosporium gramineuntRabenh. und Pleospora trichostoma Wint.Z pflanzenkrankh 15:193-205.
Pammel, L.H., King, C.M., and AL. Baker.1910. Two barley blights, withcomparison of species ofHelminthosporiunt upon cereals. BullIowa Agric Exp Stn 116:178-190.
Raemaekers, R. 1991. Contribution to theepidemiology of Bipolaris sorokinianadiseases and the development of rainfedwheat, a new crop in Zambia.Dissertationes de Agricultura, Faculteitder Landbouwwetenschappen,Katholieke Universiteit te Leuven,Belgium.
Shoemaker, RA 1959. Nomenclature ofDrechslera and Bipolaris, grass parasitessegregated from 'Helminthosporium'.Can J Botany 37:879-887.
Shoemaker, RA 1962. Drechslera Ito. Can JBotany 40:809-836.
Sivanesa.n, A 1987. Graminicolous speciesof Bipolaris, Curvularia, Drechslera,Exserohilum and their teleomorphs.Mycological Papers, No 158.Wallingford, UK: CAB InternationalMycological Institute.
Wehmeyer, L.E. 1953. On the status of thegeneric names Pyrenophora and Pleospora.Mycologia 45:562-571.
Wehmeyer, L.E. 1961. A world monographof the genus Pleospora and its segregates.Ann Arbor, USA: University of MichiganPress.
Wiese, M.V. 1977. Compendium of WheatDiseases. St. Paul, Minnesota: APS.

10
Crop ",anagement and Breeding forControl of Pyrenophora trltlel.reperitlsCausing Yellow Spot of Wheat inAustralia
R Loughman!, RE. Wilson!, J.E. Roake2, G.J. Platz3, RG. Rees3, and EW. E11ison4
1 Agriculture Western Australia, South Perth, WA, AustraliaUniversity of Sydney Plant Breeding Institute, Camden, NSW, AustraliaQueensland Department of Primary Industries, Toowoomba, QLD, Australia
4 University of Sydney Plant Breeding Institute, Narrabri, NSW, Australia
Abstract
Pyrenophora tritici-repentis is a major leafdisease in the northern wheat growing areas ofAustralia and also occurs sporadically in southern wheat growing areas. In Western Australia,the disease occurs in combination with Phaeosphaeria nodorum,and losses of5-20% arefrequent in medium to high rainfall areas. Pink grain occurs sporadically in seasonS that arevery favorable for disease development. The disease has increased in the last 20 years due tointensified cropping and adoption ofstubble retention/reduced tillage. Stubble burning and croprotation are the main means ofcontrol. Single applications oftriazole fungicides, such aspropiconazole and tebuconazole at 62 g ai ha-l applied around the time offlag leafemergence,can provide economic control but are rarely practiced because ofuncertainty ofseasonalgrowing conditions. Breeding programs for white grained, high quality wheats are pursuingresistance as a high priority in Western Australia (WA), Queensland (QLD), and northernNew South Wales (NSW). Approaches to breeding in Australia include complex crossing andbackcrossing strategies combined with glasshouse and field based screening. In WA, resistanceto P. tritici-repentis is sought in combination with P. nodorum. Moderate resistance has beendeveloped from a broad range ofgenetic material. This has resulted in the release ofcvs.Cascades (Tadorna.Inia/3*Aroona), Carnamah (Bolsena-1CH/77W:660), and Cunderdin(Flicker sister/Sunfield sister) with moderate resistance to P. tritici-repentis. In QLD andNS W, a backcrossing program using known sources ofrecessive resistance has resulted in therelease ofLeichhardt (CNT2/4*Hartog). In some cases, susceptible parents appear to contributeto the resistance. Among pathogen isolates nec+ chl+ types predominate.
In the northern wheat growing areasof Australia, Pyrenophora tritici-repentiscauses yellow spot, a major leaf disease ofwheat. It also occurs sporadically insouthern wheat growing areas. InWestern Australia (WA), the pathogen
occurs in combination with Phaeosphaerianodorum, and losses of 5-20% are frequentin medium to high rainfall areas. Pinkgrain occurs sporadically in seasons thatare very favorable for pathogendevelopment. Disease levels have

Crop Management and Breeding for Control of Pyrenophofa tritlci-repantls Causing Yellow Spot of Wheat In Australia 11
increased in the last 20 years due to
intensified cropping and adoption ofstubble retention/reduced tillage
practices. Fungicides can provide
economic control but applications are rarebecause of uncertainty of seasonal
growing conditions. Disease resistance isof high priority in breeding for white
grained, high quality wheats in WA,Queensland (QLD), and northern New
South Wales (NSW). Moderately resistantvarieties have been recently released,
thereby providing better opportunities forcontrol. In the absence of varietalresistance, crop rotation and stubble
burning are the main means of control.
Disease Management
Stubble managementThe effects of stubble management
and tillage practices on P. tritici·repentis inAustralia are well understood (Rees 1987;Summerell and Burgess 1989). In QLDand northern NSW, stubble retention is
important for erosion control of high claycontent soils during the wet non-croppingperiod. In WA, stubble is retained to
prevent wind erosion of light textured,sandy soils during the dry noh-cropping
period. In the WA environment, disease
induced by stubble-borne pathogens cancause yield losses of up to 46% under
favorable conditions; losses of up to 15%
are typical of normal conditions inmedium to high rainfall areas in WA
(Table 1). To manage these erosion risks
and, at the same time, reduce the risk of
yellow spot, stu~ble is frequently burntimmediately preceding the cropping
phase, providing most of the benefits oferosion control but reducing inoculum ofP. tritici-repentis and other diseases.
Farmers are seeking systems in which
stubble can be retained through croppingphases.
Crop rotatIonAnother important disease
management option in WA is croprotation. This practice reduces the impact
of leaf disease by separating the newwheat crop from existing inoculumsources in time and space. The mostcommon rotations involve leguminous
crops (primarily Lupinus angustifolius) orself-regenerating pastures. Stubbleretention is routinely practised in these
situations because of erosion controlbenefits, but also because surface stubble
Table 1. Yield response to control of leaf disease caused by Pyrenophors tritici-rspsntis andPhssosphssrls nodorum associated with stubble at three locations in Western Australia, 1995196.
Yield kg ha-' (%) % Leaf disease'East Chapman Wongan Rills Mingenew W. Hills Ming.
Treatment 1995 1996 1996 1996 1996
Nil stubble +Folicur 1502(100) 3019 (100) 2201(100) 31 36250EWZ10-50 9 m-2 stubble 2751 (9H 1466 (67) 6480-100 9 m·2 stubble 973 (65) 2571 (84) 1196 (54) 71 88LSD 5% 120 200 140 20
1 O/OF.2 GS74 at Wongan Hills, %F-3 GS32 at Mingenew.z Either 2or 4applications of 125 9tebuconazole ha·1, depending on location.

12 R. Loughman at al.
protects lupins from rain-splashed
soilborne Pleiochaeta setosa, causing brownspot disease (Sweetingham et al. 1993).Since stubble-borne inoculum retained on
the soil surface can remain viable for overtwo years (Summerell and Burgess 1989),there can be some risk of yellow spot
development in the return wheat
cropping phase of year-in year-outrotations. In these situations, new crops
are established 18 months after theharvest of the previous wheat crop. A
survey of stubble paddocks showed thatthe infectivity of 18-month-old stubblewas similar to that of 6-month'-01d stubble
in some situations (Table 2). While thefrequency of such an occurrence in thefield is low, disease carryover may occur,
despite rotations, if significant quantitiesof surface wheat straw persist throughthe rotation phase.
Chemical controlRotation effectively reduces the
amount of early inoculum on crops;however, wheat grown in rotation doesnot remain disease free, presumably due
to the movement of airborne inoculum
from adjacent areas. Well managed cropsgrown in rotations still exhibit some yield
loss from leaf disease. Fungicide seeddressings appear ineffective (Rees andPlatz, unpublished data). Over the last
five years, tebuconazole and flutriafol
sprays have been registered for broadacreuse in Australia and now compete with
propiconazole. In-erop control represents
another management option for P. triticirepentis. In WA, single applications ofthese fungicides at rates of 31-62 g ai ha-1
are the most cost effective, and are beingcommercially evaluated and adopted on asmall scale. At costs of around A$ 25 ha-1,
treatments are only economic withminimum yield increases of around 150kg ha-1 at present wheat prices. This is
most readily achieved in high yieldingcrops (around 3t ha-1, compared with theWA state average of 1.5 t ha-1) where yieldresponses over 5% are observed (Table 3).
Treatments applied aro~nd flag leafemergence can provide economic controlbut are generally not practised because ofuncertainty with seasonal growing
conditions.
Table 2. The effect of 18-mooth- aod 6-mooth-oldwheat stubble 00 early leaf disease of wheat.
% Disease (raoge)
Note: Plots were sown and then field-collected strawapplied to give 200 g wheat stubble m·2• Diseasewas assessed on juvenile plants (Loughman.unpublished). For each year, the data show therange of disease intensities observed:from arange of stubble samples in the two age classes.In one year (1994), some 18-month-old stubbleinduced similar disease as 6-month-old stubble.
1992 1993 1994Age of stubble
Nil stubble18 months6 monthsLSD 5%
21-12
40-7520
55-19
87-958
o0-8088-97
16
Breeding for Resistance
Genetics and sourcesRees and Platz (1990) reported that
resistance was available in Brazilian andCIMMYf material, and that some
varieties combined yellow spot resistance
with resistance to other diseases. Yellow
spot resistance sources include BH1146(selection), Chinese Spring, CNT2,
Fink'S', Genar081, Norin26, Ponta
Grossal, Red Chief, and Vicam71 (Rees
Crop Management and Breeding for Control of Pyrenophora tritiei-repentls Causing Yellow Spot of Wheat In Australia 13
and Platz 1992). Resistance may becommonin different sources (Rees and
Platz, unpublished).
Resistance utilized in QLD has beenfound to be recessive and usually
conditioned by several genes (Rees andPlatz 1992). Between 250 and 300 F2
populations frequently fail to generatehomozygous F3 families with resistance
levels as high as the resistant donor.These studies are supported by those of
Roake (unpublished) on crosses betweenJanz (susceptible) x Fink '5' (resistant),Sunco (susceptible) x Fink '5', Fink '5' x
Banks (susceptible), and Vicam71(resistant) x Banks. The F3 populationsfrom these crosses show that resistance is
determined by at least three to four
recessive complementary genes. A crossbetween two susceptible varieties,Sunelg- (toxin insensitive Sunelgselection) and Suneca (nec+ chl-, sameinfection type as cv. Glenlea), produced
lines more resistant than either parent,though no lines were as resistant as thecontrol Fink '5'. Inheritance of this
resistance was probably determined bythree to four recessive complementarygenes. Background effects are apparent in
backcrossing, with resistance being more
easily recovered with some .recurrent
parents than others. It is possible thatsuch parents carry one or two minor
genes for resistance.
Priorities, methods, andprogress
The regional significance of yellowspot varies greatly throughout Australia
and is reflected in the priorities of the
respective breeding programs. Resistanceis a priority in the breeding programs ofQLD, northern NSW, and WA.
Approaches to breeding in Australiainclude complex crossing and
backcrossing strategies combined withglasshouse- and field-based screening. In
the southeastern state of Victoria, stripe
rust and septoria tritici blotch are themost important leaf diseases. Selectionfor yellow spot resistance is not practised,
resulting in higher susceptibility levels(Table 4).
In QLD and northern NSW, yellowspot resistance is being developed in abackcrossing program using locally
adapted Prime Hard quality parents. Thebackcrossing strategy enables the
recovery of recessive resistance at levelssimilar to the resistant donor, and rust
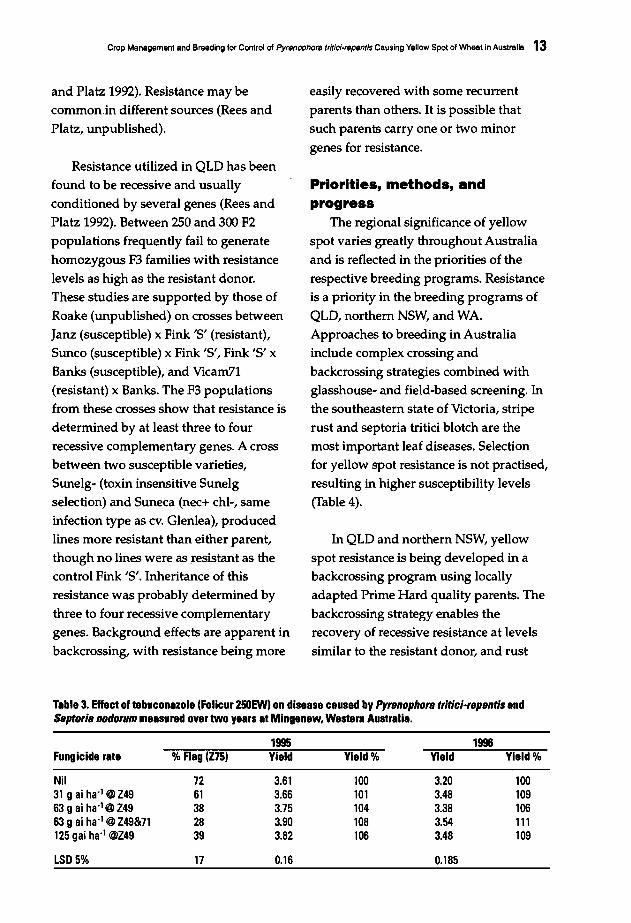
Table 3. Effect of tebuconazole (Folicur 25OEW) on disease caused by PYlenopholB tlitici-Iepentis andSeptoliB nodolum measured over two years at Mingenew. Western Australia.
1995 1996Fungicide rate %Flag (Z75) Yield Yield % Yield Yield %
Nil 72 3.61 100 3.20 10031 9 ai ha'l @Z49 61 3.66 101 3.48 10963 9 ai ha·1@Z49 38 3.75 104 3.38 10663 9 ai ha·1@Z49&71 28 3.90 108 3.54 111125 gai ha-1@Z49 39 3.82 106 3.48 109
LSD 5% 17 0.16 0.185

14 R. Loughman at al.
resistance and quality similar to therecurrent parent. Resistant x adapted
crosses are made during winter and theF1 grown in summer. In the pre-winter
period, more than 1500 F2 plants arescreened at the two-leaf stage by
inoculating with field-collected conidia (2
x 104 ml"!). Leaf wetness is maintained for40 h and seedling response assessed after
8 days at 14/23°C. Plants are then
transplanted to the field where the firstback cross is made to the six most
resistant lines. The cycle is repeated overat least the next three years includingprogeny testing of the selected BCF2s at
each stage and selection for agronomictype on field transplants. Based onseedling tests, the best 50 BC3F2s are
selected and BC3F3s are produced in thewinter of year 5. Single plant selections ofthese families are progeny tested through
two more generations, and preliminaryyield evaluation is begun in year 7,progressing through wide scale testing topotential release in year 12.
In 1993, line QT5360 (Vicam71/
3*Hartog) was in wide scale testing butdid not meet quality requirements. In
1995, Leichhardt (CNT2/4*Hartog) was
released in QLD and has shown moderateresistance. Both lines express less yield
loss in the presence of disease than the
recurrent paren,t Hartog (Table 5).Leichhardt shows a high level of seedlingresistance (Table 6). In 1997, seedling tests
of lines from the Northern WheatImprovement Program (QLD and
northern NSW) will include 30 F2 families
for selection and backcrossing, andprogeny tests of 3300 BCF2lines and 1100BCF3lines.
In WA, P. tritici-repentis resistance issought in combination with Phaeosphaerianodorum resistance as these diseasesfrequently occur together (Loughman etai. 1994). Moderate resistance has beenderived from a broad range of geneticmaterial using different, but often
Table 4. Mean responses to Pyrenophors trltie/repentls of current advanced lines from Australianregional breeding programs evaluated in theAustralian Septoria Nursery AUSENXXI (1996).
Regionalbreedingprogram
Meanresponse
(0-10 scale)Std
error
No. oflines
evaluated
Table 5. Comparison of moderately resistant linesQT5360 (Vioam 7113*Hartog) and Leichhardt (CNT2/4*Hartog) with the susceptible recurrent parentHartog and the very susceptible control Banks.infected with Pyrenophora tritie/-repentis.
Yield (g m·2) Relative %yield Flag
Fungicide Dislfung leafDiseased protected (%) diseased
Victoria 8.0 0.6 81990QT5360 607 686 88 6
Southern NSW 6.9 0.3 18 Hartog 519 672 77 56South Australia 6.4 0.4 i7Queensland1 6.1 0.4 7 1995Western Australia 5.4 0.4 13 Leichhardt 440 500 88 18Check varieties Hartog 317 398 80 81Aus20917(R) 4.3 0.3 Banks 176 274 64 33 1
Leichhardt(R) 3.5 0.5Millewa(S) 6.5 0.6 LSD 5% (1995) 29
1 Not including lines from the backcrossing program. 1 Banks is later maturing.Source: Loughman and Wilson, unpublished. Source: Rees and Platz, unpublished.
Crop Management and Breeding for Control of Pyrenophora Irllic/·repenlis Causing Yellow Spot of Wheat in Australia 15
complex, crossing strategies. The
program aims to improve resistance toboth diseases (as well as to septoria tritici
blotch and rusts) by continually crossing
the most resistant, best adapted lineswith resistance donors. Some resistance
may have been obtained through the use
of aluminum-tolerant parental materialthat also carries a range of disease
resistance. Lines are selected for
agronomic type, yield, and quality inearly generations, and screening for P.tritici-repentis resistance commences prior
to re-selection in the F5. Evaluation isfield based. Septoria nodorum blotchdevelopment can reduce discrimination
between lines varying in yellow spotresistance (Loughman et aI. 1994), so
disease is encouraged with strawbome
inoculum in which P. tritici-repentis isnaturally dominant. In this way,epidemics are generated in which P.tritici-repentis is estimated to cause 90% ofinfections.
Severe ascospore infections provide asimple, reliable non-labor intensive basis
for discrimination of resistance in youngplants up to stem elongation, while
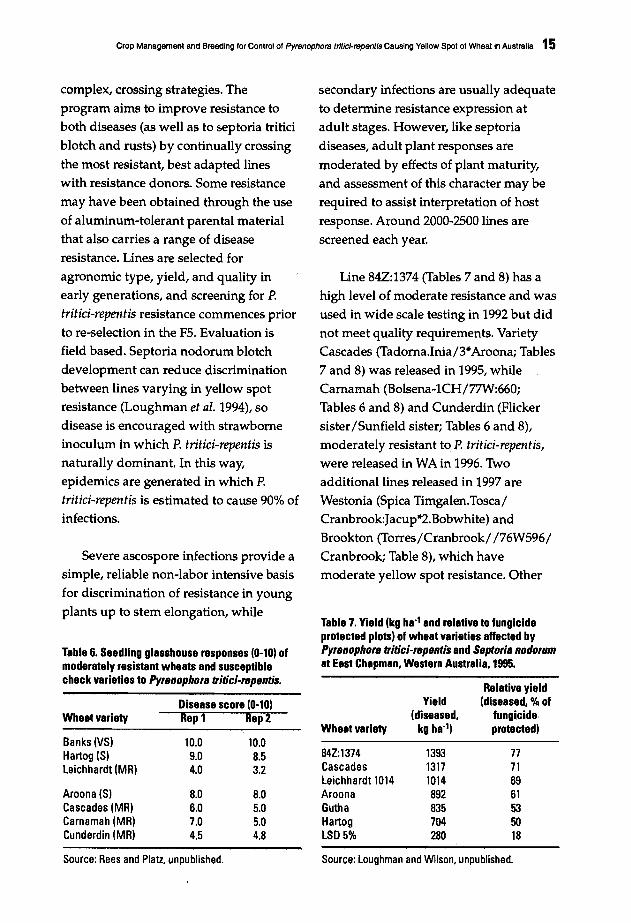
Table 6. Seedling glasshouse responses (0-10) ofmoderately resistant wheats and susceptiblecheck varieties to Pyrenophor. tritie/-repentis.
Disease score (0-10)Wheat variety Rep 1 Rep2
Banks (VS) 10.0 10.0Hartog (SI 9.0 8.5leichhardt (MR) 4.0 3.2
Arcana (SI 8.0 8.0Cascades jMR) 6.0 5.0Carnamah (MRI 7.0 5.0Cunderdin (MR) 4.5 4.8
Source: Rees and Platz. unpublished.
secondary infections are usually adequateto determine resistance expression atadult stages. However, like septoria
diseases, adult plant responses are
moderated by effects of plant maturity,and assessment of this character may be
required to assist interpretation of host
response. Around 2000-2500 lines arescreened each year.
Line 842:1374 (Tables 7 and 8) has a
high level of moderate resistance and wasused in wide scale testing in 1992 but did
not meet quality requirements. VarietyCascades (Tadoma.Inia/3"Aroonai Tables7 and 8) was released in 1995, while
Camamah (Bolsena-1CH/77W:660i
Tables 6 and 8) and Cunderdin (Flicker
sister/Sunfield sisteri Tables 6 and 8),moderately resistant to P. tritici-repentis,were released in WA in 1996. Two
additional lines released in 1997 areWestonia (Spica Timgalen.Tosca/Cranbrook:Jacup"2.Bobwhite) and
Brookton (Torres/Cranbrook/ /76W596/Cranbrooki Table 8), which havemoderate yellow spot resistance. Other
Table 7. Yield (kg ha" and relative to fungicideprotected plots) of wheat varieties affected byPyrenophor. tritiei-repentis and Septori. nodorumat East Chapman. Western Australia. 1995.
Relative yieldYield (diseased, % of
(diseased. fungicideWheat variety kg ha") protected)
84Z:1374 1393 77Cascades 1317 71leichhardt 1014 1014 69Arcana 892 61Gutha 835 53Hartog 704 50lSD5% 280 18
Source: Loughman and Wilson, unpublished.
16 R.loughman /lit a/.
lines undergoing final evaluation withmoderate yellow spot resistance includeW487118 (a sister to Westonia), 862:1494
(77W660/Spear.12IBWSN362), and
W486197 (a sister of 862;1494). Theresistance sources of these varieties or
advanced lines are not known but arediverse.
Pathogen variationThirty-seven isolates from WA and
northern NSW were tested using thedifferentials of Lamari and Bernier (1989)
and selected Australian lines (Roake,unpublished). All isolates except one (R15 'from Western Australia) were nec+ chl+
type described by Lamari and Bernier(1989). Isolate R15 was the nec+ chl-
pathotype, being avirulent on 6B365 but
virulent on Glenlea. Tests conducted onother lines showed differences in theisolates not revealed by the Canadian
differentials. R15 was avirulent on thetoxin-insensitive lines and selections
Columbus-, Cranbrook, Excalibur-, and
Sun 234A, but virulent on toxininsensitive lines Sun 124A and Sunelg-.
Isolate R40 was virulent on 6B365, but
avirulent on Columbus- and Sun 234A,and less aggressive on resistant lines andsusceptible toxin-insensitive lines
compared to other isolates. Isolate 8.3appeared to be avirulent on Columbus-,but virulent on all other susceptible toxin
insensitive lines. Isolate Su6 was asvirulent on Columbus- as on Columbus+,
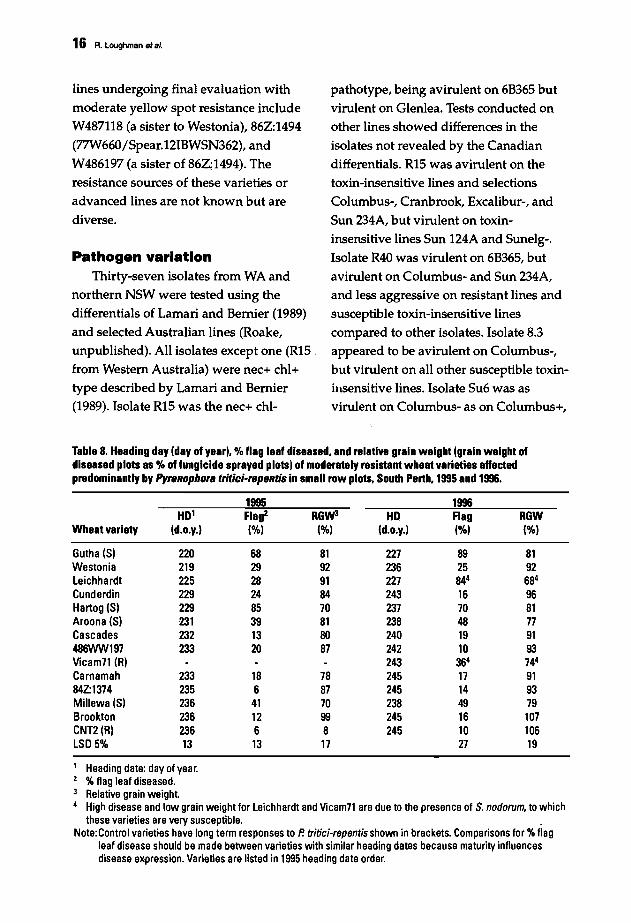
Table 8. Heading day (day of year). %flag leaf diseased. and relative grain weight (grain weight ofdiseased plots as %of fungicide sprayed plots) of moderately resistant wheat varieties affectedpredominantly by Pyl8nophora tritici-l8pentis in small row plots. South Perth. 1995 and 1996.
1995 1996HD' Flag2 RGW3 HD Flag RGW
Wheat variety (d.o.y.) (%) (%) (d.o.y.) (%) (%)
Gutha (S) 220 68 81 227 89 81Westonia 219 29 92 236 25 92Leichhardt 225 28 91 227 844 684
Cunderdin 229 24 84 243 16 96Hartog (S) 229 85 70 237 70 81Aroona (S) 231 39 81 238 48 77Cascades 232 13 80 240 19 91486WW197 233 20 87 242 10 93Vicam71 (RI 243 364 744
Carnamah 233 18 78 245 17 9184Z:1374 235 6 87 245 14 93Millewa(S) 236 41 70 238 49 79Brookton 236 12 99 245 16 107CNT2(R) 236 6 8 245 10 106LSD 5% 13 13 17 27 19
Heading date: day of year.%flag leaf diseased.Relative grain weight.High disease and low grain weight for Leichhardt and Vicam71 are due to the presence of S. nodorum. to whichthese varieties are very susceptible. •
Note:Control varieties have long term responses to P. tritici·repentisshown in brackets. Comparisons for %flagleaf disease should be made between varieties with similar heading dates because maturity influencesdisease expression. Varieties are listed in 1995 heading date order.
Crop Management and Breeding for Control of Pyrenophora trltlc~repentls Causing Yellow Spot of Wheat In Australia 17'
whereas all other isolates appeared less
virulent on Columbus- than on
Columbus+. Necrosis was apparent on
Columbus- with isolate Su6. In
conclusion, some specificity is present in
these isolates, though none were virulent
on the range of resistance sources that
were tested. Variation in aggressiveness
of isolates was also apparent.
Summary
In Australia, the impact of yellow spot
is very regionally and seasonally
dependent. Disease can be managed by
rotation, stubble reduction, and varietal
resistance. Stubble reduction is
unsustainable on some soil types. In these
situations, moderately resistant varieties
are assisting growers in developing
economic and sustainable farming
systems.
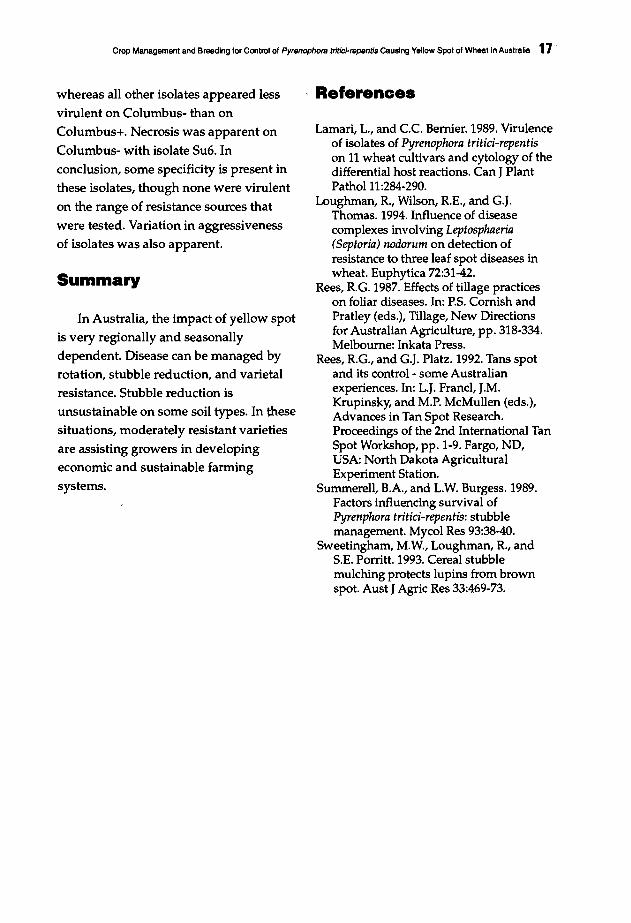
References
Lamari, L., and c.c. Bernier. 1989. Virulenceof isolates of Pyrenophora tritid-repentison 11 wheat cultivars and cytology of thedifferential host reactions. Can J PlantPathol11:284-290.
Loughman, R., Wilson, R.E., and G.J.Thomas. 1994. Influence of diseasecomplexes involVing Leptosphaeria(Septoria) nodorum on detection ofresistance to three leaf spot diseases inwheat. Euphytica 72:31-42.
Rees, R.G. 1987. Effects of tillage practiceson foliar diseases. In: P.5. Cornish andPratley (eds.), Tillage, New Directionsfor Australian Agriculture, pp. 318-334.Melbourne: Inkata Press.
Rees, R.G., and G.J. Platz. 1992. Tans spotand its control- some Australianexperiences. In: L.J. Francl, J.M.Krupinsky, and M.P. McMullen (eds.),Advances in Tan Spot Research.Proceedings of the 2nd International TanSpot Workshop, pp. 1-9. Fargo, ND,USA: North Dakota AgriculturalExperiment Station.
Summerell, B.A., and L.W. Burgess. 1989.Factors influencing survival ofPyrenphora tritici-repentis: stubblemanagement. Mycol Res 93:38-40.
Sweetingham, M.W., Loughman, R., andS.E. Porritt. 1993. Cereal stubblemulching protects lupins from brownspot. Aust J Agric Res 33:469-73.
18
Constraints on the 'IntegratedManagement of Spot Blotch 0" Wheat
Y.R. MehtaInstituto Agronomico do Parana-IAPAR, Londrina, PR, Brazil
Abalr.cl
Spot blotch ofwheat, caused by Bipolaris sorokiniana, occurs in all Latin Americancountries and affects all plant parts. The pathogen is transmitted through contaminated orinfected seed and can adversely affect germination and development ofthe root system or kill theseedling within afew days. The disease is capable ofcausing up to 100% yield loss. Integrationofdifferent disease control methods, although partially adopted, is being done in most countriesof the Southern Cone region. Methods include varietal resistance, induced resistance, varietalmanagement, soil and residue management, crop rotation, and chemical control. Nonetheless,the disease is still problematic and poses a potential threat to wheat cultivation in the region,mainly because ofpolitical, technological, and socioeconomic constraints.
Spot blotch of wheat, caused byBipolaris sorokiniana (Sacc.) Shoem., occursthroughout the world, but severe lossesoccur in Bangladesh, Bolivia, Brazil,Paraguay, and Zambia. The disease affectsall plant parts and can cause up to 100%yield loss (Mehta 1993). The pathogen istransmitted through contaminated orinfected seed, may adversely affectgermination and development of the rootsystem, and can kill the seedling within afew days, depending on the severity ofinfection. Yield losses due to the commonroot rot phase of the disease have beenreported at 5-20% (Diehl et al. 1983). Nomajor resistance is available, and diseasecontrol depends on an integrated
management approach.
Integrated disease management (10M)is not a discipline but a technique. We donot do research on IDM, as such, butinstead focus on individual control
measures for a particular disease or groupof diseases. Later, we determine whetheror not those control measures fit a"particular production system andwhether they interfere with other existingtechnologies (Figure 1). Once efficientdisease control methods are developed,efforts are made to integrate them to forma disease management system. It thenbecomes necessary to ensure theappropriate use of the IDM system and toidentify the constraints for its adoption.In recent years, IDM has been partiallypracticed in Brazil and includes thefollowing components.
Varietal Resistance
Generally speaking, highlysusceptible cultivars are quickly replacedby less susceptible cultivars. Nonetheless,most wheat cultivars are still quitesusceptible or else their degree of

Constraints on the Integrated Management of Spot Blotch of Wheat 19
resistance is insufficient (Hetzler et al.1991; Mehta et al. 1992). Some sources ofresistance are already available (Mehta1993). Wheat cultivarswith some
resistance to spot blotch also offer someresistance to tan spot (Mehta et al. 1996) .
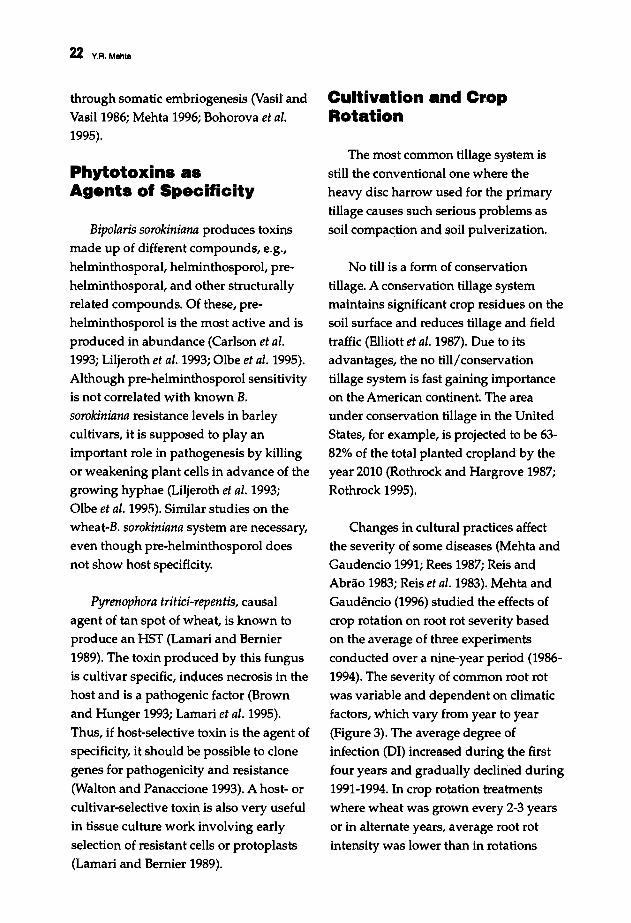
Triller and Mehta (1997) studied theinfluence of flag leaf age on expression of
B. sorokiniana resistance in wheat undercontrolled environm~ntalconditions. The
results of their study using 17 genotypesindicated that the older the flag leaves
were, the higher their susceptibility toinfection by B. sorokiniana. The correlationcoefficient (r) between flag leaf age andthe average percentage of infected leaf
area was 0.94 (Figure 2). These authorssuggested that in conducting studies onvirulence/sources of resistance, plant
growth stage DC 56 (3/4 of the
inflorescence emerged) should be usedbecause flag leaves show the highest
susceptibility to the pathogen at thatstage.
The higher predisposition at an
advanced growth stage such as DC 56 isvery problematic for the wheat crop.
Under favorable weather conditions atthis growth stage, Le., continuous rainsfor 5-6 days followed by relatively higher
temperatures (daily average of 20-23OC), a
spot blotch epidemic develops very
I,duoti.. 01 "", "'OIa'" go",~ r1 I....ducti.. 01 ",;,..,,, go", hom I. through somaclonal variation ," . alien'species through breeding
Use of phytotoxins in Partial resistance Introduction ofselection of resistant •~. and complete
~resistance genes
- cells or protoplasts ./ resistance through transformation'C
./ ~Ql C+ I.., 0
c '.I:l.!!! eo Diversification of
~ ~Use of healthy seedco .!:::!
Ql '"~'€ cultivars and seeding and seed treatment c: Ql
- Ql .~ S~- dates
Interdisciplinarywith fungicides eo'C
... Ql
--reo ..,
integration for combating ::> ede.
~i~wheat diseases-an 10M
system:= QlIQl~-g ~
~:§'~ : ~ Soil management,V C '".- eo~ c 'C ._ crop residu"e Aerial application C Ql
~.g.~ S 0'"
management, and of fungicides'.I:l eo
o f! u .! .., Ql::> Qlc3 0 "'Co. crop rotation 'C ...
ea~e e'd;8; 8:
~ Ve.",
.E~ eo 'CeoBiocontrol{Use of Ql Ql
IQ) .~
antagonistic en 'C
r--- microorganisms and
~J!l phytotoxins for seed'Cu treatment)C Ql0", 0>.., C
5l'S ~Ql'-
'" 'C_ C : ~.~o eo
at! .sa ~ Q)
c ... '"~ 0 .E5.cto) Figure 1. Wheat disease control tools and their integration.'---

20 V.R. Mehla
backcrosses. Fixed lines showing higher
levels of resistance and desirable
agronomic characters were selected inbulk and included in the preliminary
yield trial (Mehta et al. 1996).
Although new sources of resistancemay be available, breeders and
pathologists still face the challenge ofpinpointing genes that offer better levels
of resistance.
Transferring resistance genes from
alien species is problematic because of theploidy problem. Nonetheless, someprogress in transferring resistance genes
. from alien species (Thinopyrumcurvifolium, Elymus curvifolius, and T.
tauschii) to wheat germplasm has been
adlieved (Mujeeb-Kazi et al. 1996a,1996b).
80
35 -r----:----_-------,V=·0.036x2 +
~ 30 4,764x ·126,713r =0.937
rapidly and is capable of causing almost
total yield losses and very poor grainquality, especially in more susceptiblecultivars. Such epidemics were recorded
several times during the past two decades(Mehta 1993).
'0Q>
t> 25.l!!=.; 20Q>..'"~ 15.!!!Cll
~ 10'#.
5+----+--..,-----,---..,-----\30 40 50 60 70
Flag leaf age (decimal code)
Figure 2. Effect of flag leaf age of 16 wheatgenotypes on the average percentage of FLAI byB. sorokiniBnB seven days after Inoculation.Source: Triller and Mehta 1997.
The effect of flag leaf age on theseverity of B. sorokiniana infection issignificant in studies aimed at identifying
resistance sources and incorporating theirresistance into agronomically desirable
cultivars. For virulence studies conducted
in the laboratory using leaf portions, leafage should be considered in order toobtain consistent and comparable results.
In 1989-1994 the level of resistance of
31 wheat genotypes was studied using
the area under the disease progress curve(AUDPC) developed at CIMMYT,
Mexico, (Mehta 1993; Table 1). Attempts
were made to transfer resistance from
genotypes that showed higher levels ofresistance to agronomically desirable
cultivars of wider adaptation using two
Biotechnological Approach
It has been long suspected that spotblotch resistance in wheat is governed byquantitative traits, and no majorresistance genes are known to exist
(Mehta 1993). As stated earlier, thoughsources of higher levels of resistance have
been identified, little progress has been
achieved using conventional breedingmethods, mainly because of the polygenic
nature of this resistance. It is thereforenecessary to identify the quantitative trait
loci (QTLs) where segregation does not
follow Mendelian laws. Only then will it
be possible to clone such genes. Once thegenes are cloned, transformation methods
may offer new options for combating the
disease in the future.
Constraints on the Integrated Managament of Spot Blotch of Whaat 21
In recent years several transformation of DNA. Generally speaking, these
techniques have been developed, e.g., techniques are highly sophisticated and
Agrobacterium-mediated transformation, depend on the availability of an efficient
protoplast-mediated transformation, and reproducible tissue culture system
microprojectile-mediated transformation, Gahne et al. 1994). Induced variation for
tissue electroporation, and microinjection higher levels of resistance is also expected
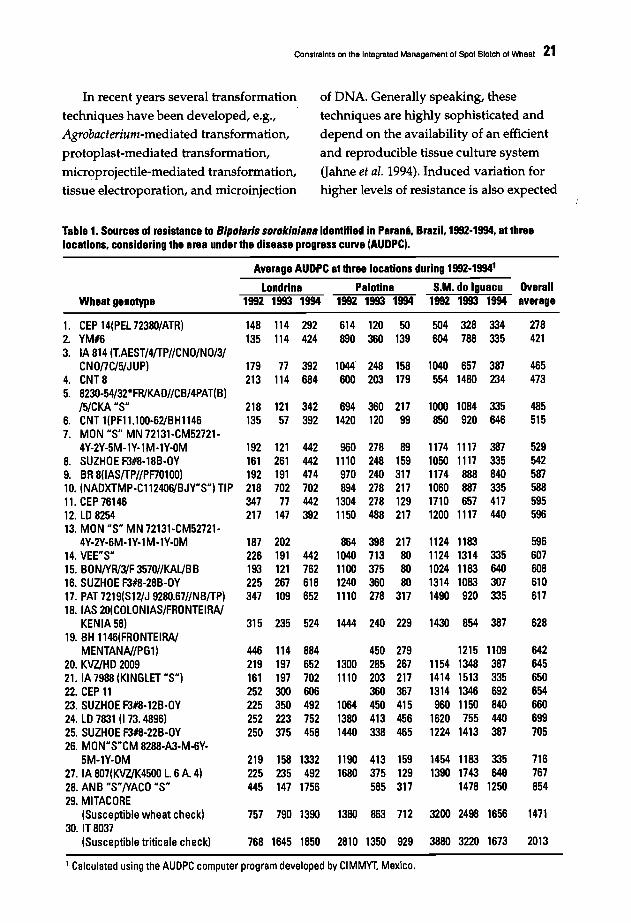
Table 1. Sources of resistance to B/polaris sorokiniana identified in Parana, Brazil. 1992·1994, at threelocations. considering the area under the disease progress curve (AllDPC).
Average AUDPC at three locations during 1992.1994'
Londrina Palotina S.M. do Iguacu OverallWheat genotype 1992 1993 1994 1992 1993 1994 1992 1993 1994 average
1. CEP 14(PEL72380/ATR) 148 114 292 614 120 50 504 328 334 2782. YM#6 135 114 424 890 360 139 604 788 335 4213. IA 814 (lAEST/4/TP/lCNO/NO/3/
CNOflC/5/JUP) 179 71 392 1044 248 158 1040 657 387 4654. CNT8 213 114 684 600 203 179 554 1480 234 4735. 823O-54/32*FR/KAD/ICB/4PAT(B)
/5/CKA "S" 218 121 342 694 360 217 1000 1084 335 4856. CNT 1(PF11.100-62/BHI146 135 57 392 1420 120 99 850 920 646 5157. MON "S" MN 72131-CM52721·
4Y-2Y-5M-1Y-l M-lY-OM 192 121 442 960 278 89 1174 1117 387 5298. SUZHOE F3#8-18B-OY 161 261 442 1110 248 159 1050 1117 335 5429. BR 8(1AS/TP/lPF70100) 192 191 474 970 240 317 1174 888 840 58710. (NADXTMP-CI12406/BJY"S") TIP 218 702 702 894 278 217 1060 887 335 58811. CEP 76146 347 71 442 1304 278 129 1710 657 417 59512. LD 8254 217 147 392 1150 488 217 1200 1117 440 59613. MON "S" MN 72131-CM52721-
4Y-2Y-6M-lY-l M-1Y-OM 187 202 864 398 217 1124 1183 59614. VEE"S" 226 191 442 1040 713 80 1124 1314 335 60715. BON/YR/31F 3570/lKAl/BB 193 121 762 1100 375 80 1024 1183 640 60816. SUZHOE F3#8-28B-OY 225 267 618 1240 360 80 1314 1083 307 61017. PAT 7219(SI2/J 9280.67/1NB/TP) 347 109 652 1110 278 317 1490 920 335 61718. lAS 20(COLONIAS/FRONTEIRA/
KENIA 58) 315 235 524 1444 240 229 1430 854 387 62819. BH 1146(FRONTEIRA/
MENTANA//PG1) 446 114 884 450 279 1215 1109 64220. KVZ/HD 2009 219 197 652 1300 285 267 1154 1348 387 64521. IA 7988 (KINGLET "S") 161 197 702 1110 203 217 1414 1513 335 65022. CEP 11 252 300 606 360 367 1314 1346 692 65423. SUZHOE F3#8-12B-OY 225 350 492 1064 450 415 960 1150 840 66024. LD 7831 (173.4896) 252 223 752 1380 413 456 1620 755 440 69925. SUZHOE F3#8-22B~OY 250 375 458 1440 338 465 1224 1413 387 70526. MON"S"CM 8288-A3-M-6Y-
5M-lY-OM 219 158 1332 1190 413 159 1454 1183 335 71627. IA 807(KVZ/K4500 l. 6A. 4) 225 235 492 1680 375 129 1390 1743 640 76728. ANB "S"/yACO "S" 445 147 1756 585 317 1478 1250 85429. MITACORE
(Susceptible wheat check) 757 790 1390 1380 863 712 3200 2498 1656 147130. IT 8037
(Susceptible triticale check) 768 1645 1850 2810 1350 929 3880 3220 1673 2013
1 Calculated using the AUDPC computer program developed by CIMMYT. Mexico.
22 V.R. Mehla
through somatic embriogenesis (Vasil andVasil 1986; Mehta 1996; Bohorova et ai.1995).
Phytotoxins asAgents of Specificity
Bipoiaris sorokiniana produces toxinsmade up of different compounds, e.g.,helminthosporal, helminthosporol, prehelminthosporal, and other structurallyrelated compounds. Of these, prehelminthosporol is the most active and isproduced in abundance (Carlson et ai.1993; Liljeroth et ai. 1993; Olbe et ai. 1995).Although pre-helminthosporol sensitivityis not correlated with known B.
sorokiniana resistance levels in barleycultivars, it is supposed to play animportant role in pathogenesis by killingor weakening plant cells in advance of thegrowing hyphae (Liljeroth et ai. 1993;Olbe et ai. 1995). Similar studies on thewheat-B. sorokiniana system are necessary,even though pre-helminthosporol doesnot show host specificity.
Pyrenophora tritici-repentis, causalagent of tan spot of wheat, is known toproduce an HST (Lamari and Bernier1989). The toxin produced by this fungusis cultivar specific, incluces necrosis in thehost and is a pathogenic factor (Brownand Hunger 1993; Lamari et ai. 1995).Thus, if host-selective toxin is the agent ofspecificity, it should be possible to clonegenes for pathogenicity and resistance(Walton and Panaccione 1993). A host- orcultivar-selective toxin is also very useful
in tissue culture work involving earlyselection of resistant cells or protoplasts(Lamari and Bernier 1989).
Cultivation and CropRotation
The most common tillage system isstill the conventional one where theheavy disc harrow used for the primarytillage causes such serious problems assoil compaction and ~oil pulverization.
No till is a form of conservationtillage. A conservation tillage systemmaintains significant crop residues on thesoil surface and reduces tillage and fieldtraffic (Elliott et ai. 1987). Due to itsadvantages, the no till/conservationtillage system is fast gaining importanceon the American continent. The areaunder conservation tillage in the UnitedStates, for example, is projected to be 6382% of the total planted cropland by theyear 2010 (Rothrock and Hargrove 1987;Rothrock 1995).
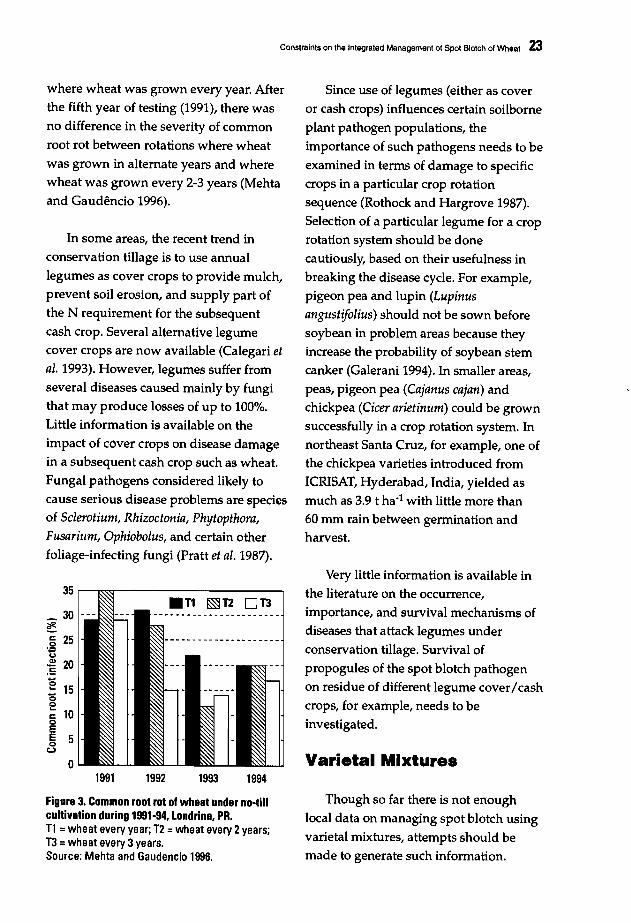
Changes in cultural practices affectthe severity of some diseases (Mehta andGaudencio 1991; Rees 1987; Reis andAbrao 1983; Reis et ai. 1983). Mehta andGaudencio (1996) studied the effects ofcrop rotation on root rot severity basedon the average of three experimentsconducted over a nine-year period (19861994). The severity of common root rotwas variable and dependent on climaticfactors, which vary from year to year(Figure 3). The average degree ofinfection (01) increased during the firstfour years and gradually declined during1991-1994. In crop rotation treatmentswhere wheat was grown every 2-3 yearsor in alternate years, average root rotintensity was lower than in rotations
Constraints on the Integratad Management of Spot Blotch of Wheat 23
where wheat was grown every year. After
the fifth year of testing (1991), there wasno difference in the severity of common
root rot between rotations where wheat
was grown in alternate years and wherewheat was grown every 2-3 years (Mehtaand Gaudencio 1996).
In some areas, the recent trend in
conservation tillage is to use annual
legumes as cover crops to provide mulch,prevent soil erosion, and supply part of
the N requirement for the subsequentcash crop. Several alternative legumecover crops are now available (Calegari etal. 1993). However, legumes suffer fromseveral diseases caused mainly by fungithat may produce losses of up to 100%.
Little information is available on the
impact of cOver crops on disease damagein a subsequent cash crop such as wheat.Fungal pathogens considered likely to
cause serious disease problems are speciesof Sclerotium, Rhizoctonia, Phytopthora,Fusarium, Ophiobolus, and certain otherfoliage-infecting fungi (Pratt et al. 1987).
Since use of legumes (either as cover
or cash crops) influences certain soilborne
plant pathogen populations, the
importance of such pathogens needs to be
examined in terms of damage to specificcrops in a particular crop rotationsequence (Rothock and Hargrove 1987).
Selection of a particular legume for a croprotation system should be done
cautiously, based on their usefulness in
breaking the disease cycle. For example,pigeon pea and lupin (Lupinusangustifolius) should not be sown before
soybean in problem areas because theyincrease the probability of soybean stemcanker (Galerani 1994). In smaller areas,
peas, pigeon pea (Cajanus cajan) andchickpea (Cicer arietinum) could be grownsuccessfully in a crop rotation system. In
northeast Santa Cruz, for example, one ofthe chickpea varieties introduced fromICRISAT, Hyderabad, India, yielded asmuch as 3.9 t ha-1 with Uttle more than60 mm rain between germination and
harvest.
35
_ 30~c 250
'-!=u
..l!! 20.=....~ 15'0~
10c0EE 50u
01991 1992 1993 1994
Very little information is available inthe literature on the occurrence,
importance, and survival mechanisms ofdiseases that attack legumes under
conservation tillage. Survival of
propogules of the spot blotch pathogenon residue of different legume cover/cash
crops, for example, needs to be
investigated.
Varietal Mixtures
Figure 3. Common root rot of wheat under no-tillcultivation during 1991-94, Londrina, PRoTl = wheat every year; T2 =wheat every 2years;T3 =wheat every 3years.Source: Mehta and Gaudencio 1996.
Though so far there is not enough
local data on managing spot blotch using
varietal mixtures, attempts should bemade to generate such information.
24 V.R. Mehta
Varietal mixtures could be successful
since they are already producingpromising results in wheat (Browning1988; Wolfe 1988; Mehta 1993). A field
trial on varietal mixtures was carried outin Brazil and Bolivia in 1992 and 1993,
respectively. Based on agronomic traits,two wheat cultivars, Genaro and Opata,were selected; they were seeded
separately and in a mixture containing
equal proportions of seed. The yield ofthe mixed plots was compared with theaverage yield of the two cultivars grown
separately, with or without f~ngicideapplication. During both years, yields ofthe mixed plots were 15.3-22.7% higherthan the average yields of the cultivarsgrown individually. This was because of
lower disease intensity and less waterstress during the critical stages of cropdevelopment in the mixed plots. Theincrease in yield was due to the increase
in grain number and grain weight perspike. Further testing is necessary togenerate local data before official
recommendations on varietal mixturescan be made.
Chemical Control
Unless soil inoculum is reduced, seedtreatments alone offer no benefit. Thoughseveral systemic fungicides for seed
treatment are now available, the decision
to treat the seed should be carefullyconsidered. In Brazil, for example, seed
treatment is recommended based on seed
health analyses plus soil condition and
crop rotation. The decision to apply seedtreatments should be based on the
following. Do not apply seed treatment ifthe seed infection level is less than 20%(as determined by the blotter test), and
germination is within standards. Seed
lots with less than 20% infection shouldbe treated only if percent germination islow and the standard limit is reached
after seed treatment. Seed lots with morethan 20% infection should be treated with
fungicide only if percent germination islower than the standard and there is ashortage of seed. Seed lots may be treated
with fungicides irrespective of the levelof infection, especially for seeding in newareas or in areas where crop rotation is
practiced.
However, in recent years only alimited number of farmers have followed
, such criteria, for two reasons. First, seed
health tests are not required forestablishing seed standards and, second,seed health tests are expensive andperformed by only a few laboratories.Unless seed health tests are a prerequisite
for setting seed standards, establishingseed treatment criteria would be
pointless.
Foliar fungicides belonging to thedithiocarbamates, such as mancozeb, and
triazoles, such as propiconazole,tebuconazole, flutriafol, iprodione,
procloraz, and triadimenol, are known tobe effective (IAPAR 1996). The first spray
should be applied soon after disease
symptoms appear, which may be 45-55
days after sowing for the spring wheatcultivars (Mehta and Igarashi 1985).

Constraints on the Integrated Management of Spot Blotch of Wheat 25
General Co"nslderations
The increase in the severity of some
wheat and soybean diseases has been
linked to changes in cultivation practices.A lack of integration among scientists of
different disciplines may sometimes be a
factor limiting the success of 10M.Undoubtedly, severity of some wheat
diseases can also be affected by the
inadequate and untimely use of differenttechnologies in the preceding and/orsubsequent agro-ecosystems.
The major constraints to 10M are: 1)inadequate resources for research andextension; 2) defective technology transfer
mechanism and inad~quateextension
services; 3) inadequat~ biologicalmonitoring systems;. 4) 10M strategiesbased on commodity and not usually on
production systems; 5) lack of 10Mdemonstrations; 6) inadequateinternational cooperation on plantprotection/quarantine problems; 7) lack
of integration between governmentorganizations and cooperatives, industry
representatives and farmers; 8)
sophisticated and/or costly 10Mprograms; and 9) lack of interdisciplinary
integration. In fact, all these constraints
can be grouped into three majorcategories: political, technological, and
socioeconomic constraints.
Conservation tillage technologies that
avoid soil degradation and disease
management practices that reduce yieldlosses and production costs need to be
combined and harmonized to achieve
successful sustainable 10M programs.
10M technologies must be compatiblewith all other technologies used within
the cropping systems in a particular agro
ecological zone. 10M systems are
regionally based and developed to suitdifferent agro-ecological or crop
production systems. Development of
10M systems should include newapproaches such as varietal mixtures and
crop rotation strategies using non
commercial crops like chickpea, pigeonpea, and common beans wherever
suitable. Pesticides are imported in
developing countries and cropproductivity is generally low. 10Msystems should reduce production costs,stabilize productivity, and, at the sametime, protect the environment.
Reference.
Bohorova, N.E., van Ginkel, M., Rajaram, 5.,and D.A Hoisington. 1995. Tissueculture response of CIMMYT elite breadwheat cultivars and evaluation ofregenerated plants. Cer Res Comm23(3):243-249.
Brown, D.A, and R.M. Hunger. 1993.Production of chlorosis-inducing, hostspecific, low molecular weight toxin byisolates of Pyrenophora tritici-repentis,cause of tan spot of wheat. J Phytopath137:221-232.
Browning, J.A 1988. Current thinking onthe use of diversity to buffer small grainsagainst highly epidemic and variablefoliar pathogens: Problems and futureprospects. In: N.W. Simmonds, and S.Rajaram (eds.), Breeding Strategies forResistance to the Rusts of Wheat.Mexico, D.F.:CIMMYT. 151 pp.
Calegari, A, Mondardo, A, Bulisani, E.A.,Wildner, L.P., Costa, M.B.B., Alcantara,P.D., Miasaka, 5., andT.G.C. Amado.1993. Aduba~ao verde no sui do Brasil.Rio de Janeiro, Brazil: AP-PTA 346 pp.
26 V.A. Mehta
Carlson, H., Nilsson, P., Jansson, H.B., andG. Odham. 1993. Characterization anddetermination of pre-helminthosporol, atoxin from the plant pathogenic fungusBipolarjs sorokiniana, causing liquidchromatography/ mass spectrometry. JMicrobiol Methods 13:259-269.
Diehl, JA, Oliveira, MAR., Igarashi, S.,Reis, E.M., Mehta, YR., and L.S. Gomes.1983. Levantamento da ocorrencia dedoen.;as do sistema radicular do trigo noParana. Fitopatol Bras 9:179-188.
Elliott, L.F., Papendick, R.I., and D.F.Bendicek. 1987. Cropping practices usinglegumes with conservation tillage andsoil benefits. In: J.F. Power (ed.), TheRole of Legumes in the ConservationTillage System. Proceedings of theNational Conference, pp. 81 89. Athens:University of Georgia.
Galerani, P.R. 1994. Cropping systems androtations. In: Tropical SoybeanImprovement and Production. Rome:FAO.254pp.
Hetzler, J., Eyal, J., Fehrmann, H., Mehta,Y.R., Kushnir, U., Zekaria~Oren, J., and L.Cohen. 1991. Interaction betweenCochiobolus sativus and wheat cultivarsIn: D.A. Saunders (ed.), Wheat forNontraditional Warm Areas, pp. 266-283.Mexico, D.F.:CIMMYT.
Iapar. 1996. Recomenda.;6es para 0 cultivode trigo no Estado do Parana. IAPAR,PR, Brazil, Circular No. 89. 116pp.
Jahne, A, Becker, D., Brettsctmeider, R., andH. Lorz. 1994. Regeneration oftransgenic, microspore-derived, fertilebarley. Theor ApPI Genet 89:525-533.
Lamari, L, Ballance, G.M., Orolaza, N.P.,and R. Kowatsch. 1995. In plantproduction and antibody neutralizationof the Ptr necrosis toxin from Pyrenophoratritici-repentis. Phytopathol 85:333-338.
Lamari, L., and CC Bernier. 1989. Toxin ofPyrenophora tritici-repentis: hostspecificity, significance in disease, andinheritance of host reaction. Phytopathol79:740-744.
Leljeroth, E., Franzon-Almgren, and M.Gustafsson. 1993. Effect of prehelminthosporol, a phytotoxin producedby Bipolaris sorokiniana, on barley roots.Can J Bot 72:558-563.
Lazzaretti, E., Menten, J.O.M., and W.Bettiol. 1994. Bacillus subtilis antagonisticto the principal pathogens associatedwith bean and wheat seed. FitopatolVenezolana 7:42-46. (Portuguese).
Luz, W.C 1994. Effect of seedmicrobiolization on grairf yield and oncontrolling common root rot and seedborne pathogens of wheat. FitopatolBras. 19:144-148.
Mehta, YR. 1993. Manejo Integrado deEnfermedades de Trigo. Santa Cruz,Bolivia: CIAT/IAPAR. 314 pp.
Mehta, Y.R. 1996. Varia.;ao somaclonal nasplantas de trigo regeneradas atraves deembriog~nese.Fitopatol Bras 21:(abstract).
Mehta, Y.R., and C Gaud~ncio. 1991. Effectsof tillage practices and crop rotation onthe epidemiology of some major wheatdiseases. In: D.A. Saunders (ed.), Wheatfor the Nontraditional Warm Areas.Mexico, D.F.:CIMMYT. 549 pp.
Mehta, YR., and C Gaud~ncio. 1996. Efeitode rota.;1io de culturas na severidade depodridao comum do trigo no sistema deplantio direto. 1st Congresso Brasileirode Plantio Direto, pp. 62-63. PontaGrossa, Pr: IAPAR.
Mehta, Y.R., and S. Igarashi. 1985 Chemicalcontrol measures for major diseases ofwheat with special attention to spotblotch. In: Proceedings of theInternational Symposium, pp. 196-200.Mexico, D,F.:CIMMYT. 364pp.
Mehta, Y.R., Riede, CR., Campos, LAC,and M.M. Kohli. 1992. Integratedmanagement of major wheat diseases inBrazil: an example for'the Southern Coneregion of Latin America. Crop Prot11:517-524.
Mehta, YR., Campos, L.AC, and E.Guzman. 1996. Resist~ncia genetica decultivares de trigo a Bipolaris sorokiniana.Fitopatol Bras 21:455-459.
Mujeeb-Kazi, A, Rosas, V., and S. Rold-an.1996a. Conservation of the genetfevariation of Triticum tauschii (Coss.)Schmalh. s. la,t. x To taust;hii; 2n=6x=42,AABBDD) and its potential utilizationfor wheat improvement. Genet ResourCrop EvoI43(2):129-134.

Constraints on the Integrated Management of Spot Blotch of Wheet 27
MUjeeb-Kazi, A, Villareal, RL., Gilchrist,L.A, and S. Rajaram. 1996b. Registrationof five wheat germplasm lines resistantto Helminthosporium leaf blight. CropSci 36(1}:216--217.
Olbe, M., Sommarin, M., Gustafsson, M.,and T. Lundborg. 1995. Effect of thefungal pathogen Bipolaris sorokinianatoxin pre-helminthosporol on barley rootplasma membrane vesicles. Plant Pathol44:625-635.
Pratt, RG., Windham, G.L., andMclaughlin. 1987. In: J.F. Power (ed.),The role of legumes in conservationtillage system.J'roceedings of theNational Conference, pp. 79-80.
Rees, R.G. 1987. Effects of tillage practiceson foliar diseases. In: P.S. Comish andJ.E. Pratley (eds.), pp. 318-334.Melboume and Sydney: Inkata Press.
Rees, RG., and G.J. Platz. 1979. Theepidemiology of yellow spot of Wheat insouthem Queensland. Aust J Agric Res31:259-267.
Reis, E.M., and Abrao. 1983. Effect of tillageand wheat residue management on thevertical distribution and inoculumdensity of Cochliobolus sativtts in soil.Plant Disease 67(10}:1088-1089.
Reis, E.M., Santos, H.P., and J.e.B. Lhamby.1983. Rotac;ll.o de culturas. 1. '·Efeito sobredoenc;as radiculares do trigo nos anos1981 e 1982. Fitopatol Bras 8:431-437.
Rothrock, e.S. 1995. Plant diseasemanagement in crop residuemanagement systems. In: Langdale et al(eds.), Crop Residue Management toReduce Erosion and Improve SoilQuality. Conservation Research ReportNo. 39, pp. 25-26. USDA
Rothrock, e.S., and w.L. Hargrove. 1987.Influence of legume cover crops andconservation tillage on soil-bome plantpathogen popUlations. In: J.F. Power(ed.), The Role of Legumes inConservation Tillage Systems.Proceedings of the National Conference,pp.70-71.
Stirn, S., Mordhorst, P., Fuchs, S., and H.Lorz. 1995. Molecular and biochemicalmarkers for embryogenic potential andregenerative capacity of barley (Hordeumvulgare L.) cell cultures. Plant Sci 106:195206.
Stoldt, A, Wang, Xuao-Hui, and H. Lorz.1996. Primary callus as source oftotipotent barley (Hordeum vulgare L.jprotoplats. Plant Cell Rep 16:137-141.
Torres, E., Saraiva, O.F., and P.R Galerani.1994. Soil management and tillageoperations. In: Tropical SoybeanImprovement and Production. Rome:FAO.254pp.
Triller, e., and Y.R Mehta. 1997. Efeito daidade da folha bandeira de trigo naexpressao de resistencia a Bipolarissorokiniana. Summa Phytopathol (inpress).
Vasil,,!., and V. Vasil. 1986. Regeneration incereal and other grass species. In: I. Vasiland V. Vasil (eds.), Cell Culture andSomatic Cell Genetics of Plants. Vol. 3,pp.121-150.
Walton, J.D., and D.G. Panaccione. 1993.Host-selective toxins and diseasespecificity: perspective and progress.Ann Rev Phytopatho131:275-303.
Wolfe, M.S. 1988. The use of varietymixtures to control diseases and stabilizeyield. In: N.W. Simmonds, and S.Rajaram (eds.), Breeding Strategies forResistance to the Rusts of Wheat.Mexico, D.F.:CIMMYT. 151 pp.

28
Components of the Tan SpotDisease Cycle
L. FranclDepartment of Plant Pathology, North Dakota State University, Fargo, USA
Abstract
The disease cycle ofwheat tan spot is being studied both as a model system to test newinformation technology and as a means to better understand the epidemiology ofthiseconomically important disease. Inoculatiot1, infection, and conidial liberation and dispersalwere assessed in the field with a mobile bioassay. Inoculation, conidiation, and liberation wereexamined in growth chambers and using a crude wind tunnel. Pyrenophora tritici-repentis
normally conidiates diurnally, but conidiogenesis proceeded in culture at 13°C in constant lightand on moist wheat leaves at 200C in constant darkness. Fewer conidia were formed on diseasedareas ofleaves subjected to interrupted wet periods than on constantly wet leaves, which bore 22conidia mm-2 after 96 h..The rate ofconidial liberation was lower than expected from studies ondetached leaves. While conidia are relatively large, they may be dispersed further than 10 km inturbulent air flow. Conidiophores were about 4% as infective as conidia, and mycelium waslargely uninfective when susceptible plants were exposed to a 24-h wet period after experimentalinoculation. In North Dakota, environmental conditions conducive to natural inoculation oftencoincided with a suitable infection period. Dew periods after intermittent rains were conduciveto tan spot development, and inoculum potential was much greater afterflowering than before.Artificial neural networks, a novel mathematical processing strategy, outperformed statisticalregression techniques and discriminated daily tan spot infection periods with as much as 87%accuracy. Neural networks thus appear well suited for disease forecasting.
The disease cycle of wheat tan spot isbeing studied at North uakota StateUniversity (NDSU) as a model system to
test new disease forecasting technologyand to better understand the
epidemiology of this economically
important disease. The primary diseasecycle on wheat is initiated by ascospores
and conidia, borne on infested plant
residues, that bridge host croppingperiods (Adee and pfender 1989). The
secondary disease cycle begins withconidiation on post-latent primary lesions
and advances when conidia successfully
liberate, disperse (if the same leaf is notre-inoculated), inoculate, and reinfed
wheat (Figure 1). The secondary cycle
repeats under favorable environmentalconditions until host maturity (Wright
and Sutton 1990).
Each of the secondary disease cycle
components, with the exception of thelatent period, has been studied to date in
the author's lab; research reports are
available elsewhere (De Wolf and Francl
1997; Francl1995; Francl et al. 1995; Francland Jordahl 1994; Riede et al. 1996; Stover
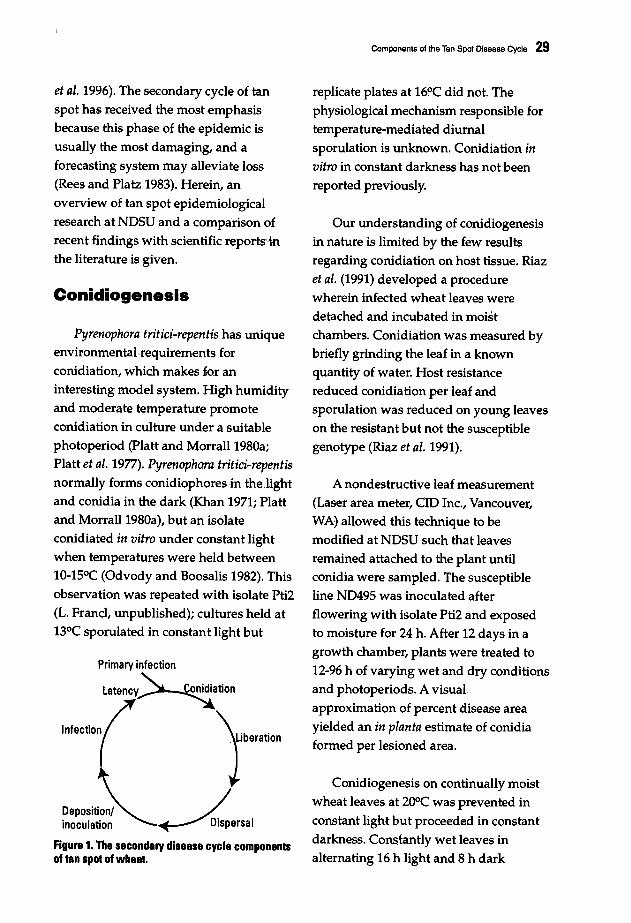
et al. 1996). The secondary cycle of tan
spot has received the most emphasisbecause this phase of the epidemic is
usually the most damaging, and a
forecasting system may alleviate loss(Rees and Platz 1983). Herein, an
overview of tan spot epidemiological
research at NDSU and a comparison ofrecent findings with scientific reports'inthe literature ,is given.
Coni.diogenesis
Pyrenophora tritici-repentis has uniqueenvironmental·requirements forconidiation, which makes for an
interesting model system. High humidityand moderate temperature promote
conidiation in culture under a suitable
photoperiod (Platt and Morrall 1980a;Platt et a1. 1977). Pyrenophora tritici-repentisnormally forms conidiophores in the ,lightand conidia in the dark (Khan 1971; Plattand Morrall 1980a), but an isolate
conidiated in vitro under constant lightwhen temperatures were held between10-15°C (Odvody and Boosalis 1982). This
observation was repeated with isolate Pti2(L. Francl, unpublished); cultures held at
13°C sporulated in constant light but
Primary infection
latency~tion
",,,.o( )b'''.''D.p"m~ /inocUla~~~"-~ispersal
Figure 1. The secondary disease cycle componentsof tan spot of wheat.
Components of the Tan Spot Disease Cycle 29
replicate plates at 16°C did not. The
physiological mechanism responsible fortemperature-mediated diurnal
sporulation is unknown.Conidiation invitro in constant darkness has not beenreported previously.
Our understanding of conidiogenesis
in nature is limited by the few resultsregarding conidiation on host tissue. Riaz
et al. (1991) developed a procedurewherein infected wheat leaves were
detached and incubated in moistchambers. Conidiation was measured bybriefly grinding the leaf in a known
quantity of water. Host resistancereduced conidiation per leaf andsporulation was reduced on young leaves
on the resistant but not the susceptible
genotype (Riaz et al. 1991).
A nondestructive leaf measurement(Laser area meter, CID Inc., Vancouver,WA) allowed this technique to be
modified at NDSU such that leavesremained attached to the plant untilconidia were sampled. The susceptible
line ND495 was inoculated afterflowering with isolate Pti2 and exposed
to moisture for 24 h. After 12 days in a
growth chamber, plants were treated to12-96 h of varying wet and dry conditionsand photoperiods. A visual,
approximation of percent disease area
yielded an in planta estimate of conidia
formed per lesioned area.
Conidiogenesis on continually moistwheat leaves at 200C was prevented in
constant light but proceeded in constant
darkness. Constantly wet leaves in
alternating 16 h light and 8 h dark

30 L. Francl
Conidia mm-2
4..,.---------------,
Figure 2. Photoperiod and moisture durationeffects on conidiogenesis of Pyrenophora tritieirepentis on diseased wheat Illaves.D= Dark. W =Wet/L = Light, D= Dryi.e., DW8/LDI6: Dark Wet 8h and Light Dry 16 h.
periods bore 12 conidia mm-2 lesion after
96 h. Diseased areas of leaves wetted only
during the dark period had 1.7 conidiamm-2 after 96 h. Conidial levels between
constant wetness during alternating
photoperiods and dryness during lightperiods were intermediate when 4-h wet
periods interrupted dry periods duringthe beginning, middle, and end of the
light cycle (Figure 2).
The modified procedure of Riaz et ai.(1991) provided a system to study
liberation in a crude wind tunnel. Air
speed measurements were taken at theheight of flag leaves at fixed distances
from a bank of six fans. Potted adult
plants of ND495 were infected withisolate ptii, incubated for 10-12 days, and
placed in constant wetness in alternating
light and dark cycles for 48 h to promote
conidiation. Two flag leaves were initially
sampled, pots were placed in a known
airflow for 6 or 24 h under ambient RHs<40%, and finally two flag leaves were
Liberation
Conidiation levels were increased when aperiod of wetness occurred at some time
during the light period, suggesting thatevaporation of dew after sunrise or
precipitation during the day may enhance
sporulation in nature.
Liberation and transport of conidia
are necessary for alloinfection in thesecondary disease cycle. Platt and Morrall(1980b) observed that most conidia were
detached from conidiophores after a5 min exposure of sporulating lesions to amoderate air flow passing over the leaf
surface. Low humidity fostered liberationexperimentally and was thought largely
responsible for peaks in conidialoccurrence commonly observed duringdry afternoons (Maraite et ai. 1992;
Morrall and Howard 1975; Platt and
Morrall 1980b). Based on their results,Platt and Morrall concluded that in a low
humidity environment, essentially all
conidia were liberatedthe day afterformation.
9672
-:4.,,.
48Hours
eDW8/LWI6• DW24.a. LW24
2412
o DW8/LDI6o DW8/LW4/LDI2• LDI2/LW4/DW8~LD8/LW4/LD4/DW8
2
3
These results show that conidiogenesisdoes not take place on leaves at a
temperature above 15°C in constant lightand so confirm in vitro results. However,
conidiation on leaves held in constantdarkness differed to in vitro results, yetdata agreed with previously reported invivo results with another diurnalsporulator (Houston and Oswald 1946).Also, conidiation occurred when leaves
were wet only during darkness, whichsuggests that nighttime dew is sufficientfor conidiation in outdoor environments.
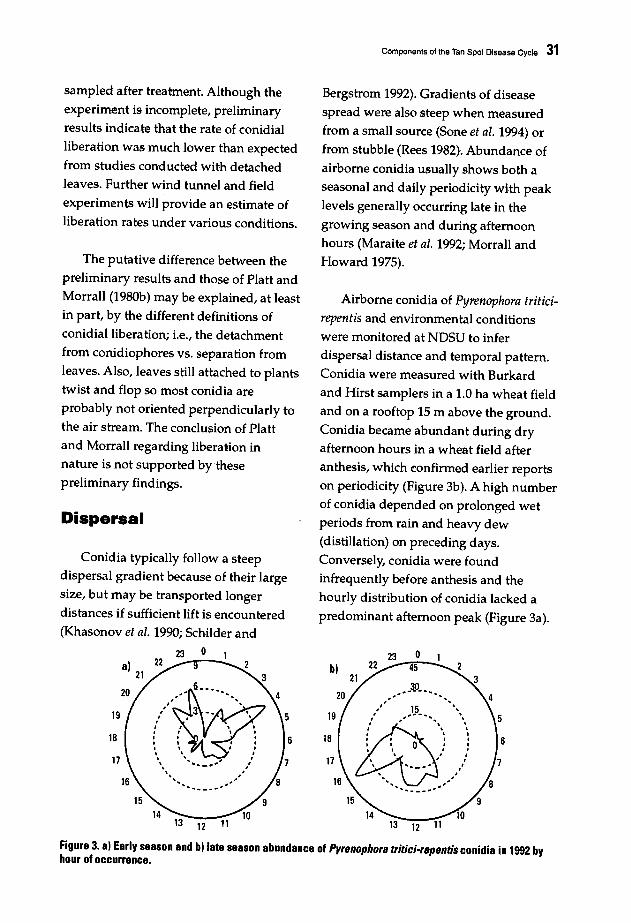
Components of the Tan Spot Disease Cycle 31
Dispersal
Conidia typically follow a steep
dispersal gradient because of their large
size, but may be transported longer
distances if sufficient lift is encountered
(Khasonov et aI. 1990; Schilder and
23 0
18
Airborne conidia of Pyrenophora triticirepentis and environmental conditions
were monitored at NDSU to infer
dispersal distance and temporal pattern.
Conidia were measured with Burkard
and Hirst samplers in a 1.0 ha wheat field
and on a rooftop 15 m above the ground.
Conidia became abundant during dry
afternoon hours in a wheat field afteranthesis, which confirmed earlier reports
on periodicity (Figure 3b). A high number
of conidia depended on prolonged wet
periods from rain and heavy dew
(distillation) on preceding days.
Conversely, conidia were found
infrequently before anthesis and the
hourly distribution of conidia lacked a
predominant afternoon peak (Figure 3a).
Bergstrom 1992). Gradients of disease
spread were also steep when measuredfrom a small source (Sone et aI. 1994) or
from stubble (Rees 1982)~ Abundance of
airborne conidia usually shows both a
seasonal and daily periodicity with peak
levels generally occurring late in the
growing season and during afternoon
hours (Maraite et aI. 1992; Morrall and
Howard 1975).
6
12
17
19
18
The putative difference between the
preliminary results and those of Platt and
Morrall (1980b) may be explained, at least
in part, by the different definitions of
conidialliberatiori; i.e., the detachment
from conidiophores vs. separation from
leaves. Also, leaves still attached to plants
twist and flop so most conidia are
probably not oriented perpendicularly to
the air stream. The conclusion of Platt
and Morrall regarding liberation in
nature is not supported bythese
preliminary findings.
sampled after treatment. Although the
experiment is incomplete, preliminary
results indicate that the rate of conidial
liberation was much lower than expected
from studies conducted with detached
leaves. Further wind tunnel and field
experiments will provide an estimate of
liberation rates under various conditions.
Figure 3. al Early season and bllate season abundance of Pyrenophora tritici-repenti,conidia in 1992 byhour of occurrence.

32 L. Francl
Samples taken from the rooftop showedthat conidia could be found remote from
any potential source. The rooftop conidialincidence was sparse and independent of
field incidence early in the season but wasmore closely coincident with field --'
incidence after anthesis. Wheat plants
became infected by P. tritici-repentis afterrooftop exposure, indicating viableconidia were being dispersed.
Conidia could have traveled from less
than 1 km to more than 10 km afterreaching the roof, according to adeterministic forward trajectory .ril.odel.
Also, conidia had to have traveled somedistance to reach the roof and morecomplex models would be needed to
reproduce faithfully the complexity ofturbulent air flow. Perhaps errors inpredicted distances are sufficiently low
for demonstrative purposes. Whileconidia of P. tritici-repentis are relativelylarge, their seasonal pattern, occurrenceremote from a source, and the trajectory
model indicate that at least some conidiaare dispersed moderate to long distancesin the northern Great Plains.
Inoculation
Tan spot will develop on a susceptiblehost if an infective propagule is deposited
on a receptive surface in a conducive
environment. Although deposition per sehas not been studied at NDSU,
inoculation under controlled conditions
has been refined to some degree (Francl
and Jordahl 1994). Conidiophore
inoculation of wheat seedlings susceptible
to tan spot (ND495) produced a lowerinfection phenotype, fewer infection sites
per cm2, and less severe damage than
conidia at equivalent dosages. Hyphalfragments were rarely infectious under a
24-h post-inoculation wet period. Therelative reaction of a resistant wheatvariety (Erik) to the three types of
inoculum was similar to ND495,
Inoculum concentration and typeparticularly influenced categories of the
infection phenotype scale that includedcoalescence as a criterion. The distal leaf
half was more severely damaged andusually had more infections per unit area
than the proximal half. Infection typedata from the middle of the uppermostfully expanded leaf at the time ofinoculation should effectivelydiscriminate resistant and susceptible
genotypes. Research laboratories thatscreen germplasmmay compare theirresults with some confidence if inoculumdosage, infection period environment,
and collection of information wereuniform.
Infection
Controlled climate re.earchMoisture and temperature are
primary determinants of tan spot
infection; indoor lighting seems to havelittle effect. On susceptible genotypes, a
minimum wet period of 6 h was
necessary for conidial infection ofinoculated leaves (Hosford et al. 1990).
Tan spot severity increased with longer
wet periods on susceptible but notresistant genotypes (Lamari et al. 1992).
Thus, temperatures around 200C and 24 h
of wetness are suitable conditions for
reliable infection (Lamari et al. 1992).
Leaves infected under these conditions
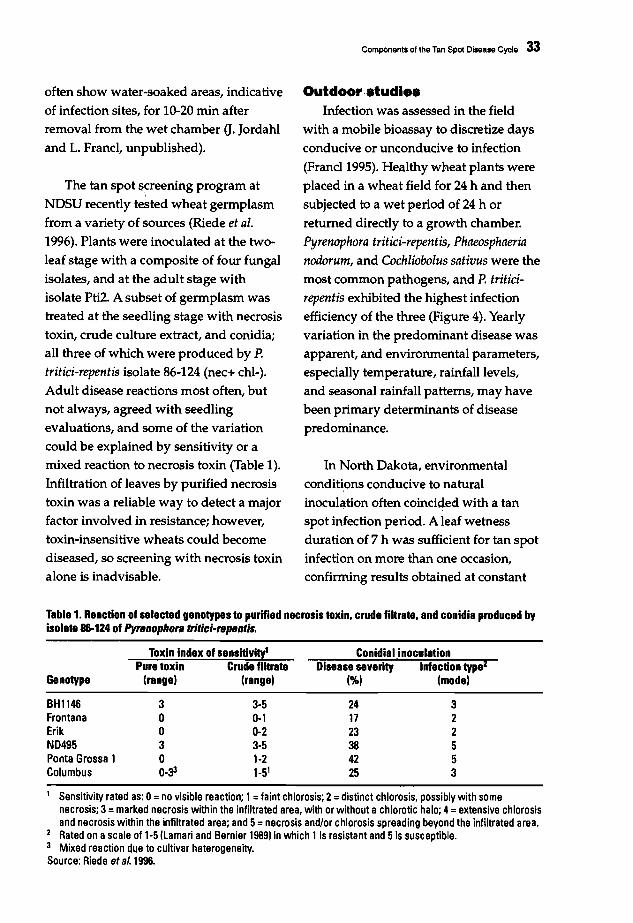
often show water-soaked areas, indicative
of infection sites, for 10-20 min after
removal from the wet chamber a. Jordahland L. Francl, unpublished).
The tan spot screening program at\
NDSU recently tested wheat germplasm
from a variety of sources (Riede et al.1996). Plants were inoculated at the two
leaf stage with a composite of four fungalisolates, and at the adult stage with
isolate Pti2. A subset of germplasm wastreated at the seedling stage with necrosistoxin, crude culture extract, and conidia;
all three of which were produced by P.tritici-repentis isolate 86-124 (nec+ chl-).Adult disease reactions most often, butnot always, agreed with seedling
evaluations, and some of the variationcould be explained by sensitivity or amixed reaction to necrosis toxin (Table 1).
Infiltration of leaves by purified necrosistoxin was a reliable way to detect a majorfactor involved in resistance; however,toxin-insensitive wheats could become
diseased, so screening with necrosis toxinalone is inadvisable.
Components of the Tan Spot Diseese Cycle 33
Outdoor.tudl••Infection was assessed in the field
with a mobile bioassay to discretize days
conducive or unconducive to infection
(Francl1995). Healthy wheat plants wereplaced in a wheat field for 24 h and then
subjected to a wet period of 24 h or
returned directly to a growth chamber.Pyrenophora tritici-repentis, Phaeosphaerianodorum, and Cochliobolus sativus were themost common pathogens, and P. triticirepentis exhibited the highest infectionefficiency of the three (Figure 4). Yearly
variation in the predominant disease wasapparent, and environmental parameters,
especially temperature, rainfall levels,and seasonal rainfall patterns, may havebeen primary determinants of disease
predominance.
In North Dakota, environmental
conditions conducive to natural
inocul~tionoften coincided with a tanspot infection period. A leaf wetness
duration of 7 h was sufficient for tan spotinfection on more than one occasion,confirming results obtained at constant
Table 1. Reaction of selected genotypes to purified necrosis toxin, crude fihrate, and conidia produced byisolate 86·124 of Pyrenophors tritici-rspentis.
Genotype
Toxin index of sensitivity'Pure toxin Crude fihrate
(range) (range)
Conidial inoculationDisease severity Infection typez
(Ofo) (mode)
BHII46FrontanaErikND495Ponta Grossa 1Columbus
3oo3oO-~
3-50-10-23-51-2I-51
241723384225
322553
1 Sensitivity rated as: 0=no visible reaction; 1=faint chlorosis; 2=distinct chlorosis. possibly with somenecrosis; 3=marked necrosis within the infiltrated area, with or without a chlorotic halo; 4=extensive chlorosisand necrosis within the infiltrated area; and 5=necrosis and/or chlorosis spreading beyond the infiltrated area.
2 Rated on ascale of '-5 (Lamari and Bernier 1989) in which' is resistant and 5is susceptible.3 Mixed reaction due to cultivar heterogeneity.Source: Riede et a/. 1996.
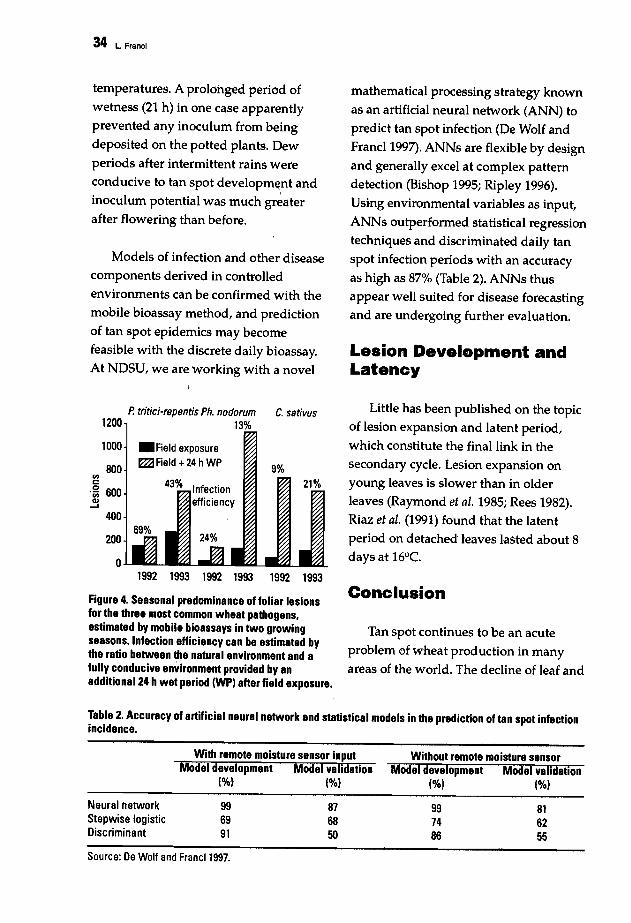
34 L. Franol
temperatures. A prolonged period ofwetness (21 h) in one case apparently
prevented any inoculum from beingdeposited on the potted plants. Dew
periods after intermittent rains wereconducive to tan spot deyelopm~ntand
\
inoculum potential was much greater
after flowering than before.
Models of infection and other diseasecomponents derived in controlledenvironments can be confirmed with the
mobile bioassay method, and prediction
of tan spot epidemics may becomefeasible with the discrete daily bioassay.At NDSU, we are working with a novel
mathematical processing strategy knownas an artificial neural network (ANN) to
predict tan spot infection (De Wolf andFrancl1997). ANNs are flexible by design
and generally excel at complex patterndetection (Bishop 1995; Ripley 1996).
Using environmental variables as input,
ANNs outperformed statistical regressiontechniques and discriminated daily tan
spot infection periods with an accuracyas high as 87% (Table 2). ANNs thusappear well suited for disease forecasting
and are undergoing further evaluation.
Lesion Development andLatency
P. tritici-repentis Ph. nodorum1200 13%
1000
800enc.~ 600~
400
200
o
_Field exposureI::i:Z:IField +24 hWP
43% Infectionefficiency
C. sativus
9%21%
Little has been published on the topic
of lesion expansion and latent period,which constitute the final link in the
secondary cycle. Lesion expansion onyoung leaves is slower than in olderleaves (Raymond et ai. 1985; Rees 1982).Riaz et ai. (1991) found that the latentperiod on detached leaves lasted about 8
days at 16°C.
1992 1993 1992 1993 1992 1993
Figure 4. Seasonal predominance of foliar lesionsfor the three most common wheat pathogens,estimated by mobile bioassays in two growingseasons. Infection efficiency can be estimated bythe ratio between the natural environment and afully conducive environment provided by anadditional 24 h wet period (WP) after field exposure.
Conclusion
Tan spot continues to be an acute
problem of wheat production in many
areas of the world. The decline of leaf and
Table 2. Accuracy of artificial neural network and statistical models in the prediction of tan spot infectionincidence.
With remote moisture sensor inputModel development Model validation
(%) (%)
Without remote moisture sensorModel development Model validation
(%) (%)
Neural networkStepwise logisticDiscriminant
996991
876850
997486
816255
Source: De Wolf and Franc11997.
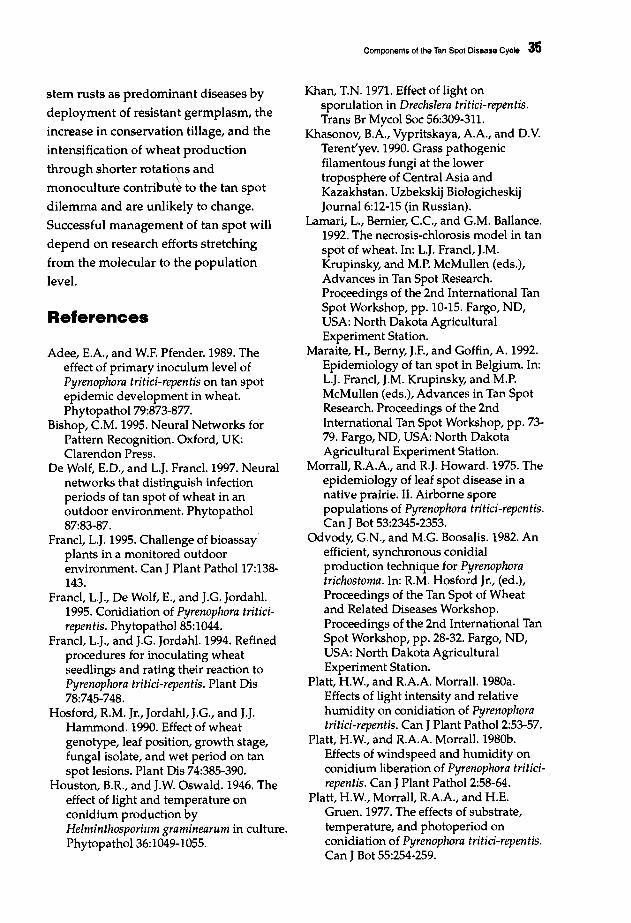
stem rusts as predominant diseases by
deployment of resistant germplasm, the
increase in conservation tillage, and the
intensification of wheat production
through shorter rotations and
monoculture contribut~to the tan spot
dilemma and are unlikely to change.
Successful management of tan spot will
depend on research efforts stretching
from the molecular to the population
level.
References
Adee, E.A., and W.F. pfender. 1989. Theeffect of primary inoculum level ofPyrenophora tritici-repentis on tan spotepidemic development in wheat.Phytopathol 79:873-877.
Bishop, eM. 1995. Neural Networks forPattern Recognition. Oxford, UK:Clarendon Press.
De Wolf, E.D., and L.J. Francl. 1997. Neuralnetworks that distinguish infectionperiods of tan spot of wheat in anoutdoor environment. Phytopathol87:83-87.
Francl, L.J. 1995. Challenge of bioassayplants in a monitored outdoorenvironment. Can J Plant PathoI17:138143.
Francl, L.J., De Wolf, E., and J.G. Jordahl.1995. Conidiation of Pyrenophora triticirepentis. Phytopathol 85:1044.
Francl, L.J., and J.G. Jordahl. 1994. Refinedprocedures for inoculating wheatseedlings and rating their reaction toPyrenophora tritici-repentis. Plant Dis78:745-748.
Hosford, RM. Jr., Jordahl, J.G., and J.J.Hammond. 1990. Effect of wheatgenotype, leaf position, growth stage,fungal isolate, and wet period on tanspot lesions. Plant Dis 74:385-390.
Houston, B.R., and J.W Oswald. 1946. Theeffect of light and temperature onconidium production byHelminthosporium graminearum in culture.Phytopathol 36:1049-1055.
Components of the Tan Spot Disease Cycle 35
Khan, T.N. 1971. Effect of light onsporulation in Drechslera tritici-repentis.Trans Br Mycol Soc 56:309-311.
Khasonov, B.A., Vypritskaya, A.A., and D.V.Terent'yev. 1990. Grass pathogenicfilamentous fungi at the lowertroposphere of Central Asia andKazakhstan. Uzbekskij BiologicheskijJournal 6:12-15 (in Russian).
Lamari, L., Bernier, ee, and G.M. Ballance.1992. The necrosis-chlorosis model in tanspot of wheat. In: L.J. Franc!, J.M.Krupinsky, and M.P. McMullen (eds.),Advances in Tan Spot Research.Proceedings of the 2nd International TanSpot Workshop, pp. 10-15. Fargo, ND,USA: North Dakota AgriculturalExperiment Station.
Maraite, H., Berny, J.F., and Goffin, A. 1992.Epidemiology of tan spot in Belgium. In:L.J. Francl, J.M. Krupinsky, and M.P.McMullen (eds.), Advances in Tan SpotResearch. Proceedings of the 2ndInternational Tan Spot Workshop, pp. 7379. Fargo, ND, USA: North DakotaAgricultural Experiment Station.
Morrall, R.A.A., and RJ. Howard. 1975. Theepidemiology of leaf spot disease in anative prairie. II. Airborne sporepopulatiohs of Pyrenophora tritici-repentis.Can J Bot 53:2345-2353.
Odvody, G.N., and M.G. Boosalis. 1982. Anefficient, synchronous conidialproduction technique for Pyrenophoratrichostoma. In: RM. Hosford Jr., (ed.),Proceedings of the Tan Spot of Wheatand Related Diseases Workshop.Proceedings of the 2nd International TanSpot Workshop, pp. 28-32. Fargo, ND,USA: North Dakota AgriculturalExperiment Station.
Platt, H.W., and RA.A. Morrall. 1980a.Effects of light intensity and relativehumidity on conidiation of Pyrenophoratritici-repentis. Can J Plant PathoI2:53-57.
Platt, H.W, and RA.A. Morrall. 1980b.Effects of windspeed and humidity onconidium liberation of Pyrenophora triticirepentis. Can J Plant Pathol 2:58-64.
Platt, H.W, Morrall, RA.A., and H.E.Gruen. 1977. The effects of substrate,temperature, and photoperiod onconidiation of Pyrenophora tritici-repentis.Can J Bot 55:254-259.
36 L. Francl
Raymond, P.J., Bockus, W.W., and B.L.Norman. 1985. Tan spot of winter wheat:procedures to determine host responSe.Phytopathol 75:686-690.
Rees, RG. 1982. Yellow spot, an importantproblem in the north-eastern wheat areasof Australia. In: RM. Hosford Jr., (eel.),Proceedings of the Tan Spot of Wheatand Related Diseases Workshop, pp. 6870. Fargo, ND, USA: North Dakota StateUniversity.
Rees, RG., and G.J. Platz. 1983. Effects ofyellow spot on wheat: comparison ofepidemics at different stages of cropdevelopment. Aust J Agric Res 34:39-46.
Riaz, M., Bockus, W.W., and M.A Davis.1991. Effects of wheat genotype, timeafter inoculation, and leaf age on conidiaproduction by Drechslera tritici-repentis.PhytopathoI81:1298-1302.
Riede, CR, Francl, L.J., Anderson, J.A,Jordahl, J.G., and S.W. Meinhardt. 1996.Additional lines with resistance to tanspot of wheat. Crop Sci 36:771-777.
Ripley, B.D. 1996. Pattern Recognition andNeural Networks. Cambridge, UK:Cambridge University Press.
Schilder, AM.C., and C.C Bergstrom. 1992.The dispersal of conidia and ascosporesof Pyrenophora tritici-repentis. In: L.J.Francl, J.M. Krupinsky, and M. P.McMullen (eds.), Advances in Tan SpotResearch. Proceedings of the 2ndInternational Tan Spot Workshop, pp. 9699. Fargo, ND, USA: North DakotaAgricultural Experiment Station.
Sone, J., Bockus, W.W., and M.M. Claasen.1994. Gradients of tan spot of winterwheat from a small-area source ofPyrenophora tritici-repentis. Plant Dis78:622-627.
Stover, RW., Francl, L.J., and J.G. Jordahl.1996. Tillage and fungicide managementof foliar diseases in a spring wheatmonoculture. J Prod Agric 9:261-265.
Wright, K.H., and J.C Sutton. 1990.Inoculum of Pyrenoplwra tritici-repentis inrelation to epidemics of tan spot ofwinter wheat in Ontario. Can J PlantPathoI12:149-157.
37
Leaf Blight Diseases and AssociatedSoilborne Fungal Pathogens of Wheat inSouth and Southeast Asia
E.E. Saari
CIMMYT, Kathmandu, Nepal
Abstract
There are two helminthosporium leaf blight (HLB) diseases in South Asia: Bipolarissorokiniana and Pyrenophora tritici-repentis, causing spot blotch and tan spot, respectively.Spot blotch dominates in the warmer, humid areas, whereas tan spot prevails in cooler seasonsin north-central India and southern Nepal. In eastern India, Bangladesh, and countries ofSoutheast Asia, B. sorokiniana is often the only HLB species isolated. HLB increased inimportance after the "green revolution." Three factors appear to be responsible: the rice-wheatcropping system, an increase in inoculum potential associated with this system, and theincorporation of leaf rust resistance. HLB has been obscured where LR has dominated. Breedingfor HLB resistance MS been difficult. The spot blotch pathogen is genetically dynamic andovercomes resistance. Tolerance or slow disease development is often associated with latematurity. The economic losses due to spot blotch exceed 20% in South Asia. Losses caused bytan spot are not well documented and often confounded because wheat is either a minor or anexperimental crop in Southeast Asia. Spot blotch is a limitingfactor to wheat production; it isexplosive, and complete crop loss is possible. Without disease resistance or an economicalfungicide treatment, wheat production in these environments is hazardous.
There are numerous foliar leaf blights,and seedbome and soilborne diseases
reported on wheat (Mathur and Cunfer
1993; Prescott et al. 1986; Wiese 1987;Zillinsky 1983). Many of these are found
in South and Southeast Asia (Alam et al.1994; Bhatti and Ilyas 1986; Dubin andvan Ginke11991; Duy and Dinh 1994;
Hafiz 1986; Joshi et al. 1978; Karki and
Karki 1996; Kulkarni and Naragund 1986;Lapis 1985a; Minh 1991; Nema 1986; Saari
1985, 1986; Saunders 1988; Sharma 1996;
Sharma et al. 1996; Singh and Srivastava1997). In these regions, the important leaf
blights are caused by fungi. The leafblight diseases represent a complex, and
are collectively referred to ashelminthosporium leaf blight (HLB). Two
of the most common diseases, spot blotch
and tan spot, are caused by the fungiBipolaris sorokiniana (Sacc. in Sorok.)
Shoem., and Pyrenophorti tritici-repentis(Died.) Drechs., respectively.
A common leaf blight fungus
reported from India is Alternaria triticinaPras. & Prab. It is considered to be an
important wheat pathogen that causes
significant losses (Joshi et al. 1986; Nema1986; Singh and Srivastava 1997). It is
prevalent in the central, eastern, and
southern wheat growing areas of India.

38 E.E. Saari
In re.cent surveys, i~s relative frequenl;,y
seems to be declining, possibly due to theavailability of more resistant varieties
(Singh and Srivastava 1997). Symptoms of
the three leaf blights are difficult todistinguish in the field. Even microscopic
viewing may not clearly resolve cause
and effect.
The other reported leaf blight
pathogens appear to be moreopportunistic or facultative in nature.They are encountered sporadically and
are seldom important on a national scale,but can cause losses in individual fields
Goshi et al. 1986; Joshi et al. 1978; Nema1986). Results from the questionnaire onthe fungal wheat diseases in tropical andsubtropical climates, distributed by
Dubin and van Ginkel in 1991, has beenupdated for the fungal pathogens ofSouth and Southeast Asia (Table 1).
The perfect stage (teleomorph) of the
HLB and Alternaria fungi does not occurin nature in South or Southeast Asia. Theteleomorph of spot blotch, Cochliobolussativus (Ito & Kuribay.) Drechs. ex Dastur.,
has been reported to occur in nature inZambia (Raemaekers 1988). The
teleomorph of the tan spot pathogen is
Pyrenophora tritid-repentis, which occursin more temperate climates where zero
tillage cultivation is practiced (Hosford1982; Mehta 1991, 1993; Reis 1991). The
tan spot disease has not been reported to
occur in Southeast Asia, except for one
report from Thailand (Hosford 1982;Schilder and Bergstrom 1993). This means
that the three leaf blight fungi survive in
the asexual form (anamorph) in theirrespective areas. Conidia or mycelia are
the forms isolated and identified from
leaf, soil, and crop debris specimens, andfrom collateral hosts (Nema 1986; Hafiz
1986; Karki 1982; Karki and Karki 1996;
Kishwar et al. 1992; Sharma et al. 1996;Singh and Srivastava 1997).
Spot blotch is considered to be themost common and widespread disease in
the three ecological zones established by
Fischer (1985) and used by Dubin andvan Ginkel (1991) to distinguish climateand disease in the non-traditional wheat
areas. The three zones were separated onthe basis of coolest month Ganuary) meantemperature: 1) very hot >22.5 °C, 2) hot
>17.5°C, and 3) warm >12.5°C. In thethree zones, where high relative humidity
(RH) or dew is common, the spot blotch
disease appears to be dominant (Dubinand van Ginke11991; Sharma 1996;
Sharma et al. 1996; Singh and Srivastava1997). Bipolaris sorokiniana has beenreported as the most frequently isolatedfungus from diseased samples (Alam et al.1994; Sharma 1996; Sharma et al. 1996).Tan spot seems to be restricted to thecooler regions of South Asia.
The three leaf blight diseases (spot
blotch, tan spot, and alternaria blight)have been recorded inmost wheat
growing areas of India Goshi et al. 1978,
Nema 1986, Sharma et al. 1996),Bangladesh (Alam et al. 1994), and Nepal(Dahal et al. 1992; Karki 1982; Karki and
Karki 1996; Sharma 1996). In Pakistan,
however, blight diseases of wheat are
considered to be of minor importance.
Reference to the blight diseases can be
found (Bajwa 1985; Bhatti and lIays 1986;Hafiz 1986), but they are seldom
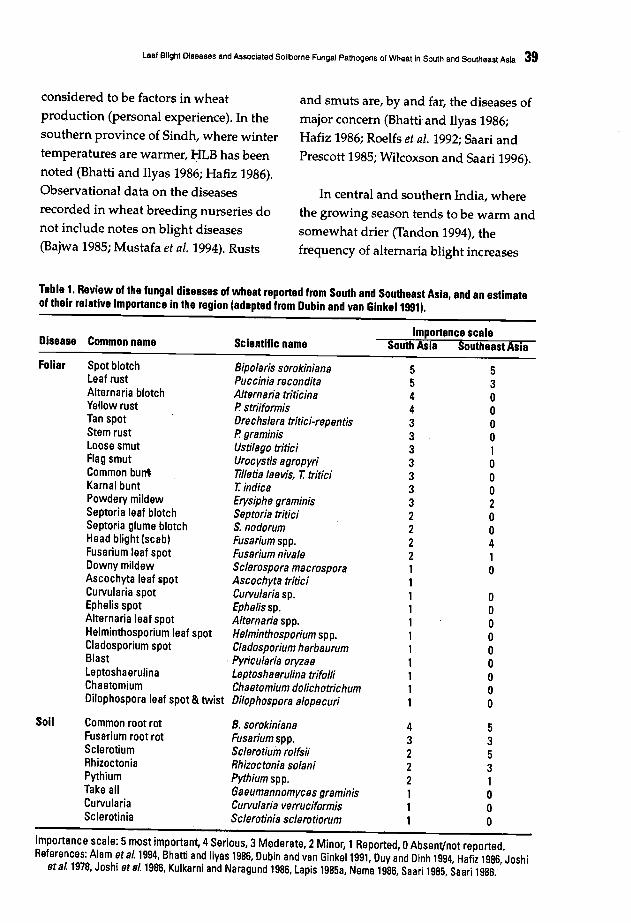
Leaf Blight Diseases and Associaled Soilborne Fungal Pathogens of Wheat in South and Southeast Asia 39
considered to be factors in wheat
production (personal experience). In the
southern province of Sindh, where winter
temperatures are warmer, l:iLB has beennoted (Bhatti and Ilyas 1986; Hafiz 1986).
Observational data on the diseasesrecorded in wheat breeding nurseries do
not include notes on blight diseases(Bajwa 1985; Mustafa et ai. 1994). Rusts
and smuts are, by and far, the diseases of
major concern (Bhatti and Ilyas 1986;Hafiz 1986; Roelfs et ai. 1992; Saari and
Prescott 1985; Wilcoxson and Saari 1996).
In central and southern India, where
the growing season tends to be warm andsomewhat drier (Tandon 1994), the
frequency of alternaria blight increases
Tablet Review of the fungal diseases of wheat reported from South and Southeast Asia, and an estimateof their relative Importance in the region (adapted from Dubin and van GlnkeI1991).
Importance scaleDisease Common name Scientific name South Asia Southeast Asia
Foliar Spot blotch 8ipolaris sorokiniana 5 5Leaf rust Puccinia recondita 5 3Alternaria blotch Alternaria triticina 4 0Yellow rust P. striiformis 4 0Tan spot Drechslera tritici·repentis 3 0Stem rust P. graminis 3 0Loose smut Ustilago tritici 3 1Flag smut Urocystls agropyri 3 0Common bunt Tilletia laevis, T. tritici 3 0Karnal bunt T. indica 3 0Powdery mildew Erysiphe graminis 3 2Septoria leaf blotch Septoria tritici 2 0Septoria glume blotch S. nodorum 2 0Head blight (scab) Fusarium spp. 2 4Fusarium leaf spot Fusarium nivale 2 1Downy mildew Sclerospora macrospora 1 0Ascochyta leaf spot Ascochyta tritici 1Curvularia spot Curvularia sp. 1 0Ephelis spot Ephelissp. 1 0Alternaria leaf spot Alternaria spp. 1 0Helminthosporium leaf spot Helminthosporium spp. 1 0Cladosporium spot Cladosporium herbauruni 1 0Blast ' Pyricularia oryzae 1 0Leptosha erulina Leptoshaerulina trifolli 1 0Chaetomium Chaetomium dolichotrichum 1 0Dilophospora leaf spot & twist Dilophospora alopecuri 1 0
Soil Common root rot 8. sorokiniana 4 5Fusarium root rot Fusarium spp. 3 3Sclerotium Sclerotium roltsii 2 5Rhizoctonia Rhizoctonia solani 2 3Pythium Pythium spp. 2 1Take all Gaeumannomyces graminis 1 0Curvularia Curvularia verruciformis 1 0Sclerotinia Sclerotinia sclerotiorum 1 0
Importance scale: 5 most important, 4 Serious, 3 Moderate, 2Minor, 1Reported, 0Absent/not reported.References: Alam et al 1994, Bhatti and lIyas 1986, Dubin and van Ginke11991, Duy and Dinh 1994, Hafiz 1986, Joshi
et al. 1978, Joshi et al. 1986, Kulkarni and Naragund 1986, Lapis 1985a, Nema 1986, Saari 1985, Saari 1986.
40 E.E. Saari
(Nema 1986; Singh and Srivastava 1997).Bipolaris sorokiniana is still the principlefungus recovered in laboratory isolations,followed by A. triticina (Sharma et al. 'I
1996). The tan spot fungus, P. triticirepentis, was recorded much lessfrequently. The low levels of P. triticirepentis recovered may reflect difficultiesencountered in isolating the pathogenfrom infected leaves (Schilder andBergstrom 1993), and its slower growth inculture, which can often be overgrown bythe prolific spot blotch fungus. It has beenreported that B. sorokiniana can also beantagonistic to P. tritici-repentis (Luz andBergstrom 1987). Using differentobservation techniques or isolationprocedures, the percentage of isolatesreported could be shifted.
Occasionally, the tan spot diseasedominates in the cooler areas or seasonsin the north central area of India andsouthern Nepal (Dubin and Bimb 1991;Dubin and van Ginkel 1991; Karki andHosford 1986; Karki 1982; Ruckstuhl 1994;Saari, unpublished). In warmer seasons, itappears that B. sorokiniana establishesearly and dominates. Nema (1986),however, reported that McRae in 1922found P. tritid-repentis to be morecommon at Pusa, Bihar, then B.
sorokiniana. Nema also reported that, inhis studies on spore trapping, highercumulative spore counts of P. triticirepentis were obtained at Pusa, Bihar. Inthe warmer areas of eastern India (Bihar,Orissa, West Bengal), Bangladesh, and thecountries of Southeast Asia, the dominantleaf blight fungus appears to be B.sorokiniana, and, in most cases, few or noother leaf blight causing fungi are
reported (Alam et al. 1994; Duy and Dinh1994; Dubin and van Ginkel 1991; Lapis1985a; Minh 1991; Raymundo 1992; Saari,unpublished data).
The HLB diseases have been presentfor many years Goshi et al. 1986; Nema1986; Misra 1973; Saari and Wilcoxson1974), but were not considered to be ofmajor importance until after the"greenrevolution" (Alam et al. 1994; Devkota1994; Joshi et al. 1978; Karki 1982;Razzaque and Hossain 1991). At leastthree factors seem to be involved in thisobservation or perceived change in thedisease situation. A primary factor is theadoption and expansion of the rice-wheatcropping system. This system was notWidely practiced in South Asia until theintroducut:ion of the early maturing'semidwarf rice and wheat cultivars (Hobbsand Morris 1996).
The strong association of HLB withthe rice-wheat system is not fullyunderstood. Two possibilities could be anincrease in the inoculum potential, or apredisposition for the dis~ase. The wheatcrop sown in November or Decemberbecomes infected at an early growth stageand increases rapidly (Alam etal. 1994). Itis likely that the primary inoculum of theHLB fungi comes from severaJ sourcessuch as weed hosts, soil, crop debris, selfsown plants, and as seedborne infections,as it does in other regionS of the world(DuveiHer and Gilchrist 1994;,Mehta 1996;Nema 1986; Raemaekers 1988; Reis 1991;Schilder and Bergstrom 1993). The role ofrice'as a passive host, epiphyte, or a
supp0t:ter ,of the saprophytic growth ofthe HLB fungi needs to be ,determined. ,
Leaf Blight Diseases and Associated Soilborne Fungal Pathogens of Wheat In South and Southeast Asia 41
Rice has been reported as a host species
for the spot blotch and tan spot fungus ininoculated trials in India (Misra 1973).
Rice stubble may also play an important
role as a substrate for the fungi after riceharvest is completed.
The role of grass weeds as a collateralhost of B. sorokiniana in the rice-wheat
system must be considered as a possiblereason for the perceived increase in HLB.·Phalaris minor Retz. has become a major
weed in the rice-wheat system, and ifunchecked can cause major losses (Hobbs .
and Morris 1996). This weed, and other
grass weeds, act as a host for the spotblotch fungus (Nema 1986; Sharma et at.1996), but their role in the epidemiology
of the disease has not been determined.
Seed infection is considered to be amajor source of primary inoculum for the
spot blotch disease (Lapis 1985a; Mehta1991; Mehta 1993). Sowing infected seedscan result in the early establishmentofleaf infection, damping off, and root rot
(Duveiller and Gilchrist 1994; Lapis1985a; Reis 1991; Schilder and Bergstrom1993).
Leaf rust of wheat was considered to
be the most important disease oil thesubcontinent during the 1970s and early
1980s. Leaf rust establishes itself early on
young seedling plants and multipli~s
rapidly Goshi 1986; Nagarajan and Joshi1985). Under such circumstances, leaf rust
dominates the leaf surfaceatea, andblight fungi are not apparent. Today there
are many cultivars available with goodlevels of leaf rust resistance; h,owever, if
new rac:e(s) of leaf ·rust evolve that can:
overcome these resistances, it could again
become the dominant disease (Roelfs et al.1992).
The early efforts to breed forresistance or tolerance to B. sorokinianawas inadequa.te, and variation for
resistance in the hexaploid wheats hasbeen limited (Dubin and Rajaram 1996;
Duveiller and Gilchrist 1'994; Gilchrist etal. 1991; Hetzler et al. 1991). The
resistances identified for spot blotch werenot robust, and tolerance has been
fleeting (personal experience). Many so.called resistant or tolerant selections did
not persist over time. The pathogenic
plasticity of the B. sorokiniana fungusseems to be large (Hetzler et al. 1991;Singh and Srivastava 1997). The fungus
evolves and overcomes 'resistance,making it difficult to capture. Tolerance,
or the ·slower rate of diseasedevelopment, appears to be involved, andthis has often been associated with latermaturity (DuveiHer and Gilchrist 1994).
'In spite of a lack of good resistance
sources 'in the hexaploid wheats, breedingprogress for tolerance or partial resistance
has been achieved (Dubin and Rajaram
1996; Dubin and van Ginke11991;
Duveiller and Gilchrist 1994). Byrecurrent selection and re-combinations
of the best lines, genetic gains for
reducing losses to HLB are beingexperienced. The extensive search for
resistance in related and alien species has
pr_ovided a number of new' resistancesources (Dubin and Rajaram 1996; Hetzler
1991; Villareal et al. 1995). These sources
may require intensive bl'eedingandselection, but in earlyevaluCl;tions, a
42 E.E. Saari
number of wide cross derivatives from
Thinopyrum curvifolium are showingpromise, involving several genes for )
resistance (Dubin and Rajaram 1996).
Hopefully, these new sources of resistance
will significantly contribute to thedevelopment of durable resistance.
Yield losses caused by the blightdiseases are considerable in South Asia
(Dubin and van GinkeI1991). Numeroustrials estimate the losses to be in exces$of
20%, depending on cultivar susceptibility
and climate. Older varieties and varietiessusceptible to leaf rust tended to suffergreater losses. Late sowing also
dramatically increases yield loss. For 'example, in Bangladesh, the late sowingof the two leaf rust susceptible cultivars
Sonalika and Kanchan resulted in a. yieldloss of 71% and 41%, respectively
(Badaruddin et ai. 1994). Sonalika is theolder variety, and Kanchan is now thedominant cultivar. In Nepal, the cultivar
RR 21 (=Sonalika) is susceptible to leafrust but is still grown. In protected yieldtrials, the yield loss of RR 21 was 34.4%,compared with 16.7% in the more widely
grown leaf rust resistant cultivar UP 262(Bhatta 1997).
Dubin and van Ginkel (1991)summarized the loss data available, and
these reports, together with newer studies
from the South Asia region, have b~encombined in Table 2. The average yield
loss due to leaf,blights for South Asia is
calculated at 19.6%. If the two extreme or
unusually severe loss figures for
Bangladesh are excluded, the calculated
average loss in yield is reduced to 16.9%.This figure tends to agree more with the
majority of the yield loss estimates, and
falls into the general range of loss figures
reported.
Soilborne diseases are considered to
be important to yield stagnation, and area major issue in sustainability. A number
of known wheat pathogens have beenidentified from South and Southeast Asia
Goshi et ai. 1978; Kulkarni and Naragund
1986; Saari 1986). The most commonly
reported soil and seedborne pathogensare fungi, although there are occasional
bacterial and nematode pathogensencountered (Alam et ai. 1994; Duveiller etai. 1991; Joshi et ai. 1986; Joshi et ai. 1978;Kulkar~i and Naragund 1986; Mathurand Cunfer 1993; Saari 1986; Sharma et ai.1996). In the survey carried out by Dubin
and van Ginkel (1991), five pathogenicfungi were mention~dby respondents,with Sclerotium rolfsii being considered themost serious soilborne pathogen,followed by Fusarium spp. Bipoiarissorokiniana has been reported to be the
principal fungus invoJved in the seedlingblight and root rot of wheat in Pakistan(Bhatti et ai. 1986; Hafiz 1986; Kishwar etai. 1992). Saksena reported (Wilcoxsonand Saari 1974) an increase in the
incidence of rhizoctonia seedling blight
and root rot in the double crop rice-wheatsystem. A number of other fungi have
been reported (Alam et ai. 1994;Joshi et ai.1986; Lapis 1985a; Nema 1986), and thelist of known soil and seed associated
fungal pathogens of wheat have been
irtcluded in Taple 1.
Seed and soilborne inoculum are
important in the esti;lblishment of leaf
blight and the initiation of seedling blight
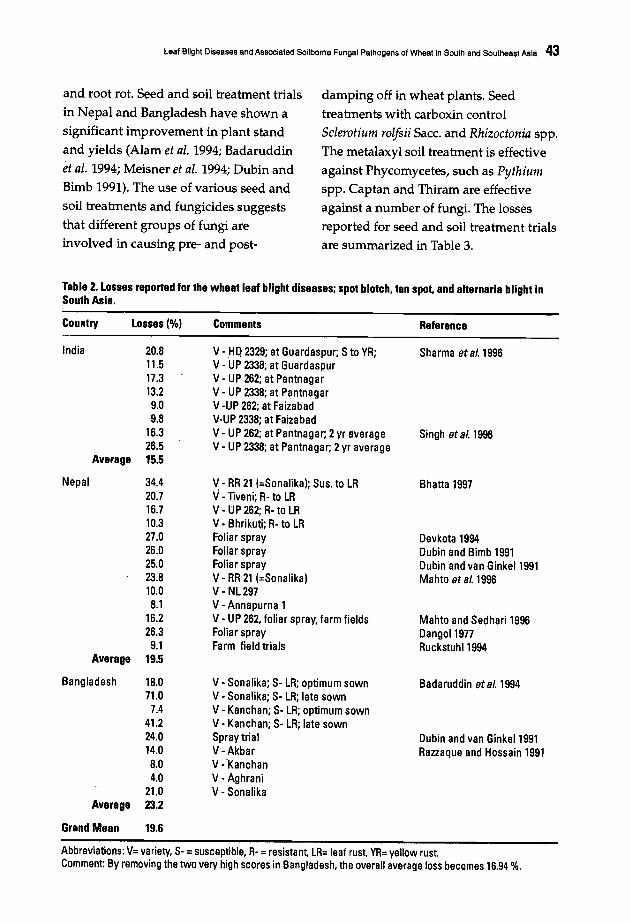
Leaf Blight Diseases and Associated Soilborne Fungal Pathogens of Wheat in South and Southeast Asia 43
and root rot. Seed and soil treatment trials
in Nepal and Bangladesh have shown asignificant improvement in plant stand
and yields (Alam et al. 1994; Badaruddinet al. 1994; Meisner et al. 1994; Dubin and
Bimb 1991). The use of various seed and
soil treatments and fungicides suggeststhat different groups of fungi are
involved in causing pre- and post-
damping off in wheat plants. Seed
treatments with carboxin control
Sclerotium rolfsii Sacco and Rhizoctonia spp.
The metalaxyl soil treatment is effective
against Phycomycetes, such as Pythiumspp. Captan and Thiram are effectiveagainst a number of fungi. The losses
reported for seed and soil treatment trialsare summarized in Table 3.
Table 2. losses feported fOf the wheat leaf blight diseases; spot blotch, tan spot, and altefnafla blight inSouth Asia.
CountfY losses (%) Commehts Refefence
India 20.8 V-HQ 2329; at Guardaspur; Sto YR; Sharma et a/. 199611.5 V- UP 2338; at Guardaspur17.3 V- UP 262; at Pantnagar13.2 V- UP 2338; at Pantnagar9.0 V-UP 262; at Faizabad9.8 V-UP 2338; at Faiza bad
16.3 V- UP 262; at Pantnagar; 2yr average Singh et a/. 199626.5 V- UP 2338; at Pantnagar; 2yr average
Avefage 15.5
Nepal 34.4 V- RR 21 (=Sonalika); Sus. to LR Bhatta 199720.7 Ij -liveni; R- to LR16.7 V- UP 262; R- to LR10.3 V- Bhrikuti; R- to LR27.0 Foliar spray Devkota 199426.0 Foliar spray Dubin and Bimb 199125.0 Foliar spray Dubin and van Ginkel199123.8 V- RR 21 (=Sonalika) Mahto et a/. 199610.0 V -NL2978.1 V- Annapurna 1
16.2 V- UP 262, foliar spray, farm fields Mahto and Sedhari 199626.3 Foliar spray Dangol1977
9.1 Farm field trials Ruckstuhl1994Avefage 19.5
Bangladesh 18.0 V- Sonalika; S- LR; optimum sown Badaruddin et a/. 199471.0 V- Sonalika; S- LR; late sown
7.4 V- Kanchan; S- LR; optimum sown41.2 V· Kanchan; S- LR; late sown24.0 Spray trial Dubin and van Ginkel199114.0 V· Akbar Razzaque and Hossain 19918.0 V·"Kanchan4.0 V· Aghrani
21.0 V- SonalikaAvefage 23.2
Gfand Mean 19.6
Abbreviations: V= variety, S- =susceptible, R- =resistant LR= leaf rust, YR= yellow rust.Comment: By removing the two very high scores in Bangladesh, the overall average loss becomes 16.94 %.
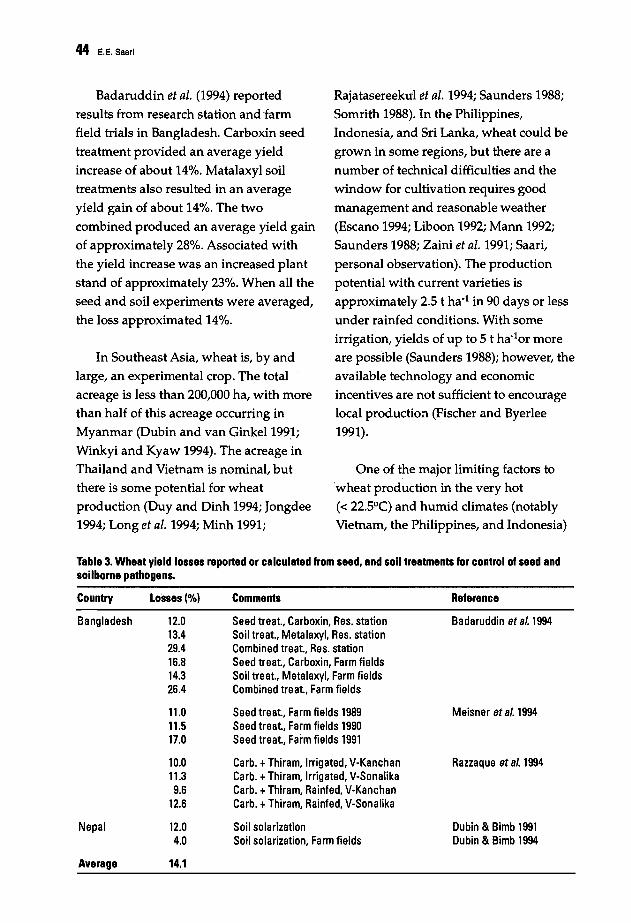
44 E.E. Saari
Badaruddin et al. (1994) reportedresults from research station andiarmfield trials in Bangladesh. Carboxin seed
treatment provided an average yield
increase of about 14%. Matalaxyl soiltreatments also resulted in an average
yield gain of about 14%. The two
combined produced an average yield gain
of approximately 28%. Associated with
the yield increase was an increased plant
stand of approximately 23%. When all theseed and soil experiments were averaged,the loss approximated 14%.
In Southeast Asia, wheat is, by and
large, an experimental crop. The totalacreage is less than 200,000 ha, with morethan half of this acreage occurring in
Myanmar (Dubin and van Ginkel 1991;
Winkyi and Kyaw 1994). The acreage inThailand and Vietnam is nominal, but
there is some potential for wheatproduction (Duy and Dinh 1994; Jongdee1994; Long et al. 1994; Minh 1991;
RajatasereekuI et al. 1994; Saunders 1988;
Somrith 1988). In the Philippines,Indonesia, and Sri Lanka, wheat could be
grown in some regions, but there are a
number of technical difficulties and thewindow for cultivation requires good
management and reasonable weather
(Escano 1994; Liboon 1992; Mann 1992;
Saunders 1988; Zaini et al. 1991; Saari,
personal observation). The production
potential with current varieties isapproximately 2.5 t ha-1in 90 days or less
under rainfed conditions. With someirrigation, yields of up to 5 t ha-1or more
are possible (Saunders 1988); however, the
available technology and economicincentives are not sufficient to encouragelocal production (Fischer and Byerlee
1991).
One of the major limiting factors to'wheat production in the very hot
« 22.5°C) and humid climates (notablyVietnam, the Philippines, and Indonesia)
Table 3. Wheat yield losses reported or calculated from seed, and soil treatments for control of seed andsoilborne pathogens.
Country LoSses ("!o) Comments Reference
Bangladesh 12.0 Seed treat., Carboxin, Res. station Badaruddin et e/. 199413.4 Soil treat., Metalaxyl, Res. station29.4 Combined treat., Res. station16.8 Seed treat., Carboxin, Farm fields14.3 Soil treat., Metalaxyl, Farm fields26.4 Combined treat., Farm fields
11.0 Seed treat., Farm fields 1989 Meisner et at. 199411.5 Seed treat., Farm fields 199017.0 Seed treat., Farm fields 1991
10.0 Carbo +Thiram, Irrigated, V-Kanchan Razzaque et e/. 199411.3 Carbo +Thiram, Irrigated, V-Sonalika9.6 Carbo +Thiram, Rainfed, V-Kanchan
12.6 Carbo +Thiram, Rainfed, V-Sonalika
Nepal 12.0 Soil solarization Dubin & Bimb 19914.0 Soil solarization, Farm fields Dubin & Bimb 1994
Average 14.1
Leaf Blight Diseases and Associated Soilborne Fungal Pathogens of Wheat in South and Southeast Asia 45
are the various diseases of wheat. The
most important dis~ase is HLB, caused byB. sorokiniana (Lapis 1985a; Mann 1992;
Saari 1986; Saunders 1988). A number of
soilborne pathogens are also present,causing both seedling blights and root
rots. The soilborne fungus S. rolfsii is a
major contributor to the root rot complex,and losses of up to 60% have been noted(Saunders 1988). Other important
seedling blights are caused by Rhizoctoniaspp.; Fusarium spp. cause both root rotand head blight where rain showers occur
after heading. Leaf rust and powderymildew are considered to be potentikl
problems in some areas (Danakusuma1985; Duy and Dinh 1994; Minh 1991).
A number offungicides have been
used to assess losses caused by spotblotch in the Philippines (Saunders 1988).
The fungicide propiconazole gave thebest control of spot blotch, and resulted ina 65% yield gain (Lapis 1985b). In years
when rains occurs late in the crop cycle,especially during grain filling, yield
losses can ,be staggering and completeloss of the crop has been observed(Saunders 1988; Saari, personal
observation). In the 1987/88 crop cycle in
northern Luzon, the Philippines, unusualrains resulted in severe leaf blight and
root rot. The highest yield obtained was
805 kg ha- t compared to the best yieldfrom the year before of 3,419 kg ha- t
(Layaoen 1993). This represents a high
risk situation which is difficult for the
farmers to accept. Even if rains do not
occur, high RH seems tc> be cc>nducive to
HLB development. In 1982 there.were few
late rains, yet severe spot blotchdeveloped, and some wheat trials and
farm demonstrations were lost. When
mean temperatures in the area average25-28°C, and the RH is above 70%, spot
blotch continues to develop (Lapis 1985a;Raymundo 1992).
Wheat production is limited bydisease in the countries of Southeast Asia
with very hot and humid climates(Fischer 1985). Spot blotch and associated
seed and soilborne disease complexes aremajor production constraints. Until better
resistance and crop managementtechnologies are combined, wheatcultivation remains marginal. In countries
where mean temperatures are considered
to be very hot «22.5°C) or hot «17.5°C),but the RH edges below 70% and dews
are less of a factor, some wheatcultivation is possible. Under theseconditions, spot blotch development is
much reduced. The countries of
Myanmar, Thailand, and possibly someareas in Laos and Vietnam fit thissituation.
In South Asia, in the hot and the
warm «22.5°C) climates, where dews area regular feature for extended periods,the blight diseases develop and caUse
significant disease levels and yield loss.
Evidence suggests that older varietiessuffer greater loss than newer cultivars.
This indicates that some progress has
been achieved in breeding for tolerance.
The results also suggest that the
combination of leaf rustand blight causes
more damage, and late sowing magnifiesyield losses.
In the central, eastern, and southern
regions of India, the terai of Nepal, and

46 E.E. Saari
throughout Bangladesh, the most
important wheat diseases today are theleaf blight diseases and associated seed
and soilborne diseases. This is the result
of the control of leaf rust. The importance
of leaf blight diseases may also be relatedto the expansion of the rice-wheat
cropping system. It should be pointedout, however, that not all of the area
vulnerable to blight diseases is under the
rice-wheat system. It is estimated that inSouth Asia, approximately 11-12 million
ha are under the rice-wheat croppingsystem, while the total wheat areaexceeds 30 million ha (Hobbs and Morris
1996).
Yield losses caused by both foliar andsoilborne diseases are significant when
measured in research and on-farm trials.Losses caused by leaf blights vary greatly,but it seems reasonable to say that theyaverage around 16-17%. Losses caused byseed and soilborne disease complexes can
vary greatly from field to field, which hasmade quantification more difficult. Thefigures currently available suggest that
these losses can average around 14%. Ifthese average losses are extrapolated overthe vulnerable area, the total production
lost is significant. For South Asia, an
attempt has been made to calculate thelosses caused by leaf blights, and these
results are given in Table 4. The area andproduction figures were taken from .
different sources. The state, province, or
area production of wheat was multiplied
by an average loss value of 8.47%, which
represents half of the calculated loss
figure of 16.94% (see Table 2). The use of
half the measured average loss is a
conservative approach, but tends to agree
with the differences in the general onfarm yield and demonstration trials
where researchers' yields are comparedwith farmers' yields. For example, the
Indian "Front Line" farm wheat
demonstrations in Uttar Pradesh, India,averaged 4.5 t ha-1 in 1995, whereas the
Uttar Pradesh state yield average was 2.2
t ha-1 (Nagarajan and Joshi 1995).
The unit area production was
multiplied by the average calculated loss(8.47%), which was then multiplied by a
vulnerability index. This index is anarbitrary estimate of incidence or overall
vulnerability of the crop in a givengeographical zone or area. The overall
calculated loss comes to between 2·3million t, and may actually be more. Thisrepresents a 3.9% loss for South Asia,
~ased on total production. Little or nowheat is cultivated in Southeast Asiasince leaf blight is a limiting disease,hence a calculation of losses was not
possible. The calculation of losses causedby the soilborne pathogens is moredifficult. The erratic and large variability
in losses between farm fields would needadditional survey results to transform the
measured losses into national or regional
averages.
Whether good management and the
development of better resistant varieties
can eliminate most of these l~af blightlosses remains to be seen. However, a
realistic and possible goal would be to
strive for a reduction of these losses by
50% in the next five to ten years.

Leaf Blight Diseases and Associated Soilborne Fungal Pathogens of Wheat In South and Southeast Asle 47
Table 4. Wheat areas of South and Southeast Asle, and estimated yield loss caused by leaf blights(calculated using an average loss value of 8.47 %. times the vulnerability Indax).
Geographic Area' Production' Vulnerability Calculated lossregion/country State/ Province/Area (1000 hal (1000mt) index2 (1000mt)
South AslBPakistan
Punjab 5970.0 12430.0 0.1 105.3Sindh 1110.0 2340.0 0.2 39.6NWFP 860.0 1200.0 0.1 10.2Balochistan 340.0 790.0 na 3
Pakistan Total 8280.0 16760.0 155.1India
Eastern Arunachal Pradesb 3.6 6.8Assam 76.4 111.2Bihar 1963.3 3566.0Meghalaya 4.6 5.9Nagaland 0.5 1.6Orissa 30.7 51.3Sikkim 11.4 17.5
, Tripura 3.7 6.9Uttar Pradesh 8625.8 20155.8West Bengal 269.1 530.2Eastern Total 10989.1 24453.2 1.0 2071.2
Northern Haryana 1808.0 6502.0Himachal Pradesh 378.1 595.8Jall)mu & Kashmir 245.0 297.4Punjab 3233.0 12295.0Delhi 32.4 109.4Northern Total 5696.5 19799.6 0.2 335.4
Southarn Andhra Pradesh 8.1 6.7Karnataka 202.6 144.3Tamil Nadu 0.2 0.2Southern Total 210.9 151.2 0.5 6.4
Western Gujl!rat 409.0 905.7Maharashtra 627.6 625.7Rajasthan 1779.2 4478.4Dadra & Nagar H. 0.2 0.4Western Total 2816.0 6010.2 0.2 101.8
Central Madhya Pradesh 3267.4 4673.1 0.5 197.9India Total 22979.9 55087.3 2712.7
Bangladesh Total 634.0 1169.0 1.0 99.0
Nepal Mountain 44.6 57.2 0.1 0.5Hill 229.6 329.2 0.2 5.6Tarai 349.9 555.1 1.0 47.0Nepal Total " 624.1 941.5 53.1
South Asia Total 32519.0 73957.8Total' calculated loss 2864.1%,Loss 3.9
SouthsBst AslBMyanmar 0.1 0.1 naThailand <1.0 <0.7 naVietnam <0.1 <0.1 naLaos 07 07 naIndonesia 0.0 0.0 naPhilippines 0.0 0.0 naSri Lanka 0.0 0.0 na1 Calculated from: CIMMYT. 1996. World Wheat Facts and Trends. CIMMYT, Mexico. 73 pgs. Duy and Dinh 1994.
Fertilizer Statistics 1992-93, 1993;Manandhar and Shakya 1996. PARC, Islamabad, Pakistan. Estimates for WheatProduction 1995·96. (Personal commun,ications). Winkyi and Kyaw 1994.Vulnerability index =O.1'reported; 0.2 low; 0.5 moderate; 1.0 high.na =not applicable or available; see text for details.

48 E.E. Saari
References,.,~ [
Alam, KB., Shaheed, M.A., Ahm!';!c;l, AU.,and P.K. Malakar. 1994. Bipolarisleafblight (spot blotch) of wheat inBangladesh. In: D.A Saunders and G.P.Hettel (eds.), WheaUn Heat-StressedEnvironments: Irrigated, Dry Areas andRice-Wh~atFarming Systems, l'P' 339342. MexIco, D.E: CIMMYT.
Badaruddin, M., Saunders, D.A, Siddique,AB., Hossain, M.A, Ahmed, M.U.,Rahman, M.M., and S. Parveen.1994.Determining yield constraints for wheatproduction in Bangladesh. In: D.ASaunders and G.P. Hettel (eds.), Wheat inHeat Stressed Environments: Irrigated,Dry Areas and Rice-Wheat FarmingSystems, pp. 265-271. Mexico, D.E:CIMMYT.
Bajwa, M.A 1985. Wheat research andproduction in Pakistan. In: Wheats forMore Tropical Environments. A .Proceedings of the InternationalSymposium, pp. 68-77. Mexico,D.E:CIMMYT.
Bhatti, M.A.R, and M.B. Ilyas. 1986. Wheatdiseases in Pakistan. In: L.M. Joshi, D.V.Singh, and KD. Srivastava (eds.),Problems and Progress of WheatPathology in South Asia, pp. 20-30. NewDelhi, India: Malhotra Publishing House.401 pp.
Dahal, G., Amatya, P., and H.K Manandhar.1992. Plant diseases in Nepal. Rev PlantPath 71:797-807.
Danakusuma, T. 1985. Wheat productionconstraints and research priorities inIndonesia. In: Wheats for More TropicalEnvironments. A Proceedings of theInternational Symposium, pp. 78-82.Mexico, D.E: CIMMYT.
Devkota, R.N. 1994. Wheat breedingobjectives in Nepal: The national testingsystem and recent progress. In: D.ASaunders and G.P. Hettel (eds.), Wheat inHeat-Stressed Environments: Irrigated,Dry Areas and Rice-Wheat FarmingSystems, pp. 216-223. Mexico, D.E:CIMMYT.
Dubin, H.J., and H.P. Bimb. 1991. Effects ofsoil and foliar treatments on yields anddiseases of wheat in lowland Nepal. In:D.A. Saunders and G.P. Hettel (eas.),Wheat in Heat-Stressed Environments:Irrigated, Dry Areas and Rice-WheatFarming Systems, pp. 484-485. Mexico,D.E: CIMMYT. .
Dubin, H.J., and H.P. Bimb. 1994. Soilbornediseases of wheat in warmer areas ofSouth Asia: An update. In: D.A Saundersand G.P. Hettel (eds.), Wheat in HeatStressed Environments: Irrigated, DryAreas and Rice-Wheat Farming Systems,pp. 353-359. Mexico, D.E: CIMMYT.
Dubin, H.J., and M. van Ginkel. 1991. Thestatus of wheat diseases and diseaseresearch in warmer areas. In: D.A.Saunders (ed.), Wheat for theNontraditional Warm Areas. AProceedings of tlw InternationalConference, pp. 125-145. Mexico, D.E:CIMMYT.
Escano, C.R 1994. The wheat developmentaction project: Philippines experience. In:D.A Saunders and G.P. Hettel (eds.),Wheat in Heat·Stressed Environments:Irrigated, Dry Areas and Rice-WheatFarming Systems, pp. 323-327. Mexico,D.E: CIMMYT.
Fischer, RA 1985. Physiologicallinl:itationsto producing wheat in semitropical andtropical environments and possibleselection criteria. In: Wheats for MoreTropical EnvIronments. A Proceed:ings ofthe International Symposium, pp. 209230. Mexico, D.E:CIMMYT.
Fischer, R.A, and D.R Byerlee. 1991. Trendsof wheat production, in the warmer areas:Major issues and economicconsiderations. In: D.A Saunders andG.P. Hettel (eds.), Wheat in Heat-StressedEnvironments: Irrigated, Dry Areas andRice-Wheat Farming Systems, pp. 3-27.Mexico, D.E: CIMMYT.
Gilchrist, L.L, Pfeiffer, WH., and S. Rajaram.1991. Progress in developing breadwheats resistant to Helminthosporiumsativum. In: D.A Saunders and G.P.Hettel (eds.), Wheat in Heat-StressedEnvironments: Irrigated, Dry Areas andRice-Wheat Farming Systems, pp. 469472. Mexico, D.E: CIMMYT.
Hafiz, A. 1986. Plant Diseases. Islamabad:Pakistan Agricultural Research Council.552pp.
Leaf Blight Diseases and Associated Soilborne Fungal Pathogens of Wheat In South and Southeast Asia 49
Hetzler, J./ Eyal, Z./ Metha, Y.R, Campos,L.A, Fehrmann, H., Kushnir, u./Zekaria-Oren, J./ and L. Cohen. 1991.Interactions between spot blotch(Cochliobolus sativus) and wheat cultivars.In: D.A. Saunders (ed.), Wheat for theNontraditional Warm Areas. AProceedings of the InternationalSymposium, pp. 146-164. Mexico, D.F.:CIMMYT.
Hobbs, P./ and M. Morris. 1996. MeetingSouth Asia/s Future Food Requirementsfrom Rice-Wheat Cropping Systems:Priority Issues Facing Researchers in thePost-Green Revolution Era. NRG Paper96-01. Mexico, D.F.: CIMMYT. 46 pp.
Hosford, R.M. Jr. 1982. Tan spbt. In: RM.Hosford Jr. (ed.), Proceedings of the TanSpot of Wheat and Related DiseasesWorkshop, 1981/ pp. 1-24. Fargo, ND,USA: North Dakota State University. 116pp.
Jongdee, B. 1994. Tillage methods for wheatafter rice in paddy soils in Thailand. In:D.A Saunders and G.P. Hettel (eds.),Wheat in Heat-Stressed Environments:Irrigated, Dry Areas and Rice-WheatFarming Systems, pp. 272-275. Mexico,D.F.: CIMMYT.
Joshi, L.M. 1986. Perpetuation anddissemination of wheat rusts in India. In:L.M. Joshi, D.V. Singh, and KD.Srivistava (eds.), Problems and Progressof Wheat Pathology in South Asia, pp.41-68. New Delhi: Malhotra PublishingHouse. 401 pp.
Joshi, L.M., Singh, D.V., and KD.Srivastava. 1986. Wheat and wheatdiseases in India. In: L.M. Joshi, D.V.Singh, and KD. Srivistava (eds.).Problems and Progress of WheatPathology in South Asia, pp. 1~19. NewDelhi: Malhotra Publishing House. 401pp. .
Joshi, L.M., Srivastava, KD., Singh, D.V.,Goel, L.B., and S. Nagarajan. 1978.Annotated Compendium of WheatDiseases in India. ICAR, New Delhi,India. 332 pp.
Karki, CB. 1982. Tan spot and other foliardiseases of wheat in Nepal. In: RM.Hosford Jr. (ed.), Proceedings of the TanSpot of Wheat and Related DiseasesWorkshop, 1981/ pp. 76-81. Fargo, ND,USA: North Dakota State University. 116pp.
Karki, CB., and P.B. Karki. 1996. Wheatdisease report, 1994-1995. In:Proceedings of the National Winter-cropsTechnology Workshop, 1995/ pp. 269-287.Kathmandu, Nepal: NARC & CIMMYT.
Karki, CB., and RM. Hosford. 1986.Epidemic of wheat leaf blight in Nepalcaused by Pyrenophora tritici-repentis.NepaleseJ Agric 17:69-74.
Kishwar, A, Sher, H., Shamim, 1./ Ali, K,Hassan, S./ and S. Iftikhar. 1992. Foot rotdisease of wheat in rainfed areas ofNorth West Frontier Province andPunjab. Sarhad J Agric 8:541-545.
Kulkarni, S./ and V.B. Naragund. 1986.Soilborne diseases of wheat. In: L.M.Joshi, D.V. Singh, and KD. Srivistava(eds.), Problems and Progress of WheatPathology in South Asia, pp. 216-229.New Delhi: Malhotra Publishing House.401 pp.
Lapis, D.B. 1985a. Insect pests and diseasesin wheat in the Philippines.. In: Wheatsfor More Tropical Environments. AProceedings of the InternationalSymposium, pp. 152-157. Mexico, D.F.:CIMMYT.
Lapis, D.B. 1988b. Chemical control ofwheat diseases in the Philippines. In:Wheats for More Tropical Environments.A Proceedings of the International,Symposium, pp. 204-208. Mexico, D.F.:CIMMYT.
Layaoen, H.L. 1993. Status of wheat RandD in Region 1. In: Wheat Review andPlanning. Proceedings of the Workshop,1989/ pp. 20-28. Los Banos, Laguna,Philippines: PCARRD and CIMMYT.
Liboon, S.P. 1992/ Summary of wheatresearch at IRRI (Philippines) [1987 DS(dry season)-1988 DS]. In: Wheat Reviewand Planning. Proceedings of theWorkshop; 1989/ pp. 103-120. Los Banos,Laguna, Philippines: PCARRD andCIMMYT.
Long, T.D., Minh, T.D., and N.T. Thu. 1994.Wheat cultivation in Northern Vietnam.In: D.A Saunders and G.P. Hettel (eds.),Wheat in Heat Stressed Environments:Irrigated, Dry Areas and Rice-WheatFarming Systems, pp. 389-390. Mexico,D.F.: CIMMYT.
Luz, W.C da, and G.C Bergstrom. 1987.InteraCtions between Cochliobolus sativltsand Pyrenophora tritici-repentis on wheatleaves. PhytopathoI77:1355-1360.
50 E.E. Saari
ManI:l., CEo 1992. Key Note Address. In:Wheat Review and Planning.Proceedings ofthe Workshop, 1989, pp.3-19. Los Banos, Laguna, Philippines:PCARRD and CIMMYT.
Mathur, S.B., and B.M. Cunfer (eds.). 1993.Seed-Borne Diseases and Seed HealthTesting of Wheat. Danish GovernmentInstitute Seed Pathology for DevelopingCountries. Copenhagen, Denmark. 168pp.
Mehta, YE. 1991. The effects of tillagepractices and crop rotation on theepidemiology of some major wheatdiseases. In: D.ASaunders and G.P.Hettel (eds.), Wheat in Heat-StressedEnvironments: Irrigated, Dry Areas andRice-Wheat Farming Systems, pp. 266283. Mexico, D.E: CIMMYT.
Mehta, Y.E. 1993. Spot blotch (Bipolarissorokiniana). In: S.B. Mathur and B.M.Cunfer (eds.), Seed-Borne Diseases andSeed Health Testing of Wheat.Copenhagen, DeI:l.mark: Institute of SeedPathology for Developing Countries. 168pp.
Mehta, Y.E. 1996. Interdisciplinaryintegration - A prerequisite to integrateddisease management programs. Indian JMycol Plant PathoI26:178-184.
Meisner, CA, Badaruddin, M., Saunders,D.A, and KoB. Alam. 1994. Seedtreatment as a means to increase wheatyields in warm areas. In: D.A Saundersand G.P. Hettel (eds.), Wheat in HeatStressed Environments: Irrigated, DryAreas and Rice-Wheat Farming Systems,pp. 360-366. Mexico, D.E: CIMMYT.
Minh, T.D. 1991. Wheat research efforts inVietnam. In: D.A Saunders (ed.), Wheatfor the Nontraditional Warm Areas, pp.65-69. Mexico, D.E: CIMMYT.
Misra, AP. 1973. Helminthosporium SpeciesOccurring on Cereals and OtherGramineae. U.S.P.L. 480 Project No. A7CR-133, Grant No. FG-IN-223. TirhutCollege of Agriculture, Dholi,Muzaffarpur, Bihar, India. 289 pp.
Mustafa, S.Z., Hashmi, N.I., Ahmad, I.,Kisana, N.S., Mujahid, M.Y.) and Z.Ahmad. 1994. Results of the NationalUniform Yield Trials (1993-94).Coordinated Wheat, Barley and TriticaleProgram, PARC, Islamabad, Pakistan.209 pp.
Nagarajan, S., and L.M. Joshi. 1985.Epidemiology in the IndianSubcontinent, pp. 371-402.
Nema, K.G. 1986. Foliar disease of wheatleaf spots and blights. In: L.M. Joshi; D.V.Singh, and K.D. Srivastava (eds.),Problems and Progress of WheatPathology in South Asia, pp. 162-175.New Delhi: Malhotra Publishing House.401 pp.
Prescott, J.M., Burnett, P.A, Saari, E.E.,Ransom, J., Bowman, J., Milliano, W. de,Singh, RP., and G. Bekele. 1986. WheatDisease and Pests: A Guide for FieldIdentification. Mexico, D.E: CIMMYT.135 pp.
Raemaekers, RH. 1988. Helminthosporiumsativum: Disease complex on wheat andsources of resistance in Zambia. In: ARKlatt (ed.), Wheat ProductionConstraints in Tropical Environments. AProceedings of the InternationalConference, 1987, pp. 175-186. Mexico,D.E: CIMMYT.
Rajatasereekul, S., Kantatat, P., Ruangsook,S., Konghakote, P., and S. Srivisuthi.1994. Wheat research efforts innortheastern Thailand. In: D.A Saundersand G.P. Hettel (eds.), Wheat in HeatStressed EnvironmeI:l.ts: Irrigated, DryAreas and Rice-Wheat Farming Systems,pp. 373-374. Mexico, D.E: CIMMYT.
Raymundo, AD. 1992. Diseasemanagement in wheat. In: In: WheatReview and Planning. Proceedings of theWorkshop, 1989, pp. 97-102. Los Banos,Laguna, Philippines: PCARRD andCIMMYT.
Razzaque, M.A, and A B.S. Hossain. 1991.The wheat development program inBangladesh. In: D.A Saunders (ed.),Wheat for the Nontraditional WarmAreas, pp. 44-54. Mexico, D.E: CIMMYT.
Reis, E.M. 1991. Integrated diseasemanagement - the changing concepts ofcontrolling head blight and spot blotch.In: D.A Saunders and G.P. Hettel (eds.),Wheat in Heat-Stressed Environments:Irrigated, Dry Areas and Rice-WheatFarming Systems, pp. 165·177. Mexico,D.E: CIMMYT.
Roelfs, AP., Singh, RP., and E.E. Saari. 1992.Rust Diseases of Wheat: Concepts andMethods of Disease Management.Mexico, D.E: CIMMYT. 81 pp.

Leel Blight Diseeses end Associated Soilborne Fungal Pathogens of Wheat In South and Southeast Asia 51
Ruckstuhl, M. 1994. Wheat yield losses infarmers' fields due to foliar blightinfection. In: D.A Saunders an<i G.P.Hettel (eds.), Wheat in Heat-StressedEnvironments: Irrigated, Dry Areas andRice-Wheat Farming Systems, pp. 397398. Mexico, D.F.: CIMMYT.
Saari, E.E. 1985. Distribution andimportance of root rot diseases of wheat,barley and triticale in south andSoutheast Asia. In: Wheats for MoreTropical Environments. A Proceedings ofthe International Symposium, pp. 189195. Mexico, D.F.: CIMMYT.
Saari, E.E. 1986. Wheat disease problems inSoutheast Asia. In: L.M. Joshi, D.V.Singh, and KD. Srivastava (eds.),Problems and Progress of WheatPathology in South Asi~, pp. 31-40. NewDelhi: Malhotra Publishing House. 401pp.
Saari, E.E., and J.M. Prescott. 1985. Worlddistribution in relation to economiclosses. In: AP. Roelfs and W.R. Bushnell(eds.), TJ:le Cereal Rusts. Vol. II, Diseases,Distribution, Epidemiology and Control,pp. 259-298. Orlando, FL, USA:Academic Press.
Saari, E.E., and RD. Wilcoxson. 1974.Disease in dwarf wheats in Asia andAfrica. Annual Review of Phytopathol12:49-68.
Saunders, D.A 1988. Characterization oftropical wheat environments:Identification of production constraintsand progress achieved. South andSoutheast Asia. In: AR Klatt (ed.),Wheat Production Constraints inTropical Environments. A Proceedings ofthe International Conference, 1987, pp.12-26. Mexico, D.F.: CIMMYT.
Schilder, A, and G.c. Bergstrom. 1993. Tanspot (Pyrenoplwra tritici-repentis). In: S.B.Mathur and B.M. Cunfer (eds.), SeedBorne Diseases and Seed Health Testingof Wheat, pp. 113-122. DanishGovernment Institute Seed Pathology forDeveloping Countries. Copenhagen,Denmark. 168 pp.
Sharma, AK, Kumar, J., and S. Nagarajan.1996. Report of the CoordinatedExperiments 1995-96: Crop Protection(Pathology and Nematology). All IndiaCoordinated Wheat ImprovementProject, Directorate of Wheat Research,Karnal, India. 185 pp.
Sharma, S. 1996. Wheat diseases in westernhills of Nepal. In: Proceedings of theNational Winter-Crops TechnologyWorkshop, 1995, pp. 339-344.Kathmandu, Nepal: NARC & CIMMYT.
Singh, D.V., and KD. Srivastava. 1997.Foliar blights and Fusarium scab ofwheat: Present status and strategies formanagement. In: Management ofThreatening Plant Disease of NationalImportance, pp.I-19. New Delhi:Malhotra Publishing House.
Somrith, B. 1988. Problems associated withsoil management issues in rice-wheatrotation areas In: AR Klatt (ed.); WheatProduction Constraints in TropicalEnvironments. A Proceedings of theInternational Conference, pp. 63-70.Mexico, D.F.: CIMMYT.
Tandon, J.P. 1994. Wheat cultivation,research organization, and productiontechnology in the hot dry regions ofIndia. In: D.A Saunders and G.P. Hettel(eds.), Wheat in Heat-StressedEnvironments: Irrigated, Dry Areas andRice-Wheat Farming Systems, pp. 17-23.Mexico, D.F.: CIMMYT.
Villareal, RL., Mujeeb-Kazi, A., Gilchrist,L.L, and E. Del Toro. 1995. Yield loss tospot blotch in spring bread wheat inWlilrm nontraditional wheat productionareas. Plant Dis 79:893-897.
Wiese, M.V. 1987. Compendium of WheatDiseases. 2nd ed. St. Paul, MN, USA: APSPress. 112 pp.
Wilcoxson, RD., and E.E. Saari. 1996. Buntand Smut Diseases of Wheat: Conceptsand Method's of Disease Management.Mexico, D.F.: CIMMYT. 66 pp.
Winkyl, D.5, and KY. Kyaw. 1994. Wheatproduction and research in Myanmar. In:D.A Saunders and G.P. Hettel (eds.),Wheat in Heat-Stressed Environments:Irrigated, Dry Areas and Rice-WheatFarming Systems, pp. 394-396. Mexico,D.E: CIMMYT.
Zaini, Z., Jusuf, M., and A Kaher. 1991.Potential for wheat production inIndonesia. In: D.A Saunders (ed.), Wheatfor the Nontraditional Warm Areas. AProceedings of the InternationalConference, pp. 55-64. Mexico, D.E:CIMMYT.
Zillinisky, EJ. 1983. Common Diseases ofSmall Grain Cereals: A Guide toIdentification. Mexico, D.E: CIMMYT.141 pp.
52
Foliar Blights of Wheat in India:Germplasm Improvement and FutureChallenges for Sustainable, High YieldingWheat Production
s. Nagarajan and J. KumarDirectorate of Wheat Research, Indian Council of Agricultural Research, Kamal,
India
Abstract
Spring wheat is grown over 25 million ha in India, covering six mega environments as awinter crop between November to April. Production is on the order of65.0 million t. In thenortheastern plain zone '(NEPZ), a major part of the 9.5 million ha is subject to severe leafblight development where rice precedes wheat; conditions are warm and humid, nutrientapplication is poor, and soils are flooded and saline. Since varietal replacement is slow, brownrust (puccinia recondita tritici) severity tends to be high and, when coupled with leafblight,crop losses are very high. Leafblight is a disease complex caused by a number ofpathogens, withthe most serious being Bipolaris sorokiniana (syn. Helminthosporium sativum) that causesspot blotch. This pathogen is capable ofcausing damage from the primary leaf stage, though theplant tends to become more susceptible after flowering. The small spots on the leaf, ifnumerous,coalesce and the leaf prematurely dries up, reducing the photosynthetic area of the plant. Therole of toxin in chlorosis and leafdrying (necrosis) is not well understood. It is furthercomplicated by the slight differences in host response, the need for a scale to separate the morecomplex levels ofhost pathogen interaction, and by the wide host range of the pathogen.Bipolaris sorokiniana has been found to infect barley, oats, and rice, as well as 12 othergrasses. At the Directorate of Wheat Research, a reliable technique has been developed to createartificial epiphytotics under a plastic tunnel and in the field. Also, a new rating procedure hasbeen suggested to score the earhead, flag leaf (F), and F-1leaf to enable plant breeders to selectfor more tolerant lines. In the northwest plain zone (NWPZ), tan spot (Pyrenophora tritici
repentis) is common on the lower leaves and leafsheath ofwheat plants, and spreads to upperleaves during prolonged wet and warm situations. Symptoms are a narrow halo around the spotand, when severe disease occurs, premature leafdrying and greater levels ofgrain shriveling.The late sown irrigated wheat ofNWPZ that is well fertilized shows severe disease levels by theend ofMarch/early April. Both bread wheat and durum are vulnerable and suffer economiclosses either due to tan spot or a combination of tan spot, stripe, and leaf rusts.
Wheat is cultivated over 25.0 million
ha in India, of which nearly 9.0 million ha
is exposed to various types of leaf
diseases other than rusts and powdery
mildew. Of this, it is estimated that more
than 6.0 million ha is in the northeastern
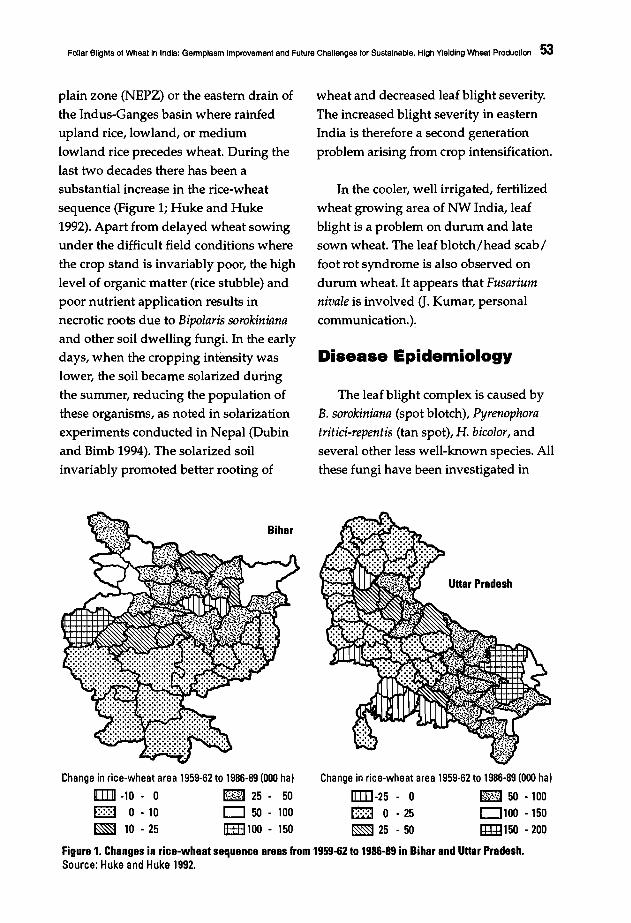
Foliar Blights of Wheat in India: Germplasm Improvement and Future Challenges for Sustainable. High Yielding Wheat Production '53
plain zone (NEPZ) or the eastern drain of
the Indus-Ganges basin where rainfedupland rice, lowland, or medium
lowland rice precedes wheat. During the
last two decades there has been asubstantial increase in the rice-wheat
sequence (Figure 1; Huke and Huke
1992). Apart from delayed wheat sowingunder the difficult field conditions where
the crop stand is invariably poor, the high
level of organic matter (rice stubble) andpoor nutrient application results innecrotic roots due to Bipolaris sorokinianaand other soil dwelling fungi. In the earlydays, when the cropping intensity was
lower, the soil became solarized during
the summer, reducing the population ofthese organisms, as noted in solarization
experiments conducted in Nepal (Dubinand Bimb 1994). The solarized soil
invariably promoted better rooting of
Change in rice-wheat area 1959-62 to 1986-89 (000 hal
[[[] -10 - 0 fis:t-l 25 - 50f:-:·:·j 0 - 10 0 50 - 100~ 10 ·25 !HEl00 • 150
wheat and decreased leaf blight severity.
The increased blight severity in eastern
India is therefore a second generation
problem arising from crop intensification.
In the cooler, well irrigated, fertilizedwheat growing area of NW India, leaf
blight is a problem on durum and late
sown wheat. The leaf blotch/head scab /
foot rot syndrome is also observed ondurum wheat. It appears that Fusariumnivale is involved (J. Kumar, personal
communication.)~
Disease Epidemiology
The leaf blight complex is caused byB. sorokiniana (spot blotch), Pyrenophoratritici-repentis (tan spot), H. bicolor, and
several other less well-known species. Allthese fungi have been investigated in
Change in rice-wheat area 1959-62 to 1986-89 (000 hal
[IIl-25 - 0 t};,,.,fJ 50 - 100
t-;·;·:1 0 - 25 0100 - 150~ 25 . 50 1B±1150 - 200
Figure 1. Changes in rice-wheat sequence areas from 1959-62 to 1986-89 in Bihar and Uttar Pradesh.Source: Huke and Huke 1992.

54 s. Nagaralan and J. Kumar
detail by Misra (1973), who failed to note
any pathogenic forms, nor any clearvariations based on aggregation of
isolates. The helminthosporium leaf
blights of wheat have a wide host range,often infecting a large number of grasses
that coexist in an area. Though the
monograph of Misra (1973) indicates thatlines Gabo, Khapli, and Thatcher are
more susceptible to one species than to
another, insufficient evidence does notallow a stronger statement to be made.
Unless a reliable seedling/adult plantreaction matrix is developed, it is difficultto quantify pathogenic variation within a
species. The different species of
Helminthosporium produce different typesof symptoms, and the toxins produced bythe pathogen further complicate the
issue. Theoretically, there can be threesituations:
1. The genetic basis of resistance is nonspecific in Triticum and acts toprovide resistance to all pathogenic
helminthosporia at the late doughstage (LOS) of the crop.
2. Different resistance genes accordresistance to different
Helminthosporium species and their
biotypes. Multiple genes areinvolved in total resistance to the leaf
blight complex.3. A mechanism such as slow disease
development also acts to reduce the
disease severity at LOS.
Realizing the difficult nature of
addressing the disease, an attempt was
made to perfect a protocol to create
epiphytotics to screen donor lines and
segregating populations.
Disease ScoringProcedures
Until recently, multilocational testing
was the only basis for evaluating wheatmaterial for leaf blight resistance. Disease
rating was carried out according to Saari
and Prescott (1975), where the emphasisis on the plant level (height) that has been
affected. The extent to which the leaf is
blighted, or leaf area damaged, wasadded as another dimension, and a
double digit system was followed for
some years. Both systems are good forrapid evaluation of genetic stocks, but areinadequate for breeding for resistance.
The shortcomings are that the diseasedleaf area and the type of lesion are notrated. A visual rating scale was
developed at the directorate: a 0-9 scalefor mean disease expression on leaves,recorded for the entire row of the
genotype under evaluation (Figure 2). Incases where the peduncle/earhead areaffected, the disease rating data isrecorded separately. Invariably, at LOS,only the top two leaves are green and
account for grain filling.
Procedure forCreating Epiphytotics
The procedure followed to this time
for creating leaf blight epiphytotics toscreen germplasm in the multilocational
trials was not satisfactory for generatingrepetitive and reliable results (Figure 3).
There were several shortcomings:• Only local isolates were used which,
in some cases, turned out to be
saprophytes.
Foliar Bllghta of Wheal in India: Germplasm Improvement and Future Challenges for Sustainable. High Yielding Wheat Production 55
• There was a loss of virulence if theorganism was repeatedly cultured on
synthetic media.
• Providing the needed level ofhumidity in the field was a difficulttask.
• Early inoculations were invariablynot done and so terminal disease
severity was always low.
To overcome these, a new
methodology was developed. Afterconfirming virulence, the B. sorokinuma
isolate was multiplied on sorghum seedssoaked in water for a day and autoclaved.The inoculated flasks were incubated at
25°C for 7-10 days, and every day the
flask was shaken to mix the grain and to
promote good coverage with spores.Mature flask cultures could be stored at
4°C for two weeks or in sterile tinfoilpouches to permit easy handling and
mailing to centers even a 1000 km away.Inoculum on sorghum grain was
multiplied once or twice following thesame procedure in the multilocation sites.
These were used for field inoculation bysyringe or spray. By suspending the
infected sorghum grains in water, and
shaking and filtering it on muslin, theinoculum was prepared for syringeinoculation similarly to the way cereal
rusts are inoculated.
Figure 2. Field key for scoring leaf blight severity.A:: Visual percentage of the leaf surface covered bylesions; B:: Numerical score.I :: Immune; R:: Resistant; MR:: Moderately resistant;MS:: Moderately susceptible; S" Susceptible; HS::Highly susceptible.
At inoculated sites, characteristic
spots appeared and subsequently spread.A few days after irrigation, the sorghumseeds loaded with inoculum were placed
at the base of the tillers of the borderrows. This was followed by a few days of
spraying with B. sorokiniana spores by
~No. of centers with poor epiphytoticsDNew technique adopted
12
10enCQ
'Q
'"'-'.5!'Iii.l!3-Qc:iZ
o1984/ 85/ 86/ 87/ 88/ 89/ 90/ 91/ 92/ 93/
85 86 87 88 89 90 91 92 93 94Year
Figure 3. Locational data rejected due to poorartificial epiphYtotlcs under AICWP'.1 All India Coordinated Wheat Improvement Project.Reasons for poor epiphytotics:
1) non pathogenic inoculum, and2) irrigation lapses.
909
HSSMRRI or escape
56 s. Nagarajan and J. Kumar
power sprayer, ensu1ring perfect epidemic
development. This technique (Figure 4) isnow followed at all multilocation test
sites and has considerably improved the
reliability of testing. Based on therigorous tests conducted over years, a
number of reliable resistant stocks have
been identified (Table 1).
Confirming the Donor Line
The identified lines harboring
resistance to spot blotch were grown in
specially designed plastic houses withmisting/sprinkler systems (Figure 5) thathave the provision for cooling the
temperature by an evapo-eooling deviceconnected to a temperature monitoringdevice. These plastic houses of 60 m2
were installed at eight test sites, eachcosting about US $335. Following thesame field procedure, with good moisture
levels provided by mist, and using
IPathogenic isolates I(hot spots)
•I Pure cultures II Koch's postulates II Multiplication I
I
I Sorghum seed I I Biofermentor Imedium I
II Inoculum mass I
I Concurrent inoculations I
II Sorghum seed I I Conidial Ibroadcast I I injection•
IDisease simulation
(temperature & RH controlledpolvthene tunnel)
I
I Scoring I(0·9 scale)
Figure 4. Artificial screening for leaf blightresistance.
Table 1. Genotypes with moderate leaf blight resistance identified in multllocational tests.
Genotype
Nepal 297Annapurna 1NL644NL 623 (Bhrikuti)HUW206SonalikaA6/Glen (BAW 713)A6/Glen (BAW 714)BAW599Fang 60K8027VL616DL153-2ACC No. 8528Bow"S"Vee S/Myna SBW1052ACC. No. 8450
Pedigree
HD2320=HD2137/HD2186//HD2160Veery 5=KvZ/Buho//KaI/BbAu/UP301//GII/Sx/3/Pew S/4/Mai S/Maya S/Pew S/5/Pea SCmt/Coc75/3/Plo//Fury/Ana75Veery 7II 54·368/An/3/Yt54/N1OBI/LR64CM 91220·1ISD-OISD-1ISD-OISDeM 91220-1ISD-0ISD·8ISD·0ISDCrt/Aid S//Seri82Pi62/Fd/3/Pi62/MZ//MxpNP875/4/N1OB/Y531/Y50/3/Kt54B/5/2*K852Ska/P46Kundan =li71/NP890
Au//KaI/Bb/3/Wop S
Zaf/3/Cno67//Lr64*2/Sn64/4/Cno67//Nad/Chr/5/Yr70
Origin
Nepal/IndiaNepal/MexicoNepal/MexicoNepal/MexicoIndia/MexicoIndia/MexicoBangladesh/MexicoBangladesh/MexicoBangladesh/MexicoPakistan/Thailand/MexicoIndiaIndiaIndiaIndiaIndia/MexicoIndia/MexicoIndia/MexicoIndia
1 Seed source from DWR. Karnal.lndia. except entries 7-9, which came directly from Bangladesh.Source: Dubin st a/., this proceedings.
Foliar Blights of Wheat in India: Germplasm Improvement and Future Challenges for Sustainable, High Yielding Wheat Production 57
Sonalika as the spreader row, a no-escape
situation was created to confirm the
reaction pattern of the donor lines. Now
attempts are underway to evaluate these
lines separately against individual
pathogens. These donor lines were used
by plant breeders in their leaf blight
resistance breeding program.
Breeding for Leaf BlightResistance
Clear differences are evident between
susceptible and resistant lines in their
ability to reduce leaf blight development.
Accordingly a strategy for breeding for
leaf blight resistance has been developed
(Figure 6). Cross combinations have been
attempted and the material subjected to
artificial evaluation at DWR, Karnal.
Alternate generations are shuttled
between DWR and BHU, Varanasi, in
eastern India, where leaf blight is a major
problem. Material in the fourth cycle
shows combined leaf blight resistance
and good ideotype. This material will bedistributed through the cooperative
I Components I
Breedina I I Patholoav II I
Multiple crosses of Artificial Naturalsuperior parents screening screening
(Karnall(AxBlxlCxDI
IFl (Off season)
Summer nursery
IF21Karnail
Low selectionpressure 510-9)
IF31Karnail
Moderate selectionpressure 3 (0-9)
IF4 (Varanasi)
High selectionpressure 1(0-9)
F5 (Hot spots)
Station tria I•
Multilocatlonal trial
-'-C Variety
Figure 6. Breeding for leaf blight resistance.
Figure 5. Polythene house designed specially for creating epiphytotics of foliar blight of wheat.

58 s. Nagarajan and J. Kumar
network to Indian wheat breeders for
further selection, evaluation, andadvancement as varieties (G. Singh,
personal communication).
Attempts are also in progress toevaluate the material against each leaf
blight separately and the segregating
population rising out of crosses betweenthe tolerants that have a leaf blight score'
below 3.0. In approximately another three
crop cycles, there will be adequatematerial available for the All India
Coordinated Wheat Improvement Projectcenters.
Future Thrust
The disease epidemiology of leaf
blight needs to be understood,particularly off-season survival andperpetuation. Role of soil organic matter,zero tillage, proper sowing, and nutrient
application all need well planne~investigation.
Emphasis will be placed on the
standardization of a procedure forscreening seedlings for leaf blight
pathogens and relating this to mature
plant reaction. By developing a seedlingresistance based breeding procedure, theincorporation of leaf blight resistant
genes can be accelerated. Also, efforts
will be made to clarify whetherpathogenic forms exist within a species.
By measuring disease progress,
genotypes that slow disease developmentwill be identified. Developing new
genetic stoeks will become an
institutional activity, and shuttle breedingattempts will be strengthened.
Acknowledgment
This forms part of the DWR project
No. DWR/RP/93-2.3 funded by ICAR,New Delhi. Thanks are due to Gyanender
Singh and Raj Kumar of the DWR,Karnal, for their input into the project.
References
Dubin, H.J., and H.P. Bimb. 1994. Soilbornediseases of wheat in warmer areas ofSouth Asia: an update. In: D.A Saundersand G.P Hettels (eds.), Wheat in HeatStressed Environments: Irrigated, DryAreas and Rice-Wheat Farming Systemspp. 353-359. Mexico, D.E: CIMMYT.
Huke, R, and E. Huke. 1992. Rice WheatAtlas of South Asia. Draft publication.Los Banos, Philippines: IRRI. 50 pp.
Misra, AP. 1973. Helminthosporium speciesoccurring on cereals and othergramineae. Trihut College of Agriculture,Dholi, Muzaffarpur, Bihar, India. 288 pp.
Saari, E.E., and J.M. Prescott. 1975. A scalefor appraising the foliar intensity ofwheat diseases. Plant Dis Rep 59:377-380.
59
Distrlbutl'on of Pathogens Causing FoliarBlight of Wheat in India and NeighboringCountries
RV. Singh, AK. Singh, andS.P. SinghDepartment of Plant Pathology, N.D. University of Agriculture and Technology,
Kumarganj, Uttar Pradesh, India
Abstract
A large number ofleaf blight affected wheat samples were received/collected in everycropping season during 1988-1996,Jrom different coordinating centers in India andneighboring countries. After repeated isolatiens Bipolaris sorokiniana, Helminthosporiumspiciferum, Pyrenophoratritici-repentis, Alternaria alternata, A triticina, andCurvularia lunata were found associated with foliar blight each year. Ofthese, all isolates ofB.sorokiniana and A triticina were pathogenic. Bipolaris sorokiniana is the predominant leafblight pathogen in the Indian states ofBihar, Delhi, Gujarat, Haryana, Karnataka, Maharashtra,Rajasthan, Uttar Pradesh,and West Bengal, and neighboring countries ofBangladesh andNepal. Alternaria triticina predominates in the states ofHimachal Pradesh, Punjab, Jammuand Kashmir, and Madhya Pradesh. Maximum disease development is promoted bytemperatures around 28"Cand relative humidity 0/92% at heading and flowering of the crop.Yield loss due to leafblight is estimated at 18-22%. Application offungicides Tilt 25 EC (0.5 Lha- l ) and Indofil M-45 (2.5 kg ha-l ) achieved satisfactory disease control.
In India, wheat (Triticum aestivum L.),the second most important crop after rice,has received much attention from both
policy makers and scientists.
Consequently, both productivity andproduction have increased many timessince the mid 1960s; however, yield varies
widely from region to region. Yields fromeastern Uttar Pradesh are around 2 t ha-1
compared with 3-4 t ha-1 in western Uttar
Pradesh, Haryana, and Punjab. Among
other constraints, foliar blight adversely
affects wheat yield, particularly under
late sown conditions, as reported byMitra (1931, 1934), Patel et al. (1953),
Singh and Singh (1967), Joshi et al. (1970),
Singh and Mukarjee (1981), and Singh etal. (1992). Due to the prevalence of ricewheat rotation and late rice harvest,
wheat sowing is often delayed until after
mid December. When wheat is sown late,plant development coincides with foliar
blight infection during late February and
early March, resulting in substantial yieldlosses. Eastern Uttar Pradesh is therefore
considered a hot spot for foliar blight of
wheat.
Based on the above situation, a"National Center" for foliar blight disease
was established by the Indian Council of
Agricultural Research (ICAR) and the

60 A.V. Singh, A.K. Singh, and S.P. Singh
Directorate of Wheat Research (Karnal) at,the Department of Plant Pathology,Narendra Deva University of Agriculture
and Technology, Kumarganj, Faizabad.
Work on foliar blight started during1987/88 and the findings to date are
reported here.
Distribution of FoliarBlight Pathogens
A large number of blight affectedwheat samples have been received/
collected from every crop season since1988 from different coordinating centersin India and neighboring countries. After
repeated isolations, Bipolaris sorokiniana,Helminthosporium spicijerum, Pyrenophoratritici-repentis, Alternaria alternata, A.
triticina, and Curvularia lunata were foundto be associated with foliar blight each
year. Of these, all cultures of B. sorokinianaand A. triticina were found to bepathogenic, as well as some isolates of H.spicijerum and A. alternata (Table 1).
Table 1. Distribution and pathogenicity of fungiassociated with foliar blight.
Prevalence of " ...o";,FC),'iarBlight Pathogens
Based on observations on the
distribution of foliar blight pathogensduring 1988-1996 (Table 2) with respect to
the two major foliar blight pathogens (B.
sorokiniana and A. triticina), B. sorokinianais the predominant pathogen in the
Indian states of Bihar, Delhi, Gujarat,
Haryana, Karnataka, Maharashtra,Rajasthan, Uttar Pradesh, and West
Bengal, and in the neighboring countries
of Bangladesh and Nepal. Alternariatriticina predominates in the states ofHimachal Pradesh, Punjab, Jammu and
Kashmir, and Madhya Pradesh.
Pathogen Behavior
During late December and January, A.
triticina was isolated from almost allwheat varieties, while only some varietiesshowed B. sorokiniana infection. Duringthis period, the frequency of A. triticinawas higher than that of B. sorokiniana.
Table 2. Prevalence of major foliar blightpathogens.
Fungi isolated Pathogenicity' Indian state/Country Prevalent pathogen
Bipolaris sorokiniana ++Helminthosporium spiciferum +Pyrenophora tritici-repentis NTAlternaria alternata +A. triticina ++Curvularia lunataEpicoccum spp.
1 ++ All isolates pathogenic on wheat; +Someisolates pathogenic on wheat; NT Pathogenicity notbe tested; - Nonpathogenic.
BiharDelhiGujaratHaryanaHimachal PradeshJammu and KashmirKarnatakaMadhya PradeshMaharashtraPunjabRajasthanUttar PradeshWest BengalBangladeshNepal
Bipolaris sorokinianaB. sorokinianaB. sorokinianaB. sorokinianaAlternaria triticinaA. triticinaB. sorokinianaA. triticinaB. sorokinianaA. triticinaB. sorokinianaB. sorokinianaB. sorokinianaB. sorokinianaB. sorokiniana
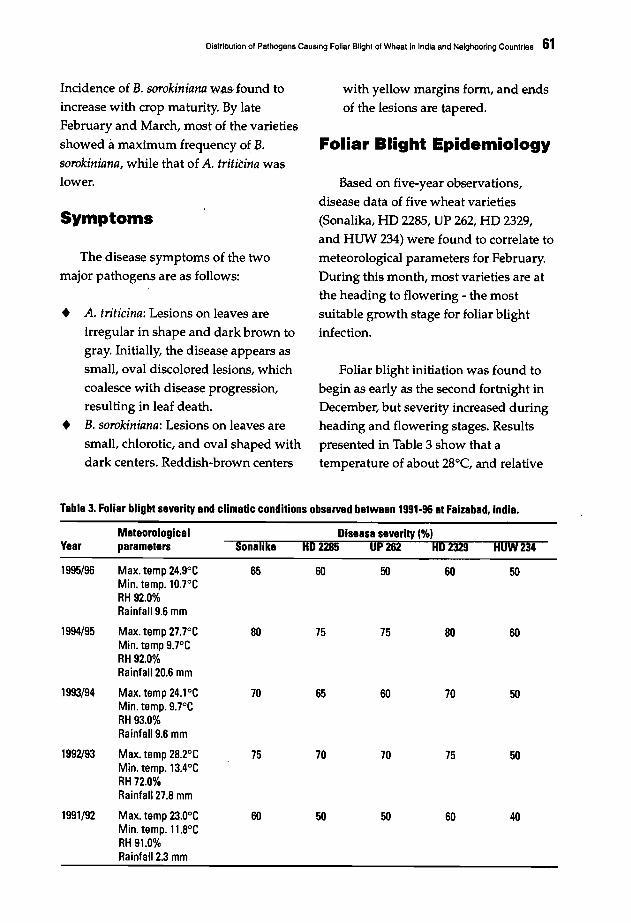
Distribution of Pathogens Causing Foliar Blight of Wheat in India and Neighboring Countries 61
Incidence of B. sorokiniana was iound to
increase with crop maturity. By lateFebruary and March, most of the varieties
showed amaximum frequency of B.sorokiniana, while that of A. trititina was
lower.
Symptoms
The disease symptoms of the two
major pathogens are as follows:
• A. triticina: Lesions on leaves are
irregular in shape and dark brown togray. Initially, the diseas~ appears as
small, oval discolored lesions, whichcoalesce with disease progression,resulting in leaf death.
• B. sorokiniana: Lesions on leaves aresmall, chlorotic, and oval shaped with
dark centers. Reddish-brown centers
with yellow margins form, and ends
of the lesions are tapered.
Foliar Blight Epidemiology
Based on five-year observations,
disease data of five wheat varieties
(Sonalika, HD 2285, UP 262, HD 2329,and HUW 234) were found to correlate to
meteorological parameters for February.
During this month, most varieties are atthe heading to flowering - the most
suitable growth stage for foliar blightinfection.
Foliar blight initiation was found to
begin as early as the second fortnight inDecember, but severity increased during
heading and flowering stages. Resultspresented in Table 3 show that atemperature of about 28°C, and relative
Table 3. Foliar blight severity and climatic conditions observed betwaen 1991·96 at Faizabad.lndia.
Mateorological Diseasa severity (%)Year parameters Sonalika HD2285 UP 262 HD2329 HOW 234
1995/96 Max. temp 24.9°C 65 60 50 60 50Min. temp. 10.7°CRH 92.0%Rainfall 9.6 mm
1994/95 Max. temp 27.7°C 80 75 75 80 60Min. temp 9.7°CRH 92.0%Rainfall 20.6 mm
1993/94 Max. temp 24.1°C 70 65 60 70 50Min. temp. 9.7°CRH 93.0%Rainfall 9.6 mm
1992/93 Max. temp 28.2°C 75 70 70 75 50Min. temp. 13.4°CRH 72.0%Rainfall 27.8 mm
1991/92 Max. temp 23.0°C 60 50 50 60 40Min. temp. 11.8°CRH 91.0%Rainfall 2.3 mm
62 R.V. Singh, A.K. Singh, and S.P. Singh
humidity (RH) of 92% promoted
maximum foliar blight development.
Rainfall directly increased disease
intensity. From the study, 1994/95 was
the most favorable year for disease
development, with an average
temperature of 27.7°C, RH of 92%, and
rainfall of 20.6 mm. Other factors which
increased foliar blight intensity wel'e
minimum tillage, irrigation, late planting,
and inappropriate fertilizer regimes.
Yield Loss Assessment
Variety HP 1633 showed a yield loss
of 21.72% and a 1000-grain weight loss of
9.80% with a disease reduction of 64.00%.
Variety UP 262 showed an 18.34% yield
loss and a 9.00% loss in 1000-grain weight
with a 68.57% reduction in disease.
Chemical Control
Maximum yield and grain weight,
and minimum disease intensity was
observed after three sprays of fungicide
Tilt 25 EC (0.5 L ha-1) followed by two
sprays of Tilt 25 EC (0.5 L ha-1) and three
sprays of Indofil M-45 (2.5 kg ha-1).
References
Joshi, L.M., Renfro, B.L., Saari, E,E.,Wilcoxon, R.D" and S.P. Raychaudhuri.1970. Diseases of wheat in India otherthan rust and smuts. Plant Dis Reptr54:594-97.
Mitra, M. 1931. A comparative study ofspecies and strains of Helminthosporiumon certain Indian cultivated crops. TransBrit Mycol Soc 15:254-63.
Mitra, M. 1934. A new leaf spot disease ofwheat caused by Helminthosporium triticirepentis Died. Indian J Agric Sci4:692:700.
Patel, M.K., Kamat, M.N., and Y.A. Padhya.1953. A new species of Helminthosporiumon wheat. Indian PhytopathoI6:15-26.
Singh, G.P., and P. Mukarjee. 1981.Occurrence of Helminthosporium tetramerain V.P. Indian PhytopathoI34:535-537.
Singh, R.v., Singh, AX, and S.P. Singh.1992. Distribution of foliar blight ofwheat pathogens in India. Proceedingsof 44th Annual Meeting of the IndianPhytopathological Society 45:LXVI.
Singh, S.D., and A. Singh. 1967.Helminthosporium blight in Mexicanwheats. The 6th All India WheatResearch Workers' Workshop, NewDelhi.
63
Occurrence and Significance of SpotBlotch In Bangladesh
KB. Alam, S.P. Banu, and M.A. Shaheed
Bangladesh Agricultural Research Institute, Joydebpur, Gazipur, Bangladesh
Abstract
Spot blotch, caused by Bipolaris sorokiniana, is adestructive disease ofwheat in the ricebased cropping system of Bangladesh. The disease has the potential to be epiphytotic on thewheat variety Kanchan, which covers 85% of the total wheat area in the country. The diseaseappears at the seedling stage and increases in severity with plant age. Incidence of the pathogenin grain is common. At the present time, almost all released varieties in Bangladesh showvarying degrees of spot blotch susceptibility but no germplasm has been found to be highlyresistant. Yield losses in varieties Akbar, Agrahni, Kanchan, Sawgat, and Sonalika were 16.7%,9.7%,19.0%,23.0%, and 23.6%, respectively. In the 1991/92-1993/94 wheat seasons, theaverage wheat yield loss due to spot blotch was estimated at 14.9%. Variability among B.
sorokiniana isolates collected from different locations in Bangladesh has been studied.
Wheat (Triticum aestivum 1.) is the
second major cereal crop in the rice-basedcropping system of Bangladesh. In 1991/92, the area under wheat cultivation wasestimated at 0.6 million ha, with anaverage yield of 2.3 t ha-1 (Anonymous
1992); during the early 1970s, the area
under wheat cultivation was only 0.1million ha. The introduction and
development of semidwarf, high yielding
varieties had a significant impact onwheat area and production: both
increased significantly between 1974/75
1984/85. The increase in wheat
\ production during this period was almost40% per annum; however, both area and
production decliJ\ed by 8% between
1985/86-1988/89 due to a rapidexpansion in winter rice cultivation. In
recent years wheat area and production
have remained almost static (Malaker1996).
Incidence
Disease is one of the major constraintsfor wheat production in Bangladesh,where climatic and agro-ecological
conditions favor rapid development andgrowth of various plant pathogens. The
most frequently occurring pathogen inBangladesh is Bipolaris sorokiniana (Sacc.
in Sorok.) Shoemaker, teleomorph
Cochliobolus sativus (Ito & Kuribayashi)Drechs. ex Dastur, (syn. Helminthosporiumsativum Pamm., King & Bakke), which
causes spot blotch of wheat, now the
major limitation for wheat cultivation in
the country (Alam et al. 1994). The
recommeJ\ded cultivars are either
moderately susceptible or susceptible;Akbar, Ananda, Sawgat, and Prativa are
moderately susceptible (MS), andAgrahni, Balaka, Barkat, Kanchan, and

64 K.B. Alam, S.P. Banu, and M.A. Shaheed
Sonalika are susceptible (S). The pathogen
is commonly found in grain. The highest
level of seedbome fungal infection was
observed for B. sorokiniana (46%),followed by Aspergillus flavus Link ex Fr.
(31%), Alternaria tenuis (Syn. A. alternata)(Fr.) Keissler (28%), Rhizopus spp. (23%),
Curvularia lunata (Wakker) Boedijn (22%),
and Sclerotium rolfsii Sacco (4%)
(Kamaluddin 1996; Figure 1).
During the 1980s, several high
yielding varieties were released for
cultivation under different growing
conditions in Bangladesh; however, cv.
Kanchan was the most popular in all
regions. This variety currently occupies
about 80% of the total wheat sown area,
whereas it covered only 40% in the 1989/
90 growing season (Razzaque et al. 1994).
Other varieties grown are Akbar,
Sonalika, Aghrani, and Prativa. Although
almost 100% of the wheat area is under
high yielding varieties, the national yield
average still remains low compared to
many other wheat producing countries.
%of prevalence50
40
30
20
10
o
• S. raltsiilIm! Rhizapus spp.~ C./unataf1m 8. sarakinianat2l A. flavusDA. tenuis
A 10-year survey conducted in
Bangladesh during the 1985/86-1995/96
wheat seasons showed that spot blotch
damage occurs late in the season when
the crop is approaching maturity. It was
also observed that environmental
conditions in the south of the country are
more favorable for rapid pathogen
development and growth than in the
north. Sowing time has a marked effect
on spot blotch incidence. From our
observations, it appeared that disease
incidence was higher on late planted
(December 15-20) than optimum planted(November 15-30) wheat (Alam and Shah
1991).
Selection for B. sorokiniana resistance
has been initiated using the best available
germplasm at seedling and adult plant
stages. To date, high resistance levels
have not been found; however, in lines
A6/Glen, Prl/Toni, Mayoor, Chirya-3,
Chirya-7, Suzhoe-8, Altar84/T.tauschii(205)/ /3"Opata, and Altar84/ T.tauschii(224)/ /4"Yaco, the top leaves were
noted to be free from infection, but some
isolated lesions were found on lower
leaves at later growth stages. Three spot
blotch resistant cultivars in Brazil, RB18,
BR4, and CEP-ll, showed susceptibility
when grown in Bangladesh. Available
alien species were tested against B.
sorokiniana strains at all growth stages.
Wild species of wheat T. e(ongatum, T.tauschii, and Haynaldia villosa were found
moderately resistant, with T. elongatumthe most resistant of the three.
652 3 4Fungi
Figure 1. Prevalence offungi associated withwheat seed.

Significance
Yield loss due to spot blotch has beenreported at 23.6% for old cultivar
Sonalika, compared with losses of 16.7,9.7,23.0, and 19.0% for recommended
cultivars Akbar, Aghrani, Sawgat, and
Kanchan, respectively (Razzaque andHossain 1991; Alam et ai. 1995). Yield
losses in Kanchan were 5.7, 8.2 and 10.5%
for the 1985/86; 1986/87, and 1987/88wheat seasons, respectively (Anonymous
1986,1987,1988). The average wheat
yield loss due to spot blotch on severalfarms in Bangladesh over a number of
years was estimated at 15%. The
experiment was conducted on farms atfour different locations during the 1991/92-1993/94 wheat seasons. Kanchan was
selected for all trials and two treatmentswere applied: spraying with 0.5 L ha-1 Tilt
250 Ee and no spraying :(Alam et ai.1995).
Pathogen Diversity
The diversity of 27 isolates of B.
sorokiniana was studied. Seven different
morphological and physiological
Figure 2. Scatter diagram of 27isolates of Bipolaris sorokinianabased on their principal 10component scores and clusteranalysis. 5
o
-5
·10
Occurrence and Significance of Spot Blotch In,Bangladesh 65
characters were considered in order to
determine the divergence level amongisolates. Based on multivariate analysis,
all 27 isolates clustered in four groups
(Figures 2 and 3). Principal component
analysis, principal coordinate analysis,cluster analysis, and canonical variate
analysis all produced similar results.Three isolates belonged to cluster I, 6 tocluster 11,14 to cluster III, and 4 to cluste~
IV. The highest inter-cluster distance wasobserved between cluster I and IV, and
the lowest between I and III. Among theseven characters evaluated, cell number
per conidium and sporulation at pH 7.0
Figure 3. Intra-and inter-cluster distences of 27isolates of Bipolaris sorokiniana.
Z,
·80 ·60 -40 -20 o 20 40 60 80
66 K.B. Alem, S.P. Benu, end M.A. Sheheed
contributed most to divergence among
isolates; however, variability in the
degree of isolate pathogenicity needs to
be tested in artificial inoculation
experiments (Ahmed 1996).
Referenoe.
Ahmed, AU. 1996. Morphological variationof isolates of B. sorokianiana. M.S. thesisInstitute of Post-graduate Studies in 'Agriculture, SaIna, Gazipur. 62 pp.
Alam, K.B., and N.K. Saha. 1991.Helminthosporium leaf blight of wheat a new problem in Bangladesh. Paperpresented at the CIMMYT RegionalWorkshop on Helminthosporium'LeafBlight, 1991. 12 pp.
Alam, K.B., Malaker, P.K., Shaheed, M.A,Ahmed, M.U., Ahmed, F., and M.S.Haque. 1995. Yield loss assessment ofwheat due to Bipolaris leaf blight inBangladesh. Bangladesh J Plant Pathol11:35-38.
Alam, K.B., Shaheed, M.A, Ahmed, AU.,and P.K. Malaker. 1994. Bipolaris leafblight (spot blotch) of wheat inBangladesh. In: D.A Saunders and G.P.Hettel (eds.), Wheat in Heat-StressedEnvironments: Irrigated, Dry Areas andRice-Wheat Farming Systems. Mexico,D.F.:CIMMYT.
Anonymous. 1986. Annual Report 1985-86.Plant Pathology Division, BangladeshAgricultural Research Institute,Joydebpur, Gazipur. 119 pp.
Anonymous. 1987. Annual Report ,1986-871Plant Pathology Division, BangladeshAgricultural Research Institute,Joydebpur, Gazipur. 109 pp.
Anonymous. 1988. Annual Report 1987·88.Plant Pathology Division, BangladeshAgricultural Research Institute,Joydebpur, Gazipur. 89 pp.
Anonymous. 1992. Wheat Newsletter.Wheat Research Center, BangladeshAgricultural Research Institute,Dinajpur. 5 pp.
Kamaluddin, M. 1996. Effect of seedtreatment on plant population and yieldof wheat. M.Sc. Ag. thesis, BangladeshAgricultural University, Mymenshing. 60pp.
Malaker, P.K. 1996. Distribution of P.recondita tritid and genetics of resistancesto three rusts in some Bangladesh wheat.Directorate of Wheat Research, RegionalStation, Flowerdale, Shimla, H.P., India.
Razzaque, M.A, and AB.S. Hossain, 1991.The wheat development program inBangladesh. In: D.A Saunders (ed.),Wheat for the Nontraditional WarmAreas, pp. 44·54. Mexico, D.E: CIMMYT.
Razzaque, M.A, Hossain, A.B.S., Ahmed,S.M., Sarkar, A::K.D., Rahman, M.,Barma, CD., and R. Amin. 1994. Wheatbreeding strategies in the rice farmingsystem of Bangladesh. In: D.A Saundersand G.P. Hettel (eds.), Wheat in HeatStressed Gnvironments: Irrigated, DryAreas and Rice-Wheat Farming Systems.Mexico, D.F.:CIMMYT.

67
Disease Incidence and Yield Loss Due toFoliar Blight of Wheat in Nepal
K.K. Shresthal, R.D. Timilal, BN. Mahto2, and H.P. Bimb2
1 Plant Pathology Division, Nepal Agricultural Research Council (NARC), Nepal2 National Wheat Research Program, Bhairahawa, Nepal
Abstract
Helminthosporium leaf blight (HLB, tan spot) is a serious disease ofwheat in Nepal, causedindividually or in combination by Bipol:uis sorokiniana (Sacc.) Shoem. and Pyrenophoratritici-repentis (Died.) Shoem. In recent years, the magnitude and severity ofHLB haveextended from the terai region (100 masl) to the hilly region (2400 masl). Since 1990, B.sorokiniana has been the predominant pathogen of the leaf blight syndrome. Incidence ofseedinfection was higher in samples from eastern terai than western terai and the hills. Therelationship between seed infection and germination was significant and negatively correlated.Most of the improved and recommended wheat varieties are severely infected by the disease;however, varieties including NL 644, NL 623, BL 1413, Nepal 297, NL 625, NL 591, andTriveni showed moderate HLB resistance and BL 1420 was observed to be resistant. Eighty-sixentries, resistant/tolerant to HLB, were selected from multilocation trials, and could be used aspotential sources of resistance. Yield losses as high as 23.8% were recorded. Poor germinationwas experienced due to high B. sorokiniana infection levels in grain harvested during 1996.This problem was solved by treating the seed with Vitavax-200 before distribution to farmers.Disease management has been practiced in Nepal for the last few years. Incidence ofHLB wassignificantly reduced by two irrigation cycles and three applications ofpropiconazole as afoliarspray at 0.5 L ha-1•
In Nepal, more than 80% of the total
population is engaged directly or
indirectly in agriculture or agro-basedindustries. Wheat occupies the third
position among the thre~ major cereal
crops with a cultivation area of 653,000 haand a productivity of 1.48 tha-1• Over the
last 10 years, there has been an increase in
wheat area, production, and productivity
from 576,000-653,000 ha, 743,000-965,000t, and 1.29-1.48 t ha-1, respectively
(Anonymous 1996; Figure 1).
88 89 90 91 92 93 94 95Year
Figure 1. Wheat area, production. and productivityin Nepal.

68 K.K. Shreslha st al.
Helminthosporium leaf blight (HLB,
tan spot) is a serious disease of wheatcaused individually or in combination by
Bipolaris sorokiniana (Sacc.) Shoem. (syn.
Helminthosporium sativum Pamm., King &
Bakke) and Pyrenophora tritici-repentis(Died.) Drechs. (syn. Drechslera triticirepentis (Died.) Shoem. Helminthosporium leaf blight is considered a disease
of major importance because of its
potential to cause yield loss. It is widelydistributed throughout the wheat
growing areas of the country, particularlyin the terai (Anonymous 1976). Tan spot,caused by P. tritici-repentis; was recordedin 1978 and its incidence has annually
increased (Karki 1982). Since this time,disease severity has been high, affectingthe leaves of commercial cultivars before
the mid dough stage of plant growth ineastern to western regions of the country(Karki and Horsford 1986). Karki and
Lohani (1980) reported that a fewcultivars were found to be resistant/tolerant to the disease. Prior to 1990, the
pathogen was considered important incausing leaf blight, but later B. sorokinianawas found to be predominant and
responsible. This change in pathogendominance may be due to environmental
change and the introduction of new exotic
wheat varieties. In Nepal, both pathogenswere isolated from similar types of lesions
on leaves, although different symptomshave been described by Wiese (1977).
Distribution, Severity,and Losses
In recent years, HLB due to B.
sorokiniana has extended from the lowerbelt of the terai region (100 masl) to the
hilly region (2400 masl); however,
incidence and severity are comparativelyhigher in the terai than in the hills
(Anonymous 1991; Karki and Sharma1990).
Magnitude of yield loss due to HLB
may vary among locations and years.Based on a survey conducted in various
parts of the country, a disease incidence
of up to 90% on cv. RR21 was recorded inthe terai belt and 40-50% in the hills
(Anonymous 1979). Leaf blight was also
reported in the lower belt of the LumleAgricultural Research Command Areas.A higher disease incidence (74, using the
double digit scale) on cv. Annapurna wasrecorded after a single top dressing offertilizer than after a double top dressing
(53) (Sharma 1995). Disease level on theflag leaf (F) and the F-1 best shows therelationship between disease severity and
grain yield loss (Chaurasia 1995). Grainyield losS'was reported to vary withgenotype (Mahto et al. 1995). The highestgrain yield loss was reported for RR 21,ranging between 23.2 and 23.8%. Yield
losses recorded in the field at Bhairahawawere 7.9%, 3.1%, and 15.2% for Ocepar 7,
Ning 8319, and Nepal 297, respectively.
Bipolaris sorokiniana inWheat Seed
Bipolaris sorokiniana is seed and
soilborne, and in nature is seed
transmitted (Neergaard 1977; Mehta
1993). In 1977, the pathogen was reportedin seed samples of wheat (Shrestha 1977;
Shrestha et al. 1977). Seed infection by B.
sorokiniana can adversely affect
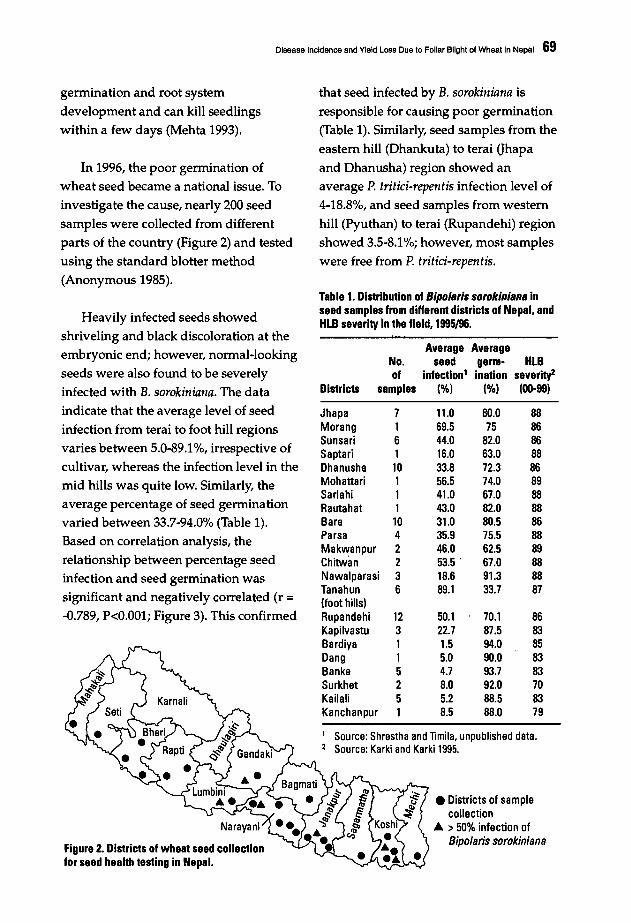
Disease Incidence and Yield Loss Due to Foliar Blight of Wheat In Nepal 69
germination and root system
development and can kill seedlingswithin a few days (Mehta 1993).
In 1996, the poor germination ofwheat seed became a national issue. To
investigate the cause, nearly 200 seed
samples were collected from differentparts of the country (Figure 2) and tested
using the standard blotter method
(Anonymous 1985).
that seed infected by B. sorokiniana is
responsible for causing poor germination(Table 1). Similarly, seed samples from the
eastern hill (Dhankuta) toterai (Jhapa
and Dhanusha) region showed anaverage P. tritici-repentis infection level of4-18.8%, and seed samples from western
hill (Pyuthan) to terai (Rupandehi) regionshowed 3.5-8.1%; however, most samples
were free from P. tritici-repentis.
Table 1. Distribution of Bipo/aris sorokiniana inseed samples from different districts of Nepal. andHLB severity in the field. 1995/96.
Jhapa 7 11.0 80.0 88Morang 1 69.5 75 86Sunsari 6 44.0 82.0 86Saptari 1 16.0 63.0 88Dhanusha 10 33.8 72.3 86Mohattari 1 56.5 74.0 89Sarlahi 1 41.0 67.0 88Rautahat 1 43.0 82.0 88Bara 10 31.0 80.5 86Parsa 4 35.9 75.5 88Mak~anpur 2 46.0 62.5 89ChiIWan 2 53.5· 67.0 88Nawalparasi 3 18.6 91.3 88Tanahun 6 89.1 33.7 87(foot hills)Rupandehi 12 50.1 70.1 86Kapilvastu 3 22.7 87.5 83Bardiya 1 1.5 94.0 85Dang 1 5.0 90.0 83Banke 5 4.7 93.7 83Surkhet 2 8.0 92.0 70Kailali 5 5.2 88.5 83Kanchanpur 1 8.5 88.0 79
1 Source: Shrestha and limila. unpublished data.2 Source: Karki and Karki 1995.
• Districts of samplecollection
... >50% infection ofBipolaris sorokiniana
HLBseverityZ(00-99)
Average Averageseed germ-
infection' inatlon(%) (%)
No.of
samplesDistricts
Figure 2. Districts of wheat seed collectionfor seed health testing in Nepal.
Heavily infected seeds showedshriveling and black discoloration at the
embryonic end; however, normal·lookingseeds were also found to be severely
infected with B. sorokiniana. The dataindicate that the average level of seed
infection from terai to foot hill regionsvaries between 5.0-89.1%, irrespective of
cultivar, whereas the infection level in themid hills was quite low. Similarly, the
average percentage of seed germinationvaried between 33.7-94.0% (Table 1).
Based on correlation analysis, the
relationship between percentage seedinfection and seed germination was
significant and negatively correlated (r =-0.789, P<0.001; Figure 3). This confirmed

70 K.K. Shresthaet 8/.
Di.ea.e .Management
Experiments on integrated disease
management for foliar blight control have
been conducted over the last few: years.
Varietal performanceMost of the improved and
recommended wheat varieties in Nepalare severely affected by foliar blight.
Generally high HLB infection wasobserved in check varieties RR 21 and UP
262 during the 1990s. High yielding
cultivars had lower AUDPC (area underthe disease progress curve). Ning 8319produced the highest yield (5,108 kg ha-1)
in 1994, followed by NL 590, DL 153~2,
and Nepal 297 (Mahto et aI. 1995). Lateheading varieties such as WPH 153, WPH
241, WPH 243 had less blight. In thelastfew years, variety NL 645 has shown goodperformance in terms of disease resistanceand agronomic character (Sharma et aI.
1995).
Genotypes NL 644, NL 623, BL 1413,Nepal 297, NL 625, NL 591, and Triveni
were found to have better levels of HLB
resistance than check varieties RR 21 and
UP 262, whereas BL 1420 was observed to
be resistant but is agronomicallyunacceptable (Bimb and Mahto 1992a,
1992b, 1992c). Six entries with a score of 93
were found in the helminthosporiummonitoring nursery, in which 44 entries
with good HLB resistance levels from
CIMMYT were included. Of 140 entries
from the multilocational
helminthosporium leaf blight screening
nursery, 86 were selected as resistant/tolerant to BLB and could be used as
potential sources of resistance (Mahto1995). Thinopyrum curvifolium derivativesand Chinese lines were also reported to
have good HLB resistance.
Soli solarizationThe residual effect of soil solarization,
occurring in May at Bhairahawa, increased
the yield of the wheat crop following riceby 12.44% by significantly reducing HLB.It was also noted that root necrosis andsubcrown internode infection were higherin the plotwhere no solarization occurred
(Bimb and Mahto 1992a). Soil solarizationin November significantly reduced rootnecrosis and HLB (Dubin and Bimb 1994).
IrrigationThe application of two irrigation cycles
reduced leaf blight levels on the wholeplant and on the flag leaf up to the dough
growth stage. This practice increased grainyield, spikes m-2, and biomass by
significantly reducing foliar blight
compared with the non-irrigated plot.•
r =-0.789P >0.001
•
30
........90 .......~.-....
''''''. .. ................. . ..""..... ' ............
.........................
Figure 3. The effect of Blpolsrl' ,oroklnlsnsinfection level on wheat seed germination.
o 20 40 60Seed infection (%1
80Chemical control
Foliar spray-Several fungicides
including Bavistin, Benlate, Blitane,

Disease Incidence and Yield Loss Due to Foliar Blight of Wheat In Nepal 71
Dithane M~45, and Ditha'ne Z~78 were
tested. Dithane M45 at 2 kg ha-1 in 800 L
of water was found to' be superior to otherchemicals in reducing disease infection
(Anonymous 1977; Bimb 1979).
Tilt (propiconazole) was also found tobe quite effective in reducing HLB. Foliar
blight was effectively controlled by threesprays of Tilt at a rate of 0.5 L ha-1 in two
weekly intervals. A 16.19% loss in grain
yield was recorded in unsprayed plots(Mahto and Sedhai 1994).
Seed treatmentRovral (iprodione) at 2.5g per kg of
seed achieved the highest control of B.sorokiniana, followed by Vitavax~260at 2.5
g, and Vitavax-75 at 2.0 g per kg of seed.
Since Rovral is not locally available,Vitavax~200 and Vitavax-75 were
recommended to farmers. A significantincrease in seedling emergence insterilized soil was also observed after
application of these fungicides (Timila andShrestha, unpublished).
Future ResearchStrategies
Studies need to focus on whether B.sorokiniana and P. tritici-repentis,individually or in combination, are
responsible for causing economic yieldloss. Research into the role of seedborne
inoculum and foliar blight incidence in the
field should be investigated. The effect of
indigenous materials should be tested todetermine their efficacy for foliar blight
control.
Conclusion
Concerns have been raised over theincreased HLB incidence in the terai belt
of Nepal due to the planting of carry-overseed by farmers in many districts. Until
resistant varieties are developed, it is
recommended that Vitavax-200 orVitavax~75be provided to farmers and
seed producers by the Government at areasonable cost.
In view of the increasing HLBincidence in the terai region, it is
emphasized that seed lots with B.sorokiniana infection levels higher than
20% may not be used for planting withoutseed treatment.
Acknowledgment
The authors are grateful to Mr. J.e.Gautam, Executive Director, and Mr. R.P.Sapkota, Director (Crop /Hort), NepalAgricultural Research Council (NARC),
for their full support and incentive toparticipate in the workshop. The financial
and technical help from Dr. E. Saari,
CIMMYT, Kathmandu, is gratefullyacknowledged. Sincere thanks are also
due to Dr. S.K. Shrestha, SerUor Plant
Pathologist, Plant PathologyDivision, forcritically examining the manuscript and
providing valuable suggestions.
References
Anonymous. 1976. National WheatDevelopment Program, Nepal. AnnualReport 1975/76, pp.75-81. Ministry ofFood, Agriculture and Irrigation.Department of Agriculture, NWDp,Nepal.
12 KK Shrsstha et a/.
Anonymous. 1977. National WheatDevelopment Program, Nepal. AnnualReport 1976/77. Ministry of Food,Agriculture and Irrigation, Departmentof Agriculture, NWDP, Nep~l.
Anonymous. 1979. Wheat Report. The 7thWinter Crops Workshop. Ministry ofFood, Agriculture and Irrigation.Department of Agriculture, NWDp,Nepal.
Anonymous. 1985. International Rules forSeed Testing. Rules 1985;. Seed Scienceand Technology 13(2):299-513.
Anonymous. 1991. National WheatDevelopment Program, Nepal. AnnualReport 1990/91. Ministry of Food,Agriculture and Irrigation. Departmentof Agriculture, NWDP, Nepal.
Anonymous. 1996. Economic Survey FiscalYear 1995/1996. Ministry of Finance,1996. (Nepali)
Bimb, H.P. 1979. Effect of DM-45 for controlof leaf blight of wheat caused byHelminthosporium spp. in 1978-1979 atBhairahawa. Wheat Report. The 7thWinter Crops Workshop. M~nistry ofFood, Agriculture and Irrigation.Department of Agriculture, NWDP,Nepal.
Bimb, H.P., and B.N. Mahto. 1992a. Residualeffect of May soil solarization onsubsequent wheat crop. Wheat Reports,1991/92, pp. 119-120. Nepal: HMG/NARC
Bimb, H.P., and B.N. Mahto. 1992b.International wheat disease nursery.Wheat Reports, 1991/92, pp. 112-113.Nepal: HMG /NARC
Bimb, H.P., and B.N. Mahto. 1992c. Geneticresistance to helminthosporium leafblight (HLB) in advanced bread wheatlines, Bhairahwa. Wheat Reports, 1991/92, pp. 114-115. Nepal: HMG.
Chaurasia, P.CP. 1995. Determination of arelationship between disease severity ofleaf blight of wheat and grain yield loss.Proceedings of Wheat Research Reports,1996, pp. 355-360. Nepal: NWRP.
Dubin, H.J., and H.P. Bimb 1994. Studies ofsoilborne diseases and foliar blight ofwheat at the National Wheat ResearchExperiment Station, Bhairahawa, Nepal.Wheat Special Report No. 36. Mexico,D.E: CIMMYT
Karki, CB. 1982. Tan spot and other foliardiseases of Wheat in N~pal. In: RM.Horsford Jr.'(ed.), Tan Spot of Wheat andRelated Diseases WotkShop; 1981, pp. 7681. Fargo, ND, USA: North I;:>akota StateUniversity.
Karki, CB., and P.B. Karki. 1995. Wheatdisease report 1995/96. In: Proceedings ofthe National Winter Crops TechnologyWorkshop, 1995. Kathmandu, Nepal:NARC & CIMMYT.
Karki, CB., and RM. Horsford. 1986.Epidemic of wheat leaf blight in Nepalcaused by Pyrenophora tritici-repentis.Nepalese J Agric 17:69-74.
Karki, CB., and S. Lohani. 1980. WheatPathology Trial Report 1979-80. In: WheatReports of the 8th Winter CropsWorkshop, pp. 151-167. Nepal: NWDP.
Karki, CB., and S. Sharma. 1990. Wheatdisease report 1989-1990. Paper presented
'at the 5th Winter Crop Working GroupMeeting. Nepal: NWDP.
Mahto, B.N. 1995. Wheat disease screening •nurseries. In: Proceedings of the 1994/95Winter Crops Research Workshop, pp.289-307. NARC
Mahto, B.N., and G.P. Sedhai. 1994. Lossassessment of wheat due to foliar blight.Wheat Proceedmgs. NWRP, NARC
Mehta, Y.R 1993. Spot blotch (Bipolarissorokiniana). In: S.B. Mathur and B.M.Cunfet (eds.), Seed-Borne Diseases ai'ldSeed Health Testing of Wheat,'pp. 105112. Copenhagen, Denmark: Institute ofSeed Pathology for Developing Countries.168 pp.
Neergaard, P. 1977. Seed Pathology. VoL 1,pp.839.
Sharma, S. 1995. Wheat diseases in westernhills of Nepal. Wheat Research Report1996, pp. 339-344. Nepal: NWRP.
Sharma, S., Ghimire, S.R, Pradhanang, P.M.,and RR Pandey. 1995. Varietal screeningagainst major diseases of wheat. WheatResearch Report 1996, pp. 329-337. Nepal:NWRP.
Shrestha, K 1977. A list of seed-borneorganisms in Nepal. Nep J Agric12:217223.
Shrestha, K, Mathur, S.B., and P. Neergaard.1977. Seed-borne organisms in SOp.1e cropsof Nepal. Seed Sci and Technol5:111-121.
Wiese, M.V. 1977. Compendium of WheatDiseases. St. Paul, MN: APS.
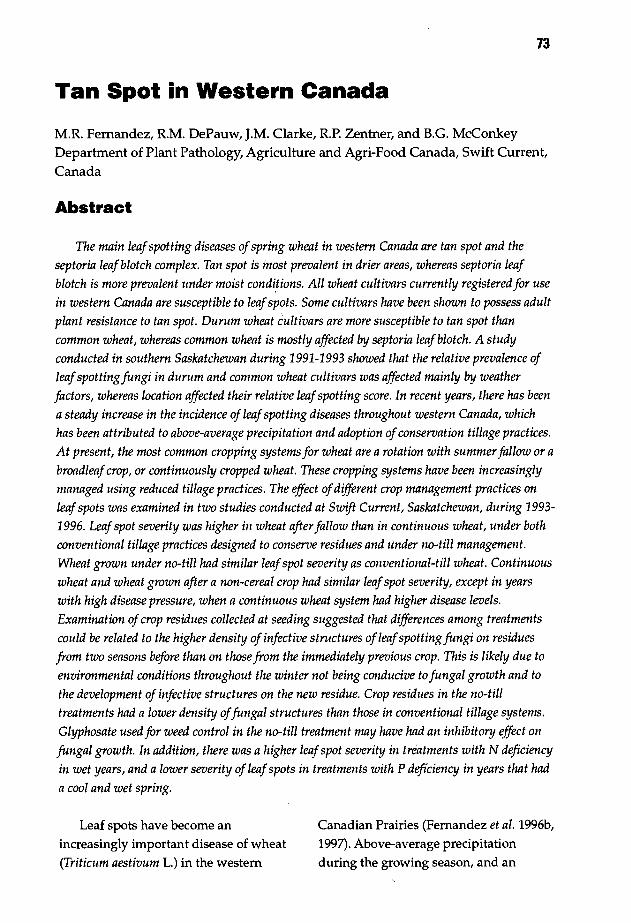
73
Tan Spot in Western Canada
M.R Fernandez, RM. DePauw, J.M. Clarke, RP. Zentner, and B.G. McConkeyDepartment of Plant Pathology, Agriculture and Agri-Food Canada, Swift Current,
Canada
Abstract
The main leafspotting diseases ofspring wheat in western Canada are tan spot and theseptoria leaf blotch complex. Tan spot is most prevalent in drier areas, whereas septoria leafblotch is more prevalent under moist conditions. All wheat cultivars currently registered for usein western Canada are susceptible to leaf spots. Some cultivars have been shown to possess adultplant resistance to tan spot. Durum wheat cultivars are more susceptible to tan spot thancommon wheat, whereas common wheat is mostly affected by septoria leaf blotch. A studyconducted in southern Saskatchewan during 1991-1993 showed that the relative prevalence ofleaf spottingfungi in durum and common wheat cultivars was affected mainly by weatherfactors, whereas location affected their relative leaf spotting score. In recent years, there has beena steady increase in the incidence of leaf spotting diseases throughout western Canada, whichhas been attributed to above-average precipitation and adoption ofconservation tillage practices.At present, the most common cropping systems for wheat are a rotation with summerfallow or abroadleafcrop, or continuously cropped wheat. These cropping systems have been increasinglymanaged using reduced tillage practices. The effect ofdifferent crop management practices onleaf spots was examined in two studies conducted at Swift Current, Saskatchewan, during 19931996. Leaf spot severity was higher in wheat after fallow than in continuous wheat, under bothconventional tillage practices designed to conserve residues and under no-till management.Wheat grown under no-till had similar leaf spot severity as conventional-till wheat. Continuouswheat and wheat grown after a non-cereal crop had similar leaf spot severity, except in yearswith high disease pressure, when a continuous wheat system had higher disease levels.Examination ofcrop residues collected at seeding suggested that differences among treatmentscould be related to the higher density of infective structures ofleafspotting fungi on residuesfrom two seasons before than on those from the immediately previous crop. This is likely due toenvironmental conditions throughout the winter not being conducive to fungal growth and tothe development of infective structures on the new residue. Crop residues in the no-tilltreatments had a lower density offungal structures than those in conventional tillage systems.Glyphosate used for weed control in the no-till treatment may have had an inhibitory effect onfungal growth. In addition, there was a higher leaf spot severity in treatments with N deficiencyin wet years, and a lower severity ofleaf spots in treatments with P defiCiency in years that hada cool and wet spring.
Leaf spots have become anincreasingly important disease of wheat(Triticum aestivum L.) in the western
Canadian Prairies (Fernandez et al. 1996b,1997). Above-average precipitationduring the growing season, and an
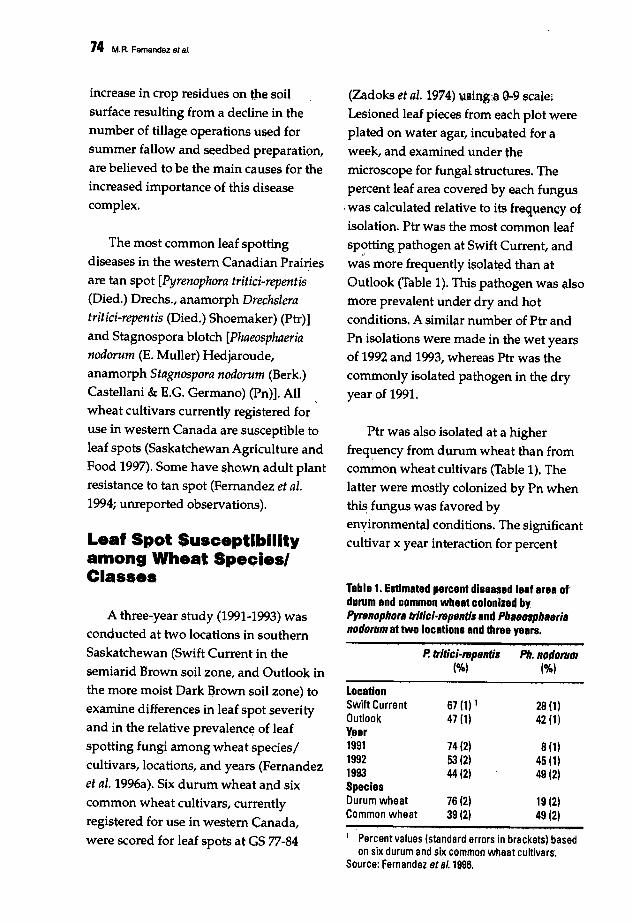
74 M.R. Femandez 9/ al.
1 Percent values (standard errors in brackets) basedon six durum and six common wheat cultivars.
Source: Fernandez at 8/.1996.
Table 1. Estimated percent diseased leaf area of'durumand oommon wheat colonized byPy",nophor. trltioi·",p8ntl, and Ph.808ph.8ri.nodorum at two locations and three years.
LocationSwift Current 67 (1) 1 28(1)Outlook 47(1) 42111Year1991 74(2) 8 (1)1992 53(2) 45 (1)1993 44(2) 49 (2)SpeciesDurum wheat 76 (2) 19 (2)Common wheat 39 (2) 49 (2)
Ptr was also isolated at a higher
freq~ency from durum wheat than fromcommon wheat cultivars (Table 1). Thelatter were mostly colonized by Pn whenthis fungus was favored byenvironmental conditions. The significantcultivar x year interaction for percent
Ph. "odorum(Ofo)
P. trltioi-",penti,(Ofo)
(Zadoks et al. 1974) 1IlJing'@ Q~9 scale,Lesioned leaf pieces from each plot wereplated on water agar, incubated for aweek, and examined under themicroscope for fungal structures. Thepercent leaf area covered by each fungus
.was calculated relative to its frequency ofisolation. Ptr was the most common leafspotting pathogen at Swift Current, and
J
was more frequently isolated than atOutlook (Table 1). This pathogen was alsomore prevalent under dry and hotconditions. A similar number of Ptr andPn isolations were made in the wet yearsof 19~2 and 1993, whereas Ptr was thecommonly isolated pathogen in the dryyear of 1991.
A three-year study (1991-1993) wasconducted at two locations in southernSaskatchewan (Swift Current in thesemiarid Brown soil zone, and Outlook inthe more moist Dark 13rown soil zone) toexamine differences in leaf spot severityand in the relative prevalenc~ of leafspotting fungi among wheat species/cultivars, locations, and years (Fernandezet al. 1996a). Six durum wheat and sixcommon wheat cultivars, currentlyregistered for use in western Canada,were scored for leaf spots at GS 77-84
L.af Spot Su.ceptibilityamong Wheat Speqi••'Cia••••
The most common leaf spottingdiseases in the western Canadian Prairiesare tan spot [Pyrenophora tritici-repentis(Died.) Drechs., anamorph Drechsleratritici-repentis (Died.) Shoemaker) (Ptr)]and Stagnospora blotch [Phaeosphaerianodorum (E. Muller) Hedjaroude,anamorph Stagnospora nodorum (Berk.)Castellani & E.G. Germano) (Pn)]. Allwheat cultivars currently registered foruse in western Canada are susceptible toleaf spots (Saskatchewan Agriculture andFood 1997). Some have shown adult plantresistance to tan spot (Fernandez et al.1994; unreported observations).
increase in crop residues on the soilsurface resulting from a decline in thenumber of tillage operations used forsummer fallow and seedbed preparation,are believed to be the main causes for theincreased importance of this diseasecomplex.

isolation of Ptr and Pn (Table 2) indicated
that cultivars reacted differently to thedifferent prevalence of the fungi
attributed to environmental conditions. In
contrast, the significant cultivar x location
interaction for leaf spot scores suggestedthat the different relative severity of leaf
spots among cuItivars was possibly
related to differences in disease pressurebetween locations.
These observations have implications
for establishing protocols for testinggermplasm for leaf spot resistance.
Selection of the most appropriatelocations and useful benchmarks for
selecting germplasm for leaf spotresistance in a given type of wheat shouldinvolve assessment of the leaf spot
reaction of potential checks underdifferent environments, and identification
of the most prevalent leaf spotting fungi.
Effect of ManagementPractice on Leaf SpottingDiseases
The effects of summer fallow, rotation
with a noncereal crop, and fertility wereexamined in a field study, conducted at
Swift Current from 1993-1996. Ten crop
Tan Spot In Weslem Canada 75
rotations suitable for southwestern
Saskatchewan, involving spring wheat(cv. Lancer) in rotation with other cereal
or noncereal crops, or in a 1-5 year
rotation with summer fallow, orcontinuously grown, were examined. All
phases of the rotations were represented
every year and each rotation was cycledon its assigned plots (10.5 m wide x 40 m
long). Treatments were arranged in a
randomized complete block design withthree replicates. Plots were managedusing conventional tillage practices, but
designed to conserve surface cropresidues. The frequency of soil tillage waskept to a minimum; fallow areas received
an average of three tillage operationsduring the summer season. Fertilizers N
and P were applied in accordance withguidelines provided by the Saskatchewan
Advisory Council on Soils. The N wasbroadcast as ammonium nitrate (34-0-0)
and soil-incorporated by tillage used toprepare the seedbed. The average rate of
N fertilizer applied to wheat was 37 kgha-1• Phosphorus was applied with theseed as monoammonium phosphate at anaverage rate of 9.7 kg P ha-1. Some of the
treatments were deficient in fertilizer;
these were continuously grown wheatwith P but no N added, and wheat grown
Table 2. Analysis of deviance of the probability of leaf spot scores not exceeding 6(on ascale of 0-9) on 12wheat cultivars at two locations over three years. and of percent leaf area colonized by leaf spottingpathogens (Pymnophor8 tritici-mpBntis and Ph8Bosph8eri8 nodorum).
Source of variation df'Deviance
Leaf spot scoreDeviance ratio
Po tritici-mpBntis Ph. nodorum
CultivarCultivar x YearCultivar x Location
1 Degrees of freedom.** Significant at P<O.01.Source: Fernandez st 8/.1996.
122212
54.49**8.40
41.24**
34.13**2.59**1.57
132.78**3.57**1.40
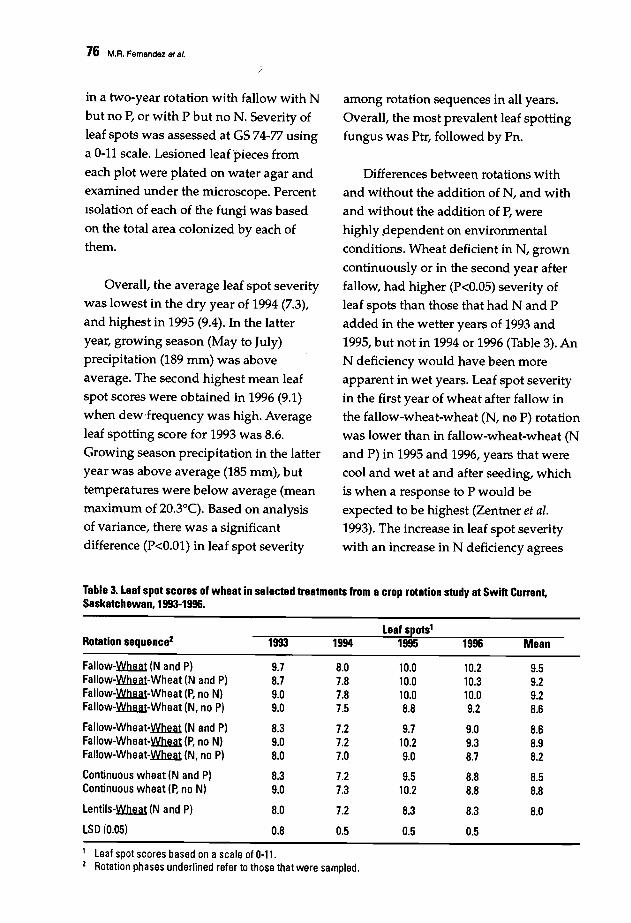
76 M.R. Fernendez et a/.
)
in a two-year rotation with fallow with N
but no P, or with P but no N. Severity ofleaf spots was assessed at GS 74-77 using
a 0-11 scale. Lesioned leaf pieces from
each plot were plated on water agar andexamined under the microscope. Percent
isolation of each of the fungi was based
on the total area colonized by each ofthem.
Overall, the average leaf spot severitywas lowest in the dry year of 1994 (7.3),and highest in 1995 (9.4). In the latter
year, growing season (May to July)precipitation (189 mm) was above
average. The second highest mean leafspot scores were obtained in 1996 (9.1)when dew frequency was high. Average
leaf spotting sCore for 1993 was 8.6.Growing season precipitation in the latteryear was above average (185 mm), but
temperatures were below average (meanmaximum of 20.3°C). Based on analysisof variance, there was a significant
difference (P<O.OI) in leaf spot severity
among rotation sequences in all years.Overall, the most prevalent leaf spotting
fungus was Ptr, followed by Pn.
Differences between rotations withand without the addition of N, and with
and without the addition of P, were
highly .dependent on environmental
conditions. Wheat deficient in N, grown
continuously or in the second year after
fallow, had higher (P<0.05) severity ofleaf spots than those that had Nand P
added in the wetter years of 1993 and1995, but not in 1994 or 1996 (Table 3). AnN deficiency would have been more
apparent in wet years. Leaf spot severityin the first year of wheat after fallow inthe fallow-wheat-wheat (N, no P) rotation
was lower than in fallow-wheat-wheat (Nand P) in 1995 and 1996, years that werecool and wet at and after seeding, which
is when a response to P would beexpected to be highest (Zentner et ai.1993). The increase in leaf spot severitywith an increase in N deficiency agrees
Table 3. leaf spot scores of wheat in selected treatments ftom a crop rotation study at Swift Cu"ent,Saskatchewan, 1993-1996.
Rotation sequence2leaf spots'
1993 1994 1995 1996 Mean
Fallow·~ (N and PI 9.7 8.0 10.0 10.2 9.5Fallow·~-Wheat (N and PI 8.7 7.8 10.0 10.3 9.2Fallow-~·Wheat (P, no NI 9.0 7.8 10.0 10.0 9.2Fallow·~·Wheat IN, no PI 9.0 7.5 8.8 9.2 8.6
Fallow·Wheat·~ (N and PI 8.3 7.2 9.7 9.0 8.6Fallow·Wheat·~ (P, no NI 9.0 7.2 10.2 9.3 8.9Fallow·Wheat-~ (N, no PI 8.0 7.0 9.0 8.7 8.2
Continuous wheat (N and PI 8.3 7.2 9.5 8.8 8.5Continuous wheat (P, no NI 9.0 7.3 10.2 8.8 8.8
Lentils-~ (N and P) 8.0 7.2 8.3 8.3 8.0
LSD (0.05) 0.8 0.5 0.5 0.5
1 Leaf spot scores based on ascale of 0-11.2 Rotation phases underlined refer to those that were sampled.
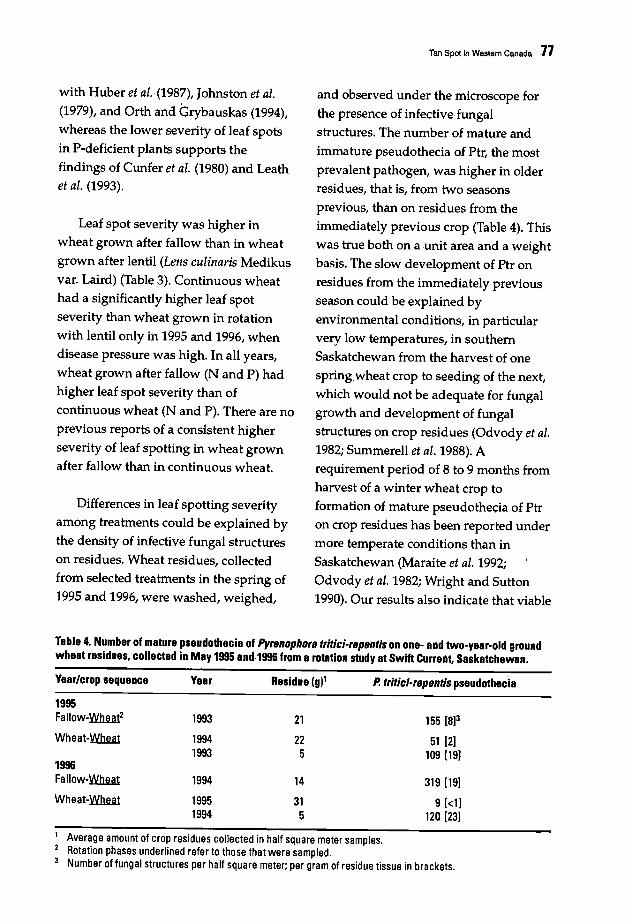
with Huber et ai.(1987), Johnston et ai.(1979), and Orth and Grybauskas (1994),whereas the lower severity of leaf spots
in P-deficient plants supports the
findings of Cunfer et ai. (1980) and Leathet ai. (1993).
Leaf spot severity was higher inwheat grown after fallow than in wheat
grown after lentil (Lens cuiinaris Medikus
var. Laird) (Table 3). Continuous wheathad a significantly higher leaf spot
severity than wheat grown in rotationwith lentil only in 1995 and 1996, whendisease pressure was high. In all years,
wheat grown after fallow (N and P) had
higher leaf spot severity than ofcontinuous wheat (N and P). There are noprevious reports of a consistent higher
severity of leaf spotting in wheat grownafter fallow than in continuous wheat.
Differences in leaf spotting severity
among treatments could be explained bythe density of infective fungal structureson residues. Wheat residues, collectedfrom selected treatments in the spring of
1995 and 1996, were washed, weighed,
Tan Spot In Westem Canada ,77
and observed under the microscope for
the presence of infective fungal
structures. The number of mature and
immature pseudotheciaof Ptr, the most
prevalent pathogen, was higher in olderresidues, that is, from two seasons
previous, than on residues from the
immediately previous crop (Table 4). Thiswas true both on a unit area and a weight
basis. The slow development of Ptr on
residues from the immediately previousseason,could be explained by
environmental conditions, in particularvery low temperatures, in southernSaskatchewan from the harvest of one
springwheat crop to seeding of the next,
which would not be adequate for fungalgrowth and development of fungal
structures on crop residues (Odvody et ai.1982; Summerell et ai. 1988). Arequirement period of 8 to 9 months from
harvest of a winter wheat crop toformation of mature pseudothecia of Ptron crop residues has been reported under
more temperate conditions than inSaskatchewan (Maraite et ai. 1992;Odvody et ai. 1982; Wright and Sutton
1990). Our results also indicate that viable
Table 4. Number of mature pseudothecia of Pyrenophor8 tritici-repentis on one- and two-year-old groundwheat residues. collected in May 1995 and,1996 from a rotation study at Swift Currellt Saskatchewan.
Year/crop sequence Year Residue (g)' Po tritici-repentis pseudothecia
1995Fallow-~ 1993 21 155 [8]3
Wheat-lIllb.e.a1 1994 22 51 [2]1993 5 109 [19]
1996Fallow-Wb.e.aJ; 1994 14 319 [19]
Wheat-Wb.e.aJ; 1995 31 9 [<1]1994 5 120 [23]
Average amount of crop residues collected in half square meter samples.Rotation phases underlined refer to those that were sampled.Number offungal structures per half square meter; per gram of residue tissue in brackets.
78 M.R. Famantlat at al.
infective structures are able to survive on
residues for at least two years, which
agrees with other reports (Krupinsky
1992; Pedersen and Hughes 1992).
The observation that rotating wheat
with a noncereal crop for one year did
not always result in lower leaf spot levels
than in continuous wheat couM be
explained by infective wheat residues
being carried over from previously
grown wheat crops, and to the possible
survival of wheat pathogens in residues
of nonhost species (Fernandez et al. 1990).
Based on these observations, we
concluded that the best crop rotation to
guarantee a low level of leaf spot
infection in spring wheat in the Brown
soil zone of the western Canadian
Prairies would be two consecutive years
of wheat followed by at least two years of
a noncereal crop, or by a noncereal crop
and summer fallow.
Acknowledgment
Partial financial assistance from the
Saskatchewan Agriculture Development
Fund is gratefully acknowledged. We
thank Sharon Jan, Marty Peru, and Ba,rry
Blomert for their technical assistance.
Reference.
Cunfer, B.M., Touchton, J.T., and J.W.Johnson. 1980. Effects of phosphorus andpotassium fertilization on septoriaglume blotch of wheat. Phytopathol70:1196-1199.
Fernandez, M.R, and J.M.C. Fernandez.1990. Survival of wheat pathogens inwheat and soybean residues underconservation tillage systems in southernand central Brazil. Can J Plant Pathol12:289-294.
Fernandez, M.R., Clarke, J.M., and RM.DePauw. 1994. Response of durumwheat kernels and leaves at differentgrowth stages to Pyrenoplwra tritid·repentis. Plant Dis 78:597-600.
Fernandez, M.R, Clarke, J.M., DePauw,RM., and L.P. Lefkovitch. 19%a.Comparison of durum and cornmonwheat cultivars for reaction to leafspotting fungi in the field. Plant Dis80:793-197.
Fernandez, M.R, Gerwing, P., Pratt, LTumbach, D., Springer, R, and S.Stanger. 1996b. Leaf spots insouthwestern Saskatchewan in 1995. CanPlant Dis Surv 76:86.
Fernandez, M.R, Campbell, H.L., Knox,R.E., Turnbach, D., and P. Gerwing. 1997.Saskatchewan Wheat Disease Survey,1'996. Can Plant Dis Surv 77:68-71.
Harrower, K.M. 1974. Survival andregeneration of Leptosphaeria nodorum inwheat debris. Trans Br Mycol Soc 63:527533.
Huber, D.M., Lee, T.S., Ross, M.A., and T.S.Abney. 1987. Amelioration of tan spotinfected wheat with nitrogen. Plant Dis71:49-50.
Johnston, H.W., MacLeod, J.A., and K.S.Clough. 1979. Effects of cycocel (Ccqand fungicide sprays on spring wheatgrown at three nitrogen levels. Can JPlant Sci 59:917-929.
Krupinsky, J.M. 1992. Collection of conidiaand ascospores of Pyrenophora trifidrepentis from wheat straw. In: L.J. Francl,J.M. Krupinsky, and M.P. McMullen(eds.), Advances in Tan Spot Research.Proceedings of the 2nd International TanSpot Workshop, pp. 91-95. Fargo, ND,USA: North Dakota AgriculturalExperiment Station.
Leath, S., Scharen, A.L., Lund, RE., andM.E. Dietz-Holmes. 1993. Factorsassociated with global occurrences ofSeptaria nodorum blotch and Septoriatritici blotch of wheat. Plant Dis 77:12661270.
Maraite, H., Berny, J.F., and A. Goffin. 1992.Epidemiology of taft spot in Belgium. In:L.J. Francl, J.M. Krupinsky, and M.P.McMullen (eds.), Advances in Tan SpotResearch. Proceedings of the 2ndInternational Tan Spot Workshop, pp. 7379. Fargo, NO, \JSA: North DakotaAgricultural Experiment Station.
Odvody, G.N., Boosalis, M.G., and J.E.Watkins. 1982. Development of .pseudothecia during progressivesaprophytic colonization of wheat strawby Pyrenophora trichostoma. In: R.M.Hosford (ed.), Tan Spot of Wheat andRelated Diseases Workshop, pp. 33-35.Fargo, NO, USA: North Dakota StateUniversity.
Orth, CE., and A.P. Grybauskas. 1994.Development of Septoria nodorumblotch on winter wheat under twocultivation schemes in Maryland. PlantDis 78:736·741.
Tan Spot In Western Canada 19
Pedersen, E.A., and G.R. Hughes. 1992. Theeffect of crop rotation on development ofthe septoria dis.ease complex on springwheat in Saskatchewan. Can J PlantPathoI14:152-158.
Saskatchewan Agriculture and Food. 1997.Varieties of grain crops 1997. Regina,Sask., Canada: SaskatchewanAgriculture and Food. 16 pp.
Summerell, B.A., Klein, T.A., and L.W.Burgess. 1988. Influence of stubblemanagement practices on yellow spot ofwheat. Plant Prot Quart 3:12-13.
Wright, KH., and J.C Sutton. 1990.Inoculum of Pyrenophora tritici-repentis inrelation to epidemics of tan spot ofwinter wheat in Ontario. Can J PlantPathoI12:149-157.
Zadoks, J.C, Chang, T.T., and CF. Konzak.1974. A decimal code for the growthstages of cereals. Weed Res 14:415-421.
Zentner, R.P., Campbell, CA., and F. Selles.1993. Build-up in soil available P andyield response of spring wheat to seedplaced P in a 24-year study in the Brownsoil zone. Can J Soil Sci 73:173-181.
80
Diseases Caused by Bipolaris sorokinianaand Drechs/era frifici-repenfis in Hungary
J. BakonyP, I. AponyF, and G. FischP1 Plant Protection Institute, Hungarian Academy of Sciences, Budapest, Hungary2 Plant Health and Soil Conservation Station, Budapest, Hungary
3 Pannon University of Agriculture, Institute for Plant Protection, Keszthely,
Hungary
Abstract
Of the fungal pathogens of cereal crops in Hungary, Drechslera and Bipolaris species haverecently increased in importance. Until 1988, B. sorokiniana was considered the mostfrequently occurring wheat pathogen of the Helminthosporium sensu lato genus. Thepathogen was found at afrequency of5-8% in fields, infecting all parts of the wheat plant.During the past few years, the fungus has often been identified on wheat seeds displaying blackpoint disease. In 1988, D. tritici-repentis was first reported on winter wheat and rye inHungary. The pathogen caused a serious epidemic ~n rye hybrids, whose cultivation wasconsequently discontinued in some regions. Later the fungus was also isolated from barley andmillet. In the early 1990s, the spread ofD. tritici-repentis decreased to afew percent but hasincreased again in the past two years. In the autumn seasons of1991-1994, hundreds ofmonocotyledonous samples were collected to examine the occurrence and host range ofBipolaris, Drechslera, and Exserohilum species. Bipolaris sorokiniana and D. triticirepentis were collected from 18 and 2 plant species, representing 12 and 2 genera, respectively.The pathogens infected both cultivated and wild plants. Grasses, especially those growing innon-cultivated fields, may act as fungal hosts during overwintering. Susceptibility of 76 wheatgenotypes to B. sorokiniana and D. tritici-repentis at the seedling stage was tested based onsporulation intensity on detached leaves. Types and degree ofchlorotic/necrotic symptoms andintensity ofmycelium formation were recorded. Plant response tv inoculation differed betweenthe two pathogens. In general, an agar plug ofB. sorokiniana produced higher sporulationlevels than that ofD. tritici-repentis. Inoculation with D. tritici-repentis, however, resulted inthe formation ofmore abundant mycelia and necrosis.
The most important pathogens ofcereal crops in Hungary are those that
cause powdery mildew, head blight, and
rusts. Since their attacks can result in
significant yield losses, control measures
through chemical applications and/or
resistance breeding are usuallyundertaken. Diseases caused by Bipolaris
Shoemaker and Drechslera Ito specieshave recently increased in importance.
This is partly indicated by a higher
incidence of leaf stripe (D. graminea(Rabenh. ex Schlecht.) Shoem.,
teleomorph: Pyrenophora graminea Ito &
Kurib.), and net blotch (D. teres (Sacc.)
Shoem., teleomorph: Pyrenophora teres
Diseases Caused by Blpolaris sorokiniana and Dreehs/era tritlei·repentis in Hungary 81
Drechsler) pathogens on barley. A new
wheat disease, commonly called tan spotor yellow leaf spot, and its causal agent,
Drechslera tritici-repentis (Died.) Shoem.
(teleomorph: P. tritici-repentis (Died.)
Drechsler), was first reported in several
parts of Hungary in 1988. Until this time,B. sorokiniana (Sacc.) Shoem. (teleomorph:
Cochliobolus sativus (Ito & Kurib.)Drechsler ex Dastur) was considered the
most frequent wheat pathogen amongthose of the Helminthosporium Link sensulato genus.
The three main objectives of this
paper are to: 1) report on the incidence
and host range of B. sorokiniana and D.
tritici-repentis in Hungary, 2) publish
results obtained on fungicideeffectiveness for controlling these two
fungi, and 3) report on the resistance/
tolerance of different wheat genotypes toB. sorokiniana and D. tritici-repentis at the
seedling stage.
Materials and Methods
To examine the host range of B.sorokiniana and D. tritici-repentis,hundreds of monocotyledonous samples
were collected in western Hungary
during the autumns of 1991-1994.
Samples were incubated in moist
Incidence and host range ofTan spot control measures include B. soroklnlana and D. trlflel-
crop rotation, inc'orporation of crop repenflsresidues, spraying with fungicides, and Plant Health and Soil Conservationplanting resistant cultivars (Raymond et Stations annually survey the incidence of
al. 1985). Incorporation of residues may spot blotch and tan spot in the field. Innot be effective enough to prevent 1989 and 1990, after the first report of tan
pathogens from spreading or from spot in Hungary, a country-wide surveysurviving for long periods because they was made to determine the frequencyare capable of infecting other gramineous and severity of the blight on winterplants that may form a permanent wheat. The area affected by spot blotch
inoculum source. Consequently, host~//:d tan spot was 5700 and 4180 ha,plants growing in non-cultivated fields respectively. At the end of May and in theare a potential infection source and, middle of June, plant samples from fields
therefore, there is an increased need for were inspected for tan spot occurrence,
chemical control and tan spot resistant or and percentage infected leaf area wastolerant cultivars. Unfortunately, recorded. Severity of infection was
fungicides used to control other diseases expressed by an index ranging from 0-6
such as powdery mildew or head blight (0 =0%, 1 =0.1-5%, 2 =5.1-10%, 3 =10.1-are not effective enough against spot 25%,4 =25.1-50%, 5 =50.1-75%, 6 =75.1-
blotch and tan spot. Furthermore, wheat 100% leaf area infected).cultivars currently used by growers are
susceptible to both B. sorokiniana and D.
tritici-repentis. For this reason, it is
necessary to test the effectiveness ofdifferent fungicides against spot blotch
and tan spot, and to screen wheat
genotypes for resistance/tolerance.

82 J. Bakonyl. I. Aponyl. and G. Fischl
chambers for 24-48 h, and microscopic
preparations were made from thesporulating lesions. Fungi were identified
according to symptoms, host source, and
morphology of cultures and conidiaformed on the substrate.
InoculationWheat genotypes to be screened for
resistance/tolerance were kindly
provided by Dr. Gains Falusi (CerealResearch Institute, Taplanszentkereszt,
Hungary). Seeds without symptoms weresown into pots containing sterile mold.Pots and seedlings were kept in the
laboratory at 22°C under an artificiallight/dark cycle for 23 days. Leaves ofeach genotype were detached from the
same height and placed in petri dishescontaining wet filter paper. The ends ofthe leaves were pinched between twoglass slides so that the leaves did not
touch the filter paper. Leaves wereuniformly sprayed with sterile distilledwater before inoculation in order toensure favorable conditions for the fungi.
Bipolaris sorokiniana and D. tritici
repentis isolates taken from naturallyinfected leaves of Bromus erectus Huds.
and Agropyron repens P.B., respectively,
were grown on potato-dextrose agar at25°C in the dark. In a preliminary
experiment, several isolate!! of the twofungi were tested and the most
pathogenic isolates were chosen. Agar
plugs (3 mm in diameter) were cut from
the edge of a seven-day-old colony andplaced onto leaf surfaces with the
mycelial side in contact with the leaf
blade. Each leaf was inoculated at three
points (top, middle, and bottom). Aftertwo days of incubation at 22GlC in the
dark, the agar plugs were removed and
leaves were further incubated at 22·25°Cunder artificial light. During evaluation, a
0-3 assessment scale was employed to
express sporulation intensity, andsymptom types and intensity of
mycelium formation on the leaves were
recorded (Raymond et al. 1985).
Fungicide evaluationSeveral fungicides (contact, systemic,
and combined), licensed in 1995 in
Hungary, have been tested foreffectiveness of control on the mostimportant winter wheat fungal diseases
including tan spot. Effectiveness wasrated ccording to a 0-10 scale. Durationof ef ect (weeks) and application costs per
ha ere recorded. Lastly thet chnological value was calculated
Results
Incidence and host range of B.sorokln/ana and D. tr/f/c/.repenfls
Figure 1 shows the D. tritici.repentisincidence in 1989 and 1990. In 1989, 70%
of the total area was affected by tan spot.Disease severity index ranged from 0-6;
however, this value was very low in most
fields. Symptoms of primary infectionfrom ascospores were first noticed at the
beginning of April when the wheat had
two to three nodes (Figure 2a). Symptoms
of secondary infection by conidia
appeared in the middle of May.
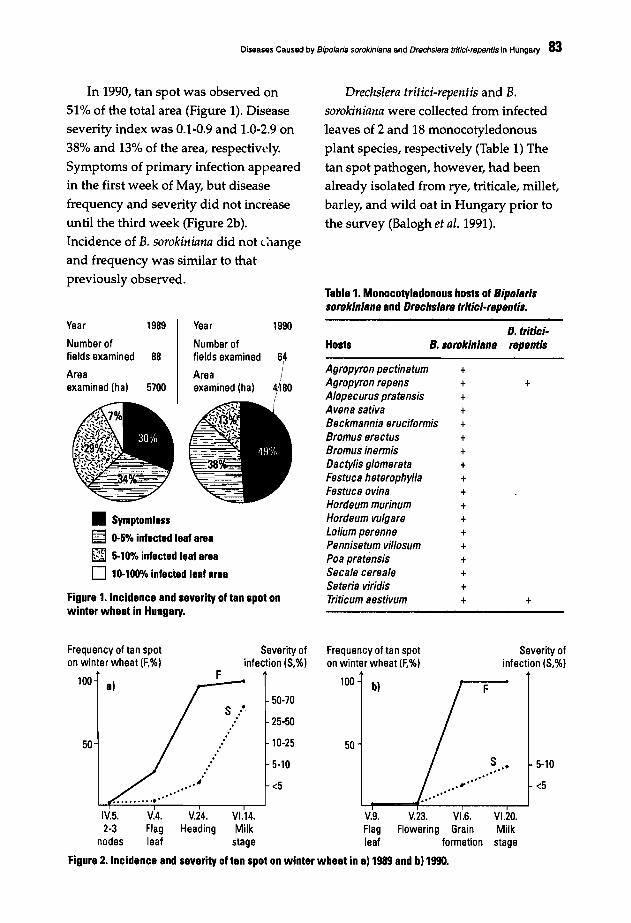
Diseases Caused by Bipolaris sorokiniana and Drechs/era tritiei-repentis In Hungary 83
In 1990, tan spot was observed on
51% of the total area (Figure 1). Diseaseseverity index was O.l~0.9 and 1.0-2.9 on
38% and 13% of the area, respectively.
Symptoms of primary infection appearedin the first week of May, but disease
frequency and severity did not increase
until the third week (Figure 2b).Incidence of B. sorokiniana did not <.. :1ange
and frequency was similar to that
previously observed.
Drechslera tritici-repentis and B.
sorokiniana were collected from infectedleaves of 2 and 18 monocotyledonous
plant species, respectively (Table 1) The
tan spot pathogen, however, had beenalready isolated from rye, triticale, millet,
barley, and wild oat in Hungary prior to
the survey (Balogh et al. 1991).
Table 1. Monocotyledonous hosts of Bipolarlssoroklnlana and DreehslafB tritlei-repentis.
D. trltleiB. sorokinlana repentis
Year 19B9 Year 1990
Number of Number offields examined BB fields examined 6
Area Areaexamined (hal 5700 examined (hal 4 BO
• Symptomless
~ 0-5% infected leef eree
~ 5-10% infected leaf area
o 10-'000/. infected leaf area
Figure 1. Incidence and severity of tan spot onwinter wheat in Hungary.
Hosts
Agropyron pectinatumAgropyron repensAlopecurus pratensisAvena sativaBeckmannia eruciformisBromus erectusBromus inermisDactytis glomerataFestuca heterophyllaFestuca ovinaHordeum murinumHordeum vulgareLotium perennePennisetum villosumPoa pratensisSecale cerealeSeteria viridisTriticum aestivum
++++++++++++++++++
+
+
Frequency of tan spoton winter wheat (F,%l
Severity ofinfection (S.%I
<5
5-10
Severity ofinfection (S,%I
F
S..•.........'......
b)
50
100
Frequency of tan spoton winter wheat (F,%l
<5
50-70
25-50
10-25
5-10
F
S ....
• iI.........
a)
50
100
IV.5. V.4. V.24. V1.14. V.9. V.23. V1.6. V1.20.2-3 Flag Heading Milk Flag Flowering Grain Milk
nodes leaf stage leaf formation stage
Figure 2. Incidence and severity of tan spot on winter wheat in a) 1989 and b) 1990.

84 J. Bakonyi, I. Aponyi, and G. Fischl
Screening winter wheat Mv 15. Necrotic symptoms formed
seedlings for tan spot and spot around the point of inoculation on the
blotch resistance leaves of GK Gereben, Vitka, F 1502,
Table 2 shows the average sporulation Ilona, and GK Marcal. In contrast,
values calculated after microscopic mycelial formation instead of necrosis
observation of infection points. Bipolaris was noted on FD 80-119/31, GK Zombor,
sorokiniana sporulated abundantly on and Viking.
almost all wheat genotypes. Average
'pomlalion valu", fo, the pathogen3'" D"ch,]em t,;fk;-,epent~ 'po_tedlowest on cultivars Alfold, Adriana, nd weakly. The highest sporulation value
Table 2. Seedling resistance of wheat genotyp ~ to Bipo/aris sorokiniana and Drechslera tritici-repentisbased on average sporulation values. ,
Genotypes B. sorokiniana D. tritici-repentis Genotypes B. sorokiniana D. tritici-repentis
GK Othalom 2.33 0.00 GK Csuros 2.66 0.00Korona 2.00 0.33 Mv 218-88 3.00 1.00Mv 19 2.33 0.33 Mv23 1.66 0.00GK Kineso 2.66 0.66 GK Orseg 3.00 0.00Mv14 3.00 0.00 GK Olt 3.00 0.00GK Bence 3.00 0.00 F1502 3.00 0.00Adriana 1.33 0.00 Mv GK 07-89 3.00 0.00Alfild 1.00 0.33 FK S005 3.00 0.00Danka 2.66 0.33 GK Ruzsa 2.33 0.00Kompolti 3 2.66 0.00 Mv9 3.00 0.66Mv 18 3.00 0.00 GK Repee 3.00 0.00GK Bania 2.66 0.00 Mv 10-90 2.00 0.66GK Bokros 3.00 0.33 Mv 15 1.33 0.00Ana 2.00 0.00 Buesanyi 20 2.66 0.00GK Kata 2.33 0.00 GK Szoke 3.00 0.66GK Kalaka 2.33 0.00 GK Othalom 3.00 0.00Mv 23-88 3.00 0.00 FD 5 3.00 0.33Mv22 3.00 0.00 Ilona 3.00 0.00ZG 167-86 3.00 0.00 GK Borzo 3.00 0.00Mv36-89 3.00 0.00 Thesee 3.00 0.66GK Gobe 3.00 0.00 GK 48-90 3.00 0.66FK 8063 2.66 0.00 GK Perint 3.00 0.66ZG 1250/86 3.00 0.00 GK Kozarl 2.66 0.00GK Delibab 2.33 0.00 Florin 2.66 0.66GK Gereben 3.00 0.66 Soissons 2.66 0.66Mv30-90 2.66 1.33 Viking 2.66 0.00GK Csirnie 2.33 0.00 FD 80-119/31 3.00 1.00GKZombor 3.00 0.00 P386/4.88 2.33 0.00Mv 16 1.66 0.00 P637.88 2.33 1.00Mv17 3.00 0.00 GK Ablane 2.00 0.00GK Othalom 2.66 0.00 GK Csenesi 3.00 0.00Jubilejnaja 50 2.66 0.00 GK Csirnie 2.00 0.00GK Mv Kooperaeio 3.00 0.33 GK Kozar2 3.00 1.00Mv 12 3.00 0.00 GK Mareal 3.00 1.00GK Istvan 3.00 0.00 GK Orseg 3.00 0.33Vitka 3.00 0.66 GK Perint 3.00 0.66GK Orzse 2.33 0.33 GK Pinka 3.00 0.00Mv20 2.66 1.00 GK Repee 2.33 0.00
Dlseasas Causad By Bipolaris sorokiniana and Dreehslera tritlei-repentis in Hungary 85
was 1.33 (Mv 30-90). The fungus did not
form conidia on 63.1% of the genotypes;
however, necrotic lesions formed on the
leaves of 40 genotypes and, of these, ,
dense mycelia appeared on 34. Chlorosis
was observed on;almost all genotypes.
Neither conidi , nor necrotic or chlorotic
lesions were served on the leaves of GK
G6M and Kozar.
,Fungicide evaluation
Data on tan spot control only is
discussed here. Figure 3a shows the
results obtained for cont~ct fungicides.
Four fungicides (Dithane M-45, Vondozeb
Plus, Polyram DF and Bravo 500) showed
some tan spot control; however,
effectiveness was low, ranging from 2-5.
Bravo 500 achieved the highest and most
prolonged control.
Results of systemic fungicide control
are presented in Figures 3b and 3c. Five of
the thirteen chemicals were useful for tan
spot control. Four of these five (Mirage 45
EC, Sportak 45 EC, Tilt Premium 37.5 WP,
and Granit SC) achieved higher control
levels than the best contact fungicide.
Efficacy of the five effective systemic
fungicide lasted from 2-3 to 3-4 weeks.
Only Alto 320 SC, Granit SC, and Tilt
Premium 37.5 WP remained effective for
longer than contact fungicides. Cost of
application was US $20-23 ha-1 for Alto
320 SC, Tilt Premium 37.5 WP, and
Mirage 45 EC; US $23-26 ha-1 for Granit
SC; and US $16-20 ha-1 for Sportak 45 EC.
Data on the five contact and systemic
fungicides are shown in Figure 3d. Their
effectiveness of tan spot control ranged
between 0-10. Milstar had no effect on tan
spot levels. Alert and Alto Combi 420 EC
achieved controllevels·of 7 and 5,
respectively. The highest score (10) was
achieved by Folicur BT and Tango. Effect
of control lasted for 3-4 weeks after
spraying with Alert or Alto Combi 420
EC and for 4-6 weeks for Folicur BT or
Tango. Cost of application was US $23-26
ha-1 for Alert and Folicur BT, and US $26
30 ha-1 for Alto Combi 420 and Tango.
The technological value of the four
effective fungicides ranged between 1.6
3.2, with the highest score achieved by
both Folicur BT and Tango.
References
Balogh, S., Ratai, R., Aponyi, I., Schweigert,A, and I. FUzi. 1991. A kalaszosokhelmintosp6riumos levelszaradasa.(Helminthosporium blights of cereals).KSZE, Agrof6rum, majusi kiil6nszam,pp.30-33.
Raymond, P.J., Bockus, W.W., and B.L.Norman. 1985. Tan spot of winter wheat:procedures to determine host response.Phytopathol 75:686-690;
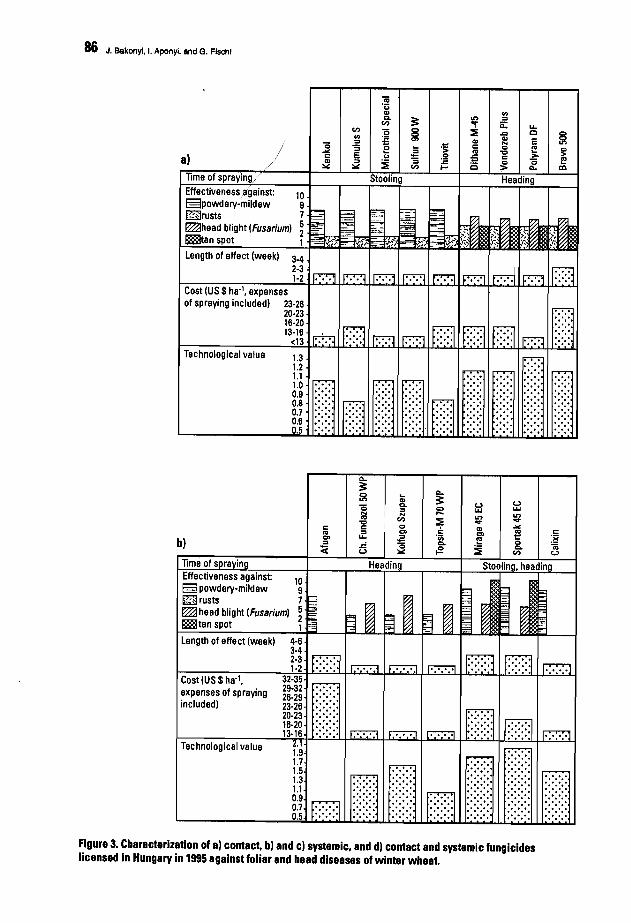
86 J. Bakonyl, I. Aponyi, and G. Fischl
IIIo.n :::>..,. a: u..::E ..Q C
~Q> Q> EN.c: C> ~ ~co '0 >-:€ c:~
~"0c Q., co
Heading
c;;'uQ>Q. 3:(I)
(I) "0 iIII :s:::>~"5 e .2E ..
:::> :i "5:..: (I)
Stooling
Cost (US $ ha·1• expensesof spraying included) 23-26
20-2316-2013-16
<13
Length of effect (week) 3-42-31-2
Technological value 1.31.21.11.00.90.80.70.60.5
lime of sprayingEffectiveness, gainst: 10Spowdery-mildew 9~rusts 7~head blight/Fusarium) ~man spot 1 l"";;;M-:d:::';"-J,.,."d::=-i>rn....
a)
b)
Length of effect (week) 4-63-42-31-2
c:coC»:::>
<
32-3529-3226-2923-2620-2316-2013·16
Technological value
Effectiveness against:E3 powdery-mildew~rusts 7~ head blight (Fusarium) ~mtan spot 1
Cost (US $ ha·1•
expenses of sprayingincluded)
lime of s ra in
Figure 3. Characterization of a) contact. b) and c) systemic. and d) contact and systemic fungicideslicensed in Hungary in 1995 against foliar and head diseases of winter wheat.

Diseeses Caused By B/polaris sorokiniana and Drechslara tritici·repentis In Hungary 87
c)Time of spraying
Effectiveness against:~powdery·mildew
IlElrusts~head blight (Fusarium)Etan spotLength of effect (week)
Cost(US$ha,l.expenses of sprayingincluded)
Technological value
' .
{/.... '...........::::::::.........
Heading
::::::::::::::::::::..........:::::::.:::::::::::::..........
3.2
2.8
2.4
2.0
1.8
1.2
33·3626·3020·2313·16
Technological value
Cost (US $ ha' •expenses of sprayingincluded)
Effectiveness against:~ powdery·mildew~rusts 7~ head blight (Fusarium) ~Etan spotLength of effect (week) 4,6
3·42·31·
(.)
!Cl w.... ~:.a l-E a:l0 ... S 0(.) :::l
0 .~ .!!! Cl<::
d) ~ ;f :i ~c:(
Ime of spraying Heading

88
Population Structure and Epidemiology ofBipolaris sorokiniana in the Rice-WheatCropping Pattern of Nepal
M. Ruckstuhl
Swiss Federal Research Station for Agroecology and Agriculture, ZiirichReckenholz, Switzerland
Abstract
Fungal species were isolated from foliar blight symptoms on spring wheat cultivars in therice-wheat cropping pattern in the subtropical terai belt ofNepal. Bipolaris sorokiniana,
Drechslera tritici-repentis, and several Curvularia spp. were identified fromindistinguishable lesions typically associated with helminthosporium leaf blight (HLB)symptoms. HLB was successfully controlled with three to four foliar applications ofpropiconazole at a rate of 125 ml ai ha-1. Assessment of crop losses in 13 farmers' fields in 1990/91 indicated significant wheat yield losses of 10.7% or 250 kg ha-1 on the most popularcommercial variety UP262 due to HLB. To estimate crop losses of rice and wheat due tosoilborne pathogens, solar heating through plastic mulching (soil solarization) was carried outin a series ofsplit-plot experiments, combined with foliar fungicide applications to the wheatcrop in farmers' fields in 1992/93. Soil solarization, before rice transplanting in May, increasedthe mean daily maximum temperature at the soil surface by more than 250C and reached 65°Cin the top-soil layer. Subsequent rice yields increased by 32%; yield of the succeeding wheat cropin fungicide protected plots increased by 25%, and in unprotected plots by 15%. Fungicideapplication enhanced grain yields by 15% in solarized and 6% in nonsolarized plots, mainlythrough an increase in 1000-grain weight. Information on the population structure ofB.sorokiniana was improved from a total of 799 fungal isolates divided into 17 populations,collected from five countries (Bolivia, Canada, Nepal, Mexico, and Switzerland). The isolateswere characterized by means of randomly amplified polymorphic DNA (RAPD) obtained bypolymerase chain reaction (PCR). Cluster analysis, using multidimensional scaling ofNei'sgenetic distance, clearly segregated populations into five groups according to region oforigin.Gene flow, however, may be strong enough to prevent geographic isolation ofpopulations bothwithin and among regions. The percentage of total gene diversity that was allocated todifferences among isolates within populations was 83%; of the remaining variance, 3% wasattributed to differences among populations within regions, and 14% among regions.
Rice-wheat cropping sequenceRice (Oryza sativa L.) and wheat
(Triticum aestivum L.) are sequentially
cropped over about 12 million ha on the
Indian subcontinent (Singh and Paroda
1994). Typically, the two cereals are
grown within a single agronomic year ineither a one-rice-one-wheat (RW) or a
rice-rice-wheat (RRW) cropping
sequence, but also in multi-year rotations
Population Structure and Epidemiology of Bipolaris sorokiniana in the Rice·Wheat Cropping Pallern of Nepal 89
including other crops such as maize,
pulses, oilseed, legumes, sugarcane, and
jute. In Nepal, the double-cereal cropping
sequence is practised on about 500,000 ha
in the subtropical terai belt and in the
adjacent hill regions, typically with low
input crop management in terms of
fertilizer application and crop protection
measures. Grain yields are low, averaging
around 1.5 t ha·1 for wheat and 2.5 t ha·1
for rice (Hobbs et al. 1996).
Concerns on systemsustainability
Longterm observations show
declining tren4s in productivity of the
RW cropping sequence in most parts of
the Indian Subcontinent, despite the use
of improved varieties and a tendency
towards higher inputs of inorganic
fertilizers. Regmi (1994) analyzed 14
years of yield data from a longterm
fertilizer trial with a RRW croppingsequence in Bhairahawa, Nepal, and
found declining trends in rice and wheat
yields closely related to P and K supply.
However, a yield decrease, particularly
for both rice crops, was also recorded in
treatments with recommended fertilizer
dosages (Giri et al. 1993). These results
supported outcomes from a series of
varietal trials over 15 years at six research
stations in Nepal: yields of two varieties
were observed to decline at annual rates
of 6.8% and 2.5%, reflecting different
levels of susceptibility to foliar pathogens
(Morris et al. 1994). Obviously not only
nutritional aspects are of concern, crop
protection issues also have to be taken
into consideration in the discussion on
system sustainability.
Low-input crop managementFarmers usually do not consider
diseases of rice and wheat to be major
production problems, although observed
infection levels of both leaf and root
diseases can result in crop losses. This
may be explained by farmers perceiving
plant diseases as a natural phenomenon
rather: than an avoidable production
constraint. However, in most situations
this attitude also follows an obvious,
economic-based logic: agronomic crop
management issues such as irrigation or
fertilizer input are ranked as higher
priorities; steps that have to be taken
before measures of disease prevention
will be profitable. However, it can beI
anticipated that phytopathological issues
will attract more attention once monetary
inputs reach higher levels, a time when
farmers need to minimize the risk of
facing even minor crop losses.
Triticum aestivum-Blpolarissoroklnlana pathosystem
This study focused on Bipolarissorokiniana (Sacc. in Sorok.) Shoem. (syn.
Helminthosporium sativum Pamm., King &
Bakke, teleomorph Cochliobolus sativus (Ito
& Kurib.) Drechsl. ex Dastur), which is
considered one of the most important
wheat pathogens in the warmer areas of
the world (Dubin and van GinkeI1991).
Fungicide Control ofHelminthosporium LeafBlight
IntroductionPreliminary field observations in
Nepal revealed that B. sorokiniana was
often found on the same leaves, and even
90 M. Ruckstuhl
sometimes in mixed lesions, together
with Curvularia spp. and Drechslera triticirepentis (Died.) Shoem. (syn. H. triticirepentis Died., teleomorph Pyrenophoratritici-repentis (Died.) Drechs.), the causalorganism of tan spot. For older leaf
lesions, it was impossible to
unequivocally identify the lesion-causingpathogen. We therefore simplified the
disease rating system and hereafter
ascribe all leaf blight symptoms tohelminthosporium leaf blight (HLB).
Materials and methodsTo estimate grain yield losses caused
by the HLB disease complex, fungicide
control trials were superimposed on 13farmers' fields in the major RW croprotation area in the Rupandehi district,
Nepal. The HLB susceptible, slow-rustingwheat cultivar UP262 was used. Cropmanagement was carried out by farmersaccording to their traditional practices.The crop planted in check plots was
protected from HLB infection with two tofour applications of propiconazole (Tilt,250EC) at a rate of 125 ml ai ha-1. Natural
buildup of HLB epidemics was recorded
in unprotected plots.
ResultsIn 1991, initial HLB symptoms on
older leaves close to the ground were
observed in all fields as early as the end
of January, but disease spread was slow
throughout February. Affected flag leaf
area averaged less than 1% at the end ofFebruary. Only two weeks later, HLB
lesions covered 6.8-87.8% of the flag
leaves; however, in most fields only 15
25% of the flag leaf area was destroyed by
the disease complex at early dough stage(GS 83). Periods of rapid diseasedevelopment occurred immediately after
two days of rare spring rainfall. This
occurred on two occasions. After March
10, daily maximum temperaturesexceeded 30°C, which led to a rapid loss
of green leaf area and premature
ripening; therefore, the final spread of the
blight epidemic was not properly
recorded.
Although fungicide applicationachieved excellent control of HLBinfection in the check plots, site-specific
analysis showed that treatment effects ongrain yield at individual locations werenot consistent enough to satisfy
significance tests. Overall grain yieldlosses were 10.7% or about 250 kg ha-1•
The 1000-grain weight (TGW) was the
yield determining factor primarilyaffected by the late epidemics. Across allsites, TGW was reduced by 4.1 % inuntreated plots with a site-specific
maximum of 12.6%.
Final disease assessment was made
just before heat and moisture stress killedthe leaves. Results correlated better with
crop parameters than with estimates of
the area under the disease progress curve(AUDPC). In seven of thirteen locations,
correlations were significant (P<0.05)
between the final estimates of HLBseverity and TGW reduction, and HLB
infection accounted for 51-76% of the
TGW variation. The other six sites, withweak and non-significant correlations,
were from the least diseased fields.
Population Structure and Epidemiology of Bipolaris sorokiniana in the Rice·Wheat Crcpping Pattern of Nepal 91
To correlate HLB severity with grain
yield or TC;;W across sites, the relativevalues of the untreated plots were
subjected to simple linear regressions.
Both relationships appeared to be
significant (grain yield: l' =0.04, TGW:1'<0.001), but only 8% of the yield
variation and 39% of the TGW variationwere accounted for by the disease
severity rate. The number of tillers per m2
and the number of grains per spike werenot affected by the late diseaseestablishment in the fields.
DiscussionIn neighboring Bangladesh, 15%
wheat yield losses, on average, wereattributed to HLB infection for 1991-1994(Alam, in press). In trials on 13 farmers'
fields in 1991, losses in variety U1'262were around 10.7%. However, in an
experiment at the Rupandehiresearchstation in the same year using the samevariety, 42% HLB infection at late crop
stages were recorded, causing a 25% yieldloss (Dubin and Bimb 1994). In similartrials in previous years, infection levelswere 47% and 88%, resulting in yield
losses of 13% and 27%, respectively.
Higher losses at the research station
might be explained by the growth ofhighly susceptible cultivars in breeding
plots and by the intensive use of the ricewheat crop rotation over several decades.
This management practice has led to high
levels of pathogen inoculum in the soil,
and the abundance of wheat straw from
previous seasons that serves as an
important primary inoculum source.
Bipolaris sorokiniana can survive in
submerged conditions in paddy fields on
rotted wheat stubble; however, in
farmers' fields, low levels of residue are
left over after the monsoon season.
For wheat production, plant stand isthe yield component most seriously
affected by low input management, astraditionally applied in the terai belt in
Nepal. Fertilizer inputs were 69:28:0N:1'20 S:!<:z0 kg ha·1, on average, which
are well below recommended doses.
Weak plant stand led to an early loss ofgreen leaf rnaterial due to increasedmoisture stress. Plants in these plots
experienced premature leaf senescenceduring periods of heaviest disease
pressure. Disease attack was then too lateto create treatment differences during the
shortened phase in which the remaininggreen leaf area influenced grain filling.
In an additional experiment, the
impact of increased rates of balanced
fertilizer dosages on wheat yield andHLB epidemics was tested. Wheat
responded with a significant yield boost
relative to increases in levels of balancedfertilizer doses up to 150:75:37.5
N:1'ps:Kp kg ha·1• HLB infection wassevere in plots without fungicideprotection, but remarkably uniform
among all but plots with the lowest
fertilizer level (50:25:12.5 N:1'20S:Kp kgha·1). AUD1'e indicated that low or
imbalanced soil nutrient levels
predispose plants to a more severe HLB
attack.
92 M. Ruckstuhl
SummaryGrain yield losses attributed to HLB
infection were less serious than reported
from other warm environments (Mehta
1985; Raemaekers 1985). Nevertheless,
preventing these losses might
compensate for the negative net return of
wheat production that farmers face in the
RW cropping sequence in the terai belt
(Hobbs et ai. 1996). However, fungicide
application is neither environmentally
desirable nor economically feasible under
low-input crop management, so the use
of varieties with higher HLB resistance
levels or altered agronomic practices
provide more appropriate and promising
control strategies.
Soil Solarization
IntroductionSoil solarization denotes the solar
heating of moistened soil by mulching
with clear polyethylene (PE) sheets.
Solarization affects both biotic and abiotic
processes and thus determines the
chemical and microbial environment for
plant growth. It may detect detrimental,
but non-lethal, pathogenic root infections
of crops, such as common root rot of
wheat caused by B. sorokiniana or Pythiumspp. However, increased growth response
(IGR) of plants in solarized soils was
frequently observed, even in the absence
of known pathogens (Katan and DeVay
1991; Stapleton et ai. 1985).
This mild form of soil disinfestation
was tested for its potential impact on the
overall performance of both rice and
wheat within a long-lasting RW cropping
regime. The main goal of soil solarization
was the control of harmful soilborne plant
pathogens and pests prior to planting.
Soil solarization in the hot pre-monsoon
period in May was expected to have a
strong disinfecting effect, with a positive
influence on the performance of the rice
crop that might be carried over into the
wheat season.
Materials and methodsIn four split-plot trials in farmers'
fields, soil solarization before rice
transplanting was tested for its effect on
both the rice and the following wheat
crop. Furthermore, propiconazole (Tilt,
250EC) was applied as a foliar spray to
the wheat crop as the subplot treatment to
estimate yield losses due to HLB
infection. A high rate of mineral fertilizer
was applied to both crops to exclude
macronutrients as the major casue for an
increased growth response.
Before plots were mulched with PE
sheets of 2 mm thickness for 31 days,
fields were irrigated up to saturation to
improve heat conduction in deeper soil
layers. After solarization, plots were
aerated for 28-32 days. Fields were then
puddled with bullocks, fertilized with a
basal dosage of 60:60:40 N:Pps:Kp kg
ha'l, and leveled with a wooden plank.
Fertilizer topdressing was 60 kg NH4-N
ha'l amended with 4 kg Zn2+ ha'l. The
high yielding rice variety Janaki was
transplanted after 20-28 days.
It was of special interest to check how
long the solarization effect could be
carried over into the wheat season.
Further, plots were split to study HLB
epidemics. The chosen tillage method
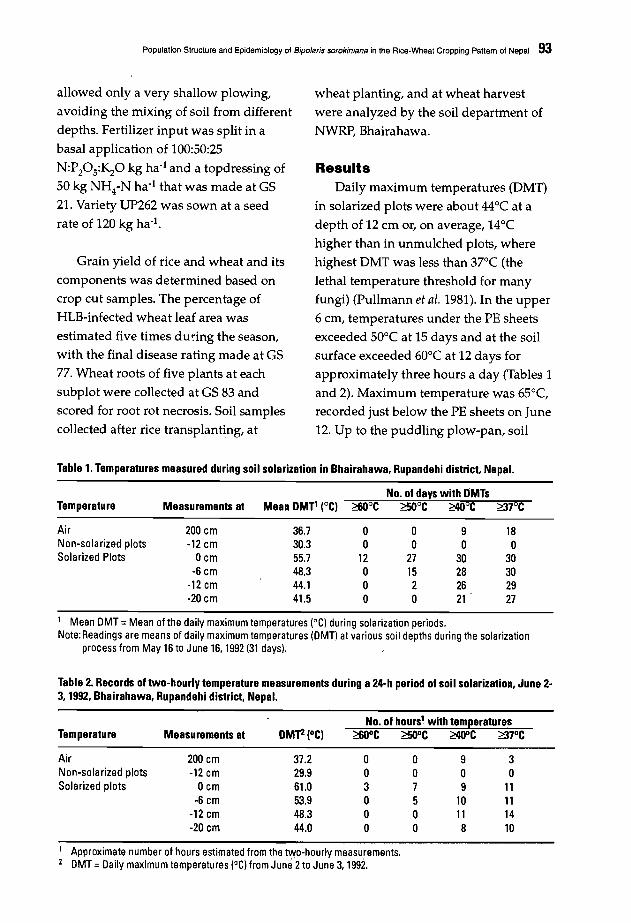
Population Structure and Epidemiology of Bipo/aris sorokiniana in the Rice·Wheat Cropping Pattern of Nepal 93
allowed only a very shallow plowing,
avoiding the mixing of soil from different
depths. Fertilizer input was split in a
basal application of 100:50:25
N:P20S:K20 kg ha·1 and a topdressing of
50 kg NH4-N ha-1 that was made at GS
21. Variety UP262 was sown at a seed
rate of 120 kg ha-1.
Grain yield of rice and wheat and its
components was determined based on
crop 0ut samples. The percentage of
HLB-infected wheat leaf area was
estimated five times during the season,
with the final disease rating made at GS
77. Wheat roots of five plants at each
subplot were collected at GS 83 and
scored for root rot necrosis. Soil samples
collected after rice transplanting, at
wheat planting, and at wheat harvest
were analyzed by the soil department of
NWRP, Bhairahawa.
ResultsDaily maximum temperatures (DMT)
in solarized plots were about 44°C at a
depth of 12 cm or, on average, 14°C
higher than in unmulched plots, where
highest DMT was less than 37°C (the
lethal temperature threshold for many
fungi) (Pullmann et al. 1981). In the upper
6 cm, temperatures under the PE sheets
exceeded 50°C at 15 days and at the soil
surface exceeded 60°C at 12 days for
approximately three hours a day (Tables 1
and 2). Maximum temperature was 65°C,
recorded just below the PE sheets on June
12. Up to the puddling plow-pan, soil
Table 1. Temperatures measured during soil solarization in Bhairahawa, Rupandehi district, Nepal.
No. of days with DMTsTemperature Measurements at Mean DMT' (OC) ~oC <1iQ°C ~40°C ~:UoC
Air 200 em 36.7 0 0 9 18Non-solarized plots -12 em 30.3 0 0 0 0Solarized Plots Oem 55.7 12 27 30 30
-6 em 48.3 0 15 28 30·12 em 44.1 0 2 26 29-20 em 41.5 0 0 21 27
1 Mean DMT =Mean of the daily maximum temperatures 1°C) during solarization periods.Note: Readings are means of daily maximum temperatures IDMT) at various soil depths during the solarization
process from May 16 to June 16, 1992 (31 daysl.
Table 2. Records of two-hourly temperature measurements during a 24·h period of soil solarization, June 23,1992, Bhairahawa, Rupandehi district, Nepal.
No. of hours' with temperaturesTemperature Measurements at DMJ2(OC) ~oC <1iQ°C ~oC ~:UoC
Air 200 em 37.2 0 0 9 3Non-solarized plots -12 em 29.9 0 0 0 0Solarized plots Oem 61.0 3 7 9 11
-6 em 53.9 0 5 10 11-12 em 48.3 0 0 11 14·20 em 44.0 0 0 8 10
Approximate number of hours estimated from the two-hourly measurements.DMT =Daily maximum temperatures (OCl from June 2to June 3, 1992.
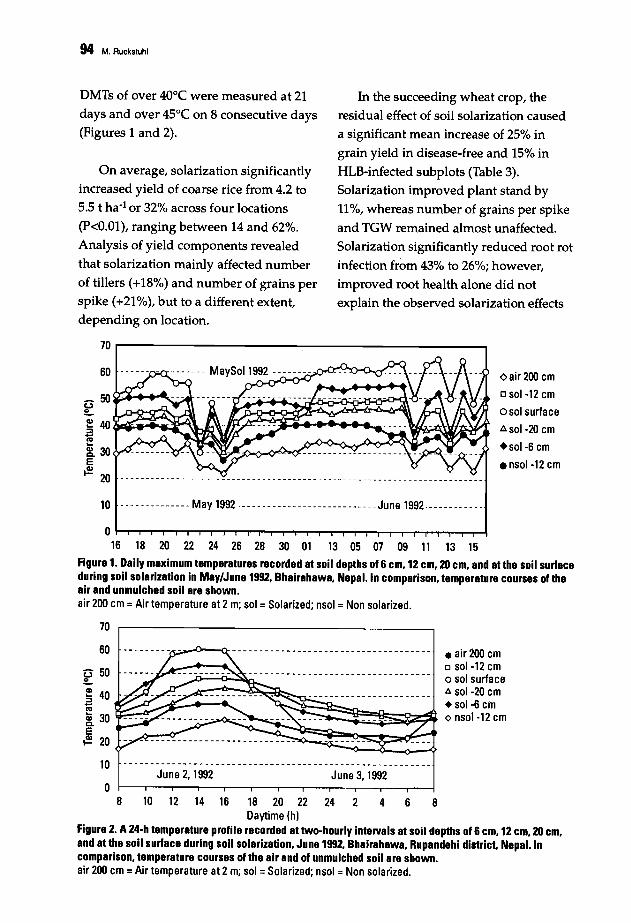
94 M. Ruckstuhl
DMTs of over 40°C were measured at 21
days and oVer 45°C on 8 consecutive days
(Figures 1 and 2).
On average, solarization significantly
increased yield of coarse rice from 4.2 to
5.5 t ha-1 or 32% across four locations
(p<O.Ol), ranging between 14 and 62%.
Analysis of yield components revealed
that solarization mainly affected number
of tillers (+18%) and number of grains per
spike (+21%), but to a different extent,
depending on location.
In the succeeding wheat crop, the
residual effect of soil solarization caused
a sign.ificant mean increase of 25% in
grain yield in disease-free and 15% in
HLB-infected subplots (Table 3).
Solarization improved plant stand by
11%, whereas number of grains per spike
and TGW remained almost unaffected.
Solarization significantly reduced root rot
infection from 43% to 26%; however,
improved root health alone did not
explain the observed solarization effects
70 r------------~----------__,
60
_ 50 Il-;..t-....~ua..
~40~~~~~ I~ 30E~ 20 - - - ---- -- - - ----- - - - - - ------- - - ----- - - - - - -- --- -- - -- - - -- -- - - -- ---- - - -- ----
10 --------------May 1992---------------------------JuneI992-----------
oair200em
0501·12 em
o sol surface
1::.501·20 em
+501-6 em
ensol-12em
OI-T....,....,.-r--r....,......-r--r....,..-r-r-r....,..................,.................,..-,...-r-r-T..,...,...,,...-,...........-\
16 18 20 22 24 26 28 30 01 13 05 07 09 11 13 15
Figure 1. Daily maximum temperatures recorded at soil depths of 6 cm, 12 cm. ZO cm, and at the soil surfaceduring soil solarization in May/June 1992, Bhairahawa, Nepal. In comparison, temperature courses of theair and unmulched soil are shown.air 200 em =Air temperature at 2 m; sol = Solarized; nsol = Non solarized.
70
60
U 50a..~ 40 .a'"~ 30E~ 20
~~~~-<r------------------------------------- • air 200 emosol-12emo sol surfaceI!. 501-20 em.501-6 emo nsol-12 em
10 ---------------------------------------------------------
oJune 2,1992 June 3,1992
8 10 12 14 16 18 20 22 24 2 4 6 8Daytime (h)
Figure 2. A 24-h temperature profile recorded at two-hourly intervals at soil depths of 6 cm, 12 cm, 20 cm,and at the soil surface during soil solarization, June 1992, Bhairahawa, Rupandehi district. Nepal. Incomparison, temperature courses of the air and of unmulched soil are shown.air 200 em =Air temperature at 2 m; sol = Solarized; nsol = Non solarized.

Population Structure and Epidemiology of Bipolarls sorokinlana in the Rice-Wheat Cropping Pattern of Nepal 95
because on~y weak, but highly significant
negative correlations (P<O.OOl) weredetected with increases in grain yield (r =..Q,43) and number of tillers (r =~0,41).
HLBinfection reduced wheat grain
yields, on average and over 'sites, by 13%
in solarized and 5.5% in unmulchedplots, mainly through a loss in TGW of
7.5% and 8%, respectively (Table 3). HLB
infection progress was described usingADDPe (area under disease progress
curve) and compared with a final disease
severity reading at soft dough stage (GS77). Both measures revealed very similar,
highly significant correlations (P<O.Ol),
with loss of TGW attributed to HLBinfection but not to the other two yield
components. Final disease severity
readings explained 45-89% of thevariance in TGW loss. The loss in grain
yield across all sites was significantly, but
weakly, correlated with HLB infection(r =..(l,45; P<O.OOl).
DiscussionIt is not fuHy understood how the
increase in temperature duringsplarization affects soil microflora. Someeffects are direct, such as physical cell
death through heat inactivation of cell
processes, whereas other mechanisms areindirect, such as a temporary nutrient
release. They affect composition and
dynamics of pathogen populations byinfluencing the biological balance
Table 3. Impflctof soit solarization (solar vs. non solar) and fungicide application (protected vs.unprot8cted)on the ,performance of rice aDd wheat cropp"d in sequence.
Non-solar %increase1,2103 21.4***
TGW (g; 14% mc)Non-solar %increase1,2
28.9 2.1 ***No. of grains/spike
Solar125
Solar29.5
Non-solar '% increase1,2
202 18.3 ***
Grain yield (dtha"; 14% mc)
Solar239
Solar Non-solar %increase1.254.9 41.5 32.3 ***
No. of tillers m-2
Rice
Solar Non-solar %reduction2
27.9 40.6 12.7***24.9 45.9 21.0***-3.0 ns 5.3 ns
TGW (g; 12% mc)
Non-solar %increase1•2
33.4 2.7 ns33.8 2.1 ns
1.2 nsRoot necrosis
(% infected root area at GS 83)
Solar34.334:50;6ns
Solar Non-solar %increase1.245.4 45.2 0.4 ns42.0 41.6 1.0 ns
8.1 *** 8.7***No. of grains/spike
Grain yield (dt ha-'; 120/0 mc)
Solar Non-solar %increase1,2
303 272 11.4***312 280 11.4***
-2.9 ns -2.9 nsHLB sevarity on flag leaves
(% infected leaf area aIGS 771
Solar Non-solar %increase1.231.8 25.4 25.2***27.7 24.0 15.4***1'4.8*** 5.8***
No. ottillers m·2
Solar Non-solar %reduction2
3.1 3.3 0.2ns27.4 23.8 -3.6 ns24.3*** 20.5***
ProtectedUnprotected%reduction C
ProtectedUnprotected%increase2•3
ProtectedUnprotected%increase2•3
Wheat
1 %change (due to soil solarization) =100 x (mean of solar pial/mean of non-solar plots} -100.2 Changes were tested for statistical significance with LSD for ROB designs at *P<O.l; ** P<0.05; *** P<O.Ol.3 %change (due to fungicide application) =100 x (mean of protected plots/mean of unprotected plots) - 100.Note:The table combines results of RCB split-plot experiments at four locations in Rupandehi district, Nepal.
carried out in 1992/93.
96 M. Ruckstuhl
between plant pathogens and their
antagonists that function as biocontrol
agents. Ultimately, this may lead to a
reduction or even extinction of
pathogenic microorganisms (Katan and
DeVay 1991). However, temperatures
recorded in the solarization plots were
probably beyond the scope of the targeted
pathogenic fungi, which are, in general,
less heat-tolerant than their antagonists
(Cook and Baker 1983).
No differences in total N, available P
or K, electrical conductivity, and pH were
detected among treatments. The organic
matter content of solarized plots was
even slightly reduced when measured inthe rice season, and indistinguishable in
the wheat season. However, chemical
analysis of wheat flag leaves sampled at
booting stage (GS 41-45) at two
experimental sites indicated an increase
in Mn content of plants from solarized
plots (Graham, unpublished data).
Moreover, rice plants with symptoms
related to Zn deficiency were commonly
observed in all plots, but only plants in
solarized plots were able to recover fully
after 4 kg Zn2+ ha-1 was applied as a
topdress fertilizer. Thus, if there are
nutritional effects associated with the
reduction of root rot after solarization,
bivalent micronutrients, particularly Mn
and Zn, may be the elements to focus on
in further studies.
The effect of soil solarization on the
rice crop was highly beneficial. The
increase in grain yield ranged from 14
62% in the four experimental locations
and averaged 32%. Nutritional factors,
especially the availability of Zn2+, are
likely to contribute to the observed yield
increase; however, considering the
detrimental temperatures of over 60°C,
populations of soilborne pathogens must
be greatly reduced. Dubin and Bimb
(1994) found a significant correlation
between the number of rice root
nematodes (Hirschmanniella oryzae and H.
Jrlucronata) and yield after soil
solarization before rice transplanting.
The strong residual effect of soil
solarization on the wheat crop after the
rice season was unexpected. Several field
management activities such as puddling,
plowing, and irrigation with surface
water must have diluted the solarization
effect, and the small size of the
experimental plots favored reinfestation
by pathogens from unmulched areas.
Nevertheless, wheat plant stand and
plant height were consistently improved,
and grain yield increases related to
soilborne factors ranged from 10 to 36%
in protected and from 5 to 25% in
unprotected subplots.
SummaryAlthough solar heating is a relatively
new technique and is restricted to areas
with special climatic conditions, Davis
(1991) presented a long list of organisms
including fungi, bacteria, nematodes, and
weeds that were reported to be
successfully controlled by soil
solarization. In practical application,
disease control with solarization has
mostly been achieved near the soil
surface in regions with high
temperatures, especially in
Mediterranean countries and California,
USA. These two conditions are perfectly
Population Structure and Epidemiology of Bipolaris sorokiniana in the Rice·Wheat Cropping Pallern of Nepal 97
met in the Terai environment with its hot
pre-monsoon periods and the very
shallow rooting layer above the
impervious hardpan.
In the RW cropping sequence, plastic
mulching as a management tool could
possibly be employed in April or May
after plowing proceeding the wheat
harvest; however, some aspects are of
practical concern. These include:
irrigation water required to assure
successful heat conduction in lower soil
layers is scarce at the end of the dry
season, occasional heavy westerly winds
may damage the PE sheets, and farmers
graze cattle in the fields during the turn
over time between wheat harvest and rice
planting.
From an economical viewpoint, the
costs of additional irrigation and PE
sheets may be lower than the commercial
value of the expected yield gains for rice
(32%) and wheat (15%); however, these
benefits are too variable and
unpredictable for farmers who manage
their crops with a low-input, low-risk
strategy. Consequently, soil solarization
will most likely not be adapted as a
management tool in the RW cropping
sequence in the Terai belt of Nepal, but
might be implemented by cereal seed
producers or vegetable farmers.
Pathogen PopulationStructure
IntroductionThe most promising measure for B.
sorokiniana control is the attempt to
introduce resistance genes into the host
genome. Advanced material from a
particular breeding site is either selected
under natural infection pressure in
disease hot spots or under artificial
inoculation. In both cases, information on
population structure and biology of the
pathogen are important prerequisites to
enhance the effectiveness of resistance
breeding schemes.
Materials and methodsRAPD marker systems were chosen to
detect population substructures of a
collection of B. sorokinialla isolates. They
were sampled in the wheat growing
regions of Bolivia, Nepal, Canada, and
Switzerland, and at CIMMYT's research
site in Poza Rica, on the Mexican Gulf
coast where wheat is not grown in
farmers' fields. Regional collections
consisted of one (Bolivia), two (Canada
and Switzerland), or three (Nepal and
Mexico) field populations and one district
population in each country (Table 4). A
total of 799 isolates from 5 regions (MEX,
BOL, NEP, CAN, SWI) were grouped in
11 field and 5 district populations.
Isolates were analyzed for the presence of
17 polymorphic RAPD marker bands
generated by 6 random primers.
ResultsSignificant differences in allelic
frequencies at the same loci were seldom
found among populations within 4 of the
5 regions, but quite frequent within the
CAN region where, for 7 of 17 loci, the
null hypothesis of no differentiation
between the populations had to be
rejected based on a c2 homogeneity test
(P<O.05). However, frequencies of all 17
RAPD markers were significantly
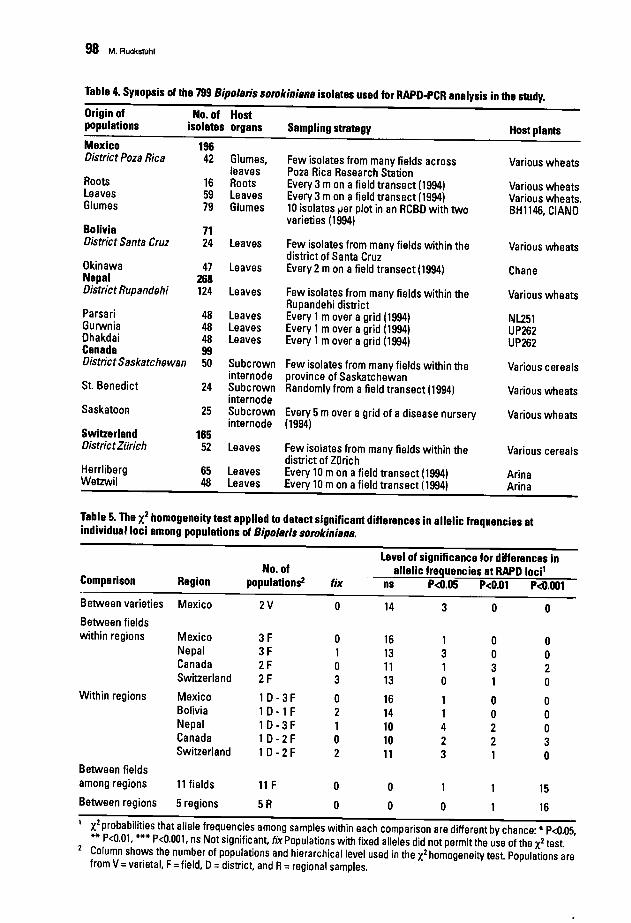
98 M. RuckslUhl
Table 4. Synopsis of the 799 8ipol8ris sorokinilJna isolates used for RAPD·PCR analysis in the study.
Origin of No. of Hostpopulations isola.tes organs Sampling strategy Host plants
Mexico 196District Poza Rica 42 Glumes, Few isolates from many fields across Various wheats
leaves Poza Rica Research StationRoots 16 Roots Every 3m on a field transect (1994) Various wheatsleaves 59 leaves Every 3 mon a field transect (1994) Various wheats.Glumes 79 Glumes 10 isolates lier plot in an RCaD with two BHII46, CIANO
varieties (1994)Bolivia 71District Santa Cruz 24 leaves Few isolates from many fields within the Various wheats
district of Santa CruzOkinawa 47 leaves Every 2mon a field transect (1994.) ChaneNepal 268District Rupandehi 124 leaves Few isolates from many fields within the Various wheats
Rupandehi districtParsari 48 leaves Every 1mover a grid (1994) Nl251Gurwnia 48 leaves Every 1mover a grid (1994) UP262Dhakdai 48 leaves Every 1mover a grid (1994) UP262Canada 99District Saskatchewan 50 Subcrown Few isolates from many fields within the Various cereals
internode province of SaskatchewanSt. Benedict 24 Subcrown Randomly from afield transect (1994) Various wheats
internodeSaskatoon 25 Subcrown Every 5mover a grid of a disease nursery Various wheats
internode (1994)Switzerland 165DistrictZurich 52 leaves Few isolates from many fields within the Various cereals
district of ZOrichHerrliberg 65 leaves Every 10 mon a field transect (1994) ArinaWetzwil 48 leaves Every 10 mon a field transect (1994) Arina
Table 5. The "I} homogeneity test applied to detect significant differences in allelic frequencies atindividual loci among populations of 8ipolaris sorokiniana.
Level of significance for differences inNo. of allelic frequencies at RAPD loci'
Comparison Region populations2 fix ns P<0.05 P<0.01 P<0.001
Between varieties Mexico 2V 0 14 3 0 0
Between fieldswithin regions Mexico 3F 0 16 1 0 0
Nepal 3F 1 13 3 0 0Canada 2F 0 11 1 3 2Switzerland 2F 3 13 0 1 0
Within regions Mexico 1D- 3F 0 16 1 0 0Bolivia 1D-I F 2 14 1 0 0Nepal 1D- 3 F 1 10 4 2 0Canada 1D- 2F 0 10 2 2 3Switzerland lD-2F 2 11 3 1 0
Between fieldsamong regions 11 fields 11 F 0 0 1 15
Between regions 5 regions 5R 0 0 0 16
I X2probabilities that allele frequencies among samples within each comparison are different by chance: * P<0.05,** P<O.01, *** P<O.OOl, ns Not significant, fix Populations with fixed alleles did not permit the use of the X2 test.
2 Column shows the number of populations and hierarchical level used in the X2homogeneity test. Populations arefrom V=varietal, F=field, D=district, and R=regional samples.

Population Structure and Epidemiology of Bipolaris sorokinianaln the Rice-Wheat Cropping Pattern of Nepal 99
different among the 11 field samples and
the 5 pooled regional samples (Table 5).
the Mexican samples were generally
shortest, and distances to the Swisssamples were longest (Figure 3).
Iteration steps: 25Stress of final configuration: 0.054Proportion of variance (r2): 0.9B7
2-,-------------,
Figure 3. Graphic description of geneticdifferences among Bipo/aris sorokinisnspopulations from five sampling regions. Relativedistances between populations are derived from adissimilarity matrix with Nei's standard geneticdistances by a multi-dimensional, monotonicscaling procedure. according to Kruskal (1964).Data points represent 5 pooled regional samplesand 5district samples (one of each per region) and12 field populations (Bolivia. 1; Switzerland, 2;Mexico, 4; Canada, 2; Nepal, 3).
The mean total gene diversity HT for
all 17 loci across all 11 field populationswas relatively high (0.39), partly because
only markers known to be polymorphic
were analyzed. Hierarchical analysisrevealed that the partition of gene
diversity varied strongly between loci.
Across all loci, 14% of total gene diversitywas allocated to variation among regions,
3% to variation among fields within
regions, and 83% to variation withinfields (Table 6).
Nei's genetic distance (Nei 1972),analyzed over all loci, was smallest
between samples within regions and only
exceeded 0.04 in the CAN region,emphasizing the special characteristics ofthe Saskatoon field population. If the
genetic distances are subjected to amultiple dimension scaling procedure(KruskaI1964), populations of the sameregion are clearly clustered. Distances to
~ I..~ 0Q)
Eis
-1
oDimension 1
2
Table 6. Mean total gene diversity Hrof a worldwide collection of 799 Bipo/aris sorokinians isolates andits partition into components assigned to different hierarchical sampling levels.
Source of gene diversity Percentage of total gene diversity'Hierarchical wlthm among among fields among
Region levels2 Total3 Hr fields varieties within regions regions
All regions 12F-5 R 0.39 83.2 0.4 2.6 13.8(range)4 (0.20-0.50) (66.7-93.6) (0.0-1.6) (0.7-7.1) (1.7-29.3)
Mexico 4F-2V 0.36 96.5 1.2 2.4Bolivia 1F 0.35Nepal 3F 0.35 97.B 2.2Canada 2F 0.32 91.9 B.lSwitzerland 2F 0.25 99.0 1.0
Partitioning of total gene diversity among hierarchical contributors according to Beckwitt (1980).Column describes the different hierarchical sampling levels that contributed to total gene diversity. F=field. R=region, V=variety.Nei's measure of total gene diversity based on 17 RAPD markers.Range of Hrand its partition, calculated individually for the 17 loci under investigation.
100 M. Rucksluhl
Pairwise population subdivision was
determined with Nei's Gst. From this,
Nm was calculated, which is an
estimation of gene flow and determines
the number of migrating individuals per
generation among the two populations.
The level of gene flow strongly fluctuated
between different loci and population
pairs, but was always sufficient to
prevent geographical separation of
populations.
The combination of 17 RAPD markers
resulted in the detection of 264 different
multilocus haplotypes among the total
population of 799 isolates. In field
populations, 1.2 to 1.8 isolates with
identical haplotype were found in all but
the SWI region, where the degree of
clonality was higher with 2.3 and 2.8
isolates per haplotype. Among the
pooled regional samples, the BOL and
CAN populations were of considerably
less clonal structure, each with 1.8
isolates per haplotype.
Putative clones of field populations
based on the 17-digit multilocus
haplotype were identified, and hence all
but one isolate of such a clone were
eliminated. This resulted in small sample
sizes of clone-corrected populations
ranging from 13 (MEX-roots) to 47
isolates (MEX-glumes). Statistical tests on
dual-loci haplotypes and gametic
disequilibrium were performed with a
reduced set of markers with intermediate
allele frequencies between 0.2-0.8 in the
original sample, on both complete and
clone-corrected populations, respectively
(Table 7). The percentage of marker pairs
for which all four possible allele
combinations were detected was over
80% in 10 of 13 field populations, while
the two Canadian samples were
considerably biased due to the small
number of isolates. Finally, in the BOL
Okinawa sample, one allele combination
was missing in almost 25% of the marker
pairs.
Eliminating putative clones in field
populations massively increased the
percentage of marker pairs in gametic
equilibrium. In clone-corrected samples,
less than 30% of the pairs of loci showed a
significant non-random association
among alleles, ranging from 2.9% in
MEX-roots to 29.7% in CAN-St. Benedict.
Comparisons of genotypic diversities
Gobs.' from field samples, with mean
values Gsim., from 1,000 simulated
populations, showed significant
deviations from the null hypothesis of
panmixis at the 1% significance level in
all cases where putative clones were not
removed (Table 8). However, among
clone-corrected populations, panmixis
was rejected in only 5 of 13 fields at
probability levels of 5% (2 populations),
1% (1 population), and two others at the
0.1% significance level. For the remaining
8 samples, there was not sufficient
evidence to reject the null hypothesis, and
it was therefore concluded that the
observed field populations did not differ
in genotypic diversity from the
bootstrapped populations simulated
under panmictic assumption.
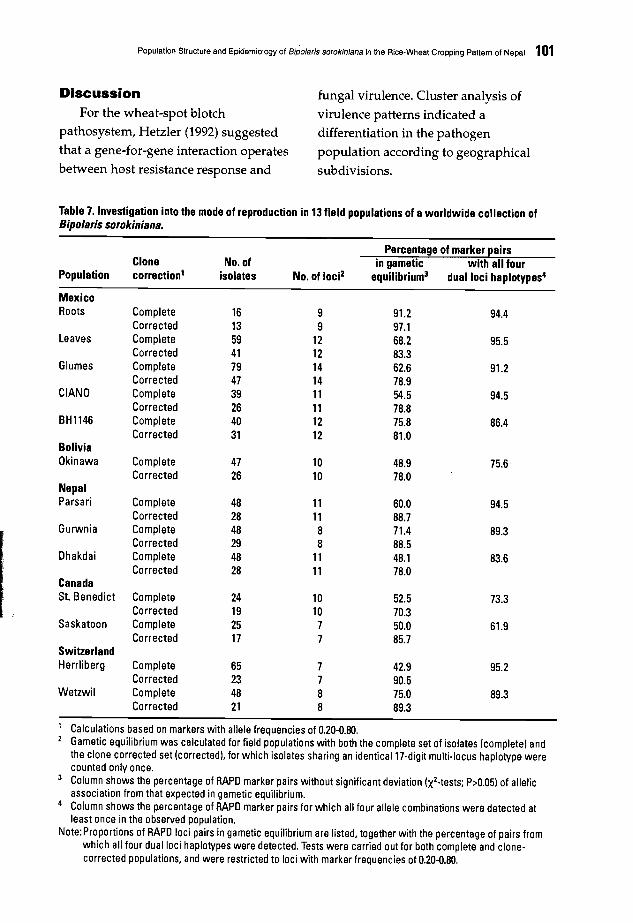
Population Structure and Epidemiology of Bipo/aris sorokiniana in the Rice-Wheat Cropping Pattern of Nepal 101
Discussion fungal virulence. Cluster analysis of
For the wheat-spot blotch virulence patterns indicated a
pathosystem, Hetzler (1992) suggested differentiation in the pathogen
that a gene-for-gene interaction operates population according to geographical
between host resistance response and subdivisions.
Table 7. Investigation into the mode of reproduction in 13 field populations of a worldwide collection ofBipolaris sorokiniana.
Percentage of marker pairsClone No. of in gametic with all four
Population correction1 isolates No. of loci2 equilibrium3 dual loci haplotypes4
MexicoRoots Complete 16 9 91.2 94.4
Corrected 13 9 97.1Leaves Complete 59 12 68.2 95.5
Corrected 41 12 83.3Glumes Complete 79 14 62.6 91.2
Corrected 47 14 78.9CIANO Complete 39 11 54.5 94.5
Corrected 26 11 78.8BH1146 Complete 40 12 75.8 86.4
Corrected 31 12 81.0BoliviaOkinawa Complete 47 10 48.9 75.6
Corrected 26 10 78.0NepalParsari Complete 48 11 60.0 94.5
Corrected 28 11 88.7Gurwnia Complete 48 8 71.4 89.3
Corrected 29 8 88.5Dhakdai Complete 48 11 48.1 83.6
Corrected 28 11 78.0CanadaSt. Benedict Complete 24 10 52.5 73.3
Corrected 19 10 70.3Saskatoon Complete 25 7 50.0 61.9
Corrected 17 7 85.7SwitzerlandHerrliberg Complete 65 7 42.9 95.2
Corrected 23 7 90.5Wetzwil Complete 48 8 75.0 89.3
Corrected 21 8 89.3
Calculations based on markers with allele frequencies of 0.20-0.80.Gametic equilibrium was calculated for field populations with both the complete set of isolates (completel andthe clone corrected set (corrected I. for which isolates sharing an identical 17-digit multi-locus haplotype werecounted only once.
3 Column shows the percentage of RAPD marker pairs without significant deviation (X2-tests; P>0.05) of allelicassociation from that expected in gametic equilibrium.
4 Column shows the percentage of RAPD marker pairs for which all four allele combinations were detected atleast once in the observed population.
Note:Proportions of RAPD loci pairs in gametic equilibrium are listed. together with the percentage of pairs fromwhich all four dual loci haplotypes were detected. Tests were carried out for both complete and clonecorrected populations. and were restricted to loci with marker frequencies of 0.20-0.80.
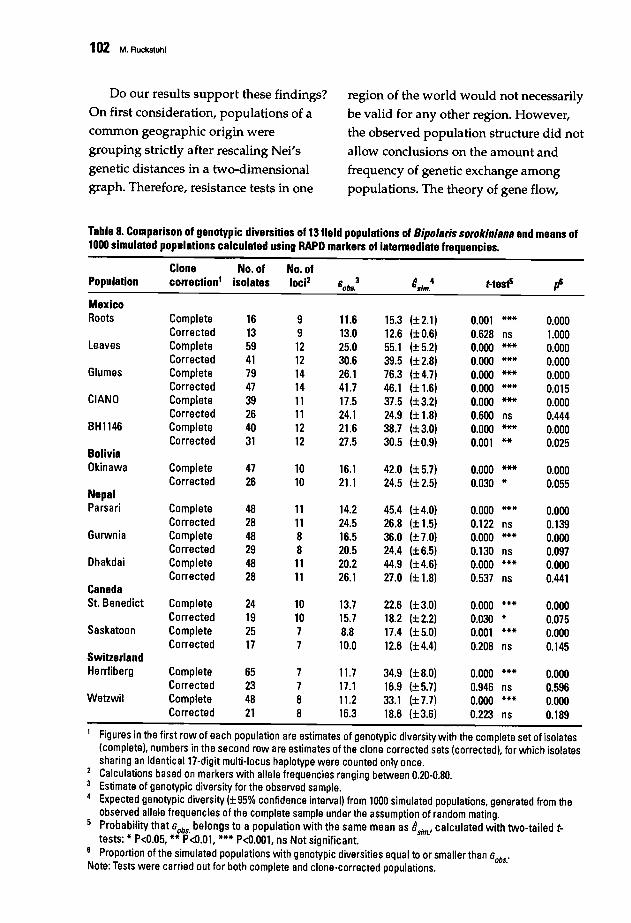
102 M. Ruckstuhl
Do our results support these findings? region of the world would not necessarily
On first consideration, populations of a be valid for any other region. However,common geographic origin were the observed population structure did not
grouping strictly after rescaling Nei's allow conclusions on the amount and
genetic distances in a two-dimensional frequency of genetic exchange amonggraph. Therefore, resistance tests in one populations. The theory of gene flow,
Table 8. Comparison of genotypic diversities of 13 field populations of Bipolaris sorokiniana and means of1000 simulated populations ~alculated using RAPD markers of intermediate frequencies.
Clone No. of No. ofPopulation correction1 isolates lociz Gobs.
3 e.1m•4 '-tesP ~
MexicoRoots Complete 16 9 11.6 15.3 (±2.1l 0.001 *** 0.000
Corrected 13 9 13.0 12.6 (±0.6) 0.628 ns 1.000Leaves Complete 59 12 25.0 55.1 (±5.2) 0.000 *** 0.000
Corrected 41 12 30.6 39.5 (±2.8) 0.000 *** 0.000Glumes Complete 79 14 26.1 76.3 (±4.7) 0.000 *** 0.000
Corrected 47 14 41.7 46.1 (± 1.6) 0.000 *** 0.015CIANO Complete 39 11 17.5 37.5 (±3.2) 0.000 *** 0.000
Corrected 26 11 24.1 24.9 (± 1.8) 0.600 ns 0.444BHl146 Complete 40 12 21.6 38.7 (±3.0) 0.000 *** 0.000
Corrected 31 12 27.5 30.5 (±0.9) 0.001 ** 0.025BoliviaOkinawa Complete 47 10 16.1 42.0 (±5.7) 0.000 *** 0.000
Corrected 26 10 21.1 24.5 (±2.5) 0.030 * 0.055NepalParsari Complete 48 11 14.2 45.4 (±4.0) 0.000 *** 0.000
Corrected 28 11 24.5 26.8 (± 1.5) 0.122 ns 0.139Gurwnia Complete 48 8 16.5 36.0 (±7.0) 0.000 *** 0.000
Corrected 29 8 20.5 24.4 (±6.5) 0.130 ns 0.097Dhakdai Complete 48 11 20.2 44.9 (±4.6) 0.000 *** 0.000
Corrected 28 11 26.1 27.0 (± 1.8) 0.537 ns 0.441CanadaSt. Benedict Complete 24 10 13.7 22.6 (±3.0) 0.000 *** 0.000
Corrected 19 10 15.7 18.2 (±2.2) 0.030 * 0.075Saskatoon Complete 25 7 8.8 17.4 (±5.0) 0.001 *** 0.000
Corrected 17 7 10.0 12.6 (±4.4) 0.208 ns 0.145SwitzerlandHerrliberg Complete 65 7 11.7 34.9 (±8.0) 0.000 *** 0.000
Corrected 23 7 17.1 16.9 (± 5.7) 0.946 ns 0.596Wetzwil Complete 48 8 11.2 33.1 (±7.7) 0.000 *** 0.000
Corrected 21 8 16.3 18.6 (±3.6) 0.223 ns 0.189
1 Figures in the first row of each population are estimates of genotypic diversity with the complete set of isolates(complete), numbers in the second row are estimates of the clone corrected sets (corrected), for which isolatessharing an identical 17-digit multi-locus haplotype were counted only once.Calculations based on markers with allele frequencies ranging between 0.20-0.80.Estimate of genotypic diversity for the observed sample.Expected genotypic diversity l± 95% confidence interval) from 1000 simulated populations, generated from theobserved allele frequencies of the complete sample under the assumption of random mating.
5 Probability that Gobs. belongs to a population with the same mean as 8Sim! calculated with two-tailed ttests: * P<0.05, ** P<O.01. *** P<O.OOI, ns Not significant.
6 Proportion of the simulated populations with genotypic diversities equal to or smaller than Gobs:
Note: Tests were carried out for both complete and clone-corrected populations.
Population Structure and Epidemiology 01 Bipolaris sorokiniana In the Rice·Wheat Cropping Pattem 01 Nepal 103
developed by Wright (1969), explains
stable subdivisions with a certain amountof migrants among populations, which
counteracts the random force of genetic
drift. In practice, this means that theobserved structure did not exclude the
migration of individuals among regions.
The data further indicate that between 33and about 200,000 migrants between
regions are necessary to prevent stronger
subdivision. If many individuals carryfavorable genes to overcome host
resistance, they will be readily amplified
in the target population.
Do we have indications of host
specialization in the pathogen populationusing our markers? Comparison of the
two glume populations isolated from
BH1l46 and Ciano showed very littledifference in gene frequencies at onlythree loci. The differentiation between the
two fields in Canada may be interpretedas differential selection; however, it is
unlikely that 6 of 17 markers are directlyselected, and therefore differ infrequencies among the two fields. If
sexual recombination is rare, or evenmissing, associations among selected and
neutral loci may persist; an effect
commonly referred to as hitch-hiking. Wecan also speculate if migration was less
intensive among populations that mainly
live on subground parts of the host, andif a specification was therefore more
likely to develop.
Do the results give any indic.ation ofsexual recombination? The.sexual stage
of B. sorokiniana is named Cochliobolussativus and, to date, has only been found
once under field conditions (Raemaekers
1991). However, the results of this study
revealed that in all clone-corrected field
populations, the vast majority of pairwise
allelic association among multi-locus
haplotypes did not differ from what
would be expected in a randomly matingpopulation. Further, measures of
genotypic diversity (Stoddart and Taylor1988) in 8 out of 13 clone-corrected field
populations did not differ from genotypic
diversities calculated for bootstrappedpopulations simulated under the
assumption of sexual recombination. Andfinally, most ma:rker pairs were found to
be in gametic equilibrium and thereforeindicated that sexual reproduction may
be occurring. However, a similar degreeof gametic equilibrium could also be
expected from genetic drift as a result of
the long-term exchange of fungalmaterial through the worldwide seedtrade.
Although these results remainsomewhat inconclusive, we foundevidence for genetic reshuffling througheither sexual or asexual recombination
processes in the life cycle of B. sorokiniana.The amount of sexual recombination is of
considerable importance for theincorporation of immigrated virulence
factors into the genetic background of
locally adapted pathogen populations. It
may, in fact, be the crucial factor in
determining how long a variety that is
susceptible in one region remains
resistant in another region.
SummaryDespite the various origins of the
isolates, whether sampled from glumes,
leaves, or subground parts of the hosts,
104 M. Rucksluhl
from commercial fields or research
stations, from traditional (CAN, SWI) or
non-traditional (MEX; NEP, BOL) wheat
growing areas, genetic substructuring of
populations expressed as measures of
gene and genotypic diversity was very
similar:
• B. sorokiniana was found to maintain
a large level of variation at a local
scale through gene flow, which
counteracts population subdivision
tendencies and may be part of the
very successful survival strategy.
• This study provided conclusive
evidence for a substructuring of the
B. sorokiniana population. However, it
remains open if traits of agronomic
interest, such as virulence genes,
which are under strong selection
pressure, would match the clustering
found with neutral markers. If so,
host genotypes selected for resistance
in one region of the world would not
necessarily be resistant in other
regions.
The presented study probably raised
more questions on B. sorokiniana
population processes than it clarifies.
Although geographic substructuring of
the pathogen population was observed,
regional populations are not strictly
separated. Therefore, for spot blotch
resistance breeding, shuttle breeding
strategies are suggested that may detect
regional differences in virulence
composition of the pathogen population.
Conclusions
Several observations across the RW
cropping belt of Asia raise concern over
the sustainability of this multiple cereal
cropping system (Paroda et ai. 1994).Growing two cereal crops such as rice
and wheat in an intensive, continuous
rotation is not likely to have conflicting
nutritional needs, and fertility
management is more a question of
refining nutrient deposits with respect to
uptake patterns. However, from these
rotations, no benefits for soil sanitation,
structure, fertility, and biodiversity can be
expected. Depletion of soil nutrients,
especially quantity and quality of the soil
organic matter, salinity and waterlogging
on irrigated land, falling water tables,
and increasing pest and diseases pressure
have to be anticipated.
Bipoiaris sorokiniana is probably not a
major reason for lack of sustainability, but
it is definitely an important explanation
for the low wheat yields in the RW
cropping sequence. Low cost
management tools to control the
pathogen are not available on the market.
Considering the low productivity of the
RW cropping sequence and the high
losses caused by diseases such common
root rot or HLB of wheat, an integrated
production approach has to be taken into
consideration that includes:
• Crop management practices: non
cereal crop rotation partners; nutrient
management, particularly farm yard
manure; and crop residue
management.
• Disease control strategies: soil
disinfestation techniques; promoting
fungal antagonists in the soil; and
varietal and/or species mixtures
Population Structure and Epidemiology of Bipolaris sorokiniana in the Rice·Wheat Cropping Pattern of Nepal 105
System intensification needed to meet
future food demands is unlikely to be
successful if the current RW cropping
sequence is not considerably diversified.
A promising system not only has to
ensure food security, but has to increase
stability through locally adapted
varieties, the use of locally available
nutritional inputs, ecologically sound
crop protection measures, and well
maintained irrigation facilities.
Unfortunately, most agricultural
research organizations date back to times
where technology packages, containing
seed, fertilizer, and irrigation, were
developed for large areas at centralized
research stations and distributed through
extension services. These packages were
strictly commodity-orientated, and
developed for an optimal crop rather
than system performance. These
packages are not designed to be used in
diverse agricultural systems and neglect
aspects of system management, further
adding to their disappearance.
What is needed are technology cumknowledge choices that offer farmers a wide
range of management tools for more
diverse production "micro
environments". These catalogues might
be the result of long-term research
activities and ought to be continuously
fine-tuned, and not based exclusively on
results from research activities, but
enriched with experiences gathered from
farmers.
References
Cook, J.R., and K.E Baker. 1983. The natureand practice of biological control of plantpathogens. St. Paul, Minnesota: APS.
Davis, J.R. 1991. Soil solarization: pathogenand disease control and increases in cropyield and quality: Short and long-termeffects and integrated control. In: J.Katan and J.E. DeVay (eds.), SoilSolarization, pp. 39-50. Boca Raton,Florida: CRC Press Inc.
Dubin, H.J., and M. van Ginkel. 1991. Thestatus of wheat diseases and diseaseresearch in warmer areas. In: D.A.Saunders (ed.), Wheat for theNontraditional Warm Areas, pp. 125-145.Mexico, D.E: CIMMYT.
Dubin, H.J., and H.P. Bimb.1994. Studies ofsoilborne diseases and foliar blights ofwheat. at the national wheat researchexperiment station, Bhairahawa, Nepal.Wheat Special Report No. 36. Mexico,D.E: CIMMYT.
Giri, G.5., Acharya, G.P., Regmi, A.P., andP.R. Hobbs. 1993. Results of a longtermrice-rice-wheat soil fertility experimentin the Terai of Nepal. In: D.A. Saundersand G. Hettel (eds.), Wheat in the HeatStressed Environment: Irrigated, DryAreas and Rice-Wheat Farming Systems.Mexico, D.E: CIMMYT.
Hetzler, J. 1992. Host-pathogen interactionsin populations of Bipolaris sorokiniana inthe warm non-traditional areas. Ph.D.thesis, Georg-August Universitat,G6ttingen, Germany. 132 pp.
Hobbs, P.R., Harrington, L.W., Adhikary, c.,Giri, G.S., Upadhyay, S.R., and B.Adhikary. 1996. Wheat and rice in theNepal Tarai: farm resources andproduction practices in RupandehiDistrict. Mexico, D.E: CIMMYT.
Katan, J., and J.E. DeVay. 1991. Soilsolarization. Boca Raton, Florida: CRCPress Inc. 267 pp.
Kruskal, J.B. 1964. Multidimensional scalingby optimizing goodness of fit to anonmetric hypothesis. Psychometrika29:1-27.

106M. Ruckstuhl
Mehta, Y.R 1985. Breeding wheats forresistance to spot blotch. In: Wheats forMore Tropical Environments.Proceedings of the InternationalSymposium, pp. 135-145. Mexico, D.E:CIMMYT.
Morris, M.L., Dubin, H.J., and T. Pokhrel.1994. Returns to wheat breeding researchin Nepal. Agric Econ 10:269-282.
Nei, M~ 1972. Genetic distance betweenpopulations. Am Nat 106:283-292.
Pullmann, G.5., DeVay, J.E., and RH.Garber. 1981. Soil solarization andthermal death: A logarithmicrelationship between time andtemperature for four soilborne plantpathogens. Phytopathol71:959.
Raemaekers, RH. 1985. Breeding wheatswith resistance to HelminthosporillmsativlIm in Zambia. In: Wheats for MoreTropical Environments. Proceedings ofthe International Symposium, pp. 145148. Mexico, D.E: CIMMYT.
Regmi, AP. 1994. Long-term effects oforganic amendment and mineralfertilizers on soil fertility in a rice-ricewheat cropping system in Nepal. M.Sc.thesis, University of the Philippines, LosBa§os, Philippines.
Singh, RB., and RS. Paroda. 1994.Sustainability and productivity of ricewheat systems in the Asia-Pacific region:research and technology developmentneeds. In: RS. Paroda, T. Woodhead, andRB. Singh (eds.), Sustainability of ricewheat production systems in Asia, pp. 135. RAPA/FAO publication 1994/11.Bangkok, Thailand: RAPA/FAO
Stapleton, J.J., Quick, J., and J.E. DeVay,1985. Soil solarization: effects on soilproperties, crop fertilization and plantgrowth. Soil BioI Biochem 17:369-373.
Wright, S. 1969. The theory of genefrequencies. In: Evolution and theGenetics of Populations. Vol 2. Chicago:University of Chicago Press.
101
Tan Spot in Central Asia
E.N. Postnikova and B.A. Khasanov
Institute of Genetics, Academy of Sciences of RUZ, Glavpochtamt, Uzbekistan
Abstract
In Central Asia, surveys are annually conducted to identify fungal pathogens occurring oncereal crops. Tan spot, caused by Pyrenophora tritici-repentis, was found for the first time in1986, and has subsequently been recorded throughout Central Asia, mainly in the Djizzakhregion of Uzbekistan and Kulyab region of Tadjikistan. To determine possible host plants andsources ofP. tritici-repentis, Gramineae plants (jour cereal and 22 wild grass species) weresurveyed under natural and artificial inoculation conditions. Based on observations, it is likelythat Agropyron repens, A. cristatum, Aegilops cylindrica, and Bromus inermis arepotential inoculum sources. Field and greenhouse experiments were conducted to identify localresistant cultivars. No immune genotypes were found among 136 cultivars tested. Effect oftemperature (2, 5, 10, and 15"C for 2,4,6,8, 10, 15,20,25,30, and 35 h) on P. tritici-repentis
isolates was investigated. The highest disease intensity was observed at 25 h moisture period at15"C. In the laboratory, various treatments were tested including light regime, mediumformulation, inoculum dose. and three-way inoculum preservation. A technique for producingdry P. tritici-repentis inoculum and creating an infection background was developed.
The government of the Republic ofUzbekistan established a goal to increase
cereal productivity and achieve grain selfsufficiency. The area sown to cerealsincreased to 1.8 million ha in 1996. Cereals
are primarily sown on irrigated landwhere grain yields of 2.5-3.0 t ha-1,
compared with 1.2-1.5 t ha-1 are possible in
rainfed areas.
However, irrigation frequently leads tothe creation of conditions more favorable
for the development of cereal disease
epidemics. Until recently, diseases such asbrown rust, yellow rust, smuts, bunts, and
powdery mildew were considered the
most important cereal diseases in Central
Asia. The epidemiology of these diseases
has been thoroughly investigated. Of the
diseases present in Central Asia, wheatfoliar spots 'and blights have been studied
the least. These diseases were usually
considered to be a natural physiologicalwithering.
Tan spot of wheat was found for thefirst time in 1986 in southern Tadjikistan(Khasanov 1988). Subsequently, the
disease has been annually reported on
winter wheat crops in parts of Uzbekistan,Tadjikistan, and southern and northern
Kazakhstan. Based on annual mycological
surveys of cereal crops, tan spot, causedby Pyrenophora tritici-repentis, was
revealed to be one of the main wheat
diseases.
The increase in distribution and
pathogenicity of tan spot in Central Asiais caused by: 1) continuous wheat
cultivation under rainfed conditions over
many years, 2) the accumulation of a large
108 E.N. Postnlkova and B.A. Khasanov
infection source in the form of infected
plant residues, and 3) the absence of
control measures.
This paper presents the results of long
term research initiated in 1986 by Drs.
B.A. Khasanov and V.A. Mostovoy, and
continued by E. Postnikova from 1988 to
the present.
Tan Spot Distribution
Cereal crop surveys were undertaken
in Kazakhstan and Tadjikistan during
1986-1992, and in Uzbekistan from 1986 to
the present. About 20-50% of cereal crop
fields were annually surveyed. Plants
sampled included cereal crops, perennial
forage grasses, and wild grasses in fields,
road borders, meadows, wooded areas,
and along rivers. In each field, two or
three quadrats of 1 m2 were checked.
Disease severity on 10 plants was
determined by the percentage of infected
leaf area. Infected plant samples were
dried and stored according to the
techniques described in CBS Course of
Mycology (1971). The samples were
stored in paper envelopes in the
refrigerator at 5°C. Afterwards, infection
parameters (including form, size and
color of spots, presence or absence of
chlorosis, necrosis, and conidia) were
recorded. Pure culture was isolated and
conidiophore development was
stimulated using fresh plant material. This
was carried out usually within a week
after sample collection. Species
identification was based on microscopic
investigation of conidiophores and
conidia and the fulfillment of Koch's
postulates.
Since 1986, surveys have covered
fields in the spring rainfed cereal
producing area of northern Kazakhstan
and rainfed or irrigated fields in southern
Kazakhstan, Uzbekistan, and Tadjikistan.
These surveys showed that P. tritici
repentis occurs throughout the region but
is mOllt widely distributed in Djizzakh
region of Uzbekistan, and Kulyab region
of Tadjikistan. Disease intensity reached
25-55% in some wheat fields at the
flowering to milk wheat growth stage. In
some fields under continuous wheat
cropping, the proportion of infected
plants was 100% and disease intensity
was 70-80%. Maximum yield losses were
estimated at 20-30% and higher.
Pyrenophora tritici-repentis was reported in
60-80% of all observed fields in
Kazakhstan, with the proportion of
infected plants reaching 100%.
Identification of P. triticirepentis Host Plants
Under natural conditions in Central
Asia, P. tritici-repentis was reported on
wheat and the following wild grasses:
Aegilops cylindrica, Agropyron spp.,
Agropyron cristatum, Agropyroninterruptum, Elymus junceus, Seratia viridis,and Agropyron repens (Table 1). The
highest tan spot intensity was recorded
on wheatgrass (Agropyron repens), where
all above-ground parts of the plant were
infected. Oval spots and stripes, 1-2 cm
long and grayish-brown in color, occurred
on leaves. An increase in the size of the
spots and stripes resulted in coalescion
and ultimately leaf rot. Conidiophores
and conidia, but rarely pseudothecia,
were observed on necrotic leaf tissues.

Some pseudothecia contained asci and
ascospores.
Various species of Gramineae plantswere artificially infected to determine
possible host plants of the tan spot
fungus. Cereal and wild grass seedlings
were inoculated using fungi isolates takenfrom infected plants. Four cereal species
and 22 wild grasses were studied. The
inoculum was a mycelial suspensioncontaining 2-3 drops of Tween 80 per 100
ml of water, which was sprayed onto the
plants until runoff. Control seedlingswere sprayed only with water and Tween80. Inoculated plants were placed in a
moist chamber at 20°C for 30 h.Observations were made on the ninth day
after inoculation according to the scale of
Rees et al. (1988).
Tan Spot in Central Asie 109
gigantea, Agrostis stolonifera, Anthoxanthumodoratum, Echinochloa crus-galii, Loliumspp., Phleum spp., and Agropyron spp.were moderately infected. Hordeumleporinum, Setaria viridis, Elymus junceus,Elymus giganteus, and Festuca rubra were
the least infected. Avena fatua, Alopecuruspratensis, Lolium perenne, and Poa pratensisshowed no infection or only minor
infection on their leaves (Table 2).
Based on results from field surveysand artificial inoculation experiments on a
wide range of grasses, it can be concludedthat in the Central Asian region Agropyronrepens, Agropyron cristatum, Ae. cylindrica,and Bromus inermis can all be considered
as tan spot infection sources.
Table 2. Artificial inoculation of cereals and wildgrasses with Pyrenophors tritici-rep8ntis.
Table 1. Host plants, other than wheat, ofPyr8nophors tritici-r8p8ntis.
The tested fungus isolates showed ahigh aggressiveness on wheat species(Triticum aestivum and T. durum), two
cultivars of barley (Hordeum vulgare), andrye (Secale cereale). Among wild grasses,the disease level was severe on brome
grass (Bromus inermis). High infection
levels were recorded on Aegilopscylindrica, Agropyron repens, Agropyroncristatum, Hordeum spontaneum, and
Sorghum sudanense. Leaves of Agrostis
Host plant
Aegilops cytindrica
Agropyron spp.Agropyron cristatumAgropyron interruptumElymus junceusSetaria viridisAgropyron repens
Regions
Uzbekistan, Tadjikistan,South Kaza khstanSouthern KazakhstanNorthern Kazakhstan
Host plants
Triticum aestivumT. durumHordeum vulgare (2 cultivars)Secale cerealeBromus inermis
Aegilops cylindricaAgropyron repensAgropyron cristatumH. spontaneumSorghum sudanense
Agrostis giganteaAgrostis stoloniferaAnthoxanthum odoratumEchinochloa crus-galiiLoliumspp.Phleumspp.Agropyron spp.
H. leporinumSetaria viridisElymus junceusElymus giganteusFestuca rubra
Avena fatuaAlopecurus pratensisLotium perennePoa pratensis
Disease rate
Very severe
Severe
Moderate
Weak
Not infected
110 E.N. Postnlkova and B.A. Khasanov
Investigation of Tan SpotResistant Wheat Cultlvars
The identification of tan spot resistant
wheat cultivars in Central Asia isimportant because of the increasing
incidence of the disease. Experiments
using 136 local cultivars were conductedin the field and the greenhouse in 1994.
Since attempts to obtain conidium
sporulation failed many times,greenhouse plants at the two-leaf stage
and plants in the field at booting totillering were inoculated with a water
mycelium suspension. Five isolates of P.
tritici-repentis, collected from variousregions of Central Asia, were used for
inoculum production. Inoculated plantswere placed in a moist chamber for 24 h.
Assessments of the number of infectedplants and infected leaf area were madeon the ninth day after inoculation.
transported over long distances or storedfor long periods. The goal was to develop
a simple technique for inoculumproduction, which involved the testing of
several nutrition media, light regimes,methods of preservation, and various
rates and formulations of inoculum.
Medium developmentFifteen different media were tested
(Table 3). Afterautoclaving, cooling, and
adding an antibiotic (streptomycinsulfate, 1 g L-l), the media were poured
into plastic petri dishes. The fungusculture was added either by injection or
by placing one drop of the mycelialconidial suspension onto the media. Thedrop was evenly spread out overthe
medium surface using a sterile glassspatula. Dishes were incubated in the
growth chamber at 20°C (day) and 18°C(night). Conidium production was
Table 3. Conillia development of PYfeRophofStrltlel-fepeRtlson nutritive media.
Lactose, 20 g; carbamide, 1.2 g; MgS04,0.8 g; KCI, 0.8 g; KHl04, 0.8 g; agar, 20.0 9
2 Medium #1 plus maize extract, 5.2 g3 Medium #2 plus V-8 juice, 50.0 ml4 Medium #1 plus yeast extract, 7.6 95 Potato, 200 g; dextrose, 20 g; agar, 16.0 96 Potato,. 50 g; dextrose, 20 g; agar, 16.0 97 Medium 6 plus V-8 juice, 50.0 ml8 Medium #6 plus maize extract, 5.2 99 Medium #6 plus yeast extract, 7.6 910 Medium #6 plus peptone. 10.0 g;
asparagine, 1.0 911 Medium #5 plus peptone, 4.9 g; CaCI2,
4.9 g; CaC03• 1.6 g; dextrose, 20.0 912 Yeast extract, 7.6 g; sucrose,
20.0 g; agar, 15.0 913 Peptone, 10.0 g; sucrose,
10.0 g; KHl04, 2.0 g; agar, 20.0 914 Lactose. 38.0 g; casein hydrolyzate,
3.2 g; KHl04' 2.0 g; MgS04, 0.8 g;microsolution, 2.0 ml; agar, 10.0 9 +
15 Medium #14 plus yeast extract, 8.0 9 +
No.sporulation.+ Abundant sporulation.
The results demonstrated that, amongthose tested, there were no cultivars
immune to tan spot. This investigation isconsidered as preliminary owing to theunavailability of proper inoculum and a
convenient inoculation technique.
Improvement ofInoculation Technique
The production of relatively large
quantities of inoculum is essential for
conducting experiments on the host range
of the tan spot pathogen or for evaluatingcultivar resistance and effects of disease
on yield. Current techniques are time and
labor consuming, contain too many
stages, and the resulting inoculum is a
water conidium suspension that cannot be
No. Media ingredients IL-Il Sporulation
observed on medium #14 and medium
#15. The first conidia began to appear onthe 5th day of incubation, and abundant
sporulation was observed on the 10th day.
Up to 40-50 conidia on medium #14 andup to 70 conidia on medium #15 were
counted per microscope field (lOx10). The
research indicated that inoculation should
be performed by injection, not with dropsof mycelial-conidial suspension because,
in the latter, mycelial growth withoutconidia was observed.
Influence of light regimeThe following light regimes were
tested during the culture incubation
period in the artificial climate chamber:
• 12 h day photoperiod (9,000 lux),illumination with cool white lightlamps;
• 12 h day photoperiod (9,000 lux) for 5days, until mass development ofconidiophores. Samples were thenexposed to near UV (NUV) light for 6h;
• 12 h day photoperiod (9,000 lux) for 5days. Samples were then twiceexposed to NUV for 6 h;
• 12 h day photoperiod (6 h NUV light,6 h 9,000 lux) throughout the
incubation period .
On medium #15, which containedyeast extract, lactose, hydrolyzate casein,
macronutrients, and microsolution,
regardless of light regime, conidiophores
appeared on the 3rd day and conidia on
the 5th day. Abundant conidia formationwas observed on the 10th day. Conidia
formation occurred only in plastic petri
dishes; there was no sporulation if glasspetri dishes were used. No difference was
Tan Spot In Central Asia 111
found in the number of conidia per unit
area among the various treatments. Themycelium surface in the dishes was a dim
velvet color from the produced spores.
The light regime of 12 h photoperiod withcool white light lamps (9,000 lux) was
chosen because it was the easiest to
im.plement.
Inoculum collectionWhen abundant conidia production
was achieved, lids of the petri dishes were
half opened and the temperature in the
climate chamber was raised to 22-25°C.p"fter two days, the substrate in the dishesand the fungus culture was air-dried and
the inoculum was easily scraped out witha scalpel. The collected inoculum wassifted to remove particles larger than 1
mm, and kept for two days above silica
gel. The number of conidia per 1 mg ofbiomaterial was determined.
Inoculum pre.ervatlonThree inoculum preservation
techniques were studied: 1) tubes withcotton stoppers at room temperature; 2)tubes with cotton wool above silica gel;
and 3) vacuum-sealed ampules at 5°C.
Research into conidium viability and
inoculum aggressiveness was conductedmonthly. It was found that when tubeswere stored above silica gel or simply at
room temperature, conidium viability was
preserved for up to four months. In theampules, viability was preserved for at
least one year and inoculum aggressi
veness remained high during storage.
This technique allows inoculum to be
accumulated in advance for use when
needed, thus making phytopathological
research on tan spot much easier.

112 E.N. Postnikova and B.A. Khasanov
Inoculum formulationsand rates
Greenhouse experiments wereconducted to determine the optimal
concentration and foqnulation ofinoculum for plant infection. Five
inoculum rates were tested: 10, 40, 100,
250, and 500 mg m-2 in a water-conidium
suspension and in dust. Theconcentration of conidia was 2,300
conidia mg-1• After inoculation, plantswere put in a moist chamber for 30 h at
18-20°C. The control plants were sprayed
with tap water, dusted with talc, and alsoput in a moist chamber. All plants(inoculated and control) were then placed
on benches in the greenhouse at IS-20°C.The number of infected plants and
infected leaf area were assessed on the
ninth day after inoculation. Resultsshowed that even though the driedinoculum was easy to use, especially inthe field, preference should be given tothe water-conidium suspension. To infect
wheat plants at the seedling-tilleringstage, a rate of 250 mg m-2 of biomaterialin the form of water conidium suspension
produced an infection severity of 60% onthe leaf surface, whereas 500 mg m-2 of
dust inoculum caused only 40% infection
severity.
EnvironmentalRequirements of P. triticirepentis
Effect of moistureperiod and temperature
Pyrenophora tritici-repentis, as well as
other Deuteromycetes, ca'n grow and infect
plants only within certain temperature
and moisture ranges. Pyrenophora tritici-
repentis has its own pattern ofenvironmental conditions required duringthe infection period; presence of inoculum
and moisture on the leaves of the host
plant do not guarantee infection. Tan spotinfection is possible within a wide range
of temperatures, but the optimal
temperature is around 22°C (Lamari et ai.1992). Deviation from this range causes a
decline in the probability of infection.
Dew and raindrops are the moisturesources on wheat crops under natural
conditions. Duration of the moist period
depends on temperature.
To determine the influence of various
combinations of temperature andmoisture period duration on the level of
tan spot infection on wheat, a series of
experiments using one local wheatcultivar (Kyzyl Shark) was carried out ingrowth chambers with constanttemperature and moisture regimes. Theeffect of low temperature was tested: 2, 5,
10, and 15°C. Plants were sprayed with awater-conidium suspension (250 mg ofdried inoculum m-2; 2,300 conidia mg-l ) at
the two leaf stage and placed in amoisture chamber for 2, 4, 6, 8, 10, IS, 20,25, 30, and 35 h. A subsequent incubation
was conducted in the greenhouse at
IS-20°C.
The effect of moisture period duration
on tan spot symptoms at certaintemperatures was estimated by recording
the number of infected plants and
infection intensity on the ninth day after
inoculation. Tan spot infection was
observed at all temperatures except at
2°C. At this temperature, only minor

infection was observed. At 5°C no
significant differences were noted among
the various dew periods.
The data showed that a 2 h moisture
period is not long enough for spore
germination and effective plant infection
at any of the tested temperatures.
Moisture periods of 5,6,8, and 10 h
caused very weak infection, with the
infection level similar at all temperatures
(differences were not significant). Where
moisture was maintained on the plants
for 15 h, the infection level was higher at
lOoC and 15°C. At a moisture period of 20
h and temperatures of lOoC and 15°C, a
sharp increase in leaf was observed from14% at 5°C, to 34% and 44% at lOoC and
15°C, respectively. The highest disease
intensity (57%) was observed for the 25 h
moisture period at 15°C. At moisture
periods 30 and 35 h, a further increase in
infection rate was not observed at all
temperatures.
In late March to early April, wheat is
at tillering to booting in Uzbekistan.
During this period, the ecological
conditions surrounding rainfed and
irrigated crops satisfy the requirements of
the tan spot pathogen: temperature, 10
15°C; daily average RH, 50-60%; and dew
periods, 8-12 h.
Conclusion
The study leads to the conclusion that
tan spot epidemics can occur if wheat
monoculture is practiced. In this study,
the distribution and sources of infection
were investigated, and host plants of P.
Tan Spot in Central Asia 113
tritici-repentis determined. Preliminary
investigation of 136 wheat cultivars
indicated the absence of tan spot
resistance in local cultivars and advanced
lines, and highlighted the necessity of
screening resistant cultivars during the
early stages of the selection process. Also,
a simple technique for inoculum
production was developed, which created
an infection background applicable to
regional conditions. This research is
essential for the development of new,
ecologically adapted cultivars that are
resistant to tan spot in Central Asia.
Acknowledgment
The authors express their sincere
thanks to Drs. Jesse Dubin, Etienne
Duveiller, and Alexei Morgounov for
their support and assistance in the review
of this manuscript.
References
CBS. 1971. The average climatic andagriclimatic conditions in Central Asia ofmany years. In: CBS Course of Mycology3rd edition. SARNIGMI. Tashkent. 75 pp.(Russian).
Khasanov, B.A. 1988. Yellow leaf spot ofcereals caused by Pyrenophora triticirepentis (Died.) Drechs. Mikologiya iFitopatologiya. 22 (1):78-83 (Russian).
Lamari, L., Bernier, c., and G.M. Ballance.1992. The necrosis-chlorosis model in tanspot of wheat. In: L.J. Francl, J.M.Krupinsky, and M.P. McMullen (eds.),Advances in Tan Spot Research:Proceedings of the 2nd International TanSpot Workshop, pp. 13. Fargo, ND, USA:North Dakota Agricultural ExperimentalStation.
Rees, RG., Platz, G.J., and RJ. Mayer. 1988.Susceptibility of Australian wheats toPyrenophora tritici-repentis. Aust J AgricRes 39:141-151.
114
Breeding for Foliar Blight Resistance inHeilongjiang Province, China
Xiao Zhimin, Sun Lianfa, and Xin Wenli
Crop Breeding Institute of Heilongjiang, Academy of Agricultural Sciences,Harbin, PR China
Abstract
Foliar blight, black point, and root rot ofwheat, caused by Bipolaris sorokiniana, B.triticicola, and Exserohilum monoceras, are the second most serious group ofdiseases inHeilongjiang province, China. Of the three pathogen strains, B. sorokiniana is the mostimportant, accounting for more than 80% offungal strains collected. Annual yield losses due toB. sorokiniana are estimated at 10-15%. Greatest damage occurs during the flowering to milkstages of the wheat plant. Disease severity is closely related to temperature and humidity,especially temperature several days before flowering. Breedingfor resistance is the best means ofreducing damage to wheat production in the province. Some germplasm and varieties with goodB. sorokiniana resistance have been developed through cross breeding, resistance evaluationafter artificial inoculation in the field and laboratory, and screening mutants by phytotoxinselection pressure and cell engineering. Since varieties with different maturation periods areexposed to different ecologicalconditions, they have different B. sorokiniana resistance levels,i.e., late varieties>middle varieties>early varieties.
Heilongjiang province is the largestarea sown to spring wheat in China, witharound 2 million ha sown each year. It is
located in the northeast of the country at121° 13' to 1300 E longitude and 43° 32' to
53° 24'N latitude. Average annualprecipitation ranges between 350 and 600
mm. The majority (70%) of total rainfall
occurs in the last 10 days ofJune, July,and August, Le., during flowering to
harvesting stages of the wheat crop,
when average temperatures are 22.325.8°C. Since the level of B. sorokinianainfection is closely related to temperature
and humidity, greatest damage occurs
during flowering to milking stages.
Stem rust of wheat was a problem inthe province until the 1950s, when a
breeding solution was found. Since thattime, foliar blight, black point, and rootrot of wheat, caused by Bipolarissorokiniana, have been an important
disease group, second only to scab. Ingeneral,annual yield losses due to the
disease range between 10 and 15%.
Although breeding for disease resistanceis considered difficult, it is an effective
way to reduce damage to wheat
production.
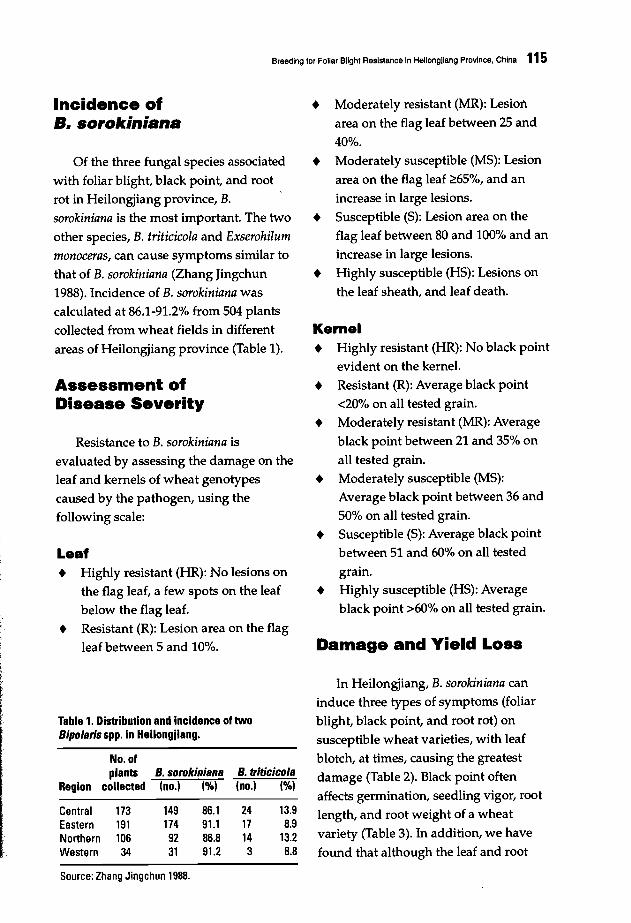
Breeding tor Foliar Blight Resistance In Heilongjiang Province, China 115
Incidence ofB. sorokiniana
Of the three fungal species associatedwith foliar blight, black point, and rootrot in Heilongjiang province, B.
sorokiniana is the most important. The two
other species, B. triticicola and Exserohilummonoceras, can cause symptoms similar tothat of B. sorokiniana (Zhang Jingchun
1988). Incidence of B. sorokiniana wascalculated at 86.1-91.2% from 504 plants
collected from wheat fields in different
areas of Heilongjiang province (Table 1).
Assessment ofDisease Severity
Resistance to B. sorokiniana is
evaluated by assessing the damage on theleaf and kernels of wheat genotypes
caused by the pathogen, using thefollowing scale:
Leaf• Highly resistant (HR): No lesions on
the flag leaf, a few spots on the leafbelow the flag leaf.
• Resistant (R): Lesion area on the flagleaf between 5 and 10%.
Table 1. Distribution and incidence oftwoBipolsrls spp. in Heilongjiang.
No. ofplants B. soroklRisRs B. tritieieols
Region collected (no.) ("to) (no.) ("to)
Central 173 149 86.1 24 13.9Eastern 191 174 91.1 17 8.9Northern 106 92 86.8 14 13.2Western 34 31 91.2 3 8.8
Source: Zhang Jingchun 1988.
• Moderately resistant (MR): Lesionarea on the flag leaf between 25 and
40%.
• Moderately susceptible (MS): Lesionarea on the flag leaf ~65%, and anincrease in large lesions.
• Susceptible (5): Lesion area on theflag leaf between 80 and 100% and an
increase in large lesions.
• Highly susceptible (HS): Lesions onthe leaf sheath, and leaf death.
Kerne.• Highly resistant (HR): No black point
evident on the kernel.
• Resistant (R): Average black point<20% on all tested grain.
• Moderately resistant (MR): Averageblack point between 21 and 35% on
all tested grain.
• Moderately susceptible (MS):Average black point between 36 and50% on all tested grain.
• Susceptible (5): Average black pointbetween 51 and 60% on all tested
grain.
• Highly susceptible (HS): Averageblack point >60% on all tested grain.
Damage and Yield Loss
In Heilongjiang, B. sorokiniana caninduce three types of symptoms (foliar
blight, black point, and root rot) onsusceptible wheat varieties, with leaf
blotch, at times, causing the greatest
damage (Table 2). Black point often
affects germination, seedling vigor, root
length, and root weight of a wheatvariety (Table 3). In addition, we have
found that although the leaf and root
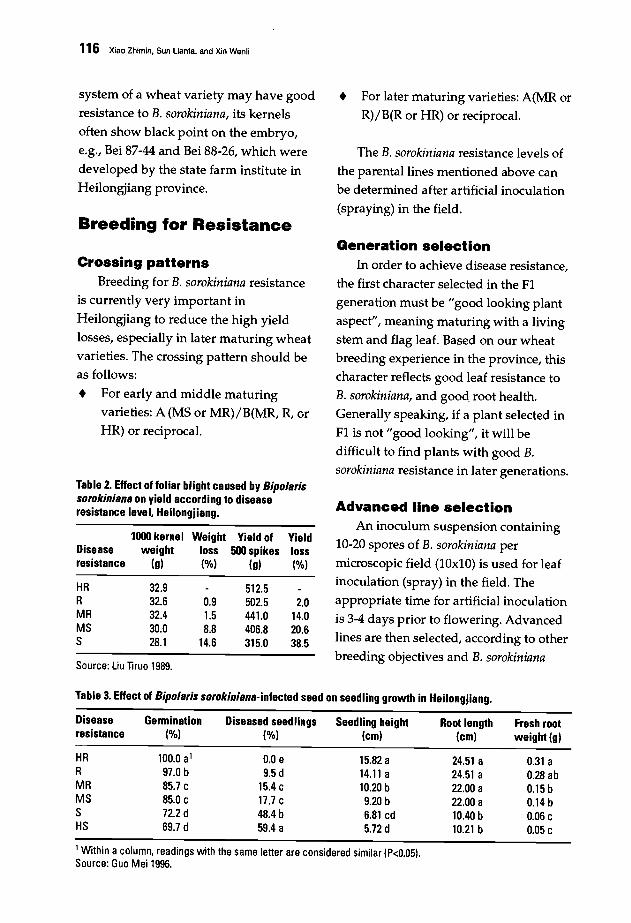
116 Xiao Zhlmin. Sun Lian'a, and Xin Wenli
system of a wheat variety may have good
resistance to B. sorokiniana, its kernels
often show black point on the embryo,
e.g., Bei 87-44 and Bei 88-26, which were
developed by the state farm institute in
Heilongjiang province.
Breeding for Resistance
Crossing patternsBreeding for B. sorokiniana resistance
is currently very important in
Heilongjiang to reduce the high yield
losses, especially in later maturing wheat
varieties. The crossing pattern should be
as follows:
• For early and middle maturingvarieties: A (MS or MR)/B(MR, R, or
HR) or reciprocal.
• For later maturing varieties: A(MR or
R)/B(R or HR) or reciprocal.
The B. sorokiniana resistance levels of
the parental lines mentioned above can
be determined after artificial inoculation
(spraying) in the field.
Generation selectionIn order to achieve disease resistance,
the first character selected in the FI
generation must be "good looking plant
aspect", meaning maturing with a living
stem and flag leaf. Based on our wheat
breeding experience in the province, this
character reflects good leaf resistance to
B. sorokiniana, and good root health.
Generally speaking, if a plant selected in
FI is not "good looking", it will be
difficult to find plants with good B.sorokiniana resistance in later generations.
Source: Liu Iiruo 1989.
Table 2. Effect of foliar blight caused by Bipo/arissorokiniana on yield according to diseaseresistance level. Heilongjiang.
1000 kernel Weight Yield of Yieldweight loss 500 spikes loss
(g) (%) (g) (%)Diseaseresistance
HRRMRMSS
32.932.632.430.028.1
0.91.58.8
14.6
512.5502.5441.0406.8315.0
2.014.020.638.5
Advanced line selectionAn inoculum suspension containing
10-20 spores of B. sorokiniana per
microscopic field (IOxIO) is used for leaf
inoculation (spray) in the field. The
appropriate time for artificial inoculation
is 3-4 days prior to flowering. Advanced
lines are then selected, according to other
breeding objectives and B. sorokiniana
Table 3. Effect of Bipo/aris sorokiniana-infected seed on seedling growth in Heilongjiang.
Disease Germination Diseased seedlings Seedling height Root length Fresh rootresistance (%) (%) (cm) (cm) weight (g)
HR 100.0 a1 0.0 e 15.82 a 24.51 a 0.31 aR 97.0 b 9.5 d 14.11 a 24.51 a 0.28 abMR 85.7 c 15.4 c 10.20 b 22.00 a 0.15 bMS 85.0 c 17.7c 9.20 b 22.00 a 0.14 bS 72.2 d 48.4 b 6.81 cd 10.40 b 0.06 cHS 69.7 d 59.4 a 5.72d 10.21 b 0.05 c
1 Within acolumn, readings with the same letter are considered similar (P<O.051.Source: Guo Mei 1996.
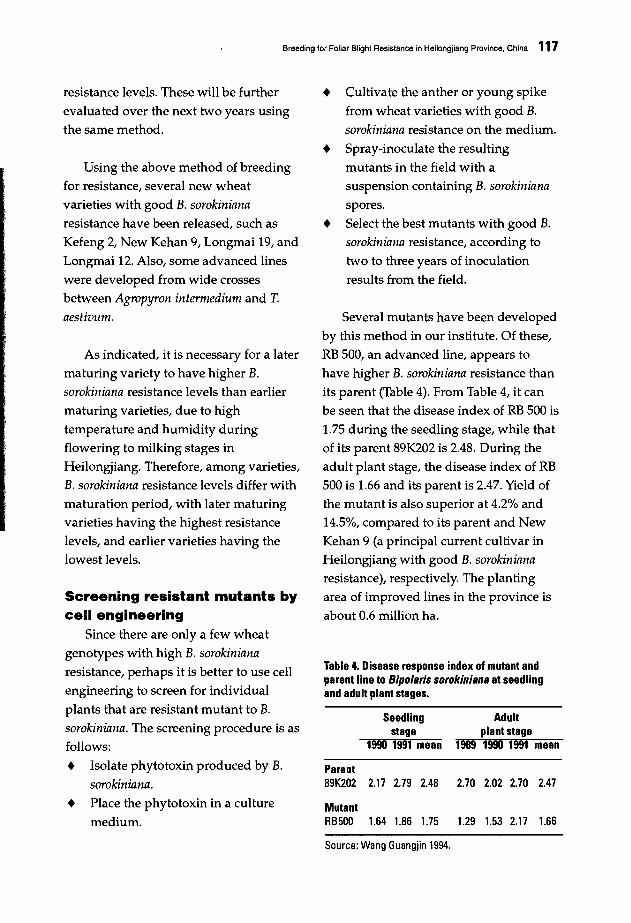
Breeding for Foliar Blight Resistance in Heilongjiang Province, China 117
MutantRB500 1.64 1.86 1.75 1.29 1.53 2.17 1.66
Table 4. Disease response index of mutant andparent line to Bipo/aris sorokiniana at seedlingand adult plant stages.
• Cultivate the anther or young spikefrom wheat varieties with good B.
sorokiniana resistance on the medium.
• Spray-inoculate the resultingmutants in the field with asuspension containing B. sorokinianaspores.
• Select the best mutants with good B.
sorokiniana resistance, according to
two to three years of inoculation
results from the field.
Several mutants have been developed
by this method in our institute. Of these,RB 500, an advanced line, appears to
have higher B. sorokiniana resistance thanits parent (Table 4). From Table 4, it canbe seen that the disease index of RB 500 is
1.75 during the seedling stage, while thatof its parent 89K202 is 2.48. During theadult plant stage, the disease index of RB
500 is 1.66 and its parent is 2.47. Yield ofthe mutant is also superior at 4.2% and14.5%, compared to its parent and NewKehan 9 (a principal current cultivar in
Heilongjiang with good B. sorokinianaresistance), respectively. The plantingarea of improved lines in the province is
about 0.6 million ha.
Adultplant stage
2.70 2.02 2.70 2.47
1989 1990 1991 mean
Seedlingstage
1990 1991 mean
Parent89K202 2.17 2.79 2.48
Screening resistant mutants bycell engineering
Since there are only a few wheat
genotypes with high B. sorokinianaresistance, perhaps it is better to use cell
engineering to screen for individual
plants that are resistant mutant to B.
sorokiniana. The screening procedure is as
follows:
• Isolate phytotoxin produced by B.
sorokiniana.• Place the phytotoxin in a culture
medium.
As indicated, it is necessary for a later
maturing variety to have higher B.
sorokiniana resistance levels than earlier
maturing varieties, due to hightemperature and humidity during
flowering to milking stages inHeilongjiang. Therefore, among varieties,B. sorokiniana resistance levels differ with
maturation period, with later maturingvarieties having the highest resistancelevels, and earlier varieties having the
lowest levels.
Using the above method of breedingfor resistance, several new wheat
varieties with good B. sorokinianaresistance have been released, such as
Kefeng 2, New Kehan 9, Longmai 19, and
Longmai 12. Also, some advanced lines
were developed from wide crossesbetween Agropyron intermedium and T.aestivum.
resistance levels. These will be further
evaluated over the next two years using
the same method.
Source: Wang Guangjin 1994.
118 Xiao Zhimln. Sun lIan!a. and Xin Wenli
Reference.
Gao Bida and Wu Yousan. 1991. A review ofthe studies of the phytotoxin producedby wheat root rot pathogen Bipolarissorokoniana. J Shenyang Agri Univ22(2):158-163. (Chinese).
Guo Lijuan et al. 1991. Studies of screenresistant to mutant HeiminthosporillmsativlIm by cell engineering in wheat.Acta Genetica Sinica 18(6):500-507.
Guo MeL 1996. A preliminary study on theeffect of wheat kernel smudge onseedling growth. Heilongjiang Agric Sci106(4)~0-21. (Chinese).
Guo MeL 1996. A preliminary study on theuse of crude toxin for evaluation ofresistance in wheat varieties to wheatroot rot. Heilongjiang Agric Sci 104(2):2021. (Chinese).
Kang Shaolan, Dong Jingao, and ZhangTing. 1991. Studies on induction ofresistant mutants to wheat root rot II.The factors affecting the role ofHeiminthosporillm sativlIm pathotoxin andits bioassay. J Hebei Agric Univ 14 (2):5459. (Chinese).
Liu Tiruo et al. 1987. Study on epidemicrules of root rot in Heilongjiang. JHeilongjiang August First Land ReclamUniv 2:37-43. (Chinese).
Liu Tiruo, Zhang Yunhua et al. 1989. Studiesof damage level ofB. sorokiniana inwheat production in Heilongjiang. ModAgric9:4-5. (Chinese).
Sun Guangzu et al. 1991. Studies oninduction mutants to root rot on wheat. JHeilongjiang Agric Sci 78(6):1-3.(Chinese).
Sun Guangzu, Wang Guangjin, and TangFenglan, 1992. Study on the mechanismof wheat mutants resistance to Bipolarissorokiniana. Acta Agri Nucleatae Sinica6(4):193-1994. (Chinese).
Wang Guangjin. 1994. Cultivation ofresistant mutant, RB 500, to B.sorokiniana. J Heilongjiang Agric Sci94(4):40-41. (Chinese).
Zhang Jingchun et al. 1988. Preliminarystudies of root rot in Heilongjiangprovince. J Heilongjiang Agric Sci60(3):23-25. (Chinese).

119
Incidence and Current Management ofSpot Blotch of Wheat in China
Chang Naitao and Wu YousanShenyang Agricultural University, Shenyang, Liaoning Province, PR China
Abstract
In recent years, wheat production in China has been severely affected by soilborne disease,including spot blotch, caused by Bipolaris sorokiniana. The disease was first reported innorthern China in the 1950s and is now prevalent throughout the country. Variation in climaticand ecological conditions among wheat growing regions affects disease symptoms, host range ofB. sorokiniana, resistance levels in wheat cultivars, and, subsequently, wheat yield losses.Disease symptoms include spot blotch; seedling blight, common root rot, head blight, and blackpoint. Dfmore than 9,400 wheat cultivars evaluated, 8% showed high spot blotch resistance,21 % showed intermediate resistance, and 69% showed low resistance. During growth of thewheat plant, spot blotch resistance levels were noted to change, with flowering and grain fillingstages being the most critical. To control spot blotch, it is important to follow an integratedmanagement approach, which combines resistant cultivars, crop rotation, crop managementpractices, and chemical control. To date, no tolerant or highly resistant cultivars have beenfound. Wheat rotation with non-gramineae crops for three years were shown to reduce spotblotch occurrence. Disease severity was lower on early sown than late sown wheat. Spot blotchcontrol levels ofhigher than 60% were achieved by fungicides triadimefon, triadimenol, anddiconazole when applied to seed. Triadimefon, applied to foliage, achieved an effective rate ofprotection ofabout 60%.
In China, wheat ranks second only torice in cultivated area. In recent years,
with the change in climate and croppingsystem, severe damage has been caused
by soilborne diseases of wheat includingtake-all (Gaeumannomyces graminis), sharp
eye spot and rhizoctonia root rot(Rhizoctonia spp.), fusarium root rot
(Fusarium spp.), common root rot (CRR),
and spot blotch (Bipolaris sorokiniana).These fungi may infect wheat plants and
cause wheat production losses depending
on the climatic and ecological conditions
in each wheat growing area (Table 1). In
this paper, the incidence and
management of wheat spot blotch are
summarized and discussed.
Spot Blotch Distributionand Damage
Wheat spot blotch is caused by B.
sorokiniana (syn. Helminthosporiumsativum, teleomorph Cochliobolus sativus).In China in the 1950s, rust resistant wheatcultivars were grown on a large scale and
replaced many landraces. Following this,
Huang Guichao et al. (1957), Wu Yousanet al. (1957), and Lu Shiyi et al. (1957)reported the occurrence of
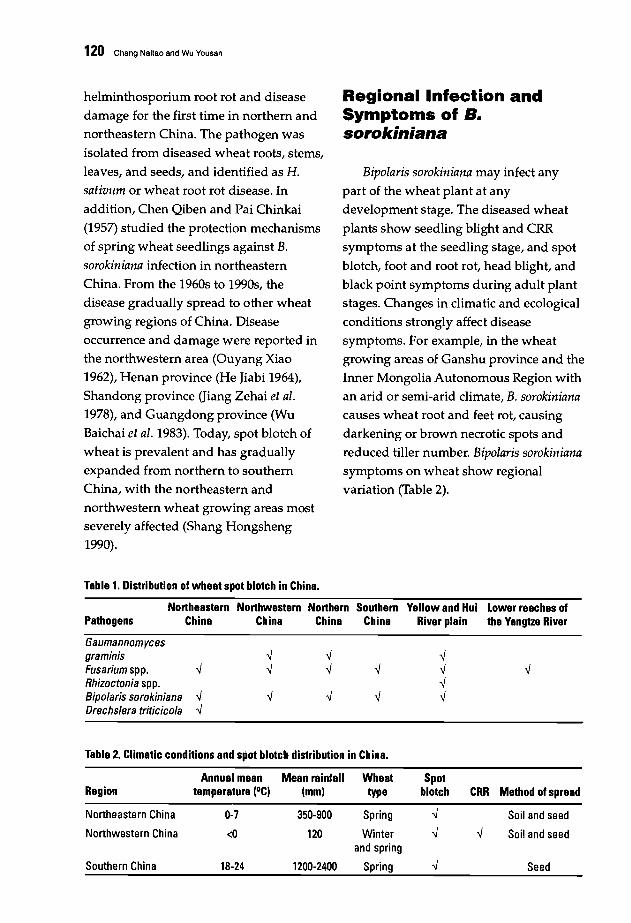
120 Chang Naitao and Wu Yousan
helminthosporium root rot and disease
damage for the first time in northern and
northeastern China. The pathogen was
isolated from diseased wheat roots, stems,
leaves, and seeds, and identified as H.sativum or wheat root rot disease. In
addition, Chen Qiben and Pai Chinkai
(1957) studied the protection mechanisms
of spring wheat seedlings against B.
sorokiniana infection in northeastern
China. From the 1960s to 1990s, the
disease gradually spread to other wheat
growing regions of China. Disease
occurrence and damage were reported in
the northwestern area (Ouyang Xiao
1962), Henan province (He Jiabi 1964),
Shandong province (Jiang Zehai et ai.1978), and Guangdong province (Wu
Baichai et ai. 1983). Today, spot blotch of
wheat is prevalent and has gradually
expanded from northern to southern
China, with the northeastern and
northwestern wheat growing areas most
severely affected (Shang Hongsheng
1990).
Table 1. Distribution of wheat spot blotch in China.
Regional Infection andSymptoms of B.sorokiniana
Bipoiaris sorokiniana may infect any
part of the wheat plant at any
development stage. The diseased wheat
plants show seedling blight and CRR
symptoms at the seedling stage, and spot
blotch, foot and root rot, head blight, and
black point symptoms during adult plant
stages. Changes in climatic and ecological
conditions strongly affect disease
symptoms. For example, in the wheat
growing areas of Ganshu province and the
Inner Mongolia Autonomous Region with
an arid or semi-arid climate, B. sorokinianacauses wheat root and feet rot, causing
darkening or brown necrotic spots and
reduced tiller number. Bipoiaris sorokinianasymptoms on wheat show regional
variation (Table 2).
Northeastern Northwestern NorthernPathogens China China China
Southern Yellow and Hui Lower reaches ofChina River plain the Yangtze River
Gaumannomycesgraminis -.J -.J -.JFusarium spp. -.J -.J -.J -.J -.JRhizoctonia spp. -.JBipolaris sorokiniana -.J -.J -.J -.J -.JDrechslera triticicola -.J
Table 2. Climatic conditions and spot blotch distribution in China.
Annual mean Mean rainfall Wheat SpotRegion temperature (OCI (mml type blotch CRR Method of spread
Northeastern China 0-7 350-900 Spring -.J Soil and seed
Northwestern China <0 120 Winter -.J -.J Soil and seedand spring
Southern China 18-24 1200-2400 Spring -.J Seed

Incidence and Current Management of Spot Blotch of Wheat in China 121
Northeastern spring wheatgrowing region
In this region, the spring wheat
growiDg area includes Liaoning, Hling,
and Heilongjiang provinces. Wheat spot
blotch occurs annually, sometimes
expressed as seedling blight, CRR, head
blight, and black point (Huang Guicao etal. 1957; Wu Yousan et al. 1957; Chen
Hongweng et al. 1982; Liu tiruo et al. 1987;Zhang Jingchun et al. 1988). Wheat yield
losses caused by spot blotch are due to a
decrease in spikelet number per tiller and
in 1000-grain weight. Yield loss has
commonly been 20 and 30% or above 75%.
Northwestern spring andwinter wheat growing region
This vast area with a dry climate
includes Shanxi, Qinghai, and Ganshu
provinces, and the Ningxia Hui and
Xinjing Uygur Nationality Autonomous
Regions.
In the winter wheat growing area,
wheat CRR is caused by B. sorokinianacombined with Fusarium spp.,
Gaeumannomyces graminis, and Rhizoctoniasolani. Common root rot was a major
disease in the area in the 1970s, causing
root and foot rot and reduced tiller
number. Yield loss due to CRR ranges
between 10 and 80% (Ouyang Xiao 1962;
Li Qiangkuen et al. 1987; Ma Yu et al.1987). With the change in wheat cultivars
and crop management practices since the
1980s, helminthosporium spot blotch and
fusarium leaf blight have become severe
in local wheat growing areas, and CRR
severity has declined. In the spring wheat
growing areas, two important diseases are
spot blotch and CRR.
Yellow and Huai River plainwheat growing region
This region includes most parts of
Shandong and Henan provinces. Here, B.
sorokiniana infects wheat and causes
seedling blight, spot blotch, head blight,
and black point. Spot blotch occurs
mainly on summer sown wheat, and
yield loss has been above 30% (He Jiabi
1964; Ma Qixiang et al. 1987; Jiang Zhehai
et al. 1978).
Southern China wheatgrowing region
In Guangdong Province, the cropping
pattern is wheat-rice-rice. Bipolarissorokiniana causes spot blotch or black
point late in the growing season.
Conidiospores of B. sorokiniana are not
able to survive for more than 80 days in
the soil. The primary infection of B.sorokiniana occurs only by seedborne
pathogens (Wu Baichai et al. 1983).
He/minfhosporium Speciesand Pathogenicity in China
In China, 51 species of
Helminthosporium have been recorded
(Dai Fanglian 1979), and among them 22
can infect Gramineae (Jiang Guangzheng
1957). Reportedly, B. sorokiniana can be
divided into HI and Hz culture forms (Pai
Chinkai et al. 1982), according to the
appearance of the culture and
conidiospore morphology on PDA
medium. The HI and Hz culture forms are
not stable, however, and do not show
differences in pathogenicity and lesion
type in the field. In addition, another
species, Dreschsiera triticicoIa, with weaker
pathogenicity, was recorded (Pai Chinkai
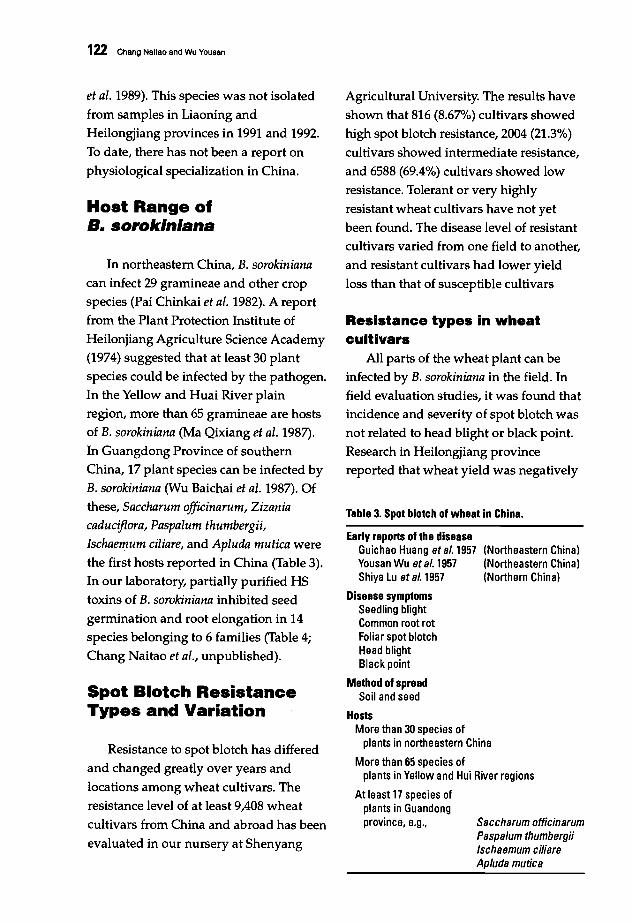
Table 3. Spot blotch of wheat in China.
(Northeastern China)(Northeastern China)(Northern China)
Saccharum officinarumPaspalum thumbergiiIschaamum ciliareApluda mutica
122 Chang Naitao and Wu Yousan
et al. 1989). This species was not isolated
from samples in Liaoning and
Heilongjiang provinces in 1991 and 1992.
To date, there has not been a report on
physiological specialization in China.
Host Range ofB. sorokiniana
In northeastern China, B. sorokinianacan infect 29 gramineae and other crop
species (Pai Chinkai et al. 1982). A report
from the Plant Protection Institute of
Heilonjiang Agriculture Science Academy
(1974) suggested that at least 30 plant
species could be infected by the pathogen.
In the Yellow and Huai River plain
region, more than 65 gramineae are hosts
of B. sorokiniana (Ma Qixiang et al. 1987).
In Guangdong Province of southern
China, 17 plant species can be infected by
B. sorokiniana (Wu Baichai et al. 1987). Of
these, Saccharum officinarum, Zizaniacaduciflora, Paspalum thumbergii,Ischaemum ciliare, and Apluda mutica were
the first hosts reported in China (Table 3).
In our laboratory, partially purified HS
toxins of B. sorokiniana inhibited seed
germination and root elongation in 14
species belonging to 6 families (Table 4;
Chang Naitao et al., unpublished).
Spot Blotch ResistanceTypes and Variation
Resistance to spot blotch has differed
and changed greatly over years and
locations among wheat cultivars. The
resistance level of at least 9,408 wheat
cultivars from China and abroad has been
evaluated in our nursery at Shenyang
Agricultural University. The results have
shown that 816 (8.67%) cultivars showed
high spot blotch resistance, 2004 (21.3%)
cultivars showed intermediate resistance,
and 6588 (69.4%) cultivars showed low
resistance. Tolerant or very highly
resistant wheat cultivars have not yet
been found. The disease level of resistant
cultivars varied from one field to another,
and resistant cultivars had lower yield
loss than that of susceptible cultivars
Resistance types In wheatcultlvars
All parts of the wheat plant can be
infected by B. sorokiniana in the field. In
field evaluation studies, it was found that
incidence and severity of spot blotch was
not related to head blight or black point.
Research in Heilongjiang province
reported that wheat yield was negatively
Early reports of the diseaseGuichao Huang at al. 1957Yousan Wu at al. 1957Shiya Lu at al. 1957
Disease symptomsSeedling blightCommon root rotFoliar spot blotchHead blightBlack point
Method of spreadSoil and seed
HostsMore than 30 species of
plants in northeastern China
More than 65 species ofplants in Yellow and Hui River regions
At least 17 species ofplants in Guandongprovince, e.g.,
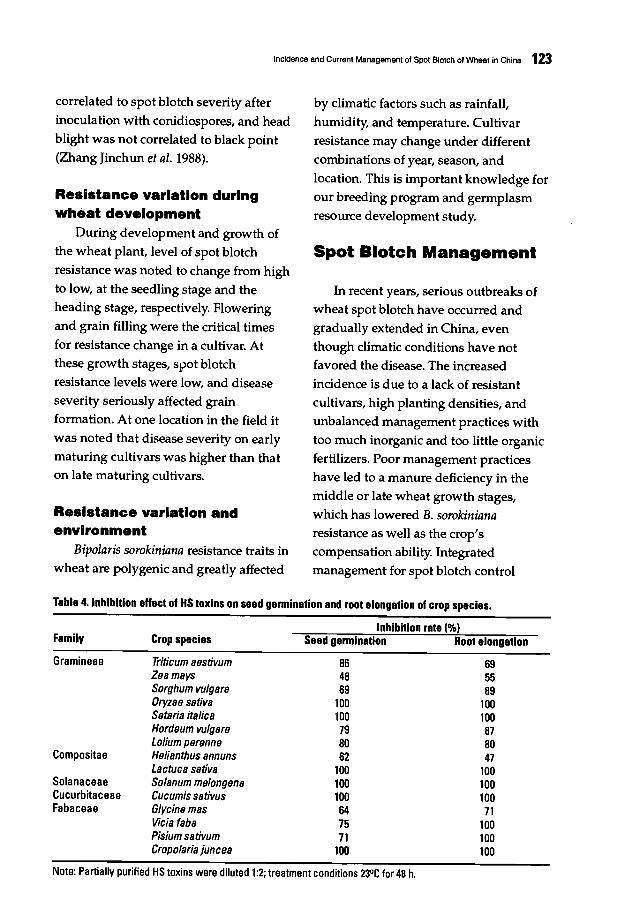
Incidence and Current Management of Spot Blolch of Wheat in China 123
correlated to spot blotch severity after
inoculation with conidiospores, and head
blight was not correlated to black point
(Zhang Jinchun et al. 1988).
Resistance variation duringwheat development
During development and growth ofthe wheat plant, level of spot blotch
resistance was noted to change from high
to low, at the seedling stage and theheading stage, respectively. Flowering
and grain filling were the critical times
for resistance change in a cultivar. Atthese growth stages, spot blotchresistance levels were low, and disease
severity seriously affected grainformation. At one location in the field itwas noted that disease severity on early
maturing cultivars was higher than thaton late maturing cultivars.
Resistance variation andenvironment
Bipolaris sorokiniana resistance traits inwheat are polygenic and greatly affected
by climatic factors such as rainfall,
humidity, and temperature. Cultivar
resistance may change under different
combinations of year, season, and
location. This is important knowledge for
our breeding program and germplasmresource development study.
Spot Blotch Management
In recent years, serious outbreaks of
wheat spot blotch have occurred and
gradually extended in China, eventhough climatic conditions have notfavored the disease. The increased
incidence is due to a lack of resistant
cultivars, high planting densities, andunbalanced management practices withtoo much inorganic and too little organic
fertilizers. Poor management practiceshave led to a manure deficiency in themiddle or late wheat growth stages,
which has lowered B. sorokinianaresistance as well as the crop'scompensation ability. Integrated
management for spot blotch control
Table 4. Inhibition effect of HS toxins on seed germination and root elongation of crop species.
Family Crop speciesInhibition rate (Ofo)
Seed germination Root elongation
Gramineae
Compositae
SolanaceaeCucurbitaceaeFabaceae
Triticum aestivumZeamaysSorghum vulgareOryzae sativaSetaria italicaHordeum vulgareLolium perenneHelianthus annunsLactuca sativaSolanum melongenaCucumis sativusGlycine masVicia tabaPisium sativumCropolaria juncea
864869
100100798062
100100100647571
100
695589
100100878047
10010010071
100100100
Note: Partially purified HS toxins were diluted 1:2; treatment conditions 23°C for 48 h.

124 Chang Naitao and Wu Yousan
combines resistant cultivars, crop
rotation, crop management practices, and
chemical control. Individually, none of
these measures provide efficient disease
control; hence a combined approach is
crucial. Practical spot blotch control
measures are listed in Table 5.
Resistant cultivarsBreeding for resistant cultivars is the
main disease management measure from
a sustainable agriculture perspective. The
leading cultivars in each wheat growing
region display different levels of spot
blotch resistance, Le., moderate
resistance, moderate susceptibility, and
susceptibility. Wheat cultivars with stable
resistance traits selected in China include
Zhongsan No.6, Dabaimai, Xiumai No.2,
and Xibeizhan No.5 (Wang Jianxiong1990).
Crop rotationIn areas of disease epidemics, wheat
rotation with non-gramineae crops for
three years could reduce spot blotch
occurrence. In Guangdong province, for
Table 5. Spot blotch control methods.
1. Resistant and tolerant wheat varieties.2. Rotation with non-gramineous crops for three
years.3. Crop management
Adjust sowing timeManure and water managementSowing
4. Chemical controlSeed treatment:
TriadimefonTriadimenolDiniconazole
Foliar treatment of adult plantTriadimefonCarboxinMancozebThiophanate-methylDiniconazole
example, the local crop sequence is
wheat-rice-rice. Conidiospores of B.
sorokiniana were observed to survive in
the soil for only 80 days and thus could
not act as the primary infection source;
therefore, disease was caused only by
seedborne pathogens.
Crop managementIn the northeastern and northwestern
wheat growing areas, improved crop
management, such as changes in sowing
time, have contributed to a reduction in
disease severity. In the spring growing
area of Liaoning, early sown wheat (early
to middle March) grows well, with an
increased tiller number and lower disease
severity. On other hand, late sown wheat
(late March-early April) is easily infected
by B. sorokiniana and showed a higher
disease severity and a yield loss of 7-12%
(Chang Naitao et al., unpublished). Good
crop management practices act to reduce
disease severity.
Chemical controlSeed treatment-Triadimefon,
triadimenol, and diniconazole were used
to treat seed against seedling blight and
CRR, as well as wheat smut, seedling
rust, and powdery mildew. Triadimefon
and triadimenol were used in the
northwestern area and the effective rate
of control was above 60% (Ma Yu et ai.1987). Diniconazole was found to achieve
better control than triadimefon in our
study (Chang Naitao et al., unpublished).
Foliar treatment-Triadimefon,
carboxin, mancozeb, and thiophanate
methyl were used for foliar treatment and
sprayed at flowering to reduce disease
Incidence and Current Management of Spot Blotch of Wheat in China 125
rate. Triadimefon was sprayed at
elongation or flowering stages. The
disease severity percentage at the milk
stage was reduced to 30-50% and the
effective rate of protection was about
60%, compared to the control (Chang
Naitao et al., unpublished).
References
Chen Hongweng, Yu Guanghua, BaiRuizhen, Zhu Xiaozheng, ZhangJinchun, and Zhu Xiuting. 1982.Evaluating resistant germplasms towheat root rot disease and the effect ofthe disease on wheat concerned traits.Heilongjiang Agric Sci 5:31-33.
Chen Qiben, and Pai Chinkai. 1957. Theeffect of root rot disease on wheatseedling. Northeastern Agric SciCommun 86-89.
Dai Fanglan (ed.). 1979. Glossary of Fungiin China, pp. 974-980. Beijing, China:China Science Press.
He Jiabi. 1964. Occurrence of wheat root rotdisease and its value to control. PlantProt 2(3):112-114.
Huan Guicao, Li Peshen, Gu Cifang, andChang Shuzhi. 1957. Initial report onwheat root rot disease. NortheasternAgric Sci Commun 1:100-108.
Jiang Guangzheng. 1957. Graminicolousspecies of Helminthosporium fromChina. Acta Phytopathologica Sinica5(1):21-37.
Jiang Zhehai, Xu Zuoting, and Wu Xianci.1978. Occurrence report on wheat rootrot disease in Maoceng area in 1978.Shandong Agric Sci Technol 4:30-33
Li Qiankun, Li Yazhe, 1987. The occurrencereason study on wheat root rot disease inHexi region. Ganshu Agric Sci Technol(6):16-17.
Liu Tiruo, and Zheng Lianzhi. 1987.Occurrence law study on spring wheatroot rot disease in northeastern China. JHeilongjinag August First Land ReclamUniv.2:37-73.
Lu Shiyi, Fan Guifang, Yang Zhuoming,Zhou Jiaping, and Shi Guangzhang.1957. Wheat root rot disease in northernChina. Phytopathol Knowledge, pp. 1923.
Ma Qixiang, and He Jiabi. 1987. Onbiological study of a wheat leaf spotp(athogen Bipolaris sorokiniana. ActaPhytopathologica Sinica 17(1):59-64.
Ma Yu, and Liao Yonghong. 1987. Primarychemical control study on wheat root rotdiseases. Ganshu Agric Sci Technol(6):24-25.
Ouyang Xiao. 1962. Wheat root rot diseasein Chaidamu basin. PhytopatholKnowledge 1(2):123.
Pai Chinkai, and Chun Qiben.1982. Studieson control of root rot caused by Bipolarissorokiniana (Sacc. in. Sorok.) Shoem. ofspring wheat in northeastern China. ActaPhytophylacica Sinica 9(4):251-256.
Pai Chinkai, Zh;mg Jingchun, and ZhuXiuting. 1989. Anew species ofDrechslera. Bull Bot Res 9(1):59-60.
Plant Protection Institute of HeilongjiangAgricultural Science Academy. 1974.Study on wheat root rot disease. AgricSciCommun.
Shang Hongsheng. 1990. Integratedmanagement of wheat pests. In: LiGuangbo (ed.), pp. 282-285. Beijing,China: China Agricultural Science andTechnology Press.
Wang Jianxiong. 1990. Leaf spot (Bipolarissorokiniana) resistance identification forthe wheat germplasm resources in Chinafrom 1983 to 1989. J Shenyang AgricUniv 21 :26-28.
Wu Baichai, and Le Yugan. 1983. Aninvestigation on the sources of primaryinoculum of wheat CRR and acomparison of methods of countingcondia in soil in Guangdong J SouthChina Agric Coli 4(1):88-96.
Wu Yousan, Zhu Youngang, Wang Huanyu,Li Wannian, and Zhang Guocun. 1957.Investigation of wheat diseaseoccurrence in North eastern China in1956 (Summary). PhytopatholKnowledge, pp. 24-26.
Zhang Jingchun, Zhu Xiuting, and LiuYingxuan. 1988. Primary study on wheatroot rot disease. Heilongjiang Agric Sci3:25-27.
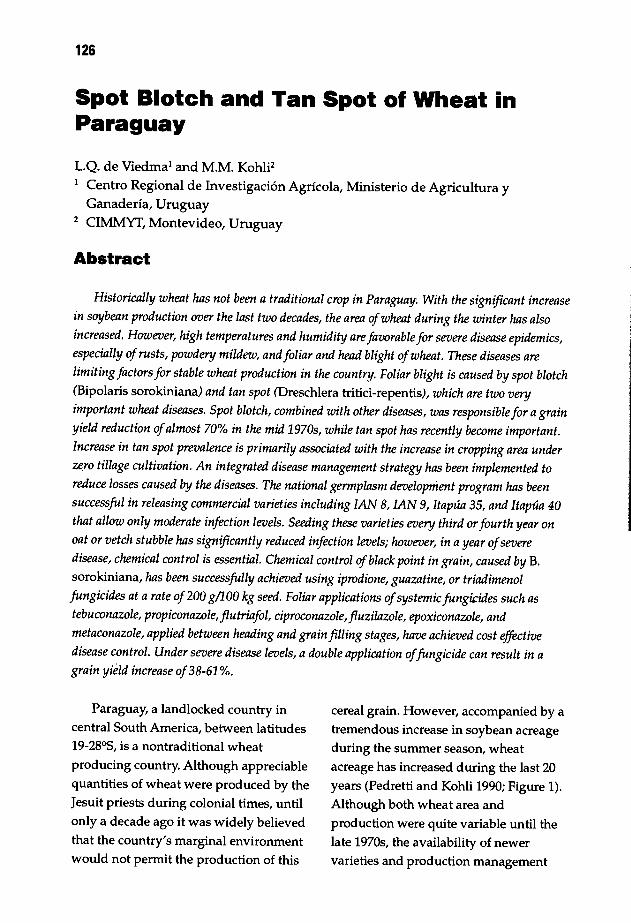
126
Spot Blotch and Tan Spot of Wheat inParaguay
L.Q. de Viedma1 and M.M. KohlF1 Centro Regional de Investigaci6n Agricola, Ministerio de Agricultura y
Ganaderia, Uruguay2 CIMMYT, Montevideo, Uruguay
Abstract
Historically wheat has not been a traditional crop in Paraguay: With the significant increasein soybean production over the last two decades, the area ofwheat during the winter has alsoincreased. However, high temperatures and humidity are favorable for severe disease epidemics,especially ofrusts, powdery mildew, and foliar and head blight ofwheat. These diseases arelimiting factors for stable wheat production in the country. Foliar blight is caused by spot blotch(Bipolaris sorokiniana) and tan spot (Dreschlera tritici-repentis), which are two veryimportant wheat diseases. Spot blotch, combined with other diseases, was responsible for agrainyield reduction ofalmost 70% in the mid 1970s, while tan spot has recently become important.Increase in tan spot prevalence is primarily associated with the increase in cropping area underzero tillage cultivation. An integrated disease management strategy has been implemented toreduce losses caused by the diseases. The national germplasm development program has beensuccessful in releasing commercial varieties including IAN 8, IAN 9, Itapua 35, and Itapua 40that allow only moderate infection levels. Seeding these varieties every third or fourth year onoat or vetch stubble has significantly reduced infection levels; however, in a year ofseveredisease, chemical control is essential. Chemical control ofblack point in grain, caused by B.sorokiniana, has been successfully achieved using iprodione, guazatine, or triadimenolfungicides at a rate of200 g/l 00 kg seed. Foliar applications ofsystemic fung4:ides such astebuconazole, propiconazole, jlutriafol, ciproconazole, jluzilazole, epoxiconazole, andmetaconazole, applied between heading and grain filling stages, have achieved cost effectivedisease control. Under severe disease levels, a double application offungicide can result in agrain yidd increase of38-61 %.
Paraguay, a landlocked country in
central South America, between latitudes19-2805, is a nontraditional wheat
producing country. Although appreciablequantities of wheat were produced by the
Jesuit priests during colonial times, until
only a decade ago it was widely believed
that the country's marginal environmentwould not permit the production of this
cereal grain. However, accompanied by a
tremendous increase in soybean acreage
during the summer season, wheat
acreage has increased during the last 20years (Pedretti and Kohli 1990; Figure 1).
Although both wheat area and
production were quite variable until the
late 1970s, the availability of newer
varieties and production management

Spot Blotch and Tan Spot of Wheat In Paraguay 127
technology has allowed the average yield
to double, reaching almost 2.1 t ha-1.
Wheat in Paraguay is concentrated in
the southeastern part of the country,
especially on the banks of the Parana
River. Two provinces, Alto Parana and
Itapua, with fertile soils and mild
temperatures, account for 43 and 40% of
the national wheat area, respectively.
Unstable climatic conditions of the
tropical and subtropical humid
environment during crop growth
seriously limit wheat production. Due to
irregular precipitation, climatic variation
and instability have more impact than
temperature variation during the crop
cycle (Figures 2a and b). Notably wet
years, such as 1972/ 1975/ and 1983/
represent years of severe leaf blight
caused by spot blotch and bacterial leaf
blight. High precipitation during the wet
years can occur during the vegetative
period of the crop Gune/July), as in 1972
and 1983/ or during the reproductive
period (August/September), as in 1972
and in 1996. During the years that grain
filling and maturity occur under wet
conditions, such as 1996/ serious pre
harvest sprouting causes further losses in
grain quality.
Figure 1. Wheat area and production. and averagegrain yield in Paraguay. 1967-1996.
Wheat diseases, in general, are one of
the most important factors limiting yield
in Paraguay. Losses caused by the disease
complex in a wet year can reach as high
as 70%/ as in 1972 (pedretti and Viedma
1988; Viedma 1989). Apart from the
predominance of foliar diseases caused
by Helminthosporium spp. and
Xanthomonas campestris pv undulosaduring wet and hot years, rusts/
especially leaf rust, remain very
important diseases (Viedma and Bozzano
1000
500
o
2000
1500
o.....u.a..__L4.J....."'-
1967m 72/76 77/81 82/86 87/90 91/95Year
200,000
100,000
Total area andproduction (hal Yield (kg ha-I )400,000.---------- 2500
_Total area~Production
300,000 o()o Yield
blal
'.'"
_Average•••. 1972••···1983-1996
200
400
100
500
300
Temperature re)24...---------------,
-Average22 -···1972
·····198320 -1996
18
16
14
12
o 10 +--...,..--...,..----r---,----r---'t
May Jun Jul Aug Sep Oct Nov May Jun Jul Aug Sep Oct Nov~~ M~
Figure 2. Comparison of al 2O·year average precipitation and bl 2O-year average temperature over threecritical years.
Precipitation (mml600.-------------,

128 L.Q. de Viedma and M.M. Kohli
1986; Viedma and Delgado 1989). The
prevalence of powdery mildew and
fusarium head blight have also increased
during the past few years. The
importance of these diseases in Paraguay
during 1972-1996 is summarized in
Table 1.
It should be noted that tan spot was
observed in Paraguay from 1986 when
zero tillage cultivation started to increase.
Since then, it has become more important
(Viedma and Oniki 1986).
Given the importance of the diseases
in the country, the wheat breeding
program has successfully released new
cultivars that are moderately to highly
rust resistant and demonstrate lower
susceptibility levels to foliar blights.
Disease reactions of the most important
commercial varieties are presented in
Table 2.
Foliar Blights
The most important foliar blights
frequently causing damage to wheat are
spot blotch, caused by Bipolaris sorokiniana(Sacc. in Sorok.) Shoem. (syn.
Helminthosporium sativum Pamm., King &
Bakke) (teleomorph Cochliobolus sativusIto & Kufib. Drechs ex Dastur) and tan
spot caused by Pyrenophora tritici-repentis(Died.) Drechs and its anamorph
Drechslera tritici-repentis (Died.) Shoem.
(Hosford 1971; Krupinsky 1983).
The spot blotch fungus is not only
important in Paraguay, but also in the
Table 1. Wheat diseases prevalent in Paraguay and their importance, 1972-96.
YearDisease 1972-75 1976-79 1980-85 1986-89 1990-95 1996
Leaf rust Xl X XX XX XX XStem rust X X XPowdery mildew X X X XX XSpot blotch XX X XX XX XTan spot X XX XXSeptoria glume blotch X X XFusarium head blight XX XX X XXBacterial leaf stripe XX XX X X
1 X=Important, XX =Very important.
Table 2. Disease reactions of important commercial wheat varieties in Paraguay.
Disease lan-7 Cordillera 3 Cordillera 4 lan-8 Itapua 35 Itapua 40 lan9
Leaf rust MSI S R R R MS MRStem rust MS R R R MS R RPowdery mildew MR MS S S R MS MSSpot blotch S S MS MS MR MS MRFusarium head blight MR S S MS MS S SBacterial leaf stripe S S MS MS MS MS MSTan spot MS MR MS MS MR MS MR
1 R=Resistant, MR =Moderately resistant, MS =Moderately susceptible, S=Susceptible.

lowlands of Bolivia and Brazil (Mehta
1987; Mehta and Gaudencio 1991), where
it causes serious crop losses during warm
and humid winters.
Spot blotch was the most important
disease during the initial phases of wheat
cultivation in Paraguay during 1967-1972,
when it caused serious production losses.
During 1972, spot blotch and septoria
glume blotch (Stagonospora nodorum) were
the most important diseases on
commercial variety 214, causing severe
yield losses of approximately 70%(Pedretti 1990). Another spot blotch
epidemic, combined with fusarium head
blight, occurred in 1975, and, even though
it was as severe as that of 1972, yield
losses were less because commercial
variety Itapua 1 grown that year was
moderately resistant to both diseases.
Continuous spot blotch epidemics
between 1979-1983 were primarily
responsible for the reduction in wheat
sown area. In addition, frequent
precipitation during crop maturity causedserious black point in harvested grain,
thereby reducing industrial quality.
Although the fungus has been known
to cause foliar damage in the past
(Pedretti and Viedma 1988), incidence of
common root rot has significantly
increased during recent years.
Spot Blotch and Tan Spot of Wheat in Paraguay 129
reported in the states of Parana and Rio
Grande do SuI since 1982.
In Paraguay, tan spot importance has
significantly increased with the increase
in area under conservation tillage
practices such as zero tillage.
Approximately one-third of the 900,000
ha of soybean sown during 1995/96 was
under zero tillage. Wheat represents
approximately one-quarter of the area
sown to soybeans. Therefore, an increase
in the area of soybean under zero tillage
equates to an increase in the area of
wheat sown into soybean stubble using
conservation tillage practices.
The alarmingly high tan spot
incidence is primarily due to the
continual sowing of wheat into the
stubble of the previous year's wheat crop.
The fungus survives during the summer
on wheat stubble; its spores are protected
in pseudothecia, even during fallow
periods. The pseudothecial density of D.
tritici-repentis can reach as high as 9,000
pseudothecia m·2 under different tillage
management systems tested in Paraguay
(Table 3). Under local conditions, it takes
approximately 17 months for the stubble
residue to decompose, which guarantees
perpetuation of the fungus, as well as an
increase in the inoculum load, year after
year (Figure 3).
Table 3. Pseudothecial density of Dr8chsl8ratr;t;c;-r8p8nt;s under different soil managementsystems, CRIA, 1994-96.
On the other hand, tan spot has
recently predominated in the Southern
Cone of South America including
Argentina, Brazil, Chile, Paraguay, and
Uruguay (Kohli et al. 1992). In Brazil,
severe losses due to tan spot wereCrop residue (9 mo2)
Pseudothecia (m·2)
Zerotillage
240
9.000
Minimumtillage
170
6.120

130 L.Q. de Vledma and M.M. Kohli
The teleomorphic phase of P. tritid·repentis occurs on crop residue, and themajority of ascospores are released
during April-May (seeding time). Their
release coincides with lowertemperatures and rainy periods, which
provide excellent conditions for primary
infection very early in the crop cycle.
Disease Management
Genetic resistanceGenetic improvement of germplasm
conducted by the Directorate ofAgricultural Research (DIA) has achievedsignificant advances over the past
decade. The most important aspect of thiswas the establishment of a shuttle
breeding program in association with
CIMMYT, which allowed the possibilitiesof evaluating two generations a year andmultilocation testing. Specific germplasmdevelopment activities were alsoconducted, utilizing the locally adaptedand disease resistant parents. The
segregating populations were selectedunder heavy disease pressure at criticallocations. As a result, the newer varieties
released in the mid 1980s and early 1990s
%Survival100
80
60
40
20
o+--.--~-----,::::::::;::::~Nov 94 May 95 Sap 95 Dec 95 Mar 96 May 96
Evaluation
Figure 3. Survival of PyrenopholB tritici-Iepentis onwheat crop residue.
represent a combination of high yield
potential and adaptation with moderate
to high disease resistance levels.
Although the majority of advanced
lines in disease resistance breeding aredeveloped for rusts and powdery mildew
control, moderate progress has also been
achieved in breeding for resistance tofoliar blights (Kohli et aI. 1990). Table 2
shows the disease reactions of importantcommercial wheat varieties in Paraguay.
For the last several years, tan spotscreening of advanced lines and
germplasm has been conducted in fieldsunder zero tillage, and, considering thehigh level of humidity present during the
crop cycle, adequate screening levels are
being achieved. Regional germplasmdemonstrating lower tan spot infectionlevels over four years are presented inTable 4.
Cultural controlSince 1990, cultural control of foliar
blights has been tested at eRIA,
comparing crop rotation with wheatmonoculture under different tillage
practices. The results presented in Table 5
show that lower levels of common rootrot and tan spot infection are possible
under zero tillage cultivation if wheat is
sown every third or fourth year on oat or
vetch residue. This practice not onlyreduces infection levels, but also results in
higher wheat yields. As a result,
significant advances can be achieved by
introducing one or more break crops
during the winter cycle under zero tillage.

Spot Blotch and Tan Spot of Wheet in Paraguay 131
Table 4. Regional advanced lines demonstrating low tan spot infection levels under natural conditions in azero tillage field, 1992-96.
10 number
P91:2470P91:2465CEP8965CEP8966CEP89171PF9058PF9067PF90120E. PElON9088053C-91020CEP8818
Cross
LAJ2965/ PFEDLAJ2963/T00026CEPI4/CEP82113//BRI4CEPI4/CEP82113//BRI4MCR/CEPI3//BRI4CI1419/2*PF8233BR35/PF84386//AMI60/BRI4PF822522222/BR35//IA7998/PF8550au P-2278BON/YR70/3/F35.70//KAljBB/4/NACNDN69144//KAlBB/3/YACO "S"/4/VEE5 "S"BUTUI/BRI4//PF79790/CEP75203
Pedigree
A11678.4T-ON-2D-IT-IT-OTA11398.Tl-0N-lB-2T-IT-OTB31751-D-OZ-OA-3A-2A-900YB31751-D-OZ-OA-3A-2A-900YB31561-6-310Y-OZ-3A-3A-900YF26562-0R-OF-OF-2F-OFF30677-0F-l F-OR-3F-OFF30872-1 F-OR-l F-OR-l F-OR-2F-OR-OFMILAN "S"CM74553-2E-2ECM8536/4Y/OM/OY/2M/OYB30654-02-0A-3A-OA
Table 5. Severity of common root rot and tan spot of wheat under different tillage and crop rotationsystems, CRIA, 1995.
Crop rotationTIllagesystem
Infection indexCommon root rot' Tan spotz
Grein yield(kg ha")
Wheat monocultureWheat monocultureWheat monocultureWheat after oats(one winter without wheat)Wheat after oats and vetch(two winters without wheat)
CV(%) 9.02Fvalue 4.288
ZeroMinimumConventional
Zero
Zero
19.713.47.4
2.5
0.9
29.826.913.3
2.6
1.0
2452 bc2467 b2663 b
2782 ab
2937 a
1 Common root rot (Helminthosporium sativum) evaluation scale. 0-100.2 Pyrenophora tritici-repentis evaluation scale. 0·100.
Table 6. Chemical control of tan spot: effect of timing of application on grain yield.'
Yield increaseTIme of application! 1992 1993 1995growth stage (kg ha") (0/0) (kg ha") (%) (kg ha") (%)
Elongation 2523 bcd2 115 1838 cd 155 2238 a 102Flowering 2903 ab 133 2328 b 146 2267 a 103Elongation +flowering 3016 a 138 2695 b 161 2337 a 106Milk stage 2200 bcd 104 1665 cd 105 2205 a 101Check without application 2180 d 100 1595 d 100 2195 a 100CV(%) 9.5 11.5 8.7
Folicur at 500 cc ha-1 of commercial product.Value in the same column followed by different letters are significantly different at the 5% level by Tukey'smUltiple range test.
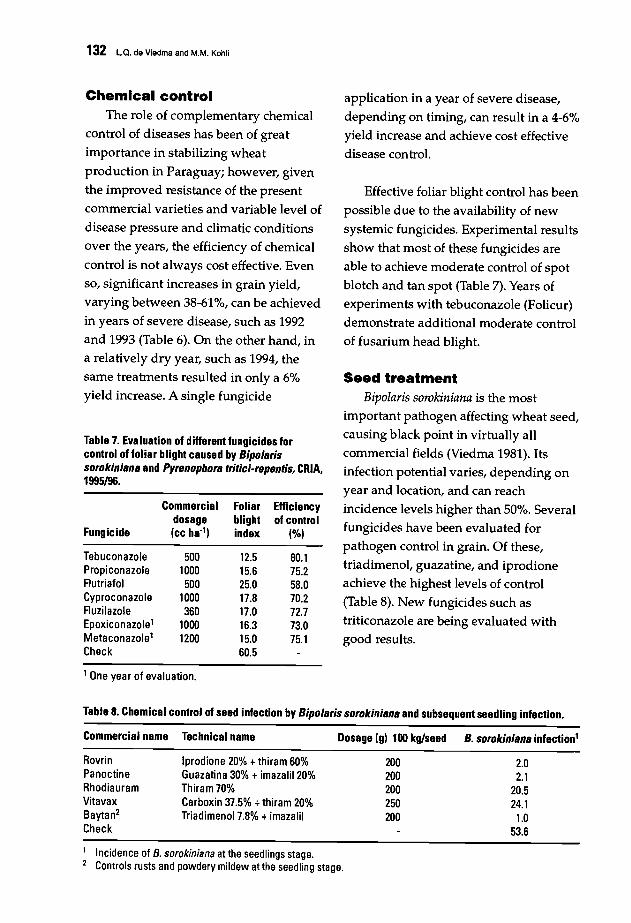
132 L.a. de Viedma and M.M. Kohli
Chemical controlThe role of complementary chemical
control of diseases has been of great
importance in stabilizing wheat
production in Paraguay; however, given
the improved resistance of the present
commercial varieties and variable level of
disease pressure and climatic conditions
over the years, the efficiency of chemical
control is not always cost effective. Even
so, significant increases in grain yield,
varying between 38-61%, can be achieved
in years of severe disease, such as 1992
and 1993 (Table 6). On the other hand, in
a relatively dry year, such as 1994, the
same treatments resulted in only a 6%
yield increase. A single fungicide
Table 7. Evaluation of different fungicides forcontrol of foliar blight caused by Bipo/arissorokiniana and Pyrenophora tritici-repentis, CRIA.1995/96.
Commercial Foliar Efficiencydosage blight of control
Fungicide (cc ha") index ("!o)
Tebuconazole 500 12.5 80.1Propiconazole 1000 15.6 75.2Flutriafol 500 25.0 58.0Cyproconazole 1000 17.8 70.2Fluzilazole 360 17.0 72.7Epoxiconazole1 1000 16.3 73.0Metaconazole1 1200 15.0 75.1Check 60.5
lOne year of evaluation.
application in a year of severe disease,
depending on timing, can result in a 4-6%
yield increase and achieve cost effective
disease control.
Effective foliar blight control has been
possible due to the availability of new
systemic fungicides. Experimental results
show that most of these fungicides are
able to achieve moderate control of spot
blotch and tan spot (Table 7). Years of
experiments with tebuconazole (Folicur)
demonstrate additional moderate control
of fusarium head blight.
Seed treatmentBipolaris sorokiniana is the most
important pathogen affecting wheat seed,
causing black point in virtually all
commercial fields (Viedma 1981). Its
infection potential varies, depending on
year and location, and can reach
incidence levels higher than 50%. Several
fungicides have been evaluated for
pathogen control in grain. Of these,
triadimenol, guazatine, and iprodione
achieve the highest levels of control
(Table 8). New fungicides such as
triticonazole are being evaluated with
good results.
Table 8. Chemical control of seed infection by Bipo/aris soroki"iana and subsequent seedling infection.
Commercial name
RovrinPanoctineRhodiauramVitavaxBaytan2
Check
Technical name
Iprodione 20% +thiram 60%Guazatina 30% +imazalil20%Thiram70%Carboxin 37.5% +thiram 20%TriadimenoI7.8% +imazalil
Dosage (g) 100 kg/seed
200200200250200
B. sorokiniana infection'
2.02.1
20.524.1
1.053.6
1 Incidence of 8. sorokiniana at the seedlings stage.2 Controls rusts and powdery mildew at the seedling stage.
References
Hosford, RM. 1971. A form of Pyrenophoratrichostoma pathogenic to wheat andother grasses. PhytopathoI61:28-32.
Kohli, M.M., Mann, C.E., and S. Rajaram.1990. Global status and recent progressin breeding wheat for the warmer areas.In: D.A. Saunders (ed.), Wheat for theNontraditional Warm Areas. AProceedings of the InternationalConference, pp. 96-112. Mexico, D.E:CIMMYT.
Kohli, M.M., Mehta, YR, and M.D.Ackermann. 1992. Spread of tan spot inthe Southern Cone region of SouthAmerica. In: L.J. Francl, J.M. Krupinsky,and M.P. McMullen (eds.), Advances inTan Spot Research. Proceedings of the2nd Tan Spot Meeting, pp. 1-9. Fargo,ND, USA: North Dakota AgriculturalExperimental Station.
Krupinsky, J.M. 1983. Observations on thehost range of isolates of P. trichostoma.Can J Plant Pathol 4:42-46.
Mehta, Y.R 1987. Interactions between spotblotch (c. sativus) and wheat cultivars.In: Wheat for the Nontraditional WarmAreas. A Proceedings of the InternationalConference, pp. 146-162. Mexico, D:E:CIMMYT.
Mehta, YR, and c.A. Gaudencio. 1991. Theeffect of tillage practices and croprotation on the epidemiology of somemajor wheat diseases. In: Wheat for theNontraditional Warm Areas. AProceedings of the InternationalConference, pp. 266-283. Mexico, D:E:CIMMYT.
Spot Blotch and Tan Spot of Wheat in Paraguay 133
Pedretti, R, and L. Viedma. 1988. Estrategiade la DIEAF-PARAGUAY para elMejoramiento para Resistencia aEnfermedades. In: Seminario sobreMejoramiento Genetico sobre Resistenciaa Enfermedades de Trigo. Passo Fundo,PR, Brasil: IICA/PROCISUR/BID.
Pedretti, R, and M.M. Kohli. 1990. Wheatproduction in Paraguay: trends, majorconstraints, and potential. In: Wheat forthe Nontraditional Warm Areas. AProceedings of the InternationalConference, pp. 84-95. Mexico, D.E:CIMMYT.
Viedma, L.Q. 1981. A survey of seed bornepathogens on different wheat samplesfrom Paraguay. Seed Pathology Institute.Copenhagen-Denmark: DANIDA.
Viedma, L.Q. 1989. Importancia ydistribucion de la fusariosis del trigo enel Paraguay. Taller sobre la Fusariosiosdel Trigo. Encarnacion, Paraguay:CIMMYT.
Viedma, L.Q., and Bozzano. 1986. Las Royasdel trigo en Paraguay. In: Dialogo XIII,Royas de Cerales de invierno, pp. 153164. PROCISUR
Viedma, L.Q., and H. Delgado. 1989..Importancia y distribucion de laSeptoriosis en el Paraguay. Taller sobreavances y metodologia de septoriosis detrigo. La Estanzuela, Uruguay: CIMMYT&CIAAB.
134
Research on Pyrenophora tritici-repentisTan Spot of Wheat in Uruguay
M. Diaz de Ackermann! and M.M. KohlF
1 INIA, La Estanzuela, Uruguay2 CIMMYT, Montevideo, Uruguay
Abstract
Tan spot ofwheat, first reported in Uruguay in 1982, did not become a major disease until1990/91 when high disease incidence was noted in the northwestern coastal region ofthecountry. During those years, identification ofgermplasm with superior disease resistance wasnot possible due to severe infection levels, although it was possible to distinguish betweensymptoms ofDrechslera tritici-repentis and ofSeptoria tritici. Almost all cultivars underevaluation were moderately to highly susceptible to tan spot. The perfect stage of thefungus wasfound on wheat stubble in 1993. Many of the numerous alternative disease hosts reported in theliterature are present in Uruguay; however, none have tested positively for tan spot. Theincrease in zero-tillage cultivation in the country has made it essential to develop and identifyhighly resistant cultivars. Local advanced breeding lines and introduced germplasm have beenscreened for tan spot resistance at key locations since 1990. Ofthese, Fink and other lines werefound to be resistant, but Vicam was found susceptible. Carifen 12 and Red Chief, sources of tanspot resistance elsewhere, were not adapted to local conditions. Newer germplasm from theregion and from CIMMYT, such as Milan, Cisne INIA, Coker62/BR14, LE2062/LE2096,LE2091/LE2089, E.Dor/Aepoglom, and Kvz//BB/Cha/3/Trm/4/TEMU36-78/5/0vacion, hasshown stable resistance over years. Recently, a set ofadvanced lines from CIMMYT selected forhigh rainfall conditions has been tested at the seedling stage. Given that disease incidence isrelated to the amount ofstubble present, four commercial cultivars (E. Cardenal, ProINTAQueguay, PI. Superior, and INIA Mirlo) were tested for disease development under zero tillage.Disease levels measured (as the area under the disease progress curve, AUDPC) weresignificantly higher (1363.98) on wheat stubble than on burned wheat stubble (907.34) and oatstubble (366.61). To date, no information on chemical control of tan spot has been locallydeveloped; fungicide for D. tritici-repentis control is applied according to recommendationsfrom Brazil.
Wheat is an important winter crop in
Uruguay, planted primarily in thewestern coastal region. The total wheat
sown area during the 1990s has varied
from around 110,000 to over 250,000 ha.
As a result of the expansion in areaseeded in 1996, production was over
600,000 t. Average yield during productiveyears has reached over 2500 kg ha-1
(Anonymous 1995a, 1997; Table 1).
Wheat diseases, in general, seriously
affect yield, especially during years with
wet spring periods. In the past, leaf and

Research on Pyrenophora tritic;,repentis Tan Spot of Wheat In Uruguay 135
stem rusts, septoria leaf blotch, and
fusarium head blight have been most
significant diseases; however, prevalence
of tan spot, caused by Pyrenophora triticirepentis, has recently increased in the
north of the country under zero tillage
conditions. At present, all commercial
cultivars are susceptible or moderately
susceptible to the disease, and infection
level is related more to weather
conditions than cultivar behavior (Diazde Ackermann 1992, 1996).
Tan spot infection was first reported
in 1982 (Luzzardi et al. 1985). Very high
disease incidence and severity levels
were recorded in 1990 in SaIto region and
in 1991 in Young. During these years, it
was difficult to identify germplasm with
Table 1. Wheet statistics, Uruguay, 1990-96.
Area Production YieldYear (ha) (t) (kg ha").
1990 224590 415716 18511991 116265 187535 16131992 148014 340912 23031993 213842 342575 16021994 189000 486864 25761995 167500 391300 23361996 250264 627496 2507
Source: Anonymous 1995a, 1997.
Table 2. Disease impact on wheat yield in Uruguay.
Yield Leaf HeadYear reduction (0/0) blotch' blight
1977 44 + ++1978 23 +1985 26 ++ +1986 24 +1990 4 +1991 19 ++1993 26 ++ +
1 Septoria tritici and Pyrenophora tritici-repentis;+Disease level moderate; ++ Disease level high;- Disease level low.
superior tan spot resistance because of the
high disease levels, yet it was possible to
recognize symptoms caused by the
conidial stage of P. tritici-repentis from
lesions caused by Septoria tritici (Diaz de
Ackermann 1992, 1996). The perfect stage
of the P. tritici-repentis fungus was found
on wheat stubble in 1993 (Stewart and
Diaz de Ackermann 1993).
Economic Impact of WheatDiseases in Uruguay
In a study conducted over 19 years
(1977-1995), a regression analysis
demonstrated that wheat production was
lower than expected during seven of
those years. During this time of reduced
wheat production, leaf blotch infection,
caused by Septoria and Pyrenophora, was
prevalent in six years, fusarium head
blight in four years, and leaf rust in only
two years (Table 2). The correlation
coefficient (r) between average yield ha-1
and severity of different diseases was
0.50,0.33, and 0.64 for leaf blights,
fusarium head blight, and leaf rust,
respectively (Diaz de Ackermann 1996).
Research Efforts
Pathogenic variabilityAs a part of her thesis work at North
Dakota State University, the first author
studied the pathogenic variability of four
isolates of P. tritici-repentis in the
laboratory (Diaz de Ackermann 1987).
Significant differences in growth patterns
among isolates were observed on potato
dextrose agar medium where strain PYD7
grew fastest, followed by PYR72,
1231CDA, and Pti2. Under culture, PYD7

136 M. Diaz de Ackermann and M.M. Kohli
and Pti2 developed dark green mycelia,
while PYR72 developed gray, and
1231CDA developed white mycelia.
Differences in sporulation were also
observed; PYD7 and Pti2 sporulated
abundantly in three days on V-8 medium
(14/10 h light/dark period), while PYR72
sporulated poorly, and 1231CDA did not
'sporulate at all. Growth, color, and
sporulation characteristics were not
related to virulence; all four isolates were
quite virulent.
Although pathogenic variability has
not been studied in Uruguay, its
occurrence is possible given the presence
of the perfect stage of the fungus as well
as abundant wild grass hosts. Among
alternative hosts cited in the literature,
Hordeum vulgare, Secale cereale, Avenasativa, Dactylis, Poa, and Lolium species are
present in the country; however, to date
only wheat (Triticum aestivum) has tested
positively for presence of the disease
(Costa Neto 1968; Krupinsky 1982, 1986,
1987). Alternative hosts, together with
seedborne inoculum (Schilder and
Bergstrom 1992), appear to have been
critical sources of inoculum because the
disease became important prior to the
adoption of zero tillage practices.
During the study in North Dakota,
five winter wheats and one spring wheat
were tested as differential, and 14 isolates
were used to determine host-pathogen
interaction (Diaz de Ackermann 1987;
Diaz de Ackermann et al. 1988). Of these,
11 isolates belonged to an identified racial
group and the other three were new, but
the host-pathogen interaction was
observed to be significant in only one of
the five trials. After inoculation with a
suspension of 50,000 infective propagules
(mycelial fragments, conidiophores, and
conidia) per ml, pots were placed in a
humid chamber for 30 h at 21± 3°C.
Infection evaluation was made by
measuring lesion length. Although
specific interactions between individual
isolates and wheat genotypes have been
shown in Canada, other studies have
reported conflicting results (Lamari and
Bernier 1989b, 1989c; Luz and Hosford
1980).
Sources of resistanceTrials have been sown for many years
to evaluate tan spot resistance under
natural infection conditions in northern
Uruguay. At present, research is
underway to identify germplasm with
higher tan spot resistance than current
varieties using artificial inoculation in the
field and on seedlings in the greenhouse.
Disease development was visually
estimated using the 0-9/0-9 modified
Saari-Prescott scale in the field and the
Lamari scale (Lamari and Bernier 1989a)
in the greenhouse.
Wheat varieties showing tan spot
resistance under field conditions are
presented in Table 3. Winter wheat
Table 3. Sources, growth habit, and origin ofPyrsnophors tr;t;c;-rspsnt;s resistance in Uruguay.
Cultivar Habit Origin Reference
Red Chief Winter USA Raymond 1985Carifen 12 Winter Chile Cox and Hosford 1987Colotana Spring Brazil Rees and Platz 1990Veranopolis Spring Brazil Rees and Platz 1990Fink"S" Spring Mexico Rees and Platz 1990Genaro"S" Spring Mexico Rees and Platz 1990Vicam"S" Spring Mexico Rees and Platz 1990
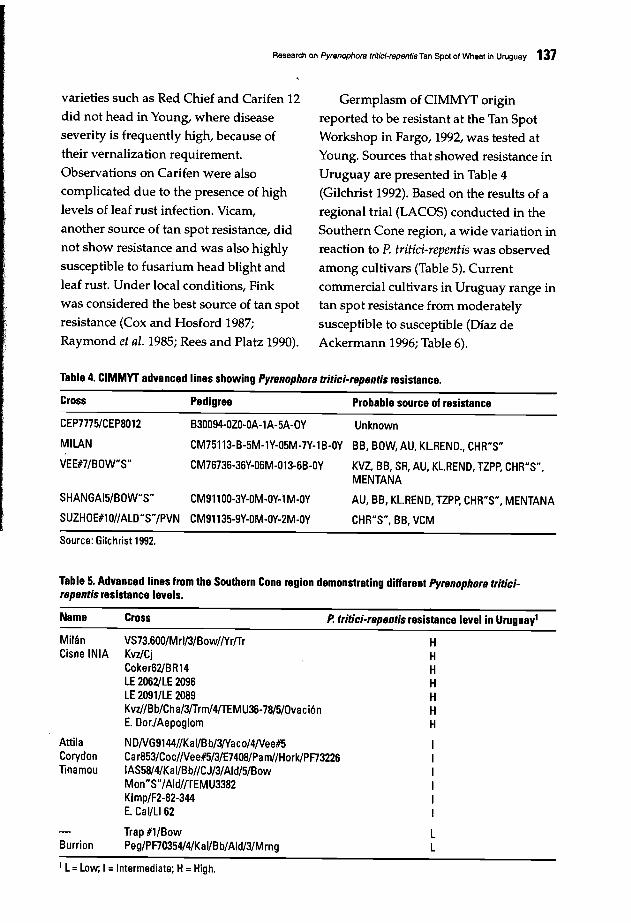
Research on Pyrenophora Irilici-rapenlis Tan Spot of Wheat in Uruguay 137
varieties such as Red Chief and Carifen 12did not head in Young, where disease
severity is frequently high, because oftheir vernalization requirement.
Observations on Carifen were alsocomplicated due to the presence of high
levels of leaf rust infection. Vicam,
another source of tan spot resistance, didnot show resistance and was also highly
susceptible to fusarium head blight and
leaf rust. Under local conditions, Finkwas considered the best source of tan spot
resistance (Cox and Hosford 1987;
Raymond et al. 1985; Rees and Platz 1990).
Germplasm of CIMMYT origin
reported to be resistant at the Tan SpotWorkshop in Fargo, 1992, was tested at
Young. Sources that showed resistance in
Uruguay are presented in Table 4(Gilchrist 1992). Based on the results of a
regional trial (LACOS) conducted in theSouthern Cone region, a wide variation in
reaction to P. tritici-repentis was observed
among cultivars (Table 5). Current
commercial cultivars in Uruguay range intan spot resistance from moderately
susceptible to susceptible (Diaz deAckermann 1996; Table 6).
Table 4. CIMMYT advanced lines showing Pyrenophor8 tritici-rBpBntis resistance.
SHANGAI5/BOW"S" CM911 00-3Y-OM-OY-l M-OY
SUZHOE#l allALD"S"/PVN CM91135-9Y-OM-OY-2M-OY
Cross
CEP7775/CEP8012
MILAN
VEE#7/BOW"S"
Pedigree
B30094-0Z0-0A-1A-5A-OY
CM75113-B-5M-lY-05M-7Y-l B-OY
CM76736-36Y-06M-013-6B-OY
Probable source of resistance
Unknown
BB, BOW, AU, KL.REND., CHR"S"
KVZ, BB, SR, AU, KL.REND, TZPP, CHR"S",MENTANA
AU, BB, KL.REND, TZPp, CHR"S", MENTANA
CHR"S", BB, VCM
Source: Gilchrist 1992.
Table 5. Advanced lines from the Southern Cone region demonstrating different Pyrenophor8 triticirBpBntis resistance levels.
Name Cross P. tritici-rBpBntis resistance level in Uruguay'
MillinCisne INIA
AttilaCorydonTinamou
Burrion
VS73.600/MrI/3/Bow//Yr/TrKvz/CjCoker62/BR14LE 2062/LE 2096LE 2091/LE 2089Kvz//Bb/Cha/3/Trm/4/TEMU36-78/5/0vaci6nE. Dor./Aepoglom
ND/VG9144//Kal/Bb/3/Yaco/4IVee#5Ca r853/Coc/IVee#5/3/E7408/Pam//Hork/PF73226IAS58/4/Kal/Bb//CJ/3/Ald/5/BowMon"S"/Ald/rrEMU3382Klmp/F2-82-344E. Cal/L162
Trap #l/BowPeg/PF70354/4/KaI/Bb/Ald/3/Mrng
HHHHHHH
IIIIII
LL
1 L=Low; I =Intermediate; H=High.

138 M. Dlaz de Ackermann and M.M. Kohli
During 1996, a large CIMMYT
collection (929 lines of PCME2HR) wastested for tan spot resistance at the
seedling stage in the greenhouse.
Significant differences in infection levelwere observed in the advanced lines.
Since this was the first of this type of
greenhouse experiment, the information
needs to be confirmed in the coming crop
cycle.
The objective of the breeding programin Uruguay is to confirm the effectiveness
of sources of tan spot resistance reportedin different regions of the world againstthe local pathogenic population, and to
try to introduce the best entries intolocally adapted germplasm.
Control measuresIn Uruguay, there has been virtually
no effort to evaluate losses due to tan spotalone as, in commercial fields, it alwaysappears as part of a leaf blight complex,
with Septaria tritid the most prevalentdisease. As previously mentioned, allUruguayan cultivars currently
recommended are susceptible or
moderately susceptible to tan spot. This,
together with the increase in wheat areaunder zero tillage conditions, makes it
necessary to generate precise data on the
economic importance of the disease.
Cultural practice-Several studies
indicated that tan spot disease level isincreased by stubble retention (Lamey
1981; Rees and Platz 1992). During 1996,
four cultivars (E. Cardenal, ProINTAQueguay, p. Superior, and INIAMirlo)
were planted under zero tillageconditions to test three methods ofstubble management. Significant
differences (P<O.01) in diseasedevelopment were observed betweenwheat planted into wheat stubble(AUDPC 1363.98 a), into burnt wheat
stubble (AUDPC 907.34 b), and into oatstubble (AUDPC 366.61 c). Disease levelwas found to be significantly higher on
the wheat crop planted into wheatstubble compared with oat stubble;therefore, an oat crop seems to be a viable
alternative in the cropping system(Figure 1).
Table 6. Commercial wheat cultivars sown in Uruguay that demonstrate a low to Intermediate level of leafspot infection.
Cultivar Cross or nameLeaf blight infection
E. Pel6n 90E. BenteveoBuck YapeyuINIAMirlo /LE 2193NEC909INIA BoyeroBuck CharruaLE 2196
Kvl/TrmBobwhiteB.Patac6nlT800Car853/Coc/Nee#5/3/UresE.FederaI/Buck6//MR74507MAG204/82.64//LAJ942*2/ND501Aepoglom/MN72116422//L17RAP/RE//IRAP/3/Lov/4/RAP/RE//IRAPE.Jilguero/ND 526
L-12LLLLLIL-IL-I
L-III-HIIILII
1 ST =Septoria tritie;' PTR =Pyrenophora tritiei-repentis.2 L=Low; I=Intermediate; H=High.
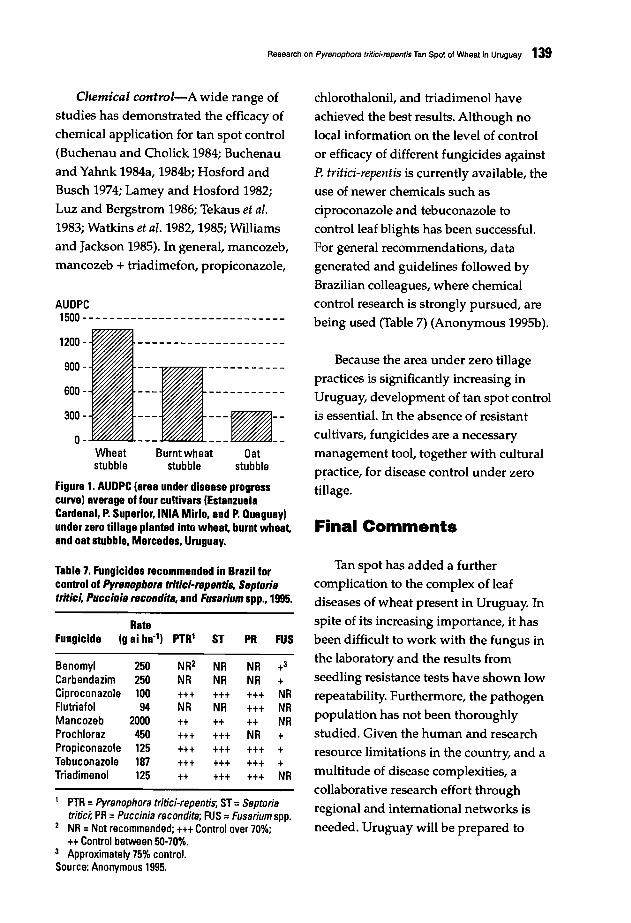
Research on Pyrenophora Irilici·repenlis Tan Spot of Wheat In Uruguay 139
Final Comments
Because the area under zero tillage
practices is significantly increasing in
Uruguay, development of tan spot controlis essential. In the absence of resistant
cultivars, fungicides are a necessarymanagement tool, together with cultural
p~actice, for disease control under zerotillage.
chlorothalonil, and triadimenol have
achieved the best results. Although nolocal information on the level of control
or efficacy of different fungicides against
P. tritici-repentis is currently available, theuse of newer chemicals such as
ciproconazole and tebuconazole to
control leaf blights has been successful.For general recommendations, data
generated and guidelines followed by
Brazilian colleagues, where chemicalcontrol research is strongly pursued, are
being used (Table 7) (Anonymous 1995b).
Oatstubble
Burnt wheatstubble
---.-------------- -------------- ---~--
--- ---~--Wheatstubble
900
600
300 -
0-
AUDPC1500 - -- - - -- -- ---- - - - - - -- - - -- --- --
1200 -
Figure 1. AUDPC (area under disease progresscurve) average of four cultivars (EstanzuelaCardenal, P. Superior,lNIA Mirlo, and P. Queguay)under zero tillage planted into wheat. burnt wheat.and oat stubble, Mercedes, Uruguay.
Chemical control-A wide range of
studies has demonstrated the efficacy of
chemical application for tan spot control
(Buchenau and Cholick 1984; Buchenauand Yahnk 1984a, 1984b; Hosford and
Busch 1974; Lamey and Hosford 1982;Luz and Bergstrom 1986; Tekaus et ai.
1983; Watkins et ai. 1982,1985; Williamsand Jackson 1985). In general, mancozeb,
mancozeb + triadimefon, propiconazole,
Table 7. Fungicides recommended in Brazil forcontrol of Pyrenophora tritici-repentis, Septoriatrhici, Puccinia recondita, and Fusarium spp., 1995.
RateFungicide (g ai ha") PTR' ST PR FUS
Benomyl 250 NR2 NR NR +3Carbendazim 250 NR NR NR +Ciproconazole 100 +++ +++ +++ NRFlutriafol 94 NR NR +++ NRMancozeb 2000 ++ ++ ++ NRProchloraz 450 +++ +++ NR +Propiconazole 125 +++ +++ +++ +Tebuconazole 187 +++ +++ +++ +Triadimenol 125 ++ +++ +++ NR
1 PTR =Pyrenophora tritici-repentis; ST =Septoriatritic;' PR =Puccinia recondita; FUS =Fusarium spp.
2 NR =Not recommended; +++ Control over 70%;++ Control between 50-70%.
3 Approximately 75% control.Source: Anonymous 1995.
Tan spot has added a furthercomplication to the complex of leafdiseases of wheat present in Uruguay. In
spite of its increasing importance, it hasbeen difficult to work with the fungus in
the laboratory and the results from
seedling resistance tests have shown low
repeatability. Furthermore, the pathogenpopulation has not been thoroughly
studied. Given the human and research
resource limitations in the country, and a
multitude of disease complexities, a
collaborative research effort throughregional and international networks is
needed. Uruguay will be prepared to
140 M. Diaz de Ackermann and M.M. Kohli
participate in any international
collaborative effort that can be identified
or developed at this workshop.
References
Anonymous. 1995a. Direcci6n de Censos yEncuestas, 1995. Cultivos de Invierno.Uruguay. MGAP. Serie informativa:Boletin No. 179.
Anonymous. 1995b. ReunHlo da ComissaoSul-Brasileira de Pesquisa de Trigo, 1995.Porto Alegre, RS, Brasil. Recomenda~oesde Comissao Sul-Brasileira de Pesquisade Trigo, Porto Alegre, Comissao. 66 pp.
Anonymous. 1997. Direcci6n de Censos yEncuestas, 1997. Cultivos de Invierno.Uruguay. MGAP. Serie informativa:Boletin No. 184.
Buchenau, G.w., and EA. Cholick. 1984. Tanspot and scab control in irrigated springwheat, 1983. Fungicide and NematicideTests 39:108.
Buchenau, G.w., and M.D. Yahnk., 1984a.Control of wheat scab and tan spot withfungicides near Huron, S.D., 1983.Fungicide and Nematicide Tests 39:107.
Buchenau, G.w., and M.D. Yahnke. 1984b.Spring wheat disease control with foliarfungicides, Brookings, S.D., 1983.Fungicide and Nematicide Tests 39:108109.
Costa Neto, J.P. Da. 1968. Fungosobservados em gramineas e leguminosasno RG. do SuI. Revista da Facudade deAgronomia e Veterinaria. Porto Alegre.Univ Federal do RG. do SuI 9:51-68.
Cox, D., and R.M. Hosford Jr. 1987.Resistant winter wheats compared atdiffering growth stages and leafpositions for tan spot severity. Plant Dis71:883-886
Diaz de Ackermann, M. 1987. Resistanceamong winter wheats to Pyrenophoratritici-repentis isolates and variability infungal growth, color, sporulation andpathogenicity. M.Sc. thesis, NorthDakota State University, Fargo. 49 pp.
Diaz de Ackermann, M. 1992. Manchaparda del trigo. Boletin de Divulgaci6nNo. 19. La Estanzuela, Uruguay: INIA.
Dfaz de Ackermann, M. 1996. Manchaparda del trigo causada por Pyrenophoratritici-repentis (Died.) Drechs., estadoperfecto de Drechslera tritici-repentis(Died.) Shoem. In: Manejo deenfermedades en cereales de invierno ypasturas. Serie Tecnica No. 74:63-78. LaEstanzuela, Uruguay: INIA.
Dfaz de Ackermann, M., Hosford, RM. Jr.,Cox, D.J., and J.J. Hammond. 1988.Resistance in winter wheats togeographically differing isolates ofPyrenophora tritici-repentis andobservations on pseudoperithecia. PlantDis 72:1028-1031
Gilchrist, L. 1992. Resistance to Pyrenophoratritici-repentis in CIMMYT bread wheatgermplasm. In: L.J. Francl, J.M.Krupinsky, and M.P. McMullen (eds.),Advances in Tan Spot Research.Proceedings of the 2nd International TanSpot Workshop, pp. 44. Fargo, ND, USA:North Dakota Agricultural ExperimentStation.
Hosford, RM. Jr., and RH. Busch. 1974.'Losses in wheat caused by Pyrenophoratrichostoma and Lepthosphaeria avenaria f.sp. triticea. PhytopathoI64:184-187.
Krupinsky, J.M. 1982. Host of Pyrenophoratrichostoma. In: RM. Hosford Jr. (ed.), TanSpot of Wheat and Related DiseasesWorkshop, pp 25. Fargo, ND, USA:North Dakota State University.
Krupinsky, J.M. 1986. Pyrenophora triticirepentis, P. bromi, and Leptosphaerianodorum on Bromus inermis in NorthernGreat Plains. Plant Dis 70:61-64.
Krupinsky, J.M. 1987. Pathogenicity onwheat of Pyrenophora tritici-repentisisolated from Bromus inermis.Phytopathol 77:760-765.
Lamari, L., and C. Bernier. 1989a.Evaluation of wheat lines and cultivarsto tan spot Pyrenophora tritici-repentisbased on lesion type. Can J Plant Pathol11:49-56.
Lamari, L., and C. Bernier. 1989b. Toxin ofPyrenophora tritici-repentis: Hostspecificity significance in disease, andinheritance of host reaction. Phytopathol79:740-744.

Research on Pyrenophora tritici'rapentls Tan Spot of Wheat in Uruguay 141
Lamari, L., and e. Bernier. 1989c. Virulenceof isolates of Pyrenophora tritici-repentison 11 wheat cultivars and cytology of thedifferential reaction. Can J Plant Pathol11:284-290.
Lamey, H.A 1981. Crop rotations formanaging plant disease. Coop Ext Serv,NDSU, pp. 705.
Lamey, H.A, and RM. Hosford Jr. 1982. Tanspot of wheat. Coop Ext Serv, NDSU, pp.766.
Luz, We. da, and RM. Hosford, Jr. 1980.Twelve Pyrenophora trichostoma races forvirulence to wheat in the Central Plainsof North America. PhytopathoI70:11931196.
Luz, W.e. da, and G.e. Bergstrom. 1986.Evaluation of triadimenol seed treatmentfor early season control of tan spot,powdery mildew, spot blotch andSeptoria nodontrn spot on spring wheat.Crop Prot 5(2):83-87.
Luzzardi, G.e., Luz, We. da, and M.G.Diaz de Ackermann. 1985. Epifitotia do"Crestamento amarelo das folhas" dotrigo, na Republica do Uruguai. FitopBras 10:A061, pp. 244.
Raymond, P.J., Bockus, WW, and B.L.Norman. 1985. Tan spot winter wheat:procedures to determine host response.Phytopathol 75:686-690.
Rees, RG., and G.]. Platz. 1990. Sources ofresistance to Pyrenophora tritici-repentis inbread wheats. Euphytica 45:59-69.
Rees, RG., and G.J. Platz. 1992. Tan Spotand its control - Some Australianexperiences. In: L.J. Franc1, J.M.Krupinsky, and M.P. McMullen (eds.),Advances in Tan Spot Research.Proceedings of the 2nd International TanSpot Workshop, pp. 1. Fargo, ND, USA:North Dakota Agricultural ExperimentStation.
Schilder, AM., and G.e. Bergstrom. 1992.Infection of wheat seed by and seedtransmission of Pyrenophora triticirepentis. In: L,J. Franc1, J.M. Krupinsky,and M.P. McMullen (eds.), Advances inTan Spot Research. Proceedings of the2nd International Tan Spot Workshop,pp. 56. Fargo, ND, USA: North DakotaAgricultural Experiment Station.
Stewart, S., and M. Diaz de Ackermann.1993. Presencia de Pyrenophora triticirepentis teleomorfo de Drechslera triticirepentis en rastrojo de trigo en Uruguay.(in press).
Tekaus, A, Samborski, D.J., Rourke, D.5.R.,and AT. Iverson. 1983. Diseases ofwinter wheat in Manitoba in 1983. ManitAgron Proc, 1983, pp. 63-68.
Watkins, J.E., Doupnick, B., and L.v.Coziahr. 1985. Effect of fungicidetreatment and timing of application onfoliar disease development in winterwheat, 1984. Fungicide and NematicideTests 40:145.
Watkins, J.E., Doupnik, B., and M.G.Boosalis. 1982. Researches assesschemical control of foliar wheat disease.Farm, Ranch and Home Quarterly 29:1619.
Williams, E., and K.E. Jackson..1985.Evaluation of fungicides for foliardisease control in winter wheat, 1984.Fungicide and Nematicide Tests 40:147.

142
Improving Control of Tan Spot Caused byPyrenophora tritiei.repent;s in theMixteca Alta of Oaxaca, Mexico
L. Osorio A.t, 1. Garcia A.2, F, Lopez F,2, and E. Duveiller
1 INIFAP, Santo Domingo Yanhuitlan, Nochixtlan, Oaxaca, Mexico2 CIMMYT, Mexico, D.F" Mexico
Abstract
Wheat production covers about 14,000 ha in Oaxaca State, Mexico, ofwhich 95% is locatedin the Mixteca Alta (2,200 masl, 1J030'N and 9J020'W), where soils are characterized by loworganic matter and high pH levels. Wheat is mainly grown under rainfed conditions andirrigation is limited. Since erosion is a concern for smallholder producers, reduced tillagecropping practices have increased in recent years. As a result ofa lack ofadequate rotation, andlimited access to fertilizers and technological support, tan spot caused by Pyrenophora tritici
repentis has become a major concern. Althoughimproved varieties are commonly used(Temporalera M-87, Arandas F-90, and Pavon F-76), they are highly susceptible to foliardiseases, particularly tan spot. In fungicide tests, manzate reduced disease severity by 25%, onaverage, compared with the control. There were no significant differences between twotreatments ofcyproconazole or propiconazole and one spray of tebuconazole; however, these fivetreatments reduced the average disease severity on combined flag leaf (F) and F-1leaves by morethan 75%. Only two sprays of tebuconazole (Folicur) caused a significantly larger reduction indisease severity (86%). Yield obtained after fungicide treatment correlated well with diseaseseverity. At two sites (Yanhuitlan and Nochixtlan), 224 genotypes were screened under zerotillage and natural rainfed conditions, and disease pressure was high as a result of the wheatmonoculture. Fifteen entries with higher yield and better disease resistance than the local checkwere identified.
Wheat Production in theMixteca Alta
Wheat production covers about 14,000ha in Oaxaca State, Mexico, of which 95%
is located in the Mixteca Alta (2,200 masl,
17°30' Nand 97°20' W), where soils are
characterized by a low organic matter
content and high pH. Wheat is mainly
grown under rainfed conditions andirrigation is limited. As erosion is a
concern for small farm producers, the use
of reduced tillage cropping practices hasincreased in recent years. Due to a lack ofadequate rotation and limited access to
fertilizers and technical support, tan spot
caused by Pyrenophora tritici-repentis has
become one of the major concerns for
small farmers in the region. Althoughimproved varieties are commonly used
(Temporalera M-87, Arandas F-90, and
Pavon F-76), they are highly susceptibleto foliar diseases, particularly tan spot. In
the last two years, chemical control was
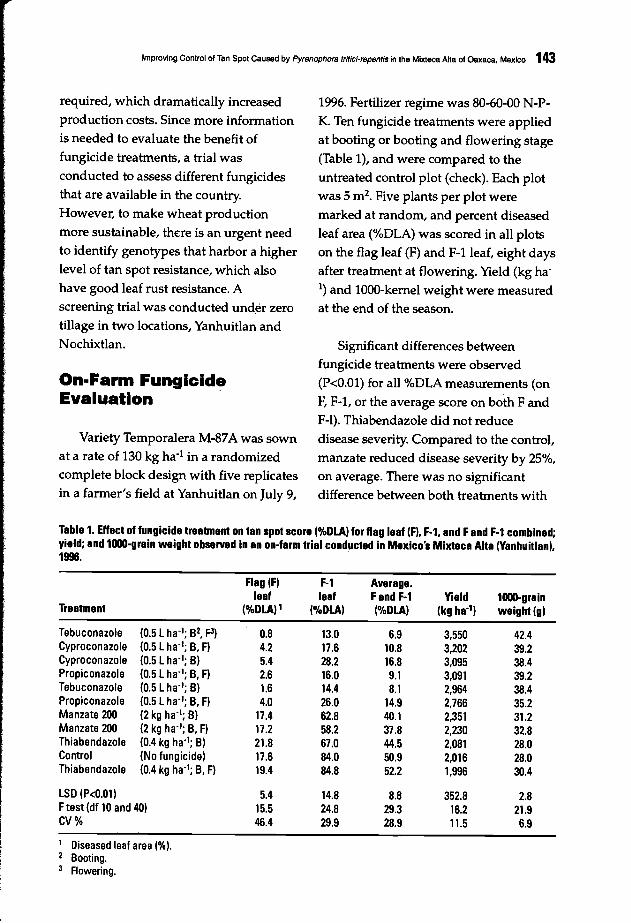
Improving Control of Tan Spot Caused by Pyrsnophors tritici-rspsntls in the Mlxteca Alta of Oaxaca, Mexico 143
required, which dramatically increased
production costs. Since more information
is needed to evaluate the benefit of
fungicide treatments, a trial was
conducted to assess different fungicides
that are available in the country.
However, to make wheat production
more sustainable, there is an urgent need
to identify genotypes that harbor a higher
level of tan spot resistance, which also
have good leaf rust resistance. A
screening trial was conducted under zero
tillage in two locations, Yanhuitlan and
Nochixtlan.
On-Farm Funglcld~
Evaluation
Variety Temporalera M-87A was sown
at a rate of 130 kg ha-I in a randomized
complete block design with five replicates
in a farmer's field at Yanhuitlan on July 9,
1996. Fertilizer regime was 80-60-00 N-P
K. Ten fungicide treatments were applied
at booting or booting and flowering stage
(Table I), and were compared to the
untreated control plot (check). Each plot
was 5 m2• Five plants per plot were
marked at random, and percent diseased
leaf area (%DLA) was scored in all plots
on the flag leaf (F) and F-1 leaf, eight days
after treatment at flowering. Yield (kg ha
l) and lOOO-kernel weight were measured
at the end of the season.
Significant differences between
fungicide treatments were observed
(P<O.Ol) for all %DLA measurements (on
F, F-1, or the average score on both F and
F-I). Thiabendazole did not reduce
disease severity. Compared to the control,
manzate reduced disease severity by 25%,
on average. There was no significant
difference between both treatments with
Table 1. Effect of fungicide treatment on tan spot score (%DLA) for flag leaf (F). F-l, and Fand F-1 combined;yield; and 1000-grain weight observed in an on-farm trial conducted in Mexico's Mixteca Alta (Yanhuitlan).1996.
Flag (F) F-1 Average.leaf leaf Fand F-1 Yield 1000-grain
Treatment (O/ODLA) , (O/ODLA) (%DLA) (kg ha") weight(gl
Tebuconazole (0.5 Lha-1; B2, F3) 0.8 13.0 6.9 3,550 42.4Cyproconazole (0.5 Lha·1; B, F) 4.2 17.6 10.8 3,202 39.2Cyproconazole (0.5 Lha-1; B) 5.4 28.2 16.8 3,095 38.4Propiconazole (0.5 Lha·1; B, F) 2.6 16.0 9.1 3,091 39.2Tebuconazole (0.5 Lha·1; B) 1.6 14.4 8.1 2,964 38.4Propiconazole (0.5 Lha·1; B, F) 4.0 26.0 14.9 2,766 35.2Manzate 200 (2 kg ha-1; B) 17.4 62.8 40.1 2,351 31.2Manzate 200 (2 kg ha-1; B, F) 17.2 58.2 37.8 2,230 32.8Thiabendazole (0.4 kg ha"; B) 21.8 67.0 44.5 2,081 28.0Control (No fungicide) 17.6 84.0 50.9 2,016 28.0Thiabendazole (0.4 kg ha"; B. F) 19.4 84.8 52.2 1,996 30.4
LSD (P<O.OI) 5.4 14.8 8.8 352.8 2.8Ftest (df 10 and 40) 15.5 24.8 29.3 16.2 21.9CV% 46.4 29.9 28.9 11.5 6.9
1 Diseased leaf area (%).Booting.Flowering.
144 L. Osorio A. st a/.
cyproconazole or propiconazole and one
spray with tebuconazole based on LSD(P<O.OI) comparisons; however, the five
treatments reduced average severity on
combine F and F-lleaves by more than
75%. Only two sprays of tebuconazole
caused a significantly higher reduction indisease severity (86%).
Yield and 1000-grain weight werehighly correlated to disease data;
however, compared to the unprotectedplots, no significant yield increase (LSD =
352.8) was observed when plots weresprayed with manzate and thiabendazole.One spray of propiconazole resulted in a
37% significant yield increase. Nosignificant yield difference was observed
between both cyproconazole treatments,two sprays of propiconazole and onetebuconazole spray at booting stage.
These four treatments, on average,produced a 53% yield increase (P<O.OI)compared to the control. Only two sprays
of tebuconazole produced a significantlyhigher yield increase (75% more thancontrol), but this treatment was not
significantly different to the twocyproconazole sprays. A farmer's
decision to use a particular fungicide maybe simplified based on these field results,
but the final choice will depend onchemical cost and, most importantly,
market grain price.
Screening Bread WheatGenotypes for Tan SpotResistance
Bread wheat genotypes (224 entries)previously selected from several
CIMMYT nurseries for potential tan spot
resistance were screened under naturalconditions at two sites (Yanhuitlan and
Nochixtlan) under zero tillage and
rainfed conditions. Natural disease
pressure was high as a result of the wheatmonoculture system used for more than
two consecutive years. At planting,
pseudothecia were clearly evident onover-wintered wheat stubble. No crop
had been planted during the winter prior
to the trial. Sowing dates were July 10and 28,1996, forYanhuitlan and
Nochixtlan, respectively. Plots were 1.4
m2 and N-P-K fertilization rate was 8060-00. The cultivar Arandas F-90,
commonly sown in the Mixteca, was used
as the local check, and Catbird and ND/
DG9144/ /KaI/BB/3/YACO/4/Chilwere the resistant and susceptible
controls, respectively.
Severe tan spot infection was initiallyobserved at tillering (Zadoks' DC 29),and epidemic development was uniformin both locations. At flowering, tan spot
infection was clearly observed up to theflag leaf of most susceptible genotypes,and was confirmed by the consistent
detection of P. tritici-repentis conidia onsamples in the CIMMYT laboratory.
Disease rating, using Saari andPrescott's 00-99 double digit scale, was
recorded on October 9,1996, when
epidemic development was highest.Growth stage was measured according to
Zadoks' scale at the time oi scoring. Yield
per plot was converted to kg ha-1• Table 2
presents the disease rating and yield of
the 15 top yielding genotypes under
these conditions. All genotypes, with the
exception of JUP/ZP/ /COC/3/PVN/4/
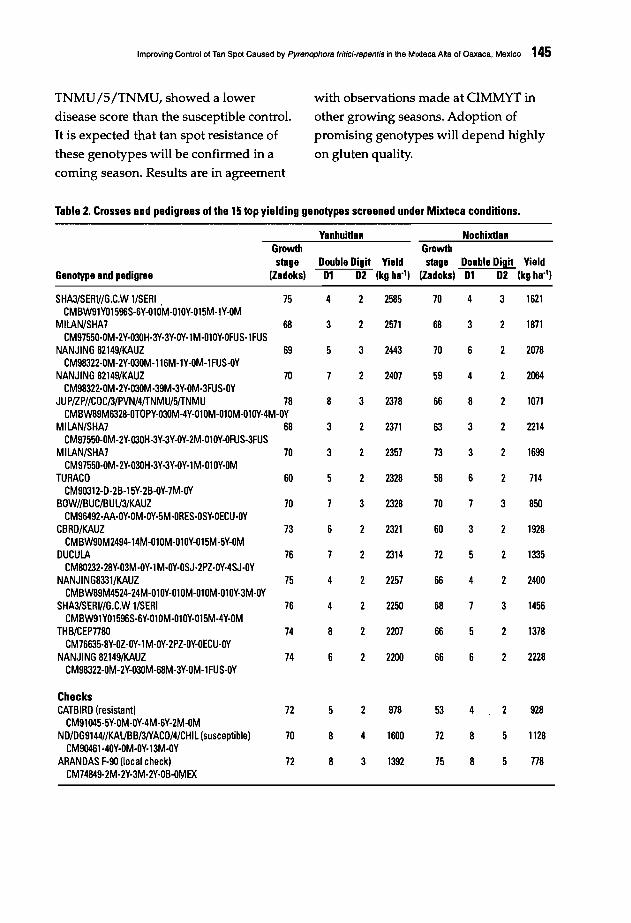
Improving Control of Tan Spot Caused by Pyrenophora tritici·repentis in the Mlxteca Alta of Oaxaca, Mexico 145
TNMU/5/TNMU, showed a lower with observations made at CIMMYT in
disease score than the susceptible control. other growing seasons. Adoption ofIt is expected that tan spot resistance of promising genotypes will depend highly
these genotypes will be confirmed in a on gluten quality.
coming season. Results are in agreement
Table 2. Crosses and pedigrees of the15 top yielding genotypes screened under Mixteca conditions.
Yanhuitlan NochixtlanGrowth Growthstage Double Digit Yield stage Double Digit Yield
Genotype and pedigree (Zadoks) D1 D2 (kg ha·l ) (zadoks) D1 D2 (kg ha·l )
SHA3/SERI//G.C.W 1/SERI , 75 4 2 2585 70 4 3 1621CMBW91Y01596S·6Y·Ol0M·01OY·015M·1Y·OM
MILAN/SHA7 68 3 2 2571 68 3 2 1871CM97550·0M·2Y·030H·3Y·3Y·OY·1M·Ol0Y·OFUS·1FUS
NANJING 82149/KAUZ 69 5 3 2443 70 6 2 2078CM98322·0M·2Y·030M·116M·1Y·OM·l FUS·OY
NANJING 82149/KAUZ 70 7 2 2407 59 4 2 2064CM98322·0M·2Y·030M·39M·3Y·OM·3FUS·OY
JUP/ZP//COC/3/PVN/4{fNMU/5{fNMU 78 8 3 2378 66 8 2 1071CMBW89M6328·0TOPY·030M·4Y·Ol0M·Ol0M·Ol0Y-4M·OY
MILAN/SHA7 68 3 2 2371 63 3 2 2214CM97550·0M·2Y·030H·3Y·3Y·OY·2M·Ol0Y·OFUS-3FUS
MILAN/SHA7 70 3 2 2357 73 3 2 1699CM97550·0M·2Y·030H·3Y·3Y·OY·l M·Ol OY·OM
TURACO 60 5 2 2328 58 6 2 714CM90312·D·2B·15Y·2B·OY·7M·OY
BOW//BUC/BUl/3/KAUZ 70 7 3 2328 70 7 3 850CM96492·AA·OY·OM·OY·5M·ORES·OSY·OECU·OY
CBRD/KAUZ 73 6 2 2321 60 3 2 1928CMBW90M2494·14M·Ol0M·Ol0Y·015M·5Y·OM
DUCULA 76 7 2 2314 72 5 2 1335CM80232·28Y·03M·OY·l M·OY·OSJ·2PZ·OY·4SJ·OY
NANJING8331/KAUZ 75 4 2 2257 66 4 2 2400CMBW89M4524·24M·Ol OY·Ol OM·Ol OM·Ol OY·3M·OY
SHA3/SERI//G.C.w 1/SERI 76 4 2 2250 68 7 3 1456CMBW91YOI596S·6Y·Ol0M·Ol0Y·015M·4Y·OM
THB/CEP7780 74 8 2 2207 66 5 2 1378CM76635·8Y·OZ·OY·l M·OY·2PZ·OY·OECU·OY
NANJING 82149/KAUZ 74 6 2 2200 66 6 2 2228CM98322·0M·2Y·03OM·68M·3Y·OM·1FUS·OY
ChecksCATBIRD Iresistant) 72 5 2 978 53 4 2 928
CM91045·5Y·OM·OY·4M·6Y·2M·OMND/DG9144//KAl/BB/3/VACO/4/CHIL (susceptible) 70 8 4 1600 72 8 5 1128
CM90461·4OY·OM·OY·13M·OYARANDAS F·90 (local check) 72 8 3 1392 75 8 5 778
CM74849·2M·2Y·3M·2Y·OB·OMEX
146
Importance of Spot Blotch Caused byBlpolaris sorokiniana in Bolivia
]. Toledo B. and E. Guzman A.International Center for Tropical Agriculture (CIAT), Santa Cruz de la Sierra,Bolivia
Abstract
In Bolivia, more than 70% ofwheat production is grown on the eastern lowlands ofSantaCruz Department. Wheat is an important winter crop grown after the summer soybean crop. Inearly sown wheat (15 April-lO May), environmental conditions prevailing in the humid andintermediate areas of the region are very favorable for development ofspot blotch, caused byBipolaris sorokiniana. Yield losses ofup to 57% have been observed but are highly dependenton planting date, wheat variety, and climatic conditions. Optimum time for fungicide treatmentis 15 days after first observation ofsymptoms, which corresponds to heading stage for normalsowing times (May).
In Bolivia, over 70% of wheatproduction is grown on the eastern plains(Department of Santa Cruz), where spot
blotch, caused by Bipolaris sorokiniana, isone of the most important wheat diseases.
Importance and Losses
Table 1 shows the estimates ofpotential losses due to spot blotch for the
Department of Santa Cruz. Based onresearch conducted to determine the
damage caused to wheat by this disease,
the best time to apply chemical controlmeasures is 15 days after the first
symptoms appear. (First symptoms =50%
incidence of plants with spots larger than2mm.)
In the wet and moderately humid
areas of Santa Cruz, under normal
planting conditions (May), the first
disease symptoms appear 35-40 days after
sowing (tillering-booting). This is theright time to apply fungicides, and it
(almost always) coincides with heading.With an early planting date (April-May)and when conditions favor diseasedevelopment (high humidity and heat),
fungicides should be applied twice; thefirst application when the symptomsappear, and the second application 15-20
days later, especially when growingsusceptible varieties. With moderately
resistant varieties, one application is
enough. Results of trials on losses andeconomic threshold are shown in Figure 1(1990-1995).
In 1995, the economic threshold
(heading) for the top three leaves of the
plant (flag leaf, F; F-l; and F-2) wasdetermined based on disease severity
(infected leaf area) (Figure 2). The price of
wheat at the mill (US $180 el , thestandard price in Bolivia) and the cost of
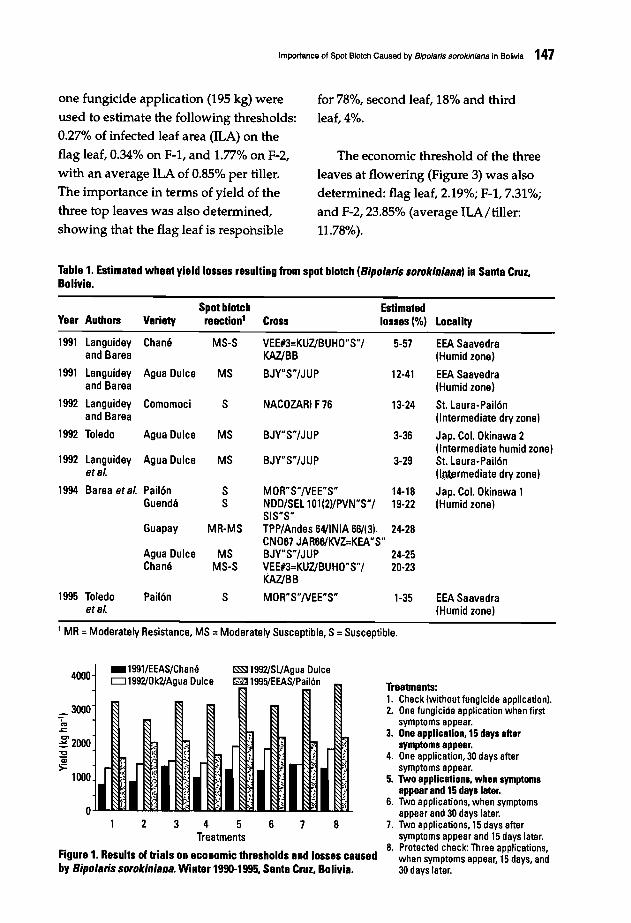
Importance of Spot Blotch Caused by Bipolarls soroklniana in Bolivia 147
one fungicide application (195 kg) were
used to estimate the following thresholds:0.27% of infected leaf area (ILA) on the
flag leaf, 0.34% on F-1, and 1.77% on F-2,
with an average ILA of 0.85% per tiller.The importance in terms of yield of the
three top leaves was also determined,
showing that the flag leaf is responsible
for 78%, second leaf, 18% and thirdleaf, 4%.
The economic threshold of the three
leaves at flowering (Figure 3) was alsodetermined: flag leaf, 2.19%; F-1, 7.31%;
and F-2, 23.85% (average ILA/tiller:11.78%).
Tabla 1. Estimated wheat yield losses resulting from spot blotch (Bipo/aris soroklnianal in Santa Cruz,Bolivia.
Spot blotch EstimatedYear Authors Variety reaction' Cross losses (%1 Locality
1991 Languidey Chane MS-S VEE#3=KUZ/BUHO"S"/ 5-57 EEA Saavedraand Barea KAZ/BB (Humid zonel
1991 Languidey Agua Dulce MS BJY"S"/JUP 12-41 EEA Saavedraand Barea (Humid zonel
1992 Languidey Comomoci S NACOZARI F76 13·24 St. Laura·Pail6nand Barea (Intermediate dry zone)
1992 Toledo Agua Dulce MS BJY"S"/JlIP 3-36 Jap. Col. Okinawa 2(Intermediate humid zonel
1992 Languidey Agua Dulce MS BJY"S"/JlIP 3·29 St. Laura-Pail6netat (I~rmediate dry zonel
1994 Barea et al. Pail6n S MOR"S"/VEE"S" 14-18 Jap. Col. Okinawa 1Guenda S NDD/SEL lol(2)/PVN"S"/ 19·22 (Humid zone)
SIS"S"Guapay MR·MS TPP/Andes 641INIA 66/13). 24·28
CN067 JAR661KVZ=KEA"S"Agua Dulce MS BJY"S"/JUP 24-25Chane MS·S VEE#3=KUZ/BUHO"S"/ 20-23
KAZ/BB
1995 Toledo Pail6n S MOR"S"NEE"S" 1·35 EEA Saavedraetat (Humid zone)
1 MR = Moderately Resistance, MS =Moderately Susceptible, S=Susceptible.
Figure 1. Results of trials on economic thresholds and losses causedby Bipo/aris sorokiniana. Winter 1990·1995, Santa Cruz, Bolivia.
4000
3000"k..r:
~2ooo"0Qj
>=1000
o
• 19911EEAS/Chane 1SS:Sl1992/SLJAgua DulceCJ1992/0k2/Agua Dulce ~ 1995/EEAS/PaiI6n
,-, I!r ?'I~ ~ J
" , I,- !r "~ I
: ~, I
~ "J I
:
2 3 4 5 6 7 8Treatments
Treatments:1. Check (without fungicide epplication).2. One fungicide application when first
symptoms appear.3. One application, 15 days after
symptoms appear.4. One application, 30 days after
symptoms appear.5. 1\Yo applications, when symptoms
appear and 15 days later.6. Two applications, when symptoms
appear and 30 days later.7. Two applications, 15 days after
symptoms appear and 15 days later.8. Protected check: Three applications,
when symptoms appear, 15 days, and30 days later.

148 J. Toledo B. and E. Guzman A.
Breeding for B.sorokiniana Resistance
Every year, CIAT's wheat project
introduces an average of 2000 wheat lines
and varieties, most from CIMMYT,
Mexico. From this wide variety of genetic
materials, intergeneric lines (from crosses
with Thinopyrum curvifolium) are being
selected more frequently for their
o+-'l''---.-------r-----,-----j
o 1 2 3 4Infected leaf area of F-l at heading
1000.--------------,
800
'"..r= 600~'"'".9 200
o-l"""-'"-r-------"'r------,---.------,
0.0 0.2 0.4 0.6 0.8 1.0Infected leaf area of flag leaf (F) at heading
1000"-
800 •'" 600
Y= -15.692 +788.83x..r=
r = 0.518 nsc>~
400'"'" • •0--' 200
8
•
••
••
y = 115.45 + 93.931 xo-t-·L....-_.---__-'rr_=..::;0.""72::.:9;....*-.,--__--1
o
1000
800
'" 600..r=c>~ 400'" •'"0 200--'
20
A
A
y = 127.31 +38.220xo..,...._~__.-r_=_0_.7r4_6*_--,-_----1
o 4 8 12 16Infected leaf area of F-2 at heading
1000
800
'" 600..r=c>~ 400'" A
'".9 200
2 4 6Infected leaf area: average of F,
F-l, and F-2 at heading
Figure 2. Economic threshold of Bipolaris sorokiniana for the three top leaves at heading. EEAS, winter1995, Santa Cruz, Bolivia.
80
y = 41.372 + 13.042xr =0.983**
o-I-"'---.-----.-------,-----io
0..,.,...--.-----.-----.-------1o 20 40 60 80
Infected leaf area of F-l at flowering
1000.----------------:::..,
800
~ 600c>
:;- 400
.3 200
100
A
y = 0.15872 +8.1812xr = 0.964**o-I"""'----r-----,-----r--~---j
o 20 40 60 80Infected leaf area of F-2 at flowering
400
o-I"---.,-----,-----,---r---1o 4 8 12 16 20
Infected leaf area of flag leaf IF) at flowering
1000 -,--------------,
800
~ 600
~'"'".9 200
20 40 60Infected leaf area: average of F.
F-l, and F-2 at heading
Figure 3. Economic threshold of Bipolaris sorokiniana for the three top leaves at flowering. EEAS. winter1995. Santa Cruz. Bolivia.
1000 1000
800 800
'" 600 ~ 600..r=c> c>~ -'"
'" 400 -;;; 400'" '"0 0--' 200 Y= 84.312 +50.446x --' 200 Y= 122.76 +9.8824x
r =0.932 ** r = 0.955**
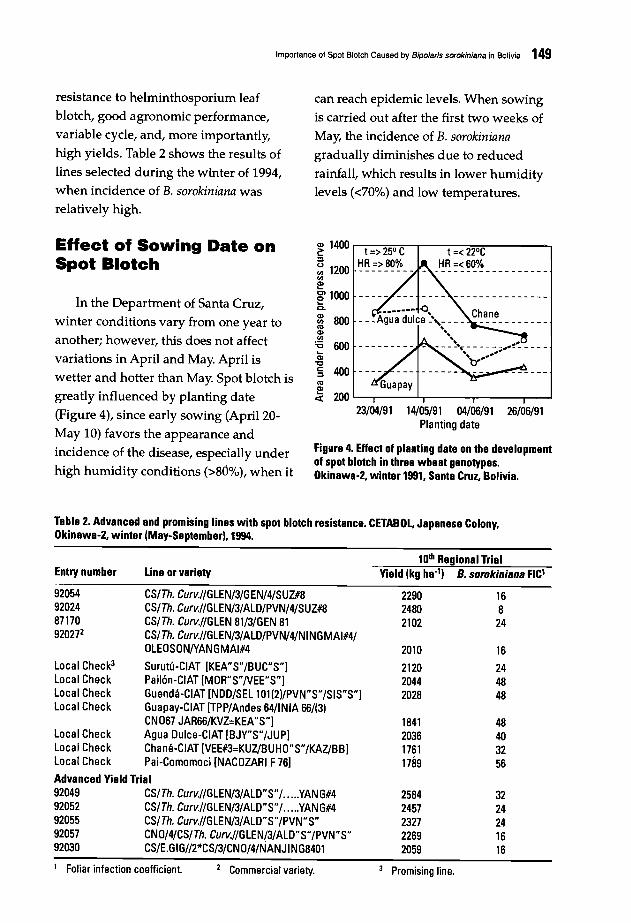
Importance of Spot Blotch Caused by Bipo/arls sorokiniana in Bolivia 149
resistance to helminthosporium leaf
blotch, good agronomic performance,
variable cycle, and, more importantly,
high yields. Table 2 shows the results of
lines selected during the winter of 1994,
when incidence of B. sorokiniana was
relatively high.
Effect of Sowing Date onSpot Blotch
In the Department of Santa Cruz,
winter conditions vary from one year to
another; however, this does not affect
variations in April and May. April is
wetter and hotter than May. Spot blotch is
greatly influenced by planting date
(Figure 4), since early sowing (April 20
May 10) favors the appearance and
incidence of the disease, especially under
high humidity conditions (>80%), when it
can reach epidemic levels. When sowing
is carried out after the first two weeks of
May, the incidence of B. sorokinianagradually diminishes due to reduced
rainfall, which results in lower humidity
levels «70%) and low temperatures.
~ 1400 """"'t-=->:;';25"'"0.".C--.-----,-----,=:-----...,
~ 1200 HR => 80%
'"~e1000c.
~ 800'"CI>
'"~ 600CI>'C
§ 400
'"~« 200 L..---r---...L.,----..---r-......J
23/04/91 14/05/91 04/06/91 26/06/91Planting date
Figure 4. Effect of planting date on the developmentof spot blotch in three wheat genotypes.Okinawa-2, winter 1991, Santa Cruz, Bolivia.
Table 2. Advanced and promising lines with spot blotch resistance. CETABOL, Japanese Colony,Okinawa-2, winter (May-September), 1994.
Entry number Line or variety10th Regional Trial
Yield (kg ha") B. sorokinisns FIC'
920549202487170920272
Local Check3
Local CheckLocal CheckLocal Check
CS/Th. Curv.//GLEN/3/GEN/4/~UZ#8CS/Th. Curv.//GLEN/3/ALO/PVN/4/SUZ#8CS/Th. Curv.//GLEN 81/3/GEN 81CS/Th. Curv.//GLEN/3/ALO/PVN/4/NINGMAI#4/OLEOSON/YANGMAI#4
Surutu-CIAT [KEA"S"/BUC"S"]PaiI6n-CIAT [MOR"S"NEE"S"]Guenda-CIAT [NOO/SEL 10l(211PVN"S"/SIS"S"]Guapay-CIAT [TPP/Andes 64/INIA 66/(3)CN067 JAR66/KVZ=KEA"S"]
Local Check Agua Oulce-CIAT [BJY"S"/JUP]Local Check Chane-CIAT [VEE#3=KUZ/BUHO"S"/KAZ/BB]Local Check Pai-Comomoci [NACOZARI F76]
Advanced Yield Trial92049 CS/Th. Curv.//GLEN/3/ALO"S"/ YANG#492052 CS/Th. Curv.//GLEN/3/ALO"S"/ YANG#492055 CS/Th. Curv.//GLEN/3/ALO"S"/PVN"S"92057 CNO/4/CS/Th. Curv.//GLEN/3/ALO"S"/PVN"S"92030 CS/E.GIG//2*CS/3/CNO/4/NANJING8401
229024802102
2010
212020442028
1841203617611789
25842457232722692059
16824
16
244848
48403256
3224241616
1 Foliar infection coefficient. 2 Commercial variety. 3 Promising line.
150
Major Foliar Diseases of Triticale inMorocco
A. El Harrakt, M. Mergoum2, and E. SaadaouP
1 Faculte des Sciences, Meknes, Morocco
2 CIMMYT, Mexico, D.P., Mexico
Abstract
Triticale (x Triticosecale Wittmack), a new crop in Morocco, is currently attracting moreinterest from farmers. Though triticale had shown excellent resistance to major diseases andinsects under Moroccan conditions in the past, many disease symptoms have recently beenobserved on several genotypes in breeding nurseries. Therefore, a survey oftriticale diseases wasconducted during the 1989/90 and 1990/91 crop seasons in different regions ofMorocco. Themain foliar diseases recorded were tan spot (Pyrenophora tritici-repentis) and spot blotch(Bipolaris sorokiniana). Speckled leafblotch (Septoria triticv, glume blotch (S. nodorum),
leaf rust (P. recondita), and stem rust (p. graminis) were less frequently observed. Anotherstudy, including 16 triticale genotypes (three ofwhich had already been released), two breadwheat, and two durum wheat cultivars, was conducted in the greenhouse to determine theirreaction to the major cereal pathogens in Morocco. Results showed that genotype reactionranged from resistant to susceptible for all patho~s except S. tritici and Erysiphe graminis,
isolated from wheat, which were not virulent on triticale genotypes. The virulence ofB.sorokiniana, P. tritici-repentis, and S. nodorum strains isolated from wheat was relativelyhigher on triticale. This suggests that selection pressure by triticale may induce variation inpathogenicity ofsome parasitic fungi ofwheat.
Triticale (x Triticosecale Wittmack), is a
small grain cereal that represents the first
successful attempt by man to synthesize a
new crop species from intergeneric
hybridization. Triticale is the product of a
cross between the genera Triticum and
Secale (Zillinski 1974; Varughese et al.1986a, 1986b). It is usually gr;own for
animal feed but also used for human
consumption in many parts of the world
(Ben Salem 1989; Mergoum et al. 1992).
In Morocco, research on triticale
started in the early 1970s, mainly on
breeding aspects (Mergoum 1988),
resulting in the release of many cultivars
beginning in 1984. Although triticale is
not yet widely grown, the area sown to
this crop is increasing significantly every
year. Triticale has shown excellent
performance in many parts of Morocco,
including coastal areas (sandy soils), high
elevation zones, and particularly the arid
and semi-arid zones (Mergoum et al.1992). One of the main obstacles to cereal
productivity in Morocco is disease
(Lyamani 1989, 1990); however, few, if no,
studies on triticale diseases have been
conducted in Morocco. Therefore, this
study was conducted to: 1) establish an
Major Foliar Diseases of Triticale In Morocco 151
Table 2. Triticale and wheat lines and cultivarsincluded in EA-I and EA·IJ experiments during the1991192 crop cycle.
symptoms were collected and analyzed
in the laboratory for diseaseidentification.
DurumwheatMarzak
Bread wheatJouda
ARDILlA"S"MUS"S"/BTA"S"STIER 4-1TA 76/1638//LYNX"S"REH"S"/HARE 212URON3pm717/1M2A/BN"S"/3/BOK"S"GRF"S"/YOGUI"S"BANTENG"S"SPD"S" PVN76//YOGUI"S"
CARMAN/YOGUrS"OCTONV/MA//IBTO"S"/3/BGL"S"RHINO"S"
EA-II
GRF"S"/IMERINO"S"/MUS"S"YOGUI"S"
TriticaleMERINO"S"/JLO"S"/IMUS 32MUS"S"/LYNX"S"//YOGIJI"S"
DurumwheatMarzak
Bread wheatJouda
EA-'
TriticaleIGUANA"S"ARDILlA"S"D7069//P1243741/SPY/3/
ANZA/PI24GNU 18-2MERINO"S"/JLO/3/
BGL"S"/CINBANTENG"S"IGUANA"S"MERINO"S"/JLOI701/1
TESMO"S"LECHO"S"/TGE"S"MUS"S"/BTA"S"UROMARD"S"ARD"S"BAWS"BANTENG"S"STIER 20URDN3MZAlBGL"S"/IJLO/6/FURY/7C1IWR MITHAN"S"PFT80413/DF"S"//TAPIR"S" REWS"/HARE 212MUS"S"/BTA"S" HARE 263/CIVET"S"Delfine 205 Delfine 205
Pathogen isolation andidentification-Symptoms on diseasedplant samples were used for preliminary
identification of the disease (Ellis 1990).Pycnidia of Septoria spp. and conidia of
Helminthosporium spp. from diseased
plant parts were placed in petri dishescontaining PDA and incubated for seven
days at 20°C. Septoria tritid was thentransferred to YMA, a yeast basedmedium. Septoria nodorum and
Helminthosporium spp. were transferred to
Disease Scalelkey Reaction type
Helminthosporiums 0-15(%) Resistant16-25 Moderate resistant26-50 Susceptible
Septorias 0-2 (0-9) Resistant3-5 Moderate resistant6-9 Susceptible
0-19(%1 Resistant20-40 Moderate resistant41·100 Susceptible
Rusts 0·14 (0·50) Resistant15·20 Moderate resistant21·50 Susceptible
Disease inventoryPlant samples-Since triticale is not
widely grown by farmers, a survey wasconducted in six INRA experimentalstations (Sidi EI Aydi, Khemis Zmamra,
Jemaatt Shaim, Tassaout, Annaceur, andMarchouch) and the NationalAgricultural School (ENA) at Meknes,
where triticale breeding material isgrown. Disease incidence (% of genotypeinfected) and severity were scored at
tillering and early maturity stages ongenotypes included in two yield trials(EA-I and EA-II) using an appropriate
scale (Table 1). Each trial included 24genotypes (20 advanced lines and 4checks; Table 2) laid out in a randomized
block design with four replications. Eachentry was grown in six rows,S m long.
Plant samples from plots showing disease
Table 1. Keys and scales used to evaluate diseasesseverity and reaction type.
Materials and Methods
inventory of foliar disease of triticale and
determine their causal agents; and 2)
determine the reaction of 98 triticale
genotypes to several diseases during
1989/90 and 1990/91 cropping seasons.
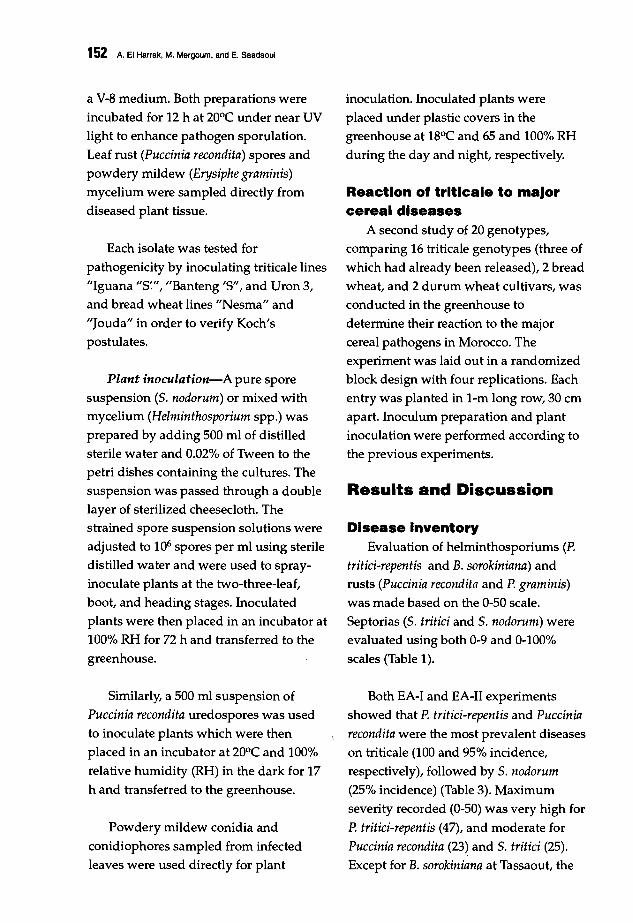
152 A. EI Harrak, M. Mergoum, and E. Saadaoul
a V-8 medium. Both preparations were
incubated for 12 h at 20°C under near UV
light to enhance pathogen sporulation.
Leaf rust (Puccinia recondita) spores and
powdery mildew (Erysiphe graminis)mycelium were sampled directly from
diseased plant tissue.
Each isolate was tested for
pathogenicity by inoculating triticale lines
"Iguana "S~"/ "Banteng /S"/ and Uron 3/
and bread wheat lines "Nesma" and
"Jouda" in order to verify Koch/s
postulates.
Plant inoculation-A pure spore
suspension (5. nodorum) or mixed with
mycelium (Helminthosporium spp.) was
prepared by adding 500 ml of distilled
sterile water and 0.02% of Tween to the
petri dishes containing the cultures. The
suspension was passed through a double
layer of sterilized cheesecloth. Thestrained spore suspension solutions were
adjusted to 106 spores per ml using sterile
distilled water and were used to spray
inoculate plants at the two-three-Ieaf,
boot, and heading stages. Inoculated
plants were then placed in an incubator at
100% RH for 72 h and transferred to the
greenhouse.
Similarly, a 500 ml suspension of
Puccinia recondita uredospores was used
to inoculate plants which were then
placed in an incubator at 20°C and 100%
relative humidity (RH) in the dark for 17
h and transferred to the greenhouse.
Powdery mildew conidia and
conidiophores sampled from infected
leaves were used directly for plant
inoculation. Inoculated plants were
placed under plastic covers in the
greenhouse at 18°C and 65 and 100% RH
during the day and night, respectively.
Reaction of triticale to majorcereal diseases
A second study of 20 genotypes,
comparing 16 triticale genotypes (three of
which had already been released), 2 bread
wheat, and 2 durum wheat cultivars, was
conducted in the greenhouse to
determine their reaction to the major
cereal pathogens in Morocco. The
experiment was laid out in a randomized
block design with four replications. Each
entry was planted in 1-m long row, 30 cm
apart. Inoculum preparation and plant
inoculation were performed according to
the previous experiments.
Results and Discussion
Disease inventoryEvaluation of helminthosporiums (P.
tritici-repentis and B. sorokiniana) and
rusts (Puccinia recondita and P. graminis)was made based on the 0-50 scale.
Septorias (5. tritici and 5. nodorum) were
evaluated using both 0-9 and 0-100%
scales (Table 1).
Both EA-I and EA-II experiments
showed that P. tritici-repentis and Pucciniarecondita were the most prevalent diseases
on triticale (100 and 95% incidence,
respectively), followed by 5. nodorum(25% incidence) (Table 3). Maximum
severity recorded (0-50) was very high for
P. tritici-repentis (47)/ and moderate for
Puccinia recondita (23~ and 5. tritici (25).Except for B. sorokiniana at Tassaout, the
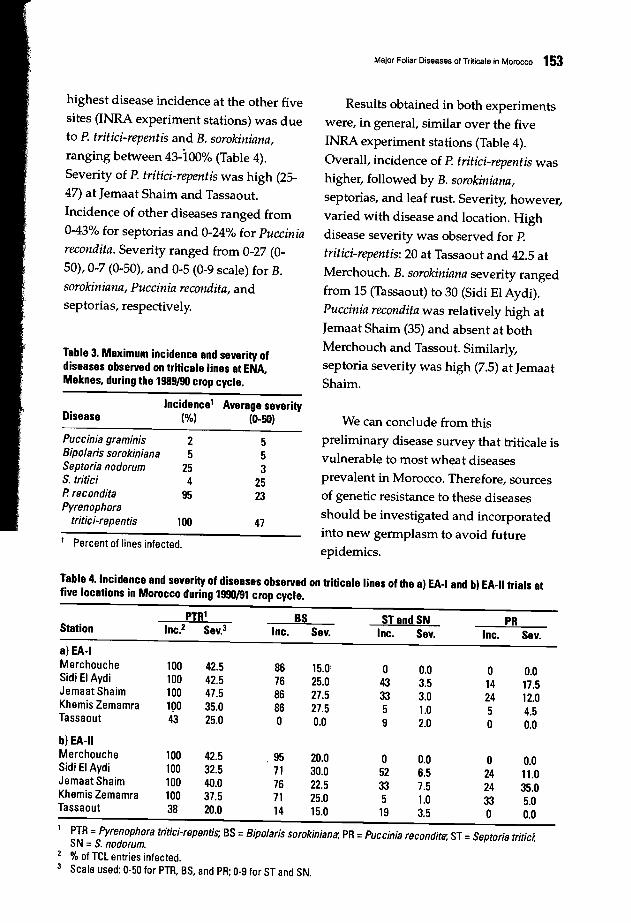
highest disease incidence at the other five
sites (INRA experiment stations) was due
to P. tritici-repentis and B. sorokiniana,ranging between 43-iOO% (Table 4).
Severity of P. tritici-repentis was high (25
47) at Jemaat Shaim and Tassaout.
Incidence of other diseases ranged from
0-43% for septorias and 0-24% for Pucciniarecondita. Severity ranged from 0-27 (0
50),0-7 (0-50), and 0-5 (0-9 scale) for B.sorokiniana, Puccinia recondita, and
septorias, respectively.
Table 3. Maximum incidence and severity ofdiseases observed on triticale lines at ENA.Meknes. during the 1989190 crop cycle.
Incidence' Average severityDisease (%) (0-50)
Puccinia graminis 2 5Bipolaris sorokiniana 5 5Septoria nodorum 25 3S. tritici 4 25P. recondita 95 23Pyrenophora
tritici-repentis 100 47
1 Percent of lines infected.
Major Foliar Diseases of Triticale in Morocco 153
Results obtained in both experiments
were, in general, similar over the five
INRA experiment stations (Table 4).
Overall, incidence of P. tritici-repentis was
higher, followed by B. sorokiniana,septorias, and leaf rust. Severity, however,
varied with disease and location. High
disease severity was observed for P.
tritici-repentis: 20 at Tassaout and 42.5 at
Merchouch. B. sorokiniana severity ranged
from 15 (Tassaout) to 30 (Sidi EI Aydi).
Puccinia recondita was relatively high at
Jemaat Shaim (35) and absent at both
Merchouch and Tassout. Similarly,
septoria severity was high (7.5) at Jemaat
Shaim.
We can conclude from this
preliminary disease survey that triticale is
vulnerable to most wheat diseases
prevalent in Morocco. Therefore, sources
of genetic resistance to these diseases
should be investigated and incorporated
into new germplasm to avoid future
epidemics.
Table 4. Incidence and severity of diseases observed on triticale lines of the a) EA-I and b) EA-II trials atfive locations in Morocco during 1990/91 crop cycle.
PTR' BS STand SN PRStation Inc.2 Sev.3 Inc. Sev. Inc. Sev. Inc. Sev.
a)EA-1Merchouche 100 42.5 86 15.0' 0 0.0 0 0.0Sidi EI Aydi 100 42.5 76 25.0 43 3.5 14 17.5Jemaat Shaim 100 47.5 86 27.5 33 3.0 24 12.0Khemis Zemamra 100 35.0 86 27.5 5 1.0 5 4.5Tassaout 43 25.0 0 0.0 9 2.0 0 0.0
b) EA-IIMerchouche 100 42.5 , 95 20.0 0 0.0 0 0.0Sidi EI Aydi 100 32.5 71 30.0 52 6.5 24 11.0Jemaat Shaim 100 40.0 76 22.5 33 7.5 24 35.0Khemis Zemamra 100 37.5 71 25.0 5 1.0 33 5.0Tassaout 38 20.0 14 15.0 19 3.5 0 0.0
1 PTR = Pyrenophora tritiei-repentis; BS = Bipolaris sorokiniana; PR = Pueeinia reeondita; ST = Septoria tritie;'SN =S. nodofum.% of TeL entries infected.Scale used: 0-50 for PTR, BS. and PR; 0-9 for ST and SN.

154 A. EI Harrak. M. Mergoum. and E. Saadaoui
Resistance of triticale to majorcereal diseases
The disease resistance levels of 16
triticale genotypes, 2 bread wheat, and 2
durum wheat genotypes to artificial
inoculation of the most important cereal
pathogens collected from wheat and
triticale in Morocco under greenhouse
conditions are reported in Table 5. The
results suggest that genetic variability for
diseases resistance exists among triticales.
Two triticale entries (PFT80413/
OF"S" / /Tapir"S" and Gnu 18-2) were
moderately susceptible and susceptible,
respectively, to P. tritici-repentis isolated
from bread wheat and triticale (Table 5).
Iguana"S" was the most resistant triticale
to both isolates. All othertriticales were
moderately resistant to resistant (1-17).
Ourum and bread wheat checks were
moderately resistant (12-23), with durum
scoring relatively higher.
Except for triticale line GNU 18-2,
which was moderately susceptible to both
B. sorokiniana isolates, all other triticale
genotypes, durum wheat Coccorit and
Karim, and bread wheat Nasma were
r~sistant«12) (Table 5). However, bread
wheat Jouda was moderately resistant
(16) to both isolates.
Table 5. Reaction of 16 triticale. 2 bread wheat. and 2 durum wheat lines to artificial inoculation bypathogen isolates originating from bread wheat and triticale.
PTR' BS SN PRGenotype BWz Trit BW Trit BW Trit BW
TriticaleJuanillo 10.00 10.00 5.00 5.00 2.00 3.33 5.66Drira out cross 5.67 5.00 1.66 2.66 5.00 3.66 10.00Delfine 205 3.67 5.00 2.66 3.66 11.66 5.00 41.66Beagle 7.00 6.67 5.00 3.00 6.66 5.00 56.66ARDILlA"S" 2.33 5.00 1.00 3.00 16.66 3.66 1.00IGUANA"S" 0.66 1.33 5.00 3.00 2.00 0.00 0.66BANTANG"S" 3.33 2.00 2.33 5.00 16.66 10.00 4.00PFT 80413/DF"S//TAPIR"S" 23.33 26.67 11.66 8.66 6.66 5.00 2.00MERINO"S"/JLO/3/BGL"S"/CIN 2.00 4.33 5.00 5.00 3.00 3.00 2.00LECHO"S"/TGE"S" 16.66 15.00 8.00 11.66 10.00 6.66 23.33D7069/PI243741/SPY/3/ANZA/PI24 5.00 5.00 8.33 9.33 4.33 5.00 4.33L1RON 8 6.00 6.67 1.00 2.66 5.00 4.33 2.66GNU 18-2 31.66 35.00 16.66 20.00 11.66 5.00 11.66URON-3 6.00 10.00 4.66 5.00 3.00 0.66 0.66REH"S"/ HARE 212 9.00 13.33 3.66 5.00 2.00 3.00 0.00SPD"S" PVN76//YOGUI"S" 4.33 6.67 3.66 5.00 13.33 6.66 2.33
Bread wheatNasma 13.33 15.00 6.66 9.00 26.66 13.33 30.00Jouda 13.33 ' 5.00 16.66 16.66 20.00 10.00 2.33
Durum wheatCoccorit 15.00 23.33 5.00 6.00 31.66 30.00 4.33Karim 18.33 11.67 8.33 9.00 15.00 11.66 2.00
LSD (P = 0.05) 3.10 2.88 3.08 2.22 3.51 2.36 3.33
1 PTR =Pyrenophora tritici-repentis; BS =Bipolaris sorokiniana; PR =Puccinia recondita; ST =Septaria tritic;,SN =S. nodorum.
2 Origin of isolates: BW = Bread wheat, Trit =Triticale.
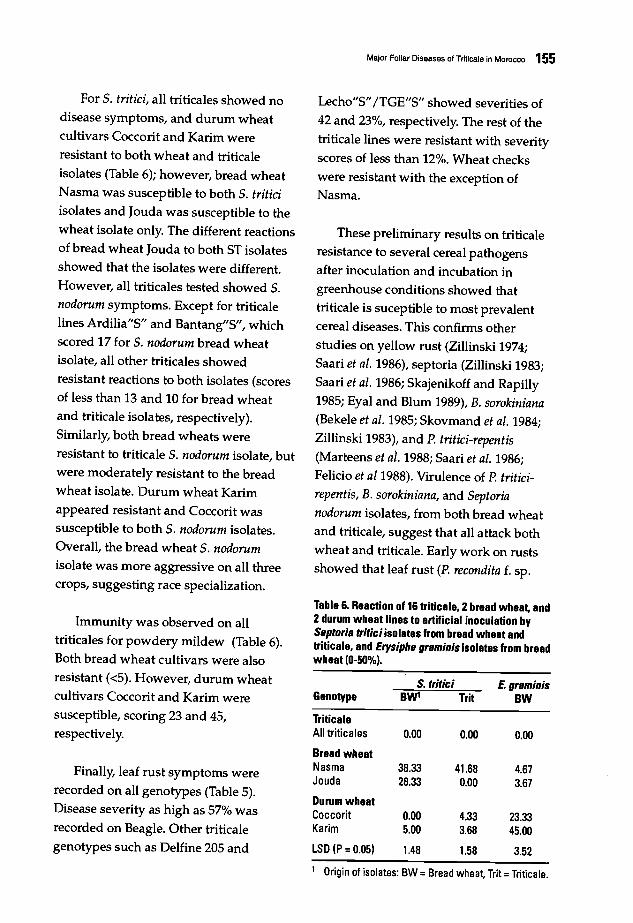
For S. tritici, all triticales showed no
disease symptoms, and durum wheat
cultivars Coccorit and Karim were
resistant to both wheat and triticaleisolates (Table 6); however, bread wheat
Nasma was susceptible to both S. triticiisolates and Jouda was susceptible to thewheat isolate only. The different reactions
of bread wheat Jouda to both ST isolatesshowed that the isolates were different.
However, all triticales tested showed S.nodorum symptoms. Except for triticale
lines Ardilia"S" and Bantang"S", whichscored 17 for S. nodorum bread wheatisolate, all other triticales showed
resistant reactions to both isolates (scores
of less than 13 and 10 for bread wheatand triticale isolates, respectively).Similarly, both bread wheats were
resistant to triticale S. nodorum isolate, butwere moderately resistant to the breadwheat isolate. Durum wheat Karim
appeared resistant and Coccorit wassusceptible to both S. nodorum isolates.Overall, the bread wheat S. llodorumisolate was more aggressive on all threecrops, suggesting race specialization.
Immunity was observed on alltriticales for powdery mildew (Table 6).
Both bread wheat cultivars were also
resistant «5). However, durum wheatcultivars Coccorit and Karim were
susceptible, scoring 23 and 45,
respectively.
Finally, leaf rust symptoms were
recorded on all genotypes (Table 5).
Disease severity as high as 57% was
recorded on Beagle. Other triticale
genotypes such as Delfine 205 and
Major Foliar Diseases of Triticale in Morocco 155
Lecho"S" /TGE"S" showed severities of
42 and 23%, respectively. The rest of the
triticale lines were resistant with severity
scores of less than 12%. Wheat checks
were resistant with the exception ofNasma.
These preliminary results on triticaleresistance to several cereal pathogens
after inoculation and incubation ingreenhouse conditions showed that
triticale is suceptible to most prevalentcereal diseases. This confirms other
studies on yellow rust (Zillinski 1974;Saari et aI. 1986), septoria (Zillinski 1983;
Saari et aI. 1986; Skajenikoff and Rapilly1985; Eyal and Blum 1989), B. sorokiniana(Bekele et aI. 1985; Skovmand et aI. 1984;Zillinski 1983), and P. tritici-repentis(Marteens et ai. 1988; Saari et aI. 1986;Felicio et aII988). Virulence of P. triticirepentis, B. sorokiniana, and Septorianodorum isolates, from both bread wheatand triticale, suggest that all attack bothwheat and triticale. Early work on rustsshowed that leaf rust (P. recondita f. sp.
Table 6. Reaction of 16 triticale. 2bread wheat. and2 durum wheat lines to artificial inoculation bySeptoria tritiei isolates from bread wheat andtriticale. and Erysiphe graminis isolates from breadwheat (0-50%).
S. tritiei E. graminisGenotype BW' Trit BW
TriticaleAll triticales 0.00 0.00 0.00
Bread wheatNasma 38.33 41.68 4.67Jouda 28.33 0.00 3.67
Durum wheatCoccorit 0.00 4.33 23.33Karim 5.00 3.68 45.00
LSD (P =0.05) 1.48 1.58 3.52
1 Origin of isolates: BW =Bread wheat, Trit =Triticale.

156 A. EI Harrak. M. Mergoum. and E. Saadaoui
tritici) (Fuentes 1973; McIntosh and Singh
198q) and stem rust (P. graminis f. sp.
tritici) (Lopez et al. 1973) have a wide host
range including triticale and wheat.
However, new recombinants from triticiand secalis races for certain pathogens can
be also considered (Lopez et al. 1973;Fuentes 1973).
References
Bekele, G.T., Skovmand, B., Gilchrist, L.,and E.J. Warham. 1985. Screeningtriticale for resistance to certain diseasesoccurring in Mexico. Paper presented atthe Eucarpia Meeting of the CerealSection on Triticale, 1984, pp. 559-564.
Ben Salem, M. 1989. Qu'est ce que Ietriticale? Resaux TRAM. 1:10-12.
Ellis, M.B. 1990. DematiaceousHyphomycetes. Surrey, UK:Commonwealth Mycological Institute,CABI. 608 pp.
Eyal, Z., and A Blum. 1989. Canopytemperature and a correlative measurefor assessing host response to Septariatritici blotch of wheat. Plant Dis 73:468471.
Felicio, J.c., Eduardo Camargo, C. de 0.,and N. Leite. 1988. Avalia Hao degenotipos de triticale Em solos de Varzeano estado de Sao Paulo. No periodo de1979 B 1984. Pesq Aaoropec Bras Brasilia23:45-51.
Fuentes, ES. 1973. Triticale diseases.Triticale breeding and research atCIMMYT. CIMMYT Research Bulletin24:34-38.
Lopez, A, Rajaram, S., and L.I. de Bauer.1973. Characterization of triticale stem
., rust. Triticale breeding and research atCIMMYT. CIMMYT Research Bulletin24:39-41.
Lyamani, A 1989. Pathology research atINRA (disease survey). In: Morocco/IVARDA, Report of the 4th CerealCoordination Meeting, pp. 24-25.
Lyamani, A 1990. Fungal foliar diseases ofwheat and barley in Morocco. In: The 8thCongress of the MediterraneanPhytopathological Union, pp. 281-282.
Martens, J.W., Seamen, W.L., and T.G.Atkinson. 1988. Diseases of Field Cropsin Canada. An Illustrated Compendium.Can Phytopathol Soc. 160 pp.
Mcintosh, RA, and S.J. Singer. 1986. Rustsreal and potential problems for triticale.In: Triticale. Proceedings of theInternational Triticale Symposium. AlASOccasional Publications 24:199-207.
Mergoum, M., Ryan, J., and J.P. Shroyer.1992. Triticale in Morocco: potential foradoption in the semi-arid cereal zone. JNat Resour Life Sci Edu 21:137-141
Mergoum,M.1988.Programed'amelioration genetique des triticalesau Maroc. In: Constitution de ReseauxThematiques de Recherche Agricole auMaghreb, 1988, pp. 127-130.
Saari, E.E., Varughese, G., and O.S. Abdalla.1986. Triticale diseases: distribution andimportance. In: N.L Darvey (ed.),Proceedings of the International TriticaleSymposium, pp. 208-231. Aust Inst AgricSci.
Skajennikoff, M., and E Rapilly. 1985.Consequences of triticale introduction onthe parasitic fungi of wheat. In: M.Bernard and S. Bernard (eds.), Geneticsand Breeding of Triticale. Proceedings ofthe 3rd Eucarpia Meeting Cereal Sectionon Triticale, pp. 537-549.
Skovmand, B., Fox, P.N., and RL. Villareal.1984. Triticale in commercial agriculture:progress and promise. Adv Agron 37:145.
Varughese, WH., Pfeiffer, WH., and RJ.Pena. 1996a. Triticale: A successfulalternative crop (part 1). Cereal FoodsWorld 41(7):474-482.
Varughese, WH., Pfeiffer, WH., and RJ.Pena. 1996b. Triticale: A successfulalternative crop (part2). Cereal FoodsWorld 41 (7):635-645
Zillinsky, EJ. 1974. The development oftriticale. Adv Agron 26:315-348.
Zillinsky, EJ. 1983. Common Diseases ofSmall Grain Cereals: A Guide toIdentification. Mexico, D.E: CIMMYT.141 pp.
157
Effect of Crop Rotation and Straw MulchInoculation on Tan Spot and Root Rot inBread and Durum Wheat
N. Nsarellah1 and M. Mergoum2
1 INRA, CRRA de Chaouia, Abda et Doukkala, Settat, Morocco
2 CIMMYT, Mexico, D.P., Mexico
Abstract
Tan spot and root rot are two major diseases ofwheat in Morocco. They affect durum wheatmost severely, especially when planted after another wheat crop. The objectives of thisexperiment were to evaluate the effects ofsowing wheat after a cereal crop and mulching withinfested straw on tan spot and root rot development and on wheat yield. Ten durum wheat andfive bread wheat cultivars were planted in a split-split-plot trial. Tan spot expression, root rotrelated symptoms, plant density, and yield were evaluated. Wheat sown after wheat was mostsusceptible to tan spot and root rot diseases. Mulching with infested straw mostly increased tanspot severity in the wheat-wheat experiment. Yield losses were correlated to severity of tan spotand root rot. Fungicide application reduced tan spot expression but had little to no effect on rootrot symptoms.
Tan spot of wheat, caused by
Pyrenophora tritici-repentis (PTR), has
become important in Morocco in the last
10-15 years. Surveys showed this disease
to most severely affect dururo wheat,
while bread wheat was less affected. Yield
losses have ranged between 12 and 18%.
Several race identification studies showed
moderate variability in overall virulence
and little physiological specialization of
the pathogen. Artificial field and
greenhouse inoculations, disease
evaluation, and resistance screening
methodologies were tested and adapted
under Moroccan conditions. Screening for
resistance allowed the identification of
moderately to highly resistant genotypes.
Resistance is linked to late maturing and
tall plants. Breeding for resistance to tan
spot using the available tall and late
maturing resistant parents in crosses with
adapted material, coupled with selection
under semi-arid conditions, was not
effective due to the linkage of resistance
with undesired traits.
Root rot of wheat is caused by a
complex of pathogens and can annually
cause huge losses. In Morocco, root rot is
caused by Cochliobolus sativus and
Fusarium culmorum. Studies have shown
that durum wheat is most affected in the
dry areas of the country. Root rot research
in Morocco started in the early 1980s. The
responsible pathogens have been
determined in numerous.surveys, field
inoculations techniques have been
developed and successfully applied, and
small genetic differences have
subsequently been observed in durum
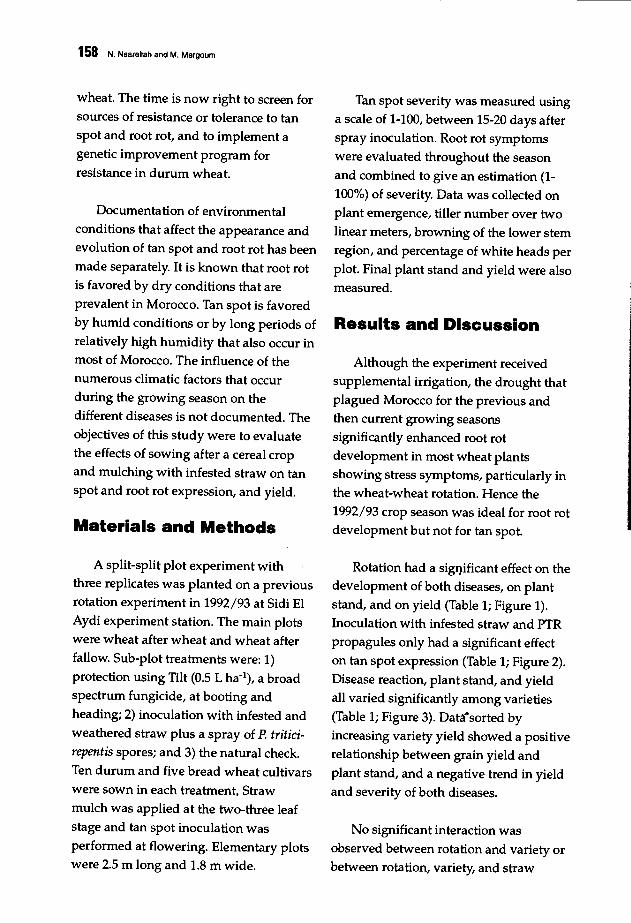
158 N. Nsarallah and M. Margoum
wheat. The time is now right to screen for
sources of resistance or tolerance to tanspot and root rot, and to implement a
genetic improvement program for
resistance in durum wheat.
Documentation of environmental
conditions that affect the appearance and
evolution of tan spot and root rot has been
made separately. It is known that root rotis favored by dry conditions that are
prevalent in Morocco. Tan spot is favoredby humid conditions or by long periods of
relatively high humidity that also occur inmost of Morocco. The influence of thenumerous climatic factors that occur
during the growing season on thedifferent diseases is not documented. The
objectives of this study were to evaluatethe effects of sowing after a cereal cropand mulching with infested straw on tan
spot and root rot expression, and yield.
Materials and Methods
A split-split plot experiment withthree replicates was planted on a previousrotation experiment in 1992/93 at Sidi EI
Aydi experiment station. The main plotswere wheat after wheat and wheat after
fallow. Sub-plot treatments were: 1)protection using Tilt (0.5 L ha-1), a broad
spectrum fungicide, at booting and
heading; 2) inoculation with infested and
weathered straw plus a spray of P. triticirepent is spores; and 3) the natural check.
Ten durum and five bread wheat cultivars
were sown in each treatment. Straw
mulch was applied at the two-three leaf
stage and tan spot inoculation was
performed at flowering. Elementary plots
were 2.5 m long and 1.8 m wide.
Tan spot severity was measured using
a scale of 1-100, between 15-20 days afterspray inoculation. Root rot symptoms
were evaluated throughout the season
and combined to give an estimation (1
100%) of severity. Data was collected on
plant emergence, tiller number over two
linear meters, browning of the lower stemregion, and percentage of white heads per
plot. Final plant stand and yield were also
measured.
Results and Discussion
Although the experiment receivedsupplemental irrigation, the drought that
plagued Morocco for the previous andthen current growing seasons
significantly enhanced root rot
development in most wheat plantsshowing stress symptoms, particularly in
the wheat-wheat rotation. Hence the1992/93 crop season was ideal for root rotdevelopment but not for tan spot.
Rotation had a sigI)ificant effect on thedevelopment of both diseases, on plant
stand, and on yield (Table 1; Figure 1).
Inoculation with infested straw and PTRpropagules only had a significant effect
on tan spot expression (Table 1; Figure 2).Disease reaction, plant stand, and yield
all varied significantly among varieties(Table 1; Figure 3). Data"sorted by
increasing variety yield showed a positive
relationship between grain yield and
plant stand, and a negative trend in yield
and severity of both diseases.
No significant interaction was
observed between rotation and variety orbetween rotation, variety, and straw
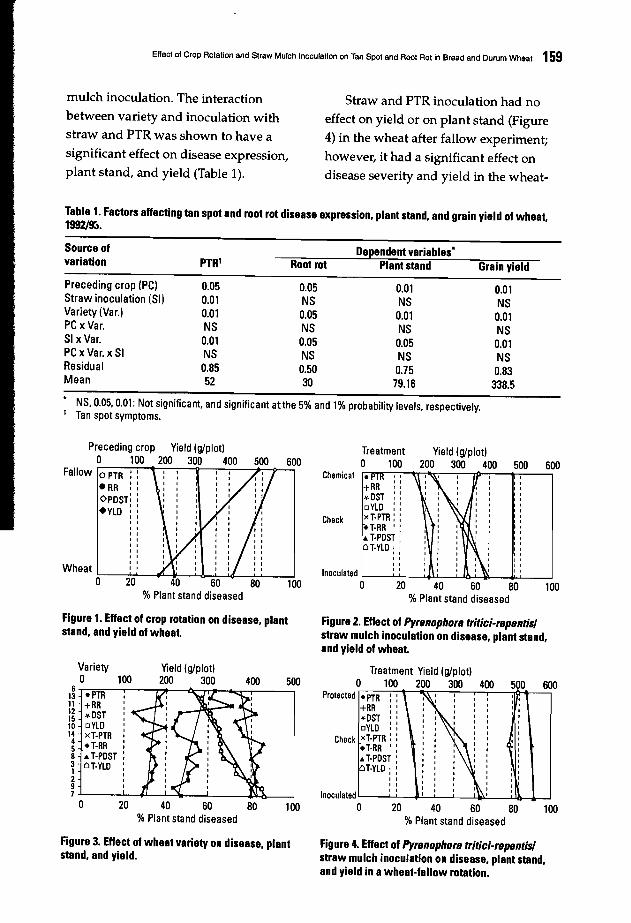
Effect of Crop Rolation and Straw Mulch Inoculation on Tan Spot and Root Rot in Bread and Durum Wheat 159
mulch inoculation. The interaction
between variety and inoculation with
straw and PTR was shown to have a
significant effect on disease expression,
plant stand, and yield (Table 1).
Straw and PTR inoculation had no
effect on yield or on plant stand (Figure
4) in the wheat after fallow experiment;
however, it had a significant effect on
disease severity and yield in the wheat-
Table 1. Factors affecting tan spot and root rot disease expression, plant stand, and grain yield of wheat,19!12m.
Source ofvariation
Preceding crop (PC)Straw inoculation (SI)Variety (Var.)PC x Var.SI xVar.PC x Var.x SIResidualMean
PTR'
0.050.010.01NS0.01NS0.8552
Root rot
0.05NS0.05NS0.05NS0.5030
Dependent variables'Plant stand
0.01NS0.01NS0.05NS0.7579.16
Grain yield
0.01NS0.01NS0.01NS0.83
338.5
• NS. 0.05. 0.01: Not significant. and significant atthe 5% and 1% probability levels. respectively.1 Tan spot symptoms.
Preceding crop Yield (g/plot) Treatment Yield (g/plotla 100 200 300 400 500 600 a 100 200 300 400 500 600
Fallow o PTR : Chemical - , , ,+AA :
,eRR :
,-v-OST :
,OPOST:
,oYLO :
,+YLD :
,Check xT·PTA:,
+T·AA ' :,, .. T·POST ,,ClHLO:
,, , ,, , ,I
, , ,, , , ,Wheat ,
Inoculated, , ,
0 20 80 100 0 20 40 60 80 100%Plant stand diseased
Figure 1. Effect of crop rotation on disease, plantstand, and yield of wheat.
Figure 2. Effect of PyreRophors tritici-repeRtis!straw mulch inoculation on disease, plant stand,and yield of wheat.
Variety Yield (g/plot~ Treatment Yield (g/plotl0 100 200 300 400 500 0 100 200 300 400 500 600
6-PTA Protected -PTA "13 , ,
11 +AA +AA ' ,, ,12 -v-OST -v-OST ' ,15
oYLO oYLD ' ,10 ' ,14 xT·PTA Check xT-PTA : :4 +T·AA +T·AA ':58 .. T·POST .. T·POST :3 ClT·YLO ClT·YLO ; :12 ' ,, ,9
Inoculated' ,
70 20 40 6 80 100 0 20 40 60 80 100
%Plant stand diseased %Plant stand diseased
Figure 3. Effect of wheat variety on disease, plantstand, and yield.
Figure 4. Effect of PyreRophors tritici-repeRtis!straw mulch inoculation on disease, plant stand,and yield in a wheat-fallow rotation.
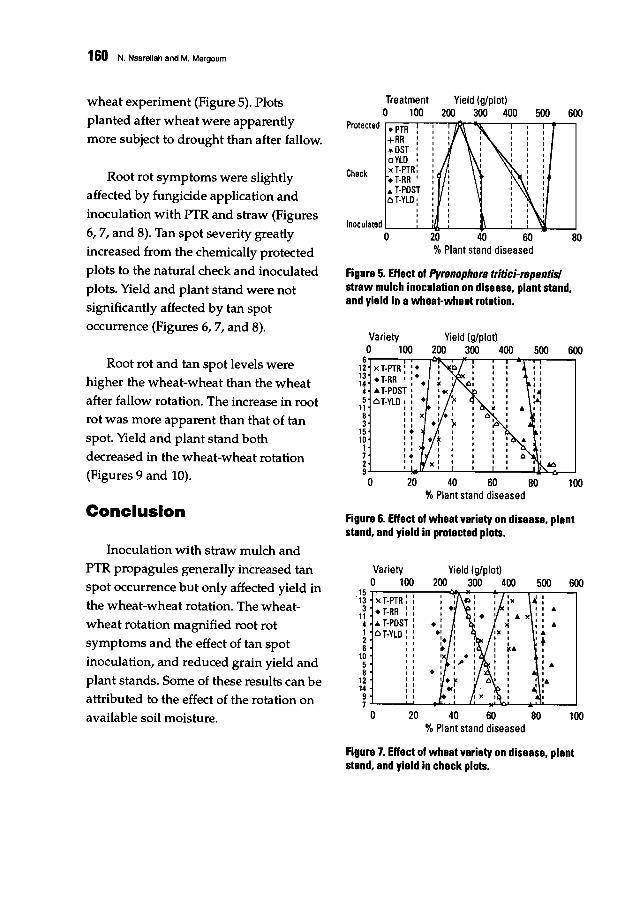
160 N. Nearallah and M. Mergoum
600500Yield (g/plot)
20ll 300 400
Variety Yield (g/plot)0 100 200 30ll 400 500 600
612 xT-PTR: :.13 • T-RR 0 : ••
1~ .a.T-POST 0
5 OT-YLDo: •11 00
8 o 0 x3
0000
15 o.10 00
001 00
7 o.2 00
090 20 40 60 80 100
%Plant stand diseased
Treatmento 100
Protected '.-=P""'TR:--T,-:--.....-rlOr------.-.,....-...,.,--,
+RR :",OST :aYLO 0
xT-PTR:• T-RR '• T-POSTCl T-YLO:
Inoculated L----'--.JlI.l-'---4'---'--'----lIl------'o 20 40 60 80
%Plant stand diseased
Check
Figure 5. Enect of Pyr8Rophors tr;t;c;-rep8Rt;s'straw mulch inoculation on disease, plant stand,and yield in a wheat-wheat rotation.
Root rot and tan spot levels werehigher the wheat-wheat than the wheatafter fallow rotation. The increase in root
rot was more apparent than that of tanspot. Yield and plant stand both
decreased in the wheat-wheat rotation(Figures 9 and 10).
wheat experiment (Figure 5). Plots
planted after wheat were apparentlymore subject to drought than after fallow.
Root rot symptoms were slightly
affected by fungicide application andinoculation with PTR and straw (Figures
6, 7, and 8). Tan spot severity greatly
increased from the chemically protectedplots to the natural check and inoculated
plots. Yield and plant stand were not
significantly affected by tan spotoccurrence (Figures 6, 7, and 8).
Conclusion Figure 6. Enect of wheat variety on disease, plantstand, and yield in protected plots.
Inoculation with straw mulch and
PTR propagules generally increased tanspot occurrence but only affected yield inthe wheat-wheat rotation. The wheat
wheat rotation magnified root rotsymptoms and the effect of tan spot
inoculation, and reduced grain yield and
plant stands. Some of these results can beattributed to the effect of the rotation onavailable soil moisture.
Variety Yield (g/plot)0 100 20ll 300 40ll 50ll 600
15xT-PTR:13
3 • T-RR :114 • T-POST1 OT-YLO:2 06 0
10 0
500
8 0
12 0
1400
9 0
7
0 20 40 60 80 100%Plant stand diseased
Figure 7. Enect of wheat variety on disease. plantstand. and yield in check plots.

Effect of Crop Rotation and Straw Mulch Inoculation on Tan Spot and Root Rot in Bread and Durum Wheat 161
Treatmento 100
Yield (g!plot)200 300 400 500 600 Bibliography
Figure 9. Effect of wheat variety on disease. plantstand. and yield in a wheat-fallow rotation.
Figure 8. Effect of variety on disease. plant stand.and yield of wheat in inoculated plots.
Baye. Y. 1984. Les pourritures racinaires descereales: comportement varietal.influence de la fertilisation azote.Memoire de troisieme cycle. InstitutAgronomique et Veterinaire Hassan II.Rabat. Maroc.
Drechsler. C 1923. Some graminicoulousspecies of Helminthosporium. J AgricRes 24:614-670.
Hosford. RM. Jr.• Larez. CR. and J.J.Hammond. 1987. Interaction of wetperiod and temperature on Pyrenophoratritici-repentis infection and developmentin wheats of differing resistance.PhytopathoI7:1021-1027.
Larez. CR 1985. Effect of environmentaland biological factors on the infectionprocess by Pyrenophora tritici-repentis.Ph.D. thesis. N.D. State University.Fargo.
Lyamani. A. 1988. Wheat root rot in WestCentral Morocco and effects of Fusariumculmonlm and Helminthosporium sativumseed and soil-borne inoculum on root rotdevelopment. plant emergence. and cropyield. Ph.D. thesis. Iowa State University.Ames.
Mergoum. M.• and J.5. Quick. 1990.Implications of root rot inoculation andnitrogen fertilization of wheat cultivarsunder varying moisture stress in WestCentral of Morocco. Agronomy Abstracts101. ASA, San Antonio. IX.
Mergoum. M. 1991. Effects of infection byFusarium acuminatum. Fusariumculmorum. or Cochliobolus sativus onwheat. Ph.D. thesis. Colorado StateUniversity. Fort Collins. CO.
Shoemaker. RA. 1962 Drechslera Ito. Can JBot 40:809-908.
100
700
100
600 700
600
80 100
80
500
Yield (g/plot)200 300 400 500
Yield (g/plot)200 300 400
o 40 60% Plant stand diseased
20 40 60 80% Plant stand diseased
20 40 60%Plant stand diseased
Varietyo 100
13 ..---O'r:-----,j4,...., ---r-tt-.......,...--,---:---:---.6 I I • I
" ,8 I )( I
15 • ' ~ :12 I )( I
11 XT-PTR • :14 .T-RR • : x :10 .. T-POST : ... :4 ~~ • ..3 • ~:1 : )( :5..1...----'----'--...J./t-.....'----...J.-ltJ.-_lI--J'--'----'o
Varietyo 100
1~ .,..x-T-.P-T...,Fi,.........,:-.."..--;-;-----t:~-,-....,......,...,.-...,
1~ .T·RR t10 .. T·POST ,1~ OT-YLD. :14 ,.
15 '.1 :3 ,8 :2 ,9 ..7 .l.-_..L--'--4I--_.J..JL_--'..L-_L.-..u.~_..J
o
1~ "-x-T.-PT-R""":""":--"":r<:l<-_+_.,...----,<......,.........---,-:-----,
:~ • T·RR :: • +:13 .. T·POST : :
1142
OT.YLD.::· :I I I I
8 I I I ••2 I I I.
1 : : ::.5 I I .. I
9 I I • I
4 : : ::.
~ .1.----"-"'---!.l4'..........' -........,,....L-...J.....30...6...J4I-------J
o
Figure 10. Effact of wheat variety on disease. plantstand. and yield in a wheat-wheat rotation.
162
Breeding for Resistance to Spot Blotch inWheat: Global Perspective
M. van Ginkel and S. RajaramCIMMYT, Mexico, D.P., Mexico
Abstract
Spot blotch (Bipolaris sorokiniana) is of increasing concern in developing countries. It
mainly occurs in warm, humid wheat growing environments (ME5) in Latin America, Africa,the Indian Subcontinent, Southeast Asia, and China. More recently, spot blotch has alsoexpanded into the cooler, traditional irrigated rice-wheat production areas (ME1), which may bedue to pathogen adaptation, changes in varietal spectrum, reduction in tillage practices, abroader host-range, or climate modifications. In the hot and warm wheat production regions(ME5), wheat researchers consider spot blotch the number one economic pathogen. Total affectedarea is estimated at about 25 million ha. The lack ofresistant, adapted cuUivars is an urgentproblem. Sources ofspot blotch resistance are: Latin America (e.g., BH1146, CNT1), China(e.g., Shanghai #4, Suzhoe #8, and Yangmai #6), and wild relatives ofwheat or alien species(e.g., Aegilops squarrosa, Thinopyrum curvifolium). One or six genes have been shown tobe involved in resistance. No immunity in wheat is known. Low heritabilities, environmentalcomponents, and unknown variability in the pathogen may make breedingfor resistancedifficult. At CIMMYT, directed crosses are made between high yielding germplasm, adaptedcultivars from target countries, and distinct sources ofresistance. In Mexico, early generationsare shuttled between Toluca (central highlands) and Cd. Obregon (coastal plains). Segregatinggermplasm is selected for resistance to diseases other than spot blotch, such as leafand stemrusts, foliar blights, head scab, and for agronomic type, potential yield, and relative adaptivetraits. CIMMYT's main testing site for spot blotch within Mexico is Poza Rica (21ON, 60 masl).Due to high temperatures and relative humidity, spot blotch is naturally prevalent. In the F4-F7populations, selected materials are grown in Poza Rica. Lines showing slow diseasedevelopment, a "good finish", and plump healthy grain are selected. These are grown in yieldtrials under irrigated conditions at Cd. Obregon under late planting conditions to also allowselection for heat tolerance. Yield is the final deciding factor, plus grain appearance. The topentries are distributed internationally for multilocation testing in the Warm Areas WheatScreening Nursery to about 50 cooperators around the world. Resistant, widely adapted linesare once again used in crosses at ClMMYT, thus building 011 what was achieved.
Target Environments
Spot blotch (Bipolaris sorokiniana,previously Helminthosporium sativum) is a
disease of growing concern in developing
countries. Typically, spot blotch occurs in
warm and humid environments, such as
the nontraditional, subtropical lowland
wheat growing areas in the Andean
region of Latin America, including
Breeding for Resistance to Spot Blotch In Wheal: Global Perspective 163
Bolivia and the warmer regions of Brazil,northeast Argentina, and Paraguay. InAfrica, similar environments are found in
Tanzania and the rainfed wheat growing
areas of Zambia and Madagascar. In theIndian Subcontinent, similar conditions
occur in the warmer parts of eastern
India, most of Bangladesh, and in theterai region of Nepal. In southeast Asia,
most small wheat growing areas in
Thailand, the Philippines and Indonesia,and the high rainfall and warm wheat
growing areas of southern China alsohave similar growing conditions.
Besides spot blotch pressure, wheatproduction in these areas is limited byrelatively high temperatures. In the areas
indicated, mean temperature in thecoolest month is generally above 17°Cand in some cases is above 22°C (see
various contributions in CIMMYT 1985;Klatt 1988; Saunders 1991; Saunders andHettel 1994).
More recently, spot blotch has begunto dramatically expand into the moremoderate and temperate regions of
irrigated rice-wheat production, such asthe vast central and northwestern regions
of the Indian Subcontinent (Diman et ai.1994). Whether this is due to pathogenadaptation, changes in the varietal
spectrum, the use of reduced tillage
practices, or changes in climate remainsto be determined in most cases. In Nepal,
the increase in spot blotch occurrence
was associated with above average warm
temperatures in January (Dubin and van
Ginke11991; Dubin and Bimb 1994). In
these rice-wheat growing areas, another
factor may also playa role: the spot
blotch fungus may be present in smallamounts on rice even though it is
basically a non-host of the disease. The
rice may then serve as a "green bridge" tothe subsequent wheat crop (Duveiller
and Gilchrist 1994). In particular, rice
wheat rotations in which zero orminimum tillage is adopted are likely to
experience increasing spot blotch
pressure (Saunders 1989).
Thus, spot blotch is now not only
located in the earlier, narrowly definednontraditional "tropical" wheat growingareas, but has spread into the large, often
adjacent areas of traditional wheatproduction with slightly more moderateclimates. In ClMMYT notation, the
"nontraditional", tropical environment isreferred to as "mega-environment 5humid" (or MESA), and the irrigated
environment with some heat as "megaenvironment 1 with heat" (or ME1HT).
Not only is spot blotch spreading, buta global survey has also established thatit is considered by wheat researchers as
the number one economic pathogen inthe hot and warm wheat production
regions (ME5), and in the slightly coolerareas (ME1HT) where mean temperature
of the coolest month may drop as low as
12.5°C. Depending on the region,commercial yield losses due to spot
blotch are estimated between 1-20%
(Dubin and van GinkeI1991). Total area
affected by spot blotch is now estimatedat about 25 million ha.

164 M. van Ginkel and S. Rajaram
The lack of resistant, adapted
cultivars can be critical, such as in
Bangladesh, where all commercial
varieties (Akbar, Kanchan, and Aghrani)
are susceptible (Razzaque et aI. 1994),Spot blotch is considered the single major
disease of wheat in Bangladesh, where
disease incidence multiplies annually
(Alam et aI. 1994). In recent years,
moderately resistant material has been
identified (Hossain Azad 1991; Islam
1991), but it has yet to be found suitable
for dissemination to farmers.
Resistance Sources
Sources of spot blotch resistance have
been identified over the years, and their
origins fall into three categories: Latin
America, China, and wild relatives of
wheat or alien species.
The Latin American sources are
mainly derived from Brazil, and may
trace back to Italian ancestry. Older
resistant Brazilian commercial varieties
are BH1146 and CNTl (Mehta 1985).
The Chinese sources are mostly
materials from the Yangtze River Basin,
and in some cases also combine
considerable resistance to head scab
(caused by various Fusarium spp.). Early
Chinese sources of resistance used at
CIMMYT include Shanghai #4, Suzhoe
#8, and Yangmai #6.
Alien resistance sources are many.
Alien sources used at CIMMYT have
centered around crosses involving
Thinopyrum curvifoIium (Mujeeb-Kazi et aI.1996; Villareal et aI. 1992). Using these
alien sources in combination with
Chinese resistance sources, outstanding
lines such as Mayoor and the Chirya
series were developed. It may sometimes
be difficult to accurately quantify or
determine the exact contribution of alien
genes in such multi-parent crosses;
however, we feel there is a component of
alien-derived resistance present in certain
advanced materials developed by Dr. A.
Mujeeb-Kazi at CIMMYT. More recently,
Aegilops squarrosa crosses have shown
impressive resistance to spot blotch in
Mexico.
Other sources of alien genes should
be further exploited (Duveiller and
Gilchrist 1994). Researchers at the Punjab
Agricultural University in Punjab, India,
have studied more than 14,000 entries of
wheat and related wild species,
representing 13 genera and 136 species,
for spot blotch resistance (Dhaliwal et aI.1993; Singh and Dhaliwal 1993). They
identified several promising entries
including Ae. triuncialis, Ae. speltoides, Ae.squarrosa, Ae. triaristata, Triticumdicoccoides, Ae. cylindrica, and T. boeoticum.
An early Mexican variety, Cocoraque,
was found to express field resistance
(Mehta 1985). Kea and Opata showed
adaptation to spot blotch affected regions.
Little study has been done to
determine whether these three sources of
spot blotch resistance contribute
distinctly different mechanisms of
resistance or even different genes. Studies
Breeding for Resistance to Spot Blotch in Wheat: Global Perspective 165
on the inheritance of spot blotch
resistance with Latin American and
Indian resistance sources have shown one
or two genes to be involved (Srivastava etai. 1971; Srivastava 1982; Adlakha et al.1984). Velazquez-Cruz (1994) found six
genes to be segregating in four
moderately resistant to resistant lines
(Gisuz, Cugap, Chirya 1, and Sabuf)
developed at CIMMYT, with two to three
genes providing good resistance levels.
These materials contain various
combinations of Chinese and possibly
alien sources of resistance.
In preliminary trials, Conner (1990)
and Gilchrist et ai. (1991a, 1991b) have
shown that foliar and seed infection by B.
sorokiniana may be determined by
different genetic systems. Although
caused by the same fungus, these are
very different symptoms that may well be
coded by separate genes.
Heritabilities of resistance tend to be
low and much influenced by the growing
environment, as determined by
temperature, humidity, inoculum
pressure, planting date, observation date,
etc. These environmental components
and the unknown variability in the
pathogen make breeding for resistance
difficult (Duveiller 1993; Duveiller and
Gilchrist 1994). No spot blotch immunity
in wheat is known.
Germplasm exchange has enabled
countries with no indigenous sources of
spot blotch resistance to release resistant
varieties to their farmers, e.g., in Zambia,
where spot blotch is the most devastating
disease of rainfed wheat production
(Muyanga 1994; Mukwavi 1995). Most
resistant cultivars in Zambia contain
Brazilian ancestry. Brazilian sources of
resistance were first introduced in 1979
from Passo Fundo (Raemaekers 1985);
however, initially many were susceptible
to leaf rust. In 1984, the introduction
PF7748 was released as Whydah, and in
1986 Hombill (= IAS64/Aldan).
PF73339/Hahn, a CIMMYT cross, was
released as Coucal in 1988 (Raemaekers
1988). The release of these three varieties
allowed yield potential to increase from1.6-1.7 t ha-1 to 2.7 t ha-1 (Mukwavi 1995).
The existence of races in the spot
blotch causal organism has been reported
by Mehta (1981); however, in a study of
206 isolates and 12 test varieties, Hetzler
et ai. (1991) found that only 1-2% of the
variance was due to host-isolate
interaction. If races do occur, their
significance at the field level may be of
little practical relevance, and have only
minor, occasional effects on varietal
resistance in farmers' fields.
Breeding Approach atCIMMYT
Over the past 50 years, the CIMMYT
breeding program has evolved from a
national focus (in Mexico) to addressing
the needs of diverse wheat growing
environments on an international scale.
Presently the program has a global focus,
though emphasizing certain regions and
constraints more than others. This
mandate centers on the development of
166 M. van Ginkel and S. RaJaram
improved germplasm that carries
resistance/tolerance to the major stresses,
but perhaps not all the significant
secondary stresses. Constant vigilance is
needed to ascertain whether secondary
stresses are becoming major stresses. The
latter appears to be increasingly the case
for spot blotch, although it was never a
truly minor disease in many countries.
Our main testing site within Mexico islocated near the city of Poza Rica,
situated at 21°N and 60 masI, on the
Caribbean coast. During the winter
period, temperatures drop and wheat
development is possible at this site. From
late January onwards, temperature and
relative humidity (RH) rise dramatically.
In a matter of a few weeks, in most years,
endemic spot blotch reaches severe
epidemic levels. No artificial inoculation
is needed. Yield losses of up to 43% have
been noted under these conditions
(Villareal et aI. 1995). Germplasm has
been screened at this site since the early
1970s, but only in 1981 did breeding for
spot blotch resistance become a stated
priority (Kohli et aI. 1991).
The breeding process starts with the
choice of parents to be crossed. Specific
crosses are made between high yielding
germplasm, adapted varieties from target
countries, and sources of spot blotch
resistance. Information obtained from
international data analysis, based on the
international nurseries and trials
distributed by CIMMYT, helps to make
proper parental choices. The mode of
intercrossing may be simple, top, or
backcross.
The early generations are shuttled
between the Toluca selection site
(Mexican Highlands: 19°N, 2640 masI,
high rainfall, moderate temperatures)
and Cd. Obregon (northwestern Mexican
coastal plains: 27°N, 40 masI, irrigated,
moderate/warm temperatures) (Rajaram
et aI. 1996). Each crop cycle takes six
months. At these two sites, the
segregating germplasm is selected for
resistance to diseases other than spot
blotch, such as leaf and stem rusts, foliar
blights, and head scab. In addition,
strong selection is applied for agronomic
type, potential yield, and adaptation
traits in the target environment. Growing
the early generations directly under spotblotch pressure in Poza Rica does not
appear to allow sufficient rounds of
segregation for recombination of desired
genes; hence the practice has been de
emphasized. Resistance appears to be
based on many minor genes with small,individual but additive effects, requiring
the postponement of strong selection
pressure to the later generations.
When the necessary traits that can be
selected for in Toluca and Cd. Obregon
have been increased in frequency in the
still segregating populations, they are
grown in Poza Rica for the F4-F7 phases.
The planting date in Poza Rica is late
November to mid December; earlier
planting dates result in higher disease
levels. Annually in Poza Rica, several
hundred segregating populations
experience a severe onslaught of spot
blotch, starting in late January. During
visual progeny selection, emphasis is on

Breeding for Resistence to Spot Blotch in Wheet: Global Perspective 167
identifying lines that show a slow disease
development and a "good finish"
(Villareal et al. 1985), Le., a bright, golden
peduncle. Following the visual
identification of populations and lines
with relatively less disease, those
materials are harvested. Strict selection
against black point (mainly due to the
same spot blotch causal organism B.sorokiniana) and for plump bold seed is
then carried out. The selected materials
are planted at EI Batan. Here, selection is
carried out against leaf rust, following
artificial inoculations with highly virulent
races. Subsequently the now considerably
reduced group of lines is once again
planted in Poza Rica.
When the latest advanced lines
emerge from this alternating, shuttling
process, they are grown as unreplicated
yield trials under irrigated conditions at
Cd. Obregon. The planting date,
normally in late November, is now
delayed until January /February. The
materials are thus exposed to increasing
temperatures (30-39°C) as grainfilling
takes place in May/ early June. Yield plus
grain appearance are the final deciding
factors in the selection process. At the
same time, a copy of these yield-trial
entries are planted in Poza Rica to
reconfirm continuing resistance in the
field.
The highest yielding materials are
shuttled again through EI Batan and
Toluca for a final round of selection for
agronomic type and resistance to disease
(other than spot blotch). At this stage,
artificial inoculation with F. graminearummay be carried out in Toluca to ascertain
if that resistance has also been
incorporated - an additional benefit.
The selected entries (several
hundreds) are then grown in large-scale
replicated trials in Cd. Obregon,
alongside checks from the target
countries, which are again late planted to
create heat stress. Final yield and
testweight must be high for the best
entries to be promoted. At the same time,
a set of the same entries is grown in Poza
Rica for confirmation of spot blotch
resistance.
The top-yielding resistant entries
from this final round of selection,
numbering 50-100, are distributed
internationally for multilocation testing
(Rajaram and van Ginke11995; Rajaram etal. 1996) in the Warm Areas Wheat
Screening Nursery (WAWSN). The latter
nursery is annually requested by about 50
cooperators around the world. The lines
that show wide adaptation, or adaptation
specifically in global hotspots, are once
again used in crosses at CIMMYT to start
a new round of selection, building on
what has been achieved. In this way
optimal and continuous progress is
achieved.
When appropriate, advanced lines
and, occasionally, segregating
populations, are shuttled with global
hotspots, such as Brazil and Zambia,
prior to global distribution. Once the spot
blotch virulence spectrum is better
understood, more early generation

168 M. van Ginkel and S. Rajaram
shuttling with hotspots around the world
representing different virulences may be
needed. Presently, proof for such
variability remains to be clearly
confirmed.
Elite lines identified in the past few
years are listed in Table 1. Upon
production, these elite lines are also
shared with CIMMYT and other
pathologists for more detailed studies,
often in collaboration with CIMMYT
breeders. These studies may generate an
understanding of resistance that will help
to identify improved parents that
contribute different resistance genes.
Thus breeding activities will be facilitated
in the future.
References
Adlakha, K.L./ Wilcoxon, R.D., and S.P.Raychaudhuri. 1984. Resistance of wheatto leaf spot caused by Bipolarissorokiniana. Plant Dis 68:320-321.
Alam, K.B., Shaheed, M.A., Ahmed, A.U./and P.K. Malakar. 1994. Bipolaris leafblight (spot blotch) of wheat inBangladesh. In: D.A. Saunders and G.P.Hettel (eds.), Wheat in Heat-StressedEnvironments: Irrigated, Dry Areas andRice-Wheat Farming Systems, pp. 339342. Mexico, D.E: CIMMYT.
Table 1. Entries most resistant to spot blotch (8;polsr;s sorok;n;sns) from recent international Warm AreasWheat Screening Nurseries (WAWSN).
Nursery Cross Pedigree Score
15t WAWSN Cno79*2/Prl CM90312-D-3B-5Y-l B-OY 4.0Ning 7840 4.0Wuhan #1 43B·OY 4.0
2nd WAWSN Gov/Az//Mus/3/Dodo/4/Bow CM79515-I-l M-07Y-Ol M-5Y-2B-OY 3.5Vee#5/3/Gov/Az//Mus CM79961-18Y-02M-OY-9M-OY 3.5ThbIllAS20/H567.71 CM81770-1Y-06PZ-1Y-15M-OY 1.5
3rd WAWSN Vee#7/Bow CM76736-36Y-06M-013Y·6B-OY 3.0Sha#4l/MynaNul CM91098·24Y·OM-OY-5M-OY 3.0Milan CM75113-B-5M-1Y-05M-7Y-l B-OY 3.3Sha#4/Lira CM91097-1Y-OM-OY-3M-OY 3.3
4th WAWSN Milan CM75113-B-5M-1Y-05M·7Y-l B-OY 4.0IAS58/4/KaI/BbI/Ci/3/Ald/5Nee CM88971-18Y-OM-OY-5M-OY 4.8
5th WAWSN RPB14.68/PvnI/Pho/3/Mon/Ald/4/Parrot CM90254-B-4M-l PR-OM-2Y-OM 6.0Sha#7/Weaver CM95119-4Y-OM-OY-2M-ORES 6.0Sha#8/Weaver CM95123-3Y-OM-OY-3M-ORES 6.0
6th WAWSN CStAg.cuI/Glen/3/Ald/Pvn/4/Suz#8 CIGM87.123-3PR-4M-1PR-030M-l M-OHer 4.2CS/Ag.cuI/Glen/3/Ald/Pvn/4/Suz#8 CIGM87.123-3PR-4M-l PR-030M-2M-OHer 4.2
7th WAWSN Mayoor CIGM84.295-24PR-OPR 7.1Mayoor CIGM84.295-4PR-OPR 7.1Chirya.l CIG M87.11 0-lY-3M-l PR-l M·3PR-2B-OPR 7.1
New group Sabuf CM95073-3Y-OM-OY-4M-ORES 3.0
Note: Scores used for the first five nurseries are means across locations using the 0-9 scale indicating relativeheight of the disease. The 6th and ph WAWSN were scored for spot blotch using the double digit scale(00-99), in which asecond digit quantifies disease severity. Epidemic levels varied between nurseries/years,therefore direct comparisons of scores between nurseries cannot be made.
Breeding for Resistanca to Spot Blotch in Wheat: Global Parspective 169
CIMMYT. 1985. Wheats for the Moretropical Environments. A Proceedings ofthe International Symposium. Mexico,D.E: CIMMYT. 354 pp.
Conner, RL. 1990. Interrelationship ofcultivar reaction to common root rot,black point, and spot blotch in springwheat. Plant Dis 74:224-227.
Dhaliwal, H.S., Singh, H., Gill, KS., andH.S. Randhawa. 1993. Evaluation andcataloguing of wheat germplasm fordisease resistance and quality. In: AB.Damania (ed.), Biodiversity and WheatImprovement, pp. 123-140. New York:John Wiley and Sons.
Diman, S.D., Chaudhary, M.K, Panwar,V.S., and KS. Verma (eds.). 1994.Proceedings of the Symposium onSustainability of the Rice-Wheat Systemin India. 233 pp.
Dubin, H.J., and H.P. Bimb. 1994. Studies ofsoilborne diseases and foliar blights ofwheat at the National Wheat ResearchExperiment Station, Bhairahawa, Nepal.Wheat Special Report No. 36. Mexico,D.F.: CIMMYT. 30 pp.
Dubin, H.J., and M. van Ginkel. 1991. Thestatus of wheat diseases and diseaseresearch in warmer areas. In: D.A.Saunders (ed.), Wheat for theNontraditional Warm Areas. Proceedingsof the International Conference, pp. 125145. Mexico, D.E: CIMMYT.
Duveiller, E. 1993. The non-specific foliarpathogens (NSFP). In: Section E of:Background Material for the Cropprotection Subprogram External Review,pp. 6-18. Mexico, D.E: CIMMYT.
Duveiller, E., and L. Gilchrist, 1994.Production constraints due to Bipolarissorokiniana in wheat: current situationand future prospects. In: D.A Saundersand G.P. Hettel (eds.), Wheat in HeatStressed Environments: Irrigated, DryAreas and Rice-Wheat Farming Systems,pp. 343-352. Mexico, D.E: CIMMYT.
Gilchrist, L.I., Pfeiffer, W.H., and S. Rajaram.1991a. Progress in developing breadwheats resistant to HeIminthosporiumsativum. In: D.A Saunders (ed.), Wheatfor the Nontraditional, Warm Areas, pp.469-472. Mexico, D.E: CIMMYT.
Gilchrist, L.I., Pfeiffer, W.H., and C.Velazquez. 1991b. Resistance toHelminthosporium sativum in breadwheat: relationship among infected plantparts and associated with agronomictraits. In: D.G. Tanner (ed.), DevelopingSustainable Wheat Production Systems.The 8th Regional Wheat Workshop forEastern, Central and Southern Africa, pp.176-181. Addis Ababa, Ethiopia:CIMMYT.
Hetzler, J., Eyal, Z., Mehta, YR, Campos,L.A., Fehrmann, H., Kushnir, U.,Zekaria-Oren, J., and L. Cohen. 1991.Interactions between spot blotch(Cochiiobolus sativus) and wheat cultivars.In: D.A Saunders (ed.), Wheat for theNontraditional, Warm Areas, pp.146164. Mexico, D.F.: CIMMYT.
Hossain, Azad, AK 1991. Studies on thesources of resistance in germplasm/lines/cultivars of wheat in Bangladeshagainst leaf blight. In:. Proceedings of theInternational Botanical Conference, 1991,pp. 10. Botanical Society, Dhaka.
Islam, M.A 1991. Genetic research in wheatfor stress tolerance: I. Characterization ofgermplasm under late planting nonirrigated conditions (in Bangladesh).Proceedings of the Workshop onBangladesh Agricultural UniversityResearch Progress, 1991.
Klatt, AR (ed.). 1988. Wheat ProductionConstraints in Tropical Environments.Mexico, D.F.: CIMMYT. 410 pp.
Kohli, M.M., Mann, C.E., and S. Rajaram.1991. Global status and recent progressin breeding wheat for the warmer areas.In: D.A Saunders (ed.), Wheat for theNontraditional, Warm Areas, pp. 96-112.Mexico, D.F:: CIMMYT.
Mehta, Y.R 1981. Identification of races ofHelminthosporium sativum of wheat inBrazil. Pesquisa Agropecuaria Brasilia16(3):331-336.
Mehta, Y.R 1985. Breeding wheats forresistance to Helminthosporium spotblotch. In: Wheats for the More TropicalEnvironments. A Proceedings of theInternational Symposium, pp. 135-144.Mexico, D.F.: CIMMYT.
170 'M. van Glnkel and S. Rajaram
Mujeeb-Kazi, A, Villareal, RL., Gilchrist,L.I., and S. Rajaram. 1996. Registration offive wheat germplasm lines resistant tohelminthosporium leaf blight. Crop Sci36:216-217.
Mukwavi, M.V. 1995. Breeding for diseaseresistance in rainfed wheat in Zambia.In: D.L. Danial (ed.), Breeding forDisease Resistance with Emphasis onDurability. Proceedings of a RegionalWorkshop for Eastern, Central andSouthern Africa, pp. 143-145.
Muyanga, S. 1994. Wheat production andresearch in Zambia: constraints andsustainability. In: D.G. Tanner (ed.),Developing Sustainable WheatProduction Systems. The 8th RegionalWheat Workshop for Eastern, Centraland Southern Africa, pp. 57-64. AddisAbaba. Ethiopia: CIMMYT.
Raemaekers, R 1985. Breeding wheat withresistance to Helminthosporium sativum inZambia. In: Wheats for the More tropicalEnvironments. A Proceedings of theInternational Symposium, pp. 145-148.Mexico, D.E: CIMMYT.
Raemaekers, R 1988. Helminthosporiumsativum: Disease complex on wheat andsources of resistance in Zambia. In: ARKlatt (ed.), Wheat ProductionConstraints in Tropical Environments,pp. 175-186. Mexico, D.E: CIMMYT.
Rajaram, S., Singh, RP., and M. van Ginkel,1996. Approaches to breed wheat forwide adaptation, rust resistance anddrought. In: RA Richards, c.w. Wrigley,H.M. Rawson, G.J. Rebetzke, J.L.Davidson, and RLS. Brettell (eds.),Proceedings of the 8th Assembly of theWheat Breeding Society of Australia.Tamworth, Australia: Wheat BreedingSociety of Australia.
Rajaram, S., and M. van Ginkel. 1995.Wheat Breeding Methodology:International Perspective. Mexico, D.E:CIMMYT. 17 pp.
Razzaque, M.A, Hossain, AB.S., Ahmed,S.M., Sarkar, AK.D., Rahman, M.,Barma, C.D., and R Amin. 1994. Wheatbreeding strategies in the rice farmingsystem of Bangladesh. In: D.A Saundersand G.P. Hettel (eds.), Wheat in HeatStressed Environments: Irrigated, DryAreas and Rice-Wheat Farming Systems,pp. 239-246. Mexico, D.E: CIMMYT.
Saunders, D. 1989. Rice-wheat rotation:constraints and future directions. In: L.RPollard and E. Cervantes (eds.),Proceedings of the International RiceResearch Conference, 1987. Los Banos,Laguna, Philippines: IRRL
Saunders, D.A (ed.). 1991. Wheat for theNontraditional, Warm Areas. Mexico,D.E: CIMMYT. 549 pp.
Saunders, D.A., and G.P. Hettel (eds.). 1994.Wheat in Heat-Stressed Environments:Irrigated, Dry Areas and Rice-WheatFarming Systems. Mexico, D.E:CIMMYT. 402 pp.
Singh, P.J., and H.S. Dhaliwal. 1993.Resistance to foliar blights of wheat inAegilops and wild Triticum species.Indian Phytopathology 46(3):246-248.
Srivastava, a.p. 1982. Genetics of resistanceto leaf blight in wheat. Indian J Genet42:140-141.
Srivastava, a.p., Luthra, J.K., and P.N.Narula. 1971. Inheritance of seedlingresistance to leaf blight of wheat. IndianJ Genet Plant Breeding 45:941-943.
Velazquez Cruz, C. 1994. Genetica de laResistencia a Bipolaris sorokiniana enTrigos Harineros. Ph.D. thesis,Montecillo, Mexico. 84 pp.
Villareal, RL., Mujeeb-Kazi, A, Gilchrist,L.L, and E. del Toro. 1995. Yield loss tospot blotch in spring bread wheat inwarm nontraditional wheat productionareas. Plant Dis 79:893-897.
Villareal, RL., Rajaram, S., Gilchrist, L., andA Mujeeb-Kazi. 1992. Advanced linesderived from wheat (Triticum aestivumL.) and Thinopyrum curvifolium resistantto Helminthosporium sativum. In:Abstracts: International Crop ScienceCongress, 1992. Ames, lA, USA: CropScience Society of America/Iowa StateUniversity.

171
Evaluating Spot Blotch Resistance ofWheat: Improving Disease Assessmentunder Controlled Conditions and in theField
E. Duveiller!, I. Garcia!, J. Franco!, J. Toledo2, J. Crossa!, and E Lopez]
] CIMMYT, Mexico, D.E, Mexico2 Centro de Investigaci6n Agricola Tropical (CIAT), Santa Cruz, Bolivia
Abstract
Studies were conducted on spot blotch resistance ofwheat at the seedling stage. Resultsshowed that plants inoculated with Bipolaris sorokiniana, causal agent ofspot blotch, shouldbe exposed to conditions of25°C and 100% relative humidity (RH) for 24 h and then incubatedat 24°C and 85% RHfor 144 h to allow the detection ofstatistically significant differences inresistance between genotypes. Among the components of resistance studied, lesion density wasdifficult to assess. Standardization ofexperimental conditions was critical for the correctappraisal ofgenetic resistance at the seedling stage and differences between genotypes tended tobe obscured as a result ofhigh data variation. In the field, comparison ofAUDPC (area underdisease progress curve) was the best approach to separate genotypes based on disease scoresrepeated over time. Differences in spot blotch resistance observed among genotypes in PozaRica, Mexico, were generally in agreement with data observed elsewhere; however, therelationship between disease severity, yield loss, plant size, and earliness appeared to becomplex. Due to high disease pressure, early genotypes such as NL297, harboring some level ofspot blotch resistance, appeared susceptible. Studies on spot blotch resistance under climaticconditions more favorable for the wheat crop are needed in order to detect moderate resistancelevels and to better assess the effect ofdisease on yield.
Spot blotch, caused by Bipolarissorokiniana, is a serious leaf blight ofwheat (Triticum aestivum) in MegaEnvironment SA (MESA), characterizedby high temperature (coolest month>17"C) and high relative humidity (RH)(Dubin and van Ginke11991; van Ginkeland Rajaram 1993). The disease is one ofthe major biotic stresses hamperingcommercial wheat production in some ofthe warmer tropical areas. Yield lossesbetween -20 and 80% have been reported
(Duveiller and Gilchrist 1994). In thehumid subtropics of South Asia, wherethe irrigated rice-wheat rotation coversmore than 12 million ha, there is growingevidence that stress conditions areincreasing the severity of foliar blights(Dubin and Bimb 1994). Moreover,leaders from the national agriculturalresearch systems (NARSs) have stressedthe increasing need for better spot blotchresistance in wheat grown underoptimum and irrigated conditions (also
172 E. Duveilier et al.
known as the MEl, Le., irrigated, low
rainfall, and temperate growing
conditions) (van Ginkel and Rajaram
1993; CIMMYT 1995).
Several sources of spot blotch
resistance have been identified in wheat
(Duveiller and Gilchrist 1994; Velasquez
1994; Dubin and Rajaram 1996), but it is
generally accepted that resistance of high
yielding genotypes is not yet satisfactory.
Progress in obtaining germplasm with
better disease resistance has been slow
due to the quantitative nature of durable
spot blotch resistance and the lack of
knowledge on screening criteria to
achieve a reliable measurement of actual
resistance. Few studies have been
conducted to detect differences among
wheat genotypes based on components of
partial resistance (Mehta 1981). Although
moisture and high temperature increase
disease progress in the field, little is
known of the effect of environmental
conditions on components of resistance
that may allow a better measurement of
small, quantitative differences in
resistance among wheat genotypes.
Therefore, components of spot blotch
resistance were studied in 10 bread wheat
genotypes at the seedling stage,
incubated under different temperature
and moisture regimes. The purpose was
to determine experimental conditions
that allow better assessment of disease
resistance at an early stage. Results were
compared with disease observations on
adult plants in the field and with yield
losses under a natural epidemic.
Materials and Methods
Resistance components at theseedling stage under controlled.conditions and adult plantresistance in the field
Genotypes-Ten genotypes grown in
geographically separate areas and with
distinct selection histories were chosen
for their different levels of spot blotch
resistance. Ciano and Sonalika are known
to be susceptible, and BH1146, Suzhoe#8,
K4, and NL297 have some level of
resistance. CS/Th. Curv./ /Glen.81/3/Ald/Pvn Cign84.295-1M-1PR-4M-OPR
OM-OY-2Y, a genotype resulting from an
interspecific cross between wheat and
Thinopyrum curvifolium, is considered
resistant. UP262 is a popular variety
largely grown in South Asia. Sawgat has
been recently released in Bangladesh.
Kvz/K4500 L.6.A.4. SW0176-3M-1Y-lOY
1Y-2M-OY-OPZ-OY is known for its tan
spot resistance and may also have some
resistance to spot blotch.
Experiments under controlled
conditions-At the four-leaf stage, all 10
genotypes in four replicates (four pots
with five plants per pot) were spray
inoculated with 50 ml of a 7,500 spore mI
l suspension of BS14M1 B. sorokiniana
monospore strain isolated from wheat
collected in Poza Rica, Mexico (60 masl,
21°N). The strain was grown on 30% V8
agar medium under a 12 h photoperiod
at room temperature. After seven days,
petri dishes were flooded with distilled
sterile water and scraped with a spatula
before filtration on cheesecloth to obtain a
spore suspension without mycelium. A
Evaluating Spot Blolch Rasistanca of Whaat: Improving Diseasa Assassmant undar Controllad Conditions and In the Field 173
Fuchs Rosenthal counting chamber was
used to adjust spore concentration.
Tween-20 (0.01%) was added to the
suspension to increase inoculum
adherence to the leaf. After inoculation,
pots were not moved (about 20 minutes)
until all plants were dry to fix the
inoculum onto the leaf. Pots were then
incubated in a plastic humid room where
a gentle mist of distilled water was
continuously supplied using a modified
ultrasonic humidifier for 4, 24, or 48 h.
After exposure to 100% RH and 25 ± 2°C,
incubation continued in a controlled
Conviron growth chamber at 12, 18, 24, or
30°C and 85% RH for 164, 144, and 120 h.
Thus, 12 experiments, hereafter referred
to as 'incubation condition', were
conducted. In both incubation chambers,
pots were arranged according to a
randomized complete block design.
Five resistance components were
measured 168 h after inoculation on the
third leaf of all five plants. Lesion density
(lesion cm-Z) was calcu!ated after
counting the number of lesions per leaf
and dividing by leaf area. The latter was
estimated as 0.7(L x 1) where L =leaf
length and 1=leaf width, based on earlier
observations (Duveiller, unpublished).
Lesion size (mmZ) was measured on five
randomly spotted lesions per leaf using
the assessment key developed by
Roumen (1991) for estimating the size of
leaf lesions caused by rice blast. Percent
diseased leaf area (%DLA) was assessed
using the scale proposed by Hetzler
(1992). Lesion type was noted according
to the following tentative 1-5 key: 1 =distinct black lesions; 2 =distinct brown
lesions; 3 = distinct lesions, black or
brown, surrounded by a clear yellow
chlorotic halo; 4 =diffuse brown
inconspicuous lesions with some
chlorosis; and 5 =coalescing lesions on
more than half of the leaf. Disease
severity was also appraised using the 0-5
scale proposed by Adlakha et al. (1984): 0
=leaf area free of spots; 1 =necrotic spots
without chlorosis, up to 5% of the leaf
area involved; 2 =necrosis spots withlight chlorosis, 6-20% of the leaf area
involved; 3 =necrotic spots with
pronounced chlorosis, 21-40% of the leaf
area involved; and 5 =spots merging,
more than 60% of the leaf area involved.
Statistical analysis was conducted with
the help of SAS (SAS, Inc.) using the
averaged data per pot.
Field trial-The 10 genotypes were
planted on November 27,1994, !n Poza
Rica, where the humid subtropical
climate favors the occurrence of severe
spot blotch epidemics every year. Plots
(0.75 x 2m) were arranged following a
randomized complete block design in
three replicates in two adjacent fields
with and without fungicide protection.
Fungicide protection was done by
spraying 0.5 L ha-1 of Folicur (ai
tebuconazole) every 10 days from early
tillering to early dough, in order to ~void
any spot blotch development in the
controlled plots. Disease scores were
taken on January 30, and February 6 and
13,1995, in the diseased field using the
double digit 00-99 assessment scale
developed by Saari and Prescott (1975;
Eyal et al. 1987). Yield (kg ha-1) and 1000
grain weight (g) were measured after
174 E. Duveiller at al.
harvesting all plots in both fields. Percent
yield and 1000-grain weight losses were
calculated.
Assessment of area underdisease progress curve (AUDPC)and apparent infection rate
Genotypes-A set of 26 bread wheat
genotypes, tentatively divided into four
groups based on earliness (late-early) and
plant height (tall-short), were sown in
Poza Rica on November 17, 1995. Results
of the early and short group of entries
including Sonalika, Vicam, NL297, Ciano,
UP262, Batuira, and Chil/Chumai#18 are
presented in this paper.
Disease evaluation-After flowering,
%OLA was assessed on five tillers. Three
disease scores were taken on the flag (F)
and F-1 leaf in order to calculate the
AUOPe. The logit of the diseased portion
of infected leaf tissue was calculated foreach genotype per replicate and 'regressed
over time in order to calculate the
apparent infection rate (r) (Zadoks and
Schein 1979). The ANOVA was conducted
on AUOPC and r, and means were
separated based on Tukey's studentized
range test.
Results
Resistance components at theseedling stage under controlledconditions and adult plantresistance In the field
Analysis of variance independently
conducted for all 12 experiments showed
highly significant differences among
genotypes (P<O.Ol and P<0.05) for almost
all five resistance components when
plants were incubated for 24 h at 25°C
and 100% RH just after inoculation,
independent of the temperature in the
second incubation chamber (Table 1).
However, as shown in Figure 1, the effect
of temperature in the second incubation
chamber is notable; incubation at 30°C
allowed the detection of highly significant
differences between genotypes for all
components of resistance except severity
when the incubation period in the plastic
chamber was 4 or 48 h (Table 1). The
lowest P values for differences between
genotypes were found for all components
of resistance when plants were first
incubated af 100% RH for 24 h and then
at 24°C and 85% RH. P = 0.001 for lesion
density and P =0.0001 for %OLA, lesion
type, and severity suggested that
differences among genotypes at the
seedling stage are best detected under
these incubation conditions. The lowest P
value (P =0.005) for lesion size was
observed when temperature was 30°C in
the Conviron chamber after the first 24 h
incubation.
Figure 1 shows that a minimum of 24
h at 100% RH just after inoculation is
advisable for successful infection. LesiOll
size, type, and severity similarly
increased according to temperature in the
second incubation chamber (Figures la,
1b, and 1c). Temperature increase was
associated with higher lesion density and
%OLA area after 48 h incubation at 100%
RH (Figures 1d and Ie), but not after 24 h
at 100% RH, suggesting that these two
components of resistance are highly
dependent on incubation conditions.
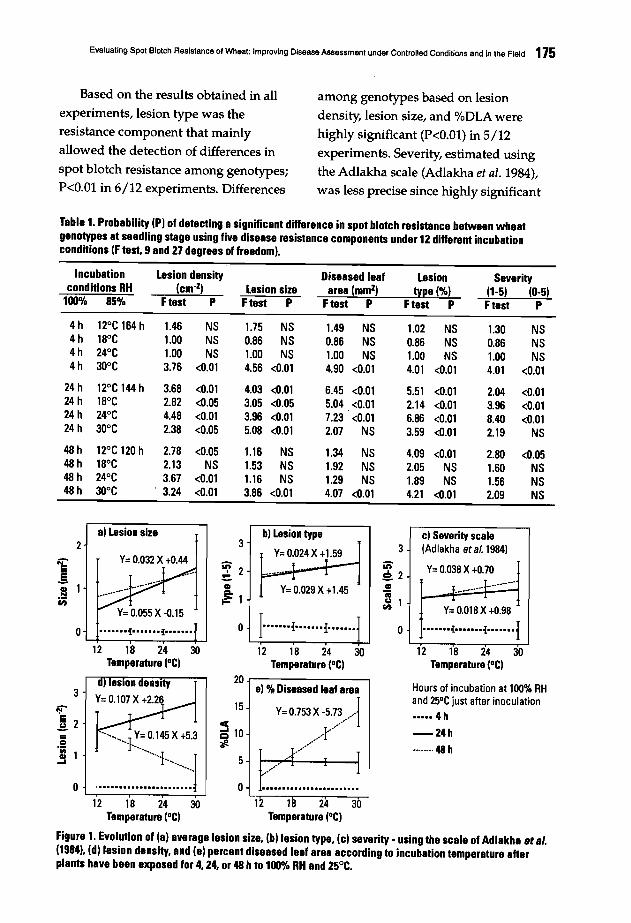
Evaluating Spot Blotch Resistance of Wheal: Improving Disease Assessment under Controlled Conditions and in the Field 175
Based on the results obtained in all
experiments, lesion type was theresistance component that mainly
allowed the detection of differences in
spot blotch resistance among genotypes;P<O.Ol in 6/12 experiments. Differences
among genotypes based on lesion
density, lesion size, and %DLA were
highly significant (P<O.Ol) in 5/12experiments. Severity, estimated using
the Adlakha scale (Adlakha et al. 1984),
was less precise since highly significant
Table 1. Probability (P) of detecting a significant difference in spot blotch resistance between wheatgenotypes at seedling stage using five disease resistance components under 12 different incubationconditions (F test, 9 and 27 degrees of freedom).
Incubation Lesion density Diseased leaf Lesion Severityconditions RH (cm·2) Lesion size area (mm2) type (%) (1·5) (0·5)
1l1O"1o 85% Ftest P Ftest P Ftest P Ftest P Ftest P
4h 12°e 164 h 1.46 NS 1.75 NS 1.49 NS 1.02 NS 1.30 NS4h 18°e 1.00 NS 0.86 NS 0.86 NS 0.86 NS 0.86 NS4h 24°e 1.00 NS 1.00 NS 1.00 NS 1.00 NS 1.00 NS4h 300 e 3.76 <0.01 4.56 <0.01 4.90 <0.01 4.01 <0.01 4.01 <0.01
24 h 12°e 144 h 3.68 <0.01 4.03 <0.01 6.45 <0.01 5.51 <0.01 2.04 <0.0124 h 18°e 2.82 <0.05 3.05 <0.05 5.04 <0.01 2.14 <0.01 3.96 <0.0124 h 24°e 4.48 <0.01 3.96 <0.01 7.23 <0.01 6.86 <0.01 8.40 <0.0124 h 300 e 2.38 <0.05 5.08 <0.01 2.07 NS 3.59 <0.01 2.19 NS
48h 12°e 120 h 2.78 <0.05 1.16 NS 1.34 NS 4.09 <0.01 2.80 <0.0548h 18°e 2.13 NS 1.53 NS 1.92 NS 2.05 NS 1.60 NS48h 24°e 3.67 <0.01 1.16 NS 1.29 NS 1.89 NS 1.56 NS48 h 300 e . 3.24 <0.01 3.86 <0.01 4.07 <0.01 4.21 <0.01 2.09 NS
c) Severity scale(Adlakha et al. 1984)
y= 0.038 X+0.70
L ....··-1······:::,""" ~. .
y= 0.018 X +0.98
.......{.......i ..·····f12 18 24 30
Temperature (OC)
Hours of incubation at 100% RHand 25°C just after inoculation••••• 4h
-24h
..····.. 48h
o
3b) Lesion type
3y= 0.024 X+1.59
~ 2::.u y= 0.029 X+1.45a.~1
0 r·······!·······!·······I12 18 24 30
Temperature (OC)
20e) %Diseased leaf area
15 Ior- y= 0.753 X -5.73 ..-
5 2 ~ 10 r'/:; ..•........-}-~~ 0.145 X+5.3 ..,. ./
~ ······-}-··.....,.r 5~o ,........................ 0 t: :
12 18 24 30 12 III 24 30Temperature (OC) Temperature (OC)
Figure 1. Evolution of (a) average lesion size, (b) lesion type, (c) severity - using the scale of Adlakha et 81.(1984), (d) lesion density, and (e) percent diseased leaf area according to incubation temperature afterplants have been exposed for 4, 24, or 48 h to 100% RH and 25°C.
a) Lesion size2
~y= 0.032 X+0.44
.!uN
C;;
0 ••••••• !l....... !l.......
12 18 24 30Temperature (OCI
3
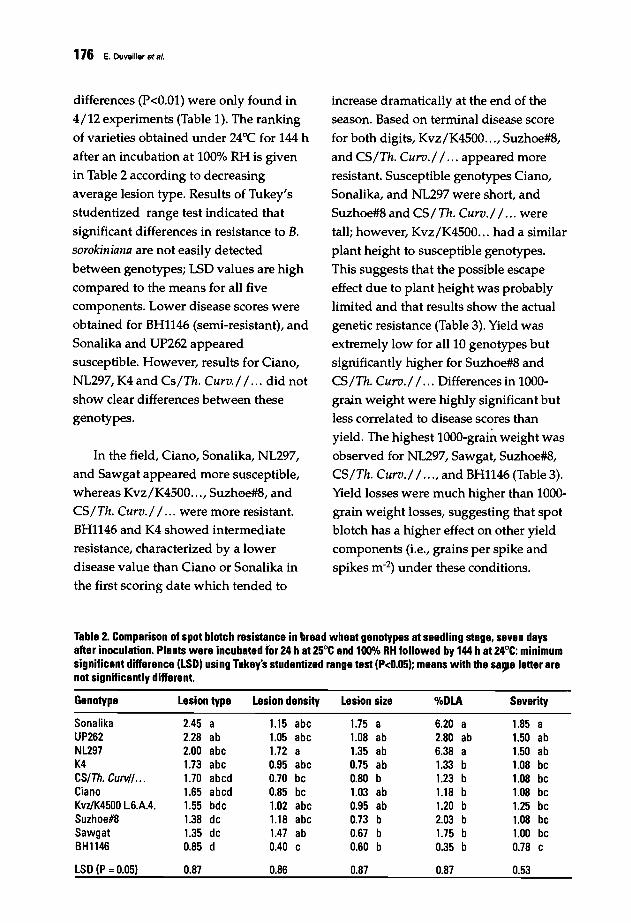
176 E. Duvaillar at a/.
differences (P<0.01) were only found in
4/12 experiments (Table 1). The rankingof varieties obtained under 24°C for 144 h
after an incubation at 100% RH is given
in Table 2 according to decreasing
average lesion type. Results of Tukey'sstudentized range test indicated that
significant differences in resistance to B.sorokiniana are not easily detected
between genotypes; LSD values are high
compared to the means for all fivecomponents. Lower disease scores were
obtained for BH1146 (semi-resistant), andSonalika and UP262 appearedsusceptible. However, results for Ciano,
NL297, K4 and Cs/Th. Curv./ / ... did not
show clear differences between thesegenotypes.
In the field, Ciano, Sonalika, NL297,and Sawgat appeared more susceptible,
whereas Kvz/K4500... , Suzhoe#8, andCS/Th. Curv./ / ... were more resistant.BH1146 and K4 showed intermediateresistance, characterized by a lower
disease value than Ciano or Sonalika inthe first scoring date which tended to
increase dramatically at the end of the
season. Based on terminal disease score
for both digits, Kvz/K4500..., Suzhoe#8,
and CS/Th. Curv./ /'" appeared moreresistant. Susceptible genotypes Ciano,Sonalika, and NL297 were short, and
Suzhoe#8 and CS/ Th. Curv./ / ... were
tall; however, Kvz/K4500... had a similar
plant height to susceptible genotypes.This suggests that the possible escape
effect due to plant height was probablylimited and that results show the actualgenetic resistance (Table 3). Yield was
extremely low for all 10 genotypes butsignificantly higher for Suzhoe#8 and
CS/Th. Curv./ / ... Differences in 1000grain weight were highly significant butless correlated to disease scores than
yield. The highest 1000-grai~weight was
observed for NL297, Sawgat, Suzhoe#8,CS/Th. Curv./ / ... , and BH1146 (Table 3).Yield losses were much higher than 1000
grain weight losses, suggesting that spotblotch has a higher effect on other yieldcomponents (Le., grains per spike andspikes m-Z) under these conditions.
Table 2. Compafison of spot blotch fesistance in bfead wheat genotypes at seedling stage, seven daysaltef inoculation. Plants wefe incubated fOf 24 h at 25°C and 100% RH followed by 144 h at 24°C: minimumsignificant diffefence (LSD) using Tukey's studentized fange test (P<O.05); means with the sa!J'e lettef afenot significantly diffefent.
Genotype Lesion type Lesion density Lesion size %DLA Sevefity
Sonalika 2.45 a 1.15 abe 1.75 a 6.20 a 1.85 aUP262 2.28 ab 1.05 abe 1.08 ab 2.80 ab 1.50 abNL297 2.00 abe 1.72 a 1.35 ab 6.38 a 1.50 abK4 1.73 abe 0.95 abe 0.75 ab 1.33 b 1.08 beCSITh. CuMI... 1.70 abed 0.70 be 0.80 b 1.23 b 1.08 beCiano 1.65 abed 0.85 be 1.03 ab 1.18 b 1.08 beKvz/K4500 L6.A.4. 1.55 bde 1.02 abe 0.95 ab 1.20 b 1.25 beSuzhoe#8 1.38 de 1.18 abe 0.73 b 2.03 b 1.08 beSawgat 1.35 de 1.47 ab 0.67 b 1.75 b 1.00 be8Hll46 0.85 d 0.40 e 0.60 b 0.35 b 0.78 e
LSD (P =0.05) 0.87 0.86 0.87 0.87 0.53
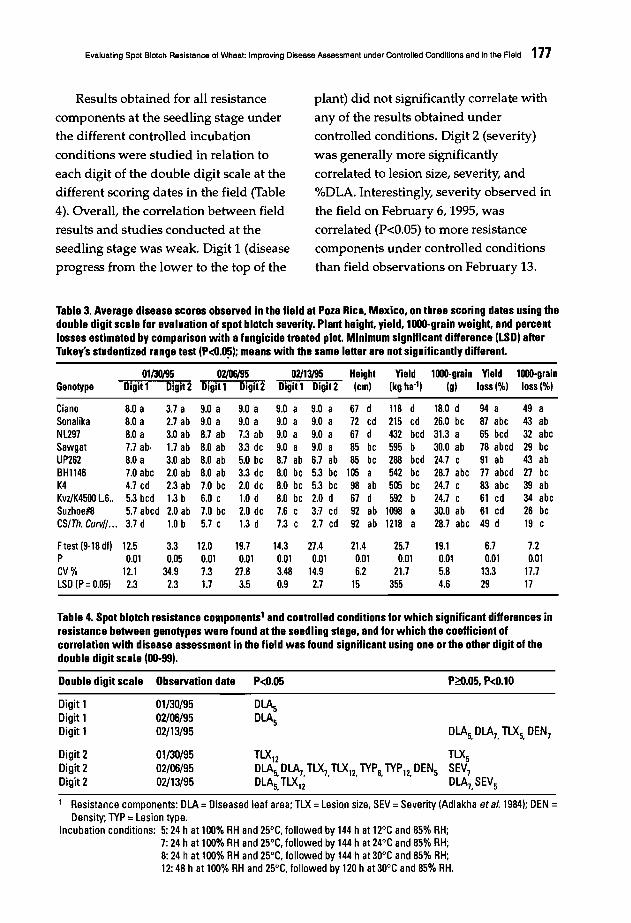
Evaluating Spot Blotch Resistance of Wheal: Improving Disease Assessment under Controlled Conditions and in the Field 177
Results obtained for all resistance
components at the seedling stage under
the different controlled incubation
conditions were studied in relation to
each digit of the double digit scale at the
different scoring dates in the field (Table
4). Overall, the correlation between field
results and studies conducted at the
seedling stage was weak. Digit 1 (disease
progress from the lower to the top of the
plant) did not significantly correlate with
any of the results obtained under
controlled conditions. Digit 2 (severity)
was generally more significantly
correlated to lesion size, severity, and
%DLA. Interestingly, severity observed in
the field on February 6, 1995, was
correlated (P<O.05) to more resistance
components under controlled conditions
than field observations on February 13.
Table 3. Average disease scores observed in the field at Poza Rica, Mexico. on three scoring dates using thedouble digit scale for evaluation of spot blotch severity. Plant height, yield. 1000-grain weight, and percentlosses estimated by comparison with a fungicide treated plot. Minimum significant difference (LSD) afterTukey's studentized range test (P<O.O~); means with the same letter are not significantly different.
01/30/95 0V06/95 07/13/95 Height Yield 1000-grain Yield 1000-grainGenotype Digit1 Digit2 Digit 1 Digit2 Digit 1 Digit2 (em) (kg ha-') (g) 1055(%) 1055(%)
Ciano 8.0 a 3.7 a 9.0 a 9.0 a 9.0 a 9.0 a 67 d 118 d 18.0 d 94 a 49 aSonalika 8.0 a 2.7 ab 9.0 a 9.0 a 9.0 a 9.0 a 72 ed 215 ed 26.0 be 87 abe 43 abN1297 8.0 a 3.0 ab 8.7 ab 7.3 ab 9.0 a 9.0 a 67 d 432 bed 31.3 a 65 bed 32 abeSawgat 7.7 abo 1.7 ab 8.0 ab 3.3 de 9.0 a 9.0 a 85 be 595 b 30.0 ab 78 abed 29 beUP262 8.0 a 3.0 ab 8.0 ab 5.0 be 8.7 ab 6.7 ab 85 be 288 bed 24.7 e 91 ab 43 abBHII46 7.0 abe 2.0 ab 8.0 ab 3.3 de 8.0 be 5.3 be 105 a 542 be 28.7 abe 77 abed 27 beK4 4.7 ed 2.3 ab 7.0 be 2.0 de 8.0 be 5.3 be 98 ab 505 be 24.7 e 83 abe 39 abKvzlK4500 1.6,. 5.3 bed 1.3 b 6.0 e 1.0 d 8.0 be 2.0 d 67 d 592 b 24.7 e 61 ed 34 abeSuzhoe#8 5.7 abed 2.0 ab 7.0 be 2.0 de 7.6 e 3.7 ed 92 ab 1098 a 30.0 ab 61 ed 26 beCS/Th. CuM/... 3.7 d 1.0 b 5.7 e 1.3 d 7.3 e 2.7 ed 92 ab 1218 a 28.7 abe 49 d 19 e
Ftest (9-18 df) 12.5 3.3 12.0 19.7 14.3 27.4 21.4 25.7 19.1 6.7 7.2P 0.01 0.05 0.01 0.01 0.01 0.01 0.01 0.01 0.01 0.01 0.01CV% 12.1 34.9 7.3 27.8 3.48 14.9 6.2 21.7 5.8 13.3 17.7LSD (P = 0.05) 2.3 2.3 1.7 3.5 0.9 2.7 15 355 4.6 29 17
Table 4. Spot blotch resistance components' and controlled conditions for which significant differences inresistance between genotypes were found at the seedling stage, and for which the coefficient ofcorrelation with disease assessment in the field was found significant using one or the other digit of thedouble digit scale (00-99).
Double digit scale Observation date P<0.05 P;:O.05, P<0.10
Digit 1 01/30/95 DLAsDigit 1 02/06/95 DLAsDigit 1 02/13/95 DLAs.DLA7•TLXs. DEN7
Digit 2 01/30/95 TLX12 TLXsDigit 2 02/06/95 DLAs.D~. TLX7•TLX12•TYPs.TYP'2. DENs SEV7Digit 2 02/13/95 DLAs.TLX12 DLA7•SEVs
1 Resistance components: DLA =Diseased leaf area; TLX =Lesion size, SEV =Severity (Adlakha at al. 1984); DEN =Density; TYP =Lesion type.
Incubation conditions: 5: 24 h at 100% RH and 25°C, followed by 144 h at 12°C and 85% RH;7: 24 h at 100% RH and 25°C, followed by 144 h at 24°C and 85% RH;8: 24 h at 100% RH and 25°C, followed by 144 h at 30°C and 85% RH;12: 48 h at 100% RH and 25°C, followed by 120 h at 30°C and 85% RH.
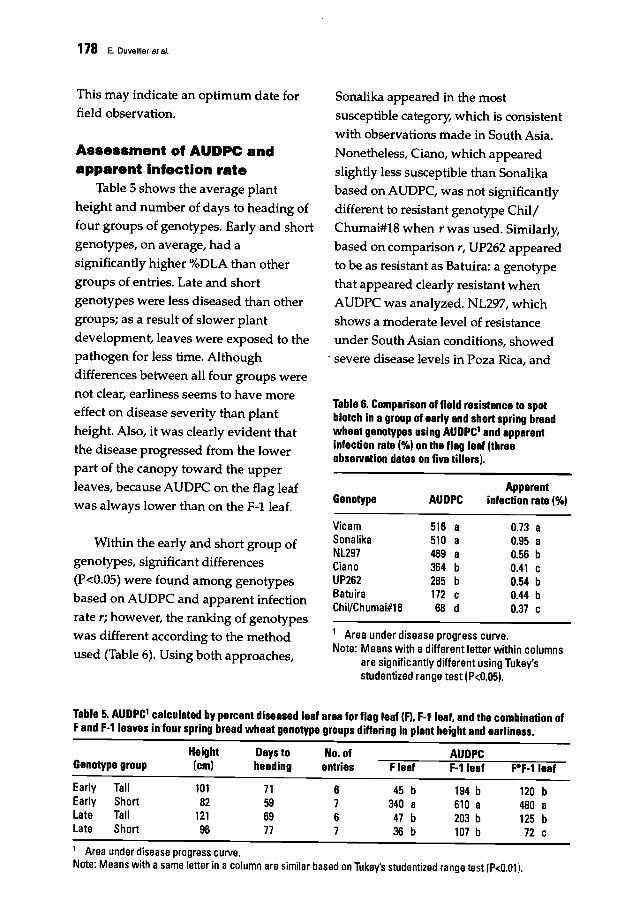
178 E. Duveiller et a/.
This may indicate an optimum date for
field observation.
Assessment of AUDPC andapparent Infection rate
Table 5 shows the average plant
height and number of days to heading of
four groups of genotypes. Early and short
genotypes, on average, had a
significantly higher %DLA than other
groups of entries. Late and short
genotypes were less diseased than other
groups; as a result of slower plant
development, leaves were exposed to the
pathogen for less time. Although
differences between all four groups were
not clear, earliness seems to have more
effect on disease severity than plant
height. Also, it was clearly evident that
the disease progressed from the lower
part of the canopy toward the upper
leaves, because AUDPC on the flag leaf
was always lower than on the F-lleaf.
Within the early and short group of
genotypes, significant differences
(P<O.OS) were found among genotypes
based on AUDPC and apparent infection
rate r; however, the ranking of genotypes
was different according to the method
used (Table 6). Using both approaches,
Sonalika appeared in the most
susceptible category, which is consistent
with observations made in South Asia.
Nonetheless, Ciano, which appeared
slightly less susceptible than Sonalika
based on AUDPC, was not significantly
different to resistant genotype Chill
Chumai#18 when r was used. Similarly,
based on comparison r, UP262 appeared
to be as resistant as Batuira: a genotype
that appeared clearly resistant when
AUDPC was analyzed. NL297, which
shows a moderate level of resistance
under South Asian conditions, showed. severe disease levels in Poza Rica, and
Table 6. Comparison of field resistance to spotblotch in a group of early and short spring breadwheat genotypes using AUDPC' and apparentinfection rate (%) on the flag leaf (threeobservation dates on fiva tillers).
ApparentGenotype AUDPC infection rate (%)
Vicam 516 a 0.73 aSonalika 510 a 0.95 aNl297 469 a 0.56 bCiano 364 b 0.41 cUP262 285 b 0.54 bBatuira 172 c 0.44 bChil/Chumai#18 68 d 0.37 c
1 Area under disease progress curve.Note: Means with adifferent letter within columns
are significantly different using Tukey'sstudentized range test (P<0.05).
Table 5. AUDPC' calculated by percent diseased leaf area for flag leaf (F). F-1Ieaf. and the combination ofFand F-1leaves in four spring bread wheat genotype groups differing in plant height and earliness.
Height Days to No. of AUDPCGenotype group (cm) heading entries Fleaf F-1leaf F*F-1Ieaf
Early Tall 101 71 6 45 b 194 b 120 bEarly Short 82 59 7 340 a 610 a 480 alate Tall 121 69 6 47 b 203 b 125 blate Short 96 77 7 36 b 107 b 72 c
1 Area under disease progress curve.Note: Means with asame letter in acolumn are similar based on Tukey's studentized range test (P<O.Oll.
Evaluating Spot Blotch Resistance of Wheal: Improving Disease Assessment under Controlled Conditions and in the Field 179
the AUDPC for this entry was notsignificantly different to that of Sonalika
orVicam.
Discussion
The study conducted under different
controlled incubation conditions showedthe important effect of moisture and
temperature on spot blotch infection. It
appeared that 24 h exposure to 100% RHjust after inoculation with B. sorokilliallawas necessary to induce successfulinfection. Significant differences in spot
blot resistance between genotypes werenot so clear when plants were exposed to
100% RH for 48 h. Temperature had astrong effect on, the different components
of resistance, particularly lesion type,lesion size, and severity. This effect wasonly seen on lesion density and %DLA
when the plant had been exposed to 100%RH for 48 h. This may result from the lackof homogeneous distribution of theinoculum during inoculation, incorrect
estimated leaf area, or the lack of preciseappraisal of coalescing and joint lesions.
It illustrates the difficulty in correctlystandardizing experimental conditionsfor identification of spot blotch genetic
resistance on seedlings. A strict inoculum
quantification that always uses cultures ofthe same age and perfect control of
incubation conditions is required. We
recommend incubating plants for 24 h at100% RH and 25°C just after inoculation
with B. sorokillialla, followed by
incubation at 24°C at 85% RH for 144 hbefore scoring the plants. Among the
criteria used in this study, %DLA, lesion
size, and lesion type were resistance
components that appeared to be more
related to field results. However, resultsobtained at the seedling stage were not
consistently correlated to fieldobservations, and differences between
genotypes under controlled conditionswere not easily detected. This is due to
the high data variability resulting fromthe difficult standardization of
experimental conditions.
In the field, the interpretation ofdisease scores over time using the double
digit scale was not easy, and thecomparison of AUDPC calculated on
%DLA should be preferred in order tointegrate disease data. In Poza Rica, the
relationship between disease rating and
yield or 1000-grain weight loss appearedunclear. This is due to confoundingeffects resulting from differing levels of
plant adaptation to the environment.Poza Rica is not a wheat growing areaand, in addition to spot blotch, otherfactors such as temperature and light
have a strong effect on plant physiology.Vernalization genes present in some
genotypes significantly increase thelength of vegetative growth under thesesubtropical conditions and negatively
affect yield components.
Although short and early genotypes
appeared distinctly more diseased in the
field than other groups of entries, furtherstudies are needed to understand the
effect of earliness and plant height on
disease development or possible escape.
Based on heading dates observed in Poza
Rica, some entries in our study have been
classified in the wrong group; this is
180 E. Duvalilar at a/.
shown by the small difference in
averaged days to heading between early
and late tall genotypes (Table 5). This may
partly result from the lack of adaptation
of some entries to Poza Rica conditions
indicated above and thus discrepancies
with agronomic data obtained in other
locations. ADOPC appeared more
appropriate than r to assess disease
progress. When r is used, differences in
ranking of genotypes are principally due
to the weight of the first scoring date in
this analysis. If a genotype has a high
disease infection score for the first
evaluation, the apparent infection rate is
expected to be low. As a result of the high
value of the first scoring date, the slope of
the logit line over time will ~e low and
this genotype will be considered more
resistant than it actually is. This explains
that, in our study, based on r, a
susceptible genotype such as Ciano does
not appear different than resistant entries.
In general, field results obtained from
Poza Rica were in agreement with dataobtained from other locations of the
world when the double digit scale or
ADOPC were used. However, small levels
of resistance may be overlooked in Poza
Rica, as clearly shown in this study with
early genotype NL297. The latter was
already severely diseased when disease
scoring started for all genotypes because
.flag leaf exertion time in all genotypes
had to be taking into account to begin
scoring. Therefore, accurately scoring
spot blotch resistance in plants that
significantly differ in maturity will
remain difficult. Poza Rica is an excellent
site to conduct pre-breeding activities for
spot blotch and advance material under a
severe disease pressure obtained under
natural conditions. There is no need to
artificially inoculate the field. However,
studies should be further developed in
commercial wheat growing areas where
spot blotch is becoming more severe,
such as in South Asia, in order to better
detect small differences in resistance and
to better understand the impact of spot
blotch on yield loss.
References
Adlakha, K.L./ Wilcoxson, R.D., and S.P.Raychauduri. 1984. Resistance of wheatto spot blotch caused by Bipolarissorokiniana. Plant Dis 68:320-321.
CIMMYT. 1995. CIMMYT/NARSConsultancy on MEl Bread WheatBreeding. Wheat Special Report No. 38.Mexico, D.E:CIMMYT. 25 pp.
Dubin, H.J., and H.P. Bimb.1994. Studies ofsoilborne diseases and foliar blights ofwheat at the National Wheat ResearchExperiment Station, Bhairhawa, Nepal.Wheat Special Report No. 36. Mexico,D.E: CIMMYT.
Dubin, H.J., and M. van Ginkel. 1991. Statusof wheat diseases and disease research inthe warmer areas of the world. In: D.A.Saunders (ed.), Wheat for theNontraditional Warm Areas, pp. 125-145.Mexico, D.E: CIMMYT.
Dubin, H.J., and S. Rajaram.1996. Breedingdisease resistant wheats for tropicalhighlands and lowlands. Ann RevPhytopathoI34:503-526.
Duveiller, E., and L. Gilchrist. 1994.Productions constraints due to Bipolarissorokiniana in wheat: current situationand future prospects. In: D.A. Saundersand G.P. Hettel (eds.), Wheat in HeatStressed Environments: Irrigated DryAreas and Rice-Wheat Farming Systems,pp. 343-352. Mexico, D.E: CIMMYT.

Evaluating Spot Blotch Resistance of Wheal: Improving Disease Assessment under Controlled Conditions and in the Field 181
Eyal, Z., Scharen, A.L., Prescott, J.M., andM. van Ginkel. 1987. The SeptoriaDiseases of Wheat: Concepts andMethods of Disease Management.Mexico, D.F.: CIMMYT.
Hetzler, J. 1992. Host-pathogen interactionsin populations of Bipolaris sorokiniana inthe warm non-traditional areas. Ph.D.thesis, Georg-August University,G6ttingen, Germany. 132pp.
Mehta, y.R. 1981. Conidial production,sporulation period and extension oflesion of Helminthosporium sativum onflag leaves of wheat. Pesq Agropec Bras16(1):77-99.
Roumen, E. 1991. Partial resistance in rice toblast and how to select for it. Ph.D.thesis, Wageningen AgriculturalUniversity, Wageningen, TheNetherlands.
Saari, E.E., and J.M. Prescott. 1975. A scalefor appraising the foliar intensity ofwheat diseases. Plant Dis Reptr 59:377380.
van Ginkel, M., and S. Rajaram. 1993.Breeding for durable resistance todiseases in wheat: an internationalperspective. In: T. Jacobs and J.E.Parlevliet (eds.), Durability of DiseaseResistance, pp. 259-272. TheNetherlands: Kluwer AcademicPublishers.
Velasquez, c.c. 1994. Genetica de laresistencia a Bipolaris sorokiniana en trigosharineros. M.Sc. thesis, Colegio dePostgraduados, Montecillo, Mexico. 84pp.
Zadoks, J., and R. Schein. 1979.Epidemiology and plant diseasemanagement. New York: OxfordUniversity Press. 427 pp.
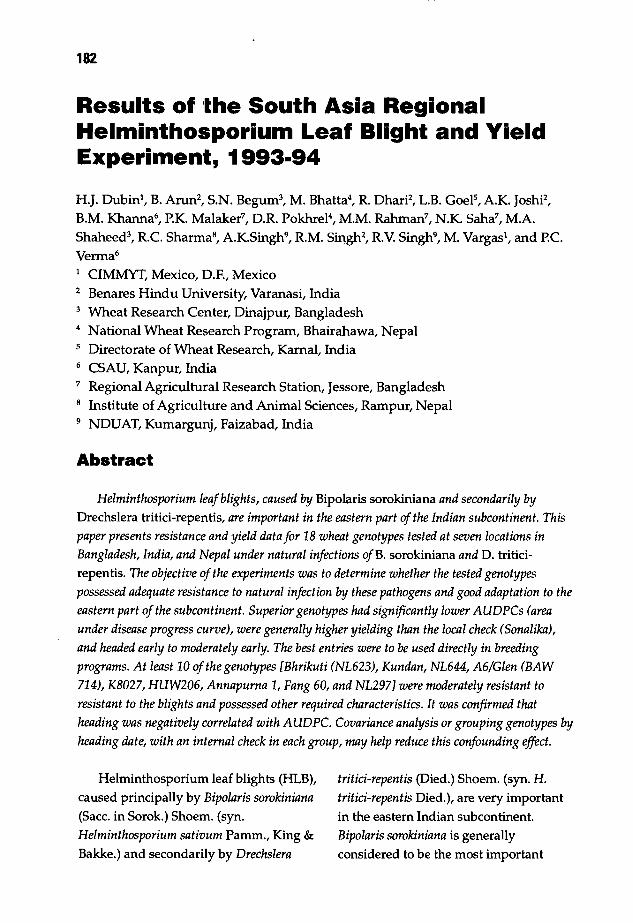
182
Results of 'the South Asia RegionalHelminthosporium Leaf Blight and YieldExperiment, 1993-94
H.J. Dubinl, B. Arun2, S.N. Begum3, M. Bhatta4, R DharF, L.B. GoelS, AK. JoshF,B.M. Khanna6, P.K. Malaker7, D.R Pokhrel4, M.M. Rahman7, N.K. Saha7, M.AShaheed3
, RC SharmaB, AK.Singh9
, RM. SiI1gh2, RV. Singh9, M. Vargasl, and P'C
Verma6
1 CIMMYT, Mexico, D.P., Mexico2 Benares Hindu University, Varanasi, India3 Wheat Research Center, Dinajpur, Bangladesh4 National Wheat Research Program, Bhairahawa, NepalS Directorate of Wheat Research, Kamal, India6 CSAU, Kanpur, India7 Regional Agricultural Research Station, Jessore, BangladeshB Institute of Agriculture and Animal Sciences, Rampur, Nepal9 NDUAT, Kumargunj, Faizabad, India
Abstract
Helminthosporium leaf blights, caused by Bipolaris sorokiniana and secondarily byDrechslera tritici-repentis, are important in the eastern part of the Indian subcontinent. Thispaper presents resistance and yield data for 18 wheat genotypes tested at seven locations inBangladesh, India, and Nepal under natural infections ofB. sorokiniana and D. triticirepentis. The objective of the experiments was to determine whether the tested genotypespossessed adequate resistance to natural infection by these pathogens and good adaptation to theeastern part of the subcontinent. Superior genotypes had significantly lower AUDPCs (areaunder disease progress curve), were generally higher yielding than the local check (Sonalika),and headed early to moderately early. The best entries were to be used directly in breedingprograms. At least 10 of the genotypes [Bhrikuti (NL623), Kundan, NL644, A6/Glen (BAW714), K8027, HUW206, Annapurna 1, Fang 60, and NL297] were moderately resistant toresistant to the blights and possessed other required characteristics. It was confirmed thatheading was negatively correlated with AUDPC. Covariance analysis or grouping genotypes byheading date, with an internal check in each group, may help reduce this confounding effect.
Helminthosporium leaf blights (HLB),caused principally by Bipolaris sorokiniana(Sacc. in Sorok.) Shoem. (syn.Helminthosporium sativum Pamm., King &
Bakke.) and secondarily by Drechslera
tritici-repentis (Died.) Shoem. (syn. H.tritici-repentis Died.), are very importantin the eastern Indian subcontinent.Bipolaris sorokiniana is generallyconsidered to be the most important
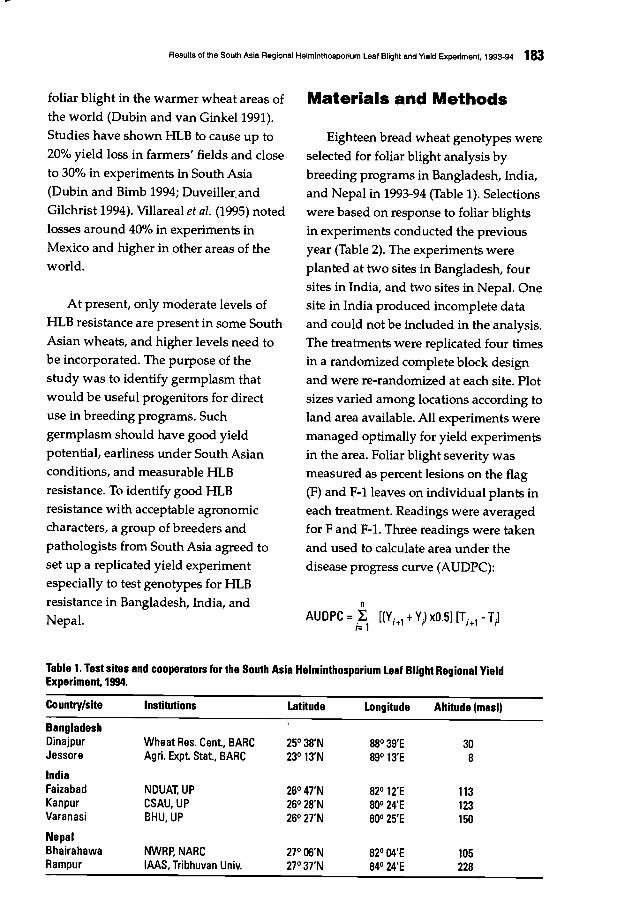
Results of the South Asia Regional Helminthosporium Leaf Blight and Yield Experiment, 1993·94 183
foliar blight in the warmer wheat areas of
the world (Dubin and van Ginkel1991).
Studies have shown HLB to cause up to20% yield loss in farmers' fields and close
to 30% in experiments in South Asia(Dubin and Bimb 1994; Duveiller,and
Gilchrist 1994). Villareal et ai. (1995) noted
losses around 40% in experiments inMexico and higher in other areas of the
world.
At present, only moderate levels of
HLB resistance are present in some SouthAsian wheats, and higher levels need tobe incorporated. The purpose of the
study was to identify germplasm thatwould be useful progenitors for directuse in breeding programs. Such
germplasm should have good yield
potential, earliness under South Asianconditions, and measurable HLB
resistance. To identify good HLB
resistance with acceptable agronomiccharacters, a group of breeders andpathologists from South Asia agreed to
set up a replicated yield experimentespecially to test genotypes for HLBresistance in Bangladesh, India, and
Nepal.
Materials and Methods
Eighteen bread wheat genotypes were
selected for foliar blight analysis by
breeding programs in Bangladesh, India,and Nepal in 1993-94 (Table 1). Selections
were based on response to foliar blights
in experiments conducted the previousyear (Table 2). The experiments were
planted at two sites in Bangladesh, four
sites in India, and two sites in Nepal. Onesite in India produced incomplete dataand could not be included in the analysis.
The treatments were replicated four timesin a randomized complete block designand were re-randomized at each site. Plot
sizes varied among locations according toland area available. All experiments were
managed optimally for yield experiments
in the area. Foliar blight severity wasmeasured as percent lesions on the flag(F) and F-1leaves on individual plants in
each treatment. Readings were averagedfor F and F-1. Three readings were takenand used to calculate area under thedisease progress curve (AUDPC):
n
AUDPC =L [(VitI +V) xO.5] [T it1 - T)i=1
Table 1. Test sites and cooperators for the South Asia Helminthosporium Leaf Blight Regional YieldExperiment, 1994.
Country/site Institutions Latitude Longitude Altitude (masl)
BangladeshDinajpur Wheat Res. Cent, BARC 25° 38'N 88° 39'E 30Jessore Agri. Expt Stat., BARC 23° 13'N 89° 13'E 8
IndiaFaizabad NDUAT, UP 26° 47'N 82° 12'E 113Kanpur CSAU,UP 26° 28'N 80° 24'E 123Varanasi BHU, UP 26° 27'N 80° 25'E 150
NepalBhairahawa NWRp, NARC 27°00'N 82° Q4'E 105Rampur IAAS, Tribhuvan Univ. 27° 37'N 84° 24'E 228
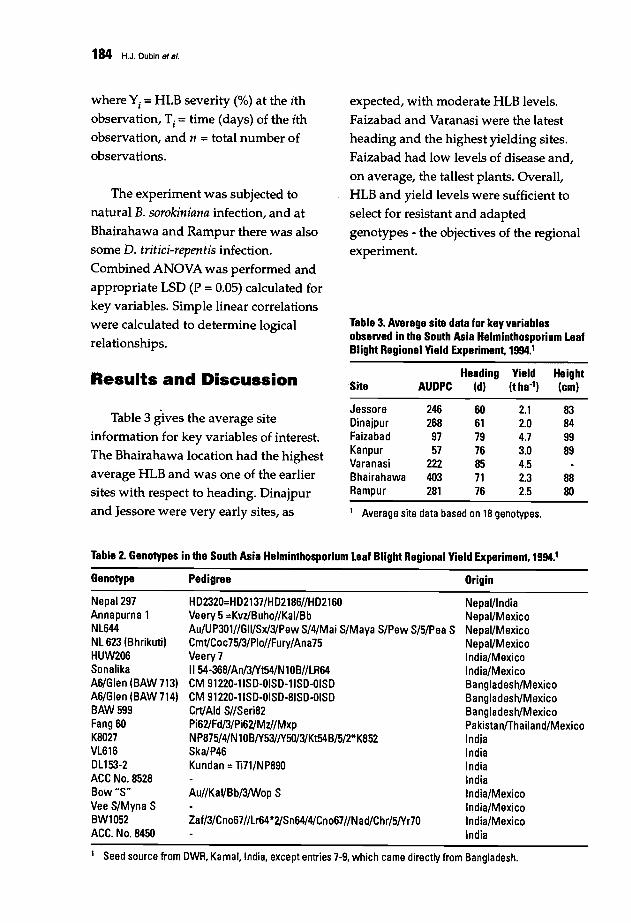
184 H.J. Dubin at al.
where Yj = HLB severity (%) at the ith
observation, Tj = time (days) of the ithobservation, dnd n = total number of
observations.
The experiment was subjected to
natural B. sorokiniana infection, and at
Bhairahawa and Rampur there was alsosome D. tritici-repentis infection.
Combined ANOVA was performed and
appropriate LSD (P = 0.05) calculated forkey variables. Simple linear correlationswere calculated to determine logical
relationships.
Results and Discussion
Table 3 gives the average siteinformation for key variables of interest.
The Bhairahawa location had the highestaverage HLB and was one of the earliersites with respect to heading. Dinajpur
and Jessore were very early sites, as
expected, with moderate HLB levels.
Faizabad and Varanasi were the latest
heading and the highest yielding sites.Faizabad had low levels of disease and,
on average, the tallest plants. Overall,
HLB and yield levels were sufficient toselect for resistant and adapted
genotypes - the objectives of the regionalexperiment.
Table 3. Average site data for key variablesobserved in the South Asia Helminthosporium LeafBlight Regional Yield Experiment. 1994.'
Heading Yield HeightSite AUDPC (d) (tha") (em)
Jessore 246 60 2.1 83Dinajpur 268 61 2.0 84Faizabad 97 79 4.7 99Kanpur 57 76 3.0 89Varanasi 222 85 4.5Bhairahawa 403 71 2.3 88Rampur 281 76 2.5 80
1 Average site data based on 18 genotypes.
Table 2. Genotypes in the South Asia Helminthosporium Leaf Blight Regional Yield Experiment, 1994.'
Genotype
Nepal 297Annapurna 1Nl644Nl623 (Bhrikuti)HUW206SonalikaA6/Glen (BAW 713)A6/Glen (BAW 714)BAW599Fang 60K8027Vl61601153·2ACC No. 8528Bow"S"Vee S/Myna SBW1052ACC. No. 8450
Pedigree
H02320=H02137/H02186//H02160Veery 5=Kvz/Buho//Kal/BbAu/UP301//GII/Sx/3/Pew S/4/Mai S/Maya S/Pew S/5/Pea SCmt/Coc75/3/Plo//Fury/Ana75Veery 7II 54-368/An/3/Yt54/N 10B//lR64CM 91220-1IS0-OIS0·IIS0-OIS0CM 91220·1IS0-OIS0·8IS0·OIS0Crt/Aid S//Seri82Pi62/Fd/3/Pi62/Mz//MxpNP875/4/N1OB/Y53//Y50/3/Kt54B/5/2*K852Ska/P46Kundan =1i71/NP890
Au//KaI/Bb/3/Wop S
Zaf/3/Cn067//lr64*2/Sn64/4/Cn067//Nad/Chr/5/yr70
Origin
Nepal/IndiaNepal/MexicoNepal/MexicoNepal/MexicoIndia/MexicoIndia/MexicoBangladesh/MexicoBangladesh/MexicoBangladesh/MexicoPakistanfThailand/MexicoIndiaIndiaIndiaIndiaIndia/MexicoIndia/MexicoIndia/MexicoIndia
1 Seed source from OWR, Karnal, India, except entries 7-9, which came directly from Bangladesh.
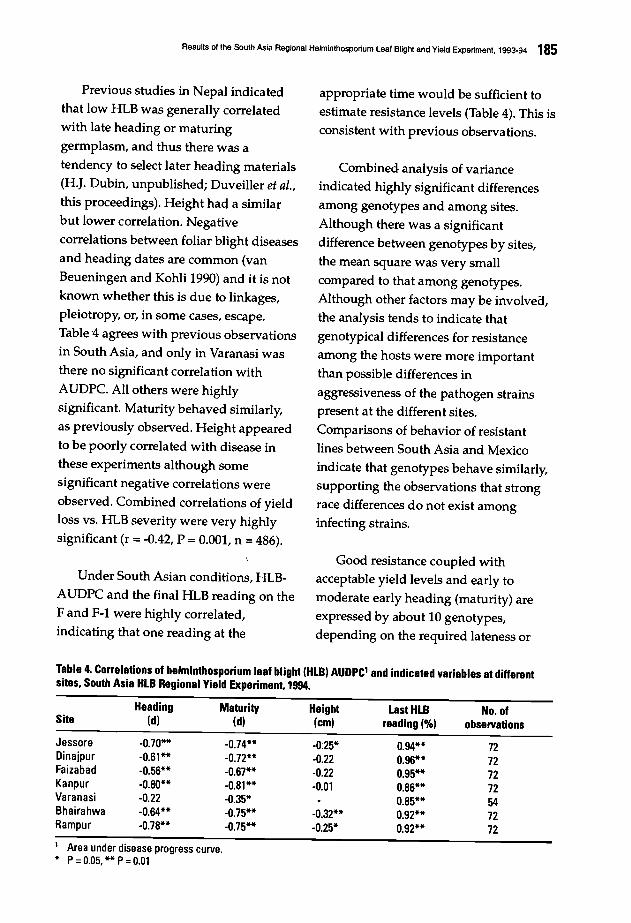
Results of the South Asia Regional Helmlnthosporium Leaf Blight and Yield Experiment. 1993·94 185
Previous studies in Nepal indicated
that low HLB was generally correlatedwith late heading or maturing
germplasm, and thus there was a
tendency to select later heading materials(H,J. Dubin, unpublished; Duveiller et al.,this proceedings). Height had a similarbut lower correlation. Negative
correlations between foliar blight diseases
and heading dates are common (van
Beueningen and Kohli 1990) and it is notknown whether this is due to linkages,pleiotropy, or, in some cases, escape.
Table '4 agrees with previous observationsin South Asia, and only in Varanasi was
there no significant correlation with
AUDPC. All others were highlysignificant. Maturity behaved similarly,
as previously observed. Height appeared
to be poorly correlated with disease inthese experiments although somesignificant negative correlations were
observed. Combined correlations of yieldloss vs. HLB severity were very highlysignificant (r = -0.42, P = 0.001, n = 486).
Under South Asian conditions, HLBAUDPC and the final HLB reading on the
F and F-1 were highly correlated,indicating that one reading at the
appropriate time would be sufficient toestimate resistance levels (Table 4). This isconsistent with previous observations.
Combined analysis of variance
indicated highly significant differences
among genotypes and among sites.
Although there was a significantdifference between genotypes by sites,
the mean square was very small
compared to that among genotypes.Although other factors may be involvea,
the analysis tends to indicate that
genotypical differences for resistanceamong the hosts were more importantthan possible differences in
aggressiveness of the pathogen strains
present at the different sites.Comparisons of behavior of resistant
lines between South Asia and Mexico
indicate that genotypes behave similarly,supporting the observations that strongrace differences do not exist amonginfecting strains.
Good resistance coupled withacceptable yield levels and early to
moderate early heading (maturity) areexpressed by about 10 genotypes,
depending on the required lateness or
Table 4. Correlations of helminthosporium leaf blight (HLB) AUDPC1 and indicated variables at differentsites. South Asia HLB Regional Yield Experiment. 1994.
Heading Maturity Height Last HLB No. ofSite (d) (d) (cm) reading (%) observations
Jessore -0.70** -0.74** -0:25* 0.94** 72Dinajpur -0.61** -0.72** -0.22 0.96** 72Faizabad -0.56** -0.67** -0.22 0.95** 72Kanpur -0.80** -0.81** -0.01 0.86** 72Varanasi -0.22 -0.35* 0.85** 54Bhairahwa -0.64** -0.75** -0.32** 0.92** 72Rampur -0.78** -0.75** -0.25* 0.92** 72
1 Area under disease progress curve.* P= 0.05, ** P= 0.01
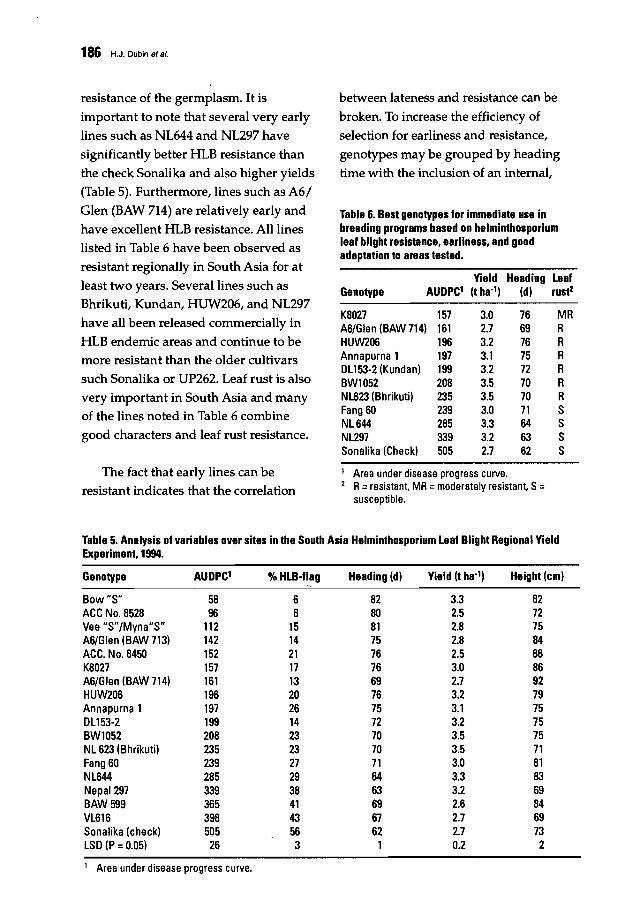
Table 6. Best genotypes for immediate use inbreeding programs based on helminthosporiumleaf bllght resistance, earliness. and goodadaptation to areas tested.
between lateness and resistance can be
broken. To increase the efficiency of
selection for earliness and resistance,
genotypes may be grouped by heading
time with the inclusion of an internal,
K8027 157 3.0 76 MRA6/Glen (BAW 714) 161 2.7 69 RHUW206 196 3.2 76 RAnnapurna 1 197 3.1 75 RD1153-2 (Kundan) 199 3.2 72 RBWI052 208 3.5 70 RNL623 (Bhrikuti) 235 3.5 70 RFang 60 239 3.0 71 SNL644 285 3.3 64 SNL297 339 3.2 63 SSonalika (Check) 505 2.7 62 S
Area under disease progress curve.R=resistant, MR =moderately resistant, S=susceptible.
186 H.J. Dubin at al.
resistance of the germplasm. It is
important to note that several very early
lines such as NL644 and NL297 have
significantly better HLB resistance than
the check Sonalika and also higher yields
(Table 5). Furthermore, lines such as A6/
Glen (BAW 714) are relatively early and
have excellent HLB resistance. All lines
listed in Table 6 have been observed as
resistant regionally in South Asia for at
least two years. Several lines such as
Bhrikuti, Kundan, HUW206, and NL297
have all been released commercially in
HLB endemic areas and continue to be
more resistant than the older cultivars
such Sonalika or UP262. Leaf rust is also
very important in South Asia and many
of the lines noted in Table 6 combine
good characters and leaf rust resistance.
The fact that early lines can be
resistant indicates that the correlation
GenotypeYield Heading Leaf
AUDPC' (t ha") (d) rustZ
Table 5. Analysis of variables over sites in the South Asia Helminthosporium Leaf Blight Regional YieldExperiment, 1994.
Genotype AUDPC' % HLB-flag Heading (d) Yield (t ha") Height (cm)
Bow"S" 58 6 82 3.3 82ACC No. 8528 96 8 80 2.5 72Vee "S"/Myna"S" 112 15 81 2.8 75A6/Glen (BAW 713) 142 14 75 2.8 84ACC. No. 8450 152 21 76 2.5 66K8027 157 17 76 3.0 86A6/Glen (BAW 714) 161 13 69 2.7 92HUW206 196 20 76 3.2 79Annapurna 1 197 26 75 3.1 75D1153-2 199 14 72 3.2 75BWI052 208 23 70 3.5 75NL623 (Bhrikuti) 235 23 70 3.5 71Fang 60 239 27 71 3.0 81NL644 285 29 64 3.3 83Nepal 297 339 38 63 3.2 69BAW599 365 41 69 2.6 84VL616 398 43 67 2.7 69Sonalika (check) 505 56 62 2.7 73LSD (P = 0.05) 26 3 1 0.2 2
1 Area under disease progress curve.

Results of the South Asia Regional Helmlnlhosporlum Leaf Blight and Yield Experiment, 1993·94 187
susceptible check of similar phenology.
Covariance analysis can be useful as well
(H.J. Dubin and M. Romero,
unpublished). In more precise work, flag
leaves may be inoculated under
controlled conditions to determine if the
amount of exposure time to the pathogen
affects resistance.
It should be remembered that the goal
of these experiments was to select
suitable parents for crossing, thus it was
considered important to have replication
and yield information. The experiments
achieved this due to good regional
cooperation; however, in segregating
populations such precision is not needed.
The earliest and most resistant progeny
may be selected regardless of the
breeding system used. At CIMMYT,
selection for resistance and earliness has
produced good resistance levels from
various sources including alien\
germplasm (Dubin and Rajaram 1996).
Use of three-way crosses seem to work
well. In Nepal, we are using several
sources of resistance for the first two
parents, and crossing with high yielding,
well adapted, moderately HLB resistant
parents in the third cross.
The results presented indicate that
excellent information on HLB resistance
can be obtained with a minimum of
sophisticated equipment through good
regional cooperation among scientists
with common problem~.
Acknowledgments
The authors thank the National
Wheat Program coordinators in
Bangladesh, India, and Nepal who
continually help in regional cooperation
in South Asia. Also L.B. Goel, Principal
Pathologist, and S. Nagarajan, Director,
DWR, Kamal, India, deserve special
thanks for their help in sending the
experiments to neighboring countries.
References
Dubin, H.J., and S. Rajaram. 1996. Breedingdisease-resistant wheats for tropicalhighlands and lowlands. Ann RevPhytopathoI34:503-26.
Dubin, H.J., and H.P Bimb.1994. Studies ofsoilborne diseases and foliar blights ofwheat at the National Wheat ResearchExperiment Station, Bhairahawa, Nepal.Wheat Special Report No. 36. Mexico,D.E: CIMMYT.
Dubin, H.J., and M. van Ginkel. 1991. Thestatus of wheat diseases and diseaseresearch in the warmer areas. In: D.ASaunders (ed.), Wheat for theNontraditional Warm Areas, pp. 125-45.Mexico, D.E: CIMMYT.
Duveiller, E., and L. Gilchrist. 1994.Production constraints due to Bipolarissorokiniana in wheat: Current situationand future prospects. In: D.A Saundersand G.P. Hettel (eds.), Wheat in HeatStressed Environments: Irrigated, DryAreas and Rice-Wheat Farming Systems,pp. 343-52. Mexico, D.E: CIMMYT.
van Beueningen, L., and M.M. Kohli. 1990.Deviation from the regression ofinfection on heading and height as ameasure of resistance in Septoria triticiblotch in wheat. Plant Dis 74:488-493.
Villareal, R.L., Mujeeb-Kazi, A, Gilchrist,L.L, and E. Del Toro. 1995. Yield loss tospot blotch in spring bread wheat inwarm nontraditional wheat productionareas. Plant Dis 79:893-897.
188
Breeding for Resistance toHelminthosporium Blights in Nepal:Strategies and Genetic Gains
M.R Bhattal, D.R PokhareP, RN. Devkotal, H.J. Dubin2, A. MudwarP, H.P. Bimbl,
B.R Thapal, B.P. Sahl, and D. Bhandari!
1 National Wheat Research Program, Bhairahawa, Nepal2 CIMMYT, Mexico, D.P., Mexico
Abstract
Helminthosporium leaf blight (HLB) ofwheat, caused by Bipolaris sorokiniana and
Pyrenophora tritici-repentis, is a disease ofeconomic importance in the terai ofNepal. Mostcommercial varieties show inadequate HLB resistance. Yield loss assessments conducted by theNational Wheat Research Program, Bhairahawa, have shown losses of23.8-27% in highly
susceptible varieties. On-farm studies indicated yield losses ofup to 16%. Considering the
sizable losses, top priority is being given to breeding for HLB resistance. This paper summarize.,the breeding strategy adopted by the National Wheat Research Program to develop and ident~fy
HLB resistant wheats and to assess the genetic gains achieved. Breeding begins with theidentification of resistant donor lines from different sources. To date, the best materials identifiedhave comefrom China, CIMMYT alien gene lines from Thinopyrum curvifolium, Brazil, and
Zambia. Crossing strategies of the hybridization program are designed to involve one parentfrom our adapted varieties to incorporate earliness, acceptable grains, and other desirable traitsinto the progeny. Plants in the segregating populations are selected based on resistancegoverned by quantitative traits such as small lesions on uppermost leaves, low disease severity,
'stay green' at high temperatures during grain filling, freedom from black point, and grainplumpness. A limited backcross program has been initiated, assuming inheritance to be
qualitative in some cases; however, progress har remained slow. The best progeny have resultedfrom three-way and single crosses. Besides hybridizl-ltion, selection and identification of resistant
genotypes from different international collaborative nurseries is continuing. The major outcomeof this work is the identification of resistant lines· that are now at different stages of
multilocation testing. Variety Bhrikuti, released in 1994, is well accepted by farmers, possesses asignificant level ofHLB resistance, and has 13-39% higher yield than existing varieties. Many
other HLB resistant genotypes are in advanced stages ofyield testing.
In Nepal, wheat is the third major
cereal crop after rice and maize. Until
1960, it was a minor cereal whose
cultivation was limited to a small area inthe western hills. With the introduction of
Mexican semi-dwarf, high yielding
varieties during the mid 1960s, there has
been a highly significant increase in both
wheat area and production. At present,
the wheat sown area is greater than
Breeding for Resistance to Helminthosporium Blights in Nepal: Strategies and Genetic Gains 189
650,000 ha, with a total production of
nearly 1 million t (CBS 1996). Wheat is
rotated with rice in Nepal. Rice-wheat (R
W) represents more than 84% of the total
wheat area in the country.
In Nepal, Bipolaris sorokiniana (Sacc. in
Sorok., syn. Helminthosporium sativumPamm., King & Bakke.) and Pyrenophoratritici-repentis (Died.) Drechs often occur
in combination and, based on symptom
observations in the field, it is often
impossible to determine if a lesion is
caused by one pathogen or the other.
Accordingly, both fungi should be
considered responsible for the disease
complex referred to as helminthosporium
leaf blight (HLB) in this paper.
Helminthosporium leaf blight has
been a disease of major economic
importance, mainly in the terai area _
where climatic conditions are highlyfavorable for HLB development. In recent
years, it has also extended to hill wheat
growing environments. January and
February mean temperatures are 16 and
18°C, respectively, with a relative
humidity (RH) of more than 90%. Most
currently grown commercial wheat
varieties have inadequate resistance to
the HLB pathogens.
Natural HLB infection generally
begins at the tillering stage. Symptoms
gradually increase up to and rapidly
develop after flowering, covering all
above-ground plant parts, depending on
genotype. Combined with high
temperatures during grain filling, the
disease causes premature leaf firing of the
wheat plants, resulting in reduced kernel
weight and grain yield. These pathogens
seem to be very opportunistic in nature
and the disease tends to be more severe
under stressed plant growth caused by
poor nutrition (NPK), low soil organic
matter, and heat stress during later
growth plant stages (personal
observations on long term fertility
experiments in R-R-W and R-W systems,
Bhairahawa, Nepal).
Both pathogens are commonly
observed together on blight affected
leaves (Dubin and van GinkeI1991);
however, species predominance has been
observed to change with environmental
conditions (Dubin and Bimb 1991). For
example, P. tritici-repentis was the
principal pathogen causing foliar blight
during 1987/88, whereas B. sorokinianahas been dominant since 1989 (Dubin and
Bimb 1991; personal observations, 1992
1996).
These pathogens are reported to be
highly variable (Mehta 1985; Hetzler et al.1991; Duveiller and Gilchrist 1994). The
main inoculum sources are free dormant
conidia in the soil, infected seeds,
infected crop residues, secondary hosts,
and volunteer plants (Reis 1991).
Inoculum that persists in the soil has
been reported to cause pre-and post
emergence damping off, root rot, sub
crown internode infection, and seedling
blight during early crop stages (Saari
1986; personal observations,
Bhairahawa).
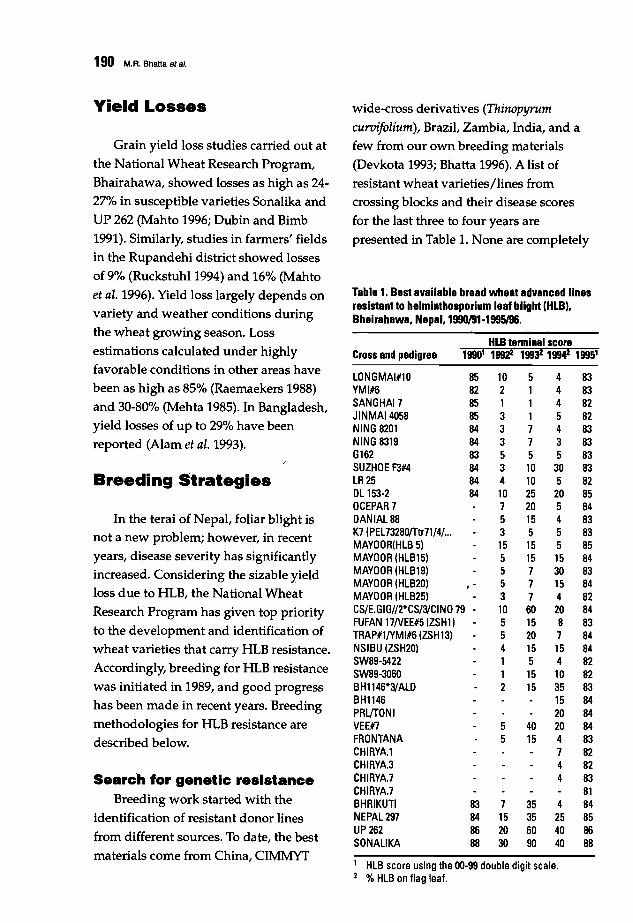
190 M.R. Bhalla at a/.
Yield Losses wide-cross derivatives (Thinopyrum
curvijolium), Brazil, Zambia, India, and aGrain yield loss studies carried out at few from our own breeding materials
the National Wheat Research Program, (Devkota 1993; Bhatta 1996). A list ofBhairahawa, showed losses as high as 24- resistant wheat varieties/lines from27% in susceptible varieties Sonalika and crossing blocks and their disease scoresUP 262 (Mahto 1996; Dubin and Bimb for the last three to four years are1991). Similarly, studies in farmers' fields presented in Table 1. None are completelyin the Rupandehi district showed lossesof 9% (RuckstuhI1994) and 16% (Mahto
et al. 1996). Yield loss largely depends on Table 1. Best available bread wheat advanced linesresistant to helminthosporium leaf blight IHLBI.
variety and weather conditions during Bheirahawa. Nepal. 19911191-1995196.the wheat growing season. Loss
HLB terminal scoreestimations calculated under highly Cross and pedigree 19901 19922 19932 19942 1995'favorable conditions in other areas have
LONGMAI#10 85 10 5 4 83been as high as 85% (Raemaekers 1988) YMI#6 82 2 1 4 83
and 30-80% (Mehta 1985). In Bangladesh, SANGHAI7 85 1 1 4 82JINMAI4058 85 3 1 5 82
yield losses of up to 29% have been NING 8201 84 3 7 4 83
reported (Alam et al. 1993). NING 8319 84 3 7 3 83G162 83 5 5 5 83SUZHOE F3#4 84 3 10 30 83
Breeding Strategies LR 25 84 4 10 5 82DL 153-2 84 10 25 20 85OCEPAR 7 7 20 5 84
In the terai of Nepal, foliar blight is DANIAL 88 5 15 4 83
not a new problem; however, in recent K7 (PEL73280/Ttr71/4/... 3 5 5 83MAYOOR(HLB 5) 15 15 5 85
years, disease severity has significantly MAYOOR (HLBI5) 5 15 15 84
increased. Considering the sizable yield MAYOOR (HLBI9) 5 7 30 83MAYOOR (HLB20) 5 7 15 84
loss due to HLB, the National Wheat MAYOOR IHLB25) 3 7 4 82
Research Program has given top priority CS/E.GIGI/2*CS/31CINO 79 10 60 20 84FUFAN 17NEE#5IZSHll 5 15 8 83
to the development and identification of TRAP#I/YMI#6 (ZSHI3) 5 20 7 84wheat varieties that carry HLB resistance. NSIBU (ZSH20) 4 15 15 84
Accordingly, breeding for HLB resistanceSW89-5422 1 5 4 82SW89-3060 1 15 10 82
was initiated in 1989, and good progress BHI146*31ALD 2 15 35 83
has been made in recent years. Breeding BH1146 15 84PRl/TONI 20 84
methodologies for HLB resistance are VEE#7 5 40 20 84
described below. FRONTANA 5 15 4 83CHIRYA.l 7 82CHIRYA.3 4 82
Search for genetic resistance CHIRYA.7 4 83CHIRYA.7 81
Breeding work started with the BHRIKUTI 83 7 35 4 84identification of resistant donor lines NEPAL 297 84 15 35 25 85
from different sources. To date, the bestLIP 262 86 20 60 40 86SONALIKA 88 30 90 40 88
materials come from China, CIMMYT1 HLB score using the 00-99 double digit scale.2 %HLB on flag leaf.

Breeding for Resistence to Helmlnthosporium Blights in Nepel: Stretegies end Genetic Gelns 191
free of HLB infection. Furthermore,
disease severity largely depends onweather conditions, genotypes, time of
planting, and inoculum density. For
example, some lines which in the pastwere identified as resistant, such as
Mayoor sisters, have shown increased
susceptibility levels in recent years andhave thus been deleted from the resistant
group. Also, wheats with low HLB levels
on foliar tissues have shown graininfection. Grain infection is more severe
when rain occurs during grain filling
(Alam et al. 1994; personal observations,Nepal)..
As part of varietal screening, resistant
and susceptible varieties/lines werestudied to observe the degree of B.sorokiniana infection on grain and on thesub-crown internode in the laboratoryand field. In the laboratory, 40 untreated
grains of each variety/line wererandomly selected and placed onmoistened filter paper in sterilized petridishes. After 10 days, grains were
examined under a light microscope forthe presence of B. sorokiniana and other
fungi. In the field, 200 seeds of eachvariety/line were selected and half weretreated with carboxin at 2.5 g kg-I. The
treated and untreated seeds were plantedin four 1-m long rows under an unknown
inoculum density of B. sorokiniana.Fifteen-day-old seedlings from each lot(treated and untreated) were uprooted,
washed with clean water, and seedlings
with dark brown sub·crown internode
counted.
Interestingly, some varieties/lineswhich showed no B. sorokiniana infection
of grains showed sub-crown internode
infection in the field, indicating the
presence of the fungus in the soil. Seedtreatment with carboxin was not effective
in eliminating sub-crown internode
infection by B. sorokiniana already presentin the soil. Soil samples from the field
showed B. sorokiniana conidia onmicroscopic examination. Absence of the
fungus in the grains but susceptibility offoliar tissue and sub-crown internode
may suggest that resistance to B.sorokiniana is governed by two to threeindependent genes.
Breeding for HLB realatanceHybridization work in Nepal started
in 1989, and multilocational yield testingof HLB resistant advanced lines fromdifferent sources has been a regular
activity of the wheat breeding program.With the limited knowledge of thegenetics of HLB, crosses (40% of totalcrosses since 1989) involving resistant vs.susceptible and resistant vs. resistant
lines are made every year. Some Fls are
triple crossed with the best adaptedvarieties/lines to incorporate earliness,
acceptable grains, and other desirable
traits. A few back-crosses and multiplecrosses were also attempted in the
beginning; however, progress was slow.
The best progenies have resulted fromthree-way and single crosses. F2s are
space-planted with approximately 2000
plants per cross and are selected based on
small lesions on upper-most leaves, low
disease severity, 'stay green' at high
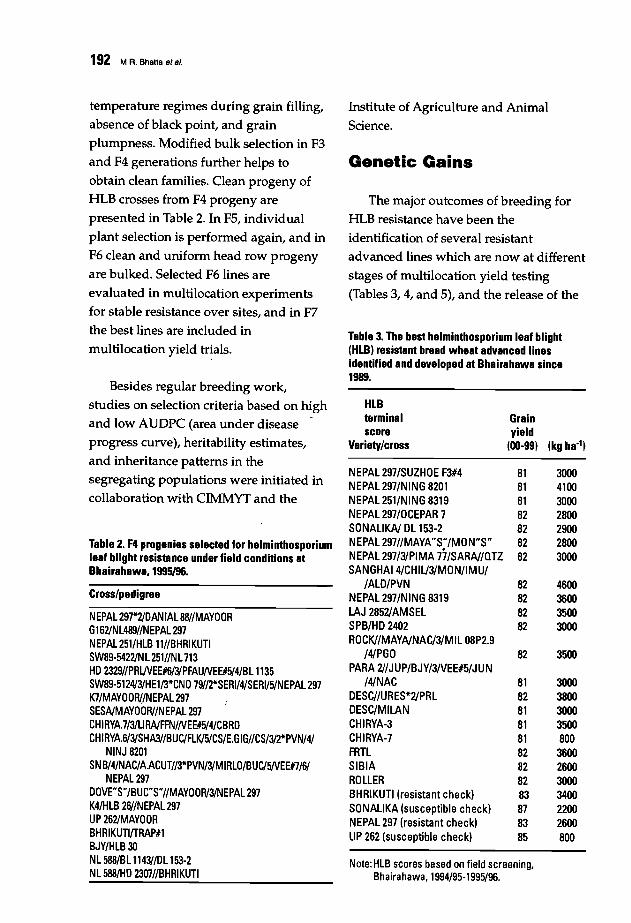
192 M.R. ShaUa at a/.
temperature regimes during grain filling,absence of black point, and grain
plumpness. Modified bulk selection in F3
and F4 generations further helps to
obtain clean families. Clean progeny ofHLB crosses from F4 progeny arepresented in Table 2. In F5, individual
plant selection is performed again, and in
F6 clean and uniform head row progenyare bulked. Selected F6 lines are
evaluated in multilocation experiments
for stable resistance over sites, and in F7the best lines are included in
multilocation yield tr~als.
Besides regular breeding work,
studies on selection criteria based on highand low AUDPC (area under disease
progress curve), heritability estimates,and inheritance patterns in the
segregating populations were initiated incollaboration with CIMMYT and the
Table 2. F4 progenies selected for helminthosporiumleaf blight resistance under field conditions atBhairahawa.1995/96.
Cross/pedigree
NEPAl297*2/DAN(Al88//MAYOORGI62/Nl489//NEPAl297NEPAl 251/HlB 11//BHRIKUTISW89·5422/Nl251//Nl713HD 2329//PRlJVEE#6/31PFAUNEE#5/4/Bll135SW89·5124/31HE1/3*CNO 79//2*SERI/4/SERI/5/NEPAl297K7/MAYOOR//NEPAl297SESA/MAYOOR//NEPAl297CHIRYA.7/3/liRNFFN/NEE#5/4/CBRDCHIRYA.6131SHA3//BUC/FlK/5/CS/E.GIG//CS/3/2*PVN/4/
NINJ 8201SN B/4/NAC/A.ACUT//3*PVN/31MIRlO/BUC/5NEE#7/6/
NEPAL 297DOVE"S"/BUC"S"//MAYOOR/31NEPAl297K4/HlB 261/NEPAl297UP 262/MAYOORBHRIKUTI/TRAP#1BJY/HlB 30Nl588/BlI1431IDll53-2Nl588/HD 2307//BHRIKUTI
Institute of Agriculture and Animal
Science.
Genetic Gains
The major outcomes of breeding for
HLB resistance have been the
identification of several resistantadvanced lines which are now at different
stages of multilocation yield testing
(Tables 3, 4, and 5), and the release of the
Table 3. The best helminthosporium leaf blight(HlB) resistant bread wheat advanced linesidentified and developed at Bhairahawa since1989.
HlBterminal Grainscore yield
Variety/cross (00·99) (kg ha-')
NEPAL 297/SUZHOE F3#4 81 3000NEPAL 297/NING 8201 81 4100NEPAL 251/NING 8319 81 3000NEPAL 297/0CEPAR 7 82 2800SONALIKA/ Dl153-2 82 2900NEPAL 297//MAYA"S;'/MON"S" 82 2800NEPAL 297/31PIMA 77/SARA/laTZ 82 3000SANGHAI4/CHIl/3/MON/IMU/
/AlD/PVN 82 4600NEPAL 297/NING 8319 82 3600LAJ 2852/AMSEl 82 3500SPB/HD 2402 82 3000ROCK//MAYA/NAC/3/Mll08P2.9
/4/PGO 82 3500PARA 2//JUP/BJY/3/VEE#5/JUN
/4/NAC 81 3000DESCl/URES*2/PRl 82 3800DESC/MILAN 81 3000CHIRYA-3 81 3500CHIRYA·7 81 800FATl 82 3600SIBIA 82 2600ROllER 82 3000BHRIKUTI (resistant check) 83 3400SONALIKA (susceptible check) 87 2200NEPAL 297 (resistant check) 83 2600UP 262 (susceptible check) 85 800
Note: HlB scores based on field screening,Bhairahawa, 1994/95-1995/96.
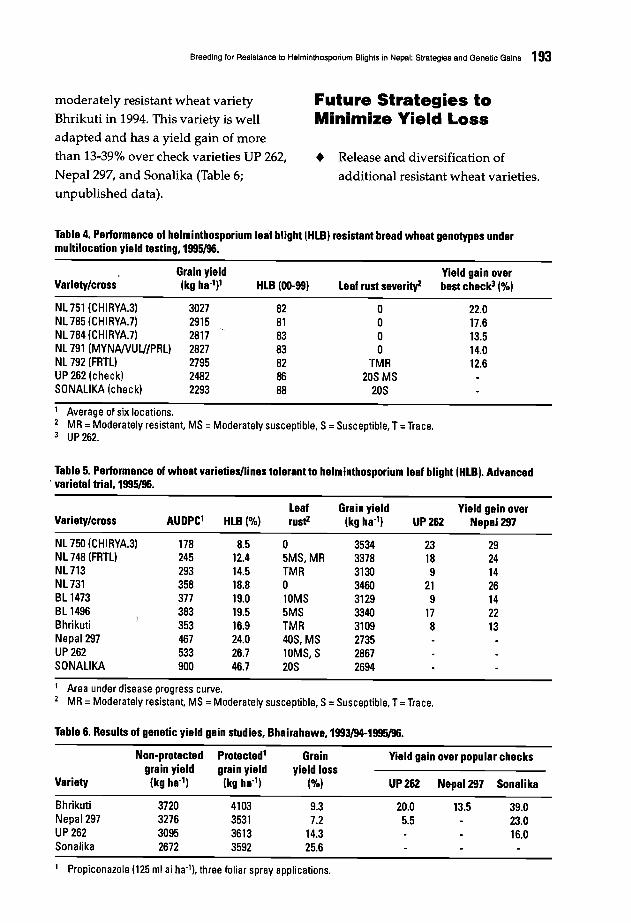
Breeding for Resistance to Helmlnthosporium Blights in Nepal: Strategies and Genetic Gains 193
moderately resistant wheat variety
Bhrikuti in 1994. This variety is well
adapted and has a yield gain of more
than 13-39% over check varieties UP 262,
Nepal 297, and Sonalika (Table 6;
unpublished data).
Future Strategies toMinimize Yield Loss
• Release and diversification of
additional resistant wheat varieties.
Table 4. Performance of helminthosporium le8f blight (HLB) resistant bread wheat genotypes undermultilocation yield testing,1995/96.
Grain yieldVariety/cross (kg ha")'
NL 751 (CHIRYA.3) 3027NL 785 (CHIRYA.7) 2915NL 784 (CHIRYA.71 2817NL 791 (MYNA/VULJ/PRL) 2827NL 792 (FRTL) 2795UP 262 (check) 2482SONALIKA (check) 2293
HLB (00-99)
82818383828688
Yield gain overLeaf rust severityZ best check3 (%)
o 22.0o 17.6o 13.5o 1~0
TMR 12.620S MS
20S
1 Average of six locations.MR = Moderately resistant, MS =Moderately susceptible, S= Susceptible, T=Trace.UP 262.
Tabla 5. Parformance of wheat varieties/linas tolerant to helminthosporium leaf blight (HLB). Advanced. varietal trial,1995/96.
Leaf Grain yield Yield gain overVariety/cross AUDPC' HLB(%) rust2 (kg ha") UP 262 Nepal 297
NL 750 (CHIRYA.3) 178 8.5 0 3534 23 29NL 748 (FRTL) 245 12.4 5MS,MR 3378 18 24NL 713 293 14.5 TMR 3130 9 14NL 731 358 18.8 0 3460 21 26BL 1473 377 19.0 10MS 3129 9 14BL 1496 383 19.5 5MS 3340 17 22Bhrikuti 353 16.9 TMR 3109 8 13Nepal 297 467 24.0 4OS, MS 2735UP 262 533 26.7 lOMS,S 2867SONALIKA 900 46.7 20S 2694
1 Area under disease progress curve.2 MR = Moderately resistant, MS = Moderately susceptible, S=Susceptible, T=Trace.
Table 6. Results of genetic yield gain studies, Bhairahawa,1993/94-1995/96.
Non-protected Protected' Grain Yield gain over popular checksgrain yield grain yield yield loss
Variety (kg ha") (kg ha") (%) UP 262 Nepal 297 Sonalika
Bhrikuti 3720 4103 9.3 20.0 13.5 39.0Nepal 297 3276 3531 7.2 5.5 23.0UP 262 3095 3613 14.3 16.0Sonalika 2672 3592 25.6
1 Propiconazole (125 ml ai ha·11. three foliar spray applications.
194 M.R. Bhatta at a/.
• Continuation of the search for better
resistance in synthetic hexaploids
and other bread wheats, and its
transfer to better adapted wheats.
• Inheritance studies on HLBresistance.
• Legume crop establishment between
wheat harvest and rice planting to
minimize soilborne inoculum.
Reference.
Alam, K.B., Ahmed, AU., and P.K. Malakar.1994. Bipolaris leaf blight (spot blotch) of 'wheat in Bangladesh. In: D.A Saundersand G.P. Hettel (eds.), Wheat in HeatStressed Environments: Irrigated DryAreas and Rice-Wheat Farming Systems,pp. 339-342. Mexico, D.E:CIMMYT.
Bhatta, M.R 1996. Present status of wheatimprovement research in Nepal and thebreeding strategies. In: R.N. Devkota andE.E. Saari (eds.), Proceedings of WheatResearch Reports. National WintercropsTechnology Workshop, pp. 27-36.Kathmandu, Nepal: NARC/CIMMYT.
Central Bureau of Statistics 1996.Preliminary Estimates.
Devkota, R.N. 1994. Wheat breedingobjectives in Nepal: the national testingsystem and recent progress. In: D.ASaunders and G.P. Hettel (eds.), Wheat inHeat Stressed Environments: IrrigatedDry Areas and Rice-Wheat FarmingSystems, pp. 216-223. Mexico, D.E:CIMMYT.
Dubin, H.J., and H.P. Bimb. 1991. Effects ofsoil and foliar treatment on yields anddisease of wheat in low land Nepal. In:D.A Saunders (ed.), Wheat for theNontraditional Warm Areas, pp. 484-485.Bangkok, Thailand: CIMMYT.
Dubin, H.J., and M. van Ginkel. 1991. Thestatus of wheat diseases and diseaseresearch in warmer areas. In: D.A.Saunders (ed.), Wheat for theNontraditional Warm Areas, pp. 125-146.Bangkok, Thailand: CIMMYT.
Duveiller, E.L., and L. Gilchrist. 1994.Production constraints due to Bipolatissorokiniana in wheat: current situationand future prospects. In: D.A Saundersand G.P. Hettel (eds.), Wheat in HeatStressed Environments: Irrigated DryAreas and Rice-Wheat Farming Systems,pp. 343-352. Mexico, D.E: CIMMYT.
Hetzler, J., Eyal, Z., Mehta, Y.R, Campos,L.A., Fehrmann, H., Kushnir, U.,Zekaria-Oren, J., and L. Cohen. 1991.Interactions between spot blotch(Cochliobolus sativus) and wheat cultivars.In: D.A Saunders (ed.), Wheat for theNontraditional Warm Areas, pp. 146164. Bangkok, Thailand: CIMMYT.
Mahto, B.N. 1996. Level of resistance inselected wheat genotypes againstHelminthosporium leaf blight. In: R.N.Devkota and E.E. Saari (eds.),Proceedings of Wheat Research Reports.National Wintercrops TechnologyWorkshop, pp. 315-324. Kathmandu,Nepal: NARC/CIMMYT.
Mahto, B.N., Sedhai, G.R, and J.J. Tripathi.1996. Wheat grain yield losses infarmers' field due to foliar blightinfection at outreach site Bankatti,Rupandehi. In: RN. Devkota and E.E.Saari (eds.), Proceedings of WheatResearch Reports. National WintercropsTechnology Workshop, pp. 593-596.Kathmandu, Nepal: NARC/CIMMYT.
Mehta, YR. 1985. Breeding wheats forresistance to helminthosporium spotblotch. In: Wheats for More TropicalEnvironments. Proceedings of theInternational Symposium, pp. 135-144.Mexico, D.E: CIMMYT.
Breeding for Resistance 10 Helminthosporlum Blights in Nepal: Strategies and Genetic Gains 195
Raemaekers, R.H. 1988. Helminthosporiumsativum: disease complex on wheat andsources of resistance in Zambia. In: A.R.Klatt (ed.), Wheat ProductionConstraints in Tropical Environments,pp. 175-186. Mexico, D.F.: CIMMYT.
Reis, E.M. 1991. Integrated diseasemanagement the changing concepts ofcontrolling head blight and spot blotch.In: D.A. Saunders (ed.), Wheats for theNontraditional Warm Areas, pp. 165-177.Bangkok, Thailand: CIMMYT.
Ruckstuhl, M. 1994. Wheat yield losses infarmers' fields due to foliar blightinfection. In: D.A. Saunders and G.P.Hettel (eds.), Wheat in Heat StressedEnvironments: Irrigated Dry Areas andRice-Wheat Farming Systems, pp. 397398. Mexico, D.F.:CIMMYT.
Saari, E.E. 1986. Wheat disease problems insoutheast Asia. In: L.M. Joshi, D.V. Singh,and K.D. Srivastava (eds.), Problems andProgress of Wheat Pathology in SouthAsia pp. 31-40. New Delhi: MalhotraPublishing House.
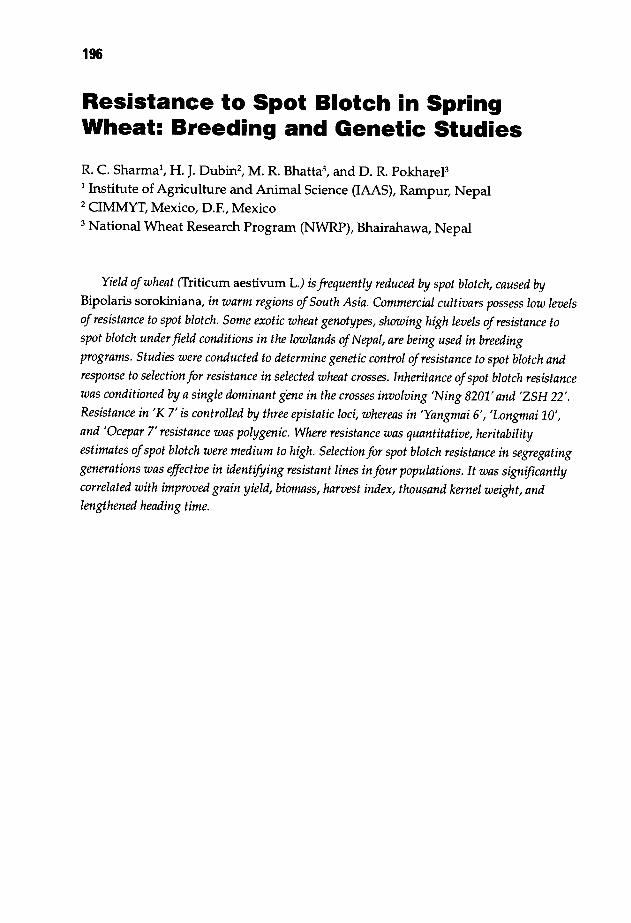
196
Resistance to Spot Blotch in SpringWheat: Breeding and Genetic Studies
R. C. Sharmal , H. J. Dubin2, M. R. Bhatta3
, and D. R. PokhareP1 Institute of Agriculture and Animal Science (IAAS), Rampur, Nepal2 CIMMYT, Mexico, D.E, Mexico
3 National Wheat Research Program (NWRP), Bhairahawa, Nepal
Yield ofwheat (friticum aestivum L.) is frequently reduced by spot blotch, caused byBipolaris sorokiniana, in warm regions ofSouth Asia. Commercial cultivars possess low levelsof resistance to spot blotch. Some exotic wheat genotypes, showing high levels of resistance tospot blotch under field conditions in the lowlands ofNepal, are being used in breedingprograms. Studies were conducted to determine genetic control of resistance to spot blotch andresponse to selection for resistance in selected wheat crosses. Inheritance ofspot blotch resistancewas conditioned by a single dominant gene in the crosses involving 'Ning 8201' and 'ZSH 22'.Resistance in 'K 7' is controlled by three epistatic loci, whereas in 'Yangmai 6', 'Longmai 10',and 'Ocepar 7' resistance was polygenic. Where resistance was quantitative, heritabilityestimates ofspot blotch were medium to high. Selection for spot blotch resistance in segregatinggenerations was effective in identifying resistant lines in four populations. It was significantlycorrelated with improved grain yield, biomass, harvest index, thousand kernel weight, andlengthened heading time.
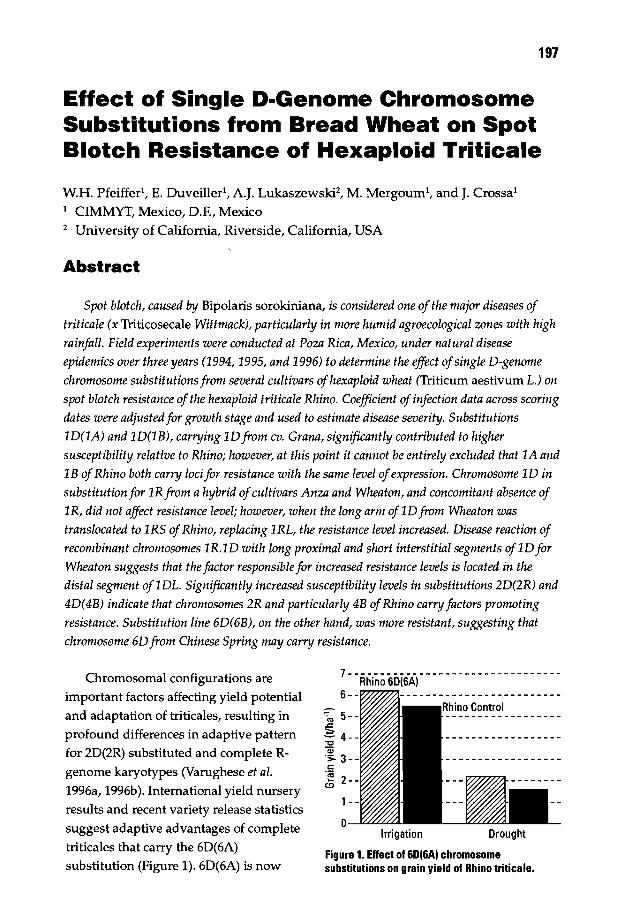
197
Effect of Single D-Genome ChromosomeSubstitutions from Bread Wheat on SpotBlotch Resistance of Hexaploid Triticale
W.H. Pfeiffer!, E. Duveiller!, A.J. LukaszewskF, M. Mergoum1, and J. Crossa1
1 CIMMYT, Mexico, D.P., Mexico
2 University of California, Riverside, California, USA
Abstract
Spot blotch, caused by Bipolaris sorokiniana, is considered one of the major diseases oftriticale (x Triticosecale Wittmack), particularly in more humid agroecological zones with highrainfall. Field experiments were conducted at Poza Rica, Mexico, under natural diseaseepidemics over three years (1994, 1995, and 1996) to determine the effect ofsingle D-genomechromosome substitutions from several cultivars ofhexaploid wheat (Triticum aestivum L.) onspot blotch resistance of the hexaploid triticale Rhino. Coefficient of infection data across scoringdates were adjusted for growth stage and used to estimate disease severity. Substitutions1D(1A) and 1D(1B), carrying 1D from cv. Grana, significantly contributed to highersusceptibility relative to Rhino; however, at this point it cannot be entirely excluded that 1A and1B of Rhino both carry loci for resistance with the same level ofexpression. Chromosome 1D insubstitution for 1R from a hybrid ofcultivars Anza and Wheaton, and concomitant absence of1R, did not affect resistance level; however, when the long arm of1D from Wheaton wastranslocated to 1RS of Rhino, replacing 1RL, the resistance level increased. Disease reaction ofrecombinant chromosomes 1R.1D with long proximal and short interstitial segments of1D forWheaton suggests that the factor responsible for increased resistance levels is located in thedistal segment of1DL. Significantly increased susceptibility levels in substitutions 2D(2R) and4D(4B) indicate that chromosomes 2R and particularly 4B ofRhino carry factors promotingresistance. Substitution line 6D(6B), on the other hand, was more resistant, suggesting thatchromosome 6D from Chinese Spring may carry resistance.
Chromosomal configurations areimportant factors affecting yield potential
and adaptation of triticales, resulting in
profound differences in adaptive patternfor 2D(2R) substituted and complete R
genome karyotypes (Varughese et al.1996a, 1996b). International yield nursery
results and recent variety release statistics
suggest adaptive advantages of completetriticales that carry the 6D(6A)
substitution (Figure 1). 6D(6A) is now
7---------------------------------Rhino 6D(6A)6--
":'", 5-.<:
~ 4---c~>- 3-c
'cot5
oIrrigation Drought
Figure 1. Effect of 6D(6A) chromosomesubstitutions on grain yield of Rhino triticale.
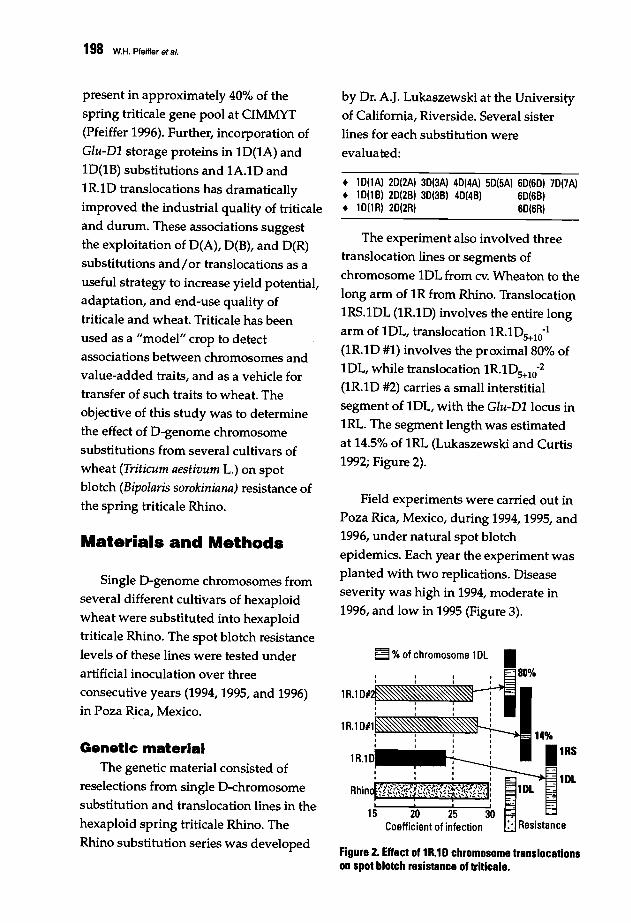
198 W.H. Pfeiffer 91 a/.
Figure 2. Effect of 1R.1D chromosome translocationson spot blotch resistance of triticale.
~%of chromosome 10L •
80%
1DL
14%
11R5
~1DL
~ Resistance
Rhin~.<"l:}§1("'t':}tf(.<"lY'li(ll:}q~~r\\'t.. ' ~J "'I\.... '~.: "I: l\,,~.: )\ I
! ! , !
15 20 25 30Coefficient of infection
I,, , ,, , ,
lR.10#1
lR.10#
• m(IA) 20(2A) 30(3A) 40(4Al 50(5A) 60(601 70(7A)• 10(1 B) 20(2B) 30(3B) 40(4B) 60(6B)• 10(IR) 20(2Rl 60(6R)
Field experiments were carried out in
Poza Rica, Mexico, during 1994, 1995, and
1996, under natural spot blotch
epidemics. Each year the experiment was
planted with two replications. Disease
severity was high in 1994, moderate in
1996, and low in 1995 (Figure 3).
by Dr. A.I. Lukaszewski at the University
of California, Riverside. Several sister
lines for each substitution were
evaluated:
The experiment also involved three
translocation lines or segments of
chromosome 10L from cv. Wheaton to the
long arm of 1R from Rhino. Translocation
1RS.10L (lR10) involves the entire long
arm of 10L, translocation 1R10s+1O-1
(lR10 #1) involves the proximal 80% of
10L, while translocation 1R10s+1O-2
(lR10 #2) carries a small interstitial
segment of 10L, with the Glu-Dllocus in
1RL. The segment length was estimated
at 14.5% of 1RL (Lukaszewski and Curtis
1992; Figure 2).
Single O-genome chromosomes from
several different cultivars of hexaploid
wheat were substituted into hexaploid
triticale Rhino. The spot blotch resistance
levels of these lines were tested under
artificial inoculation over three
consecutive years (1994, 1995, and 1996)
in Poza Rica, Mexico.
Materials and Methods
Genetic materialThe genetic material consisted of
reselections from single O-chromosome
substitution and translocation lines in the
hexaploid spring triticale Rhino. The
Rhino substitution series was developed
present in approximately 40% of the
spring triticale gene pool at CIMMYT
(Pfeiffer 1996). Further, incorporation of
Glu-Dl storage proteins in 10(lA) and
10(lB) substitutions and 1A.10 and
1R10 translocations has dramatically
improved the industrial quality of triticale
and durum. These associations suggest
the exploitation of O(A), O(B), and O(R)
substitutions and/or translocations as a
useful strategy to increase yield potential,
adaptation, and end-use quality of
triticale and wheat. Triticale has been
used as a "model" crop to detect
associations between chromosomes and
value-added traits, and as a vehicle for
transfer of such traits to wheat. The
objective of this study was to determine
the effect of O-genome chromosome
substitutions from several cultivars of
wheat (Triticum aestivum L.) on spot
blotch (Bipolaris sorokiniana) resistance of
the spring triticale Rhino.

Effect cf Single D·Gencme Chrcmcscme Substitutions from Bread Wheat on Spot Blotch Resistance of Hexaploid Triticale 199
Disease was scored at three dates in
1994 and 1996, and at two dates in 1995,
using a 00-99 double-digit scale. The first
digit represents the vertical disease
progress and the second digit, a disease
severity estimate. Grain yield and
agronomic data from Cd. Obregon,
Sonora, and Toluca, Edo. de Mexico, were
also used for covariance analysis. Growth
stage (Zadoks' decimal code) was
recorded for each scoring date (Zadoks etai.1974).
Data analysisDetailed data analysis was
performed, taking into account all
variables. Results included a pooled
analysis across sister lines, scoring dates,
and years using c?efficient of infection
data (digit 1: disease progress x digit 2:
severity) adjusted by growth stage.
Results
Substitutions ID(IA) and ID(18)
carried the same chromosome 1D from
cv. Grana, a winter wheat from Poland.
Both substitution lines show clearly
90..,.-------------,
80
g 70.~
.2! 60 -c::s 50-
'g 40
~ 30-'"8 20 - ~"
L~~~~=~~;~~....--10 - ~~~~-
O-~"""'-----------......
Figure 3. Dynamics of disease epidemics indifferent years.
higher susceptibility levels (Figure 4).
This suggests that chromosome ID of
Grana contributed to susceptibility;
however, at this point it cannot be
entirely excluded that both chromosomes
lA and 18 of Rhino carry loci for
resistance with the same level of
expression. Chromosome 1D in
substitution for lR was from a hybrid
between cultivars Anza and Wheaton,
and the presence of the chromosome and
concomitant absence of lR did not affect
the resistance level; however, when the
long arm of ID from Wheaton was
translocated to IRS of Rhino (i.e., it
replaced lRL of Rhino), the resistance
level increased (Figure 2). Two
recombinant chromosomes of 1R.ID with
a long proximal (80%) and a short
interstitial segment (14%) of IDL from
Wheaton did not differ in their spot
blotch disease reaction relative to Rhino,
indicating that the factor responsible for
increased resistance levels in the lRS.IDL
translocation must be located in the distal
70{7A) ·.·.·.·.·.·.·.·.·.·.·.·160(6R) ·.·.·.·.·.·.·.·.·.·.·~I
60{6B} 1
60(6A) ·.·.·.·.·.·.·.·.·.·.·.·.·.·.150(5A} ·.·.···.·.·.·.·-:1 I:~::::~..~...~..~..,~..~..~...~..~...~:-~..I~$~~~~l30(3B) ····················]1~~\~~:~..~...~..~..~.:-~:-~:-:~-:~-:~~$~20~2B} .•.•.·.••·.·.•.·.· .. :1120(2A) ..••.•••••.•.••••.•. ~ I
:~i:::~··I···I··I··I···I··I···I··I···~I~.~FRhino. I
10 20 30 40 50 60Coefficient of infection
Figure 4. Effect of D-genome chromosomesubstitutions on spot blotch resistance of triticale.

200 W.H. Pfeiffer at a/.
segment of 10L (the area which was
eliminated when chromosome lR.lOs+10·lwas produced) (Figure 2).
Increased susceptibility levels were
observed in substitutions 20(2R) and
40(4B), indicating that chromosomes 2R
and 4B of Rhino carry factors promoting
resistance (Figure 5). The factor on 4B
must be particularly stronger.
Substitution line 60(6B), on the other
hand, was more resistant, suggesting that
chromosome 60 from the hexaploid
wheat Chinese Spring maY' carryresistance.
Conclusions
• 10 of Grana contributes to
susceptibility. Substitutions 10(lA)
and 10(18) carry 10 from cv. Grana
and show clearly higher levels of
susceptibility; however, it cannot
entirely be excluded that lA and 18
of Rhino carry both loci for resistance
with same level of expression.
• Presence of 10 of Anza/Wheaton in10(lR) and concomitant absence of
lR had no effect on the level of
resistance..
• 10L from cv. Wheaton ,translocatedto IRS (replacing lRL), increased
resistance.
• A factor for increased resistance islocated in the distal segment of 10L.
Two recombinant chromosomes
lR.lO with long proximal and short
interstitial segments did not differ in
spot blotch resistance.
• Chromosomes 2R and 4B carryfactors promoting resistance. High
susceptibility levels were observed in
20(2R) and 40(4B).
• 60 of Chinese Spring may carryresistance. Substitution line 60(6B)
showed significantly higher
resistance levels.
90 ---------------------------------------------------------------
60(6B)40(4B)o ......aa.J.....................
40 ----------.. --68
30 ---------
20 66 .---
10 ..............·......
5 ~: ~~~~~~:~~~~~~~~~~~lltJ~ 60 ------------------~ 75~ 50 ------------------... 72c::Cl>'u==Cl>o
U
Figure 5. Growth stage and disease development in susceptible 4D(4B) and resistant 6D(6B) substitutionlines across scoring dates and years.
Effect of Single D·Genome Chromosome Substitutions from Bread Wheat on Spot Blotch Resistance of Hexaploid Triticale 201
References
Lukaszewski, A.J., and CA. Curtis. 1992.Transfer of the GIlI-D1 from chromosome1D of breadwheat to chromosome 1R inhexaploid triticale. Plant Breed 109:203210.
Pfeiffer, W.H. 1996. Triticale: potential andresearch status of a man-made cerealcrop. In: H. Guedes-Pinto, N. Darvey,and v.p. Carnide (eds.), Triticale: Todayand Tomorrow. Developments in PlantBreeding. Vol. 5, pp. 571-580. Dordrecht,the Netherlands: Kluwer AcademicPublishers.
Varughese, G., Pfeiffer, W.H., and R.J. Pena.1996a. Triticale: A successful alternativecrop (Part I). Cer Foods World 41 (6}:474482.
Varughese, G., Pfeiffer, W.H., and R.J. Pena.1996b. Triticale: A successful alternativecrop (Part 2). Cer Foods World 41 (7}:635645.
Zadoks, J.C, Chang, T.T., and CP. Konzak.1974. A decimal code for the growthstages of cereals. Weed Res 14:415-421.

202
Repeatability of Tan Spot ResistanceEvaluation in Wheat
X. Zhang, S.D. Haley, and Y. JinPlant Science Department, South Dakota State University, Brookings, USA
Abstract
Tan spot is an increasingly important problem for winter wheat production in the northernGreat Plains of the USA. Reduced-tillage (or no-tillage) planting into spring wheat stubble,widely credited with contributing to increased winter survival, is largely responsiblefor thedisease increase. The objective ofour study was to assess the inherent repeatability ofourgreenhouse seedling screening procedures as a complement to field screeningfor improvement oftan spot resistance. Thirty-seven wheat genotypes (released cultivars and experimental lines,both spring and winter growth habit), representing a range ofresistance reactions, were testedwith a tan spot isolate at four different time periods ("sets"). For each set, materials wereplanted in a randomized completed block design with two replications. Set inoculations,repeated at three-day intervals, were performed at the two-leafstage (when the second leafwasfully expanded) with a conidial suspension ofabout 7,000 spores mZ-1• The repeatability of tanspot resistance evaluation obtained.by the partitioning ofvariance components was very high(90.5%), suggesting a high degree ofconsistency between different evaluation periods. It wasconcluded that our current greenhouse screening procedure is very reliable and consistentlyidentifies germplasm with a high degree ofresistance at the seedling stage. More research isneeded, however, to verify the association between tan spot resistance reactions in juvenile andadult plants.
Tan spot, caused by Pyrenophora triticirepentis (Died.) Drechs., is an increasingly
important problem for winter wheat
(Triticum aestivum L.) production in thenorthern Great Plains of the USA(Hosford 1982). Reduced-tillage (or no
tillage) planting into spring wheatstubble, widely credited with
contributing to increased winter survival,
is largely responsible for the diseaseincrease. The use of resistant cultivars is
the most economic means to reduce yield
losses caused by tan spot. Althoughsources of P. tritici-repentis resistance are
available from diverse germplasms
(Evans et al. 1992; Gilchrist 1992; Rees andPlatz 1990; Riede et al. 1996), the
reliability of tan spot evaluation at the
seedling stage is unknown.
The objective of this study was to
assess the repeatability of our currentgreenhouse screening procedure for tan
spot resistance at the seedling stage.
Knowledge of repeatability of the
evaluation procedure would be
important for determining proper
allocation of project resources for
screening activities.

Materials and Methods
Plant material andseedling production
Thirty-seven wheat genotypes(released cultivars and experimental
lines, both spring and winter growth
habit; Table I), representing a range ofresistance reactions, were tested at four
different time periods ("sets") at three
day intervals. For each set, materials wereplanted in a randomized completed block
design with two replications. Plants were
Table 1. Wheat genotypes used in the study.
Genotype Growth habit Origin/source
BR34 Spring arazilCEP 11 Spring BrazilHalt Winter Colorado2137 Winter KansasJagger Winter KansasKS84063-9-39-3-2W Winter KansasKS84063-9-39-3-4W Winter KansasKS85W663-11-6-33 Winter KansasKS91044-9-39-3-2W Winter KansasKS91044-B-l-l Winter KansasKS950771-24-1 Winter KansasAlliance Winter NebraskaArapahoe Winter NebraskaRedland Winter NebraskaSiouxland Winter NebraskaVista Winter NebraskaElkhorn Winter North DakotaDawn Winter South DakotaRose Winter South DakotaSD89119 Winter South DakotaSD92174 Winter South DakotaSD93104 Winter South DakotaSD93113 Winter South DakotaSD93128 Winter South DakotaSD93267 Winter South DakotaSD93336 Winter South DakotaSD93340 Winter South DakotaSD93352 Winter South DakotaSD93407 Winter South DakotaSD94110 Winter South DakotaSD94112 Winter South DakotaSD94118 Winter South DakotaSD94167 Winter South DakotaSD94188 Winter South DakotaSD94189 Winter South DakotaSD94208 Winter South DakotaTAM 107 Winter Texas
Repeatability of Ten Spot Resistance Evaluation In Wheat 203
grown in plastic cell cone-tainers filled
with Sunshine No.1 mix. Three seedsfrom each genotype were planted in each
cone-tainer.
Inoculum productionA culture of P. tritici-repentis (Ptr002,
isolated in South Dakota) was used in thestudy. Conidia were produced following
the procedure described by Lamari and
Bernier (1989) with slight modification.Three V8-PDA agar pieces of the culture
were transferred onto one V8-PDA agarplate and incubated at 23 ± 2°C in the
dark. After three days of incubation, themycelium was flattened with a glass rod,
and the culture was incubated at room~emperaturewith constant fluorescent
light for 24 h. Plates were then incubatedat 15°C in the dark for 12-24 h. Conidia
were harvested by flooding the plateswith 10 ml water and dislodging the
spores by gently scraping colonies with arubber policeman (a piece of rubber
attached to a glass rod). To discardmycelia fragments, the suspension wasfiltered through two layers of
cheesecloth. One drop of Tween 80 wasadded to every 200 ml of conidia
suspension. The spore suspension wasadjusted to about 7,000 conidia ml- l .
InoculationPlants were inoculated when the
second leaf was fully expanded. Avolume of 80 ml of the conidia
suspension was sprayed evenly onto 300
plants using an atomizer. Plants were
placed into a mist chamber where a cool
mist ultrasonic humidifier was used to
supply constant mist. After 24 h ofincubation at 20°C in the dark, plants
204 X. Zhang, S.D. Haley, and Y. Jin
were incubated in a growth chamber with
a 12 h photoperiod at 20°C.
Disease rating and dataanalysis
Seven days after inoculation, the
lesion type was recorded based on a 0-9
visual rating scale (Table 2). The data were
analyzed by split-plot design, with
different sets as the main plots and
genotypes as subplots. A one-way
analysis of variance was used to estimate
the between and within mean squares and
variance components. Repeatability was
estimated according to Falconer (1989).
(P<O.OOl) at each evaluation time. The
genotype by set interaction was not
significant (P = 0.434). Results suggest
that, under our conditions, a single
replication provides reliable data for tan
spot seedling screening evaluations.
One-way analysis of variance is given
in Table 3. The estimate of repeatability is
0.905 (90.5%). The gain in precision from
repeating measurements (shown in
Figure 1), derived directly from the
variance components, indicates that a
moderate increase in precision (5%) may
be obtained by repeating the screening
evaluation a second time.
Results and Discussion
Analysis of variance revealed that
differences between replications within
evaluation times (sets) were not
significant (P =0.402), while differences
among genotypes were highly significant
Repeatability is the ratio of the
between individual components of
variance to total phenotypic variance.
From a breeder's viewpoint, the estimate
of repeatability provides an evaluation of
consistency of screening procedures
Table 3. One-way analysis of variance.Table 2. Tan spot rating scale used in the study.
Rating Symptom description Source df Mean squares EMS
Repeatability =crb2/lcrb
2+crw2) =5.28/(5.28 +0.55)= 0.905
Figure 1. Gain in precision from multiplemeasurements.
21.670.55
Between individuals 36Within individuals 108
1.00-0---------------,
§ 0.98
:~ 0.96Q)
15.0.94c.~ 0.92'n;CJ 0.90
0.88
0.86 +----r----,--r----r----,--r----r----;---i
1 2 3 4 5 6 7 8 9 10Number of measurements
o Small brown or black spots without anysurrounding chlorosis.
Small dark spots dominate the leaf but a fewspots are surrounded by a chlorosis ring.
2 Small black spots, but more than 50% aresurrounded by ayellow expanding area.
3 Yellow spots with tiny brown points at theircenters.
4 Yellow brown spots, few of which becomenecrotic.
5 Majority of the infection spots are smallnecrotic or chlorotic lesions marked withsome tiny black lesions.
6 All lesions are necrotic with a clear border.7 Some of the necrotic lesions begin to
coalesce and become small necroticcoalescing blotches.
8 Most necrotic lesions coalesce intonecrotic zones, and only a small portionof spots have distinguishable borders.
9 All lesions coalesce and the leaf is dead.
Repeatability of Tan Spot Resistance Evaluation in Wheal 205
repeated over time, or the reliability of
the screening technique (Campbell and
Carter 1990). For our greenhouse tan spot
seedling screening method, repeatability
of tan spot evaluation was high,
indicating that sufficient precision exists
for tan spot resistance selection in the
greenhouse.
Repeatability also establishes the
upper ceiling for heritability. As with
heritability, repeatability is not a property
of the trait per se but is a function of the
genotype and environment in which the
plants are grown and evaluated. When
data from different sources are compared,
evaluation technique should be taken
into consideration. We found that a
consistent and high spore concentration
(-7000 spores ml"l) could reduce
variation. As the tan spot reaction is
highly influenced by leaf age (Cox 1987;
Hosford et al. 1990), evaluation at a
specific leaf stage is critical.
The genotype x environment
interaction is another reason for data
variation. Further studies of plant
evaluation in different environments
should provide more information on the
improvement of tan spot screening
procedures. While seedling tan spot
resistance evaluation appears to be
consistent and reliable, more information
on correlation between field adult
screening and greenhouse seedling
screening is necessary to assess the
predictive value of the latter method.
Future research in our laboratory will
focus on the development of reliable field
screening procedures of adult plants.
References
Campbell, K.A.G., and T.E. Carter, Jr. 1990.Aluminum tolerance in soybean: I.Genotypic correlation and repeatability ofsolution culture and greenhouse screeningmethods. Crop Sci 30:1049-1054.
Cox, D.J. 1987. Resistant winter wheatscompared at differing growth stages andleaf positions for tan spot severity. PlantDis 71:10 883-886.
Evans, c.K., Hunger, R.M., and B.P. Carver.1992. Assessment of wheat genotypes inthe 1992 Southern Regional PerformanceNursery and genetic stocks carrying thelB/1R translocation for reaction to tan spotof wheat. In: L.J. Francl, J.M. Krupinsky,and M.P. McMullen (eds.), Advances in TanSpot Research. Proceedings of the 2ndInternational Tan Spot Workshop, pp. 3338. Fargo, ND, USA: North DakotaAgricultural Experiment Station.
Falconer, D.S. 1989. Introduction toQuantitative Genetics. 3rd ed. New York:Longman Scientific and Technical.
Gilchrist, L. 1992. Resistance to Pyrenopfwratritici-repentis in CIMMYT bread wheatgermplasm. In: L.J. Francl, J.M. Krupinsky,and M.P. McMullen (eds.), Advances in TanSpot Research. Proceedings of the 2ndInternational Tan Spot Workshop, pp. 4449. Fargo, ND, USA: North DakotaAgricultural Experiment Station.
Hosford, RM., Jr. 1982. Tan spot. In: RM.Hosford, Jr. (ed.), Tan Spot of Wheat andRelated Diseases Workshop, pp. 1-24.Fargo, ND, USA: North Dakota StateUnversity.
Hosford, RM., Jr., Jordahl, J.G., and J.J.Hammond. 1990. Effect of wheatgenotypes, leaf position, growth stage,fungal isolate, and wet period on tan spotlesions. Plant Dis 74:385-390.
Lamari, L., and c.c. Bernier. 1989. Evaluationof wheat for reaction to tan spot(Pyrenophora tritici-repentis) based oninfection type. Can J Plant Patholll:49-56.
Rees, RG., and D.J. Platz. 1990. Sources ofresistance to Pyrenophora tritici-repentis inbread wheats. Euphytica 45:59-69.
Riede, C.R, Francl, L.J., Jordahl, J.G., andS.W. Meinhardt. 1996. Additional sourcesof resistance to tan spot of wheat. Crop Sci36:771-777.
206
New Approach for Clustering BreedingGenotypes Using Production Variables,Yield Losses, and a Double-Digit DiseaseScale
J. Francol, E. Duveiller2
, J. Crossa2, and I. Garda2
1 Prograrna de Estadistica, ISEI, Colegio de Postgraduados, Montecillo, Mexico,and Biometrics and Statistics Unit, CIMMYT, Mexico
2 CIMMYT, Mexico, D.P., Mexico
Abstract
Spot blotch resistance was scored in an non-replicated set of198 bread wheat entries in PozaRica, Mexico. A 00-99 double-digit scale (DO) was used which can be considered as twoseparate discrete variables with different disease level categories (0, I, ... ,9). Continuousproduction variables were also measured: yield (YLD), WOO-grain weight (TGW), growth stage(GS; Zadoks' decimal code), and percent YLD and TGW loss (after comparison with afungicide-protected plot in the samefield). Genotypes were grouped according to threeapproaches: 1) using only DD data, 2) using only continuous variables GS, YLD, TGW, andpercent loss, and 3) using both types ofvariables. In the first approach, a cluster analysis wasconducted using Ward's minimum variance within groups. In the second method, genotypeswere clustered based on the normal mixture method sequential to Ward. The third and newapproach used the homogeneous conditional Gaussian (moqijied) method sequential to Ward.Classifications produced with the three methods were compared in order to choose the beststrategy for selecting genotypes based on a simultaneous analysis ofdiscrete disease data, yield,yield loss, and growth stage. In contrast to the two other methods, the third approach presenteda balanced distribution ofgenotypes for both types ofvariables (discrete and continuous),allowing the identification of three groups ofentries: 1) agroup (G2) with low values for bothdisease digits, the highest average value for YLD and TGW under disease pressure, and thelowest average YLD and TGW losses; 2) agroup (G4) with intermediate disease scores and thehighest average YLD and TWG with fungicide protection; and 3) agroup (G6) with the highestdisease level, the lowest average YLD and TGW under disease pressure, and the highest averageYLD and TGW losses. Breeders should carefully consider genotypes classified under G2, as they
•can be more useful than entries clustering in agroup with a lower disease level.
An unreplicated experiment yieldsone observation per experimental unitper treatment and does not allowexperimental error to be estimated;therefore, mean separation and
comparison based on least significant
difference (LSD) or Tukey are notpossible. In agricultural sciences, it iscommon to measure several variables inthe same experimental unit, i.e., presence
New Approach for Clustering Breeding Genotypes Using Production Variables, Yield Losses, and a Double-Digit Disease Scale 207
or absence of disease, grain yield
response, plant height, etc. Thus, it ispossible to use cluster analysis techniques
to group treatments (genotypes) into
homogeneous groups and be able toquantify and compare "within group"
variability and "between group"variability.
In general, hierarchical cluster
analyses are descriptive and geometrictechniques; however, Wolfe (1970)
introduced a more statistical approach tothe problem of classification. Heproposed the Gaussian mixture model,
which is a combination of severalmultivariate variables with normal
probability distributions, to estimateprobabilities of membership for each
individual into each group.
Materials and Methods
Statistical methodsThe Gaussian mixture model (Wolfe
1970; McLachlan and Basford 1988) hasbeen used to classify a random sample of
n observations xl' x2"'" xn obtained froma heterogeneous population into ghomogeneous subpopulations, based onthe measure of p continuous variables.
Lawrence and Krzanowski (1996)
extended the Gaussian mixture model for
clustering n observations into g
underlying subpopulations using a
mixture of continuous and categorical
data. The model, called HomogeneousConditional Gaussian Model (HGCM),
combines the q possible levels of the
categorical variables in one multinomial
variable W, with m = rr~ = 1 Ck total levels.
The vector representing the jth
observation (individual) in the sth
multinomial cell XjS [s = 1,2, , m(multinomial cells); j = 1, 2, , ns
(observations in the cell s)] has a size of
(p+l) x 1, containing the p continuousvariables and the multinomial variable. It
is assumed that the distribution of the p
continuous variables is multivariate,
normal and depends upon themultinomial cell in which the observationis placed, the probability of observing an
individual in cell s is Ps' and that eachobservation is drawn from a mixture of gsubpopulations 7t1, i = 1, 2, ..., g, with a
proportion 91 ( L~ = 191 = 1 ).
The model defines m x g cells and,
assuming homogeneous variance
covariance, the probability density
function in the Pi subpopulation is:
(1)
(i=l, 2, ..., g; s=l, 2, ..., m; j=l, 2, ..., ns)'
where Np(llls''1:.) is a random variable with
vector of means Ilis, and variancecovariance matrix '1:..
The solution is based on the
maximum likelihood estimation of thecell parameters, and is an iterative
process that starts with some estimators
and continues until the successive values
for f iSj are equal within the defined
tolerance limits. The authors propose
starting with a random grouping of thedata into g groups and m subgroups
within groups, and the usual maximum
likelihood estimators for each parameter
in each subgroup.
208 J. Franco at al.
Franco et al. (1997c) proposed a
modification to the HCGM model, calledMHCGM, which assumes that the
probability distribution function in the 1ti
subpopulation (Equation 1) is:
where the mean and variance-covariance
of the continuous variables depend only
on the ith subpopulation instead of on thespecific (is)lh cell. The model assumes that
the dispersion matrices and mean vectors
are equal for all multinomial cells withineach subpopulation, Le., the distributionof the continuous variables is
independent of the categorical variables.
The likelihood estimators of theparameters are:
t =I~ I m I~s t isj (Xf Pi)' (xs; - Pi)J=l s=l J=l
where
is the estimated probability ofmembership of the jslh observation into
the i1h subpopulation. Each observation is
assigned into the subpopulation with thelargest probability of membership.
The modification allows using
sequential clustering strategy (Franco etal. 1997a, 1997b) where priori groups are
first defined by a hierarchical method
such as the Ward method (1963) with the
Gower distance method (1971)
implemented by Wishart (1986) using all(continuous and categorical) variables.
Secondly, the MHCGM model is applied
to the Ward groups in an attemptto
improve their structure. This sequentialstrategy can be used with either theHCGM model (Ward-HCGM) or the
MHCGM model (Ward-MHCGM) and
allows the optimal number of
subpopulations to be estimated using
simple rules.
The approximate number of groups is
first determined from the results of theWard method using the upper tail rule
(Wishart 1987). Different numbers of
groups are then compared using themaximum likelihood criterion (Mardia etal. 1979), but always close to the number
of groups found by the upper tail rule.The final number of groups is chosen asthe g' with the highest value of X2 =-2 logL, the largest increment in the likelihood,when comparing gvs. g using the
likelihood criterion L =Lg/Lg" g<g'.
We implemented two algorithms
using the IML procedure in SAS (1990),which will fit either the HCGM model orthe MHCGM model, and used the
CLUSTAN (Wishart 1987) software for
the Ward method with the Gower
distance and upper tail rule.
For comparing the different strategies,the measures of affinity and distance
between groups were used for the HCGM
model proposed by Krzanowski (1983),
adapted to the MHCGM model. The
affinity coefficient between two groups i
and j (Pij) has two components: 1) theaffinity due to the continuous variables
New Approach for Clustering Breeding Genotypes Using Production Variables. Yield Losses, and a Double-Digit Disease Scale 209
Iij' associated with the Mahalanobis (1930)
distance 0 2, I ij = EXP{-D2i/8}, and 2) the
square root of the product of the relative
frequencies, due to the categorical
variables. The coefficient for the MCHGM
is:
when Pis and PjS are the proportion ofcases with the sth value in the i and jgroups, respectively. The affinity is then
the product of the affinity due to the
continuous variables by the affinity due
to the categorical variables. The measure
of distance adopted by Krzanowski (1983)
is that proposed by Matusita (1956):
~ij ={2(I-Pij )11/2.
Experimental dataResistance to spot blotch caused by
Bipolaris sorokiniana was evaluated in
Poza Rica, Mexico. Ouring the 1994-95
growing season, 198 spring wheat
genotypes were sown in an unreplicated
experiment with one plot (1 x 0.75 m) per
entry. Oisease scores were recorded when
most entries were at flowering stage (mid
February) using the double digit scale for
rating foliar disease intensity (Saari and
Prescott 1975; Eyal et al. 1987). This 00-99
scale can be considered as two discrete
variables, where digit 1 (01) measures the
height of the disease progress in the
canopy, and digit 2 (02) measures
severity on ordinal 0-9 scale. Seven
continuous variables, referred to as
production variables in this paper, were
also measured. Zadoks' scale (0-100
decimal code) was used to appraise
growth stage at disease scoring time
(Zadoks et al. 1979). Yield (g/plot) and
1000-grain weight were measured in the
diseased plot and in a continuous plot
sown with the same entries protected by
six sprays (0.5 L ha-1) of Folicur (ai
tebuconazole). This allowed percent yield
loss and 1000-grain weight loss to be
evaluated. Spot blotch was assessed in a
naturally infected field under the severe
epidemic conditions annually prevailing
in Poza Rica.
Results and Discussion
Six groups were formed when only
01 and 02 categories were used with the
Ward method. Groups Gl, G2, and G3
had low 01 and 02 values (01~8, 02~3;
Table 1); groups G4 and G5 had
intermediate infection levels (7~01~8,
4~02~6); and group G6 showed high
infection levels (01 =9, 4~02~9). The
groups did not show important
differences between means for the
continuous variables; the range of group
means of the continuous variables were
smaller than in any of the other
classification strategies. The Gaussian
mixture model applied to the groups
formed by using the Ward method, and
using only continuous variables,
produced five groups which showed a
clear separation of means of continuous
variables. The group means of the
continuous variables showed the widest
range; however, no clear pattern could be
found when 01 and 02 variables were
related to the five groups (Table 1).
The six groups formed using both
categorical and continuous variables and
applying the Ward-MHCGM sequential
approach showed differences in the range
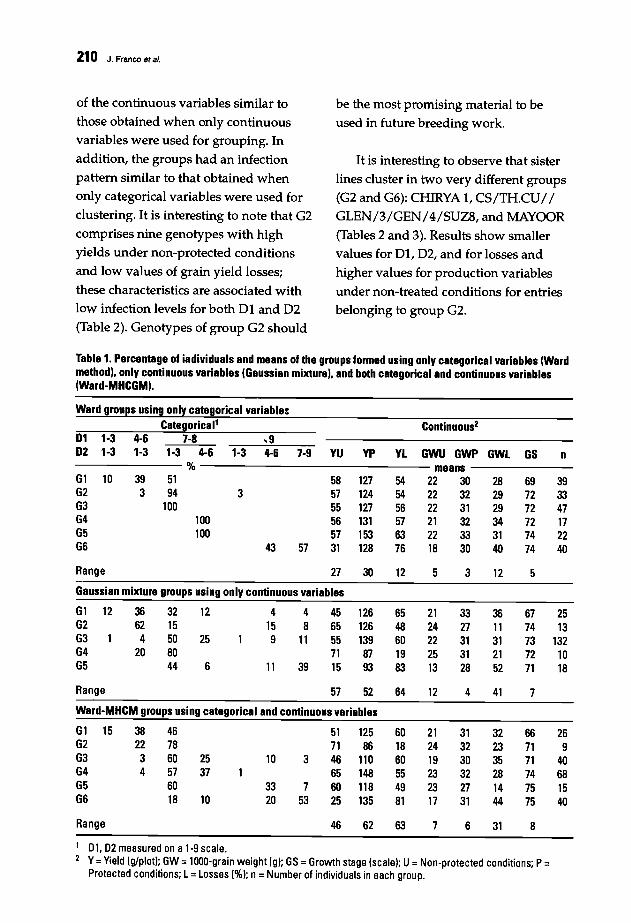
210 J. Franco et al.
of the continuous variables similar to
those obtained when only continuousvariables were used for grouping. In
addition, the groups had an infection
pattern similar to that obtained whenonly categorical variables were used for
clustering. It is interesting to note that G2
comprises nine genotypes with highyields under non-protected conditions
and low values of grain yield losses;
these characteristics are associated withlow infection levels for both 01 and 02
(Table 2). Genotypes of group G2 should
be the most promising material to be
used in future breeding work.
It is interesting to observe that sister
lines cluster in two very different groups(G2 and G6): CHIRYA 1, CS/TH.CU/ /
GLEN/3/GEN/4/SUZ8, and MAYOOR(Tables 2 and 3). Results show smaller
values for 01, 02, and for losses and
higher values for production variables
under non-treated conditions for entriesbelonging to group G2.
Table 1. Percentage of i.ndividuals and means of the groups formed using only categorical variables (Wardmethod), only continuous variables (Gaussian mixture), and both categorical and continuous variables(Ward-MHCGM).
Ward groups using only categorical variablesCategorical' Continuous2
n
393347172240
697272727474
5
GS
1235
545456576376
12
127124127131153128
30
585755565731
27
5743
3
100100
39 513 94
100
Range
61 106263646566
D1 1-3 4-6 7-8 ,9D2 1-3 1-3 1-3 4-6 1-3 4-6 7-9 YU YP YL GWU GWP GWL
% ---------------- means -------22 30 2822 32 2922 31 2921 32 3422 33 3118 30 40
Gaussian mixture groups using only continuous variables
61 1262636465
36624
20
3215508044
12
25
6
4159
11
48
11
39
45 12665 12655 13971 8715 93
6548601983
2124222513
12
3327313128
4
3611312152
41
67 2574 1373 13272 1071 18
7
Ward-MHCM groups using categorical and continuous variables
51 12571 8646 11065 14860 11825 135
61 156263646566
Range
382234
467860576018
2537
10
10
3320
3
753
46 62
601860554981
63
212419232317
7
313230322731
6
322335281444
31
667171747575
8
269
40681540
01. 02 measured on a 1-9 scale.Y=Yield (g/plot); GW =1000-grain weight (g); GS =Growth stage (scale); U=Non-protected conditions; P=Protected conditions; L=Losses (%); n= Number of individuals in each group.
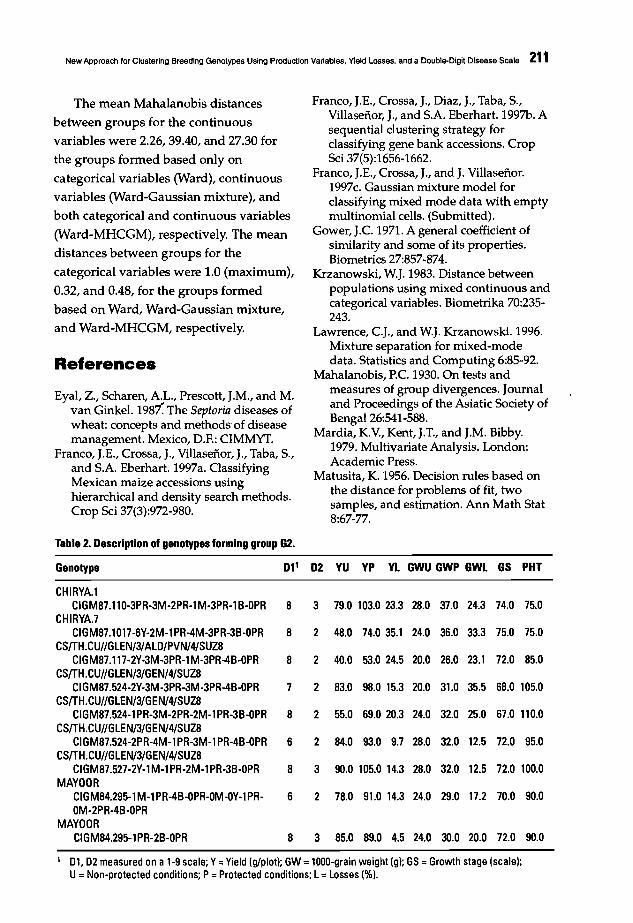
New Approach for Clustering Breeding Genotypes Using Production Variables, Yield Losses, and a Double-Digit Disease Scale 211
The mean Mahalanobis distances
between groups for the continuous
variables were 2.26, 39.40, and 27.30 for
the groups formed based only on
categorical variables (Ward), continuous
variables (Ward-Gaussian mixture), and
both categorical and continuous variables
(Ward-MHCGM), respectively. The mean
distances between groups for the
categorical variables were 1.0 (maximum),
0.32, and 0.48, for the groups formed
based on Ward, Ward-Gaussian mixture,
and Ward-MHCGM, respectively.
References
Eyal, Z., Scharen, AL., Prescott, J.M., and M.van Ginkel. 198i The Septaria diseases ofwheat: concepts and methods'of diseasemanagement. Mexico, D.E: CIMMYT.
Franco, J.E., Crossa, J., Villasenor, J., Taba, S.,and S.A Eberhart. 1997a. ClassifyingMexican maize accessions usinghierarchical and density search methods.Crop Sci 37(3):972-980.
Table 2. Description of genotypes forming group G2.
Franco, J.E., Crossa, J., Diaz, J., Taba, S.,Villasenor, J., and S.A Eberhart. 1997b. Asequential clustering strategy forclassifying gene bank accessions. CropSci 37(5):1656-1662.
Franco, J.E., Crossa, J., and J. Villasenor.1997c. Gaussian mixture model forclassifying mixed mode data with emptymultinomial cells. (Submitted).
Gower, J.e. 1971. A general coefficient ofsimilarity and some of its properties.Biometrics 27:857-874.
Krzanowski, W.J. 1983. Distance betweenpopulations using mixed continuous andcategorical variables. Biometrika 70:235243.
Lawrence, e.J., and W.J. Krzanowski. 1996.Mixture separation for mixed-modedata. Statistics and Computing 6:85-92.
Mahalanobis, P.e. 1930. On tests andmeasures of group divergences. Journaland Proceedings of the Asiatic Society ofBengal 26:541-588.
Mardia, K,Y., Kent, J.T., and J.M. Bibby.1979. Multivariate Analysis. London:Academic Press.
Matusita, K, 1956. Decision rules based onthe distance for problems of fit, twosamples, and estimation. Ann Math Stat8:67-77.
Genotype D1' D2 YU YP Yl GWU GWP GWL GS PHT
CHIRYA.lCIGM87.110-3PR-3M-2PR-l M-3PR-l B-OPR 8 3 79.0 103.0 23.3 28.0 37.0 24.3 74.0 75.0
CHIRYA.7CIGM87.1017-6Y-2M-l PR-4M-3PR-3B-OPR 8 2 48.0 74.0 35.1 24.0 36.0 33.3 75.0 75.0
CSfTH.CU//GLEN/3/ALD/PVN/4/SUZ8CIGM87.117-2Y-3M-3PR-l M-3PR-4B-OPR 8 2 40.0 53.0 24.5 20.0 26.0 23.1 72.0 85.0
CSfTH.CU//GLEN/3/GEN/4/SUZ8CIGM87.524-2Y-3M-3PR-3M-3PR-4B-OPR 7 2 83.0 98.0 15.3 20.0 31.0 35.5 68.0 105.0
CSfTH.CU//GLEN/3/GEN/4/SUZ8CIGM87.524-1 PR-3M-2PR-2M-l PR-3B-OPR 8 2 55.0 69.0 20.3 24.0 32.0 25.0 67.0 110.0
CSfTH.CU//GLEN/3/GEN/4/SUZ8CIGM87.524-2PR-4M-l PR-3M-l PR-4B-OPR 6 2 84.0 93.0 9.7 28.0 32.0 12.5 72.0 95.0
CSfTH.CU//GLEN/3/GEN/4/SUZ8CIGM87.527-2Y-l M-l PR-2M-l PR-3B-OPR 8 3 90.0 105.0 14.3 28.0 32.0 12.5 72.0 100.0
MAYOORCIGM84.295-1 M-l PR-4B-OPR-OM-OY-l PR- 6 2 78.0 91.0 14.3 24.0 29.0 17.2 70.0 90.0OM-2PR-4B-OPR
MAYOORCIGM84.295-1PR-2B-OPR 8 3 85.0 89.0 4.5 24.0 30.0 20.0 72.0 90.0
1 01,02 measured on a 1-9 scale; Y=Yield (g/plot); GW = IOOO-grain weight (g); GS =Growth stage (scale);U=Non-protected conditions; P=Protected conditions; L=Losses (%).
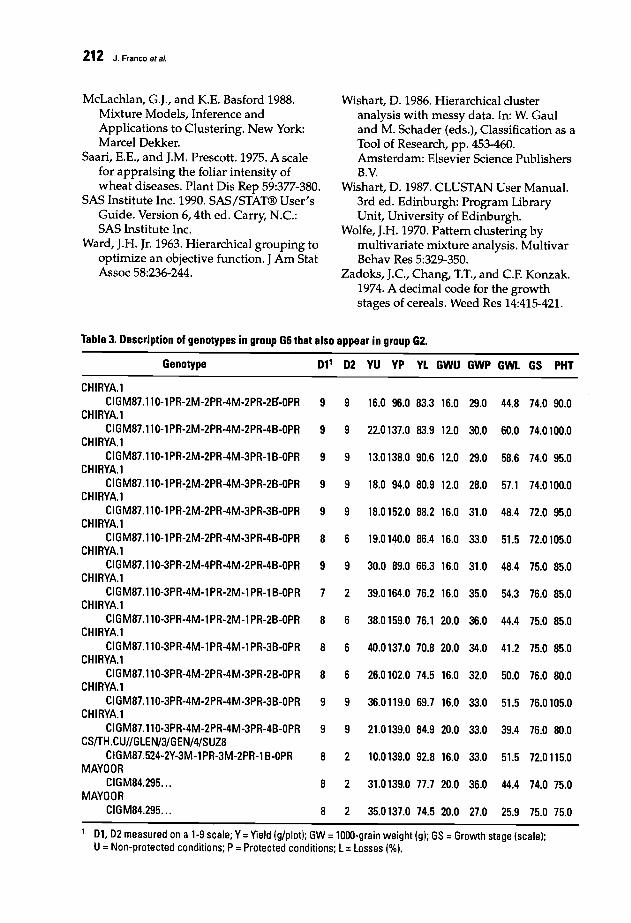
212 J. Franco at al.
McLachlan, G.J., and K.E. Basford 1988.Mixture Models, Inference andApplications to Clustering. New York:Marcel Dekker.
Saari, E.E., and J.M. Prescott. 1975. A scalefor appraising the foliar intensity ofwheat diseases. Plant Dis Rep 59:377-380.
SAS Institute Inc. 1990. SAS/STAT® User'sGuide. Version 6, 4th ed. Carry, N.C:SAS Institute Inc.
Ward, J.H. Jr. 1963. Hierarchical grouping tooptimize an objective function. J Am StatAssoc 58:236-244.
Wishart, D. 1986. Hierarchical clusteranalysis with messy data. In: W. Gauland M. Schader (eds.), Classification as aTool of Research, pp. 453-460.Amsterdam: Elsevier Science PublishersB.Y.
Wishart, D. 1987. CLUSTAN User Manual.3rd ed. Edinburgh: Program LibraryUnit, University of Edinburgh.
Wolfe, J.H. 1970. Pattern clustering bymultivariate mixture analysis. MultivarBehav Res 5:329-350.
Zadoks, J.C, Chang, T.T., and CF. Konzak.1974. A decimal code for the growthstages of cereals. Weed Res 14:415-421.
Table 3. Description of genotypes in group G6 that also appear in group G2.
Genotype D11 D2 YU YP YL GWU GWP GWL GS PHT
CHIRYA.lCIGM87.110-1 PR-2M-2PR-4M-2PR-2El'-OPR 9 9 16.0 96.0 83.3 16.0 29.0 44.8 74.0 90.0
CHIRYA.lCIGM87.110-1 PR-2M-2PR-4M-2PR-4B-OPR 9 9 22.0137.0 83.9 12.0 30.0 60.0 74.0100.0
CHIRYA.lCIGM87.110-1 PR-2M-2PR-4M-3PR-l B-OPR 9 9 13.0138.0 90.6 12.0 29.0 58.6 74.0 95.0
CHIRYA.lCIGM87.110-1 PR-2M-2PR-4M-3PR-2B-OPR 9 9 18.0 94.0 80.9 12.0 28.0 57.1 74.0100.0
CHIRYA.lCIGM87.110-1 PR-2M-2PR-4M-3PR-3B-OPR 9 9 18.0152.0 88.2 16.0 31.0 48.4 72.0 95.0
CHIRYA.lCIGM87.110-1 PR-2M-2PR-4M-3PR-4B-OPR 8 6 19.0140.0 86.4 16.0 33.0 51.5 72.0105.0
CHIRYA.lCIGM87.110-3PR-2M-4PR-4M-2PR-4B-OPR 9 9 30.0 89.0 66.3 16.0 31.0 48.4 75.0 85.0
CHIRYA.lCIGM87.110-3PR-4M-l PR-2M-l PR-l B-OPR 7 2 39.0164.0 76.2 16.0 35.0 54.3 76.0 85.0
CHIRYA.lCIGM87.110-3PR-4M-l PR-2M-l PR-2B-OPR 8 6 38.0159.0 76.1 20.0 36.0 44.4 75.0 85.0
CHIRYA.lCIG M87.11 0-3PR-4M-l PR-4M-l PR-3B-OPR 8 6 40.0137.0 70.8 20.0 34.0 41.2 75.0 85.0
CHIRYA.lCIGM87.110-3PR-4M-2PR-4M-3PR-2B-OPR 8 6 26.0102.0 74.5 16.0 32.0 50.0 76.0 80.0
CHIRYA.lCIGM87.110-3PR-4M-2PR-4M-3PR-3B-OPR 9 9 36.0119.0 69.7 16.0 33.0 51.5 76.0105.0
CHIRYA.lCIGM87.110-3PR-4M-2PR-4M-3PR-4B-OPR 9 9 21.0139.0 84.9 20.0 33.0 39.4 76.0 80.0
CS/TH.CU//GlEN/3/GEN/4/SUZ8CIGM87.524-2Y-3M-l PR-3M-2PR-l B-OPR 8 2 10.0139.0 92.8 16.0 33.0 51.5 72.0115.0
MAYOORCIGM84.295... 8 2 31.0139.0 77.7 20.0 36.0 44.4 74.0 75.0
MAYOORCIGM84.295... 8 2 35.0137.0 74.5 20.0 27.0 25.9 75.0 75.0
1 Dl, D2 measured on a 1-9 scale; Y=Yield (g/plot); GW = IOOO-grain weight (g); GS = Growth stage (scalel;U= Non-protected conditions; P= Protected conditions; l = losses (%).
r
213
Screening Wheat for Bipolarissorokiniana Resistance in Vietnam
T.D. Minh, T.D. Long, and T.T. Ngu
Vietnam Agricultural Science Institute (VASI), Van Dien, Thanh Tri, Hanoi,
Vietnam
Abstract
Spot blotch, caused by Bipolaris sorokiniana (Helminthosporium sativum syn.Cochliobolus sativus), is one of the most important diseases ofwheat in northern Vietnam,particularly in the Red River Plains (lowlands). In 1987 and 1988, early maturing and spotblotch resistant wheat lines (Long 83-3393, Yiu 83N-6148, Yiu83-5069, and Vee/Buc) wereselected from CIMMYT, Thailand, sources. New sources were received from CIMMYT, Mexico.Of 1751 lines introduced between 1991-1995, 198 were selected for spot blotch resistance. Linesshowing the best resistance and good agronomic type were: Chyria-1, Chyria-3, SHA3//BUC/FLK, Yang Mai 6, Mayoor, and Chyria-1. They produced yields of up to 5 t ha-1• Most are midmaturing lines with moderate susceptibility to powdery mildew.
Vietnam is a tropical country in
Southeast Asia, located between 9 and
23°N latitude, with a total area of around
32,955,600 ha. Population has increased
from 64 to 74 million people during 19891996. Rice is the staple food, but wheat
products are becoming more common in
the Vietnamese diet. Although rice
exports are 1-3 million t per year, wheat
flour imports increased from 300,000 to
800,000 t in 1996.
In the northern part of Vietnam (Red
River Plains, Hanoi), winter temperatures
vary between 24.6°C in October and 18
20°C in November to March. Winter
rainfall is low at around 100 mm and
relative humidity (RH) levels are 80-88%
(Table 1).
An attempt to develop wheat as a
commercial crop in Vietnam failed due to
a lack of disease resistant material. The
climate is favorable for wheat growing
but also for disease development. In the
Red River Plains (lowlands), wheat
production is limited by disease, in
particular by spot blotch, caused by
Bipolaris sorokiniana.
Breeding Objectives
The first wheat breeding objective is
selection for resistance to B. sorokiniana.Other traits selected for are: early
maturity, powdery mildew resistance,
fusarium head scab resistance, leaf rust
resistance, and yield stability.
Materials and Methods
A total of 1872 bread wheat entries .
have been introduced, most of them
originating from CIMMYT. During 1987-
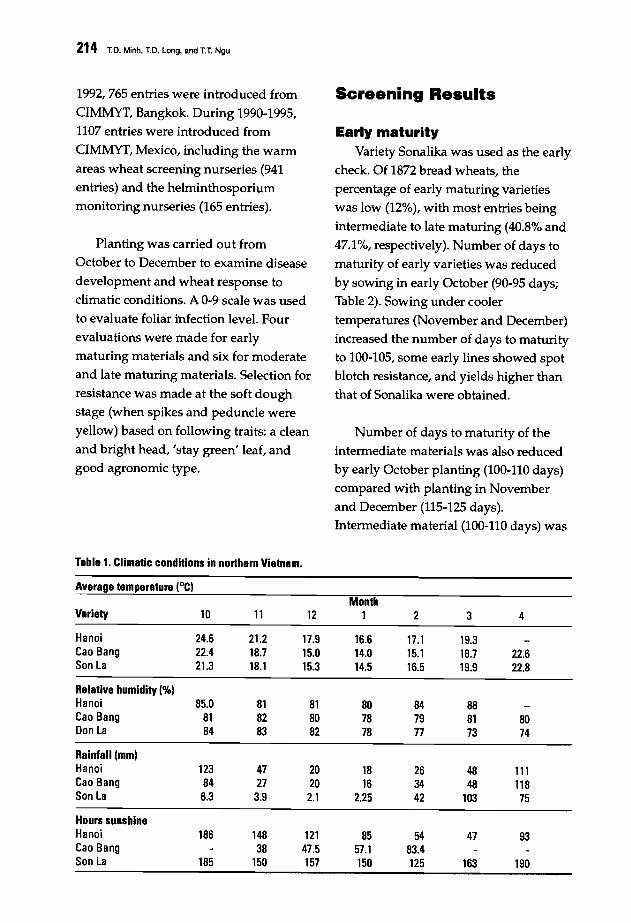
214 T.O. Minh, T.O. Long, and T.T. Ngu
1992/765 entries were introduced from
CIMMYT, Bangkok. During 1990-1995/
1107 entries were introduced fromCIMMYT, Mexico, including the warm
areas wheat screening nurseries (941
entries) and the helminthosporiummonitoring nurseries (165 entries).
Planting was carried out from
October to December to examine disease
development and wheat response toclimatic conditions. A 0-9 scale was usedto evaluate foliar infection level. Four
evaluations were made for earlymaturing materials and six for moderate
and late maturing materials. Selection for
resistance was made at the soft doughstage (when spikes and peduncle wereyellow) based on following traits: a cleanand bright head, /stay green/ leaf, and
good agronomic type.
Table 1. Climatic conditions in northern Vietnam.
Screening Results
Early maturityVariety Sonalika was used as the early
check. Of 1872 bread wheats, the
percentage of early maturing varietieswas low (12%)/ with most entries being
intermediate to late maturing (40.8% and
47.1%/ respectively). Number of days tomaturity of early varieties was reduced
by sowing in early October (90-95 days;Table 2). Sowing under cooler
temperatures (November and December)
increased the number of days to maturityto 100-105/ some early lines showed spotblotch resistance, and yields higher than
that of Sonalika were obtained.
Number of days to maturity of theintermediate materials was also reducedby early October planting (100-110 days)
compared with planting in Novemberand December (115-125 days).Intermediate material (100-110 days) was
Average temperature (OCIMonth
Variety 10 11 12 1 2 3
Hanoi 24.6 21.2 17.9 16.6 17.1 19.3Cao Bang 22.4 18.7 15.0 14.0 15.1 18.7Son La 21.3 18.1 15.3 14.5 16.5 19.9
Relative humidity (%1Hanoi 85.0 81 81 80 84 88Cao Bang 81 82 80 78 79 81Don La 84 83 82 78 77 73
Rainfall (mmlHanoi 123 47 20 18 26 48Cao Bang 84 27 20 16 34 48Son La 6.3 3.9 2.1 2.25 42 103
Hours sunshineHanoi 186 148 121 85 54 47Cao Bang 38 47.5 57.1 83.4Son La 185 150 157 150 125 163
4
22.622.8
8074
11111875
93
190
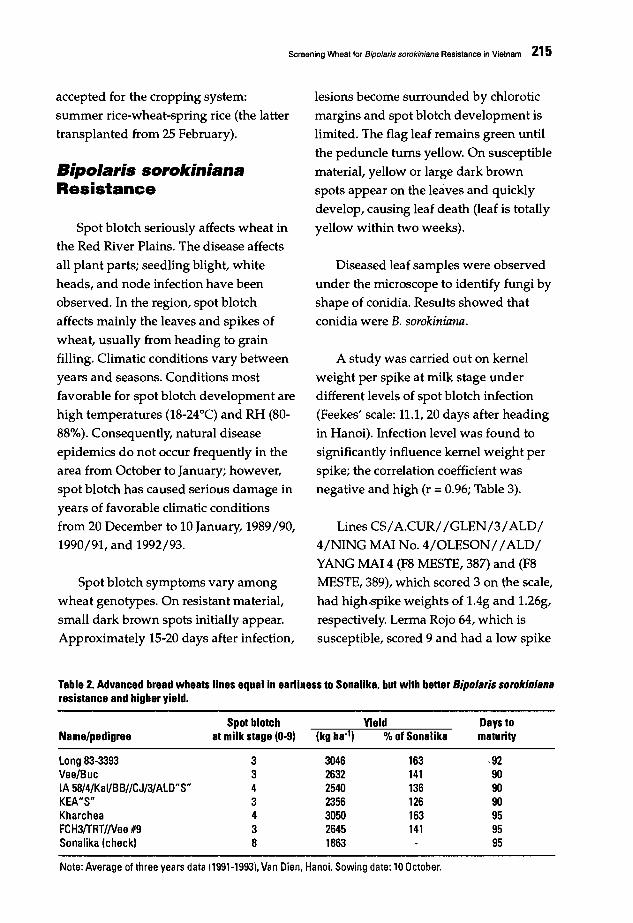
Screening Wheat for Bipolaris sorokiniana Resistance in Vietnam 215
accepted for the cropping system:
summer rice-wheat-spring rice (the latter
transplanted from 25 February).
Bipolaris sorokinianaResistance
Spot blotch seriously affects wheat in
the Red River Plains. The disease affects
all plant parts; seedling blight, white
heads, and node infection have been
observed. In the region, spot blotch
affects mainly the leaves and spikes of
wheat, usually from heading to grain
filling. Climatic conditions vary between
years and seasons. Conditions most
favorable for spot blotch development are
high temperatures (18-24°C) and RH (80
88%). Consequently, natural disease
epidemics do not occur frequently in the
area from October to January; however,
spot blotch has caused serious damage in
years of favorable climatic conditions
from 20 December to 10 January, 1989/90,
1990/91, and 1992/93.
Spot blotch symptoms vary among
wheat genotypes. On resistant material,
small dark brown spots initially appear.
Approximately 15-20 days after infection,
lesions become surrounded by chlorotic
margins and spot blotch development is
limited. The flag leaf remains green until
the peduncle turns yellow. On susceptible
material, yellow or large dark brown
spots appear on the leaves and quickly
develop, causing leaf death (leaf is totally
yellow within two weeks).
Diseased leaf samples were observed
under the microscope to identify fungi by
shape of conidia. Results showed that
conidia were B. sorokiniana.
A study was carried out on kernel
weight per spike at milk stage under
different levels of spot blotch infection
(Feekes' scale: 11.1,20 days after heading
in Hanoi). Infection level was found to
significantly influence kernel weight per
spike; the correlation coefficient was
negative and high (r = 0.96; Table 3).
Lines CS/A.CUR/ /GLEN/3/ALD/
4/NING MAl No. 4/0LESON/ / ALD/YANG MAl 4 (F8 MESTE, 387) and (F8
MESTE, 389), which scored 3 on the scale,
had high.spike weights of l.4g and 1.26g,
respectively. Lerma Rojo 64, which is
susceptible, scored 9 and had a low spike
Table 2. Advanced bread wheats lines equal in earliness to Sonalika. but with better Bipolaris sorokinianaresistance and higher yield.
Spot blotch Yield Days toName/pedigree at milk stage (0-9) (kg ha") % of Sonalika maturity
Long 83-3393 3 3046 163 ,92Vee/Buc 3 2632 141 90IA 58/4/KaI/BBI/CJ/3/ALD"S" 4 2540 136 90KEA"S" 3 2356 126 90Kharchea 4 3050 163 95FCH3/TRT//Vee #9 3 2645 141 95Sonalika (check) 8 1863 95
Note: Average of three years data 0991-19931. Van Dien. Hanoi. Sowing date: 10 October.
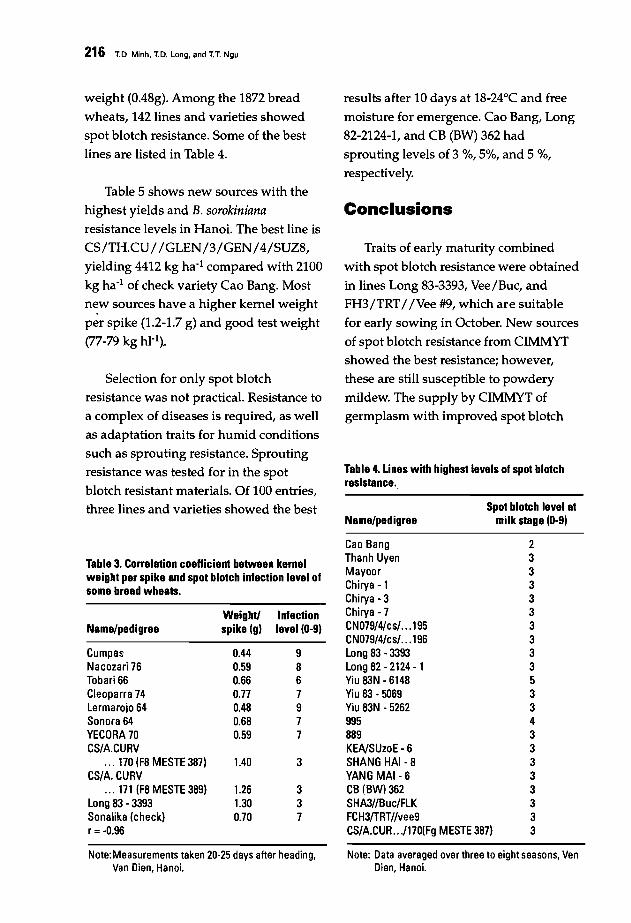
216 ToO. Minh, T.D. Long, and T.T. Ngu
weight (0.48g). Among the 1872 bread
wheats, 142 lines and varieties showed
spot blotch resistance. Some of the bestlines are listed in Table 4.
results after 10 days at 18-24°C and free
moisture for emergence. Cao Bang, Long82-2124-1, and CB (BW) 362 had
sprouting levels of 3 %, 5%, and 5 %,
respectively.
Conclusions
Table 4. Lines with highest levels of spot blotchresistance..
Traits of early maturity combined
with spot blotch resistance were obtained
in lines Long 83-3393, Vee/Buc, andFH3/TRT/ /Vee #9, which are suitable
for early sowing in October. New sourcesof spot blotch resistance from CIMMYTshowed the best resistance; however,
these are still susceptible.to powdery
mildew. The supply by CIMMYT ofgermplasm with improved spot blotch
Table 5 shows new sources with the
highest yields and B. sorokinianaresistance levels in Hanoi. The best line is
CS/TH.CU/ /GLEN/3/GEN/4/SUZ8,yielding 4412 kg ha- l compared with 2100
kg ha- l of check variety Cao Bang. Most
n~w sources have a higher kernel weightper spike (1.2-1.7 g) and good test weight(77-79 kg hI-I).
Selection for only spot blotchresistance was not practical. Resistance toa complex of diseases is required, as well
as adaptation traits for humid conditions
such as sprouting resistance. Sproutingresistance was tested for in the spotblotch resistant materials. Of 100 entries,
three lines and varieties showed the bestName/pedigree
Spot blotch level atmilk stage (0-9)
Cao Bang 2
Table 3. Correlation coefficient between kernel Thanh Uyen 3
weight per spike and spot blotch infection level of Mayoor 3
some bread wheats. Chirya - 1 3Chirya - 3 3
Weight! Infection Chirya - 7 3
Name/pedigree spike (g) level (0-9) CN079/4/cs/... 195 3CN079/4/cs/... 196 3
Cumpas 0.44 9 long 83 - 3393 3Nacozari 76 0.59 8 long 82 - 2124 - 1 3Tobari 66 0.66 6 Yiu 83N ·6148 5Cleoparra 74 0.77 7 Yiu 83·5069 3lermarojo 64 0.48 9 Yiu 83N - 5262 3Sonora 64 0.68 7 995 4YECORA 70 0.59 7 889 3CS/A.CURV KEA/SUzoE - 6 3
... 170 (F8 MESTE 387) 1.40 3 SHANG HAI-8 3CS/A. CURV YANG MAI- 6 3
... 171 (F8 MESTE 389) 1.26 3 CB (BW) 362 3long 83 - 3393 1.30 3 SHA3//Buc/FlK 3Sonalika (check) 0.70 7 FCH3/TRT//vee9 3r =-0.96 CS/A.CUR .. ./170(Fg MESTE 387) 3
Note: Measurements taken 20-25 days after heading, Note: Data averaged over three to eight seasons, VenVan Dien, Hanoi. Dien, Hanoi.

Screening Wheat for Bipolaris sorokiniana Resistance in Vietnam 217
resistance accelerates our work-However, Acknowledgmentwe hope CIMMYT will be successful incombining this with resistanc.e to other The authors wish to thank CIMMYT
biotic constraints that are part of the for providing materials to VASI, and Dr.
disease complex present in Vietnam. E. Duveiller for the opportunity topresent this paper.
Table 5. Characteristics of lines with the highest Bipo/aris sorokiniana resistance levels and yields inHanoi.
Weight (g) TestYield Days to Height Spikes 1000- Disease' weight
Name/pedigree (kg ha-') maturity (cm) m-2 grain Spike H E.g (kg hl-')
CS/TH.CU//G LEN/3/G EN/4/SUZ8 4412 125 106 277 39.2 1.59 0 76.6IBS-15
CH4227/TRM//MAD/3NEE 3842 115 105 223 35 1.72 0 77.6IBS·29
CHIRYA-3 3628 125 86 237 38 130 3 0 79.2IBS-85
CHIRYA-3 3619 125 84 219 39 1.65 3 0 77.8IBS-84
CHIRYA-3 3514 125 80 283 32 1.24 0 75.2IBS·62
SANTA ANA 88 3408 125 87 223 40 1.53 0 78.8IBS-35
MAYOOR 3394 125 105 255 32 1.33 0 79IBS-56
A6/GLEN 3312 125 100 276 40 1.2 0 76.8IBS-20
CS/TH.CU//GLEN/3/GEN/4/SUZ8 3076 115 95 183 38 1.68 3 5 79.2IBS-l00
CS/TH.CU//GLEN/3/GEN/4/SUZ8 3054 115 95 196 37 1.56 3 5 76.8IBS-99
CHIRYA-3 3043 125 83 227 34 1.34 3 0 79.0IBS-88
CS/TH.CU//G LEN/3/G EN/4/SUZ8 2942 115 93 203 34 1.45 3 5 78.6IBS·97
CS/TH.CU//GLEN/3/GEN/4/SUZ8 2874 115 93 215 36 1.34 3 5 76.8IBS-98
CHI RYA-3 2861 125 87 210 34 1.36 3 0 77.8IBS-87
CHIRYA-7 2828 125 90 210 33 1.35 3 0 77.2IBS-l02
CN079/4/CS/TH.CUI/GLEN/3/ALD/PVN 2591 120 96 186 34 1.39 3 0 78.8N IBS-l05
CAO BANG (resistant check) 2100 145 106 250 17 0.84 1 0 77.2CHIRYA·7 2057 130 90 150 36 1.37 3 0 73.8
IBS-l0l
Note: Sowing date: 5October 1995.1 H=BipoJaris sorokiniana; E.g =Erysiphe graminis.
218
Tan Spot Resistance in Tetraploid andHexaploid Wheat
H. Ma, G.R. Hughes, and Wenguang Cao
Crop Development Centre, University of Saskatchewan, Saskatoon, SK, Canada
Abstract
Tan spot is a member of the leaf-spot complex that attacks wheat in 5askatchewan each yearand can cause significant yield losses. Tan spot is particularly important on durum wheat (pinksmudge phase) and winter wheat. As part ofa program to breed for tan spot resistance in wheat,a range ofwheat genotypes was evaluated at the two-to-three-Ieafstage for reaction toPyrenophora tritici-repentis in growth room tests. 50urces ofresistance, some believed to bepreviously unreported, were identified in both durum and common wheat. Resistance to tanspot has also been transferred from Triticum timopheevii (PI 290518) into durum wheat cv.Wakooma to produce resistant sib-lines 53-6, 59-10, and 512-1. Preliminary genetic studies ofresistant tetraploid and hexaploid wheats indicate that resistance is simply controlled, involvingone or two genes. Evidence for linkage of tan spot resistance and resistance to septoria nodorumblotch to red kernel color was found in line 59-10. More detailed inheritance studies areplanned. Attempts to identify RAPD markers to use in marker-assisted selection for tan spotresistance have commenced. Preliminary results indicate that marker UBC521-650 is looselylinked (15% recombination) to tan spot resistance in the cross 59-1O/5ceptre.
In the central and northern croppingareas of Saskatchewan, tan spot, caused
by Pyrenophora tritici-repentis, occurs as
part of the wheat leaf spot complex that
also includes septoria nodorum blotch
and septoria tritici blotch. This leaf spot
complex is estimated to cause an average
15% reduction in grain yield and to affect
grain bread-making quality (G.R.
Hughes, unpublished data). Tan spot is
found in most wheat fields each year, but
severity varies in this cropping region.
However, in recent years, tan spot has
become the predominant leaf-spotting
disease on durum wheat. Spot blotch,
caused by Cochliobolus sativus, is generally
only a minor disease in this region.
Because none of the current
commercially grown bread and durum
wheat cultivars possess good resistance
to tan spot, some years ago we initiated a
research program to identify useful
sources of resistance, to determine the
genetic control of resistance in these
sources, and, more recently, to identify
RAPD markers to permit marker-assisted
selection for tan spot resistance. Our
immediate breeding objectives are to
incorporate resistance into adapted
durum and winter wheat cultivars. This
paper will report briefly on our progress,
with particular emphasis on durum
wheat.
Screening Methodology
A combination of growth room and
field tests is used. In the growth room
tests, inoculum is prepared according to
the procedure described by Lamari and
Bernier (1989). Seedlings are inoculated at
the two-leaf stage with a single isolate of
P. tritici-repentis (Ptr 200, collected at
Aylsham, SK) at a concentration of 3-4
x103 spores per ml. After inoculation,
plants are placed in a moist chamber for
24 h and then moved back to growth
room benches. The moist chamber is
locate'd in the growth room which runs at
21/16°C day/night temperature and a 16
h photoperiod. Plants are rated using the
scale proposed by Lamari and Bernier
(1989), seven days after inoculation.
Plants rating lor 2 on this scale are
considered resistant.
In field tests, both infected straw and
spore suspension are used as inoculum.
The infected straw is spread in the plots
soon after seedling emergence. Plots are
sprayed in the evening with the spore
suspension at the three-leaf and flag-leaf
stages and irrigated by a low-volume
irrigation system for 10 minutes each
hour for the next 12 h. To enhance disease
spread, this same irrigation schedule is
followed twice each week during the
growing season. Plots are rated at the
flag-leaf and mid-milk stages using a 1-10
scale, which considers both disease
severity and spread on the three highest
leaves. On this scale, plants rating 6 (5
10% severity on the flag leaf) at the flag
leaf stage are classed as resistant, and
rating 7 (10-25%) are classed as
moderately resistant.
Tan Spot Resistance in Tetraploid and Hexaploid Wheat 219
Screening for Resistance
Both tetraploid wild and adapted
cultivars and hexaploid wheats have
been screened for resistance. Of 390
tetraploid accessions from the USDA
wheat collection tested in growth room
seedling tests, only one, T. dicoccon PI
254190, gave a resistant reaction (rating 1)
in duplicate tests. Fourteen accessions
were moderately resistant in both tests: T.
carthlicum CI 7692; T. dicoccon accessions
CI 3686, CI 4572, CI 9311, CI 12213, PI
254178, PI 254190, PI 254193; T. turanicumaccessions CI 11390, PI 254201, PI 254212;
and T. turgidum accessions CI 3270, CI
7877, CI 8077, CI 13713. Other resistance
sources identified are listed in Table 1.
Genetic Control of TanSpot Resistance
Hexaploid wheatPreliminary studies based on seedling
tests of the F1 generation and F3 or BCF2
families of the crosses 81IWWMN2095,
Hadden, and ZG7581-83 with susceptible
cv. Kenyon suggested that resistance is
partially recessive and controlled by a
single gene (Table 2).
Tetraploid wheatThree resistant, red-seeded sib-lines,
53-6,59-10, and 512-1, were extracted
from the cross T. timopheevii (PI 290518)/
2"durum cv. Wakooma. Since Wakooma is
susceptible, these lines represent a
successful attempt to introgress tan spot
resistance from T. timopheevii into a T.
durum background.
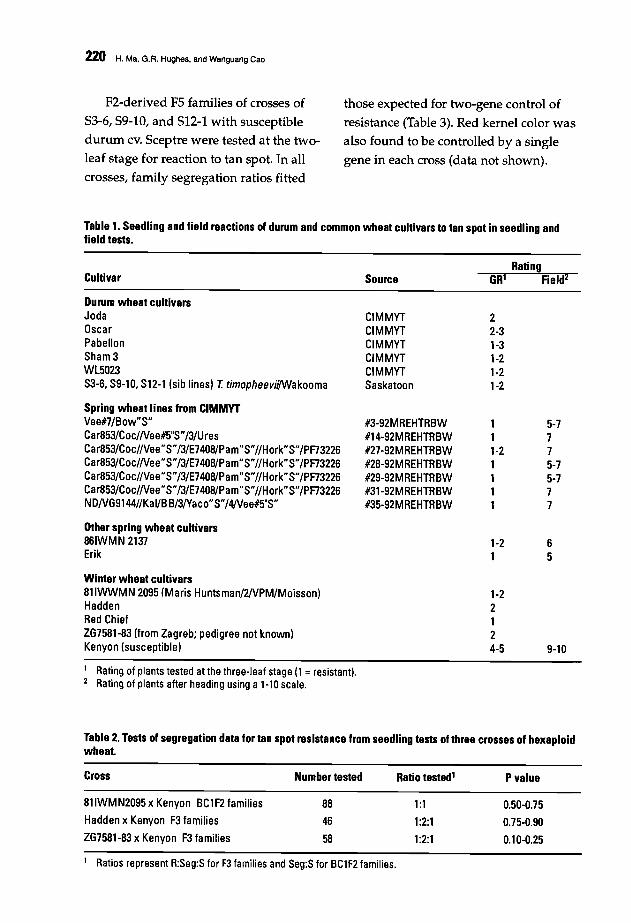
220 H. Ma. G.R. Hughes. and Wenguang Cao
F2-derived F5 families of crosses of
53-6,59-10, and 512-1 with susceptibledurum cv. 5ceptre were tested at the two
leaf stage for reaction to tan spot. In all
crosses, family segregation ratios fitted
those expected for two-gene control ofresistance (Table 3). Red kernel color was
also found to be controlled by a single
gene in each cross (data not shown).
Table 1. Seedling and field reactions of durum and common wheat cultivars to tan spot in seedling andfield tests.
Cultivar Source
Durum wheat cultivarsJodaOscarPabellonSham3Wl5023S3-6, S9-10, S12-1 (sib lines) T. timopheeviilWakooma
Spring wheat lines from CIMMYTVee#7/Bow"S"Car853/Coc//Vee#5"S"/3/UresCar853/Coc//Vee"S"/3/E7408/Pam"S"//Hork"S"/PF73226Car853/Coc//Vee"S"/3/E7408/Pam"S"/IH ork"S"/PF73226Car853/Coc//Vee"S"/3/E7408/Pam"S"//Hork"S"/PF73226Car853/Coc//Vee"S"/3/E7408/Pam"S"//Hork" S"/PF73226ND/VG9144//KaI/BB/3/Yaco"S"/4/Vee#5"S"
Other spring wheat cultivars861WMN 2137Erik
Winter wheat cultivars811WWMN 20951Maris Huntsman/2/VPM/Moisson)HaddenRed ChiefZG7581-83 (from Zagreb; pedigree not known)Kenyon (susceptible)
1 Rating of plants tested at the three-leaf stage (1 =rQsistant).2 Rating of plants after heading using a 1-10 scale.
CIMMYTCIMMYTCIMMYTCIMMYTCIMMYTSaskatoon
#3-92MREHTRBW#14-92MREHTRBW#27-92MREHTRBW#28-92MREHTRBW#29-92MREHTRBW#31-92MREHTRBW#35-92MREHTRBW
22-31-31-21-21-2
111-21111
1-21
1-22124-5
5-7775-75-777
65
9-10
Table 2. Tests of segregation data for tan spot resistance from seedling tests of three crosses of hexaploidwheat
Cross
811WM N2095 xKenyon BC1F2 families
Hadden xKenyon F3 families
ZG7581-83 xKenyon F3 families
Number tested
88
46
58
Ratio tested'
1:1
1:2:1
1:2:1
Pvalue
0.50-0.75
0.75-0.90
0.10-0.25
1 Ratios represent R:Seg:S for F3 families and Seg:S for BC1F2 families.
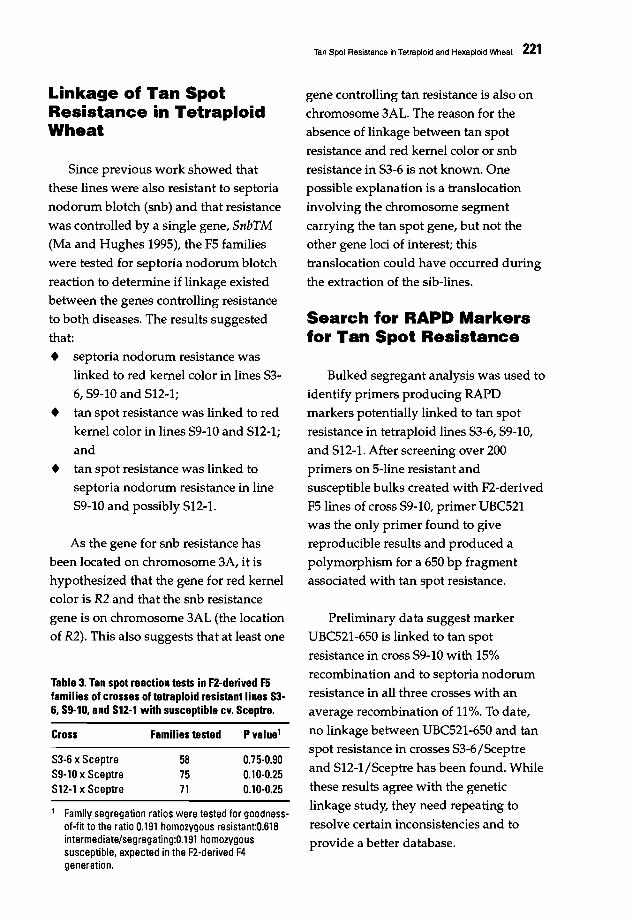
Tan Spot Resistance in Tetraploid and Hexaploid Wheat 221
Table 3. Tan spot reaction tests in F2-derived F5families of crosses of tetraploid resistant lines S36. S9-10. and S12-1 with susceptible cv. Sceptre.
Linkage of Tan SpotResistance in TetraploidWheat
1 Family segregation ratios were tested for goodnessof-fit to the ratio 0.191 homozygous resistantO.618intermediate/segregating:O.191 homozygoussusceptible, expected in the F2-derived F4generation.
As the gene for snb resistance has
been located on chromosome 3A, it is
hypothesized that the gene for red kernel
color is R2 and that the snb resistance
gene is on chromosome 3AL (the location
of R2). This also suggests that at least onePreliminary data suggest marker
UBC521-650 is linked to tan spot
resistance in cross 59-10 with 15%
recombination and to septoria nodorum
resistance in all three crosses with an
average recombination of 11%. To date,
no linkage between UBC521-650 and tan
spot resistance in crosses 53-6/5ceptre
and 512-1/5ceptre has been found. While
these results agree with the genetic
linkage study, they need repeating to
resolve certain inconsistencies and to
provide a better database.
Search for RAPD Markersfor Tan Spot Resistance
Bulked segregant analysis was used to
identify primers producing RAPD
markers potentially linked to tan spot
resistance in tetraploid lines 53-6, 59-10,
and 512-1. After screening over 200
primers on 5-line resistant and
susceptible bulks created with F2-derived
F5lines of cross 59-10, primer UBC521
was the only primer found to give
reproducible results and produced a
polymorphism for a 650 bp fragmentassociated with tan spot resistance.
gene controlling tan resistance is also on
chromosome 3AL. The reason for the
absence of linkage between tan spot
resistance and red kernel color or snb
resistance in 53-6 is not known. One
possible explanation is a translocation
involving the chromosome segment
carrying the tan spot gene, but not theother gene loci of interest; this
translocation could have occurred during
the extraction of the sib-lines.
0.75-0.900.10-0.250.10-0.25
Pvalue1
587571
Families tested
S3-6 x SceptreS9-10 x SceptreS12-1 x Sceptre
Cross
5ince previous work showed that
these lines were also resistant to septoria
nodorum blotch (snb) and that resistance
was controlled by a single gene, SnbTM(Ma and Hughes 1995), the F5 families
were tested for septoria nodorum blotch
reaction to determine if linkage existed
between the genes controlling resistance
to both diseases. The results suggested
that:
• septoria nodorum resistance waslinked to red kernel color in lines 53
6,59-10 and 512-1;
• tan spot resistance was linked to redkernel color in lines 59-10 and 512-1;
and
• tan spot resistance was linked toseptoria nodorum resistance in line
59-10 and possibly 512-1.
222 H. Ma. G.A. Hughes, and Wenguang Cao
Conclusion andFuture Studies
Useful levels of resistance to tan spotwere found in both tetraploid and
hexaploid wheats. Resistance in
tetraploid wheats was found in bothdurum cultivars and in related species,
but in both cases the frequency ofoccurrence of high resistance levels was
less than found in hexaploid wheat.
Based on studies of three crosses of
tetraploid wheat, genetic control ofresistance derived from the related
species T. timopheevii was due to two
genes. This suggests that the two-genemodel proposed by Lamari and Bernier
(1991) to explain the genetic control of the
necrosis and chlorosis symptoms causedby the tan spot fungus may apply here.However, in tests with the same P. triticirepentis isolate (Ptr 200), resistance in
three hexaploid cultivars appeared due toonly one gene. Studies on resistance tothe necrosis toxin in these crosses mayhelp to elucidate this and additional
generations of these crosses will be
studied. As well, additional populationshave been generated to investigate the
control of resistance in other tetraploid
and hexaploid resistance sources.
Evidence for linkage between tan spot
resistance, red kernel color, and septorianodorum resistance was found in
tetraploid wheat crosses of those studied,
and agreed with preliminary data from
studies to identify RAPD markers.However, insufficient data was available
to permit a reliable estimate of the degreeof linkage. The search for other RAPD
markers linked to tan spot resistance in
both the tetraploid and hexaploidresistance sources will continue. The
RAPD marker UBC521-650, which is
loosely linked to the 59-10 resistance withabout 15% recombination, will be of onlylimited value for marker-assisted
selection.
References
Lamari, L., and c.c. Bernier. 1989.Evaluation of wheat for reaction to tanspot (Pyrfnophora tritici-repentis) basedon lesion type. Can JPlant Patholll:4956.
Lamari, L., and c.c. Bernier. 1991. Geneticsof tan necrosis and extensive chlorosis intan spot of wheat caused by Pyrenophoratritici-repentis. PhytopathoI81:1092-1095.
Ma, H., and G.R. Hughes. 1995. Geneticcontrol and chromosomal location ofTriticum timopheevii-derived resistance toseptoria nodorum blotch in durumwheat. Genome 38:332-338.

223
Novel Genetic Diversity for StressTolerance in the Triticeae: StrategicAvenues and Applied Potentials
A. Mujeeb-Kazi
CIMMYT, Mexico, D.E, Mexico
Abstract
Plant breeders exploit conventional crop improvement methods to meet the ever-increasingdemands for food production. However, among cultivated crops they are finding less and lessgermplasm having desired traits with which to make the needed improvements. Fortunately,new and useful genetic resources are beingfound in wild uncultivated plant species that have aclose or distant genetic relationship to food crops. The challenge is to expediently incorporatethis alien germplasm into existing food crops and simultaneously sustain genetic diversity. Inthe Triticeae tribe, these goals are being addressed through intergeneric and interspecifichybridization methodologies. Aided by critical embryo/tissue culture techniques, researchershave ingeniously produced an ample array ofwide hybrids among Triticeae species. The currentstatus suggests that hybridization barriers can be readily circumvented and novel germplasmdeveloped. Simultaneously, conventional and molecular diagnostics have evolved to the levelwhere alien introgression detection is no longer a complex process. To speed up alienintrogression and production/maintenance ofgenetic stock programs, use of polyhaploidythrough sexual hybridization ofbread wheat with maize, pearl millet, sorghum, and Tripsacum
has emerged as a stable technique. The above areas form a package that facilitates exploitation ofalien genetic diversity for wheat improvement. These views shall be elucidated whiledemonstrating our main emphasis on the D genome synthetic hexaploid germplasm developedin CIMMYT.
Spot blotch (leaf blotch) of wheat
(Triticum aestivum L.), caused by
Cochliobolus sativus (Ito & Kuribayashi)
Drechs. ex Dastur (syn., Bipolaris sorokiniana(Sacc.) Shoemaker, Helminthosporiumsativum Pammel, King & Bakke), is an
important pathogen that limits production
in many non-traditional hot and humid
wheat producing areas of Asia, Africa, and
South America. Cochliobolus sativus can
attack seedlings, roots, leaves, nodes,
spikes, and grains during vadous stages of
plant development.
Estimates of wheat yield loss due to
spot blotch vary widely. Losses of 85%
were reported from Zambia, and 40%
from field trials in the Philippines. In
addition, in an experiment conducted at
Londrina, Brazil, yield losses in the
highly susceptible cultivar Mitacore
ranged between 79 and 87%, and grain
quality was severely affected. De Milliano
and Zadoks (1985) found a 38% yield loss
using African wheat cultivars in growth
chamber studies in the Netherlands.
Because of the importance of spot blotch,
224 A. Mujeeb-Kazi
chemical control is applied in many parts
of the world in order to obtain crop
production stability. Emphasis is also
being given to an integrated pest
management approach, utilizing resistant
cultivars, healthy seed, cultural practices,
and chemical sprays. Though breeding
for resistance is a high priority, it is
hampered by scarcity of adequate
resistance within T. aestivum.
Sources of C. sativus resistance in
species other than T. aestivum (Le., alien
gene pools) are of special interest in
breeding programs and we, at the
International Wheat and Maize
Improvement Center (CIMMYT), have
been making some effort to incorporate
and exploit alien resistance genes in a
wheat background.
Our program that has produced
significant results so far encompasses two
distinct methodologies aimed at
introgressing alien genetic diversity:
1. Intergeneric hybridization route for
incorporating distant gene pools
concentrated around the E genome,
and
2. Interspecific hybridization aimed at
utilizing closely related genetic
diversity focused on the 0 genome
present in T. tauschii accessions.
The objectives of this paper are to
elucidate the current status of C. sativusresistant germplasm that has emanated
from use of the above alien genetic
resources, and document the practical
potential of some of the incorporated
genetic variation.
Materials and Methods
Study 1: Categorization ofgermplasm resistant to C.satlvus from intergenericsourcesa) Thinopyrum curvifolium (2n=4x=28,
E1E1E2E2). The hybridization and
advanced procedures of Th.curvifolium with wheat have been
described by Mujeeb-Kazi et al.(1987). Fieid screening of the derived
germplasm under a natural epidemic
location of the advanced derivativeswas conducted in Poza Rica, Mexico
(21°N, 60 masl), during winter cycles
(November-March) over three years.
Resistance of the selected resistant
germplasms to C. sativus was based
on damage ~cordedon leaves,
nodes, spikes, ahd grains.
Comparison of this resistant
germplasm was made with BH1146,
a resistant check, and Ciano 79, a
susceptible check.
b) Several other basic genetic stocks
from wheat/alien Triticeae were also
screened in Poza Rica over two years
(1994 and 1995) using similar criteria
as mentioned above. These genetic
stocks have been developed and
maintained in CIMMYT since 1980.
Study 2: Evaluation of the Dgenome germplasm forresistance to C. safivus
Gennplasm-Triticum tauschii(2n=2x=14, DO) accessions were obtained
from the CIMMYT germplasm bank in
Mexico (El Batan) and from researchers in

Novel Genetic Diversity for Stress Tolerance in the Triticeae: Strategic Avenues and Applied Potentials 225
Pakistan (N. Hashmi, National
Agriculture Research Council,
Islamabad), UK (c. Law, AFRC-IPSR),
and USA (8. Gill, Kansas State; G.
Kimber, University of Missouri; R.
Metzger, then at Oregon State; G. Waines,
University of California, Riverside). A
total of 490 accessions were acquired and
increased for seed quantity prior to their
utilization by a vernalization procedure
(8°C, 8 h of light for 8 weeks). After the
accession seed increase, additional T.
tauschii seedlings similarly vernalized
were also transplanted to the field cycles
in Ciudad Obregon, Mexico, during
November to May for hybridization to T.
turgidum.
Hybridization, embryo rescue andplantlet regeneration-Forty-eight elite
durum wheat (T. turgidum) cultivars were
planted over four dates at to-day
intervals in order to correspond with T.
tauschii pollen availability. Emasculation,
pollination, embryo rescue, and
regeneration procedures were similar to
those reported earlier (Mujeeb-Kazi et al.
1987).
Cytology ofhybrids, colchicinedoubling, and cytology ofamphiploidsFrom each potted hybrid plantlet, root
tips were collected and somatically
analyzed (Mujeeb-Kazi and Miranda
1985) to validate hybridity. The hybrid
plants possessing 2n=3x=21
chromosomes were treated with 0.1%
colchicine + 2.0% dimethyl-sulfoxide for
6 h via aerated root-treatment to double
the chromosome number in order to
obtain fertile amphiploids (2n=6x=42).
All amphiploid seed produced was
germinated and somatically analyzed to
validate the amphiploid status and to
obtain a seed increase.
Cochliobolus sativus diseasescreening-The 570 amphiploid synthetic
hexaploid (SH) combinations, their
durum parents, and the susceptible Ciano
79 and resistant BH 1146 bread wheat
cultivars were each planted in replicated
hill plots in Poza Rica, Mexico, November
1994 and 1995, for C. sativus screening.
Disease evaluations were based on foliar
infection and grain blemish at maturity. A
double digit scale was used to measure
foliar infection, where the first digit
equated to the height of infection and the
second digit to the infection severity.
Scale gradations were 1-9. For height of
infection, a score of 5 was for plants with
infection up to the plant center, and for a
score of 9 the infection had spread to the
flag leaf. A disease severity score of 1 was
for infected leaves exhibiting low disease
symptoms, whereas a score of 9 reflected
total leaf destruction. Grain infection at
maturity was scored On a 1-5 scale, with 1
being low and 5 representing a high seed
blemish at embryo points.
Results and Discussion
Study 1: Intergeneric source ofresistance
Five lines were identified and
characterized as resistant to C. sativus and
their agronomic attributes established.
Data are presented in Tables 1 and 2. The
intergeneric cross pedigree was Chinese
Spring/Tho curvijolium//Glen/3/
Alondra/Pavon. These lines have been
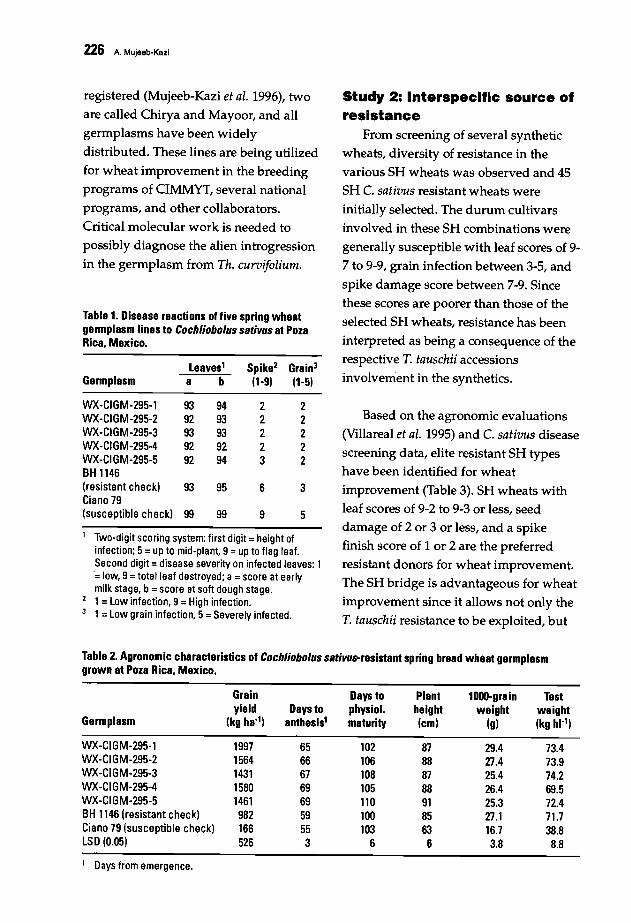
226 A. Mujeeb-Kazi
registered (Mujeeb-Kazi et al. 1996), two
are called Chirya and Mayoor, and allgermplasms have been widely
distributed. These lines are being utilized
for wheat improvement in the breedingprograms of CIMMYT, several national
programs, and other collaborators.Critical molecular work is needed to
possibly diagnose the alien introgression
in the germplasm from Th. curvifolium.
Table 1. Disease reactions offive spring wheatgermplasm lines to Cochliobolus sBtivus at PozaRica, Mexico.
Leaves' Spike2 Grain3
Germplasm a b (1·9) (1-5)
WX-CIGM-295-1 93 94 2 2WX-CIGM-295-2 92 93 2 2WX-CIGM-295-3 93 93 2 2WX-CIGM-295-4 92 92 2 2WX-CIGM-295-5 92 94 3 2BH 1146(resistant check) 93 95 6 3Ciano 79(susceptible check) 99 99 9 5
1 Two-digit scoring system: first digit =height ofinfection; 5=up to mid-plant, 9=up to flag leaf.Second digit =disease severity on infected leaves: 1'= low, 9= total leaf destroyed; a = score at earlymilk stage, b=score at soft dough stage.1=Low infection, 9=High infection.1=Low grain infection, 5=Severely infected.
Study 2: Interspecific source ofresistance
From screening of several synthetic
wheats, diversity of resistance in the
various SH wheats was observed and 45SH C. sativus resistant wheats were
initially selected. The durum cultivarsinvolved in these SH combinations were
generally susceptible with leaf scores of 9
7 to 9-9, grain infection between 3-5, and
spike damage score between 7-9. Sincethese scores are poorer than those of the
selected SH wheats, resistance has been
interpreted as being a consequence of therespective T. tauschii accessionsinvolvement in the synthetics.
Based on the agronomic evaluations
(Villareal et al. 1995) and C. sativus disease
screening data, elite resistant SH typeshave been identified for wheat
improvement (Table 3). SH wheats withleaf scores of 9-2 to 9-3 or less, seeddamage of 2 or 3 or less, and a spikefinish score of 1 or 2 are the preferredresistant donors for wheat improvement.The SH bridge is advantageous for wheat
improvement since it allows not only theT. tauschii resistance to be exploited, but
Table 2. Agronomic characteristics of Cochliobolus sBtivus-resistant spring bread wheat germplasmgrown at Poza Rica, Mexico.
Grain Days to Plant 1000-grain Testyield Days to physiol. height weight weight
Germplasm (kg ha-') anthesis' maturity (cm) (g) (kg hl-')
WX-CIGM-295-1 1997 65 102 87 29.4 73.4WX-CIGM-295-2 1564 66 106 88 27.4 73.9WX-CIGM-295-3 1431 67 108 87 25.4 74.2WX-CIGM-295-4 1580 69 105 88 26.4 69.5WX-CIGM-295-5 1461 69 110 91 25.3 72.4BH 1146 (resistant check) 982 59 100 85 27.1 71.7Ciano 79 (susceptible check) 166 55 103 63 16.7 38.8LSD (0.05) 526 3 6 6 3.8 8.8
1 Days from emergence.
Novel Genetic Diversity for Stress Tolerence in the Triticeae: Strategic Avenues and Applied Potentials '22.7
also incorporates the genetic diversity of
the A and B genomes of the respectivedurum wheat cultivars. Using this
approach, we have developed bread
wheat/diverse SH germplasms fromwhich 50 lines resistant to C. sativus have
been identified. These lines have been
further selected for desirable plant type,maturity, and resistance to leaf, stem, and
stripe rust. The C. sativus resistance
attributes of these lines are similar to theSH entries in Table 3. These lines have
been made homozygous using the sexualdouble haploid (DH) methodology(Mujeeb-Kazi and Riera-Lizarazu 1996).
The haploid procedure allows for
frequencies of about 20% embryoexcision, 80% plantlet regeneration, and
70% colchicine induced doubling.
The T. tauschii accessions contributing
to resistance in the SH wheats have
become the parental sources in anotherapproach for their exploitation for wheat
improvement through direct susceptible
T. aestivum/resistant T. tauschii accessioncrosses. This methodology has been
advocated as a rapid and efficienttechnique for exploiting T. tauschiivariability for wheat improvement.
Table 3. Synthetic hexaploids (SH) for Triticum turgidum x (As. squBrrosB) 1. tBuschii; 2n=6x=42. evaluatedfor Cochliobolus sBtivus in Poza Rica. Mexico.
Disease score1. turgidum cultivar/As. squBrrosB accession(SH) combinationand CIGM cross number
leaves' Seed2 Spike3
a (1-9)
Doy I/Ae. squarrosa (188) CIGM88.1175Rabi//GS/CRA/3/Ae. squarrosa (190) CIGM88.1178Gan/Ae. squarrosa (236) CIGM88.1228Scoop_l/Ae. squarrosa (434) CIGM88.1335Doy I/Ae. squarrosa (447) CIGM88.1344Doy I/Ae. squarrosa (511) CIGM88.1363Doy I/Ae. squarrosa (515) CIGM90.56668.111//RGB-U/Ward/3/FGO/4/Rabi/5/Ae. squarrosa (629) CIGM90.590Ceta/Ae. squarrosa (895) CIGM89.567-1 BCeta/Ae. squarrosa (895) CIGM89.567Gan/Ae. squarrosa (890) CIGM90.909Croc_l/Ae. squarrosa (224) CIGM86.95068.112/Ward//Ae. squarrosa (369) CIGM88.1313Yav3/Sco//J069/Cra/3/Yav79/4/Ae. squarrosa (498) CIGM88.1356Fgo/USA2111//Ae. squarrosa (658) CIGM89.50668.111/RGB-U//Ward Resel/3/Stil/4/Ae. squarrosa (783) CIGM89.53868.111/RGB-U//Ward/3/Fgo/4/Rebi/5/Ae. squarrosa (878) CIGM89.559Scoop_l/Ae. squarrosa (358) CIGM90.820Gan/Ae. squarrosa (408) CIGM90.824ScalAe. squarrosa (518) CIGM90.845Yar/Ae. squarrosa (418) CIGM90.846Ciano 79 (susceptible bread wheat)BH 1146 (resistant bread wheat)
9-39-39-39-39-39-29-39-29-39-39-39-39-39-39-29-39-39-29-29-39-39-99-5
11221221112222111112253
11221111112221122121296
1 Two-digit scoring system: first digit = height of infection; 5= up to center of plant 9= up to the flag leaf. Seconddigit =disease severity on infected leaves: 1=low, 9=total leaf destroyed; a=Score at dough stage of graindevelopment.Grain infection scored as: 1= Low. 5= High seed blemish at embryo points.Spike infection scored as: 1=Low infection, 9= High infection.
228 A. Mujeeb-Kezi
Direct T. tauschii hybridization with T.
aestivum cultivars is accepted as a priority
since backcrosses onto the T. aestivum/T.tauschii ABDD Fl hybrids (2n=4x=28) by
the same T. aestivum cultivar readily gives
11/12 (92 %) ofthe genotype ofthe
recurrent parent in a single growing
season. This inference was drawn by
Alonso and Kimber (1984) based on stem
rust transfers from T. tauschii into the T.aestivum cultivar Chinese Spring. Using
this approach, we have now targeted
some resistant T. tauschii accessions for
direct hybridization with susceptible but
elite T. aestivum cultivars such as Ciano 79
and Bacanora (see Mujeeb-Kazi and
Hettel 1995).
Conclusions
1. The intergeneric hybrid combinations
provide a unique genetic pool for
wheat improvement, and through the
advanced Th. curvifolium germplasm
coupled with the basic resistant
stocks of Aegilops variabilis, Th.elongatum, and Th. scirpeum, adequate
alien diversity has become available.
2. The D genome resistance in SH
wheats is a rapid and potent source
for wheat improvement. Synthetics
covering more T. tauschii accessions
than the presently screened 250 are
being produced, and we anticipate
incorporating our entire 490 winter
habit T. tauschii entry working
collection in this SH wheat form. The
SH wheats embody the wide array of
genetic diversity of T. tauschiiaccessions but are all spring types,
hence offering an easier route for
their practical utilization,
conservation, and global distribution
to areas that harbor the C. sativusstress constraint. The international
distribution of synthetic hexaploids
has additional merit in that following
screening by national agricultural
programs for different objectives, the
variation can be readily incorporated
into their local adapted germplasm.
3. Results of the with and without
fungicide yield tests not reported
here unequivocally demonstrate the
superiority of the Th. curvifoliumderivatives over the advanced
breeding lines ,and parental cultivars.
We conclude that the Th. curvifoliumderivatives express superior
resistance to C. sativus under the
Poza Rica conditions in Mexico.
Resistance to C. sativus obtained from
Th. curvifolium also exhibits an
increased grain yield performance
and test weight than our present
conventional breeding materials.
This germplasm provides a valuable
"genetic source" for enhancing spot
blotch resistance in T. aestivum, and
leads to better plant performance and
crop adaptation of wheat in warmer
humid production areas of the world.
References
Alonso, L.e., and G. Kimber. 1984. Use ofrestitution nuclei to introduce aliengenetic variation into hexaploid wheat. ZPfIanzenzuchtg 92:185-189.
De Milliano, W.A.J., and J.e. Zadoks. 1985.The effect of early foliar infection byHelminthosporium sativum on some yieldcomponents of two African wheats. In:Wheats for More Tropical Environments.A Proceedings of the InternationalSymposium, pp.154-157. Mexico, D.E:CIMMYT.

Novel Genetic Diversity for Stress Tolerance in the Triticeae: Strategic Avenues and Applied Potentials 229
MUjeeb-Kazi, A, and J.L. Miranda. 1985.Enhanced resolution of somaticchromosome constrictions as an aid toidentifying intergeneric hybrids amongsome Triticeae. Cytologia 50:701-109.
MUjeeb-Kazi, A, Roldan, S., Suh, D.Y., Sitch,L.A, and S. Farooq. 1987. Productionand cytogenetic analysis of hybridsbetween Triticum aestivum and somecaespitose Agropyron species. Genome29:537-553
MUjeeb-Kazi, A, and G.E. Hettel. 1995.Utilizing wild grass biodiversity inwheat improvement: 15 years of WideCross Research at CIMMYT. CIMMYTResearch Report No.2, pp. 140. Mexico,D. E: CIMMYT.
MUjeeb-Kazi, A, and O. Riera-Lizarazu.1996. Polyhaploid production in theTriticeae by sexual hybridization. In:S.M. Jain, S.K. Sopory, and RE. Veilleux(eds.), In Vitro Haploid Production inHigher Plants, Vol. 1: FundamentalAspects and Methods. Netherlands:Kluwer Academic Publishers.
MUjeeb-Kazi, A, Villareal, RL., Gilchrist,L.L, and S. Rajaram. 1996. Registration offive Helminthosporium leaf blightresistant wheat germplasm lines. CropSci 36:216-217.
Villareal, RL., MUjeeb-Kazi, A, Gilchrist,L.L, and E. Del Toro. 1995. Yield loss tospot blotch in spring bread wheat inwarm nontraditional wheat productionareas. Plant Dis 79:1-5.
230
Evaluating Southern Cone WheatGermplasm for Spot Blotch and Tan Spot
M.M. KohlP and M. Diaz de Ackermann2
1 CIMMYT, Montevideo, Uruguay
2 INIA, La Estanzuela, Uruguay
Abstract
Since 1981, advanced lines from wheat breeding programs in the Southern Cone region ofSouth America (Argentina, Brazil, Bolivia, Chile, Paraguay, and Uruguay) have been evaluatedin LACOS a regional nursery. The nursery is annually seeded in over 25 key locations. Ofthese, 1-5'report data on spot blotch (Bipolaris sorokiniana) and another 2-4 on tan spot(Drechslera tritici-repentis). Based on 10 years ofobservations, Santa Cruz (Bolivia) andLondrina (Brazil) represent two critical sites for spot blotch evaluation. Correlation coefficientsamong infection indices from various locations during a severe disease year (1994) show notonly low, statistically significant relationships between Bolivia and Brazil (r =0.142"-0.214....), but also indicate that pathogen populations may differ within a country such asBrazil. Tan spot infection, on the other hand, has been increasingly evaluated at Pergamino(Argentina), Bella Vista (Paraguay), and Young (Uruguay). While the relationship among theselocations is low but statistically significant (r = 0.219.... - 0.267*"), there is a possibility ofadifferential pathogen population between Paraguay and Uruguay, Of the commercial varietiestested in 1994/95, most are moderately to highly susceptible; however, some varieties such asDon Ernesto INTA, ProINTA Federal, and ProINTA Guazu from Argentina; Domo INIA,Saeta INIA, and Chagual INIA (durum) from Chile; IAN 7 and Itapua 35 from Paraguay; andProINTA Superior and E. Pelon 90 from Uruguay demonstrated moderate spot blotch resistancelevels. During the same year, lAC 5 - Maringa from Brazil; Domo INIA, Nobo INIA, and SaetaINIA from Chile; E. Cardenal, E. Pelon, and ProINTA Querandi from Uruguay; and IAN 7,IAN 9, Itapua 35, and Itapua 40 from Paraguay showed moderate tan spot resistance. A largenumber ofbreeding lines with moderate to high resistance levels to both diseases have beenselected, Among these, CIMMYT lines derived from Thinopyrum curvifolium combined withChinese sources ofspot blotch resistance and Milan as a source of tan spot resistance have beenmost outstanding.
The Southern Cone of South America
is one of the most critical regions in theworld for disease epidemics of wheat.
The region comprising Argentina,Bolivia, Brazil, Chile, Paraguay, and
Uruguay sows approximately 10 million
ha of wheat every year and, depending
on climatic conditions, produces between
16-20 million t of grain. The crop sownarea, located between 10° and 400 S
latitude, spans vast geographic and
climatic conditions that range from
tropical!subtropical to temperate regimes

Evaluating Southern Cone Wheat Gennplasm for Spot Blotch and Tan Spot 231
and from flat grasslands to the high
Andes mountains. Although spring
growth habit is predominant in most of
the region, facultative and winter wheats
are also grown in the southern latitudes.
Except for the Central Valley of Chile and
a small area in central Brazil that is under
irrigation, the majority of the crop is
seeded under rainfed conditions. As a
result, unstable climatic conditions and
severe drought stress annually affect
yield in a large part of the region.
However, in the high rainfall areas of the
South and Central subtropical region,
wheat diseases are probably the most
important factor limiting yield. Serious
diseases that cause epidemics and
production losses include rusts, powdery
mildew, leaf blights, bacterial leaf stripe,
fusarium head blight, and several viral
diseases including barley yellow dwarf
and soilborne mosaic virus.
Given the regular frequency of
disease epidemics that severely affect
various parts of the region, tremendous
progress was achieved by the early wheat
breeders in selecting and developing new
varieties with very high levels of general
resistance to a complex of diseases, and
other characteristics. Famous examples of
such varieties utilized internationally
include: Frontana, Surpresa, lAS 20, 38
MA, Barletta, Buck Manantial, Klein
Atlas, Tezanos Pintos Precoz, Americano
26, and Litoral. Some of these not only
possess a high degree of rust resistance
(especially adult plant resistance to leaf
rust), but also a significant level of
tolerance to foliar blights caused by
Septaria and Helminthasparium species.
Modern wheat breeding programs in
the Southern Cone, being aware of their
geographic and agroclimatic limitations,
in particular the lack of physical barriers
to check movement of disease-causing
pathogens, have aggressively utilized all
opportunities to expand the wheat
germplasm base at both the formal and
informal levels. With the objective to
evaluate adaptation and a wide spectrum
of disease resistance, exchange of
advanced germplasm within and outside
the region has continued since 1950. Some
of the formal vehicles of germplasm
exchange at the regional level have been:
the Latin American Wheat Yield Trial,
organized by Dr. Norman Borlaug of the
Office of the Special Studies (predecessor
institute of CIMMYT); the International
Rust Screening Nursery, organized by the
US Department of Agriculture; the
Southern Cone Wheat Yield Trial
(ERCOS), primarily organized by
EMBRAPA, Brazil and later by INTA; and
the Argentina and Latin American
Disease Observation Nursery (VEOLA),
organized by the CIMMYT Andean
Program.
Under the auspices of the Southern
Cone Cooperative Program (PROCISUR),
the CIMMYT regional network has
organized the Southern Cone Wheat
Advanced Lines (LACOS) nursery to
increase the annual exchange of
germplasm among participating
countries. Since 1981, the nursery,
consisting of approximately 300 advanced
wheat lines from over 20 national
breeding programs, has been distributed
to approximately 30 locations in the
region and another 20 outside the region.
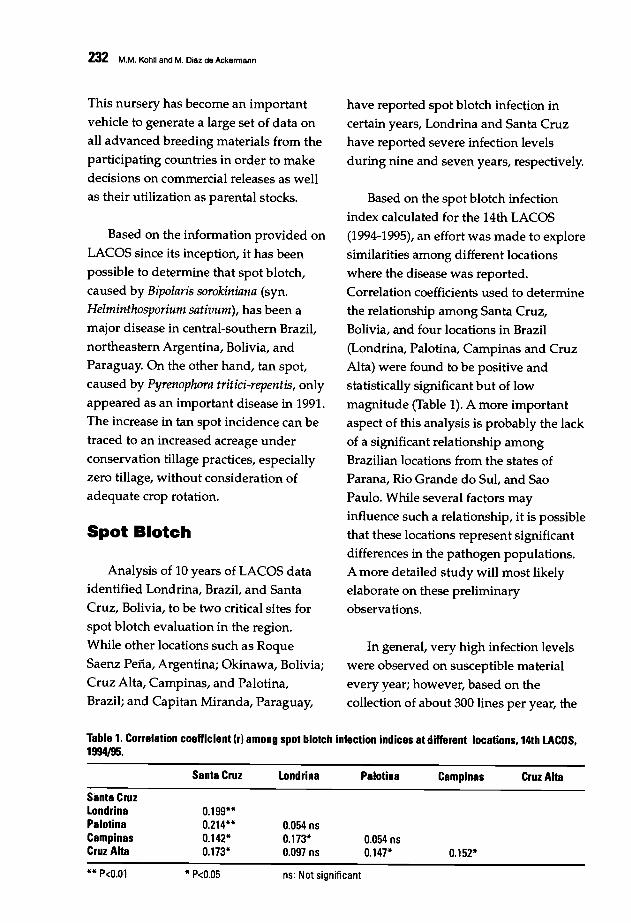
232 M.M. Kohli and M. Diaz de Ackermann
This nursery has become an important
vehicle to generate a large set of data onall advanced breeding materials from the
participating countries in order to make
decisions on commercial releases as wellas their utilization as parental stocks.
Based on the information provided onLACOS since its inception, it has been
possible to determine that spot blotch,
caused by Bipolaris sorokiniana (syn.Helmin-thosporium sativum), has been a
major disease in central-southern Brazil,northeastern Argentina, Bolivia, and
Paraguay. On the other hand, tan spot,
caused by Pyrenophora tritici-repentis, onlyappeared as an important disease in 1991.The increase in tan spot incidence can be
traced to an increased acreage under
conservation tillage practices, especiallyzero tillage, without consideration of
adequate crop rotation.
Spot Blotch
Analysis of 10 years of LACOS dataidentified Londrina, Brazil, and SantaCruz, Bolivia, to be two critical sites for
spot blotch evaluation in the region.While other locations such as Roque
Saenz Pena, Argentina; Okinawa, Bolivia;
Cruz Alta, Campinas, and Palotina,Brazil; and Capitan Miranda, Paraguay,
have reported spot blotch infection incertain years, Londrina and Santa Cruz
have reported severe infection levelsduring nine and seven years, respectively.
Based on the spot blotch infection
index calculated for the 14th LACOS
(1994-1995), an effort was made to explore
similarities among different locations
where the disease was reported.
Correlation coefficients used to determinethe relationship among Santa Cruz,Bolivia, and four locations in Brazil
(Londrina, Palotina, Campinas and CruzAlta) were found to be positive and
statistically significant but of low
magnitude (Table 1). A more importantaspect of this analysis is probably the lack
of a significant relationship among
Brazilian locations from the states ofParana, Rio Grande do SuI, and SaoPaulo. While several factors may
influence such a relationship, it is possiblethat these locations represent significantdifferences in the pathogen populations.A more detailed study will most likely
elaborate on these preliminaryobservations.
In general, very high infection levels
were observed on susceptible material
every year; however, based on thecollection of about 300 lines per year, the
Table 1. Correlation coefficient Ir) among spot blotch infection indices at different locations. 14th LACOS.1994/95.
Santa Cruz Londrina Palotina Campinas Cruz Alta
Santa CruzLondrina 0.199**Palotina 0.214** 0.054 nsCampinas 0.142* 0.173* 0.054 nsCruz Alta 0.173* 0.097 ns 0.147* 0.152*
** P<O.OI * P<0.05 ns: Not significant
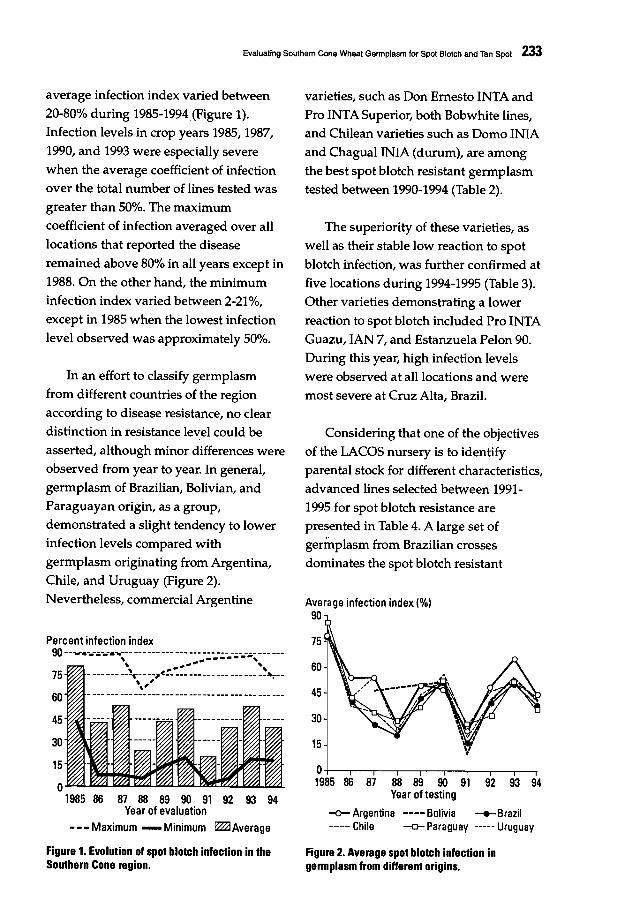
Evaluating Southem Cone Wheat Germplasm for Spot Blotch and Tan Spot 233
Percent infection index
30
15
o+----r--,----,,--.---r--r--.-----,-..,.
1985 86 87 88 89 90 91 92 93 94Year ottesting
-0- Argentina ---- Bolivia -+-Brazil---- Chile -,(j- Paraguay ----- Uruguay
45
60
Average infection index (%)90
75
Considering that one of the objectives
of the LACOS nursery is to identifyparental stock for different characteristics,
advanced lines selected between 1991
1995 for spot blotch resistance are
presented in Table 4. A large set of
germplasm from Brazilian crosses
dominates the spot blotch resistant
The superiority of these varieties, as
well as their stable low reaction to spot
blotch infection, was further confirmed at
five locations during 1994-1995 (Table 3).
Other varieties demonstrating a lower
reaction to spot blotch included Pro INTA
Guazu, IAN 7, and Estanzuela Pelon 90.
During this year, high infection levels
were observed at all locations and were
most severe at Cruz Alta, Brazil.
varieties, such as Don Emesto INTA and
Pro INTA Superior, both Bobwhite lines,
and Chilean varieties such as Domo INIA
and Chagual INIA (durum), are among
the best spot blotch resistant germplasm
tested between 1990-1994 (Table 2).
90 --......-.-..-.-."""-- --- --- --- --- ---..-:-_-:'-_-';-';-_~ --- ---\ .......... "
75 - --- --- --"T-- --,~-- --- --- --- --- --- --- --....--',,'
60
45
30
15
o1985 86 87 88 89 90 91 92 93 94
Year of evalu.ation
--- Maximum -Minimum ~Average
In an effort to classify germplasm
from different countries of the region
according to disease resistance, no clear
distinction in resistance level could be
asserted, although minor differences were
observed from year to year. In general,
germplasm of Brazilian, Bolivian, and
Paraguayan origin, as a group,
demonstrated a slight tendency to lower
infection levels compared with
germplasm originating from Argentina,Chile, and Uruguay (Figure 2).
Nevertheless, commercial Argentine
average infection index varied between
20-80% during 1985-1994 (Figure 1).
Infection levels in crop years 1985, 1987,
1990, and 1993 were especially severe
when the average coefficient of infection
over the total number of lines tested was
greater than 50%. The maximum
coefficient of infection averaged over all
locations that reported the disease
remained above 80% in all years except in
1988. On the other hand, the minimum
infection index varied between 2-21%,
except in 1985 when the lowest infection
level observed was approximately 50%.
Figure 1. Evolution of spot blotch infection in theSouthern Cone region.
Figure 2. Average spot blotch infection ingermplasm from different origins.
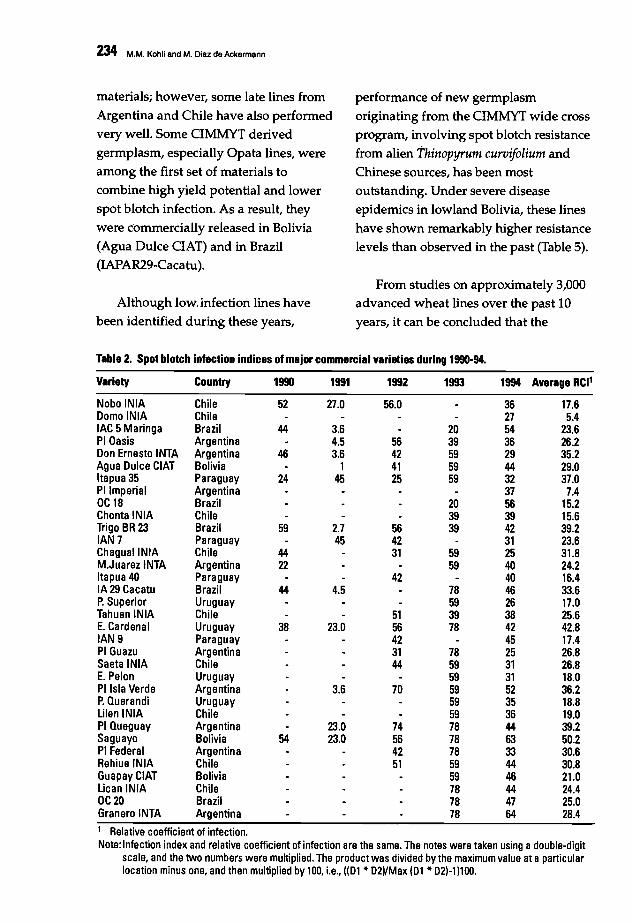
234 M.M. Kohli and M. Diaz de Ackermann
materials; however, some late lines from
Argentina and Chile have also performedvery well. Some CIMMYT derived
germplasm, especially Opata lines, wereamong the first set of materials to
combine high yield potential and lower
spot blotch infection. As a result, theywere commercially released in Bolivia
(Agua Dulce CIAT) and in Brazil(IAPAR29-Cacatu).
Although low. infection lines have
been identified during these years,
performance of new germplasm
originating from the CIMMYT wide crossprogram, involving spot blotch resistance
from alien Thinopyrum curvifolium and
Chinese sources, has been mostoutstanding. Under severe diseaseepidemics in lowland Bolivia, these lines
have shown remarkably higher resistance
levels than observed in the past (Table 5).
From studies on approximately 3,000advanced wheat lines over the past 10
years, it can be concluded that the
Table 2. Spot blotch infection indices of major commercial varieties during 1990-94.
Variety Country 1990 1991 1992 1993 1994 Average RCI'
Nobo INIA Chile 52 27.0 56.0 36 17.6Domo INIA Chile 27 5.4lAC 5Maringa Brazil 44 3.6 20 54 23.6PI Oasis Argentina 4.5 56 39 36 26.2Don Ernesto INTA Argentina 46 3.6 42 59 29 35.2Agua Dulce CIAT Bolivia 1 41 59 44 29.0Itapua 35 Paraguay 24 45 25 59 32 37.0PI Imperial Argentina 37 7.4OC18 Brazil 2Q 56 15.2Chonta INIA Chile 39 39 15.6Trigo BR 23 Brazil 59 2.7 56 39 42 39.2IAN7 Paraguay 45 42 31 23.6ChaguallNIA Chile 44 31 59 25 31.8M.Juarez INTA Argentina 22 59 40 24.2Itapua 40 Paraguay 42 40 16.4IA 29 Cacatu Brazil 44 4.5 78 46 33.6P. Superior Uruguay 59 26 17.0Tahuen INIA Chile 51 39 38 25.6E. Cardenal Uruguay 38 23.0 56 78 42 42.8IAN 9 Paraguay 42 45 17.4PI Guazu Argentina 31 78 25 2.6.8Saeta INIA Chile 44 59 31 26.8E. Pelon Uruguay 59 31 18.0PI Isla Verde Argentina 3.6 70 59 52 36.2P. Querandi Uruguay 59 35 18.8lilen INIA Chile 59 36 19.0PI Queguay Argentina 23.0 74 78 44 39.2Saguayo Bolivia 54 23.0 56 78 63 50.2PI Federal Argentina 42 78 33 30.6Rehiue INIA Chile 51 59 44 30.8Guapay CIAT Bolivia 59 46 21.0lican INIA Chile 78 44 24.4OC20 Brazil 78 47 25.0Granero INTA Argentina 78 64 28.41 Relative coefficient of infection.Note: Infection index and relative coefficient of infection are the same. The notes were taken using adouble-digit
scale, and the two numbers were multiplied. The product was divided by the maximum value at aparticularlocation minus one, and then multiplied by 100, Le., ((01 * D21!Max (01 * 02)-1 )100.

Evaluating Southam Cone Wheal Germplasm for Spot Blotch and Tan Spot 235
majority of South American germplasm
demonstrates only moderate spot blotch
resistance levels. However, based on the
continuous pyramiding of various
sources, as well as newer germplasm
identified from the wide cross program,
significant advances are expected in the
future.
Tan Spot
The increase in tan spot incidence and
its establishment as a serious disease in
the region has been observed since 1991.
As mentioned earlier, the increased
incidence in most of the region has been
primarily related to the increase in zero
Table 3. Spot blotch infection on commercial wheat varieties from the Southern Cone at five locations,1994/95.
Variety CountryInfection score'
Santa Cruz Londrina Campinas Cruz Alta PalotinaAverage
RCI2
PI GuazuChaguallNIAP. SuperiorDomo INIADon Ernesto INTAIAN 7E. PelonSaeta INIAItapua 35PI FederalP. QuerandiNobo INIAPI OasisLilen INIAPI ImperialTahuen INIAChonta INIAM.Juarez INTAItapua 40E. CardenalTrigo BR 23Agua Dulce CIATLican INIARehiue INIAPI QueguayIAN9GuapayCIATIA 29 CacatuOC20PI Isla VerdelAC 5MaringaOC18SaguayoGranero INTAMaximum
ArgentinaChileUruguayChileArgentinaParaguayUruguayChileParaguayArgentinaUruguayChileArgentinaChileArgentinaChileChileArgentinaParaguayUruguayBrazilBoliviaChileChileArgentinaParaguayBoliviaBrazilBrazilArgentinaBrazilBrazilBoliviaArgentina
T3T
3131313T
32413T4231323162323141313T513132
423242725263527383
32223223232333142433333443322222345
102020102030601020304010
50404020204030604060504040305050206040603090
939583939593939393969694'94979494959598969893969695989797979798989798
318231
81513183
8131823T328132
81823131818331T
52518282848382848396
24.825.426.427.328.530.330.731.132.032.934.935.635.836.237.038.039.139.640.341.842.143.643.943.944.244.745.745.747.351.953.855.763.264.4
1 Infection score according to double digit scale (00-991 at Santa Cruz, Cruz Alta, and Palotina; a0-9 scale atLondrina, and percentage at Campinas.
2 Relative coefficient of infection.Note: Infection index and relative coefficient of infection are the same. The notes were taken using adouble-digit
scale, and the two numbers were mUltiplied. The product was divided by the maximum value at aparticularlocation minus one, and then multiplied by 100, i.e., ((01 * 02)fMax (01 * 02)-11100.
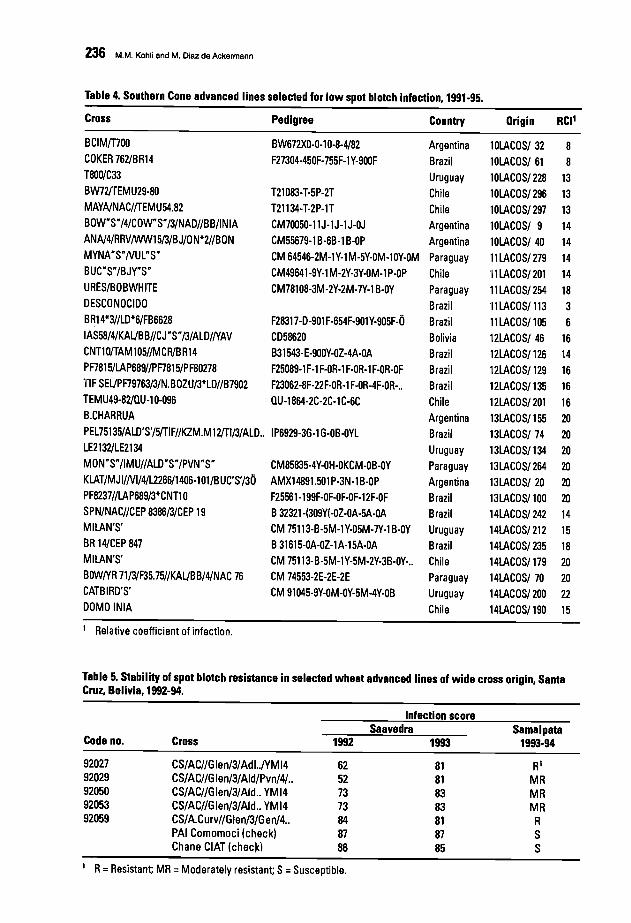
236 M.M. Kohli and M. Diaz de Ackermann
Table 4. Southern Cone advanced lines selected for low spot blotch infection, 1991·95.
Cross Pedigree Country Origin RCI'
BCIMmOO BW672XO-0-l0·8·4/82 Argentina 10LACOS/ 32 8COKER 762/BR14 F27304-450F·755F-l Y-900F Brazil 10LACOS/61 8T800lC33 Uruguay 10LACOS/228 13BW72/TEMU29-80 T21083·T·5P-2T Chile 10LACOS/296 13MAYA/NAC//TEMU54.82 T21134-T-2P-1T Chile 1OLACOS/ 297 13BOW"S"/4/COW"S"I3/NAD//BB/INIA CM70050-11J·1J-1J-OJ Argentina 10LACOS/ 9 14ANA/4/RRV!WW1513/BJ/ON*2//BON CM55679-1 B·6B-l B-OP Argentina 10LACOS/ 40 14MYNA"S"NUl"S" CM 64546-2M-1Y·1M-5Y-OM·l0Y-OM Paraguay 11 LACOS/ 279 14BUC"S"/BJY"S" CM49641·9Y-l M-2Y-3Y·OM-l p·Op Chile '1'1 LACOS/ 201 14URES/BOBWHITE CM78108-3M-2Y·2M-7Y-l B·OY Paraguay 11 LACOS/ 254 18DESCONOCIDO Brazil '11 LACOS/ "3 3BR14*3//lD*6/FB6628 F28317-D-901 F·654F-901Y·905F-O Brazil 11 LACOS/ 105 6IAS58/4/KALjBB//CJ"S"I3/AlD//YAV CD58620 Bolivia 12LACOS/ 46 16CNTlO/TAM105//MCR/BR14 B31543-E·900Y-OZ-4A·OA Brazil 12LACOS/126 14PF7815/LAP6891/PF7815/PF80278 F25089·1 F-l F-OR·l F·OR-l F-OR·OF Brazil 12LACOS/129 16TIF SELjPF79763I3/N.BOZU/3*lD//B7902 F23062·8F-22F-OR·l F-OR-4F·OR-.. Brazil 12LACOS/135 16TEMU49-82/QU-l0-096 QU·1864-2C-2C-1C·6C Chile 12LACOS/201 16B.CHARRUA Argentina 13LACOS/155 20PEl75135/AlD'S'/5/TIF//KZM.Ml2/TII3/AlD.. IP6929·3G·l G-OB-OYl Brazil 13LACOS/74 20lE2132/lE2134 Uruguay 13LACOS/134 20MOWS"/IMU//AlD"S"/PVN "S" CM85835-4Y-OH·OKCM-OB·OY Paraguay 13LACOS/264 20KLAT/M.II/NI/4/L2266/1406·101/BUC'S'/30 AMXl4891.501 P·3N·l B-OP Argentina 13LACOS/ 20 20PF8237//LAP68913*CNT10 F25561-199F-OF·OF·OF-12F-OF Brazil 13LACOS/l00 20SPN/NAC//CEP 838613/CEP 19 B32321·(309Y(-OZ·OA·5A-OA Brazil 14LACOS/242 14MILAN'S' CM 75113·B-5M-1Y·05M-7Y-l B·OY Uruguay 14LACOS/212 15BR 14/CEP 847 B31615·0A·OZ-1A-15A·OA Brazil 14LACOS/ 235 18MILAN'S' CM 75113·B-5M-1Y-5M·2Y·3B-OY-.. Chile 14LACOS/179 20BOW/yR 71/3/F35.75//KALjBB/4/NAC 76 CM 74553-2E-2E-2E Paraguay 14LACOS/ 70 20CATBIRD'S' CM 91045·9Y·OM-OY-5M·4Y·OB Uruguay 14LACOS/200 22DOMO INIA Chile 14LACOS/190 15
1 Relative coefficient of infection.
Table 5. Stability of spot blotch resistance in selected wheat advanced lines of wide cross origin, SantaCruz, Bolivia, 1992-94.
Infection scoreSaavedra Samaipata
Code no. Cross 1992 1993 1993·94
92027 CS/AC//Glen/3/Adl../yMI4 62 81 Rl92029 CS/AC//G len/3/Ald/Pvn/4/.. 52 81 MR92050 CS/AC//Glen/3/Ald.. YMI4 73 83 MR92053 CS/ACI/Glen/3/Ald.. YMI4 73 83 MR92059 CS/A.Curv//Glen/3/Gen/4.. 84 81 R
PAl Comomoci (check) 87 87 SChane CIAT (chec~) 86 85 S
1 R=Resistant; MR =Moderately resistant; S=Susceptible.
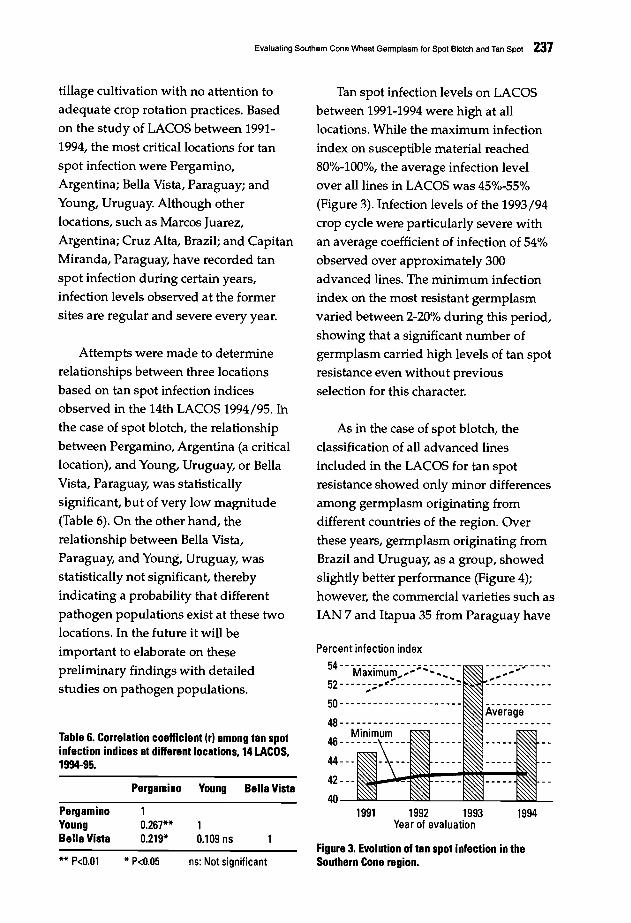
Evaluating Southern Cone Wheat Germplasm for Spot Blotch and Tan Spot 237
tillage cultivation with no attention to
adequate crop rotation practices. Basedon the study of LACOS between 1991
1994/ the most critical locations for tan
spot infection were Pergamino,Argentina; Bella Vista, Paraguay; and
Young, Uruguay. Although other
locations, such as Marcos Juarez,Argentina; Cruz Alta, Brazil; and Capitan
Miranda, Paraguay, have recorded tan
spot infection during certain years,infection levels observed at the former
sites are regular and severe every year.
Attempts were made to determinerelationships between three locations
based on tan spot infection indicesobserved in the 14th LACOS 1994/95. Ih
the case of spot blotch, the relationshipbetween Pergamino, Argentina (a critical
location), and Young, Uruguay, or BellaVista, Paraguay, was statistically
significant, but of very low magnitude(Table 6). On the other hand, the
relationship between Bella Vista,Paraguay, and Young, Uruguay, wasstatistically not significant, thereby
indicating a probability that different
pathogen populations exist at these twolocations. In the future it will be
important to elaborate on these
preliminary findings with detailedstudies on pathogen populations.
Table 6. Correlation coefficient (r) among tan spotinfection indices at different locations. 14 LACas.1994-95.
Pergamino Young Bella Vista
Pergamino 1Young 0.267** 1Bella Vista 0.219* 0.109 ns
** P<O.Ol * P<0.05 ns: Not significant
Tan spot infection levels on LACOSbetween 1991-1994 were high at all
locations. While the maximum infection
index on susceptible material reached80%-100%/ the average infection levelover all lines in LACOS was 45%-55%
(Figure 3). Infection levels of the 1993/94crop cycle were particularly severe withan average coefficient of infection of 54%
observed over approximately 300
advanced lines. The minimum infectionindex on the most resistant germplasm
varied between 2-20% during this period,
showing that a significant number ofgermplasm carried high levels of tan spotresistance even without previous
selection for this character.
As in the case of spot blotch, the
classification of all advanced lines
included in the LACOS for tan spotresistance showed only minor differences
among germplasm originating fromdifferent countries of the region. Overthese years, germplasm originating from
Brazil and Uruguay, as a group, showedslightly better performance (Figure 4);however, the commercial varieties such as
IAN 7 and Itapua 35 from Paraguay have
Percent infection index54----------------------Maximum ...52 -- --- - -.~~- - - - -- - - - -~~.. ..50---------------------
48----------------------Minimum
46------- ----
44- -
42 - -
401991 1992 1993 1994
Year of evaluation
Figure 3. Evolution of tan spot infection in theSouthern Cone region.

238 M.M. Kohli and M. Diaz de Ackermann
Average infection index (%)70
-0- Argentina -••• Bolivia ..... Brazil
consistently demonstrated excellent tan
spot resistance over the years. Among thecommercial varieties derived from
CIMMYT germplasm, all Veery
selections, as a group, demonstrated ahigh level of tan spot resistance (Table 7).
20 1-------.-------,----..,.1991 1992 1993 1994
Year of testing
Figure 4. Average tan spot infection in germplasmfrom different origins.
30--- Chile -0- Paraguay···· Uruguay Thirty-four commercial varieties used
as checks in the 14th LACOS, 1994/95,
were studied for tan spot infection at
three locations (Pergamino, Bella Vista,and Young). Based on their average
Table 7. Tan spot infection indices of major commercial varieties during 1990-94.
Variety Country 1991 1992 1993 1994 Average RCI'
E. Pelon Uruguay 26 21 23.5E. Cardenal Uruguay 24 24 28 33 27.2P. Querandi Uruguay 32 30 31.0Itapua 35 Paraguay 41 29 38 23 32.8IAN7 Paraguay 24 46 31 33.7Oomo INIA Chile 37 37.0Tahuen INIA Chile 28 39 46 37.7Itapua 40 Paraguay 46 30 38.0Nobo INIA Chile 52 34 43 25 38.5IAN9 Paraguay 46 36 41.0Rehiue INIA Chile 35 46 43 41.3OC18 Brazil 43 43.0ChaguallNIA Chile 41 46 35 51 43.2lAC 5Maringa Brazil 36 70 25 43.7Saguayo Bolivia 24 46 60 53 45.8IA 29 Cacatu Brazil 55 39 49 47.7OC20 Brazil 48 48.0Chonta INIA Chile 47 51 49.0Don Ernesto INTA Argentina 42 46 65 44 49.2Saeta INIA Chile 52 35 79 31 49.2P'Superior Uruguay 60 41 50.5PI Guazu Argentina 38 57 58 51.0Trigo BR23 Brazil 64 54 34 53 51.2Ucan INIA Chile 51 52 51.5Ulen INIA Chile 43 70 56.5PI Federal Argentina 64 58 52 58.0PI Imperial Argentina 62 62.0PI Oasis Argentina 55 79 53 62.3PI Queguay Argentina 92 63 57 53 66.2Agua Dulce CIAT Bolivia 50 64 99 71.0M. Juarez INTA Argentina 73 73 73.0Granero INTA Argentina 74 73 73.5Guapay CIAT Bolivia 64 84 74.0PI Isla Verde Argentina 86 80 83 83.0.1 Relative coefficient of infection.Note: Infection index and relative coefficient of infection are the same. The notes were taken using adouble-digit
scale, and the two numbers were multiplied. The product was divided by the maximum value at aparticularlocation minus one, and then multiplied by 100, i.e., ((01 * 02J/Max (01 * 02)-1 )100.
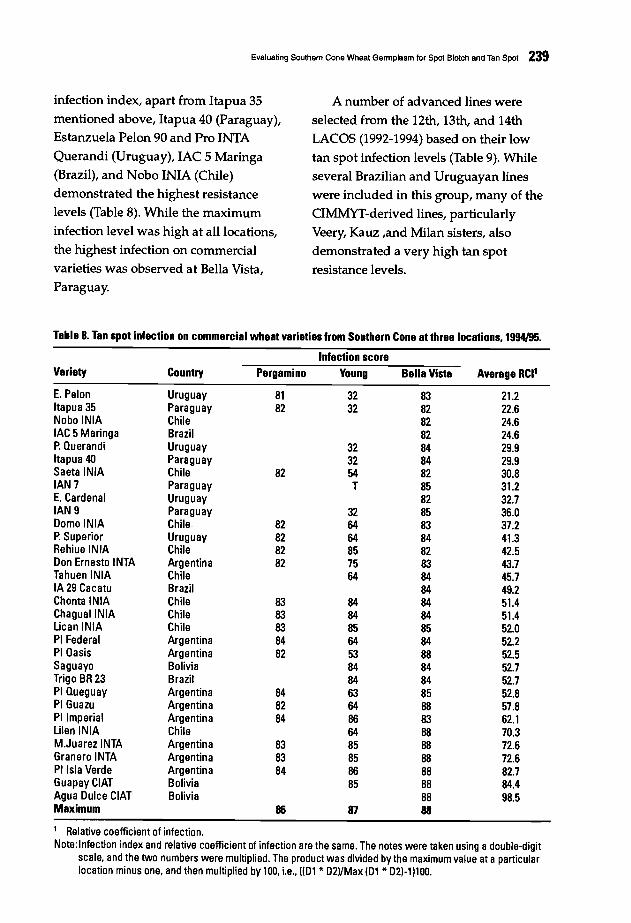
Evaluating Southern Cone Whaat Gennplasm fa' Spot Blotch and Tan Spot 239
infection index, apart from Itapua 35
mentioned above, Itapua 40 (Paraguay),Estanzuela Pelon 90 and Pro INTA
Querandi (Uruguay), lAC 5 Maringa
(Brazil), and Nobo INIA (Chile)demonstrated the highest resistance
levels (Table 8). While the maximum
infection level was high at all locations,the highest infection on commercial
varieties was observed at Bella Vista,
Paraguay.
A number of advanced lines were
selected from the 12th, 13th, and 14thLACOS (1992-1994) based on their low
tan spot infection levels (Table 9). While
several Brazilian and Uruguayan lineswere included in this group, many of the
CIMMYT-derived lines, particularlyVeery, Kauz ,and Milan sisters, also
demonstrated a very high tan spot
resistance levels.
Table 8. Tan spot infection on commercial wheat varieties from Southern Cone at three locations, 1994/95.
Infection scoreVariety Country Pergamino Young Bella Vista Average RCI'
E. PelonItapua 35Nobo INIAlAC 5MarinllaP. QuerandiItapua 40Saeta INIAIAN7E. CardenalIAN9Domo INIAP'SuperiorRehiue INIADon Ernesto INTATahuen INIAIA 29 CacatuChonta INIAChaguallNIALican INIAPI FederalPI OasisSaguayoTrigo BR 23PI QueguayPI GuazuPI ImperialLilen INIAM.Juarez INTAGranero INTAPI Isla VerdeGuapay CIATAgua Dulce CIATMaximum
UruguayParaguayChileBrazilUruguayParaguayChileParaguayUruguayParaguayChileUruguayChileArgentinaChileBrazilChileChileChileArgentinaArgentinaBoliviaBrazilArgentinaArgentinaArgentinaChileArgentinaArgentinaArgentinaBoliviaBolivia
8182
82
82828282
8383838482
848284
838384
B6
32 83 21.232 82 22.6
82 24.682 24.6
32 84 29.932 84 29.954 82 30.8T 85 31.2
82 32.732 85 36.064 83 37.264 84 41.385 82 42.575 83 43.764 84 45.7
84 49.284 84 51.484 84 51.485 85 52.064 84 52.253 88 52.584 84 52.784 84 52.763 85 52.864 88 57.886 83 62.164 88 70.385 88 72.685 88 72.686 88 82.785 88 84.4
88 98.587 88
1 Relative coefficient of infection.Note: Infection index and relative coefficient of infection are the same. The notes were taken using adouble-digit
scale, and the two numbers were multiplied. The product was divided by the maximum value at aparticularlocation minus one, and then multiplied by 100, Le., ((01 * 02)/Max (01 * 02)-1)100.
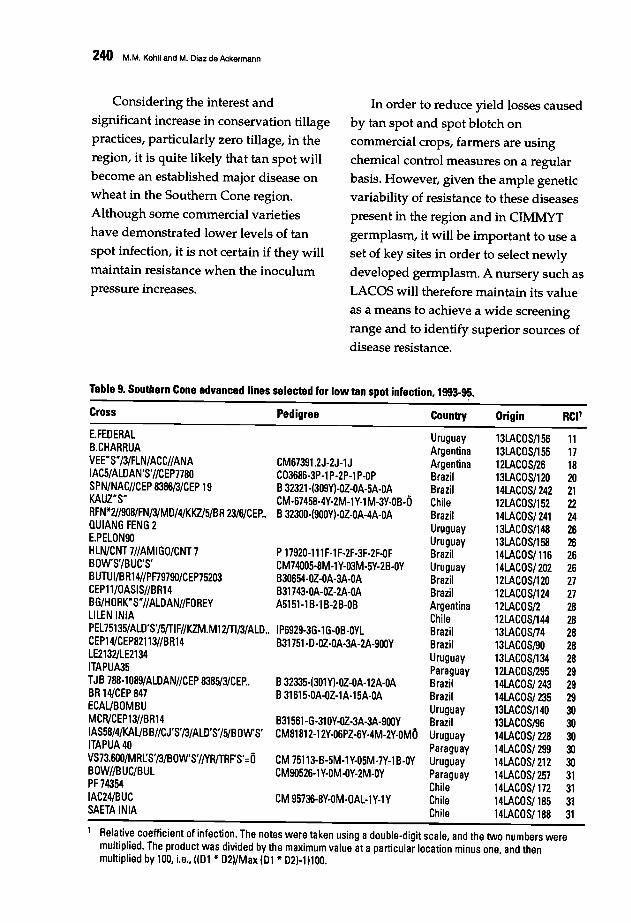
240 M.M. Kohli and M. Diaz de Ackermann
Considering the interest andsignificant increase in conservation tillage
practices, particularly zero tillage, in theregion, it is quite likely that tan spot will
become an established major disease onwheat in the Southern Cone region.
Although some commercial varieties
have demonstrated lower levels of tanspot infection, it is not certain if they will
maintain resistance when the inoculum
pressure increases.
In order to reduce yield losses caused
by tan spot and spot blotch oncommercial crops, farmers are usingchemical control measures on a regular
basis. However, given the ample geneticvariability of resistance to these diseases
present in the region and in CIMMYT
germplasm, it will be important to use aset of key sites in order to select newly
developed germplasm. A nursery such as
LACOS will therefore maintain its valueas a means to achieve a wide screening
range and to identify superior sources of
disease resistance.
Table 9. Southern Cone advanced lines selected for low tan spot infection, 1993-95.
Cross Pedigree Country Origin RCI1
E.FEOERAL Uruguay 13LACOS/156 11B.CHARRUA Argentina 13LACOS/155 17VEE· S·/3/FLN/ACC//ANA CM67391.2J-2J-1J Argentina 12LACOS/26 18IAC5/ALOAN'S'//CEP7780 C03686-3P-l P-2P-l poOP Brazil 13LACOS/120 20SPN/NAC//CEP 8386/3/CEP 19 B32321-(309Y)-OZ-OA-5A-OA Brazil 14LACOS/242 21KAUZ·S· CM-67458-4Y-2M-1Y-l M-3Y-OB-O Chile 12LACOS/152 22RFN*2//908/FN/3/MO/4/KKZ/5/BR 23/6/CEP.. B32300-(900Y)-OZ-OA-4A-OA Brazil 14LACOS/241 24QUIANG FENG 2 Uruguay 13LACOS/148 26E.PELON90 Uruguay 13LACOS/158 26HLN/CNT 7//AMIGO/CNT 7 P17920·111 F-l F·2F-3F-2F-OF Brazil 14LACOS/116 26BOW'S'/BUC'S' CM74005-8M-l Y·Q3M-5Y·2B·OY Uruguay 14LACOS/202 26BUTUI/BR14//PF79790/CEP75203 B30654-0Z-OA·3A-OA Brazil 12LACOS/120 27CEPll/0ASIS//BR14 B31743-0A-OZ-2A·QA Brazil 12LACOS/124 27BG/H ORK·S·//ALOAN//FOREY A5151-1 B-'I B-2B-OB Argentina 12LACOS/2 28L1LEN INIA Chile 12LACOS/144 28PEL75135/ALD'S'/5/T1F//KZM.Ml2/TI/3/ALO.. IP6929-3G·l G·OB-OYL Brazil 13LACOSm 28CEP14/CEP82113//BR14 B31751·0-0Z-0A·3A·2A-900Y Brazil 13LACOS/90 28LE2132/LE2134 Uruguay 13LACOS/134 28ITAPUA35 Paraguay 12LACOS/295 29TJB 788-1089/ALOAN//CEP 838513/CEP.. B32335·(301 Y)·OZ-OA-12A-OA Brazil 14LACOS/243 29BR 14/CEP 847 B31615·0A-OZ·1A·15A-OA Brazil 14LACOS/235 29ECAl/BOMBU Uruguay 13LACOS/140 30MCR/CEP13//BR14 B31561-G-310Y-OZ-3A-3A-900Y Brazil 13LACOS/96 30IAS58/4/KAl/BB//CJ'S'/3/ALO'S'/5/BOWS' CM81812-12Y-06PZ-6Y·4M-2Y-OMO Uruguay 14LACOS/228 30ITAPUA40 Paraguay 14LACOS/ 299 30VS73.600/MRI:S'/3/BOW'S'//YR/TRPS'=O CM 75113-B-5M-1Y-05M·7Y·1B-OY Uruguay 14LACOS/ 212 30BOW//BUC/BUL CM90526-1Y-OM-OY-2M·OY Paraguay 14LACOS/257 31PF 74354 Chile 14LACOS/172 31IAC24/BUC CM 95736-8Y-OM·OAL-1Y-1Y Chile 14LACOS/185 31SAETA INIA Chile 14LACOS/188 31
1 Relative coefficient of infection. The notes were taken using adouble-digit scale, and the two numbers weremultiplied. The product was divided by the maximum value at aparticular location minus one, and thenmultiplied by 100, i.e., ((01 * 02)/Max (01 * 02)-1)100.

241
Variation in Resistance to Sipolarissorokiniana and Nlagnaporthe grisea inWheat Plants Regenerated throughEmbryogenesis
Y.R. Mehta
Instituto Agronomico do Paraml-IAPAR, Londrina, PR, Brazil
Abstract
Three wheat cultivars (Batuira, Ibiara, Cacatu) with some degree of resistance to Bipolaris
sorokiniana, Magnaporthe grisea, and Xanthomonas campestris pv. undulosa, and onecultivar (Mirim) susceptible to all three pathogens were used to induce higher resistance levelsthrough somaclonal variation. Floral primordia of 15-20 plants per cultivar at initialdevelopment stages were used for callus induction and plant regeneration in petri platescontaining 10 ml ofMS culture medium and 2.0 mg of2, 4-D. After acclimatization, theregenerated plants were transferred to pots containing soil in agrowth chamber and grown tomaturity. Callus initiation was observed within 12-15 days and frequency ofcallus inductionwas 100% in all cultivars. Calli were continuously transferred every 30 days to the MS
regeneration medium without 2, 4-D. Frequency of regeneration ofRl plants was 10% forBatuira and 15.6% for Mirim. Calli ofother cultivars failed to regenerate plants. No albino orsterile plants were regenerated. On average, regenerated plants of Batuira yielded 12 seeds andthose ofMirim 15 seeds per spike. Variation in resistance ofR2 plants to B. sorokiniana and M.
grisea was observed, indicating the possibility ofnovel resistance genes through embryogenesis.
The majority of wheat cultivars in
Brazil have high yield potentials but are
susceptible to several diseases such as
spot blotch, caused by Bipolaris sorokiniana;blast, caused by Magnaporthe grisea; and
bacterial leaf stripe, caused by
Xanthomonas campestris pv. undulosa.Resistance to spot blotch and bacterial
stripe is governed by polygenes. Although
resistance sources are constantly being
identified, their resistance levels are
inadequate. Breeding efforts aimed at
transferring resistance have received top
priority during the past two decades;however, the results are not very
encouraging, partly because of the nature
of resistance and partly due to the lack of
ample genetic diversity among resistance
sources. Using somaclonal variation,
attempts were made to induce novel
resistance genes against B. sorokiniana, M.
grisea, and X. c. pv undulosa without
drastically altering the beneficial
agronomic characteristics of the original
genotypes.
242 V.A. Mehta
Materials and Methods
Major success in callus induction and
regeneration of disease resistant
somaclonal plants has been obtained
through the utilization of explants of
genotypes that already possess some
degree of resistance (Maddock et al. 1983).Cultivars Batuira, lbiara, and Cacatu were
reported to have some degree of
resistance to B. sorokiniana and X. c. pv.
undulosa (Mehta 1996; Mehta et al. 1996),and hence were selected for somaclonal
variation, with Mirim the susceptible
cultivar.
Fifteen to twenty plants of each
cultivar were grown in the glasshouse at
three sowing dates. Floral primordia were
selected at the initial stage of plant
development (inflorescences of 0.5-2.0 cm
in length) for callus induction and
regeneration of somaclonal plants in petri
plates containing 10 ml of MS culture
medium with 2.0 mg of 2,4-0 (Murashige
and Skoog 1962). The immature
inflorescences were surface sterilized in
sodium hypocloride solution, excised into
small pieces of up to 2-3 mm, placed in
petri plates containing the callus
induction medium, and incubated in the
dark for 30 days at 26°C. Calli were
transferred onto fresh medium for a
further period of 15 days under a similar
set of incubation conditions. After 45
days, calli were transferred to the
regeneration MS medium without 2, 4-0,
but supplemented with 27.8 mg L-l
Fe2S04 4Hp, 37.3 mg L-l Na2-EOTA, 0.5
mg L-l ANA, and 3.0 mg L-l kinetin, and
incubated at 26°C and 8/16 h light/dark
(Araujo et al. 1995). After reaching the
three-leaf stage, regenerated seedlings
were acclimatized by flooding the plates
with water and incubating them at room
temperature for 24 h. Later, the plates
were transferred to the growth chamber
in earthen pots of 20 cm diameter
containing soil and organic manure. Pots
were periodically manured with N, P205'
and K at a rate of 4:30:10 (2.5g/pot) and
grown to maturity.
R2 plants were inoculated using a
mixture of seven monosporic aggressiveisolates of B. sorokiniana obtained from the
1989 culture collection of IAPAR (strain
numbers 9130, 9131, 9132, 9133, 9134,
9140, and 9141). Plants were inoculated
with one isolate of M. grisea, 15 days after
inoculation with B. sorokiniana. A separate
leaf was inoculated for each pathogen.
For B. sorokiniana, cultures were grown on
potato-dextrose agar (POA), and for M.
grisea cultures were grown on oatmeal
agar (Araujo et al. 1995). Isolates were
stored on POA under room temperature
and were used for inoculations in 1989
and 1990. Cultures were initiated one
week before inoculation in petri dishes
containing POA. Plates were flooded with
distilled water, the spores gently scraped,
and the resulting ~uspension filtered
through cheesecloth. Conidial
concentration was diluted to 2.0-3.0 x 10⁴
conidia mP. One drop of Tween 20 per
200 ml of suspension was added and the
suspension was sprayed using a small
atomizer and a pressure pump. Leaves
were first washed with distilled water,
gently rubbed between the fingers, and
then each one was held upright, given a
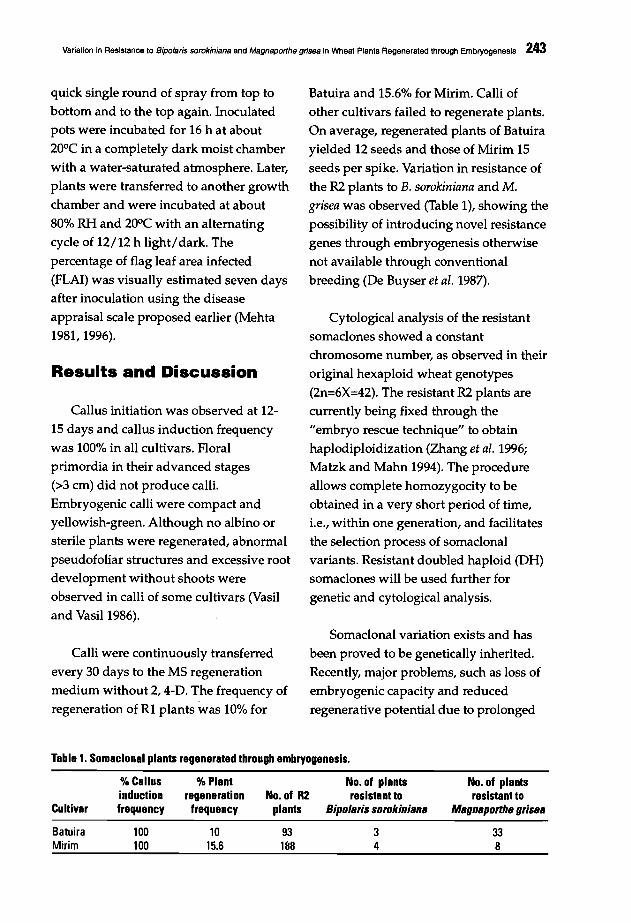
Variation in Resistance to Bipolaris sorokiniana end Magnaporthe grisea in Wheet Plents Regenerated through Embryogenesis 243
quick single round of spray from top to
bottom and to the top again. Inoculated
pots were incubated for 16 h at about
20°C in a completely dark moist chamber
with a water-saturated atmosphere. Later,
plants were transferred to another growth
chamber and were incubated at about
80% RH and 20°C with an alternating
cycle of 12/12 h light/dark. The
percentage of flag leaf area infected
(FLAI) was visually estimated seven days
after inoculation using the disease
appraisal scale proposed earlier (Mehta
1981, 1996).
Results and Discussion
Callus initiation was observed at 12
15 days and callus induction frequency
was 100% in all cultivars. Floral
primordia in their advanced stages
(>3 cm) did not produce calli.
Embryogenic calli were compact and
yellowish-green. Although no albino or
sterile plants were regenerated, abnormal
pseudofoliar structures and excessive root
development without shoots were
observed in calli of some cultivars (Vasil
and Vasil 1986).
Calli were continuously transferred
every 30 days to the MS regeneration
medium without 2, 4-0. The frequency of
regeneration of Rl plants was 10% for
Batuira and 15.6% for Mirim. Calli of
other cultivars failed to regenerate plants.
On average, regenerated plants of Batuira
yielded 12 seeds and those of Mirim 15
seeds per spike. Variation in resistance of
the R2 plants to B. sorokiniana and M.
grisea was observed (Table 1), showing the
possibility of introducing novel resistance
genes through embryogenesis otherwise
not available through conventional
breeding (De Buyser et al. 1987).
Cytological analysis of the resistant
somaclones showed a constant
chromosome number, as observed in their
original hexaploid wheat genotypes
(2n=6X=42). The resistant R2 plants are
currently being fixed through the
"embryo rescue technique" to obtain
haplodiploidization (Zhang et al. 1996;
Matzk and Mahn 1994). The procedure
allows complete homozygocity to be
obtained in a very short period of time,Le., within one generation, and facilitates
the selection process of somaclonal
variants. Resistant doubled haploid (DH)
somaclones will be used further for
genetic and cytological analysis.
Somaclonal variation exists and has
been proved to be genetically inherited.
Recently, major problems, such as loss of
embryogenic capacity and reduced
regenerative potential due to prolonged
Table 1. Somaclonal plants regenerated through embryogenesis.
% Callus % Plant No. of plants No. of plantsinduction regeneration No. of R2 resistant to resistant to
Cultivar frequency frequency plants Bipo/sris sorokinisns Msgnsporth8 gris8s
Batuira 100 10 93 3 33Mirim 100 15.6 188 4 8
244 V.A. Mehta
time in suspension culture, are presumed
to be due to somaclonal variation (Stirn
et ai. 1995). Funatsuki et ai. (1996)
demonstrated that somaclonal problems
in suspension cultures of barley, for
example, can be overcome by directly
regenerating plants from callus-derived
protoplasts.
Discrepancies in in vitro variation in
tissue cultures are encountered in the
literature (Larkin et ai. 1989; Chaudhury
et ai. 1994; Bohorova et ai. 1995). Some
laboratories have shifted their efforts
from somaclonal variation to other
transformation techniques, mainly
because somaclonal variation is
unpredictable and hence cannot be pre
planned or guaranteed. The desired
variation for a particular trait may be
achieved within three to four months or
may take five to six years. Besides,
success in somaclonal variation is
genotype dependent. In recent years,
several transformation techniques have
been developed including: 1)
Agrobacterium-mediated transformation;
2) protoplast-mediated transformation;
3) microprojectile-mediated
transformation; 4) tissue electroporation;
and 5) microinjection of DNA. Generally
speaking, these techniques are highly
sophisticated and depend on the
availability of an efficient and
reproducible tissue culture system (Jahne
et ai. 1994). Somaclonal variation, on the
other hand, is a relatively simple
technique and can be used where other
methods are not feasible or where
resistance genes are not available.
References
Araujo, L.G., Prabhu, AS., and AB. Freire.1995. Varia~ao somaclonal na cultivar dearroz IAC-47 para resistencia parcial abrusone. Fitopatol Bras 20:302 (abstr.).
Bohorova, N.E., van Ginkel, M., Rajaram, S.,and D.A Hoisington. 1995. Tissueculture response of CIMMYT elite breadwheat cultivars and evaluation ofregenerated plants. Cer Res Comm23:243-249.
Chaudhury, M.K.U., Vasil, V., and I.K. Vasil.1994. Molecular analysis of plantsregenerated from embryogenic culturesof wheat (Triticum aestivum L.). TheorAppl Genet 87:821-828.
De Buyser, J., Lonnet, P., Hertzoc, R, and AHespel. 1987. "Florin": A doubledhaploid wheat variety developed by theanther culture method. Plant Breed98:53-56.
Funatsuki, H., Kuroda, H., Kihara, M., andP.A Lazzeri. 1995. Fertile transgenicbarley generated by direct DNA transferto protoplasts. Theor Appl Genet 91:707712.
Jahne, A, Becker, D., Brettschneider, R, andH. Lorz. 1994. Regeneration oftransgenic, microspore-derived, fertilebarley. Theor Appl Genet 89:525-533.
Maddock, S.E., Lancaster, V.A., Risiott, R,and J. Franklin. 1983. Plant regenerationfrom cultured immature embryos andinflorescences of 25 cultivars of wheat(Triticum aestivum). J Exp Bot 34:915-926.
Matzk, F., and A Mahn.1994. Improvedtechniques for haplOid production inwheat using chromosome elimination.Plant Breed 113:125-129.
Mehta, YR 1981. Conidial production,sporulation period and lesion extensionof Helminthosporium sativum on flagleaves of wheat. Pesq Agrop Bras Brasilia16(1):77-79.
Mehta, Y.R 1996. Varia~ao somaclonal nasplantas de trigo regeneradas atraves deembriogenese. Fitopatol Bras 21: (abstr.).
Mehta, YR, Campos, L.AC., and E.Guzman. 1996. Resistencia genetica decultivares de trigo a Bipoiaris sorokiniana.Fitopatol Bras 21:455-459.
Variation in Resistance to Bipo/aris sorokiniana and Magnaporthe grisea in Wheat Plants Regenerated through Embryogenesis 245
Murashige, T., and F. Skoog. 1962. A revisedmedium for rapid growth and bioassayswith tobacco tissue cultures. PhysiolPlant 15:473-497.
Stirn, S., Mordhorst, P., Fuchs, S., and H.Lorz. 1995. Molecular and biochemicalmarkers for embryogenic potential andregenerative capacity of barley (Hordeumvulgare L.) cell cultures. Plant Sci 106:195206.
Vasil, I., and V. Vasil. 1986. Regeneration incereal and other grass species. In: I. Vasiland V. Vasil (eds.), Cell Culture andSomatic Cell Genetics of Plants. Vol. 3,pp.121-150.
Zhang, J., Friebe, B., Raupp, W.J., Harrison,S.A., and B.S. Gill. 1996. Wheatembryogenesis and haploid productionin wheat x maize hybrids. Euphytica90:315-324.
246
Evaluating Spot Blotch Resistance Traitsin Wheat and Related Species
Chang Naitao, Jia Xianlu, Gao Zenggui, Wu Wui, Liu Weizhi, and WU Yousan
Shenyang Agricultural University, Shenyang, Liaoning Province, PR China
Abstract
Spot blotch ofwheat, caused by Bipolaris sorokiniana (syn. Helminthosporium
sativum), is regarded as an important wheat disease in China due to its high disease frequencyin the northwestern, northeastern, and southern regions of the country. Breeding for resistantwheat varieties is considered the most effective method ofcontrol. A critical step in breedingwheat for spot blotch resistance is to evaluate resistance traits and their characteristics. Fivelocal spring wheat varieties and 56 species ofwheat relatives were selected for resistance usingpercent diseased area and lesion type methods. After three years offield evaluation, the five localspring wheat varieties were found to be susceptible to spot blotch, whereas the 56 related speciesshowed varying resistance levels, suggesting there is plenty ofresistance for spot blotch in eachgenus ofwheat relatives. Drop inoculation for scoring lesion type was, among other things, easyto perform, repeatable, and produced stable disease scores over years and locations. The lesiontype method was also more sensitivefor reflecting resistance change with growth stage. Thismethod revealed stable resistance traits and high levels ofspot blotch resistance in wheatrelatives and would be useful in future breeding programs.
Spot blotch of wheat, caused byBipolaris sorokiniana (Helminthosporiumsativum syn. Cochliobolus sativus), occurs
worldwide. In the countries of SoutheastAsia, where climates are warm and moist,such as India, Bangladesh, and Thailand,
spot blotch is the most severe constraint
to wheat production. Several epidemics
of the disease have been reported innortheastern, northwestern, and southernChina (WU Yousan et al. 1957; Hand
Guichao et al. 1957; Ouyang Xiao 1962;
Ma Qixang, et al. 1987; Wu Baichai et al.1983). Due to this high disease frequency,
spot blotch is regarded as an important
wheat disease in China. However, most
leading commercial varieties are not spot
blotch resistant. Therefore, the mosteffective method for future disease
control is breeding for resistant wheatvarieties.
A critical step in breeding wheat for
spot blotch resistance is to evaluateresistance traits and their characteristics.
The conventional method is to select for
resistance in the field. This method islikely to fluctuate due to climate change
and requires further refinement. Another
factor that limits breeding efforts is the
lack of resistance sources in wheat. Wild
sources are rich in resistance genes for
various stresses and have been exploitedfor improving wheat. Disease resistance

Evaluating Spot Blotch Resistance Traits in Wheat and Related Species 247
traits are thus being studied and
compared using different evaluation
methods for the special features of wheat
and its relatives.
Materials and Methods
Field selectionSpot blotch resistance of wheat and its
relatives was evaluated in the nursery at
Shenyang Agricultural University during
1992-1994. Five local spring wheat
varieties studied were Tiechun No.1,
Tiechun No.2, Liaochun No.9, Liaochun
No. 10, and Shenmian 85. Fifty-six species
of wheat relatives grouped into seven
genera were screened, including AegilopsL., Agropyron Gaerth., Elytrigia Desu.,
Haynaldia Schur., Leymus Hochst,
Roegneria C. Koch, and Secale L.
Disease severity in the field was
recorded on a 0-4 scale according to
Zhang Jinchun and Zhu Xinting (1991)
and Wu Wei et al. (1989) at milk and soft
dough stages. The scoring standards were
as follows:
o Immunity (1M) = Free from spotting.
1 Resistance (R) =Necrotic spots on 2-5%
of the flag leaf and 5-10% of the
penultimate leaf area.
2 Moderate resistance (MR) =Necrotic
spots on 25% of the flag leaf and 40% of
the penultimate leaf area.
3 Moderate susceptibility (MS) = Necrotic
spots on up to 50% of the flag leaf and
80% of the penultimate leaf area.
4 Susceptibility (S) = Necrotic spots on up
to 80% of the flag leaf area, the
penultimate leaf dead, and leaf sheath
infected.
Reaction type on excisedleaves in vitro
Six excised leaves were placed in a
petri dish containing a layer of filter
paper moistened with 40 ppm 6 BA water
solution. Each leaf was inoculated with 4
6 drops of a suspension solution of
conidiospores (B. sorokiniana), then
transferred and cultured under for 12 h at
25±1°C and 2000 lux. Necrotic spot
reaction types were scored at intervals.
Control leaves were drop-inoculated with
water. Number of B. sorokinianaconidiospores in suspension was
determined under a microscope at a low
magnification (15x4).
Disease severity was recorded on a 0-4
scale, according to the type of necrotic
spot on the excised leaf. Resistance level
was scored according to disease severity
as follows:
o Immunity (1M) = Free from spotting.
1 Resistance (R) = Necrotic spots without
chlorosis.
2 Moderate resistance (MR )= Necrotic
spots with light chlorosis but of limited
area.
3 Moderate susceptibility (MS) =Necrotic
spots with obvious chlorosis along the
vein.
4 Susceptibility (S) = Large necrotic spots
with a larger area of chlorosis.
Disease severity and lesiontype at different growth stages
The flag and penultimate leaves,
detached from the wheat plant at
elongation, boot, early heading, and
heading stages, were used to evaluate
resistance reaction by drop inoculation.

248 Chang Naitao 91 a/.
Five spring wheat varieties (Tiechun No.I, Tiechun No.2, Liaochun No.9,
Liaochun No. 10, and Shenmian 85)
grown in the greenhouse were chosen forthe study. Lesions were scored at 48, 72,and 120 h after drop inoculation. Trial
procedures were repeated three times,
and mean disease severity data werecompared.
Lesion type In wheat relativesSix species of wheat relatives were
grown in the greenhouse, and the flag
and penultimate leaves were detachedfrom the plants at early heading. The
species studied after drop inoculationwere: Triticum tauschii (D genome),
Agropyron desertorum, Elytrigia elongata,Et. intermedia, Haynaldia villosa, and
Leymus racemosus.
Resistance reaction was continuouslymonitored until lesion development onthe excised leaves had finished. Lesiontype was recorded at 144, 216, 240,and288 hours. The experiment was repeatedthree times.
Results
Field selectionDuring three years of field resistance
evaluation, the five local spring wheat
varieties were found to be susceptible to
spot blotch, whereas the 56 species ofwheat relatives grouped into seven
genera had varying resistance levels.
Of the 56 wild wheat species, all were
infected by B. sorokiniana but to different
degrees. In terms of disease severityscoring, the number of resistant wild
species was 26 (46.4%); moderately
resistant, 7 (12.5%); moderatelysusceptible,l (1.7%); and susceptible, 22
(39.2%). Haynaldia villosa, with the highest
level of sp~t blotch resistance, showedsparse necrotic spots on leaves; the next
most resistant species belonged to the
Elytrigia, Elymus, and Secale genera.Aegilops was an important genus,
co~prisingmany species with higherspot blotch resistance levels such as T.
tauschii, Ae. longissima Chw. et Musch,and Ae. spertoides Tausch.
Fielmresistance selection resultssuggest that there are plenty of resistance
traits for spot blotch in each genus ofwheat relatives, except for Agropyrondesertorum, which was susceptible.Resistance in the wild relatives included
diverse characters, since the genescontrolling resistance belonged todifferent genomes. The results also showthat wheat relatives have valuablesources of resistance that could be
exploited for spot blotch control (Table 1).
Lesion types onexcised wheat leaves
To study disease reaction change, the
flag and penultimate leaves excised from
wheat plants at heading were inoculatedwith drops of a conidial suspension of B.
sorokiniana. Five spring wheat varieties
were used. After drop inoculation of theleaves in petri dishes, light chlorosis
appeared at the site of the drops after
about 24 h. After 48 h, brown and black
necrotic spots were obvious, occasionally
surrounded by water soaked chlorosis. At
72 h, the lesioJ;l coalesced and expanded

Evaluating Spot Blotch Resistance Traits in Wheat and Related Species 249
along the veins with an area of obvious
yellowish chlorosis. After 140 h, thenecrosis and chlorosis joined togetherbetween the drop inoculation sites,
causing leaf death. The control..leaves notonly stayed alive and green at 24, 48, 72,
and 120 h, but there was no sign of
chlorosis or wilting in that time. Rate offormation and area of necrosis with
chlorosis between the two uppermost.,.leaves differed between the flag and
penultimate leaf. Prior to 72 h.~n the petridish, the disease area on the penultimate
leaf expanded faster than that on the flag
leaf. By 120 h after inoculation, lesion
types on both leaves reached the samescore, and the lesions joined together,
causing the leaves to wilt.
After inoculation, lesion development
was similar on both the flag and
penultimate leaves, and after 120 h the
disease reaction was equal for the fivespring wheat varieties. Compared with
the results of adult plant resistance
evaluated in the field, the five springwheat varieties had the same disease
scores (Figure 1).~,.
Effect of wheat growthstage on lesion type
The flag and penultimate leaves of the
five wheat varieties were inoculated with
drops of conidiospore suspension in vitro
at elongation, boot, early heading, andheading. Disease reaction and type on the
leaves were recorded and compared(Figure 2). Results showed that reaction
type on leaves. at early heading differedwith growth stage and leaf position at 48hours after drop inoculation. At 120 h,lesion type differed with growth stage
SS
1 2Shenmian
85
SS.4Bh ESI62h D140h
S S MS S S S
o
4
'" 3~§ 2
'c;;~
12121212liechun liechun Liaochun Liaochun
NO.1 No.2 No.9 NO.10
1Flag leaf 2Second leaf
Figure 1. Change in lesion type among wheatcultivars.
Resistance ResistanceSpecies type Species type
Aegilops T. tausehii SAe. umbel/ulata S T. tausehii RAe. umbel/ulata S T. tausehii RAe. umbel/ulata S T. tausehii SAe.ovata R T. tausehii SAe. triaristata R T. tausehii SAe. recta R T. tausehii SAe. recta R T. tausehii RAe. vaFiabilis MS T. tausehii RAe. triuneialis S T. tausehii RAe. triuneialis MR T. tausehii RAe. triuneialis S RoegneriaAe. triuneialis R tsuekushienesis MRAe. triuneialis S ElytrigiaAe. eylindriea R Et. intermedia RAe. cylindrica R Et. elongata RT. tausehii R Haynaldia villosa RT. tausehii R Leymus raeemosus RT. tausehii MR Agropyron desertorum SAe. erassa S SeealeAe. erassa S S. eereale SAe. ventrieosa S (spring rye)Ae. ventrieosa S S. eereale RAe. juvenalis S (Xinjiang rye}Ae. varilovii S S. eereale MRAe. varilovii S S. eereale MRAe. speltoides R S. eereale MRAe. speltoides R (winter rye)Ae. speltoides R S. eereale SAe. longissima S (winter rye}Ae. longissima S S. eereale MRAe.longissima MS (winter rye)
Table 1. Adult plant resistance of wheat relativesin the field.
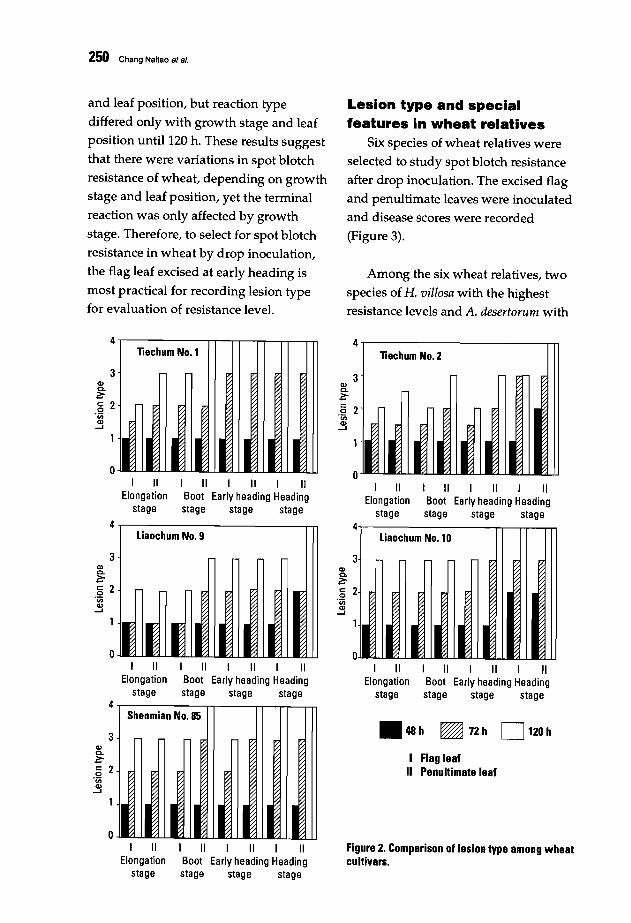
250 Chang Nailao 8/8/.
and leaf position, but reaction type
differed only with growth stage and leaf
position until 120 h. These results suggest
that there were variations in spot blotch
resistance of wheat, depending on growth
stage and leaf position, yet the terminal
reaction was only affected by growth
stage. Therefore, to select for spot blotch
resistance in wheat by drop inoculation,
the flag leaf excised at early heading is
most practical for recording lesion type
for evaluation of resistance level.
Lesion type and specialfeatures In wheat relatives
Six species of wheat relatives were
selected to study spot blotch resistance
after drop inoculation. The excised flag
and penultimate leaves were inoculated
and disease scores were recorded
(Figure 3).
Among the six wheat relatives, two
species of H. villosa with the highest
resistance levels and A. desertorum with
4,---------,-,--,,-rr--.-r-"'TT1Tiechum No.1
4-,--------------.,..,..,Tiechum No.2
3
I II I II I IIBoot Early heading Headingstage stage stage
I IIElongation
stage
.48h ~ 72h D 120h
I II I II I IIBoot Early heading Headingstage stage stage
I IIElongation
stage
0 0I II I II I II I II I II I II I II I II
Elongation Boot Early heading Heading Elongation Boot Early heading Headingstage stage stage stage stage stage stage stage
4 4Liaochum No.9 Liaochum No. 10
3 3Q) Q)a. a.~ ~§ 2 § 2'iii 'iiiQ) Q)
...J ...J
Q)a.~
§ 2'iiiQ)
...J
3
4,---------,.,-----rr-rr-1TlShenmian No. 85
Figure 2. Comparison of lesion type among wheatcultivars.
I Flag leafII Penultimate leaf
I II I II I IIBoot Early heading Headingstage stage stage
I IIElongation
stage
o
Q)
a.~
§ 2'iii.3

Evaluating Spot Blotch Resistance Traits in Wheat and Related Species 251
the lowest resistance level produced
results equal to those attained in the field.
Results for the other four species with
moderate disease resistance scores [Et.eiongata, Et. intermedia, T. tauschii Coss (0
genome), and Leymus racemosus] differed
from the resistance levels they showed in
the field. In contrast to wheat, disease
reactions on the leaves of wild species
(except A. desertorum) did not clearly
appear before 120 h after drop
inoculation. Stable disease reactions with
low expanding rates occurred at 144 h,
and disease reactions finished at 216
hours. This was a special feature of wheat
relatives. Resistance traits were stable
over time and high levels of disease
resistance were observed in wheat
relatives after drop inoculation.
Resistance levels were not easy to
determine and would otherwise be
achieved through multilocation tests over
a series of years. Moreover, differences in
disease reaction between the flag and
penultimate leaves were not obvious
among wheat relatives; only a few species
had larger necrotic spots on the
penultimate leaf than on the flag leaf
during lesion development.
Discussion
Gilchrist (1984) and Large and Doling
(1962) reported on selection methods for
spot blotch resistance. In China, both
natural occurrence (Wu Wei et al. 1989)and conidiospore inoculation in the field
(Zhang Jingchun and Zhu Zinting 1991)
evaluation methods have been used for
resistance selection. The methods cited
above for selection for spot blotch
resistance depend on percent necrosis
and associated chlorosis on the surfaces
of the two uppermost leaves. Since these
are easily affected by environmental
factors, disease scores of wheat varieties
recorded in the field often change over
years at the same location. Therefore,
multilocation testing over several years is
needed to determine whether resistance
levels of the species or varieties are
stable.
S S4 .144h ~216h )
':,1 Flag leaf
1.... ___ .1240 h 1:7':'.:'i;"l 288 h ':i:'.~~::".~_
3 ...... 2 Second leaf iMR MR l~
CI>,
Cl.':~ MR MR MR , MR MR
i '; ,c:: 2 "0
~, ':'iii '-CI>,
t...J"
, ':~ '- i R R t"
, ':~ '- i 1 i~
" ,,'-
,"i 1 J,
01 2 1 2 1 2 1 2 1 2 1 2
Et. e/angata Et. intermedia Et. tauschii Ha. villosa A. desertorum Leymusracemosus
Figure 3. Evaluation of spot blotch resistance in wheat relatives by drop-inoculation method.
252 Chang Naitao at a/.
Bailey et al. (1988) reported that spot
blotch resistance was polygenic. Conner
(1990) considered that each part of the
wheat plant had its own resistance to B.
sorokiniana that was independently
effected. For scoring lesion type, the drop
inoculation method was easy to perform
and repeat. The method could decrease
environmental effects and produce
comparable, stable disease scores over
years and locations. It was found that
while percent diseased area and lesion
type methods for selecting spot blotch
resistant traits could compensate for each
other, the lesion type method was more
sensitive for reflecting resistance change
with growth stage. This method showed
stable resistance traits that expressed
high levels of spot blotch resistance in
wheat relatives, ~nd would be useful in
future breeding programs. To date, no
resistance selection method is able to
precisely and completely demonstrate
spot blotch resistance traits in wheat and
its relatives due to the complicated nature
and diversity of the resistant traits.
References
Bailey, KL., Knott, D.R., and H. Harding.1988. Heritability and inheritance ofresistance to common root rot(Cochliobolus sativus) in wheat (Triticumaestivum). Can J Plant PathoI1O:207-214.
Conner, R.L. 1990. Interrelationship ofcultivar reaction to common root rot,black point, and spot blotch in springwheat. Plant Dis 74:224-227.
Gilchrist, L. 1984. CIMMYT method forscreening wheat for Helminthosporiumsativum resistance. In: Wheat for MoreTropical Environments. A Proceedings ofthe International Symposium, pp. 149150. Mexico, D.E: CIMMYT.
Large, E.C., and D.H. Doling. 1962. Themeasurement of cereal mildew and itseffect on yield. Plant Patholll:47-57.
Wu Wei, Yang Jashu, and Chang Naitao.1989. Method for determining varietalresistance for mature wheat plant to rootrot disease. J Shenyang Agric Univ20(2):102-107.
Zhang Jingchun and Zhu Xiuting. 1991.Resistance evaluation method for wheatroot rot. In: Wu Quanan (ed.), MethodUsed in the Evaluation of Pest ResistantPotentialities in Food Crop GermplasmResources, pp. 19-21. Beijing: ChinaAgricultural Press.
253
In vitro Selection for Spot BlotchResistance in Wheat
Chang Naitao, Gao Zenggui, Jia Xianlu, Wu Wei, and Wu Yousan
Shenyang Agricultural University, Shenyang, Liaoning Province, PR China
Abstract
Spot blotch ofwheat, caused by Bipolaris sorokiniana (syn. Helminthosporium
sativum), is an important wheat disease in China. The main varieties currently grown inChina are susceptible to the disease, and sources ofresistance are limited. A rese.arch programwas undertaken in 1988-92 to improve resistance by developing a practical procedure forsomaclonal selection for spot blotch resistance. Resistance enhanced mutants were obtained fromfour spring wheats. Afterfield testing the regenerated plantlets for four successive generations,resistance was found to be stable. Resistance evaluation in the field suggested that in vitro
selection ofembryonic calli l!sing H. sativum toxins was effective. The mutants obtainedexpressed higher levels ofstable, heritable resistance.
Introduction
Somaclonal variation is known to
cause wide genetic changes and has been
used in breeding for disease resistance,
salt and drought tolerance, and increased
protein levels since 1970. Carlson (1973)
was the first to successfully use in vitrosomaclonal screening for tobacco black
foot disease (Pseudomonas tabaci)resistance by the toxin-like material to
obtain a disease resistant mutant. Since
then, there have been reports on
somaclonal in vitro selection for resistance
to helminthosporium leaf spot
(Helminthosporium maydis), sugarcane eye
spot disease (H. sacchari), mustard family
black foot disease (Phoma lingam), and
rice bacterial blight disease (Xanthomonasoryzae).
Spot blotch, caused by Bipolarissorokiniana (syn. H. sativum) of wheat is
an important disease in China. There are
limited sources of spot blotch resistance
available; the principal varieties currently
grown in the epidemic regions are
susceptible to the disease. In 1988-1992, a
research program was undertaken to
develop a practical procedure for'
somaclonal selection for spot blotch
resistance. Resistance enhanced mutants
from four spring wheats were obtained.
The regenerated plantlets were evaluated
for spot blotch resistance in the field for
four successive generations, and
resistance was found to be stable. The cell
membrane resistance value technique
was used to detect tissue sensitivity to HS
(H. sativum) toxins.
254 Chang Naitao at al.
Materials and Methods
VarietiesFour spring wheat varieties were
studied including A2U (MS), Tiechun No.
1 (S), Shenmian 85-9 (S), and Shenmian
85-14 (S). Varietal resistance level was
evaluated in the field for two growing
seasons (Zhang ]ingchun et al. 1991).
Purification andtoxicity of HS toxins
Strains of B. sorokiniana were isolated
from diseased wheat plants in the field,
transferred to PDA medium, and
maintained at 4°C. Toxins
(helminthosporal) were extracted and
purified according to the method of Wu
Wei et al. (1989). Toxicity of the HS toxins
was tested by the resistance value and
bioassay method. The partially purified
toxin was kept at 4°C and utilized to
screen for resistance (somaclonal)
variation in the embryonic calli.
Induction and plantletregeneration of embryoniccallus
Young embryos 17-20 days post
anthesis were selected as explants to
induce calli from donor plants. The basic
medium used was MS medium. Callus
inducing medium consisted of 2.0 mg L-l2,4,5-T, 0.2 mg L-l KT, and 0.4 mg L-l IAA
in MS medium. Plantlet regeneration
medium contained no hormone. Callus
induction, and subculture, screening of
HS toxins, and plantlet regeneration from
the HS toxin-screened calli were done on
different media in a 100 ml flask at
25±1°C under 12 h light of 2000 lux.
Choosing suitable HS toxinconcentration for resistantmutant selection
While toxicity was being measured,
the partially purified HS toxin was
applied to the research work and
concentration was set at 0.1,0.5, 1.0, 1.5,
2.0, 2.5, and 3.0 treatment units (1
treatment unit =1 ml HS toxin in 30 ml
MS medium). Controls were kept.
According to callus size and the interval
between the two HS toxin subculture
selections, survival rate and plantlet
regeneration rate of the callus were
calculated at each HS toxin concentration
according to the following formulae:
Survivalrate (%) = Live cal!j after HS toxin selection x 100
Total number of cal!j inoculated
Plantletregeneration Regenerated calli
rate (%) = screened by HS toxins x 100Live calli after HS
toxin selection
Measuring resistance In thecallus
The method used for measuring
resistance level in the calli was that of
Zhang Xianzheng et al. (1986). An
improved needle-like electrode was used
to measure and compare the change in
resistance of the cell membrane during
HS toxin selection. The electrode was
connected parallel to an electric
conductance meter (r..jodel DDS-U). The
procedure took place under conditions of
saturated humidity and was repeated six
times for each test.
In vitro Selection for Spot Blotch Resistance in Wheat 255
Evaluating resistance inregenerated plants
Plants regenerated from HS toxin
selected calli were evaluated for spot
blotch resistance in adult plants using the
field method mentioned above in the
nursery at Shenyang Agricultural
University. Morphological changes in the
regenerated plants were recorded at the
same time. Both donor varieties and non
toxin screened plants were maintained in
the nursery as controls. Resistance
evaluation was recorded over four
successive growing seasons to test the
heredity of resistance stability in the
mutants.
Results
Callus survival andregeneration rate
Immature wheat embryos were
inoculated on induction medium
repeatedly for 5-6 weeks until the calli
were 2-4 mm long. Calli were then
transferred to HS toxin screening
medium. Survival and regeneration rates
of the screened calli were compared over
HS toxin concentrations and used as
double inspection standards to determine
practical HS toxin concentrations for
selection. All seven HS toxin
concentration treatments were toxic on
calli and HS toxins were observed to
inhibit callus growth and differentiation
(Figures 1 and 2). At 3.0 toxic units, most
inoculated calli turned brownish or
hydrated and died within two weeks,
while some calli survived but lost the
ability to regenerate. Although sensitivity
to HS toxins differed among calli induced
from the four cultivars, the effect of toxins
on plantlet regeneration rates showed a
similar changing tendency among the
four cultivars. In addition, the subculture
time on toxic medium affected plantlet
regeneration rate of calli, i.e., an increase
in toxic subculture time decreased the
plantlet regeneration rate. Resuming
subculture immediately after toxic
medium subculture inG::reased callus
regeneration rate.
30.5 1 1.5 2 2.5HS toxin concentration
20
40
80
60
Regeneration rate
100-,---------------.,
30.5 1 1.5 2 2.5HS toxin concentration
20
40
80
60
Survival rate
100 -0;;;::---------------.,
Figure 1. Correlation between Hs/minthosporiums8tivum (HS) toxin concentration and calli survivalrate.Note: The unit of HS toxin concentration was ml30 mi'!
medium solution. Calli were cultured on toxicmedium for two weeks.
Figure 2. Correlation between Hs/minthosporiums8tivum (HS) toxin concentration and plantletregeneration rate.Note: The unit of HS toxin concentration was ml30 ml'!
medium solution. Calli were cultured on toxicmedium for two weeks.
256 Chang Naitao st al.
Figure 3. Comparison of call membrane resistancechange in toxin-screened calli and unscreenedvarieties.
For a cultivar, the resistance value of calli
after HS toxin selection was much higherthan that of non-toxin screened calli
(Figure 3), suggesting that HS toxin
selection may increase cell membranestability and reduce tissue sensitivity to
HS toxins.
Heredity stability of spot blotchresistance in regeneratedplants
Plantlets regenerated (Ro generation)
from HS toxin screened calli were
recorded and harvested in thegreenhouse. Progeny of Ro generationplants were continuously evaluated for
spot blotch resistance in the field at milkstage for four years (Table 2).
Regenerated plants from toxin selectedcalli were evaluated for spot blotch
resistance and compared with donor and
.Non-toxin ~ Toxin screenedscreened
Tiechun Shenmian Shenmian A2111 85-9 85-14
7
6Q)
~ 5>~ 4l:
tl 3.~ 2a::
1
o
Cell membrane resistance withHS toxin selection
Plant cell membrane resistance value
method is an electric physiological
method used to inspect both cellmembrane stability and ability to endure
external stress. It was found that
membrane resistance varied amongcultivars and their development status.
Results showed that callus survival
and plantlet regeneration rates rangedbetween 20-30% and 15-40%, at 1.5 and
2.0 toxic units, respectively. Accordingly,
1.5 (for cultivars with low regenerationrates) and 2.0 toxic units were chosen as
HS toxin selection pressure. The toxin
selection cycle involved two weeks oftoxic subculture repeated twice, and a
three-week interval during which
subculture was resumed between the twotoxic subcultures. When HS toxin
selection had finished, the surviving calliwere transferred to differentiation mediato induce plantlet regeneration. Plantlets
were then grown in pots in the
greenhouse. HS toxin selection resultsand callus regeneration rates of the fourcultivars are listed in Table 1. After the
second toxic medium subculture, callussurvival rates ranged between 3.8 and
10.3% and callus regeneration rates wererelatively stable at about 40%.
Table 1./n vitro screening of wheat cultivars and comparison of plantlet regenerating rates.
No. of surviving calli after toxin screening Toxin PJantletDonor No. of 1st screening 2nd screening screening rate regeneration ratevariety calli cycie cycle (%) (%)
Tiechun 1 958 327 71 7.4 34Shenmian 85-9 654 125 45 6.9 37Shenmian 85-14 3214 627 124 3.8 42A211 657 230 68 10.3 40

regenerated plants from non-toxin
selected calli. Individual screened plants
with plant height and prolonged heading
stage variation in the Ro generation
showed stability in spot blotch resistance
from the R1 to R4 generation without
restoration. Some Ro plants with varying
leaf and spike morphology, and spikelet
number regained normalcy before R2
generations; other plants in the R3 or R4
generation showed variation in
susceptibility to powdery mildew
(Erysiphe graminis) and leaf rust (Puccinia
recondita). There was also some variation
in susceptibility to spot blotch in the R3
and R4 generations. The head line
numbers were stable in the R3 and R4
generation.
Resistance evaluation in the field
suggested that in vitro selection of
embryonic calli for spot blotch resistance
using HS toxins was effective, and the
mutants obtained expressed a higher
level of spot blotch resistance with stable
resistance heredity.
Discussion
Chalwa et al. (1987) and Guo Lijuan et
al. (1991) studied somaclonal selection for
B. sorokiniana resistance in wheat;
however, research has not yet been
In vitro Selection for Spot Blotch Resistance in Wheat 257
undertaken on the toxicity of HS toxins,
establishment of HS toxin screening
pressure and resistance assessment
methods, and the stability of resistance
hereditary in plants regenerated from
toxin screened calli. In contrast with
donor plants, the number and structure
of chromosomes for plant height and
prolonged heading stage variation in
regenerated plants were found to be
normal. Since plant height, heading, and
spot blotch resistance are polygenically
controlled traits in wheat, it was not clear
that morphological changes were due to
resistance variation.
It was also found that HS toxin
screened tissue with higher HS toxin
resistance levels expressed higher cell
membrane resistance. Also, activity of
enzymes such as PAL (phenylalaninase),
PO (peroxidase), and SOD (superoxide
dismutase) increased in the resistant
mutant (data not shown) and reached
higher levels in regenerated plants
infected by B. sorokiniana. The reasons for
resistance variation in the biochemistry
reaction will be studied further.
In somaclonal selection for disease
resistance, the key step was to set up the
screening procedure according to disease
characteristics. Since difficulties exist in
Table 2. Spot blotch resistance of regenerating plantlets in the field.
R3 generation R4 generationDonor Resistance Regenerated Head Plant Resistant Head Plant Resistantvariety type plantlets line (no.) plant (no.) line (no.) plant (no.)
A211 MS 491 3 578 344 3 320 100Shenmian 85-9 S 28 3 64 57 3 46 27Shenmian 85-14 S 144 6 154 226 6 199 107liechun 1 S 1372 16 1728 962 16 557 364Total 4 2035 28 2524 1589 28 1122 618

258 Chang Nailao 91 al.
using genetic engineering for crop
improvement, more attention should be
paid to improving in vitro somaclonal
selection technique and developing new
germplasm for use in wheat resistance
breeding programs. Other theoretic and
technical problems need to be studied
further.
References
Carlson, P.S. 1973. Methioine-sulfeximineresistant mutants of tobacco. Science180:1366-1368.
Guo Lijuan, Yao QingXiao, Hu Qide, KangShaolen, Dong Jingao, and HuangWufang. 1991. Studies of screeningresistant to mutant Helminthosporiumsativum by cell engineering in wheat.Acta Genetica Sinica 18(6):500-507.
Wu Wei, Yang Jiashu, Chang Naitao, andWu Yousan. 1989. Study on the toxins ofHelminthosporium sativum. ActaMycologica Sinica 8(1):70-79.
Zhang Xianzheng, Wu Wei, Yang Jiashu,and Hao Jianjun. 1986. A ZD type plantelectrical resistance measurement clip.Plant Physiol Commun (6):57-58.
Zhang Jingchun, and Zhu Xiuting. 1991.Resistance evaluation method for wheatroot rot. In: Wu Quanan (ed.), MethodsUsed in the Evaluation of Pest ResistantPotentialities in Food Crop GermplasmResources, pp. 19-21. Beijing: ChinaAgricultural Press.
259
Identification and Inheritance ofResistance to Foliar Blight of Wheat
D. Singh, R.V. Singh, A.K. Singh, and B.N. SinghDepartment of Plant Pathology, N.D. University of Agriculture and Technology,
Kurnarganj, Faizabad, Uttar Pradesh, India
Abstract
A total of102 wheat genotypes were tested for resistance to Bipolaris sorokiniana andAlternaria triticina under artificial epiphytotics for three consecutive crop years. Among these,13 genotypes (PATO (R)/3/fZPP/SN64//NAR, VEE"S", BOW"S", KVZ/BON, B/Y"S"//TOB/CHA, PF 70354jYACOS"S", HD2206/HORK"S", DL 153-2, HS 284, NI 8289, BW
1052, BW 11259, and CPAN 1910) constantly showed resistance throughout the years oftesting. Twenty-one genotypes were found to be moderately resistant; 48, moderatelysusceptible; 15, susceptible; and 5, highly susceptible. No genotype was found to be free fromfoliar blight. In inheritance studies, Fl progenies ofall crosses (NI 8289/UP 262, CPAN 1910/UP 262, and NI 8289/HUW 234) showed high susceptibility to foliar blight and werecomparable to parents UP 262 and HUW 234. In the F2 generation, the segregation in allcrosses followed a 1 (resistant):15 (susceptible) ratio, indicating that inheritance ofresistance tofoliar blight is controlled by two major recessive genes.
Although foliar blight of wheat wasreported in India as early as 1924(Kulkarni 1924; McRae 1924), it was not
of much consequence until recently. With
the changes in cropping system, croppingintensity, crop management, and varietalspread, the foliar blight complex has now
become a serious disease, causing high
yield losses in eastern India. A number ofpathogens causing leaf spots, blights, and
blotches on wheat have been reported in
India. Among them, Bipolaris sorokiniana(Sacc. in Sorok.) (syn. Helminthosporiumsativum Pamm., King, & Bakke) and
Alternaria triticina (Prasada & Vrabhu) areconsidered important, and it has been
shown that B. sorokiniana is more
important than A. triticina (Singh et al.1992).
The main concern today is diseasemanagement to achieve sustainable wheat
yields. Breeding varieties with leaf blight/blotch resistance provides the cheapestand easiest means of increasing
productivity; however, very few resistantsources have been identified.
This paper describes our investigationsinto the identification of resistant sources
to both pathogens, and the elucidation of
the inheritance pattern of B. sorokiniana for
further use in breeding.
Materials and Methods
Seeds of 102 wheat genotypes were
obtained from the Directorate of WheatResearch, Kamal, India. Each genotype
260 D. Singh at al.
was sown in aIm long row with 25 cm
between rows and 5 cm between plantsunder irrigated and high fertility
conditions for three years (1988/89 to
1990/91). Pure cultures of B. sorokinianaand A. triticina were obtained from the
Department of Plant Pathology, N.D.
University of Agriculture and Technology,Kumarganj, Faizabad, India. These
inocula were multiplied separately on
PDA medium. Spore suspensions of bothpathogens were prepared in distilled
water. The final mixed spore suspension
contained 8-10 spores per microscopicfield (lOx). Three days prior to eachinoculation, the crop was irrigated. Using
an atomizer, the mixed inoculum wassprayed thoroughly onto each genotypes,
during the evening at growth stages DC37 (flag leaf initiation) and DC 52(heading initiation). The field was
irrigated just after inoculation, followed
by frequent irrigations to create favorableconditions for rapid disease developmentwith high disease pressure. Diseaseintensity was noted 10 days afterinoculation according to the 0-9 Saari
Prescott scale (Saari and Prescott 1975).
Using this scale, a score of 1-3 wasconsidered resistant; 4, moderately
resistant; 5 and 6, moderately susceptible;
7 and 8, susceptible; and 9, highlysusceptible.
During 1991/92, the following crosseswere also made: NI 8289/UP 262, CPAN
1910/UP 262, and NI 8289/HUW 234.Lines NI 8289 and CPAN 1910 were used
as resistant sources, and UP 262 and
HUW 234 as agronomic parents
susceptible to leaf blight. The F1 progeny
was grown during 1992/93, inoculated
with a spore suspension of B. sorokiniana,and disease observations recorded. TheF1s, F2s, and their parents were grown
again during 1993/94 to study the modeof inheritance of resistance. All were
inoculated with a spore suspension of B.sorokiniana and disease developmentobservations were recorded. Based on
observations of individual F2 plants, the
mode of segregation was tested using the
Chi-square test:
x2 = L (O-E)2E
where 0 is the observed frequency, and Eis the expected frequency in anyparticular distribution class.
Results and Discussion
Results presented in Table 1 indicatethat the 13 genotypes (PATO(R)/3/TZPP/SN64/ /NAR, VEE"S", BOW"S",
KVZ/BON, BJY"S"/ /TOB/CHA, PF70354/YACO"S", HD 2206/HORK"S",DL 153-2, HS 284, NI 8289, BW 1052, BW
11259, and CPAN 1910) were found to beconsistently resistant during the three
years of testing. Among the remaininggenotypes, 21 were moderately resistant;
48, moderately susceptible; IS,
susceptible; and 5, highly susceptible. No
entry was found to be free from foliarblight during the testing.
Observations shown in Table 2indicate that all F1 plants in the three
crosses (NI 8289/UP 262, CPAN 1910/UP
262, and NI 8289/HUW 234) were highly
susceptible to leaf blight and were
comparable to the susceptible parents UP
262 and HUW 234.

Identification and Inheritance of Resistance to Foliar Blight of Wheat 261
Data shown in Table 3 indicate that in
the F2 generation, the segregation in allthree crosses followed a 1 (resistant):15
(susceptible) ratio. This suggests that
inheritance of blight is controlled by twomajor gene loci. Further, it was evident
that resistance was controlled by two
pairs of recessive genes.
Screening under artificial conditions
provides the best means for identifyingresistance sources, as it ensures sufficientdisease pressure to distinguish between
resistant and susceptible types.Furthermore, if the testing continues over
years and disease response remains
constant, results can be confirmed. In thepresent case, testing was performed for
three years under artificial epiphytotics
which helped to clearly categorize the 102genotypes into resistance grades.
Genotypes such as PATO (R)/3/TZPP/
SN 64/ /NAR, VEE"S", BOW"S", KVK/BON, BJY"S" / /TOB/CHA, PF 70354/YP-CO"S", HD 2206/HORK"S", DL 153
2, HS 284, NI8289, BW 1052, BW 11259,and CPAN 1910, which constantly scored
1-3 on the Saari Prescott scale, are clearly
resistant and could be utilized as parentallines harboring blight resistance.
Table 1. Foliar blight resistance reaction of 102 wheat genotypes over three years.
Category
Resistant
Score' (0-9) No. of entries Genotypes number/name
1-3 13 PATO(R)/3/TZPP SN 64 X NAR, VEE"S", BOW"S",KVZ,lBON, BJY"S"/ITOB/CHA, PF 70354/yACO"S",HD 2206//HORK"S", DL 153-2, HS 284, NI8289,BW 1052, BW 11259, and CPAN1910
Moderately resistantModerately susceptibleSusceptibleHighly susceptible
1 Saari Prescott scale.
45and 67 and 8
9
2148155
Table 2. Disease scores observed on F1 progenies of three crosses using the 0-9 Saari Prescott scale forassessment of foliar blight intensity.
After inoculationCross Before inoculation I observation II observation
N18289/UP 262CPAN 1910/UP 262N18289/HUW 234
344
787
899
Table 3. Distribution of resistant/susceptible plants in the F2 generation.
Pvalue Mode of inheritanceCrosses Resistant Susceptible (X2) (ratio)
N18289/ UP 262 24 292 0.50-0.30 1:15CPAN 1910/UP 262 19 269 0.90-0.80 1:15NI 8289/HUW 234 21 272 0.70-0.50 1:15
262 D. Singh 9/ al.
Similarly, highly susceptible genotypes
such as HD 2329, Sonalika, Bansi, A-9-30
1, and HD 2285 could be used as
susceptible checks.
The identification of resistance donors
is only the first step in breeding for
resistant varieties. The most important
aspect is the knowledge of the inheritance
of resistance, and unfortunately little is
known about the inheritance of foliar
blight caused by B. sorokiniana. The
current study, involving three different
crosses, indicated that two major
recessive genes are responsible for
resistance to foliar blight caused by B.
sorokiniana. Earlier studies on resistance
to foliar blight caused by A. triticina also
indicated a similar nature of inheritance
(Narula and Srivastava 1971; Sokhi 1971).
References
Kulkarni, G.S. 1924. Report of the workdone in Plant Pathology section duringthe year 1922-23. Annual Report,Department of Agriculture, BombayPresidency for the year 1922-23, pp. 16771.
McRae, W. 1924. Economic Botany, Part III:Mycology. Annual Report, BoardScientific Advice, India, 1922-23, pp. 3135.
Narula, PN., and a.p. Srivastava. 1971.Genetics of Alternaria resistance inwheat. Indian J Genet 31:105-107.
Saari, E.E., and J.M. Prescott 1975. A scalefor appraising the foliar intensity ofwheat diseases. Plant Dis Reptr 59:377388
Singh, R.V., Singh, A.K., and S.P. Singh 1992.Distribution of foliar blight of wheatpathogens in India. In: Proceedings ofthe 44th Annual Meeting of the IndianPhytopathological Society, 45: LXVL.
Sokhi, S.S. 1971. Studies on leaf blight ofwheat caused by Alternaria triticina withspecial reference to the diseaseresistance. Ph.D. thesis, LA.R.L, NewDelhi.
263
Root Rot of Wheat: Inoculation andScreening Techniques, Yield LossAssessment, and Germplasm Evaluation
M. Mergoum\ }.S. Quick2,}. HilF, N. Nsarellah3, M. Nachit1, and W.H. Pfeiffer1
1 CIMMYT, Mexico, D.E, Mexico
2 Colorado State University, Agronomy Department, Fort Collins, CO, USA
3 INRA, CRRA de Chaouia, Abda et Doukkala, Settat, Morocco
Abstract
The effects of root rot inoculation on the agro-physiological traits ofwheat were evaluated inlaboratory/greenhouse and field experiments in Colorado and Morocco during 1986-1990.Under laboratory/greenhouse conditions, inoculated adult plants had significantly lower leafrelative water content, reduced plant height, fewer tillers, and higher cell ion leakage comparedwith non-inoculated plants. Wheat genotypes differed significantly for most traits studied.Genotypes C0840186 and Sandy were the most susceptible and tolerant to root rot,respectively. At Colorado, in early planting trials, root rot severity, measured by average rootrot score (ARRS) and white heads (WH), was significantly higher compared with normalplanting. Genotypes significantly differed for grain yield, test weight, and reaction to root rot.Seeding rates and inoculation with Fusarium acuminatum and Cochliobolus sativus didnot significantly affect disease development; C0840186 was most affected. Seed treatment withimazalil and Trichoderma harzianum did not inhibit disease development. WH due to root rotwas, in general, a more accurate measure ofroot rot severity than ARRS to differentiate betweengenotypes under Colorado field conditions. Under Moroccan conditions, N level had nosignificant effect on disease epidemics. From February to April, 1989/90, high root rot incidence(WH percentage) after seed inoculation with a spore suspension coincided with severe drought.Inoculation significantly reduced grain yield and kernel weight, and increased WH percentageofboth durum and bread wheat cultivars. Durums were generally more affected by inoculationthan bread wheats for all studied traits.
Root rot, foot rot, crown rot, pink root,culm rot, and stalk rot are all terms used
to describe a group of wheat diseases
caused by one or more organisms, aloneor in association (Burgess et al. 1975).
Common root rot has been reported in
most cereal growing areas of the world.Root and foot rots can be important
diseases worldwide; however, the
occurrence and frequency of causal agents
vary regionally (Fernandez et al. 1985;
Lyamani 1988). Damage caused by root
rot pathogens depends on the amount of
inoculum present, cultural practices, andsoil and climatic factors (Statler and
Darlington 1972; Tinline 1986;
Wildermuth and McNamara 1991).
Typical disease symptoms include
discoloration, and necrosis or rotting of
roots, subcrown internodes, crown and/
264 M. Margoum at al.
or the stem base (Sallans 1965; Watkins
and Kerr 1980; Stack 1982). Under severe
disease pressure, symptoms such as
stunting, late death tillers, and premature
ripening and bleaching of spikes, known
as "white heads" (WH) or "dead heads",
may occur (Scardaci and Webster 1982;
Satck 1982; Lyamani 1988; Mergoum 1990,
1991).
Root rot can be caused by one or
several pathogens, alone or in
combination (Statler and Darlington
1972): Cochliobolus sativus (Ito &
Kuribayashi) Drechsler ex Dastur
(conidial stage =Helminthosporiumsativum Pammel, King & Bakke, syn.
Bipolaris sorokiniana (Sacc. in Sorokin
Shoemaker» (Verma et al. 1976; Specht
and Rush 1988), Fusarium culmorum (W.G.
Smith) Sacc., Fusarium graminearumSchwabe, and Fusarium avenacum (Cook
1980; Saari and Wilcoxon 1984; Dodman
and Wildermuth 1987).
Root rot is a persistent and
inconspicuous disease that reduces
seedling vigor and impairs the
functioning of roots and crowns, resulting
in stand loss, reduced yield, and lower
grain quality (Fenster et al. 1972;Mergoum 1990). Number of tillers per
plant and number of kernels per spike
appear to be the yield components most
affected by root rot. Protein content seems
to be only slightly affected by root rot
(Ismail and Michalik 1980). Plants can
recover from initial stunting due to early
infection by root rot pathogens if
favorable environmental conditions
prevail later (Sallans 1959). Recovery
from F. culmorum infection is less marked
than from C. sativus infection and is
cultivar dependent. Simultaneous
infection of wheat seedlings by both F.culmorum and C. sativus causes more
initial stunting and is followed by a
stronger recovery than with either
pathogen alone (Sallans, 1965). When
severe damage occurs in the crown, plants
will not recover, even under optimum
environmental conditions. Recovery
depends on damage of crown tissue
(Fenster et al. 1972).
This paper summarizes the work that
has been conducted on root rot diseases
under field conditions and in the
laboratory and greenhouse in Morocco
and Colorado (USA) during the last
decade. The main results reported in this
paper relate to: 1) inoculation and
evaluation techniques of root rot, 2)
effects of the disease on wheat under
different water regimes and N levels, and
3) wheat germplasm evaluation in
Morocco.
Inoculation
Selection of resistant cultivars to root
rot pathogens has been hindered by
inadequate and inconsistent inoculation
methods, and lack of accurate and
suitable techniques for measurement of
disease response. In this paper, two (seed
and seed/soil inoculations) and one
(seedling inoculation with a single
germinated macroconidia) inoculation
methods were used for field and
greenhouse experiments, respectively.
Fusarium spp. (F. acuminatum or F.culmorum) were isolated 'on potato

Root Rot of Wheat: Inoculation and Screening Techniques. Yield Loss Assessment. and Germplasm Evaluation 265
dextrose agar (PDA). Isolates were then
grown on water agar containing carnation
leaves to induce macroconidium
production. After six days, a piece of
carnation leaf was placed ina test tube
containing sterile water and then shaken.
Two ml of conidial suspension were
added to a test tube containing 10 ml ofsterile water, thoroughly mixed, and 2 ml
were placed in petri dishes containing
water agar. The dilution procedure was
repeated three to five times. Petri dishes
were incubated at room temperature
under continuous light for one to two
days to allow spore germination. Single,
isolated and germinated macroconidia
were cut out of the agar with a sterile
needle under a binocular microscope
(lOOx) and used to inoculate seedlings.
Seedling inoculation was performed by
placing the macroconidia on the largest
root of each vernalized seedling. One-halfof the seedlings were inoculated.'After
four days, all seedlings were transplanted
to 15 x 20 em pots containing steamed
soil, peat, and vermiculite in a ratio of
2:2:1 (three plants per pot) and incubated
in the greenhouse.
One Fusarium spp. isolate and one C.
sativus isolate were separately cultured on
PDA for 15 days at room temperature
(20°C). After 15 days, distilled sterile
water was added to the petri dishes,
spores and mycelia were gently scraped
off the plates into a 250 ml flask
containing 200 ml distilled water, and
flasks were shaken. The solution was
filtered through sterilized cheesecloth.
The spore suspension was adjusted to 106
spores per ml and used for wheat seed
inoculation in the field trial. The fungal
suspension (200 ml) and 2 kg of seeds
were mixed in a plastic bag for 4 to 5 min.
Seeds were dried at room temperature for
48 h, placed in paper bags, and planted
one week later.
In addition, one Fusarium spp. isolate
grown on PDA medium was used to
infest autoclaved barley or oat seeds.
Barley or oat seeds (200 g) were immersed
in sterile water in a flask and autoclaved
for 30 minutes at 103°C. Barley or oat
substrate, inoculated with Fusarium, was
incubated at room temperature. After
three weeks incubation, barley seeds were
removed from the flasks, dried at room
temperature for four days, chopped into
1-3 mm chunks, sprayed with a C. sativusspore suspension (106 spores per ml), andmixed with wheat seed (200 g kg-I).
Disease Evaluation
Many scoring techniques have been
used for root rot diseases (Dodman and
Wildermuth 1985, 1987; Lyamani 1988;
Kommedahl and Patel 1966; Harding
1971; Hill'et ai. 1987; Mergoum 1991;
Armitage 1984; Ismail and Michalik 1980),
but are not effective for differentiating
small quantitative differences in disease
resistance among genotypes. Disease
incidence and severity and subcrown
internode discoloration have also been
used for disease assessment since the
above ground symptoms are seldom
observed (Ledingham et ai. 1973; Piening
1973; Mergoum 1991).
In our studies, root rot severity was
evaluated by assessing percent premature
ripening and "white heads" (WH) or

266 M. Mergoum 9/ a/.
"dead heads" and average root rot score
(ARRS). ARRS is based on subcrown
internode discoloration according to a 0-4
scale. ARRS was used to evaluate 20
plants in the 1987/88 experiments. WH
percentage was used in 1988/89 in
Colorado, and in 1988/89 and 1989/90 in
Morocco. In Colorado experiments,
treatments were seed density, planting
date, inoculation, chemical (imazlil) and
biological control (Trichoderma); in
Morocco treatments included inoculation,
water regime, and N level.
Average root rot scoreIn Colorado experiments (1987/88),
ARRS was significantly higher in early
planting than normal planting trials.
ARRS was significantly different among
cultivars for both early and normal
planting dates (Table 1). Significant ARRS
differences between treatments were also
detected within cultivars. In early
planting, the lowest ARRS was attributed
to Trichoderma for both C0840186 and
Sandy. In the normal planting date
experiment, ARRS was very low «1), but
treatments were also significantly
different for both C0840186 and Sandy.
The lowest ARRS was consistently
recorded on the Trichoderma treatment for
both .cultivars in addition to imazalil
treatment for C0840186.
Although significant differences
between cultivars and treatments were
detected, correlation coefficients between
ARRS, grain yield, and grain test weight
were, in general, not significant. Thus,
root rot evaluation based on ARRS is not
considered very reliable under our
conditions. Previous studies also showed
variable correlations between yield
reduction and similar root rot disease
evaluation methods (Piening 1973; Tinline
and Ledingham 1979). Other disease
scoring techniques also yielded
inconsistent results (Kommedahl and
Patel 1966; Harding 1971; Armitage 1984;
Ismail and Michalik 1980). The percentage
Table 1. Grain yield (GY), volume weight (VW). and root rot scores IARRS) of wheat cultivars Sandy andC0840186 grown at Julesburg. Colorado. USA, 1987188.
Early planting Normal plantingGY VW ARRS GY VW ARRS
Genotype Treatment' (kg ha") (kg m,3) (0-5) (kg ha") (kg m,3) (0-5)
C0840186 1m. 155 196 1.3 1945 762 0.1Tr. 0 0 0.5 2160 807 0.1Im.tTr. 0 0 1.1 2160 790 0.3In. 0 0 0.9 2302 802 0.580G 332 190 0.9 2641 823 0.340G 0 0 1.2 1821 756 0.2
Sandy 1m 5182 877 0.7 5970 883 0.4Tr. 4652 876 0.5 5741 878 0.1Im.tTr. 5950 882 0.9 5706 904 0.2In. 5614 894 1.7 5674 888 0.780G 6446 892 1.5 6202 901 0.640G 5245 889 0.9 5661 881 0.2
Means 2798 475 1.0 3999 840 0.3LSD (P<0.05) 1103 134 0.7 905 40 0.2
11m. =Imazalil; Ir. =Trichoderma; In. =Inoculated lseed/soil inoculation); 40G =40 9seed per plot (check); BOG =BO 9seed per plot (double normal seed rate).
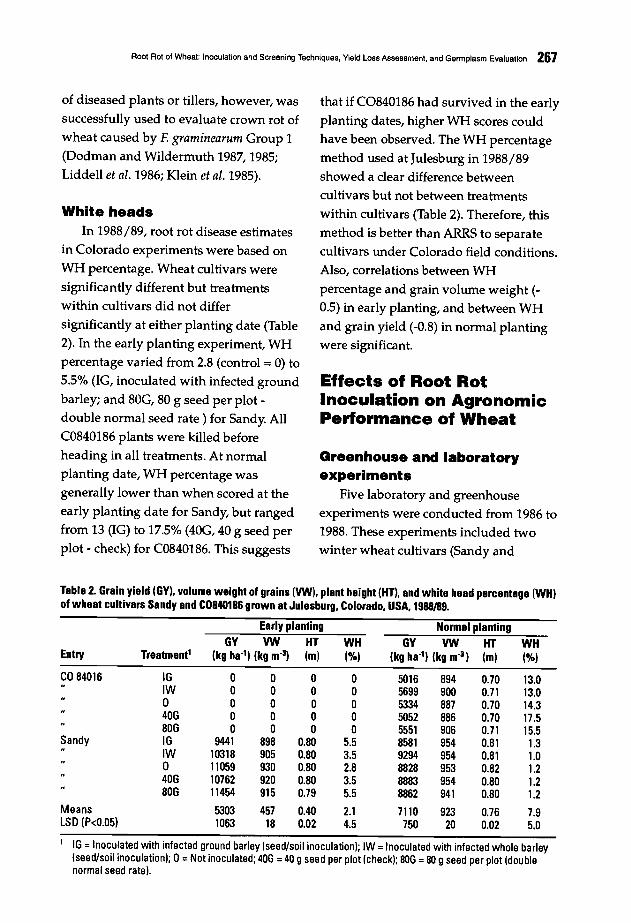
Root Rot of Wheal: Inoculation and Screening Techniques, Yield Loss Assessment, and Germplasm Evaluation 267
of diseased plants or tillers, however, was
successfully used to evaluate crown rot of
wheat caused by F. graminearum Group 1
(Dodman and Wildermuth 1987, 1985;
Liddell et al. 1986; Klein et al. 1985).
White headsIn 1988/89, root rot disease estimates
in Colorado experiments were based on
WH percentage. Wheat cultivars were
significantly different but treatments
within cultivars did not differ
significantly at either planting date (Table
2). In the early planting experiment, WH
percentage varied from 2.8 (control = 0) to
5.5% (IG, inoculated with infected ground
barley; and 80G, 80 g seed per plot
double normal seed rate) for Sandy. All
C0840186 plants were killed before
heading in all treatments. At normal
planting date, WH percentage was
generally lower than when scored at the
early planting date for Sandy, but ranged
from 13 (IG) to 17.5% (40G, 40 g seed per
plot - check) for C0840186. This suggests
that if C0840186 had survived in the early
planting dates, higher WH scores could
have been observed. The WH percentage
method used at Julesburg in 1988/89
showed a clear difference between
cultivars but not between treatments
within cultivars (Table 2). Therefore, this
method is better than ARRS to separate
cultivars under Colorado field conditions.
Also, correlations between WH
percentage and grain volume weight (
0.5) in early planting, and between WH
and grain yield (-D.8) in normal planting
were significant.
Effects of Root RotInoculation on AgronomicPerformance of Wheat
Greenhouse and laboratoryexperiments
Five laboratory and greenhouse
experiments were conducted from 1986 to
1988. These experiments included two
winter wheat cultivars (Sandy and
Table 2. Grain yield (GY). volume weight of grains (VW), plant height (HT), and white head percentage (WH)of wheat cultivars Sandy and C0840186 grown at Julesburg, Colorado. USA. 1988/89.
Early planting Normal planting
GY VW HT WH GY VW HT WHEntry Treatment' (kg ha") (kg m,3) (m) (Ofo) (kg ha") (kg m,3) (m) (Ofo)
CO 84016 IG 0 0 0 0 5016 894 0.70 13.0IW 0 0 0 0 5699 900 0.71 13.00 0 0 0 0 5334 887 0.70 14.340G 0 0 0 0 5052 886 0.70 17.580G 0 0 0 0 5551 906 0.71 15.5
Sandy IG 9441 898 0.80 5.5 8581 954 0.81 1.3IW 10318 905 0.80 3.5 9294 954 0.81 1.00 11059 930 0.80 2.8 8828 953 0.82 1.240G 10762 920 0.80 3.5 8883 954 0.80 1.280G 11454 915 0.79 5.5 8862 941 0.80 1.2
Means 5303 457 0.40 2.1 7110 923 0.76 7.9LSD (P<0.05) 1063 18 0.02 4.5 750 20 0.02 5.0
1 IG =Inoculated with infected ground barley lseed/soil inoculation); IW =Inoculated with infected whole barley(seed/soil inoculationl; 0 =Not inoculated; 406 =40 g seed per plot (check); 80G =80 g seed per plot (doublenormal seed rate).

268 M. Mergoum e/a/.
C0840186) considered resistant and
susceptible, respectively, to common
dryland root rot under Colorado field
conditions (Quick 1986, personal
communication), two inoculation
treatments (inoculated vs. non
inoculated), and two water stress
treatments (stressed vs. irrigated). The
water stress treatment was similar in all
experiments, except one, where all plants
were grown under full irrigation until
tillering (6, Feekes' scale) (Large 1954)
before irrigation was stopped in stressed
plots. Samples of three plants per
treatment were collected at 3-day
intervals.
Seedling survival was assessed one
week after transplanting plants to pots;
plant infection and height were recorded
at heading (10, Feekes' scale), relative
water content (RWC) of the flag leaf was
scored, and ion leakage (IL) was
measured based on electrical
conductivity.
Plant tiller number and heightSeedling inoculation with a single
germinated F. acuminatum
macroconidium significantly reduced
number of tillers per plant and height,
particularly under water stress (Table 3).
Under full irrigation, number of tillers
per plant was significantly reduced by F.
acuminatum inoculation from 4.2 to 3.9
and 3.9 to 2.9 for C0840186 and Sandy,
respectively. Under water stress, tiller
number was reduced more drastically
from 4.0 to 3.7 and 3.4 to 1.9 for Sandy
and C0840186, respectively. This is in
agreement with other results (Piening
1973; Ledingham et ai. 1973; Verma et ai.
1976; Grey et ai. 1991). Similarly, root
Table 3. Trait means of two wheat cultivars grown in the greenhouse under two root rot inoculationtreatments (Fusarium acuminatuml. 1986-1988.
Sandy CO 84018Full LSD Full LSD
Trait Inoculation irrigation Stressed (P<o.051 irrigation Stressed (P<O.051
Seedling survival ('Yo) Inoculated 70 35Control 75 74LSD (P<0.05) 15 15
Plant infection ('Yo) Inoculated 56 83 14 73 97 14Control 5 7 14 4 9 14LSD IP<0.05) 11 11 11 11
Plant height (m) Inoculated 0.60 0.43 0.07 0.62 0.39 0.07Control 0.65 0.47 0.07 0.66 0.45 0.07LSD (P<0.05) 0.03 0.03 0.03 0.03
Tiller number/plant Inoculated 3.9 3.7 0.2 2.9 1.9 0.2Control 4.2 4.0 0.2 3.9 3.4 0.2LSD (P<0.05) 0.4 0.4 0.4 0.4
Relative water content ('Yo) Inoculated 52 44 6 41 29 6Control 60 55 6 53 50 6LSD (0.05) 4 4 4 4
Electric conductivity Inoculated 1.57 2.84 0.35 1.67 3.24 0.35(micromho) Control 0.98 1.40 0.35 1.32 1.32 0.35
LSD IP<0.05) 0.30 0.30 0.30 0.30
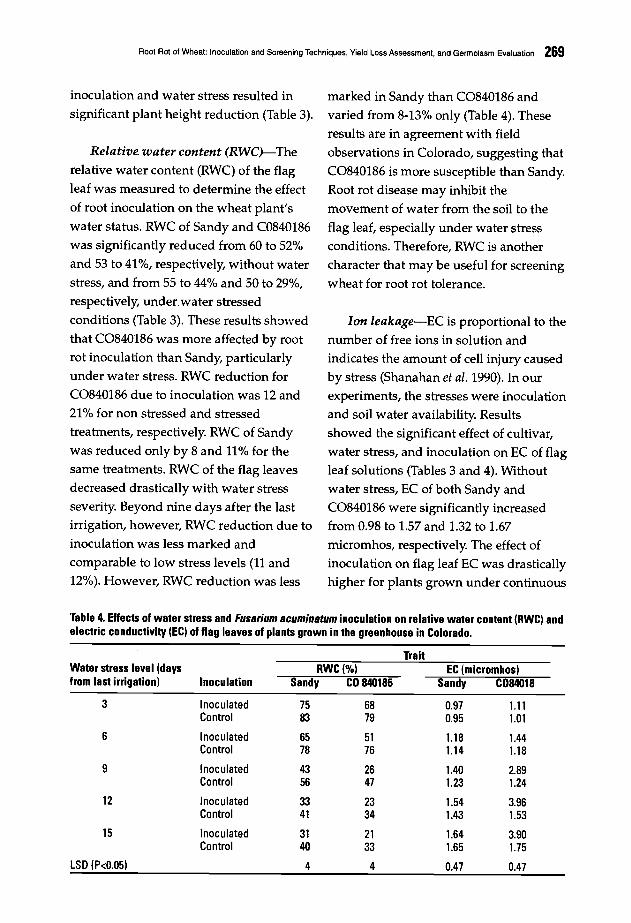
Root Rot of Wheat: Inoculation and Screening Techniques, Yield Loss Assessment, and Germplasm Evaluation 269
inoculation and water stress resulted in
significant plant height reduction (Table 3).
Relative water content (RWC)-The
relative water content (RWC) of the flag
leaf was measured to determine the effect
of root inoculation on the wheat plant's
water status. RWC of Sandy and C0840186was significantly reduced from 60 to 52%
and 53 to 41%, respectively, without water
stress, and from 55 to 44% and 50 to 29%,respectively, underwater stressed
conditions (Table 3). These results sh:>'Ned
that C0840186 was more affected by rootrot inoculation than Sandy, particularlyunder water stress. RWC reduction for
C0840186 due to inoculation was 12 and21% for non stressed and stressedtreatments, respectively. RWC of Sandy
was reduced only by 8 and 11% for thesame treatments. RWC of the flag leaves
decreased drastically with water stressseverity. Beyond nine days after the lastirrigation, however, RWC reduction due to
inoculation was less marked andcomparable to low stress levels (11 and12%). However, RWC reduction was less
marked in Sandy than C0840186 and
varied from 8-13% only (Table 4). Theseresults are in agreement with field
observations in Colorado, suggesting that
C0840186 is more susceptible than Sandy.Root rot disease may inhibit the
movement of water from the soil to the
flag leaf, especially under water stressconditions. Therefore, RWC is another
character that may be useful for screening
wheat for root rot tolerance.
Ion leakage-EC is proportional to the
number of free ions in solution andindicates the amount of cell injury caused
by stress (Shanahan et al. 1990). In ourexperiments, the stresses were inoculationand soil water availability. Results
showed the significant effect of cultivar,
water stress, and inoculation on EC of flagleaf solutions (Tables 3 and 4). Withoutwater stress, EC of both Sandy andC0840186 were significantly increasedfrom 0.98 to 1.57 and 1.32 to 1.67
micromhos, respectively. The effect ofinoculation on flag leaf EC was drastically
higher for plants grown under continuous
'rable 4. Effects of water stress and Fus8rium Bcumin8tum inoculation on relative water content (RWC) andelectric conductivity (EC) of flag leaves of plants grown in the greenhouse in Colorado.
TraitWater stress level (days RWC(%) EC hnicromhos)from last irrigation) Inoculation Sandy CO 840186 Sandy C084018
3 Inoculated 75 68 0.97 1.11Control 83 79 0.95 1.01
6 Inoculated 65 51 1.18 1.44Control 78 76 1.14 1.18
9 Inoculated 43 26 1.40 2.89Control 56 47 1.23 1.24
12 Inoculated 33 23 1.54 3.96Control 41 34 1.43 1.53
15 Inoculated 31 21 1.64 3.90Control 40 33 1.65 1.75
LSD (P<0.05) 4 4 0.47 0.47
270 M. Mergoum 9t al.
water stress, particularly for C0840186.
With varying water stress, significant ECdifferences between both cultivars were
observed as a result of inoculation (Table
4). Under moderate water stress,inoculation by the root rot pathogen did
not significantly affect EC of both
cultivars. Severe water stress (>9 dayssince last irrigation), however, caused
significant EC differences betweeninoculated and control plants for
C0840186 only (Table 4). These results
show another aspect of root rot tolerancein cultivar Sandy and suggest that EC ispossibly useful to separate wheat
genotypes with respect to root diseasetolerance.
Field Experiments
Colorado (USA)Field experiments on root rot were
conducted in 1987/88 and 1988/89Gulesburg, Colorado, USA) to determine
the effect of F. acuminatum inoculation onseveral characteristics of wheat, as well asthe role of seeding rate, sowing date, and
seed treatment on disease development.
Grain yield-Genotypes significantlydiffered in grain yield in all field
experiments (Tables 1 and 2). In the early
planting experiments, C0840186 did notproduce any grain because of root rot,
except in 1987/88 when treated with
fungicide or when seed rate was doubled(Tables 1 and 2).
In 1987/88, the double seed rate
produced higher yields than other
treatments at both planting dates. For thenormal sowing time, grain yield
significantly differed between cultivars;
differences between treatments were onlyfound for C0840186.
In 1988/89, wheat grain yield wassignificantly different at both plantingdates. In the early planting trial, yield
was significantly different for Sandy, andC0840186 was not harvested due to total
destruction by root rot.
Although significant differences
occurred between both cultivars for grain
yield, the effect of treatments on grainyield, including inoculation, were
variable at both planting dates in bothyears. Using a doubled seed rate,however, produced significantly higher
grain yields. The effects of F. acuminatuminoculation in the experiments were notsupported by previous works in the USA(Hill and Fernandez 1983; Stack 1982;Grey et al. 1991), Canada (Ledingham etal. 1973; Piening et al. 1976; Verma et al.1976; Tinline and Ledingham 1979),Australia (Dodman and Wildermuth1985; Wearing and Burgess 1977), and
Brazil (Luz 1984).
Volume weight ofgrain-Wheat
genotypes significantly differed in grainvolume weight (VW) for both planting
dates and seasons (Tables 1 and 2). In
1987/88, only C0840186 showedsignificant differences in grai~VW at
both planting dates. At normal planting,VW was 756 and 823 kg m-3 for normal
and double seed rate treatments,
respectively. VW of Sandy was
significantly higher in most cases, but
was not significant at both planting dates.

Root Rot of Wheat: Inoculation and Screening Techniques, Yield Loss Assessment, and Germplasm Evaluation 271
In 1988/89, although the two cultivars
significantly differed for VW at both
planting dates, significant differences for
treatments were only observed for Sandy
at the early planting date.
Results indicated, in general, no
significant effect of F. acuminatuminoculation on VW. This is probably due
to the presence of root rot pathogens in
the soil which infected plants in non
inoculated plots. Other studies on the
effect of root rot on VW, however,
reported negative effects of the disease on
VW (Sims et ai. 1961; Ledingham et ai.1973; Verma et ai. 1976; Weise 1977).
Plant height-Plant height was
examined in 1988/89. Significant
differences between genotype were
observed (Table 2); however, treatments
within genotypes did not significantly
affect plant height. Field results
contrasted with those from the
greenhouse (Table 3).
Chemical and biological control-The
effects of imazalil and Trichodermaharzianum on F. acuminatum were
examined in the field during 1987/88 only
(Table 1). Compared to the checks and
other treatments, imazalil and Trichodermadid not reduce disease severity and did
not significantly affect grain yield or VW
(Table 1). These results confirmed that
chemical seed treatments have limited
value since infection from soilborne
pathogens can occur after the protective
period of the fungicide treatment has
ended (Watkins and Kerr 1980; Stack
1982); however, positive results have been
obtained in controlling root rot in spring
wheat with fungicides including imazalil
(Verma 1983; Verma et ai. 1986) and other
systemic fungicides (Cassini 1967, 1970;
Lyamani 1988). In other studies, Tr.harzianum was reported to have strong
control over both F. cuimorum and C.sativus (Anwar 1949; Uoti 1976).
MoroccoIn Morocco, root rot is caused mainly
by C. sativus and F. cuimorum (Baye 1984;
Lyamani 1988). Previous studies have
shown the importance of water deficit
and N fertilization effects on diseasedevelopment (Baye 1984; Mergoum 1991).
Although Moroccan plant breeders and
pathologists believe that root rot is a
serious problem for cereals, no accurate
information is available to document the
effects of root rot pathogens on wheat
under water stress and low N. Several
experiments were conducted at Sidi EIAydi and Tassaout experiment stations
during 1988/89 and 1989/90 growing
seasons to study the effect of root rot
inoculation by C. sativus and F. cuimorumon several traits of wheat.
Root rot evaluation-Percent WH
was recorded in 1988/89 and 1989/90
(Tables 5 and 6). WH scores were much
lower in 1988/89 compared to 1989/90.
WH percentage significantly varied only
for irrigation regimes and cultivars.
During 1989/90, however, WH
percentage varied with irrigation, cultivar,
and inoculation; there was a cultivar x
inoculation interaction. Cultivars showed
consistently higher WH percentages
under stressed conditions than under
irrigation in all 1989/90 field experiments
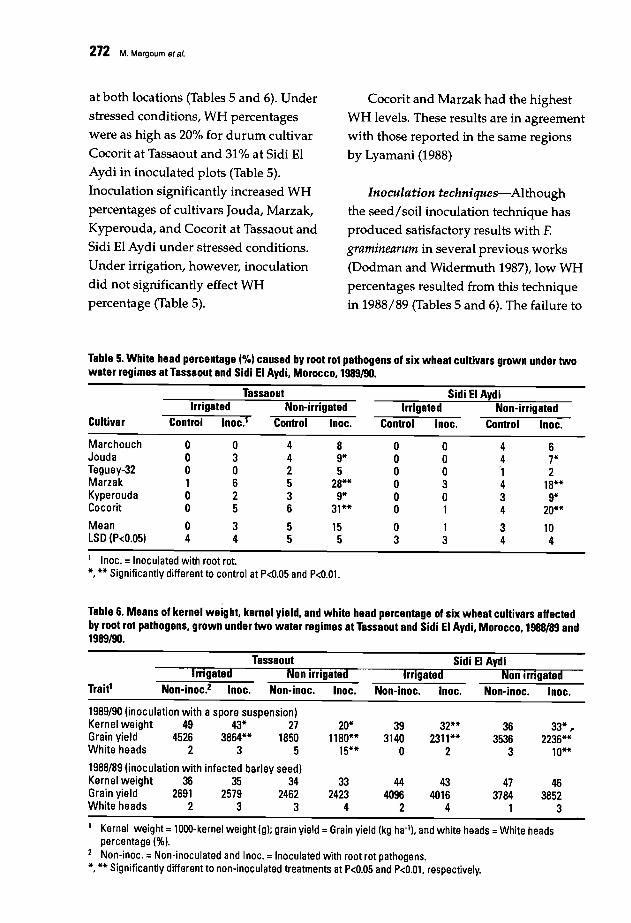
272 M. Mergoum al al.
at both locations (Tables 5 and 6). Under
stressed conditions, WH percentages
were as high as 20% for durum cultivar
Cocorit at Tassaout and 31% at Sidi EI
Aydi in inoculated plots (Table 5).
Inoculation significantly increased WH
percentages of cultivars Jouda, Marzak,
Kyperouda, and Cocorit at Tassaout and
Sidi EI Aydi under stressed conditions.
Under irrigation, however, inoculation
did not significantly effect WH
percentage (Table 5).
Cocorit and Marzak had the highest
WH levels. These results are in agreement
with those reported in the same regions
by Lyamani (1988)
Inoculation techniques-Althoughthe seed/soil inoculation technique has
produced satisfactory results with F.
graminearum in several previous works
(Dodman and Widermuth 1987), low WH
percentages resulted from this technique
in 1988/89 (Tables 5 and 6). The failure to
Table 5. White head percentage (%) caused by root rot pathogens of six wheat cultivars grown under twowater regimes at Tassaout and Sidi EI Aydi. Morocco. 1989/90.
Tassaout Sidi EIAydiIrrigated Non-irrigated Irrigated Non-irrigated
Cultivar Control Inoc.l Control Inoc. Control Inoc. Control Inoc.
Marchouch 0 0 4 8 0 0 4 6Jouda 0 3 4 9* 0 0 4 7*Teguey-32 0 0 2 5 0 0 1 2Marzak 1 6 5 28** 0 3 4 18**Kyperouda 0 2 3 9* 0 0 3 9*Cocorit 0 5 6 31** 0 1 4 20**
Mean 0 3 5 15 0 1 3 10LSD (P<0.05) 4 4 5 5 3 3 4 4
1 Inoc. =Inoculated with root rot.*. ** Significantly different to control at P<0.05 and P<O.01.
Table 6. Means of kernel weight. kernel yield, and white head percentage of six wheat cultivars affectedby root rot pathogens. grown under two water regimes at Tassaout and Sidi EI Aydi. Morocco, 1988/89 and1989/90.
Tassaout Sidi EI AydiIrrigated Non irrigated Irrigated Non irrigated
Trait' Non-inoc.2 Inoc. Non-inoc. Inoc. Non-inoc. Inoc. Non-inoc. Inoc.
1989/90 (inoculation with a spore suspension)Kernel weight 49 43* 27 20* 39 32** 36 33* ,.Grain yield 4526 3864** 1850 1180** 3140 2311** 3536 2236**White heads 2 3 5 15** 0 2 3 10**
1988/89 (inoculation with infected barley seed)Kernel weight 36 35 34 33 44 43 47 46Grain yield 2691 2579 2462 2423 4096 4016 3784 3852White heads 2 3 3 4 2 4 1 3
1 Kernel weight = 1000-kernel weight (g); grain yield =Grain yield (kg ha-11. and white heads =White headspercentage (%j.
2 Non-inoc. =Non-inoculated and Inoc. =Inoculated with root rot pathogens.*. ** Significantly different to non-inoculated treatments at P<0.05 and P<O.01. respectively.

Root Rot of Wheat: Inoculation and Screening Techniques, Yield Loss Assessment, and Germplasm Evaluation 273
obtain adequate levels of root rot
symptoms could be due to environmental
conditions rather than the inoculation
technique. At Sidi El Aydi, average air
temperature was similar in both years
and total rainfall was 341 and 326 mm in
1988/89 and 1989/90, respectively.
However, rainfall distribution drastically
differed, particularly during February to
April; whereas 168 mm of rainfall
occurred during this period in 1988/89,
only 84 mm were recorded in 1989/90. At
Tassaout, average air temperature and
total rainfall were comparable and had
similar distribution patterns to that of
Sidi El Aydi in both seasons. The
inoculation technique was modified in
1989/90 by treating wheat seed with a
spore suspension of the pathogens. This
enabled an average WH percentage of
31% to be obtained on durum wheat
Cocorit at Tassaout under the non
irrigated regime (Table 5).
Effects ofN-In general, N
fertilization did not effect root rot
development. At Sidi EI Aydi, this was
possibly due to the high level of residual
N in the soil from heavy applications in
previous years. At Tassaout, however, the
soils were relatively N deficient. These
results are in agreement with some
previous reports (Sims et al. 1961;
Broscious and Frank 1986) but conflict
with others that demonstrate that root rot
severity is enhanced by high N levels
(Baye 1984; Smiley et al. 1972). Excess N
normally promotes growth and increases
transpiration of plants, resulting in
depletion of soil moisture (Papendick and
Cook 1974; Cook 1980).
Effects on grain-Inoculation
treatments did not significantly affect
yield in 1988/89. In 1989/90, however,
inoculation, cultivar, and inoculation x
cultivar interaction effects were
significant for grain yield.
Grain yield reduction caused by
inoculation was higher under the limited
water regime than under irrigated
conditions (Tables 6 and 7). Under water
stress in 1989/90, inoculation
significantly reduced average grain yield
of all cultivars by 37% (Table 7); however,
Table 7. Grain yield reduction ("Ia) caused by root rot pathogens in six wheat cultivars grown under twowater regimes at Tassaout and Sidi EI Aydi, Morocco, 1988/89 and 1989/90.
1988/89 1989/90Tassaout Sidi el Aydi Tassaout Sidi el Aydi
Cultivars Irr.' Non-in. In. Non-in. Irr. Non-in. Irr. Non-irr.
Marchouch 1 3 2 2 10* 26** 12** 25**Jouda 3 2 0 3 1 14** 23** 20**Teguey-32 0 4 1 2 19** 31** 36** 48**Marzak 3 6 5 4 33** 50** 40** 51**Kyperouda 4 4 3 5 12* 60** 27** 40**Cocorit 2 5 4 6 11* 43** 20** 41a**
Mean 2 4 2 4 14 37 26 38LSD (P<0.05) 4 6 6 7 8 9 8 10
1 Irr. =Irrigated, Non-irr. =Non-irrigated.*, ** Significantly different to non-inoculated treatments at P<O.05 and P<O.Ol, respectively.

274 M. Mergoum eta/.
under irrigation, inoculation reduced
yield by only 26 and 14%. Inoculation
greatly reduced grain yield of all
cultivars without regard to water stress at
both locations in all field experiments in
1989/90. Yield losses as high as 51 and
60% were recorded for durum wheats
Marzak and Kyperounda, respectively.
Large yield losses resulting from
inoculation by F. culmorum and C. sativus
in 1989/90 (Tables 6 and 7) showed that
durum wheat cultivars Marzak, Cocorit,
and Kyperounda were more affected than
bread wheat cultivars Jouda, Marchouch,
and Teguey-32. This is in agreement with
previous works conducted in the USA
(Hill and Fernandez 1983; Stack 1982)/
Canada (Ledingham et al. 1973; Verma et
al. 1976)/ and Australia (Wearing and
Burgess 1977).
Cultivar and N level showed
significant differences for kernel weight
under all environments in both seasons.
Inoculation had no effect on kernel
weight of cultivars. In 1989/90/ however,
Table 8. Kernel weight reduction (%) caused byroot rot pathogens in six wheat cultivars grownunder two water regimes at Tassaout and Sidi EIAydi. Morocco, 1989190.
Tassaout Sidi elAydiNon Non
Cultivars Irrigated Irrigated Irrigated Irrigated
Marchouch 1 20** 1 2Jouda 2 12* 0 2Teguey-32 4 8 3 9Marzak 8* 34** 10* 14**Kyperouda 2 28** 3 12**Cocorit 2 29** 11* 17**
Mean 3 26 4 11LSD (P<0.05) 7 11 6 10
*. ** Significantly different to non-inoculatedtreatments at P<O.05 and P<O.Ol, respectively.
inoculation and the interaction with
irrigation showed significant effects on
kernel weight. Cultivars significantly
differed for kernel weight in all field
experiments at both locations (Table 8).
Reductions of up to 34% of kernel weight
were recorded on durum wheat Marzak,
and, in general, kernel weight of durum
wheat cultivars was reduced more than
bread wheat.
References
Anwar, AA 1949. Factors affecting thesurvival of Heiminthosporium sativum andFusarium lini in soil. Phytopath 39:10051019.
Armitage, c.R. 1984. Quantitativeassessment of wheat seedling rootinfection by Fusarium acuminatum. M.S.thesis, Colorado State University, FortCollins, USA
Baye, Y. 1984. Les pourritures racinaires descereales: comportement varietal,influence de la fertilisation azotee.Memoire de troisime cycle. InstituteAgronomique et Veterinaire Hassan II,Rabat, Maroc.
Broscious, S.c./ and J.A Frank. 1986. Effectsof crop management practices oncommon root rot of winter wheat. PlantDis 70:857-859.
Burgess, L.W./ Wearing, AH., and T.AToussoun. 1975. Survey of Fusariaassociated with crown rot or wheat ineastern Australia. Aust J Agric Res26:791-799.
Cassini, R. 1967. A propos des degatsprovoques par Fusarium roseum (Link)Sn. et H. dans les cultures de cereales dubassin Parisien. Academie d'Agriculturede France. Extrait du ProcPs Verbalde laSeance du 21 Juin 1967.
Cassini, R. 1970. Sur l'importance de lacontamination des semences dansl'apparition et Ie developpement de lamaladie du pied des cereales dfe auFusarium roseum (Link) Sm. et H. Ann.Acad. Sci. Fenn. A, IV Biologica 168:2830.
Root Rot of Wheet: Inoculation and Screening Techniques, Yi~ld Loss Assessment. and Germplasm Evaluation 275
Cook, R.J. 1980. Fusarium foot rot of wheatand its control in the Pacific Northwest.Plant Dis 64:1061-1066.
Dodman, RL., and G.B. Wildermuth. 1985.Field resistance of wheat cultivars tocrown rot (Fusarium graminearum Group1). In: CA Parker, AD. Rovira, KJ.Moore, and P.T.W. Wong (eds.), Ecologyand Management of Soilborne PlantPathogens, pp. 172-3. Minnesota, USA:APS
Dodman, RL., and G.B. Wildermuth. 1987.Inoculation methods for assessingresistance in wheat to crown rot causedby Fusarium graminearum Group 1. Aust JAgric Res 38:473-486.
Fenster, CR, Boosalis, M.G., and J.L.Weihing. 1972. Date of planting studiesof winter wheat and winter barley inrelation to root and crown rot, grainyields and quality. Nebr Agric Exp ResBull 250.
Fernandez, J.A, Wofford, D.S., and J.L.Horton. 1985. Interactive effects offreezing and common root rot fungi onwinter wheat. Phytopath 75:845-847.
Grey, W.E., Engel, RE., and D.E. Mathre.1991. Reaction of spring barley tocommon root rot under several moistureregimes: Effect on yield components,plant stand, and disease severity. Can JPlant Sci 71:461-472.
Harding, H. 1971. Effect of Bipolarissorokiniana on germination and seedlingsurvival of varieties or lines of 14Triticum species. Can J Bot 49:281-287.
Hill, J.P., and J.A. Fernandez. 1983. Fungiassociated with common root rot ofwinter wheat in Colorado and Wyoming.Plant Dis 67:795-796.
Hill, J., Armitage, CR, Autzman-Eades, D.,and P. Hanchey. 1987. Surfacedisinfestation of wheat seed andinoculation of seedling roots with singlemacroconidia of Fusarium acuminatum.Plant Dis 71:130-131.
Ismail, I.M.K, and I. Michalick. 1980.Proteins and amino acids in shoots androots of some wheat cultivars before andafter infection with Helminthosporiumsativum, Pam., King et Bakke. Egypt J Bot23(3):145-160.
Klein, T.A., Liddell, CM., and L. W.Burgess. 1985. Glasshouse test fortolerance of wheat to crown rot causedby Fusarium graminearum Group 1. In:CA Parker, AD. Rovira, KJ. Moore, andP.T.W. Wong (eds.), Ecology andManagement of Soilborne PlantPathogens, pp. 172-3. Minnesota, USA:APS.
Kommedahl, T., and KP. Patel. 1966. Amethod of rating wheat varieties in thefield for resistance to common root rot.Plant Dis Rep 50(1):26-27.
Large, E.C 1954. Growth stages in cereals,illustration of the Feeke's scale. PlantPath 3:128-129.
Ledingham, RJ., Atkinson, T.G., Horricks,J.S., Mills, J.T., Piening, L.J., and RD.Tinline. 1973. Wheat losses due tocommon root rot in the prairie provincesof Canada, 1969-71. Can Plant Dis Surv53:113-122.
Liddell, CM., Burgess, L.W., and P.W.J.Taylor. 1986. Reproduction of crown rotcaused by Fusarium graminearum Group 1in the greenhouse. Plant Dis 70:632-635.
Luz, W.C da. 1984. Yield losses caused byfungal foliar wheat pathogens in Brazil.Phytopath 74(12):1403-1407.
Lyamani, A. 1988. Wheat root rot in WestCentral Morocco <}nd effects of Fusariumculmorum and Helminthosporium sativumseed and soil-borne inoculum on root rotdevelopment, plant emergence, and cropyield Ph.D. thesis, Iowa State University,Ames, USA
Mergoum, M., and J.S. Quick. 1990.Implications of root rot inoculation andnitrogen fertilization of wheat cultivarsunder varying moisture stress in WestCentral of Morocco. Agron Abstr 101,ASA, San Antonio, TX.
Mergoum, M. 1991. Effects of infection byFusarium acuminatum, Fusariumculmorum, or Cochliobolus sativus onwheat. Ph.D. thesis, Colorado StateUniversity, Fort Collins, CO, USA.
Papendick, RI., and RJ. Cook. 1974. Plantwater stress and development ofFusarium foot rot in wheat subjected todifferent cultural practices. Phytopath64:358-363.

276 M. Mergoum at al.
Piening, L.J. 1973. Differential yieldresponse of 10 barley cultivars tocommon root rot. Can J Plant Sci53(4):763-764.
Piening, L.J., Atkinson, I.G., Horricks, J.S.,Ledingham, RJ., Mills, J.I., and RD.Tinline. 1976. Barley losses due tocommon root rot in the prairie provincesof Canada, 1970-1972. Canadian Journalof Plant Disease Surveys 56:41-45.
Saari, E.E., and RD. Wilcoxson. 1974. Plantdisease situation of high-yielding dwarfwheats in Asia and Africa. Ann RevPhytopathol12:343-351.
Sallans, B.J. 1965. Root Rots of Cereals 3. TheBotanical Review 31(4):505-535.
Scardaci, S.c., and RK. Webster. 1982.Common root rot of cereals in California.Plant Dis 66:31-34.
Shanahan, J.F., Edwards, LB., Quick, J.5.,and RJ. Fenwick. 1990. Membranethermostability and heat tolerance ofspring wheat. Crop Sci. 30:247-251.
Sims, H.J., Meagher, J.w., and C.R Millikan.1961. Dead heads in wheat field studiesin Victoria. Australian Journal ofExperimental Agriculture and AnimalHusbandry 1:99-108.
Smiley, RW., Cook, RJ., and RL Papendick.1972. Fusarium foot rot of wheat and peasas influenced by soil application ofanhydrous ammonia and ammoniapotassium azide solutions. Phytopath62:86-91.
Specht, L.D., and C.M. Rush, 1988. Fungiassociated with root and foot rot ofwinter wheat and populations ofBipolaris sorokiniana in the Texaspanhandle. Plant Dis 72:959-963.
Stack, RW. 1982. Root and crown rots ofsmall grains. Cooperative ExtensionService, Ext. Circular, pp. 785, NorthDakota State University, USA.
Statler, GD., and L.c. Darlington. 1972.Resistance of hard red spring wheat anddurum wheat to seedling blight andcrown rot. Plant Dis Rep 56(9):788-792.
Tinline, RD. 1986. Agronomic practices andcommon root rot in spring wheat: Effectof depth and density of seeding disease.Can J Plant Pathol8:429-435.
Tinline, RD., and RJ. Ledingham. 1979.Yield losses in wheat and barleycultivars from common root rot in fieldtests. Can J Plant Sci 59:313-320.
Uoti, J. 1976. The effect of five Fusariumspecies on the growth and developmentof spring wheat and barley. Ann AgricFenn 15:254-262.
Verma, P.R 1983. Effect of triadimenol,imazalil, and nuarimol seed treatment oncommon root rot and grain yields inspring wheat. Can J Plant Pathol5:174176.
Verma, P.R, Morrall, RA.A., and RD.Tinline. 1976. The effect of common rootrot on components of grain yield inManitou wheat. Can J Bot 54:2888-2892.
Verma, P.R, Spurr, D.I., and F.5. Sedun.1986. Effect of triadimenol, imazalil andnuarimal seed treatment on subcrowninternode length, coleoptile-nodetillering and common root rot in springwheat. Plant and Soil 91:133-138.
Watkins, J.E., and RD. Kerr. 1980. Root andcrown rot of winter wheat. Neb GuideG80-483.
Wearing, A.H., and L.W. Burgess. 1977.Distribution of Fusarium roseumgraminearum' group 1 and its mode ofsurvival in eastern Australian wheat beltsoils. Trans Br Mycol Soc 69(3):423-442.
Wiese, M.V. 1977. Compendium of wheatdiseases. St. Paul, MN: A.P.5. 112 pp.
Wildermuth, G.B., and RB. McNamara.1991. Effects of cropping history on soilpopulations of Bipolaris sorokiniana andcommon root rot of wheat. Aust J AgricRes 41:1-10.
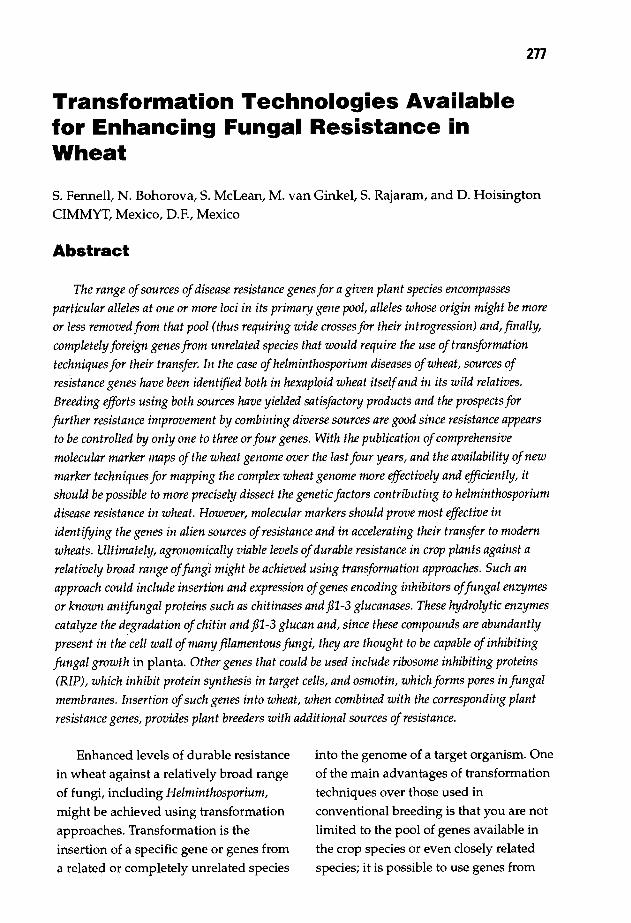
277
Transformation Technologies Availablefor Enhancing Fungal Resistance inWheat
S. Fennell, N. Bohorova, S. McLean, M. van Ginkel, S. Rajaram, and D. Hoisington
CIMMYT, Mexico, D.E, Mexico
Abstract
The range ofsources ofdisease resistance genes for a given plant species encompassesparticular alleles at one or more loci in its primary gene pool, alleles whose origin might be moreor less removed from that pool (thus requiring wide crosses for their introgression) and, finally,completely foreign genes from unrelated species that would require the use of transformationtechniques for their transfer. In the case ofhelminthosporium diseases ofwheat, sources ofresistance genes have been identified both in hexaploid wheat itselfand in its wild relatives.Breeding efforts using both sources have yielded satisfactory products and the prospects forfurther resistance improvement by combining diverse sources are good since resistance appearsto be controlled by only one to three or four genes. With the publication ofcomprehensivemolecular marker maps of the wheat genome over the last four years, and the availability ofnewmarker techniques for mapping the complex wheat genome more effectively and efficiently, itshould be possible to more precisely dissect the genetic factors contributing to helminthosporiumdisease resistance in wheat. However, molecular markers should prove most effective inidentifying the genes in alien sources ofresistance and in accelerating their transfer to modernwheats. Ultimately, agronomically viable levels ofdurable resistance in crop plants against arelatively broad range offungi might be achieved using transformation approaches. Such anapproach could include insertion and expression ofgenes encoding inhibitors offungal enzymesor known antifungal proteins such as chitinases and fll-3 glucanases. These hydrolytic enzymescatalyze the d~gradation ofchitin and fll-3 glucan and, since these compounds are abundantlypresent in the cell wall ofmany filamentous fungi, they are thought to be capable of inhibitingfungal growth in planta. Other genes that could be used include ribosome inhibiting proteins(RIP), which inhibit protein synthesis in target cells, and osmotin, which forms pores in fungalmembranes. Insertion ofsuch genes into wheat, when combined with the corresponding plantresistance genes, provides plant breeders with additional sources of resistance.
Enhanced levels of durable resistancein wheat against a relatively broad range
of fungi, including Helminthosporium,
might be achieved using transformationapproaches. Transformation is the
insertion of a specific gene or genes from
a related or completely unrelated species
into the genome of a target organism. Oneof the main advantages of transformation
techniques over those used in
conventional breeding is that you are not
limited to the pool of genes available in
the crop species or even closely related
species; it is possible to use genes from
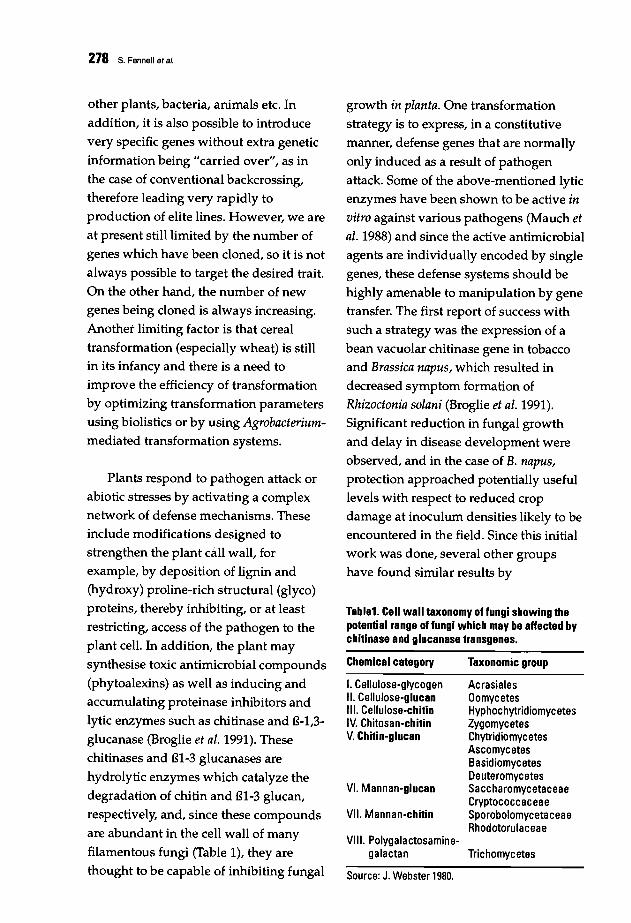
Tablet Cell wall taxonomy of fungi showing thepotential range of fungi which may be affected bychitinase and glucanase transgenes.
growth in planta. One transformation
strategy is to express, in a constitutive
manner, defense genes that are normally
only induced as a result of pathogen
attack. Some of the above-mentioned lytic
enzymes have been shown to be active invitro against various pathogens (Mauch etal. 1988) and since the active antimicrobial
agents are individually encoded by single
genes, these defense systems should be
highly amenable to manipulation by gene
transfer. The first report of success with
such a strategy was the expression of a
bean vacuolar chitinase gene in tobacco
and Brassica napus, which resulted in
decreased symptom formation of
Rhizoctonia solani (Broglie et al. 1991).Significant reduction in fungal growth
and delay in disease development were
observed, and in the case of B. napus,protection approached potentially useful
levels with respect to reduced crop
damage at inoculum densities likely to be
encountered in the field. Since this initial
work was done, several other groups
have found similar results by
278 s. Fennell at al.
other plants, bacteria, animals etc. In
addition, it is also possible to introduce
very specific genes without extra genetic
information being "carried over", as in
the case of conventional backcrossing,
therefore leading very rapidly to
production of elite lines. However, we are
at present still limited by the number of
genes which have been cloned, so it is not
always possible to target the desired trait.
On the other hand, the number of new
genes being cloned is always increasing.
Another limiting factor is that cereal
transformation (especially wheat) is still
in its infancy and there is a need to
improve the efficiency of transformation
by optimizing transformation parameters
using biolistics or by using Agrobacteriummediated transformation systems.
Plants respond to pathogen attack or
abiotic stresses by activating a complex
network of defense mechanisms. These
include modifications designed to
strengthen the plant call wall, for
example, by deposition of lignin and
(hydroxy) proline-rich structural (glyco)
proteins, thereby inhibiting, or at least
restricting, access of the pathogen to the
plant cell. In addition, the plant may
synthesise toxic antimicrobial compounds
(phytoalexins) as well as inducing and
accumulating proteinase inhibitors and
lytic enzymes such as chitinase and 15-1/3glucanase (Broglie et al. 1991). These
chitinases and 151-3 glucanases are
hydrolytic enzymes which catalyze the
degradation of chitin and 151-3 glucan,
respectively, and, since these compounds
are abundant in the cell wall of many
filamentous fungi (Table 1)/ they are
thought to be capable of inhibiting fungal
Chemical category
I. Cellulose-glycogenII. Cellulose-glucanIII. Cellulose-chitinIV. Chitosan-chitinV. Chitin-glucan
VI. Mannan-glucan
VII. Mannan-chitin
VIII. Polygalactosaminegalactan
Source: J. Webster 1980.
Taxonomic group
AcrasialesOomycetesHyphochytridiomycetesZygomycetesChytridiomycetesAscomycetesBasidiomycetesDeuteromycetesSaccharomycetaceaeCryptococcaceaeSporobolomycetaceaeRhodotorulaceae
Trichomycetes
Transformation Tachnologias Available for Enhancing Fungal Resistance in Wheat 279
transforming various antifungal genes
into a range of crop plants including
tobacco, tomato, canola, and rice which
have given enhanced resistance to a
number of fungal pathogens including
Rhizoctonia solani, Fusarium oxysporum,Cercospora nicotianae, and Cladosporumfulvum (Table 2).
Genes encoding ribosome-inactivating
proteins (RIP) are also candidates as
defense transgenes as they inhibit protein
synthesis by specific RNA N-glycosidase
modification of 28S rRNA (Endo et al.
1988). RIPs do not activate 'self'
ribosomes but show activity towards
ribosomes from distantly related species
including fungi (Endo et al. 1988; Stirpe etal. 1992). Thus, Logemann et al. (1992)have shown that expression of a barley
endosperm RIP under the control of an
inducible promoter resulted in an
increased protection of transgenic tobacco
plants against Rhizoctonia solani without
influencing plant growth.
A notable feature of plant response to
pathogen attack is the coordinative nature
of the complex network of defense,
suggesting that different protective
mechanisms may have complementary
roles in the overall expression of
resistance (Zhu et al. 1994). For hydrolytic
enzymes such as chitinases or 15-1,3
glucanases, synergistic antifungal
properties, leading to enhanced mycelial
cell wall destructions, were demonstrated
by combining these proteins in in vitroassays (Leah et al. 1991; Mauch et al.1988). In vitro synergistically enhanced
antifungal activity of other antifungal
proteins such as the barley endosperm
RIP combined with the barley class II 15
l,3-glucanase was also observed (Leah etal. 1991). The first evidence for enhanced
protection in planta was reported by Zhuet al. (1994) where co-expression of a rice
basic chitinase and an acidic 15-1,3
glucanase derived from alfalfa gave
substantially greater protection against
the pathogen Cercospora nicotianae than
either transgene alone. Similar results
were obtained in tomato Oongedijk et al.1995) where the synergistic effects of
chitinase and lS-l,3-glucanase genes gave
enhanced resistance to Fusariumoxysporum f.sp. Iycopersici. Jach et al. (1995)showed that the performance of tobacco
plants co-expressing the barley
transgenes GLU/CHI (l5-l,3-glucanase
and chitinase) or CHI/RIP (chitinase,
ribosome inhibiting protein) in a
Rhizoctonia solani infection assay were
enhanced, in terms of fungal attack, when
Table 2. Crop plants transformed with anti-fungal genes which gave enhanced resistance to a number offungal pathogens.
Crop planttransformed
TobaccoTobaccoTobacco, canolaRiceTomatoTomatoTobacco
Gene(s)
Chitinase, 13 1-3 glucanase, RIPBarley RIPBean chitinaseChitinaseChitinase, 131·3 glucanasesChitinase, 131-3 glucanasesChitinase, 131·3 glucanase
Fungal pathogenattacked
Rhizoctonia solaniRhizoctonia solaniRhizoctonia solaniRhizoctonia solaniFusarium oxysporiumCladosporum fulvumCercospora nicotianae
Reference
Jach et al. 1995Logemann et al. 1992Broglie et al. 1991Lin et al. 1995Jongedijk et al. 1995Wubben et al. 1996Zhu et al. 1994
280 s. Fennell et al.
compared with the protection levels
obtained with corresponding isogenic
lines expressing a single barley transgene
to a similar level. Preliminary infection
assays with other phytopathogenic fungi
such as Alternaria alternata and Botrytiscinerea also revealed significantly
enhanced protection against fungal attack
of GLU/CHI or CHI/RIP transgenic
tobacco lines. These result!' indicate that
the combinatorial expression of different
antifungal proteins can lead to improved
protection against a broad range of
phytopathogenic fungi. The strategy of
producing different antifungal proteins in
the same plant is not limited to the
combination of different hydrolytic
enzymes attacking fungal cell walls. It is
possible that the hydrolytic activity of
chitinase or fS71,3-glucanase could result
in an increased uptake of RIP into fungal
cells and therefore drastically enhance the
inhibition of the growth of invading fungi
Oach et ai. 1995). It is likely that this
battery of inducible defenses represents a
series of complementary mechanisms for
protection against both the initial attack
and possibly secondary, opportunistic
infections.
Other candidates\as defense
transgenes are osmotin, which forms
pores in fungal membranes, and the
antifungal peptide (AFP) from the mold
Aspergillus giganteus (Nakaya et al. 1990).Preliminary data on this AFP revealed
protection against fungal attack in piantaas well as dramatically enhanced
inhibition of fungal growth in vitro when
combined with RIP (G6rnhardt et ai.1994), suggesting further interesting
combinations of antifungal transgenes.
Defense responses such as
phytoalexin biosynthesis or lignin
deposition in the cell wall require the
action of many genes (Lamb et ai. 1989).Prospects for enhancing the expression of
such multigenic defenses depend on
either the identification of a rate
determining step or the identification of
regulatory genes that playa part in the
coordinate expression of groups of
functionally interdependent defense
genes (Lamb et ai. 1992). In addition,
confrontation of pathogens with
unfamiliar phytoalexins is potentially an
attractive strategy for enhancing
resistance. Advances are being made in
this area, but our current strategy at
CIMMYT has involved insertion of single
defense genes in combination (GLU/CHI
or CHI/RIP) to give synergistic effects
which we hope will lead to enhanced
resistance to a range of pathogenic fungi.
Early strategies for breeding for fungal
resistance were based on single genes;
however, such a single gene strategy
favored the rapid co-evolution of
resistance-breaking pathogen strains. As a
result, more recent breeding programs
have tried to achieve more durable
resistance using multigene combinations
(Rajaram et ai. 1988; Singh and Rajaram
1992). Similarly, breeding for fungal
resistance using transgeniC plants with
multigene combinations seems to be a
wise approach and may result in a
reductiol'\ of the probability of the
emergence of resistance-breaking strains
of phytopathogenic fungi. Insertion of
antifungal transgenes into wheat, when
combined with the corresponding host
plant resistance genes, provides plant
breeders with additional sources of

Transformation Technologies Available for Enhancing Fungal Resistance in Wheat 281
resistance, and such a concerted approach
should give rise to cultivars with a broad
and durable field resistance.
References
Broglie, K., Chet, I., Holliday, M., Cressman,R, Biddle, P., Knowlton, c., Mauvais,c.J., and R Broglie. 1991. Transgenicplants with enhanced resistance to thefungal pathogen Rhizoctonia solani.Science 254:1194-1197.
Endo, Y., Tsurugi, K., and RF. Ebert. 1988.The mechanism of action of barley toxin:a ~e 1 ribosome-inactivating proteinwIth RNA N-glycosidase activity.Biochem Biophys Acta 954:224-226.
Gornhardt, B., Jach, G., Logemann, J.,Pinsdorf, E., Schell, J., and C. Maas. 1994.Plants expressing an antifungal protein(Ag-AFP) from Aspergillus giganteus. In:The 16th International Congress ofBiochemistry and Molecular Biology,·pp.4-55. New Delhi, India: Publications andInformation Directorate.
Jach, G., Gornhardt, B., Mundy, J.,Logemann, J., Pinsdorf, E., Leah, R.,Schell, J., and C. Maas. 1995. Enhancedq~antitativeresistance against fungaldIsease by combinatorial expression ofdifferent barley antifungal proteins intransgenic tobacco. Plant J 8(1):97-109.
Jongedijk, E., Tigelaar, H., van Roekel, J.s.c.,Bres-Vloemans, S.A., Dekker, I., van denElzen, P.J.M., Cornelissen, B.J.c., and L.S.Melchers. 1995. Synergistic activity ofchitinases and B-1,3-glucanases enhancesfungal resistance in transgenic tomatoplants. Euphytica 85:173-180.
Lamb, c.J., Lawton, M.A., Dron, M., andRA. Dixon. 1989. Signals andtransduction mechanisms for activationof plant defenses against microbialattack. Cell 56:215-224.
Lamb, c.J., Ryals, J.A., Ward, E.R, and RADixon. 1992. Emerging strategies forenhancing crop resistance to microbialpathogens. Bio/Technol10:1436-1445.
Leah, R, Tommerup, H., Svendsen, I., and J.Mundy. 1991. Biochemical and molecularcharacterization of three barley seedproteins with antifungal properties. J BioIChern 266:1464-1573.
Lin, W., Anuratha, C.s., Datta, K., Potrykus,I., Muthukrishnan, S., and S.W. Datta.1995. Genetic engineering of rice forresistance to sheath blight. Bio/Technol13:686-691.
Logemann, J., Jach, G., Tommerup, H.,Mundy, J., and J. Schell. 1992. Expressionof a barley ribosome-inactivating proteinleads to increased fungal protection intransgenic tobacco plants. Bio/Technol10:305-308.
Mauch, F., Mauch-Mani, B., and T. Boller.1988. Antifungal hydrolases in pea tissueII. Inhibition of fungal growth bycombinations of chitinase and B-1,3glucanase. Plant PhysioI88:936-942.
Nakaya, K., Ornata, K., Okahasi, I.,Nakamura, Y., Kolkenbrock, H., and N.Ulbrich. 1990. Amino acid sequence and~isulfidebridges of an antifungal proteinIsolated from Aspergillus giganteus.European J Biochem 193:31-38.
Rajaram, S., Singh, RP., and E. Torres. 1988.Current CIMMYT approaches inbreeding wheat for rust resistance. In:N.W. Simmonds and S. Rajaram (eds.),Breeding Strategies for Resistance to theRusts of Wheat, pp. 101-118. Mexico,D.F.: CIMMYT.
Singh, RP., and S. Rajaram. 1992. Geneticsof adult-plant resistance to leaf rust in'Frontana' and three CIMMYT wheats.Genome 35:24-31.
Stirpe, F., Barbieri, L., Battelli, L.G., Soria,M., and P.A. Lappi. 1992. Ribosomeinactivating proteins from plants:present status and future prospects. BioiTechnol10:405-412.
Webster, J. 1980. Eumycota. In: Introductionto Fungi. 2nd edition, pp. 59. Cambridge,UK: Cambridge University Press.
Wubben, J.P., Lawrence, c.B., and P.J.G.M.de Wit. 1996. Differential induction ofchitinase and 1,3-B-glucanase geneexpression in tomato by Cladosporiumfulvum and its race-specific elicitors.Physiol Mol Plant Path 48:105-116.
Zhu, Q., Maher, E.A., Masoud, S., Dixon,RA., and c.J. Lamb. 1994. Enhancedprotection against fungal attack byconstitutive co-expression of chitinaseand glucanase genes in transgenictobacco. Bio/TechnoI12:807-812.
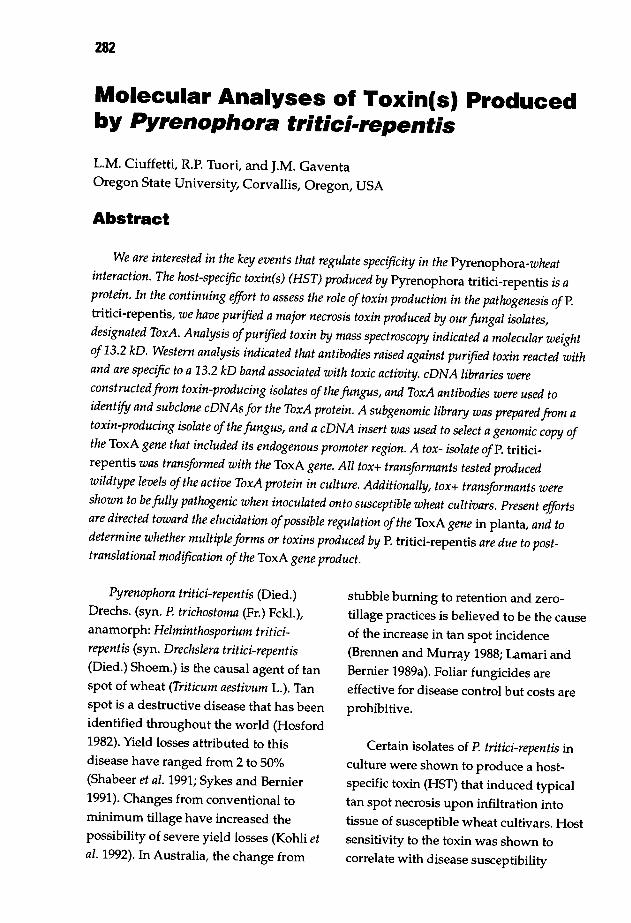
282
Molecular Analyses of Toxin(s) Producedby Pyrenophora frifici-repenfis
L.M. Ciuffetti, R.P. Tuori, and J.M. GaventaOregon State University, Corvallis, Oregon, USA
Abstract
We are interested in the key events that regulate specificity in the Pyrenophora-wheatinteraction. The host-specific toxin(s) (HST) produced by Pyrenophora tritici-repentis is aprotein. In the continuing effort to assess the role of toxin production in the pathogenesis ofP.tritici-repentis, we have purified a major necrosis toxin produced by our fungal isolates,designated ToxA. Analysis ofpurified toxin by mass spectroscopy indicated a molecular weightof13.2 kD. Western analysis indicated that antibodies raised against purified toxin reacted withand are specific to a 13.2 kD band associated with toxic activity. cDNA libraries wereconstructed from toxin-producing isolates of the fungus, and ToxA antibodies were used toidentify and subclone cDNAs for the ToxA protein. A subgenomic library was prepared from atoxin-producing isolate of the fungus, and a cDNA insert was used to select a genomic copy ofthe ToxA gene that included its endogenous promoter region. A tox- isolate ofP. tritici
repentis was transformed with the ToxA gene. All tox+ transformants tested producedwildtype levels ofthe active ToxA protein in culture. Additionally, tox+ transformants wereshown to be fully pathogenic when inoculated onto susceptible wheat cultivars. Present effortsare directed toward the elucidation ofpossible regulation ofthe ToxA gene in planta, and todetermine whether multiple forms or toxins produced by P. tritici-repentis are due to posttranslational modification of the ToxA gene product.
Pyrenophora tritici-repentis (Died.)Drechs. (syn. P. trichostoma (Fr.) Fckl.),
anamorph: Helminthosporium triticirepentis (syn. Drechslera tritici-repentis(Died.) Shoem.) is the causal agent of tan
spot of wheat (Triticum aestivum L.). Tanspot is a destructive disease that has beenidentified throughout the world (Hosford
1982). Yield losses attributed to this
disease have ranged from 2 to 50%
(Shabeer et al. 1991; Sykes and Bernier
1991). Changes from conventional to
minimum tillage have increased the
possibility of severe yield losses (Kohli etal. 1992). In Australia, the change from
stubble burning to retention and zero
tillage practices is believed to be the causeof the increase in tan spot incidence
(Brennen and Murr~y1988; Lamari andBernier 1989a). Foliar fungicides are
effective for disease control but costs are
prohibitive.
Certain isolates of P. tritici-repentis in
culture were shown to produce a hostspecific toxin (HST) that induced typical
tan spot necrosis upon infiltration into
tissue of susceptible wheat cultivars. Host
sensitivity to the toxin was shown to
correlate with disease susceptibility
Molecular Analyses of Toxin(s) Produced by Pyrenophora tritlci·repentis 283
(Tomas and Bockus 1987; Lamari and
Bernier 1989b), indicating causality of the
toxin in pathogenesis. Because toxin
production appears causal in disease
development, this information could be
exploited to control this wide-ranging
and serious disease.
Our approach to investigating
molecular mechanisms in the P. triticirepentis-wheat interaction is firstly to
isolate and clone the gene(s) responsible
for pathogenesis. We then determine how
the expression of these genes impacts on
host function such that a successful
interaction can occur. Ptr toxin has
provided a unique opportunity for the
isolation of an HST gene (a pathogenicity
gene) because the toxin is a protein and,
consequently, the direct product of a
single gene. Cloning of the gene for toxin
production has lead to a direct analysis of
the toxin's role as a primary determinant
of pathogenicity, and further analysis
should indicate how its production
impacts on host function. Because a single
gene appears responsible for
pathogenesis and host sensitivity is
conditioned by a single dominant gene
(Faris et al. 1996; Stock et al. 1996), the
wheat-Po tritici-repentis interaction
presents an ideal system for the
investigation of plant/microbe
interactions. We have been able to take a
straightforward approach to the isolation
of the gene responsible for toxin
production because the gene product is
available. Our most recent goal was to
directly evaluate the effect of toxin
production on pathogenicity.
Molecular Analysis ofToxA Produced byPyrenophora triticirepentis
A necrosis-inducing toxin was
purified (Tuori et al. 1995) by a
modification of the procedures published
by Tomas et al. (1990) and Ballance et al.(1989). The purified toxin appeared
homogeneous by analyses of both SOS
and native gel electrophoresis. The toxin
is heat stable and an average minimum
concentration of 60 nM toxin is required
to induce visible necrosis in susceptible
wheat cultivars. Analysis of purified toxin
by mass spectroscopy indicated a
molecular weight of 13.2 kO (Tuori et al.1995). Our purified toxin was designated
ToxA.
The detection of necrosis-inducing
components distinct from the 13.2 kO
ToxA protein was reported by Tuori et al.(1995). These components elute in two
fractions during HPLC chromatography:1) in the flpw-through, Le., material
which did not bind to the cation exchange
resin (anionic toxic component or AI);
and 2) immediately following elution of
the ToxA protein (cationic toxic
component or CI). These other toxic
components appear to be chromato
graphically and immunologically distinct
from ToxA or are much more active than
the ToxA protein. Interestingly, the CIs
appear to be heat-labile. The loss of most
activity following a heat treatment
indicates that these fractions contain a
toxin different from ToxA.
284 L.M. Ciuffelti, R.P. Tuori, and J.M. Geventa
Polyclonal and monoclonal antibodieswere raised against purified ToxA.
Western analysis indicated that theantibodies against the toxin reacted with
and are specific to the 13.2 kD bandassociated with toxin activitY. Indirect
immunoprecipitations of crude toxin
preparations confirmed the specificity ofthe antibodies for the 13.2 kD toxin band
and indicated that the 13.2 kD protein
was the major toxic agent. Electrophoreticanalysis of immunoprecipitated products
revealed a unique 13.2 kD protein band
present only when anti-ToxA antiserawere used for the reaction. This unique
protein band co-migrated with purifiedtoxin on polyacrylamide gels. Bioassay ofthe immunoprecipitated 13.2 kD band
demonstrated specific necrosis-inducing
activity when infiltrated into susceptible(toxin sensitive) wheat (Tuori et al. 1995).
Cloning the ToxA genefrom P. tritici-repentis
Time-course studies were performedcomparing toxin production and toxicactivity in culture filtrates. Toxin
production was determined by western
blotting, and toxic activity was assessed
by symptom development following leafinfiltration of culture filtrates into
sensitive wheat cultivars. Toxin was
detected by western analysis as early astwo days and appeared to reach a
maximum level at 10-12 days post
inoculation. The appearance of toxic
activity was directly correlated with the
appearance of the ToxA protein (Ciuffettiet al. 1997).
Poly(A)+ RNA was prepared from
mycelia from 6-, 7-, and 10-day-old
cultures. In vitro translations of the
isolated mRNA were performed toconfirm the integrity of the mRNA.Further, indirect immunoprecipitations of
total translation products with anti-ToxA
antibody were performed to confirm thepresence of mRNA for the toxin.
Immunoprecipitation results indicated
the presence of a ca. 19,500 D translationproduct that reacted with anti-ToxA
antibody. The translation product had a
molecular weight larger than the maturetoxin. This result supports the contention
that multiple proteolytic processing isinvolved in the formation of mature
ToxA. Additionally, the results indicatedthat the translation product was present
in relatively high abundance, suggestinga high relative abundance of the mRNA
for toxin. Immunoprecipitation resultsalso further established that the antibodyreaction is specific, as indicated by theprecipitation of a single translation
product.
A lambda cDNA library was prepared
from mRNA isolated from the fungusduring maximum rate of toxin
production. This library was screened
with anti-ToxA antibody, and antibodypositive recombinants were identified at a
high frequency that reacted with anti
ToxA antibodies. Initially we subcloned
and conducted nucleotide sequenceanalysis on(ive cDNA inserts. Amino
acid sequence information deduced fromnucleotide sequence was compared with
amino acid sequence obtained from the
protein. These data confirmed the identity

Molecular Analyses of Toxin(s) Produced by Pyrenophora Irillci-repenlis 285
of the cloned cDNAs (Ciuffetti et al. 1997).Southern analysis was performed with a
labeled cDNA clone. Digested genomic
DNA of toxin producing (pathogenic)
and non-toxin producing (nonpathogenic) isolates were probed with a32P-Iabeled cDNA insert, encoding ToxA,
to establish the presence or absence of thetoxin gene in these isolates. Southern
analysis of independent fungal isolates
indicated that the gene for ToxA ispresent only in toxin-producing isolates
of the fungus. These data support thecausal role of the toxin in successfuldisease interactions.
A genomic clone for the TaxA gene
was identified by hybridization with theTaxA cDNA insert. Restriction analysisidentified a 1.3-kb fragment that
contained the TaxA gene and its putativeendogenous promoter. This 1.3-kb
subcloned fragment was sequenced(Ciuffetti et al. 1997). The deduced open
reading frame from the TaxA geneencodes a protein with a calculated massof 19,707 D. This is very close to that
predicted from immunoprecipitation of invitra translation products. The first 22amino acids of the N-terminal domain
comprise the signal peptide necessary for
secretion of the ToxA protein. Theputative signal peptide is followed by a
38-39 amino acid region with a
theoretically determined anionicisoelectric point of 4.55. The C-terminal
domain encodes the 117-118 amino acid
mature ToxA region, as deduced by massspectral analysis and amino-acid
sequence analysis. Based on the
determined mass of 13,208 D (Tuori et al.
1995) and the assumption that the
inferred signal sequence of 22 amino
acids is proteolytically cleaved following
import into the endomembrane system,
additional proteolytic processing isapparently involved in the production of
the mature ToxA. The 278-nucleotide
region 5' to the transcribed region of thegene functions as a promoter both in
culture and in planta. Two introns have
been identified: intron 1 has typicaleukaryotic splice junctions, whereas
intron 2 lacks this consensus (Ciuffetti etaI.1997).
Transformation of a ToxIsolate to a Tox+Phenotype
A tox- isolate of P. tritici-repentis wastransformed (Ciuffetti et al. 1997) with a
vector containing the genomic copy of theTaxA gene and its putative endogenouspromoter and the hygromycin B
resistance gene for use as a selectablemarker (P. tritici-repentis is sensitive tohygromycin). DNA was prepared fromthe tox+ control isolate, the tox- recipient,
the vector-only control transformant, andthree putative tox+ transformants, and
analyzed by polymerase chain reaction(PCR). PCR analysis confirmed that the
tox+ transformants contained the TaxA
gene. The PCR products were sequencedand nucleotide sequence analysis of the
PCR products from the tox+
transformants confirmed that the
products were generated from the TaxA'
gene.

286 L.M. Ciuffetli. R.P. Tuori, and J.M. Gavenla
To determine the presence of the ToxA
protein, total protein precipitated from
samples of culture filtrate were evaluated
by western analysis. All tox+
transformants shown to contain the TaxA
gene produced ToxA in culture. Culture
filtrates from the tox+ transformants were
infiltrated into sensitive and insensitive
wheat cultivars. Culture filtrate from all
tox+ transformants tested caused typical
tan spot necrosis in the sensitive but not
in the insensitive wheat cultivars. Culture
filtrates from the tox- recipient and the
tox- recipient transformed with the vector
only did not induce necrosis in either
sensitive or insensitive wheat cultivars
(Ciuffetti et al. 1997).
To determine whether ToxA is
responsible for pathogenicity, the tox+
transformants were inoculated onto
susceptible and resistant cultivars of
wheat. The tox+ transformants produced
typical tan spot lesions on susceptible
wheat (TAM 105)/ but not on resistant
wheat (Auburn). The tox- recipient and
the tox- recipient transformed with the
vector only did not develop typical tan
spot symptoms in susceptible or resistant
wheat cultivars.
Conclusions
This host-pathogen interaction
provided a unique opportunity to isolate
a single gene for the production of a HST
and transformation of a tox- isolate to the
tox+ phenotype. Our recent studies
demonstrate that the TaxA gene is both
necessary and apparently sufficient for
the pathogenicity of P. tritici-repentis on
the toxin-sensitive wheat genotypes
tested. Our previous work indicated the
detection of necrosis-inducing activity
distinct from the 13.2 kD ToxA protein.
These other toxic components appear to
be distinct from the ToxA protein or are
much more active than the ToxA protein.
A possible explanation for the appearance
of multiple toxins in pathogenic isolates
of P. tritici-repentis is that these toxins are
all encoded by the TaxA gene. This
possibility gains plausibility based on the
analysis of the TaxA gene. With the
combined possibility of differential
proteolytic processing and/or post
translational modification, the TaxA gene
could account for all forms of the
proteinaceous host-selective toxins found
in the pathogenic isolates of the fungus.
Future studies will be directed to
determine.if one or multiple genes exist
for the production of the various toxic
components. The long-term goal of our
research program is a complete molecular
description of the P. tritici-repentis-wheatinteraction. With toxin purification and
gene cloning for TaxA production, we are
now in a position to extend our studies to
elucidate the site- and mode-of-action of
this proteinaceous host-specific toxin.
References
Ballance, G.M., Lamari, L./ and c.c. Bernier.1989. Purification and characterization ofa host-selective necrosis toxin from ~
Pyrenophora tritici-repentis. Physiol MolecPlant PathoI3S:203-213.
Brennen, J.P./ and G.M. Murray. 1988.Australian wheat diseases - assessingtheir economic importance. Agric Sci1:26-35.
Ciuffetti, L.M., Tuori, RP., and J.M.
Molecular Analyses of Toxin(s) Produced by Pyrsnophora tritici-rspsntis 287
Gaventa. 1997. A single gene encodes aselective toxin causal to development oftan spot of wheat. The Plant Cell 9:135144.
Faris, J.D., Anderson, J.A, Francl, J., andJ.G. Jordahl. 1996. Chromosomal locationof a gene conditioning insensitivity inwheat to a necrosis-inducing culturefiltrate from Pyrenoplwra tritici-repentis.Phytopathol 86:459-463.
Hosford, RM. Jr. 1982. Tan spot. In: RM.Hosford Jr. (ed.), Tan Spot of Wheat andRelated Diseases Workshop, pp.1-24.Fargo, ND, USA: North Dakota StateUniversity. 116pp
Kohli, M.M., Mehta, YR, and M. Diaz deAckerman. 1992. Spread of tan spot inthe southern cone region of SouthAmerica. In: L.J. Francl, J.M. Krupinsky,and M.P. McMullen (eds.), Advances inTan Spot Research. Proceedings of the2nd International Tan Spot Workshop,pp. 1-9.Fargo, ND, USA: North DakotaAgricultural Experiment Station.(Abstract).
Lamari, L., and c.c. Bernier. 1989a.Evaluation of wheat lines and cultivarsto tan spot (Pyrenophora tritici-repentis)based on lesion type. Can J Plant Pathol11:49-56.
Lamari, L., and c.c. Bernier. 1989b. Toxin ofPyrenoplwra tritici-repentis: Hostspecificity, significance of disease, andinheritance of host reaction. Phytopathol79:740-744.
Shabeer, A, Bockus, W.W., and B.L.Norman. 1991. Evidence for cytoplasmicdeterminants in the reaction of wheatcultivars to tan spot. Sarhad J Agric7:101-104.
Stock, W.S., Brule-Babel, AL, and G.APenner. 1996. A gene for resistance to anecrosis-inducing isolate of Pyrenophoratritici-repentis located on 5BL of Triticumaestivum cv. Chinese Spring. Genome39:598-604.
Sykes, E.E., and c.c. Bernier. 1991.Qualitative inheritance of tan spotresistance in hexaploid, tetraploid, anddiploid wheat. Can J Plant PathoI13:3844.
Tomas, A, and W.W. Bockus. 1987. Cultivarspecific toxicity of culture filtrates ofPyrenophora tritici-repentis. Phytopathol77:1337-1340.
Tomas, A., Feng, G.H., Reech, G.R, Bockus,WW, and J.E. Leach. 1990. Purificationof a cultivar-specific toxin of Pyrenoplwratritici-repentis, causal agent of tan spot ofwheat. Mol Plant-Microbe Interact 3:221224.
Tuori, RP., Wolpert, T.J., and L.M. Ciuffetti.1995. Purification and immunologicalcharacterization of toxic componentsfrom cultures of Pyrenoplwra triticirepentis. Mol Plant-Microbe Interact 8:4148.
288
Role of Host Metabolism in Ac'tion ofNecrosis Toxin 'from Pyrenophora frifici·repenfis
J.B. RasmussenDepartment of Plant Pathology, North Dakota State University, Fargo, North
Dakota, USA
Abstract
Ptr necrosis toxin, a cultivar-specific toxin produced by Pyrenophora tritici-repentis, hasbeen closely associated with the symptomatology of tan spot ofwheat. We have developed a rapidquantitative bioassay for Ptr necrosis toxin based on electrolyte leakage. All toxin-sensitivewheat lines (based on necrosis development during a 72-h incubation with toxin) showedenhanced electrolyte leakage in response to toxin relative to water controls, whereas all toxininsensitive wheats did not. The magnitude ofleakage increased with toxin concentration understandard assay conditions. A 4-h toxin exposure permitted completion of the assay in one day.The electrolyte leakage bioassay has been used to demonstrate that toxin action is temperaturesensitive in the host. Other experiments with the assay indicate that toxin action requires hostmetabolism, including ATP-utilizing proton pumps, protein synthesis, and putative signalingmechanisms.
Most North American isolates of
Pyrenophora tritici-repentis, the causalagent of tan spot of wheat, producelesions with a necrotic center (Lamari andBernier 1989a). Necrosis development has
been genetically linked to production of atoxin in the pathogen (Ciuffetti et al. 1997)
and to toxin sensitivity in the host(Lamari and Bernier 1989b, 1991; Farisetal. 1996). The toxin produced by the
fungus is a 13.2-kD protein that has been
designated by different groups as Ptrnecrosis toxin (Ballance et al. 1989) and
ToxA (Tuori et al. 1995). (My laboratory
uses the fungal strain described by
Lamari and associates, so I will use the
Ptr necrosis toxin nomenclature.) In
recent years, impressive advances in our
knowledge have been made with regardsto toxin biochemistry (Ballance et al. 1989;
Tuori et al. 1995; Zhang et al. 1997), host
genetics (Lamari and Bernier 1989b, 1991;Faris et al. 1996), and toxin molecular
biology (Ciuffetti et al. 1997). However, todate, relatively little is known of the
mechanisms by which necrosis developsin the host in response to toxin. This is the
area in which my laboratory has been
working in recent years.
When this work was initiated, the
only bioassay for toxin described in the
literature was based on necrosis
development 48-72 hours after infiltration
into the host. This "necrosis bioassay" isfairly easy to perform, gives reproducible
Role of Host Metabolism in Action of Necrosis Toxin from Pyrenophora tritici-repentis 289
results, and requires no special
equipment; however, it is not well-suitedfor mode-of-action studies because
necrosis is slow to develop and difficult
to quantify. Our first step, then, was todevelop a more rapid quantitative
bioassay for Ptr necrosis toxin. The
bioassay developed, which was recentlypublished (Kwon et al. 1996), is based on
electrolyte leakage. Important attributes
of this bioassay are that it can becompleted in one day, gives quantitative
data, and requires no special equipment
other than a conductivity meter.
In developing the bioassay, it was
found that toxin exposures ofapproximately four hours were requiredfor reliable development of electrolyte
leakage (Kwon et al. 1996). This wasinterpreted to mean that electrolyteleakage develops fairly late in toxin
action, and possibly is preceded by otherprocesses or events in the host.
Materials and Methods
Biological materialAll experiments used N0495, a hard
red spring wheat sensitive to Ptr necrosis
toxin. Plants were grown in the
greenhouse or in growth chambers forapproximately 14-17 days until the third
leaf was approximately one-half
expanded. Ptr necrosis toxin was
obtained from P. tritici-repentis (strain 86
124), as described by Zhang et al. (1997).All experiments used pure toxinquantified by the method of Bradford
(1976) using BSA (bovine serum albumin)
as a standard.
Electrolyte leakageElectrolyte leakage bioassays were as
described by Kwon et al. (1996) with onlyslight modification as needed. The second
true leaf of intact seedlings was infiltrated
with water (controls), pure toxin, or toxin
combined with one of the metabolicinhibitors listed below. After a defined
exposure period (generally 4-8 h), a single
2.5 cm leaf section was obtained from theinfiltrated region of each leaf. Five of
these leaf sections were combined to form
a single replicate and there were two
replicates per treatment. Each replicatewas placed in 15 ml of distilled water andvacuum infiltrated. Conductivity of the
ambient water was measured periodicallywith a conductivity meter.
Metabolic inhibitorsSodium vanadate, cobalt chloride,
lanthanum chloride, cycloheximide, and
actinomycin 0 were purchased fromSigma Chemical (St. Louis, MO, USA). All
inhibitors were dissolved in water exceptactinomycin 0, which was dissolved indimethyl sulfoxide.
Temperature experimentsOne experiment examined the effect
of cold temperature on toxin action, as
determined by electrolyte leakage. In thisexperiment, N0495 seedlings were held
in a Percival growth chamber at 4°C for
24 h prior to infiltration. The second trueleaf was infiltrated as described above,
then the seedlings were returned to the
growth chamber for incubation at 4°C.Following exposure to toxin or water, leaf
sections were leached at 4°C in distilled
water previously equilibrated at 4°C. As a
290 J.B. Rasmussen
positive control, electrolyte leakage was
determined for seedlings in a growth
chamber at 20°C.
Results and Discussion
Effect of cold temperature onelectrolyte leakage
Cold temperature (4°C) completely
eliminated the action of Ptr necrosis
toxin, as determined by electrolyte
leakage, relative to controls at 20°C.
Conductivity of ND495 seedlings treated
with water and toxin for 8 h was 6.6 and
6.5 llS, respectively, after 6 h leaching. By
comparison, leachate from seedlings at
20°C at the same time had conductivity
measurements of 6.2 and 23.8 llS for
water and toxin treatments, respectively.
The data indicate that toxin action is
inhibited by cold temperatures, and this
suggests that toxin action requires active
metabolism from the host. This
hypothesis was tested in subsequent
experiments by determining the effect of
various metabolic inhibitors on the action
of Ptr necrosis toxin.
Effect of sodium vanadate onelectrolyte leakage
Sodium vanadate significantly
reduced the amount of electrolyte leakage
when co-applied to seedlings with toxin,
relative to toxin treated controls.
Conductivity measurements after 8 hours
exposure and 6 hours of leaching were
5.5, 32.2, and 9.0 llS for water controls,
toxin only controls, and toxin + vanadate,
respectively. Vanadate is a well-known
inhibitor of H+-ATPases, which are
membrane-bound enzymes that utilize
ATP to pump hydrogen ions out of the
cell. This creates a pH gradient across the
membrane that is then used by the cell for
various metabolic functions such as
uptake of solutes (Serrano 1989). This
experiment clearly demonstrates that
wheat plants need an active H+-ATPase in
order to develop electrolyte leakage in
response to toxin, but the mechanism of
this requirement is not yet clear. Plants
require an active H+-ATPase to undergo
the hypersensitive response (HR) to
bacteria (Atkinson et ai. 1990), and this
suggests, at least superficially, that
necrosis development in response to toxin
may involve processes similar to those
activated by the HR. Further, the action of
certain elicitors of the defense responseinvolve H+-ATPase (Vera-Estrella et ai.1994; Xing et ai. 1996).
Effect of calcium channelblockers on toxin action
The inorganic calcium channel
blockers cobalt chloride and lanthanum
chloride significantly reduced electrolyte
leakage when co-infiltrated with toxin.
For example, conductivity measurements
after 8 h exposure to toxin and 6 h
leaching were 6.1, 27.5, and 1O.211S, for
water controls, toxin only controls, and
toxin + cobalt chloride, respectively.
Similar results were obtained for
lanthanum chloride. These data suggest
that calcium may be part of the signal
transduction pathway that acts between
toxin perception and necrosis
development. Calcium is known to act as
a secondary messenger for many plant
responses (Poovaiah and Reddy 1993),
including the HR (Atkinson and Baker
1989; Goodman and Novacky 1994).
Role of Host Metabolism in Action of Necrosis Toxin from Pyrenophora tritic;-repentis 291
Effect of staurosporine onelectrolyte leakage
Staurosporine, a potent inhibitor of
protein kinases, including those protein
kinases responsive to calcium, reduced
electrolyte leakage by approximately 50%
when applied to leaves with toxin.
Conductivity after 4 h exposure and 6 h
leaching was 4.1/ 20.1/ and 11.9 IlS for
water controls, toxin only controls, and
toxin + staurosporine, respectively. This
experiment implicates protein kinases in
the signal transduction for necrosis
development. It is possible that the
protein kinase(s) involved are activated
by calcium.
Effect of cycloheximide andactinomycin D on electrolyteleakage
Cycloheximide, but not actinomycin
D, blocked the action of Ptr necrosis
toxin. Cycloheximide provided
approximately 90% protection relative to
controls in experiments with an 8 h
exposure and 6 h leaching period.
Conductivity measurements were 5.1/
30.2/ and 8.2 IlS for water controls, toxin
only controls, and toxin + cycloheximide,
respectively; however, no protection was
obtained with actinomycin D.
Cycloheximide is a known inhibitor of
translation, and these experiments
suggest that Ptr necrosis toxin triggers
the synthesis of at least one new protein
required for cell death in wheat. The
identification of the protein(s)
synthesized is required for a thorough
understanding of the mode-of-action of
Ptr necrosis toxin. It is most plausible that
the protein(s) synthesized by the host in
response to toxin are under
transcriptional control, but this was not
supported by the actinomycin D
experiments. Actinomycin D is a known
inhibitor of transcription, but it is
notorious for being slow to enter cells.
Thus, available data do not support the
hypothesis that transcription is required,
but this needs to be examined much more
thoroughly with other inhibitors and
approaches.
References
Atkinson, M.M., and c.J. Baker. 1989. Roleof the plasmalemma H+-ATPase inPseudomonas syringae-induce K+ /H+exchange in suspension-cultured tobaccocells. Plant PhysioI91:298-303.
Atkinson, M.M., Keppler, L.D., Orlandi,E.W., Baker, c.J./ and c.P. Mischke. 1990.Involvement of plasma membranecalcium influx in bacterial induction ofthe K+ /H+ and hypersensitive responsesin tobacco. Plant Physiol 92(1):215-221.
Ballance, G.M., Lamari, L./ and c.c. Bernier.1989. Purification and characterization ofa host-selective toxin from Pyrenophoratritici-repentis. Physiol Molecul PlantPathoI35:203-213.
Bradford, M.M. 1976. A rapid and sensitivemethod for the quantitation ofmicrogram quantities of protein utilizingthe principle of protein-dye binding.Anal Biochem 72:248-254.
Ciuffetti, L.M., Tuori, R.P./ and Gaventa.1997. A single gene encodes a selectivetoxin causal to the development of tanspot of wheat. The Plant Cell 9:135-144.
Faris, J.D., Anderson, J.A./ Francl, L.J./ andJ.G. Jordahl. 1996. Molecular mapping inwheat of reaction to a necrosis-inducingprotein produced by Pyrenophora triticirepentis. Phytopathol 86:459-463.
Goodman, R.N., and A.J. Novacky. 1994.The Hypersensitive Reaction in Plants toPathogens. A Resistance Phenomenon.St. Paul, MN: APS Press.
292 J.B. Rasmussen
Kwon, c.Y., Rasmussen, J.B., Francl, L.J.,and S.w. Meinhardt. 1996. A quantitativebioassay for necrosis toxin fromPyrenophora tritici-repentis based onelectrolyte leakage. PhytopathoI86:13601363.
Lamari, L., and c.c. Bernier. 1989a.Evaluation of wheat lines and cultivarsto tan spot (Pyrenophora tritici-repentis)based on lesion type. Can J Plant Pathol11:49-56.
Lamari, L., and c.c. Bernier. 1989b. Toxin ofPyrenophora tritici-repentis: hostspecificity, significance in disease, andinheritance of host reaction. Phytopathol79:740-744.
Lamari, L., and c.c. Bernier. 1991. Geneticsof tan necrosis and extensive chlorosis intan spot of wheat caused by Pyrenophoratritici-repentis. PhytopathoI81:1092-1095.
Poovaiah, B.W., and A.S.N. Reddy. 1993.Calcium and signal transduction inplants. Crit Rev Plant Sci 12:185-211.
Serrano, R 1989. Structure and function ofplasma membrane ATPase. Ann RevPlant Physiol Plant Molec Bioi 40:61-94.
Tuori, RP., Wolpert, T.J., and L.M. Ciuffetti.1995. Purification and immunologicalcharacterization of toxic componentsfrom cultures of Pyrenophora triticirepentis. Molec Plant-Microbe Interact8:41-48.
Vera-Estrella, R, Barkla, B.J., Higgins, v.J.,and E. Blumwald. 1994. Plant defenseresponse to fungal pathogens. PlantPhysiol 104:209-215.
Xing, T., Higgins, v.J., and E. Blumwald.1996. Regulation of plant defenseresponse to fungal pathogens: Two typesof protein kinases in the reversiblephosphorylation of the host plasmamembrane H+-ATPase. The Plant Cell8:555-564.
Zhang, H.-F., Francl, L.J., Jordahl, J.G., andS.W. Meinhardt. 1997. Structural andphysical properties of a necrosisinducing toxin from Pyrenophora triticirepentis. Phytopathol (in press).
293
Fungi Associated with Foliar Blight ofWheat in Warm Areas
H. Maraitel, T. Di Zinno1, H. Longree1, V. Daumerie1, and E. Duveiller2
1 Unite de Phytopathologie, Universite catholique de Louvain (UCL), Belgium
2 CIMMYT, Mexico D.P., Mexico
Abstract
As part ofa CIMMYT-UCL collaborative r~search project, 360 wheat leafsamples withblight symptoms were collected during 1993-1996 from Bangladesh, China, India, Nepal,Vietnam, Morocco, South Africa, Mexico, Bolivia, and Argentina, and analyzed in Belgium.Bipolaris sorokiniana was detected in 81 % of the samples and was the only fungus associatedwith leaf blight in hot and humid areas, while Drechslera tritici-repentis, detected on 29% ofthe samples, prevailed in the colder regions. In the Gangetic Plain, both pathogens wereassociated with indistinguishable blight spots, sometimes combined on a single leaf, withproportions varying according to local climatic conditions. Drechslera gigantea was detectedin Nayarit state, Mexico. Occasionally Alternaria spp. were found associated with varioustypes of lesions. Differences in colony appearance were noted among B. sorokiniana strains.The radial growth rate on minimal medium at 20"C ranged from 2 to 9 mm/day among a set of29 strains, with no relation to origin or pathogenicity. Inoculation ofCiano, Kanchan, BH1146,and Mayoor with a selection ofstrains also revealed wide variation in aggressiveness, with somespecific and nonspecific interactions, the latter especially for the most aggressive strainsinducing extensive blight lesions even on the highly resistant genotype Mayoor. No specificrelationship between pathogenicity and country or genotype oforigin was evident.
A survey carried out by Dubin and
van Ginkel (1991) on the perceptionamong wheat researchers of the economic
importance of wheat diseases in the
warmer areas of the developing worldhighlighted fungal foliar blights as a
major production constraint. Leaf spot
associated with the anamorph stateBipolaris sorokiniana (Sacc.) Shoem. of
Cochliobolus sativus (Ito & Kurib.)
Drechsler ex Dastur was identified as the
most important disease in all
environmental zones. Tan spot with
sporulation of the anamorph Drechsleratritici-repentis (Died.) Shoem. of
Pyrenophora tritici-repentis (Died.)
Drechsler was reported mostly from thecoolest zones of the warm areas, while
alternaria leaf blight, associated with
Alternaria triticina Prasada & Prabhu, wasmostly identified in the hottest zones.
Nevertheless, the symptoms caused by
these fungi are similar, which can causediagnostic confusion.
Crop management practices and soilfertility are considered to significantly
influence disease occurrence, and sources
of resistance to leaf spot and tan spothave been identified; however, genotypes
294 H. Maraita at a/.
resistant in one location sometimes show
severe disease symptoms in others
(Raemaekers 1988). The exact cause,
differences in the pathogen population
and/or effect of the environment on
resistance expression are generally not
clearly established. Through a
collaborative research project set up by
Drs. E. Saari and J. Dubin with our group
at VCL, and funded by the Belgian
Agency for Development Cooperation,
CIMMYT has extended research into leaf
blight resistance of wheat and the
evaluation of cropping systems on the
development of this pathosystem. As part
of this project, diseased samples collected
during field trips, and surveys of
CIMMYT scientists or partners in various
warm areas, were sent to our laboratory
at Louvain-Ia-Neuve, Belgium, for
identification and isolation of pathogens,
and for assessment of pathogen diversity.
This paper presents some of the data
obtained from samples collected between
1993-1996/ as well as initial studies on the
pathogenic diversity among C. sativusstrains. Data on diversity of P. triticirepentis isolates are presented elsewhere
(Di Zinno et aI., this proceedings).
Materials and Methods
Diseased leaf samples were collected
at random from farmers fields and trials
with the main purpose to identify the
fungus associated with the lesion, not to
make a systematic quantitative survey on
the incidence of the various fungi. A
sample generally comprised up to five
leaves collected from one plot. Each
sample was dried separately in a paper
bag and stored and mailed at room
temperature. In the laboratory, lesions
were analyzed under a stereo-microscope
to detect fungal sporulation. Conidia and
conidiophores were removed with Scotch
tape and mounted on cotton blue
lactophenol for precise identification at
higher magnification.
To isolate the causal fungus, leaf
sections were surface sterilised with
NaClO (0.5 % in distilled water
containing two drops of Tween 20 per 100
ml ) for 3 min, rinsed three times with
sterile water, and transferred to petri
dishes containing water agar (1.5 %)
amended with streptomycin (150 mg L-l).
Plates were incubated in the dark at 20°C
until fungal growth appeared on the agar.
The plates were then placed at room
temperature under continuous white and
black fluorescent light to stimulate
conidiophore production, before being
returned to darkness at 20°C to induce
sporulation. These conditions appeared
critical for isolation of P. tritici-repentis.Conidia were spread on fresh water agar
plates and after germination were singly
transferred to V8-PDA plates (150 ml V8
juice/lOg Difco PDA, 3 g CaC03, 10 g
Difco bacto agar, and distilled water up
to a total volume of 1 L). Single-spore
cultures were stored on V8 slants
under oil.
Colony morphology and growth rate
were analysed on minimal medium
plates (100ml of solution 1/ 100ml of
solution 2/1 ml of solution 3/ 5 g sucrose,
15 g agar, 800 ml distilled water; solution
1: 31.2 g KN03, 7.5 g K
2HP04, 7.5 g
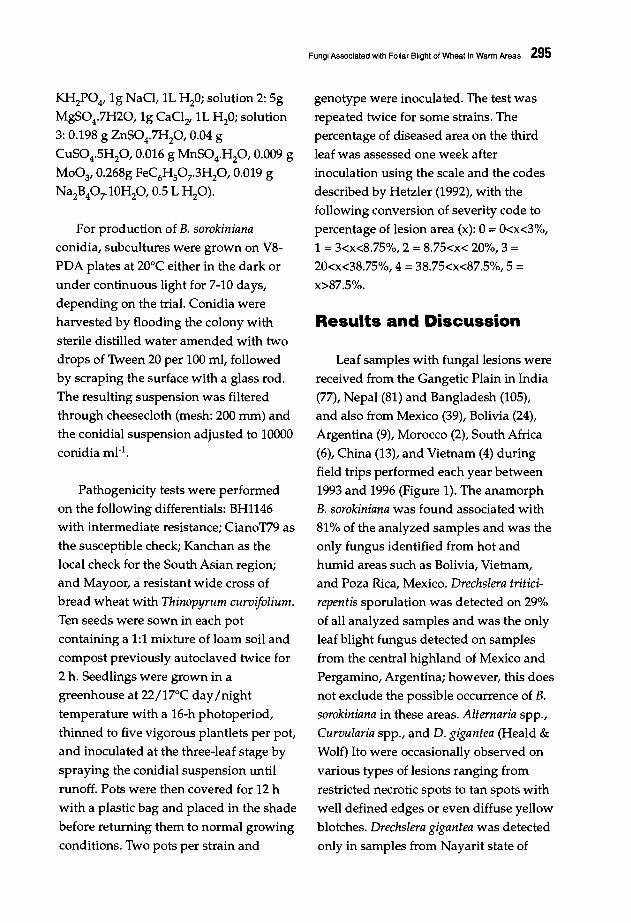
KH2P04, 19 NaCl, 1L H20; solution 2: 5g
MgS04.7H20, 19 CaCl2, 1L H20; solution
3: 0.198 g ZnS04.7Hp, 0.04 g
CuS04.5HP, 0.016 g MnS04.Hp, 0.009 g
Mo03, 0.268g FeC6Hs0 7.3Hp, 0.019 g
Na2Bp7.lOHp, 0.5 L HP).
For production of B. sorokinianaconidia, subcultures were grown on V8
PDA plates at 20°C either in the dark or
under continuous light for 7-10 days,
depending on the trial. Conidia were
harvested by flooding the colony with
sterile distilled water amended with two
drops of Tween 20 per 100 ml, followed
by scraping the surface with a glass rod.
The resulting suspension was filtered
through cheesecloth (mesh: 200 mm) and
the conidial suspension adjusted to 10000
conidia mI-!.
Pathogenicity tests were performed
on the following differentials: BH1146
with intermediate resistance; CianoT79 as
the susceptible check; Kanchan as the
local check for the South Asian region;
and Mayoor, a resistant wide cross of
bread wheat with Thinopyrum curvifo1ium.Ten seeds were sown in each pot
containing a 1:1 mixture of loam soil and
compost previously autoclaved twice for
2 h. Seedlings were grown in a
greenhouse at 22/17°C day /night
temperature with a 16-h photoperiod,
thinned to five vigorous plantlets per pot,
and inoculated at the three-leaf stage by
spraying the conidial suspension until
runoff. Pots were then covered for 12 h
with a plastic bag and placed in the shade
before returning them to normal growing
conditions. Two pots per strain and
Fungi Associated with Foiiar Blight of Wheal in Warm Areas 295
genotype were inoculated. The test was
repeated twice for some strains. The
percentage of diseased area on the third
leaf was assessed one week after
inoculation using the scale and the codes
described by Hetzler (1992), with the
following conversion of severity code to
percentage of lesion area (x): 0 = 0<x<3%,
1 =3<x<8.75%, 2 =8.75<x< 20%, 3 =20<x<38.75%,4 =38.75<x<87.5%, 5 =x>87.5%.
Results and Discussion
Leaf samples with fungal lesions were
received from the Gangetic Plain in India
(77), Nepal (81) and Bangladesh (105),
and also from Mexico (39), Bolivia (24),
Argentina (9), Morocco (2), South Africa
(6), China (13), and Vietnam (4) during
field trips performed each year between
1993 and 1996 (Figure 1). The anamorph
B. sorokiniana was found associated with
81% of the analyzed samples and was the
only fungus identified from hot and
humid areas such as Bolivia, Vietnam,
and Poza Rica, Mexico. Drechslera triticirepentis sporulation was detected on 29%
of all analyzed samples and was the only
leaf blight fungus detected on samples
from the central highland of Mexico and
Pergamino, Argentina; however, this does
not exclude the possible occurrence of B.
sorokiniana in these areas. Alternaria spp.,
Curvularia spp., and D. gigantea (Heald &
Wolf) Ito were occasionally observed on
various types of lesions ranging from
restricted necrotic spots to tan spots with
well defined edges or even diffuse yellow
blotches. Drechslera gigantea was detected
only in samples from Nayarit state of
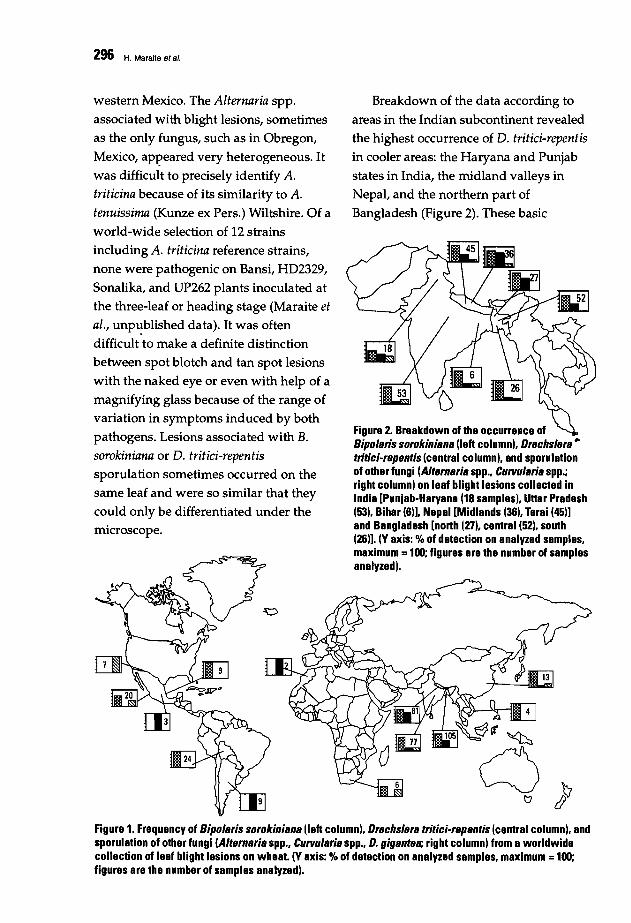
296 H. Maraita at al.
Breakdown of the data according to
areas in the Indian subcontinent revealed
the highest occurrence of D. tritici-repentisin cooler areas: the Haryana and Punjab
states in India, the midland valleys inNepal, and the northern part of
Bangladesh (Figure 2). These basic
Figure 2. Breakdown of the occurrence ofBipo/aris sorokiniana (left column), Drechs/era ..tritici-repentis (central column), and sporulationof other fungi (Alternaria spp., Curvularia spp.;right column) on leaf blight lesions collected inIndia [Punjab-Haryana (18 samples), Uttar Pradesh(53), Bihar (6)], Nepal [Midlands (36), Terai (45)]and Bangladesh [north (27), central (52), south(26)]. (V axis: % of detection on analyzed samples,maximum =10l1; figures are the number of samplesanalyzed).
western Mexico. The Alternaria spp.
associated with blight lesions, sometimesas the only fungus, such as in Obregon,
Mexico, aPI?eared very heterogeneous. It
was difficult to precisely identify A.
triticina because of its similarity to A.
tenuissima (Kunze ex Pers.) Wiltshire. Of a
world-wide selection of 12 strains
including A. triticina reference strains,none were pathogenic on Bansi, HD2329,
Sonalika, and UP262 plants inoculated atthe three-leaf or heading stage (Maraite etai., unp,,!,blished data). It was oftendifficult to make a definite distinction
between spot blotch and tan spot lesionswith the naked eye or even with help of a
magnifying glass because of the range ofvariation in symptoms induced by bothpathogens. Lesions associated with B.sorokiniana or D. tritici-repentissporulation sometimes occurred on the
same leaf and were so similar that theycould only be differentiated under themicroscope.
Figure 1. Frequency of Bipo/aris sorokinianalleft column), Drechs/era tritici-repentis (central column), andsporulation of other fungi (Alternaria spp., Curvularia spp., D. giganteB; right column) from a worldwidecollection of leaf blight lesions on wheat. (V axis: % of detection on analyzed samples, maximum =10l1;figures are the number of samples analyzed).
differences were consistently observed
over the various sampling dates each year
between February 15 and March 15,
although minor variations in relative
importance were observed from one date
to another, but without any specific trend.
This suggests variation in occurrence due
to differences in growth stage as well as
climate. From the National Wheat
Research Experiment Station,
Bhairahawa, Nepal, Dubin and Bimb
(1994) reported higher levels of conidial
dispersal and blight by D. tritici-repentiscompared to B. sorokiniana in February; B.
sorokiniana became predominant later in
the season with a temperature increase
and wheat maturation. Our data do not
claim to give a complete evaluation of the
relative importance of the various leaf
blight fungi; however, they are in line
with previous and more recent in depth
surveys, e.g., from India (Singh et al. 1986;Nagarajan, this proceedings). Tan spotwas considered a new problem in
Bangladesh, linked to the introduction of
high yielding varieties (Alam and Saha
1991); however, D. tritici-repentis was
already reported by McRae (1932) as
more common on wheat than B.
sorokiniana in Pusa (Bihar). This highlights
the possible fluctuation in time of the
relative importance of the various fungi
associated with leaf blight and the
Fungi Associatad with Foliar Blight of Whaat In Warm Araas 297
necessity to adapt control strategies to the
complex of pathogens which may occur
in a specific area.
Comparison of the detection of B.
sorokiniana and D. tritici-repentissporulation under the microscope and
subsequent isolation frequencies (Table 1)
revealed B. sorokiniana growth from
lesions where this fungus was not
detected before. Furthermore, there was a
systematic reduction of D. tritici-repentisisolation frequency. This suggests a
higher saprophytic capacity of B.
sorokiniana under the experimental
conditions as well as an underestimation
of D. tritici-repentis when incidence is
assessed only by isolation frequency.
From this world-wide collection of
leaf blight symptoms, a collection of
fungal isolates was established,
cOI11posed until now of Alternaria spp. (34strains), Cochiiobolus sativus (247),Curvularia spp. (4), D. gigantea (10), and
Pyrenophora tritici-repentis (73). The aim
was to use this collection for pathogen
diversity and toxin production studies. In
a first series of trials, a selection of 27
Cochliobolus sativus strains (Table 2) were
tested. The color of the colonies on
minimal medium varied from white
(strain CF 02-03) to light pink (J 1-15 and
Table 1. Comparative detection of Bipolsris sorokinisns (BS) and Drechslers tritici-repentis (DTR) onwheat leaf samples received from various origins in 1994 and subsequent isolation frequencies.
Detection IsolationNo. of BS DTR Others No. of BS DTR Others
Origin of samples samples % strains %
Bangladesh 24 65 30 5 24 91 9 9India 34 44 18 38 31 63 10 10Nepal 28 42 48 10 27 59 30 30
298 H. Maraita at a/.
K 3) and dark green (the remaining
strains). Maximum radial growth rate
also appeared very variable and ranged
from 2 mm/day (I?8) up to 9 mm/day
(CS 12-06); most strains ranged between
4-7mm/day.
When these 27 strains were used to
inoculate four genotypes with different
resistance backgrounds, a wide and
continuous range of aggressiveness was
revealed, with some strains inducing only
very restricted lesions on the most
susceptible Ciano, while others caused
severe symptoms even on the most
resistant Mayoor (Figure 3). The regular
progression of mean disease severity
suggests the occurrence of quantitative
differences in aggressiveness. On the
whole, spot blotch severity decreased as
follows: Ciano a Kanchan > BH1146 >Mayoor. This order differed for some
strains with medium aggressiveness,
suggesting specific interactions.
Nevertheless, there appeared to be no
specific link between aggressiveness and
the genotype from which the strain was
isolated, e.g., strain CS 11-20 isolated
from Kanchan showed a low
aggressiveness on this cultivar but a
comparatively high aggressiveness on
BH1146. These most aggressive strains
Table 2. Origin of Cochliobolus sBtivus strains used in pathogenicity studies.
Origin of sampleStrain code' Country Location Genotype Date
A18 Canada Saskatoon Unknown 01/11/94CF 02-01 South Africa Kimberley Durum 27/10/93CF 02-03 South Africa Kimberley Unknown 27/10/93CF 02-05 South Africa Durum 27/10/93CM 01-02 Mexico Poza Rica Pavon 21/01/93CM 01-05 Mexico Poza Rica Alondra 21/01/93CM 03-01 Bolivia Okinawa 1 Guapay 22/08/94CM 03-02 Bolivia Okinawa 1 Guenda 22/08/94CM 03-04 Bolivia Okinawa 2 Guapay 18/08/94CM 03-08 Bolivia Okinawa 2r Guenda 18/08/94CS 10-03 Vietnam Hanoi Barley 24/02/94CS 10-04 Vietnam Van Dien Zebra 24/02/94CS 10-05 Vietnam Duyen Thai Unknown 24/02/94CS 11-01 Bangladesh Joydepur Pavon76 28/02/94CS 11-10 Bangladesh Ranpur Kanchan 02/03/94CS 11-13 Bangladesh Rajshahi Kanchan 02/03/94CS 11-20 Bangladesh Jessore Kanchlln 03/03/94CS 12-06 Nepal Rampur Unknown 06/03/94CS12·13 Nepal Bhairahawa Sonalika 07/03/94CS 13-05 Nepal Hardinath UP 262 01/03/94CS 14-06 India Basti-Faizab. Unknown 08/03/94CS 14-07 India Basti-Faizab. Barley 08/03/94CS14-17 India Luknow Sonalika 10/03/94CS 14-31 India Sarhand Unknown 05/04/94081 Canada Saskatoon Unknown 01/11/94JI-151 Canada Saskatoon Unknown 01/11/94K31 Canada Saskatoon Unknown 01/11/94
1 Reference strains of C. sativus mating type provided in Nov. 1994 by K. Bailey, Agricultural Canada, Saskatoon,Saskatchewan.
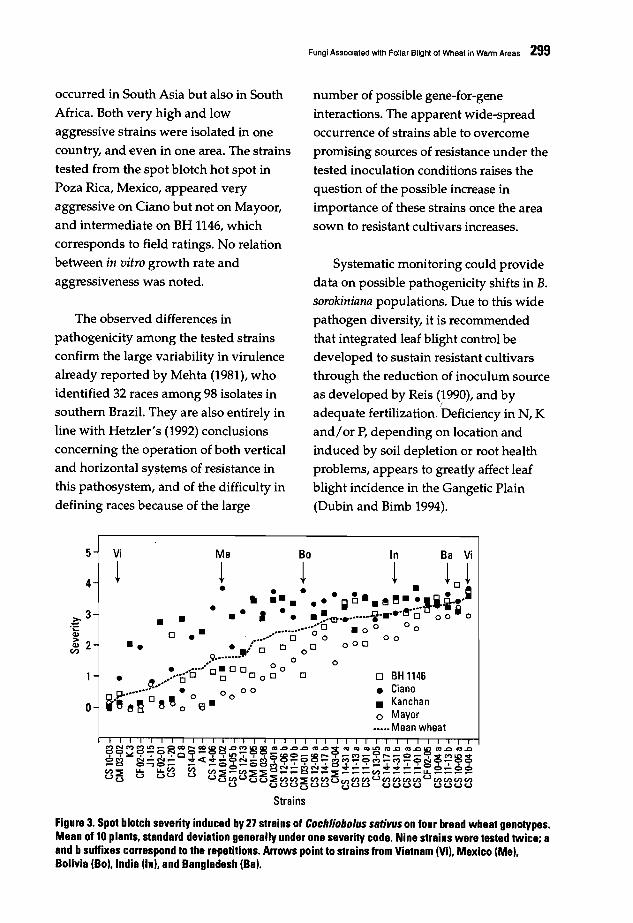
Fungi Associated with Foliar Blight of Wheat In Warm Areas 299
occurred in South Asia but also in South
Africa. Both very high and low
aggressive strains were isolated in onecountry, and even in one area. The strains
tested from the spot blotch hot spot in
Poza Rica, Mexico, appeared veryaggressive on Ciano but not on Mayoor,
and intermediate on BH 1146, which
corresponds to field ratings. No relationbetween in vitro growth rate and
aggressiveness was noted.
The observed differences in
pathogenicity among the tested strainsconfirm the large v.:uiability in virulence
already reported by Mehta (1981), whoidentified 32 races among 98 isolates insouthern Brazil. They are also entirely in
line with Hetzler's (1992) conclusions
concerning the operation of both verticaland horizontal sy~tems of resistance inthis pathosystem, and of the difficulty indefining races because of the large
number of possible gene-for-gene
interactions. The apparent wide-spreadoccurrence of strains able to overcome
promising sources of resistance under the
tested inoculation conditions raises thequestion of the possible increase in
importance of these strains once the areasown to resistant cultivars increases.
Systematic monitoring could provide
data on possible pathogenicity shifts in B.
sorokiniana populations. Due to this widepathogen diversity, it is recommended
that integrated leaf blight control bedeveloped to sustain resistant cultivars
through the reduction of inoculum source
as developed by Reis (1990), and byI
adequate fertilization. Deficiency in N, Kand/or P, depending on location and
induced by soil depletion or root healthproblems, appears to greatly affect leafblight incidence in the Gangetic Plain(Dubin and Bimb 1994).
o BH 1146• Ciano• Kanchano Mayor
••••• Mean wheat
o
••••
o••
Vi
~Me Bo In Ba Vi
~ ~ ~ ~o~.. • :·.· .. ·~~·.~~·;.i~~J• • I. • .c.•.•.e- 0 ts' i• •....1!J'......... 00 0
••••••••••••;;0.00 00
• >l··~ ..~ DO 00
0 0 00 00
9•••••••••• 0.........,....~. DO 0 0
• ~ ,~EO 0 000 0
i.~·;i'~·: ~ : 0 e • 0 0 0 0
4
o
5
~ 3-0;::Cl)
6; 2-en
a~~a~5~~9~~~~~~~~~~~~~~~~~~~~~~~~~~~
Oa~N~N~o~<~~~N~a9~e5~~~~~5~~~e5N~~9~
~~ ~~~§ § ~~*~~~a~~a~~~~~~~~~~~~*~e*Uu u u uu~uuu~~~~~~u~~~u~~~~u~~~~
u uuuuuu uuu uuuu uuuu
Strains
Figure 3. Spot blotch severity induced by 27 strains of Cochliobolus sativus on four bread wheat genotypes.Mean of 10 plants. standard deviation generally under one severity code. Nine strains were tested twice; aand b suffixes correspond to the repetitions. Arrows point to strains from Vietnam (Vi), Mexico (Me),Bolivia (Bo).lndia (In). and Bangladesh (Ba).
300 H. Maralla a/ a/.
References
Alam, K.B., and N.K. Saha. 1991.Helminthosporium leaf blight of wheat - Anew problem in Bangladesh. Paperpresented at the CIMMYT regionalworkshop on Helminthosporium leafblight, 1991, Kathmandu, Nepal. 12 pp.
Dubin, H.J., and H.P. Bimb. 1994. Studies ofsoilborne diseases and foliar blights ofwheat at National Wheat ResearchExperiment Station, Bhairahawa, Nepal.Wheat Special Report No. 36. Mexico,D.E: CIMMYT.
Dubin, H.J., and M. van Ginkel. 1991. Thestatus of wheat diseases and diseaseresearch in warmer areas. In: D.A.Saunders (ed.), Wheat for theNontraditional Warm Areas, pp. 125-145.Mexico, D.E: CIMMYT.
Hetzler, J. 1992. Host-pathogen interactionsin populations of Bipolaris sorokiniana inthe warm non-traditional areas. Doctoraldissertation, Faculty of AgriculturalSciences, Georg-August-Universit1H,G6ttingen, Germany.
McRae, W. 1932. Report of the ImperialMycologist. Sci Rep Imp Agric Res InstPusa 1930-31:51-86.
Mehta, Y.R 1981. Identification of races ofHelminthosporium sativum of wheat inBrazil. Pesq Agropec Bras 16:331-336.
Raemaekers, RH. 1988. Helminthosporiumsativum: Disease complex on wheat andsources of resistance in Zambia. In: A.RKlatt (ed.), Wheat ProductionConstraints in Tropical Environments,pp. 175-185. Mexico, D.E: CIMMYT.
Reis, E.M. 1991. Integrated diseasemanagement - The changing concepts ofcontrolling head blight and spot blotch.In: D.A. Saunders (ed.), Wheat for theNontraditional Warm Areas, pp. 165-177.Mexico, D.E: CIMMYT.
Singh, D.V., Joshi, L.M., and K.D.Srivastava. 1986. Foliar blights and spotsof wheat in India. Indian J Genet 46(suppl.):217-245.

301
Characterization of the Pyrenophorafrifici.repenfis Necrosis Toxin and aFolding Precursor
S.w. Meinhardt and H.P. ZhangDepartmentof Biochemistry, North Dakota State University, Fargo, NO, USA
Abstract
A Pyrenophora tritici-repentis necrosis-inducing toxin was purified from crude extractsfrom isolate 86-124. The purified toxin was characterized by SDS-PAGE, isoelectric focusing,and circular dichroism (CD) spectroscopy. Analysis of the CD spectrum indicated a compositionof 13% alpha helix, 36% antiparallel beta sheet, 25% turn, and 25% other structure. Enzymaticproteolysis and subsequent gas-phase amino acid sequencing resulted in sufficient overlappingfragments to produce acontinuous sequence ofl0l amino acids. The amino acid sequenceinformation was used to synthesize degenerate polymerase chain reaction (PCR) primers andthe DNA sequence of the toxin was obtained from eDNA. Secondary structure prediction basedon the amino acid sequence indicated a beta sheet protein with little alpha helix, in agreementwith the CD measurement. During toxin purification two additional peaks of toxin activitywere observed. All peaks contained a protein that has a similar molecular weight to the toxinand is antigenically related to the necrosis toxin. One peak undergoes conversion to a moleculeessentially indistinguishable from the necrosis toxin as measured by ion exchange and reversedphase HPLC chromatography, CD spectroscopy, and mass spectrometry. CD spectroscopy ofthis protein before conversion indicated incomplete formation ofsecondary structure whencompared to the necrosis toxin. This evidence suggests that this protein is afolding precursor ofthe toxin.
302
Diversity of Pyrenophora frifici.repenfisIsolates from Warm Wheat GrowingAreas: Pathogenicity, Toxin Production,and RAPD Analysis
T. Di Zinno, H. Longree, and H. MaraiteUnfte de Phytopathologie, Universite catholique de Louvain, Place Croix du Sud,Louvain-Ia-Neuve, Belgium
Abstract
The diversity ofPyrenophora tritici-repentis isolates collected from warm wheat growingareas around the world was studied. Four cultivars (Ciano, Hartog, Vicam, and BH1146) at thethree-leaf stage were inoculated with a conidial suspension under controlled conditions. Vicamappeared resistant to all P. tritici-repentis isolates, while Ciano, BH1146, and Hartog showedvarying susceptibility levels. Interactions were observed between cultivars and isolates,especially between Hartog and Ciano and the most aggressive isolates. Using a single conidiuminoculation method on detached leaves, all P. tritici-repentis isolates failed to producesymptoms on Vicam, whereas tan necrosis was induced by some isolates on Ciano, Hartog, andBH1146. Strains and cultivars were differentiated by induction and expression ofnecrosis,respectively. Strains that induced lesions were observed to produce necrosis-inducing toxins onall susceptible cultivars; however, NDNG9144//KAL/BB/3/YA was the exception. It failed todevelop symptoms when infiltrated by the toxin, even ~hough it is susceptible to tan spot underboth field and controlled conditions. Preliminary results from random amplified polymorphicDNA (RAPD) analyses indicated the presence of polymorphism between strains, but nocorrelation could be established between these differences and geographic origin, pathogenicity,and toxin production.
Tan spot of wheat, caused byPyrenophora tritici-repentis, is widespread
in temperate areas such as the Great
Plains of USA, Canada, Australia, and,less frequently, in western Europe
(Maraite and Weyns 1982). It is also
present in warmer areas of the world,
including South Asia (Bangladesh, Nepal,India), Latin America, and Africa. The
host range covers wheat, other cereals
such as barley and rye, and also grasses
(Kuprinsky 1992). Typical symptoms are
necrotic elliptical spots with a black point
at the center, surrounded by a chlorotic
ring. Tan spot is considered a majordisease in all warm wheat growing areas,
causing severe yield losses worldwide(Dubin and van GinkeI1991). This
situation is partly due to the recentprogress in breeding for rust resistance,
which has emphasized disease~
previously less apparent, but also to the
expansion of wheat cultivation into
nontraditional environments and to
Diversity of Pyrenophora tritici-repentis Isolates from Wann Wheat Growing Areas: Pathogenicity. Toxin Production. and RAPD Analysis 303
changes in agricultural practices,
including minimum tillage and stubble
management (Duveiller 1994).
Resistant cultivars offer an
economically effective means of keeping
disease losses to a minimum; however,
resistance varies with wheat cultivar, leaf
position, and fungal isolate (Hosford et al.1990). Physiological specialization, Le.,
differential adaptation of pathogen
isolates to certain host cultivars, could
complicate screening strategies in the
development of disease-resistant
varieties. Isolate x cultivar interaction
specificity should be a consideration not
only in systems where resistance is
governed by major genes, but also in
quantitative host-pathogen systems. In
the latter, physiological specialization
may be less obvious and based on
quantitative differences in disease
expression (Schilder and Bergstrom 1990).
Pyrenophora tritici-repentis has been
reported to exhibit isolate x cultivar
interactions in a number of studies
(Schilder and Bergstrom 1990; Lamari and
Bernier 1989a) but not in others (Diaz de
Ackermann et al. 1988; Hosford et al.1990). These discrepancies could be due,
in part, to differences in methods for
rating host reaction among researchers, as
well as to possible differences in the
virulence of P. tritici-repentis isolates used
in each study (Lamari and Bernier 1989a).
Therefore, the refinement of methods and
ratings systems that are both informative
and reliable is important in the
development of tan spot resistant
cultivars (Francl and Jordahl 1994).
Pyrenophora tritici-repentis isolates
have been grouped into pathotypes based
on their ability to induce tan necrosis and
extensive chlorosis (nec+, chl+), tan
necrosis only (nec+, chl-), extensive
chlorosis only (nec-, chl+), and neither
necrosis nor chlorosis (nec-, chl-) (Lamari
and Bernier 1989b). Tan necrosis-inducing
isolates release a host-selective toxin that
induces necrosis in culture (Lamari and
Bernier 1989b; Tomas et al. 1990; Tuori etal. 1995). The toxin exhibits the same host
specificity as the isolates from which it is
produced, and is assumed to be the
primary pathogenicity factor for tan
necrosis development in susceptible
wheats (Lamari and Bernier 1989b).
Therefore, characterization of toxin
production and analysis of isolate
pathogenicity are of primary importancein understanding the role of toxin in host
pathogen interactions and in determining
how to efficiently use the toxin in
screening for tan spot resistant wheat.
The use of random amplified
polymorphic DNA (RAPD) techniques for
identification and differentiation of many
microorganisms has greatly expanded
during the last few years. For plant
pathogenic fungi, RAPD analysis has
been used to analyze genetic variation or
distinguish races in several Fusarium spp.
(Manulis et al. 1994), and in Colletotrichumgraminicoia (Guthrie et al. 1992),Cochiiobolus carbonum (Jones and Dunkle
1993), and Pyrenophora teres (Peltonen etal. 1996). Using this technique, a study
was undertaken to explore the possibility
of a correlation between DNA
polymorphism and pathogenicity and
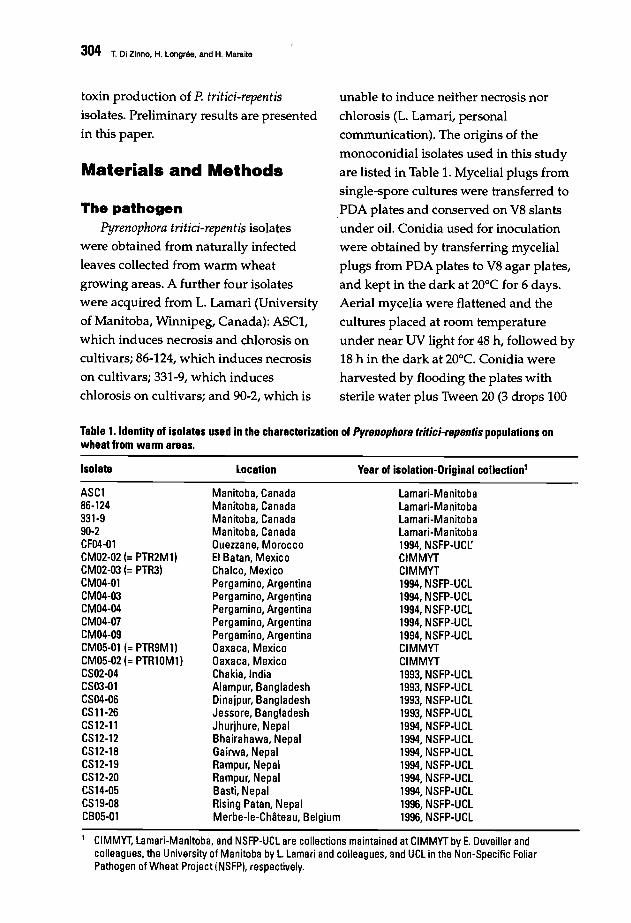
304 T. Oi Zinno, H. Longree. and H. Maraite
toxin production of P. tritici-repentisisolates. Preliminary results are presentedin this paper.
Materials and Methods
The pathogenPyrenophora tritici-repentis isolates
were obtained from naturally infectedleaves collected from warm wheat
growing areas. A further four isolateswere acquired from L. Lamari (Universityof Manitoba, Winnipeg, Canada): ASCI,
which induces necrosis and chlorosis oncultivars; 86-124, which induces necrosison cultivars; 331-9, which induces
chlorosis on cultivars; and 90-2, which is
unable to induce neither necrosis nor
chlorosis (L. Lamari, personalcommunication). The origins of the
monoconidial isolates used in this study
are listed in Table 1. Mycelial plugs fromsingle-spore cultures were transferred to
.PDA plates and conserved on V8 slantsunder oil. Conidia used for inoculation
were obtained by transferring mycelialplugs from PDA plates to V8 agar plates,
and kept in the dark at 20°C for 6 days.Aerial mycelia were flattened and the
cultures placed at room temperatureunder near UV light for 48 h, followed by18 h in the dark at 20°C. Conidia were
harvested by flooding the plates withsterile water plus Tween 20 (3 drops 100
Table 1. Identity of isolates used in the characterization of PyrBnophors tritici-rBpBntis populations onwheat from warm areas.
Isolate
ASCI86-124331-990-2CF04-01CM02·02 (= PTR2Ml)CM02-03 (= PTR3)CM04-01CM04-03CM04-04CM04-07CM04-09CM05-01 (= PTR9Ml)CM05-02 (= PTR10Ml)CS02-04CS03·01CS04-06CSl1-26CS12-11CS12-12CS12-18CS12-19CS12-20CS14-05CS19-08CB05-01
location
Manitoba, CanadaManitoba, CanadaManitoba, CanadaManitoba, CanadaOuezzane, MoroccoEI Batan, MexicoChalco, MexicoPergamino, ArgentinaPergamino, ArgentinaPergamino, ArgentinaPergamino, ArgentinaPergamino, ArgentinaOaxaca, MexicoOaxaca, MexicoChakia, IndiaAlampur, BangladeshDinajpur, BangladeshJessore, BangladeshJhurjhure, NepalBhairahawa, NepalGairwa, NepalRampur, NepalRampur, NepalBasti, NepalRising Patan, NepalMerbe-le-Ch6teau, Belgium
Year of isolation-Original collection'
lamari-Manitobalamari-Manitobalamari-Manitobalamari-Manitoba1994, NSFP-UCrCIMMYTCIMMYT1994, NSFp·UCl1994, NSFP·UCl1994, NSFP-UCl1994, NSFP-UCl1994, NSFp·UClCIMMYTCIMMYT1993, NSFP-UCl1993, NSFP-UCl1993, NSFP-UCl1993, NSFP-UCl1994, NSFP-UCl1994, NSFp·UCl1994, NSFP-UCl1994, NSFP-UCl1994, NSFP-UCl1994, NSFP-UCl1996, NSFP-UCl1996, NSFP·UCl
1 CIMMYT. lamari-Manitoba, and NSFP-UCl are collections maintained at CIMMYT by E. Duveiller andcolleagues, the University of Manitoba by l.lamari and colleagues, and UCl in the Non-Specific FoliarPathogen of Wheat Project (NSFP), respectively.

Diversity of Pyrenophora tritici·repentis Isolates from Wann Wheat Growing Areas: Pathogenicity, Toxin Production, and RAPD Analysis 305
ml·1) and scraping the agar surface with
the edge of a glass slide. The suspension
was filtered through cheesecloth and
adjusted to a concentration. of 2000conidia ml·1.
Plant materialThe host differential comprised four
hexaploid wheat cultivars (Ciano T79,
BH1146, Vicam, and Hartog) provided by
CIMMYT. Plants were grown in pots
containing a 1:1 mixture of soil and
compost previously twice sterilized at
120°C for 2 h. Approximately 10 kernels
per cultivar were sown in each pot.
Seedlings were grown in the greenhouse
(22/17°C day /night with a 16 h
photoperiod) and were fertilized at the
one- and three-leaf stages. At this time,
before inoculation, plants where thinned
to five plants per pot. Plants were
sprayed with fungicide (Corbel, BASF), as
necessary, to control powdery mildew.
InoculationSeedlings were spray inoculated with
the conidial suspension at the three-leaf
stage using an atomizer until run-off. Pots
were then covered with a plastic bag for
24 h to maintain high humidity in the
greenhouse (22/17°C day /night, with a
16 h photoperiod). Plants were evaluated
after one week according to the following
qualitative scale adapted from Lamari
and Bernier (1989a): 1) small dark brown
to black spots without any surrounding
chlorosis or tan necrosis; 2) small dark
brown to black spots with very little
chlorosis or tan necrosis; 3) small dark
brown to black spots completely
surrounded by a distinct chlorotic or tan
necrotic ring, lesions generally not
coalescing; 4) small dark brown to black
spots completely surrounded by a distinct
chlorotic or tan necrotic ring, some of the
lesions coalescing; 5) dark brown or black
centers mayor may not be
distinguishable, most lesions consist of
coalescing chlorotic or tan necrotic zones;
6) extensive chlorosis; 7) extensive
chlorosis with visible black point
infection; and 8) all lesions coalesce,
resulting in leaf death. In a second
experiment, percentage diseased leaf area
(%DLA) was used to assess fungal
infection level. In both experiments, a
randomized complete block design was
used. Ten replicate plants were inoculated
by isolates for the first experiment, and
five for the second.
Detached leaf assays were performed
by placing wheat leaf sections (a 6-em
center section of the third leaf) on water
agar (0.5%) containing 150 ppm of
benzimidazole in square plastic dishes
(120 x 15 mm). Leaves were inoculated
either by depositing a 10 III drop ofconidial suspension (as described above)
in the center of the leaf section or by
single conidia inoculation. Conidia for the
latter method were obtained by spreading
conidia suspension on a water agar plate
and transferring the conidia one by one
onto the detached leaves. Inoculated
dishes were incubated in a controlled
temperature chamber at 20°C under a
16-h photoperiod. Presence or absence of
necrosis was scored after one week.
Toxin production and bioassaysToxin was produced in liquid Fries
medium (No. 66; Dhingra and Sinclair
1985) inoculated with 2 ml of a conidial
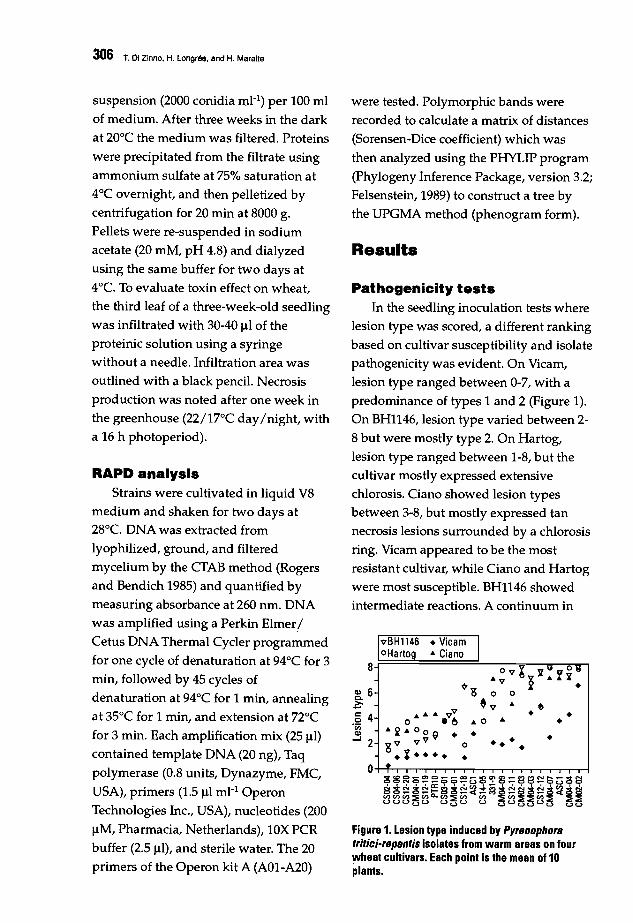
306 T. 01 Zinno, H. Longnle, and H. Maralle
Results
Figure 1. Lesion type induced by Pyr8nophoratritici-r8p8ntis isolates from warm areas on fourwheat cultivars. Each point is the mean of 10plants.
were tested. Polymorphic bands were
recorded to calculate a matrix of distances
(Sorensen-Dice coefficient) which was
then analyzed using the PHYLIP program
(Phylogeny Inference Package, version 3.2;
Felsenstein, 1989) to construct a tree by
the UPGMA method (phenogram form).
•••••••
• Vicam I.. Ciano
vBH1146oHartog
8
CI> 6~:5 4
'enCI>
..... 2
Pathogenicity testsIn the seedling inoculation tests where
lesion type was scored, a different ranking
based on cultivar susceptibility and isolate
pathogenicity was evident. On Vicam,
lesion type ranged between 0-7/ with a
predominance of types 1 and 2 (Figure 1).
On BH1l46, lesion type varied between 2
8 but were mostly type 2. On Hartog,
lesion type ranged between 1-8/ but the
cultivar mostly expressed extensive
chlorosis. Ciano showed lesion types
between 3-8/ but mostly expressed tannecrosis lesions surrounded by a chlorosis
ring. Vicam appeared to be the most
resistant cultivar, while Ciano and Hartog
were most susceptible. BH1l46 showed
intermediate reactions. A continuum in
RAPD analysisStrains were cultivated in liquid V8
medium and shaken for two days at
28°C. DNA was extracted from
lyophilized, ground, and filtered
mycelium by the CTAB method (Rogers
and Bendich 1985) and quantified by
measuring absorbance at 260 nm. DNA
was amplified using a Perkin Elmer/
Cetus DNA Thermal Cycler programmed
for one cycle of denaturation at 94°C for 3
min, followed by 45 cycles of
denaturation at 94°C for 1 min, annealing
at 35°C for 1 min, and extension at nocfor 3 min. Each amplification mix (25 Ill)
contained template DNA (20 ng), Taq
polymerase (0.8 units, Dynazyme, FMC,
USA), primers (1.5 III ml- l Operon
Technologies Inc., USA), nucleotides (200
IlM, Pharmacia, Netherlands), lOX PCR
buffer (2.5 IlI), and sterile water. The 20
primers of the Operon kit A (A01-A20)
suspension (2000 conidia ml- l ) per 100 ml
of medium. After three weeks in the dark
at 20°C the medium was filtered. Proteins
were precipitated from the filtrate using
ammonium sulfate at 75% saturation at
4°C overnight, and then pelletized by
centrifugation for 20 min at 8000 g.
Pellets were re-suspended in sodium
acetate (20 mM, pH 4.8) and dialyzed
using the same buffer for two days at
4°C. To evaluate toxin effect on wheat,
the third leaf of a three-week-old seedling
was infiltrated with 30-40 III of the
proteinic solution using a syringe
without a needle. Infiltration area was
outlined with a black pencil. Necrosis
production was noted after one week in
the greenhouse (22/17°C day/night, with
a 16 h photoperiod).
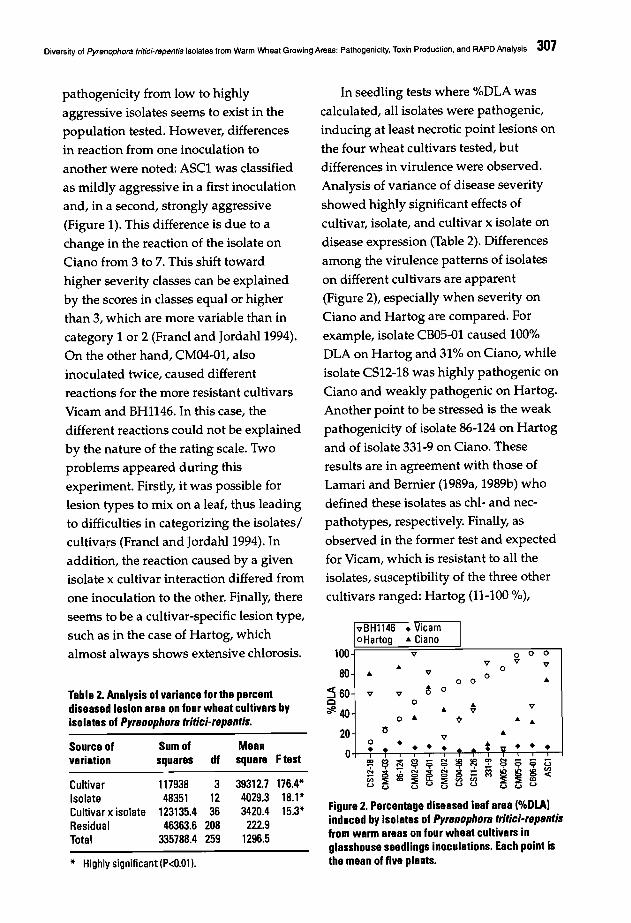
Diversity of Pyrenophora trltic;·repentis Isolates from Warm Wheat Growing Areas: Pathogenicity, Toxin Production, and RAPD Analysis 307
pathogenicity from low to highly
aggressive isolates seems to exist in the
population tested. However, differences
in reaction from one inoculation to
another were noted: ASCI was classified
as mildly aggressive in a first inoculation
and, in a second, strongly aggressive
(Figure 1). This difference is due to a
change in the reaction of the isolate on
Ciano from 3 to 7. This shift toward
higher severity classes can be explained
by the scores in classes equal or higher
than 3, which are more variable than in
category 1 or 2 (Francl and Jordahl 1994).
On the other hand, CM04-01, also
inoculated twice, caused different
reactions for the more resistant cultivars
Vicam and BH1146. In this case, the
different reactions could not be explained
by the nature of the rating scale. Two
problems appeared during this
experiment. Firstly, it was possible for
lesion types to mix on a leaf, thus leading
to difficulties in categorizing the isolates/
cultivars (Francl and Jordahl 1994). In
addition, the reaction caused by a givenisolate x cultivar interaction differed from
one inoculation to the other. Finally, there
seems to be a cultivar-specific lesion type,
such as in the case of Hartog, which
almost always shows extensive chlorosis.
Table 2. Analysis of variance for the percentdiseased lesion area on four wheat cultivars byisolates of Pyrenophora tritici-repentis.
Source of Sum of Meanvariation squares df square Ftest
Cultivar 117938 3 39312.7 176.4*Isolate 48351 12 4029.3 18.1*Cultivar x isolate 123135.4 36 342D.4 15.3*Residual 46363.6 208 222.9Total 335788.4 259 1296.5
* Highly significant (P<O.Ol).
In seedling tests where %DLA was
calculated, all isolates were pathogenic,
inducing at least necrotic point lesions on
the four wheat cultivars tested, but
differences in virulence were observed.
Analysis of variance of disease severity
showed highly significant effects of
cultivar, isolate, and cultivar x isolate on
disease expression (Table 2). Differences
among the virulence patterns of isolates
on different cultivars are apparent
(Figure 2), especially when severity on
Ciano and Hartog are compared. For
example, isolate CBOS-Dl caused 100%
DLA on Hartog and 31% on Ciano, while
isolate CS12-18 was highly pathogenic on
Ciano and weakly pathogenic on Hartog.
Another point to be stressed is the weak
pathogenicity of isolate 86-124 on Hartog
and of isolate 331-9 on Ciano. These
results are in agreement with those of
Lamari and Bernier (1989a, 1989b) who
defined these isolates as chl- and nec
pathotypes, respectively. Finally, as
observed in the former test and expected
for Vicam, which is resistant to all the
isolates, susceptibility of the three other
cultivars ranged: Hartog (11-100 %),
vBHl146 + VicamIoHartog .. Ciano
100 v 0 0 0v v v.. 080 .. v 0
0 0 ..:5 60 v v ~ 0
Cl 0 ..~40 .. v v
0 .. ~ .. ..20 15 ..v0 + + t n + +0 + • + + ~ +
~ a ~ a N~ ~ 'l' N <; 9 ;:;
"c c
N c!; '7 N~
N ;; - i:i :£ ,;, ~en
c c <Cc;; :::;: lIil :::;: :::;: en en :::;: ~ al'-' '-' '-' '-' '-' '-' '-' '-' '-' '-'
Figure 2. Percentage diseased leaf area (%DLA)induced by isolates of Pyrenophora tritici-repentisfrom warm areas on four wheat cultivars inglasshouse seedlings inoculations. Each point isthe mean of five plants.

308 T. Di Zinno. H. Longrea. and H. Maralla
BH1146 (2-99%), and Ciano (8-87%)
(Figure 2).
In the detached-leaf assay, chlorosis
development was observed for all isolate
x cultivar combinations tested, but this
does not fit the description of extensive
chlorosis described by Lamari and
Bernier (1989a). The tested cultivars thus
appear unable to express extensive
chlorosis under our conditions. Isolates
ASCI and 86124 caused necrosis
development beyond the area of
inoculation on all cultivars except Vicam.
Isolate 331-9 produced necrosis but not
beyond the area where the drop of
inoculum was deposited on the leaf. This
is probably due to the combined effect of
all fungal infection sites (Table 3). Results
from the single conidia inoculation
confirmed those of the conidia
suspension inoculation. Necrosis was
again observed on genotypes Ciano,
BH1146, and Hartog for isolates ASCI
and 86124, but not for isolates 331-9 and
90-2. The resistant Vicam did not displayany necrotic symptoms.
A set of isolates originating from
different countries was tested on the four
cultivars (BH1146, Hartog, Vicam, and
Ciano) using the drop and single spore
inoculation techniques in a detached leaf
assay. Results of tan necrosis production,
similar for the two inoculation types, are
presented in Table 4. For all isolates,
Vicam did not express any necrosis, while
necrosis was induced on BH1146, Hartog,
and Ciano by all isolates except 331-9 and
90-2 (nec-), two isolates isolated by E.
Duveiller in Oaxaca, Mexico, and one
from Bangladesh.
Toxin productionBH1146, Hartog, and Ciano, but not
Vicam, showed necrosis after leaf
infiltration with a proteinic solution
obtained by partial purification of culturefiltrates (Table 5). Four additional
cultivars were tested using this protocol
(Table 5): GUAMUCHIL, considered
susceptible in field tests (E. Duveiller,
personal communication), showed
necrosis, while the two resistant wheat
genotypesALD/COC/ lURES and
Table 3. Reactions of Pyrenophors tritici-repentis isolates inoculated as conidial droplets or singleconidium on four wheat cultivars in detached-leaf assays.
Isolate Origin BHl146 Hartog Vicam Ciano
ASC1 Manitoba, Canada Nl N 0 N86124 Manitoba, Canada N N 0 N331-9 Manitoba, Canada OIN) O(N) O(N) O(N)90-2 Manitoba, Canada 0 0 0 0CF 04-01 Ouezzane-Morocco N N 0 NCM 04-03 Pergamino-Argentina N N 0 NCM 02-02 EI Batan-Mexico N N 0 NCM 02·03 Chalco-Mexico N N 0 NCM 05·01 Oaxaca-Mexico 0 0 0 0CM 05-02 Oaxaca-Mexico 0 0 0 0CS 04-06 Dinajpur-Bangladesh 0 0 0 0CS 11·26 Jessore-Bangladesh N N 0 N
1 N=Induction of necrosis; IN) =Scattered necrotic spots with droplets of conidial suspension; 0=No induction.
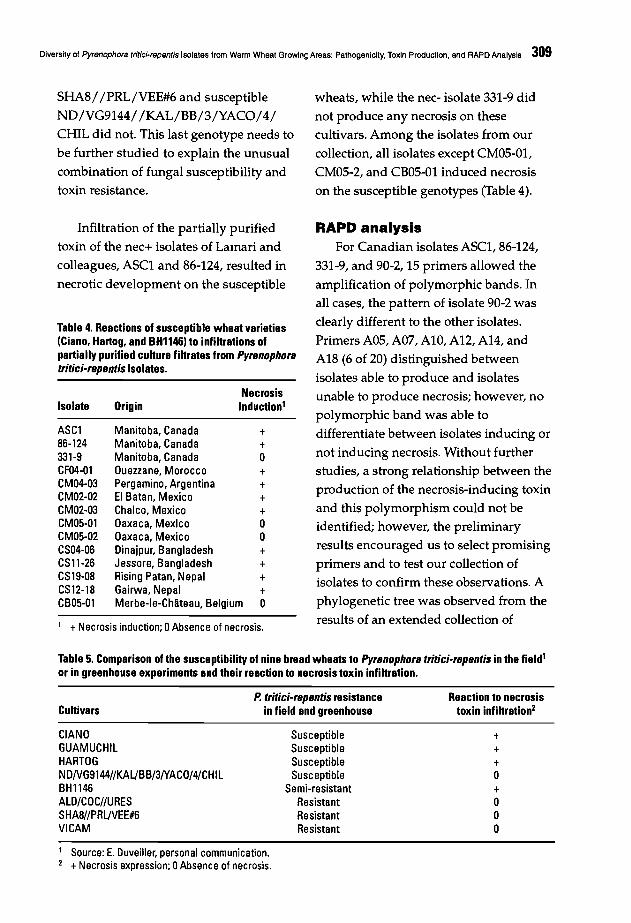
Diversity of Pyrenophora tritici-repenlis Isoletes from Warm Wheat GrowinG Areas: Pathogenicity, Toxin Production, and RAPD Analysis 309
SHA8/ /PRL/VEE#6 and susceptible
ND/VG9144/ /KAL/BB/3/YACO/4/CHIL did not. This last genotype needs to
be further studied to explain the unusual
combination of fungal susceptibility andtoxin resistance.
wheats, while the nec- isolate 331-9 did
not produce any necrosis on these
cultivars. Among the isolates from our
collection, all isolates except CMOS-01,
CMOS-2, and CBOS-01 induced necrosis
on the susceptible genotypes (Table 4).
1 +Necrosis induction; 0Absence of necrosis.
Table 4. Reactions of susceptible wheat varieties(Ciano, Hartog, and BH1146) to infiltrations ofpartially purified culture filtrates from Pyrenophoratritici-repentis isolates.
Infiltration of the partially purified
toxin of the nec+ isolates of Lamari and
colleagues, ASCI and 86-124, resulted in
necrotic development on the susceptible
Necrosisinduction'
RAPD analysisFor Canadian isolates ASCI, 86-124,
331-9, and 90-2, IS primers allowed the
amplification of polymorphic bands. In
all cases, the pattern of isolate 90-2 was
dearly different to the other isolates.
Primers AOS, A07, AlO, A12, A14, and
A18 (6 of 20) distinguished between
isolates able to produce and isolates
unable to produce necrosis; however, no
polymorphic band was able to
differentiate between isolates inducing or
not inducing necrosis. Without further
studies, a strong relationship between the
production of the necrosis-inducing toxin
and this polymorphism could not beidentified; however, the preliminary
results encouraged us to select promising
primers and to test our collection of
isolates to confirm these observations. A
phylogenetic tree was observed from the
results of an extended collection of
++o++++oo++++o
Manitoba, CanadaManitoba, CanadaManitoba, CanadaOuezzane, MoroccoPergamino, ArgentinaEI Batan, MexicoChalco, MexicoOaxaca, MexIcoOaxaca, MexicoDinajpur, BangladeshJessore, BangladeshRising Patan, NepalGairwa, NepalMerbe-Ie-Chliteau, Belgium
Origin
ASC186-124331-9CF04-01CM04-03CM02-02CM02-03CM05-01CM05-02CS04-06CSll-26CS19-08CS12-18CB05-01
Isolate
Table 5. Comparison of the susceptibility of nine bread wheats to Pyrenophora tritici-repentis in the field'or in greenhouse experiments and their reaction to necrosis toxin infiltration.
CultivarsP. tritici-repentis resistance
in field and greenhouseReaction to necrosis
toxin infiltration2
CIANOGUAMUCHllHARTOGNDNG9144/1KALjBB/3/yACO/4/CHllBH1146AlD/COC//URESSHA8//PRLjVEE#6VICAM
SusceptibleSusceptibleSusceptibleSusc eptible
Semi-resistantResistantResistantResistant
+++o+ooo
1 Source: E. Duveiller, personal communication.2 +Necrosis expression; 0Absence of necrosis.
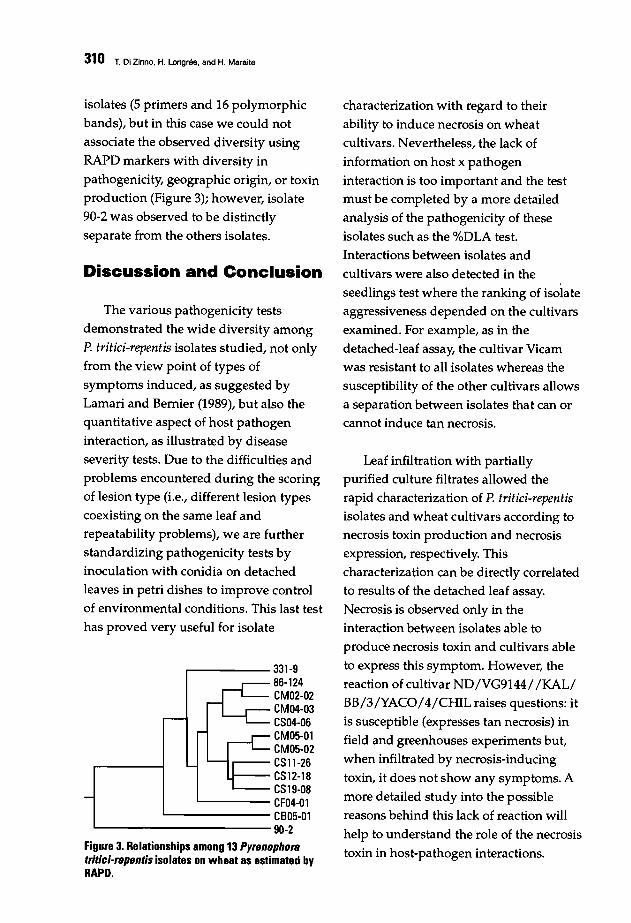
310 T. Oi Zinno, H. Long"le, and H. Maraile
isolates (5 primers and 16 polymorphic
bands), but in this case we could not
associate the observed diversity using
RAPD markers with diversity in
pathogenicity, geographic origin, or toxin
production (Figure 3); however, isolate
90-2 was observed to be distinctly
separate from the others isolates.
Discussion and Conclusion
The various pathogenicity tests
demonstrated the wide diversity among
P. tritici-repentis isolates studied, not only
from the view point of types of
symptoms induced, as suggested by
Lamari and Bernier (1989), but also the
quantitative aspect of host pathogen
interaction, as illustrated by disease
severity tests. Due to the difficulties and
problems encountered during the scoring
of lesion type (Le., different lesion types
coexisting on the same leaf and
repeatability problems), we are further
standardizing pathogenicity tests by
inoculation with conidia on detached
leaves in petri dishes to improve control
of environmental conditions. This last test
has proved very useful for isolate
.------- 331-986-124CM02-02CM04-03CS04-06CM05-01CM05-02CSl1-26CS12-18CS19·08
L...- CF04-01L...- CB05-01
L...- 90-2
Figure 3. Relationships among 13 Pyrenophoratritici-repentis isolates on wheat as estimated byRAPD.
characterization with regard to their
ability to induce necrosis on wheat
cultivars. Nevertheless, the lack of
information on host x pathogen
interaction is too important and the test
must be completed by a more detailed
analysis of the pathogenicity of these
isolates such as the %DLA test.
Interactions between isolates and
cultivars were also detected in the
seedlings test where the ranking of isolate
aggressiveness depended on the cultivars
examined. For example, as in the
detached-leaf assay, the cultivar Vicam
was resistant to all isolates whereas the
susceptibility of the other cultivars allows
a separation between isolates that can or
cannot induce tan necrosis.
Leaf infiltration with partially
purified culture filtrates allowed the
rapid characterization of P. tritici-repentisisolates and wheat cultivars according to
necrosis toxin production and necrosis
expression, respectively. This
characterization can be directly correlated
to results of the detached leaf assay.
Necrosis is observed only in the
interaction between isolates able to
produce necrosis toxin and cultivars able
to express this symptom. However, the
reaction of cultivar ND IVG9144 I lKALI
BB/3/YACO/4/CHIL raises questions: it
is susceptible (expresses tan necrosis) in
field and greenhouses experiments but,
when infiltrated by necrosis-inducing
toxin, it does not show any symptoms. A
more detailed study into the possible
reasons behind this lack of reaction will
help to understand the "role of the necrosis
toxin in host-pathogen interactions.
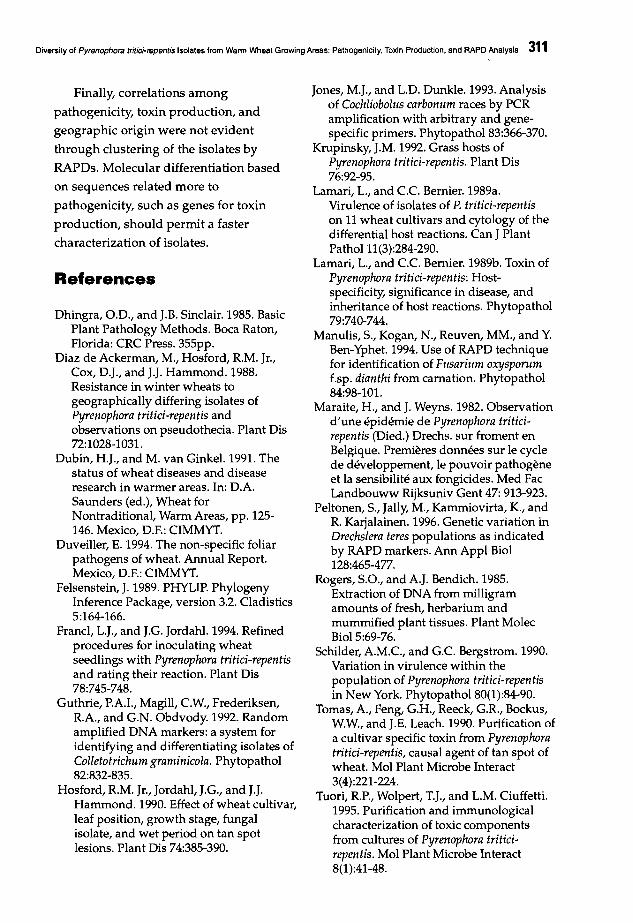
Diversity of Pyrenophora Iritici-repentis Isolates from Warm Wheat Growing Areas: Pathogenicity, Toxin Production. and RAPD ~nalYSiS 311
Finally, correlations among
pathogenicity, toxin production, and
geographic origin were not evident
through clustering of the isolates by
RAPOs. Molecular differentiation based
on sequences related more to
pathogenicity, such as genes for toxin
production, should permit a faster
characterization of isolates.
References
Dhingra, O.D., and J.B. Sinclair. 1985. BasicPlant Pathology Methods. Boca Raton,Florida: CRC Press. 355pp.
Diaz de Ackerman, M., Hosford, RM. Jr.,Cox, D.J., and J.J. Hammond. 1988.Resistance in winter wheats togeographically differing isolates ofPyrenophora tritici-repentis andobservations on pseudothecia. Plant Dis72:1028-1031.
Dubin, H.J., and M. van Ginkel. 1991. Thestatus of wheat diseases and diseaseresearch in warmer areas. In: D.ASaunders (ed.), Wheat forNontraditional, Warm Areas, pp. 125146. Mexico, D.E: CIMMYT.
Duveiller, E. 1994. The non-specific foliarpathogens of wheat. Annual Report.Mexico, D.E: CIMMYT.
Felsenstein, J. 1989. PHYLIP. PhylogenyInference Package, version 3.2. Cladistics5:164-166.
Francl, L.J., and J.G. Jordahl. 1994. Refinedprocedures for inoculating w~~~t .seedlings with Pyrenophora tntlcl-repentlsand rating their reaction. Plant Dis78:745-748.
Guthrie, P.AI., Magill, C.W, Frederiksen,RA, and G.N. Obdvody.1992. Randomamplified DNA markers: a system foridentifying and differentiating isolates ofColletotrichum graminicola. Phytopathol82:832-835.
Hosford, RM. Jr., Jordahl, J.G., and J.J.Hammond. 1990. Effect of wheat cultivar,leaf position, growth stage, fungalisolate, and wet period on tan spotlesions. Plant Dis 74:385-390.
Jones, M.J., and L.D. Dunkle. 1993. Analysisof COc1lliobolus carbonum races by PCRamplification with arbitrary and genespecific primers. Phytopathol 83:366-370.
Krupinsky, J.M. 1992. Grass hosts ofPyrenophora tritici-repentis. Plant Dis76:92-95.
Lamari, L., and c.c. Bernier. 1989a.Virulence of isolates of P. tritici-repentison 11 wheat cultivars and cytology of thedifferential host reactions. Can J PlantPathol11(3):284-290.
Lamari, L., and c.c. Bernier. 1989b. Toxin ofPyrenophora tritici-repentis: Hostspecificity, significance in disease, andinheritance of host reactions. Phytopathol79:740-744.
Manulis, 5., Kogan, N., Reuven, MM., and Y.Ben-Yphet. 1994. Use of RAPD techniquefor identification of Fusarium oxysporumf.sp. dianthi from carnation. Phytopathol84:98-101.
Maraite, H., and J. Weyns. 1982. Observationd'une epidemie de Pyrenophora triticirepentis (Died.) Drechs. sur froment enBelgique. Premieres donnees sur Ie cyclede developpement, Ie pouvoir pathogeneet la sensibilite aux fongicides. Med FacLandbouww Rijksuniv Gent 47: 913-923.
Peltonen, 5., Jally, M., Kammiovirta, K., andR Karjalainen. 1996. Genetic variation inDrechslera teres populations as indicatedby RAPD markers. Ann Appl BioI128:465-477.
Rogers, 5.0., and AJ. Bendich. 1985.Extraction of DNA from milligramamounts of fresh, herbarium andmummified plant tissues. Plant MolecBioi 5:69-76.
Schilder, AM.C., and Gc. Bergstrom. 1990.Variation in virulence within thepopulation of Pyrenophora tritici-repentisin New York. PhytopathoI80(1):84-90.
Tomas, A., Feng, GH., Reeck, GR, Bockus,WW, and J.E. Leach. 1990. Purification ofa cultivar specific toxin from Pyrenophoratritici-repentis, causal agent of tan spot ofwheat. Mol Plant Microbe Interact3(4):221-224.
Tuori, RP., Wolpert, T.J., and L.M. Ciuffetti.1995. Purification and immunologicalcharacterization of toxic componentsfrom cultures of Pyrenophora triticirepentis. Mol Plant Microbe Interact8(1):41-48.
312
Role of Root Exudates and Toxins inSusceptibility of Yemeni Wheat Varietiesto Cochliobolus sativus
A.A. Hassan and TI. HackDepartment of Biological and Nutritional Sciences, University of Newcastle,Newcastle upon Tyne, UK
Abstract
The pathogenicity ofeight isolates ofCochliobolus sativus (Bipolaris sorokiniana) (sixfrom Scottish barley, one from Yemeni barley, and one from Yemeni wheat) was tested on rootsand leaves ofeight Yemeni wheat cultivars. There were significant differences in resistanceamong cultivars and in pathogenicity among isolates, but no evidence ofstrong hostspecialization. The most resistant cultivar, Sonalica, and the most susceptible, Mohtar, wereselected to study possible resistance mechanisms. Root exudates may influence how successfullythe pathogen grows before infection takes place. Compared to deionized water, root exudates oflO-day-old seedlings ofMohtar promoted spore germination and growth ofc. sativus, whereasroot exudates of Sonalica were inhibitory. The Mohtar exudates contained significantly higherlevels ofwater-soluble carbohydrate and total nitrogen than corresponding Sonalica exudates,with different sugar and amino acid composition. When seedlings ofMohtar and Sonalica weregrown in water culture with C. sativus, the Mohtar seedlings became chlorotic and were killedmuch more quickly than the Sonalica seedlings, suggesting that they were more sensitive totoxins produced by the pathogen. We compared the effects ofculture filtrates from two pathogenisolates on seed germination, seedling growth, and leaves ofMohtnr and Sonalica. Filtrates fromboth isolates were much more toxic to Mohtar than to Sonalica, although toxicity was reducedby neutralization of the filtrate.
313
Characterization of Cochliobolus safivusIsolates from the UK and Yemen
E. Hack, K. Emami, and A.A. Hassan
Department of Biological and Nutritional Sciences, University of Newcastle,
Newcastle upon Tyne, UK
Abstract
The properties ofsix isolates ofCochliobolus sativus (Bipolaris sorokiniana) from barleyin Scotland, one isolate from Yemeni barley with black point disease, and one from Yemeniwheat with black point disease were compared. The eight isolates differ in pathogenicity, conidiasize, growth rate, and response to temperature; only the isolate from Yemeni wheat was able togrow well at 35 "C. All isolates were all able to produce xylanase when grown in culture. Tocompare genes coding for cell-wall-degrading enzymes in the different isolates, total DNA wasdigested with several restriction enzymes and probed with XYLl and PGNI cDNAs ofC.carbonum. Southern hybridization patterns were similar for all isolates except the one fromYemeni wheat, and were distinct from those obtained with DNA of the related species C.
heterostrophus. DNA ofall eight isolates and ofc. heterostrophus could be amplified by thepolymerase chain reaction (peR) with sequences from the C. sativus XYL2 gene as primers.DNA ofmost isolates gave two bands; sequence analysis showed that these correspond to theXYLl gene (with one intron) and the XYL2 gene (with two introns) ofC. carbonum. DNA ofthe isolate from Yemeni wheat, however, also gave a third, smaller baizd. DNA ofC.heterostrophus gave two bands, but one corresponds to XYLl and the other co-migrates with thethird band of the Yemeni wheat isolate ofc. sativus.
314
A Xylanase Gene from Cochliobo/ussafivus
K. Emami and E. Hack
Department of Biological and Nutritional Sciences, University of Newcastle,
Newcastle upon Tyne, UK
Abstract
Cell-wall-degrading enzymes are expected to be important in pathogenesis by Cochliobolus
sativus (Bipolaris sorokiniana). The xylanase activity ofan isolate from barley was assayed in
five different culture media. The highest activity was in Fries' medium containing 2% oat speltxylan, 3% cellulose, and 4% peptone. To investigate genes coding for cell-wall-degradingenzymes in C. sativus, total DNA was digested with restriction enzymes and probed with C.
carbonum XYLl and PGN1 cDNAs, coding for a xylanase and an endo-polygalacturonase.The hybridization patterns indicate that C. sativus has genes resembling both. A cDNA librarywas constructed from mRNA ofC. sativus grown on xylanase-inducing medium, and screenedwith C. carbonum XYLl cDNA. All xylanase-encoding clones identified in this way weremore similar to a second C. carbonum xylanase gene, XYL2, than to XYLl. Part of the C.
sativus xylanase gene corresponding to the clones was amplified by the polymerase chainreaction (PCR), and found to have two introns like C. carbonum XYL2. Amplification withreduced stringency gave a second PCR product; DNA sequencing showed that it is derived fromthe C. sativus homologue of the C. carbonum XYLl gene, with a single intron. The 5¢ and 3¢
flanking regions of the C. sativus XYL2 homologue were amplified by inverse PCR. Theresemblance between the C. sativus and C. carbonum XYL2 sequences extends to the ends ofthe reported C. carbonum sequence.
Most microbial plant pathogens can
produce extracellular enzymes that
degrade plant cell wall carbohydrates
(Bateman 1976). Although the role of such
cell-wall-degrading enzymes (CWDEs) in
pathogenesis is not yet fully understood,
initial penetration of plants and tissue
maceration through host cell wall
degradation are two phenomena that can
be attributed to their production.
Penetration of cell walls may also occur
through mechanical pressure, and
CWDEs may assist in this process. In
some instances, CWDEs have been
shown to have an additional effect, acting
as elicitors of plant defence responses.
CWDEs of plant pathogens seem to be a
suitable model system for molecular
manipulation approaches to
understanding hQst-pathogen interactions
(Yoder 1985).
It is estimated that xylans make up
one-third of all renewable organic carbon
available on earth (Prade 1995). Not
surprisingly, therefore, xylanase
production is widespread among
saprotrophic organisms. Besides
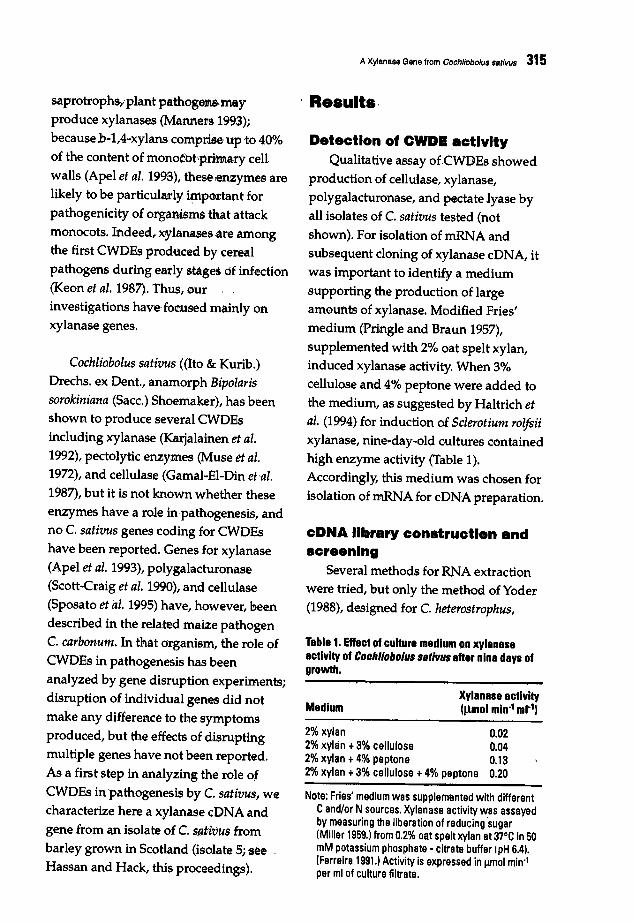
A Xylanase Gene from eoch/lobolus sal/vus 315
, R.sults.
Tablat Effact \tf.cultura madlum lin xylanasaactivity of. Coeb//obo/us sst/ruB aftar nina days of.growth.
2% xylan 0.022% xylan +3% cellulose 0.042% xylan +4% peptone 0.132% xylan +3% cellulose +4% peptone 0.20
Note: Fries' medium was supplemented with differentCand/or Nsources. Xylanase activity was assayedby measuring the liberation of reducing ·sugar(Miller 1959.) from 0.2% oat spelt xylan at 37°C in 50mM potassium phosphate - citrate buffer (pH 6.41.(Ferreira 1991.1 Activity is expressed in ~ol min"per ml of culture filtrate.
Xylanasa activity(Jlmol min" ml")Madium
cDNA library construction andscreening
Several methods for RNA extractionwere tried, but only the method of Yoder(1988), designed for C. heterostrophus,
Detectlonot CWDI activityQualitative assay ofCW'DEs showed
production of cellulase, xylanase,polygalacturonase, and pectate lyase byall isolates of C. sativus tested (notshown). For isolation of mRNA andsubsequent cloning of xylanase cDNA, itwas important to identify a mediumsupporting the production of largeamounts of xylanase. Modified Fries'medium (Pringle and Braun 1957),supplemented with 2% oat spelt xylan,induced xylanase activity. When 3%cellulose and 4% peptone were added tothe medium, as suggested by Haltrich etal. (1994) for induction of Sclerotium rolfsiixylanase, nine·day-old cultures containedhigh enzyme activity (Table 1).Accordingly, this medium was chosen forisolation of mRNA for cDNA preparation.
Cochliobolus sativus «Ito & Kurib.)Drechs. ex Dent., anamorph Bipolarissorokiniana (Sacc.) Shoemaker), has beenshown to produce several CWDEsincluding xylanase (Karjalainen et al.1992), pectolytic enzymes (Muse et al.1972), and cellulase (Gamal-EI-Din et·aI.1987), but it is not known whether theseenzymes have a role in 'pathogenesis, andno C. sativus genes coding for CWDEshave been reported. Genes for xylanase(Apel et al. 1993), polygalacturonase(Scott-eraig et al. 1990), and cellulase(Sposato et al. 1995) have, however, been
described in the related maize pathogenC. carbonum. In that organism, the role ofCWDEs in pathogenesis has beenanalyzed by gene disruption experiments;disruption of individual genes did notmake any difference to the symptomsproduced, but the effects of disruptingmultiple genes have not been reported.As a first step in analyzing the role ofCWDEs in pathogenesis by C. sativus, wecharacterize here a xylanase cDNA and
gene from an isolate of C. sRtivus frombarley grown in Scotland (isolate 5; 'SeeHassan and Hack, this proceedings).
saprotrophs,:plant pathogelllunayproduce xylanases (Manners 1993);because b-l,4-xylans comprise up to 40%of the content of monocbt\pmary cellwalls (Apel et al. 1993), these ,enzymes arelikely to be particularly ~portant forpathogenicity of organislt\s that attackmonocots. Indeed" xylanases ,are amongthe first CWDEs produced by cerealpathogens during early stages df infection(Keon et al. 1987). Thus, .ourinvestigations have· focused mainly onxylanase genes.
316 K. Emami and E. Hack
gave good quality RNA. The mRNA was
purified by oligo(dT)-cellulose column
chromatography (Pharmacia mRNA
purification kit). cDNA was synthesized
(Stratagene cDNA synthesis kit) and
cloned in the EcoRI and XhoI cloning sites
of the I ZAP vector (Stratagene Zap
cDNA Gigapack III Gold Cloning Kit).
In order to identify xylanase clones,
the resulting library was probed with
radiolabeled C. carbonum XYLl cDNA,
since this probe had been shown to
hybridize to C. sativus DNA on Southern
blots (Hack et al., this proceedings).
Several strong positive signals were
observed. For further analysis, the phage
identified in this way were converted into
plasmids (Short et al. 1988) in E. coli strain
SOLR' (Stratagene).
Xylanase production bytransformed bacteria
Plate assays were carried out to
determine whether there was any
xylanase activity in transformed E. coli
cells containing putative C. sativusxylanase cDNA. Transformants were
grown overnight on LB mediumcontaining 25mg ml-1 ampicillin, at 37°C
and 200 rpm. Cell-free extracts of the
bacteria were placed in wells in agar
plates containing 20 ml of 0.1%
solubilized oat spelt xylan, 0.8% agar. For
some transformants, Congo red staining
of the plates and subsequent destaining
with 1 M NaCl revealed xylanase activity
as clear zones against a red background,
showing that these transformants did
indeed contain xylanase activity.
Sequencing of xylanase cDNAPlasmids were isolated from
positively transformed E. coli cells,
digested with EcoRI and XhoI, analyzed
by agarose gel electrophoresis, and
screened again by Southern hybridization
with XYLl cDNA of C. carbonum, in order
to confirm the identity of the inserts and
estimate their size. Six clones were
sequenced (Perkin Elmer Sequencer). The
longest of these had an 861-bp insert.
Although not all inserts were the same
length, all corresponded to a single gene
product, which contains an open reading
frame of 693 bp (Figure 1). The cDNA
sequence is similar to C. carbonum XYLl
(Apel et al. 1993), as expected, but it
shows greater similarity to another C.carbonum xylanase gene, XYL2 (Ee. Apel
Birkhold and J.D. Walton, unpublished,
GenBank/EMBL accession number
U58915, submitted 1996) - it is 96%
identical to XYL2, but only 59% identical
to XYLll - suggesting that it is the C.sativus counterpart of C. carbonum XYL2.
Consistent with this suggestion, the
predicted translation product is 98%
identical to the C. carbonum XYL2 gene
product (Figure 2), but only 66% identical
to the C. carbonum XYLl gene product.
IntronsIn C. carbonum, the XYLl gene has a
single intron, whereas the XYL2 gene has
two. To identify introns in C. sativus
xylanase genes, two primers were
designed to correspond to sequences
common to the C. sativus cDNA and both
the XYLl and XYL2 genes of C.
carbonum2• These primers were used to
amplify C. sativus genomic DNA by the

A Xylanase Gene from Coch/iobolus sativus 317
1 ATATTTTGGG CAGGACCGTG TTCCAACCGG TGGTTAACTG AAAGATTGCC CGAGATTTCC CGCCTAGAGC CTTCTGTGTC81 CTGTTCACGT GTGATACTAC CCCTGATCGA TTCCTCGTCT ATGCATGTTT TAGCCCCGAT TGAAGTCCCT TCTTGGGCTG
161 TGAAAGCATA TGGGGAGTGT GGGGTAGGGT GTCTGCACTT ATTTCTGTGG CGTTCCCTTT ATATTAACGT CCTCGAAACC241 CGGTTCAAAC AGCGCGTAAA CCCGGGTAGA GCGATGTTCT GTTAATTATG TTATGCAGAT TTACGC.AGGG CTACGGATCT
C. carbonum 1 CCCGGGTAGA GCGATGTTCT TTTAATTATG TTATGCAGAT TTACGCAAGGG CTACAGATCT
321 TTTTGATCAC CCCGTGGTGG CTGTTGCTAC CGAAACTGGA TGCCGATCGG TGCATGTTCC CTATGTGTCT CGACTTGGTC
62 TTTTGATCAC CCCGTCGTGG CCGTTGCTAC CGAAACTGGA TGCCGATCGG TGCATGTCCC CTATGTGTCT CGACTTGGTC
401 ATTGTGGCCG CCGCTTAGGG CGAGGTTGTC GAAGTGAGAG GCTCTAACCT ACCACCAATG TGTACACCAT CACGAATAGA
142 ATTGTGGCCG CCGCTTAGGG TGAGCTTGTC GAAGTGAGAG GCCTTAACCT ACCACCAATG TGTACACCAT CACGAATAGA
481 GACAACACGT GAGACGAGAC CTCATGACCC CCCAGTATCA TTTCATCCTG CGATTCAGGC TCAACTATTA CTCGGCGTAG
222 GACAGCACGC GAGATGAGAC CTCATGA.CC ACCAGTGTCA TTTCATCCTG CGATTCAGGC TCAACTATTA CTCGGCGTAG
561 AGATATAAGT TGATAGCTGC TCCCAGTCAG TAGCATCACT GCATCCAACA CAGATCAGCA ACACTCAACA CAAGATGGTT
301 AGATATAAGT CGATAGCTGC TCCCAGTCAG TAGCATCACT GCATCCAACA CAGATCAGCA ACACTCAACA CAAGATGGTT
641 TCCTTCAAGT CTCTGCTTCT CGCCGCTGTG GCTACCACCA GTGTCCTCGC TGCTCCCTTC GACTTCCTTC GTGAGCGCGA
381 TCCTTCAAGT CTCTGCTTCT CGCCGCTGTG GCTACCACCA GCGTCCTCGC TGCTCCCTTC GATTTCCTTC GTGAGCGCGA
721 CGATGGCAAC GCGACTGCTC TCCTTGAGAA GCGTCAGT~ ACTCCCAGCT CTGAGGGATA CCACAACGGA TACTTCTACT
461 CGATGTCAAC GCGACTGCTC TCCTTGAGAA GCGTCAGTCT ACTCCCAGCG CCGAGGGATA CCACAATGGA TACTTCTACT
801 CGTGGTGGAC TGATGGCGGC GGCTCTGCCC AGTACACCAT GGGTGAGGGC AGCAGGTACT CCGTGACCTG GAGGAACACT
541 CGTGGTGGAC TGATGGCGGT GGCTCTGCCC AGTACACTAT GGGTGAGGGC AGCAGGTACT CTGTGACCTG GAGGAACACT
881 GGCAACTTTG TTGGTGGCAA GGGATGGAAC CCTGGAACCG ~GTAGGT TGCGAAGACT GGTTGCTGAT TAGAATTTTA
621 GGCAACTTTG TTGGTGGAAA GGGGTGGAAC CCTGGAAGCG GCCGGTAGGT TGCGAAGACT GTTTGGTGAT GAGAATCTTA
961 CTAATGTGAC TTCGTAGTGT CATCAACTAC GGCGGAGCTT TCAACCCCCA GGGCAACGGA TACCTCGCTG TGTACGGATG
701 CTAATGTGGA TTCGTAGT3T CATCAACTAC GGCGCAGCCT TCAACCCCCA GGGCAACGGA TACCTCGCTG TGTACGGATG
1041 GACCCGCAAC CCGCTTGTCG AGTACTACGT AATTGAATCC TACGQAACCT ACAACCCCAG CAGTGGAGCC CAGGTCAAGG
781 GACCCGCAAC CCGCTTGTCG AGTACTACGT GATTGAATCC TACGGAACCT ACAACCCCAG CAGTGGAGCC CAAATCAAGG
1121 GAAGCTTCCA GACTGACGGT GGTACTTACA ACGTTGCCGT CTCCACCCGT TACAACCAGC CCTCCATTGA CGGAACAAGG
861 GCAGCTTCCA GACCGACGGT GGTACTTACA ACGTTGCCGT CTCCACCCGT TACAACCAGC CCTCCATTGA CGGAACAAGG
1201 ACCTTTCAGC ~GTA AGTCATTTTG GTGTTTGATT CAACAGAAGC GTAGATTCTG ACTATTGTGA TA~
941 ACCTTTCAGC AGTACTGGTA AGTCATTTCG GTGTTTAATC AGACAGAAGC GTAGATGTTG ACTGTTATGA TAGGTCTGTC
128f CGCCAACAGA AGCGTGTCGG TGGAAGCGTG AACATGCAGA ACCACTTCAA CGCTTGGTCT CGCTATGGCT TGAACCTTGG
1021 CGCACCCAGA AGCGTGTCGG TGGAAGCGTG AACATGCAGA ACCACTTCAA CGCTTGGTCT CGCTATGGCT TGAACCTTGG
1361 TCAACACTAC TACCAGATCG TCGCCACTGA GGGTTACCAG TCTTCCGGAA GCTCTGACAT CTACGTGCAG ACTCAGTAQA
1101 TCAACACTAC TACCAGATCG TCGCCACTGA GGGTTACCAG TCCTCTGGAA GCTCTGACAT CTATGTGCAG ACTCAGTAGA
1441 GGAGTTGTTG TCTGTGGAGC GAGCAACTAG CAGACGAGAT CAGACAAGAA TAGTGCCTCG GATAGTTGTG AGCAAATTGG
1181 GTAGTTGTTG TCTGTGAAGC GAGCAACTAG TAGACGAGAT TAGACAAGAA TAGTGTCTCG GATAGTTGTA AGCAGGTTGG
1521 AGAAAGAGCG ATGCGTTCGA GTTACTGTAC CTAGAAbCAT GTCAATTCAC TCGCTArAAA AIATTCCGTT CTCGAATTTG
1261 AGAAAGAGCG ATGTGTTCGA TTTCCTGTAC ATAGAAACAT GTCAATTCAC TCGCTATAAA ACCTTCCGTC CTCGAATGTG
1601 TTCTTTTTTT TTTGGAGTAT TTGAGCATGG TATCATGCTG CAGCAAAAGC AGCTAGAATC TAAGTGAGGT AGAAAACGAA
1341 TTC .... TCT TTTGTATTAG CTGAGCATTG TATCGTGGTT CGGCAAAAGC AGGTAAAGTT TAGGTGAGGG CATTTGTTAT
1681 AATCATGAAG TAGCTAGCAT GATGATGGCG CAATAGCACT TTGCCCCAGT AGGCGCACTA ATGTGTTGAT TTCACAGGGG
1417 AAACAGTCAT AGTCTCGTAG CCATCGAATG CTGGTGTGTG AATTC
1761 TGCCTTGACG ATCGTTTTGT GTATAGCTGA CTCATGGAGA CTTGTATTGC AGACCGTCTT AGTCCAGTAG CCATAGAATG1841 CTGGTATGAG TTCGACGTAG CTAACACATG TGTGCTGACT GAGCGGTTTT CTCCTCTCAT CTACTAACCA GCAACAGCAT1921 ACTACTCTTG TTTGGCAACT TTACATTTTG TTAAAGACAT TCGTTCCAGT CATATATTGT TCCGTGCCCT CTCTCATCCT2001 GCCTTCAGTC TCCATGTTAT AACTGTCCTC GGTGACATGA ACTCATCAGT TAGTCCTTCC AATAATACGC TATTTTGGCG2081 CCTCCAGCCT CGGCCATGAG GTCGAAGCAT TCGCCAGACT CACTGCCTGG CCTTTTCCAA AACGGCCAAG ACCACCATCG2161 AACCAACGTG CCTGCTCCCT TCGAACTTCC CTAAAGCCGG AATTCCCAGC A
Figure 1. Nucleotide sequence ofthe Cochliobolus sativus XYL2 gene. aligned with the C. carbonum XYL2 genesequence; dots indicate identical residues. Italics show the introns. The start and stop codons are in bold. Thecloned C. sativus cDNA sequence is underlined. Single overlines indicate positions of primers for amplifying themiddle part of the gene. including the introns; double overlines indicate positions of primers for inverse peR.
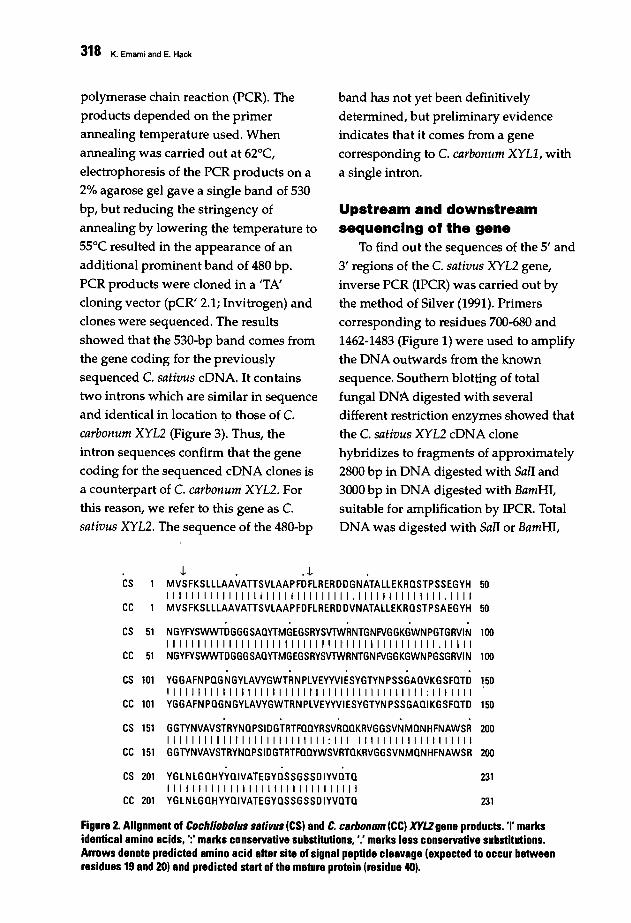
318 K. Emami and E. Hack
polymerase chain reaction (PCR). The
products depended on the primer
annealing temperature used. When
annealing was carried out at 62°C,
electrophoresis of the PCR products on a
2% agarose gel gave a single band of 530
bp, but reducing the stringency of
annealing by lowering the temperature to
55°C resulted in the appearance of an
additional prominent band of 480 bp.
PCR products were cloned in a 'TA'
cloning vector (pCR' 2.1; Invitrogen) and
clones were sequenced. The results
showed that the 530-bp band comes from
the gene coding for the previously
sequenced C. sativus cDNA. It contains
two introns which are similar in sequence
and identical in location to those of C.
carbonum XYL2 (Figure 3). Thus, the
intron sequences confirm that the gene
coding for the sequenced cDNA clones is
a counterpart of C. carbonum XYL2. For
this reason, we refer to this gene as C.
sativus XYL2. The sequence of the 480-bp
band has not yet been definitively
determined, but preliminary evidence
indicates that it comes from a gene
corresponding to C. carbonum XYLl, with
a single intron.
Upstream and downstreamsequencing of the gene
To find out the sequences of the 5' and
3' regions of the C. sativus XYL2 gene,
inverse PCR (IPCR) was carried out by
the method of Silver (1991). Primers
corresponding to residues 700-680 and
1462-1483 (Figure 1) were used to amplify
the DNA outwards from the known
sequence. Southern blotting of total
fungal DN~ digested with several
different restriction enzymes showed that
the C. sativus XYL2 cDNA clone
hybridizes to fragments of approximately
2800 bp in DNA digested with Sall and
3000 bp in DNA digested with BamHI,
suitable for amplification by IPCR. Total
DNA was digested with Sall or BamHI,
.J. . .J.CS MVSFKSLLLAAVATTSVLAAPFDFLRERDDGNATALLEKRQSTPSSEGYH 50
111111111111111111111111111111.11111111111111.1111CC MVSFKSLLLAAVATTSVLAAPFDFLRERDDVNATALLEKRQSTPSAEGYH 50
CS 51 NGYFYSWWTDGGGSAQYTMGEGSRYSVTWRNTGNFVGGKGWNPGTGRVIN 10011111111111111111111111111111111111111111111.11111
CC 51 NGYFYSWWTDGGGSAQYTMGEGSRYSVTWRNTGNFVGGKGWNPGSGRVIN 100
CS 101 YGGAFNPQGNGYLAVYGWTRNPLVEYYVIESYGTYNPSSGAQVKGSFQTD 150111111111111111111111111111111111111111111: 11I1111
CC 101 YGGAFN PQG NGYLAVYGWTRN PLVEYYVI ESYGTYN PSSGAQI KGSFQTD 150
CS 151 GGTYNVAVSTRYNQPSIDGTRTFQQYRSVRQQKRVGGSVNMQNHFNAWSR 20011111111111111111111111111: III 1111111111111111111
CC 151 GGTYNVAVSTRYNQPSIDGTRTFQQYWSVRTQKRVGGSVNMQNHFNAWSR 200
CS 201 YG LN LG QHYYQIVATE GYQSSGSSD IYVQTQ 2311111111111111111111111111111111
CC 201 YG LN LG QH YYQIVATEGYQSSGSSD IYVQTQ 231
Figure 2. Alignment of Cochliobolus sativus (CS) and C. carbonum (CC) XYU gene products. 'I' marksidentical amino acids, ':' marks conservative substitutions, ',' marks less conservative substitutions.Arrows denote predicted amino acid after site of signal peptide cleavage (expected to occur betweenresidues 19 and 20) and predicted start of the mature protein (residue 40).

A Xylanase Gene from Cochllobolus sat/vus 319
then self~ligated to give a cirliulaf,
template. Both templates gavB,prod,ucts
when used for IPCR. DNA digested with
Sail was chosen for furtllter analysis;further cutting of the, ligated DNA withSeal gave a template that was more
efficient for amplification than circular
DNA. The >2000~bp product of the IPCRwas cloned in pCR' 2..1 and sequenced,
giving another 612 base pairs of the 5'and 629 base pairs of the 3' flankingregions of the C. sativus XYL2 gene(Figure 1).
Dlscu••ion
We have determined the sequence of atotal of 2211 bp ofaxylanase gene from C.
sativus. This gene codes for a xylanase of
glycosyl hydrolase family 11 (Henrissat1991). Although the gene was originallydetected with a C. earbonum XYL1 probe,
it is more similar to XYL2 (91% identity at
the genomic DNA level; Figure 2) than to
XYLl of that furtgus (50% identity at thegenomic DNA level). On the 5¢ side,
XYL2 of C. earbonum and C. sativus are
very similar for as far as the C. earbonumsequence has been reported; oil the 3¢
side, the sequences become completely
different about 90 bp beyond the
polyadenylation site. The high level ofsimilarity between XYL2 of C. earbonumand C. sativus is consistent with otherevidence that these species are closelyrelated (Jones and Dunkle 1993).
Coehiiobolus sativus XYL2 can, however, bedistinguished from C. earbonum XYL2 by
its possession of a single internal HindIIIrestriction site (AAGCTT at position1122).
When the translated coding sequencewas compared to protein sequences in the
OWL database (Bleasby et al. 1994), themost similar. sequence was C. earbonum
XVNB':'!A$Ii1AKXYN2_ASPNG
......---XYN1_EMENI-----XYN2_EMENI___"""", C. sativus XYL2
......_-1 C. carbonum XYL2.....---XYN1_HUMIN
r__C==APEI4BXYL
XYN1_CQCCA.....1--- CEMXAl....-----CEMXB2
L...-------XYN2_MAGGR
Figure 3. p"ndropram of l(ylanllse sequen.ces similar toCocb/lobo/us sat/vlls XYI.2, produced by the GCGprogram PILEUP. B'ranch lengths are proportional todistanc,ell betwlten sequences. El(cept for C. sBtlvusand C. cBrbonulIJ XYU. all abbreviations iut as in theOWL composite protein sequence database (Bleasby BtBI.19941. The xylanases are from: XYNB_ASPAK•AspBrglllus BWBmori (var. k!lWBCh~; XYN2_ASPNG,AspBrglllus nigBr; XYN1_EMENI and XYN2_EMENI.EmBricBI/. nldulBns (AspBrglllus nldulBnsl;XYNCHUMIN, HumicolBlnsolBns, APE14BXYL,AscochytB plsi; XYN1_COCCA, Cochliobo/us cBrbonum(xylanase I); CEMXA1 and CEMXB2, ChBBtomiumgrBcils; XYN2_MAGGR. MBgnBporthB grisBB.
1 Sequence comparisons were carrietl out with the GCG program GAP (Devereux 8t 8/. 1984; Program Manual forthe Wisconsin Package. Version 8. August 1994. Genetics Computer GrQU~. 575 Science Drive, Madison,Wisconsin 53711, USA). The calculation of percentage identity ignores Inserti'ons and deletions in thesequences\
2 Forward,5e-TGTAAAACGACGGCCAGT-Gl3CAAGGGATGGAACC-3eReverse, 5e-CAGGAAACAGCTA1GACC-GCGACGATCTGGTAGTAGTG-3eThe 5e 18 nucleotides of eaoh primer are derlvedifrom bacteriophage M13. foru,e in direct sequencing of PCRproducts. Direct sequencing did not, howelle,/ gjvll reliable F9.Sults. The last 16 nucleotides of the forward primercorrespond to residues 896-911 of the genomic sequence (Figure 21. the last 20 nucleotides of the reverse primerto residues 1384-1365.'

320 K. Emami and E. Hack
XYL2. The next most similar sequence
was not C. carbonum XYLl but the XYLlxylanase of Humicola insolens (Dalbege
and Heldt-Hansen 1994). Multiple
comparison among xylanase sequences(Figure 3) shows that C. sativus XYL2, C.
carbonum XYL2, and H. insolens XYLl
form a group of sequences resemblingone another more closely than any other
xylanase in the database. Cochlioboluscarbonum XYL1, in contrast, is mostsimilar to a xylanase of Ascochyta pisi (P.S.
Lubeck et al., unpublished, GenBanklEMBL accession number Z68891,submitted 1996). That XYLl and XYL2 of
C. carbonum resemble xylanases of other
fungi more than each other suggests thatthe XYLl-type and XYL2-type xylanasegenes diverged in a common ancestor of
all these fungi. The XYL2 genes of C.
carbonum and C. sativus are the only
reported fungal genes coding for family11 xylanases that have two introns: allothers have a sIngle intron in
approximately the same position as thefirst intron of XYL2. For H. insolens XYLl,only the cDNA sequence has been
reported, but the similarity of the proteinto Cochliobolus XYL2 suggests that this
gene, too, may have two introns. Since H.insolens and Cochliobolus species are
probably not closely related, xylanasegenes of this sub-family may bewidespread among fungi.
Karjaleinen et al. (1992) purified and
determined the amino-terminal sequence
ofaxylanase produced by C. sativus inliquid culture. This enzyme is in a
different family of glycosyl hydrolasesfrom XYL2, probably family 10. Thus, C.
sativus has the ability to synthesize at
least two different kinds of xylanase. Apelet al. (1993) reported that in C. carbonumcultures, XYLl is the most highlyexpressed xylanase gene. Cochliobolussativus probably possesses a XYLl-typegene, since a genomic sequence with one
intron was amplified by PCR. Our resultssuggest, however, that in C. sativus, XYL2is more strongly expressed than XYLl, at
least under the culture conditions weused: all six cDNA clones we identified
using XYLl as probe were of the XYL2type, not the XYLl type. In the future, it
.will be important to examine the roles of
the various xylanase gene products in
degradation of cell walls in infectedplants. Since H. insolens is not a plant
pathogen, there does not appear to be a
specific association between genes of theXYL2 type and pathogenicity. Preliminaryresults indicate, however, that XYL2 is
expressed in infected plants, suggestingthat it plays a part in pathogenesis.
Acknowledgments
We thank Dr. J. Chard, Scottish
Agricultural Science Agency, for C. sativusisolates; Dr. J. D. Walton, Michigan State
University, for cDNA clones of C.
carbonum CWDEs; Professor H. J. Gilbert,University of Newcastle, for a sample of
xylanase from Pseudomonas fluorescenssubsp. cellulosa; and CIMMYT for theirhospitality during the workshop. K.
Emami was supported by a Ph.D.
scholarship award from the Iranian
Ministry of Culture and Higher
Education. This work benefited from the
use of the SEQNET computer facility,Daresbury, UK.

References
Apel, P.C, Panaccione, D.G., Holden, P.R,and J.D. Walton. 1993. Cloning andtargeted gene disruption of XYLl, a b-1,4xylanase gene from the maize pathogenCochliobolus carbonum. Mol Plant-MicrobeInteract 6:467-473.
Bateman, D.P. 1976. Plant cell wall hydrolysisby pathogens. In: J. Friend and D.RThrelfall (eds.), Biochemical Aspects ofPlant-Parasite Relationships, pp. 79-103.London: Academic Press.
Bleasby, AJ., Akrigg, D., and T.K. Attwood.1994. OWL: a non-redundant compositeprotein sequence database. Nucleic AcidsRes 22:3574-3577.
Dalb0ge, H., and H.P. Heldt-Hansen. 1994. Anovel method for efficient expressioncloning of fungal enzyme genes. Mol GenGenet 243:253-260.
Devereux, J., Haeberli, P., and O. Smithies.1984. A comprehensive set of sequenceanalysis programs for the VAX. NucleicAcids Res 12:387-395
Ferreira, L.M.A 1991. Molecular analysis ofcellulases and xylanases fromPseudomonas fluorescens subspeciescellulosa. Ph.D. thesis, University ofNewcastle, UK.
Gamal-EI-Din, I.P., Ghobrial, E., EI-Deeb,AA, Ahmed, K.G.M., and M.1. Elia:l.1987. Enzyme acting in relation toinfection with spot blotch of barley. AgricRes Rev 65:213-223.
Haltrich, D., Laussamayer, B., and W. Steiner.1994. Xylanase formation by Sclerotiumrolfsii: effect of growth substrates anddevelopment of a culture medium usingstatistically designed experiments.Applied Microbiol Biotechnol 42:522-530.
Henrissat, B. 1991. A classificatio~ ofglycosyl hydrolases based on amino acidsequence similarities. Biochem J 280:309316.
Jones, M.J., and L.D. Dunkle. 1993. Analysisof Cochliobolus carbonum races by PCRamplification with arbitrary and genespecific primers. Phytopathol 83:366-370.
Karjalainen, R, Peltonen, S., Kajander, 0.,and M.-L. Niku-Paavola. 1992. Productionand characterization ofaxylanase from aphytopathogenic fungus, Bipolarissorokiniana. In: J. Visser (ed.), Xylans andXylanases, pp. 529-533. Amsterdam:Elsevier Science Publishers.
A Xylanase Gene from Cochliobolus sativus 321
Keon, J.P.R, Byrde, RJ.W, and RM. Cooper.1987. Some aspects of fungal enzymesthat degrade plant cell walls. In: G.P.Pegg and P.G. Ayres (eds.), FungalInfection of Plants, pp. 133-157.Cambridge, UK: Cambridge UniversityPress.
Manners, J.G. 1993. Principles of PlantPathology. 2nd ed. Cambridge, UK:Cambridge University Press.
Miller, G.L. 1959. Use of dinitrosalicylic acidreagent for determination of reducingsugars. Anal Chem 31 :426-428
Muse, RR, Couch, H.B., Moore, L.D., andB.D. Muse 1972. Pectolytic andcellulolytic enzymes associated withHelminthosporium leaf spot on Kentuckybluegrass. Can J MicrobioI18:1091-1098.
Prade, RA 1995. Xylanases: from biology tobiotechnology. Biotechnol Genet Eng Rev13:101-131.
Pringle, RB., and AC Braun, 1957. Theisolation of the toxin of Helminthosporiumvictoriae. PhytopathoI47:369-371.
Scott-Craig, J., Panaccione, D.G., Cervone, P.,and J.D. Walton. 1990.Endopolygalacturonase is not requiredfor pathogenicity of Cochliobolus carbonumon maize. Plant Ce1l2:119i-1200.
Short, J.M., Fernandez, J.M., Sorge, J.A, andWD. Huse. 1988. I ZAP: a bacteriophage Iexpression vector with in vivo excisionproperties. Nucleic Acids Res 16:75837600.
Silver, J. 1991. Inverse polymerase chainreaction. In: M.J. McPherson, G.R. Taylor,and P. Quirke (eds.), PCR: A PracticalApproach, pp. 137-146. Oxford: OxfordUniversity Press.
Sposato, P., Ahn, J.-H., and J.D. Walton.1995. Characterization and disruption ofa gene in the maize pathogen Cochlioboluscarbonum encoding a cellulase lacking acellulose binding domain and hingeregion. Mol Plant-Microbe Interact 8:602609.
Yoder, O.C 1985. Molecular analysis of theplant fungus interaction. In: W.E.Timberlake (ed.), Molecular Genetics ofFilamentous Fungi, pp. 383-403. NewYork: Alan R Liss.
Yoder, O.C 1988. Cochliobolus heterostrophus,cause of southern corn leaf blight. AdvPlant PathoI6:93-1l2.
322
Leaf Spot Diseases of Wheat in aConservation Tillage Study
J.M. Krupinsky, A.D. Halvorson, and A.L. Black
USDA, Agriculture Research Service, Northern Great Plains Research Laboratory,}
Mandan, North Dakota, USA
Abstract
A conservation tillage cropping systems project was initiated 12 years ago to study theinfluence ofcrop rotation, tillage practice, fertility level, and crop cultivar on the severity of leafspot diseases. The experiment included the following experimental variables in all combinationswith three replicates: 1) two cropping rotations (spring wheat1allow and spring wheat-winterwheat-sunflowers); 2) three tillage treatments (conventional till, minimum till, and zero till); 3)
three nitrogen (N) fertilizer rates; and 4) two cultivars ofeach crop grown. Pyrenophora
tritici-repentis and Stagonospora nodorum (syn. Septoria nodorum) were the main causalagents ofa leaf$pot disease complex. Higher levels ofnecrosis and chlorosis were associated withthe no additional N (crop1allow) and the low N (continuous cropping) treatments compared tohigher N levels. When significant differences were evident among tillage treatments, in generalhigher levels ofnecrosis and chlorosis were associated with wheat leaves from zero till plots thanthose from minimum or conventional till plots. The winter wheat cultivar Roughrider hadhigher levels ofnecrosis and chlorosis compared to Norstar; however, the differences between thespring wheat cultivars Stoa and Butte 86 were not consistent. With some disease ratings, theeffect of tillage on leaf spot diseases varied depending on N level. With the no additional Nandlow N treatments, leaf spot severity was higher under zero tillage than conventional tillage, butat the higher N treatments the differences in leafspot severity among tillage treatments wasgreatly reduced or eliminated.
In the USA, the Conservation
Technology Information Center (1995)
indicated that the use of conservation
tillage (Le., over 30% residue on the
surface) increased from 26% in 1989 to
35% in 1995. Use of zero tillage, alone,
increased from 5% in 1989 to 15% in 1995
in the USA. The increase in conservation
tillage methods has created a need for
more information on plant diseases in
conservation tillage systems. Recent
literature reviews are available (Bailey
1996; Bailey and Duczek 1996; Burton etal. 1994; Conway 1996; McMullen and
Lamey 1994; Rothrock 1992; Scott et al.1992; Watkins and Boosalis 1994).
1 USDA-ARS, Northern Plains Area: is an equal opportunity/affirmative action employer and all agencyservices are available without discrimination. Mention of atrademark, proprietary product, or companyby USDA personnel is intended for explicit description only and does not constitute aguarantee orwarranty of the product by the USDA and does not imply its approval to the exclusion of other productsthat may also be suitable.
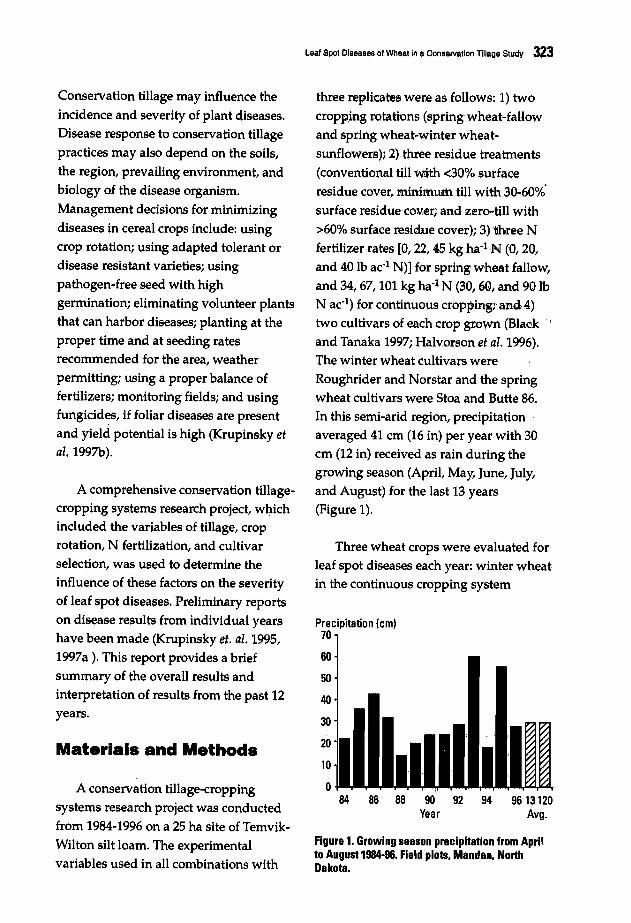
Leaf Spot Diseases of Wheat in a Oonservatlon Tillage Study 323
Figure'. Growing season precipitation from Aprilto August '984-96. Field plots. Mandan. NorthDakota.
Three wheat crops were evaluated forleaf spot diseases each year: winter wheatin the continuous cropping system
three.repl,icates were as follows: 1) two
cropping rotations (spring wheat-fallowand spring wheat-winter wheatsunflowers); 2). three residue treatments
(conventional till With <30% surfaceresidue cover, minimum till with 30-60%'
surface residue cover; and zero-till with>60% surface residue cover); 3) three Nfertilizer rates [0, 22, 45 kg ha-lN (0, 20,
and 40 lb ac·1 N)] for spring wheat fallow,and 34, 67, 101 kg ha·l N (30, 60, and 90 lbN ac·1) for continuous croppingi'aJ!).d4)two cultivars of each crop grown (Black .and Tanaka 1997; Halvorson et al. 1996).
The winter wheat cultivars wereRoughrider and Norstar and the springwheat cultivars were Stoa and Butte 86.In this semi-arid region, precipitation 'averaged 41 cm (16 in) per year with 30cm (12 in) received as rain during thegrowing season (April, May, June, July,and August) for the last 13 years(Figure 1).
96 13120Avg.
84 86 88 90 92 94Year
Precipitation (em)70
60
50
40
30
20
10
o
Materiais and Methods
A conservation tillage-croppingsystems research project was conductedfrom 1984-1996 on a 25 ha site of Temvik
Wilton silt loam. The experimentalvariables used in all combinations with
A comprehensive conservation tillagecropping systems research project, wl;\ichincluded the variables of tillage, croprotation, N fertilization, and cultivarselection, was used to determine theinfluence of these factors on the severityof leaf spot diseases. Preliminary reportson disease results from individual yearshave been made (Krupinskyet. al. 1995,
1997a ). This report provides a briefsummary of the overall results andinterpretation of results from the past 12years.
Conservation tillage may influence the
incidence and severity of plant diseases.Disease response to conservation tillage
practices may also depend on the soils,the region, prevailing environment, andbiology of the disease organism.Management decisions for minimizing
diseases in cereal crops include: usingcrop rotation; using adapted tolerant ordisease resistant varieties; usingpathogen-free seed with highgermination; eliminating volunteer plantsthat can harbor diseases; planting at theproper time and at seeding rateSrecommended for the area, weatherpermitting; using a proper balance offertilizers; monitoring fields; and usingfungicides, if foliar diseases are presentand yield potential is high (Krupinskyetal.1997b).
324 J.M. Kruplnsky, A.D. Halvorson. and A.L. Black
(WWCC), spring wheat in the continuous
cropping system (SWCC), and springwheat in the spring wheat-fallow system(SWF). The total percentage of necrosis
and chlorosis on wheat leaves was usedas an indicator of the amount of damage
caused by leaf spot diseases. Twenty
leaves of the same leaf type (e.g., flag leaf)from plants at the same development
stage were collected at random from each
plot (18 plots per replicate) each time acrop was rated. Plots were rated several
times each year during the growingseason. The leaves most commonly ratedwere the flag leaf (F), F-l, and F-2.
To confirm the identity of the mostcommon leaf spot pathogens presentunder natural field conditions, infected
wheat leaves with lesions were collectedfrom one replication of each study while
being rated. Leaves were pressed,allowed to dry, and stored in arefrigerator at 3-5°C until they were
processed, one to six months aftercollection. Leaf sections about 3 cm longwere surface-sterilized for 3 min in a 1%
sodium hypochlorite solution containinga surfactant, rinsed in sterile distilled
water, plated on water agar in plastic
petri dishes, and incubated under a 12-hphotoperiod (cool-white fluorescent
tubes) at 20°C. After seven days, leafsections were examined for fungi.
Pycnidiospores from pycnidia on the leafsections were identified microscopically.
The number of leaf sections infected with
a particular fungus was used as anindicator of the relative importance of
that fungus in causing leaf spot diseasesin the field.
An analysis of variance was
conducted using the arcsin-transformed
percentage necrosis data (SAS version6.08, SAS Institute, Cary, NC) from each
rating. Statistical comparisons within eachstudy were made with Student-Newman
Keuls' test (SAS).
Results and Discussion
Leaf spot disease complexBased on annual isolations during
1987-1996, the major causal agents of theleaf spot disease complex present in thefield plots were Pyrenophora tritici-repentis(Died.) Drechs. (anamorph Drechsleratritici-repentis (Died.) Shoemaker) and
Phaeosphaeria nodorum (E. Muller)Hedjaroude (= Leptosphaeria nodorum E.
Muller), anamorph: Stagonospora nodorum(Berk.) Cast. et Germ. (= Septoria nodorum(Berk.) Berk. in Berk. & Broome). Minor
components of the leaf spot diseasecomplex were Cochliobolus sativus (Ito &
Kurib.) Drechs. ex Dastur, andPhaeosphaeria avenaria (G. F. Weber) O.Eriksson f. sp. triticea T. Johnson,
anamorph: Stagonospora avenae Bissett f.
sp. triticea T. Johnson (= Septoria avenaeA.B. Frank f. sp. triticea T. Johnson).
Leaf spot diseases under the differenttreatments-During 1986-1987 and 1989
1996, there were 50 ratings of WWCC, 51ratings of SWCC, and 61 ratings of SWF.
Ratings from 1988, a low precipitation
year (Figure 1), were not included
because of low disease levels.
Differences in severity of leaf spotdiseases among N treatments were
significant for 56% of the WWCC ratings,
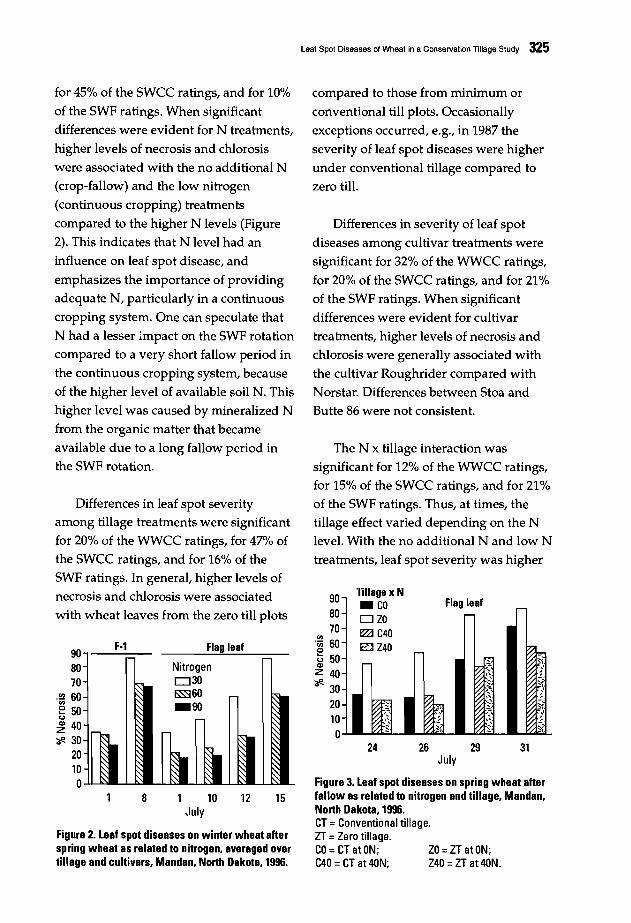
Leaf Spot Diseases of Wheat in a Conservation Tillage Study 325
Figure 2. leaf spot diseases on winter wheat afterspring wheat as related to nitrogen. averaged overtillage and cultivars. Mandan. North Dakota, 1996.
Differences in leaf spot severityamong tillage treatments were significantfor 20% of the WWCC ratings, for 47% ofthe SWCC ratings, and for 16% of theSWF ratings. In general, higher levels of
necrosis and chlorosis were associatedwith wheat leaves from the zero till plots
... ~1-, l'~ ~1-, l'"~ ~1-, "
~~~1
29 31
Flag leaf90'Iillage x N.CO
80 OZO70
~C40.1il 60 EJ Z400t; 50Ql
z40"#. 30
20100
24 26.Iuly
Figure 3. leaf spot diseases on spring wheat afterfallow as related to nitrogen and tillage. Mandan,North Dakota, 1996.CT =Conventional tillage.ZT =Zero tillage.CO = CT at ON; ZO = ZT at ON;C40 =CT at 40N; Z40 =ZT at 4ON.
The N x tillage interaction wassignificant for 12% of the WWCC ratings,for 15% of the SWCC ratings, and for 21%of the SWF ratings. Thus, at times, thetillage effect varied depending on the Nlevel. With the no additional N and low N
treatments, leaf spot severity was higher
Differences in severity of leaf spotdiseases among cultivar treatments were
significant for 32% of the WWCC ratings,
for 20% of the SWCC ratings, and for 21%
of the SWF ratings. When significantdifferences were evident for cultivar
treatments, higher levels of necrosis andchlorosis were generally associated with
the cultivar Roughrider compared withNorstar. Differences between Stoa and
Butte 86 were not consistent.
compared to those from minimum or
conventional till plots. Occasionally
exceptions occurred, e.g., in 1987 the
severity of leaf spot diseases were higherunder conventional tillage compared to
zero till.
15121 10•Iuly
8
908070
.1il 60e 50u
~ 40"#. 30
2010o
for 45% of the SWCC ratings, and for 10%
of the SWF ratings. When significantdifferences were evident for N treatments,
higher levels of necrosis and chlorosis
were associated with the no additional N(crop-fallow) and the low nitrogen
(continuous cropping) treatmentscompared to the higher N levels (Figure
2). This indicates that N level had aninfluence on leaf spot disease, and
emphasizes the importance of providingadequate N, particularly in a continuous
cropping system. One can speculate thatN had a lesser Impact on the SWF rotationcompared to a very short fallow period in
the continuous cropping system, because
of the higher level of available soil N. Thishigher level was caused by mineralized Nfrom the organic matter that became
available due to a long fallow period inthe SWF rotation.

326 J.M. Krupinsky. A.D. Halvorson, and A.L. Black
for zero tillage than conventional tillage,
but at higher N levels, the difference in
leaf spot severity for the tillage
treatments was greatly reduced or
eliminated, e.g., leaf spot diseases for
SWF for 1996 (Figure 3).
Acknowledgments
The authors thank the Area IV Soil
Conservation Districts for their support,
D. Wetch, J. Harms, M. Hatzenbuhler, F.
Jacober, and L. Renner for technical
assistance, G. Richardson for statistical
advice, and Dr. D. Mathre, and Dr. KL.
Bailey for their reviews and constructive
comments.
References
Bailey, KL. 1996. Diseases underconservation tillage systems. Can J PlantSci 76:635-639.
Bailey, KL., and L.J. Duczek. 1996.Managing cereal diseases under reducedtillage. Can J Plant PatholI8:159-167
Black, AL., and DL Tanaka. 1997. Aconservation tillage-cropping systemsstudy in the northern Great Plains of theUnited States. In: E.A Paul, K Paustian,E.T. Elliott, and e.v. Cole (eds.), SoilOrganic Matter in TemperateAgroecosystems, Long-TermExperiments in North America, ch. 24,pp. 335-342. Boca Raton, Florida: CRCPress.
Burton, R., Rush, e., and P. Sloderbeck.1994. Insects and diseases. In: B.AStewart and W.e. Moldenhauer (eds.),Crop Residue Management to ReduceErosion and Improve Soil Quality:Southern Great Plains. ConservationResearch Report No. 37, pp. 48-50.USDA, Agricultural Research Service, 70pp.
Conservation Technology InformationCenter. 1995. National Crop ResidueManagement Survey. West Lafayette, IN,USA: CTIe.
Conway, KE. 1996. An overview of theinfluence of sustainable agriculturalsystems on plant diseases. Crop Prot15:223-228.
Halvorson, AD., Black, AL., Krupinsky,J.M., Merrill, S.D., and D.L. Tanaka. 1996.Long-term tillage and N effects on cropproduction in dryland cropping systems.In: J.L. Havlin (ed.), Proceedings of GreatPlains Soil Fertility Conference, Vol. 6,pp. 199-204. Manhattan, KS: Kansas StateUniversity.
Krupinsky, J.M., Halvorson, AD., Tanaka,D.L., and AL. Black. 1995 Diseasesrelated to residue management, 1994. In:Proceedings. of the 17th AnnualManitoba-North Dakota Zero TillageFarmers Association Workshop, pp. 3538.198 pp.
Krupinsky, J.M., Halvorson, AD., and AL.Black. 1997a Diseases in zero-till cerealcrops. In: Proceedings of the 19th AnnualManitoba-North Dakota Zero TillageFarmers Association Workshop, pp. 93102. 182 pages.
Krupinsky, J.M., McMullen, M., Bailey, KL.,Duczek, L.J., and B.D. Gossen. 1997b.Diseases. In: Advancing the Art, pp. 2933. Manitoba-North Dakota Zero TillageFarmer's Association. 40 pp.
McMullen, M., and A Lamey. 1994. Cropdisease control in conservation tillagecropping systems. In: W.e. Moldenhauerand AL. Black (eds.), Crop ResidueManagement to Reduce Erosion andImprove Soil Quality: Northern GreatPlains, Conservation Research ReportNo. 38, pp. 60-65. USDA, AgriculturalResearch Service. 84 pp.
Rothrock, e.S. 1992. Tillage systems andplant disease. Soil Science 154:308-315.
Scott, D.H., Jardine, D.J., McMullen, M., andE.W. Palm. 1992. Disease management.In: Conservation Tillage Systems andManagement, Cr'op ResidueManagement with No-till, Ridge-till,Mulch-till, pp. 75-82. MWPS-45. Ames,IA: MidWest Plant Service. 140 pp.
Watkins, J.E., and M.G. Boosalis. 1994. Plantdisease incidence as influencedconservation tillage systems. In: P.W.Unge (ed.), Managing AgriculturalResidues, pp. 261-283. Ann Arbor: LewisPublishers.

327
Control of Leaf Blights of Wheat byElimination of the Inoculum Source
E.M. Reis, c.A. Medeiros, and R.T. Casa
Universidade de Passo Fundo, Passo Fundo, RS, Brazil
Abstract
The main inoculum sources ofwheat leaf blights are infected seed and crop residues. Infected
seeds introduce the pathogens into newly cultivated areas or to areas where the inoculum waseliminated through crop rotation with non-host crops. Disease transmission rate from seeds is
high and very efficient. High sporulation on coleoptile tips confirm the potential ofseedinoculum for causing epidemics, depending on climatic conditions during emergence to
tillering. Such findings highlighted the need for eradication ofseedborne inoculum. Onceinoculum is introduced by seed, disease develops on above-ground plant parts where pathogens
sporulate. Conidia are transported to new infection sites and to the soil by wind and rainsplashes. Inoculum in the soil, as free dormant conidia (Bipolaris sorokiniana), increases withthe amount ofnecrotic tissue. Sporulation continues in the residue until its complete
decomposition. Dormant conidia may survive free in the soil for up to 37 months. Crop rotationmay eliminate pathogens or reduce their inoculum to such an extent that they cannot cause anepidemic, even under favorable weather. Spot blotch may be economically controlled by treating
seeds with fungicides and by rotating crops. In this case, epidemics do not reach the economicaldamage threshold level of70-80% foliar incidence.
The most important leaf blights of
wheat in Brazil are spot blotch (Bipolaris
sorokiniana Sacco in Sorok), yellow spot
(Drechslera tritici-repentis (Died)
Shoemaker), leaf, node, and glume blotch
(Septoria nodorum (Berk) Berk), and
speckled leaf blotch (Septoria tritici Rob. in
Desm.). The latter has become of
secondary importance after the generalized
use of seed treatment and crop rotation.
This group of necrotrophic pathogens are
all introduced into new areas through
infected seed and maintained indefinitely
by monoculture (the succession of similar
crops in the field). These diseases have
increased in intensity under monoculture
and no-till farming.
The development of wheat cultivars
with good levels of genetic resistance to
leaf blights has been difficult, hence the
introduction of an alternative disease
control strategy: the use of systemic
fungicides (mainly propiconazole and
( tebuconazole) sprayed on the foliage at a
cost of US $31.00 ha-1 per application.
Disease Control Based onReduction of InoculumSource
Seeds as inoculum sourceAccording to Shaner (1981), infected
seed is the main source of inoculum of
leaf blight pathogens. Surveys carried out

328 E.M. Rels, C.A. Medeiros, and R.T. Casa
in the state of Parana showed a seed '
incidence of B. sorokiniana as high as 91%
(Mehta and Igarashi 1981). In this warm
region, wheat is cultivated mainly under
monoculture and disease intensity has
been very high, as has incidence in the
seed. Seed disease incidence relates to the
disease level on the above-ground plant
parts. Hence, the more severe the disease,
the higher the seed incidence.
~)
The importance of seed inoculum has
been illustrated by several works, which
demonstrated that pathogen transmission
from infected seeds to plumules and
coleoptile tips may reach an efficiency of
87% for B. sorokiniana (Reis and Forcelini
1993). These authors also quantified
sporulation in a greenhouse experiment.
On coleoptile tips, number of conidia was
as high as 1,509 conidia per coleoptile.
Taking into consideration that wheat is
seeded at a rate of 320 viable seeds m-2,
one may expect a spore density of 250,000
m-2on the 49th day after crop emergence.
When climatic conditions are favorable
for infection, disease may reach epidemic
levels. Couture and Sutton (1978)
reported that spot blotch infection will
occur when leaves remain wet for more
than 18 h at a mean temperature >18°C.
Such conditions very often prevail in
most wheat growing areas in the states of
Parana, Mato Grosso do SuI, and Sao
Paulo, Brazil, and in Paraguay.
For S. nodorum and D. tritici-repentis,transmission rates from seeds to
coleoptiles of 34% and 38%, respectively,
have been reported by Reis and Forcelini
(1994).
These findings have led to the
approach of controlling spot blotch and
other leaf blights by the elimination of
inoculum from seed (Cunfer 1983).
Questions have been raised: What is the
epidemiological meaning of high seed
incidence? Can this inoculum lead to an
epidemic? What is the real meaning of
seed inoculum? Is it of real importance?
Can we reduce the disease severity on
leaves by reducing or eliminating seed
inoculum? Such questions prompted us to
investigate seed treatment with a new
approach - eradication of B. sorokinianaand other pathogens from the seeds. A
100% control efficiency was pursued,
taking into consideration the high
transmission efficiency, the potential of
sporulation, and climatic conditions
conducive to disease outbreak.
Eradication is not easily achieved with
commercial fungicides (iprodione +thiram and guazatine). Only in seed lots
with low disease incidence «30%) can
100% control be obtained. Nevertheless,
the fungicide iminoctadine (a good
research tool) eradicates B. sorokinina from
infected seed independently of the
incidence level.
Once leaf blight pathogens have been
introduced into new wheat growing areas
through infected seed, they will remain as
saprophytes in the area as long as wheat
residues remain on the field. Monoculture
ensures the presence of stubble
indefinitely. Pathogens will continue to
sporulate on the residue and B. sorokinianawill add more inoculum to the soil as free
dormant conidia; thus, the presence of
residue also indicates the presence of leaf
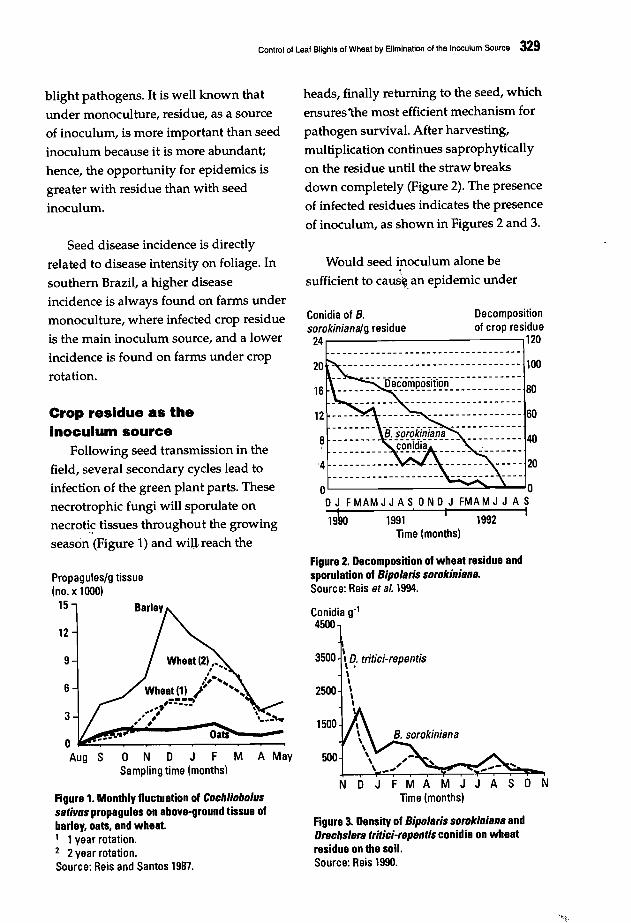
Control of Leaf Blights 01 Wheat by Elimination of the Inoculum Source 329
blight pathogens. It is well known thatunder monoculture, residue, as a sourceof inoculum, is more important than seed
inoculum because it is more abundant;
hence, the opportunity for epidemics isgreater with residue than with seedinoculum.
heads, finally returning to the seed, which
ensures1:he most efficient mechanism for
pathogen survival. After harvesting,multiplication continues saprophytically
on the residue until the straw breaksdown completely (Figure 2). The presence
of infected residues indicates the presence
of inoculum, as shown in Figures 2 and 3.
Seed disease incidence is directly
related to disease intensity on foliage. In
southern Brazil, a higher diseaseincidence is always found on farms undermonoculture, where infected crop residue
is the main inoculum source, and a lowerincidence is found on farms under croprotation.
Crop residue as theinoculum source
Following seed transmission in thefield, several secondary cycles lead toinfection of the green plant parts. Thesenecrotrophic fungi will sporulate onnecroti~ tissues throughout the growingseason (Figure 1) and wilL reach the
Would seed inoculum alone be'\
sufficient to caus~. an epidemic under
Conidia of B. Decompositionsorokiniana/g residue of crop residue24.-----------------,120
o 0oJ FMAM J J AS 0 N 0 J FMA M J J A S
19to 1991 I 1992 ITime (months)
\ D. tritici-repentis\ .\\\\\
SOO
2500
1500
3500
Figure 2. Decomposition of wheat residue andsporulation of Bipolaris sorokiniana.Source: Reis et al. 1994.
Conidia g"4500
o N D J F M A MaySampling time (months)
Oats:----OjIC.;;.,....~-_~-~~-_~~
Aug S
6
3
12
9
Propagules/g tissue(no. x 1000)
15
Figure 1. Monthly fluctuation of Cochliobolussativus propagules on above-ground tissue ofbarley, oats, and wheat.1 1year rotation.2 2year rotation.Source: Reis and Santos 1987.
NDJFMAMJJASONTime (months)
Figure 3. Density of Bipolaris sorokiniana andDrechsler. tritici-repentis conidia on wheatresidue on the soil.Source: Reis 1990.
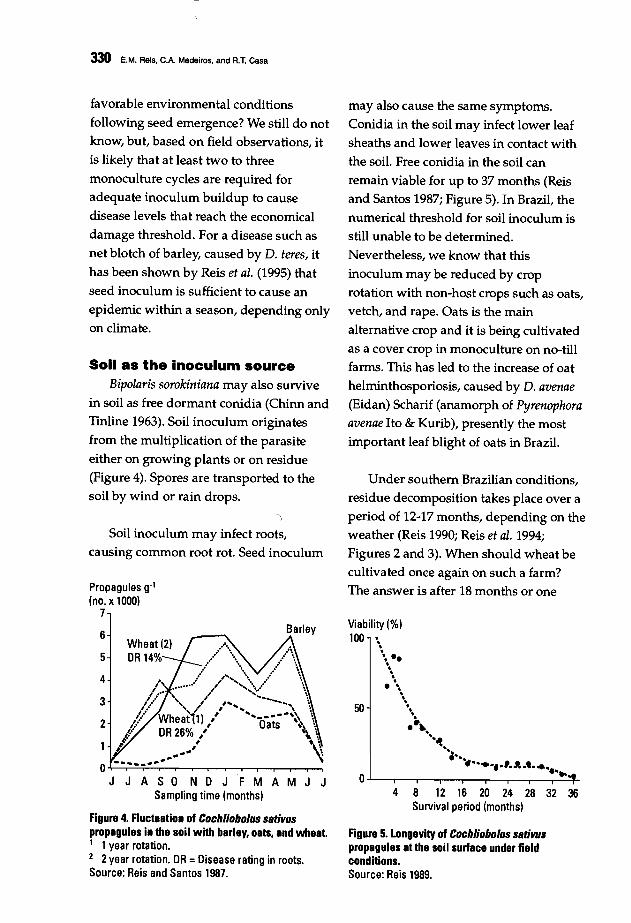
330 E.M. Reis. C.A. Medeiros, and R.T. Casa
)
Soil inoculum may infect roots,
causing common root rot. Seed inoculum
Figure 4. Fluctuation of Cochliobolus sBtivuspropagules in the soil with barley. oats. and wheat.1 1year rotation.2 2year rotation. DR = Disease rating in roots.Source: Reis and Santos 1987.
Soil as the inoculum sourceBipolaris sorokiniana may also survive
in soil as free dormant conidia (Chinn and
Tinline 1963). Soil inoculum originates
from the multiplication of the parasite
either on growing plants or on residue
(Figure 4). Spores are transported to the
soil by wind or rain drops.
50
Viability (%)100 '•..
•• e.......'..'.......~"'~
'.••••
iI··•••• '.A.t••••-..a..L----,-.---r-,....---r----r-.,..---r____'+
Under southern Brazilian conditions,
residue decomposition takes place over a
period of 12-17 months, depending on the
weather (Reis 1990; Reis et al. 1994;Figures 2 and 3). When should wheat be
cultivated once again on such a farm?
The answer is after 18 months or one
4 8 12 16 20 24 28 32 36Survival period (months)
Figure 5. Longevity of Cochliobolus sBtivuspropagules at the soil surface under fieldconditions.Source: Reis 1989.
may also cause the same symptoms.
Conidia in the soil may infect lower leaf
sheaths and lower leaves in contact with
the soil. Free conidia in the soil can
remain viable for up to 37 months (Reisand Santos 1987; Figure 5). In Brazil, the
numerical threshold for soil inoculum is
still unable to be determined.
Nevertheless, we know that this
inoculum may be reduced by crop
rotation with non-host crops such as oats,
vetch, and rape. Oats is the main
alternative crop and it is being cultivated
as a cover crop in monoculture on no-till
farms. This has led to the increase of oat
helminthosporiosis, caused by D. avenae(Eidan) Scharif (anamorph of Pyrenophoraavenae Ito & Kurib), presently the most
important leaf blight of oats in Brazil.
Barley
.....,...•.../ .
,. ..- ,"........ ..-I' •••••••• , ' .
,~..... ~ ,;' :. .../~... '" I' "......... ... , ~
1.* '1" ...... .. ,\ ~?/ Wheat 1),' oats'~ \l DR 26% " \ \,,' .~\--- ~....a+---...,-""-::"..T-'..:........-...,......-,---.---.-.--...-...,......-,---,.---.
JJASO NDJ FMAMJJSampling time (months)
4
3
2
Propagules g-l(no. x 1000)
7
6
5
favorable environmental conditions
following seed emergence? We still do not
know, but, based on field observations, it
is likely that at least two to three
monoculture cycles are required for
adequate inoculum buildup to cause
disease levels that reach the economical
damage threshold. For a disease such as
net blotch of barley, caused by D. teres, it
has been shown by Reis et al. (1995) that
seed inoculum is sufficient to cause an
epidemic within a season, depending only
on climate.
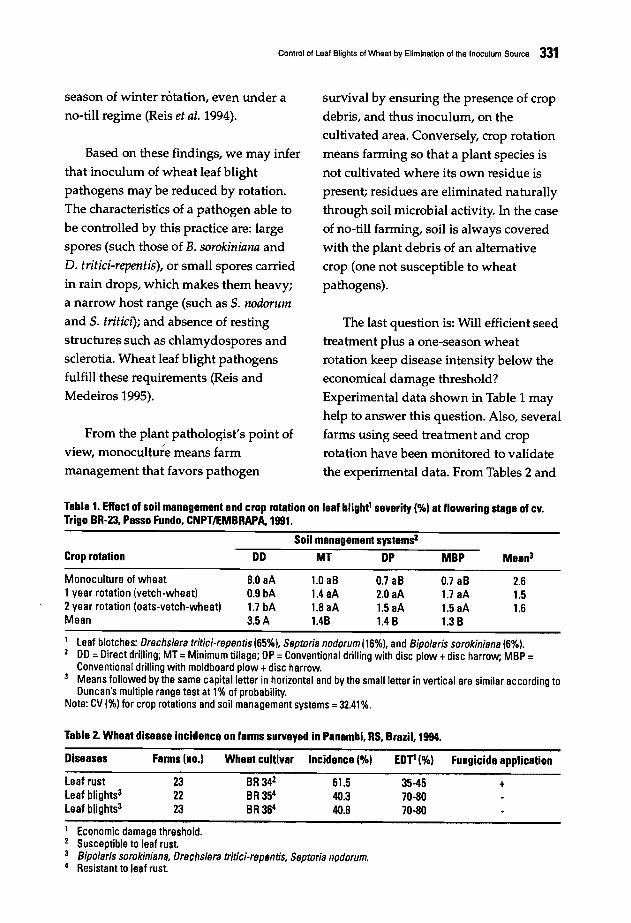
Control of Leaf Blights of Wheat by Elimination of the Inoculum Source 331
season of winter rotation, even under ano-till regime (Reis et al. 1994).
Based on these findings, we may infer
that inoculum of wheat leaf blightpathogens may be reduced by rotation.
The characteristics of a pathogen able tobe controlled by this practice are: large
spores (such those of B. sorokiniana and
D. tritici-repentis), or small spores carried
in rain drops, which makes them heavy;a narrow host range (such as S. nodorumand S. tritici); and absence of resting
structures such as chlamydospores andsclerotia. Wheat leaf blight pathogens
fulfill these requirements (Reis andMedeiros 1995).
From the plant pathologist's point ofc)
view, monoculture means farmmanagement that favors pathogen
survival by ensuring the presence of cropdebris, and thus inoculum, on the
cultivated area. Conversely, crop rotation
means farming so that a plant species is
not cultivated where its own residue ispresent; residues are eliminated naturally
through soil microbial activity. In the caseof no-till farming, soil is always covered
with the plant debris of an alternative
crop (one not susceptible to wheat
pathogens).
The last question is: Will efficient seed
treatment plus a one-season wheatrotation keep disease intensity below theeconomical damage threshold?
Experimental data shown in Table 1 mayhelp to answer this question. Also, several
farms using seed treatment and croprotation have been monitored to validate
the experimental data. From Tables 2 and
Table 1. Effect of soil management and crop rotation on leaf blight' severity ("to) at flowering stage of cv.Trigo BR-23. Passo Fundo. CNPT/EMBRAPA, 1991.
Soil management systems2
Crop rotation DD MT DP MBP Mean3
Monoculture of wheat1year rotation (vetch-wheat)2 year rotation (oats-vetch-wheat)Mean
8.0 aA0.9 bA1.7 bA3.5A
1.0 aB1.4aA1.8 aA1.4B
0.7 aB2.0 aA1.5 aA1.4 B
0.7 aB1.7 aA1.5aA1.3 B
2.61.51.6
leaf blotches: Dreehslera tritiei-repentis(65%), Septoria nodorum(16%), and Bipolaris sorokiniana {6%1.DO =Direct drilling; MT =Minimum tillage; DP =Conventional drilling with disc plow +disc harrow; MBP =Conventional drilling with moldboard plow +disc harrow.
3 Means followed by the same capital letter in horizontal and by the small letter in vertical are similar according toDuncan's multiple range test at 1% of probability.
Note: CV (%) for crop rotations and soil management systems =32.41 %.
Table 2. Wheat disease incidence on fanns surveyed in Panambi. RS. Brazil, 1994.
Diseases
Leaf rustLeaf blights3
Leaf blights3
Fanns (no.)
232223
Wheat cultlvar Incidence ("to)
BR 342 61.5BR 354 40.3BR 364 40.8
EDT! ("to) Fungicide application
35-45 +70-8070-80
Economic damage threshold.Susceptible to leaf rust.Blpolarls sorokiniana, Dreehslera tritlei-reprlntis. Septoria nodorum.Resistant to leaf rust.

332 E.M. Reis, C.A. Medeiros, and R.T. Casa
3, one may see the effect of correct crop
management on the incidence of leaf
blights of wheat in Southern Brazil
during the 1994 growing season. It was
clearly shown that under climatic
conditions conducive to disease, many
growers produced wheat without
applying fungicides. Crop sustainability
may thus be achieved through integrated
disease management.
This is a contribution to the
sustainability of wheat to feed the poor.
References
Chinn, S.H.F., and RD. Tinline. 1963. Sporegerminability in soil as an inherentcharacter of Cochliobolus sativus.PhytopathoI53:1109-1112.
Couture, L., and J.e. Sutton. 1978. Controlof spot blotch in barley by fungicidesapplications timed according to weatherfactors. Phytoprotection 59(2):65-75.
Cunfer, B.M. 1983. Epidemiology andcontrol of seedborne Septoria nodorum.Seed Sci Technolll:707-718.
Mehta, YR, and S. Igarashi. 1981. Sanidadede sementes de trigo no Parana, seuefeito na infec~ao db sistema radicular econtrole. Ponta Grossa: s.n., 1981.Trabalho apresentado na VII ReuniaoNorte Brasileira de Pesquisa de Trigo,Ponta Grossa, PR 47 pp.
Table 3. Effect of seed treatment and crop rotationon leaf blight incidence (Ofo) at anthesis on CY. BR23. Passo Fundo. RS. Brazil. 1997.
Reis, E.M. 1989. Longevity of Cochliobolussativus propagules in soil. Fitopatol Bras14:205-207.
Reis, E.M. 1990. Control of diseases of smallgrains by rotation and management ofcrop residues, in southern Brazil. In:Proceedings of the InternationalWorkshop On Conservation TillageSystems, pp. 140-146.
Reis, E.M., and e.A. Forcelini. 1993.Transmissao de Bipolaris sorokiniana desementes para 6rgaos radiculares eaereos do trigo. Fitopatol Bras 18:76-81.
Reis, E.M., and e.A. Forcelini. 1994. Manualde fungicidas: guia para controle dedoen~asde plantas. Passo Fundo:.Grafica e Editora Pe. Berthier. 100 pp.
Rels, E.M., and e.A.M. Medeiros. 1995.Control de enfermedades de plantas porrotaci6n de cultivos. In: M.M. Kohli, J.A.Annone, and R Garcia (eds.), Curso deManejo de Enfermedades del Trigo, pp.53-67. Pergamino: INTA-CIMMYT.
Reis, E.M., and H.P. Santos. 1987. Theincreased sporulation of Cochliobolussativus on above-ground tissues of smallgrains and its relationship to the originof inoculum in the soil. Fitopatol Bras12:206-208.
Reis, E.M., Casa, RT., and M.S. Silva. 1995.Efeito do tratamento de sementes decevada no controle e nodesenvolvimento da mancha-em-rede,causada por Drechslera teres. FitopatolBras 20:561-565.
Reis, E.M., Gassen, F., Silva, e.E., and RT.Casa. 1994. Sobrevivencia de Bipolarissorokiniana em restos culturais do trigo.In: Reuniao Nacional de Pesquisa deTrigo, pp. 92. Passo Fundo: CNPT.(Resumos).
Shaner, G. 1981. Effect of environment onfungal leaf blights of small grains. AnnRev PhytopathoI19:273-296.
Seed treatment
WithoutWith
Monoculture
88.2 (3)1
Crop rotation
52.3 (4)33 (22)
1 Number offarms.Note:Economic damage threshold: incidence of 70
80%. No-till farming.
333
Incidence and Severity of Leaf-SpottingDiseases of Spring Wheat in SouthernManitoba
J. Gilbert, S.M. Woods, and A. TekauzAgriculture and Agri-Food Canada, Cereal Research Centre, Winnipeg, Canada
Abstract
From 1989 to 1993, annual surveys were carried out to monitor incidence and severity ofseptoria nodorum blotch (SNB), tan spot, and spot blotch. Between 123-185 fields ofbread,Canada Prairie Spring (CPS), and durum wheat types were surveyed each year. Infected leaftissue was collected, surface sterilized, and placed in moisture chambers for 5-7 days to facilitatedisease identification based on conidiation ofpathogenic species. Environmental data werecollected from the weather station closest to each field. In durum wheat, incidence and severityofSNB were lower, and of tan spot higher, than in the other two wheat types. Incidence ofspotblotch was similar in all classes, but severity was higher in CPS wheat than in the other twowheat types. All wheat types showed a positive correlation between spot blotch severity andminimum and maximum temperatures, and a negative correlation for tan spot severity andamount ofrainfall. Higher levels ofSNB were associated with lower temperatures and with rain.In part, the environmental data help to explain the variability in annual incidence and severityof leaf-spotting diseases ofwheat in Manitoba. A study to monitor these disease levels inconventional and conservation tilled fields was initiated in Manitoba in 1993. Infected leaftissue was collected at growth stages (GS) 39, 65, and 75. Variation between years was highlysignificant for all diseases except spot blotch. Tan spot and septoria diseases increased as plantsmatured, but spot blotch was most severe at GS 61 and least at GS 39. Effect of tillage system ondisease levels was not significant in this study.
In southern Manitoba, leaf-spotting
diseases of wheat have the potential to
cause estimated annual losses of up to20% due to kernel shriveling (Tekauz et al.1982; Gilbert and Tekauz 1993). The
predominant leaf-spotting pathogens are
Pyrenophora tritici-repentis (Died.) Drechs.(anamorph, Drechslera tritici-repentis(Died.) Shoemaker), Cochliobolus sativus(Ito & Kuribayashi) Drechs. Ex Dastur.(anamorph, Bipolaris sorokiniana (Sacc.)
Shoemaker), Phaeosphaeria nodorum (E.
Muller) Hedjaroude (anamorph,
Stagonospora nodorum (Berk.) Castellani andE.G. Germano), and Mycosphaerellagraminicola (Fuckel) J. Schrot. in Cohn
(anamorph, Septoria tritici Roberge inDesmaz.), causing tan spot, spot blotch,
septoria nodorum blotch (SNB), and
septoria tritici blotch (STB), respectively.
The importance of these diseases has
increased in the last few decades
(Fernandez et al. 1993) as genetic control of
rusts and smuts has been incorporated intoadapted cultivars, leaving tissue available
for colonization by facultative fungi.
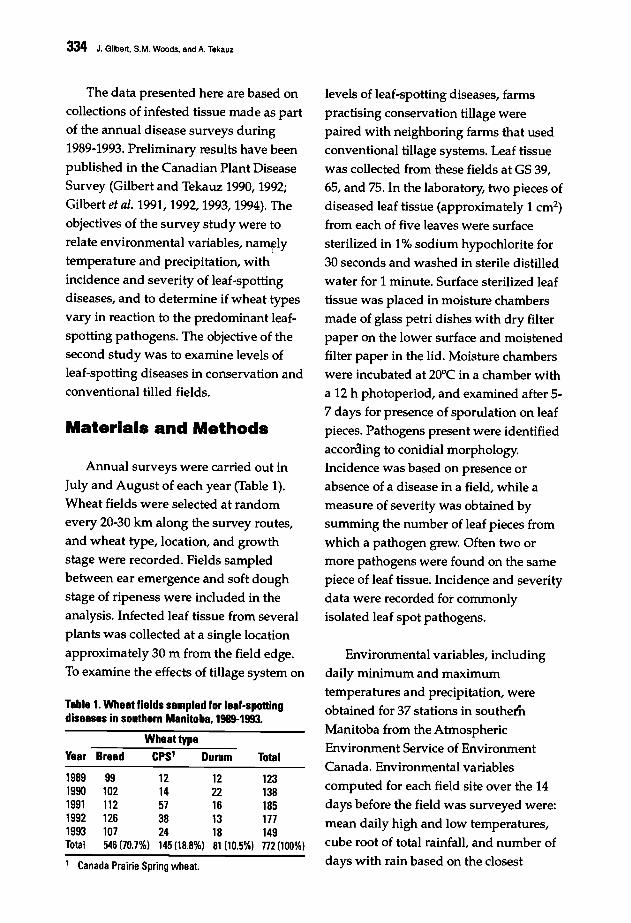
334 J. Gilbert, S.M. Woods, end A. Tekauz
The data presented here are based on
collections of infested tissue made as partof the annual disease surveys during1989-1993. Preliminary results have been
published in the Canadian Plant DiseaseSurvey (Gilbert and Tekauz 1990, 1992;
Gilbert et al. 1991, 1992, 1993, 1994). The
objectives of the survey study were to
relate environmental variables, naInflytemperature and precipitation, with
incidence and severity of leaf-spottingdiseases, and to determine if wheat types
vary in reaction to the predominant leaf
spotting pathogens. The objective of thesecond study was to examine levels of
leaf-spotting diseases in conservation andconventional tilled fields.
Materials and Methods
Annual surveys were carried out in
July and August of each year (Table 1).Wheat fields were selected at randomevery 20-30 km along the survey routes,and wheat type, location, and growth
stage were recorded. Fields sampledbetween ear emergence and soft doughstage of ripeness were included in the
analysis. Infected leaf tissue from several
plants was collected at a single location
approximately 30 m from the field edge.To examine the effects of tillage system on
Table 1. Wheat fields sampled for leaf-spottingdiseases in southern Manitoba. 1989-1993.
Wheat type
Year Bread CPS' Durum Total
1989 99 12 12 1231990 102 14 22 1381991 112 57 16 1851992 126 38 13 1771993 107 24 18 149Total 546 (70.7%1 145 (18.8%) 81 (10.5%) 772(100%)
1 Canada Prairie Spring wheat.
levels of leaf-spotting diseases, farms
practising conservation tillage werepaired with neighboring farms that used
conventional tillage systems. Leaf tissuewas collected from these fields at GS 39,65, and 75. In the laboratory, two pieces of
diseased leaf tissue (approximately 1 cm2)
from each of five leaves were surfacesterilized in 1% sodium hypochlorite for
30 seconds and washed in sterile distilled
water for 1 minute. Surface sterilized leaftissue was placed in moisture chambers
made of glass petri dishes with dry filter
paper on the lower surface and moistenedfilter paper in the lid. Moisture chamberswere incubated at 20°C in a chamber with
a 12 h photoperiod, and examined after 57 days for presence of sporulation on leaf
pieces. Pathogens present were identified
according to conidial morphology.Incidence was based on presence orabsence of a disease in a field, while a
measure of severity was obtained bysumming the number of leaf pieces fromwhich a pathogen grew. Often two or
more pathogens were found on the samepiece of leaf tissue. Incidence and severitydata were recorded for commonly
isolated leaf spot pathogens.
Environmental variables, including
daily minimum and maximumtemperatures and precipitation, were
obtained for 37 stations in southern
Manitoba from the AtmosphericEnvironment Service of Environment
Canada. Environmental variables
computed for each field site over the 14
days before the field was surveyed were:
mean daily high and low temperatures,
cube root of total rainfall, and number of
days with rain based on the closest
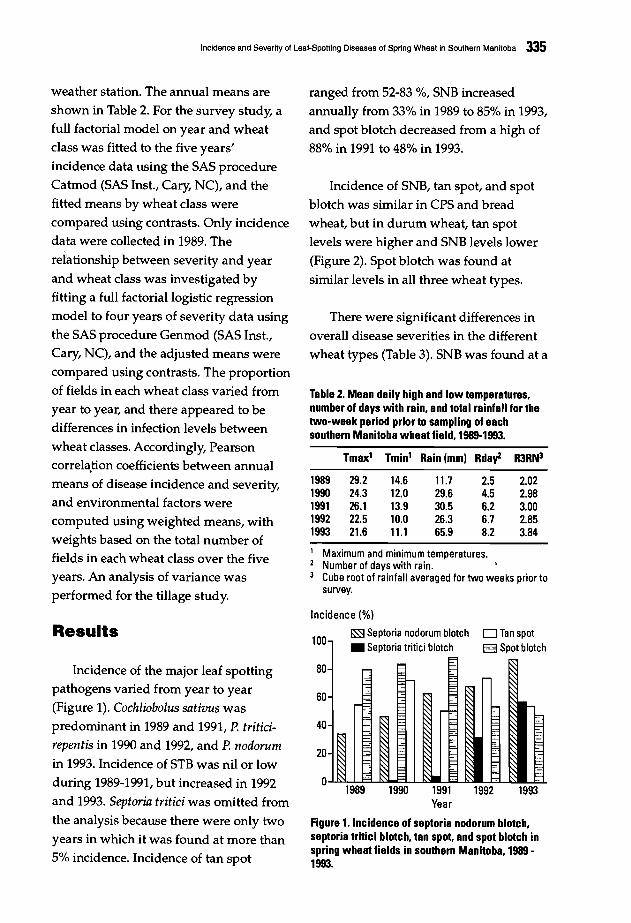
Incidence and Severity of Leaf-Spotting Diseases of Spring Wheat in Southern Manitoba 335
weather station. The annual means are
shown in Table 2. For the survey study, afull factorial model on year and wheat
class was fitted to the five years'
incidence data using the SAS procedureCatmod (SAS Inst., Cary, NC), and the
fitted means by wheat class were
compared using contrasts. Only incidencedata were collected in 1989. The
relationship between severity and year
and wheat class was investigated byfitting a full factorial logistic regression
model to four years of severity data usingthe SAS procedure Genmod (SAS Inst.,Cary, NC), and the adjusted means were
compared using contrasts. The proportion
of fields in each wheat class varied fromyear to year, and there appeared to be
differences in infection levels betweenwheat classes. Accordingly, Pearsoncorrela,tion coefficients between annual
means of disease incidence and severity,and environmental factors werecomputed using weighted means, withweights based on the total number of
fields in each wheat class over the fiveyears. An analysis of variance was
performed for the tillage study.
ranged from 52-83 %, SNB increased
annually from 33% in 1989 to 85% in 1993,
and spot blotch decreased from a high of88% in 1991 to 48% in 1993.
Incidence of SNB, tan spot, and spot
blotch was similar in CPS and bread
wheat, but in durum wheat, tan spotlevels were higher and SNB levels lower
(Figure 2). Spot blotch was found at
similar levels in all three wheat types.
There were significant differences in
overall disease severities in the differentwheat types (Table 3). SNB was found at a
Table 2. Mean daily high and low temperatures.number of days with rain. and total rainfall for thetwo-week period prior to sampling of eachsouthern Manitoba wheat field. 1989-1993.
Tmax' Tmin' Rain (mm) Rday2 R3RN3
1989 29.2 14.6 11.7 2.5 2.021990 24.3 12.0 29.6 4.5 2.981991 26.1 13.9 30.5 6.2 3.001992 22.5 10.0 26.3 6.7 2.851993 21.6 11.1 65.9 8.2 3.84
Maximum and minimum temperatures.Number of days with rain.Cube root of rainfall averaged for two weeks prior tosurvey.
100Results
Incidence (%)
~ Septoria nodorum blotch• Septoria tritici blotch
D Tan spotE§l Spot blotch
19931992
40
20
60
80
0.....",........-=--""'-=:::1-.J.-""'--..........1989 1990 1991
Year
Figure 1. Incidence of septoria nodorum blotch,septoria tritici blotch. tan spot, and spot blotch inspring wheat fields in southern Manitoba, 1989 1993.
Incidence of the major leaf spottingpathogens varied from year to year(Figure 1). Cochliobolus sativus was
predominant in 1989 and 1991, P. triticirepentis in 1990 and 1992, and P. nodorumin 1993, Incidence of STB was nil or low
during 1989-1991, but increased in 1992and 1993. Septoria tritici was omitted from
the analysis because there were only two
years in which it was found at more than5% incidence. Incidence of tan spot
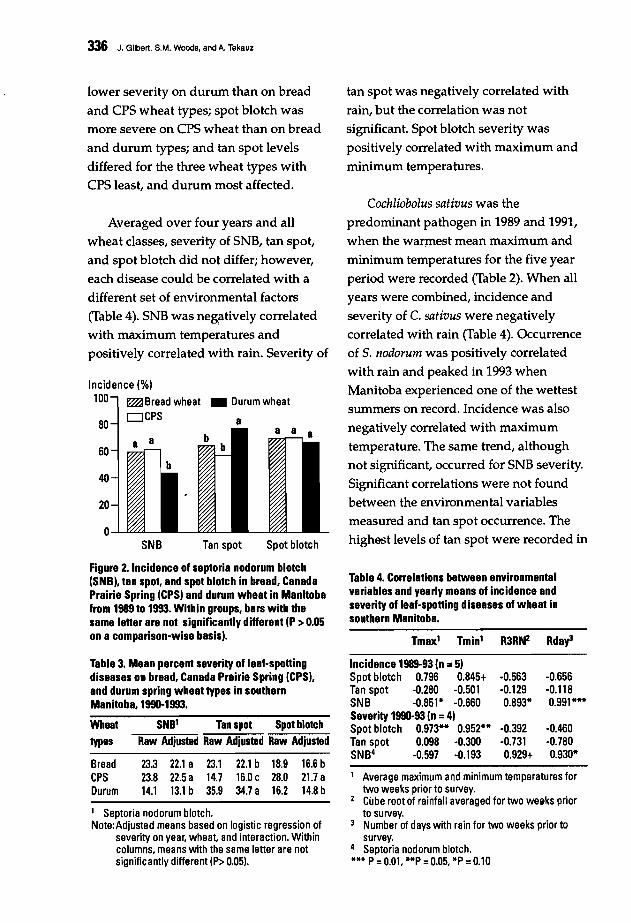
336 J. Gilbert, S.M. Woods, and A, Tekauz
lower severity on durum than on bread
and CPS wheat types; spot blotch was
more severe on CPS wheat than on bread
and durum types; and tan spot levels
differed for the three wheat types with
CPS least, and durum most affected.
tan spot was negatively correlated with
rain, but the correlation was not
significant. Spot blotch severity was
positively correlated with maximum and
minimum temperatures.
Cochliobolus sativus was the
predominant pathogen in 1989 and 1991,
when the warmest mean maximum and
minimum temperatures for the five year
period were recorded (Table 2). When all
years were combined, incidence and
severity of C. sativus were negatively
correlated with rain (Table 4). Occurrence
of S. nodorum was positively correlated
with rain and peaked in 1993 when
Manitoba experienced one of the wettest
summers on record. Incidence was also
negatively correlated with maximum
temperature. The same trend, although
not significant, occurred for SNB severity.
Significant correlations were not found
between the environmental variables
measured and tan spot occurrence. The
highest levels of tan spot were recorded inSpot blotchTan spotSNBo
40
20
60
Incidence (%)
100 ~ Bread wheat • Durum wheat
80 DCPS a
Averaged over four years and all
wheat classes, severity of SNB, tan spot,
and spot blotch did not differ; however,
each disease could be correlated with a
different set of environmental factors
(Table 4). SNB was ne~ativelycorrelated
with maximum temperatures and
positively correlated with rain. Severity of
Figure 2. Incidence of septoria nodorum blotch(SNB). tan spot. and spot blotch in bread. CanadaPrairie Spring (CPS) and durum wheat in Manitobafrom 1989 to 1993. Within groups. bars with thesame letter are not significantly different (P >0.05on a comparison-wise basis).
Table 3. Mean percent severity of leaf-spottingdiseases on bread. Canada Prairie Spring (CPS).and durum spring wheat types in southernManitoba. 1990-1993.
Wheat SNB' Tan spot Spot blotchtypes Raw Adjusted Raw Adjusted Raw Adjusted
Bread 23.3 22.1 a 23.1 22.1 b 18.9 16.6 bCPS 23.8 22.5 a 14.7 16.0 c 28.0 21.7 aDurum 14.1 13.1 b 35.9 34.7 a 16.2 14.8 b
1 Septoria nodorum blotch.Note:Adjusted means based on logistic regression of
severity on year, wheat, and interaction. Withincolumns, means with the same letter are notsignificantly different (P> 0.051.
Table 4. Co"elations between environmentalvariables and yearly means of incidence andseverity of leaf-spotting diseases of wheat insouthern Manitoba.
Tmax' Tmin' R3RN2 Rday3
Incidence 1989-93 (n =5)Spot blotch 0.796 0.845+ -0.563 -0.656Tan spot -0.280 -0.501 -0.129 -0.118SNB -0.851* -0.660 0.893* 0.991***Severity 1990-93 (n =4)Spot blotch 0.973** 0.952** -0.392 -0.460Tan spot 0.098 -0.300 -0.731 -0.780SNB4 -0.597 -0.193 0.929+ 0.930*
1 Average maximum and minimum temperatures fortwo weeks prior to survey.
2 Cube root of rainfall averaged for two weeks priorto survey.
3 Number of days with rain for two weeks prior tosurvey.
4 Septoria nodorum blotch.*** P=0.01. -P =0.05, *p =0.10
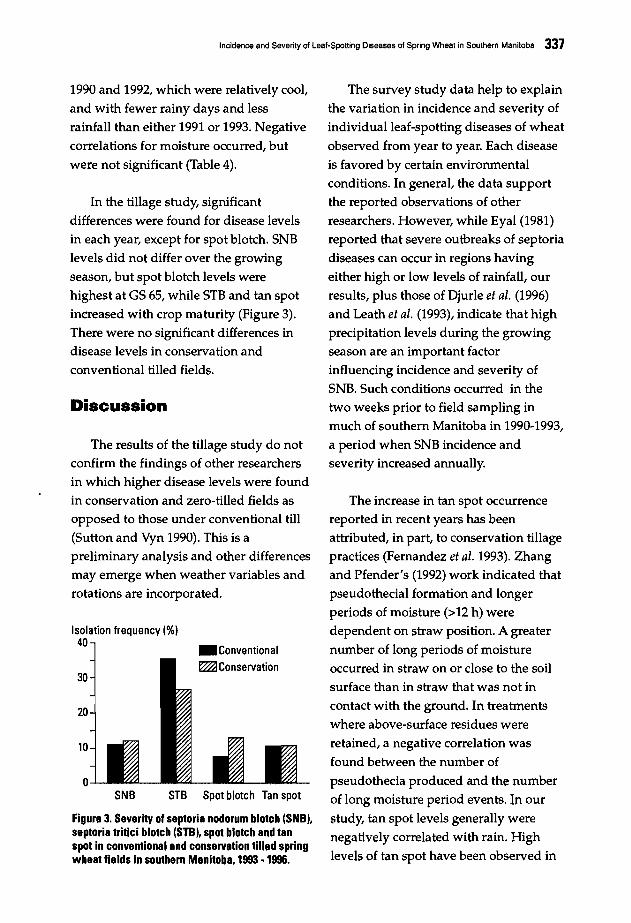
Incidence and Severity of Leaf-Spotting Diseases of Spring Wheal in Southern Manitoba 337
Discussion
SNB STB Spot blotch Tan spot
Figure 3. Severity of septoria nodorum blotch (SNB).septoria tritlci blotch (STB), spot blotch and tanspot in conventional and conservation tilled springwheat fields in southern Manitoba, 1993 - 1996.
1990 and 1992, which were relatively cool,
and with fewer rainy days and lessrainfall than either 1991 or 1993. Negative
correlations for moisture occurred, but
were not significant (Table 4).
The increase in tan spot occurrencereported in recent years has beenattributed, in part, to conservation tillagepractices (Fernandez et al. 1993). Zhangand Pfender's (1992) work indicated that
pseudothecial formation and longer
periods of moisture (>12 h) weredependent on straw position. A greater
number of long periods of moistureoccurred in straw on or close to the soil
surface than in straw that was not incontact with the ground. In treatments
where above-surface residues were
retained, a negative correlation was
found between the number of
pseudothecia produced and the numberof long moisture period events. In our
study, tan spot levels generally were
negatively correlated with rain. Highlevels of tan spot have been observed in
The survey study data help to explain
the variation in incidence and severity ofindividual leaf-spotting diseases of wheat
observed from year to year. Each diseaseis favored by certain environmental
conditions. In general, the data supportthe reported observations of other
researchers. However, while Eyal (1981)reported that severe outbreaks of septoria
diseases can occur in regions having
either high or low levels of rainfall, ourresults, plus those of Djurle et al. (1996)
and Leath et al. (1993), indicate that high
precipitation levels during the growingseason are an important factor
influencing incidence and severity ofSNB. Such conditions occurred in the
two weeks prior to field sampling inmuch of southern Manitoba in 1990-1993,
a period when SNB incidence andseverity increased annually.
• Conventional~Conservation
o
10
20
30
Isolation frequency (%)40
The results of the tillage study do notconfirm the findings of other researchersin which higher disease levels were foundin conservation and zero-tilled fields as
opposed to those under conventional till(Sutton and Vyn 1990). This is apreliminary analysis and other differencesmay emerge when weather variables and
rotations are incorporated.
In the tillage study, significant
differences were found for disease levelsin each year, except for spot blotch. SNB
levels did not differ over the growing
season, but spot blotch levels werehighest at GS 65, while STB and tan spotincreased with crop maturity (Figure 3).
There were no significant differences indisease levels in conservation andconventional tilled fields.

338 J. Gilbert, S.M. Woods, and A. Tekauz
Saskatchewan in years of generally dry
weather, and a greater prevalence of the
disease on durum cultivars was likewise
observed (Bailey et al. 1993).
In 1991, warm temperatures and high
levels of rainfall in southern Manitoba
provided a humid environment that
promoted spot blotch development. In
1993, a wet but cool year, spot blotch
levels were low. In Nepal, Dubin
(personal communication) attributed a
change in predominance from tan spot to
spot blotch during 1990-1991 to foggy
weather and higher than normal night
temperatures.
The results of this study indicate that
the pathogens which contribute to the leaf
spotting complex on wheat in Manitoba
require rather specific conditions and
inhabit unique ecological niches. This has
important ramifications on the focus and
prioritization needed in wheat breeding
programs. While it is convenient to
consider the leaf spotting pathogens
individually, it is evident that because of
variable conditions in the Manitoba
environment, one or more members of
the complex can predominate. Therefore,
breeding programs should aim for
resistance, even if moderate, to all
members of the complex, to ensure yield
stability in all years.
References
Bailey, K.L., Duczek, L.J., Jones-Flory, L.,Kutcher, R., Fernandez, M.R, Hughes,G.R., Kirkham, c., Mortensen, K.,Boyetchko, S., Burnett, P., and D. Orr.1993. Saskatchewan/Central AlbertaWheat Disease Survey 1992. Can PlantDis Surv 73:75-78.
Djurle, A, Ekbom, B., and J.E. Yuen. 1996.The relationship 6f leaf wetness durationand disease progress of glume blotch,caused by Staganaspara nadarum in winterwheat to standard weather data. Eur JPlant Pathol102:9-20.
Eyal, Z. 1981. Integrated control of Septoriadiseases of wheat. Plant Dis 65:763-768.
Fernandez, M.R., Fernandes, J.M., and J.c.Sutton. 1993. Effects of fallow and ofsummer and winter crops on survival ofwheat pathogens in crop residues. PlantDis 77:698-703.
Gilbert, J., and A Tekauz. 1990. Foliarpathogens of spring wheat in Manitobain 1989. Can Plant Dis Surv 70:46.
Gilbert, J., and A Tekauz. 1992. Foliarpathogens of spring wheat in Manitobain 1991. Can Plant Dis Surv 72:60.
Gilbert, J., and A Tekauz. 1993. Seedlingand adult plant reactions of Canadiancultivars to Septaria nadarum (Berk.) BerkPlant Dis 77:398-402.
Gilbert, J., Tekauz, A, and E. Mueller. 1991.Foliar pathogens of wheat in Manitoba in1990. Can Plant Dis Surv 71:78.
Gilbert, J., Tekauz, A, and E. Mueller. 1993.Foliar diseases of spring wheat inManitoba in 1992. Can Plant Dis Surv73:69-70.
Gilbert, J., Tekauz, A, Mueller, E., and U.Kromer. 1994. Foliar diseases of springwheat in Manitoba in 1993. Can Plant DisSurv 74:75-76.
Leath, S., Scharen, AL., Lund, RE., andM.E. Dietz-Holmes. 1993. Factorsassociated with global occurrence ofSeptaria nadarum blotch and Septaria triticiblotch of wheat. Plant Dis 77:1266-1270.
Sutton, J.c., and T.J. Vyn. 1990 Cropsequences and tillage practices in relationto diseases of winter wheat in Ontario.Can J Plant Pathol 12:358-368.
Tekauz, A, Platford, RG., and N.C. English.1982. Tan spot of wheat. In: 1982Manitoba Agronomists' Proceedings, pp.60-65.
Zhang, w., and W.E Pfender. 1992. Effect ofresidue management on wetnessduration and ascocarp production byPyrenoplwra tritici-repentis in wheatresidue. PhytopathoI82:1434··1439.

339
Tan Spot of Wheat in Argentina:Importance and Disease ManagementStrategies
J.G.Annone
Estacion Experimental Agropecuaria INTA, Pergamino, Buenos Aires, Argentina
Abstract
Tan spot ofwheat, caused by Pyrenophora tritici-repentis, was first observed inArgentina in the early 1980s and has now been detected in most wheat producing areas. Thedisease is currently recognized as one ofthe most important leafspots ofwheat. The northcentral area ofArgentina's wheat producing region has become a disease hot spot due tofavorable environmental conditions and asteady increase in the area under minimum tillage.Loss appraisals obtained by comparing fungicide treated plots with non-protected checks havedemonstrated yield reductions of 10-20%. Current disease management is far from optimum.Most commercial wheat cultivars are susceptible to highly susceptible to P. tritici-repentis
under high inoculum pressure; however, cultivars derived from Bobwhite, Veery, Alondra,IAS55, and 58 germplasm, and old Argentine cultivars, such as Klein Rendidor and BuckCimarron, have shown partial resistance., Several entries in cooperative nurseries screenedunder naturally induced epidemics were reported as showing partial resistance to the fungus.These entries included germplasm ofBobwhite, Kavkaz, Veery, Kauz, and Attila, as well ascrosses involving lines from Brazil, Chile, Mexico, Uruguay, and some Argentine cultivars.Fungicides applied as foliar treatments have shown potential to reduce disease developmentunder conditions ofmoderate to low inoculum pressure, but inconsistent results were obtainedunder high inoculum pressure. Among fungicides tested under field conditions, tebuconazoleand propiconazole achieved the highest levels ofcontrol, though results varied widely (30-80 %).
Recently released Azoxystrobin was considerably effective (50-75 %) in one year oftesting. Tanspot symptoms have been suppressed in farmers' fields where adequate soil fertility, normal rowspacing (17.5 cm), and normal to high crop densities (300-500 plants m-2) promoted a densecrop canopy.
Tan spot of wheat, caused by
Pyrenophora tritici-repentis (Died.)
Drechsler (anamorph: Drechslera triticirepentis (Died.) Shoem.), has become one
of the most important foliar diseases of
wheat in Argentina. The disease began to
noticeably affect wheat crops in the
north-central region of the Buenos Aires
province in the early 1980s (Annone 1985,
1996). Since then, tan spot symptoms have
been detected in most wheat growing
areas in the country. The disease is
particularly prevalent and intense in the
northern area of the Argentine wheat
producing region (central and northern
Buenos Aires, southern Santa Fe,
southeastern Cordoba, and Entre Rios
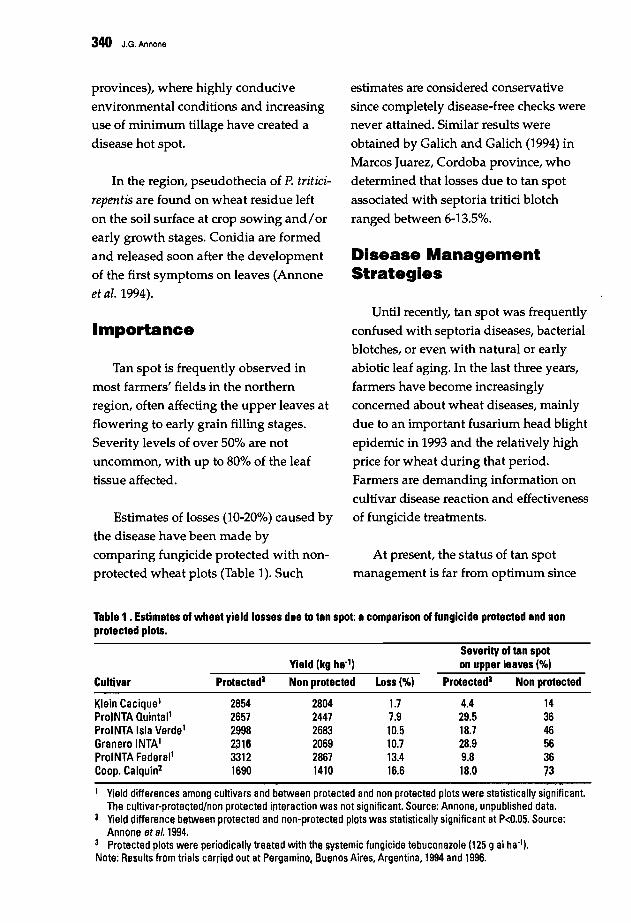
340 J.G. Annona
provinces), where highly conducive
environmental conditions and increasinguse of minimum tillage have created a
disease hot spot.
In the region, pseudothecia of P. triticirepentis are found on wheat residue left
on the soil surface at crop sowing and/orearly growth stages. Conidia are formed
and released soon after the development
of the first symptoms on leaves (Annoneet ai. 1994).
Importance
Tan spot is frequently observed inmost farmers' fields in the northernregion, often affecting the upper leaves at
flowering to early grain filling stages.
Severity levels of over 50% are notuncommon, with up to 80% of the leaf
tissue affected.
Estimates of losses (10-20%) caused by
the disease have been made by
comparing fungicide protected with nonprotected wheat plots (Table 1). Such
estimates are considered conservativesince completely disease-free checks werenever attained. Similar results were
obtained by Galich and Galich (1994) in
Marcos Juarez, Cordoba province, whodetermined that losses due to tan spot
associated with septoria tritici blotch
ranged between 6-13.5%.
Disease ManagementStrategies
Until recently, tan spot was frequentlyconfused with septoria diseases, bacterialblotches, or even with natural or early
abiotic leaf aging. In the last three years,farmers have become increasinglyconcerned about wheat diseases, mainly
due to an important fusarium head blight
epidemic in 1993 and the relatively highprice for wheat during that period.
Farmers are demanding information oncultivar disease reaction and effectiveness
of fungicide treatments.
At present, the status of tan spotmanagement is far from optimum since
Table 1 •Estimates of wheat yield losses due to tan spot: a comparison of fungicide protected and nonprotected plots.
Severity of tan spotYield (kg ha"l) on upper leaves (%)
Cultivar Protected3 Non protected Loss(%) Protected3 Non protected
Klein Cacique! 2854 2804 1.7 4.4 14ProlNTA Quintail 2657 2447 7.9 29.5 36ProlNTA Isla Verde1 2998 2683 10.5 18.7 46Granero INTA1 2316 2069 10.7 28.9 56ProlNTA Federail 3312 2867 13.4 9.8 36Coop. Calquln2 1690 1410 16.6 18.0 73
1 Yield differences among cultivars and between protected and non protected plots were statistically significant.The cultivar-protected/non protected interaction was not significant. SOlJrce: Annone, unpublished data.
a Yield difference between protected and non-protected plots was stati~tically significant at P<0.05. Source:Annone at a/. 1994.
3 Protected plots were periodically treated with the ~ystemic fungicide tebuconazole (125 g ai ha·l ).
Note: Results from trials carrilld out at Pergamino, Buenos Aires, Argentina, 1994 and 1996.

Tan Spot of Wheat in Argentina: Importance and Disease Management Strategies 341
several commercial wheat cultivars are
susceptible to highly susceptible to the
disease, many chemical treatments show
moderate to low effectiveness under field
conditions, and the need for soil
conservation requires an increasing
adoption of minimum tillage practices.
Genetic resistanceAvailable tan spot resistance in wheat
is partial/incomplete (Rees and Platz
1992). These researchers reported that of
more than 60 cultivars screened, only a
few displayed detectable P. tritici-repentisresistance. The situation is similar in the
north-central area of Argentina's wheat
producing region. Most commercial
wheat cultivars are susceptible to highly
susceptible to tan spot under conditions
conducive to the disease. Some cultivars,
however, display a partially resistant
response compared to the high
susceptibility shown by many varieties
under similar inoculum loads/
environmental conditions. Examples of
such behavior are presented in Table 2,
where severity readings from 19 trials
conducted in the central-northern region
of the Buenos Aires province highlighted
11 cultivars that were consistently less
affected than the most susceptible entries
in every situation. The pedigree of the
partially resistant cultivars involves
widely recognized germplasm such as
Bobwhite, Veery (Ures=Veery), Alondra,
IAS55 and 58, and some old Argentine
cultivars such as Klein Rendidor (Aldan
includes K. Rendidor in its pedigree) and
Buck Cimarron (Table 2).
Screening advanced bread wheat lines
from the 14th (1994), 15th (1995), and 16th
(1996) LACOS Nursery (Advanced
Wheat Lines from the Southern Cone) has
also highlighted lines partially resistant
to tan spot (Table 3). Pedigrees of these
Table 2. Commercial bread wheat cultivars showing partial tan spot resistance under naturally inducedepidemics.
Tan spot Tan spot severity range of theseverity range most affected cultivars
Cultivar Pedigree (00-991' (00-991
Buck Charrua RAP/REI/TRAP/LOVRIN/3/RAP/RE//1 RAP 31-81 84·86Buck Guarani URES/JUNCO 74-85 82-86Coop. Calqufn BOBWHITE"S" 73-84 82·86Coop. Maipun DoNATA/3/FLN/ACC/4/ALD "S"/COC 72-83 83-86Don Ernesto INTA BOBWHITE"S" 31-82 73-86Klein Cacique BCIM/25348/NEE"S" 52-81 83-85Klein Centauro KLLUC/Y53//KLSEND/4/CNO/N066//S0N64 31-82 73·85Klein Estrella2 COCHICO INTA/CHAT"S"//BPONCHO 53-82 84-86ProlNTA Federal BOBWHITE"S" 32-83 73-86ProlNTA Guazu JUP/ZP"S"//COC/3/ALDAN"S" 55-83 73-85ProlNTA Real VI/SNB"S"/5/IAS58/IAS55//ALD"S"/3/
MRNG/4/ALD"S"/IAS58//ALD"S· 82-85 85-86
1 Double digit scale.2 One-year observations.Note: Results for each cultivar are compared with results obtained by the most severely diseased entries in the
same trial. Data from 19 trials/demonstration plots in the central-northern region of Buenos Aires province,1994,1995, and 1996.
Source: Annone, unpublished.

342 J.G. Annone
selected lines also involve Bobwhite,Veery (which includes Kavkaz), Kavkaz,
Mexican lines (Myna/Vulture, Parula/Bobwhite, Ures/Bobwhite), Brazilian
lines (BR..., PE.., CEP..., IAS58), Chilean
lines (TEMU...), Uruguayan lines (LE2150
and 11 lOS), and some old Argentinecultivars (Buck Cimarron and BuckNamuncura).
Chemical protectionMost fungicide treatments for wheat
have been developed to reduce fusarium
head blight epidemics. The complex offoliar diseases is now beginning to beconsidered a p.roduction constraint, so
foliar treatments have only been recently
adopted. Most treatments carried out infarmers' fields are evaluated by crop
appearance (how green it looks), some
are evaluated by yield increment alone,and only a few are evaluated by
reduction in disease severity combinedwith yield increment.
Effectiveness of chemical treatments
in reducing tan spot severity has not yetreached satisfactory levels (around 50%
control in the best situations). Reasons for
this are the use of inadequate volumes ofspray, inappropriate timing ofapplication, and the relatively low effect
Table 3. Bread wheat lines showing partial tan spot resistance under naturally induced epidemics.
Tan spot severity 100-991'Entry
ATIlLABCIM/7C/lFCT/4/LiB/BB/lBNAM/3/BCIMBOWNS"BOWNS"/NKT"S"BRI4/CEP847BR32/CEP21/1CN079CMH79A210/PIFEDCHAT"SN/CEP7780/lPRLusn/BOWE.CAl/L1105E.FED/LE2150ENC/PF79768/1PF80284GAA"S"/KAUZ"S"GLl/CUCKOO/lKVZ/SXIAS58/4/KAl/BB/lCJ"S"/3/ALD"S"/5/BOWIAS58/4/KAl/BB/lCJ/3/ALD/5NEEKLT"S"/BOWNS"MJII/PAK/CHAP70/3/DEIMJII/PAK/CHAP70/3/PRL"S"/ALD"S"MYNA"S"NllL"S"P.DALB/4/CN067/MED/IMOWS"/3/BOWPRL"S"/BOWNS"PRL"S"NEE#6/MYNA/VUL=PRINIARFN*2//980/FN/3/KVZ/5/BR23/6/CEP8466TEMU 49-82TEMUI93-83/TEMU233-85URES"S"jBOW"S"
Entry score Highest score in trial
822+823 85+8781+73 84+8782 8581 8581 8576 8773 8781 8575 8581 8481 8781 8481 8581 8582 8782 8582 8581 8582 8572 8482 8581+76 84+8781 8582 8581 8581 85
1 Double digit scale 2 Readings from year 1. 3 Readings from year 2.Note: Data from the 14th (1994), 15th (1995), and 16th (1996) LACOS Nursery, Pergamino Experiment Station of INTA,
Buenos Aires, Argentina.Source: Annone, unpublished.
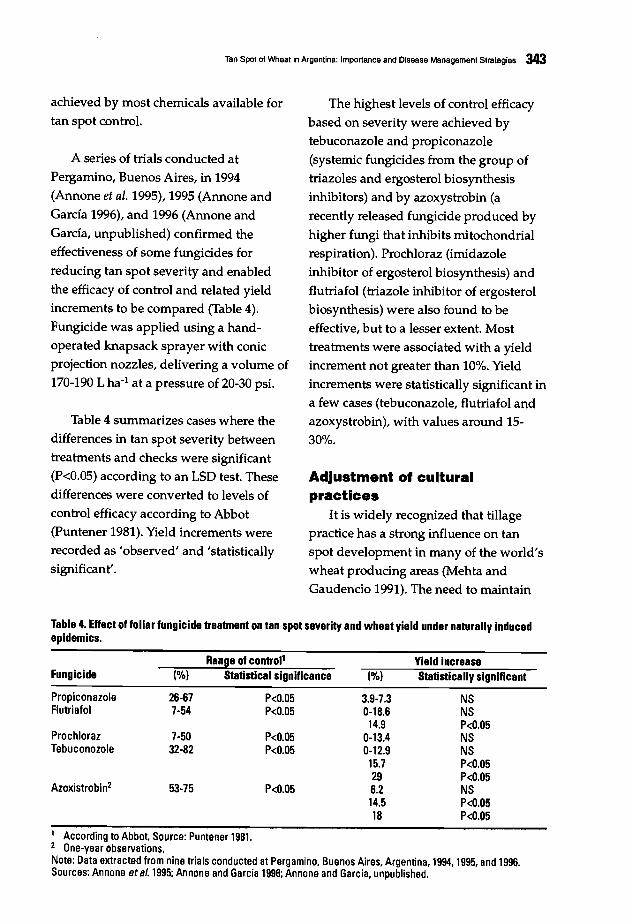
Tan Spot of Wheat in Argentina: Importance and Disease Management Strategies 343
achieved by most chemicals available for
tan spot control.
A series of trials conducted at
Pergamino, Buenos Aires, in 1994(Annone et al. 1995),1995 (Annone and
Garcia 1996), and 1996 (Annone and
Garcia, unpublished) confirmed the
effectiveness of some fungicides for
reducing tan spot severity and enabledthe efficacy of control and related yieldincrements to be compared (Table 4).
Fungicide was applied using a hand
operated knapsack sprayer with conicprojection nozzles, delivering a volume of170-190 L ha-1 at a pressure of 20-30 psi.
Table 4 summarizes cases where the
differences in tan spot severity betweentreatments and checks were significant(P<0.05) according to an LSD test. These
difference~ were converted to levels ofcontrol efficacy according to Abbot(Puntener 1981). Yield increments wererecorded as 'observed' and 'statistically
significant'.
The highest levels of control efficacy
based on severity were achieved bytebuconazole and propiconazole(systemic fungicides from the group of
triazoles and ergosterol biosynthesisinhibitors) and by azoxystrobin (a
recently released fungicide produced by
higher fungi that inhibits mitochondrialrespiration). Prochloraz (imidazole
inhibitor of ergosterol biosynthesis) and
flutriafol (triazole inhibitor of ergosterolbiosynthesis) were also found to beeffective, but to a lesser extent. Most
treatments were associated with a yieldincrement not greater than 10%. Yieldincrements were statistically significant in
a few cases (tebuconazole, flutriafol andazoxystrobin), with values around 15
30%.
Adjustment of culturalpractices
It is widely recognized that tillagepractice has a strong influence on tanspot development in many of the world's
wheat producing areas (Mehta andGaudencio 1991). The need to maintain
Table 4. Effect of foliar fungicide treatment on tan spot severity and wheat yield under naturally inducedepidemics.
Range of control' Yield increaseFungicide ("!oj Statistical significance ("!oj Statistically significant
Propiconazole 26-67 P<0.05 3.9-7.3 NSFlutriafol 7·54 P<0.05 0-18.6 NS
14.9 P<0.05Prochloraz 7·50 P<0.05 0-13.4 NSTebuconozole 32-82 P<0.05 0-12.9 NS
15.7 P<0.0529 P<0.05
Azoxistrobin2 53·75 P<0.05 6.2 NS14.5 P<0.0518 P<0.05
1 According to Abbot, Source: Puntener 1981.2 One-year observations.Note: Data extracted from nine trials conducted at Pergamino. Buenos Aires. Argentina, 1994, 1995. and 1996.Sources: Annone at a/. 1995; Annone and Garcia 199B; Annone and Garcia. unpublished.
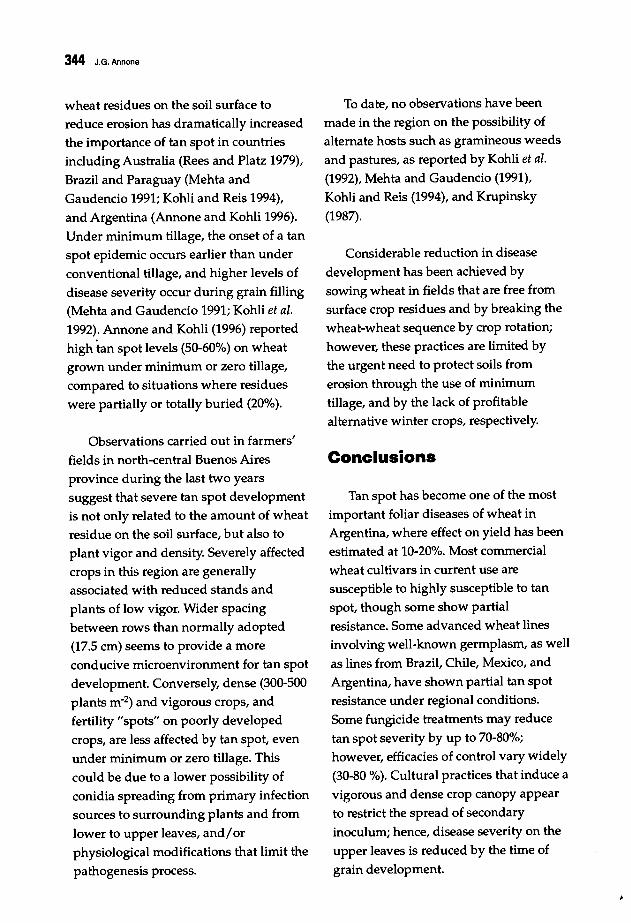
344 J.G. Annona
wheat residues on the soil surface to
reduce erosion has dramatically increasedthe importance of tan spot in countries
including Australia (Rees and Platz 1979),
Brazil and Paraguay (Mehta and
Gaudencio 1991; Kohli and Reis 1994),
and Argentina (Annone and Kohli 1996).
Under minimum tillage, the onset of a tan
spot epidemic occurs earlier than under
conventional tillage, and higher levels of
disease severity occur during grain filling
(Mehta and Gaudencio 1991; Kohli et al.1992). Annone and Kohli (1996) reported
high tan spot levels (50-60%) on wheat
grown under minimum or zero tillage,
compared to situations where residues
were partially or totally buried (20%).
Observations carried out in farmers'
fields in north-central Buenos Aires
province during the last two years
suggest that severe tan spot development
is not only related to the amount of wheat
residue on the soil surface, but also to
plant vigor and density. Severely affected
crops in this region are generally
associated with reduced stands and
plants of low vigor. Wider spacing
between rows than normally adopted
(17.5 cm) seems to provide a more
conducive microenvironment for tan spot
development. Conversely, dense (300-500
plants m-Z) and vigorous crops, and
fertility "spots" on poorly developed
crops, are less affected by tan spot, even
under minimum or zero tillage. This
could be due to a lower possibility of
conidia spreading from primary infection
sources to surrounding plants and from
lower to upper leaves, andlorphysiological modifications that limit the
pathogenesis process.
To date, no observations have been
made in the region on the possibility of
alternate hosts such as gramineous weeds
and pastures, as reported by Kohli et al.(1992), Mehta and Gaudencio (1991),
Kohli and Reis (1994), and Krupinsky
(1987).
Considerable reduction in disease
development has been achieved by
sowing wheat in fields that are free from
surface crop residues and by breaking the
wheat-wheat sequence by crop rotation;
however, these practices are limited by
the urgent need to protect soils from
erosion through the use of minimum
tillage, and by the lack of profitable
alternative winter crops, respectively.
Conclusions
Tan spot has become one of the most
important foliar diseases of wheat in
Argentina, where effect on yield has been
estimated at 10-20%. Most commercial
wheat cultivars in current use are
susceptible to highly susceptible to tan
spot, though some show partial
resistance. Some advanced wheat lines
involving well-known germplasm, as well
as lines from Brazil, Chile, Mexico, and
Argentina, have shown partial tan spot
resistance under regional conditions.
Some fungicide treatments may reduce
tan spot severity by up to 70-80%;
however, efficacies of control vary widely
(30-80 %). Cultural practices that induce a
vigorous and dense crop canopy appear
to restrict the spread of secondary
inoculum; hence, disease severity on the
upper leaves is reduced by the time of
grain development.

Tan Spot of Wheat in Argentina: Importence and Disease Menagement Strategies 345
References
Annone, J.G. 1985. Presencia de la "manchtostada" del trigo (Helminthosporiumtritici-repentis). Carpeta de ProduccionVegetal. TRIGO. TOMO VII. Inf. No. 88.EEA INTA, Pergamino, Buenos Aires.
Annone, J.G., Botta, G., and A Ivancovich.1994. Ocurrencia de la manchabronceada del trigo en el area norte de laprovincia de Buenos Aires. In: IIICongreso Nacional de Trigo y SimposioNacional de Cereales de Siembra Otoii.oinvernal, pp. 205-207. Dpto deAgronomfa, Universidad Nacional delSur-Asociacion de IngenierosAgronomos del Norte de la Provincia deBuenos Aires (AIANBA).
Annone, J.G., Trujillo Rojas, E., and RLazarte. 1995. Evaluacion del efecto decompuestos fungicidas sobre eldesarrollo de enfermedades foliares y dela espiga. Carpeta de ProduccionVegetal. TRIGO. TOMO XIII. Inf. No.161. EEA INTA Pergamino, BuenosAires. 11 pp. (English summary)
Annone, J.G. 1996. La mancha amarilla 0
bronceada del trigo. In: M.M. Kohli, J.G.Annone, y R Garda (eds.), Lasenfermedades del trigo en el Cono Sur.Curso de Manejo de Enfermedades delTrigo, pp. 118-134. Pergamino, BuenosAires, Argentina.
Annone, J.G., and M.M. Kohli. 1996.Principales enfermedades del trigoasociadas con la siembra directa enArgentina: Importancia y medidas deproteccion. In: IV Congreso Nacional deSiembra Directa. Asociacion Argentinade Productores en Siembra Directa(AAPRESID), pp. 135-159. VillaGiardino, Cordoba, Argentina.
Annone, J.G., and R Garda. 1996. Efecto decompuestos fungicidas y momentos deaplicacion sobre el desarrollo de lamancha amarilla y la fusariosis del trigo.Carpeta de Produccion Vegetal. TRIGO.TOMO XlV. Inf. No. 174. EEA INTAPergamino, Buenos Aires. 11 pp. (Englishsummary).
Galich, M.T.V., and AN. Galich. 1994.Enfermedades del trigo en el area sur deSanta Fe y Cordoba correspondientes ala subregion II Norte. Aii.o 1993/94.Informe para Extension No.5. EEAINTA, Marcos Juarez, Cordoba,Argentina. 7 pp.
Kohli, M.M., Mehta, Y.R, and M. Diaz deAckermann. 1992. Spread of tan spot inthe Southern Cone region of SouthAmerica. In. L.J. Franc1, J.M. Krupinsky,and M.P. Mc Mullen (eds.), Advances inTan Spot Research. Proceedings of the2nd International Tan Spot Workshop,pp. 86-90. Fargo, ND, USA: NorthDakota Agricultural Experiment Station.
Kohli, M.M., and E.M. Reis. 1994.Estrategias en el control deenfermedades de trigo. In: III CongresoNacional de Siembra Directa. AsociacionArgentina de Productores en SiembraDirecta (AAPRESID), pp. 174-192. VillaGiardino, Cordoba, Argentina.
Krupinsky, J.M. 1987. Pathogenicity onwheat of Pyrenophora tritici-repentisisolated from Bromus inermis.PhytopathoI77:760-765.
Mehta, Y.R, and C.A Gaudencio. 1991. Theeffects of tillage practices and croprotation on the epidemiology of somemajor wheat diseases. In: D.E Saunders(ed.), Wheat for the NontraditionalWarm Areas, pp. 266-283. Mexico, D.E:CIMMYT.
Puntener, W. 1981. Manual para ensayos decampo en Proteccion Vegetal. 2nd Ed.,pp. 33. Division Agricola. CIBA GEIGY,Basilea, Suiza.
Rees, RG., and G.J. Platz. 1979. Theoccurrence and control of yellow spot ofwheat in north-eastern Australia. Aust JExp Agric Anim Husb 19:369-372.
Rees, RG., and G.J. Platz. 1992. Tan spotand its control - some Australianexperiences. In: L.J. Franc1, J.M.Krupinsky, and M.P. Mc Mullen (eds.),Advances in Tan Spot Research.Proceedings of the 2nd International TanSpot Workshop, pp. 1-9. Fargo, ND,USA: North Dakota AgriculturalExperiment Station.

346
Influence of Agronomic Practice on FoliarBlight, a'nd Identification of AlternateHosts in the Rice-Wheat Cropping System
R.V. Singh, A.K. Singh, R. Ahmad, and S.P. Singh
Department of Plant Pathology, N.D. University of Agriculture and Technology,
Kumarganj, Faizabad, Uttar Pradesh, India
Abstract
Foliar blight ofwheat, caused mainly by Bipolaris sorokiniana and Alternaria triticina,
adversely affects the crop, particularly under late sown conditions. Due to the prevalence of therice-wheat cropping system and late rice harvest in eastern Uttar Pradesh, wheat is sown aftermid December. The crop sown during late December coincides with foliar blight infectionduring late February and March, resulting in substantial yield losses. The influence ofagronomic practice on foliar blight, and the identification ofalternate hosts in the rice-wheatcropping system are presented. With less space between rows (15 cm), a high seed rate (125 kgha-1), and full fertilizer dose (120:60:60 N:P:K), foliar blight intensity increased in comparisunto wider spaced rows (23 cm), a lower seed rate (100 kg ha-1), and half the fertilizer dose(60:30:30 N:P:K). An increased number of irrigation applications (6) and delayed sowing (after30th November) increased foliar blight intensity compared with fewer irrigation applications (3)and timely sowing. Isolating fungi from potential hosts indicated that Phalaris minor harborsB. sorokiniana and A. alternata, while only A. alternata was isolated from Anagallis
arvensis and Cannabis sativa. Alternaria alternata and A. triticina were isolated fromChenopodium album and Circium arvense. Only B. sorokiniana was pathogenic on bothwheat and Phalaris minor, indicating that P. minor serves as an alternate host.
Foliar blight of wheat, caused mainlyby Bipolaris sorokiniana and Alternariatriticina, adversely affects the crop,
particularly under late sown conditions.Although foliar blight was reported in
India as early as 1924 (Kulkarni 1924;
McRae 1924), it was of little consequence
until very recently. With changes in the
cropping system, cropping intensity, cropmanagement, and varietal spread, the
foliar blight complex is causing serious
wheat yield losses in eastern Uttar
Pradesh compared with other wheat
diseases. Ojha and Mehta (1970) and
Sokhi (1971) reported that susceptibility
of wheat to A. triticina increased withincreasing N levels. Singh et al. (1995)
found that high fertilizer and irrigation
levels favored the incidence and severityof foliar blight of wheat. Further, there is
the possibility of alternate hosts of the
foliar blight pathogens. The present study
was undertaken to observe the influence
of agronomic practice on foliar blight,
and to identify alternate hosts, if any, offoliar blight pathogens.

Influence of Agronomic Practice on Foliar Blight, and Identification of Alternate Hosts In the Rice·Wheat Cropping System 347
Table 1. Effect of agronomic practice on foliarblight intensity.
Similarly, Sokhi (1971) reported thathigher levels of N, P, and K resulted in anincrease in foliar blight intensity. Singh etal. (1995) reported that high levels of N, P,and K and increased irrigationapplications promoted disease incidence.High plant populations may create a
(6), and late sowing (20th December)increased foliar blight intensity comparedwith a lower seed rate (100 kg ha-1),
wider spaced rows (23 cm), half fertilizerdose (60:30:30 N:P:K), a lower number ofirrigation applications (3), and timelysowing (30th November).
The data presented in Table 2indicates that P. minor harbors B.sorokiniana and A. alternata, while only A.alternata was isolated from Anagallisarvensis and Canabis sativa. Alternariaalternata and A. triticina were isolatedfrom Chenopodium album and Circiumarvense. Of these fungi, only isolates of B.sorokiniana were pathogenic on wheat andP. minor. These findings indicate that aweed such as P. minor serves as analternate host for B. sorokiniana.
Foliarblight intensity
Application (% on flag leaf)Treatment
Materials and Methods
Weed leaves showing foliar blight inwheat fields and surrounding areas werecollected. From these leaves, fungi wereisolated and identified. All isolated fungiwere maintained in culture to confirmpathogenicity in the next season(confirmation of pathogenicity in thesame season is not possible due to the risein temperature after March). To testpathogenicity, five-week old seedlings ofwheat cultivar UP 262 and the weed fromwhich the fungus was isolated wereinoculated with the individual fungalcultures in the greenhouse in February.Uninoculated checks were alsoconsidered. All conditions favorable fordisease expression (humidity etc.) weremaintained. Final observations wererecorded 10-15 days after inoculation.
Trials were conducted using asusceptible wheat variety (Sonalika) andwere replicated four times. Treatmentsincluding seed rate (100 and 125 kg ha-1),
row spacing (15 and 23 cm), fertilizerdose (120:60:60 and 60:30:30, N:P:K),number of irrigations (3 and 6), and dateof sowing (30th November and 20thDecember) were tested. Diseaseobservations were recorded at full diseasedevelopment according to the percentdisease coverage on the flag leaf.
Results and Discussion
Table 1 shows that a higher seed rate(125 kg ha·1), lower row spacing (15 cm),full fertilizer dose (120:60:60 N:P:K),higher number of irrigation applications
Seed rate (kg ha-ll 100125
Row spacing (em) 1523
Fertilizer (N:P:K) 60:30:30120:60:60
Irrigations 36
Sowing date 30th November20th December
60757060658060756080
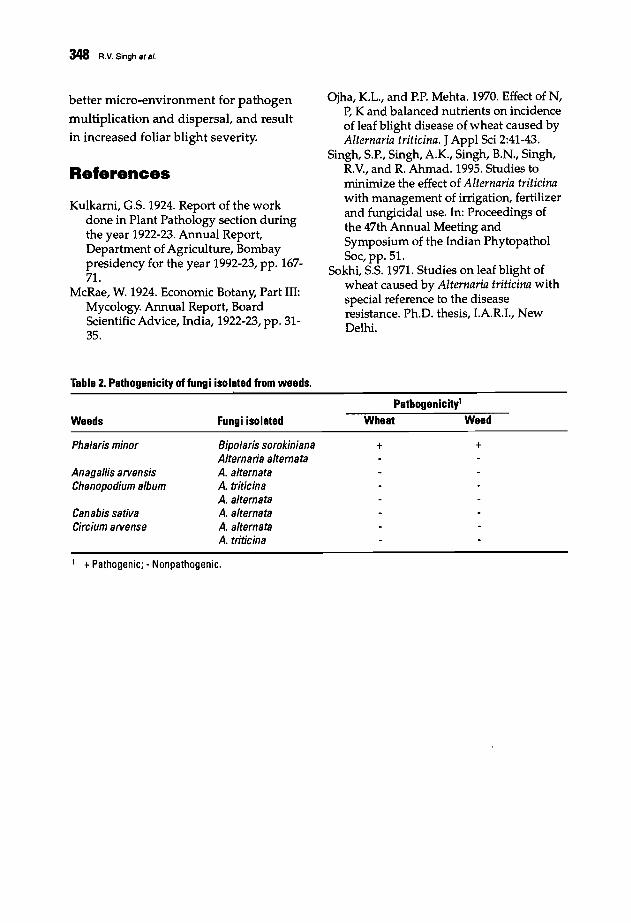
348 R.V. Singh at al.
better micro-environment for pathogen
multiplication and dispersal, and result
in increased foliar blight severity.
References
Kulkarni, G.5. 1924. Report of the workdone in Plant Pathology section duringthe year 1922-23. Annual Report,Department of Agriculture, Bombaypresidency for the year 1992-23, pp. 1677l.
McRae, W. 1924. Economic Botany, Part III:Mycology. Annual Report, BoardScientific AdVice, India, 1922-23, pp. 3135.
Table 2. Pathogenicity of fungi isolated from weeds.
Ojha, KL., and P.P. Mehta. 1970. Effect of N,P, K and balanced nutrients on incidenceof leaf blight disease of wheat caused byAlternaria triticina. JAppl Sci 2:41-43.
Singh, S.P., Singh, A.K, Singh, B.N., Singh,R.V., and R. Ahmad. 1995. Studies tominimize the effect of Alternaria triticinawith management of irrigation, fertilizerand fungicidal use. In: Proceedings ofthe 47th Annual Meeting andSymposium of the Indian PhytopatholSoc, pp. 5l.
Sokhi, S.S. 1971. Studies on leaf blight ofwheat caused by Alternaria triticina withspecial reference to the diseaseresistance. Ph.D. thesis, LA.R.L, NewDelhi.
Pathogenicity'Weeds Fungi isolated Wheat Weed
Phalaris minor
Anagallis arvensisChenopodium album
Canabis sativaCircium arvense
Bipolaris sorokinianaAlternaria alternataA. alternataA. triticinaA. alternataA. alternataA. alternataA. triticina
+ +
1 +Pathogenic; - Nonpathogenic.
349
Evaluation of Tan Spot Research inMorocco
N. Nsarellah1 and N. BouliF1 INRA, Settat, Morocco
2 ENA, Meknes, Morocco
Abstract
Tan spot ofwheat, caused by Pyrenophora tritici-repentis, has become important inMorocco in recent years. Surveys conducted during the last decade revealed that the diseaseaffected durum wheat more severely than bread wheat. Yield losses from field experiments, usingcurrent moderately susceptible cultivars, were calculated at 12-18% under moderate infestationlevels. Number ofgrains per spike and WOO-kernel weight were generally not affected.Comparisons offield inoculation methods showed that spraying was more effective thanmulching with infected straw under humid conditions prevailing in northern Morocco, whilemulching was more reliable under dry conditions. Several laboratory and greenhouse studieswere conducted to refine screening and evaluation methodologies. Lesion size on the upperleaves best showed the variation in tan spot expression related to genotype. Disease severity on.both upper and lower leaves was found to be a useful indicator. A::cording to several raceidentification studies, virulence ofdifferent tan spot isolates varied significantly; however, therewas little physiological specialization. Screeningfor disease resistance showed large variation ingenotype response, with moderately to highly resistant accessions identified. Resistance wasfound to be linked to maturity date and plant height. Breedingfor resistance to tan spot usingthe available tall, late maturing, resistant parents in crosses with adapted material, coupled withselection under semi-arid conditions, was not effective due to the linkage of resistance withundesired traits. The current breeding approach is to search for materials with flexible maturitydate and plant height that could produce acceptable levels of tan spot resistance.
Tan spot was unknown in Moroccoprior to 1980. The old cultivars, widely
grown by farmers because of grain
quality, were mostly tall and latematuring and did not suffer from tan spot
early in the season. Disease levels were
severe only shortly before maturity and
did not cause concern. When early
varieties became popular, it was realized
that the leaf spots believed to be caused
by septoria were in fact tan spot. Thechange in varieties may not be the only
factor causing an increase in tan spotoccurrence; however, at the present time,
most of the new, early maturing, high
yielding varieties are moderately tohighly susceptible to the disease.
Importance of Tan Spot
Prior to 1989, several cereal disease
surveys highlighted the importance oftan spot on durum wheat which, until
this time, was mistakenly reported as

350 N. Nsarellah and N. Boulif
septoria disease. During 1989-1995, mid
season disease surveys consistentlyshowed that tan spot was always presenton durum wheat. Furthermore, in the
numerous growing seasons when leaf
rust was not severe, tan spot was rated
the most important disease on durum,
whereas it was reported as negligible on
bread wheat. The disease appeared
earlier in the southern and drier growingareas than in the northern, more humid
areas. Most of the attacks were observedaround the time of heading.
Yield Loss
Yield losses caused by tan spot wereevaluated during the 1990/91 to 1992/93
growing seasons at the experiment
stations of Jemaat Shaim, Sidi El Aydi,and Annoceur, which represent thedifferent d urum growing regions of
Morocco. The experiments were laid outin a split plot design with three replicates.The main plot comprised three
treatments: 1) chemical protection atheading growth stage; 2) spray and straw
mulch inoculation with propagules ofPyrenophora tritici-repentis; and 3) naturalepidemics. Sub-plots consisted of 10
durum wheat and 5 bread wheat
cultivars. Observations were made on
grain yield, number of grains per spike,1000-grain weight, and black point
severity.
The tan spot epidemics achieved
through inoculation with propagules ofthe fungus were no more severe than
most natural epidemics in Morocco. Some
of the stations/years were not considered
due to low disease severity resulting fromdrought, but data from at least one stationper year was available. Yields of the
protected plots were highest, followed by
yield under natural conditions and in
inoculated plots; however, yields under
natur;il conditions and in the inoculated
plots were comparable in some cases.Yield loss, calculated by the difference
between inoculated and chemically
proteCted plots, ranged between 12-18%over stations and years. It is believed,however, that yield loss is underestimated
since the tested seasons were all partlydry, which did not favor disease
development. Number of grains per spikeand 1000-kernel weight were generallynot affected by tan spot inoculation;
however, results varied among cultivars.
Black point severity was not influencedby tan spot inoculation, possibly because
wet conditions never occurred at the endof the growing season.
Evaluation of FieldInoculation Methods
During the 1989/90 and 1990/1991growing seasons, a study was conducted
to compare three field inoculation
procedures at two experiment stations,Sidi El Aydi and Annoceur. Field
inoculation procedures were: 1) early
spray (before heading), 2) late spray (10
days after heading), and 3) application ofstraw mulch at the three-leaf stage.
The experiments were conducted on100 advanced lines sown in six
completely randomized blocks for each
inoculation procedure in hill plots. The
objective was to compare the variation intan spot expression under eachinoculation method. Data from the three
experiments was compared to results
obtained under greenhouse conditionswhere the trial was repeated.
Results showed that inoculation
success depended on growing conditions.
Tan spot expression was higher afterspray inoculation under favorable
conditions similar to those prevailing inthe north of Morocco. An early spray
induced more contrasting responsesbetween genotypes than a late spray ofinoculum. Straw mulch inoculation
induced the best infection levels underdry climatic conditions.
Field and GreenhouseDisease EvaluationMethodologies
Two studies were carried out tocompare disease evaluation methods inthe field (Sidi El Aydi, 1989-90; Annoceur,
1990-91) and the greenhouse (Settat). Inthe field, 100 advanced lines were
inoculated with tan spot and the resultingdisease severity was evaluated using four
methods: lesion size on the upper and the
lower leaves, and disease severity(percentage leaf area covered by lesions)
on the upper and the lower leaves. In the
greenhouse, a replicate of the field trialwas planted with the addition of 11
known checks. Lesion size was evaluated
on each leaf. Results from the field and
the greenhouse were compared.
Evaluation of Tan Spot Research in Morocco 351
Lesion size on the upper leaves wasthe most useful method to distinguishdifferences in tan spot resistance among
genotypes. Lesion size on the lowerleaves was not a reliable indicator of
disease level. Assessment of disease
severity on both the upper and the lower
leaves was a good disease evaluation tool.In the greenhouse, a comparison of lesion
size on the different leaves showed that
the first and second uppermost leaveswere the most suitable for estimating
differences in tan spot resistance between
genotypes.
Another study of disease assessment
on separate leaves was carried out in the
field. Results showed that the seconduppermost leaf was most suitable for
evaluating differences between
genotypes.
Heritability andCorrelation of Resistanceto Other Traits
The F5 progenies of a cross betweentwo resistant parents (PIl66308 and
PIl88526) and genotypes Calvin andEdmore were tested at the Sidi El Aydi
and Annoceur experiment stations during
two growing seasons, 1989/90 and 1990/91. Broad sense heritability was estimated
based on the analysis of variance
components. Heritability of resistanceranged from 52% (disease severity) to
79% (lesion size), depending on the
disease evaluation method used in the
field. A highly significant correlation was
observed between tan spot resistance,
352 N. Nsarallah and N. Boullf
number of days to heading, and the
decimal growth stage at the time of
scoring. Plant height was positively
correlated to tan spot resistance.
PhysiologicalSpecialization of thePathogen
The evaluation of P. tritici-repentispathotypes in Morocco was conducted in
three separate studies (1989-1993). Three
groups of differential wheat genotypes
were used to study the reaction of 12,19,
and 20 P. tritici-repentis isolates occurring
in Morocco. All three studies showed a
small but significant host-pathogen
interaction. Virulence of the different
isolates significantly differed but
differences between host genotypes were
more signifiCant.
Screening and BreedingTrials
Several separate studies on screening
for tan spot resistance have been
conducted since 1990 on durum wheat
collections from the USA, Canada,
CIMMYT, and ICARDA, including
germplasm from international and
national collections. All studies showed a
large variation in genotype response to
the disease and a correlation between
disease resistance and late and tall plant'
types. No complete resistance was
observed. The most resi.stant parents
identified to date are PI166308 and
PI188526, followed by several moderately
resistant cultivars from Tunisia and
Algeria.
Crosses of early, adapted Moroccan
durum wheat varieties with late
maturing, tall, and resistant PI166308 and
PI188526 lines, followed by field selection
at Sidi EI Aydi and Jemaat Shaim
experiment stations, yielded no early
maturing, resistant progeny. Furthermore,
no germplasm selected for tan spot
resistance under other environments was
found to have satisfactory resistance in
Morocco.
The current objective of breeding for
tan spot resistance in adapted germplasmis to search for germplasm with flexible
earliness and plant height; these traits are
present in some drought tolerant lines
that may harbor satisfactory tan spot
resistance. Due to the difficulty of
combining'tan spot resistance with
drought escape or drought tolerance
related traits, durum wheat breeding
should aim to combine tan spot resistance
with adaptability and yield potential.
Adaptability and flexibility could be the
starting point to which improved
resistance to tan spot could be added.
Bibliography
Boulif, M., Amiri, S., Saoud, H., Sayoud, R.,and M. Harrabi. 1994. Current status oftan spot research in the Maghreb. In:Proceedings of the 5th Arab Congress ofPlant Protection, pp. 35.
Boulif, M., Amiri, A., and H. Saoud. 1996.Specialization Pathogenique ahezPyrenophora tritici-repentis dans IeMaghreb. Symposium Regional sur LesMaladies Des Cereales et DesLegumineuses Alimentaires, pp. 171.
Boulif, M., Amiri, A, Saoud, H., MraniAlaoui, I., and H. Bargach. 1996.Evaluation de la Resistance a Pyrenophoratritici-repentis de 119 genotypes de bledur au Maghreb. Symposium Regionalsur Les Maladies des Cereales et desLegumineuses Alimentaires, pp. 251.
Ezzahiri, B., Farih, A, and M. Taoufiq. 1996.Surveillance de maladies du ble et del'orge au Maroc. Symposium Regionalsur les Maladies des Cereales et desLegumineuses Alimentaires, pp. 71.
Evaluation of Tan Spot Research in Morocco 353
Nsarellah, N. 1991. Eyaluation of tan spoton wheat in North Dakota and Morocco.Ph.D. thesis, N,D. State University,Fargo.
Nsarellah, N. 1994. Comparison of field andgreenhouse evaluation of tan spot indurum. In: Proceedings of the 5th ArabCongress of Plant Protection, pp. 46.
Nsarellah, N. 1996. Tan spot expression inrelation to leaf position in wheat plant.Symposium Regional sur les MaladiesDes Cereales et des LegumineusesAlimentaires, 1996, pp. 243.
354
Controlling Leaf Spot of Wheat throughNutrient Management
I. Hossain
Deparbnent of Plant Pathology, Bangladesh Agricultural University, Mymensingh,
Bangladesh
Abstract
Leafspot ofwheat, caused by Bipolaris sorokiniana, is a major problem for wheatproduction in Bangladesh. During a study on the status of leaf blight ofwheat, it appeared thatnone of the currently cultivated wheat varieties in the country are free from the disease. Morethan 600 wheat materials ofexotic and national origin were screened in the field under naturalepiphytotics and artificial inoculation. It was observed that only afew showed resistance to B.sorokiniana but none showed immunity. A study into the effect ofB. sorokiniana on wheatyield revealed that the artificial inoculation of plants at the flag leafstage reduced the number ofgrains per ear and 1000-grain weight by 7-100% and 12-100%, respectively, compared with thecontrol. Nutrient elements, especially micro-elements Cu, B, and Mo, were used as an alternatemethod of leaf spot control with the least possible disturbance of the overall natural soil fertilitybalance. Cu, B, and Mo, applied either as afoliar spray or to the soil, did not significantly affectleaf blight incidence; however, B application increased grain formation and wheat yields. An invitro study revealed that Bhas a strong inhibitory effect on B. sorokiniana.
Wheat is an important cereal after ricein Bangladesh. Of the many diseases
affecting wheat, spot blotch, caused byBipolaris sorokiniana, is considered themost important and common in the
country (Hossain and Azad 1992; Alam etal. 1994). Under field conditions, thedisease may be recorded on the wheat
plant from the seedling stage, but severity
increases with plant age. All commercial
varieties/cultivars in the country areeither moderately susceptible or
susceptible to spot blotch. Under fieldconditions, cultivars showed seedling
blight, leaf spot, leaf blight, head blight,
and black pointed grains. Furthermore, ifinfection is severe, the disease may cause
sterile spikes. Considering the importance
of the disease, research into 1) sources ofspot blotch resistance, 2) the effect of
disease on wheat yield, and 3) reducingyield loss through nutrient application isbeing conducted as discussed in this
paper.
Reaction to B. sorokln/anaof Local and Exotic WheatMaterials
Field study under naturaleplphytotlcs
In the search for sources of B.sorokiniana resistance, 619 wheat lines of
local and exotic origins were screened in
the field under natural epiphytoticconditions during 1990-1995. Wheat

genotypes were received from Brazil (Dr.Y.R. Mehta, Instituto Agronomico do
Parana, Brazil), Japan (Dr. Shoji Ohta,Plant Germplasm Institute, Faculty of
Agriculture, Kyoto University, Japan),India, Nepal, and Bangladesh (Dr. A.
Islam, Department of Genetics and Plant
Breeding, Bangladesh AgriculturalUniversity, Mymensingh, Bangladesh).
Moreover, wheat materials from
CIMMYT, obtained through Prof. Dr. A.
Islam, were included in the study.
The 619 genotypes showed differentreactions to B. sorokiniana. Diseaseevaluations were made at seedling,
maximum tillering, flag leaf, andflowering stages. Combined disease
severity was taken into account to assess
the entries. The rating scale of Gilchrist(1984) and Alam and Gustafson (1988)were modified and used according to
Hossain and Azad (1992). Only twoentries, one from Brazil and one from
Japan, were recorded as highly resistantto leaf spot. It was observed that 28,10,1,1, and 71 materials collected from Brazil,
Japan, India, Nepal and Bangladesh,
respectively, were recorded as resistant,Le., only 17.9% of the materials showed
resistance under natural infection in the
field. Another 15.8% materials were ratedas moderately resistant, while the rest
were found moderately susceptible,
susceptible, and highly susceptible.Variation in disease reaction among the
wheat materials may be due to: 1) genetic
variation among the test wheat materials,
2) genetic variation in the strains/races of
B. sorokiniana, and 3) variation in climatic
conditions.
Controlling Leaf Spot of Wheat through Nutrient Management 355
Artificial Inoculation studyTo further evaluate the promising
wheat genotypes, seed of the resistant tohighly resistant materials was grown and
tested under artificial inoculationconditions in the susbsequent growing
seasons. Pathogen isolation, and culture
and inoculum preparations wereperformed according to a CIMMYT
method (Gilchrist 1984), and reactions of
the wheat materials to B. sorokiniana werescored according to the scale of Alam and
Gustafson (1988). In total 113 wheatmaterials were tested.
Wheat plants were found to be more
vulnerable to B. sorokiniana at theseedling stage. Some materials showed
resistance to the pathogen at one growth
stage, and susceptibility at others. Onlyone material was rated as highly resistantat both seedling and maximum tillering
stages, but not at the flag leaf stage. Only15 of 113 (13.2%) wheat materials wererecorded as resistant.
Effect of Spot Blotch onWheat Yield
A study was undertaken to determine
the relationship between leaf spot
severity caused by B. sorokiniana underartificial epiphytotics and wheat yield.
Isolation and culture of the pathogen
were performed following the method ofGilchrist (1984). Inoculum preparation,
growing of the test plants, and
inoculation were carried out using themethods of Hossain et al. (1992). Only the
flag leaves of the plants were inoculated.
Disease reaction was estimated according
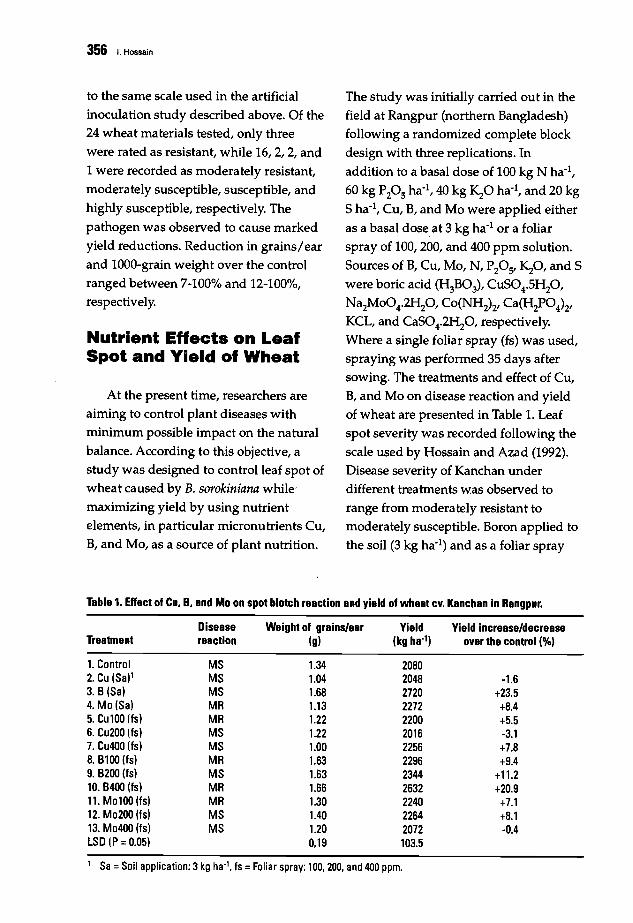
356 I. Hossain
to the same scale used in the artificialinoculation study described above. Of the24 wheat materials tested, only three
were rated as resistant, while 16, 2, 2, and
1 were recorded as moderately resistant,moderately susceptible, susceptible, and
highly susceptible, respectively. The
pathogen was observed to cause markedyield reductions. Reduction in grains/ear
and lOOO-grain weight over the control
ranged between 7-100% and 12-100%,respectively.
Nutrient Effects on LeafSpot and Yield of Wheat
At the present time, researchers areaiming to control plant diseases with
minimum possible impact on the naturalbalance. According to this objective, a
study was designed to control leaf spot ofwheat caused by B. sorokiniana while'
maximizing yield by using nutrientelements, in particular micronutrients Cu,
B, and Mo, as a source of plant nutrition.
The study was initially carried out in the
field at Rangpur (northern Bangladesh)following a randomized complete block
design with three replications. Inaddition to a basal dose of 100 kg N ha- l ,
60 kg Pz05 ha- l , 40 kg KzO ha- l , and 20 kgS ha- l , Cu, B, and Mo were applied either
as a basal dose at 3 kg ha- l or a foliar
spray of 100, 200, and 400 ppm solution.
Sources of B, Cu, Mo, N, P205' K20, and Swere boric acid (H3B03), CuS04.5HzO,
Na2Mo04·2HzO, Co(NH2)2' Ca(H2P04)2'KCL, and CaS04.2HzO, respectively.Where a single foliar spray (fs) was used,
spraying was performed 35 days aftersowing. The treatments and effect of Cu,B, and Mo on disease reaction and yieldof wheat are presented in Table 1. Leaf
spot severity was recorded following the
scale used by Hossain and Azad (1992).Disease severity of Kanchan under
different treatments was observed torange from moderately resistant tomoderately susceptible. Boron applied to
the soil (3 kg ha- l ) and as a foliar spray
Table 1. Effect of Cu. B. and Mo on spot blotch reaction and yield of wheat CY. Kanchan in Rangpur.
Disease Weight of grains/ear Yield Yield increase/decreaseTreatment reaction (g) (kg ha-') oyer the control (Ofo)
1. Control MS 1.34 20802.Cu(Sa)l MS 1.04 2048 -1.63.8 (Sa) MS 1.68 2720 +23.54. Mo (Sa) MR 1.13 2272 +8.45. Cul00 Its) MR 1.22 2200 +5.56. Cu200 (ts) MS 1.22 2016 -3.17. Cu400 (ts) MS 1.00 2256 +7.88.8100 (ts) MR 1.63 2296 +9.49.8200 (ts) MS 1.63 2344 +11.210.8400 (ts) MR 1.66 2632 +20.911. Mol00 (ts) MR 1.30 2240 +7.112. Mo200 (ts) MS 1.40 2264 +8.113. Mo400 (ts) MS 1.20 2072 -0.4LSD (P =0.05) 0.19 103.5
1 Sa =Soil application: 3kg ha-1, ts =Foliar spray: 100,200, and 400 ppm.
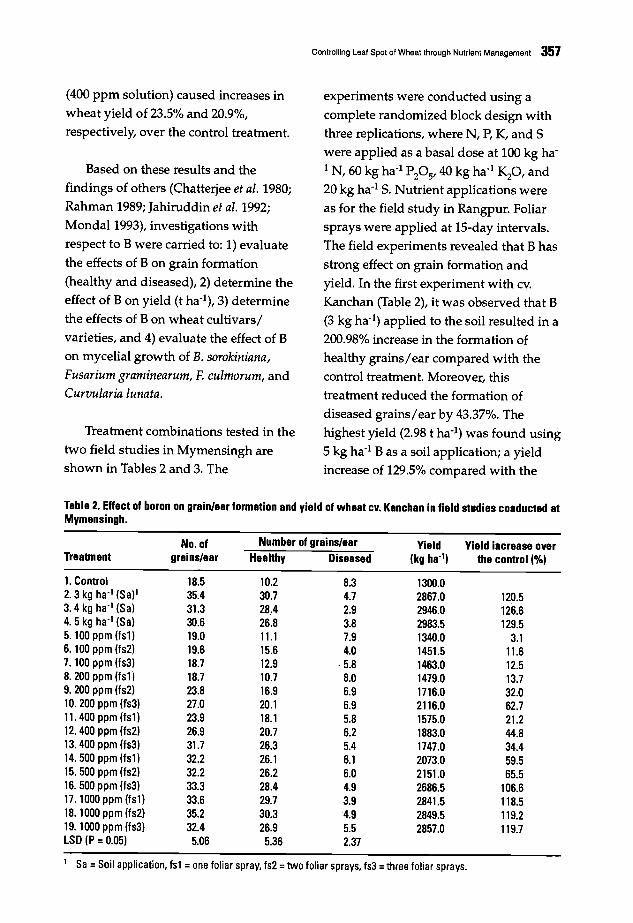
(400 ppm solution) caused increases in
wheat yield of 23.5% and 20.9%,respectively, over the control treatment.
Based on these results and thefindings of others (Chatterjee et al. 1980;
Rahman 1989; Jahiruddin et al. 1992;
Monda11993), investigations withrespect to B were carried to: 1) evaluate
the effects of B on grain formation
(healthy and diseased), 2) determine theeffect of B on yield (t ha- l ), 3) determine
the effects of B on wheat cultivars/
varieties, and 4) evaluate the effect of Bon mycelial growth of B. sorokiniana,
Fusarium graminearum, F. culmorum, and
Curvularia lunata.
Treatment combinations tested in the
two field studies in Mymensingh areshown in Tables 2 and 3. The
Controlling Leaf Spot of Wheat through Nutrient Management 357
experiments were conducted using a
complete randomized block design withthree replications, where N, P, K, and Swere applied as a basal dose at 100 kg ha
IN, 60 kg ha- l Pps' 40 kg ha- l Kp, and20 kg ha- l S. Nutrient applications were
as for the field study in Rangpur. Foliar
sprays were applied at IS-day intervals.
The field experiments revealed that B has
strong effect on grain formation and
yield. In the first experiment with cv.Kanchan (Table 2), it was observed that B(3 kg ha- l ) applied to the soil resulted in a
200.98% increase in the formation of
healthy grains/ear compared with thecontrol treatment. Moreover, thistreatment reduced the formation of
diseased grains/ear by 43.37%. Thehighest yield (2.98 t ha-l ) was found using
5 kg ha-l B as a soil application; a yieldincrease of 129.5% compared with the
Tabla 2. Enact of boron on grain/aar formation and yiald of whaat cv. Kanchan in fiald studias conductad atMymansingh.
No. of Numbar of grains/ear Yield Yiald increase overTreatment grains/ear Healthy Diseased (kg ha-') the control (%)
1. Control 18.5 10.2 8.3 1300.02.3 kg ha' l (Sa)l 35.4 30.7 4.7 2867.0 120.53.4 kg ha' l (Sa) 31.3 28..4 2.9 2946.0 126.64. 5 kg ha' l (Sa) 30.6 26.8 3.8 2983.5 129.55. 100 ppm (fsl) 19.0 11.1 7.9 1340.0 3.16. 100 ppm (fs2) 19.6 15.6 4.0 1451.5 11.67. 100 ppm (fs3) 18.7 12.9 ·5.8 1463.0 12.58. 200 ppm (fsll 18.7 10.7 8.0 1479.0 13.79. 200 ppm (fs2) 23.8 16.9 6.9 1716.0 32.010.200 ppm (fs3) 27.0 20.1 6.9 2116.0 62.711.400 ppm (fsl) 23.9 18.1 5.8 1575.0 21.212.400 ppm (fs2) 26.9 20.7 6.2 1883.0 44.813.400 ppm (fs3) 31.7 26.3 5.4 1747.0 34.414.500 ppm (fs1) 32.2 26.1 6.1 2073.0 59.515.500 ppm (fs2) 32.2 26.2 6.0 2151.0 65.516.500 ppm (fs3) 33.3 28.4 4.9 2686.5 106.617.1000 ppm (fsl) 33.6 29.7 3.9 2841.5 118.518.1000 ppm (fs2) 35.2 30.3 4.9 2849.5 119.219. 1000 ppm (fs3) 32.4 26.9 5.5 2857.0 119.7LSD (P = 0.05) 5.06 5.36 2.37
1 Sa =Soil application, fsl =one foliar spray, fs2 =two foliar sprays, fs3 =three foliar sprays.

358 I. Hossain
control. Boron at 3 kg ha·1 produced
yields of 2.87 t ha·1 which was 120.5%
higher than the control. Three foliar
sprays of Bat 1000 ppm also resulted in
significantly higher results and there was
no significant difference with resped to
production of healthy grains/ear among
treatments 2, 3, 4, 13,14,15,16,17,18,
and 19 (See Table 2).
Boron was found to always
significantly affect yields of the cultivars
tested (Table 3). It is interesting to note
that B produced similar yield effects for
cultivars Kanchan, Agrani, and Sonalika.
In vitro studyAn in vitro test revealed that mycelial
growth of B. sorokiniana was completely
inhibited at 6000 ppm B on PDA at
25+1°C; however, growth of F.graminearum, F. culmorum, and C. lunatawere not evident at 5000 ppm of B.
Conclusion
Leaf spot of wheat is common in
Bangladesh and is ranked the most
important disease with resped to
Table 3. Effect of boron and wheat variety onnumber of grains/ear (healthy and diseased) andyield of wheat.
No. of grains/ear
Healthy Diseased Yield It ha")
Treatment V1' V2 V3 V1 V2 V3 V1 V2 V3
BO (Control) 6.4 8.2 16.2 4.8 5.9 7.1 1.3 1.4 1.9B3 (Sa)2 32.7 43.1 29.1 4.8 2.9 2.7 2.5 2,3 2.3LSD (P =0.05) 9.39 ns ns
1 Vl =Kanchan. V2 =Agrani, and V3 =Sonalika.2 B3 (Sa) =3kg ha'l Bapplied to soil.
prevalence and reduction in wheat yield
and grain quality. Since no wheat
cultivars are free from leaf spot, sources
of resistance need to be identified under
Bangladesh conditions. In reality, it is
difficult and time consuming to develop
disease resistant wheat cultivars;
therefore, an integrated approach for leaf
spot control needs to be implemented.
Reference.
Alam, KB., and J.P. Gustafson. 1988. Tanspot resistance screening of Aegilopsspecies. Plant Breed 110:112-118.
Alam, KB., Shaheed, M.A., Ahmed, H.D.,and P.K. Malakar. 1994. Bipolaris leafblight (spot blotch) of wheat inBangladesh. In: D.A Saunders and G.P.Hettel (eds.), Wheat in Heat-StressedEnvironments: Irrigated, Dry areas andRice Wheat Farming Systems, pp. 339342. Mexico, D.E: CIMMYT.
Chatterjee, BN.,Chatterjee, M., and N.R.Das. 1980. Differences in the response ofwheat varieties to boron. Indian JAgricSci 50(10):796.
Gilchrist, L.I. 1984. CIMMYT methods forscreening wheat for Helminthosporiumsativum resistance. In: Wheat for moreTropical Environments. Proceedings ofthe International Symposium, pp. 149151~Mexico, D.F.: CIMMYT.
Hossain, I., and AK Azad. 1992. Reactionof wheat to Helminthosporium sativum inBangladesh. Hereditas 116:203-205.
Jahiruddin, M., Haque, M.S., Haque,AKM.M., and P.K. Rog. 1992. Influenceof boron, copper and molybdenum ongrain formation in wheat. Crop Res 5:3542.
Mondal, AB. 1993. Effect of boron ondifferent varieties of bread wheat(Triticum aestivum). Crop Res 6:330·340.
359
Phytosanitary Effect of the CombinedApplication of Green Manure andAntagonistic Bacterium Bacillus subfilison Bipolaris sorokiniana
A.K. NikonorovaAll-Russia Institute of Agricultural Microbiology, St. Petersburg, Pushkin, Russia
Abstract
A study was carried out to assess the potential ofantagonistic bacterium Bacillus subtilis
for biological control ofBipolaris sorokiniana, which causes common root and black point ofcereals. In in vitro experiments, Bacillus subtilis was found to negatively affect germ tubelength, hyphal development, and radial mycelial growth ofB. sorokiniana. A pre-sowingtreatment ofbarley seed with a cell suspension ofBacillus subtilis was found to improve cropyield. Inoculation with Bacillus subtilis, after covering soil with green manure, increased thephytosanitary effect of the soil, increased plant height, and improved seed quality. Theseimprovements led to a decrease in ratings ofcommon root rot to 6% and disease severity to32%. Crop yield increased by 35% and WOO-grain weight by 45%. Furthermore, the amount ofseed infected by black point (B. sorokiniana) fell below significant levels.
A bacteriu~ antagonistic to mostsoilborne cereal pathogenic fungi wasselected by the biological agriculturegroup of the All-Russia Institute of
Agricultural Microbiology. The bacterialstrain was found to produce an antibiotic
in pure culture that inhibits the growth ofpathogenic fungi, a group B vitamin, andindole-acetic acid. Based on cultural,
physiological, and biochemical tests, thebacterium was identified as Bacillussubtilis.
The aim of the study was to assess thepotential of Bacillus subtilis for biological
control of cereal pathogenic fungi. To
achieve this, the interaction mechanisms
between antagonist, soil, plant, and
phytopathogen had to be determined.
Materials and Methods
The fungus used in the experimentwas Bipolaris sorokiniana (Sacc.)
Shoemaker. The number of B. sorokinianaspores in the soil was calculated by theflotation method according to Ledingham
and Chinn (1955). Soil microflora were
identified by the dilution-plate technique.Bacillus subtilis was selected from the soil,
characterized by its gram-positive, sporeforming, and rod-shaped properties. A
bacterial cell suspension containing
metabolites was cultured in a liquid
meat-peptone broth with 0.5% CaC03. A
cell suspension of Bacillus subtilis was
extracted from the culture by
centrifugation at 40,000 revolutions per
minute. Bacillus subtilis infection on seedswas 1 x 10⁸ cells per seed.
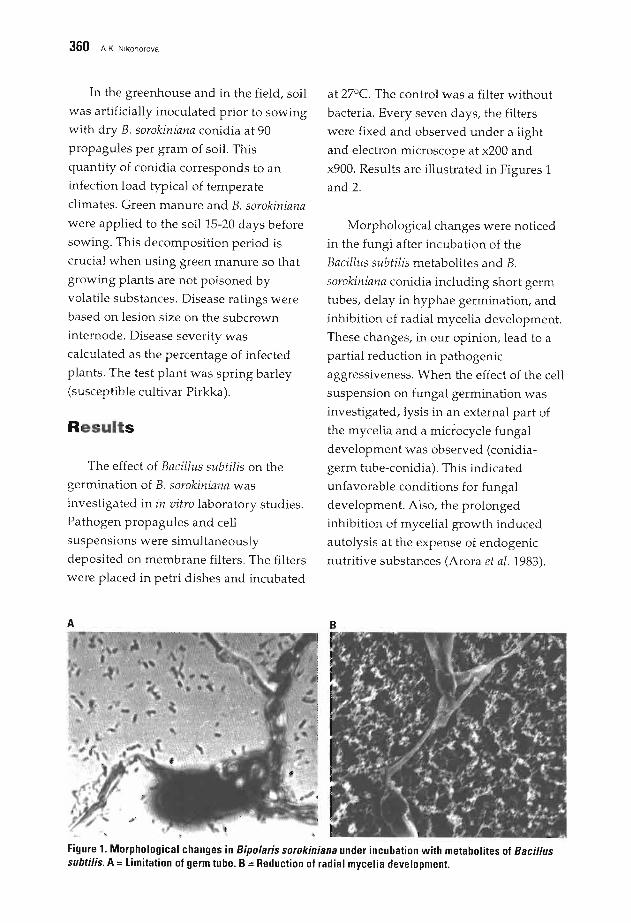
360 AX Nikonorova
In the greenhouse and in the field, soil
was artificially inoculated prior to sowing
with dry B. sorokiniana conidia at 90
propagules per gram of soil. This
quantity of conidia corresponds to an
infection load typical of temperate
climates. Green manure and B. sorokiniana
were applied to the soil 15-20 days before
sowing. This decomposition period is
crucial when using green manure so that
growing plants are not poisoned by
volatile substances. Disease ratings were
based on lesion size on the subcrown
internode. Disease severity was
calculated as the percentage of infected
plants. The test plant was spring barley
(susceptible cultivar Pirkka).
Results
The effect of Bacillus subtilis on the
germination of B. sorokiniana was
investigated in in vitro laboratory studies.
Pathogen propagules and cell
suspensions were simultaneously
deposited on membrane filters. The filters
were placed in petri dishes and incubated
A
at 27°C. The control was a filter without
bacteria. Every seven days, the filters
were fixed and observed under a light
and electron microscope at x200 and
x900. Results are illustrated in Figures 1
and 2.
Morphological changes were noticed
in the fungi after incubation of the
Bacillus subtilis metabolites and B.
sorokiniana conidia including short germ
tubes, delay in hyphae germination, and
inhibition of radial mycelia development.
These changes, in our opinion, lead to a
partial reduction in pathogenic
aggressiveness. When the effect of the cell
suspension on fungal germination was
investigated, lysis in an external part of
the mycelia and a microcycle fungal
development was observed (conidia
germ tube-conidia). This indicated
unfavorable conditions for fungal
development. Also, the prolonged
inhibition of mycelial growth induced
autolysis at the expense of endogenic
nutritive substances (Arora et al. 1983).
B
Figure 1. Morphological changes in Bipolaris sorokiniana under incubation with metabolites of Bacillussubtilis. A =Limitation of germ tube. B =Reduction of radial mycelia development.

Phytosanilary Effect of the Combined Application of Green Manure and Antagonistic Bacterium Bacillus subrilis on Bipolaris sorokiniana 361
To study the potential of Bacillus
subtilis for biological control on barley
seedlings, soil was sterilized twice under
2 at 30 min. Seeds were surface sterilized
with HgClz (1:1000), repeatedly washed
with distilled water, and placed on a
meat-peptone agar prior to seedling
shooting.
It was established that metabolites
increased root length by 39.4%, and
infection of seeds by spores increased
seedling weight by 34.8% (Table 1). This
was obviously due to stimulation of
growth by metabolites produced by the
A
o
o
B
Figure 2. Conidia of Bipolaris sorokinianaincubated with a cell suspension of Bacillussubtilis. A =Lysis of mycelia. B =Microcycle.
Bacillus subtilis culture during
development in the soil. To investigate
further, the cell suspension culture and
metabolites of Bacillus subtilis were
combined in other experiments.
It was previously demonstrated that
green fertilizers activate soil microflora
and the production of antibiotics by
Bacillus subtilis (Voznyakovskaya and
Nikonorova 1992). Using this knowledge,
the effect of a combined application of
green organic matter and antagonistic
Bacillus subtilis culture on B. sorokiniana
survival in the soil was tested.
In the greenhouse, different types of
organic matter were analyzed including
common winter cress, blue lupine, and
green oat. Two seed inoculation methods
were used: at the time of sowing, and
after covering with green manure. Results
showed that: 1) inoculation of seeds with
Bacillus subtilis after covering with green
manure (independent of the green
manure quality) improved the
phytosanitary effect of the culture; and 2)
the positive effect of the combined
application of green manure and
antagonistic bacterium was independent
of the inoculation method.
Table 1. Effect of Bacillus subtilis on thedevelopment of barley seedlings. A comparison ofdifferent formulations of the antagonist.
Root Seedling Drylength height weight
Treatment (em) (%) (em) (%) (g) (%)
Liquid media 9.9 0.0 24.4 0.0 0.23 0.0Spores 10.8 9.1 25.9 6.1 0.31 34.8Metabolites 13.8 39.4 25.5 4.5 0.25 8.7
P<0.05 (LSD) 0.7 0.5 0.01
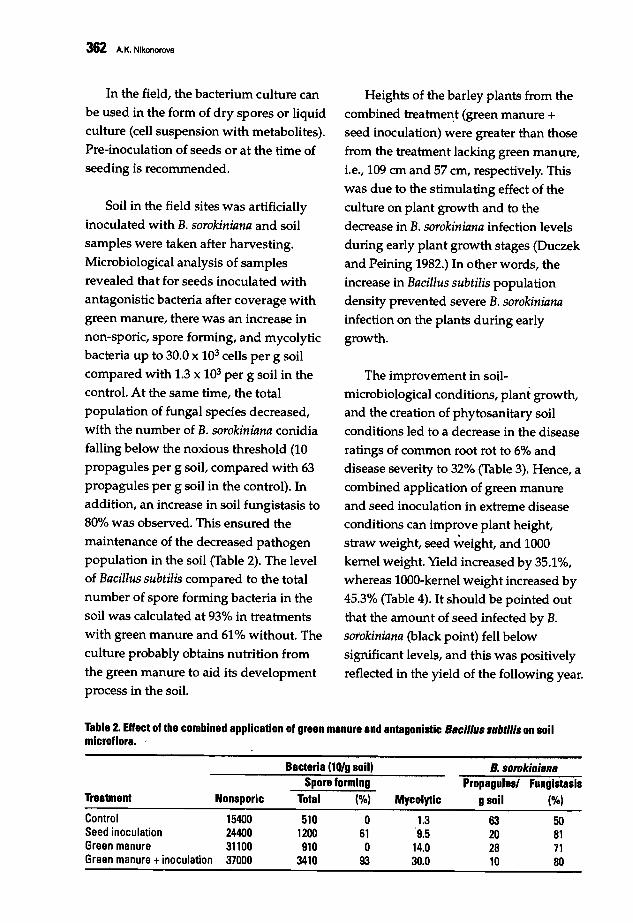
362 A.K. NlkonorOVB
In the field, the bacterium culture can
be used in the form of dry spores or liquidculture (cell suspension with metabolites).Pre-inoculation of seeds or at the time of
seeding is recommended.
Soil in the field sites was artificially
inoculated with B. sorokiniana and soil
samples were taken after harvesting.
Microbiological analysis of samplesrevealed that for seeds inoculated with
antagonistic bacteria after coverage withgreen manure, there was an increase in
non-sporic, spore forming, and mycolyticbacteria up to 30.0 X 10³ cells per g soilcompared with 1.3 x 10³ per g soil in thecontrol. At the same time, the total
population of fungal species decreased,with the number of B. sorokiniana conidiafalling below the noxious threshold (10
propagules per g soil, compared with 63propagules per g soil in the control). Inaddition, an increase in soil fungistasis to80% was observed. This ensured the
maintenance of the decreased pathogenpopulation in the soil (Table 2). The levelof Bacillus subtilis compared to the totalnumber of spore forming bacteria in the
soil was calculated at 93% in treatmentswith green manure and 61% without. The
culture probably obtains nutrition from
the green manure to aid its developmentprocess in the soil.
Heights of the barley plants from the
combined treatme~t (green manure +
seed inoculation) were greater than thosefrom the treatment lacking green manure,
Le., 109 em and 57 em, respectively. This
was due to the stimulating effect of the
culture on plant growth and to the
decrease in B. sorokiniana infection levelsduring early plant growth stages (Duczek
and Peining 1982.) In other words, the
increase in Bacillus subtilis populationdensity prevented severe B. sorokinianainfection on the plants during early
growth.
The improvement in soilmicrobiological conditions, plant growth,and the creation of phytosanitary soil
conditions led to a decrease in the disease
ratings of common root rot to 6% anddisease severity to 32% (Table 3). Hence, a
combined application of green manureand seed inoculation in extreme diseaseconditions can improve plant height,
straw weight, seed ~eight, and 1000kernel weight. Yield increased by 35.1%,whereas 1000-kernel weight increased by45.3% (Table 4). It should be pointed out
that the amount of seed infected by B.sorokiniana (black point) fell below
significant levels, and this was positively
reflected in the yield of the following year.
Table 2. Effect of the combined application of green manure and antagonistic Bacillus subl/lls on soilmlcroflora.
Bacteria (10/g soli) B. sorokinianaSpore forming Propagules/ Fungistasis
Treatment Nonsporlc Total (%) Mycolytlc gsoil (%)
Control 15400 510 0 1.3 63 50Seed inoculation 24400 1200 61 9.5 20 81Green manure 31100 910 0 14.0 28 71Green manure +inoculation 37000 3410 93 30.0 10 80
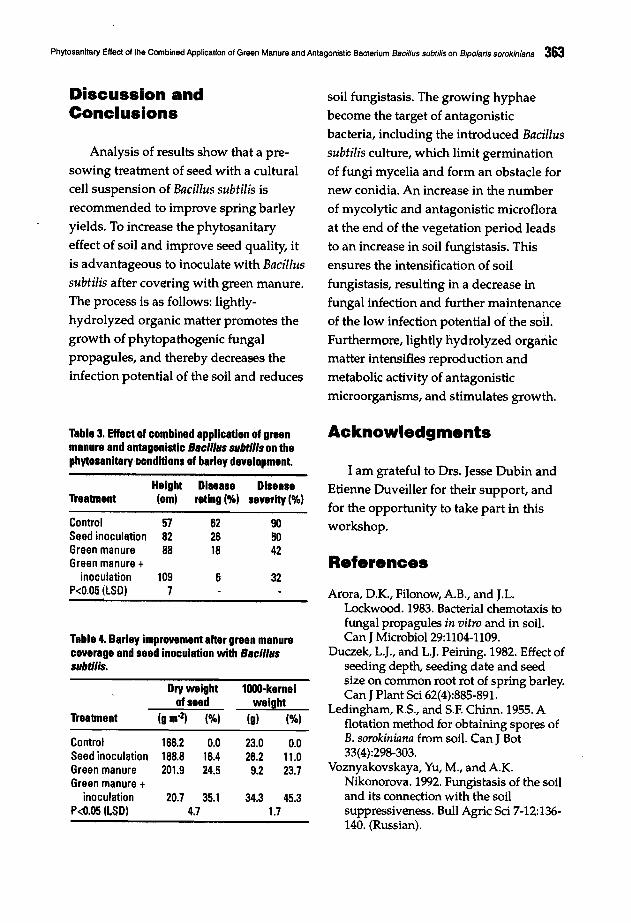
Phytosanitary Effect of the Combined Application of Green Manure and Antagonistic Bacterium Bscillus subtilis on Bipo/sris sorokinlsns 363
Discussion andConclusions
Analysis of results show that a presowing treatment of seed with a cultural
cell suspension of Bacillus subtilis isrecommended to improve spring barley
yields. To increase the phytosanitary
effect of soil and improve seed quality, it
is advantageous to inoculate with Bacillussubtilis after covering with green manure.The process is as follows: lightly
hydrolyzed organic matter promotes thegrowth of phytopathogenic fungalpropagules, and thereby decreases the
infection potential of the soil and reduces
Table 3. Effect of Qombined application of greenmanure and antagonistic Bacillus subtl/ls on thephytosanltaryoondltlons of barley development.
Height Disease DiseaseTreatment (om) retlng (0/0) severity (0/0)
Control 57 62 90Seed inoculation 82 26 50Green manure 88 18 42Green manure +
inoculation 109 6 32P<0.05ILSD) 7
Table 4. Barley improvement after green manurecoverage and seed inoculation with Bac;llussubtll;s.
Dry weight 1l1OO·kernelof seed weight
Treatment (g moZ) (0/0) (g) ("!o)
Control 166.2 0.0 23.0 0.0Seed inoculation 188.8 16.4 26.2 11.0Green manure 201.9 24.5 9.2 23.7Green manure +
inoculation 20.7 35.1 34.3 45.3P<0.05 (LSD) 4.7 1.7
soil fungistasis. The growing hyphaebecome the target of antagonisticbacteria, including the introduced Bacillussubtilis culture, which limit germination
of fungi mycelia and form an obstacle fornew conidia. An increase in the number
of mycolytic and antagonistic microflora
at the end of the vegetation period leadsto an increase in soil fungistasis. This
ensures the intensification of soil
fungistasis, resulting in a decrease infungal infection and further maintenance
of the low infection potential of the soil.
Furthermore, lightly hydrolyzed organicmatter intensifies reproduction andmetabolic activity of antagonistic
microorganisms, and stimulates growth.
Acknowledgments
I am grateful to Drs. Jesse Dubin andEtienne Duveiller for their support, and
for the opportunity to take part in thisworkshop.
References
Arora, D.K., Filonow, A.B., and J.L.Lockwood. 1983. Bacterial chemotaxis tofungal propagules in vitro and in soil.CanJ MicrobioI29:1104-1109.
Duczek, L.J., and L.J. Peining. 1982. Effect ofseeding depth, seeding date and seedsize on common root rot of spring barley.Can J Plant Sci 62(4):885-891.
Ledingham, R.S., and S.P. Chinn. 1955. Aflotation method for obtaining spores ofB. sorokiniana from soil. Can J Bot33(4):298-303.
Voznyakovskaya, Yu, M., and A.K.Nikonorova. 1992. Fungistasis of the soiland its connection with the soilsuppressiveness. Bull Agric Sci 7-12:136140. (Russian).

364
Seed Pathology of Tan Spot
G.c. Bergstrom and A.M.C. SchilderDepartment of Plant Pathology, Cornell University, Ithaca, New York, USA
Abstract
Pyrenophora tritici-repentis is a common component of the internal flora ofwheat seed. Amodel ofseed infection and transmission ofP. tritici-repentis was developed based primarily onresearch with soft white winter wheat. Spores of the pathogen germinate on the wheat floret. Thefungus initially colonizes the surfaces of the lemma, palea, or glume, and reaches the seed viamycelial proliferation. Penetration of the kernel pericarp is direct via appressoria. The pathogenramifies throughout the pericarp, where it remains viable for at least three years. Maximal seedinfection results from spike inoculation at kernel milk stage. In naturally infected wheat seeds,P. tritici-repentis is found throughout the pericarp but seldom in the seed coat or embryo. Seedtransmission occurs in a non-systemic manner. The emerging coleoptile is externally infected byhyphal growth from the infected pericarp, and the first and second seedling leaves may beinfected by external hyphal growth from the coleoptile. Transmission efficiency varies with seedlot and ranges from 0 to 92%. Factors affecting seed transmission are not well understood; theyinclude soil temperature and may also include age ofseed, wheat cultivar, developmental stagewhen seed infection occurred, and soil moisture during emergence. Infected seed may provideinoculum for tan spot epidemics and for dispersal offungal strains to new geographic locations.
Pyrenophora tritici-repentis is
documented worldwide as a componentof the fungal flora of wheat seed (Schilderand Bergstrom 1993). Seeds infected by P.
tritici-repentis often show a salmon-pink
discoloration at the embryo end orelsewhere on the seed surface (Valder
1954; VanterpooI1963), but may
otherwise look healthy. Schilder andBergstrom (1993) reviewed practical
procedures for assessing seed lots for the
presence of the fungus. Seed infectiondoes not affect germination, but does
reduce seedling vigor (Hylten-Cavallius
1984; Schilder and Bergstrom 1995). The
fungus also may be transmitted to
seedlings. Symptoms on seedlings grown
from infected seed on water agar consistof numerous, tiny dark brown spots on
the lower coleoptile, whereas seedlingsgrown in soil show elongated brownlesions up to 2 mm in length on thecoleoptile and occasionally on the first
.. leaf (Hylten-eavallius 1984; Obst 1989).Infected seedlings are smaller than their
healthy counterparts and sometimesdistorted (Hylten-Cavallius 1984; Schilder
and Bergstrom 1995). Transmission
efficiency has been reported to rangebetween 18 and 92% (Schilder and
Bergstrom 1995; Hylten-Cavallius 1984;
Obst 1989). Bergstrom (unpublished) hasalso examined lots with a high incidence
ofinfected seed, but with seedlingtransmission efficiencies of 0-10%. The
relative contribution of seedbome
inoculum to tan spot epidemics has notbeen established.

Seed Pathology of Tan Spot 365
embryo
Pyrenophora tritici-repentis penetrated
the pericarp (Figure 2) of the wheat kernel
directly via appressoria. Hyphal density
quickly increased below the upper
pericarp, and the fungus also established
itself readily in the lower pericarp, where
it can remain viable for at least three years
in refrigerated storage. The glume by
itself apparently contributed less to seed
infection than did the lemma and palea.
Seed infection after inoculation of the
glume per se was attributed to invasion
and colonization of the glume at
senescence and subsequent penetration of
the various layers at the base of the floret.
Anthers appeared to slightly stimulate
seed infection by P. tritici-repentis, possibly
by serving as a source of nutrients or as a
parts were also indicative of a resistant
reaction. Only at the onset of senescence
did P. tritici-repentis ramify through the
internal cell layers of the glume, lemma,
and palea.
aleurone layer
Figure 2. The caryopsis (C) of wheat and its pericarp (A,B). The caryopsis was cut longitudinally parallel withthe groove. The small rectangle in C, above, indicatesthe location of the section in A. B shows a surfaceview of the pitted wall of a cross cell. Letters ii signifyinner integument.Reprinted from 'Plant Anatomy' by K. Esau, 1965, JohnWiley and Sons, New York, with permission granted bythe estate of Dr. Esau.
epidermis~~j~ fe- hypodermiS ~~~ ~ :fI~ mesocarp[~ ~CJ ~f~0. cross cells _
tube cell J _~{Cutlcular layer _..- jEe Inner layer of II :;
crushed nucellar cells i"fJ
l!1-p;ts
Figure 1. A floret of wheat.
Schilder and Bergstrom (1993)
employed targeted inoculation of flower
parts followed by microscopic
examination to elucidate the infection
process. Pyrenophora tritici-repentis initially
colonized the outer and sometimes the
inner surfaces of the glume, lemma, and
palea (Figure 1), and reached the seed
primarily via mycelial proliferation. The
thick-walled epidermides of the glume,
lemma, and palea were initially
sufficiently resistant to penetration to
permit invasion only at the thin edges.
Small dark lesions observed on these
The Seed InfectionProcess
Highlighted findings are reported here
from studies on seed pathology of P.
tritici-repentis in wheat at Cornell
University, and the reader is referred to
the original references (Schilder 1993;
Schilder and Bergstrom 1993, 1994a, b,
1995) for more details on procedure and
reviews of other pertinent literature.
Models are presented of the processes of
seed infection and seed transmission as
derived from experiments performed
primarily with soft white winter wheat.
366 G.C. Bergstrom and A.M.C. Sohilder
port of entry, as many of the dehiscedanthers partly extruded from between thelemma and palea.
Most seed infection events occurredbetween 5-14 days after inoculation, butinfection took place as early as 3 and upto 21 days after inoculation. The timeframe of seed infection may also beinfluenced by humidity, temperature,inoculum density, and seed developmentstage. Wheat seeds were susceptible toinfection by P. tritici-repentis throughoutmost of their development, from the endof anthesis through the soft dough stageand possibly beyond. An increase in thenumber of P. tritici-repentis-infected seedswas noted when inoculation took place atthe milk stage. This may be explained bythe large seed size and high moisturecontent favoring access to and infection ofthe seeds at this stage. The lowerincidence of infected seeds afterinoculation at the dough stage may alsobe due to the reduced time available forinfection before harvest. A fieldexperiment showed that, under naturalconditions, seed infection can take placeat very late stages of development, and .that the incidence of seed infection islikely to be affected by the amount ofinoculum available at the time ofripening.
Although incidence of seed infectionby P. tritici-repentis was affected by
genotype, foliar susceptibility wasgenerally not a good predictor ofsusceptibility to seed infection. Fernandezet al. (1992) reported that durum wheatvarieties differed in pink smudgeincidence which was not correlated with
flag leaf resistance to P. tritici·repentis.Resistance to seed infection may beexplained by incompatibility with thefungus, an unfavorablemicroenvironment of the florets, orrestriction of fungal invasion of floral andseed tissues. The latter may have been afactor in the apparent resistance ofgenotype BR 8 to seed infection at earlyand late stages of seed development, asthe palea was observed to have broadermargins and the seed was more tightlyenclosed. Perhaps BR 8 also supportedless hyphal colonizatiohof the floretsurfaces. Since even BR 8 could attainhigh levels of infected seeds wheninoculated at the appropriate stage,resistance to seed infection may only bepartially effective; however, noinformation is a\railable on the efficiencyof transmission of the fungus by infectedseed of resistant cultivars.
'Fh. S.ed 'FransmlsslonProc•••.
Schilder and Bergstrom (1995) studiedseed transmission in vitro and in soil. Seedtransmission rates of P. tritici·repentis frominfected seeds to seedling coleoptiles wereas high as 92% in vitro, and as high as 60%in potting soil outdoors. Transmissionrates to seedling leaves were lower ~t 14%in vitro and 17% in potting soil. Hylten·Cavallius (1984) reported a 59%transmission rate in seedlings grown inpotting mix at 6°C for 10 days, followedby 200C. A tranlJmisttion rate of 13%1 forseedlings grown at 8·9OC at highhumidity was reported by Obat (1989).The humid environment created by wateragar in test tubes was very conducive to

both growth and transmission of P. triticirepentis. Seed infection by P. tritici-repentisreduced emergence only slightly, butresulted in a marked and long-lasting
reduction in plant vigor. This could affectwinter survival, susceptibility to other
pathogens, and possibly even yield.
Activity of P. tritici-repentis within theseed remnants was evident by the
formation of immature pseudothecia in
the pericarp. The general stuntingobserved in plants grown from infected
seed may be explained by competition
with the seedling for the nutrients storedin the endosperm and aleurone layer.
Microscopic examination of infectedseedlings provided information regarding
the probable path followed by the fungus
during seed-to-seedling transmission(Schilder and Bergstrom 1995).Pyrenophora tritici-repentis externally
infected the coleoptile as it emergedduring germination by hyphal growthfrom the pericarp. The first leaf
apparently became i."fected by contactwith hyphae from an infected coleoptileas the leaf pushed through its tip.
Seed transmission efficiency of P.
tritici-repentis was reduced by lm increase
in soil temperature. The fungus may havebeen at a relative advantage due to slow
growth of the seedling at lower
temperatures. A delay in seedgermination by means of an osmotic
sugar solution enhanced symptom
development on coleoptiles of seedlingsgrown from P. tritici-repentis-infectedwheat seed (Schilder 1993). These
findings imply that seedborne inoculumof P. tritici-repentis may be managed by
Seed Pathology ot Tan Spot 367
adjusting the planting date. In contrast to
seed transmission efficiency, recovery ofP. tritici-repentis from symptomaticcoleoptiles and leaves improved with an
increase in soil temperature. Morethorough colonization of plant tissues
probably occurred at warmer
temperatures. In general, the fungus was
more frequently isolated from large
lesions than from small lesions.
The incidence of lesions on the uppercoleoptile, which may be of
epidemiological importance, was muchlower than the incidence of lesions on theentire coleoptile, and also exhibited a
negative linear response to an increas~ intemperature. PrOXimity of the fungus
within the pericarp to the emergingcoleoptile may determine the location oflesions on the coleoptile, and indirectly
the incidence of foliar lesions, whichapparently resulted from hyphae onlesions at the coleoptile tip or along
cracks in the coleoptile.
Further Re.earch
Research is needed to determine therelative contribution of infected seed to
tan spot development and to subsequent
yield losses under growing conditions invarious parts of the world. Important
epidemiological factors that will
determine the impact of seedborneinoculum on subsequent disease
development in the field are incidence of
seed infection, the efficiency of seed-to
seedling transmission, and the rate of
disease development from the initial
focus of inoculum. The effects of soil
moistur~, planting depth, wheat cultivar,
368 G.e. Bergstrom and A.M.e. Schilder
fungus isolate, and even degree of seed
colonization on seed transmission of P.tritici-repentis should be investigated
further. Perhaps high transmission rates
occur only with 'deep-seated' infections
associated with infection at early stages of
seed development. A preliminary
experiment showed differences in seed
transmission of P. tritici-repentis, unrelated
to foliar susceptibility, among wheat
cultivars (Schilder, unpublished). This
question needs to be explored. Both seed
applied fungicides and microbial
antagonists need to be evaluated forcontrol of seedbome inoculum of P. triticirepentis.
Even if seedbome inoculum turns out
to playa minor role in the development of
tan spot epidemics, it may still provide
additional inoculum, possibly with a
different array of virulence phenotypes
than already exists in a field. Fungal
populations that are normally isolated in
space and time may get a chance to
interact through the planting of infected
seed and may constitute, in effect, a
single, large population. Seed infection by
P. tritici-repentis has consequences for both
wheat production and trade of Wheat
seed at a national and international level.
In 1964, de Tempe postulated that
movement of infected seed was
responsible for the worldwide occurrence
of tan spot. Different pathotypes of the
fungus may also spread via seed to areas
where they did not previously exist.
Among international cooperators, seed
health testing and fungicidal seed
treatment should be practiced to reduce
risk associated with seed exchange.
Reference.
de Tempe, J. 1964. Helminthosporium speciesin seeds of wheat, barley, oats, and rye.Proceedings of the International SeedTesting Association 29:117-140.
Fernandez, M.R, Clarke,J.M., DePauw,RM., Irvine, RB., and J.G. Mcleod. 1992.Evaluation of durum wheat for resistanceto tan spot and pink smudge. In: L.J.Francl, J.M. Krupinsky, and M.P.McMullen (eds.), Advances in Tan SpotResearch: Proceedings of the 2ndInternational Tan Spot Workshop, pp. 2832. Fargo, ND, USA: North DakotaAgricultural Experiment Station.
Hylten-Cavallius, I. 1984. VetetsBladflacksjuka (Drechslera tritici-repentis(Died.) Shoem.) ~ Biologi ochBekampning. Examensarbeten 1984:1.Institutionen for viixt- och skogsskydd.54pp.
Obst, A 1989. Weizen auch gegen HTRbeizen? Gesunde Pflanzen 41:278-281.
Schilder, AM.C., and G.c. Bergstrom. 1993.Tan spot. In: :;.B. Mathur and B.M.Cunfer (eds.); Seed-borne Diseases andSeed Health Testing of Wheat, pp. 113122. Copenhagen, Denmark: Institute ofSeed Pathology for DevelopingCoimtries. 168 pp.
Schilder, AM.C. 1993. Aspects of theepidemiology of tan spot of wheat inNew York. Ph.D. thesis, CornellUniversity, Ithaca, New York. 195 pp.
Schilder, AM.C., and G.c. Bergstrom. 1994a.Infection of wheat seed by Pyrenophoratritici-repentis. Can J Bot 72:51O-~~9.
Schilder, AM.C., and G.c. Bergstrom. 1994b.." PyrenophOra tritici-repentisas a component
of the fungal flora of winter wheat seed·in New York. Seed Sci TechnoI22:285,297.
Schilder, AM.C., and G.c. Bergstrom. 1995.Seed transmission of Pyrenophora triticirepentis, causal fungus of tan spot of .wheat. Eur J Plant Pathol101:81~91.
Valder, P.G. 1954. Yellow spot and pink grainin wheat. Agriculture Gazette NSW65:36~37. .
Vanterpool, T.C. 1963. Pink and smudgepink discoloration of wheat seedassociated with the yellow leaf spotdisease (Drechslera tritici-repentisr .Proceedings of the CanadianPhytopathological Society 30:19-20.
369
Wheat Reaction to Kernel Infection byPyrenophora frifici-repenfis and Effect onthe Subsequent Crop
M.R. Fernandez, J.M. Clarke, R.M. DePauw, and S.L. FoxDepartment of Plant Pathology, Agriculture and Agri-Food Canada, SwiftCurrent, Canada
Abstract
Infection ofwheat kernels by Pyrenophora tritici-repentis (Ptr) causes different types ofdiscoloration. The symptom most commonly associated with kernel infection by this fungus isa reddish/pinkish discoloration known as red smudge, but dark smudge/specks and black pointare also common. Other fungi, mostly Alternaria spp. and Cochliobolus sativus, have beenmore frequently isolated than Ptr from black-pointed durum wheat kernels in southernSaskatchewan. All wheat cultivars currently registered for use in western Canada aresusceptible to Ptr-kernel infection. There is no correlation between susceptibility of leaves andofkernels to Ptr. There are differences among cultivars in incidence and severity of infection,and in the prevalent type ofsymptom developed. The intensity, incidence, and extent ofkerneldiscoloration is partially related to seed color. The reddish discoloration was more apparent inwhite than in red seeds, and percent and severity ofPtr infection were generally higher inwhite seeded wheats than in red seeded wheat cultivars. Black point in Ptr-infected kernels wasobserved in all wheat classes. Its development was genotype-dependent, although it alsoappeared to be related to infection severity: The effect of red smudge infection ofdurum wheatseed on the health of the subsequent plants was examined in controlled-environment and fieldstudies. Percent germination was lower for naturally infected red smudged seed than foruninfected seed, whereas germination rate was higher for artificially infected red smudged seedthan for uninfected seed. The observation that red smudge speeds up germination ofseeds wasconfirmed in common wheat. Growth of the coleoptile and primary roots, and number of rootswere also depressed in red smudged seeds, indicating that Ptr-infection has a negative effect onseed vigor. A field study designed to examine the effect of red smudge on seedling emergence,plant growth, and yield using three red smudge treatments (0%, 50%, and 100%) showed thatpercent emergence ofseedlings declined with increasing proportion ofred smudged seeds. Thisresulted in poor stands and lower yields per unit area in the field. Rate ofseedling emergenceand time to heading were also lower for red smudge treatments than controls; however, grainweight and yield per plant were not significantly affected. In none of the experiments wastransmission of Ptr to durum wheat seedlings observed, but only to the coleoptile undercontrolled conditions.
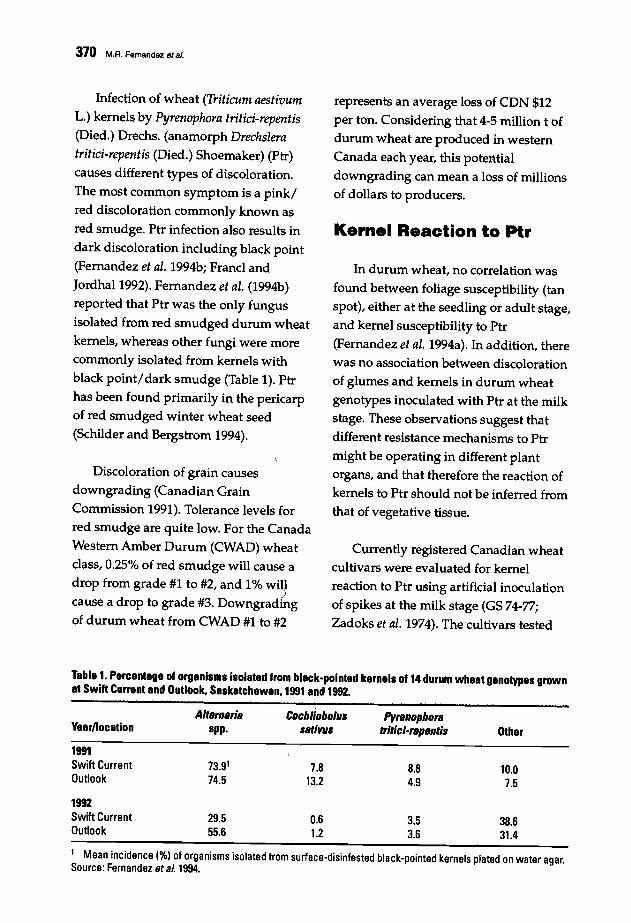
310 M.R. Farnandaz at a/.
Infection of wheat (Triticum aestivumL.) kernels by Pyrenophora tritici-repentis(Died.) Drechs. (anamorph Drechsieratritici-repentis (Died.) Shoemaker) (Ptr)
causes different types of discoloration.
The most common symptom is a pink/red discoloration commonly known as
red smudge. Ptr infection also results indark discoloration including black point
(Fernandez et ai. 1994b; Francl and
]ordhaI1992). Fernandez et ai. (1994b)reported that Ptr was the only fungusisolated from red smudged durum wheat
kernels, whereas other fungi were morecommonly isolated from kernels with
black point/dark smudge (Table 1). Ptrhas been found primarily in the pericarpof red smudged winter wheat seed
(Schilder and Bergstrom 1994).
Discoloration of grain causesdowngrading (Canadian Grain
Commission 1991). Tolerance levels forred smudge are quite low. For the Canada
Western Amber Durum (CWAD) wheatclass, 0.25% of red smudge will cause a
drop from grade #1 to #2, and 1% wi~l
cause a drop to grade #3. Downgrading
of durum wheat from CWAD #1 to #2
represents an average loss of CDN $12per ton. Considering that 4-5 million t ofdurum wheat are produced in western
Canada each year, this potential
downgrading can mean a loss of millionsof dollars to producers.
Kernel Reaction to Plr
In durum wheat, no correlation was
found between foliage susceptibility (tanspot), either at the seedling or adult stage,
and kernel susceptibility to Ptr(Fernandez et ai. 1994a). In addition, there
was no association between discolorationof glumes and kernels in durum wheat
genotypes inoculated with Ptr at the milkstage. These observations suggest thatdifferent resistance mechanisms to Ptr
might be operating in different plantorgans, and that therefore the reaction of
kernels to Ptr should not be inferred fromthat of vegetative tissue.
Currently registered Canadian wheatcultivars were evaluated for kernelreaction to Ptr using artificial inoculationof spikes at the milk stage (GS 74~77;
Zadoks et ai. 1974). The cultivars tested
Tablet Percentage of organisms isolated from black-pointed kernels of 14 durum wheat ganotypes grownat Swift Current and Outlook. Saskatchewan. 1991 and 1992.
Alternsris Cochliobolu. PyrllnophorsYear/location spp. .stivu. tritici-repenti. Other
1991Swift Current 73.91 7.8 8.8 10.0Outlook 74.5 13.2 4.9 7.5
1992Swift Current 29.5 0.6 3.5 38.6Outlook 55.6 1.2 3.6 31.4
1 Mean incidence (%) of organisms isolated from surface-disinfested black-pointed kernels plated on water agar.Source: Fernandez et al. 1994.
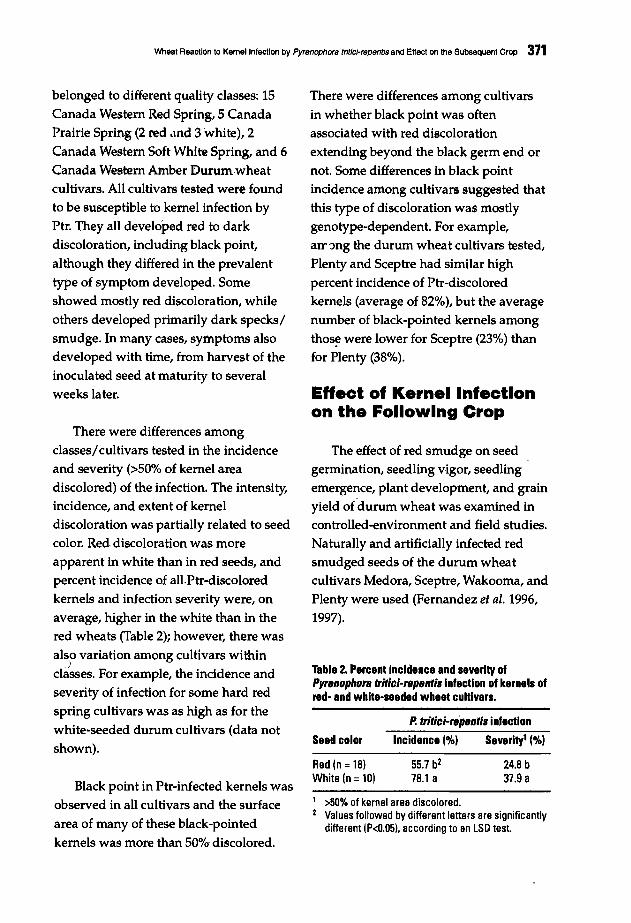
Wheat Raactlon to Kemellnfection by Pyrenophora tritlci·repentis and Effect on the Subsequent Crop 371
belonged to different quality classes: 15Canada Western Red Spring, 5 CanadaPraitie Spring (2 red .lnd 3 white), 2Canada Western Soft White Spring, and 6Canada Western Amber Durumwheatcultivars. All cultivats tested were foundto be susceptible to kernel infection byPtr. They all developed red to darkdiscoloration, including black point,although they differed in the prevalenttype of symptom developed. Someshowed mostly red discoloration, whileothers developed primarily dark specks/smudge. In many cases, symptoms alsodeveloped with time, from harvest of theinoculated seed at maturity to severalweeks later.
There were differences among cultivarsin whether black point was oftenassociated with red discolorationextending beyond the black germ end ornot. Some differences in black pointincidence among cultivars suggested thatthis type of discoloration was mostlygenotype·dependent. For example,arr:mg the durum wheat cultivars tested,Plenty and Sceptre had similar highpercent incidence of Ptr-discoloredkernels (average of 82%), but the averagenumber of black-pointed kernels amongtho~were lower for Sceptre (23%) thanfor Plenty (38%).
Effect of Kernel Infectionon the Following Crop
>50% of kernel area discolored.Values followed by different letters are significantlydifferent IP<O,05). according to an LSD test.
Table 2. Percent incidence and severity ofPyrenophor. tritlel-repentis Infection of kernels ofred- and white-seeded wheet cultivars.
The effect of red smudge on seedgermination, seedling vigor, seedlingemergence, plant development, and grainyield of durum wheat was examined incontrolled-environment and field studies.Naturally and artificially infected redsmudged seeds of the durum wheatcultivars Medora, Sceptre, Wakooma, andPlenty were used (Fernandez et ai. 1996,
1997).
Po tritiei-repentis infection
24.8 b37.9 a
55.7 b2
78.1 a
Incidence 1%) Severlty1 (%)Seed color
Red (n =18)White (n =10)
There were differences amongclasses/cultivars tested in the incidenceand severity (>50% of kernel a.readiscolored) of the infection. The intensity,incidence, and extent of kerneldiscoloration was partially related to seedcolor. Red discoloration was moreapparent in white than in red seeds, andpercent incidence of all.Ptr-discoloredkernels and infection severity were, onaverage, higher in the white than in thered wheats (Table 2); however, there wasalso variation among cultivars within
)classes. For example, the incidence andseverity of infection for some hard redspring cultivars was as high as for thewhite·seeded durum cultivars (data notshown).
Black point in Ptr-infected kernels wasobserved in all cultivars and the surfacearea of many of these black-pointedkernels was more than 50%-discolored.
372 M.R. Femandez et a/.
Percent germination at BOC and high
humidity was lower for naturallyinfected red smudged than for uninfected
seed, whereas the time to germination ofall seeds (T100) was lower for artificially
infected red smudged than for uninfectedseed (Table 3). Red smudge could also
speed up germination in common wheat.
Fox et al. (unpublished) observed that Ptrinfected seed of some common wheat
genotypes had significantly lower meangermination time than healthy seed when
incubated under high humidity at 20°C.These observations suggest that, underfield conditions, kernel infection by Ptr
might contribute to sprouting.
Growth of the coleoptile and primary
roots, and number of roots, measured at12 days of incubation at BOC unde~ highhumidity, were depressed in red
smudged seeds (Table 4), indicating thatPtr infection has a negative effect on seedvigor. Transmission of Ptr to the
coleoptile, but not to the true leaves, wasobserved under these controlled )
conditions (Fernandez et al. 1996).
Table 3. Percent germination and time to completegermination of all seeds (T100) of naturally orartificially infected red smudged and healthyseeds of four durum wheat cultivars. incubatedunder high humidity at SOC.
Seedling emergence, plant growth,
and grain yield were determined in areplicated field trial conducted in 1993
and 1994 near Swift Current, Sask. Therewere three treatments: 0 (control), 50, and
100% red smudge, randomized in a
factorial, complete block design with four
replicates. Each replicate consisted of 50space-planted seeds in 3-m single rows,
with a 30 cm space between rows.
Seedling emergence was recorded dailyafter seeding, and rate of emergence andtotal percent emergence calculated.
Measurements of plant growthparameters and grain yield were takenduring plant growth and after harvest.
The lower the percent emergence of
seedlings, the higher the proportion of
red smudged seeds. The controltreatment (0% red smudge) had 14% and22% greater emergence than the 50% and
100% red smudge treatments,respectively. Red smudge also had aneffect on T100. It took, on average, 2.4
more days for all seedlings in the 50%and 100% red smudge treatments to
Table 4. Number of seminal roots and length oflongest root and coleoptile of naturally orartificially infected red smudged seeds andcontrols of four durum wheat cultivars, at 12 daysof incubation at SoC and under high humidity.
Test!trealment Germination (%) T100 (h) Length ofNumber roots coleoptile
Naturally infected Test!trealment of roots (cm) (cm)Red smudge 90.5 (0.9)1 152.9 (6.3)Control (healthy) 97.6 (0.4) 149.7 (6.11 Naturally infected
Red smudge 4.2 «0.1)1 2.2 «0.11 1.5 «0.1)Artificially infected Control (healthy) 4.51<0.11 3.4 «0.11 2.0«0.1)Red smudge 99.7 (0.11 161.0 (4.4)Control (healthy) 99.6(0.1) 196.5 (6.11 Artificially infected
Red smudge 3.3«0.11 2.0«0.1) 0.8«0.1)1 Standard errors. Control (healthy) 3.11<0.11 3.2«0.1) 1.1 «0.11Source: Fernandez et al. 1996.
1 Standard errors.Source: Fernandez et al. 1996.
Wheet Reaction to Kernel Infection by Pyrenophora trltlci·repentis and Effect on the Subsequent Crop 373
emerge than those in the control. Based
on the controlled-environment study
discussed above, the lower percent
seedling emergence could be attributed to
reduced germination of naturally infected
seeds, whereas increased time to
emergence could be mostly attributed to
reduced seedling vigor.
The lower emergence of seedlings in
the red smudge treatments resulted in
poor stands in the field. Number of .
spikes, above-ground dry weight, and
grain yield per plot were 20%, 18%, and
17% lower, respectively, in the 100% red
smudge treatment than in the control.
There was no treatment effect for 1000
kernel weight or number of kernels per
spike.
Acknowledgment
We thank Sharon Jan, Heather
Campbell, and Linda Thiessen for their
technical assistance.
References
Canadian Grain Commission. 1991. OfficialGrain Grading Guide. 189 pp.
Fernandez, M.R, Clarke, J.M., and RM.DePauw. 1994a. Response of durumwheat kernels and leaves at differentgrowth stages to Pyrenophora triticirepentis. Plant Dis 78:597-600.
Fernandez, M.R, Clarke, J.M., DePauw,RM., Irvine, RB., and RE. Knox. 1994b.Black point and red smudge in irrigateddurum wheat in southern Saskatchewanin 1990-1992. Can J Plant PathoI16:221227.
Fernandez, M.R, DePauw, RM., Clarke,J.M., and L.P. Lefkovitch. 1996. Redsmudge in durum wheat reducesseedling vigor. Can J Plant Sci 76:321324.
Fernandez, M.R, Clarke, I.M., DePauw,RM., and L.P. Lefkovitch. 1997.Emergence and growth of durum wheatderived from red smudge-infected seed.Crop Sci 37:510-514.
Francl, L.J., and J.H. Jordhal. 1992. Seedsymptomatology of durum wheat. In:L.J. Francl, J.M. Krupinsky, and M.P.McMullen (eds.), Advances in Tan SpotResearch. Proceedings of the 2ndInternational Tan Spot Workshop, pp. 5660. Fargo, ND, USA: North DakotaAgricultural Experiment Station.
Schilder, A.M.C., and G.c. Bergstrom. 1994.Pyrenophora tritici-repentis as acomponent of the fungal flora of winterwheat seed in New York. Seed SciTechnoI22:285-297.
Zadoks, J.c., Chang, T.T., and c.P. Konzak.1974. A decimal code for the growthstages of cereals. Weed Rese 14:415-421.

374
List of ParticipantsK.B.AlamPlant Pathology DivisionBangladesh Agriculture ResearchInstituteJoydebpur Gazipur 1701BangladeshPhone: +880 (6081) 2091 ext. 429 or 347Fax: +880 (2) 883-516
J.G.AnnonaINTAPergaminoArgentinaFax: +54 (477) 32·756Email: [email protected]
J. BakonylPlant Protection InstituteHungarian Academy of SciencesP.O. Box 102Herman Otto Str. 15H·1525 Budap'estHungaryPhone: +36 (1) 155·8722Fax: +36 (1)156·3698
G.C. BergstromDepartment of Plant PathologyCornell University316 Plant Science BuildingIthaca NY 14853U.S.A.Phone: +1(607) 255-7849Fax: +1(607) 255·4471Email: [email protected]
M.R.BhattaNational Wheat Research ProgramNepal Agricultural Research CouncilBhairahawa RupandehiNepalPhone: +977 (071)202·26
Chang NaltaoPlant Immunology Research )LaboratoryShenyang Agricultural UniversityShenyang Liaoning 110161ChinaPhone: +86 (241841-5534Fax: +86(24) 841-7416
L CluffettiDept. of Botany and Plant PathologyOregon State UniversityCorvallis 97331·2902U.S.A.Email: [email protected]
T. Di ZinnoUnite de PhytopathologieUniversite catholique de LouvainFaculte des Sciences AgronomiquesPlace Croix du Sud. 2bte 31348 Louvain-la·NeuveBelgiumPhone: +32 (10) 473~752Fax: +32 (10) 478·697Email: [email protected]
M. Diaz de AckermannINIA La EstanzuelaUruguayPhone: +598 (5) 224-060Fax: +598 (5) 224-061Email: [email protected]
J.H.DublnWheat ProgramCIMMYTLisboa 27, Col. JuarezDelegacion CuauhtemocApdo. Postal 6-64106600 Mexico, D.F.MexicoPhone: +52 (517·26-9091Fax: +52 (5) 728,7558/9Email: [email protected]
E.DuvelllerWheat ProgramCIMMYTP.O. Box 5186KatbmanduNepalPhone: +997-1-422-773Fax: +977-1-419·352Email: [email protected]
K.EmamlDept. of Biological &NutritionalSciencesUniversity of NewcastleNewcastle upon Tyne NEI 7RUUnited KingdomPhone: +44 (191) 222·8576Fax: +44 (191) 222-8684Email:[email protected]
S. FennellApplied Genetic EngineeringLaboratoryCIMMYTLisboa 27. Col. JuarezDelegacion CuauhtemocApdo. Postal 6-64106600 Mexico. D.F.MexicoPhone: +52 (51726,9091 ext. 1391Fax: +52 (5) 726·7558/9Email: [email protected]
M.R. FernandezDept. of Plant PathologyAgriculture and Agri-Food CanadaP.O. Box 1030Swift Current SK S9H 3X2CanadaPhone: +1(306)778·7255Fax: +1(306) 773-9123Email: [email protected]
L. FranclPlant Pathology Department. WalsterHallNorth Dakota State UniversityFargo NO 58105U.S.A.Fax: +1 (7011231-7851Email: [email protected]
J. FrancoBiometricsCIMMYTLisboa 27. Col. Jua rezDelegacion CuauhtemocApdo. Postal 6-84106600 Mexico. D.F.MexicQPhone: +52 (5) 726-9091 ext. 2207Fax: +52 (5) 126-7558/9Email: [email protected]
I. Garcia AltamiranoWheat ProgramCIMMYTLisboa 27, Col. Juarez,Delegaclon CuauhtemocApdo. Postal 6-64106600 Mexico, D.F.MexicoPhone: +52 (5) 726-9091 ext. 1247Fax: +52 (5) 726-7558/9Email: [email protected]
J. GilbertCereal Research CentreAgriculture and Agri-Food Canada195 Dafoe ReadWinnipeg MBR3T 2M9CanadaPhone: +1(2041983-0891Fax: +1 (2041983-4604Email: [email protected]
E. HackDept. of Biological &NutritionalSciencesUniversity of NewcastleNewcastle upon Tyne NEI 7RUUnited KingdomPhone: +44 (191)222-8576Fax: +44 (191) 222-8684Email: [email protected]

A.A.M. HassanDept. of Biological & NutritionalSciencesUniversity of NewcastleNewcastle upon Tyne NEI 7RUUnited KingdomPhone: +44 (0191) 222-8576Fax: +44 (01911 222-8684
P. HobbsNRGCIMMYTP.O. Box 5186KathmanduNepalPhone: # 00-977-1-417-791Fax: +977 (1) 419-352 CIMMYT office;+977(1) 414-184 Att'n. CIMMYTEmail: [email protected]: 2276 HOSANG NP
D. HoisingtonApplied Biotechnology CenterCIMMYTLlsboa 27. Col. JuarezDelegaclon CuauhtemocApdo. Postal 6-64106600 Mexico. D.EMexicoPhone: +52 (5) 726-7575Fax: +52 (5) 726-7558/9Email: [email protected]
I. HossainDepartment of Plant PathologyBangladesh Agriculture UniversityMymensingh 2202BangladeshPhone: +880 (91) 55695-7 ext. 142Fax: +880 (91) 3804
G. HughesCrop Science and Plant EcologyUniversity of SaskatchewanSaskatoon SK S7N OWOCanadaPhone: +1(306) 966-4951Fax: +1 (306) 966-5015Email: [email protected]
M.M.KohliWheat ProgramCIMMYTcc1iI7 MontevideoUruguayPhone: +598 (2) 928-522/923-630Fax: +598 (2)928-522/923-633Email: [email protected]: 23271 CIAAB UY
J.M. KrupinskyNorthern Great Plains Research LabUSDA-ARSP.O. Box 459Mandan ND 58554·0459U.S.A.Phone: +1(701)667-3011Fax: +1(701) 667-3054Email: [email protected]
R. LoughmanPlant Protection BranchAgriculture Western AustraliaPlant Research and DevelopmentServicesBaron-Hay CourtSouth Perth W.A. 6151AustraliaPhone: +61 (619) 368-3691Fax: +61(6191367-2625Email: [email protected]
H. MaraiteUnite de PhytopathologieFaculte des Sciences AgronomiquesUniversite catholique de LouvainPlace Croix du Sud, 2bte 3B-1348 Louvain-Ia-NeuveBelgiumPhone: +32 (10) 473-749Fax: +32 (10) 478·697Email: [email protected]
A. MaltheeUnite de PhytopathologieUniversite catholique de LouvainFaculte des Sciences AgronomiquesPlace Croix du Sud, 2bte 31348 Louvain-Ia-NeuveBelgium
Y.R.Meh18Dept. of Plant PathologyInstituto Agronomico do ParanaCaixa Postal 48186001-970 Londrina ParanaBrazilPhone: +55 (43) 326·1525Fax: +55 (43) 326·7868
S. MeinhardtDept. of BiochemistryNorth Dakota State University166 Loftsgard HallFargo ND 58105U.S.A.Phone: +1 (701) 231-7944Fax: +1 (701) 231-8324Email: [email protected]
375
M.MergoumWheat ProgramCIMMYTLisboa 27, Col. JuarezDelegacion CuauhtemocApdo. Postal 6-64106600 Mexico, D.EMexicoPhone: +52 (5) 726-9091 ext. 2218Fax: +52 (5) 726-7558/9Email: [email protected]
MinhTa DuyVietnam Agricultural Science InstituteVan Dien, Thanh TriHanoiVietnamPhone: +84 (4) 861-2131Fax: +84 (4) 861-3937
A. Mujeeb-KaziWide CrossesWheat ProgramCIMMYTLisboa 27, Col. JuarezDelegacion CuauhtemocApdo. Postal 6-64106600 Mexico, D.F.MexicoPhone: +52 (5) 726·9091Fax: +52 (51726-7558/9Email: [email protected]
S. NagarajanDirectorate of Wheat ResearchIndian Council of AgriculturalResearchP.O. Box 158, Kunjpura RoadKarnal Haryana 132001IndiaPhone: +91 (184) 262-390Fax: +91 (184) 251·390Email: [email protected]: 0396-233 DWR IN
A. NlkoronovaRussian Agricultural AcademyAII·Russian Research Institute ofAgricultural MicrobiologyPodbelsky Shausse 3Pushkin 8St. Petersburg 189620Russian FederationPhone: +7 (812) 470-5100Fax: +7 (812) 470-4362Email: [email protected]
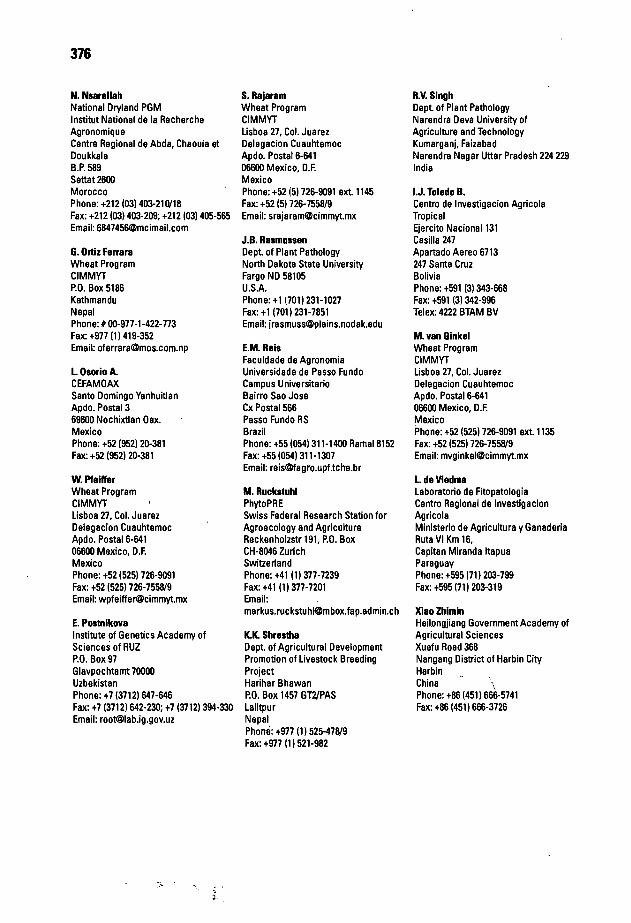
376
N. NsarellahNational Dryland PGMInstitut National de la RechercheAgronomiqueCentre Regional de Abda, Chaouia etDoukkalaB.P.589Settat 2600MoroccoPhone: +212 (03) 403-210/18Fax: +212 (03) 403-209; +212 103} 405-565Email: [email protected]
G. Ortiz FerraraWheat Prog ramCIMMYTP.O. Box 5186KathmanduNepalPhone: # 00-977-1-422-773Fax: +977 (1) 419-352Email: [email protected]
L. Osorio A.CEFAMOAXSanto Domingo YanhuitlanApdo. Postal 369600 Nochixtlan Oax.MexicoPhone: +52 (952) 20-381Fax: +52 (952) 20-381
W. PfeifferWheat ProgramCIMMYTLisboa 27, Col. JuarezDelegacion CuauhtemocApdo. Postal 6-64106600 Mexico, D.F.MexicoPhone: +52 (525)726-9091Fax: +52 (525) 726-755819Email: [email protected]
E. PostnikovaInstitute of Genetics Academy ofSciences of RUZP.O. Box 97Glavpochtamt 70000UzbekistanPhone: +7 (3712) 647-646Fax: +7 (3712) 642·230; +7 (3712) 394·330Email: [email protected]
" ........~.
S. RajaramWheat ProgramCIMMYTLisboa 27, Col. JuarezDelegacion CuauhtemocApdo. Postal 6-64106600 Mexico, D.EMexicoPhone: +52 (5) 726-9091 ext. 1145Fax: +52 (5}726·7558/9Email: [email protected]
J.B. RasmussenDept. of Plant PathologyNorth Dakota State UniversityFargo ND 58105U.S.A.Phone: +1 (701) 231-1027Fax: +1(7011231.7851Email: [email protected]
E.M.ReisFaculdade de AgronomiaUniversidade de Passo FundoCampus UniversitarioBairro Sao JoseCx Postal 566Passo Fundo RSBrazilPhone: +55 (054) 311-1400 Ramal 8152Fax: +55 (054)311-1307Email: [email protected]
M. RuckstuhlPhytoPRESwiss Federal Research Station forAgroecology and AgricUltureReckenholzstr 191, P.O. BoxCH-8046 ZurichSwitzerlandPhone: +41 (1) 377·7239Fax: +41 (1) 377-7201Email:[email protected]
K.K. ShresthaDept. of Agricultural DevelopmentPromotion of Livestock BreedingProjectHarihar BhawanP.O. Box 1457 GT2/PASLalitpurNepalPhornl: +977 (1) 525-478/9Fax: +977 (11521·982
R.V. SinghDept of Plant PathologyNarendra Deva University ofAgriculture and TechnologyKumarganj, FaizabadNarendra Nagar Uttar Pradesh 224 229India
I.J. Toledo B.Centro de Investigacion AgricolaTropicalEjercito Nacional131Casilla 247Apartado Aereo 6713247 Santa CruzBoliviaPhone: +591 (3) 343-668Fax: +591 (3) 342-996Telex: 4222 BTAM BV
M. van GinkelWheat ProgramCIMMYTLisboa 27, Col. JuarezDelegacion CuauhtemocApdo. Postal 6-64106600 Mexico, D.F.MexicoPhone: +52 (525) 726·9091 ext. 1135Fax: +52(525) 726-755819Email: [email protected]
L. deViedmaLaboratorio de FitopatologiaCentro Regional de InvestigacionAgricolaMinisterio de Agricultura y GanaderlaRuta VI Km 16,Capitan Miranda ItapuaParaguayPhone: +595(71) 203·799Fax: +595 (71) 203-319
XiaoZhiminHeilongjiang Government Academy ofAgricultural SciencesXuefu Road 368Nangang District of Harbin CityHarbinChina \Phone: +86 (4511666-5741Fax: +86 (451) 666-3726