Origin and expansion of the allotetraploid Aegilops geniculata, a wild relative of wheat
11
Origin and expansion of the allotetraploid Aegilops geniculata, a wild relative of wheat Nils Arrigo 1 , Franc ¸ois Felber 1 , Christian Parisod 1 , Sven Buerki 1 , Nadir Alvarez 2 , Jacques David 3 and Roberto Guadagnuolo 1 1 Laboratory of Evolutionary Botany, Institute of Biology, University of Neucha ˆtel, 11 rue Emile-Argand, 2009 Neucha ˆtel, Switzerland; 2 Department of Ecology and Evolution, University of Lausanne – UNIL Sorge, Biophore Building, 1015 Lausanne, Switzerland; 3 UMR Diversite ´ et Adaptation des Plantes Cultive ´es, SupAgro, 2 Place P. Viala, Domaine de Melgueil, 34130 Mauguio, France Author for correspondence: Nils Arrigo Tel: +41 (0)32 718 2338 Email: [email protected] Received: 29 March 2010 Accepted: 26 April 2010 New Phytologist (2010) doi: 10.1111/j.1469-8137.2010.03328.x Key words: Aegilops geniculata (=Ae. ovata), amplified fragment length polymorphism, chloroplast DNA sequencing, human-driven migration, introgression, phylogeography, polyploidy, postglacial recolonization. Summary • This study reconstructs the phylogeography of Aegilops geniculata, an allotetra- ploid relative of wheat, to discuss the impact of past climate changes and recent human activities (e.g. the early expansion of agriculture) on the genetic diversity of ruderal plant species. • We combined chloroplast DNA (cpDNA) sequencing, analysed using statistical parsimony network, with nonhierarchical K-means clustering of amplified frag- ment length polymorphism (AFLP) genotyping, to unravel patterns of genetic structure across the native range of Ae. geniculata. The AFLP dataset was further explored by measurement of the regional genetic diversity and the detection of isolation by distance patterns. • Both cpDNA and AFLP suggest an eastern Mediterranean origin of Ae. geniculata. Two lineages have spread independently over northern and southern Mediterranean areas. Northern populations show low genetic diversity but strong phylogeographical structure among the main peninsulas, indicating a major influence of glacial cycles. By contrast, low genetic structuring and a high genetic diversity are detected in southern Mediterranean populations. Finally, we highlight human-mediated dispersal resulting in substantial introgression between resident and migrant populations. • We have shown that the evolutionary trajectories of ruderal plants can be similar to those of wild species, but are interfered by human activities, promoting range expansions through increased long-distance dispersal and the creation of suitable habitats. Introduction The influence of geological and evolutionary processes on the distribution of organisms is becoming increasingly well understood thanks to the development of phylogeographical studies focusing on the genetic signal left by past events (e.g. Wiens & Donoghue, 2004). Accordingly, the impact of the last glacial maximum (i.e. 15 000 yr ago) on intraspecific genetic variation, as well as on the location of glacial refugia and postglacial recolonization pathways, has been reported for various species across diverse areas (e.g. Taberlet et al., 1998; Hewitt, 2004; Hampe & Petit, 2005; Me ´dail & Diadema, 2009). By contrast, little is known about the influence of humans on past events, such as the survival, dispersal or range expansion–contraction of wild species. Agricultural practices emerged in the eastern Mediterranean area (i.e. the Fertile Crescent) c. 10 000 yr ago, and subsequently spread rapidly around the Mediterranean Sea and across Europe (Zeder, 2008). Neolithic farmers might have influenced the current distribution of plant or animal populations in multiple ways, acting as dispersal agents through exchanges or interfering with natural recol- onization by modifying the landscape (e.g. deforestation). Given that the Mediterranean region has a long history of farmer occupation, ancient as well as recent human activities have probably had a significant impact on the genetic diversity of plants associated with agroecosystems, New Phytologist Research ȑ The Authors (2010) Journal compilation ȑ New Phytologist Trust (2010) New Phytologist (2010) 1 www.newphytologist.com
-
Upload
independent -
Category
Documents
-
view
1 -
download
0
Transcript of Origin and expansion of the allotetraploid Aegilops geniculata, a wild relative of wheat

Origin and expansion of the allotetraploidAegilops geniculata, a wild relative of wheat
Nils Arrigo1, Francois Felber1, Christian Parisod1, Sven Buerki1, Nadir Alvarez2, Jacques David3 and
Roberto Guadagnuolo1
1Laboratory of Evolutionary Botany, Institute of Biology, University of Neuchatel, 11 rue Emile-Argand, 2009 Neuchatel, Switzerland; 2Department of
Ecology and Evolution, University of Lausanne – UNIL Sorge, Biophore Building, 1015 Lausanne, Switzerland; 3UMR Diversite et Adaptation des Plantes
Cultivees, SupAgro, 2 Place P. Viala, Domaine de Melgueil, 34130 Mauguio, France
Author for correspondence:Nils Arrigo
Tel: +41 (0)32 718 2338
Email: [email protected]
Received: 29 March 2010Accepted: 26 April 2010
New Phytologist (2010)doi: 10.1111/j.1469-8137.2010.03328.x
Key words: Aegilops geniculata
(=Ae. ovata), amplified fragment lengthpolymorphism, chloroplast DNA sequencing,human-driven migration, introgression,phylogeography, polyploidy, postglacialrecolonization.
Summary
• This study reconstructs the phylogeography of Aegilops geniculata, an allotetra-
ploid relative of wheat, to discuss the impact of past climate changes and recent
human activities (e.g. the early expansion of agriculture) on the genetic diversity of
ruderal plant species.
• We combined chloroplast DNA (cpDNA) sequencing, analysed using statistical
parsimony network, with nonhierarchical K-means clustering of amplified frag-
ment length polymorphism (AFLP) genotyping, to unravel patterns of genetic
structure across the native range of Ae. geniculata. The AFLP dataset was further
explored by measurement of the regional genetic diversity and the detection of
isolation by distance patterns.
• Both cpDNA and AFLP suggest an eastern Mediterranean origin of Ae.
geniculata. Two lineages have spread independently over northern and southern
Mediterranean areas. Northern populations show low genetic diversity but strong
phylogeographical structure among the main peninsulas, indicating a major
influence of glacial cycles. By contrast, low genetic structuring and a high genetic
diversity are detected in southern Mediterranean populations. Finally, we highlight
human-mediated dispersal resulting in substantial introgression between resident
and migrant populations.
• We have shown that the evolutionary trajectories of ruderal plants can be similar
to those of wild species, but are interfered by human activities, promoting range
expansions through increased long-distance dispersal and the creation of suitable
habitats.
Introduction
The influence of geological and evolutionary processes onthe distribution of organisms is becoming increasingly wellunderstood thanks to the development of phylogeographicalstudies focusing on the genetic signal left by past events(e.g. Wiens & Donoghue, 2004). Accordingly, the impactof the last glacial maximum (i.e. 15 000 yr ago) onintraspecific genetic variation, as well as on the location ofglacial refugia and postglacial recolonization pathways, hasbeen reported for various species across diverse areas(e.g. Taberlet et al., 1998; Hewitt, 2004; Hampe & Petit,2005; Medail & Diadema, 2009). By contrast, little isknown about the influence of humans on past events, such as
the survival, dispersal or range expansion–contraction ofwild species.
Agricultural practices emerged in the easternMediterranean area (i.e. the Fertile Crescent) c. 10 000 yr ago,and subsequently spread rapidly around the MediterraneanSea and across Europe (Zeder, 2008). Neolithic farmersmight have influenced the current distribution of plant oranimal populations in multiple ways, acting as dispersalagents through exchanges or interfering with natural recol-onization by modifying the landscape (e.g. deforestation).Given that the Mediterranean region has a long historyof farmer occupation, ancient as well as recent humanactivities have probably had a significant impact on thegenetic diversity of plants associated with agroecosystems,
NewPhytologist Research
� The Authors (2010)
Journal compilation � New Phytologist Trust (2010)
New Phytologist (2010) 1www.newphytologist.com
such as Abies sp. (Parducci et al., 2001), Castanea sativa(Fineschi et al., 2000), Festuca pratensis (Fjellheim et al.,2006), Lolium sp. (Balfourier et al., 2000), Nigella arvensis(Bittkau & Comes, 2005) and Olea europaea (Besnardet al., 2007).
Aegilops geniculata Roth is a wild relative of wheat and iscurrently abundant in agricultural landscapes (e.g. in fieldedges, along roadsides, in pastures or in disturbed areas) ofthe Mediterranean Basin (Van Slageren, 1994). The speciesis annual and largely autogamous (Hammer, 1980). Themorphological features of spikes (e.g. awns and hairs)ensure an efficient zoochorous dispersal of seeds, whichremain intact in the soil for years, supplying a consistentseed bank. Accordingly, human activities, such as pastoral-ism of goats and ovine livestock or cereal cultivation, mighthave contributed to long-distance seed dispersal inAe. geniculata (Zaharieva et al., 2001a). The species thusoffers a good model to explore how humans might haveinterfered with natural expansion. Schematically, two con-trasting hypotheses can be postulated to explain the presentdistribution of this species in the Mediterranean area: Ae.geniculata spread across the region before the last glacialmaximum and recolonized its current distribution rangefrom glacial refugia during the postglacial period (i.e. thelast 15 000 yr), or Ae. geniculata accompanied Neolithicfarming and dramatically expanded its range during thespread of agriculture. Unfortunately, no evidence yet avail-able clearly favours or dismisses one of these hypotheses(Zaharieva et al., 2001b).
Aegilops geniculata is an allotetraploid species (2n = 4x =28 chromosomes; genome formula MMUU), whose ances-tors are Ae. comosa Sm. in Sibth. & Sm. var. comosa(genome MM) and Ae. umbellulata Zhuk. (genome UU;Van Slageren, 1994; Friebe et al., 1999). Based on the cur-rent distribution of the diploid progenitor species, mostauthors have suggested an eastern Mediterranean origin ofAe. geniculata (Chennaveeraiah, 1960; Waines & Barnhart,1992; Van Slageren, 1994; Resta et al., 1996). Previousmolecular studies have also corroborated this hypothesis(Zaharieva et al., 2001a). Nevertheless, its precise originremains elusive and might have involved multiple poly-ploidy events (Meimberg et al., 2009). As Ae. geniculataconstitutes an important reservoir of genes for wheatimprovement (Zaharieva et al., 2001a, 2003), a betterunderstanding of the origin of the species and theevolutionary processes shaping genetic variation across itsnative distribution range is critical for genetic resourceconservation. Accordingly, the present study investigates thespatiotemporal dynamics of native populations of Ae.geniculata over the whole Mediterranean area. In particular,using both chloroplast DNA (cpDNA) sequencing andamplified fragment length polymorphism (AFLP), weaim to describe the distribution of genetic variation acrossthe Mediterranean Basin to characterize the origin of
Ae. geniculata, unravel the species’ expansion patterns andthe putative human imprints, and highlight the evolution-ary processes acting on genetic diversity. We report a strongphylogeographical pattern, suggesting that the polyploid Ae.geniculata evolved multiple times in the area of theBosphorus Strait, and that independent lineages expandednaturally towards the north or south of the MediterraneanSea. Accordingly, human-mediated migration was probablylimited, but immigrated individuals seem to have influ-enced genetic variation locally in resident populationsthrough considerable introgression.
Materials and Methods
Sampling area and plant material investigated
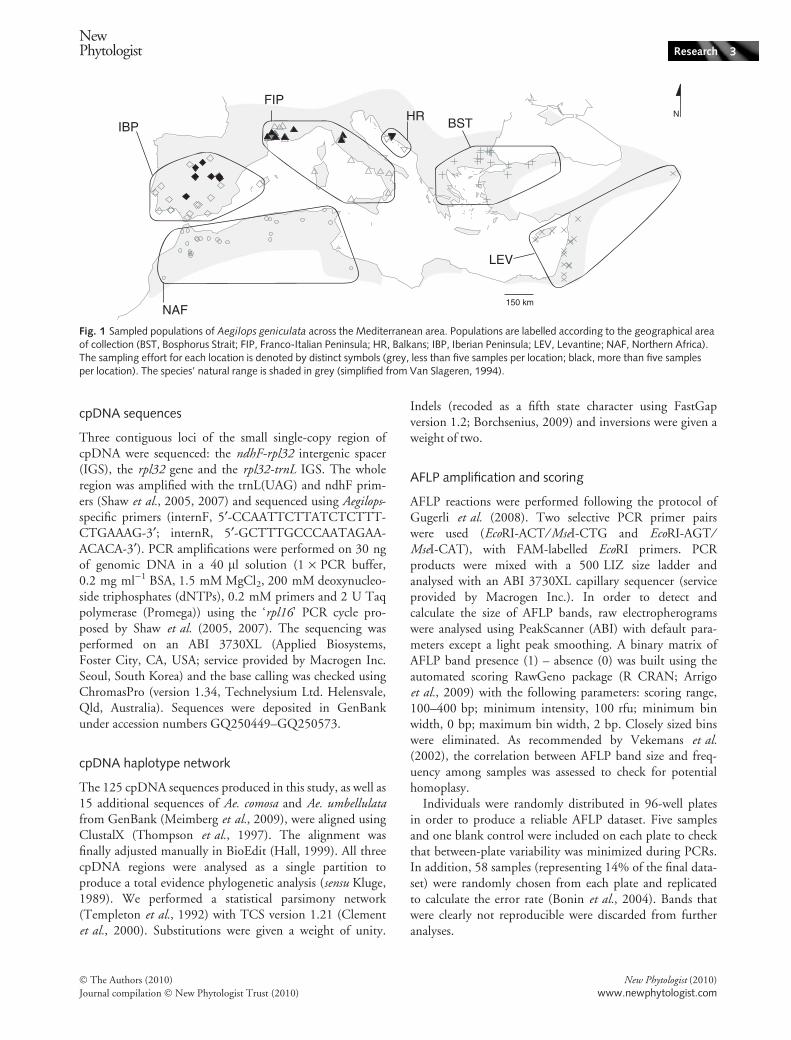
The sampling area covers the whole Mediterranean Basin(Fig. 1) and has been further divided into six natural bio-geographical regions defined on the basis of natural frontiersaccording to Presti & Oberprieler (2009): the IberianPeninsula (IBP), the Franco-Italian Peninsula (FIP), theBalkans (HR), the Bosphorus Strait (BST), the Levantine(LEV) and, finally, Northern Africa (NAF).
A total of 411 Aegilops geniculata Roth individuals wassampled in 146 locations. Half of the samples (194 individ-uals) were collected as seeds in 22 naturally occurring popu-lations from Spain, France, Italy, Croatia and Turkey (ninesamples per population on average), and were cultivated atthe Botanical Garden of the University and the City ofNeuchatel, Switzerland. The sampling was completed with217 DNA samples from germplasm accessions (depositedat IAV, Rabat, Morocco; ICARDA, Aleppo, Syria;IIPGR, Sadovo, Bulgaria; INIA, Madrid, Spain; INRA,Montpellier, France; and IPK, Gatersleben, Germany)collected in 121 different locations (two samples per popu-lation on average; Supporting Information Table S1).DNA was extracted from 10 mg of silica-dried leaves usinga standard cetyltrimethylammonium bromide (CTAB) pro-tocol (Chen & Ronald, 1999), and the concentration wasstandardized at 10 ng ml)1.
Chloroplast DNA sequences were characterized in a sub-set of 125 individuals, including 115 samples ofAe. geniculata (one to three individuals per population) aswell as 10 outgroup samples (Ae. neglecta Req. ex Bertol.,Ae. biuncialis Vis., Ae. triuncialis L., Triticum aestivumL. and T. turgidum L.). Available sequences (GenBankaccessions EU012758–EU012763; EU012766–EU012770;EU012967; EU012801–EU012803; Meimberg et al.,2009) from Ae. comosa and Ae. umbellulata, the diploidprogenitor species of Ae. geniculata (Friebe et al., 1999),were also included. AFLP analyses were performed on thecomplete set of Ae. geniculata samples (411 individuals). Acomplete description of the samples, as well as cpDNA andAFLP, is presented in Table S1.
2 Research
NewPhytologist
� The Authors (2010)
Journal compilation � New Phytologist Trust (2010)
New Phytologist (2010)
www.newphytologist.com
cpDNA sequences
Three contiguous loci of the small single-copy region ofcpDNA were sequenced: the ndhF-rpl32 intergenic spacer(IGS), the rpl32 gene and the rpl32-trnL IGS. The wholeregion was amplified with the trnL(UAG) and ndhF prim-ers (Shaw et al., 2005, 2007) and sequenced using Aegilops-specific primers (internF, 5¢-CCAATTCTTATCTCTTT-CTGAAAG-3¢; internR, 5¢-GCTTTGCCCAATAGAA-ACACA-3¢). PCR amplifications were performed on 30 ngof genomic DNA in a 40 ll solution (1 · PCR buffer,0.2 mg ml)1 BSA, 1.5 mM MgCl2, 200 mM deoxynucleo-side triphosphates (dNTPs), 0.2 mM primers and 2 U Taqpolymerase (Promega)) using the ‘rpl16’ PCR cycle pro-posed by Shaw et al. (2005, 2007). The sequencing wasperformed on an ABI 3730XL (Applied Biosystems,Foster City, CA, USA; service provided by Macrogen Inc.Seoul, South Korea) and the base calling was checked usingChromasPro (version 1.34, Technelysium Ltd. Helensvale,Qld, Australia). Sequences were deposited in GenBankunder accession numbers GQ250449–GQ250573.
cpDNA haplotype network
The 125 cpDNA sequences produced in this study, as well as15 additional sequences of Ae. comosa and Ae. umbellulatafrom GenBank (Meimberg et al., 2009), were aligned usingClustalX (Thompson et al., 1997). The alignment wasfinally adjusted manually in BioEdit (Hall, 1999). All threecpDNA regions were analysed as a single partition toproduce a total evidence phylogenetic analysis (sensu Kluge,1989). We performed a statistical parsimony network(Templeton et al., 1992) with TCS version 1.21 (Clementet al., 2000). Substitutions were given a weight of unity.
Indels (recoded as a fifth state character using FastGapversion 1.2; Borchsenius, 2009) and inversions were given aweight of two.
AFLP amplification and scoring
AFLP reactions were performed following the protocol ofGugerli et al. (2008). Two selective PCR primer pairswere used (EcoRI-ACT ⁄ MseI-CTG and EcoRI-AGT ⁄MseI-CAT), with FAM-labelled EcoRI primers. PCRproducts were mixed with a 500 LIZ size ladder andanalysed with an ABI 3730XL capillary sequencer (serviceprovided by Macrogen Inc.). In order to detect andcalculate the size of AFLP bands, raw electropherogramswere analysed using PeakScanner (ABI) with default para-meters except a light peak smoothing. A binary matrix ofAFLP band presence (1) – absence (0) was built using theautomated scoring RawGeno package (R CRAN; Arrigoet al., 2009) with the following parameters: scoring range,100–400 bp; minimum intensity, 100 rfu; minimum binwidth, 0 bp; maximum bin width, 2 bp. Closely sized binswere eliminated. As recommended by Vekemans et al.(2002), the correlation between AFLP band size and freq-uency among samples was assessed to check for potentialhomoplasy.
Individuals were randomly distributed in 96-well platesin order to produce a reliable AFLP dataset. Five samplesand one blank control were included on each plate to checkthat between-plate variability was minimized during PCRs.In addition, 58 samples (representing 14% of the final data-set) were randomly chosen from each plate and replicatedto calculate the error rate (Bonin et al., 2004). Bands thatwere clearly not reproducible were discarded from furtheranalyses.
N
NAF
IBP
FIPHR BST
LEV
150 km
Fig. 1 Sampled populations of Aegilops geniculata across the Mediterranean area. Populations are labelled according to the geographical areaof collection (BST, Bosphorus Strait; FIP, Franco-Italian Peninsula; HR, Balkans; IBP, Iberian Peninsula; LEV, Levantine; NAF, Northern Africa).The sampling effort for each location is denoted by distinct symbols (grey, less than five samples per location; black, more than five samplesper location). The species’ natural range is shaded in grey (simplified from Van Slageren, 1994).
NewPhytologist Research 3
� The Authors (2010)
Journal compilation � New Phytologist Trust (2010)
New Phytologist (2010)
www.newphytologist.com

Patterns of AFLP diversity
The diversity patterns of Ae. geniculata were investigated bycomputing the Shannon index, as recommended by Bussel(1999). Spatial patterns of genetic diversity were inferredusing a ‘sliding window’ that considered a 100 km grid overthe whole sampling area (i.e. one grid point for each100 km, in latitude and longitude) and computed theShannon index by considering samples located within a150 km perimeter around each grid point. In order to pro-vide an unbiased Shannon index under unequal samplingamong areas, computations were bootstrapped by a 1000times resampling of 10 samples per grid point.Computations were performed using custom R scripts (RDevelopment Core Team, 2009, script available onrequest). Finally, the regional Shannon index was computedby averaging the values obtained from the moving windowanalysis for each sampling area (i.e. IBP, FIP, HR, BST,LEV and NAF). These regional diversities were comparedwith a post hoc Tukey honest significant differences test.
Isolation by distance was tested over the whole samplingarea, as well as within the different geographical districts, byMantel tests between the genetic and geographical distancesamong sampled individuals using R (packages ‘stats’ and‘vegan’; R Core Development Team, 2009). Genetic dis-tances were assessed by the Jaccard distance on the binaryAFLP matrix, and geographical distances were calculated asthe Euclidean distance based on spherical projection centredon the sampling area of the geographical coordinates.Significance was assessed by 1000 permutations.
AFLP genetic structure
Because Ae. geniculata is an autogamous allotetraploidspecies, Hardy–Weinberg equilibrium is unexpected. Wetherefore investigated the genetic structure using a nonmod-el-based algorithm. Nonhierarchical K-means clustering(Hartigan & Wong, 1979) was performed using R (package‘stats’; R Core Development Team, 2009, script available onrequest). This technique assigns individuals to a definednumber of genetic groups (hereafter K) in order to maximizethe intergroup variance (measured here as the inertia;Legendre & Legendre, 1998). It has already been successfullyapplied in a phylogeographical framework based on AFLPmarkers (Burnier et al., 2009). Here, we performed 100 000independent runs (i.e. starting from random points) for eachassumed value of K (ranging between 1 and 11) and recordedthe intergroup inertia of each run. We adapted the strategyproposed by Evanno et al. (2005) to select the most likelynumber of groups using intergroup inertia as a proxy ofclustering accuracy (see details in Notes S1). The proportionof individuals assigned to each K-means group withinpopulations was displayed on a map. As a complementaryrepresentation of genetic structure, a principal coordinates
analysis was computed on a Jaccard distance matrix betweenindividuals and labelled with the K-means groups.
Comparison of cpDNA and AFLP phylogeographicalsignals
Association between datasets was investigated through acontingency table by comparing the occurrence of cpDNAhaplotypes and AFLP groups defined with K-means.Associations were evaluated using chi-squared (v2) tests.
Results
cpDNA haplotypes in Ae. geniculata
The whole cpDNA dataset, including the outgroups andthe diploid progenitor species, resulted in a sequence align-ment of 795 bp (the rpl32-trnL IGS (519 bp), the rpl32gene (195 bp) and the ndhF-rpl32 IGS (81 bp)), with atotal of 20 potentially parsimony informative characters(PPIc) among 24 variable characters (16 substitutions, oneinversion and seven indels). The rpl32-trnL IGS, the rpl32gene and the ndhF-rpl32 IGS showed 10, six and fourPPIc, respectively (out of 11, seven and six variable charac-ters, respectively). Considering the 115 Ae. geniculatasamples only, six PPIc out of seven variable characters (foursubstitutions, one inversion and two indels) were left. As awhole, the cpDNA sequences allowed 17 distinct haplo-types to be distinguished, with nine haplotypes restricted toAe. geniculata.
The statistical parsimony network (Fig. 2b) distinguishedtwo major clades (hereafter referred to as N and S haplo-types), discriminated by a 6 bp inversion located in therpl32-trnL IGS. Accordingly, S haplotypes occurred in 44Ae. geniculata individuals (i.e. 36% of the sampling) withfour distinct S haplotypes (i.e. S1–S4), whereas N haplo-types accounted for 76 individuals (64% of the sampling)and five haplotypes were detected (N1–N5). The positionof the most external outgroup individuals (Triticum sp.)indicated that N haplotypes were derived from S haplo-types. The diploid progenitor species Ae. comosa (M gen-ome) presented only S haplotypes. By contrast, the otherprogenitor Ae. umbellulata (U genome) showed both S andN haplotypes. Finally, closely related Aegilops species (i.e.Ae. neglecta, Ae. biuncialis and Ae. triuncialis) had N and Shaplotypes, respectively.
Considering only Ae. geniculata, the statistical parsimonynetwork presented a star-like topology, with rare andgeographically restricted variants (N2–N5 and S2–S4) radi-ating from the most commonly occurring haplotypes (N1and S1, respectively). The BST area showed the highestregional diversity, with five different haplotypes (Fig. 2b).Although the N and S haplotypes were equally frequent inthe BST area, the N haplotypes occurred significantly more
4 Research
NewPhytologist
� The Authors (2010)
Journal compilation � New Phytologist Trust (2010)
New Phytologist (2010)
www.newphytologist.com
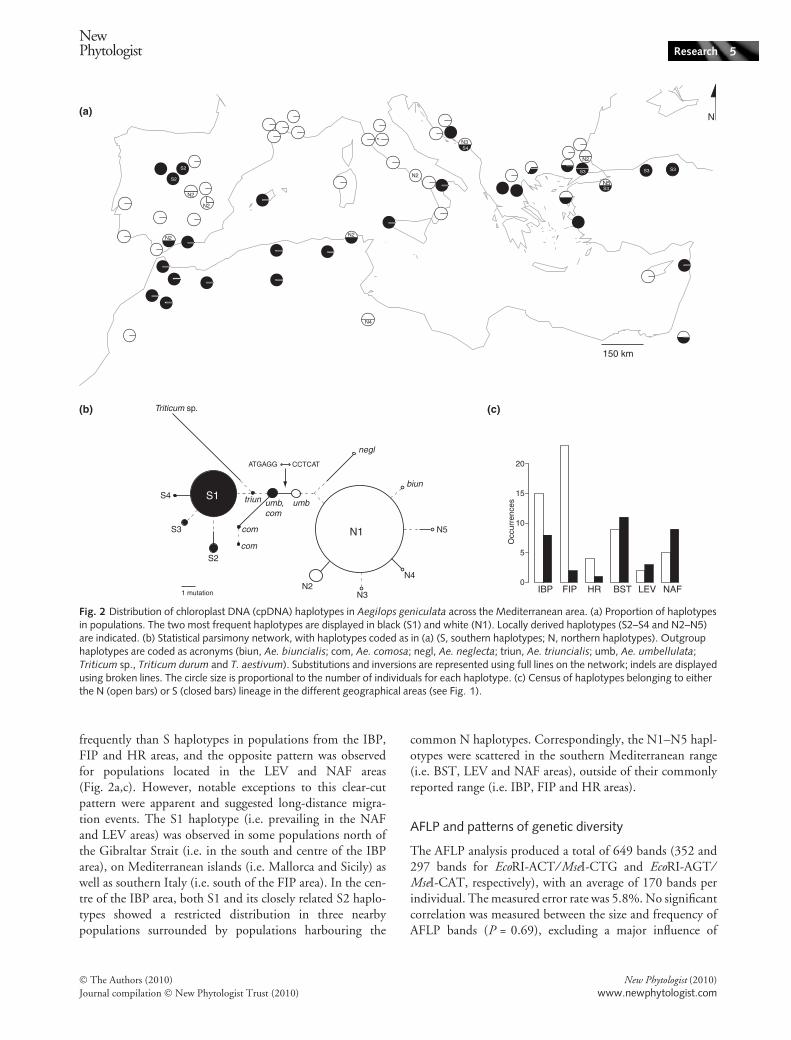
frequently than S haplotypes in populations from the IBP,FIP and HR areas, and the opposite pattern was observedfor populations located in the LEV and NAF areas(Fig. 2a,c). However, notable exceptions to this clear-cutpattern were apparent and suggested long-distance migra-tion events. The S1 haplotype (i.e. prevailing in the NAFand LEV areas) was observed in some populations north ofthe Gibraltar Strait (i.e. in the south and centre of the IBParea), on Mediterranean islands (i.e. Mallorca and Sicily) aswell as southern Italy (i.e. south of the FIP area). In the cen-tre of the IBP area, both S1 and its closely related S2 haplo-types showed a restricted distribution in three nearbypopulations surrounded by populations harbouring the
common N haplotypes. Correspondingly, the N1–N5 hapl-otypes were scattered in the southern Mediterranean range(i.e. BST, LEV and NAF areas), outside of their commonlyreported range (i.e. IBP, FIP and HR areas).
AFLP and patterns of genetic diversity
The AFLP analysis produced a total of 649 bands (352 and297 bands for EcoRI-ACT ⁄ MseI-CTG and EcoRI-AGT ⁄MseI-CAT, respectively), with an average of 170 bands perindividual. The measured error rate was 5.8%. No significantcorrelation was measured between the size and frequency ofAFLP bands (P = 0.69), excluding a major influence of
(a) N
150 km
(b) (c)
N2
N2
N4
N2
N2
N5N2
N3
N2
Triticum sp.
CCTCAT
N2N3
N4
N5
umb
biun
triun
negl
com
com
umb,com
ATGAGG
S2
S3
S4
1 mutation
S1
N1
Occ
urre
nces
0
5
10
15
20
FIP BSTIBP HR LEV NAF
Fig. 2 Distribution of chloroplast DNA (cpDNA) haplotypes in Aegilops geniculata across the Mediterranean area. (a) Proportion of haplotypesin populations. The two most frequent haplotypes are displayed in black (S1) and white (N1). Locally derived haplotypes (S2–S4 and N2–N5)are indicated. (b) Statistical parsimony network, with haplotypes coded as in (a) (S, southern haplotypes; N, northern haplotypes). Outgrouphaplotypes are coded as acronyms (biun, Ae. biuncialis; com, Ae. comosa; negl, Ae. neglecta; triun, Ae. triuncialis; umb, Ae. umbellulata;Triticum sp., Triticum durum and T. aestivum). Substitutions and inversions are represented using full lines on the network; indels are displayedusing broken lines. The circle size is proportional to the number of individuals for each haplotype. (c) Census of haplotypes belonging to eitherthe N (open bars) or S (closed bars) lineage in the different geographical areas (see Fig. 1).
NewPhytologist Research 5
� The Authors (2010)
Journal compilation � New Phytologist Trust (2010)
New Phytologist (2010)
www.newphytologist.com

homoplasy on the results (as suggested in Vekemans et al.,2002).
A lower genetic diversity was observed in northernMediterranean (i.e. IBP, FIP and HR) relative to southernMediterranean (i.e. LEV and NAF) and BST areas(Fig. 3a,b). Indeed, the IBP, FIP, HR and BST areas pre-sented an averaged Shannon index of 0.060–0.067, whereasvalues of 0.072 and 0.078 were reported in LEV and NAFareas. The genetic diversity was apparently not evenly dis-tributed within geographical areas, with an elevatedShannon index in areas in which N and S haplotypes co-occurred, around the Gibraltar and the Bosphorus Straits(i.e. between the IBP and NAF areas and in the BST area).
Significant isolation by distance patterns, as revealed bycorrelations between genetic and geographical distances,were observed over the whole sampling area (r = 0.28,P < 0.01) and in most of the northern Mediterranean areas(IBP = 0.53, P < 0.001; FIP = 0.29, P < 0.001; but notHR = 0.12, P > 0.05), as well as the BST area (BST = 0.22P < 0.01; Fig. 3c). By contrast, the correlation was not sig-nificant in the southern Mediterranean areas (LEV = 0.08,P > 0.05 and NAF = 0.11, P > 0.05).
AFLP genetic structure
According to nonmodel hierarchical K-means clustering,the most likely genetic structure among the 411 individualscharacterized with AFLP was obtained when seven groupswere considered (designated as A–G; intergroup iner-tia = 13.5% of the total inertia; Notes S1). Congruentresults were obtained using Bayesian clustering, as imple-mented in STRUCTURE version 2.2 (data not shown;
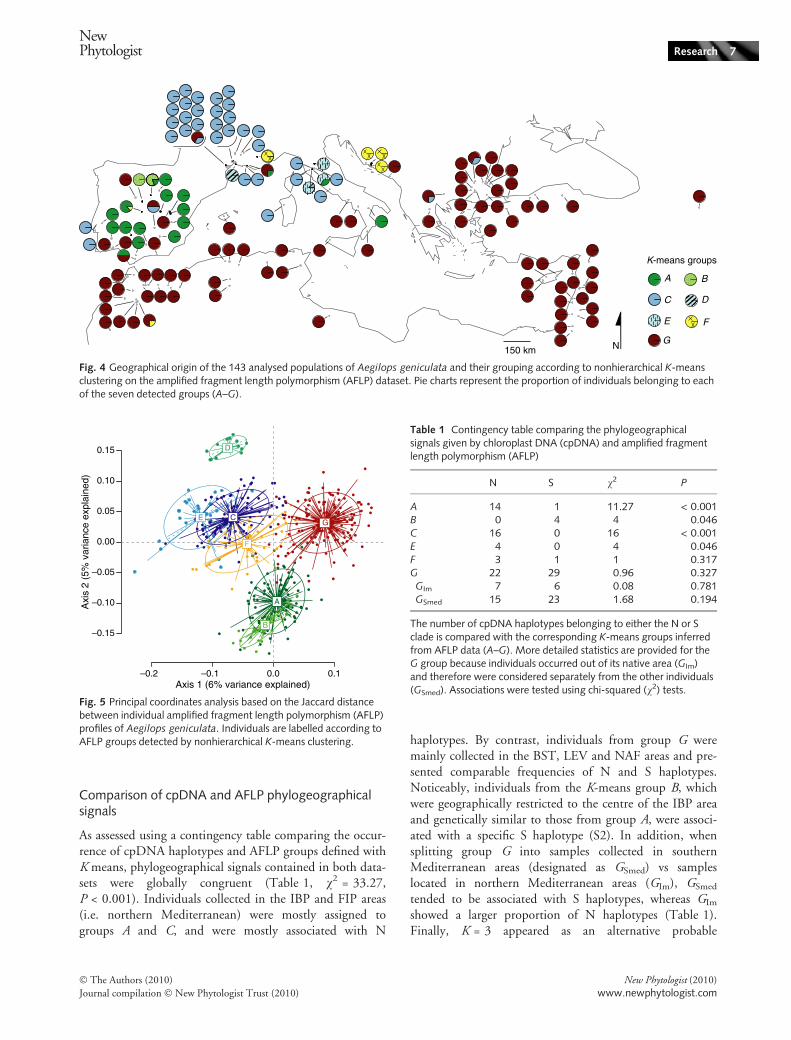
Falush et al., 2007). These groups were unevenly frequentand presented dissimilar distributions across the samplingarea (Fig. 4). Individuals were frequently assigned to groupsA (19%), C (21%) and G (34%), whereas the other groups(B, D, E and F) accounted for only 26% of the total.
Groups A and B occurred almost exclusively in the IBPand FIP areas, A being largely spread over Spain andPortugal, with inclusions in France and Italy, and Brestricted to two neighbouring populations in central Spain.Groups C, D and E were mainly confined to the FIP area.As an exception, a few individuals from the widespreadgroup C were observed in IBP and BST areas. Individualsfrom group D were restricted to a single population insouthern France, and group E was represented in threepopulations from northern Italy. Individuals from therare group F showed a fuzzy geographical structure, withscattered populations in various distant areas (IBP, FIP, HRand NAF). Individuals from group G were clearly prevalentin the BST, NAF and LEV areas, but were also observed atlower frequencies in all geographical areas. Indeed, 24 indi-viduals from group G (hereafter designated as GIm) werereported in the HR area, the south of the FIP area, in theIBP area and on most Mediterranean islands.
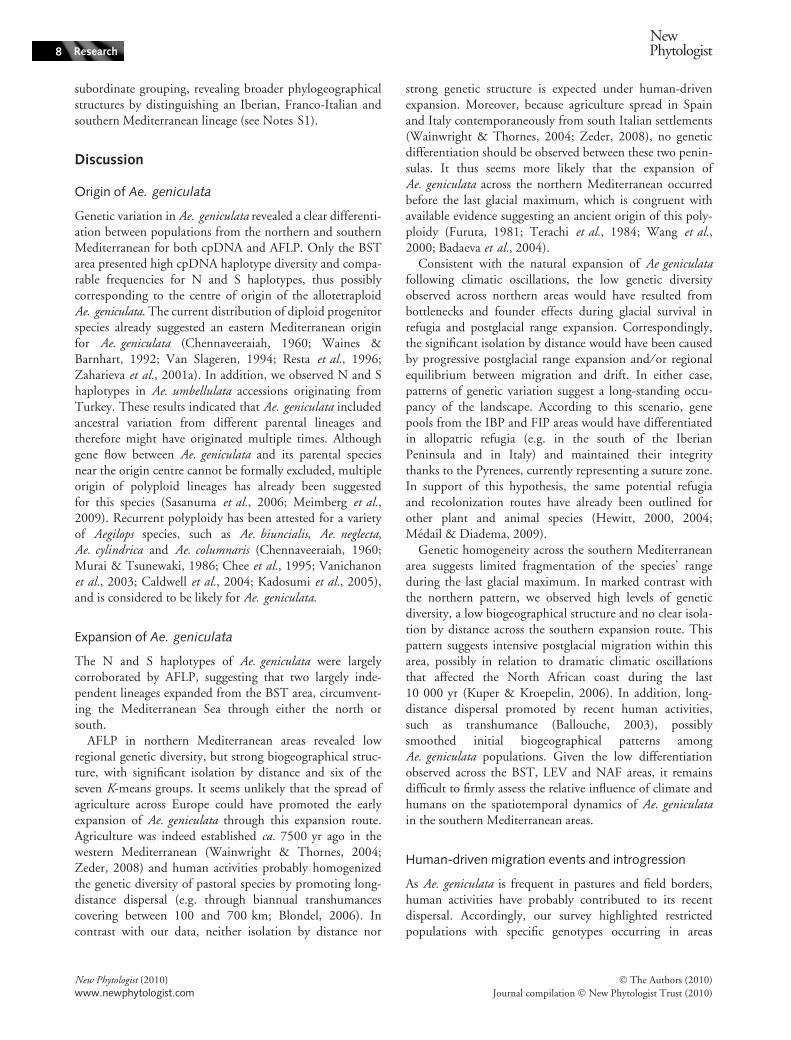
Principal coordinates analysis on AFLP profiles (Fig. 5)was largely congruent with nonhierarchical K-means clus-tering. Indeed, the two first axes clearly distinguishedindividuals sampled in the IBP area (i.e. groups A and Bthat appear to be closely related), in the FIP area (i.e. groupsC, D and E) and individuals collected in the eastern andsouthern parts of the Mediterranean area (i.e. BST, LEVand NAF, corresponding to group G). Individuals of groupF were intermediate between these three main clusters.
Shannon index0.035 – 0.045
0.046 – 0.0550.056 – 0.0650.066 – 0.075
0.076 – 0.085
N
150 km
NAF
IBP
FIP HRBST
LEV
(a)
0
0.055
0.060
0.065
0.070
0.075
0.080
IBP FIP HR BST LEV NAF
Sha
nnon
inde
x
IBD
(P
ears
on's
cor
rela
tion)
a aab ab
bb
IBP FIP HR BST LEV NAF
***
*******
0.00
0.10
0.20
0.30
0.40
0.50
0.60
Global
(c)(b)
Fig. 3 Patterns of genetic diversity withinAegilops geniculata in the differentMediterranean areas: IBP, Iberian Peninsula;FIP, Franco-Italian Peninsula; HR, theBalkans; BST, the Bosphorous Strait; LEV, theLeventine; NAF, Northern Africa. (a) Localgenetic diversity (Shannon index) measuredusing a sliding window on a 100 km grid. (b)Regional genetic diversity, measured as theaveraged local genetic diversities, for eacharea. Error bars represent the standard devia-tion. Different letters indicate areas that aresignificantly different at a = 0.05 (post hoc
Tukey honest significant differences test). (c)Mantel tests between the inter-individualgenetic and geographical distances (1000permutations; ***significant at a = 0.001;**significant at a = 0.01). IBD, isolation bydistance.
6 Research
NewPhytologist
� The Authors (2010)
Journal compilation � New Phytologist Trust (2010)
New Phytologist (2010)
www.newphytologist.com
Comparison of cpDNA and AFLP phylogeographicalsignals
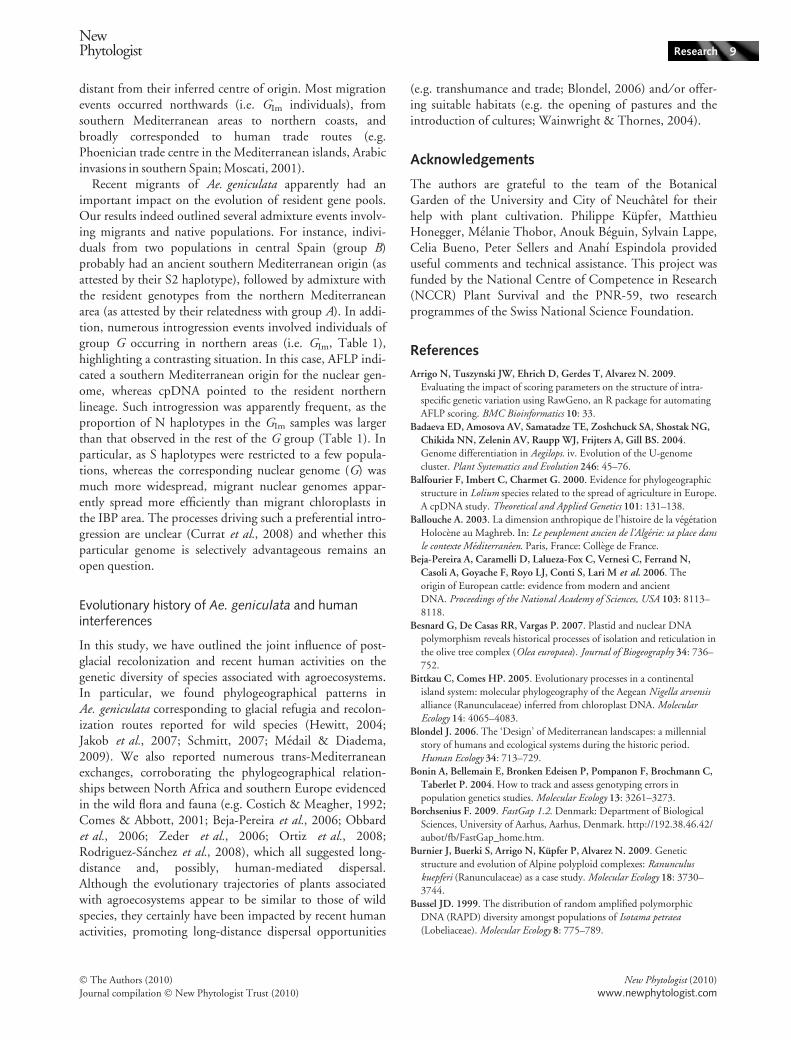
As assessed using a contingency table comparing the occur-rence of cpDNA haplotypes and AFLP groups defined withK means, phylogeographical signals contained in both data-sets were globally congruent (Table 1, v2 = 33.27,P < 0.001). Individuals collected in the IBP and FIP areas(i.e. northern Mediterranean) were mostly assigned togroups A and C, and were mostly associated with N
haplotypes. By contrast, individuals from group G weremainly collected in the BST, LEV and NAF areas and pre-sented comparable frequencies of N and S haplotypes.Noticeably, individuals from the K-means group B, whichwere geographically restricted to the centre of the IBP areaand genetically similar to those from group A, were associ-ated with a specific S haplotype (S2). In addition, whensplitting group G into samples collected in southernMediterranean areas (designated as GSmed) vs sampleslocated in northern Mediterranean areas (GIm), GSmed
tended to be associated with S haplotypes, whereas GIm
showed a larger proportion of N haplotypes (Table 1).Finally, K = 3 appeared as an alternative probable
N150 km
A B
C D
E F
G
K-means groups
Fig. 4 Geographical origin of the 143 analysed populations of Aegilops geniculata and their grouping according to nonhierarchical K-meansclustering on the amplified fragment length polymorphism (AFLP) dataset. Pie charts represent the proportion of individuals belonging to eachof the seven detected groups (A–G).
–0.2 –0.1 0.0 0.1
–0.15
–0.10
–0.05
0.00
0.05
0.10
0.15
Axis 1 (6% variance explained)
Axi
s 2
(5%
var
ianc
e ex
plai
ned)
A
B
C
D
E
F
G
Fig. 5 Principal coordinates analysis based on the Jaccard distancebetween individual amplified fragment length polymorphism (AFLP)profiles of Aegilops geniculata. Individuals are labelled according toAFLP groups detected by nonhierarchical K-means clustering.
Table 1 Contingency table comparing the phylogeographicalsignals given by chloroplast DNA (cpDNA) and amplified fragmentlength polymorphism (AFLP)
N S v2 P
A 14 1 11.27 < 0.001B 0 4 4 0.046C 16 0 16 < 0.001E 4 0 4 0.046F 3 1 1 0.317G 22 29 0.96 0.327GIm 7 6 0.08 0.781GSmed 15 23 1.68 0.194
The number of cpDNA haplotypes belonging to either the N or Sclade is compared with the corresponding K-means groups inferredfrom AFLP data (A–G). More detailed statistics are provided for theG group because individuals occurred out of its native area (GIm)and therefore were considered separately from the other individuals(GSmed). Associations were tested using chi-squared (v2) tests.
NewPhytologist Research 7
� The Authors (2010)
Journal compilation � New Phytologist Trust (2010)
New Phytologist (2010)
www.newphytologist.com
subordinate grouping, revealing broader phylogeographicalstructures by distinguishing an Iberian, Franco-Italian andsouthern Mediterranean lineage (see Notes S1).
Discussion
Origin of Ae. geniculata
Genetic variation in Ae. geniculata revealed a clear differenti-ation between populations from the northern and southernMediterranean for both cpDNA and AFLP. Only the BSTarea presented high cpDNA haplotype diversity and compa-rable frequencies for N and S haplotypes, thus possiblycorresponding to the centre of origin of the allotetraploidAe. geniculata. The current distribution of diploid progenitorspecies already suggested an eastern Mediterranean originfor Ae. geniculata (Chennaveeraiah, 1960; Waines &Barnhart, 1992; Van Slageren, 1994; Resta et al., 1996;Zaharieva et al., 2001a). In addition, we observed N and Shaplotypes in Ae. umbellulata accessions originating fromTurkey. These results indicated that Ae. geniculata includedancestral variation from different parental lineages andtherefore might have originated multiple times. Althoughgene flow between Ae. geniculata and its parental speciesnear the origin centre cannot be formally excluded, multipleorigin of polyploid lineages has already been suggestedfor this species (Sasanuma et al., 2006; Meimberg et al.,2009). Recurrent polyploidy has been attested for a varietyof Aegilops species, such as Ae. biuncialis, Ae. neglecta,Ae. cylindrica and Ae. columnaris (Chennaveeraiah, 1960;Murai & Tsunewaki, 1986; Chee et al., 1995; Vanichanonet al., 2003; Caldwell et al., 2004; Kadosumi et al., 2005),and is considered to be likely for Ae. geniculata.
Expansion of Ae. geniculata
The N and S haplotypes of Ae. geniculata were largelycorroborated by AFLP, suggesting that two largely inde-pendent lineages expanded from the BST area, circumvent-ing the Mediterranean Sea through either the north orsouth.
AFLP in northern Mediterranean areas revealed lowregional genetic diversity, but strong biogeographical struc-ture, with significant isolation by distance and six of theseven K-means groups. It seems unlikely that the spread ofagriculture across Europe could have promoted the earlyexpansion of Ae. geniculata through this expansion route.Agriculture was indeed established ca. 7500 yr ago in thewestern Mediterranean (Wainwright & Thornes, 2004;Zeder, 2008) and human activities probably homogenizedthe genetic diversity of pastoral species by promoting long-distance dispersal (e.g. through biannual transhumancescovering between 100 and 700 km; Blondel, 2006). Incontrast with our data, neither isolation by distance nor
strong genetic structure is expected under human-drivenexpansion. Moreover, because agriculture spread in Spainand Italy contemporaneously from south Italian settlements(Wainwright & Thornes, 2004; Zeder, 2008), no geneticdifferentiation should be observed between these two penin-sulas. It thus seems more likely that the expansion ofAe. geniculata across the northern Mediterranean occurredbefore the last glacial maximum, which is congruent withavailable evidence suggesting an ancient origin of this poly-ploidy (Furuta, 1981; Terachi et al., 1984; Wang et al.,2000; Badaeva et al., 2004).
Consistent with the natural expansion of Ae geniculatafollowing climatic oscillations, the low genetic diversityobserved across northern areas would have resulted frombottlenecks and founder effects during glacial survival inrefugia and postglacial range expansion. Correspondingly,the significant isolation by distance would have been causedby progressive postglacial range expansion and ⁄ or regionalequilibrium between migration and drift. In either case,patterns of genetic variation suggest a long-standing occu-pancy of the landscape. According to this scenario, genepools from the IBP and FIP areas would have differentiatedin allopatric refugia (e.g. in the south of the IberianPeninsula and in Italy) and maintained their integritythanks to the Pyrenees, currently representing a suture zone.In support of this hypothesis, the same potential refugiaand recolonization routes have already been outlined forother plant and animal species (Hewitt, 2000, 2004;Medail & Diadema, 2009).
Genetic homogeneity across the southern Mediterraneanarea suggests limited fragmentation of the species’ rangeduring the last glacial maximum. In marked contrast withthe northern pattern, we observed high levels of geneticdiversity, a low biogeographical structure and no clear isola-tion by distance across the southern expansion route. Thispattern suggests intensive postglacial migration within thisarea, possibly in relation to dramatic climatic oscillationsthat affected the North African coast during the last10 000 yr (Kuper & Kroepelin, 2006). In addition, long-distance dispersal promoted by recent human activities,such as transhumance (Ballouche, 2003), possiblysmoothed initial biogeographical patterns amongAe. geniculata populations. Given the low differentiationobserved across the BST, LEV and NAF areas, it remainsdifficult to firmly assess the relative influence of climate andhumans on the spatiotemporal dynamics of Ae. geniculatain the southern Mediterranean areas.
Human-driven migration events and introgression
As Ae. geniculata is frequent in pastures and field borders,human activities have probably contributed to its recentdispersal. Accordingly, our survey highlighted restrictedpopulations with specific genotypes occurring in areas
8 Research
NewPhytologist
� The Authors (2010)
Journal compilation � New Phytologist Trust (2010)
New Phytologist (2010)
www.newphytologist.com
distant from their inferred centre of origin. Most migrationevents occurred northwards (i.e. GIm individuals), fromsouthern Mediterranean areas to northern coasts, andbroadly corresponded to human trade routes (e.g.Phoenician trade centre in the Mediterranean islands, Arabicinvasions in southern Spain; Moscati, 2001).
Recent migrants of Ae. geniculata apparently had animportant impact on the evolution of resident gene pools.Our results indeed outlined several admixture events involv-ing migrants and native populations. For instance, indivi-duals from two populations in central Spain (group B)probably had an ancient southern Mediterranean origin (asattested by their S2 haplotype), followed by admixture withthe resident genotypes from the northern Mediterraneanarea (as attested by their relatedness with group A). In addi-tion, numerous introgression events involved individuals ofgroup G occurring in northern areas (i.e. GIm, Table 1),highlighting a contrasting situation. In this case, AFLP indi-cated a southern Mediterranean origin for the nuclear gen-ome, whereas cpDNA pointed to the resident northernlineage. Such introgression was apparently frequent, as theproportion of N haplotypes in the GIm samples was largerthan that observed in the rest of the G group (Table 1). Inparticular, as S haplotypes were restricted to a few popula-tions, whereas the corresponding nuclear genome (G) wasmuch more widespread, migrant nuclear genomes appar-ently spread more efficiently than migrant chloroplasts inthe IBP area. The processes driving such a preferential intro-gression are unclear (Currat et al., 2008) and whether thisparticular genome is selectively advantageous remains anopen question.
Evolutionary history of Ae. geniculata and humaninterferences
In this study, we have outlined the joint influence of post-glacial recolonization and recent human activities on thegenetic diversity of species associated with agroecosystems.In particular, we found phylogeographical patterns inAe. geniculata corresponding to glacial refugia and recolon-ization routes reported for wild species (Hewitt, 2004;Jakob et al., 2007; Schmitt, 2007; Medail & Diadema,2009). We also reported numerous trans-Mediterraneanexchanges, corroborating the phylogeographical relation-ships between North Africa and southern Europe evidencedin the wild flora and fauna (e.g. Costich & Meagher, 1992;Comes & Abbott, 2001; Beja-Pereira et al., 2006; Obbardet al., 2006; Zeder et al., 2006; Ortiz et al., 2008;Rodriguez-Sanchez et al., 2008), which all suggested long-distance and, possibly, human-mediated dispersal.Although the evolutionary trajectories of plants associatedwith agroecosystems appear to be similar to those of wildspecies, they certainly have been impacted by recent humanactivities, promoting long-distance dispersal opportunities
(e.g. transhumance and trade; Blondel, 2006) and ⁄ or offer-ing suitable habitats (e.g. the opening of pastures and theintroduction of cultures; Wainwright & Thornes, 2004).
Acknowledgements
The authors are grateful to the team of the BotanicalGarden of the University and City of Neuchatel for theirhelp with plant cultivation. Philippe Kupfer, MatthieuHonegger, Melanie Thobor, Anouk Beguin, Sylvain Lappe,Celia Bueno, Peter Sellers and Anahı Espindola provideduseful comments and technical assistance. This project wasfunded by the National Centre of Competence in Research(NCCR) Plant Survival and the PNR-59, two researchprogrammes of the Swiss National Science Foundation.
References
Arrigo N, Tuszynski JW, Ehrich D, Gerdes T, Alvarez N. 2009.
Evaluating the impact of scoring parameters on the structure of intra-
specific genetic variation using RawGeno, an R package for automating
AFLP scoring. BMC Bioinformatics 10: 33.
Badaeva ED, Amosova AV, Samatadze TE, Zoshchuck SA, Shostak NG,
Chikida NN, Zelenin AV, Raupp WJ, Frijters A, Gill BS. 2004.
Genome differentiation in Aegilops. iv. Evolution of the U-genome
cluster. Plant Systematics and Evolution 246: 45–76.
Balfourier F, Imbert C, Charmet G. 2000. Evidence for phylogeographic
structure in Lolium species related to the spread of agriculture in Europe.
A cpDNA study. Theoretical and Applied Genetics 101: 131–138.
Ballouche A. 2003. La dimension anthropique de l’histoire de la vegetation
Holocene au Maghreb. In: Le peuplement ancien de l’Algerie: sa place dansle contexte Mediterraneen. Paris, France: College de France.
Beja-Pereira A, Caramelli D, Lalueza-Fox C, Vernesi C, Ferrand N,
Casoli A, Goyache F, Royo LJ, Conti S, Lari M et al. 2006. The
origin of European cattle: evidence from modern and ancient
DNA. Proceedings of the National Academy of Sciences, USA 103: 8113–
8118.
Besnard G, De Casas RR, Vargas P. 2007. Plastid and nuclear DNA
polymorphism reveals historical processes of isolation and reticulation in
the olive tree complex (Olea europaea). Journal of Biogeography 34: 736–
752.
Bittkau C, Comes HP. 2005. Evolutionary processes in a continental
island system: molecular phylogeography of the Aegean Nigella arvensisalliance (Ranunculaceae) inferred from chloroplast DNA. MolecularEcology 14: 4065–4083.
Blondel J. 2006. The ‘Design’ of Mediterranean landscapes: a millennial
story of humans and ecological systems during the historic period.
Human Ecology 34: 713–729.
Bonin A, Bellemain E, Bronken Edeisen P, Pompanon F, Brochmann C,
Taberlet P. 2004. How to track and assess genotyping errors in
population genetics studies. Molecular Ecology 13: 3261–3273.
Borchsenius F. 2009. FastGap 1.2. Denmark: Department of Biological
Sciences, University of Aarhus, Aarhus, Denmark. http://192.38.46.42/
aubot/fb/FastGap_home.htm.
Burnier J, Buerki S, Arrigo N, Kupfer P, Alvarez N. 2009. Genetic
structure and evolution of Alpine polyploid complexes: Ranunculuskuepferi (Ranunculaceae) as a case study. Molecular Ecology 18: 3730–
3744.
Bussel JD. 1999. The distribution of random amplified polymorphic
DNA (RAPD) diversity amongst populations of Isotama petraea(Lobeliaceae). Molecular Ecology 8: 775–789.
NewPhytologist Research 9
� The Authors (2010)
Journal compilation � New Phytologist Trust (2010)
New Phytologist (2010)
www.newphytologist.com
Caldwell KH, Dvorak J, Lagudah ES, Akhunov E, Luo MC, Wolters P,
Powell W. 2004. Sequence polymorphism in polyploid wheat and their
D-genome diploid ancestor. Genetics 167: 941–947.
Chee PW, Lavin M, Talbert LE. 1995. Molecular analysis of evolutionary
patterns in U genome wild wheats. Genome 38: 290–297.
Chen DH, Ronald PC. 1999. A rapid DNA minipreparation method
suitable for AFLP and other PCR applications. Plant Molecular BiologyReporter 17: 53–57.
Chennaveeraiah MS. 1960. Some aspects of the cytotaxonomy of Aegilops.Proceedings Summer School of Botany 43–50.
Clement M, Posada D, Crandall K. 2000. TCS: a computer program to
estimate gene genealogies. Molecular Ecology 9: 1657–1660.
Comes HP, Abbott RJ. 2001. Molecular phylogeography, reticulation,
and lineage sorting in Mediterranean Senecio sect. Senecio (Asteraceae).
Evolution 55: 1943–1962.
Costich DE, Meagher TR. 1992. Genetic variation in Ecballium elaterium(Cucurbitaceae): breeding system and geographic distribution. Journal ofEvolutionary Biology 5: 589–601.
Currat M, Ruedi M, Petit RJ, Excoffier L. 2008. The hidden side of
invasions: massive introgression by local genes. Evolution 62: 1908–
1920.
Evanno G, Regnaut S, Goudet J. 2005. Detecting the number of clusters
of individuals using the software STRUCTURE: a simulation study.
Molecular Ecology 14: 2611–2620.
Falush D, Stephens M, Pritchard JK. 2007. Inference of population
structure using multilocus genotype data: dominant markers and null
alleles. Molecular Ecology Notes 7: 574–578.
Fineschi S, Taurchini D, Villani F, Vendramin GG. 2000. Chloroplast
DNA polymorphism reveals little geographical structure in Castaneasativa Mill. (Fagaceae) throughout Southern European countries.
Molecular Ecology 9: 1495–1503.
Fjellheim S, Rognli OA, Fosnes K, Brochmann C. 2006.
Phylogeographical history of the widespread meadow fescue (Festucapratensis Huds.) inferred from chloroplast DNA sequences. Journal ofBiogeography 33: 1470–1478.
Friebe BR, Tuleen NA, Gill BS. 1999. Development and identification of
a complete set of Triticum aestivum–Aegilops geniculata chromosome
addition lines. Genome 42: 374–380.
Furuta Y. 1981. Chromosome structural variation in Aegilops ovata L.
Japanese Journal of Genetics 56: 287–294.
Gugerli F, Englisch T, Niklfeld H, Tribsch A, Mirek Z, Ronikier M,
Zimmermann NE, Holderegger R, Taberlet P. 2008. Relationships
among levels of biodiversity and the relevance of intraspecific diversity in
conservation – a project synopsis. Perspectives in Plant Ecology, Evolutionand Systematics 10: 259–281.
Hall TA. 1999. Bioedit: a user-friendly biological sequence alignment
editor and analysis program for Windows 95 ⁄ 98 ⁄ NT. Nucleic AcidsSymposium Series 41: 95–98.
Hammer K. 1980. Vorarbeiten zur monographischen Darstellung von
Wildpflanzensortimenten: Aegilops L. Kulturpflanze 28: 33–180.
Hampe A, Petit RJ. 2005. Conserving biodiversity under climate change:
the rear edge matters. Ecology Letters 8: 461–467.
Hartigan JA, Wong MA. 1979. A K-means clustering algorithm. AppliedStatistics 28: 100–108.
Hewitt GM. 2000. The genetic legacy of the Quaternary ice ages. Nature405: 907–913.
Hewitt GM. 2004. Genetic consequences of climatic oscillations in the
Quaternary. Philosophical Transactions of the Royal Society of LondonSeries B-Biological Sciences 359: 183–195.
Jakob SS, Ihlow A, Blattner FR. 2007. Combined ecological niche
modelling and molecular phylogeography revealed the evolutionary
history of Hordeum marinum (Poaceae) – niche differentiation, loss of
genetic diversity, and speciation in Mediterranean Quaternary refugia.
Molecular Ecology 16: 1713–1727.
Kadosumi S, Kawahara T, Sasanuma T. 2005. Multiple origins of U
genome in two UM genome tetraploid Aegilops species, Ae. columnarisand Ae. triaristata, revealed based on the polymorphism of a genome-
specific PCR fragment. Genes & Genetic Systems 80: 105–111.
Kluge AG. 1989. A concern for evidence and a phylogenetic hypothesis of
relationships among Epicrates (Boidae, Serpentes). Systematic Zoology 38:
7–25.
Kuper R, Kroepelin S. 2006. Climate-controlled Holocene occupation in
the Sahara: motor of Africa’s evolution. Science 313: 803–807.
Legendre P, Legendre L. 1998. Numerical ecology. Amsterdam, the
Netherlands: Elsevier.
Medail F, Diadema K. 2009. Glacial refugia influence plant diversity
patterns in the Mediterranean basin. Journal of Biogeography 36: 1333–
1345.
Meimberg H, Rice KJ, Milan NF, Njoku CC, Mckay JK. 2009. Multiple
origins promote the ecological amplitude of allopolyploid Aegilops(Poaceae). American Journal of Botany 96: 1262–1273.
Moscati S. 2001. The Phoenicians. London, UK & New York, NY, USA:
I.B. Tauris & Co Ltd.
Murai K, Tsunewaki K. 1986. Molecular-basis of genetic diversity among
cytoplasms of Triticum and Aegilops species. 4. ctDNA variation in Ae.triuncialis. Heredity 57: 335–339.
Obbard DJ, Harris SA, Pannell JR. 2006. Sexual systems and population
genetic structure in an annual plant: testing the metapopulation model.
The American Naturalist 167: 354–366.
Ortiz MA, Tremetsberger K, Terrab A, Stuessy TF, Garcia-Castano JL,
Urtubey E, Baeza CM, Ruas CF, Gibbs PE, Talavera S. 2008.
Phylogeography of the invasive weed Hypochaeris radicata (Asteraceae):
from Moroccan origin to worldwide introduced populations. MolecularEcology 17: 3654–3667.
Parducci L, Szmidt AE, Madaghiele A, Anzidei M, Vendramin GG.
2001. Genetic variation at chloroplast microsatellites (cpSSRs) in Abiesnebrodensis (Lojac.) Mattei and three neighboring Abies species.
Theoretical and Applied Genetics 102: 733–740.
Presti RM, Oberprieler C. 2009. Evolutionary history, biogeography and
eco-climatological differentiation of the genus Anthemis L. (Compositae,
Anthemideae) in the circum-Mediterranean area. Journal of Biogeography36: 1313–1332.
R Development Core Team. 2009. R: a language and environment for
statistical computing, reference index version 2.8.1. Vienna, Austria: R
Foundation for Statistical Computing.
Resta P, Zhang HB, Dubcovsky J, Dvorak J. 1996. The origins of
the genomes of Triticum biunciale, T. ovatum, T. neglectum, T.columnare, and T. rectum (Poaceae) based on variation in
repeated nucleotide sequences. American Journal of Botany 83:
1556–1565.
Rodriguez-Sanchez F, Perez-Barrales R, Ojeda F, Vargas P, Arroyo J.
2008. The Strait of Gibraltar as a melting pot for plant biodiversity.
Quaternary Science Reviews 27: 2100–2117.
Sasanuma T, Kadosumi S, Kawahara T. 2006. Multiple origins of U
genome in two UM genome tetraploid Aegilops species, Ae. biuncialisand Ae. ovata. Wheat Info Service 101: 11–12.
Schmitt T. 2007. Molecular biogeography of Europe: Pleistocene cycles
and postglacial trends. Frontiers in Zoology 4, doi:10.1186/1742-9994-
4-11.
Shaw J, Lickey EB, Beck JT, Farmer SB, Liu WS, Miller J, Siripun
KC, Winder CT, Schilling EE, Small RL. 2005. The tortoise and
the hare II: relative utility of 21 noncoding chloroplast DNA
sequences for phylogenetic analysis. American Journal of Botany 92:
142–166.
Shaw J, Lickey EB, Schilling EE, Small RL. 2007. Comparison of whole
chloroplast genome sequences to choose noncoding regions for
phylogenetic studies in angiosperms: the tortoise and the hare III.
American Journal of Botany 94: 275–288.
10 Research
NewPhytologist
� The Authors (2010)
Journal compilation � New Phytologist Trust (2010)
New Phytologist (2010)
www.newphytologist.com

Taberlet P, Fumagalli L, Wust-Saucy AG, Cosson JF. 1998. Comparative
phylogeography and postglacial colonization routes in Europe.
Molecular Ecology 7:
Templeton AR, Crandall KA, Sing CF. 1992. A cladistic analysis of
phenotypic associations with haplotypes inferred from restriction
endonuclease mapping and DNA sequence data. III. Cladogram
estimation. Genetics 132: 619–633.
Terachi T, Ogihara Y, Tsunewaki K. 1984. The molecular-basis of
genetic diversity among cytoplasms of Triticum and Aegilops. 3.
Chloroplast genomes of the M and modified-M genome-carrying
species. Genetics 108: 681–695.
Thompson JD, Gibson TJ, Plewniak F, Jeanmougin F, Higgins DG.
1997. The Clustal X windows interface: flexible strategies for multiple
sequence alignment aided by quality analysis tools. Nucleic AcidsResearch 25: 4876–4882.
Van Slageren MW. 1994. Wild wheats: a monograph of Aegilops L. andAmbylopyrum (Jaub and Spach) Eig (Poaceae). Wageningen,
the Netherlands: Wageningen Agricultural University Papers,
94–97.
Vanichanon A, Blake NK, Sherman JD, Talbert LE. 2003. Multiple
origins of allopolyploid Aegilops triuncialis. Theoretical and AppliedGenetics 106: 804–810.
Vekemans X, Beauwens T, Lemaire M, Roldan-Ruiz I. 2002. Data
from amplified fragment length polymorphism (AFLP) markers
show indication of size homoplasy and of a relationship between
degree of homoplasy and fragment size. Molecular Ecology 11: 139–
151.
Waines JG, Barnhart D. 1992. Biosystematic research in Aegilops and
Triticum. Hereditas 116: 207–212.
Wainwright J, Thornes JB. 2004. Environmental issues in theMediterranean: processes and perspectives from the past and present.London, UK: Routledge.
Wang GZ, Matsuoka Y, Tsunewaki K. 2000. Evolutionary features of
chondriome divergence in Triticum (wheat) and Aegilops shown by
RFLP analysis of mitochondrial DNAs. Theoretical and Applied Genetics100: 221–231.
Wiens JJ, Donoghue MJ. 2004. Historical biogeography, ecology and
species richness. Trends in Ecology & Evolution 19: 639–644.
Zaharieva M, Dimov A, Stankova P, David J, Monneveux P. 2003.
Morphological diversity and potential interest for wheat improvement of
three Aegilops L. species from Bulgaria. Genetic Resources and CropEvolution 50: 507–517.
Zaharieva M, Gaulin E, Havaux M, Acevedo E, Monneveux P. 2001a.
Drought and heat responses in the wild wheat relative Aegilops geniculataRoth: potential interest for wheat improvement. Crop Science 41: 1321–
1329.
Zaharieva M, Santoni S, David J. 2001b. Use of RFLP markers to study
genetic diversity and to build a core-collection of the wild wheat relative
Ae. geniculata Roth (= Ae. ovata L.). Genetics Selection Evolution 33:
S269–S288.
Zeder M. 2008. Domestication and early agriculture in the Mediterranean
basin: origins, diffusion and impact. Proceedings of the National Academyof Sciences, USA 105: 11597–11604.
Zeder M, Emshwiller E, Smith BD, Bradley D. 2006. Documenting
domestication: the intersection of genetics and archaeology. Trends inGenetics 22: 139–155.
Supporting Information
Additional supporting information may be found in theonline version of this article.
Table S1 Detailed plant material investigated in the presentstudy
Notes S1 Screening for the most likely number of groups innonhierarchical K-means clustering.
Please note: Wiley-Blackwell are not responsible for thecontent or functionality of any supporting informationsupplied by the authors. Any queries (other than missingmaterial) should be directed to the New Phytologist CentralOffice.
NewPhytologist Research 11
� The Authors (2010)
Journal compilation � New Phytologist Trust (2010)
New Phytologist (2010)
www.newphytologist.com