Relative mislocalization of successively presented stimuli
10
This article appeared in a journal published by Elsevier. The attached copy is furnished to the author for internal non-commercial research and education use, including for instruction at the authors institution and sharing with colleagues. Other uses, including reproduction and distribution, or selling or licensing copies, or posting to personal, institutional or third party websites are prohibited. In most cases authors are permitted to post their version of the article (e.g. in Word or Tex form) to their personal website or institutional repository. Authors requiring further information regarding Elsevier’s archiving and manuscript policies are encouraged to visit: http://www.elsevier.com/copyright
-
Upload
rwth-aachen -
Category
Documents
-
view
1 -
download
0
Transcript of Relative mislocalization of successively presented stimuli

This article appeared in a journal published by Elsevier. The attachedcopy is furnished to the author for internal non-commercial researchand education use, including for instruction at the authors institution
and sharing with colleagues.
Other uses, including reproduction and distribution, or selling orlicensing copies, or posting to personal, institutional or third party
websites are prohibited.
In most cases authors are permitted to post their version of thearticle (e.g. in Word or Tex form) to their personal website orinstitutional repository. Authors requiring further information
regarding Elsevier’s archiving and manuscript policies areencouraged to visit:
http://www.elsevier.com/copyright

Author's personal copy
Relative mislocalization of successively presented stimuli q
Diana Bocianski a,*, Jochen Müsseler a, Wolfram Erlhagen b
a Psychology Department, RWTH Aachen University, Jägerstrasse 17-19, 52066 Aachen, Germanyb Department of Mathematics for Science and Technology, University of Minho, Portugal
a r t i c l e i n f o
Article history:Received 19 February 2008Received in revised form 27 May 2008
Keywords:Localization errorRelative judgmentSpace perceptionVisual illusionSpatial cuing
a b s t r a c t
When observers were asked to localize the peripheral position of a briefly presented target with respectto a previously presented comparison stimulus, they tended to judge the target as being more towardsthe fovea than the comparison stimulus. Three experiments revealed that the mislocalization onlyemerged when the comparison stimulus and the target were presented successively. Varying the tempo-ral interval between stimuli showed that the mislocalization reversed with longer stimulus-onset asyn-chronies. Further, the mislocalization was increased with a decrease of the spatial distance betweenstimuli. These findings suggested that the mislocalization originated from local excitatory and inhibitorymechanisms. Corroborating this idea a neuronal dynamic field model was successfully developed toaccount for the findings.
� 2008 Elsevier Ltd. All rights reserved.
1. Relative mislocalization of successively presented stimuli
Typically, the visual system processes the position of targetswith high precision—at least when these targets are presented sta-tionary with high contrast and without time restrictions so thatobservers can easily fixate them. Localization is much poorer oris even distorted when targets are briefly presented before, duringor after a saccade or during smooth pursuit eye movements(e.g., Awater & Lappe, 2006; Brenner, Smeets, & van den Berg,2001; Rotman, Brenner, & Smeets, 2005).
However, there are also studies reporting distortions withbriefly presented stimuli during steady eye fixation. In some ofthese studies, (involuntary) microsaccades towards the stimuliwere observed which seemed to affect their perceived positions(e.g., Fahle, 1991; Findlay, 1974; Matin, Pola, Matin, & Picoult,1981). The distortions were gathered with absolute and relativelocalization tasks. In studies with absolute localization tasksobservers pointed with their finger or with a computer mouse tothe targets’ location. For example, in a study of Sheth and Shimojo(2001) targets were briefly presented in peripheral space. After ashort delay following the targets’ disappearance, observers locatethe target position by means of a computer mouse. Mislocaliza-tions emerged systematically toward the center of the gaze (fovealmislocalization, see also Kerzel, 2002; Müsseler & Aschersleben,
1998; Müsseler, van der Heijden, Mahmud, Deubel, & Ertsey,1999; O’Regan, 1984; van der Heijden, Müsseler, & Bridgeman,1999a). Additionally, mislocalizations were in direction of salientmarkers in the visual display. A perceptual judgment task revealedthat the localization error is independent from the execution of eyemovements. The amplitude of distortion enhanced with an increas-ing time interval between targets disappearance and judgment.Thus, this compression phenomenon seemed to establish a visualmemory effect according to which the spatial location is systemat-ically distorted over time.
Uddin, Kawabe and Nakamizo (2005) investigated the influenceof spatial and temporal factors on localization of visual stationarytargets. Spatial variation consisted in display manipulation withor without distractors. Target and distractor were presented eithersimultaneously, for 150 or 1000 ms while observers had to memo-rize the targets position under fixed gaze conditions. 150 ms afterstimuli offset a mouse cursor was shown to adjust the rememberedtarget position. Under the condition of 150 ms presentation timeand distractor presence, judgment performance remained unbi-ased, whereas with 1000 ms presentation time and distractor pres-ence as well as absence, a foveal bias was observed.
In relative localization tasks observers judged the targets’ posi-tion with regard to the location of a comparison stimulus (e.g., Fo-ley, 1976; Kerzel, 2002). For example, Kerzel (2002) examined theinfluence of foveal mislocalization and memory averaging onmemory for the position of stationary objects, presented brieflyin the periphery. When a distractor was flashed during the reten-tion interval after targets presentation and even when the distrac-tor was visible throughout the trial, a bias away from the distractorwas observed. However, a foveal tendency existed regardless ofadditional presented objects.
0042-6989/$ - see front matter � 2008 Elsevier Ltd. All rights reserved.doi:10.1016/j.visres.2008.06.016
q We thank the anonymous reviewers for helpful comments and suggestions andThomas Klapdor and Stefan Ladwig for carrying out the experiments. This researchwas supported by a grant from the Deutsche Forschungsgemeinschaft to the secondauthor (DFG MU 1298/4) and a grant form the Acções Integradas Luso-Alemãs tothe third author (Acção No A-12/06).
* Corresponding author. Fax: +49 241 80 92318.E-mail address: [email protected] (D. Bocianski).
Vision Research 48 (2008) 2204–2212
Contents lists available at ScienceDirect
Vision Research
journal homepage: www.elsevier .com/locate /v isres

Author's personal copy
Using also a relative judgment task, an incidental observation ofMüsseler and co-workers (Müsseler et al., 1999, Exp. 5) revealed arelated localization error. In one of their conditions the authorsasked observers to localize the peripheral position of a single targetwith respect to a comparison stimulus presented above the target(Fig. 1). Both stimuli were briefly flashed with the comparison first,followed by the target with a stimulus onset asynchrony (SOA) ofabout 100 ms. The authors found with these presentation condi-tions that observers tended to judge the target as being more to-wards the fovea than the comparison stimulus (or thecomparison stimulus as being more peripheral than the target,respectively).
For a first rough explanation of this mislocalization, the authorsreferred to the method of constant stimuli, which was applied intheir study. The comparison stimulus was presented at a fixed po-sition, whereas the target was presented below with constanteccentricities varying between 3.8� and 6.8�. Observers’ task wasalways to judge whether the upper or the lower stimulus was moreperipheral (which implies that the other stimulus was perceivedmore foveal). The authors assumed that the explanation of the rel-ative mislocalization was in the varying eccentricities of the tar-gets. Adding the reasonable assumption that localizationjudgments became more variable with eccentricity, the distribu-tions of perceived target positions were presumed to get flatterthe more the target’s eccentricity is. From that, it simply followedthat the overall distribution of judgments had a skewness towardsmore foveal judgments. In the following we will refer to this expla-nation as the variability-by-eccentricity assumption. Note, thataccording to this explanation the mislocalization was not a percep-tual phenomenon, which can be ‘perceived’ in a single trial. Insteadthe mislocalization emerges only from the distribution of judg-ments over trials, which were affected by the different targets’eccentricities.
In the present paper we started with the variability-by-eccen-tricity assumption, which remained unchallenged so far. Experi-ments 1 aimed to replicate the mislocalization and to examinespecific hypotheses derived from the variability-by-eccentricityassumption. In Experiments 2 and 3 the spatial and temporal dis-tance between stimuli was varied to examine whether localexcitatory or inhibitory mechanisms contribute to themislocalization.
2. Experiment 1
In the study of Müsseler and co-workers (1999, Exp. 5) the com-parison stimulus was always presented first, followed by the targetpresented below at varying eccentricities. In the present experi-ment we examined whether the localization error occurred also
when the temporal sequence between stimuli was reversed. If itwould always be the second stimulus, which is localized moretowards the fovea, the mislocalization is expected to reverse too.In other words, the comparison stimulus in Fig. 1 should be judgedmore foveal. Contrary, nothing essential would be changed whenconsidering the variability-by-eccentricity assumption. The lowertarget’s positions were still varying, what should result in more in-ner judgments of the lower stimulus, i.e., in this case of the firststimulus (i.e., the target in Fig. 1).
Therefore, in the present experiment stimuli were presentedwith a positive (the comparison stimulus comes first) and a nega-tive SOA (the target comes first). Additionally, both stimuli werepresented simultaneously. In this case, it can be assumed that theywere processed as one stimulus with veridical relative positioninformation. With simultaneous presentation we expect thatrelative position judgments are more or less error-free (see alsoMüsseler & van der Heijden, 2004).
2.1. Method
2.1.1. Apparatus and stimuliThe experiments were carried out in a dimly lit and soundproof
chamber and were controlled by an Apple Macintosh computerwith Matlab software using the Psychophysics Toolbox extension(Brainard, 1997; Pelli, 1997). The stimuli were presented on a2200 color CRT monitor (Iiyama Vision Master Pro 513, 100 Hz re-fresh rate, 1024 � 768 pix). The observers sat at a table with a chinrest and were positioned at a viewing distance of 50 cm to thedisplay.
The stimuli were made up of two singular dark squares (1.9 cd/m2) on a light background (68 cd/m2) and had a size of0.33� � 0.33�, respectively. The display consisted of a single uppersquare (the comparison stimulus) and a single lower square (thetarget). The position of the comparison stimulus was held constantat 5� in the left or right visual field. The probe’s position had a ver-tical distance of 1.4� to the comparison stimulus and was horizon-tally varied with respect to the mid-position of the comparisonstimulus by ±0.2�, ±0.7�, and ±1.2�; thus, the target was presentedat 3.8�, 4.3�, 4.8�, 5.2�, 5.7�, or 6.2�.
2.1.2. DesignTarget and comparison stimulus were presented unpredictably
in either the left or the right visual field. They appeared eithersimultaneously or the target followed the comparison stimulusby an SOA of +100 ms or the sequence of presentation was re-versed (SOA of �100 ms). Each combination of hemifield (leftvs. right) � SOA (+100, 0, �100 ms) � probe position (3.8–6.2�)was presented to all participants in two blocks. In one block theSOAs of 0 and �100 ms were randomly combined with the targetpositions, in the other block the SOAs of 0 and +100 ms are ap-plied. The sequence of blocks was counterbalanced betweenparticipants.
2.1.3. ProcedureThe fixation cross was visible throughout the experiment and
the instruction stressed concentration on the fixation point. Theparticipants initiated stimulus presentation by pressing a mousebutton. Three hundred milliseconds after a beep the target andthe comparison stimulus were presented. The participants wereasked to judge whether the upper square (comparison stimulus)or the lower square (target) was perceived as being more periphe-ral; accordingly they pressed the upper button of a horizontally ar-ranged mouse for the upper square and the lower button for thelower square. Following a response, the next trial was triggeredafter 1 s. A training period of 48 trials and the experimental sessionof 2 � 288 trials lasted about 30 min.
Fig. 1. Stimulus presentation in the experiments. Participants fixated a cross in themiddle of a screen. A stimulus configuration consisting of an upper square(comparison stimulus) and a lower square (target) appeared to the left or to theright of the fixation cross (here 5� to the left). Participants’ task was to judgewhether the target (presented at 3.8�–6.2�) or the comparison stimulus wasperceived more outer.
D. Bocianski et al. / Vision Research 48 (2008) 2204–2212 2205

Author's personal copy
2.1.4. ParticipantsTen individuals (7 females) with a mean age of 27.0 years were
paid to participate in the experiment. All participants in the pres-ent and the subsequent experiments reported having normal orcorrected-to-normal vision.
2.2. Results
For every participant and condition the frequency of trials werecounted in which the target was perceived more outer than thecomparison stimulus. Frequencies of the judgments at the six tar-get positions were entered in a Probit analysis of the Psignifit Soft-ware Package, which determined the 50%-threshold points ofsubjective equality (PSE) for every participant and condition (boot-strap-software.org, cf. Wichmann & Hill, 2001a; Wichmann & Hill,2001b). Positive deviations indicate PSE values higher than theobjective mid-position and thus a tendency to more inner judg-ments of the target (Fig. 2).
The PSE values were dependent variables in a 2 (left vs. righthemifield) � 3 (SOAs of �100, 0, and +100 ms) analysis of variance(ANOVA). The analysis revealed no effect of the hemifield and theinteraction (both p’s > .20), but a significance of the SOA factor withF(9, 18) = 8.91, MSE = 74.75, p = .0091. When the comparison stimu-lus was presented first (SOA = +100 ms), participants judged it asbeing more outer than the target; or the other way around, theyjudged the target as being more inner than the comparison stimulus(mean PSE deviation from the objective mid-position of 0.33�). Whenthe target was presented first (SOA = �100 ms), participants judgedthe comparison stimulus as being more inner than the target (meanPSE deviation of �0.20�). With simultaneously presented stimuli,localization judgments were nearly error free (PSE deviation of0.03�). Correspondingly, t-tests yielded (nearly) significant differ-ences between the SOA conditions of �100 and 0 ms [t(9) = 2.19,p = .057] and between 0 and +100 ms [t(9) = �3.16, p = .011; two-tailed].
2.3. Discussion
Four main results were observed. The first finding was thatlocalization judgments were not affected by the left/right visualfield, in which the stimuli appeared. In the subsequent experi-ments we will therefore average across this factor.
The second finding was that relative judgments were nearly er-ror free when the two stimuli were presented simultaneously. Wetake that as evidence that in this case stimuli were processed asone stimulus with veridical relative position information betweenthem (cf. Müsseler & van der Heijden, 2004; van der Heijden et al.,1999a).
The third finding was that mislocalizations emerged when bothstimuli are presented successively. When the comparison stimulus(the upper stimulus) was presented first, we observed a deviationof the PSE value from the objective mid-position of 0.33�. This va-lue matches nearly with the PSE deviation of 0.43�, which was ob-served under similar conditions in the predecessor’s study(Müsseler et al., 1999, Exp. 5). Thus, we successfully replicatedthe reported mislocalization.
The fourth and main finding was that the mislocalization wasreversed when the sequence of stimulus presentation is re-versed. Or in other words, it was always the second stimulus,which was judged as the more inner stimulus. This findingwas not in accordance with our variability-by-eccentricity expla-nation of the mislocalization. With regard to this explanation themislocalization should originate from the method of constantstimuli only, more precisely from the different target eccentrici-ties across trials. However, in both SOA conditions, the lowertarget’s positions were still varying in eccentricity, what shouldresult in more inner judgments of the lower stimulus indepen-dently from the temporal sequence of presentation, but it was.Instead, the finding can be taken as first evidence that the mislo-calization originated from perceptual mechanisms and not fromthe method used. In the subsequent experiments we examinedwhether the mislocalization was sensitive for spatio-temporalvariations.
3. Experiment 2
The main finding of Experiment 1, which indicated that themislocalization was reversed when the temporal sequence of stim-ulus presentation was reversed, pointed to a spatio-temporalexplanation. For example, it is possible to think of an interpretationof the mislocalization based upon the idea that briefly presentedstimuli are first localized more foveally and than ‘‘move outwards”over time. Then, when the target is displayed, the previously pre-sented comparison stimulus could already have ‘‘moved” moreoutwards. In this case, the mislocalization should be reversed withthe reversal of presentation—as it was. What needs to be specifiedis, of course, the mechanism, which causes moving-outward move-ments over time.
Several recent studies identified locally working mechanismsaccording to which the presentation of a stimulus elicits excitatoryand inhibitory processes determining a temporal activation pat-tern, which is not restricted to the area covered by the stimulus.Rather it spreads its activation to and integrates contextualinformation from the adjacent parts of the visual field (e.g., Berry,Brivanlou, Jordan, & Meister, 1999; Erlhagen & Jancke, 2004;Kirschfeld & Kammer, 1999; Müsseler & van der Heijden, 2004).To examine whether the present mislocalization was caused bysuch a mechanism, the temporal interval between stimuli wasvaried in the present experiment. In the previous experiment,stimuli were presented only with the 0-ms and the 100-ms SOA.Comparison stimulus and target were now temporarily separatedby seven SOAs varying between 0 and 700 ms.
Fig. 2. Mean probabilities of outer judgments of the target and fitted functions forthe three stimulus-onset asynchronies (SOAs) between comparison stimulus andtarget (�100, 0, and +100 ms). A more eccentric deviation of the function from theobjective mid-position (5�) means that the point of subjective equality is moreperipheral thus the target is perceived more towards the fovea and vice versa(Experiment 1, N = 10).
1 In order to avoid the risk of violating statistical assumptions that is present inrepeated-measures designs due to inhomogeneity of the variance-covariance matrix,F-probabilities in the present and the following experiments were correctedaccording to Huynh and Feldt (1980).
2206 D. Bocianski et al. / Vision Research 48 (2008) 2204–2212
Author's personal copy
3.1. Method
3.1.1. Stimuli, design and procedureThese were essentially the same as in Experiment 1 with the
following changes. Seven SOAs between comparison stimulusand target were introduced: 0, 50, 150, 250, 350, 500 or 700 ms.Each combination of hemifield (left vs. right visual filed) � targetpositions (3.8�–6.2�) � SOAs was presented to all participants ina randomized sequence. A training period of 48 trials and theexperimental session of 8 blocks—each with 84 trials—lasted about45 min.
3.1.2. Control of eye fixationIn the previous experiment the presentation of comparison
stimulus and target was much too short to execute eye movementssuccessfully. Additionally, keeping fixation seems to be much moreconvenient for the observers than moving their eyes. However, inthe present experiment eye movements were more critical to occurespecially with the SOAs of 500 and 700 ms. Therefore, the hori-zontal position of the right eye was monitored with a headmounted and infrared light reflecting eye-tracking device (SkalarMedical B.V., IRIS Model 6500). A horizontal three point calibrationwas made at the beginning of each block. If a saccade was detectedduring the presentation of the target stimulus, the data of the cor-responding trial was excluded from analysis. The mean exclusionrate was only 1.26%, overall 127 of 10,080 trials.
3.1.3. ParticipantsFifteen individuals with a mean age of 27.0 years were paid to
participate in the experiment.
3.2. Results and discussion
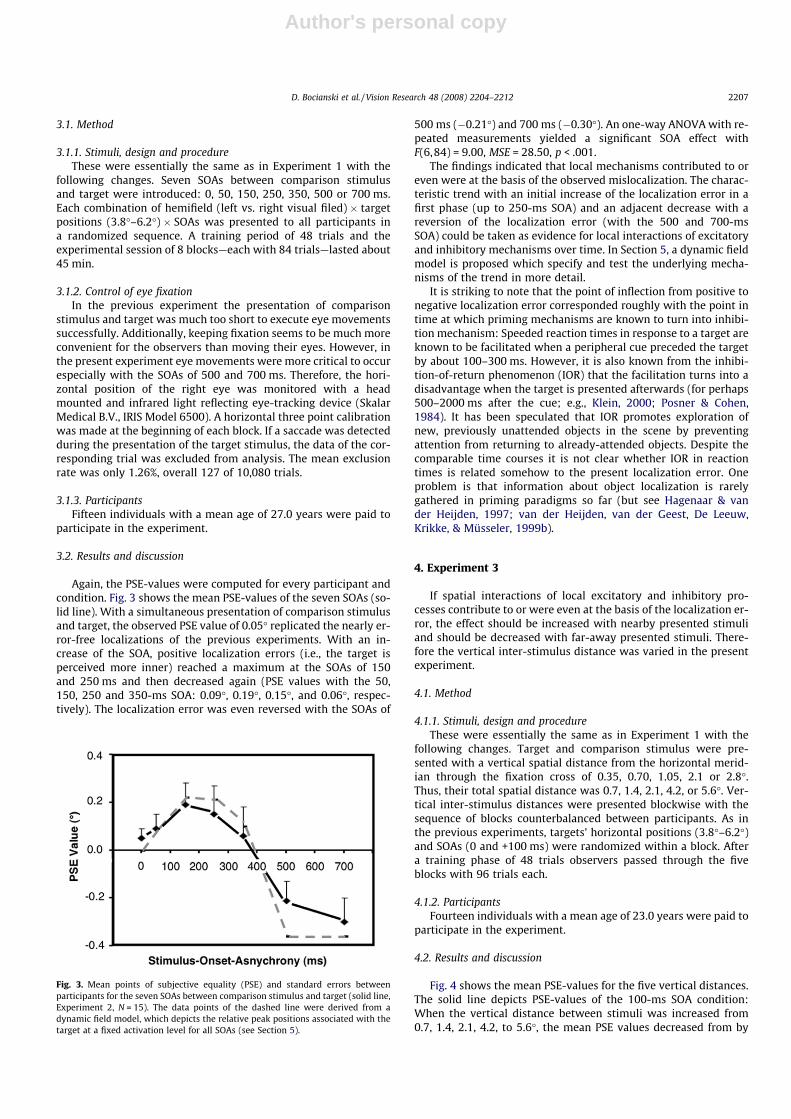
Again, the PSE-values were computed for every participant andcondition. Fig. 3 shows the mean PSE-values of the seven SOAs (so-lid line). With a simultaneous presentation of comparison stimulusand target, the observed PSE value of 0.05� replicated the nearly er-ror-free localizations of the previous experiments. With an in-crease of the SOA, positive localization errors (i.e., the target isperceived more inner) reached a maximum at the SOAs of 150and 250 ms and then decreased again (PSE values with the 50,150, 250 and 350-ms SOA: 0.09�, 0.19�, 0.15�, and 0.06�, respec-tively). The localization error was even reversed with the SOAs of
500 ms (�0.21�) and 700 ms (�0.30�). An one-way ANOVA with re-peated measurements yielded a significant SOA effect withF(6,84) = 9.00, MSE = 28.50, p < .001.
The findings indicated that local mechanisms contributed to oreven were at the basis of the observed mislocalization. The charac-teristic trend with an initial increase of the localization error in afirst phase (up to 250-ms SOA) and an adjacent decrease with areversion of the localization error (with the 500 and 700-msSOA) could be taken as evidence for local interactions of excitatoryand inhibitory mechanisms over time. In Section 5, a dynamic fieldmodel is proposed which specify and test the underlying mecha-nisms of the trend in more detail.
It is striking to note that the point of inflection from positive tonegative localization error corresponded roughly with the point intime at which priming mechanisms are known to turn into inhibi-tion mechanism: Speeded reaction times in response to a target areknown to be facilitated when a peripheral cue preceded the targetby about 100–300 ms. However, it is also known from the inhibi-tion-of-return phenomenon (IOR) that the facilitation turns into adisadvantage when the target is presented afterwards (for perhaps500–2000 ms after the cue; e.g., Klein, 2000; Posner & Cohen,1984). It has been speculated that IOR promotes exploration ofnew, previously unattended objects in the scene by preventingattention from returning to already-attended objects. Despite thecomparable time courses it is not clear whether IOR in reactiontimes is related somehow to the present localization error. Oneproblem is that information about object localization is rarelygathered in priming paradigms so far (but see Hagenaar & vander Heijden, 1997; van der Heijden, van der Geest, De Leeuw,Krikke, & Müsseler, 1999b).
4. Experiment 3
If spatial interactions of local excitatory and inhibitory pro-cesses contribute to or were even at the basis of the localization er-ror, the effect should be increased with nearby presented stimuliand should be decreased with far-away presented stimuli. There-fore the vertical inter-stimulus distance was varied in the presentexperiment.
4.1. Method
4.1.1. Stimuli, design and procedureThese were essentially the same as in Experiment 1 with the
following changes. Target and comparison stimulus were pre-sented with a vertical spatial distance from the horizontal merid-ian through the fixation cross of 0.35, 0.70, 1.05, 2.1 or 2.8�.Thus, their total spatial distance was 0.7, 1.4, 2.1, 4.2, or 5.6�. Ver-tical inter-stimulus distances were presented blockwise with thesequence of blocks counterbalanced between participants. As inthe previous experiments, targets’ horizontal positions (3.8�–6.2�)and SOAs (0 and +100 ms) were randomized within a block. Aftera training phase of 48 trials observers passed through the fiveblocks with 96 trials each.
4.1.2. ParticipantsFourteen individuals with a mean age of 23.0 years were paid to
participate in the experiment.
4.2. Results and discussion
Fig. 4 shows the mean PSE-values for the five vertical distances.The solid line depicts PSE-values of the 100-ms SOA condition:When the vertical distance between stimuli was increased from0.7, 1.4, 2.1, 4.2, to 5.6�, the mean PSE values decreased from by
Fig. 3. Mean points of subjective equality (PSE) and standard errors betweenparticipants for the seven SOAs between comparison stimulus and target (solid line,Experiment 2, N = 15). The data points of the dashed line were derived from adynamic field model, which depicts the relative peak positions associated with thetarget at a fixed activation level for all SOAs (see Section 5).
D. Bocianski et al. / Vision Research 48 (2008) 2204–2212 2207

Author's personal copy
0.38, 0.13, 0.19, 0.04, to 0.07�. PSE-values were nearly parallel tothe abscissa in the 0-ms SOA condition (squares) with a mean devi-ation of 0.08�. Accordingly, a 5 (vertical distance) � 2 (SOA) ANOVArevealed a significant interaction of both factors [F(4,52) = 3.48,MSE = 0.04, p = .027] and a tendency for a main effect of verticaldistance, F(4,52) = 2.35, MSE = 0.06, p = .088.
The observation that the mislocalization was increased whenthe distance between stimuli was decreased is clear evidence thatlocal mechanisms contributed to the mislocalization. In the subse-quent section, a dynamic field model specifies possible locallyworking mechanisms.
5. General discussion
In three experiments we examined a localization error, whichwas observed when a briefly presented target appeared in the ret-inal periphery and observers’ task was to judge its position rela-tively to a previously presented comparison stimulus.Experiment 1 replicated and extended the basic observation thatwith these conditions observers judged the target as being moretowards the fovea than the comparison stimulus (cf. Müsseleret al., 1999, Exp. 5). The mislocalization was observed only whenboth stimuli were presented successively. Moreover, when the se-quence of stimulus presentations was reversed, results showedthat it was always the second stimulus, which was judged as themore inner stimulus. The temporal interval between stimuli wasvaried in Experiment 2. Most interestingly, the localization errorincreased in a first phase (up to the 250-ms SOA) and then de-creased in an adjacent phase leading to a reversion of the effect(with the 500- and 700-ms SOA). The results of Experiment 3 dem-onstrated that the mislocalization increased with small inter-stim-ulus distances.
The findings of the experiments ruled out the variability-by-eccentricity assumption according to which the mislocalizationemerged from the varying target eccentricities necessary to applythe method of constant stimuli. In all experiments the lower tar-get’s positions were always varying in eccentricity, what should re-sult in more inner judgments of the lower stimulus independentlyfrom the factorial variations in the experiments, but they were.
Instead, the dynamic trends in the data let us speculate that thelocalization error originated from locally working interactions ofexcitatory and inhibitory mechanisms. To specify this hypothesiswe applied a dynamic field model to the data, which is described
in the subsequent section. In particular we were interested tounderstand the reversal of the error with sufficiently large SOAs(Exp. 2) and then try to apply the model to the distance variation(Exp. 3).
It is worth to note that the model has been originally developedto explain nonlinear interaction effects observed in neural popula-tions of primary visual cortex (Jancke et al., 1999). Later, the modelwas extended to discuss potential neural correlates of systematicmisperceptions of the position of a moving object known as theFröhlich effect, the representational momentum and the flash-lagillusion (Erlhagen, 2003; Erlhagen & Jancke, 2004; Jancke &Erlhagen, 2008; see also Müsseler, Stork, & Kerzel, 2002).
6. A dynamic field model accounting for the localization error
The dynamic field model implements the idea that the informa-tion about the horizontal position is represented by the dynamicactivity pattern of local populations of interconnected spatiallytuned neurons. The population response is triggered by afferent in-put carrying the retinal information and shaped by interactionswithin the neural ensemble. Since the neurons split into an excit-atory and an inhibitory subpopulation, the evolving activity pat-tern in response to a brief input of adequate intensity is transientin nature (Wilson & Cowan, 1973). Recurrent excitatory interac-tions lead to a continuous increase of the activation level eventafter stimulus offset. The inhibitory population spatially integratesthis activity and feeds back locally to the excitatory population. Asa result, the population activity reaches a peak value when theexcitation is counterbalance by the inhibition, and then decaysback to resting level. The interactions depend on the functional dis-tance of the field elements, with excitatory coupling between neu-rons with similar preferred position and inhibition dominating forlarger distances. This functional circuitry, known as Mexican-hatorganization, guarantees that the transient population response re-mains localized in position space.
To account for the relative localization errors observed in theexperiments we made two main adjustments to the basic fieldmodel used in our previous work (for details of the mathematicalmodel see the Appendix). First, we adapted the time scale of theequations describing the population dynamics to reflect the exper-imentally observed temporal interaction effects, which span sev-eral hundred milliseconds (SOAs varying between 0 and 700-msin Exp. 2). A second modification concerns the spatial interactions.Fig. 5A depicts the Gaussian weight profiles for the integrationwithin the excitatory population (solid line) and for the integrationfrom the excitatory to the inhibitory population (dashed line) thatwe used for the model simulations. The profiles are not symmetric(e.g., reciprocal connections are not equal) but shifted to some ex-tent in the direction of the fovea. This means that a neuron tunedto position x� does not get its strongest input from the direct fieldneighbor but from a neuron with a preferred position (x-Dx)� closerto the fovea. As can be clearly seen in Fig. 5B, this bias causes thepopulation activity, u(x), to drift in the direction of the fovea. Themagnitude of the shift Dx determines the magnitude of the drift.This model parameter was calibrated to account for the systematicmislocalization of a stimulus flashed at 5� in the periphery. Asfound in absolute judgment tasks, the magnitude of the localiza-tion error is about 10% of targets’ eccentricity, thus estimating inour case 0.5� (van der Heijden et al., 1999b; van der Heijdenet al., 1999a).
The model explains the observed spatiotemporal interaction ef-fect as the result of an integration of sub-threshold activation in-duced by the vertically displaced stimuli. There is a large body ofexperimental evidence showing that stimuli presented outsidethe classical receptive field (the region of visual space in which
Fig. 4. Mean points of subjective equality (PSE) for the five vertical distancesbetween comparison stimulus and target. The solid line depicts PSE-values with100-ms SOA; squares represent PSE-values with the 0-ms SOA (Experiment 3,N = 14). The data points of the dashed line were obtained from the dynamic fieldmodel (see Section 5).
2208 D. Bocianski et al. / Vision Research 48 (2008) 2204–2212

Author's personal copy
stimuli evoke spike discharge) can facilitate or suppress supra-threshold responses of cells in visual cortex. Long-range horizontalconnections are thought to constitute a neural substrate forspreading sub-threshold activity (for a review see Fitzpatrick,2000). The potential impact on the perceptual level has beendirectly investigated in a recent experiment by Jancke, Chavane,Naaman, & Grinvald, 2004 in the context of the line-motionillusion. Applying sensitive dye optical imaging the authorsshowed that the spatiotemporal characteristic of sub-thresholdcortical activity is consistent with the striking observation thatnon-moving stimuli can give rise to motion perception.
In the model we represent the paradigm of Experiment 2 byassuming that the horizontal positions of the comparison stimulusand the target stimulus are represented by two distinct local poolsof neurons, P1 and P2, respectively. Each pool splits into an excit-atory subpopulation u and an inhibitory subpopulation v, that is,P1 = (u1,v1) and P2 = (u2,v2). As depicted in Fig. 6, the two poolsare bilaterally coupled through sub-threshold spatial integrationof activity (dashed lines). For simplicity we used scaled versionsof the weight profiles shown in Fig. 5A for modelling the long-range connections between the four populations. Their standarddeviations, rsub,u and rsub,v, determine the spatial extension ofthe horizontal spread of the sub-threshold activity. Excitation ismediated through direct connections whereas inhibitory input
comes through the inhibitory population that projects on the tar-get neurons. The sub-threshold inhibition induced by the secondstimulus thus appears to be delayed with respect to the sub-threshold excitation.
For the modelling we exploit the fact that there exits a thresh-old for triggering the self-stabilized population response of a localnetwork. Weak input will only lead to a pre-activation of the targetpopulation. As we shall show, this pre-shaping may have neverthe-less a significantly effect on the time course and the position of thesupra-threshold population response to an afferent input carryingretinal information.
To test our working hypothesis that the induced systematicchanges in position may explain the relative localization errorswe have to propose a mechanism how to read out the excitatorypopulation responses encoding position. By taking the peak posi-tion as a read-out value we make the simplifying assumption thatthe shape of the activity distribution does not matter for the per-ceptual performance. For other paradigms like for instance dis-crimination tasks in which multiple stimuli have to be encodedby a single population this assumption may not be justified. Ithas been suggested that in this case an interpretation of the popu-lation response as a probability distribution over stimulus spacemay constitute a better predictor (Pouget, Dayan, & Zemel, 2000).
Since the internal representation is dynamic in space and timean obvious questions concerns how to link the activity pattern tothe single, unambiguous answer in the position judgment task.One possibility is that the visual system attributes the percept froma kind of snapshot at the point in time when a fixed internal crite-rion (e.g., an activation threshold) is reached. An alternative viewpostulates that the position information is computed by averagingover positions occupied by the population response in a small timewindow after the event (Eagleman, 2001). Here an additional pro-cess translates the spatial smear of peak positions into a singlepercept.
A discussion of the plausibility and neural implementation ofdifferent read-out mechanisms goes beyond the scope of this arti-cle. It is important, however, to stress that both proposed mecha-nisms could be used for the modelling. Appropriate choices ofthe parameter Dx controlling the drift and/or the time windowfor the temporal averaging will predict values for the localizationjudgment that are comparable with the predictions based on thesnapshot mechanism.
Following our previous work we have chosen the peak positionas a reference value for a comparison with the perceptual findingsin the double stimulus paradigm. The internal criterion that
Fig. 6. Schematic view of the connectivity between the 4 subpopulations definingthe model. Solid lines indicate the connections between the excitatory and theinhibitory subpopulations representing the same stimulus, (u1,v1) and (u2,v2),respectively. An inhibitory neuron spatially integrates activity from excitatoryneurons (as indicated by the summation sign) but feeds back only locally to theneuron with the same tuning properties. The dashed lines represent the long-rangeconnections that mediate the integration of sub-threshold activity from anexcitatory subpopulation encoding the horizontal position of the second stimulus.
Fig. 5. (A) Gaussian weight profiles for the spatial integration of activity within theexcitatory population (solid line) and from the excitatory to the inhibitorypopulation (dashed line) are shown. The profiles are slightly shifted in the directionof the fovea. (B) The spatiotemporal evolution of the normalized response of theexcitatory population, u(x,t), to a briefly flashed afferent stimulus at x = 5� is shown.Note the drift of the peak position in the direction of the fixation point (x = 0�).
D. Bocianski et al. / Vision Research 48 (2008) 2204–2212 2209
Author's personal copy
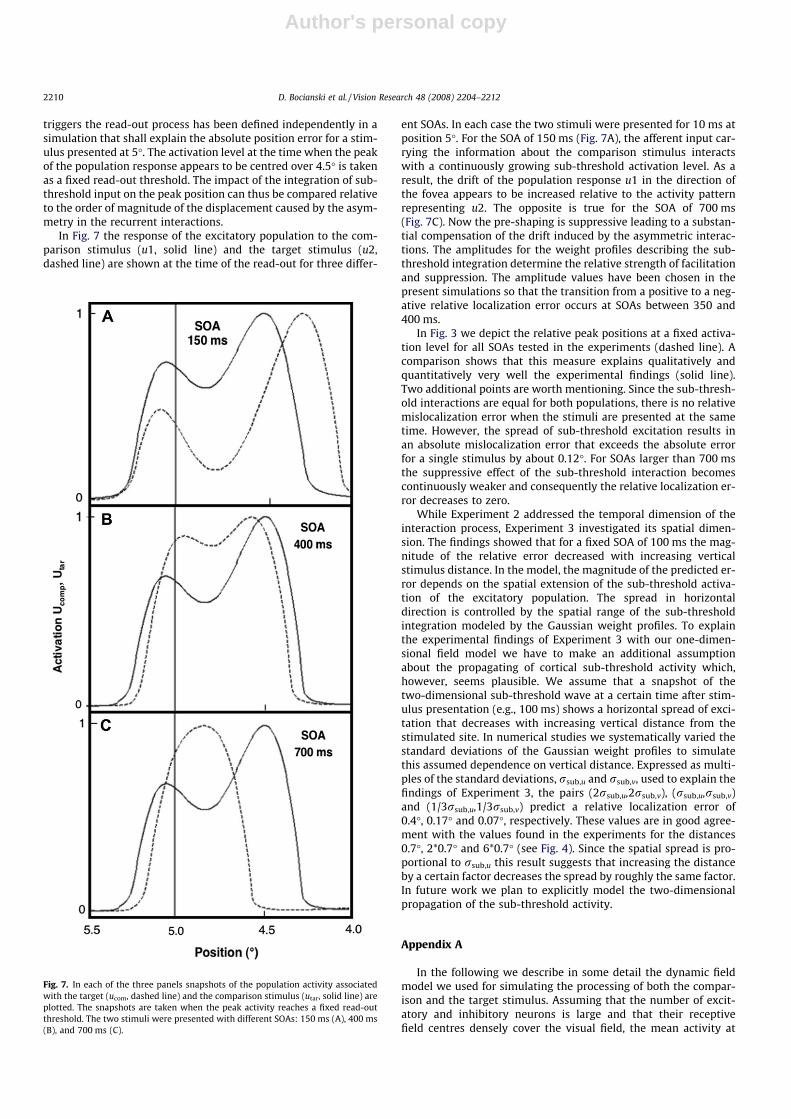
triggers the read-out process has been defined independently in asimulation that shall explain the absolute position error for a stim-ulus presented at 5�. The activation level at the time when the peakof the population response appears to be centred over 4.5� is takenas a fixed read-out threshold. The impact of the integration of sub-threshold input on the peak position can thus be compared relativeto the order of magnitude of the displacement caused by the asym-metry in the recurrent interactions.
In Fig. 7 the response of the excitatory population to the com-parison stimulus (u1, solid line) and the target stimulus (u2,dashed line) are shown at the time of the read-out for three differ-
ent SOAs. In each case the two stimuli were presented for 10 ms atposition 5�. For the SOA of 150 ms (Fig. 7A), the afferent input car-rying the information about the comparison stimulus interactswith a continuously growing sub-threshold activation level. As aresult, the drift of the population response u1 in the direction ofthe fovea appears to be increased relative to the activity patternrepresenting u2. The opposite is true for the SOA of 700 ms(Fig. 7C). Now the pre-shaping is suppressive leading to a substan-tial compensation of the drift induced by the asymmetric interac-tions. The amplitudes for the weight profiles describing the sub-threshold integration determine the relative strength of facilitationand suppression. The amplitude values have been chosen in thepresent simulations so that the transition from a positive to a neg-ative relative localization error occurs at SOAs between 350 and400 ms.
In Fig. 3 we depict the relative peak positions at a fixed activa-tion level for all SOAs tested in the experiments (dashed line). Acomparison shows that this measure explains qualitatively andquantitatively very well the experimental findings (solid line).Two additional points are worth mentioning. Since the sub-thresh-old interactions are equal for both populations, there is no relativemislocalization error when the stimuli are presented at the sametime. However, the spread of sub-threshold excitation results inan absolute mislocalization error that exceeds the absolute errorfor a single stimulus by about 0.12�. For SOAs larger than 700 msthe suppressive effect of the sub-threshold interaction becomescontinuously weaker and consequently the relative localization er-ror decreases to zero.
While Experiment 2 addressed the temporal dimension of theinteraction process, Experiment 3 investigated its spatial dimen-sion. The findings showed that for a fixed SOA of 100 ms the mag-nitude of the relative error decreased with increasing verticalstimulus distance. In the model, the magnitude of the predicted er-ror depends on the spatial extension of the sub-threshold activa-tion of the excitatory population. The spread in horizontaldirection is controlled by the spatial range of the sub-thresholdintegration modeled by the Gaussian weight profiles. To explainthe experimental findings of Experiment 3 with our one-dimen-sional field model we have to make an additional assumptionabout the propagating of cortical sub-threshold activity which,however, seems plausible. We assume that a snapshot of thetwo-dimensional sub-threshold wave at a certain time after stim-ulus presentation (e.g., 100 ms) shows a horizontal spread of exci-tation that decreases with increasing vertical distance from thestimulated site. In numerical studies we systematically varied thestandard deviations of the Gaussian weight profiles to simulatethis assumed dependence on vertical distance. Expressed as multi-ples of the standard deviations, rsub,u and rsub,v, used to explain thefindings of Experiment 3, the pairs (2rsub,u,2rsub,v), (rsub,u,rsub,v)and (1/3rsub,u,1/3rsub,v) predict a relative localization error of0.4�, 0.17� and 0.07�, respectively. These values are in good agree-ment with the values found in the experiments for the distances0.7�, 2*0.7� and 6*0.7� (see Fig. 4). Since the spatial spread is pro-portional to rsub,u this result suggests that increasing the distanceby a certain factor decreases the spread by roughly the same factor.In future work we plan to explicitly model the two-dimensionalpropagation of the sub-threshold activity.
Appendix A
In the following we describe in some detail the dynamic fieldmodel we used for simulating the processing of both the compar-ison and the target stimulus. Assuming that the number of excit-atory and inhibitory neurons is large and that their receptivefield centres densely cover the visual field, the mean activity at
Fig. 7. In each of the three panels snapshots of the population activity associatedwith the target (ucom, dashed line) and the comparison stimulus (utar, solid line) areplotted. The snapshots are taken when the peak activity reaches a fixed read-outthreshold. The two stimuli were presented with different SOAs: 150 ms (A), 400 ms(B), and 700 ms (C).
2210 D. Bocianski et al. / Vision Research 48 (2008) 2204–2212

Author's personal copy
time t of an excitatory neuron and an inhibitory neuron tuned tohorizontal position x can be described by two continuous functionsu(x,t) and v(x,t), respectively. To model the dynamics of the neuralpopulations we use the model class of neural fields first introducedand analyzed by Wilson and Cowan (1973). Neural field models aresystem-level models, which are adequate to describe the meanactivity of large populations of neurons without referring to the de-tailed level of physiological realism. The temporal evolution of theactivation variables (u1, v1) and (u2, v2) describing the four sub-populations is governed by the following system of coupled differ-ential equations:
s ddt
u1ðx; tÞ ¼ �u1ðx; tÞ þ hþ S1ðx; tÞ þ Subex;u2ðx; tÞ þ gðu1ðx; tÞÞZwuuðx� x0Þf ðu1ðx0; tÞÞdx0 � v1ðx; tÞ
� �
s ddt
v1ðx; tÞ ¼ �v1ðx; tÞ þ Subin;u2ðx; tÞ þZ
wuvðx� x0Þf ðu1ðx0; tÞÞdx0
s ddt
u2ðx; tÞ ¼ �u2ðx; tÞ þ hþ S2ðx; tÞ þ Subex;u1ðx; tÞ þ gðu2ðx; tÞÞZwuuðx� x0Þf ðu2ðx0; tÞÞdx0 � v2ðx; tÞ
� �
s ddt
v2ðx; tÞ ¼ �v2ðx; tÞ þ Subin;u1ðx; tÞ þZ
wuvðx� x0Þf ðu2ðx0; tÞÞdx0
The parameter s > 0 is used to adjust the time scale of the fielddynamics to the experimentally observed time scale. The constanth defines the resting level to which the population activity relaxeswithout external input. The integral terms describe the spatial sum-mation of excitation in the two layers. The spatial interactions falloff with increasing distance between field sites:
Wuiðx� x0Þ ¼ Aiexp �ðx� x0Þ2
2r2i
!; ði ¼ u; vÞ ðA:1Þ
where the choice of the relative amplitudes and spatial ranges,Au > Av and ru < rv, implements the Mexican-hat pattern. Theweight profiles are shifted in ‘‘foveal” direction (see Fig. 5A) by anamount Dx which is chosen in the present simulations as 10% of rv.
Only sufficiently activated neurons contribute to the interac-tion. The nonlinear activation function f(u) is taken as a monotonicfunction of sigmoid shape going from 0 to 1:
f ðuÞ ¼ 11þ expð�bðu� uf ÞÞ
ðA:2Þ
The parameter uf determines the position of the maximum slope ofthe function f, and b controls the value of the maximum slope. Theshunting function g(u) which is also of sigmoidal type (with param-eters ug and b) does not play a functional role for the present appli-cation (but see Jancke et al., in press, for a discussion). The briefafferent inputs, S1(x,t) and S2(x,t), to the excitatory populationsare modelled as Gaussian profiles with space constant rs and ampli-tude AS. The inputs were presented for 10 ms in all modelsimulations.
The terms
Subex;uiðx; tÞ ¼Z
wsub;uðx—x0Þf ðuiðx0; tÞÞdx0 and
Subin;uiðx; tÞ ¼Z
wsub;vðx—x0Þf ðuiðx0; tÞÞdx0; i ¼ 1;2;
describe the summed sub-threshold input from the second excit-atory population. The weight functions wsub,u(x,x0) and wsub,v(x,x0)are Gaussians with amplitudes Asub,u, Asub,v and space constantsrsub,u, rsub,v, respectively. The amplitude values are adjusted toguarantee that this input alone does not trigger a supra-thresholdpopulation response.
For the model simulations a forward Euler integration schemewas used with a time step of 0.001 s, the fields consisted of 200 ele-ments (spatial resolution:10 elements = 0.1�). The numerical val-ues for the model parameters describing the field interactionswere within the range used in our previous work; they guaranteethe existence of the localized transient activity pattern:ru = 0.15�, rv = 0.25�, Au = 4.65, Au = 3.2, b = 1, uf = ug = 0, h = �3.
The time scale of the field dynamics was s = 125 ms, the param-eters for the afferent input were rs = 0.15� and As = 40, and the val-ues describing the sub-threshold inputs were: Asub,u = 0.062,Asub,v = 0.376, rsub,u = 0.15�, rsub,u = 0.25�.
References
Awater, H., & Lappe, M. (2006). Mislocalization of perceived saccade target positioninduced by perisaccadic visual stimulation. Journal of Neuroscience, 26(1),12–20.
Berry, M. J., Brivanlou, I. H., Jordan, T. A., & Meister, M. (1999). Anticipation ofmoving stimuli by the retina. Nature, 398, 334–338.
Brainard, D. H. (1997). The psychophysics toolbox. Spatial Vision, 10, 433–436.Brenner, E., Smeets, J. B. J., & van den Berg, A. V. (2001). Smooth eye movements and
spatial localization. Vision Research, 41, 2253–2259.Eagleman, D. M. (2001). Visual illusions and neurobiology. Nature Reviews, 2,
920–926.Erlhagen, W. (2003). Internal models for visual perception. Biological Cybernetics, 88,
409–417.Erlhagen, W., & Jancke, D. (2004). The role of action plans and other cognitive
factors in motion extrapolation: A modelling study. Visual Cognition, 11(2/3),315–340.
Fahle, M. (1991). Psychophysical measurements of eye drifts and tremor bydichoptic or monocular vernier acuity. Vision Research, 31, 209–222.
Findlay, J. M. (1974). Direction perception and human fixation eye movements.Vision Research, 14, 703–711.
Fitzpatrick, D. (2000). Seeing beyond the receptive field in primary visual cortex.Current Opinion in Neurobiology, 10, 438–443.
Foley, J. M. (1976). Successive stereo and vernier position discrimination as afunction of dark interval. Vision Research, 16, 1269–1273.
Hagenaar, R., & van der Heijden, A. H. C. (1997). On the relation between type ofarrays and type of errors in partial-report bar-probe studies. Acta Psychologica,88, 89–104.
Huynh, H., & Feldt, L. S. (1980). Performance of traditional F-test in repeatedmeasure designs under covariance heterogeneity. Communication in Statistics:Theory and Methods, A9, 61–74.
Jancke, D., & Erlhagen, W. (in press), Bridging the gap: A model of common neuralmechanisms underlying the Fröhlich effect, the flash-lag effect, and therepresentational momentum effect. In R. Nijhawan & B. Khurana (eds.), Spaceand time in perception and action. Cambridge, UK: Cambridge University Press.
Jancke, D., Chavane, F., Naaman, S., & Grinvald, A. (2004). Imaging correlates ofvisual illusion in early visual cortex. Nature, 428, 423–426.
Jancke, D., Erlhagen, W., Dinse, H. R., Akhavan, A. C., Giese, M., Steinhage, A., et al.(1999). Parametric population representation of retinal location: Neuronalinteraction dynamics in cat primary visual cortex. Journal of Neuroscience, 19,9016–9028.
Kerzel, D. (2002). Memory for the position of stationary objects: Disentanglingfoveal bias and memory averaging. Vision Research, 42(2), 159–167.
Kirschfeld, K., & Kammer, T. (1999). The Fröhlich effect: A consequence of theinteraction of visual focal attention and metacontrast. Vision Research, 39(22),3702–3709.
Klein, R. M. (2000). Inhibition of return. Trends in Cognitive Sciences, 4(4), 138–147.Matin, L., Pola, J., Matin, E., & Picoult, E. (1981). Vernier discrimination with
sequentially flashed lines: Roles of eye movements retinal offsets and short-term memory. Vision Research, 21, 556–647.
Müsseler, J., & Aschersleben, G. (1998). Localising the first position of a movingstimulus: The Fröhlich Effect and an attention-shifting explanation. Perception& Psychophysics, 60, 683–695.
Müsseler, J., Stork, S., & Kerzel, D. (2002). Comparing mislocalizations in movementdirection: The Fröhlich effect, the flash-lag effect and the representationalmomentum. Visual Cognition, 9, 120–138.
Müsseler, J., & van der Heijden, A. H. C. (2004). Two spatial maps contributing toperceived space: Evidence from a relative mislocalization. Visual Cognition,11(2/3), 235–254.
Müsseler, J., van der Heijden, A. H. C., Mahmud, S. H., Deubel, H., & Ertsey, S. (1999).Relative mislocalization of briefly presented stimuli in the retinal periphery.Perception & Psychophysics, 61(8), 1646–1661.
O’Regan, J. K. (1984). Retinal versus extraretinal influences in flash localizationduring saccadic eye movements in the presence of a visible background.Perception and Psychophysics, 36, 1–14.
Pelli, D. G. (1997). The VideoToolbox software for visual psychophysics:Transforming numbers into movies. Spatial Vision, 10, 437–442.
Posner, I. M., & Cohen, Y. (1984). Components of visual orienting. In H. Bouma & D.G. Bouwhuis (Eds.), Attention and performance X (pp. 531–556). Hillsdale, NJ:Lawrence Erlbaum.
D. Bocianski et al. / Vision Research 48 (2008) 2204–2212 2211

Author's personal copy
Pouget, A., Dayan, P., & Zemel, R. (2000). Information processing with populationcodes. Nature Reviews, 1, 125–132.
Rotman, G., Brenner, E., & Smeets, J. B. J. (2005). Flashes are localized as if they weremoving with the eyes. Vision Research, 45, 355–364.
Sheth, B. R., & Shimojo, S. (2001). Compression of space in visual memory. VisionResearch, 41(3), 329–341.
Uddin, M. K., Kawabe, T., & Nakamizo, S. (2005). Differential roles of distracters inreflexive and memory-based localization. Spatial Vision, 18, 579–592.
van der Heijden, A. H. C., Müsseler, J., & Bridgeman, B. (1999a). On the perception ofposition. In G. Aschersleben, T. Bachmann, & J. Müsseler (Eds.), Cognitivecontribution to the perception of spatial and temporal events (pp. 19–38). North-Holland: Elsevier.
van der Heijden, A. H. C., van der Geest, J. N., De Leeuw, F., Krikke, K., & Müsseler, J.(1999b). Sources of position-perception error for small isolated targets.Psychological Research, 62, 20–35.
Wichmann, F. A., & Hill, N. J. (2001a). The psychometric function: I.Fitting, sampling, and goodness of fit. Perception & Psychophysics, 63,1293–1313.
Wichmann, F. A., & Hill, N. J. (2001b). The psychometric function: II. Bootstrap-based confidence intervals and sampling.. Perception & Psychophysics, 63,1314–1329.
Wilson, H. R., & Cowan, J. D. (1973). A mathematical theory of the functionaldynamics of cortical and thalamic nervous tissue. Kybernetik (BiologicalCybernetics), 13, 55–80.
2212 D. Bocianski et al. / Vision Research 48 (2008) 2204–2212