Envy and jealousy as discrete emotions: A taxometric analysis
Upload
khangminh22Category
view
3download
0
EMBODIED CAPITAL, ENVY, AND RELATIVE DEPRIVATION
A Thesis
Submitted to the Faculty of Graduate Studies and Research
In Partial Fulfillment of the Requirements
For the Degree of
Master of Arts
in
Experimental and Applied Psychology
University of Regina
By
Dallas Robert Novakowski
Regina, Saskatchewan
August, 2017
Copyright 2017: D. Novakowski

UNIVERSITY OF REGINA
FACULTY OF GRADUATE STUDIES AND RESEARCH
SUPERVISORY AND EXAMINING COMMITTEE
Dallas Robert Novakowski, candidate for the degree of Master of Arts in Experimental & Applied Psychology, has presented a thesis titled, Embodied Capital, Envy, and Relative Deprivation, in an oral examination held on August 28, 2017. The following committee members have found the thesis acceptable in form and content, and that the candidate demonstrated satisfactory knowledge of the subject material. External Examiner: *Dr. Daniel Krupp, Queen’s University
Co-Supervisor: Dr. Sandeep Mishra, Faculty of Business Adminisstration
Co-Supervisor: **Dr. Nicholas Carleton, Department of Psychology
Committee Member: Dr. Thomas Phenix, Department of Psychology
Chair of Defense: Dr. Ronald Camp, Kenneth Levene Graduate School *via SKYPE **Not present at defense
i
Abstract
Inequality causes feelings of relative deprivation and envy. Inequality has almost
exclusively been examined as an environmental variable, characterized by skewed
distribution of resources; however, inequality can also manifest through individual
differences in traits such as intelligence, strength, and attractiveness. These innate
qualities aid in successful social competition and are collectively referred to as embodied
capital. Mishra, Barclay, and Sparks (2017) posit that both environmental and embodied
factors influence an individual’s relative state – their assessment of their competitive
(dis)advantage. This study examined whether low embodied capital is associated with
feelings of relative deprivation and envy. Participants (n = 198) attending a lab session
completed several self-report measures indicating feelings of personal relative
deprivation and envy, as well as self-perceptions of embodied capital and self-efficacy.
Additionally, participants had their strength, intelligence, body fat percentage, muscle
percentage, coordination, and height assessed through objective measurements. The
results indicate that objective and subjective indices of embodied capital are
intermittently significant predictors of feelings of envy and personal relative deprivation.
Moreover, the effects of objective and perceived embodied capital generally lost their
significance once measures of self-efficacy were introduced to predictive models. In
summary, the results of this study indicate a significant impact of embodied capital on
feelings of disadvantage, with a substantial portion of this effect being subsumed under
self-efficacy. Future research on inequality, competition, and feelings of disadvantage
will likely benefit from considerations of individuals’ embodied capital and the
psychology of relative state more broadly.

ii
Table of Contents
Abstract................................................................................................................................i
Table of Contents.................................................................................................................ii
List of Appendices...............................................................................................................v
1.0 Literature Review...........................................................................................................1
1.1 Relative Deprivation Theory.....................................................................................2
1.2 Envy..........................................................................................................................4
1.3 Relative Deprivation and Envy as Social Comparison Reactions............................7
1.4 Importance of Relative Position................................................................................9
1.4.1 Relative State Model.......................................................................................11
1.4.2 Proximate Mechanisms Leading from Competitive Disadvantage................12
1.5 Sensitivity to Competitive Ability..........................................................................15
1.5.1 Sensitivity to Embodied Capital in Humans...................................................14
1.6 Hypotheses..............................................................................................................19
2.0 Methods........................................................................................................................21
2.1 Measures.................................................................................................................21
2.1.1 Demographic Measures..................................................................................21
2.1.2 Personal Relative Deprivation……................................................................21
2.1.3 Dispositional Envy Scale................................................................................22
2.1.4 Domain-Specific Envy Scale..........................................................................22
2.1.5 Benign and Malicious Envy Scale..................................................................23
2.1.6 Objective Measures of Embodied Capital......................................................23
2.1.7 Subjective Embodied Capital.........................................................................25
iii
2.1.8 Self-Efficacy...................................................................................................27
2.2 Procedure................................................................................................................28
2.3 Variable construction..............................................................................................29
3.0 Results..........................................................................................................................31
3.1 Partial correlations..................................................................................................31
3.2 Hierarchical regression analyses….........................................................................35
4.0 Discussion....................................................................................................................38
4.1 Correlations across objective measures of embodied capital.................................40
4.2 Correlations between subjective embodied capital and self-efficacy.....................42
4.3 Hierarchical Multiple Regressions..........................................................................43
4.3.1 Objective indices of embodied capital............................................................43
4.3.2 Subjective embodied capital...........................................................................48
4.3.3 Self-Efficacy...................................................................................................52
4.3.3.1 General self-efficacy. .............................................................................53
4.3.3.2 Perceived physical ability and social self-efficacy.................................54
4.3.3.3 Physical Self-presentation confidence....................................................56
4.3.3.4 Self-efficacy summary............................................................................59
4.4 Disposition or Repeated Situational Evocation? ..........................................62
4.4 Potential Moderators...............................................................................................63
4.5 Test of the Relative State Model.............................................................................65
4.6 Future Directions ...................................................................................................67
6.0 Conclusion...................................................................................................................70
References..........................................................................................................................72

iv
Appendices.........................................................................................................................89
Tables and Figures...........................................................................................................127

v
List of Appendices
Appendix A. Demographics...............................................................................................89
Appendix B. Peg Task.......................................................................................................91
Appendix C. Hand grip strength........................................................................................92
Appendix D. Verbal intelligence.......................................................................................93
Appendix E. Omron Fat Loss Monitor HBF 306C............................................................94
Appendix F. Ozeri Touch 440lbs Total Body Bath Scale ................................................95
Appendix G. Self-Perceived Embodied Capital Scale.......................................................96
Appendix H. Self-Attributes Questionnaire.......................................................................98
Appendix I. Personal Relative Deprivation Scale-Revised...............................................99
Appendix J. Dispositional Envy Scale.............................................................................100
Appendix K. Benign and Malicious Envy Scale ............................................................101
Appendix L. Domain-Specific Envy Scale......................................................................102
Appendix M. New General Self-Efficacy Scale..............................................................103
Appendix N. Physical Self-Efficacy Scale .....................................................................104
Appendix O. Scale of Perceived Social Self-Efficacy.....................................................105
Appendix P. Consent form...............................................................................................106
Appendix Q. Debriefing form..........................................................................................108
Appendix R. Procedure....................................................................................................109
Appendix Q. Ethics Materials..........................................................................................113

1
1.0 Literature Review
The consequences of envy and personal relative deprivation are nearly uniformly
negative. The costs imposed by such feelings on individuals, organizations, and societies
suggest that we must understand their underlying causal mechanisms. Envy and feelings
of personal relative deprivation can most accurately be described as responses to
victimization by inequality. Inequality has historically been defined as a skewed
distribution of desired outcomes or resources such as money, prestige, or romantic
partners; however, inequality can manifest in forms beyond these extrinsic outcomes.
Humans differ significantly in traits and abilities that facilitate effective social
competition; for example, there is inequality in who is smart, strong, attractive, and
charming. Traits and abilities influencing successful social competition, referred to as
embodied capital, are important predictors of who will gain access to contested outcomes
and resources (Bourdieu, 2011; Kaplan, 1996; Kaplan & Gangestad, 2005; Kaplan,
Gurven, & Winking, 2009; Lalumière, Harris, Quinsey, & Rice, 2005; von Rueden,
Lukaszewski, & Gurven, 2015). Given the importance of embodied capital in attaining
envy-inducing outcomes, social comparisons should be attuned to one’s own competitive
ability relative to others. The current study will test the hypothesis that individuals with
low embodied capital will experience more envy and relative deprivation.
Research evidence to date suggests humans generally have adverse reactions to
perceived victimization by inequality. Individuals are more likely to report lower life
satisfaction if they made less money than their co-workers (Frank, 1999). Half of
individuals prefer less purchasing power in order to have more money relative to peers
(Solnick & Hemenway, 1998). Experimental evidence also demonstrates that victims of

2
inequality engage in more gambling and spiteful behaviours (Callan, Ellard, Shead, &
Hodgins, 2008; Mishra, Son Hing, & Lalumière, 2015; Wobker, 2015). Even children
resort to spiteful behaviours when they are worse off than their peers (Steinbeis & Singer,
2013).
1.1 Relative Deprivation Theory
Relative deprivation theory (Stouffer et al., 1949) is a key framework for
describing and predicting how people react to inequality and disadvantage. An experience
of relative deprivation has three steps. First, an individual makes a comparison (to either
their past/future state, other individuals, or other groups). Second, the individual in
question to perceives that they are at a disadvantage. Third, the perceived disadvantage is
viewed as unfair, leading to angry resentment (Smith, Pettigrew, Pippin, & Bialoseiwicz,
2012). Relative deprivation theory has challenged the conventional wisdom that absolute
deprivation (i.e., poverty) is of prime importance for understanding social functioning.
Relative deprivation was conceived as a post-hoc explanation for anomalies in
soldier behaviours and preferences during World War II. For example, researchers found
evidence that Military Police were more satisfied despite their slow promotions than Air
Corpsmen were with their rapid promotions (Stouffer et al., 1949). The researchers
speculated the discrepancy was due to the immediacy of comparisons; specifically,
Military Police were satisfied with their promotion speed because Military Police
members compared within their own ranks, instead of making comparisons with the Air
Corpsmen whom the Military Police rarely encountered. The dissatisfaction of
objectively privileged individuals reveals that relative deprivation is a subjective, not
objective, experience. Satisfaction can be relative to available and salient comparisons;

3
even individuals in the highest ranks of society can experience relative deprivation
depending on their reference groups (Smith et al., 2012).
Attributions of deservingness are also central to the experience of relative
deprivation. Deservingness is based on a balance principle: positive actions deserve
positive results and negative actions deserve negative results (Feather, 1999).
Reminiscent of equity theory (Adams, 1965), a discrepancy between an individual’s
actions and their outcomes is interpreted as undeserved (e.g., someone’s payment not
adequately compensating their time and effort). Overall, perceptions of deservingness are
inversely associated with anger, resentment, and schadenfreude – the feeling of pleasure
at someone else’s expense (reviewed in Feather, 2006, 2015).
Judgments of deservingness are heavily informed by the perception of control;
thus, attributions of control are central to relative deprivation theory. Crosby (1976)
asserted that feelings of relative deprivation can only occur when the individual does not
blame him/herself for their undesirable position. However, Beshai, Mishra, Meadows,
Parmar, and Huang (2017) found that the relationship between feelings of personal
relative deprivation and depressive symptoms were fully mediated by automatic negative
thoughts about the self. These results indicate that individuals who feel personal relative
deprivation can attribute their disadvantage to personal shortcomings, rather than solely
blaming external forces, contradicting Crosby’s (1976) assertion. Since its conception,
relative deprivation theory has been, and continues to be, expanded.
Runciman (1966) posited that relative deprivation can be experienced both as an
individual and as a member of a social group. The distinction between personal and
group-level relative deprivation produced two lines of research: 1) how individual-level

4
relative deprivation is associated to internal states (e.g., stress, depression, health) and
individual behaviour (e.g., absenteeism, bullying, drug use); and 2) how group-level
relative deprivation is linked to intergroup attitudes (e.g., stereotyping, nationalism, in-
group identification) and collective behaviours (e.g., approving violent politics, signing
petitions, joining strikes; Smith et al., 2012). The effects of relative deprivation can be
pervasive. Group relative deprivation has been associated with racist voting behaviours in
the United States (Vanneman & Pettigrew, 1972) and prejudice against individuals
immigrating into Europe (Pettigrew et al. 2008; Pettigrew & Meertens, 1995). Individual
feelings of relative deprivation have also been associated with poorer mental and physical
health, stress, a widespread pattern of risk-acceptance, lower reported conscientiousness,
extraversion, agreeableness, emotional stability, honesty/humility, self-control, and
higher impulsivity and sensation-seeking (Callan, Kim, & Matthews, 2015b; Mishra &
Carleton, 2015; Mishra & Novakowski, 2015; Novakowski & Mishra, under review).
Relative deprivation has predicted other social psychological outcomes such as social
protest, prejudice, and delinquency (Smith et al., 2012).
1.2 Envy
Relative deprivation has substantial convergence with theoretical work
surrounding envy. Envy is broadly defined as a painful feeling of inferiority, hostility,
and resentment when another person or group has a desired advantage (reviewed in Smith
& Kim, 2007). Envy is an unpleasant experience, being associated with neural activation
of the anterior cingulated cortex, which processes cognitive conflict and social pain
(Eisenberger, Lieberman, & Williams, 2003; Kerns et al., 2004; Singer et al., 2004).

5
Until recently, envy has been formally studied as a unitary construct, known as
envy proper. However, the unitary conceptualization of envy cannot account for instances
where envious individuals do not experience hostility, and are instead motivated to
improve their own standing (e.g., van de Ven, 2017). A dual pathway model of envy has
largely resolved these issues surrounding envy proper; malicious and benign envy
describe two diverse ways in which people react to their feelings of envy. Benign and
malicious envy are both rated as highly unpleasant experiences (van de Ven, Zeelenberg,
& Pieters, 2009), but can be distinguished by underlying motivational and affective
tendencies. Malicious envy includes hostility towards the envied individual and action
tendencies designed to damage their position. Benign envy consists of positive regard for
the advantaged individual and attempts to improve one’s own position. Lange and
Crusius (2015) have found that envy proper is strongly positively correlated with
dispositional malicious envy, but has no relationship with dispositional benign envy.
These results suggest that what has been traditionally studied as envy proper
approximates malicious envy more so than benign envy, with benign envy being a
relatively novel reaction to disadvantage.
Deservingness plays a key role in distinguishing malicious from benign envy.
Malicious envy is more likely to occur in situations where the advantaged person’s
position is perceived as undeserved; conversely, benign envy is more likely to occur
when the advantaged person’s position is perceived as highly deserved. Perceptions that
one has control over their disadvantage can also lead to more benign envy, but only when
the envied person’s advantage is deserved (van de Ven, Zeelenberg, & Pieters, 2012).
Malicious and benign envy can also be distinguished from resentment and admiration,

6
two other social comparison reactions. Malicious envy is produced by perceptions of an
unfair environment, whereas resentment is elicited when unfairness is the product of an
individual’s willful behavior (van de Ven et al., 2012). Admiration, as opposed to benign
envy, occurs when a social comparison does not reflect poorly on the observer. Benign
envy can be further distinguished from admiration by a sense of control; individuals are
more likely to feel benign envy than admiration when they feel they can control their
situation (van de Ven et al., 2012). The extant evidence is suggestive that benign and
malicious envy are distinct constructs from each other as well as other social comparison
reactions.
Envy, like relative deprivation, is associated with a wide range of outcomes. Envy
proper has been associated with spiteful behaviours (Wobker, 2015) and deviant
workplace behaviours (Kim, Jung, & Lee, 2013). Malicious envy has been associated
with less cooperation (Parks, Rumble, & Posey, 2002), greater fear of failing, avoidance
in goal-setting (Lange & Crusius, 2015), an attentional bias towards an envied person
rather than an envied object (Crusius & Lange, 2014), an intention to harm an envied
individual (van de Ven et al., 2012), and avoidance of normative envy-inducing
consumer products (van de Ven, Zeelenberg, & Pieters, 2011a). Benign envy is
associated with greater hope for success, more ambitious goal-setting (Lange & Crusius,
2015), an attentional bias towards means to improve (Crusius & Lange, 2014), increased
persistence and performance (van de Ven, Zeelenberg, & Pieters, 2011b), and an
increased willingness to pay for envy-inducing consumer products (van de Ven et al.,
2011b). The extant research suggests that envy has a substantial influence on individual
outcomes.

7
1.3 Relative Deprivation and Envy as Social Comparison Reactions
Relative deprivation and envy come from very different fields. Relative
deprivation was originally conceived as a sociological construct, whereas envy was
conceived as a purely psychological construct. The segregation of psychology and
sociology has resulted in the absence of investigations testing the overlap between envy
and personal relative deprivation. Envy is seldom discussed as a factor influencing
societal outcomes and there has not been an investigation concerning the psychological
mechanisms of relative deprivation. Envy and relative deprivation have another key
conceptual difference in that envy appears to have distinct malicious and benign forms,
while relative deprivation has only been considered as a unitary construct (Crusius &
Lange, 2015; Smith et al. 2012; van de Ven et al., 2009). The role of deservingness is
also different for envy and relative deprivation. Relative deprivation must derive from
perceptions of unfairness (Smith et al., 2012). Envy proper might not require perceptions
of undeservingness, but instead motivate individuals to fabricate or exaggerate evidence
of unfairness to justify their envy to themselves and, more importantly, to third party
observers (Smith & Kim, 2007). A perception of another’s deservingness is a positive
predictor of benign envy, but a negative predictor of malicious envy (van de Ven et al.,
2009). No empirical work exists testing whether feelings of relative deprivation are
associated with any form of envy, but relative deprivation may be analogous to envy
proper or malicious envy.
Despite differences in origins, number of factors, and the role of deservingness,
feelings of individual relative deprivation and envy both appear to be important social
comparison- and justice-related reactions. No study to date has tested the overlap or
8
distinctiveness of these two constructs. At their core, feelings of proper, benign, and
malicious envy and relative deprivation are all reactions to perceived disadvantage: when
people perceive that they are worse off than others, negative emotions ensue and they
attempt to reduce the inequality. For instance, both envy and relative deprivation have
been associated with schadenfreude (e.g., Feather, 2015; Smith et al., 1996). Relative
deprivation and envy are both associated with outcomes such as poorer health, risk-
taking, and deviance (Callan et al., 2008; Callan et al., 2015b; Kim et al., 2013; Mishra &
Carleton, 2015; Mishra & Novakowski, 2016). Crucially, societal inequality is also
associated with these outcomes (reviewed by Wilkinson & Pickett, 2006, 2007, 2009).
Sensitivity to relative disadvantage reflects the positional bias: the tendency to
judge success by making comparisons to others (Hill & Buss, 2006). When trying to
maximize one’s relative position, there are two ways to be more “successful”: 1) improve
one’s own standing; or 2) degrade the standing of others. People tend to envy others who
are better off than themselves, and envious individuals are more likely to pay a cost if the
spiteful strategy causes more damage to the envied person (Wobker, 2015). Furthermore,
schaudenfreude, pleasure at someone else’s failure, is experienced more when the
individual suffering a failure is/was envied for being higher in achievement or status
(Smith et al., 1996). The positional bias is unexpected given rational choice models of
behaviour; specifically, why would someone be so affected by relative disadvantage that
they would make more risky decisions, be more spiteful, and experience poorer health?
Objectively, the utility of someone’s possessions should be unaffected by what peers
possess; enjoyment of a $60,000 car should be unaffected by a neighbor having a

9
$100,000 car. The functional basis for relative deprivation and envy, and the positional
bias more broadly are detailed below.
1.4 Importance of Relative Position
Concerns about relative position are intimately tied to competition, which
describes any instance where “one party’s possession or use of a mutually desired
resource precludes the other party’s possession or use of the same” (Daly & Wilson,
1988, p. 83). Competition is ubiquitous throughout the animal kingdom. Individuals
compete for limited access to sexual partners, resources, territory, and positions of high
social standing. Regardless of domain, obtaining desired goods is dependent on the
environment (e.g., whether desired goods are scarce or plentiful) and an individual’s
ability to acquire resources compared to rivals (Milinski & Parker, 1991). Some have
argued that competitive tendencies in humans are due to psychopathology and political
structures such as capitalism (e.g., Bhurga, 1993); however, several studies suggest the
motivation to outperform others is an evolved psychological design that helps meet goals
in competitive environments (reviewed in Hill & Buss, 2006).
A central tenet of evolutionary theory is that present-day behaviours exist because
those behaviors historically enhanced, or at least did not hinder, an organism’s ability to
survive and/or reproduce (Cosmides & Tooby, 2000). Outcompeting opponents for
resources is a critical predictor of fitness in the animal kingdom. Male elephant seals, for
example, fight to gain access to harems of females. Successful males become part of the
four percent of breeding-age males responsible for 90% of that season’s offspring (Le
Boeuf, 1974). As such, successful competitors pass more of their genes onto future
generations, meaning that fitness must be considered relative to competitors (Hamilton,

10
1964). In competitive environments, organisms that fail to notice or counter their own
disadvantage (i.e., those that lack a positional bias) should be less likely to have their
genes spread across future generations (Garay & Móri, 2011). For example, during times
of famine in human society, there is always some quantity of food; however, Sen (1981)
argues that those who have the largest relative wealth holdings outcompete others for
food. Even in a contemporary society, relative position can be a matter of survival.
The importance of relative position highlights the tension between conflict and
cooperation in social species. Helping someone else (e.g., sharing food) can improve the
other individual’s chances of producing viable offspring. Since other organisms (apart
from identical twins) increase the frequency of competing alleles in the population,
helping other people can decrease the relative representation of one’s own genes.
However, social behaviour must be considered with its direct and indirect fitness
consequences to the actor (Hamilton, 1964). Direct fitness refers to the actor’s immediate
gain or loss in reproduction (e.g., reciprocal cooperation). Indirect fitness refers to the
reproduction of alleles identical to the actors’, but with these identical alleles being
present within individuals other than the actor or the actor’s descendants (e.g.,
reproductive success of a sibling). The importance of indirect fitness can be best
exemplified by altruism, whereby the actor incurs a cost for the benefit of the recipient.
Altruistic acts, such as saving another from a physical threat, can reduce the agent’s
personal fitness (i.e., number of viable offspring for the agent). However, inclusive
fitness theory posits that by selectively targeting altruism towards genetically related
individuals (i.e., kin), agents can (in certain environments) propagate shared altruistic
genes (Hamilton, 1963). In summary, cooperative behaviours (and indeed any social

11
action) should be favored when “the sum of its direct and indirect fitness consequences
are greater than the mean population fitness” (Krupp, DeBruine, Jones, 2011; reviewed in
Lehmann & Keller, 2006). The fitness consequences of social behaviours are thus
determined by factors such as resource scarcity, genetic relatedness, mobility of agents,
and likelihood of reciprocation. These factors should in turn influence the costs of
benefits of competing or cooperating with other individuals.
The implications of inclusive fitness theory must be considered carefully.
Although kin members are overall more genetically related than non-kin, relatedness does
not ensure cooperative and mutualistic interactions among related individuals. Consider
siblings: an agent carries 100% of their own genes, whereas a sibling will carry
approximately 50% of the agent’s genes. Although a sibling will generally be more likely
to carry the agent’s alleles than the rest of the population, contested resources in shared
developmental environments force siblings into conflict (as an agent’s fitness will be
most increased if they, instead of their sibling, survive and attain reproductive success).
Although sibling presence can aid in food collection and territorial defense in later life
stages, contested access to resources necessary for growth and survival can lead to
begging behaviours, aggression, and even fratricide across taxa (reviewed in Hudson &
Trillmich, 2007).
1.4.1 Relative State Model
The relative state model is the only existing framework of decision-making that
incorporates environmental and ability-based factors with relative position (Mishra,
Barclay, & Sparks, 2017). The relative state model focuses on risk-taking behaviour;
however, the model suggests that both situational and individual-level factors interact to

12
produce a perception of one’s own relative state, which is the broad assessment of
competitive advantage or disadvantage relative to others in the environment.
The relative state model posits that individuals who are disadvantaged will seek to
take risks in accordance with risk-sensitivity theory. Specifically, if organisms cannot
meet a goal through reliable strategies (a condition of need), they will resort to risky
behaviours that are more variable in their outcome (e.g., choosing a 10% chance of $50
over $5 guaranteed). A risk-accepting strategy allows in-need individuals to meet goals
that would have been inaccessible otherwise, whether due to environmental or embodied
factors. Seeing others better off than one’s self can lead to greater expectations for one’s
own possible outcomes (Collins, 1996). Therefore, disadvantaged individuals should
engage in greater risk-taking because they have not reached the position of more
privileged others.
1.4.2 Proximate Mechanisms Leading from Competitive Disadvantage
The relative state model primarily describes the functional role and antecedents of
risk-taking, but also posits that proximate systems (i.e., mechanisms within the individual
that generate behaviour) at the hormonal, cognitive, or emotional level must exist to
motivate individuals to engage in functional behaviours. Cosmides and Tooby (2000)
argue that emotions developed to automatically motivate organisms to resolve recurring
adaptive problems. Competitive disadvantage can be categorized as such a challenge.
Unfavorable relative states should activate proximate mechanisms that help individuals
reduce their perceived disadvantage. Social psychological emotions and hormones should
be effective barometers and motivators in response to changes in relative state.

13
In primates, relative advantage and disadvantage has been linked to behavioural
and hormonal changes. Across taxa, most famously baboons, subordinate individuals
exhibit substantially higher levels of stress hormones than those that are dominant.
However, in unstable hierarchies, dominant individuals experience the greatest amounts
of psychological and physiological stress until the social structure is solidified.
Hierarchy-driven stress responses are most pronounced when resource access is most
highly skewed in favor of dominant individuals (i.e., high environmental inequality;
reviewed in Sapolsky, 2005), demonstrating that the psychology of relative state is most
pronounced in stratified environments. The generalizability of the primate-stress
literature to humans may be limited because an individual’s dominance or subordination
is not as important for humans compared to other primates (reviewed in Cheng, Tracy, &
Henrich, 2010). However, the literature is suggestive that proximate systems exist across
a wide variety of taxa that respond to relative social positioning.
Feelings of relative deprivation and envy, as well as schaudenfreude, likely have
developed as psychological systems that detect and respond to competitive disadvantage.
From an evolutionary point of view, humans should not have developed visceral
reactions to disadvantage to maintain self-esteem. Instead, feelings of envy and personal
relative deprivation are part of a functional system to effectively compete for mates,
status, and resources (Hill & Buss, 2006). By integrating theories of envy and relative
deprivation with evolutionary theory, two key testable hypotheses can be posited: (1)
feelings of envy and relative deprivation should be highest when at a relative
disadvantage in any domain that is a proxy of biological fitness (e.g., access to desired
mates, money); and (2) feelings of envy and relative deprivation should lead individuals

14
to try to improve their relative state, either by trying to strive upwards or attempting to
damage others. As predicted, feelings of envy and relative deprivation increase in
situations of perceived disadvantage (Callan et al., 2008; Wobker, 2015). Furthermore,
when individuals report feelings of envy and personal relative deprivation, they are more
likely to use higher risk strategies that can improve their personal relative standing, such
as gambling or spiteful behaviours (Callan et al., 2008; Mishra et al., 2015; Wobker,
2015). Overall, feelings of envy and personal relative deprivation motivate individuals to
improve their relative access to proxies of fitness.
1.5 Sensitivity to Competitive Ability
The relative state model posits that an individual’s relative state is determined by
both the situation and their own abilities. There has only been limited research examining
whether humans assess their abilities compared to others, and how their relative ability
influences their thoughts, feelings, and behaviours. In contrast, research on animal-
fighting suggests a deeply ingrained sensitivity to relative competitive ability.
There is substantial variability in size, weaponry access, and health within and
between species. Traits that affect fighting ability are broadly referred to as resource-
holding potential (Parker, 1974). Fighting for limited resources costs time and risks
injury or death (e.g., Glass & Huntingford, 1988; Kelly & Godin, 2001; Briffa & Elwood,
2004). Due to the immediate and potential costs of fighting, organisms should only fight
when they are likely to have a net benefit from the outcome. In situations where the
opponents are unequal in their fighting ability, weak, unskilled, or ill-equipped opponents
will likely lose the contest. In such a mismatch, a long and intense fight has little value
for the weaker organism.
15
Relative competitive ability is an important predictor of winning fights, and
should influence fighting duration and intensity. Reviewed in Arnott and Elwood (2009),
long and intense fighting most often occurs when competitors have similar resource-
holding potential. Furthermore, animals fight for a shorter amount of time if they have
observed their opponent beforehand. Animals, ranging from mammals to insects, exhibit
sophisticated mutual assessment and corresponding behavioural changes. Despite the
animal literature indicating widespread sensitivity to inequality in abilities, little research
has examined how humans respond to relative competitive ability.
1.5.1 Sensitivity to Embodied Capital in Humans
Evolutionary theorists posit that modern humans behave in ways that helped their
ancestors compete for fitness-related resources (Cosmides & Tooby, 2000). Humans who
were better able to compete for resources would have enjoyed greater reproductive
success over time, therein leading to (a) sensitivity to relative position, and (b) the
proliferation of traits that enhance competitive advantage. Consequently, contemporary
humans should also be sensitive to their competitive ability. Consistent with the reviewed
animal fighting literature, humans (particularly males) are more willing to be physically
aggressive when perceiving themselves to have more resource-holding potential (i.e.,
greater physical size, more allies, a “tougher” reputation) than an opponent (Archer &
Benson, 2008).
Human competition does not always involve physical aggression. Attracting
sexual partners and accumulating resources can also be determined by factors such as
intelligence, attractiveness, and knowledge. The broad suite of intrinsic attributes that
allow for successful social competition is known as embodied capital (Bourdieu, 2011;
16
Kaplan, 1996; Kaplan & Gangestad, 2005; Kaplan, Gurven, & Winking, 2009;
Lalumière, Harris, Quinsey, & Rice, 2005; von Rueden, Lukaszewski, & Gurven, 2015).
For the purposes of the current study, embodied capital is a useful term for capturing
stable individual differences that individuals leverage to meet goals. However,
interpreting embodied capital as a general factor such as the general factor of intelligence
may be premature. Social psychological and evolutionary theories have hypothesized a
positive relationship between desirable (i.e., fitness-enhancing) traits. Social
psychologists posit that attractive individuals are more likely to be given access to
opportunities to improve themselves, and evolutionary theorists have argued that more
attractive individuals tend pair with more intelligent mates, resulting in offspring that
express both phenotypes (i.e., assortative mating). Despite the theoretical background,
empirical investigations have yielded inconsistent support for the hypothesized positive
relationship between distinct types of embodied capital (reviewed in Mitchem et al.,
2015). In the absence of conclusive evidence concerning the generality of embodied
capital, considering each individual form of embodied capital independently is most
prudent.
As reviewed above, relative resource-holding potential influences fitness-related
outcomes and behaviours. Relative embodied capital should be similarly associated with
competitive outcomes, cognitions, and behaviours. Physically attractive individuals are
cooperated with more often, have higher social standing with their peers, have more
sexual partners, and make more money (Anderson, John, Keltner, & Kring, 2001; Judge,
Hurst, & Simon, 2009; Mulford, Orbell, Shatto, & Stockard, 1998; Rhodes, Simmons, &
Peters, 2005). Intelligence is associated with income and occupational status, as well as

17
sexual desirability (Buss, 1989; Ceci & Williams, 1997; Hauser & Huang, 1997; Sherkat,
2010). In a Malaysian sample, office workers were physically stronger than manual
laborers and unemployed individuals (Hossain, Zyroul, Pereira, & Kamarul, 2012).
Stronger males have more sexual partners and earlier first sexual encounters (Gallup,
White, & Gallup, 2007). Taller individuals have greater incomes and occupational status
(Judge & Cable, 2004), and taller males are perceived as more attractive (Lerner &
Moore, 1974). Together, these results suggest that embodied capital is essential for
successful interpersonal competition. Moreover, individuals appear to exhibit a greater
positional bias when considering relative embodied capital compared to relative wealth.
Although wealth and other outcomes (such as access to desirable romantic partners) can
be transient, embodied capital is present within an individual across multiple domains
and instances of competition.
Having low embodied capital puts individuals at a competitive disadvantage.
Those who do not possess high levels of intelligence, for example, are less likely to find
themselves in high paying jobs given that such jobs are typically cognitively complex
(Ceci & Williams, 1997). Disadvantage in resource access (via high salaries and
occupational prestige/status) manifests because of a relatively stable embodied trait (low
intelligence).
There is evidence that people are sensitive to how their embodied capital
compares with others. Solnick and Henenway (1998) found that 68-80% of individuals
would sacrifice their absolute attractiveness and intelligence to be more attractive and
intelligent relative to others. The preference for relative embodied capital is greater than
the 38-56% of individuals who reported preferring greater relative income. Mishra,

18
Barclay, and Lalumière (2014) manipulated feedback on an intelligence test and found
evidence that people took more in-lab risks when they received an evaluation denoting
below-average intelligence. The result is consistent with risk-sensitivity theory (Mishra,
2014), which predicts that low embodied capital (and thus competitive disadvantage)
would lead to greater risk-taking. Humans seem to have, at minimum, an implicit
understanding that relative embodied capital influences their access to desired outcomes.
Past studies describe how objective indices of embodied capital are associated
with proxies of fitness. However, the existing research does not capture how perceptions
of embodied capital uniquely affect individuals’ perceived competitive ability. Social
comparisons are based primarily upon perceptions of oneself and others, rather than
objective reality. Among a variety of other perceptual biases, individuals tend to
overestimate their embodied capital (i.e., the self-enhancement bias or above average
effect, e.g., Nestor, Stillman, & Frisina, 2010). The systematic inaccuracy in self-
assessments highlights that individuals’ self-perceptions are informed by factors beyond
objective reality. Thus, subjective ratings of embodied capital will likely uniquely predict
individuals’ experiences of envy and relative deprivation, even after controlling for
objective measures of embodied capital.
Self-efficacy, described as “beliefs in one’s capabilities to mobilize the
motivation, cognitive resources, and courses of action needed to meet given situational
demands” (Wood & Bandura, 1989, p. 408), could be considered (at least in part)
analogous to perceived embodied capital; one’s capacity to meet situational demands
should be determined at least in part by ability. While self-efficacy also captures
individuals’ confidence in their ability to effectively wield their embodied capital, self-

19
efficacy should be informed by the belief that one has sufficient embodied capital to
wield for the task. In support of the role of embodied capital in self-efficacy, general
mental ability and experience are both positively associated with higher work-related
performance and task-specific self-efficacy (reviewed in Judge, Jackson, Shaw, Scott, &
Rich, 2007). In sum, self-efficacy should indicate an individual’s confidence in their
ability to carry out fitness- and competition-related tasks.
Embodied capital and self-efficacy may have a unique relationship with benign
envy. Perceived control has been argued to be a defining component of benign envy;
when recalling instances of benign envy, individuals tend to report having greater control
over their situation than those recalling instances of malicious envy (van de Ven et al.,
2009). One would expect that possessing sufficient embodied capital would lead an
individual to believe that they are able to “meet situational demands” (Wood & Bandura,
1989, p. 408). Rather than fostering malicious intent towards their comparator, an internal
locus of control would increase an individual’s motivation to strive upwards in a
disadvantaged situation, and thus be positively associated with benign envy.
1.6 Hypotheses
Taken together, extant empirical and theoretical work suggests individuals
experience feelings of envy and relative deprivation when perceiving victimization by
inequality. Inequality can manifest in two forms: 1) environmental inequality, defined as
skewed distribution of resources and outcomes; and 2) individual differences in
embodied capital. Humans feel envy and relative deprivation when they have less
resources, status, or reproductive success. Feelings of relative deprivation and envy
should also manifest when humans lack the ability to compete for these proxies of fitness

20
(i.e., a competitive disadvantage). The proposed study will test two main hypotheses: (1)
self-perceived and objective measures of embodied capital will be negatively correlated
with measures of relative deprivation and envy, and (2) self-perceptions of embodied
capital will account for unique variance in measures of personal relative deprivation and
envy above and beyond objective measures.
The current study will test several specific predictions. All measured forms of
embodied capital (i.e., hand grip strength, verbal intelligence, performance on the Peg
Task, small difference between hands on the Peg Task, low body fat, high muscle
composition) will be negatively correlated with scores on the Personal Relative
Deprivation Scale, the Dispositional Envy Scale, the Domain-Specific Envy Scale, and
the malicious envy component of the Benign and Malicious Envy Scale. Embodied
capital will be positively correlated with the benign envy component of the Benign and
Malicious Envy Scale. The competence component of the domain-specific envy scale
will be correlated with measures of intelligence (i.e., performance on the verbal ability
test, intelligence items in the self-attributes scale, the self-reported embodied capital
scale). Objective measures of embodied capital are important to reduce the impact of
response biases (reviewed in Hoorens, 1993); however, self-perceptions of embodied
capital may be unique predictors of feelings of envy and personal relative deprivation.
Self-perceived embodied capital, as measured by the Self-Attributes Questionnaire and
the Self-Report Embodied Capital Scale, will account for statistically significant variance
in self-reported feelings of envy and personal relative deprivation (i.e., Personal Relative
Deprivation Scale, Dispositional Envy Scale, Benign and Malicious Envy Scale, Domain-
Specific Envy Scale) above and beyond objective measures of embodied capital (i.e.,

21
height, muscle mass %, body fat %, hand grip strength, peg task completion time,
handedness in the peg task, verbal ability score).
Self-efficacy should be positively correlated with indices of objective and
perceived embodied capital. Moreover, general physical, and social self-efficacy will be
negatively correlated with relative deprivation, envy proper, and malicious envy, but
positively associated with benign envy. These relationships should remain statistically
significant even after controlling for all other measurements of embodied capital.
2.0 Methods
Undergraduate participants, n = 198 (59 males, Mage = 22.04, SD = 4.38), were
recruited from participant pools in the Department of Psychology and the Faculty of
Business Administration at the University of Regina. The procedure was conducted at an
on-site laboratory and was conducted by one of four researchers. Participants were
compensated with course credit.
2.1 Measures
2.1.1 Demographic Measures
Participants completed the following demographic questions: age, sex,
relationship status, number of children, number and type of siblings, employment status,
mental illnesses, household income, personal income, employment status, and whether
they had been arrested, charged, convicted, and/or incarcerated due to a criminal offence.
2.1.2 Personal Relative Deprivation.
Feelings of relative deprivation were measured using the Personal Relative
Deprivation Scale – Revised (PRDS-R; Callan, Shead, & Olson, 2011). The PRDS-R is a
5-item measure of the degree to which people feel subjectively deprived relative to others

22
(e.g., “I feel resentful when I see how prosperous other people seem to be”). Items are
rated on a scale from 1 (strongly disagree) to 7 (strongly agree). The PRDS-R has had
acceptable internal consistency, α = 0.86 (e.g., Callan et al., 2011), and has been
associated with poorer physical and mental health (Callan et al., 2015b; Mishra &
Carleton, 2015), and higher levels of risk-related personality, attitudes, and behavior
(Mishra & Novakowski, 2016). Research into envy and relative deprivation is rapidly
growing, with several emerging measurements. Accordingly, participants responded to
multiple measures of envy.
2.1.3 Dispositional Envy Scale.
The Dispositional Envy Scale (Smith, Parrott, Diener, Hoyle, & Kim, 1999) is the
most established measure of envy proper to date. Participant’s chronic feelings of envy
proper (e.g., “Feelings of envy constantly torment me”) are assessed with eight items,
each rated from 1 (strongly disagree) to 5 (strongly agree). The measure has good
internal consistency (as posited by Streiner, 2003), α = 0.83-0.86, and two-week test-
retest reliability, r = 0.80, and has been associated with lower self-esteem, more
depressive symptoms, higher neuroticism, lower happiness, and lower life satisfaction
(Smith et al., 1999).
2.1.4 Domain-Specific Envy Scale
The Domain-Specific Envy Scale (Rentzsch & Gross, 2015) is a 15-item measure
that assesses envious reactions in three distinct domains; specifically, attraction (e.g., “It
bothers me when others can have every romantic partner that they want”), competence
(e.g., “It is hard to bear when other people are more intelligent than I am”), and wealth
(e.g., “It bothers me when others own things that I cannot have”). Items are rated from 1
23
(not at all) to 7 (very much). The internal consistencies, αTotal = 0.91-0.93, αAttraction = 0.80
-0.90, αCompetence = 0.84-0.89, αWealth = 0.84-0.88, and three-month test-retest reliabilities,
rTotal = 0.77, rAttraction = 0.78, rCompetence = 0.72, rWealth = 0.73, of the total scale and
subscales range from good to excellent.
2.1.5 Benign and Malicious Envy Scale
The Benign and Malicious Envy Scale (Lange & Crusius, 2015) is a 10-item
measure assessing typical dispositional responses to perceived disadvantage. Benign envy
motivates individuals to reach the envied person’s position (e.g., “Envying others
motivates me to accomplish my goals”) and malicious envy reflects the desire to bring
the envied person down to the envier’s position (e.g., “I feel ill will toward people I
envy”). The benign and malicious envy factors are each five items and have high internal
consistency, α = 0.79-0.85 and 0.83-0.90, respectively. Benign envy is associated with
greater hope for success, whereas malicious envy is associated with more fear of failure
(Lange & Crusius, 2015).
2.1.6 Objective Measures of Embodied Capital
Embodied capital was assessed by measuring hand grip strength, manual
dexterity, severity of hand preference, verbal intelligence, and body fat percentage.
Handgrip strength was assessed using a Jamal Hydraulic Hand Dynamometer according
to the standardized procedure detailed by Roberts et al. (2011). Handgrip strength has
been associated with reproductive success in an ancestral population (Atkinson, et al.,
2012), more sexual partners in males (Gallup et al., 2007), and slower cognitive decline
(Alfaro-Acha, et al., 2006).

24
Symmetrical faces are considered more attractive than less symmetrical ones
(Perrett et al.,1999; Rhodes et al., 2005). As such, participants’ pictures were taken under
standardized distance and lighting conditions. However, facial symmetry is an imperfect
correlate of facial attractiveness, and has been characterized as a weak signal in a “sea of
noise” (e.g., Hume & Montgomerie, 2001). The conceptual limitations of facial
symmetry, combined with a high frequency of non-planar orientation photographs, led to
the exclusion of facial symmetry from the current analyses. However, 146 participants
consented to having their pictures distributed to third parties to be rated on attractiveness.
Although the collection and analysis of third-party ratings of facial photographs were not
conducted for the current study, photographs will eventually be independently rated for
attractiveness using a sample outside of Regina.
Manual dexterity and severity of handedness were measured using the Peg Task
(Mathiowetz, Weber, Kashman, & Volland, 1985). Participants were instructed to move
10 wooden pegs into holes as fast as they can, with trials alternating between their right
and left hands. Research indicates that severities in handedness are indicators of
developmental instability. Extreme handedness associated with minor physical
anomalies, such as widely spaced eyes and low ears. Severity of handedness is also
associated with fluctuating asymmetries such as foot, ear, elbow, and knee breadth.
Extreme handedness is also associated with schizophrenia and low birth weight. Minor
physical anomalies and fluctuating asymmetries are both considered classic markers of
developmental instability (reviewed in Yeo & Gangestad, 1994).
The Peg Test has most frequently been used with individuals suffering motor
impairments and has adequate test-retest reliability, rs = 0.43 to 0.69 (Mathiowetz et al.,

25
1985). Participants had their performance time measured across eight trials (four for the
left hand, four for the right). Severity of handedness was assessed by subtracting the
average performance time for the dominant hand from the average time for the non-
dominant hand. In eight cases, the subtracting procedure yielded negative values,
signaling that participants’ reported dominant hand was actually slower than their
reported non-dominant hand. Indices of handedness which yielded negative signs were
reversed to reflect functional asymmetry, despite participants’ self-reported handedness.
Individuals had their height measured. Height has been associated with income,
controlling for age, sex, and weight (Judge & Cable, 2004), and taller men are judged as
more attractive (Lerner & Moore, 1974; Shepperd & Strathman, 1989). Individuals also
had their body fat percentage and muscle percentage measured using impedance analysis
with an Ozeri Touch Digital Bath Scale. An Omron HBF-306CAN Fat Loss Monitor was
also used to calculate body fat percentage from the upper body. Body Mass Index has
been negatively correlated with perceived bodily attractiveness in men (Hönekopp,
Rudolph, Beier, Liebert, & Müller, 2007), and lean body mass is positively correlated
with infant birth weight in low socioeconomic status east Indian mothers (Kulkarni,
Shatrugna, Balakrishna, 2006). The current study also collected participants’ Body Mass
Index; however, Body Mass Index is calculated using only height and weight, thereby
ignoring participants’ body composition (e.g., a short individual with a very high lean
body mass would have a high Body Mass Index, as would a short person with high body
fat). As such, indices of body fat and muscle percentage were used, as they are more
accurate indicators of embodied capital.

26
Verbal intelligence was assessed using the verbal ability subscale of the General
Social Survey (Smith, Hout, & Marsden, 2012). The verbal ability task uses ten word-
equivalence items (e.g., “select the most similar word to the term beast: disruption,
landscape, animal, lumber, police”) and has been associated with several measures of
general intelligence, as well as occupational status and earnings (Hauser & Huang, 1997;
Sherkat, 2010).
2.1.7 Subjective Embodied Capital
Perceived embodied capital, as opposed to objective embodied capital, may
account for unique variance above and beyond objective measures. The Self-Attributes
Questionnaire (Pelham & Swann, 1989) and the Self-Report Embodied Capital Scale
(Novakowski & Mishra, 2015b) were used to assess individual self-perceptions of traits
such as physical strength, physical attractiveness, and intelligence. The Self-Attributes
Questionnaire is a 10-item measurement that asks participants to rank themselves on a
10-point percentile scale on their traits and abilities. The Self-Attributes Questionnaire
has acceptable 4-month test-retest reliability, r = 0.77, and internal consistency, α = 0.76
and is associated with self-esteem and self-reported social inclusion (Pelham & Swann,
1989). The Self-Report Embodied Capital Scale is a 10-item scale that asks participants
to rank themselves out of 10 hypothetical individuals who were of similar age and sex
(one being the individual lowest in a trait, 10 being the highest). The Self-Report
Embodied Capital Scale is associated with more prosocial and non-antisocial risk-taking,
greater general self-efficacy, as well as greater self-esteem (Novakowski & Mishra,
2015a; 2015b).

27
2.1.8 Self-Efficacy
Participants also completed multiple measures of self-efficacy. Self-efficacy was
measured using the New General Self-Efficacy Scale (Chen, Gully, & Eden, 2001), the
Scale of Perceived Social Self-Efficacy (Smith & Betz, 2000), and the Physical Self-
Efficacy Scale (Ryckman, Robbins, Thornton, & Cantrell, 1982). The Self-Attributes
Questionnaire and the Self-Report Embodied Capital scales should provide an index of
perceived quality and ability; however, the scales measure very discrete forms of
embodied capital, such as strength, musical skills, and verbal intelligence. Self-efficacy is
grounded in diverse behaviours, rather than the ranking of discrete traits. As such,
measures of self-efficacy may provide a more comprehensive assessment of perceived
embodied capital not captured by other measures, and thus uniquely predict feelings of
envy and relative deprivation.
The New General Self-Efficacy Scale was developed to replace the General Self-
Efficacy Scale developed by Sherer et al. (1982). The New General Self-Efficacy Scale
has good internal consistency, (α = 0.86 to 0.90; Chen et al., 2001). The new scale is one-
dimensional, whereas the General Self-Efficacy Scale has yielded three dimensions. The
New General Self-Efficacy Scale is highly related to, but still distinct from, self-esteem
(Chen et al., 2001). The New General Self-Efficacy Scale is associated with task-specific
self-efficacy in domains such as exam-writing, music, persuasion, and literature, and was
associated with actual performance on a mid-semester exam (Chen et al., 2001).
Self-efficacy in social scenarios was measured using the Scale of Perceived Social
Self-Efficacy (Smith & Betz, 2000). Participants were asked about their confidence to
engage in a variety of social behaviours (e.g., “Start a conversation with someone you
28
don’t know very well”) Three-week test-retest reliability was r = 0.82 and internal
consistency was α = 0.94. Scores on the Scale of Perceived Social Self-are is associated
with the social self-efficacy subscale of Sherer et al.’s (1982) General Self-Efficacy Scale
and the social skills subscale of the Skills Confidence Inventory (Betz, Borgen, &
Harmon, 1996). Social self-efficacy is also associated with less shyness, less social
anxiety, and higher self-esteem (Smith & Betz, 2000).
Physical self-efficacy was measured using the 22-item Physical Self-Efficacy
Scale (Ryckman et al., 1982). The scale contains two factors: perceived physical ability
(“I can’t run fast”), and physical self-presentation confidence (“I am rarely embarrassed
by my voice”). Items are rated from strongly disagree (1) to strongly agree (6). The
internal consistencies αTotal =0.85, αPerceived physical ability = 0.75, αPhysical self-presentation confidence =
.82 and six-week test-retest reliabilities of rTotal = 0.80, rPerceived physical ability = 0.69, rPhysical
self-presentation confidence = 0.80 range from good to excellent. Scores on the Physical Self-
Efficacy Scale are associated with higher self-esteem, less self-consciousness, lower
anxiety, greater sports involvement, better performance on a dart-throwing task, better
reaction times, and more athletic body types (as assessed by third party observers).
2.2 Procedure
Sessions occurred in two consecutive phases: 1) a self-report phase and 2) a
physical measurement phase. Participants were asked to provide informed consent prior
to starting the self-report phase. The self-report phase included all self-report measures.
Participants also completed additional inventories to address separate questions regarding
risk-taking behaviour, mindfulness, and psychopathology. All questionnaire items were
randomized to prevent order and fatigue effects. Participants informed the researcher
29
when they finished the self-report items and then the researcher conducted the physical
measurement phase. Physical measurements were presented in a consistent order for
convenience purposes (i.e., shoes need to be taken off for measurements of height,
weight, body fat percentage, and muscle percentage): hand grip strength, height, the
Ozeri Touch Digital Bath Scale, the Omron HBF-306CAN Fat Loss Monitor, then the
peg task. Participants were then debriefed and thanked for their time.
2.3 Variable construction
Given the considerable number of variables in the current study, an exploratory
factor analysis using principal axis factoring (direct oblimin rotation) was conducted to
determine whether items from the Self-Perceived Embodied Capital Scale and the Self
Attributes Questionnaire could be reduced to a more manageable response set
(correlation matrices reported in Tables 1, 2, and 3), KMO = 0.81, Bartlett’s test of
sphericity, p < .001. The first analysis retained five factors (accounting for 64.85% of the
observed variance). Sense of humor and artistic/musical ability failed to load on any
factor (< 0.30), while leadership and intellectual ability crossloaded across two factors.
Perceived sense of humor, as well as artistic/musical, leadership, and intellectual ability
were removed from the subsequent factor analyses. A second factor analysis retained four
factors (accounting for 66.21% of the observed variance). Perceived athletic ability
crossloaded across factors one and two, so was removed from subsequent analyses.
Perceived general intelligence failed to load on any factor (< 0.30), but was retained, as
self-reports of intelligence tended to load on the fifth factor in the first factor analysis. In
the third factor analysis (four factors accounting for 66.82% of the variance), perceived
general and verbal intelligence failed to load on any of the four factors (< 0.30).

30
However, self-perceptions of intelligence loaded on the fifth factor in the first analysis.
As such, a fourth factor analysis was conducted, with the extraction criterion retaining
five factors. The fourth and final model accounted for 73.52% of the observed variance.
Although the fifth factor had an eigenvalue of 0.94 (below the commonly used threshold
of eigenvalue > 1), this final factor was retained because the inclusion of a fifth factor
uniquely accommodated items regarding perceived intelligence. In summary, the final
model yielded five distinct factors that were interpreted as the following: (1) perceived
attractiveness, (2) perceived social skills, (3) perceived athletic ability, (4) perceived
emotional skills, (5) perceived intelligence. Importantly, the items concerning
intelligence (e.g., “If you were one of 10 people to have your general intelligence
evaluated, which one would you most likely be?”) loaded negatively on the factor of
perceived intelligence. As such, a higher score on the factor of perceived intelligence is
suggestive of lower perceived embodied capital. For ease of comprehension, scores on
perceived intelligence will be reverse-scored in the upcoming correlation and regression
tables, so that a higher score on perceived intelligence reflects higher embodied capital.
Body fat percentage was highly correlated across both upper (normal and athlete
mode) and lower body measurements rs =0.83 and 0.81, respectively. As such, body fat
percentage was calculated by averaging all of participants’ body fat measures (lower
body, upper body “normal” mode, upper body “athlete” mode, maximum of 8
measurements). Muscle percentage was highly correlated across two repeated
measurements, r = 0.91. As such, muscle percentage was calculated by averaging both of
participants’ readings on the Ozeri Touch Digital Bath Scale. Hand grip strength was
highly correlated across all six measurements, rs = 0.9 to 0.96. For analyses, hand grip

31
strength was calculated by averaging participants’ dominant and nondominant hand grip
strength into a single index of overall grip strength. Completion time of the peg task was
highly correlated across all trials, rs = 0.66 to 0.88. Peg task completion time was
calculated by averaging individual performance across all trials.
3.0 Results
Descriptive statistics and reliability estimates for all measures are provided in
Table 6. Reliability analyses using Cronbach’s alpha indicated that the internal
consistency of the measures ranged from near-acceptable to excellent (Streiner, 2003).
Examination of Skewness and kurtosis statistics, Q-Q plots, histograms, and Shapiro-
Wilk tests suggested that several of the measures used in the current study had
unacceptably non-normal distributions. As such, all correlation and regression analyses
were conducted using bootstrapping analyses with 2000 resamples (Efron &
Tibshirani,1993) and 95% confidence intervals being calculated using the bias-corrected
accelerated option in IBM SPSS Statistics 22.
3.1 Partial correlations
All correlations were bootstrapped and controlled for age and reported gender.
There was a moderate amount of interrelatedness between objective measures of
embodied capital. Higher body fat percentage was associated lower muscle percentage
and severities in handedness on the peg task. Taller individuals tended to have a stronger
grip strength, as did participants with a higher score on the verbal intelligence test.
However, taller individuals also tended to have lower muscle percentage. Participants
with a stronger grip were faster when completing the Peg Task. Participants with a faster

32
performance time on the peg task also tended to have less disparity between their left and
right hands (Table 7).
All measurements of self-efficacy were significantly intercorrelated with each
other (Table 8). All five factors of perceived embodied capital (attractiveness, social
skills, athletic ability, emotional skills, intelligence) were significantly intercorrelated
with each other. Perceived athletic ability was not associated with physical self-
presentation confidence nor general self-efficacy. Neither perceived emotional skill nor
perceived intelligence were associated with the perceived physical ability factor of the
physical self-efficacy scale. Additionally, perceived intelligence was not associated with
physical self-presentation confidence. All other factors of perceived embodied capital
were significantly correlated with measures of self-efficacy.
Perceived attractiveness and the perceived physical ability subscale of the
physical self-efficacy scale were negatively associated with body fat percentage and
positively associated with muscle percentage (Table 9). Neither handedness on the peg
task nor height had any relationship with any form of perceived embodied capital.
Performance on the verbal intelligence task was positively correlated with perceived
intelligence, as well as perceived emotional ability, attractiveness, and reported general
self-efficacy. Grip strength was positively associated with the perceived physical ability
subscale of the physical self-efficacy scale and perceived athletic ability. Completion
time on the peg task was negatively associated with the perceived physical ability
subfactor of the physical self-efficacy scale and general self-efficacy (Table 9).
In summary, objective indices of embodied capital were associated with relevant
self-reports of embodied capital and self-efficacy. Physical traits (i.e., muscle and fat
33
composition, grip strength, peg task performance) tended to correlate with beliefs
concerning attractiveness and physical ability. There was some evidence that some forms
of embodied capital can influence multiple domains of self-evaluation. Although
performance on the verbal intelligence task was indeed positively correlated with
perceived intelligence, verbal intelligence was also associated with perceived
attractiveness, emotional ability, and general self-efficacy. These results suggest that
beliefs regarding one’s embodied capital and self-efficacy may be informed by actual
embodied capital. Moreover, it appears that intelligence can influence both specific and
general self-evaluations.
All measures of envy were significantly intercorrelated, rs = 0.26 to 0.64 (Table
10). Personal relative deprivation was associated with envy proper, as well as attraction-
based, wealth-based, and malicious envy. However, personal relative deprivation was not
significantly associated with benign nor competence-based envy. Objective indices of
embodied capital were inconsistently associated with feelings of envy and personal
relative deprivation, but those relationships that were significant were in the predicted
direction. Body fat percentage and handedness on the peg task were positively correlated
with solely envy proper. Performance on the verbal intelligence task was negatively
correlated with only reported personal relative deprivation. Neither grip strength, peg task
performance time, height, nor muscle percentage were significantly associated with any
measures of envy or personal relative deprivation (Table 11). These results are suggestive
of limited relationships between objective embodied capital and feelings of disadvantage;
objective embodied capital (i.e., body fat, verbal intelligence, extreme handedness) was
only associated with general measures of envy and personal relative deprivation.

34
There was some evidence for an effect of objective embodied capital on feelings
of envy and personal relative deprivation. However, one of the hypotheses for the current
study was that perceptions of embodied capital would account for unique variance in
feelings of disadvantage above and beyond objective indices of embodied capital. Before
examining the effects of perceived embodied capital in the upcoming multiple
regressions, partial correlations between perceived embodied and the criterion variables
may serve as a preliminary test of the hypotheses. Perceived attractiveness was
negatively associated with only envy proper. Perceived social skills were negatively
associated with envy proper, personal relative deprivation, and wealth-based envy.
Perceived athletic ability was not significantly associated with any measure of envy nor
personal relative deprivation. Perceived intelligence was negatively correlated with
feelings of personal relative deprivation. Perceived emotional skills were associated with
less envy proper, personal relative deprivation, as well as less attraction-based and
malicious envy.
General self-efficacy was negatively correlated with malicious, attraction- and
wealth-based envy, as well as envy proper and personal relative deprivation, but was not
significantly associated with competence-based nor benign envy. Social self-efficacy was
negatively correlated with envy proper, malicious, attraction-, and wealth-based envy, as
well as personal relative deprivation, but was not associated with competence-based nor
benign envy. Perceived physical ability was not significantly correlated with any measure
of envy nor relative deprivation. Physical self-presentation confidence was negatively
correlated with all measures of envy and personal relative deprivation (Table 11). The
results indicate that perceptions of embodied capital and self-efficacy have a farther-

35
reaching relationship with feelings of disadvantage than solely objective indices of
embodied capital. While indices of perceived physical ability and intelligence were null
correlates of feelings of disadvantage, items concerning perceived emotional skills and
self-efficacy had fairly consistent associations with feelings of envy and personal relative
deprivation.
3.2 Hierarchical Regression Analyses
Bootstrapped hierarchical multiple regressions were conducted to determine
whether embodied capital is associated with the various measures of envy and relative
deprivation. The hierarchical regression models were conducted in four steps: (1) age and
sex; (2) objective forms of embodied capital (i.e., height, muscle %, body fat %, hand
grip strength, peg task completion time, peg task handedness, and verbal ability score);
(3) perceived embodied capital (i.e., attractiveness, social skills, athletic ability,
emotional skills, intelligence); and (4) general and social self-efficacy and the two
subfactors of physical self-efficacy. The analysis plan was devised to: (1) control for
basic demographic characteristics, (2) assess the effect of objective embodied capital
beyond age and gender, (3) determine whether self-perceptions of embodied capital were
unique determinants of envy and personal relative deprivation above and beyond
objective measures, and (4) assess whether measures of self-efficacy could account for
variance these feelings of disadvantage after controlling for both objective and subjective
indices of embodied capital. The use of 18 predictor variables across seven regressions
increases the likelihood of Type I Error. However, due to the directional hypotheses and
controlled analyses, the hierarchical regressions were not adjusted for multiple

36
comparisons. The reported p-values and 95% confidence intervals should thus be
considered with greater scrutiny.
It should be noted that the regressions conducted are slightly overparameterized
for the current study’s sample size. Tabachnik and Fidell (2007) recommend that a
regression model with m predictors requires a sample size greater than 50 + 8m for tests
of the overall model and a sample size greater than 104 + m for testing whether a specific
predictor has an influence. Thus, for the regressions conducted, n=194 cases are
recommended to test the overall model, and n=122 to test individual predictors. However,
due to missing data, the regressions conducted had sample sizes of n=109 to 110 with
pairwise exclusions. The combination of many predictor variables and relatively low
sample size can be seen to affect variance accounted for in the models, as seen in
negative R2 adjusted values in the models analyzing attraction- and competence-based
envy (Tables 14 and 15), and ΔR2 values coupled with negligible increases in R2 adjusted
values across regressions (e.g., Table 14).
Summaries of hierarchical regressions are available in Tables 12 to 18. When
explaining envy proper (Table 12), the steps introducing self-perceived embodied capital
(Step 3) and self-efficacy (Step 4) accounted for significant portions of variance (ΔR2s =
0.17, 0.23 respectively). However, the step introducing objective measures of embodied
capital (Step 2) did not significantly improve the model fit. In the final model (R2adj
=0.47), social self-efficacy and physical self-presentation confidence were the only
variables to account for unique variance in envy proper, being negatively correlated with
scores on the Dispositional Envy Scale, as hypothesized.

37
When explaining scores on the Personal Relative Deprivation Scale-Revised,
steps introducing objective indices of embodied capital, as well as self-efficacy,
significantly improved the model fit (ΔR2s = 0.18, 0.08, respectively; Table 13). In the
final model (R2adj =0.24), verbal intelligence, perceived attractiveness, and physical self-
presentation confidence uniquely contributed to the model fit. Verbal intelligence and
physical self-presentation confidence were negatively correlated with personal relative
deprivation, as predicted, whereas perceived attractiveness was positively associated with
the criterion, the opposite direction as predicted.
When explaining scores on the attraction subscale of the Domain-Specific Envy
Scale, only the final step introducing self-efficacy significantly improved the model fit
(ΔR2 = 0.19). In the final model (R2adj =0.17), physical self-presentation confidence was
the only variable to contribute significant variance to attraction-based envy, being
negatively correlated with scores on the attraction subscale of the Domain-Specific Envy
Scale (Table 14). When explaining scores on the competence subscale of the Domain-
Specific Envy Scale, the step introducing self-efficacy was the only one to significantly
improve the model fit (ΔR2 = 0.16, R2adj =0.09), with physical self-presentation
confidence solely improving the model fit (Table 15). When explaining scores on the
wealth subscale of the Domain-Specific Envy Scale, the step introducing self-efficacy
was the only one to significantly improve the model fit (ΔR2 = 0.13). In the final model
(R2adj =0.14), physical self-presentation confidence was the only significant individual
predictor (Table 16).
When explaining scores on the benign envy subscale of the Benign and Malicious
Envy Scale, introducing measures of self-efficacy was the only step to significantly

38
improve the model fit (ΔR2 = 0.17). In the final model (R2adj =0.13), physical self-
presentation confidence was negatively correlated with experiences of benign envy
(again, with the single largest effect). General self-efficacy was a marginal nonsignificant
correlate of benign envy, p =.06 (Table 15).
When explaining scores on the malicious subscale of the Benign and Malicious
Envy Scale, only the step self-efficacy significantly improved the model fit (ΔR2 = 0.21).
In the final model (R2adj =0.30), body fat percentage, muscle percentage, perceived
attractiveness, general self-efficacy, and physical self-presentation confidence accounted
for unique variance in malicious envy. Muscle and fat percentage, as well as overall
perceived attractiveness were positively associated with malicious envy, whereas general
self-efficacy and physical self-presentation confidence were negatively correlated with
malicious envy (Table 16).
4.0 Discussion
Feelings of envy and personal relative deprivation often have a corrosive effect on
psychological, social, and even physiological functioning. The relative state model
(Mishra et al., 2017) posits that the possession of low relative embodied capital is an
antecedent of feelings of disadvantage. The current study sought to test whether indices
of objective and perceived embodied capital are associated with experiences of envy and
relative deprivation, and whether perceptions of embodied capital would account for
variance in these social comparison reactions above and beyond objective measures.
In summary, the current study found that objective indices of embodied capital
were weakly negatively correlated with certain measures of envy (the only emerging
effects being envy proper’s positive correlations with body fat and extreme handedness, and

39
a negative correlation between personal relative deprivation and verbal intelligence)”. When
examined in the final models of the regression analyses, verbal intelligence accounted for
unique variance in feelings of personal relative deprivation, but body fat failed to
uniquely explain envy proper. Interestingly, despite body fat and muscle percentage not
significantly correlating with malicious envy, both body fat and muscle percentage
accounted for unique variance in the final regression model explaining malicious envy.
Although muscle percentage was a null correlate of malicious envy, r= -0.13, p = 0.19
(Table 11), the final model explaining malicious envy saw muscle percentage become a
significant positive correlate of the criterion. Only some forms of objective embodied
capital have a small link to feelings of disadvantage. Moreover, most do not add unique
variance after controlling for subjective indices of embodied capital and self-efficacy.
These results only provide partial support for the hypothesis that objective embodied
capital would explain variance in feelings of disadvantage. However, the role of muscle
percentage in malicious envy must be examined further.
Self-efficacy accounted for most of the variance in all seven of the regression
analyses. The widespread utility of self-efficacy supported the hypothesis. Most notably,
self-efficacy accounted for variance in the criterion variables even after controlling for
objective and subjective indices of embodied capital. Physical self-presentation
confidence (and general self-efficacy, to a lesser extent) accounted for the explanatory
power of the regression steps introducing self-efficacy, being negatively correlated with
all measures of envy and personal relative deprivation, and accounting for unique
variance in all final regression models. The analyses revealed that individuals’ tendencies
to feel envious or relatively deprived can be most consistently explained by individuals’

40
reported confidence when encountering consequential social evaluations (physical self-
presentation confidence). Although there is some evidence that objective indices of
embodied capital can explain feelings of personal relative deprivation independent of
perceived embodied capital and self-efficacy, most of the effects of embodied capital
appear to be subsumed under the effects of general self-efficacy and physical self-
presentation confidence.
4.1 Correlations Across Objective Measures of Embodied Capital
Grip strength was most broadly associated with other objective forms of
embodied capital, being associated with height, verbal intelligence, and
coordination/dexterity. Although grip strength was associated with height, grip strength
was not associated with body fat nor muscle percentage (Table 7). Muscle mass, rather
than muscle percentage, may influence grip strength; if a 100-pound and 200-pound
individual were to have identical muscle percentages, the 200-pound individual would
inarguably have more muscle mass. Alternatively, grip strength may be principally
influenced by efficient recruitment of existing muscle fibers. Grip strength was also
associated with faster performance on the peg task, suggesting that there may be an
underlying component of physical embodied capital increasing manual strength and
dexterity. Like all forms of embodied capital, manual competence is likely caused by
interactions between gene expression and environmental factors (such as athletic
training).
Interestingly, grip strength was also associated with performance on the verbal
intelligence task (Table 7), a finding that is less intuitive than the relationship between
strength and dexterity; verbal intelligence and the ability to squeeze do not have much

41
conceptual overlap. The relationship between grip strength and performance on the verbal
intelligence task could be considered as evidence for “general embodied capital” within
individuals; if smarter, stronger individuals selectively chose (and still choose) mating
partners who were similarly high in embodied capital, such traits should be
overrepresented, and positively correlated, within their offspring (i.e., assortative mating,
Buss, 1985). However, the assortative mating hypothesis must still account for the null
association between verbal intelligence and performance on the Peg Task; if some
common factors of ability are driving the relationships between manual strength and
dexterity, as well as strength and intelligence, why do we not observe a similar
relationship between dexterity and verbal intelligence?
It may be the case that strong individuals are more likely to self-select into
physically demanding tasks that allow for the practice of manual dexterity. For instance,
someone high in physical strength and stamina could enter a sport that requires
substantial practice of fine motor skills (e.g., stick handling in hockey), and thus develop
generalizable fine motor skills. Such specialization decisions could conceivably be made
independent of one’s intelligence.
Beyond grip strength, body fat percentage was associated with extreme
handedness, which was in turn associated slower performance on the peg task (Table 7).
If severities in handedness are indeed an indicator of developmental instability, these
results provide some evidence that developmental instability (and individuals’ abilities to
cope with such fluctuations) are associated with individual differences in body
composition and manual dexterity. Alternatively, the relationship between body fat
percentage and extreme handedness might be better accounted for by individuals’
42
physical activity; those who exercise tend to have lower body fat percentage (Ballor &
Keesey, 1991), and may develop greater general coordination and dexterity, as well as
help reduce discrepancies in handedness. Future studies should test the predictive ability
of developmental instability versus exercise levels in accounting for individual
differences in handedness, dexterity, and body fat percentage.
4.2 Correlations Between Subjective Embodied Capital and Self-Efficacy
The broad intercorrelations between self-perceived embodied capital and self-
efficacy (Table 8) are suggestive of a common factor underlying participants’ perceptions
of being capable individuals possessing many desirable traits. The factor underlying self-
perceptions may represent individuals’ accurate perceptions of relative embodied capital,
or a mistaken impression driven by contextual (e.g., being typically surrounded by
individuals with lower embodied capital) and/or psychological factors.
When interpreting the broad associations between perceived embodied capital and
self-efficacy, those explanations invoking accurate self-perceptions and
contextual/psychological factors might not be mutually exclusive. Perceptions should be
influenced by both objective and subjective factors. The notion of accurate perceptions of
embodied capital is bolstered by the relationships between objective and subjective
measures of embodied capital. there are negative relationships between body fat
percentage and self-perceived attractiveness and perceived physical ability. The
perceived physical ability subscale of the physical self-efficacy scale was also associated
with increased muscle percentage, a stronger grip, and a faster completion time on the
peg task. Participants who scored higher on the verbal intelligence task rated themselves
as more intelligent, attractive, emotionally skilled, and having more general self-efficacy

43
(Table 9). In summary, participants’ judgments of their self-efficacy and embodied
capital are partially correlated with their objective embodied capital.
4.3 Hierarchical Multiple Regressions
The regression analyses significantly predicted all seven criterion variables (envy
proper, personal relative deprivation, attraction-based envy, competence-based envy,
benign envy, and malicious envy), with most of the explanatory power coming from
physical self-presentation confidence (Tables 12 to 18). The first step introducing age and
sex failed to account for variance in any of the criterion variables. The second step
introducing objective indices of embodied capital uniquely predicted personal relative
deprivation (Table 13). The third step introducing perceived embodied capital accounted
for variance in envy proper above and beyond objective indices of embodied capital
(Table 12). The final step introducing measures of self-efficacy accounted for unique
variance in all seven criterion variables. Physical self-presentation confidence had a
significant effect across all regression models.
4.3.1 Objective indices of embodied capital. The hypothesis that objective
indices of embodied capital would account for unique variance in feelings of
disadvantage was only supported in one of the seven models (personal relative
deprivation). The varied effects of objective embodied capital are surprising given that
indices of objective embodied capital only had to account for variance beyond age and
gender. Given the small effects of the demographic characteristics (ΔR2s = 0.01 to 0.05),
significantly improving the model fit should not be a demanding task. The relative state
model posits that relative state is at least in part informed by objective disadvantage;
acting on perceptions that are uncorrelated with reality should impede fitness. As such,

44
the inconsistent relationships between objective indices of embodied capital and feelings
of disadvantage must be examined further.
The inconsistent effects of objective embodied capital could have occurred for
several reasons. The step introducing objective indices of embodied capital did not
include any data regarding individuals’ facial attractiveness. Comparatively, perceived
embodied capital and self-efficacy included some items that explicitly assessed
individuals’ attractiveness. The absence of objective indices of facial attractiveness will
be addressed once participants’ pictures are distributed to third parties to be evaluated for
attractiveness. Additionally, objective indices of embodied capital could also be
considered weak measures of their underlying constructs. For instance, strength and
dexterity may be better assessed by full-body tasks, intelligence is better assessed by a
comprehensive test, and body fat percentage is best measured using water displacement
tanks. Future studies may find that more refined measures of embodied capital are better
correlates of psychological outcomes.
The use of a voluntary undergraduate sample likely limited the variability of
observed embodied capital for the current study. Individuals of low socioeconomic status
(manifesting in poorer nutrition, less educational support, and developmental instability),
are less likely to enter postsecondary education (Corack, Lipps, & Zhao, 2003). Thus, due
to the selection bias favoring high SES individuals, an undergraduate sample may have
generally higher levels of embodied capital compared to a community sample, and
subsequently diluted the relationship between embodied capital and feelings of
disadvantage. The voluntary nature of the current study may have also provided a means
to bias the sample; the study was advertised as involving physical measurements.

45
Students with lower embodied capital (or those that were especially insecure about their
embodied capital) may have preemptively opted out of the study. For these reasons, a
community sample with greater variability in embodied capital (if an undergraduate
sample does indeed represent a biased sample), may prove a better test of the hypotheses.
The concern of a biased undergraduate sample might be mitigated by the nature of
social comparison processes. Even if an undergraduate sample has consistently higher
and less variable embodied capital compared to the general population, these students’
social comparisons are likely directed towards other students. The notion that individuals
compare themselves to similar others is a fundamental component of social comparison
theory (Festinger, 1954), and has received empirical support (reviewed in Smith & Kim,
2007). Even if undergraduate students represent a curated segment of the population, with
objectively higher levels of embodied capital, they should tend to make comparisons with
other students, as these fellow students are likely to be available and similar to the
comparator. Future studies should determine how assessments of ability, and the
subsequent effects of ability-based assessments on feelings of envy, are influenced by
individuals’ reference groups.
Perceived similarity has long been considered a crucial component of social
comparisons (Festinger, 1954). However, the factors that determine perceived similarity
have received only limited attention. The predominant theory in social psychology for
explaining the role of similarity in social comparisons is the Self-Evaluation Maintenance
model (Tesser, 1988; Tesser & Campbell, 1983). This model defines similarity those
factors that foster “psychological closeness,” referring to the degree one perceives
another as being “close” or “distant.” This psychological closeness is proposed to be

46
influenced by similarity in origins, physical proximity, age, looks, etc., resulting in social
comparisons that are difficult to avoid (Tesser & Campbell, 1980).
The Self-Evaluation-Maintenance model fails to explain why similarity is so
crucial to social comparisons. Given the importance of competition in maximizing
biological fitness (Hamilton, 1964), judgments of similarity might be a proxy to help
individuals identify potential competitors in an immediate environment. Consider
Salovey and Rodin’s (1984) manipulation of similarity, participants received feedback
that a subject next door had “superior performance” on a personality scale that
purportedly either did or did not correspond to the participants’ stated career interests
(e.g., medicine, business, performing arts). The authors could have chosen to manipulate
similarity through other factors such as favorite musical genres, hometown, or desire to
travel. Despite all the available domains of similarity, these authors decided to focus on
career interests. The reliance on cues of occupational ambition suggests that people (or at
least the authors) may judge similarity based on factors that facilitate access to contested
mates, status, and resources. Theories in social comparison would benefit from further
examination of the attributes that most impact perceptions of similarity.
Overall, objective indices of embodied capital were poor correlates of feelings of
envy and personal relative deprivation. Only a handful of these objective measures were
correlated with the criterion variables (Table 11), and fewer still uniquely improved the
hierarchical regression models. However, some measures of embodied capital were
stronger than others. Grip strength, height, and performance on the peg task were
universally uncorrelated with feelings of envy and personal relative deprivation.

47
Body fat percentage was significantly correlated with envy proper, and verbal
intelligence was significantly correlated with personal relative deprivation (Table 11).
Moreover, verbal intelligence contributed unique variance in the final model explaining
personal relative deprivation, and fat and muscle percentage accounted for unique
variance in the final regression model explaining malicious envy. These results are
suggestive of a small effect of objective embodied capital, even after controlling for
perceived embodied capital and self-efficacy. The unique effect of objective embodied
capital (particularly verbal intelligence) appears to be robust and unique when explaining
personal relative deprivation. Further research is needed to investigate why the effects of
these indices of embodied capital were limited to envy proper, personal relative
deprivation, and malicious envy. The intercorrelations between objective and subjective
measures of embodied capital suggest that participants were aware of how their embodied
capital compared to other people. However, there may be certain aspects of one’s
objective relative embodied capital that do not reach one’s consciousness, instead
modifying psychological and behavioural process through implicit systems.
Muscle percentage was generally a poor correlate of feelings of disadvantage.
Muscle percentage accounted for unique variance in malicious envy in the final
regression model. However, the effect of muscle percentage on malicious envy was
initially nonsignificant as a partial correlation r= -0.13, p = 0.19 (Table 11), and became a
significant positive predictor of malicious envy. Such a stark change in effect may be
attributed to statistical suppression (p. 49-51). However, a more parsimonious
explanation may be multicollinearity: muscle percentage was entered in the same step as
body fat percentage; these variables shared a strong relationship: r =.85, p < .001 (Table

48
7). However, the stark change in effect of muscle percentage failed to replicate in the
other regression models.
Although there appears to be a null to suppression effect of muscle composition
on feelings of disadvantage, stronger and more muscular individuals may react to and
perceive their relative state differently. Petersen, Szyncer, Sell, Cosmides, and Tooby
(2013) found that when disadvantaged, upper body strength was positively correlated
men’s increased support for redistribution of wealth. Since formidability increases a
person’s ability to impose costs on others, people who are more physically formidable
may report becoming more frustrated when feeling materially disadvantaged (wealth-
based envy), and could be more willing to harm the position of someone who is more
advantaged (malicious envy). An interpretation focusing on the psychology of dominance
and formidability is substantially weakened by the null correlations between of grip
strength (controlling for age and gender) and these envious reactions. Further analyses on
a larger sample of exclusively men, and variables focusing on formidability and
dominance (dispositional dominance, muscle mass, voice pitch, etc.) would be a stronger
test of the hypothesis that formidable individuals would be more likely to perceive
disadvantage, and subsequently experience feelings of envy and relative deprivation.
4.3.2 Subjective embodied capital. Objective measures of embodied capital do
not capture individuals’ perceptions of themselves. As an extreme example, body
dysmorphic disorder is characterized by individuals’ distorted view bodily
characteristics; an objectively strong individual could still perceive themselves to be
especially weak. Subjective perceptions, which are imperfectly correlated with reality,
should have a substantial role in guiding thoughts and behaviours. Perceived embodied

49
capital was only partly correlated with measures of envy and personal relative
deprivation. Although perceived social skills and perceived emotional skills were
associated with several of the criterion variables for instance, perceived intelligence was
only associated with one of seven feelings of disadvantage (personal relative
deprivation), and perceived attractiveness was only associated with envy proper (Table
11). Moreover, introducing perceived embodied capital only improved the regression
model explaining envy proper. In sum, the results largely fail to support the prediction
that perceived embodied capital would uniquely account for feelings of envy and relative
deprivation; the step that reached statistical significance may simply be the result of Type
I Error.
The null to small effects of perceived embodied capital on feelings of
disadvantage could have manifested because ratings of perceived embodied capital did
not specifically invoke competitors. Participants were asked to rank themselves on certain
traits compared to other people, but these assessments were not framed in relation to their
competitive context. For instance, participants were asked to rate their attractiveness.
However, these assessments of relative attractiveness were not portrayed as being
immediately relevant to fitness-related challenges (i.e., sexual access). Future studies may
be more likely to find significant associations between perceived embodied capital and
feelings of disadvantage if these assessments are clearly framed in relation to salient
competitors and relevant outcomes (e.g., “rate your overall attractiveness compared to
those who would be most likely be interested in your ‘type’ of romantic partner”).
Of the five factors of perceived embodied capital, perceived emotional skills, was
surprisingly the most consistent correlate of feelings of disadvantage, being significantly

50
correlated with envy proper, personal relative deprivation, attraction-based envy, and
malicious envy (Table 11). As an underlying factor, perceived emotional skills may
represent emotional reactivity to a certain degree, as the items include questions on
emotional intelligence and stability. The relatively robust correlations between perceived
emotional skills and feelings of disadvantage may be explained by negative affect;
participants that consistently felt disadvantaged likely felt more stress and negative
emotions (Beshai et al., 2017, Callan et al., 2015), and may have consequently behaved
less patiently, deliberately, or with less “common sense.” Despite its partial correlations
with feelings of disadvantage, perceived emotional skills failed to contribute unique
variance to any of the seven regression models. Although perceived emotional skills
emerged as a distinct factor using principal axis factoring, the results, the negligible
unique impact of perceived emotional skills suggests that this factor shares substantial
variance with other independent variables. Indeed, perceived emotional skills were
associated with every measure of perceived embodied capital and self-efficacy, except for
the perceived physical ability subscale of the physical self-efficacy scale.
Despite not accounting for incremental variance when initially introduced,
perceived attractiveness had a significant positive effect on malicious envy in the final
model (the opposite direction as predicted). Self-perceived attractiveness was not
significantly correlated with malicious envy (Table 8), and reached significance only in
the final step (in the third model, self-perceived embodied capital had a b = .88, p = .17).
The effect of self-perceived attractiveness on malicious envy is surprising both
empirically and theoretically (being in the opposite direction as predicted), and is
examined below.

51
When explaining malicious envy, the significance of perceived attractiveness
(Table 16) solely in the final regression model is indicative of classical statistical
suppression (also known as enhancement; Friedman & Wall, 2005). Although perceived
attractiveness has a nonsignificant correlation with malicious envy (Table 11), its
inclusion with measures of self-efficacy may have improved the observed effects by
removing irrelevant variance from the measures of self-efficacy, allowing the ‘true’
explanatory power of self-efficacy to be uncovered. The extraneous variance manifests in
perceived attractiveness’s positive b-value.
The correlations between perceived embodied capital and measures of self-
efficacy (Table 8) raise the possibility that suppression is the result of excessive
multicollinearity within the model (e.g., Beckstead, 2012). However, only gender and
grip strength had VIFs above 4, suggesting that multicollinearity was within acceptable
limits (VIF < 4 being a conservative criterion; Pan & Jackson, 2008, but see O’Brien,
2007 for a review on how VIF criteria can be relaxed when considered in the context of
sample size and confidence intervals).
The presence of suppression indicates that perceived attractiveness should not be
discarded from the model based on its null association with malicious envy. Rather,
perceived attractiveness provides the means to clarify the existing effects of general self-
efficacy and physical self-presentation confidence (more generally, the possibility of
suppressor effects suggests that otherwise nonsignificant correlates can still improve a
model’s R2 by “carving out” irrelevant variance from significant variables). The
possibility of statistical suppression indicates that researchers should be mindful when
52
confronted with null correlations, as the variables involved may help refine future models
as suppressor variables.
Perceived attractiveness may have emerged as a suppressor variable because
perceived attractiveness was consistently and strongly associated with measures of self-
efficacy, while also having a nonsignificant association with malicious envy (Tables 8
and 11). Perceived attractiveness also appeared to have had a suppression effect on
personal relative deprivation, having a null partial correlation with the criterion, but
uniquely contributing to the final regression model. Malicious envy and personal relative
deprivation may have been the only criterion variables to be subjected to the suppression
effect because neither malicious envy nor personal relative deprivation had significant
partial correlations with perceived attractiveness, while having significant relationships
with both general self-efficacy and physical self-presentation confidence. Future studies
should determine why the variance shared between perceived attractiveness and self-
efficacy was so cleanly separate from malicious envy and personal relative deprivation as
to lead to a suppression effect.
4.3.3 Self-Efficacy. Accounting for a significant amount of variance across all
seven regression analyses (ΔR2s = 0.08 to 0.23), introducing self-efficacy into the
regression models was a surprisingly useful step. The hypothesis stated that self-efficacy
may account for incremental variance above and beyond perceived embodied capital, as
someone’s confidence in their abilities should be informed by the belief that they have
embodied capital to leverage (as seen in Table 7). However, self-efficacy’s explanatory
power was widespread and unique from perceived embodied capital, to the point that
controlling for indices of perceived embodied capital increased self-efficacy’s ability to

53
explain malicious envy and personal relative deprivation. Although the direction of self-
efficacy’s effects on envy and personal relative deprivation were predicted, the
magnitude of some of these effects demands further examination.
4.3.3.1 General self-efficacy. General self-efficacy was negatively correlated with
five of the seven criterion variables (i.e., all but competence-based and benign envy,
Table 11). However, general self-efficacy accounted for unique variance only the
regression model explaining malicious envy. These results provide mixed support for the
hypothesis that self-efficacy would add significant variance when explaining feelings of
disadvantage. These varying effects are explored below.
General self-efficacy was not significantly associated with benign envy, and
failed to contribute unique variance to the regression model explaining benign envy. The
null effect of general self-efficacy on benign envy suggests that confidence in one’s
ability is not a substantial part of benign envy. Given the relative novelty of empirical
work examining benign envy, future studies should investigate whether self-efficacy
moderates the effects of disadvantage on benign envy.
General self-efficacy had nonsignificant (competence-based envy) to small
(attraction- and wealth-based envy) relationships with domain-specific envy, and failed to
reach significance in the hierarchical regression models explaining the above criterion
variables. The inconsistent relationships between general self-efficacy and domain-
specific envy are in stark contrast to the large effect of general self-efficacy on envy
proper (Table 11). Such divergence in effects is interesting given the interrelatedness
between the Dispositional Envy Scale and the three measures of domain-specific envy
(Table 6).

54
The variance shared between the Dispositional Envy Scale and domain-specific
measures of envy appears to have little overlap with general self-efficacy. Indeed, after
controlling for age, gender, and all three subscales of domain-specific envy, envy proper
still had a moderate-strong correlation with general self-efficacy, r = -.39, p < .001.
Given the supposed domain-generality of envy proper and general self-efficacy, one
would expect for domain-general variables to share variance in the discrete domains of
attraction, wealth, and competence. The domain-specific measures of envy all correspond
to proxies of fitness, which would presumably be personally-relevant enough to share
variance with general measures of envy and self-efficacy. However, competitive
disadvantage in such specific domains may be unaffected by such a broad construct as
general self-efficacy. Alternatively, subscales of the Domain-Specific Envy Scale may
fail to effectively portray the domain-specificity of envy (S. Mishra, personal
communication, July 18, 2017). The notion of domain-specificity in the study of envy is
still novel. As such, future studies should seek to test whether envy feelings can indeed
be broken into discrete functional domains, and whether the items of the Domain-
Specific Envy Scale effectively capture these areas. Afterwards, future studies should
examine whether general self-efficacy indeed fails to explain objective indices of relative
standing in the domains of attraction, wealth, and competence.
4.3.3.2 Perceived physical ability and social self-efficacy. Perceived physical
ability was a null correlate of all feelings of disadvantage (Table 11). Perceived physical
ability was associated with lower body fat percentage, higher muscle percentage, higher
grip strength, and faster completion of the peg task (Table 9). Thus, perceived physical
ability appears to be at least partly influenced by real indices of physical ability.

55
However, its null associations with feelings of envy and personal relative deprivation
casts doubt on the importance of physical attributes in understanding feelings of
disadvantage, or competitive (dis)advantage more generally. The average undergraduate
student in an industrialized society likely only seldom relies on physical ability, and
might not be psychologically affected by their relative athletic ability. Future studies may
benefit from focusing on samples that rely on physical skill to gain access to proxies of
fitness (e.g., hunters, athletes). In these populations, perceived physical ability may be a
significant predictor of feelings of envy and personal relative deprivation. Future studies
should also investigate why perceived physical ability was associated with feelings of
personal relative deprivation, but not any other measure of envy.
Social self-efficacy was negatively correlated with envy proper, wealth-based and
malicious envy envy, as well as personal relative deprivation. In the following regression
analyses, social self-efficacy accounted for a small, but significant amount of unique
variance in envy proper (Table 12). However, social self-efficacy failed to explain
variance in other feeling of disadvantage after controlling for objective and subjective
embodied capital. Developing strong cooperative relationships is an important predictor
of biological fitness in social species such as humans (reviewed in Silk & House, 2011).
Moreover, under constrained time, energy, and resources, individuals must be selective
with whom they form relationships, forcing individuals to compete for more desirable
social partners (reviewed in Barclay, 2016). Given the competitive markets surrounding
social and sexual partners, social skills are important predictors of gaining access to these
desirable goods (e.g., Crawford & Manassis, 2011). In addition to being negatively
correlated with envy proper (as seen in Table 11), one might expect that social self-

56
efficacy would be more important than the subscales of the physical self-efficacy scale
(as many individuals in an industrialized society spend more time being social than
physical). However, social self-efficacy captures individuals’ confidence in their ability
to perform specific social tasks, such as asking someone out for coffee. These items fail
to capture how individuals believe they will be perceived by others. Although social self-
efficacy appears to have a small unique effect on envy proper, physical self-presentation
confidence may better capture the competitive and threatening nature of social
interactions, at least as they pertain to feelings of envy and relative deprivation.
4.3.3.3 Physical self-presentation confidence. The physical self-presentation
confidence subscale of Ryckman et al. (1982)’s Physical Self-Efficacy Scale was the
strongest correlate of every single criterion variable, except for personal relative
deprivation. The large and universally negative effect of physical self-presentation
confidence on feelings of envy and relative deprivation suggests that physical self-
presentation confidence may capture a characteristic that is common to all feelings of
disadvantage that has not been examined before. However, the relationship between
physical self-presentation confidence and all measures of envy and relative deprivation
can be puzzling. Consider the role of physical self-presentation confidence in wealth-
based envy. Especially in an undergraduate sample, one would not expect that physical
self-presentation confidence impacts one’s access to wealth (physical self-presentation
confidence was not associated with personal or household income, ps = 0.53 and 0.51,
respectively). Physical self-presentation confidence’s role in accounting for variance
across all measures of envy (and personal relative deprivation to a lesser extent) may lie
in the importance of social evaluation processes in competitive contexts.

57
Individuals appear to recognize that physical self-presentation is especially
important in specific scenarios. Martin and Mack (1996) tested whether there are gender
differences in how physical self-presentation confidence affects competitive anxiety in
sport. The authors reasoned that if sport encourages females to emphasize physical
appearance (compared to men, who only need to focus on physical skill; MacNeill,
1988), “self-presentation doubts should be a source of sport competition anxiety [for
women], just as doubts about performance are a source of anxiety” (p. 76). Indeed, the
authors found that, in women but not men, lower physical self-presentation confidence
was associated with greater anxiety in sport competition. Thus, the effect of physical self-
presentation confidence on competition-related emotions appears when self-presentation
is a perceived determinant of successful competition.
Similarly, most competitive contexts for humans depend on some sort of social
evaluation, whether in romantic pursuits or professional interviews. If social evaluations
are indeed an important input into feelings of envy and personal relative deprivation, one
might expect that social self-efficacy would be stronger correlate than physical self-
presentation confidence, given the importance of being able to successfully make and
maintain social connections. However, in the multiple regression analyses, physical self-
presentation confidence had a larger and more consistently significant effect on feelings
of disadvantage than social self-efficacy. As such, self-presentation confidence appears to
better represent the competitive nature of attracting desirable social and romantic partners
than social self-efficacy. While physical self-presentation confidence sometimes
explicitly assesses individuals’ value relative to others (e.g., “I am sometimes envious of
those better looking than myself”), social self-efficacy assesses one’s confidence in their
58
ability to engage in tasks to initiate and maintain relationships (e.g., “put yourself in a
new and different social situation”). Thus, self-presentation confidence may better
approximate one’s confidence when interfacing with these competitive markets, and is
therefore a stronger predictor of feelings of envy and personal relative deprivation than
social self-efficacy.
Although the items of the physical self-presentation confidence subscale
explicitly and exclusively focus on physical characteristics and skills, they may represent
an underlying factor: one’s confidence when encountering consequential social
evaluations. There are factors beyond physiological attributes that can affect social
evaluations, such as intelligence, experience, fashion (reflecting financial capital), and
reputation (reflecting social capital). The belief that one lacks the capital to receive
favorable social evaluations may manifest in feelings of disadvantage across multiple
domains, but only to the extent that success in the relevant domains relies on effective
self-presentation. For instance, physical self-presentation confidence may have been
associated with wealth-based envy because wealth allows individuals to improve their
social evaluations through purchasing of status goods (reviewed in Nelissen & Meijers,
2011). Physical self-presentation confidence was not associated with personal nor
household income in the current sample, weakening the interpretation that physical self-
presentation confidence may also capture wealth-based presentation confidence. Future
studies should investigate whether self-presentation confidence mediates relationships
between the possession of capital, embodied or otherwise, and feelings of envy and
relative deprivation.

59
4.3.3.4 Self-efficacy summary. The role of self-efficacy in explaining feelings of
envy and personal relative deprivation should be interpreted considering the criticisms of
the scales used in the current study. Bandura (2012) has specifically criticized both the
general (Chen et al., 2001) and physical (Ryckman et al., 1982) self-efficacy scales.
Bandura argues that efficacy beliefs must be specific to the activities and goals that
individuals are pursuing. He criticizes the General Self-Efficacy Scale for its
decontextualized and indefinite items (e.g., “perform effectively on different tasks”), and
its occasional use of intentional statements (“I will” versus the more appropriate “I can”).
Bandura goes on to criticize the physical self-efficacy scale, asserting that it, among other
scales, “assess[es] the cognitive, motivational, affective, decisional, and behavioral
effects of self-efficacy rather than peoples’ beliefs in their capabilities” (2012; p. 19-18).
Bandura’s criticisms of the General Self-Efficacy Scale have two principal
implications: firstly, envy proper might be better explained by more specific forms of
self-efficacy (as demonstrated by self-presentation confidence, but see below); secondly,
the confounding of efficacy (“I can”) and intentional (“I will”) statements means that the
relationship between general self-efficacy might not precisely reflect one’s confidence in
their capacity to carry out tasks, but rather confidence in tasks being accomplished
(which could be attributed to third parties). The confounding of efficacy and intention
could have implications for judgments of fairness; if individuals attribute their inability to
accomplish tasks to external factors, they should be more likely to perceive unfairness,
and subsequently experience greater envy. Such semantic subtleties may have little
bearing on the interpretations of general self-efficacy in the current study, but future

60
researchers should be mindful of the above criticisms as more refined measures of self-
efficacy become available.
Bandura’s claim of confounds within the physical self-efficacy scale is especially
relevant for the current study. The physical self-presentation confidence subscale
simultaneously assesses individuals’ comfort in presenting their physical characteristics
(“I am rarely embarrassed by my voice”), social feedback (“athletic people usually do not
receive more attention than me”), accident-proneness (“I find that I am not accident-
prone”), and stress reactivity (“sometimes I don’t hold up well under stress”). Moreover,
self-presentation confidence has an item that explicitly taps into an envious reaction (“I
am sometimes envious of those better looking than myself”). The substantial explanatory
power of self-presentation confidence across models may be partly attributable to
confounds within the measure. The items seldom explicitly assess participants’
confidence in carrying out specific self-presentation tasks. Instead, physical self-
presentation confidence appears to be an amalgamation of variables surrounding one’s
self-presentation. The intra-scale heterogeneity can be seen to compromise the measures
integrity via a low Cronbach’s alpha of .69. Consequently, future research is needed to
precisely specify the role of physical self-presentation confidence in explaining envy and
personal relative deprivation.
As mentioned above, the Physical Self-Efficacy Scale has been criticized by
Bandura (2012) for confounding self-efficacy with its effects. By Bandura’s standards,
the Scale of Perceived Social Self-Efficacy is a clearer measure of self-efficacy, assessing
confidence in one’s ability to carry out discrete social tasks. Given the specificity of
social self-efficacy, the current study may have been underpowered to detect its effect

61
(Table 11). Moreover, even with a larger sample size, the effect of social self-efficacy
would have likely still been overshadowed by a more complex variable such as physical
self-presentation confidence.
The limitations of the current self-efficacy measures must be considered against
self-efficacy’s usefulness in accounting for variance in envy even after controlling for
objective and subjective indices of embodied capital. Bandura (2012) asserted that “there
is a marked difference between possessing knowledge and skills and being able to use
them well under diverse circumstances, many of which contain ambiguous,
unpredictable, and stressful elements” (p. 24). According to Bandura’s perspective,
embodied capital represents a set of tools that help individuals meet fitness-related goals,
but such traits and abilities must be effectively wielded.
Measures of self-efficacy were inconsistently, and then only moderately,
correlated with indices of embodied capital. Thus, self-efficacy is only partly informed by
someone’s possession of embodied capital. Bandura (2012) describes four sources of
self-efficacy: mastery experiences, social modeling, social persuasion, and
physical/emotional states. Future studies should focus on whether embodied capital
influences these antecedents of self-efficacy. Mastery experiences may prove to be the
most sensitive to embodied capital. Those who have embodied capital relevant to
immediate tasks should be the most likely to experience mastery in these tasks (e.g., a
smart person experiencing mastery in an intellectually demanding task).
The other sources of self-efficacy may also be influenced by embodied capital.
Those who are higher in embodied capital may be increasingly exposed to strong social
models and social persuasion attempts; for instance, intelligent students are often put in

62
advanced programs, being exposed to similarly talented peers, and receiving greater
support to be resilient and persistent in the face of academic challenges (although these
programs may also serve to foster feelings of envy and personal relative deprivation, as
with repeated interactions these talented peers can become individuals’ new reference
group). Lastly, people with higher embodied capital may experience more favorable
physical and emotional states, which in turn foster judgments of self-efficacy. Indeed,
using a longitudinal design, Koenen et al. (2009) found that childhood IQ is negative
predictor of a variety of mental illnesses at age 32 (except for IQ’s positive relationship
with mania). Given the utility of self-efficacy in explaining feelings of disadvantage,
future studies should assess the role of embodied capital in the etiology of self-efficacy.
4.5 Disposition or Repeated Situational Evocation?
One underlying assumption of the current study is that measures of envy and
personal relative deprivation capture a barometer of individuals’ competitive
(dis)advantage. The measures of envy and personal relative deprivation capture
individuals’ tendencies to feel upset about a given disadvantage, and individuals’
affective and motivational responses to the perceived disadvantage. However, the
tendency to be upset about a perceived disadvantaged might not be the result of
individuals’ objective disadvantage. Rather, measures such as the Dispositional Envy
Scale may assess a personality construct rather than individual’s general feelings of envy
and personal relative deprivation.
The ambiguity within measures of envy and personal relative deprivation raises
the question of what causes a person to be prone to feelings of disadvantage. Consider the
items of the Dispositional Envy Scale (e.g., “I feel envy every day”). Regular feelings of

63
envy may be the consequence of constant exposure to cues of disadvantage.
Alternatively, individuals may habitually feel envious because of a stable (i.e., trait)
tendency to become discontent in the face of unfavorable social comparisons. The
confounding of disposition and repeated situational evocation is common throughout
social and personality psychology. Consider the two-week test-retest reliability of the
Dispositional Envy Scale, r = .80 (Smith et al., 1999). Such statistics are insufficient to
discern the cause of temporal stability. Considering the historically low levels of social
mobility (Clark, 2014), dispositional measures of envy might effectively capture
individuals’ responses to objective and persistent disadvantage. Future research should
investigate whether stability in measures of envy and relative deprivation can be
accounted for by heritability, and whether the effect of heritability persist after
controlling for indices of embodied capital.
4.4 Potential Moderators
The current study found a substantial main effect perceived embodied capital and
self-efficacy on feelings of disadvantage. However, perceptions of embodied capital and
self-efficacy may only influence feelings of disadvantage in certain individuals and
circumstances. These potential moderating variables are explored below.
Social comparison appears to be positively associated with feelings of
disadvantage (Callan, Kim, & Matthews, 2015a). Thus, individuals higher in social
comparison orientation may report greater envy and relative deprivation when possessing
(or perceiving themselves to have) lower embodied capital. By comparison, people who
are lower in social comparison orientation may be relatively unaffected by lower
embodied capital. Additionally, a larger sample with more equal numbers of men and

64
women may find that men and women’s feelings of envy and relative deprivation are
differentially affected by discrete forms of embodied capital. For instance, cross-
culturally, men tend to prefer characteristics signaling reproductive capacity in their
sexual partners, whereas women tend to prefer partners to possess cues signaling resource
acquisition (Buss, 1989). Thus, in self-assessments, men may be more sensitive to forms
of embodied capital that reflect resource acquisition, such as intelligence or physical
ability, whereas women may be more sensitive to indices of reproductive capacity, such
as physical attractiveness.
Given the importance of fairness in envy and relative deprivation, future studies
may benefit from studying whether embodied capital impacts judgments of fairness.
Eisenbruch and Roney (2017) found that when individuals are paired with a stingy, but
productive partner, participants are more likely to be more grateful and less angry (the
authors interpreted these measures as a rating of fairness) than they would be with a
stingy, but unproductive partner. In order to continue benefitting from the productivity of
desirable partners, individuals appear to treat productive partners as though they are
entitled to greater selfishness.
The fact that individuals are more willing to make concessions to desirable
partners suggests that individuals with higher embodied capital have more bargaining
power in social interactions. The greater power that comes with being a “productive”
partner may cause those with higher embodied capital to feel that they deserve more
benefits stemming from cooperation. Heightened perceptions of deservingness may cause
people with high embodied capital to be more likely to perceive disadvantage (and
believe that the disadvantage is unfair). Some research is suggestive of the role of ability

65
in reacting to disadvantage: Boen and Vanbeselaere (2000) found that when in a low-
status group, high ability individuals are more likely to try to abandon the low-status
group in an attempt to enter a high-status group. Additionally, Ku and Salmon (2012)
found that when wealth distribution is determined by superior performance, wealthier
individuals preferred that their poorer partners transferred more money to themselves in a
public goods game than when advantage was determined randomly. The evidence
suggests that perceptions of ability may systematically change individuals’ reactions to
advantage or disadvantage.
4.5 Test of the Relative State Model
Although correlational data prevents inferences of causality, the current study
provides partial support for a crucial hypothesis of the relative state model (Mishra et al.,
2017): that embodied capital affects barometers of relative state. Objective indices of
embodied capital were nonsignificant correlates of domain-specific, as well as benign and
malicious envy. Handedness on the peg task was positively correlated with envy proper,
but failed to account for unique variance in the final regression model. Personal relative
deprivation was negatively correlated with verbal intelligence, with the introduction of
objective indices of embodied capital significantly improving the model’s ability to
explain variance in personal relative deprivation.
The effects of objective embodied capital on feelings of disadvantage were
surprisingly small and inconsistent. Embodied capital, alongside environmental factors, is
argued to be one of the only determinants of an individual’s overall competitive
(dis)advantage. As such, one would expect that objective embodied capital would have
large and widespread effects on feelings of envy and relative deprivation. For instance,

66
given the general utility of intelligence, an objectively intelligent person would be
expected to feel less envious across domains due to her persistent advantage. By contrast,
the results indicated that the effect of objective embodied capital was constrained to only
a few measures of envy and relative deprivation. As mentioned earlier, the inconsistent
ability of objective embodied capital to explain relevant social comparison reactions
could be attributed to the use of an undergraduate population and limited measures of
embodied capital. If the limited effects of objective embodied capital persist with
improved samples and methodologies (e.g., examining the effects of body composition,
intelligence, and hunting ability in ancestral populations), the relative state model may
need to be revised to appropriately weight embodied capital’s effect on relative state.
Compared to objective indices of embodied capital, self-efficacy and perceived
embodied capital were generally stronger correlates of feelings of envy and relative
deprivation. The increased utility of subjective measures reiterates that relative state is a
subjective computation of competitive (dis)advantage. Although one’s absolute state
(e.g., embodied capital, current wealth) can be objectively quantified, cues of relative
state must be subjectively integrated by the decision-maker. Throughout the assimilation
and interpretation of status cues, absolute state is contextualized by numerous factors,
most notably social comparisons. Since self-report measures necessarily capture
subjective ratings, subjective ratings are better approximations of relative state than
objective and “unbiased” measures. If the current study only examined objective indices
of embodied capital, the (erroneous) conclusion would have been that individuals are not
very affected by how their skills, traits and abilities compare to others. Thus, future

67
studies investigating relative state (as well as the behavioural sciences more generally)
will benefit from pairing subjective and objective measures in their methodologies.
4.6 Future Directions
Inequality is a common issue in organizations; limited resources and positions are
contested by multiple parties, and can seldom be distributed completely equally (e.g.,
promotions, corner offices). The psychology of relative state can have profound
implications for the efficacy and well-being of employees; envy proper is associated with
greater workplace deviance (Kim et al., 2013). Thus, understanding the antecedents of
feelings of disadvantage may have a substantial role in crafting effective organizations.
The current study found that indices of subjective embodied capital and self-
efficacy effectively explained feelings of disadvantage, while objective measures of
embodied capital had largely negligible relationships with feelings of envy. The results of
the current study suggest that organizations may effectively reduce feelings of
disadvantage through psychological interventions, rather than focusing on improving
individuals’ objective embodied capital. For instance, consider an individual who is
feeling less competent than their peers in a workplace. The ensuing feelings of
disadvantage could potentially be mitigated by moving the individual in question to a
new unit. Since social comparisons are most envy-inducing when the involved parties are
judged to be similar, feelings of disadvantage might be best mitigated by moving the
envious person into a new group of peers that are distinct in their skill sets. Although
moving the envious individual does not necessarily increase their embodied capital, such
displacement should change the envious person’s reference group. Changing the
reference group to individuals that are distinct in their skill sets might hamper

68
individuals’ tendencies to categorize people as “better” or “worse.” In addition to
intervening at the psychological level, worker displacement would also likely be far less
expensive than investing in that employee’s professional development or hiring and
training a new employee. By considering the importance of perceived embodied capital,
organizations might effectively and efficiently prevent feelings of disadvantage, and
subsequent outcomes such as workplace delinquency.
According to the relative state model, embodied capital should only be one input
into relative state; perceptions of a disadvantaged relative state are also a product of
environmental factors, such as inequality. Higher inequality increases the stakes of
competition; when winners capture increasingly sizable portions of desired rewards,
“winning” becomes especially important. As such, the effect of perceived embodied
capital on feelings of envy and relative deprivation may be moderated by perceived
environmental inequality. Future studies may find that individuals who have (or perceive
themselves to have) low embodied capital will experience less feelings of envy and
relative deprivation in more equal environments. Similarly, by reducing inequality within
an organization, employers may be able to alleviate feelings of envy experienced by those
who believe they are disadvantaged.
Future studies should assess whether there are instances when an absence of
embodied capital is not envy inducing. Deficits in embodied capital do not always impair
fitness: Stephen Hawking has severe motor impairments, but has still achieved significant
prestige due to his intelligence (and has even fathered three children). Potentially,
individuals do not need to be high in all forms of embodied capital so long as they are
high in at least one type of embodied capital.

69
The notion that individual forms of embodied capital may be given
disproportionate weighting in assessments of relative state can be in part explained by
social differentiation: the process of individuals distinguishing themselves from others
(Lemaine, 1974). Evolutionary theory posits that social differentiation (and niche
selection) exists to reduce competition over resources: the individual who enjoys the food
source that other individuals dislike should have increased fitness (reviewed in Lemaine,
1974). Embodied capital may be an important determinant of social differentiation.
Individuals might attempt to structure their environments (and create self-concepts) to be
most consistent with their existing forms of embodied capital: smart people should
dedicate time and effort to domains that require intelligence, and strong people should
choose activities that showcase strength. Specializing reduces individuals’ need to
compete in similar domains. However, specializing also reduces flexibility; after opting
out of some strategies, being a successful competitor in the chosen domain of functioning
becomes especially necessary for improving fitness. People should be most affected by
status in domains that is relevant to their embodied capital, and less affected by embodied
capital that is not relevant (for instance, graduate students would probably be more
affected by information suggesting lower relative intelligence or knowledge, compared to
information suggestive of less relative physical strength). Future studies should test
whether individuals who are high in one form of embodied capital still have envious
reactions to deficits in other types of embodied capital.
Future studies would also benefit from determining the effect of modifications to
embodied capital. Individuals can change embodied capital to some degree: people can
diet and exercise, pursue an education, and undergo cosmetic surgery. Alleviating
70
environmental inequality can reduce risk-taking (Mishra et al., 2015), but little data exists
on the effects of reducing inequalities in competitive ability. Individuals who seek and
receive cosmetic surgery generally report better mood, increased self-confidence,
increased popularity, and feelings of sexual well-being (e.g., Kamburoğlu, & Özgür,
2007; McCarthy et al., 2012). The existing research suggests that increasing embodied
capital may alleviate some psychological distress.
Alternatively, individuals who engage in intense self-investment may shift
reference groups, and in turn be unsatisfied with the adjusted relative position. For
instance, after schooling, doctors accrue far more money and social status than most
individuals. However, if comparing themselves to other medical professionals, doctors
may focus on how other physicians make even more money, or work in more prestigious
specializations. Likewise, individuals who undergo cosmetic surgery might begin make
comparisons with only the most attractive individuals, or with people who have also
undergone cosmetic surgery. If individuals indeed shift their reference groups following
increases in embodied capital, individuals may come to feel more disadvantaged, despite
improving their objective standing. People that manage to improve their absolute state
may still experience poor psychological outcomes. Future studies may find that
psychological outcomes (e.g., job satisfaction) following modifications to embodied
capital are mediated by feelings of envy and relative deprivation.
6.0 Conclusion
Past studies have considered envy and personal relative deprivation as
downstream affective consequences of environmental inequality. The current study is the
first empirical work suggesting that individuals’ (perceived) embodied capital has links to

71
feelings of disadvantage. Thus, feelings of envy and relative deprivation are not only
influenced by inequality in resources and outcomes. As hypothesized by the relative state
model, people are sensitive to both situational and embodied indices of competitive
(dis)advantage, and react accordingly. Investigations of envy and relative deprivation,
and social psychology more generally, have historically focused on the power of the
situation on the individual. The results of the current study suggest that competitive
ability and the psychology of relative state may be useful across the behavioural sciences.

72
References
Alfaro-Acha, A., Al Snih, S., Raji, M. A., Kuo, Y. F., Markides, K. S., & Ottenbacher, K.
J. (2006). Handgrip strength and cognitive decline in older Mexican Americans.
The Journals of Gerontology Series A: Biological Sciences and Medical Sciences,
61(8), 859-865.
Adams, J. S. (1965). Inequity in social exchange. Advances in Experimental Social
Psychology, 2, 267-299.
Anderson, C., John, O. P., Keltner, D., & Kring, A. M. (2001). Who attains social status?
Effects of personality and physical attractiveness in social groups. Journal of
Personality and Social Psychology, 81(1), 116.
Archer, J., & Benson, D. (2008). Physical aggression as a function of perceived fighting
ability and provocation: An experimental investigation. Aggressive Behavior,
34(1), 9-24.
Arnott, G., & Elwood, R. W. (2009). Assessment of fighting ability in animal contests.
Animal Behaviour, 77(5), 991-1004.
Atkinson, J., Pipitone, R. N., Sorokowska, A., Sorokowski, P., Mberira, M., Bartels, A.,
& Gallup Jr, G. G. (2012). Voice and handgrip strength predict reproductive
success in a group of indigenous African females. PloS one, 7(8), e41811
Ballor, D. L., & Keesey, R. E. (1991). A meta-analysis of the factors affecting exercise-
induced changes in body mass, fat mass and fat-free mass in males and females.
International Journal of Obesity, 15(11), 717-726.
Bandura, A. (2012). On the functional properties of perceived self-efficacy revisited.
Journal of Management, 38(1), 9-44.

73
Barclay, P. (2016). Biological markets and the effects of partner choice on cooperation
and friendship. Current Opinion in Psychology, 7, 33-38.
Beckstead, J. W. (2012). Isolating and examining sources of suppression and
multicollinearity in multiple linear regression. Multivariate Behavioral Research,
47(2), 224-246.
Beshai, S., Mishra, S., Meadows, T. J., Parmar, P., & Huang, V. (2017). Minding the gap:
Subjective relative deprivation and depressive symptoms. Social Science &
Medicine, 173, 18-25.
Betz, N., Borgen, F., & Harmon, L. (1996). Manual for the Skills Confidence Inventory.
Palo Alto, CA: Consulting Psychologists Press.
Bhurga, D. (1993). Cross-cultural aspects of jealousy. International Review of
Psychiatry, 5(2-3), 271-280.
Boen, F., & Vanbeselaere, N. (2000). Responding to membership of a low-status group:
The effects of stability, permeability and individual ability. Group Processes &
Intergroup Relations, 3(1), 41-62.
Bourdieu, P. (2011). The forms of capital (1986). In I. Szeman and T. Kaposy (Eds.).
Cultural theory: An anthology. Chichester, UK: John Wiley & Sons.
Briffa, M., & Elwood, R. W. (2004). Use of energy reserves in fighting hermit crabs.
Proceedings of the Royal Society of London B: Biological Sciences, 271(1537),
373-379.
Buss, D. M. (1985). Human mate selection. American Scientist, 73, 47−51.
Buss, D. M. (1989). Sex differences in human mate preferences: Evolutionary hypotheses
tested in 37 cultures. Behavioral and Brain Sciences, 12(01), 1-14.

74
Callan, M. J., Ellard, J. H., Shead, N. W., & Hodgins, D. C. (2008). Gambling as a search
for justice: Examining the role of personal relative deprivation in gambling urges
and gambling behavior. Personality and Social Psychology Bulletin, 34(11),
1514-1529.
Callan, M. J., Kim, H., & Matthews, W. J. (2015a). Age differences in social comparison
tendency and personal relative deprivation. Personality and individual
differences, 87, 196-199.
Callan, M. J., Kim, H., & Matthews, W. J. (2015b). Predicting self-rated mental and
physical health: the contributions of subjective socioeconomic status and personal
relative deprivation. Frontiers in Psychology, 6, 1-14.
Callan, M. J., Shead, N. W., & Olson, J. M. (2011). Personal relative deprivation, delay
discounting, and gambling. Journal of Personality and Social Psychology, 101,
955-973.
Ceci, S. J., & Williams, W. M. (1997). Schooling, intelligence, and income. American
Psychologist, 52(10), 1051-1058.
Chen, G., Gully, S. M., & Eden, D. (2001). Validation of a new general self-efficacy
scale. Organizational Research Methods, 4(1), 62-83.
Cheng, J. T., Tracy, J. L., & Henrich, J. (2010). Pride, personality, and the evolutionary
foundations of human social status. Evolution and Human Behavior, 31(5), 334-
347.
Clark, G. (2014). The son also rises: surnames and the history of social mobility.
Princeton University Press.

75
Collins, R. L. (1996). For better or worse: The impact of upward social comparison on
self-evaluations. Psychological Bulletin, 119(1), 51-69.
Corak, M. R., Lipps, G., & Zhao, J. Z. (2003). Family income and participation in post-
secondary education. Ottawa, ON: Statistics Canada.
Cosmides L, & Tooby J., (2000). Evolutionary psychology and the emotions. In Lewis,
M., & Haviland-Jones, J. M. (eds), Handbook of Emotion. (91–115). Guilford
Press: New York.
Crawford, A. M., & Manassis, K. (2011). Anxiety, social skills, friendship quality, and
peer victimization: An integrated model. Journal of Anxiety Disorders, 25(7),
924-931.
Crosby, F. (1976). A model of egoistical relative deprivation. Psychological Review,
83(2), 85-113.
Crusius, J., & Lange, J. (2014). What catches the envious eye? Attentional biases within
malicious and benign envy. Journal of Experimental Social Psychology, 55, 1-11.
Daly, M., & Wilson, M. (1988). Homicide. New York: Aldine de Gruyter.
Efron, B., & Tibshirani, R. J. (1994). An introduction to the bootstrap. CRC press.
Eisenberger, N. I., Lieberman, M. D., & Williams, K. D. (2003). Does rejection hurt? An
fMRI study of social exclusion. Science, 302(5643), 290-292.
Eisenbruch, A. B., & Roney, J. R. (2017). The Skillful and the Stingy: Partner Choice
Decisions and Fairness Intuitions Suggest Human Adaptation for a Biological
Market of Cooperators. Evolutionary Psychological Science, 1-15.
Feather, N. T. (1999). Values, achievement, and justice: Studies in the psychology of
deservingness. Springer Science & Business Media.

76
Feather, N. T. (2006). Deservingness and emotions: Applying the structural model of
deservingness to the analysis of affective reactions to outcomes. European Review
of Social Psychology, 17(1), 38-73.
Feather, N. T. (2015). Analyzing relative deprivation in relation to deservingness,
entitlement and resentment. Social Justice Research, 28(1), 7-26.
Festinger, L. (1954). A theory of social comparison processes. Human Relations, 7(2),
117-140.
Frank, R. H. (1999). Luxury fever: Why money fails to satisfy in an era of excess. Simon
and Schuster.
Friedman, L., & Wall, M. (2005). Graphical views of suppression and multicollinearity in
multiple linear regression. The American Statistician, 59(2), 127-136.
Gallup, A. C., White, D. D., & Gallup, G. G. (2007). Handgrip strength predicts sexual
behavior, body morphology, and aggression in male college students. Evolution
and Human Behavior, 28(6), 423-429.
Garay, J., & Móri, T. F. (2011). Is envy one of the possible evolutionary roots of charity?.
Biosystems, 106(1), 28-35.
Glass, C. W., & Huntingford, F. A. (1988). Initiation and resolution of fights between
swimming crabs (Liocarcinus depurator). Ethology, 77(3), 237-249.
Hamilton, W. D. (1963). The evolution of altruistic behavior. The American Naturalist,
97(896), 354-356.
Hamilton, W. D. (1964). The genetical evolution of social behaviour. Journal of
Theoretical Biology, 7(1), 17-52.

77
Hauser, R. M., & Huang, M. (1997). Verbal ability and socioeconomic success: A trend
analysis. Social Science Research, 26(3), 331-376.
Hill, S. E., & Buss, D. M. (2006). Envy and positional bias in the evolutionary
psychology of management. Managerial and Decision Economics, 27(2‐3), 131-
143.
Hönekopp, J., Rudolph, U., Beier, L., Liebert, A., & Müller, C. (2007). Physical
attractiveness of face and body as indicators of physical fitness in men. Evolution
and Human Behavior, 28(2), 106-111.
Hoorens, V. (1993). Self-enhancement and superiority biases in social comparison.
European Review of Social Psychology, 4(1), 113-139.
Hossain, M. G., Zyroul, R., Pereira, B. P., & Kamarul, T. (2012). Multiple regression
analysis of factors influencing dominant hand grip strength in an adult Malaysian
population. Journal of Hand Surgery (European Volume), 37(1), 65-70.
Hume, D. K., & Montgomerie, R. (2001). Facial attractiveness signals different aspects
of “quality” in women and men. Evolution and Human Behavior, 22(2), 93-112.
Judge, T. A., & Cable, D. M. (2004). The effect of physical height on workplace success
and income: preliminary test of a theoretical model. Journal of Applied
Psychology, 89(3), 428-441.
Judge, T. A., Hurst, C., & Simon, L. S. (2009). Does it pay to be smart, attractive, or
confident (or all three)? Relationships among general mental ability, physical
attractiveness, core self-evaluations, and income. Journal of Applied Psychology,
94(3), 742-755.

78
Judge, T. A., Jackson, C. L., Shaw, J. C., Scott, B. A., & Rich, B. L. (2007). Self-efficacy
and work-related performance: the integral role of individual differences. Journal
of Applied Psychology, 92(1), 107-127.
Kamburoğlu, H. O., & Özgür, F. (2007). Postoperative satisfaction and the patient’s body
image, life satisfaction, and self-esteem: a retrospective study comparing
adolescent girls and boys after cosmetic surgery. Aesthetic Plastic Surgery, 31(6),
739-745.
Kaplan, H. (1996). A theory of fertility and parental investment in traditional and modern
human societies. Yearbook of Physical Anthropology, 39, 91-135.
Kaplan, H., & Gangestad, S. (2005). Life history theory and evolutionary psychology. In
D. M. Buss (Ed.), The handbook of evolutionary psychology (pp. 68-95). Hoboken,
NJ: John Wiley & Sons.
Kaplan, H., Gurven, M., & Winking, J. (2009). An evolutionary theory of human
lifespan: Embodied capital and the human adaptive complex. V. Benston, M.
Silverstein, N. Putney, & D. Gans (Eds.), Handbook of theories of aging (pp. 39-
66). New York, NY: Springer.
Kelly, C. D., & Godin, J. G. J. (2001). Predation risk reduces male-male sexual
competition in the Trinidadian guppy (Poecilia reticulata). Behavioral Ecology
and Sociobiology, 51(1), 95-100.
Kerns, J. G., Cohen, J. D., MacDonald, A. W., Cho, R. Y., Stenger, V. A., & Carter, C. S.
(2004). Anterior cingulate conflict monitoring and adjustments in control.
Science, 303(5660), 1023-1026.

79
Kim, S. K., Jung, D. I., & Lee, J. S. (2013). Service employees’ deviant behaviors and
leader–member exchange in contexts of dispositional envy and dispositional
jealousy. Service Business, 7(4), 583-602.
Koenen, K. C., Moffitt, T. E., Roberts, A. L., Martin, L. T., Kubzansky, L., Harrington,
H., ... & Caspi, A. (2009). Childhood IQ and adult mental disorders: a test of the
cognitive reserve hypothesis. American Journal of Psychiatry, 166(1), 50-57.
Krupp, D. B., DeBruine, L. M., & Jones, B. C. (2011). Cooperation and conflict in the
light of kin recognition systems. The Oxford handbook of evolutionary family
psychology, 345-362.
Ku, H., & Salmon, T. C. (2013). Procedural fairness and the tolerance for income
inequality. European Economic Review, 64, 111-128.
Kulkarni, B., Shatrugna, V., & Balakrishna, N. (2006). Maternal lean body mass may be
the major determinant of birth weight: A study from India. European Journal of
Clinical Nutrition, 60(11), 1341-1344.
Lalumière, M. L., Harris, G. T., Quinsey, V. L., & Rice, M. E. (2005). The causes of
rape: Understanding individual differences in male propensity of sexual
aggression. Washington, D.C.: American Psychological Association.
Lange, J., & Crusius, J. (2015). Dispositional Envy Revisited Unraveling the
Motivational Dynamics of Benign and Malicious Envy. Personality and Social
Psychology Bulletin, 41(2), 284-294.
Le Boeuf, B. J. (1974). Male-male competition and reproductive success in elephant
seals. American Zoologist, 14(1), 163-176.
80
Lehmann, L., & Keller, L. (2006). The evolution of cooperation and altruism–a general
framework and a classification of models. Journal of Evolutionary Biology, 19(5),
1365-1376.
Lemaine, G. (1974). Social differentiation and social originality. European Journal of
Social Psychology, 4(1), 17-52.
Lerner, R. M., & Moore, T. (1974). Sex and status effects on perception of physical
attractiveness. Psychological Reports, 34(3c), 1047-1050.
Mathiowetz, V., Weber, K., Kashman, N., & Volland, G. (1985). Adult norms for the
nine hole peg test of finger dexterity. OTJR: Occupation, Participation and
Health, 5(1), 24-38.
McCarthy, C. M., Cano, S. J., Klassen, A. F., Scott, A., Van Laeken, N., Lennox, P. A.,
... & Pusic, A. L. (2012). The magnitude of effect of cosmetic breast
augmentation on patient satisfaction and health-related quality of life. Plastic and
Reconstructive Surgery, 130(1), 218-223.
Milinski, M., & Parker, G. A. (1991). Competition for resources. In J. R. Krebs & N. N.
Davies (eds.), Behavioural Ecology, 3rd Ed., (137-168). Blackwell: Oxford
Mishra, S., Barclay, P., & Lalumière, M. L. (2014). Competitive disadvantage facilitates
risk taking. Evolution and Human Behavior, 35(2), 126-132.
Mishra, S., Barclay, P., & Sparks, A. (2017). The relative state model: Integrating need-
based and ability-based pathways to risk-taking. Personality and Social
Psychology Review, 21(2), 176-198.
Mishra, S., & Carleton, R. N. (2015). Subjective relative deprivation is associated with
poorer physical and mental health. Social Science & Medicine, 147, 144-149.
81
Mishra, S., & Novakowski, D. (2016). Personal relative deprivation and risk: An
examination of individual differences in personality, attitudes, and behavioral
outcomes. Personality and Individual Differences, 90, 22-26.
Mishra, S., Son Hing, L. S. S., & Lalumière, M. L. (2015). Inequality and risk-taking.
Evolutionary Psychology, 13(3), 1-11.
Mitchem, D. G., Zietsch, B. P., Wright, M. J., Martin, N. G., Hewitt, J. K., & Keller, M.
C. (2015). No relationship between intelligence and facial attractiveness in a
large, genetically informative sample. Evolution and Human Behavior, 36(3),
240-247.
Mulford, M., Orbell, J., Shatto, C., & Stockard, J. (1998). Physical attractiveness,
opportunity, and success in everyday exchange. American Journal of Sociology,
103(6), 1565-1592.
Nelissen, R. M., & Meijers, M. H. (2011). Social benefits of luxury brands as costly
signals of wealth and status. Evolution and Human Behavior, 32(5), 343-355.
Nestor, M. S., Stillman, M. A., & Frisina, A. C. (2010). Subjective and objective facial
attractiveness: ratings and gender differences in objective appraisals of female
faces. The Journal of Clinical and Aesthetic Dermatology, 3(12), 31-36.
Novakowski, D., & Mishra, S. (2015a). Individual differences in self-esteem and
embodied capital: Expanding the sociometer hypothesis. Presentation at the 27th
Human Behavior and Evolution Society Conference, University of Missouri,
Columbia, Missouri.
82
Novakowski, D., & Mishra, S. (2015b). Individual differences in risk-taking as a function
of embodied capital. Southern Ontario Behavioural Decision Research
Conference.
Novakowski, D., & Mishra, S. (under review). Relative deprivation and the Big Five and
HEXACO personality traits.
O’Brien, R. M. (2007). A caution regarding rules of thumb for variance inflation factors.
Quality & Quantity, 41(5), 673-690.
Pan, Y, & Jackson, R. T. (2008). Ethnic difference in the relationship between acute
inflammation and and serum ferritin in US adult males. Epidemiology and
Infection, 136, 421-431.
Parks, C. D., Rumble, A. C., & Posey, D. C. (2002). The effects of envy on reciprocation
in a social dilemma. Personality and Social Psychology Bulletin, 28, 509-520.
Parker, G. A. (1974). Assessment strategy and the evolution of fighting behaviour.
Journal of Theoretical Biology, 47(1), 223-243.
Patil, V. H., Singh, S. N., Mishra, S., & Donavan, D. T. (2008). Efficient theory
development and factor retention criteria: Abandon the ‘eigenvalue greater than
one’ criterion. Journal of Business Research, 61(2), 162-170.
Pelham, B. W., & Swann, W. B. (1989). From self-conceptions to self-worth: on the
sources and structure of global self-esteem. Journal of Personality and Social
Psychology, 57(4), 672-680.
Perrett, D. I., Burt, D. M., Penton-Voak, I. S., Lee, K. J., Rowland, D. A., & Edwards, R.
(1999). Symmetry and human facial attractiveness. Evolution and Human
Behavior, 20(5), 295-307.

83
Pettigrew, T. F., Christ, O., Wagner, U., Meertens, R. W., van Dick, R., & Zick, A.
(2008). Relative deprivation and intergroup prejudice. Journal of Social Issues,
64, 385-401.
Pettigrew, T. F., & Meertens, R. W. (1995). Subtle and blatant prejudice in Western
Europe. European Journal of Social Psychology, 25, 57-75.
Raleigh, M. J., McGuire, M. T., Brammer, G. L., & Yuwiler, A. (1984). Social and
environmental influences on blood serotonin concentrations in monkeys. Archives
of General Psychiatry, 41(4), 405-410.
Rentzsch, K., & Gross, J. J. (2015). Who turns green with envy? Conceptual and
empirical perspectives on dispositional envy. European Journal of Personality,
29(5), 530-547.
Richard, F. D., Bond Jr, C. F., & Stokes-Zoota, J. J. (2003). One Hundred Years of Social
Psychology Quantitatively Described. Review of General Psychology, 7(4), 331-
363.
Roberts, H. C., Denison, H. J., Martin, H. J., Patel, H. P., Syddall, H., Cooper, C., &
Sayer, A. A. (2011). A review of the measurement of grip strength in clinical and
epidemiological studies: Towards a standardised approach. Age and ageing, 40,
423-429.
Rhodes, G., Simmons, L. W., & Peters, M. (2005). Attractiveness and sexual behavior:
Does attractiveness enhance mating success? Evolution and Human Behavior,
26(2), 186-201.

84
Runciman, W. G. (1966). Relative deprivation and social justice: A study of attitudes to
social inequality in twentieth-century England. Berkley, CA: University of
California Press.
Ryckman, R. M., Robbins, M. A., Thornton, B., & Cantrell, P. (1982). Development and
validation of a physical self-efficacy scale. Journal of Personality and Social
Psychology, 42(5), 891-900.
Salovey, P., & Rodin, J. (1984). Some antecedents and consequences of social-
comparison jealousy. Journal of Personality and Social Psychology, 47(4), 780-
792.
Sapolsky, R. M. (2005). The influence of social hierarchy on primate health. Science,
308(5722), 648-652.
Sherer, M., Maddux, J. E., Mercandante, B., Prentice-Dunn, S., Jacobs, B., & Rogers, R.
W. (1982). The self-efficacy scale: Construction and validation. Psychological
Reports, 51(2), 663-671.
Schönbrodt, F. D., & Perugini, M. (2013). At what sample size do correlations stabilize?
Journal of Research in Personality, 47(5), 609-612.
Sen, A. (1981). Poverty and famines: An essay on entitlement and deprivation. Oxford
university press.
Shepperd, J. A., & Strathman, A. J. (1989). Attractiveness and height the role of stature in
dating preference, frequency of dating, and perceptions of attractiveness.
Personality and Social Psychology Bulletin, 15(4), 617-627.
Sherkat, D. E. (2010). Religion and verbal ability. Social Science Research, 39(1), 2-13.

85
Silk, J. B., & House, B. R. (2011). Evolutionary foundations of human prosocial
sentiments. Proceedings of the National Academy of Sciences, 108(Supplement
2), 10910-10917.
Singer, T., Seymour, B., O'Doherty, J., Kaube, H., Dolan, R. J., & Frith, C. D. (2004).
Empathy for pain involves the affective but not sensory components of pain.
Science, 303(5661), 1157-1162.
Smith, H. M., & Betz, N. E. (2000). Development and validation of a scale of perceived
social self-efficacy. Journal of Career Assessment, 8(3), 283-301.
Smith, T. W., Hout, M., & Marsden, P. V. (2012). General Social Survey, 1972-2012,
Storrs, CT: Roper Center for Public Opinion Research, University of
Connecticut/Ann Arbor, MI: Inter-university Consortium for Political and Social
Research.
Smith, R. H., & Kim, S. H. (2007). Comprehending envy. Psychological Bulletin, 133(1),
46-64.
Smith, R. H., Parrott, W. G., Diener, E. F., Hoyle, R. H., & Kim, S. H. (1999).
Dispositional envy. Personality and Social Psychology Bulletin, 25, 1007-1020.
Smith, H. J., Pettigrew, T. F., Pippin, G. M., & Bialosiewicz, S. (2012). Relative
deprivation a theoretical and meta-analytic review. Personality and Social
Psychology Review, 16(3), 203-232.
Smith, R. H., Turner, T. J., Garonzik, R., Leach, C. W., Urch-Druskat, V., & Weston, C.
M. (1996). Envy and schadenfreude. Personality and Social Psychology Bulletin,
22(2), 158-168.

86
Solnick, S. J., & Hemenway, D. (1998). Is more always better?: A survey on positional
concerns. Journal of Economic Behavior & Organization, 37(3), 373-383.
Steinbeis, N., & Singer, T. (2013). The effects of social comparison on social emotions
and behavior during childhood: the ontogeny of envy and Schadenfreude predicts
developmental changes in equity-related decisions. Journal of Experimental Child
Psychology, 115(1), 198-209.
Stouffer, S. A., Lumsdaine, A. A., Lumsdaine, M. H., Williams Jr, R. M., Smith, M. B.,
Janis, I. L., ... & Cottrell Jr, L. S. (1949). The American soldier: Combat and its
aftermath. (Studies in social psychology in World War II, Vol. 2.) Princeton, NJ:
Princeton University Press.
Streiner, D. L. (2003). Being inconsistent about consistency: When coefficient alpha does
and doesn't matter. Journal of Personality Assessment, 80(3), 217-222.
Tesser, A. (1988). Toward a self-evaluation maintenance model of social behavior.
Advances in Experimental Social Psychology, 21, 181-227.
Tesser, A., & Campbell, J. (1980). Self-definition: The impact of the relative
performance and similarity of others. Social Psychology Quarterly, 341-347.
Tesser, A., & Campbell, J. (1983). Self-definition and self-evaluation maintenance.
Psychological Perspectives on the Self, 2, 1-31.
Weber, E. U., Shafir, S., & Blais, A. R. (2004). Predicting risk sensitivity in humans and
lower animals: risk as variance or coefficient of variation. Psychological Review,
111(2), 430-445.
Wobker, I. (2015). The Price of Envy—An Experimental Investigation of Spiteful
Behavior. Managerial and Decision Economics, 36(5), 326-335.
87
Wood, R., & Bandura, A. (1989). Impact of conceptions of ability on self-regulatory
mechanisms and complex decision making. Journal of Personality and Social
Psychology, 56, 407-415.
Wilkinson, R. G., & Pickett, K. E. (2006). Income inequality and population health: A
review and explanation of the evidence. Social Science and Medicine, 62, 1768–
1784.
Wilkinson, R. G., & Pickett, M. (2007). The problems of relative deprivation: Why some
societies do better than others. Social Science & Medicine, 65, 1965–1978.
Wilkinson, R., & Pickett, M. (2009). The spirit level: Why more equal societies almost
always do better. London: Penguin.
van de Ven, N. (2017). Envy and admiration: Emotion and motivation following upward
social comparison. Cognition and Emotion, 31(1), 193-200.
Van de Ven, N., Zeelenberg, M., & Pieters, R. (2009). Leveling up and down: the
experiences of benign and malicious envy. Emotion, 9(3), 419-429.
van de Ven, N., Zeelenberg, M., & Pieters, R. (2011a). The envy premium in product
evaluation. Journal of Consumer Research, 37(6), 984-998.
van de Ven, N., Zeelenberg, M., & Pieters, R. (2011b). Why envy outperforms
admiration. Personality and Social Psychology Bulletin, 37(6), 784-795.
van de Ven, N., Zeelenberg, M., & Pieters, R. (2012). Appraisal patterns of envy and
related emotions. Motivation and Emotion, 36(2), 195-204.
Vanneman, R. D. and Pettigrew, T. (1972) Race and relative deprivation in the urban
United States, Race, 13, 461-486

88
von Rueden, C. R., Lukaszewski, A. W., & Gurven, M. (2015). Adaptive personality
calibration in a human society: Effects of embodied capital on prosocial traits.
Behavioral Ecology, 26, 1071-1082.
Yeo, R. A., & Gangestad, S. W. (1994). Developmental origins of variation in human
hand preference. In Developmental instability: Its origins and evolutionary
implications (pp. 283-298). Springer Netherlands

89
Appendix A
Demographics
Age: _________________________
Gender: Male Female Other
Major (if applicable): ______________________________________
Please indicate your current relationship status:
• Single
• Dating
• Married or cohabitating
• Separated or divorced
• Widowed
How many children do you have?
What is the highest level of education you have completed?
• None
• Elementary/primary
• High school
• Some college/university
• College/university
• Graduate/post-graduate (Masters)
• Professional (e.g., JD, MBA, MD)
• Doctoral (PhD)
How many siblings do you have?
Older
brothers_______
Younger
brothers_______ Older sisters_______
Younger
sisters______
How many siblings do you have that are biologically related to you through your
mother:
Older
brothers_______
Younger
brothers_______ Older sisters_______
Younger
sisters______
Which hand do you use predominately to write with?
Left Right
What is your current job status?

90
• Employed full time
• Employed part time
• Previous employed, but not currently employed
• Never employed
• Retired
If employed, what is your current position/title?____________
What is the total amount of money your family household earned last year?
Less than
$10,000
$10,001 to
$20,000
$20,001 to
$30,000
$30,001 to
$40,000
$40,001 to
$50,000
$50,001 to
$75,000
$75,000 to
$100,000
More than
$100,000
How much money did you personally earn last year?
Less than
$10,000
$10,001 to
$20,000
$20,001 to
$30,000
$30,001 to
$40,000
$40,001 to
$50,000
$50,001 to
$75,000
$75,000 to
$100,000
More than
$100,000
Have you ever been arrested?
Yes No
If yes, at what age were you first arrested? _______
Have you ever been charged with a crime?
Yes No
If yes, at what age were you first charged with a crime? _________
Have you ever been convicted or found guilty of committing a crime?
Yes No
If yes, at what age were you first convicted of a crime? _________
Have you ever been incarcerated?
Yes No
If yes, at what age were you first incarcerated?_________
If yes, what is the longest time period that you were incarcerated? (in years OR
months)
Years Months
Have you been diagnosed with a mental illness?
If so, what kind? __________

91
Appendix B
Peg Test
Participants are instructed to move the pegs from the dish to the 9 holes and then return
them back into the container as quickly as possible.
“Pick up the pegs one at a time, using your right (or left) hand only, and put them into
the holes in any order until the holes are filled. Then, remove the pegs one at a time and
return to the container. Stabilize the peg board with your left (or right) hand. This is a
practice test. See how fast you can put all of the pegs in and take them out again. Are
you ready? GO!!”

92
Appendix C
Hand grip strength
(1) Sit the participant comfortably in a standard chair with legs, back support and fixed
arms. Use the same chair for every measurement. (2) Ask them to rest their forearms on
the arms of the chair with their wrist just over the end of the arm of the chair—wrist in a
neutral position, thumb facing upwards. (3) Demonstrate how to use the Jamar handgrip
dynamometer to show that grip- ping very tightly registers the best score. (4) Start with
the right hand. (5) Position the hand so that the thumb is round one side of the handle and
the four fingers are around the other side. The instrument should feel comfortable in the
hand. Alter the position of the handle if necessary. (6) The observer should rest the base
of the dynam- ometer on the palm of their hand as the subject holds the dynamometer.
The aim of this is to support the weight of the dynamometer (to negate the effect of
gravity on peak strength), but care should be taken not to restrict its movement. (7)
Encourage the participant to squeeze as long and as tightly as possible or until the needle
stops rising. Once the needle stops rising the participant can be instructed to stop
squeezing. (8) Read grip strength in kilograms from the outside dial and record the result
to the nearest 1 kg on the data entry form. (9) Repeat measurement in the left hand. (10)
Do two further measurements for each hand alternating sides to give three readings in
total for each side. (11) The best of the six grip strength measurements is used in
statistical ana- lyses so as to encourage the subjects to get as high a score as possible. (12)
Also record hand domi- nance, i.e., right, left or ambidextrous (people who can genuinely
write with both hands).
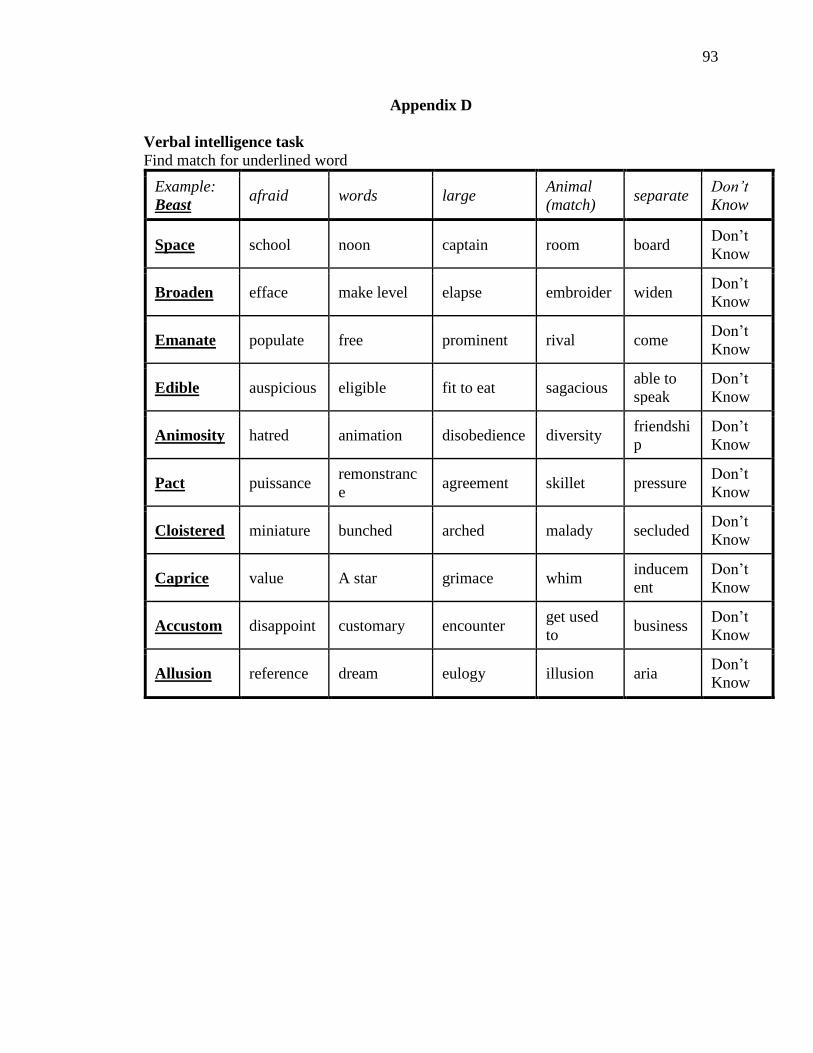
93
Appendix D
Verbal intelligence task
Find match for underlined word
Example:
Beast afraid words large
Animal
(match) separate
Don’t
Know
Space school noon captain room board Don’t
Know
Broaden efface make level elapse embroider widen Don’t
Know
Emanate populate free prominent rival come Don’t
Know
Edible auspicious eligible fit to eat sagacious able to
speak
Don’t
Know
Animosity hatred animation disobedience diversity friendshi
p
Don’t
Know
Pact puissance remonstranc
e agreement skillet pressure
Don’t
Know
Cloistered miniature bunched arched malady secluded Don’t
Know
Caprice value A star grimace whim inducem
ent
Don’t
Know
Accustom disappoint customary encounter get used
to business
Don’t
Know
Allusion reference dream eulogy illusion aria Don’t
Know

94
Appendix E
Omron Fat Loss Monitor HBF 306C
Records body fat % and Body Mass Index
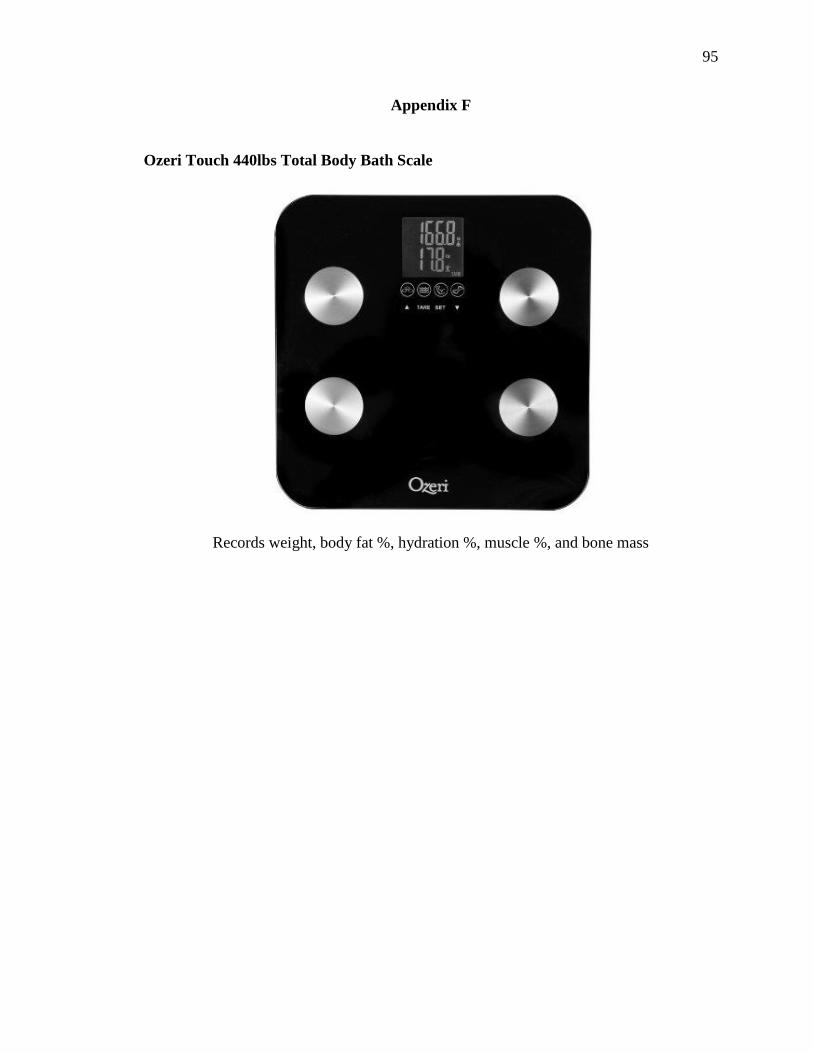
95
Appendix F
Ozeri Touch 440lbs Total Body Bath Scale
Records weight, body fat %, hydration %, muscle %, and bone mass

96
Appendix G
Self-Perceived Embodied Capital Scale
If you were one of ten people to perform a general strength test, which one would you
be?
Weakest Strongest
1 2 3 4 5 6 7 8 9 10
If you were one of ten people to perform the hand grip strength test, which one would
you be?
Weakest Strongest
1 2 3 4 5 6 7 8 9 10
If you were one of 10 people to test your coordination/dexterity, which one would you
be?
Least Most
Coordinated coordinated
1 2 3 4 5 6 7 8 9 10
If you were one of 10 people to have your physical attractiveness evaluated, which one
would you be?
Least Most
Attractive attractive
1 2 3 4 5 6 7 8 9 10
If you were one of 10 people to have your overall attractiveness (including personality,
skills, etc.) evaluated, which one would you be?
Least Most
Attractive attractive
1 2 3 4 5 6 7 8 9 10
If you were one of 10 people to have your verbal intelligence evaluated, which one would
you be?
Least Most
verbally intelligent verbally intelligent
1 2 3 4 5 6 7 8 9 10
If you were one of 10 people to have your emotional intelligence evaluated, which one
would you be? (emotional intelligence being the ability to effectively perceive, appraise,
express, and regulate emotions)
Least Most
emotionally intelligent emotionally intelligent
1 2 3 4 5 6 7 8 9 10

97
If you were one of 10 people to have your social skills evaluated, which one would you
be?
Worst Best
social skills Social skills
1 2 3 4 5 6 7 8 9 10
If you were one of 10 people to have your general intelligence evaluated, which one
would you be?
Least Most
intelligent intelligent
1 2 3 4 5 6 7 8 9 10

98
Appendix H

99
Appendix I
Personal Relative Deprivation Scale-Revised

100
Appendix J
Dispositional Envy Scale
1. I feel envy every day.
2. The bitter truth is that I generally feel inferior to others.
3. Feelings of envy constantly torment me.
4. It is so frustrating to see some people succeed so easily.
5. No matter what I do, envy always plagues me.
6. I am troubled by feelings of inadequacy.
7. It somehow doesn’t seem fair that some people seem to have all the talent.
8. Frankly, the success of my neighbors makes me resent them.
1 = strongly disagree, 2 = moderately disagree, 3 = neither agree nor disagree, 4 =
moder- ately agree, and 5 = strongly agree
Smith, R. H., Parrott, W. G., Diener, E. F., Hoyle, R. H., & Kim, S. H. (1999).
Dispositional envy. Personality and Social Psychology Bulletin, 25, 1007-1020.
doi:10.1177/01461- 672992511008
Internal consistency
coefficient alphas for each sample range from .83 to .86
test-retest
r = .80

101
Appendix K
Benign and Malicious Envy Scale (BeMaS)
1 (strongly disagree) to 6 (strongly agree).
(1) When I envy others, I focus on how I can become equally successful in the future. (B)
(2) I wish that superior people lose their advantage. (M)
(3) If I notice that another person is better than me, I try to improve myself. (B)
(4) Envying others motivates me to accomplish my goals. (B)
(5) If other people have something that I want for myself, I wish to take it away from
them. (M)
(6) I feel ill will toward people I envy. (M)
(7) I strive to reach other people’s superior achievements. (B)
(8) Envious feelings cause me to dislike the other person. (M)
(9) If someone has superior qualities, achievements, or possessions, I try to attain them
for myself. (B)
(10) Seeing other people’s achievements makes me resent them. (M)
(B) – Benign
(M) – Malicious
Lange, J., & Crusius, J. (2014). Dispositional Envy Revisited: Unraveling the
Motivational Dynamics of Benign and Malicious Envy. Personality and social
psychology bulletin, 0146167214564959.
Internal consistency
The benign and malicious envy facets have high internal consistency, α = .79-.85 and .83-
.90, respectively.

102
Appendix L
Domain-Specific Envy Scale
Envy - attraction
1. It eats me up inside when people come across to others better than I do.
2. It annoys me when others are more popular than I am.
3. It disturbs me when people get along with others better than I do.
4. It makes me feel uncomfortable when others are more attractive than I am.
5. It bothers me when others can have every romantic partner that they want.
Envy - competence
6. It disturbs me when others have a greater fund of knowledge than I have.
7. It disturbs me when others can express themselves verbally better than I can.
8. It bothers me when others are quicker on the uptake of an issue than I am.
9. It is hard to bear when other people are more intelligent than I am.
10. It bothers me when others are more creative than I am.
Envy - wealth
11. It is hard for me to bear when others can buy everything they want to buy.
12. It bothers me when others own things that I cannot have.
13. It troubles me when others have higher tech equipment than I have.
14. It bothers me when others live in a better neighborhood than I do.
15. It is hard for me to bear when others have more clothes in their wardrobe than I have.
1 (not at all) 7 (very much)
Rentzsch, K., & Gross, J. J. (2015). Who turns green with envy? Conceptual and
empirical perspectives on dispositional envy. European Journal of Personality, 29(5),
530-547.
Interal consistency
Tested across 4 studies (Cronbach’s α = .91-.93)
attraction
.80-.90
competence
.84-.89
wealth
.84-.88
test-retest
total(r = .77, p < .001). Retest correlations were stable across domains (i.e., r = .78, p <
.001 for attraction; r = .72, p < .001 for competence; and r = .73, p < .001 for wealth)

103
Appendix M
New General Self-Efficacy Scale
1 = Not at all true 2 = Hardly true 3 = Moderately true 4 = Exactly true
New General Self-Efficacy Scale
1. I will be able to achieve most of the goals that I have set for myself.
2. When facing difficult tasks, I am certain that I will accomplish them.
3. In general, I think that I can obtain outcomes that are important to me.
4. I believe I can succeed at most any endeavor to which I set my mind.
5. I will be able to successfully overcome many challenges.
6. I am confident that I can perform effectively on many different tasks.
7. Compared to other people, I can do most tasks very well.
8. Even when things are tough, I can perform quite well.
Schwarzer, R., & Jerusalem, M. (1995). Generalized Self-Efficacy scale. In J. Weinman,
S. Wright, & M. Johnston, Measures in health psychology: A user’s portfolio. Causal and
control beliefs (pp. 35-37). Windsor, UK: NFER-NELSON.
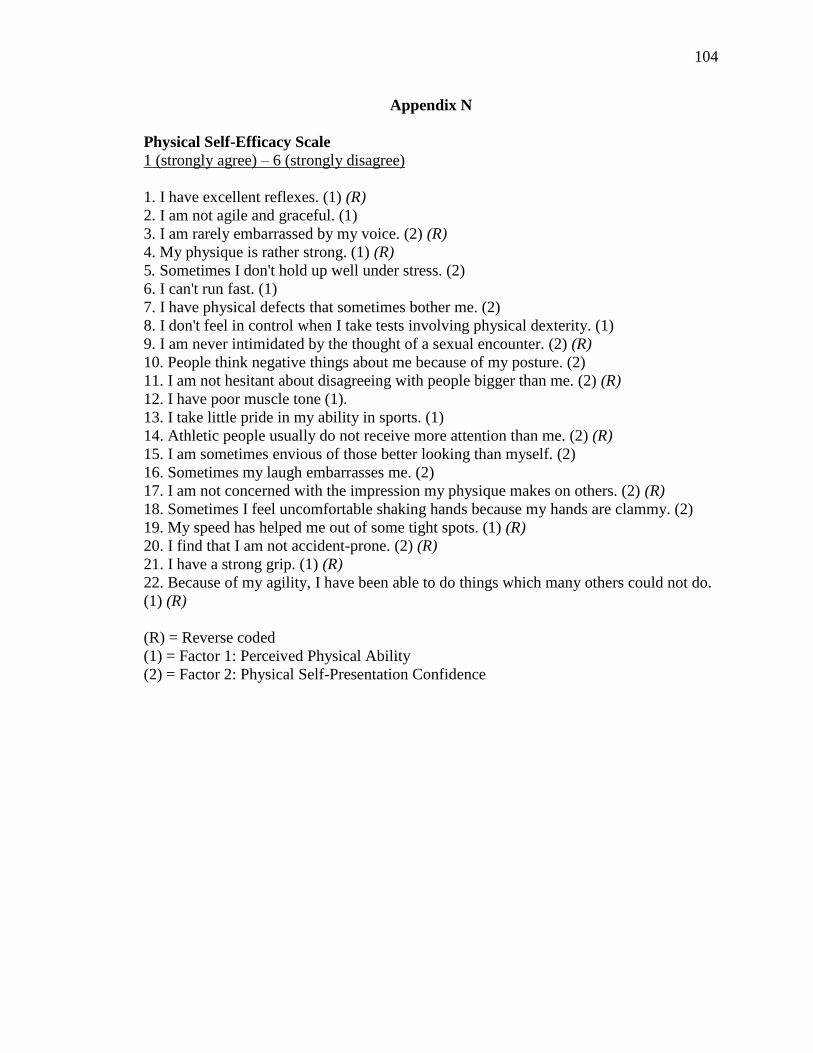
104
Appendix N
Physical Self-Efficacy Scale
1 (strongly agree) – 6 (strongly disagree)
1. I have excellent reflexes. (1) (R)
2. I am not agile and graceful. (1)
3. I am rarely embarrassed by my voice. (2) (R)
4. My physique is rather strong. (1) (R)
5. Sometimes I don't hold up well under stress. (2)
6. I can't run fast. (1)
7. I have physical defects that sometimes bother me. (2)
8. I don't feel in control when I take tests involving physical dexterity. (1)
9. I am never intimidated by the thought of a sexual encounter. (2) (R)
10. People think negative things about me because of my posture. (2)
11. I am not hesitant about disagreeing with people bigger than me. (2) (R)
12. I have poor muscle tone (1).
13. I take little pride in my ability in sports. (1)
14. Athletic people usually do not receive more attention than me. (2) (R)
15. I am sometimes envious of those better looking than myself. (2)
16. Sometimes my laugh embarrasses me. (2)
17. I am not concerned with the impression my physique makes on others. (2) (R)
18. Sometimes I feel uncomfortable shaking hands because my hands are clammy. (2)
19. My speed has helped me out of some tight spots. (1) (R)
20. I find that I am not accident-prone. (2) (R)
21. I have a strong grip. (1) (R)
22. Because of my agility, I have been able to do things which many others could not do.
(1) (R)
(R) = Reverse coded
(1) = Factor 1: Perceived Physical Ability
(2) = Factor 2: Physical Self-Presentation Confidence

105
Appendix O
Scale of Perceived Social Self-Efficacy (PSSE)
rate 1(no confidence)- 5(complete confidence)
1. Start a conversation with someone you don’t know very well.
2. Express your opinion to a group of people discussing a subject that is of interest to
you.
3. Work on a school, work, community or other project with people you don’t know
very well
4. Help to make someone you’ve recently met feel comfortable with your group of
friends.
5. Share with a group of people an interesting experience you once had.
6. Put yourself in a new and different social situation.
7. Volunteer to help organize an event.
8. Ask a group of people who are planning to engage in a social activity (e.g., go to a
movie) if you can join them.
9. Get invited to a party that is being given by a prominent or popular individual.
10. Volunteer to help lead a group or organization.
11. Keep your side of the conversation.
12. Be involved in group activities.
13. Find someone to spend a weekend afternoon with.
14. Express your feelings to another person.
15. Find someone to go to lunch with.
16. Ask someone out on a date.
17. Go to a party or social function where you probably won’t know anyone.
18. Ask someone for help when you need it.
19. Make friends with a member of your peer group.
20. Join a lunch or dinner table where people are already sitting and talking.
21. Make friends in a group where everyone else knows each other.
22. Ask someone out after s/he was busy the first time you asked.
23. Get a date to a dance that your friends are going to.
24. Call someone you’ve met and would like to know better.
25. Ask a potential friend out for coffee.

106
Appendix P
Consent
Project Title: Individual differences in mindfulness and social comparisons
Researcher(s): Dallas Novakowski, Master’s Thesis Student, Psychology, University of
Regina, (306) 550-8646, [email protected]
Tyler Meadows, undergraduate Student, Psychology, University of Regina, (306) 737-
6058, [email protected]
Supervisor: Sandeep Mishra, Faculty of Business Administration, (306) 737-3250
Purpose(s) and Objective(s) of the Research:
The purpose of this research project is to determine whether certain individual differences
such as personality, intelligence, facial symmetry, strength, are associated with specific
types of risk-taking behaviour such as asocial risks (extreme sports) and prosocial risks
(heroic acts).
Procedures:
· You will be asked to fill in several self-report measures on your risk-taking behaviours
as well as several questionnaires about yourself. Additionally, you will be asked to
complete a brief test of verbal intelligence, a measurement of hand grip strength, an
assessment of your weight and height, and to have your picture taken in order to calculate
your facial symmetry.
· This study will take approximately 60 minutes
Please feel free to ask any questions regarding the procedures and goals of the study or
your role.
Potential Risks:
There is a risk for psychological or emotional distress as you will be asked to report some
potentially unpleasant information: feelings of anxiety, intolerance of uncertainty, past
antisocial or criminal behaviours, and any diagnoses of mental illness. There may also be
some risk of muscle discomfort when measuring handgrip strength.
· If you feel discomfort when faced with any questions or measurements, you may skip
them with no penalty.
· Should you experience any significant distress, please contact the Saskatchewan crisis
hotline: http://www.sk.211.ca/saskatchewan_247_hour_crisis_hotlines - 6th
Compensation:
· By participating in this study you are eligible for 2% bonus for an eligible class in either
the Psychology or Business Participant Pool. Preference for the application of this credit
should be declared before the study begins.
Confidentiality:
· Although the data from this research project will be published and presented at
conferences, the data will be reported in aggregate form, so that it will not be possible to
identify individuals.

107
· If you have participated in the online version of this study before, titled “Individual
differences and risk-taking behaviour,” you will be asked to provide your email address
so that we may link the data from your two sessions. Otherwise, do not put your name or
other identifying information on the materials used.
· Although your picture will be taken and may be used for future studies outside of the
city, it will only be distributed or otherwise viewed outside of our studies with your
consent.
Right to Withdraw:
Your participation is voluntary and you can answer only those questions and participate
in tasks that you are comfortable with. You may withdraw from the research project for
any reason, at any time without explanation or penalty of any sort.
· Whether you choose to participate or not will have no effect on your class standing or
how you will be treated.
Should you wish to withdraw during the study, your course credit will still be applied and
your data will be excluded from analyses and destroyed. Your right to withdraw data
from the study will apply until results have been disseminated. After April 16th, 2016, it
is possible that some form of research dissemination will have already occurred and it
may not be possible to withdraw your data.
Follow up:
To obtain results from the study, please inform the researcher via the contact information
listed at the top of this section.
Questions or Concerns:
Contact the researcher(s) using the information at the top of page 1; This project has been
approved on ethical grounds by the UofR Research Ethics Board on (October 27,
2015). Any questions regarding your rights as a participant may be addressed to the
committee at (585-4775 or [email protected]). Out of town participants may
call collect.
You will be asked to have your picture taken and saved for analysis, do you consent to
having your face photographed? (Y/N)
If you have your picture taken, do you consent to photographs being viewed by
participants in future studies?
Note: photographs will only be shown to participants in later projects if they live outside
of Regina, minimizing the chances of you being recognized by your peers.
(Y/N)

108
Appendix Q
DEBRIEFING
A Study of individual differences in social comparisons and mindfulness
The study you just participated in was designed to understanding the relationships
between (a) tendency to feel negative emotions when at a disadvantage, (b) Intrinsic
factors such as strength, coordination, verbal intelligence, and facial symmetry, and (c) a
variety of other individual differences.
The purpose of this research is to examine whether various individual differences
are associated with greater negative reactions to unfavourable social comparisons. We are
specifically interested in the association between embodied capital (strength,
coordination, verbal intelligence, facial symmetry) and social comparisons and
individuals’ tendency to experience envy and their ability to be mindful of their present
experiences. We expect that since individuals high in these forms of embodied capital can
effectively compete for resources, status, sexual partners, and so on, they will have less
negative reactions when comparing themselves to others. Due to the stress of potentially
being at a disadvantage, we also expect that people low in traits such as strength,
intelligence, and attractiveness will have a more difficult time being mindful
Additionally, you completed measures of personality, mindfulness, self-esteem,
social acceptance, mate value, relative deprivation, self-efficacy, narcissism, self-
perceived attractiveness, strength, and intelligence. We are interested in exploring how
these individual differences are associated with different patterns of social comparisons
and risk-taking behaviours.
Thank you for participating in this study! Your time and effort is very much
appreciated. If you have any further comments or questions about this research project,
please contact us:
PRIMARY RESEARCHER:
Dallas Novakowski, Undergraduate Student, Department of Psychology, University of
Regina [email protected] (306) 550-8646
Tyler Meadows, undergraduate Student, Psychology, University of Regina
[email protected] (306) 737-6058
Supervisor: Sandeep Mishra, Ph.D., Faculty of Business Administration, University of
Regina
[email protected] (306) 585-4783
If you feel distress for any reason, you may reach the Saskatchewan Crisis Hotline at
http://www.sk.211.ca/saskatchewan_247_hour_crisis_hotlines - 6th
Results will be posted at http://www.sandeepmishra.ca/?page_id=227; please make
record this link and check back after <April 16, 2017> for full results.
The Research Ethics Board at the University of Regina has approved this project. If you
have any questions or concerns about your rights or treatment as a research participant,
you may contact the Chair of the Ethics Board at (306) 585-4775 (you may call collect if

109
you wish) or by email: [email protected]. If you require any assistance related
to your participation in this study, you can contact any member of the research team and
thereafter be provided, or guided to a provider, of the assistance they require.

110
Appendix R
Procedure
1. Give participants briefing on procedure
a. They will sit at a computer and complete a series of self-report instruments
as well as a small verbal IQ test
b. Afterwards, they will 1) have their picture taken, 2) perform a hand grip
strength test, 3) do a test of coordination, and 4) have their body fat
percentage measures on an upper body and a lower body scale
2. Before starting, note time and date next to participant number (on a shared excel
spreadsheet, or if necessary, on a piece of paper)
a. Participant number will be used to connect data from the computer task to
the in-person task
3. Computer task
a. When seating participant at their computer, enter their participant number
where prompted (before consent form)
b. Let participant know that they can skip any items or measures they do not
wish to answer and that they can come to the researcher with questions at
any time. Instruct participant to approach researcher when they are
finished
In-lab section
4. Hand grip strength test
a. Right hand tested first
b. bicep parallel to torso
c. Elbow at 90º
d. Sit in chair with back support and fixed arms (same chair every time)
e. Wrists in a neutral position just over the arm of the chair, thumb facing
upward
f. Observer rests base of the dynamometer in the palm of their hand while
participant grips (not restricting movement, just negating gravity)
g. Encourage participant to grip as hard and long as possible
h. Once needle stops rising, participant can be instructed to stop squeezing
i. Read measurement in kilograms from outside dial and record to nearest 1
kg
j. Rest one minute then perform with left hand
k. Three readings for each hand should be taken in total (three left, three
right)
5. Photograph
a. Ask participant if they have consented to having their picture taken
b. Standardize distance, zoom, and lighting conditions
c. Take four to six images
d. Instructions
i. Please tie your hair back and maintain a neutral expression
e. Exclude
i. Facial hair obscuring landmarks

111
ii. No image with neutral expression
iii. No image with planar orientation of the face
6. Peg task
a. Centered in front of person
b. Dominant hand tested first
c. Instructions
i. “Pick up the pegs one at a time, using your right (or left) hand
only, and put them into the holes in any order until the holes are
filled. Then, remove the pegs one at a time and return to the
container. Stabilize the peg board with your left (or right) hand.
This is a practice test. See how fast you can put all of the pegs in
and take them out again. Are you ready? GO!!”
ii. “This will be the actual test. The instructions are the same. Work
as quickly as you can. Are you ready? GO! [During the test]
“Faster!” [As soon as the last peg is in the board] “Out
again…faster!”
d. Repeat with left hand (5 times each?)
7. Height
a. Ask participants to take off their shoes and stand in front of measuring
tape, measure in centimetres
8. BMI
a. Ask participant if they have a pacemaker or any other electronic medical
device – these measures use electrical currents and could KILL
participants
9. Lower body (do first to determine weight)
a. Ask participants their age, input age and height (convert to feet)
b. Record layers/ask participants to take off any excess garments
i. Ask them to take off their socks and stand on the scale
ii. Once reading is complete ask them to step off and record weight,
body fat percentage, hydration, muscle, and bone density (take
picture?)
c. Instruct them to put footwear back on
10. Upper body
a. Enter weight (in kilograms) and height (in centimeters)
b. Instruct participant to stand and hold the scale with elbows locked at 90
degrees (OMRON instruction manual)
c. Record body fat percentage in athlete and nonathlete modes
i. Nicole E. Jensky-Squires, et alia, “Validity and reliability of body
composition analysers in children and adults,” British Journal of
Nutrition, vol 100 (2008), pp. 859–865. All quotes and citations
from this article unless otherwise noted.
d. Errors
i. E1 – electrodes not firmly grasped
ii. E3 - hands are dry (moisten with a wet towel)
iii. E4 - % is outside of measurable range
iv. E5 + E6 – Irregular operation (turn off and on again)

112
e. If “ERR” more than twice, record missing information
11. Thank participant for their time, give them a debriefing form
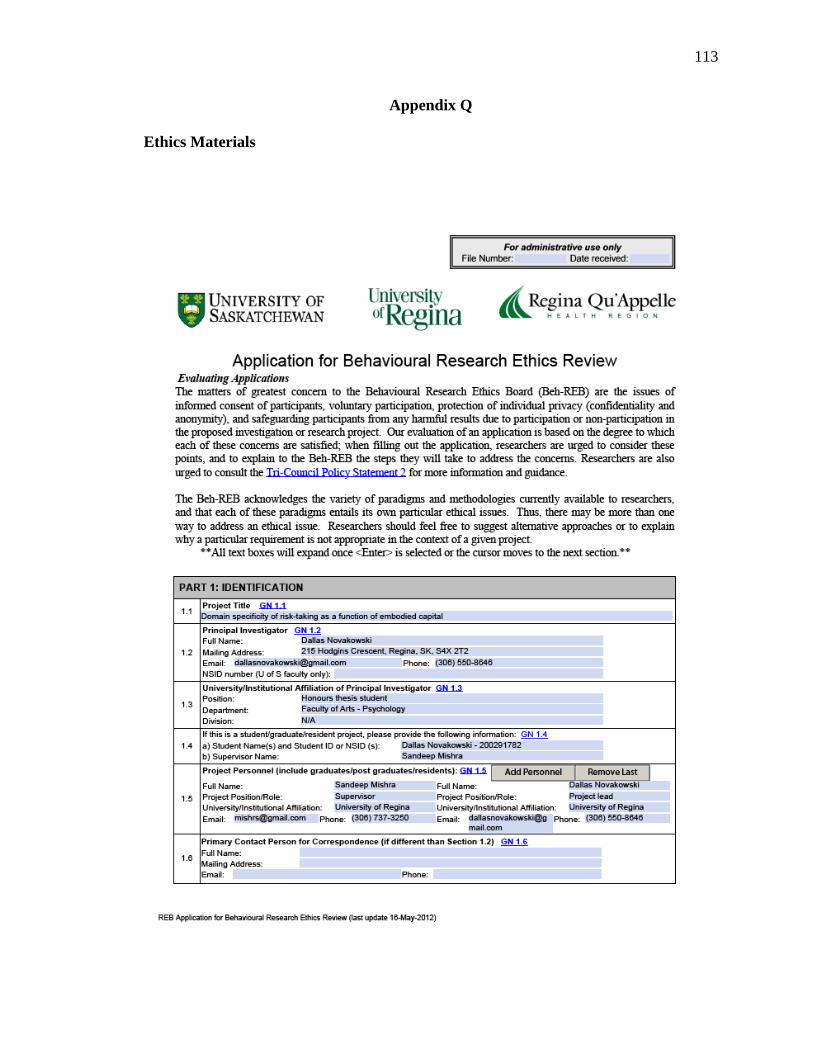
113
Appendix Q
Ethics Materials

114

115

116

117

118

119

120

121

122
123

124

125

126

127
Tables and Figures
Table 1. Item-level intercorrelations within the Self-Perceived Embodied Capital Scale, bootstrapped and controlling for age
and gender (n = 141).
SPECgrip SPECpA SPECcrd SPECvIQ SPECgIQ SPECoA SPECeIQ SPECstrong
SPECpA 0.45*** SPECcrd 0.41*** 0.38*** SPECvIQ 0.19* 0.36*** 0.34*** SPECgIQ 0.24** 0.36*** 0.26** 0.60*** SPECoA 0.26** 0.71*** 0.43*** 0.50*** 0.39*** SPECeIQ 0.08 0.17* 0.14 0.31*** 0.17* 0.25** SPECstrong 0.74*** 0.39*** 0.47*** 0.32*** 0.29** 0.35*** 0.21* SPECsoc 0.14 0.26** 0.17* 0.44*** 0.36*** 0.38*** 0.34*** 0.16
Notes: Significance tests were two-tailed. * p < .05; ** p < .01; *** p < .001. SPEC=Self-Perceived Embodied Capital Scale.
SPECgrip=grip strength, SPECpA=physical attractiveness, SPECcrd=coordination, SPECvIQ=verbal intelligence,
SPECgIQ=general intelligence, SPECoA=overall attractiveness, SPECeIQ=emotional intelligence, SPECstrong=overall
strength, SPECsoc=social skills..

128
Table 2. Item-level bootstrapped partial correlations within the Self-Attributes Questionnaire, controlling for age and gender
(n = 141).
SAQint SAQsoc SAQart SAQath SAQatt SAQlead SAQcs SAQes SAQhum
SAQsoc 0.21* SAQart 0.09 0.12 SAQath 0.21* 0.19* 0.16 SAQatt 0.27** 0.29*** 0.29*** 0.48*** SAQlead 0.34*** 0.48*** 0.19* 0.16 0.17* SAQcs 0.41*** 0.26** 0.14 0.2* 0.26** 0.33*** SAQes 0.31*** 0.2* 0.11 0.12 0.27** 0.35*** 0.33*** SAQhum 0.19* 0.4*** 0.17* 0.36*** 0.32*** 0.14 0.31*** 0.18* SAQdisc 0.44*** 0.22** 0.12 0.16 0.31*** 0.29** 0.37*** 0.41*** 0.10
Notes: Significance tests were two-tailed. * p < .05; ** p < .01; *** p < .001. SAQ = Self-Attributes Questionnaire
SAQint=intellectual/academic ability, SAQsoc=social skills, SAQart=artisitic and/or musical ability, SAQath=competency or
skill at sports, SAQatt=physical attractiveness, SAQlead=leadership ability, SAQcs=common sense, SAQes=emotional
stability, SAQchum=humour, SAQdisc=discipline.

129
Table 3. Intercorrelations between items from the Self-Perceived Embodied Capital Scale and the Self-Attributes
Questionnaire, bootstrapped and controlling for age and gender (n = 141).
SPECgrip SPECpA SPECcrd SPECvIQ SPECgIQ SPECoA SPECeIQ SPECstrong SPECsoc
SAQint 0.12 0.20* 0.20* 0.46*** 0.53*** 0.27** 0.27** 0.18* 0.14
SAQsoc 0.14 0.24** 0.18* 0.42*** 0.27** 0.37*** 0.28** 0.26** 0.7***
SAQart 0.05 0.17* 0.05 0.24** 0.11 0.20* 0.10 0.16 0.10
SAQath 0.52*** 0.54*** 0.56*** 0.25** 0.11 0.4*** 0.11 0.5*** 0.18*
SAQatt 0.29*** 0.77*** 0.29** 0.28** 0.29*** 0.68*** 0.20* 0.30*** 0.23**
SAQlead 0.12 0.08 0.15 0.34*** 0.26** 0.19* 0.28** 0.26** 0.32***
SAQcs 0.13 0.21* 0.18* 0.30*** 0.3*** 0.24** 0.28** 0.17* 0.16
SAQes 0.12 0.20* 0.14 0.23** 0.07 0.27** 0.41*** 0.16 0.12
SAQhum 0.17* 0.26** 0.13 0.24** 0.08 0.23** 0.22** 0.22** 0.25**
SAQdisc 0.12 0.26** 0.16 0.31*** 0.28** 0.29*** 0.25** 0.15 0.10
Notes: Significance tests were two-tailed. * p < .05; ** p < .01; *** p < .001. Conceptually-related relationships are bolded
and underlined. SAQ = Self-Attributes Questionnaire SAQint=intellectual/academic ability, SAQsoc=social skills,
SAQart=artisitic and/or musical ability, SAQath=competency or skill at sports, SAQatt=physical attractiveness,
SAQlead=leadership ability, SAQcs=common sense, SAQes=emotional stability, SAQchum=humour, SAQdisc=discipline.
SPEC=Self-Perceived Embodied Capital Scale. SPECgrip=grip strength, SPECpA=physical attractiveness,
SPECcrd=coordination, SPECvIQ=verbal intelligence, SPECgIQ=general intelligence, SPECoA=overall attractiveness,
SPECeIQ=emotional intelligence, SPECstrong=overall strength, SPECsoc=social skills
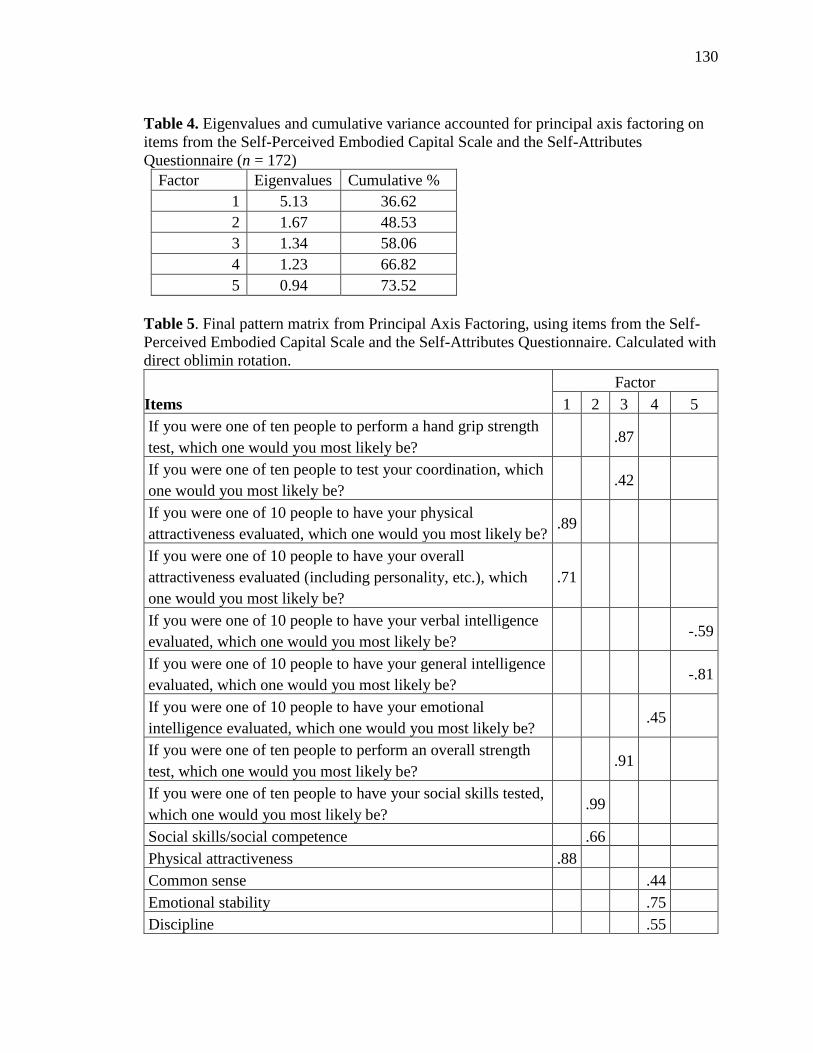
130
Table 4. Eigenvalues and cumulative variance accounted for principal axis factoring on
items from the Self-Perceived Embodied Capital Scale and the Self-Attributes
Questionnaire (n = 172)
Factor Eigenvalues Cumulative %
1 5.13 36.62
2 1.67 48.53
3 1.34 58.06
4 1.23 66.82
5 0.94 73.52
Table 5. Final pattern matrix from Principal Axis Factoring, using items from the Self-
Perceived Embodied Capital Scale and the Self-Attributes Questionnaire. Calculated with
direct oblimin rotation.
Items
Factor
1 2 3 4 5
If you were one of ten people to perform a hand grip strength
test, which one would you most likely be? .87
If you were one of ten people to test your coordination, which
one would you most likely be? .42
If you were one of 10 people to have your physical
attractiveness evaluated, which one would you most likely be? .89
If you were one of 10 people to have your overall
attractiveness evaluated (including personality, etc.), which
one would you most likely be?
.71
If you were one of 10 people to have your verbal intelligence
evaluated, which one would you most likely be? -.59
If you were one of 10 people to have your general intelligence
evaluated, which one would you most likely be? -.81
If you were one of 10 people to have your emotional
intelligence evaluated, which one would you most likely be? .45
If you were one of ten people to perform an overall strength
test, which one would you most likely be? .91
If you were one of ten people to have your social skills tested,
which one would you most likely be? .99
Social skills/social competence .66
Physical attractiveness .88
Common sense .44
Emotional stability .75
Discipline .55
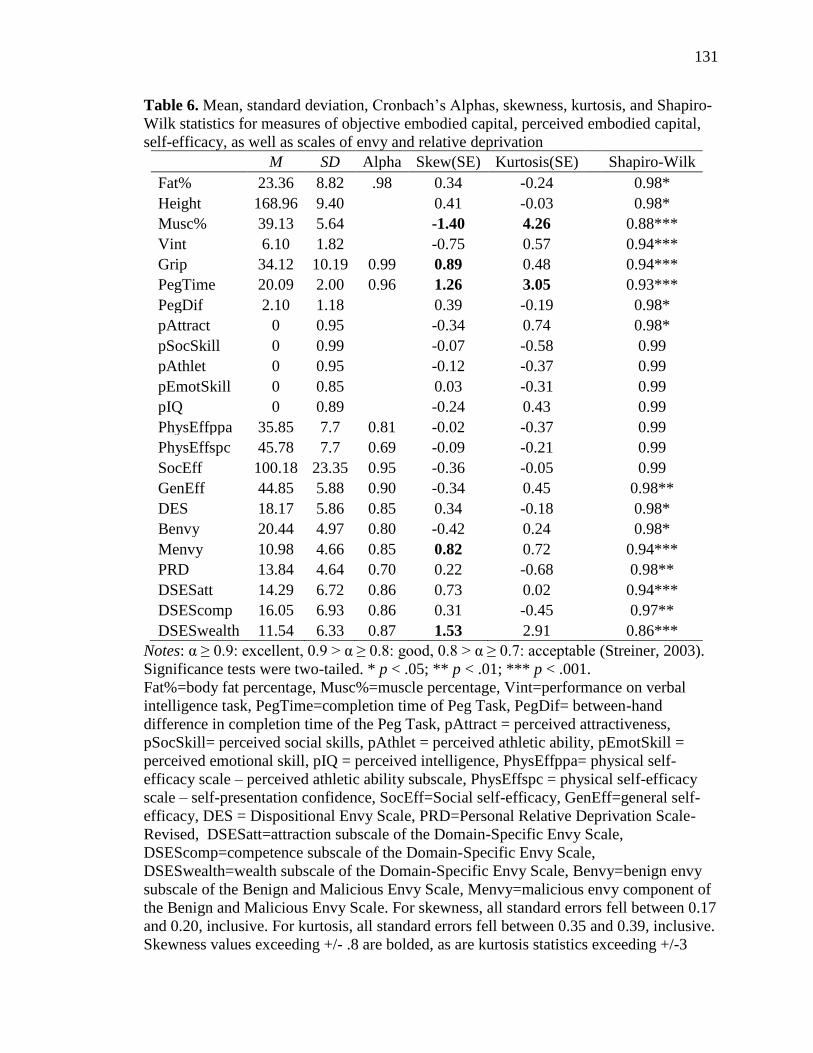
131
Table 6. Mean, standard deviation, Cronbach’s Alphas, skewness, kurtosis, and Shapiro-
Wilk statistics for measures of objective embodied capital, perceived embodied capital,
self-efficacy, as well as scales of envy and relative deprivation
M SD Alpha Skew(SE) Kurtosis(SE) Shapiro-Wilk
Fat% 23.36 8.82 .98 0.34 -0.24 0.98*
Height 168.96 9.40 0.41 -0.03 0.98*
Musc% 39.13 5.64 -1.40 4.26 0.88***
Vint 6.10 1.82 -0.75 0.57 0.94***
Grip 34.12 10.19 0.99 0.89 0.48 0.94***
PegTime 20.09 2.00 0.96 1.26 3.05 0.93***
PegDif 2.10 1.18 0.39 -0.19 0.98*
pAttract 0 0.95 -0.34 0.74 0.98*
pSocSkill 0 0.99 -0.07 -0.58 0.99
pAthlet 0 0.95 -0.12 -0.37 0.99
pEmotSkill 0 0.85 0.03 -0.31 0.99
pIQ 0 0.89 -0.24 0.43 0.99
PhysEffppa 35.85 7.7 0.81 -0.02 -0.37 0.99
PhysEffspc 45.78 7.7 0.69 -0.09 -0.21 0.99
SocEff 100.18 23.35 0.95 -0.36 -0.05 0.99
GenEff 44.85 5.88 0.90 -0.34 0.45 0.98**
DES 18.17 5.86 0.85 0.34 -0.18 0.98*
Benvy 20.44 4.97 0.80 -0.42 0.24 0.98*
Menvy 10.98 4.66 0.85 0.82 0.72 0.94***
PRD 13.84 4.64 0.70 0.22 -0.68 0.98**
DSESatt 14.29 6.72 0.86 0.73 0.02 0.94***
DSEScomp 16.05 6.93 0.86 0.31 -0.45 0.97**
DSESwealth 11.54 6.33 0.87 1.53 2.91 0.86***
Notes: α ≥ 0.9: excellent, 0.9 > α ≥ 0.8: good, 0.8 > α ≥ 0.7: acceptable (Streiner, 2003).
Significance tests were two-tailed. * p < .05; ** p < .01; *** p < .001.
Fat%=body fat percentage, Musc%=muscle percentage, Vint=performance on verbal
intelligence task, PegTime=completion time of Peg Task, PegDif= between-hand
difference in completion time of the Peg Task, pAttract = perceived attractiveness,
pSocSkill= perceived social skills, pAthlet = perceived athletic ability, pEmotSkill =
perceived emotional skill, pIQ = perceived intelligence, PhysEffppa= physical self-
efficacy scale – perceived athletic ability subscale, PhysEffspc = physical self-efficacy
scale – self-presentation confidence, SocEff=Social self-efficacy, GenEff=general self-
efficacy, DES = Dispositional Envy Scale, PRD=Personal Relative Deprivation Scale-
Revised, DSESatt=attraction subscale of the Domain-Specific Envy Scale,
DSEScomp=competence subscale of the Domain-Specific Envy Scale,
DSESwealth=wealth subscale of the Domain-Specific Envy Scale, Benvy=benign envy
subscale of the Benign and Malicious Envy Scale, Menvy=malicious envy component of
the Benign and Malicious Envy Scale. For skewness, all standard errors fell between 0.17
and 0.20, inclusive. For kurtosis, all standard errors fell between 0.35 and 0.39, inclusive.
Skewness values exceeding +/- .8 are bolded, as are kurtosis statistics exceeding +/-3

132
Table 7. Bootstrapped correlations between objective indices of embodied capital,
controlling for age and gender (n=100).
Fat% HeightCM Musc% Vint Grip PegTime
HeightCM 0.09
Musc% -0.85*** -0.20*
Vint 0.01 0.15 -0.09
Grip 0.08 0.33** -0.15 0.25*
PegTime -0.03 -0.10 -0.03 -0.04 -0.27**
PegDif 0.20* 0.03 -0.17 -0.01 -0.12 0.20*
Notes: Significance tests were two-tailed. * p < .05; ** p < .01; *** p < .001.
Fat%=body fat percentage, Musc%=muscle percentage, Vint=performance on verbal
intelligence task, PegTime=completion time of peg task, PegDif= between-hand
difference in completion time of the peg task,
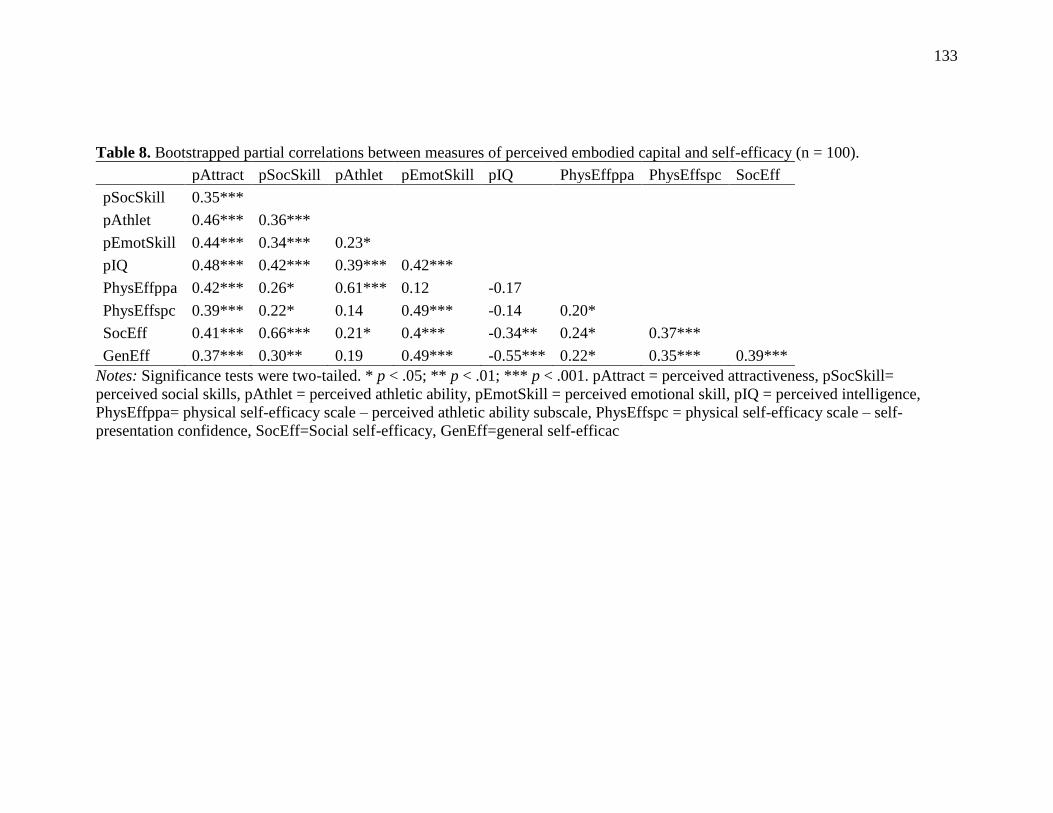
133
Table 8. Bootstrapped partial correlations between measures of perceived embodied capital and self-efficacy (n = 100).
pAttract pSocSkill pAthlet pEmotSkill pIQ PhysEffppa PhysEffspc SocEff
pSocSkill 0.35***
pAthlet 0.46*** 0.36***
pEmotSkill 0.44*** 0.34*** 0.23*
pIQ 0.48*** 0.42*** 0.39*** 0.42***
PhysEffppa 0.42*** 0.26* 0.61*** 0.12 -0.17
PhysEffspc 0.39*** 0.22* 0.14 0.49*** -0.14 0.20*
SocEff 0.41*** 0.66*** 0.21* 0.4*** -0.34** 0.24* 0.37***
GenEff 0.37*** 0.30** 0.19 0.49*** -0.55*** 0.22* 0.35*** 0.39***
Notes: Significance tests were two-tailed. * p < .05; ** p < .01; *** p < .001. pAttract = perceived attractiveness, pSocSkill=
perceived social skills, pAthlet = perceived athletic ability, pEmotSkill = perceived emotional skill, pIQ = perceived intelligence,
PhysEffppa= physical self-efficacy scale – perceived athletic ability subscale, PhysEffspc = physical self-efficacy scale – self-
presentation confidence, SocEff=Social self-efficacy, GenEff=general self-efficac

134
Table 9. Bootstrapped partial correlations between objective and subjective indices of
embodied capital, as well as self-efficacy, controlling for age and gender (n = 100).
Fat% HeightCM Musc% Vint Grip PegTime PegDif
pAttract -0.47*** 0.09 0.34** 0.22* 0.09 0.02 -0.06
pSocSkill -0.08 -0.02 0.11 0.16 -0.02 0.04 -0.04
pAthlet -0.16 0.06 0.18 -0.04 0.25* -0.002 0.02
pEmotSkill -0.19 0.13 0.16 0.22* 0.11 -0.004 -0.16
pIQ -0.12 0.12 0.13 0.4*** 0.06 -0.001 0.04
PSEppa -0.41*** -0.11 0.33** -0.06 0.30** -0.24* -0.13
PSEspc -0.19 -0.02 0.17 -0.04 -0.01 -0.16 -0.09
SocEff -0.14 -0.18 0.19 0.06 -0.10 -0.08 0.01
GenEff -0.15 -0.02 0.15 0.27** 0.16 -0.23* -0.14
Notes: Significance tests were two-tailed. * p < .05; ** p < .01; *** p < .001. Fat%=body
fat percentage, Muscle=muscle percentage, Vint=performance on verbal intelligence task,
PegTime=completion time of Peg Task, PegDif= between-hand difference in completion
time of the Peg Task, pAttract = perceived attractiveness, pSocSkill= perceived social
skills, pAthlet = perceived athletic ability, pEmotSkill = perceived emotional skill, pIQ =
perceived intelligence, PhysEffppa= physical self-efficacy scale – perceived athletic
ability subscale, PhysEffspc = physical self-efficacy scale – self-presentation confidence,
SocEff=Social self-efficacy, GenEff=general self-efficacy.
Table 10. Bootstrapped partial correlations between scales measuring envy and relative
deprivation, controlling for age and gender (n = 100).
DES PRDS DSESatt DSEScomp DSESwealth Benvy
PRDS 0.4***
DSESatt 0.52*** 0.35***
DSEScomp 0.28** 0.11 0.64***
DSESwealth 0.47*** 0.28** 0.63*** 0.58***
Benvy 0.29** 0.15 0.34** 0.39*** 0.26**
Menvy 0.63*** 0.42*** 0.51*** 0.41*** 0.59*** 0.28**
Notes: Significance tests were two-tailed. * p < .05; ** p < .01; *** p < .001.DES =
Dispositional Envy Scale, PRD=Personal Relative Deprivation Scale-Revised,
DSESatt=attraction subscale of the Domain-Specific Envy Scale,
DSEScomp=competence subscale of the Domain-Specific Envy Scale,
DSESwealth=wealth subscale of the Domain-Specific Envy Scale, Benvy=benign envy
subscale of the Benign and Malicious Envy Scale, Menvy=malicious envy component of
the Benign and Malicious Envy Scale.
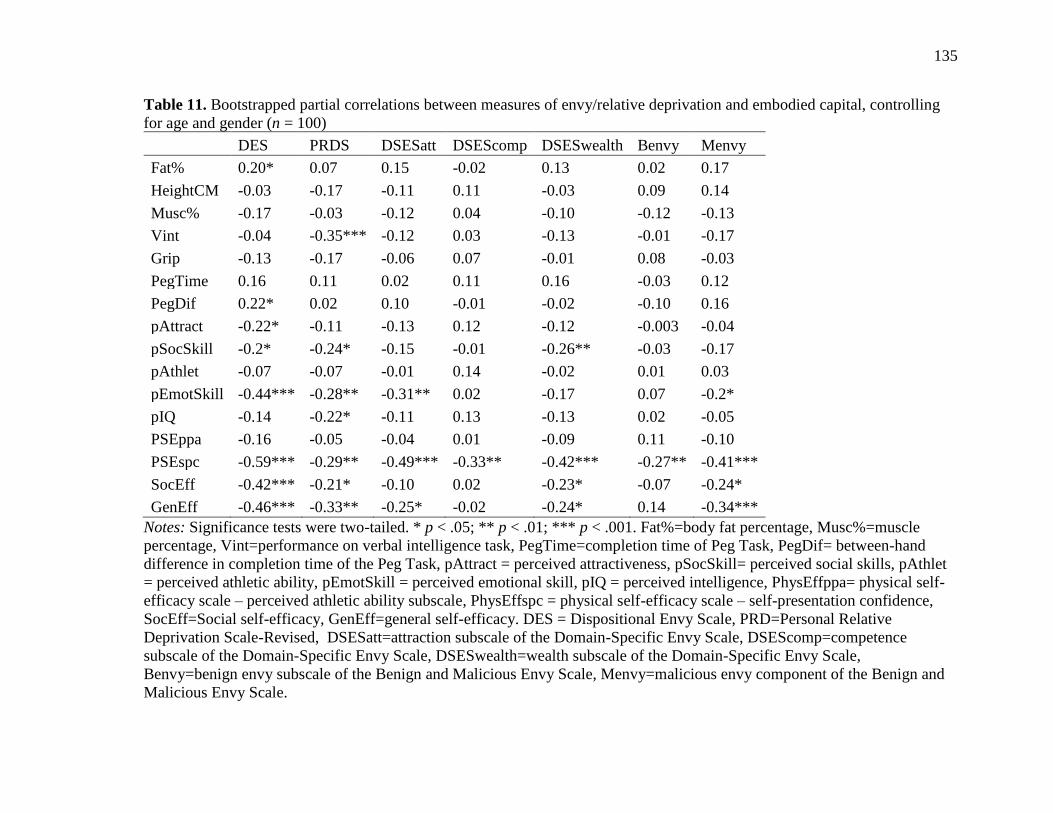
135
Table 11. Bootstrapped partial correlations between measures of envy/relative deprivation and embodied capital, controlling
for age and gender (n = 100)
DES PRDS DSESatt DSEScomp DSESwealth Benvy Menvy
Fat% 0.20* 0.07 0.15 -0.02 0.13 0.02 0.17
HeightCM -0.03 -0.17 -0.11 0.11 -0.03 0.09 0.14
Musc% -0.17 -0.03 -0.12 0.04 -0.10 -0.12 -0.13
Vint -0.04 -0.35*** -0.12 0.03 -0.13 -0.01 -0.17
Grip -0.13 -0.17 -0.06 0.07 -0.01 0.08 -0.03
PegTime 0.16 0.11 0.02 0.11 0.16 -0.03 0.12
PegDif 0.22* 0.02 0.10 -0.01 -0.02 -0.10 0.16
pAttract -0.22* -0.11 -0.13 0.12 -0.12 -0.003 -0.04
pSocSkill -0.2* -0.24* -0.15 -0.01 -0.26** -0.03 -0.17
pAthlet -0.07 -0.07 -0.01 0.14 -0.02 0.01 0.03
pEmotSkill -0.44*** -0.28** -0.31** 0.02 -0.17 0.07 -0.2*
pIQ -0.14 -0.22* -0.11 0.13 -0.13 0.02 -0.05
PSEppa -0.16 -0.05 -0.04 0.01 -0.09 0.11 -0.10
PSEspc -0.59*** -0.29** -0.49*** -0.33** -0.42*** -0.27** -0.41***
SocEff -0.42*** -0.21* -0.10 0.02 -0.23* -0.07 -0.24*
GenEff -0.46*** -0.33** -0.25* -0.02 -0.24* 0.14 -0.34***
Notes: Significance tests were two-tailed. * p < .05; ** p < .01; *** p < .001. Fat%=body fat percentage, Musc%=muscle
percentage, Vint=performance on verbal intelligence task, PegTime=completion time of Peg Task, PegDif= between-hand
difference in completion time of the Peg Task, pAttract = perceived attractiveness, pSocSkill= perceived social skills, pAthlet
= perceived athletic ability, pEmotSkill = perceived emotional skill, pIQ = perceived intelligence, PhysEffppa= physical self-
efficacy scale – perceived athletic ability subscale, PhysEffspc = physical self-efficacy scale – self-presentation confidence,
SocEff=Social self-efficacy, GenEff=general self-efficacy. DES = Dispositional Envy Scale, PRD=Personal Relative
Deprivation Scale-Revised, DSESatt=attraction subscale of the Domain-Specific Envy Scale, DSEScomp=competence
subscale of the Domain-Specific Envy Scale, DSESwealth=wealth subscale of the Domain-Specific Envy Scale,
Benvy=benign envy subscale of the Benign and Malicious Envy Scale, Menvy=malicious envy component of the Benign and
Malicious Envy Scale.

136
Table 12. Final model of hierarchical multiple regression analysis of scores on the
Dispositional Envy Scale (n=109)
DES
B (SE) Bias p 95% CI
Step 1: R2adj =0.02; ΔR2 = 0.04
Age 0.10 (0.12) 0.01 0.34 [-0.19, 0.44]
Gender -2.66 (1.81) 0.01 0.16 [-6.19, 1.16]
Step 2: R2adj =0.08; ΔR2 = 0.12
Height -0.06 (0.11) 0.01 0.56 [-0.28, 0.18]
Fat% 0.15 (0.10) 0.002 0.12 [-0.05, 0.35]
Musc% 0.14 (0.13) 0.02 0.31 [-0.18, 0.41]
Grip -0.10 (0.08) -0.01 0.21 [-0.23, 0.02]
PegTime 0.01 (0.13) -0.01 0.92 [-0.28, 0.22]
PegDif 0.53 (0.37) -0.004 0.16 [-0.22, 1.28]
Vint 0.18 (0.31) -0.04 0.56 [-0.37, 0.67]
Step 3: R2adj =0.23; ΔR2 = 0.17**
pAttract 1.16 (0.65) 0.02 0.06 [0.04, 2.44]
pSocSkill 0.78 (0.65) 0.05 0.25 [-0.64, 2.15]
pAthlet -0.27 (0.73) -0.06 0.68 [-1.70, 1.02]
pEmotSkill -0.80 (0.82) -0.06 0.32 [-2.26, 0.6]
pIQ 0.01 (0.77) -0.04 0.99 [-1.74, 1.64]
Step 4: R2adj =0.47; ΔR2 = 0.23***
GenEff -0.22 (0.13) 0.01 0.09 [-0.49, 0.05]
SocEff -0.07 (0.02) -0.002 0.01 [-0.12, -0.03]
PhysEffppa 0.06 (0.09) 0.004 0.56 [-0.13, 0.25]
PhysEffspc -0.38 (0.08) 0.001 0.001 [-0.54, -0.21]
Notes: For Gender, 1 = male, 2 = female. Significance tests were two-tailed. * p < .05;
** p < .01; *** p < .001. Predictors whose p-values < .05 are bolded. Fat%=body fat
percentage, Musc%=muscle percentage, Vint=performance on verbal intelligence task,
PegTime=completion time of Peg Task, PegDif= between-hand difference in completion
time of the Peg Task, pAttract = perceived attractiveness, pSocSkill= perceived social
skills, pAthlet = perceived athletic ability, pEmotSkill = perceived emotional skill, pIQ =
perceived intelligence, SocEff=Social self-efficacy, GenEff=general self-efficacy,
PhysEffppa= physical self-efficacy scale – perceived athletic ability subscale, PhysEffspc
= physical self-efficacy scale – self-presentation confidence.
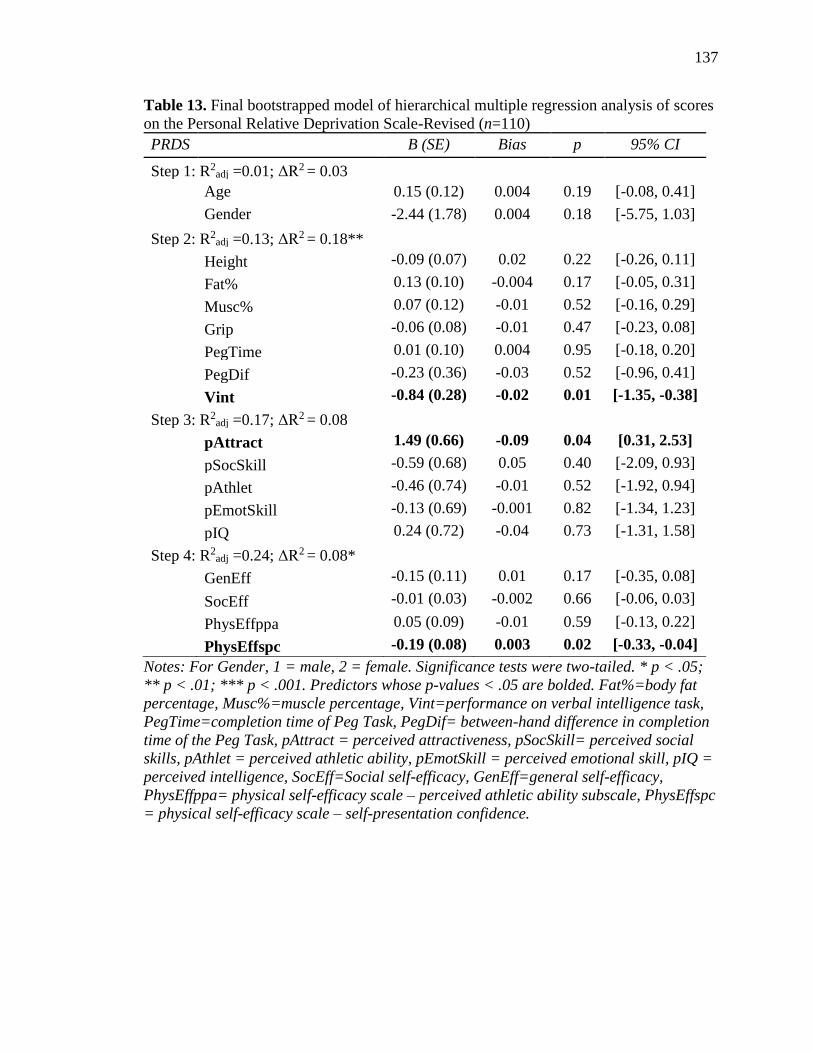
137
Table 13. Final bootstrapped model of hierarchical multiple regression analysis of scores
on the Personal Relative Deprivation Scale-Revised (n=110)
PRDS
B (SE) Bias p 95% CI
Step 1: R2adj =0.01; ΔR2 = 0.03
Age 0.15 (0.12) 0.004 0.19 [-0.08, 0.41]
Gender -2.44 (1.78) 0.004 0.18 [-5.75, 1.03]
Step 2: R2adj =0.13; ΔR2 = 0.18**
Height -0.09 (0.07) 0.02 0.22 [-0.26, 0.11]
Fat% 0.13 (0.10) -0.004 0.17 [-0.05, 0.31]
Musc% 0.07 (0.12) -0.01 0.52 [-0.16, 0.29]
Grip -0.06 (0.08) -0.01 0.47 [-0.23, 0.08]
PegTime 0.01 (0.10) 0.004 0.95 [-0.18, 0.20]
PegDif -0.23 (0.36) -0.03 0.52 [-0.96, 0.41]
Vint -0.84 (0.28) -0.02 0.01 [-1.35, -0.38]
Step 3: R2adj =0.17; ΔR2 = 0.08
pAttract 1.49 (0.66) -0.09 0.04 [0.31, 2.53]
pSocSkill -0.59 (0.68) 0.05 0.40 [-2.09, 0.93]
pAthlet -0.46 (0.74) -0.01 0.52 [-1.92, 0.94]
pEmotSkill -0.13 (0.69) -0.001 0.82 [-1.34, 1.23]
pIQ 0.24 (0.72) -0.04 0.73 [-1.31, 1.58]
Step 4: R2adj =0.24; ΔR2 = 0.08*
GenEff -0.15 (0.11) 0.01 0.17 [-0.35, 0.08]
SocEff -0.01 (0.03) -0.002 0.66 [-0.06, 0.03]
PhysEffppa 0.05 (0.09) -0.01 0.59 [-0.13, 0.22]
PhysEffspc -0.19 (0.08) 0.003 0.02 [-0.33, -0.04]
Notes: For Gender, 1 = male, 2 = female. Significance tests were two-tailed. * p < .05;
** p < .01; *** p < .001. Predictors whose p-values < .05 are bolded. Fat%=body fat
percentage, Musc%=muscle percentage, Vint=performance on verbal intelligence task,
PegTime=completion time of Peg Task, PegDif= between-hand difference in completion
time of the Peg Task, pAttract = perceived attractiveness, pSocSkill= perceived social
skills, pAthlet = perceived athletic ability, pEmotSkill = perceived emotional skill, pIQ =
perceived intelligence, SocEff=Social self-efficacy, GenEff=general self-efficacy,
PhysEffppa= physical self-efficacy scale – perceived athletic ability subscale, PhysEffspc
= physical self-efficacy scale – self-presentation confidence.

138
Table 14. Final bootstrapped model of hierarchical multiple regression analysis of scores
on the attraction subscale of the Domain-Specific Envy Scale (n=110).
DSESattract
B (SE) Bias p 95% CI
Step 1: R2adj = 0; ΔR2= 0.02
Age -0.07 (0.20) 0.02 0.70 [-0.34, 0.41]
Gender -4.37 (2.41) 0.02 0.08 [-8.75, 0.44]
Step 2: R2adj = -0.03; ΔR2 = 0.04
Height -0.11 (0.12) 0.01 0.35 [-0.33, 0.14]
Fat% 0.12 (0.13) 0.01 0.34 [-0.15, 0.41]
Musc% 0.09 (0.14) 0.02 0.52 [-0.27, 0.37]
Grip 0.01 (0.10) -0.01 0.95 [-0.19, 0.19]
PegTime -0.18 (0.15) 0.004 0.22 [-0.44, 0.13]
PegDif 0.12 (0.53) -0.04 0.82 [-0.87, 0.98]
Vint -0.22 (0.44) 0.03 0.63 [-1.19, 0.70]
Step 3: R2adj = -0.01; ΔR2 = 0.06
pAttract 1.42 (1.02) 0.04 0.16 [-0.60, 3.60]
pSocSkill -0.74 (0.91) 0.11 0.42 [-2.70, 1.46]
pAthlet 0.12 (1.06) -0.11 0.91 [-1.76, 1.87]
pEmotSkill -0.23 (1.18) -0.01 0.83 [-2.53, 2.04]
pIQ -0.17 (0.97) -0.10 0.86 [-2.43, 1.71]
Step 4: R2adj = 0.17; ΔR2 = 0.19***
GenEff -0.11 (0.17) 0.00 0.51 [-0.45, 0.23]
SocEff 0.03 (0.04) 0.001 0.41 [-0.04, 0.11]
PhysEffppa 0.01 (0.12) 0.01 0.95 [-0.26, 0.30]
PhysEffspc -0.49 (0.11) -0.01 0.001 [-0.68, -0.31]
Notes: For Gender, 1 = male, 2 = female. Significance tests were two-tailed. * p < .05;
** p < .01; *** p < .001. Predictors whose p-values < .05 are bolded. Fat%=body fat
percentage, Musc%=muscle percentage, Vint=performance on verbal intelligence task,
PegTime=completion time of Peg Task, PegDif= between-hand difference in completion
time of the Peg Task, pAttract = perceived attractiveness, pSocSkill= perceived social
skills, pAthlet = perceived athletic ability, pEmotSkill = perceived emotional skill, pIQ =
perceived intelligence, SocEff=Social self-efficacy, GenEff=general self-efficacy,
PhysEffppa= physical self-efficacy scale – perceived athletic ability subscale, PhysEffspc
= physical self-efficacy scale – self-presentation confidence.

139
Table 15. Final bootstrapped model of hierarchical multiple regression analysis of scores
on the competence subscale of the Domain-Specific Envy Scale (n=110).
DSEScomp
B (SE) Bias p 95% CI
Step 1: R2adj = -0.01; ΔR2 = 0.01
Age -0.05 (0.20) 0.03 0.78 [-0.37, 0.47]
Gender 2.77 (3.00) 0.14 0.36 [-3.16, 9.19]
Step 2: R2adj = -0.03; ΔR2 = 0.05
Height 0.08 (0.10) 0.003 0.48 [-0.13, 0.28]
Fat% -0.01 (0.12) 0.01 0.94 [-0.24, 0.26]
Musc% 0.10 (0.12) 0.02 0.37 [-0.15, 0.39]
Grip 0.08 (0.12) -0.002 0.49 [-0.16, 0.31]
PegTime 0.04 (0.16) 0.004 0.78 [-0.33, 0.37]
PegDif -0.30 (0.53) 0.01 0.59 [-1.26, 0.74]
Vint 0.01 (0.50) -0.01 0.99 [-1.03, 1.00]
Step 3: R2adj = -0.06; ΔR2 = 0.02
pAttract 0.88 (0.87) 0.08 0.30 [-0.95, 2.93]
pSocSkill -0.89 (0.98) 0.11 0.36 [-3.00, 1.47]
pAthlet 0.89 (1.17) -0.09 0.44 [-1.30, 2.90]
pEmotSkill 0.71 (0.97) 0.01 0.47 [-1.19, 2.59]
pIQ 0.22 (1.17) -0.05 0.84 [-2.23, 2.62]
Step 4: R2adj = 0.09; ΔR2 = 0.16**
GenEff 0.02 (0.17) 0.01 0.90 [-0.36, 0.37]
SocEff 0.05 (0.04) 0.001 0.17 [-0.03, 0.13]
PhysEffppa -0.07 (0.13) 0.01 0.60 [-0.34, 0.21]
PhysEffspc -0.44 (0.10) -0.02 0.001 [-0.62, -0.30]
Notes: For Gender, 1 = male, 2 = female. Significance tests were two-tailed. * p < .05;
** p < .01; *** p < .001. Predictors whose p-values < .05 are bolded. Fat%=body fat
percentage, Musc%=muscle percentage, Vint=performance on verbal intelligence task,
PegTime=completion time of Peg Task, PegDif= between-hand difference in completion
time of the Peg Task, pAttract = perceived attractiveness, pSocSkill= perceived social
skills, pAthlet = perceived athletic ability, pEmotSkill = perceived emotional skill, pIQ =
perceived intelligence, SocEff=Social self-efficacy, GenEff=general self-efficacy,
PhysEffppa= physical self-efficacy scale – perceived athletic ability subscale, PhysEffspc
= physical self-efficacy scale – self-presentation confidence.

140
Table 16. Final bootstrapped model of hierarchical multiple regression analysis of scores
on the wealth subscale of the Domain-Specific Envy Scale (n=110).
DSESwealth
B (SE) Bias p 95% CI
Step 1: R2adj = 0; ΔR2 = 0.02
Age -0.12 (0.14) 0.02 0.39 [-0.42, 0.22]
Gender -1.75 (2.29) 0.14 0.47 [-5.93, 3.27]
Step 2: R2adj = 0.01; ΔR2 = 0.07
Height -0.06 (0.10) -0.001 0.57 [-0.26, 0.15]
Fat% 0.14 (0.12) 0.003 0.26 [-0.09, 0.39]
Musc% 0.13 (0.12) 0.01 0.27 [-0.14, 0.42]
Grip 0.03 (0.10) 0.004 0.73 [-0.17, 0.25]
PegTime 0.12 (0.12) 0.01 0.33 [-0.20, 0.42]
PegDif -0.45 (0.53) -0.003 0.42 [-1.58, 0.55]
Vint -0.26 (0.48) -0.003 0.59 [-1.22, 0.69]
Step 3: R2adj = 0.03; ΔR2 = 0.07
pAttract 1.08 (1.04) 0.17 0.30 [-1.03, 3.95]
pSocSkill -1.17 (0.89) 0.11 0.21 [-3.23, 0.80]
pAthlet 0.18 (1.08) -0.08 0.87 [-1.94, 2.13]
pEmotSkill 0.79 (1.05) -0.11 0.46 [-1.15, 2.47]
pIQ -0.21 (1.09) -0.17 0.86 [-3.04, 1.87]
Step 4: R2adj = 0.14; ΔR2 = 0.13**
GenEff -0.06 (0.16) 0.01 0.73 [-0.39, 0.30]
SocEff -0.01 (0.04) 0.002 0.79 [-0.08, 0.07]
PhysEffppa 0.03 (0.11) 0.002 0.79 [-0.19, 0.26]
PhysEffspc -0.36 (0.10) -0.01 0.002 [-0.55, -0.20]
Notes: For Gender, 1 = male, 2 = female. Significance tests were two-tailed. * p < .05;
** p < .01; *** p < .001. Predictors whose p-values < .05 are bolded. Fat%=body fat
percentage, Musc%=muscle percentage, Vint=performance on verbal intelligence task,
PegTime=completion time of Peg Task, PegDif= between-hand difference in completion
time of the Peg Task, pAttract = perceived attractiveness, pSocSkill= perceived social
skills, pAthlet = perceived athletic ability, pEmotSkill = perceived emotional skill, pIQ =
perceived intelligence, SocEff=Social self-efficacy, GenEff=general self-efficacy,
PhysEffppa= physical self-efficacy scale – perceived athletic ability subscale, PhysEffspc
= physical self-efficacy scale – self-presentation confidence.

141
Table 17. Final bootstrapped model of hierarchical multiple regression analysis of scores
on the benign envy subscale of the Benign and Malicious Envy Scale (n=106).
Benvy
B (SE) Bias p 95% CI
Step 1: R2adj = 0.03; ΔR2 = 0.05
Age 0.03 (0.17) 0.06 0.85 [-0.28, 0.55]
Gender -2.31 (2.21) 0.02 0.30 [-6.35, 2.33]
Step 2: R2adj = 0.01; ΔR2 = 0.04
Height 0.08 (0.08) 0.001 0.30 [-0.09, 0.26]
Fat% 0.06 (0.11) -0.03 0.61 [-0.14, 0.2]
Musc% -0.07 (0.11) -0.01 0.50 [-0.34, 0.13]
Grip -0.03 (0.08) -0.01 0.73 [-0.18, 0.1]
PegTime 0.02 (0.12) -0.01 0.85 [-0.21, 0.24]
PegDif -0.24 (0.42) 0.08 0.59 [-1.16, 0.82]
Vint -0.34 (0.30) 0.003 0.25 [-0.96, 0.27]
Step 3: R2adj = -0.03; ΔR2 = 0.01
pAttract 0.35 (0.70) -0.01 0.58 [-1.07, 1.67]
pSocSkill -0.35 (0.66) 0.03 0.61 [-1.82, 1.08]
pAthlet -0.67 (0.99) -0.14 0.53 [-2.38, 0.86]
pEmotSkill 1.25 (0.85) -0.10 0.14 [-0.26, 2.58]
pIQ -0.45 (0.91) -0.02 0.63 [-2.26, 1.39]
Step 4: R2adj = 0.13; ΔR2 = 0.17**
GenEff 0.24 (0.12) -0.003 0.06 [0.00, 0.51]
SocEff 0.00 (0.03) 0.01 0.99 [-0.06, 0.07]
PhysEffppa 0.16 (0.1) 0.01 0.11 [-0.04, 0.40]
PhysEffspc -0.34 (0.1) -0.003 0.002 [-0.52, -0.16]
Notes: For Gender, 1 = male, 2 = female. Significance tests were two-tailed. * p < .05;
** p < .01; *** p < .001. Predictors whose p-values < .05 are bolded. Fat%=body fat
percentage, Musc%=muscle percentage, Vint=performance on verbal intelligence task,
PegTime=completion time of Peg Task, PegDif= between-hand difference in completion
time of the Peg Task, pAttract = perceived attractiveness, pSocSkill= perceived social
skills, pAthlet = perceived athletic ability, pEmotSkill = perceived emotional skill, pIQ =
perceived intelligence, SocEff=Social self-efficacy, GenEff=general self-efficacy,
PhysEffppa= physical self-efficacy scale – perceived athletic ability subscale, PhysEffspc
= physical self-efficacy scale – self-presentation confidence.

142
Table 18. Final bootstrapped model of hierarchical multiple regression analysis of scores
on the malicious envy subscale of the Benign and Malicious Envy Scale (n=106).
Menvy
B (SE) Bias p 95% CI
Step 1: R2adj = 0; ΔR2 = 0.02
Age -0.11 (0.11) 0.02 0.22 [-0.31, 0.21]
Gender -0.83 (1.58) -0.05 0.59 [-3.86, 2.05]
Step 2: R2adj = 0.07; ΔR2 = 0.13
Height 0.06 (0.07) -0.008 0.41 [-0.09, 0.18]
Fat% 0.23 (0.09) -0.01 0.02 [0.05, 0.38]
Musc% 0.17 (0.07) 0.01 0.01 [0.04, 0.34]
Grip -0.03 (0.07) -0.001 0.70 [-0.18, 0.12]
PegTime -0.03 (0.11) 0.01 0.76 [-0.27, 0.22]
PegDif 0.19 (0.36) 0.01 0.62 [-0.47, 0.91]
Vint -0.58 (0.31) 0.02 0.07 [-1.22, 0.09]
Step 3: R2adj = 0.08; ΔR2 = 0.06
pAttract 1.76 (0.59) 0.05 0.01 [0.32, 3.17]
pSocSkill -0.13 (0.65) 0.04 0.83 [-1.66, 1.24]
pAthlet -0.30 (0.63) -0.09 0.66 [-1.45, 0.68]
pEmotSkill 0.60 (0.64) -0.05 0.34 [-0.48, 1.66]
pIQ 0.64 (0.65) 0.01 0.32 [-0.62, 1.81]
Step 4: R2adj = 0.30; ΔR2 = 0.21***
GenEff -0.23 (0.1) -0.003 0.02 [-0.42, -0.03]
SocEff -0.02 (0.02) 0.00 0.29 [-0.07, 0.02]
PhysEffppa 0.04 (0.09) 0.01 0.64 [-0.15, 0.23]
PhysEffspc -0.30 (0.07) -0.003 0.001 [-0.41, -0.17]
Notes: For Gender, 1 = male, 2 = female. Significance tests were two-tailed. * p < .05;
** p < .01; *** p < .001. Predictors whose p-values < .05 are bolded. Fat%=body fat
percentage, Musc%=muscle percentage, Vint=performance on verbal intelligence task,
PegTime=completion time of Peg Task, PegDif= between-hand difference in completion
time of the Peg Task, pAttract = perceived attractiveness, pSocSkill= perceived social
skills, pAthlet = perceived athletic ability, pEmotSkill = perceived emotional skill, pIQ =
perceived intelligence, SocEff=Social self-efficacy, GenEff=general self-efficacy,
PhysEffppa= physical self-efficacy scale – perceived athletic ability subscale, PhysEffspc
= physical self-efficacy scale – self-presentation confidence.
Copyright © 2022 FDOKUMEN