Rheology and Quality Research of Cereal-Based Food - MDPI
134
Rheology and Quality Research of Cereal-Based Food Printed Edition of the Special Issue Published in Foods www.mdpi.com/journal/foods Anabela Raymundo, María Dolores Torres and Isabel Sousa Edited by
-
Upload
khangminh22 -
Category
Documents
-
view
3 -
download
0
Transcript of Rheology and Quality Research of Cereal-Based Food - MDPI
Rheology and Quality Research of Cereal-Based Food • Anabela Raym
undo, María Dolores Torres and Isabel Sousa
Rheology and Quality Research of Cereal-Based Food
Printed Edition of the Special Issue Published in Foods
www.mdpi.com/journal/foods
Anabela Raymundo, María Dolores Torres and Isabel SousaEdited by

Rheology and Quality Research of Cereal-Based Food


Rheology and Quality Research of Cereal-Based Food
Editors
Anabela Raymundo
Marıa Dolores Torres
Isabel Sousa
MDPI • Basel • Beijing • Wuhan • Barcelona • Belgrade • Manchester • Tokyo • Cluj • Tianjin

Editors
Anabela Raymundo
Universidade de Lisboa
Portugal
Marıa Dolores Torres
Universidade de Vigo
Spain
Isabel Sousa
Universidade de Lisboa
Portugal
Editorial Office
MDPI
St. Alban-Anlage 66
4052 Basel, Switzerland
This is a reprint of articles from the Special Issue published online in the open access journal Foods
(ISSN 2304-8158) (available at: https://www.mdpi.com/journal/foods/special issues/Rheology
Quality Cereal-Based Food#).
For citation purposes, cite each article independently as indicated on the article page online and as
indicated below:
LastName, A.A.; LastName, B.B.; LastName, C.C. Article Title. Journal Name Year, Volume Number,
Page Range.
ISBN 978-3-0365-0504-6 (Hbk)
ISBN 978-3-0365-0505-3 (PDF)
Cover image courtesy of Pedro Raymundo Carlota.
© 2021 by the authors. Articles in this book are Open Access and distributed under the Creative
Commons Attribution (CC BY) license, which allows users to download, copy and build upon
published articles, as long as the author and publisher are properly credited, which ensures maximum
dissemination and a wider impact of our publications.
The book as a whole is distributed by MDPI under the terms and conditions of the Creative Commons
license CC BY-NC-ND.

Contents
About the Editors . . . . . . . . . . . . . . . . . . . . . . . . . . . . . . . . . . . . . . . . . . . . . . vii
Anabela Raymundo, Marıa Dolores Torres and Isabel Sousa
Special Issue: Rheology and Quality Research of Cereal-Based FoodReprinted from: Foods 2020, 9, 1517, doi:10.3390/foods9111517 . . . . . . . . . . . . . . . . . . . . 1
Maria Cristiana Nunes, Isabel Fernandes, Ines Vasco, Isabel Sousa and Anabela Raymundo
Tetraselmis chuii as a Sustainable and Healthy Ingredient to Produce Gluten-Free Bread: Impacton Structure, Colour and BioactivityReprinted from: Foods 2020, 9, 579, doi:10.3390/foods9050579 . . . . . . . . . . . . . . . . . . . . 7
R. Beltrao Martins, M. C. Nunes, L. M. M. Ferreira, J. A. Peres, A. I. R. N. A. Barros and A. Raymundo
Impact of Acorn Flour on Gluten-Free Dough Rheology PropertiesReprinted from: Foods 2020, 9, 560, doi:10.3390/foods9050560 . . . . . . . . . . . . . . . . . . . . 23
Carla Graca, Anabela Raymundo and Isabel Sousa
Yogurt as an Alternative Ingredient to Improve the Functional and Nutritional Properties ofGluten-Free BreadsReprinted from: Foods 2020, 9, 111, doi:10.3390/foods9020111 . . . . . . . . . . . . . . . . . . . . 39
Ye-Eun Hong and Meera Kweon
Optimization of the Formula and Processing Factors for Gluten-Free Rice Bread with Tamarind GumReprinted from: Foods 2020, 9, 145, doi:10.3390/foods9020145 . . . . . . . . . . . . . . . . . . . . 53
Pavalee Chompoorat, Napong Kantanet, Zorba J. Hernandez Estrada and Patricia Rayas-Duarte
Physical and Dynamic Oscillatory Shear Properties of Gluten-Free Red Kidney Bean Batter and Cupcakes Affected by Rice Flour AdditionReprinted from: Foods 2020, 9, 616, doi:10.3390/foods9050616 . . . . . . . . . . . . . . . . . . . . 65
Claudia Arribas, Blanca Cabellos, Carmen Cuadrado, Eva Guillamon and Mercedes M. Pedrosa
Bioactive Compounds, Antioxidant Activity, and Sensory Analysis of Rice-Based Extruded Snacks-Like Fortified with Bean and Carob Fruit FloursReprinted from: Foods 2019, 8, 381, doi:10.3390/foods8090381 . . . . . . . . . . . . . . . . . . . . 77
Luca Nuvoli, Paola Conte, Sebastiano Garroni, Valeria Farina, Antonio Piga and Costantino Fadda
Study of the Effects Induced by Ball Milling Treatment on Different Types of Hydrocolloids in a Corn Starch–Rice Flour SystemReprinted from: Foods 2020, 9, 517, doi:10.3390/foods9040517 . . . . . . . . . . . . . . . . . . . . 91
Silvia Mironeasa and Georgiana Gabriela Codina
Dough Rheological Behavior and Microstructure Characterization of Composite Dough withWheat and Tomato Seed FloursReprinted from: Foods 2019, 8, 626, doi:10.3390/foods8120626 . . . . . . . . . . . . . . . . . . . . 107
v


About the Editors
Anabela Raymundo is a chemical engineer with an M.Sc. in Food Science and Technology and
a Ph.D. in Food Engineering. She is an Assistant Professor with Habilitation whose activities include
integrating of LEAF (Linking Landscape, Environment, Agriculture and Food) and responsibility in
the areas of Rheology and Food Texture and Quality Control in Food Engineering in graduate and
master programs, such as the Masters of Food Engineering and Gastronomic Sciences. Her main work
is focused on the use of poorly exploited food sources (e.g., microalgae biomass and food industry
byproducts) for the development of products with high added value.
Maria Dolores Torres’ research interests are focused on the valorization of byproducts from the
agri-food industry and the development of innovative functional gelled foodstuffs mainly directed
toward target population groups with special nutritional requirements. Currently, she is working on
the integral valorization of brown and red algae using environmental friendly technologies to obtain
functional hydrogels and other components of industrial value.
Isabel Sousa, Ph.D. in Food Science from University of Nottingham, UK, is Associate Professor
with Habilitation at Instituto Superior de Agronomia (ISA), Universidade de Lisboa. She is Head of
the LEAF (Linking Landscape Environment Agriculture and Food) research center at the Portuguese
Foundation for Science and Technology (FCT) and, in Portugal, an expert and pioneer of Food Texture
and Rheology research and teaching. In addition, she is the coordinator of numerous national and
European projects with SMEs.
vii


foods
Editorial
Special Issue: Rheology and Quality Researchof Cereal-Based Food
Anabela Raymundo 1,*, María Dolores Torres 2 and Isabel Sousa 1
1 LEAF—Linking Landscape, Environment, Agriculture and Food, Research Center of Instituto Superior deAgronomia, Universidade de Lisboa, Tapada da Ajuda, 1349-017 Lisboa, Portugal; [email protected]
2 Department of Chemical Engineering, Science Faculty, Universidade de Vigo (Campus Ourense), As Lagoas,32004 Ourense, Spain; [email protected]
* Correspondence: [email protected]; Tel.:+351-21-365-2114
Received: 12 October 2020; Accepted: 19 October 2020; Published: 22 October 2020
Abstract: New trends in the cereal industry deal with a permanent need to develop new foodproducts that are adjusted to consumer demands and, in the near future, the scarcity of food resources.Sustainable food products as health and wellness promoters can be developed redesigning traditionalstaple foods, using environmentally friendly ingredients (such as microalgae biomass or pulses) orby-products (e.g., tomato seeds) in accordance with the bioeconomy principles. These are topics thatact as driving forces for innovation and will be discussed in the present special issue. Rheology alwayswas the reference discipline to determine dough and bread properties. A routine analysis of cerealgrains includes empirical rheology techniques that imply the use of well-known equipment in cerealindustries (e.g., alveograph, mixograph, extensograph). Their parameters determine the blending ofthe grains and are crucial on the technical sheets that determine the use of flours. In addition, thestructure of gluten-free cereal-based foods has proven to be a determinant for the appeal and stronglyimpacts consumers’ acceptance. Fundamental rheology has a relevant contribution to help overcomethe technological challenges of working with gluten-free flours. These aspects will also be pointedout in order to provide a prospective view of the relevant developments to take place in the area ofcereal technology.
Keywords: gluten-free products; dynamic oscillatory shear measurements; pasting profile; rheology;texture; X-ray diffraction; red kidney bean; microalga Tetraselmis chuii; acorn flour; tamarind gum;yogurt; tomato seed flour; antioxidants; phenolics; fibre-rich ingredient; ball milling
1. Introduction
Innovation plays a key role in the current development of food companies. Food trends are launchedevery year, allowing stakeholders to be aligned around common axes on consumer’s preferences.
The most recent trends in the food industry [1] are focused on foods of vegetable origin, andcommitment to sustainability stands out. The increase in the trend of personalized diet (“good forme”) is also noteworthy, which includes gluten-free products or foods with a direct impact on healthand well-being (rich in bioactive compounds).
It is well known that products with the same chemical composition can present very differentstructures that are built up by processing techniques, resulting in differently perceived texture andsensory properties. Rheology has been the reference discipline for the food cereal industries since thevery start of quality control. Food macromolecules (proteins and polysaccharides) are the major playersfor the creation of relevant food structures, such as dough and crisp snacks. The development ofgluten-free products using alternative proteins and polysaccharides, nutritious mixtures of cereals andpulses to replace meat protein, as well as the use of food industry by-products, such as tomato seeds asa source of these structuring biopolymers (pectins), are some other challenges in creating innovative
Foods 2020, 9, 1517; doi:10.3390/foods9111517 www.mdpi.com/journal/foods1

Foods 2020, 9, 1517
food products. Sustainability in the production of the food ingredients and the economic viabilityof their production and subsequent transformation into fair-traded, well-accepted food products,are essential for the progress of the cereal industry, with a relevant impact on human wellness andprogress. The use of poorly exploited food sources, such as microroalgae, in cereal products is also anopportunity to explore. This approach includes the design of added value food products and relevantnutritional benefits. The use of ancient flours that have fallen out of use, such as acorn flour or ancientwheat varieties with low-gluten proteins, could be a sustainable strategy to enhance cereal productswith an important source of bioactivities and fiber.
Finally, consumer attitude toward new food products is a relevant issue for the success ofinnovations and should be considered for food products that are close to the market. In this sense,the sensory evaluation of innovative products, in the preliminary stage of the development process,is an important tool in order to predict their final acceptance of the market.
2. Contributions
Gluten-free foods stand out in terms of food trends in the field of cereal technology. These typesof products are on the agenda of the most important food companies and many research groups.This results from the steady increase of the gluten-free products market due to the growing number ofindividuals diagnosed with some type of gluten sensitivity. About 38% of consumers are avoiding orlimiting gluten-free foods [2].
Generally, gluten-free foods are nutritionally unbalanced in terms of lipids, fibers, minerals,and vitamins. This can be critical for the celiac patients, who have co-pathologies and therefore need anutritionally balanced diet [3].
As bakery products are traditionally produced with gluten flours, they have undergone extensiveredesign in order to optimize their production from gluten-free flours. In this context, bread takes on aconsiderable prominence. Several works on this theme have been published in recent years [4–6], whichare related to the incorporation of underexplored ingredients and by-products of the food industry,in order to improve the rheological and texture properties, nutritional performance, and sensoryappreciation. In the present special issue, relevant studies related to gluten-free products are present.
Nunes et al. (2020) [7] evaluated the impact of Tetraselmis chuii microalgae incorporation on thestructure, color, and bioactivity of a gluten-free (GF) bread formulation based on rice, buckwheat flour,and potato starch to increase nutrition, using hydroxipropylmethylcellulose (HPMC) as a structuringagent. The dough pasting profile assessed by Microdough-Lab and shear oscillatory measurementswas conducted to evaluate the dough structure. Physical properties of the loaves, total phenoliccontent (Folin–Ciocalteu), and antioxidant capacity (DPPH and FRAP methods) of the bread extractswere assessed. Promising results related with the use of T. chuii as a sustainable ingredient in GFbread formulation were found, with a positive impact on the structure and antioxidant capacityand an innovative green appearance. This microalgae presented different behavior, according to theincorporation level: below 2%, T. chuii proteins destabilize the structure developed by starch andHPMC, and smaller bread volume was obtained, which was associated with a more compact crumband harder properties. However, for higher levels of incorporation (4%), the microalgal proteins withstarch and HPMC build up another type of structure, which is characterized by higher values of theviscoelastic functions (G‘ and G”) producing higher bread volume and a softening effect. There wasevidence that the structure of 4% T. chuii bread is competitive with the control bread (with no biomassaddition), in terms of structure and with a boost in nutritional performance, despite having revealed aweak acceptance by a non-targeted sensory panel.
Martins et al. (2020) [8] studied the possibility of using acorn flour, an under-exploited GF rawmaterial, in a similar formulation as the one developed by Nunes et al. (2020). This flour was testedin order to improve dough rheology, following also market trends of sustainability and fiber-richingredients. Acorn flour significantly affected the rheology properties of the doughs. An impact onthe dough’s mixing and pasting curves, an improvement of the texture parameters (firmness and
2

Foods 2020, 9, 1517
cohesiveness) and the viscoelasticity of the fermented dough were highlighted. In this way, the role ofdough characterization by rheology tools was evidenced, as being determinant for the optimizationof new food products. According to small amplitude oscillatory shear measurements, all the GFdoughs studied exhibit a weak gel-elastic-like behavior with G’ values higher than G” and frequencydependent. Acorn flour incorporation caused the acidification and increased the darkness of thedough, which can have a positive impact in terms of sensory appreciation of the bread. Therefore,it was stated that acorn flour can be a very promising ingredient to improve both the rheological GFdough properties and nutritional GF bread quality, in particular dietary fiber content, which is a reallyimportant nutrient in special requirement diets.
In line with the work already presented on the nutritional enrichment of GF bread, Graça et al.(2020) [9] studied the possibility of enriching a similar type of bread with yogurt. Following thisstrategy, the low functional and nutritional properties of GF bread can be minimized, using dairyprotein. Fresh yogurt represents an interesting ingredient since in addition to being an importantprotein source, it also provides polysaccharides and minerals that have the potential to mimic the glutennetwork, while improving the nutritional value of gluten-free products. Gluten-free bread formulations,with different levels of yogurt addition (5% up to 20%, weight/weight), were evaluated, using doughrheology measurements and baking quality parameters. It was shown that the functionality ofgluten-free breads, in terms of bread-making performances, quality parameters, and nutritional profilecan be successfully improved by the addition of fresh yogurt, resulting in a significant improvementin the overall quality of the GF yogurt-breads. Linear correlations between bread firmness, specificvolume with flow behavior, and viscoelastic functions were found, supporting the results obtained.These correlation can assume a considerable importance in terms of the bakery industry and for futurestudies in this area. Yogurt was shown to be a potential ingredient to improve the quality of gluten-freebreads, resulting in softer breads with higher volume and lower staling rate, compared to control bread.In relation to the nutritional composition, yogurt addition was revealed to be an attractive ingredientto enhance the nutritional value of GF breads: an increase in the protein and mineral contents and areduction in carbohydrates was found, with a good chance to improve the daily diet of celiac people.
Hong and Kweon (2020) [10] presented another study on gluten-free rice bread, incorporatingtamarind gum. In this work, the importance of optimizing the formulation and processing conditionsis highlighted when combining new ingredients for product design. An experimental factorial designwas used and revealed to be useful for the optimization process, minimizing the number of experimentsand emphasizing the weight of each independent variable in the explanation of the process. Gumconcentration (GC), water amount (WA), mixing time (MT), and fermentation time (FT) were selectedas factors, and two levels were used for each factor. WA and FT were identified as the most significantfactors to determine the quality of GF rice bread with tamarind gum. Therefore, proper control overthe water content and fermentation time can maximize the bread volume and minimize the firmnessof the bread. The addition of an anti-staling enzyme was also studied and proved to be effective inretarding the retrogradation enthalpy and decrease of bread firmness. Using an optimized formulaand processing factors for gluten-free rice bread with the combined addition of tamarind gum and ananti-staling enzyme (maltogenic amylase) can be applied successfully in commercially manufacturedgluten-free rice bread.
In addition to gluten-free bread, several formulations of bakery products, based on GF flours,have appeared on the market. Chompoorat et al. (2020) [11] studied the impact of rice flour additionon red kidney bean (RKB) cupcakes. The incorporation of rice flour promoted an increase in the degreeof structuring of the cupcake dough and an improvement in the texture properties of the RKB cupcakes.It is important to note that also for this type of matrix, the use of fundamental rheological techniquessuch as dough linear viscoelastic behavior and empirical tests such as texture characterization werecrucial to optimizing the final product. Rice flour addition in gluten-free RKB flour increased thebatter’s solid-like and viscous behavior, batter consistency, inflection of gelatinization and temperature,and produced a softer cupcake texture. The activation energy of gelatinization also increased with
3
Foods 2020, 9, 1517
rice incorporation, as well as the cupcakes’ macrostructural characteristics. The potential of RKB asa functional ingredient and its improvement in cupcake application with the addition of rice flourwas highlighted.
Arribas et al. (2019) [12] studied another relevant GF product: an extruded rice snack. This type ofproduct, in addition to being part of the current trend in the consumption of GF cereal foods, assumesan important position in the snacking food trend [13]. Snacking has intensively grown in the last fewyears and is associated with the growth of new forms of consumption associated with more dynamiclifestyles. The authors evaluated the impact of adding two legumes, bean and carob fruit flours,on the physical properties and bioactivity of GF puffed snacks. The fortification with carob fruit flourimproved their textural attributes and did not significantly affect their overall quality. The extrusionhad positive implications in terms of the nutrition and availability of bioactive compounds, as well asgood acceptance in sensory terms. All the experimental extrudates had higher amounts of bioactivecompounds than the commercial extruded rice. This process affected phytochemicals to a differentextent. While total α-galactosides and phenols increased, the phytic acid was reduced, and thelectins and protease inhibitors were eliminated. The content of bioactive compounds present in theseextrudates might be enough to promote health-associated functions. Moreover, the absence of lectinsand protease inhibitors enhanced the nutritional quality of the extrudates. The developed snackswould be of interest to both health-conscious consumers and the food industry.
The development of gluten-free bakery products is a major challenge, which can be overcomethrough several strategies that were already presented in the works mentioned above. The use ofhydrocolloids that are capable of creating a structure that mimics the gluten matrix is often followed.Nuvoli et al. (2020) [14] studied the effect of ball milling treatment on different types of hydrocolloidsin a corn starch–rice flour system. Guar gum (GG), tara gum (TG), and methylcellulose (MC) were thehydrocolloids studied, and they were previously analyzed to assess their potential interactions withstarch components, when they are used alone or in blends in a corn starch–rice flour system. Basedon X-ray diffraction (XRD) experiments and gelling rheology characterization, it could be stated thatthe ball milling treatment affected the structure of the tested hydrocolloids and, in turn, the viscosityof their aqueous solutions in different ways. In fact, ball milling caused a reduction in the crystallindomain and, in turn, a diminished viscosity of the GG aqueous solutions. Despite an increase inits flow properties (viscosity), effects on TG were minimal, while the milled MC exhibited reducedcrystallinity but similar viscosity. When both milled and un-milled hydrocolloids were individuallyadded to the starch–flour system, the pasting properties of the resulting mixtures seemed to be affectedby the type of hydrocolloid added, rather than by the structural changes induced by the treatment.All hydrocolloids increased the peak viscosity of the binary blends (especially pure GG). However,only milled and un-milled MC showed values of setback and final viscosity similar to those of theindividual starch. Ball milling seemed to be more effective when two combined hydrocolloids (milledGG and MC) were simultaneously used. No significant differences were observed in the viscoelasticproperties of the blends, except for un-milled GG/starch, milled TG/starch, and milled MC/milledTG/starch gels. The work presented was considered by the authors as an initial study, recognizingthe need to deepen the theme. In this way, in future studies, the relevance of using the ball millingtreatment, in the development of gluten-free bakery products, using hydrocolloids–starch systems willbe clarified.
The enrichment of bakery goods, with and without gluten, by means of the incorporation ofby-products from the food industry, has assumed special relevance, in recent years, taking into accountthe principles of the circular economy. Mironeasa and Codina (2019) [15] studied the utilization ofa very relevant by-product of the food industry: tomato seed flour (TSF) produced. This work alsohighlighted the importance in the rheological and microstructure characterization of the dough onthe bakery products development process. Rheology methods through the Mixolab device, dynamicrheology, and epifluorescence light microscopy (EFLM) were used to characterize the dough obtainedfrom different formulations. From the Mixolab results, it was noticed that replacing wheat flour with
4

Foods 2020, 9, 1517
TSF increased the dough development time, stability, and viscosity during the initial heating–coolingcycle and decreased alpha amylase activity. The dynamic rheological data showed that the viscoelasticmoduli (G’ and G”) increased with the level of TSF addition. Creep recovery tests of the samplesindicated that the dough elastic recovery was at a high percentage after stress removal for all the samplesin which TSF was incorporated in wheat flour. Using EFLM, all the samples seemed homogeneousshowing a compact dough matrix structure. The parameters measured with Mixolab during mixingwere in agreement with the dynamic rheological data and in accordance with the EFLM structureimages. The authors show a correlation between the mixing properties and the viscoelastic behaviorfor the studied system (with gluten), as was also verified by Graça et al. (2020) [6], of GF bread.
The results presented in the different works of this special issue are useful for bakery producers todevelop new products with the highest nutritional value, respecting the major key trend of sustainabilityand aligning with the major food trend to answer the consumer’s actual needs.
Author Contributions: A.R.—writing and organizing of the document; I.S. and M.D.T.—writing and revised thedocument. All authors have read and agreed to the published version of the manuscript.
Funding: A.R. and I.S. are grateful to FCT for the financial support of LEAF—UIDP/04129/2020. M.D.T. thanksSpanish Ministry of Science, Innovation and Universities for her postdoctoral grant (RYC2018-024454-I).
Conflicts of Interest: The authors declare no conflict of interest.
References
1. EUFIC. Food Choice—Why Do We Eat What We Eat. Available online: https://www.eufic.org/en/food-safety/healthy-living/category/food-choice (accessed on 20 October 2020).
2. Hendry, N. Innovation Opportunities across the Global Food Landscape; Global Data Report; Portugal Foods:Lisbon, Portugal, 2019.
3. Missbach, B.; Schwingshackl, L.; Billmann, A.; Mystek, A.; Hickelsberger, M.; Bauer, G.; König, J. Gluten-freefood database: The nutritional quality and cost of packaged gluten-free foods. PeerJ 2015, 3, e1337. [CrossRef][PubMed]
4. Wang, K.; Lu, F.; Li, Z.; Zhad, L.; Han, C. Recent developments in gluten-free bread baking approaches:A review. Food Sci. Technol. Campinas. 2017, 37, 1–9. [CrossRef]
5. Beltraão-Martins, R.; Gouvinhas, I.; Nunes, M.C.; Peres, J.; Raymundo, A.; Barros, A. Acorn Flour as a Sourceof Bioactive Compounds in Gluten-Free Bread. Molecules 2020, 25, 3568. [CrossRef] [PubMed]
6. Graça, C.; Fradinho, P.; Sousa, I.; Raymundo, A. Impact of Chlorella vulgaris on the rheology of wheat flourdough and bread texture. LWT—Food Sci. Technol. 2018, 89, 466–474. [CrossRef]
7. Nunes, M.C.; Fernandes, I.; Vasco, I.; Sousa, I.; Raymundo, A. Tetraselmis chuii as a Sustainable and HealthyIngredient to Produce Gluten-Free Bread: Impact on Structure, Colour and Bioactivity. Foods. 2020, 9, 579.[CrossRef] [PubMed]
8. Beltrão-Martins, R.; Nunes, M.C.; Ferreira, L.M.; Peres, J.R.N.A.; Barros, A.I.; Raymundo, A. Impact of AcornFlour on Gluten-Free Dough Rheology Properties. Foods 2020, 9, 560. [CrossRef] [PubMed]
9. Graça, C.; Raymundo, A.; Sousa, I. Yogurt as an Alternative Ingredient to Improve the Functional andNutritional Properties of Gluten-Free Breads. Foods 2020, 9, 111. [CrossRef] [PubMed]
10. Hong, Y.-E.; Kweon, M. Optimization of the Formula and Processing Factors for Gluten-Free Rice Bread withTamarind Gum. Foods 2020, 9, 145. [CrossRef] [PubMed]
11. Chompoorat, P.; Kantanet, N.; Hernández Estrada, Z.J.; Rayas-Duarte, P. Physical and Dynamic OscillatoryShear Properties of Gluten-Free Red Kidney Bean Batter and Cupcakes Affected by Rice Flour Addition.Foods 2020, 9, 616. [CrossRef] [PubMed]
12. Arribas, C.; Cabellos, B.; Cuadrado, C.; Guillamón, E.; Pedrosa, M. Bioactive Compounds, AntioxidantActivity, and Sensory Analysis of Rice-Based Extruded Snacks-Like Fortified with Bean and Carob FruitFlours. Foods 2019, 8, 381. [CrossRef] [PubMed]
13. Mordor Intelligence. Free-From Food Market—Growth, Trends, and Forecast (2020–2025). Available online:https://www.mordorintelligence.com/industry-reports/free-from-food-market (accessed on 20 October 2020).
5

Foods 2020, 9, 1517
14. Nuvoli, L.; Conte, P.; Garroni, S.; Farina, V.; Piga, A.; Fadda, C. Study of the Effects Induced by Ball MillingTreatment on Different Types of Hydrocolloids in a Corn Starch–Rice Flour System. Foods 2020, 9, 517.[CrossRef] [PubMed]
15. Mironeasa, S.; Codină, G.G. Dough Rheological Behavior and Microstructure Characterization of CompositeDough with Wheat and Tomato Seed Flours. Foods 2019, 8, 626. [CrossRef] [PubMed]
Publisher’s Note: MDPI stays neutral with regard to jurisdictional claims in published maps and institutionalaffiliations.
© 2020 by the authors. Licensee MDPI, Basel, Switzerland. This article is an open accessarticle distributed under the terms and conditions of the Creative Commons Attribution(CC BY) license (http://creativecommons.org/licenses/by/4.0/).
6

foods
Article
Tetraselmis chuii as a Sustainable and HealthyIngredient to Produce Gluten-Free Bread: Impact onStructure, Colour and Bioactivity
Maria Cristiana Nunes *, Isabel Fernandes, Inês Vasco, Isabel Sousa and Anabela Raymundo
LEAF—Linking Landscape, Environment, Agriculture and Food, Instituto Superior de Agronomia,Universidade de Lisboa; Tapada da Ajuda, 1349-017 Lisbon, Portugal; [email protected] (I.F.);[email protected] (I.V.); [email protected] (I.S.); [email protected] (A.R.)* Correspondence: [email protected]; Tel.: +351-21-365-3100
Received: 31 March 2020; Accepted: 1 May 2020; Published: 4 May 2020
Abstract: The objective of this work is to increase the nutritional quality of gluten-free (GF) breadby addition of Tetraselmis chuii microalgal biomass, a sustainable source of protein and bioactivecompounds. The impact of different levels of T. chuii (0%—Control, 1%, 2% and 4% w/w) on the GFdoughs and breads’ structure was studied. Microdough-Lab mixing tests and oscillatory rheologywere conducted to evaluate the dough´s structure. Physical properties of the loaves, total phenoliccontent (Folin-Ciocalteu) and antioxidant capacity (DPPH and FRAP) of the bread extracts wereassessed. For the low additions of T. chuii (1% and 2%), a destabilising effect is noticed, expressed bylower dough viscoelastic functions (G’ and G”) and poor baking results. At the higher level (4%) ofmicroalgal addition, there was a structure recovery with bread volume increase and a decrease incrumb firmness. Moreover, 4% T. chuii bread presented higher total phenolic content and antioxidantcapacity when compared to control. Bread with 4% T. chuii seems particularly interesting since asignificant increase in the bioactivity and an innovative green appearance was achieved, with a lowimpact on technological performance, but with lower sensory scores.
Keywords: gluten-free bread; microalga Tetraselmis chuii; rheology; texture; colour; antioxidants;phenolics
1. Introduction
This study is part of Algae2Future project, that intends to explore the microalgae potential to be alow-carbon/nitrogen-footprints healthy food ingredient. These photosynthetic unicellular organismshave a huge importance in terms of the carbon dioxide mitigation [1] and nitrogen balance [2]. Moreover,microalgae are considered to be one of the most promising sources of functional food ingredientssince their natural encapsulated bioactive compounds to promote important health benefits [3,4].In the near-future context of food shortage and urge for sustainability, when the rate of populationincrease will be higher than increase of food production, caused by several environmental, social andeconomic factors, the use of alternative or under-exploited sources of protein is a very important issue.Microalgae are exceptional protein resources with potential to become a staple food for consumers allover the planet [1,5,6].
When considering microalgae as food for the future, it is also important to highlight that itsincorporation into food is a challenge. There is a technological limit of microalgae incorporation,resulting from its impact on the food structure, that can be followed by a change on the rheologybehaviour [7–9]. The introduction of microalgae biomass imparts changes in foods structure, but alsoin colour and flavour. Consumers are very sensitive to the changes in sensory characteristics, whichinduces limitations on the level of microalgae incorporation. Tetraselmis chuii is a green microalga
Foods 2020, 9, 579; doi:10.3390/foods9050579 www.mdpi.com/journal/foods7

Foods 2020, 9, 579
approved by EFSA (Regulation UE 2017/2470) which has a high protein content, that is an importantrequirement to be used in bread with a specific nutritional profile. In the last few years, severalworks have been developed about the incorporation of microalgae into food. Many innovative foodsystems enriched with algae have been proposed, namely pasta [10–13], cookies [14–16] and wheatbread [17,18].
Bread is a staple food with specific characteristics in terms of the development of a cohesiveand elastic dough structure. Since gluten confers unique rheological properties to yeast-leavenedbaked products, the absence of gluten is a major technological drawback. The combination ofstructural ingredients, including starches, gluten-free (GF) flours, hydrocolloids, proteins and additives,to develop an alternative to gluten dough´s structure has been widely tested [19–21]. Therefore,the addition of microalgae with high protein content can be important for the development of GFbread. In addition, nutritional benefits can be achieved by the addition of microalgae, and this isparticularly important in GF bread, since celiac patients have nutritional deficiencies due to theirabsorption limitations.
Gluten-free is a current hot topic in the food industry. Consumption of GF products, andparticularly bread, has increased considerably in recent times. This is due not only to the increase ofceliac disease, but also to an increase in other gluten-related disorders [21]. Now, an increasing numberof consumers, who have not been diagnosed with celiac disease, are cutting gluten from the diet andGF products are aligned with the top ten food trends.
Research on GF products with algae is scarce. From our knowledge, the only study focused onthe technology and nutritional properties of GF bread supplemented with a cyanobacteria (Arthrospiraplatensis, known as Spirulina) was published by Figueira et al. [22], and more recently Rózylo andco-workers [23] determined the effect of brown macroalgae (Ascophyllum nodosum) on GF breads andobserved increased antioxidant activity. In GF fresh pasta, the seaweed Laminaria ochroleuca showedpromising potential to be used and similar mechanical and texture characteristics to the referencesample were achieved [12,13].
In the present study, a formulation based on buckwheat, rice flours and potato starch was enrichedwith Tetraselmis chuii biomass. Doughs prepared with the addition of microalgal biomass (1%, 2%and 4% w/w) were characterized using mixing tests in a MicrodoughLab and by oscillatory tests in acontrolled-stress rheometer. The amount of water required to yield the same dough consistency ofthe previously optimized control-formulation was determined by the mixing test for the formulationsenriched with microalgal biomass. Texture, volume and colour properties were used to evaluate theimpact of different levels of T. chuii on the bread quality. Total phenolic content and reduction powerof the bread extracts were assessed.
2. Materials and Methods
2.1. Raw Materials
Tetraselmis chuii was produced and collected by A2F partners in NORCE/UiB (Bergen, Norway).Cell wall disruption was applied to promote a controlled release of the active biocompounds, as it wasrecently proven in a previous study [18]. Fresh biomass was pre-processed by bead milling mechanicaltreatment in the pilot unit of NOFIMA and freeze-dried. It was determined to have high content ofprotein and also an important content of bioactive compounds: 47.7% protein, 11.4% lipids with 3.6%EPA, 2.4% starch and 2.3% salt [24].
Samples were prepared with the following flours: buckwheat flour (Próvida, Mem Martins,Portugal), rice flour (Espiga, Alcains, Portugal), potato starch (Globo, Seixal, Portugal), dried yeast(Fermipan®, Setúbal, Portugal), hydroxipropylmethylcellulose (HPMC) as a gelling agent (WellenceTM321, Dow, Bomlitz, Germany), commercially available sugar, sunflower oil, salt, and water. The floursand HPMC were kindly supplied for free, except yeast, sugar, oil and salt that were purchased from
8

Foods 2020, 9, 579
local market. The commercial GF mix (Schär, Burgstall, Italy) has the following ingredients: cornstarch, flax flour 12%, buckwheat flour 8%, pea bran, rice bran, apple fibre, sugar, guar seed flour, salt.
2.2. Preparation of the Samples
To compare the performance of GF breads with T. chuii, 2 controls were set up: a commercial GFmix to bake bread at home and a blank test without microalgae, called Control dough. The commercialGF bread was prepared from the mix, following the recommendations described on the product label.
GF breads with T. chuii (1.0 g, 2.0 and 4.0 g of T. chuii/100 g of flours + T. chuii) were preparedaccording to a previously optimised method [25]. This formulation, based on buckwheat and riceflours and potato starch, was tested using the specific volume and crumb firmness of the resultingbreads as responses. Hydroxypropylmethylcellulose (HPMC), which is commonly used in GF breads,was used as a thickening agent, binding water and increasing doughs viscosity. The formulationsstudied are summarised in Table 1.
Table 1. Formulation of gluten-free (GF) samples and respective codes. Control: dough withoutmicroalgal biomass; Tc 1%, Tc 2%, Tc 4%: dough with 1%, 2% and 4% (w/w) T. chuii, respectively.
Ingredients (g/100g) Control Tc 1% Tc 2% Tc 4%
Buckwheat flour 46.0 45.5 45.1 44.2Rice flour 31.0 30.7 30.4 29.8
Potato starch 23.0 22.8 22.5 22.1Tetraselmis chuii 0.0 1.0 2.0 4.0
Sunflower oil (in relation to flours) 5.5 5.5 5.5 5.5HPMC (in relation to flours) 4.6 4.6 4.6 4.6
Dried yeast (in relation to flours) 2.8 2.8 2.8 2.8Sugar (in relation to flours) 2.8 2.8 2.8 2.8Salt (in relation to flours) 1.8 1.8 1.8 1.8
Water Absorption (14% moisture basis) 69.0 69.0 69.0 69.0
Ingredients were mixed in a thermoprocessor equipment (Bimby—Vorwerk, Carnaxide, Portugal),initially to activate the yeast, by adding water, yeast and sugar for 2 min at 27 ◦C, at velocity 1.Following, the other ingredients were added and mixed for 10 min in a dough mixing program (wheatear symbol). The resulted dough was placed in a fermentation chamber Arianna XLT133 (Unox,Cadoneghe, Italy) for 50 min at 37 ◦C. For breadmaking tests, the dough was baked in an electricoven Johnson A60 (Johnson & Johnson, New Brunswick, NJ, USA) at 180 ◦C for 50 min. Breads wereanalysed after cooling for 2 h. Three loaves of each formulation were prepared, and all the analysiswere performed minimum in triplicate.
The pH values of the doughs ranged from 5.3 to 5.4, respectively for the commercial mix andcontrol-dough, and increased with T. chuii incorporation (5.5 in Tc 1%, 5.7 in Tc 2% and 5.9 in Tc 4%).
2.3. Mixing Behaviour of the Dough
The Micro-doughLab 2800 (Perten Instruments, Sidney, Australia) was used to investigate thedifferences in formulation performances and determine the optimum water absorption capacity foreach microalgal content (1% to 4% w/w). Tests were carried out using 4.00 ± 0.01 g mixed flours,at 14% moisture basis, using full formulation. The moisture of the different materials was measuredthrough an automatic moisture analyser PMB 202 (Adam Equipment, Oxford, NJ, USA). Samples andwater weights were corrected from flours and microalga moisture content. Standard manufacturer’sprotocol “General Flour Testing Method” was used, mixing the samples at a constant 63 rpm speedand temperature of 30 ◦C for 20 min. The peak value of torque of the optimised control-formulationwas used, as a reference, to assess the optimum water absorption for each GF bread formulation withT. chuii addition. As a result, mixing curves and dough’s mixing properties were assessed—peakresistance (mN.m), dough development time (s), stability (s) and softening (mN.m).
9

Foods 2020, 9, 579
The amount of water added to the control dough (without microalgal biomass) was 69% on floursmixture basis. This water content was determined in the preliminary assays to produce breads havingthe best quality, based on bread volume and crumb firmness.
2.4. Viscoelastic Behaviour of the Dough
Small amplitude oscillatory shear (SAOS) measurements were performed in a controlled stressrheometer (Haake MARS III, Thermo Fisher Scientific, Waltham, MA, USA) equipped with a UTC-Peltierand fitted with a serrated parallel plate system with 20 mm diameter (PP20) and 1 mm gap (previouslyoptimized for this type of material). After mixing, the dough was shaped into small balls and fermentedin the oven at 37 ◦C, during 50 min. The fermented samples were placed between the plate sensor andthe dough surface exposed was coated with paraffin oil to prevent drying, and allowed to rest at 5 ◦C± 1 ◦C for 10 min before testing at same temperature to avoid fermentation during tests. Stress andfrequency sweep tests were performed: stress sweep test at 6.28 rad/s (1 Hz) was always performedprior to the frequency sweep, to ensure testing within the linear viscoelastic zone. The viscoelasticproperties of the dough were determined from the frequency sweep tests, applying a sinusoidal shearstress of 10 Pa (previously determined linear viscoelastic limit) over an angular frequency range of0.0628 to 628 rad/s. For each sample, at least three repetitions were performed.
2.5. Evaluation of the Bread Texture
Bread texture was characterised using a Texturometer TA.XTplus (Stable Micro Systems, Surrey,UK) equipped with a 5 kg load cell, in a temperature controlled room at 20 ± 1 ◦C. Bread crumb wasmeasured 2 h after baking by a puncture test using a cylindrical acrylic probe of 10 mm diameter(p/10) at 1 mm·s−1 crosshead speed and 10 mm penetration distance. Loaves were sliced by hand,with 20 mm thick. Measurements were repeated at least six times for each bread. Firmness (N) andcohesiveness were the texture parameters used to discriminate different bread samples [26].
2.6. Evaluation of the Bread Volume
Volume of the bread was measured using rapeseed displacement method AACC 10-05.01.In order to compare different breads, the same weight of ingredients, in relation to 300 g of flours inmixture with T. chuii, was used to prepare all the breads, using the formulations presented in Table 1.All the samples were evaluated, at least, in triplicate.
2.7. Evaluation of the Bread Colour
The bread colour was measured using a Minolta CR-400 (Japan) colorimeter with standardilluminant D65 and a visual angle of 2◦. The results use the CIELAB system: L*—lightness (0 to 100),a*—greenness to redness (−60 to 60), and b*—blueness to yellowness (−60 to 60). The total colourdifference between breads containing the microalgal biomass and the Control sample was calculatedusing the equation ΔE* = [(ΔL*)2 + (Δa*)2 + (Δb*)2]1/2. The measurements were replicated at least sixtimes under artificial fluorescent light using a white standard (L* = 94.61, a* = −0.53, and b* = 3.62).
2.8. Evaluation of the Bread Bioactivity
To evaluate the bioactivity of breads, aqueous extracts were prepared by freeze-drying the breadsamples and then milling into homogeneous fine powders using an electric blender. Then, 500 mg ofeach sample was stirred in 50 mL of distilled water using a magnetic bar for 30 min at room temperature,and then filtered by Whatman n◦ 4 paper. This procedure was repeated in duplicate for each bread.For all the bioactivity analysis, three replicates were performed for each extract, correspondent to sixmeasurements for each bread sample.
The total phenolic content (TPC) of bread extract was evaluated using the method reported byOktya et al. [27], with some modifications. The aqueous bread extract (300 μL) was added to 1500 μL
10

Foods 2020, 9, 579
of 0.1 mol/L Folin–Ciocalteu reagent and mixed with 1200 μL of sodium carbonate (7.5%) after 10 min.The mixtures were incubated in the dark at room temperature for 2 h, and then the absorbance wasmeasured at 760 nm in a UNICAM UV4 UV/Vis Spectrometer. For blank testing, the extract wasreplaced by the same volume of water. The TPC was reported as milligrams of gallic acid equivalentsper gram of extract (db).
The scavenging effect of bread extracts was determined using the DPPH (2,2-diphenyl-1-picryl-hydrazyl-hydrate) methodology [28]. Extraction solutions with a volume of 100 μL each were addedto 1000 μL (90 μmol/L) of the DPPH solution in methanol, and the mixture was diluted with 1900 μL ofmethanol. After 1 h in the dark at room temperature, the absorbance was measured at 515 nm. In blanktesting, the extract was replaced by the same volume of methanol. The reducing power of the breadextracts was determined using the ferric ion reducing antioxidant power (FRAP) assay [29]. The breadextract (90 μL) was added to 270 μL of water and 2.7 mL of FRAP reagent (2,4,6-tripyridyl-s-triazine(10 mmol/L) with HCl (40 mmol/L), FeCl3 (0.02 mol/L) and acetate buffer (0.3 mol/L pH 3.6) in a ratioof 1:1:10). After 30 min of incubation period in a 37 ◦C water bath (Thermo Scientific Precision 2864),the absorbance was measured at 593 nm wavelength. For the blank, the extract was substituted by thesame volume of water. The mean values were reported as milligrams of ascorbic acid equivalents pergram of extract (db).
2.9. Sensory Evaluation
Hedonic sensory evaluation was performed for breads with 1 and 4% of T. chuii, as well as forcontrol sample, using an untrained panel of 32 consumers, randomly chosen among the staff andstudents from the Instituto Superior de Agronomia Food Science Department, 14 males and 18 females,with ages between 16 and 65. The three breads were analysed in terms of colour, smell, taste, textureand general acceptance using a 5-point hedonic scale from “very unpleasant” (1) to “very pleasant”(5). The assays were conducted in a standardized sensory analysis room, according to the standardEN ISO 8589: 2007.
2.10. Statistical Analysis
The analysis of variance (one-way ANOVA) of the experimental data was performed usingOrigin Pro 8.0 software (OriginLab Corporation, Northampton, MA, USA), followed by Tukey’s test.Correlation analysis was performed by using STATISTICA (version 10.0, StatSoft, Hamburg, Germany)and the function Bivariate Scatterplot. The significance level was set to 95% (p < 0.05).
3. Results and Discussion
3.1. Impact of Tetraselmis chuii Addition on the Dough Rheology
3.1.1. Empirical Methods—MicrodoughLab
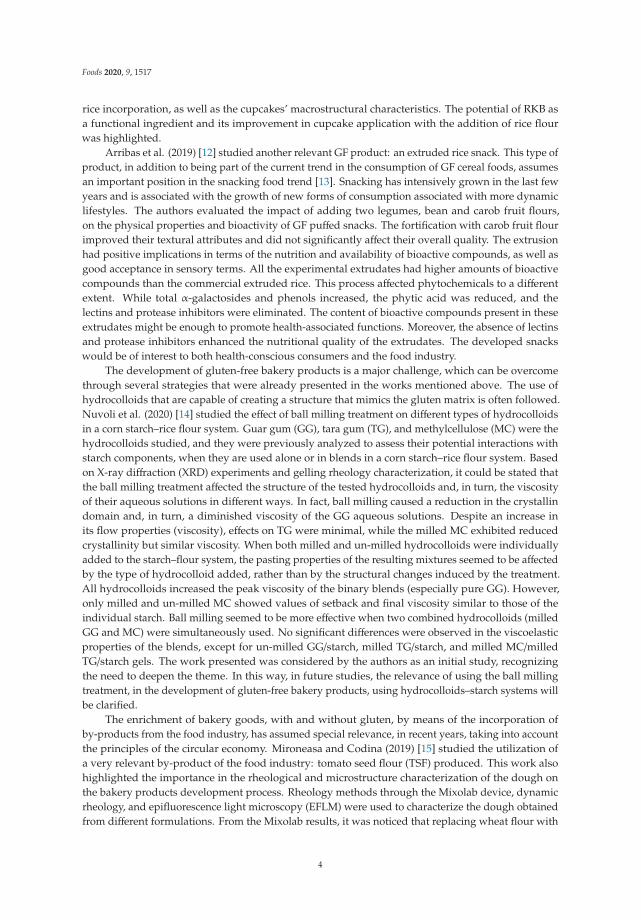
The mixing curves obtained from the MicrodoughLab are represented in Figure 1, where resistanceto mixing is measured as torque. The manufacturer’s protocol “General Flour Testing Method”, at slowspeed, was adopted. GF bread doughs have a completely different composition and structure fromthe wheat dough. These GF systems are mainly composed of starch granules embedded in a matrixcomposed of proteins and other hydrocolloids, but without a gluten network [21]. GF doughs areadhesive and have poor mixing properties. The mixing curves showed a high initial torque as water washydrating the flours, followed by torque decrease and unstable mixing curves were obtained, withouta peak development as observed in wheat doughs mixing curves. Although this test was developedfor wheat dough, and aims a targeted peak of 100 mN.m torque, for an optimum consistency, it is notpossible to use this value in GF doughs. Therefore, different approaches have been used to determinethe water absorption level of GF formulations. Some researchers carried out preliminary assays tooptimise the amount of water necessary for bread making process based on the specific volume of the
11
Foods 2020, 9, 579
produced bread [30,31] and crumb hardness of the resulting breads [30]. Others, used the farinographmixer in order to achieve an optimal dough consistency of 200 BU [32] or 500 BU—Brabender units [33],dough consistency checked by the texturometer equipped with back extrusion rig, using a referencevalue of firmness [34], comparison of complex viscosity (η*) values vs. frequency, taking a soft wheatflour dough which gave a peak at 500 BU as a reference [35], etc.
Figure 1. Mixing curves obtained from the Micro-doughLab of Control and GF doughs with T. chuii Tc1%, Tc 2% and Tc 4%.
Our proposed methodology is to assess optimum water absorption values (amount of waterneeded to achieve target peak torque, corrected to 14% moisture basis) for the formulations containingmicroalgal biomass in order to achieve a peak of 56 nN.m ± 5 mN.m. This peak value corresponds toa control-dough (same GF formulation without microalgae) with good bread baking characteristics,previously optimised by testing different water hydrations (data not presented). The technologicalparameters obtained from the mixing curves are presented in Table 2. For the microalgae contentsconsidered in the present study (1 to 4% w/w) and 69% of water absorption, similar peak values wereobtained, without being necessary to adjust the water content of microalgal-containing formulations.From this empirical rheology test, it was concluded that T. chuii addition had no significant (p < 0.05)impact on the rheology parameters extracted from de mixing curves: optimum water absorption, peakdevelopment time, stability and softening.
Table 2. Parameters obtained from Micro-doughLab mixture curves of Control and GF dough with T.chuii Tc 1%, Tc 2% and Tc 4%.
GF Dough WA (%) P (mN.m) DDT (s) DS (s) DSO (mN.m)
Control 69.0 56 ± 1.2 48 a 30 a 9 aTc 1% 69.0 51 ± 1.7 48 a 44 a 7 aTc 2% 69.0 56 ± 3.8 50 a 44 a 7 aTc 4% 69.0 51 ± 1.5 48 a 50 a 9 a
Note: WA—water absorption; P—peak resistance; DDT—dough development time; DS—dough stability;DSO—dough softening; PE—peak energy. For each sample, the test was performed in triplicate. Differentletters in the same column correspond to significant differences (p < 0.05).
The GF mix was not evaluated using Micro-doughLab since water hydration followed the recipeindicated on the label of this commercial product.
12

Foods 2020, 9, 579
3.1.2. Fundamental Methods—Small Amplitude Oscillatory Shear Measurements (SAOS)
Frequency sweeps were performed to evaluate the impact of T. chuii biomass addition on doughstructure, after fermentation (Figure 2). For each sample, the test was performed in triplicate, and themost representative curve for each sample is presented. Doughs have a viscoelastic behaviour with G’> G”, for the whole range of frequencies studied, showing a destructuring effect, resulting from themicroalgae addition, that was observed at 1% and 2% levels. However, for higher Tc incorporation, 4%,an increase of G’ values was observed. For the 4% T. chuii dough, the values of the elastic modulus (G´at 6.283 rad/s and 62.83 rad/s) are significantly (p < 0.05) higher than for 2% T. chuii, and are similar tothe commercial mix, control-sample and 1% T. chuii. These values correspond to a structure recoveryat 4% level of microalgae addition.
Figure 2. (A) Mechanical spectra and (B) values of G’ at 6.283 rad/s (1 Hz) and 62.83 rad/s (10 Hz)obtained after GF dough fermentation. G’ (storage modulus—filled symbol), G” (loss modulus—opensymbol). Mix, Control and GF dough with T. chuii Tc 1%, Tc 2% and Tc 4%. Error bars indicate thestandard deviations from the repetitions. Different letters correspond to significant differences (p< 0.05).
The frequency dependence of G’ (elastic modulus) and G” (viscous modulus) could be describedby the power law Equations (1) and (2):
G’ = a’ ωb’ (1)
G” = a” ω b” (2)
13

Foods 2020, 9, 579
Values of a and b are determined by performing a linear regression on log G’ and G” versus logfrequency, where a’ and a” are the y-intercepts and b’ and b” are the slopes of the resulting line [7].According to a’ and a” values, Tc 2% dough presented a lower level of structure, showing the lower a’value and the highest value of b’ (Table 3).
Table 3. Frequency dependence of G’ and G” described by the power-law parameters. Mix, Controland GF dough with T. chuii Tc 1%, Tc 2% and Tc 4%. Different letters in the same column correspond tosignificant differences (p < 0.05). R2 > 0.91.
GF Dough a’ b’ a” b”
Mix 38397 a 0.182 d 13942 a,b 0.130 a
Control 43446 a 0.289 a,b 23896 a 0.239 a
Tc 1% 31724 a,b 0.267 b,c 15642 a,b 1.497 a
Tc 2% 11639 b 0.318 a 6875 b 0.268 a
Tc 4% 37213 a 0.249 c 17555 a 0.223 a
Flours from grains without gluten, such as rice, and from pseudocereals, such as buckwheat, havebeen used as ingredients to produce GF breads. Addition of pseudocereals considerably improvesdough viscosity and the texture, volume and nutritional quality of GF products [20,36] and could leadto improved anti-staling properties [37]. To our knowledge, studies relating the impact of microalgaein GF dough rheology have not been published so far. For wheat bread, Nunes et al. [18] have studiedthe impact of microalgae cell disruption pretreatment on the dough rheology and bread bioactivityand found that 1% Chlorella vulgaris has a negative impact on the dynamic viscoelastic properties of thewheat dough.
The structure of complex GF dough systems is mainly accounted by starch and HPMC whichcould entrap the air. When small amounts of protein are added, coming from T. chuii, a destabilisationof this structure can be noticed (Figure 2), mainly for the sample with 2% of microalgal incorporation,however there is a structure recovery for 4% addition. It looks like microalgae elements at first disruptthe structure formed by starch granules embedded in amylose matrix reinforced by HPMC long rods,this can probably happen by depletion flocculation by antagonism with protein macromolecules fromT. chuii, up to a certain concentration. For higher levels (4%), the proteins should take the lead in thestructure network, playing an important role by replacing the former structure, contributing to a newmatrix, dominated by protein interactions, where the starch granules and HPMC will be embeddedwith some compatible reinforcement of the amylose released from starch granules. This structure isdifferent from the previous one, more compact, as it can be seen by the smaller size of the crumb alveoli.
3.2. Impact of Tetraselmis chuii Addition on the Breadmaking Properties
The impact of T. chuii incorporation in the GF bread shape and colour can be accessed throughFigure 3.
Figure 3. General aspect of the GF breads prepared with commercial mix, control and 1, 2 and 4% (w/w)T. chuii gluten free breads.
To study the relation between overall bread quality parameters, raw materials and doughproperties, the texture and the volume of bread loaves were evaluated. For bread crumb differing
14

Foods 2020, 9, 579
in composition, crumb firmness increased with microalgal addition until 2% T. chuii (Figure 4) andthere was a negative impact on loaf volume (Table 4). However, at 4% level, there was an increase ofthe bread volume and a significant (p < 0.05) reduction of bread crumb firmness comparing to 2%,not differing from 1% T. chuii bread. Nevertheless, this formulation with 4% of microalgal biomasspresented a significant (p < 0.05) lower cohesiveness when compared to all the others, including thecontrol-bread and the bread prepared with a commercial mix.
Figure 4. Firmness (A) and cohesiveness (B) values of GF doughs with T. chuii obtained by thetexturometer. Mix, Control and GF dough with T. chuii Tc 1%, Tc 2% and Tc 4%. Error bars indicatethe standard deviations from the repetitions (n = 6). Different letters in the same graph correspond tosignificant differences (p < 0.05).
Table 4. Bread volume and colour parameters obtained for bread crumb. Mix, Control and GF doughwith T. chuii Tc 1%, Tc 2% and Tc 4%. Different letters in the same column correspond to significantdifferences (p < 0.05).
GF Bread Volume (cm3) L* a* b* ΔE*
Mix 674 b 89.3 a 8.5 a 24.0 a,b _Control 701 a 94.6 a 1.4 b 19.2 c _Tc 1% 642 c 38.9 b −1.1 c 16.2 d 64Tc 2% 612 d 29.8 b,c −1.3 c 27.1 a 73Tc 4% 640 c 25.7 c −0.3 c 22.2 b,c 77
Starch gelatinization plays an important role in GF formulations, due to the ability of starch toform a matrix in which gas bubbles are entrapped [38]. Incorporation of non-gluten proteins in theformulation, even at lower amounts, may be essential in achieving final product volume [30,39,40].
15

Foods 2020, 9, 579
Considering the present results, it is possible to conclude that at low contents of T. chuii incorporation,microalgal protein induces a destabilisation of the network formed by starch and HPMC. This isrevelled by a significant reduction of bread volume (the bread becomes more compact), as well as asignificant increase of firmness. However, for the highest protein content of 4%, microalgal proteinplays an important role on the GF dough structure, increasing the capacity to retain the gas bubbles.
In what crumb colour is concerned (Table 4), it is possible to conclude that there was a reduction inlightness (L*) and an increase in greeness (a*, in modulus), comparing to commercial mix and controlbreads. In respect to yellowness (b*), there was a significant (p < 0.05) decrease from control (19.2) to 1%T. chuii bread (16.2), increasing with 2% of algae (27.1) and decreasing again for 4% T. chuii (22.2). Theseresults are related to the pigments of this Chlorophyceae green algae, namely chlorophylls, carotenoids(such as fucoxanthin and β-carotene) and α-tocopherol (Vitamin E) [41]. The total colour differenceΔE* between control and T. chuii crumbs was higher than 64, despite the small differences between 2%and 4% T. chuii bread colours. Several authors consider that the human eye can differentiate colourswhen the total colour difference ΔE* > 5 [42], therefore big colour changes were obtained when breadswere enriched with microalgal biomass. From these results, it seems that T. chuii is contributing to adarkening effect, as it is evident by visual observation (Figure 3) and through the instrumental colourparameters. As will be described in Section 3.5., these colour characteristics are not well appreciated bythe sensory panel.
3.3. Correlations between Breadmaking Properties and Dough Rheology
Using correlation analysis, the relationships between dough rheology and breadmakingperformance of breads with different amounts of T. chuii incorporation were obtained. In Figure 5,one can see the bivariate scatterplots of significant (r > 0.70) dependences - bread firmness vs elasticmodulus (G’6.283 rad/s), bread volume vs elastic modulus (G’6.283 rad/s), and bread volume vs breadfirmness. High G’ values are related with greater elastic contribution and this is negatively correlatedwith the bread firmness (softening effect), followed by a bread volume increase. As expected, breadvolume presented a negative correlation with bread firmness.
Similar results were described by Martínez & Gómez [43], showing that viscoelastic propertiesof several GF doughs strongly influenced the bread volume and crumb texture. Elgeti et al. [44]referred that the rheology of starch-based dough systems influences the level of aeration during mixingand baking.
3.4. Impact of Tetraselmis chuii Addition on the Bread Bioactivity
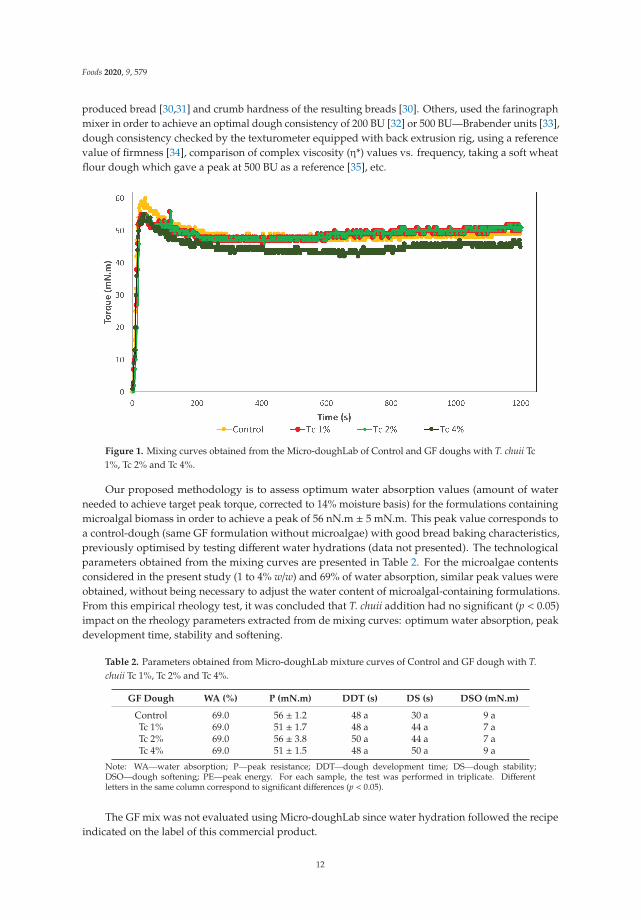
Total phenolic content and antioxidant capacity (DPPH and FRAP) were evaluated only for thecontrol and 4% T. chuii breads, considering the previous results and the objective of achieving highlevels of microalgae incorporation.
The addition of the microalgal biomass at 4% (w/w) resulted in a significant (p < 0.05) increase inthe total phenolic content (TPC) (Figure 6), which was 0.11 mg·g−1 gallic acid equivalents in the Controlbread and 0.24 mg·g−1 in the bread containing T. chuii. TPC values were lower than the values reportedfor GF breads with brown microalgae [23] and may be a result of the formation of protein-phenoliccomplexes [23,45].
16

Foods 2020, 9, 579
Figure 5. Mathematical correlations between GF breadmaking properties and dough rheology(p < 0.05). (A) Bread firmness and G’6.283 rad/s; (B) Bread volume and G’6.263 rad/s; (C) Bread volumeand bread firmness.
The antioxidant capacity was tested using the DPPH and FRAP methods. Compared with thecontrol-bread (2.75 mg·g−1 and 0.33 mg·g−1 ascorbic acid equivalents obtained by DPPH and FRAP,respectively), the incorporation of microalgal biomass led to a significant (p < 0.05) increase in theantioxidant capacity of the breads (3.22 mg·g−1 and 0.47 mg·g−1 ascorbic acid equivalents). Evenupon baking, the antioxidant activity of these breads is interesting. Some other authors reportedsimilar results, Rózylo et al. [23] determined the effect of brown macroalgae on GF bread and observedincreased FRAP activity, and higher FRAP antioxidant capacity was found by Nunes et al. [18] inwheat breads enriched with Chlorella vulgaris.
17
Foods 2020, 9, 579
Figure 6. Total phenolic content (mg·g−1 gallic acid equivalents), antioxidant capacity measured usingthe DPPH assay (2,2-diphenyl-1-picryl-hydrazyl-hydrate; mg.g−1 ascorbic acid equivalents) and FRAPassay (ferric ion reducing antioxidant power; mg.g−1 ascorbic acid equivalents) of GF breads enrichedwith 4% (w/w) of T. chuii biomass in comparison with Control bread. Error bars indicate the standarddeviations of the repetitions (n = 3).
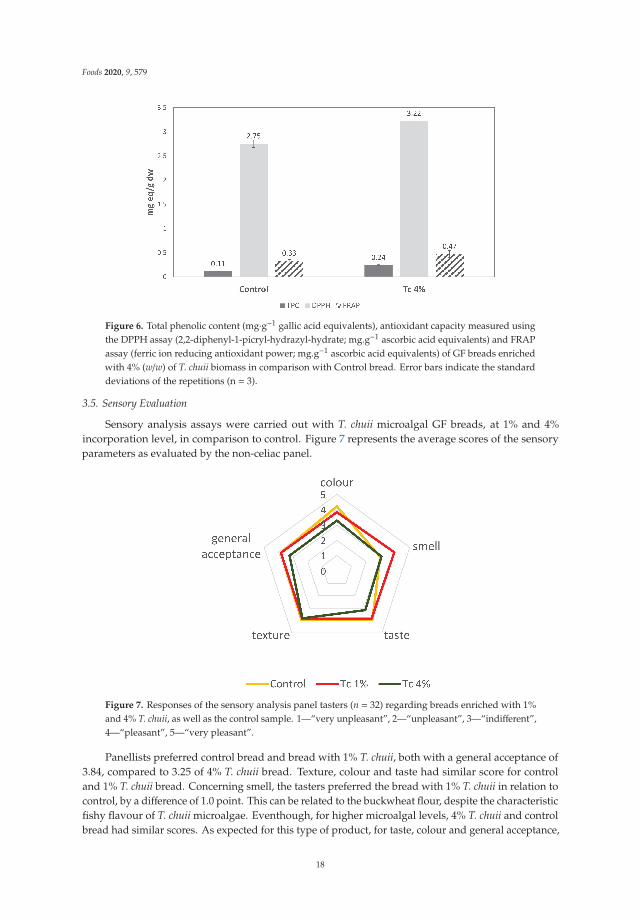
3.5. Sensory Evaluation
Sensory analysis assays were carried out with T. chuii microalgal GF breads, at 1% and 4%incorporation level, in comparison to control. Figure 7 represents the average scores of the sensoryparameters as evaluated by the non-celiac panel.
Figure 7. Responses of the sensory analysis panel tasters (n = 32) regarding breads enriched with 1%and 4% T. chuii, as well as the control sample. 1—“very unpleasant”, 2—“unpleasant”, 3—“indifferent”,4—“pleasant”, 5—“very pleasant”.
Panellists preferred control bread and bread with 1% T. chuii, both with a general acceptance of3.84, compared to 3.25 of 4% T. chuii bread. Texture, colour and taste had similar score for controland 1% T. chuii bread. Concerning smell, the tasters preferred the bread with 1% T. chuii in relation tocontrol, by a difference of 1.0 point. This can be related to the buckwheat flour, despite the characteristicfishy flavour of T. chuii microalgae. Eventhough, for higher microalgal levels, 4% T. chuii and controlbread had similar scores. As expected for this type of product, for taste, colour and general acceptance,
18

Foods 2020, 9, 579
bread with 4% T. chuii had lower scores, but not lower than 3, corresponding to “indifferent”. In thecomments field of the sensory analysis sheet, some tastes referred the strong fishy flavour of the 4%T. chuii bread, but that it could be pleasant to eat with fish meals. Furthermore, this bread could bean interesting alternative for consumers interested in healthy products with an innovative taste andcolour. To improve the acceptance by the conventional consumers, educational marketing strategiesand formulation enhancements are programmed in the Algae2Future project.
4. Conclusions
The mixing and viscoelastic behaviour of GF doughs enriched with Tetraselmis chuii was comparedwith the control formulation. Bread baking performance was also evaluated since GF doughs arecomplex systems and final bread quality is affected by processing conditions.
T. chuii can be used as a natural novel and sustainable ingredient to increase the bioactivityof GF bread based on buckwheat flour, rice flour and potato starch, obtaining an innovative greenappearance. Different behaviour was found according with the level of T. chuii incorporation. Below2%, T. chuii proteins destabilize the structure developed by starch and HPMC, smaller bread volumewas obtained, associated with a more compact crumb and harder properties. However, for higherlevels of incorporation (4%), the microalgal proteins with starch and HPMC build up another type ofstructure, characterised by higher values of the viscoelastic functions (G‘and G”) producing higherbread volume and a softening effect. This study shows that the structure of 4% T. chuii bread iscompetitive with the control-bread with the advantage of having an improved bioactivity (phenolicsand antioxidants) with possible positive impacts on health. The use of T. chuii at 4% level is interesting,but low sensory scores postpone its utilization.
Author Contributions: M.C.N., I.S. and A.R. oversaw conception and design. M.C.N. and I.F. oversaw breadformulation and preparation, physical analysis and data interpretation. M.C.N. and I.V. oversaw bread bioactivityanalysis and data interpretation. M.C.N. was responsible for statistical analysis and redaction of the manuscript.M.C.N., I.S. and A.R. were responsible for the discussion of the results and revision of the manuscript. All authorshave read and agreed to the published version of the manuscript.
Funding: Research Council of Norway, Algae to Future (A2F) Project - From Fundamental AlgaeResearch to Applied Industrial Practices. Portuguese Foundation for Science and Technology (FCT),UID/AGR/04129/2013—LEAF.
Acknowledgments: The authors wish to thank Dorinde Kleinegris from NORCE/UiB in Bergen (Norway) forTetraselmis chuii microalgal biomass production at pilot scale, as well as Maria Eleni Kokkali and KaterinaKousoulaki from NOFIMA in Bergen (Norway) for cell wall disruption and freeze drying of T. chuii biomass.
Conflicts of Interest: None of the authors has potential financial or other conflicts of interest to disclose.
References
1. Koyande, A.K.; Chew, K.W.; Rambabu, K.; Tao, Y.; Chu, D.-T.; Show, P.-L. Microalgae: A potential alternativeto health supplementation for humans. Food Sci. Hum. Wellness 2019, 8, 16–24. [CrossRef]
2. Leach, A.M.L.; Gallowaya, J.N.; Bleeker, A.; Erisman, J.W.; Khon, R.; Kitzes, J. A nitrogen footprint model tohelp consumers understand their role in nitrogen losses to the environment. Environ. Dev. 2012, 1, 40–66.[CrossRef]
3. Batista, A.P.; Gouveia, L.; Bandarra, N.M.; Franco, J.M.; Raymundo, A. Comparison of microalgal biomassprofiles as novel functional ingredient for food products. Algal Res. 2013, 2, 164–173. [CrossRef]
4. Khan, M.I.; Shin, J.H.; Kim, J.D. The promising future of microalgae: Current status, challenges, andoptimization of a sustainable and renewable industry for biofuels, feed, and other products. Microb. CellFactories 2018, 17, 36. [CrossRef]
5. Lafarga, T. Effect of microalgal biomass incorporation into foods: Nutritional and sensorial attributes of theend products. Algal Res. 2019, 41, 101566. [CrossRef]
6. Lafarga, T.; Mayre, E.; Echeverria, G.; Viñas, I.; Villaró, S.; Acién-Fernández, F.G.; Castellari, M.;Aguiló-Aguayo, I. Potential of the microalgae Nannochloropsis and Tetraselmis for being used as innovativeingredients in baked goods. LWT Food Sci. Technol. 2019, 115, 108439. [CrossRef]
19

Foods 2020, 9, 579
7. Bernaerts, T.M.M.; Panozzo, A.; Doumen, V.; Foubert, I.; Gheysen, L.; Goiris, K.; Moldenaers, P.;Hendrickx, M.E.; Van Loey, A.M. Microalgal biomass as a (multi)functional ingredient in food products:Rheological properties of microalgal suspensions as affected by mechanical and thermal processing. AlgalRes. 2017, 25, 452–463. [CrossRef]
8. Bernaerts, T.M.M.; Gheysen, L.; Foubert, I.; Hendrickx, M.E.; Van Loey, A.M. The potential of microalgae andtheir biopolymers as structuring ingredients in food: A review. Biotechnol. Adv. 2019, 37, 107419. [CrossRef][PubMed]
9. Raymundo, A.; Nunes, M.C.; Sousa, I. Microalgae biomass as a food ingredient to design added valueproducts. In Valorising Seaweed by-Products; Domínguez, H., Torres, M.D., Eds.; Nova Science Publishers:Hauppauge, NY, USA, 2019; ISBN 978-1-53615-398-9.
10. Fradique, M.; Batista, A.P.; Nunes, M.C.; Gouveia, L.; Bandarra, N.M.; Raymundo, A. Incorporation ofChlorella vulgaris and Spirulina maxima biomass in pasta products. Part I: Preparation and evaluation. J. Sci.Food Agric. 2010, 90, 1656–1664. [CrossRef] [PubMed]
11. Fradique, M.; Batista, A.P.; Nunes, M.C.; Gouveia, L.; Bandarra, N.; Raymundo, A. Isochrysis galbana andDiacronema vlkianum biomass incorporation in pasta products as PUFA’s source. LWT Food Sci. Technol. 2013,50, 312–319. [CrossRef]
12. Fradinho, P.; Raymundo, A.; Sousa, I.; Domínguez, H.; Torres, M.D. Edible brown seaweed in gluten-freepasta: Technological and nutritional evaluation. Foods 2019, 8, 622. [CrossRef] [PubMed]
13. Fradinho, P.; Niccolai, A.; Soares, R.; Rodolfi, L.; Biondi, N.; Tredici, M.R.; Sousa, I.; Raymundo, A. Effect ofArthrospira platensis (spirulina) incorporation on the rheological and bioactive properties of gluten-free freshpasta. Algal Res. 2020, 45, 101743. [CrossRef]
14. Gouveia, L.; Coutinho, C.; Mendonça, E.; Batista, A.P.; Sousa, I.; Bandarra, N.M.; Raymundo, A. Functionalbiscuits with PUFA-ω3 from Isochrysis galbana. J. Sci. Food Agric. 2008, 88, 891–896. [CrossRef]
15. Batista, A.P.; Nicccolai, A.; Fradinho, P.; Fragoso, S.; Bursic, I.; Rodolfi, L.; Biondi, N.; Tredici, M.R.; Sousa, I.;Raymundo, A. Microalgae biomass as an alternative ingredient in cookies: Sensory, physical and chemicalproperties, antioxidant activity and in vitro digestibility. Algal Res. 2017, 26, 161–171. [CrossRef]
16. Batista, A.P.; Niccolai, A.; Bursic, I.; Sousa, I.; Raymundo, A.; Rodolfi, L.; Biondi, N.; Tredici, M.R. Microalgaeas funtional ingredientes in savory food products: Application to wheat crackers. Foods 2019, 8, 611.[CrossRef]
17. Graça, C.; Fradinho, P.; Sousa, I.; Raymundo, A. Impact of Clorella vulgaris addition on rheology wheat doughproperties. LWT Food Sci. Technol. 2018, 89, 466–474. [CrossRef]
18. Nunes, M.C.; Graça, C.; Vlaisavljevic, S.; Tenreiro, A.; Sousa, I.; Raymundo, A. Microalgae cell disruption:Effect on the bioactivity and rheology of wheat bread. Algal Res. 2020, 45, 101749. [CrossRef]
19. Matos, M.E.; Rosell, C.M. Understanding gluten-free dough for reaching breads with physical quality andnutritional balance. J. Sci. Food Agric. 2015, 95, 653–661. [CrossRef]
20. Naqash, F.; Gani, A.; Gani, A.; Masoodi, F.A. Gluten-free baking: Combating the challenges – a review. TrendsFood Sci. Technol. 2017, 66, 98–107. [CrossRef]
21. El Khoury, D.; Balfour-Ducharme, S.; Joye, I.J. A review on the gluten-free diet: Technological and nutritionalchallenges. Nutrients 2018, 10, 1410. [CrossRef]
22. Figueira, F.S.; Crizel, T.M.; Silva, C.R.; Salas-Mellado, M.M. Elaboration of gluten-free bread enriched withthe microalgae Spirulina platensis. Braz. J. Food Technol. 2011, 14, 308–316.
23. Rózylo, R.; Hassoon, W.H.; Gawlik-Dziki, U.; Siastala, M.; Dziki, D. Study on the physical and antioxidantproperties of gluten-free bread with brown algae. CyTA J. Food 2017, 15, 196–203. [CrossRef]
24. Kokkali, M.E.; Kleinegris, D.M.M.; de Vree, J.H.; Haugsgjerd, B.O.; Samuelsen, T.A.; Oterhals, A.;Kousoulaki, K. Optimising cell wall disruption by bead milling of microalgae biomass for release ofnutrients for aquafeed and food applications (preliminary results). In Proceedings of the HydroMedit 2018,3rd International Congress on Applied Ichthyology & Aquatic Environment, Volos, Greece, 8–11 November2018.
25. Fernandes, I.C.X. Desenvolvimento de Pães Sem Glúten Enriquecidos com Tetraselmis chuii. Master’s Thesis,Instituto Superior de Agronomia da Universidade de Lisboa, Lisboa, Portugal, 2019.
26. Bourne, M. Food Texture and Viscosity, 2nd ed.; Academic Press: London, UK, 2002.27. Oktay, M.; Gülçin, Ì.; Kufrevioglu, O.Ì. Determination of in vitro antioxidant activity of fennel (Foeniculum
vulgare) seed extracts. LWT Food Sci. Technol. 2003, 36, 263–271. [CrossRef]
20

Foods 2020, 9, 579
28. Sánchez-Moreno, C.; Larrauri, J.A.; Saura-Calixto, F. A procedure to measure the antiradical efficiency ofpolyphenols. J. Sci. Food Agric. 1998, 76, 270–276. [CrossRef]
29. Rufino, M.S.M.; Alves, R.E.; Brito, E.S.; Morais, S.M.; Sampaio, C.G.; Pérez-Jiménez, J.; Saura-Calixto, F.D.Metodologia Científica: Determinação da Atividade Antioxidante Total em Frutas pelo Método de Redução do Ferro(FRAP); Embrapa Agroindústria Tropical: Fortaleza Brasil, 2006.
30. Storck, C.R.; Zavareze, E.R.; Gularte, M.A.; Elias, M.C.; Rosell, C.M.; Dias, A.R.G. Protein enrichment and itseffects on gluten-free bread characteristics. LWT Food Sci. Technol. 2013, 53, 346–354. [CrossRef]
31. Sahagún, M.; Gómez, M. Assessing influence of protein source on characteristics of gluten-free breadsoptimising their hydration level. Food Bioprocess Technol. 2018, 11, 1686–1694. [CrossRef]
32. Mariotti, M.; Lucisano, M.; Pagani, M.A.; Ng, P.K.W. The role of corn starch, amaranth flour, pea isolate, andPsyllium flour on the rheological properties and the ultrastructure of gluten-free doughs. Food Res. Int. 2009,42, 963–975. [CrossRef]
33. Mohammadi, M.; Azizi, M.H.; Neyestani, T.R.; Hosseini, H.; Mortazavian, A.M. Development of gluten-freebread using guar gum and transglutaminase. Ind. Eng. Chem. 2015, 21, 1398–1402. [CrossRef]
34. Korus, J.; Witczak, M.; Ziobro, R.; Juszczak, L. The influence of acorn flour on rheological properties ofgluten-free dough and physical characteristics of the bread. Eur. Food Res. Technol. 2015, 240, 1135–1143.[CrossRef]
35. Yazar, G.; Duvarci, O.; Tavman, S.; Kokini, J.L. Non-linear rheological behaviour of gluten-free flour doughsand correlations of LAOS parameters with gluten-free bread properties. J. Cereal Sci. 2017, 74, 28–36.[CrossRef]
36. Wang, K.; Lu, F.; Li, Z.; Zhao, L.; Han, C. Recent developments in gluten-free bread baking approaches: Areview. Food Sci. Technol 2017, 37, 1–9. [CrossRef]
37. Torbica, A.; Hadnacev, M.; Dapcevic, T. Rheological, textural and sensory properties of gluten-free breadformulations based on rice and buckwheat flour. Food Hydrocoll. 2010, 24, 626–632. [CrossRef]
38. Horstmann, S.W.; Lynch, K.M.; Arendt, E.K. Starch characteristics linked to gluten-free products. Foods 2017,6, 29. [CrossRef] [PubMed]
39. Graça, C.; Raymundo, A.; Sousa, I. Yogurt as an alternative ingredient to improve the functional andnutritional properties of gluten-free breads. Foods 2020, 9, 111. [CrossRef]
40. Tomic, J.; Torbica, A.; Belovic, M. Effect of non-gluten proteins and transglutaminase on dough rheologicalproperties and quality of bread based on millet (Panicum miliaceum) flour. LWT Food Sci. Technol. 2020, 118,108852. [CrossRef]
41. Carballo-Cárdenas, E.C.; Tuan, P.M.; Janssen, M.; Wijffels, R.H. Vitamin E (α-tocopherol) production bymarine microalgae Dunaliella tertiolecta and Tetraselmis suecica in batch cultivation. Biomol. Eng. 2003, 20,139–147. [CrossRef]
42. Francis, F.J.; Clydesdale, F.M. Food Colorimetry: Theory and Applications; The AVI Publishing Company Inc.:Westport, CT, USA, 1975.
43. Martínez, M.M.; Gómez, M. Rheological and microstructural evolution of the most common gluten-freeflours and starches during bread fermentation and baking. J Food Eng. 2017, 197, 78–86. [CrossRef]
44. Elgeti, D.; Peng, L.; Jekle, M.; Becker, T. Foam stabilization during processing of starch-based dough systems.Innov. Food Sci. Emerg. Technol. 2017, 39, 267–274. [CrossRef]
45. Ballester-Sánchez, J.; Gil, J.V.; Haros, C.M.; Fernández-Espinar, M.T. Effect of Incorporating white, red orblack quinoa flours on free and bound polyphenol content, antioxidant activity and colour of bread. PlantFoods Hum. Nutr. 2019, 74, 185–191. [CrossRef]
© 2020 by the authors. Licensee MDPI, Basel, Switzerland. This article is an open accessarticle distributed under the terms and conditions of the Creative Commons Attribution(CC BY) license (http://creativecommons.org/licenses/by/4.0/).
21


foods
Article
Impact of Acorn Flour on Gluten-Free DoughRheology Properties
R. Beltrão Martins 1,2,*, M. C. Nunes 3, L. M. M. Ferreira 1, J. A. Peres 2, A. I. R. N. A. Barros 1 and
A. Raymundo 3
1 CITAB—Centre for the Research and Technology of Agro-Environmental and Biological Sciences,Universidade de Trás-os-Montes e Alto Douro, 5000-801 Vila Real, Portugal; [email protected] (L.M.M.F.);[email protected] (A.I.R.N.A.B.)
2 CQVR—Chemistry Research Centre, Chemistry Department, Universidade de Trás-os-Montes e Alto Douro,5000-801 Vila Real, Portugal; [email protected]
3 LEAF—Linking Landscape, Environment, Agriculture and Food, Instituto Superior de Agronomia,Universidade de Lisboa, Tapada da Ajuda, 1349-017 Lisbon, Portugal; [email protected] (M.C.N.);[email protected] (A.R.)
* Correspondence: [email protected]; Tel.: +351-966-908-963
Received: 31 March 2020; Accepted: 26 April 2020; Published: 2 May 2020
Abstract: Gluten is a fundamental ingredient in breadmaking, since is responsible for the viscoelasticbehaviour of the dough. The lack of gluten has a critical effect on gluten-free dough, leading to lesscohesive and less elastic doughs, and its replacement represents a challenge for bakery industry.However, dough rheology can be improved combining different ingredients with structural capacityand taking advantage from their interactions. Although acorn flour was used to bake bread evenbefore Romans, nowadays is an underexploited resource. It presents good nutritional characteristics,particularly high fibre content and is naturally gluten free. The aim of this study was to use acorn flouras a gluten-free ingredient to improve dough rheology, following also market trends of sustainabilityand fibre-rich ingredients. Doughs were prepared with buckwheat and rice flours, potato starchand hydroxypropylmethylcellulose. Two levels of acorn flour (23% and 35% w/w) were testedand compared with control formulation. Micro-doughLAB was used to study mixing and pastingproperties. Doughs were characterised using small amplitude oscillatory measurements (SAOS),with a controlled stress rheometer, and regarding Texture Profile Analysis (TPA) by a texturometer.Dietary fibre content and its soluble and insoluble fractions were also evaluated on the developedbreads. Acorn flour showed promising technological properties as food ingredient for gluten-freebaking (improved firmness, cohesiveness and viscoelasticity of the fermented dough), being animportant fibre source.
Keywords: acorn flour; gluten-free dough; fibre-rich ingredient; underexploited resources; rheology;pasting properties
1. Introduction
Gluten is one of the most important ingredients in bread making. It is responsible for theviscoelastic behaviour of the dough [1]. Gluten matrix has a major role on the main dough properties:extensibility, stretching resistance, mixing tolerance, gas-holding capacity and allows to obtain ahigh-quality bread crumb structure [2].
On the other hand, gluten-free dough (GFD) is unable to form a protein network similar to gluten.This raises several difficulties and thus the loss of quality on gluten-free bread baking [3]. The lack ofgluten has a critical effect on dough rheology (less cohesive and elastic than wheat dough), formulationprocess and sensory quality of the final product [2]. The replacement of gluten in baking is a great
Foods 2020, 9, 560; doi:10.3390/foods9050560 www.mdpi.com/journal/foods23

Foods 2020, 9, 560
challenge. There is no raw material or any other ingredient capable of completely replacing gluten,in terms of structural builder. Only the combination of different ingredients and its interactions,with adequate technologies, can improve gluten-free bread (GFB) quality [3–6]. Therefore, innovativeingredients with structural properties, novel approaches and processes, have been studied and testedwith notable results so far obtained [7–11]. In our study, a mixture of natural gluten-free flours wasused: buckwheat flour, rice flour, potato starch, acorn flour, and hydroxipropylmethylcellulose (HPMC)as thickening agent.
Rheology measurements are essential tools to understand the performance of the doughs,allowing to predict the final result and the before quality of bread [12]. Among the different rheologicaltechniques, the small amplitude oscillatory shear (SAOS), demonstrated to be adequate to characteriseviscoelastic materials and its structure properties [13]. The rheology of GFD, is also very important inorder to understand the doughs behaviour during the baking process. Although the studies about thissubject have recently increased, the information available is still limited [14]. Additionally, the majorityof the GF flours are starch based, yet with different botanical sources, leading to completely diverseperformances, according to the GF dough formulation [15].
Nowadays, due to resource scarcity worldwide, is essential to use by-products and underexploitednatural raw materials that are not valued enough in food production. This fact led to market trendsof sustainability [16], natural products and fibre-rich ingredients, which have contributed to theintroduction of underexploited natural raw materials into food chain [17]. Acorn flour is an example,in particular to special requirements products as GF bread [18], increasing the importance of researchingthis flour. Several authors have been recently studying the incorporation of acorn flour in glutencontaining biscuits and bread, in combination with wheat and barley. In all studies, the incorporationof acorn flour until a specific proportion improved the quality of the different final products, both innutritional and sensorial characteristics [19–21]. Korus et al. [22] and Skendy et al. [11] have studied theeffect of acorn flour addition in GF bread making, and both concluded that acorn flour incorporationin GF bread could be useful for nutritional and technological reasons. Additionally, many otherinnovative GF flours, and their impact on GF bread making, have been studied. Particularly, alternativesources of protein, like insects and legumes, found to improve GF bread nutritional composition andcontribute to substitute gluten role [23,24]. In addition, microalgae, sorghum, millet, pseudo-cereals,fruit-based flours, by-products and other naturally GF flours have been tested, with very promisingresults [5,8,9].
Acorn is the fruit of Quercus genus tree. These trees are the basis of the Sustainable AgricultureSystem named “Montado” in South of Europe. In Portugal, acorns are abundant and can be consideredan underexploited resource, since nearly 50% of the fruits in the trees are not used or harvested [17].Many authors [25,26] state the use of acorn flour to bake bread has occurred since before the RomanEra. Veiga de Oliveira et al. [27] go further, referring that this flour was already consumed even beforethe Romans [27]. This fruit was traditionally present in the Mediterranean diet, some decades ago,especially in scarcity years [26]. The acorns most commonly used in human feed were from Quercusilex and Quercus rotundifolia (holm oak). Since they are not so bitter comparing to other species, isnot necessary to remove bitterness, as Korus et al. [22] described in their work. According to Silvaand co-workers [18], acorn flour has interesting nutritional characteristics, and is rich in lipids (8.5%),especially in unsaturated fatty acids and fibre (9.5%–11.5%). Fibres have a major role in GFD rheologycharacteristics, besides improving nutritional GF bread quality [28,29].
Comparing this work with the referred authors [11,22] who have studied acorn flour incorporationin GF bread, it is important to highlight the innovation of our study. Since holm oak acorn is naturallyslightly sweet, no bitterness removal treatment is needed, as mentioned before, which is a greattechnological advantage. The amount of water added to each flour blend was assessed throughMicro-DoughLAB tests. Bread control formulation has buckwheat flour besides starch-based flours.Finally, pasting properties and dough TPA measurements were performed.
24

Foods 2020, 9, 560
The objective of this work was to study the impact of acorn flour from holm oak, on the rheologycharacteristics of the GF dough, and also on the dietary fibre content, both soluble and insolublefractions, of the GF baked breads. Two levels of incorporation (23% and 35%) were considered.
2. Materials and Methods
2.1. Raw Materials
Doughs formulations were prepared with the following flours: buckwheat flour (Próvida,Pêro Pinheiro, Portugal), acorn flour from dried holm oak (Quercus ilex and Quercus rotundifolia)(Terrius, Marvão, Portugal), rice flour (Fábricas Lusitana, Castelo Branco, Portugal), potato starch(Colmeia do Minho, Paio Pires, Portugal), dried yeast (Fermipan®, Lesaffre, Marcq-en-Baroeul,France), hydroxipropyl methylcellulose (HPMC) as a gelling agent (WellenceTM 321, Dow, MI, USA),sugar, sunflower oil, salt, and water. The flour ingredients and the HPMC were kindly supplied forfree, except yeast, sugar, oil and salt that were purchased from local market.
2.2. Dough Preparation and Sampling
Fernandes [30] developed and analysed a GFD recipe that showed promising results, based onbuckwheat flour, rice flour and potato starch, with HPMC as a gelling agent. The control dough (C)was prepared without acorn flour addition. Preliminary assays were conducted to adjust the watercontent of the control formulation to produce breads having the best quality, based on bread volumeand crumb firmness, by testing different water hydrations (data not presented). Two incorporationlevels of acorn flour were tested, 23% w/w (sample A23%) and 35% w/w (sample A35%) of total floursmixture, respectively, 50% and 75% in relation to the buckwheat flour. The three formulations studiedare summarised in Table 1.
Table 1. Formulation of the gluten-free dough (GFD) samples and respective codes.
Ingredients (%) Control (C) Acorn 23% (A23%) Acorn 35% (A35%)
Buckwheat flour 46.0 23.0 12.0Rice flour 31.0 31.0 31.0
Potato starch 23.0 23.0 23.0Acorn flour 0.0 23.0 35.0
Sunflower oil (in relation to flours) 5.5 5.5 5.5HPMC (in relation to flours) 4.6 4.6 4.6
Dried yeast (in relation to flours) 2.8 2.8 2.8Sugar (in relation to flours) 2.8 2.8 2.8Salt (in relation to flours) 1.8 1.8 1.8
Water absorption (14% moisture basis) 65.0 63.0 62.0
Micro-doughLAB 2800 (Perten Instruments, Sidney, Australia) manufacturer’s protocol at 63 rpmspeed (AACC (American Association of Cereal Chemists) Method 54-21.01) was used to assess theoptimum water absorption capacity for formulations with acorn flour. The peak value of torque ofthe optimised control-formulation was used as a reference (93 mN.m). Optimum water absorptionvalues (amount of water needed to achieve target peak torque, corrected to 14% moisture basis) weredetermined for the formulations containing acorn flour in order to achieve a peak of 93 mN.m ± 4%.
The moisture of the different flours was measured through an automatic moisture analyser PMB 202(Adam Equipment, Oxford, CT, USA). The values were buckwheat flour—12.35%; acorn flour—8.03%;rice flour—11.08%; potato starch—18.10%.
Ingredients were mixed in a Thermo processor equipment (Bimby—Vorwerk, Wuppertal,Germany), initially to activate the yeast, by adding water, yeast and sugar for 2 min at 27 ◦C,at velocity 1. Following, the other ingredients were added and mixed for 10 min in a dough mixingprogram (wheat ear symbol). The resulting dough was divided in three portions and poured into three
25

Foods 2020, 9, 560
equal containers and placed in a fermentation chamber Arianna XLT133 (Unox, Cadoneghe, Italy) for50 min at 37 ◦C. All measurements were carried out after fermentation: three loaves of each formulationwere prepared, and all the analyses were performed minimum in triplicate: three measurements weretaken from independent three portions of each loaf. Mean values and standard deviations from eachdetermination were recorded.
In a parallel work, the impact of acorn flour addition in the bread characteristics was studied,using exactly the same dough formulations above described. After fermentation, the dough was bakedin an electric oven Johnson A60 (Johnson & Johnson, NJ, USA) for 50 min at 180 ◦C. Correlationsbetween dough properties and breadmaking characteristics (bread firmness) were analysed.
2.3. Rheology Measurements
2.3.1. Pasting Properties
The pasting properties of flour blends, according to each GFD formulation, were tested using aMicro-doughLAB 2800 (Perten Instruments, Sidney, Australia), following the manufacturer’s cookingprotocol with some modifications [31]. Constant mixing rate at 63 rpm for 43 min (2580 s), and thefollowing temperature cycle: 30 ◦C for 6 min, then rise temperature until 90 ◦C during 15 min,the temperature of 90 ◦C keeps constant for 7 min, then decrease to 50 ◦C during 10 min and finally,constant temperature of 50 ◦C for more 5 min, until the end. Only the flours and HPMC were added inthe mixture, and 4.00 ± 0.01 g of each flour blend sample was weighed and placed in the chamberof Micro-doughLAB. The amount of water used was studied in previous mixing tests to find theoptimum water absorption. Additionally, pure buckwheat flour and acorn flour were tested in the sameconditions. Tests were performed at least in triplicate. Concerning rice flour and potato starch, sincethese ingredients were in the same share in all the formulations, were not submitted to pasting test.
2.3.2. Small Amplitude Oscillatory Measurements (SAOS) Testing
For dough characterisation, by dynamic rheometric measurements, formulations were preparedwith all ingredients, as previously described. Rheological tests were performed using a controlled stressrheometer (MARS III, Haake, Germany) coupled with a UTC-Peltier system. A serrated parallel-plateP20 (diameter of 20 mm) was used, with a gap between plates of 1 mm. Each sample was prepared in asmall portion of dough, and after 50 min of fermentation at 37 ◦C in a fermentation chamber AriannaXLT133 (Unox, Cadoneghe, Italy), was allowed to rest for 30 min at 5 ◦C. The fermented dough sampleswere placed between the plates, and after its adjustment, the edges were covered with paraffin toprotect the sample from dehydration during measurements. Rheometer temperature was kept at 5 ◦Cduring test performance to avoid dough fermentation. Samples were left for 15 min before the test,to allow residual stress to relax and to stabilise the temperature. All rheological measurements wererun, at least, in triplicate.
Small amplitude oscillatory shear (SAOS) tests were conducted to assess linear viscoelasticproperties of the GFD. The dynamic linear viscoelastic region of each sample was previously determinedthrough stress sweep tests at frequency of 6.28 rad/s (1 Hz). Frequency sweeps (from 0.0628 to 628 rad/s)were performed at constant shear stress of 10 Pa.
2.3.3. Dough Texture Profile Analysis (TPA)
Texture profile analysis (TPA) was performed after dough fermentation at 37 ◦C during 50 min,using a texturometer TA.XT.plus (Stable Micro Systems, Surrey, England) equipped with a load cell of5 kg and penetration mode of the equipment set up. Dough samples were placed in cylindric containerswith 100 mm in diameter and a height of 80 mm. These cylinders were completely filled by the sample.
The measurement conditions were 19 mm diameter acrylic cylindrical probe, 20 mm of penetrationdistance, 1 mm/s of crosshead speed and 5 s of waiting time between the two measurements cycles.Each measurement was repeated at least four times. Firmness and cohesiveness were the main
26

Foods 2020, 9, 560
representative texture parameters obtained from TPA, to characterise the dough, as it was reported byNunes et al. [8].
2.4. Colour Characterisation and pH Values of GF Dough
Dough colour was determined using a colorimeter Croma-Meter CR 400 (Konica-Minolta SensingAmericas, New Jersey, USA), through the CIE L*a*b* system (International Commission on Illumination)using the following parameters: L*—lightness variable (L* = 100 white, L* = 0 black); a*—intensityof green (−60 < a* < 0) or red (0 < a* < +60); and b*—intensity of blue (−60 < b* < 0) or yellow(0 < b* < +60). Each sample was measured in triplicate.
pH measurements were performed in three different points of each fermentation dough,with a potentiometer pH-Meter Basic 20 (Crison Instruments, Barcelona, Spain), until stabilisation.
2.5. Dietary Fibre: Soluble, Insoluble and Total Fibre in GF Bread
According to Martins et al. [32], gluten-free breads were prepared from the same GF doughsstudied in this work, as previously described. The soluble, insoluble and total fibre of GF breads(Control, A23% and A35%), were determined by using a “Total Dietary Fibre Assay Kit” from Megazyme(Wicklow, Ireland). According to manufacturer’s information, the analysis can be considered to bedivided in two methods: (1) based on AOAC (Association of Official Agricultural Chemists) Method991.43 “Total, Soluble, and Insoluble Dietary Fibre in Foods” (First Action 1991) and AACC Method32-07.01 “Determination of Soluble, Insoluble, and Total Dietary Fibre in Foods and Food Products”(Final Approval 10-16-91); (2) determination of total dietary fibre based on AACC method 32-05.01 andAOAC Method 985.29. All procedures were done at least in duplicate.
2.6. Statistical Analysis
Results were analysed using the statistical programme Origin Pro 8 (OriginLab Corporation,MA, USA). Experimental data were compared using analysis of variance (one-way ANOVA), and theTukey test was used to evaluate mean differences at a confidence level of 95%, with significantdifferences considered to be p < 0.05. Results are presented as mean values and standard deviations.Correlations were tested between the different variables, using the program Statistica 10.0 and thefunction Bivariate Scatterplot.
3. Results and Discussion
3.1. Dough Rheology Characterisation
3.1.1. Pasting Properties
Flour blends’ and pure flours’ pasting curves, obtained from the MidrodoughLab are representedin Figure 1, with the main points marked with a blue circle.
In Figure 1, it is possible to observe the maximum torque of the flour blends’ mixing curves, that isrepresented in C1, with a constant temperature of 30 ◦C. After 6 min, the temperature starts rising.The graphic shows the breakdown (C2), minimum torque (linked with minimum viscosity) at 61 ◦C,corresponding to protein weakening. All the flour blends had a similar response concerning bothtemperature and torque (40 m.Nm). At the same stage (C2), pure flours showed the minimum torque,related with a minimum of viscosity, at the same temperature, but with a lower torque comparingwith the blends. Buckwheat flour torque (directed related with its viscosity) was around 20 m.Nm andacorn flour dropped to 1 m.Nm, which is in agreement with [33], that found likewise, lowest viscosityin the breakdown for acorn starch comparing with buckwheat.
27

Foods 2020, 9, 560
Figure 1. Pasting curves of the tested blend flours: control, A23% and A35%, and also buckwheat andacorn flour.
Along the heating process, the starch granules retain water and swell, which results in viscosityincreasing, until peak viscosity (C3) is reached and indicates water-binding capacity, and starchgelatinisation [34,35]. Control flours mixture reached the gelatinisation peak torque (175 m.Nm) at71 ◦C and both acorn flour mixtures at 85 ◦C, but with a lower torque (137 m.Nm). From the curve ofacorn flour, with a lower peak torque (87 m.Nm), it is possible to understand this behaviour, where thecontribution of acorn flour decreased the viscosity of the blends A23% and A35%. Buckwheat flourpresents higher viscosity, as well as the control blend, where this flour is present in 46% share. In GFD,starch gelatinisation performs an essential function, since it has the aptitude to trap gas bubbles in itsown matrix, promoting the gas holding capacity of the dough [36,37].
Starch gelatinisation depends on the starch characteristics and its swelling capacity. Moreover,the starches establish interactions with the HPMC, a fact that also contributes to the maximum viscosityof the dough, reached during gelatinisation [15]. According to Hager et al. [38], buckwheat flourhas approximately 60% of starch, with around 25% amylose, while acorn flour has around 50% ofstarch [18], where 55% is amylose [39]. Singh et al. [40] state that amylose and lipid contents areone of the causes for the differences between the swelling capacity of starches. Higher lipid contentis supposed to decrease the swelling capacity of individual granules [40]. However, Debet andGindley [41] suggest that when the amylose content is high, the effect of lipids is secondary, concludingthat high amylose content inhibits swelling. Correia et al. [39], concluded fewer amylose leaching andlower degree of gelatinisation has been attributed to acorn structure type of starch. Regarding thehigher temperature of acorn flour gelatinisation, according to Correia et al. [39], indicates increasedresistance to swelling, a characteristic response of acorn starch. On the contrary, according to Debetand Gindley [41], higher viscosity reveals starch with higher swelling capacity, and Torbica et al. [42]identify it as a pasting property of buckwheat flour.
The following stage is characterised by a viscosity decreasing to a minimum (breakdown).This happens when the granule absorbs as much water as to achieve its rupture point, while temperaturekeeps increasing [40]. As we can see from the results, the breakdown (C4) occurs at the end of 90 ◦Cwith higher torque (132 m.Nm) for control dough and lower torque (110 m.Nm), meaning lowerviscosity, for both acorn blends. Buckwheat flour showed the highest torque (154 m.Nm) and acornthe lowest (68 m.Nm), revealing the contribution that each pure flour has in the respective blends,according to the different levels of incorporation in the dough.
28

Foods 2020, 9, 560
When gelatinised starch temperature cools, viscosity increases until the end of the test (C5),the moment when we can see the formation of a gel, resulting from amylose retrogradation [34].Regarding Figure 1, is possible to observe that retrogradation torque was quite similar betweencontrol blend (305 m.Nm) and pure buckwheat flour (300 m.Nm). Following, the acorn flour blends,present a lower torque, respectively, A23% (270 m.Nm) and A35% (262 m.Nm). Finally, pure acornflour torque was the lowest (129 m.Nm). Despite this retrogradation low viscosity of acorn flour, it ispossible to recognise that acorn flour blends have a quite high viscosity, when comparing with thepure flour. Synergetic effects between the starches, proteins, HPMC and fibres, and also the proportionof acorn flour in the blends, can explain why these blends are able to maintain a higher viscosity inthe retrogradation process. Paste retrogradation is influenced by the amylose content and also bythe structural arrangement of the starch chains [37,38]. According to Hager et al. [35], buckwheatstarch presents a granular shape, whereas acorn starch granules show a spheroid/ovoid and cylindricalshape [43].
Since our study is focused on acorn flour, it is important to highlight that among the differentspecies of oak trees, the acorn starch is also different due to taxonomic characteristics of the plant [43].For this reason, to make possible the comparison about starch behaviour, we used the studies based onthe same species: Quercus rotundifolia and Quercus ilex from Cappai et al. [43] and Correia et al. [39].
Finally, it is also important to mention the role that proteins have in the dough rheologybehaviour, contributing as well to gluten replacing functions [3]. Different authors [41,44,45] statethat interactions between the different types of starch and proteins, have an influence on the doughrheology characteristics, affecting also pasting properties of starch. Concerning the developed doughs,the average protein content (data obtained from suppliers) of buckwheat is 12%, and acorn flour is4.5%, in accordance with literature [18,38]. As previously described in Section 2.2, samples A23% andA35% have 50% and 75% replacement of buckwheat flour, by acorn flour, respectively, when comparingwith the control sample. This means that buckwheat flour changes from 46% incorporation in controlto 23% in A23% sample and to 11% in A35%, with a corresponding increasing of 23% and 35% ofacorn flour. In relation to protein, acorn flour presents approximately 8% less content than buckwheatflour, resulting in a lower protein content on sample blends A23% and A35%. This will influenceprotein–starch interactions and consequently pasting properties. As we can observe from the graphic,torque values in C3, C4, and C5, are lower in acorn flour blends when comparing to the controlblend. Similar results have been reported in different studies about proteins influence in starch pastingproperties [46–48].
3.1.2. Small Amplitude Oscillatory Measurements (SAOS)
The mechanical spectra of the GF doughs (control, A23%, A35%) are presented in Figure 2A.The mechanical spectra of GF doughs represent the variation of storage modulus (G′) and loss modulus(G′′) as a function of angular frequency (ω). In order to promote a more systematic comparison of thespectra, the values of G′ obtained at 62.8 rad/s (10 Hz) are presented in Figure 2B.
It is possible to observe in Figure 2A, that both moduli G′ and G′′ show high frequency dependence.The three GF doughs compared presented higher values of G′ in comparison with G′′, in the wholefrequency ranges, expressing a predominance of the elastic behaviour. It is also important to note thatthe control dough shows lower values of the viscoelastic functions and a pseudo-terminal region at lowfrequency values, with a tendency for a crossing point at very low frequencies. This type of behaviourreflects the existence of a less structured system in the control dough, which may be associated with aless stable structure [22]. In other words, the incorporation of acorn flour had an important role inincreasing the degree of structuring of the dough. This increase in the degree of structure should haveresulted from the greater ability of acorn starch to create structures, which was evidenced by the resultsobtained in terms of pasting curves. Our results are in accordance with different authors [22,49,50] thatalso have studied GF dough with different botanical source flours (respectively, acorn flour, carob flourand legume flours), and obtained similar results, where G′ > G′′, showing a soft gel-like structure.
29

Foods 2020, 9, 560
Figure 2. (A): Mechanical spectra of GF doughs (control, A23%, A35%); G´ (storage modulus—filledsymbol), G′′ (loss modulus—open symbol). (B): G′ values at 62.8 rad/s (10 Hz) for the same samples.
About G′ values at 62.8 rad/s, a significantly higher value (p < 0.05) for A23% dough was observed,meaning that the addition of acorn flour in dough formulation induced a significantly increase ofelastic modulus, acting as a strengthening agent of the structure. However, the dough with 35% ofacorn flour, reduces significantly G′ values, being similar to control dough. A similar effect will befound in the texture results, in terms of the TPA parameters. This fact indicates that the growingincorporation level of acorn flour presents a negative impact on the structure, since it is possible toobserve a modification of the rheological behaviour, with the reduction of the elastic modulus at62.8 rad/s. The aforementioned behaviour is not significantly different (p > 0.05) from the one of controldough, showing that the benefits, in terms of viscoelastic characteristics, induced from the addition ofacorn flour are not extend to higher levels of incorporation. Regarding the improvement of rheologycharacteristics observed in acorn flour doughs, it is also important to underline the contribution ofthe fibre content present in acorn flour. Several authors have studied the impact of fibre in GFDformulation, with the objective of improving rheology. The dough formulation with the inclusion offibre-rich ingredients, positively influenced rheological properties, with higher values of both moduli,and structuring the GF dough closer to a gel-like material [11,28,35,51,52].
Korus et al. [22] obtained different results, where partial (20%, 40%, 60%) replacement of starchwith acorn flour, resulted in a significant increase in both moduli, and proportional to the extent ofacorn flour replacement. Nevertheless, it is important to clarify that the control dough formulation wasbased on corn and potato starch, totally different from the control dough in our study. Nevertheless,the author refers that higher levels of acorn flour incorporation revealed a negative impact, since itcaused the reduction of loaf volume, not shown in rheology tests [22]. This should also be related witha negative impact on the dough viscoelasticity.
3.1.3. Texture Profile Analysis (TPA)
Figure 3 shows the results of TPA: firmness and cohesiveness. The incorporation of both acornflour levels, 23% and 35%, increased significantly (p < 0.05) the firmness of the dough comparing withcontrol. Between the two acorn flour doughs, the firmness is significantly (p < 0.05) higher in A23%when comparing with A35%. For the lowest level of incorporation, it was possible to obtain a morestructured dough, already supported in terms of increasing the elastic modulus (G′), which correspondsto a higher firmness value. For the 35% of acorn flour incorporation, the extension of the networkdeveloped is weaker, resulting in a softer dough, similar to the control. Probably, the excess of acornstarch caused the weakening of this network, as we can observe from pasting curve analysis, where anoticeable decrease of acorn flour viscosity parameters is revealed.
30

Foods 2020, 9, 560
Figure 3. Firmness (A) and cohesiveness (B) of GF doughs (control, A23% and A35%).
These findings are in accordance with the previous rheology measurements results discussion.Nevertheless, the firmness of the dough with 35% of acorn flour is significantly higher than the controldough. The results show that partial replacement of buckwheat flour by acorn flour improves thefirmness of the dough, for either levels of acorn flour.
Cohesiveness is associated with the level of structure between the different elements that takepart in the dough matrix [53]. The obtained results demonstrate that dough A23% and also doughA35% significantly increased (p < 0.05) their cohesiveness, when compared with control dough.However, no significant differences were found between the two levels of acorn flour incorporation.From these results, it is possible to observe that the incorporation of acorn flour in the formulation,with the reduction of buckwheat flour share, increases the cohesiveness of the dough. Furthermore,Correia et al. [39] also concluded that acorn starches have the ability to contribute to a coherent structure.
The increase of firmness and cohesiveness of the dough with acorn flour addition, together with thereduction of buckwheat flour incorporation level, can be explained due to the nutritional compositionof acorn flour [18] in comparison to buckwheat flour [38]. As previously mentioned, acorn flour has ahigher content of fibre (9.5–11.5%) and total fat (8.5%), when compared to buckwheat flour with about2% of fibre and 5% of total fat [18,38]. According to different authors presented in a review article,the level of fibre has a major role as structure enhancer in GF leavened bread, as well as the interactionsbetween the different components of the complex dough system. Due to water binding capacity,gel forming ability, fat mimetic, textural and thickening effects, fibres have a positive impact on thetexture, improving both firmness and cohesiveness [52]. As previously reported by Graça et al. [7],firmness and cohesiveness are the most representative texture parameters of GF dough, as they have agreat influence on bread quality and acceptance [3].
3.2. Impact of Acorn Flour Addition in Bread Texture
In a parallel work, the impact of acorn flour addition in the bread texture was characterised,using exactly the same formulations and processing conditions used in the present study. In thatwork, it was found that acorn flour incorporation, generally, induces an increase in bread firmness.Through the results obtained in the present study, it was possible to establish a positive correlationbetween the bread firmness and the viscoelastic characteristics of the dough—G′ at 0.628 rad/s(Figure 4A) and between the bread firmness and the dough firmness (Figure 4B).
The obtained correlations, which allow to predict the behaviour of the bread, in terms of firmness,taking into account the dough rheological behaviour and its texture, are extremely useful in terms ofthe gluten-free bakery industry. Similar correlations have been obtained by other authors [7,37].
31

Foods 2020, 9, 560
Figure 4. (A): Correlation between bread firmness and the viscoelastic characteristics of the dough (G′at 0.628 rad/s) and (B): correlation between the bread firmness and dough firmness.
3.3. Characteristics of GF Dough: Colour and pH
Table 2 presents the results of GF dough colour measurements and respective pH. It can beobserved that pH significantly decreased from control dough to acorn dough. Either levels of addedacorn flour led to an acidification of the dough, although there are no significant differences betweenA23% and A35% (p > 0.05).
Table 2. Colour parameters and pH of GF doughs (control, A23% and A35%).
Control A23% A35%
pH 5.35 a ± 0.04 5.09 b ± 0.05 5.05 b ± 0.05
Colour L* 82.49 a ± 0.42 70.90 b ± 0.08 66.42 c ± 0.26
Colour a* 0.56 c ± 0.21 6.11 b ± 0.35 7.89 a ± 0.31
Colour b* 15.50 c ± 0.33 24.45 b ± 0.83 27.31a ± 0.65
Mean values with different letters in the same row are significantly different (one-way ANOVA, p < 0.05).
Concerning dough colour, it is possible to observe that L* value has reduced significantly (p < 0.05)with the increase of acorn flour content. These results show a reduction in whiteness and an increasein the browning index, meaning the darkness of the dough. This effect on the dough is important,as it will contribute to the improvement of bread colour. This is a relevant parameter when observingconsumers’ preferences. For GF bread, this characteristic is even more important, since it frequentlypresents pale colours when compared to their wheat counterparts, what is referred as a depreciativefactor in GF bread [2]. Regarding the a* and b* parameters of the dough, it is possible to observea significant (p < 0.05) increase with acorn flour incorporation, which means, respectively, a moreintensive red than green, and a predominance of yellow over blue. Colour differences (ΔE) betweencontrol bread and acorn breads can be calculated by the following equation:
ΔE* = (ΔL*2+Δa*2+Δb*2)1/2 (1)
The human eye can only detect the difference in the colours if ΔE > 5 [54]. When comparing thecontrol dough with both acorn flour dough, the obtained results for were ΔE*(control–A35%) = 21.25;and ΔE*(control–A23%) = 15.66, revealing that the difference between the dough colours was really
32

Foods 2020, 9, 560
high. Finally, the difference between the two levels of acorn flour dough was ΔE*(A23%–A35%) = 5.61,almost in the human eye threshold perception.
3.4. Dietary Fibre: Soluble, Insoluble and Total Fibre
As fibre content increases, besides the rheology improvement above mentioned, is also possibleto improve GF bread nutritional profile. Several authors have studied the addition of fibre-rich rawmaterials in GF bread formulation, obtaining very promising results [52]. Fratelli et al. [55] evaluatedand optimised the applications of fibre (psyllium) in GF formulation, and obtained a final recipe with anincrease of fibre content from 2.5% to 4% and a decrease of glycaemic response, with good acceptabilityscores. Rocha Parra et al. [35,51] studied apple pomace as an alternative source for fibre enrichment ofGF baked products. Tsatsaragkou et al. [49] concluded that carob flour could be a promising solution todevelop high quality formulations of GF bread with a fibre-rich ingredient. Hager et al. [38] analysedthe chemical profile of nutrient-dense GF flours, and compared them with wheat flours. In addition,Hager et al. [38] have also studied soluble and total fibre, together with recommended daily intake.
According to AACC [56], dietary fibre (DF) is defined as the carbohydrates (from edible part ofplants) which are resistant to digestion and adsorption in the human small intestine, with complete orpart fermentation in the large intestine. The term DF comprises polysaccharides, oligosaccharides andassociated plant compounds. DF is fractionated into insoluble fibre, linked with intestinal regulation,and soluble fibre associated to serum cholesterol reduction levels and with glycaemic response [38,56].
According to Hager et al. [38], buckwheat flour presents approximately 2% of DF, from whichabout 23% is soluble fibre. Concerning acorn flour, Silva et al. [18] obtained values between 9.5%and 11.5%. Our results were also similar, with 10% of DF, from which about 9% is soluble fibre (datanot shown).
The results of GF bread fibre analysis, soluble fraction, insoluble fraction and total fibre arepresented in Table 3. From the presented data, it is possible to observe that the incorporation of bothlevels of acorn flour increased significantly (p < 0.05) the total fibre and insoluble fibre, comparing withcontrol bread formulation. This was expected, since acorn is a good source of DF, particularly in theinsoluble fraction [22].
Table 3. Insoluble, soluble and total fibre of GF breads (in dry matter): control, A23% and A35%.
Control A23% A35%
Insoluble Fibre (%) 8.99 b ± 0.63 11.96 a ± 0.53 12.46 a ± 0.92
Soluble Fibre (%) 1.32 a ± 0.38 0.31 b ± 0.24 0.12 b ± 0.10
Total Fibre (%) 10.31 b ± 0.65 12.27 a ± 0.75 12.58 a ± 0.90
Mean values with different letters in the same row are significantly different (one-way ANOVA, p < 0.05).
However, it is important to note that the soluble fibre content of the breads significantly decreased(p < 0.05), comparing with the control formulation, when acorn flour incorporation was considered.This fact can be explained since the soluble fibre fraction of acorn flour in comparison to buckwheatflour is much lower.
According to Melini and Melini [57], a healthy diet needs to be diverse, balanced and it mustassure a high intake of DF. Even though DF health benefits are profusely documented, is frequentlyconcluded that recommended daily intake is not followed by the majority of the consumers [35]. In thecase of consumers with special requirements as GF diet, it is even more difficult, since GF products arein general described with a lack of fibre [58].
Following USDA recommendations, the DF Reference Intake is 25 g/day for women and 38 g/dayfor men. If we consider an ingestion of 100 g of fresh bread per day, the 23% acorn flour bread wouldserve 7.5 g of fibre. This represents about 30% and 20% of daily adequate DF intake for womenand men, respectively, meaning that acorn flour bread can be an important vehicle of fibre, with thepossibility to use the respective nutritional claim.
33

Foods 2020, 9, 560
Thus, acorn flour seems to be a very promising ingredient, in order to improve DF content inGF bread.
4. Conclusions
Based on the obtained results, it can be stated that acorn flour significantly affects the rheologyproperties of the doughs. Moreover, acorn flour has an impact on the dough’s mixing and pastingcurves and improved the firmness, the cohesiveness and the viscoelasticity of the fermented dough.The 23% of acorn flour incorporation presented better results when comparing with 35%. According toSAOS, GF doughs exhibit a weak gel-elastic like behaviour with G’ values higher than G” and frequencydependent. Acorn flour incorporation caused the acidification and increased the darkness of the dough,that will have a positive impact in terms of sensory appreciation of the bread. Thus, acorn flour can bea very promising ingredient, in order to improve both rheological GF dough properties and nutritionalGF bread quality, in particular DF content, a really important nutrient in special requirement diets.
Author Contributions: R.B.M. and L.M.M.F. conceived and planned the fibre analysis experiments. R.B.M., M.C.N.and A.R. conceived and planned all the other experiments. R.B.M. developed all the sample preparations andlaboratory analyses; performed the data analysis, interpretation of the results, and wrote the paper draft. M.C.N.,A.R. and L.M.M.F., supervised the research work. M.C.N., A.R., L.M.M.F., J.A.P. and A.I.R.N.A.B. contributed tothe discussion of the data and revised the manuscript. All authors have read and agreed to the published versionof the manuscript.
Funding: This work had the financial support provided by the FCT-Portuguese Foundation for Science andTechnology PD/BD/135332/2017 under the Doctoral Programme “Agricultural Production Chains—from forkto farm”, through the research unit UIDB/04033/2020 (CITAB), UID/AGR/04129/2013 (LEAF) and UIDB/00616/2020 (CQVR).
Acknowledgments: The authors would like to acknowledge the companies Próvida, Fábricas Lusitania, A Colmeiado Minho, and Dow that kindly provided the raw materials used in this study.
Conflicts of Interest: The authors declare no conflict of interest.
References
1. Schofield, J.D. Wheat proteins: Structure and functionality in milling and breadmaking. In Wheat Production,Properties and Quality, 1st ed.; Bushuk, W., Rasper, V.F., Eds.; Springer: Boston, MA, USA, 1994; pp. 73–106.[CrossRef]
2. Gallagher, E.; Gormley, T.R.; Arendt, E.K. Recent advances in the formulation of gluten-free cereal-basedproducts. Trends Food Sci. Technol. 2004, 15, 143–152. [CrossRef]
3. Matos, M.E.; Rosell, C.M. Understanding gluten-free dough for reaching breads with physical quality andnutritional balance. J. Sci. Food Agric. 2015, 95, 653–661. [CrossRef] [PubMed]
4. Rai, S.; Kaur, A.; Chopra, C.S. Gluten-Free Products for Celiac Susceptible People. Front. Nutr. 2018, 5, 116.[CrossRef] [PubMed]
5. Padalino, L.; Conte, A.; Del Nobile, M. Overview on the General Approaches to Improve Gluten-Free Pastaand Bread. Foods 2016, 5, 87. [CrossRef] [PubMed]
6. Deora, N.S.; Deswal, A.; Mishra, H.N. Alternative Approaches Towards Gluten-Free Dough Development:Recent Trends. Food Eng. Rev. 2014, 6, 89–104. [CrossRef]
7. Graça, C.; Raymundo, A.; Sousa, I. Yogurt as an Alternative Ingredient to Improve the Functional andNutritional Properties of Gluten-Free Breads. Foods 2020, 9, 111. [CrossRef]
8. Nunes, M.C.; Graça, C.; Vlaisavljevic, S.; Tenreiro, A.; Sousa, I.; Raymundo, A. Microalgal cell disruption:Effect on the bioactivity and rheology of wheat bread. Algal Res. 2020, 45, 101749. [CrossRef]
9. Torbica, A.; Belovic, M.; Tomic, J. Novel breads of non-wheat flours. Food Chem. 2019, 282, 134–140. [CrossRef]10. Vidaurre-Ruiz, J.; Matheus-Diaz, S.; Salas-Valerio, F.; Barraza-Jauregui, G.; Schoenlechner, R.;
Repo-Carrasco-Valencia, R. Influence of tara gum and xanthan gum on rheological and textural properties ofstarch-based gluten-free dough and bread. Eur. Food Res. Technol. 2019, 245, 1347–1355. [CrossRef]
11. Skendi, A.; Mouselemidou, P.; Papageorgiou, M.; Papastergiadis, E. Effect of acorn meal-water combinationson technological properties and fine structure of gluten-free bread. Food Chem. 2018, 253, 119–126. [CrossRef]
34
Foods 2020, 9, 560
12. Stojceska, V.; Butler, F. Investigation of reported correlation coefficients between rheological properties of thewheat bread doughs and baking performance of the corresponding wheat flours. Trends Food Sci. Technol.2012, 24, 13–18. [CrossRef]
13. Dobraszczyk, B.J.; Morgenstern, M.P. Rheology and the breadmaking process. J. Cereal Sci. 2003, 38, 229–245.[CrossRef]
14. Masure, H.G.; Fierens, E.; Delcour, J.A. Current and forward looking experimental approaches in gluten-freebread making research. J. Cereal Sci. 2016, 67, 92–111. [CrossRef]
15. Zhang, D.; Mu, T.; Sun, H. Comparative study of the effect of starches from five different sources on therheological properties of gluten-free model doughs. Carbohydr. Polym. 2019, 176, 345–355. [CrossRef][PubMed]
16. Notarnicola, B.; Tassielli, G.; Renzulli, P.A.; Monforti, F. Energy flows and greenhouses gases of EU (EuropeanUnion) national breads using an LCA (Life Cycle Assessment) approach. J. Clean. Prod. 2017, 140, 455–469.[CrossRef]
17. Vinha, A.F.; Costa, A.S.G.; Barreira, J.C.M.; Pacheco, R.; Oliveira, M.B.P.P. Chemical and antioxidant profilesof acorn tissues from Quercus spp.: Potential as new industrial raw materials. Ind. Crops Prod. 2016, 94,143–151. [CrossRef]
18. Silva, S.; Costa, E.M.; Borges, A.; Carvalho, A.P.; Monteiro, M.J.; Pintado, M.M.E. Nutritional characterizationof acorn flour (a traditional component of the Mediterranean gastronomical folklore). Food Meas. 2016, 10,584–588. [CrossRef]
19. Švec, I.; Hrušková, M.; Kadlcíková, I. Features of flour composites based on the wheat or wheat-barley flourcombined with acorn and chestnut. Croat. J. Food Sci. Technol. 2018, 10, 89–97. [CrossRef]
20. Pasqualone, A.; Makhlouf, F.Z.; Barkat, M.; Difonzo, G.; Summo, C.; Squeo, G.; Caponio, F. Effect of acornflour on the physico-chemical and sensory properties of biscuits. Heliyon 2019, 5, e02242. [CrossRef]
21. Hrusková, M.; Svec, I.; Kadlcíková, I. Effect of chestnut and acorn flour on wheat/wheat-barley flourproperties and bread quality. Int. J. Food Stud. 2019, 8, 41–57. [CrossRef]
22. Korus, J.; Witczak, M.; Ziobro, R.; Juszczak, L. The influence of acorn flour on rheological properties ofgluten-free dough and physical characteristics of the bread. Eur. Food Res. Technol. 2015, 240, 1135–1143.[CrossRef]
23. Cappelli, A.; Oliva, N.; Bonaccorsi, G.; Lorini, C.; Cini, E. Assessment of the rheological properties and breadcharacteristics obtained by innovative protein sources (Cicer arietinum, Acheta domesticus, Tenebrio molitor):Novel food or potential improvers for wheat flour? LWT 2020, 118, 108867. [CrossRef]
24. Kowalczewski, P.Ł.; Walkowiak, K.; Masewicz, Ł.; Bartczak, O.; Lewandowicz, J.; Kubiak, P.; Baranowska, H.M.Gluten-Free Bread with Cricket Powder—Mechanical Properties and Molecular Water Dynamics in Doughand Ready Product. Foods 2019, 8, 240. [CrossRef] [PubMed]
25. Jacob, H.E. 6000 Anos de Pão, 1st ed.; Antígona: Lisboa, Portugal, 2003; p. 587.26. Ribeiro, O. Portugal o Mediterrâneo e o Atlântico, 4th ed.; Livraria Sá da Costa Editora: Lisboa, Portugal,
1986; p. 188.27. Veiga de Oliveira, E.; Galhano, F.; Pereira, B. Tecnologia Tradicional Portuguesa-Sistemas de Moagem;
INIC, Centro de Estudos de Etnologia: Lisboa, Portugal, 1983; p. 520.28. Kiumarsi, M.; Shahbazi, M.; Yeganehzad, S.; Majchrzak, D.; Lieleg, O.; Winkeljann, B. Relation between
structural, mechanical and sensory properties of gluten-free bread as affected by modified dietary fibers.Food Chem. 2019, 277, 664–673. [CrossRef] [PubMed]
29. Naqash, F.; Gani, A.; Gani, A.; Masoodi, F.A. Gluten-free baking: Combating the challenges-A review.Trends Food Sci. Technol. 2017, 66, 98–107. [CrossRef]
30. Fernandes, I.C.X. Desenvolvimento de pães sem glúten enriquecidos com Tetraselmis chuii. Dissertação de Mestradoem Engenharia Alimentar; Instituto Superior de Agronomia da Universidade de Lisboa: Lisboa, Portugal, 2019.
31. Dang, J.M.C.; Bason, M.L. Comparison of Old and New Dough Mixing Methods and their Utility in PredictingBread Quality. In Proceedings of the 65th Australian Cereal Chemistry Conference, Coogee, NSW, Australia,16–18 September 2015.
32. Martins, R.B.; Nunes, M.C.; Peres, J.A.; Barros, A.I.R.N.A.; Raymundo, A. Acorn Flour as bioactivecompounds source in gluten free bread. In Proceedings of the Book of Abstracts of XX EuroFoodChemCongress, Porto, Portugal, 17–19 June 2019.
35

Foods 2020, 9, 560
33. Cho, A.; Kim, S.K. Particle size distribution, pasting pattern and texture of gel of acorn, mungbean,and buckwheat starches. Korean J. Food Sci. Technol. 2000, 32, 1291–1297.
34. Sciarini, L.S.; Ribotta, P.; León, A.; Pérez, G. Influence of Gluten-free Flours and their Mixtures on BatterProperties and Bread Quality. Food Bioprocess Technol. 2010, 3, 577–585. [CrossRef]
35. Rocha Parra, A.F.; Ribotta, P.D.; Ferrero, C. Starch–Apple Pomace Mixtures: Pasting Properties andMicrostructure. Food Bioprocess Technol. 2015, 8, 1854–1863. [CrossRef]
36. Abdel-Aal, E.-S.M. Functionality of Starches and Hydrocolloids in Gluten-Free Foods. In Gluten-Free FoodScience and Technology; Gallagher, E., Ed.; Wiley-Blackwell: Oxford, UK, 2009; pp. 200–224.
37. Martínez, M.M.; Gómez, M. Rheological and microstructural evolution of the most common gluten-freeflours and starches during bread fermentation and baking. J. Food Eng. 2017, 197, 78–86. [CrossRef]
38. Hager, A.S.; Wolter, A.; Jacob, F.; Zannini, E.; Arendt, E.K. Nutritional properties and ultra-structure ofcommercial gluten free flours from different botanical sources compared to wheat flours. J. Cereal Sci. 2012,56, 239–247. [CrossRef]
39. Correia, P.R.; Nunes, M.C.; Beirão-da-Costa, M.L. The effect of starch isolation method on physical andfunctional properties of Portuguese nut starches. II. Q. rotundifolia Lam. and Q. suber Lam. acorns starches.Food Hydrocoll. 2013, 30, 448–455. [CrossRef]
40. Singh, N.; Singh, J.; Kaur, L.; Sodhi, N.S.; Gill, B.S. Morphological, thermal and rheological properties ofstarches from different botanical sources. Food Chem. 2003, 81, 219–231. [CrossRef]
41. Debet, M.R.; Gidley, M.J. Three classes of starch granule swelling: Influence of surface proteins and lipids.Carbohydr. Polym. 2016, 64, 452–465. [CrossRef]
42. Torbica, A.; Hadnađev, M.; Dapcevic, T. Rheological, textural and sensory properties of gluten-free breadformulations based on rice and buckwheat flour. Food Hydrocoll. 2010, 24, 626–632. [CrossRef]
43. Cappai, M.G.; Alesso, G.A.; Nieddu, G.; Sanna, M.; Pinna, W. Electron microscopy and composition of rawacorn starch in relation to in vivo starch digestibility. Food Funct. 2013, 4, 917–922. [CrossRef]
44. Horstmann, S.W.; Lynch, K.M.; Arendt, E.K. Starch Characteristics Linked to Gluten-Free Products. Foods2017, 6, 29. [CrossRef]
45. Schirmer, M.; Jekle, M.; Becker, T. Starch gelatinization and its complexity for analysis. Starch-Stärke 2015, 67,30–41. [CrossRef]
46. Alonso-Miravalles, L.; O’Mahony, J.A. Composition, Protein Profile and Rheological Properties ofPseudocereal-Based Protein-Rich Ingredients. Foods 2018, 7, 73. [CrossRef]
47. Storck, C.R.; Zavareze, E.R.; Gularte, M.A.; Elias, M.C.; Rosell, C.M.; Dias, A.R.G. Protein enrichment and itseffects on gluten-free bread characteristics. LWT 2013, 53, 346–354. [CrossRef]
48. Xu, M.; Jin, Z.; Simsek, S.; Hall, C.; Rao, J.; Chen, B. Effect of germination on the chemical composition,thermal, pasting, and moisture sorption properties of flours from chickpea, lentil, and yellow pea. Food Chem.2019, 295, 579–587. [CrossRef]
49. Tsatsaragkou, K.; Yiannopoulos, S.; Kontogiorgi, A.; Poulli, E.; Krokida, M.; Mandala, I. Effect of CarobFlour Addition on the Rheological Properties of Gluten-Free Breads. Food Bioprocess Tech. 2014, 7, 868–876.[CrossRef]
50. Miñarro, B.; Albanell, E.; Aguilar, N.; Guamis, B.; Capellas, M. Effect of legume flours on baking characteristicsof gluten-free bread. J. Cereal Sci. 2012, 56, 476–481. [CrossRef]
51. Rocha Parra, A.F.; Ribotta, P.D.; Ferrero, C. Apple pomace in gluten-free formulations: Effect on rheologyand product quality. Int. J. Food Sci. Technol. 2015, 50, 682–690. [CrossRef]
52. Tsatsaragkou, K.; Styliani, P.; Ioanna, M. Structural role of fibre addition to increase knowledge of non-glutenbread. J. Cereal Sci. 2016, 67, 58–67. [CrossRef]
53. Marchetti, L.; Cardós, M.; Campaña, L.; Ferrero, C. Effect of glutens of different quality on dough characteristicsand breadmaking performance. LWT 2012, 46, 224–231. [CrossRef]
54. Delta E 101. Available online: http://zschuessler.github.io/DeltaE/learn/ (accessed on 13 January 2020).55. Fratelli, C.; Muniz, D.G.; Santos, F.G.; Capriles, V.D. Modelling the effects of psyllium and water in gluten-free
bread: An approach to improve the bread quality and glycemic response. J. Funct. Foods 2018, 42, 339–345.[CrossRef]
56. Devries, J.; Camire, M.; Cho, S.; Craig, S.; Gordon, D.; Jones, J.M.; Li, B.; Lineback, D.; Prosky, L.; Tungland, B.The definition of dietary fiber. Cereal Food World 2001, 46, 112–129.
36

Foods 2020, 9, 560
57. Melini, V.; Melini, F. Gluten-Free Diet: Gaps and Needs for a Healthier Diet. Nutrients 2019, 11, 170.[CrossRef]
58. Vici, G.; Belli, L.; Biondi, M.; Polzonetti, V. Gluten free diet and nutrient deficiencies: A review. Clin. Nutr.2016, 35, 1236–1241. [CrossRef]
© 2020 by the authors. Licensee MDPI, Basel, Switzerland. This article is an open accessarticle distributed under the terms and conditions of the Creative Commons Attribution(CC BY) license (http://creativecommons.org/licenses/by/4.0/).
37


foods
Article
Yogurt as an Alternative Ingredient to Improve theFunctional and Nutritional Properties ofGluten-Free Breads
Carla Graça, Anabela Raymundo and Isabel Sousa *
LEAF—Linking Landscape, Environment, Agriculture and Food, Research Center of Instituto Superior deAgronomia, Universidade de Lisboa, Tapada da Ajuda, 1349-017 Lisboa, Portugal;[email protected] (C.G.); [email protected] (A.R.)* Correspondence: [email protected]; Tel.: +351-21-365-3246
Received: 25 November 2019; Accepted: 19 January 2020; Published: 21 January 2020
Abstract: Absence of gluten in bakery goods is a technological challenge, generating gluten-freebreads with low functional and nutritional properties. However, these issues can be minimized usingnew protein sources, by the addition of nutritional added-value products. Fresh yogurt representsan interesting approach since it is a source of protein, polysaccharides, and minerals, with potentialto mimic the gluten network, while improving the nutritional value of gluten-free products. In thepresent work, different levels of yogurt addition (5% up to 20% weight/weight) were incorporatedinto gluten-free bread formulations, and the impact on dough rheology properties and bread qualityparameters were assessed. Linear correlations (R2 > 0.9041) between steady shear (viscosity) andoscillatory (elastic modulus, at 1 Hz) values of the dough rheology with bread quality parameters(volume and firmness) were obtained. Results confirmed that the yogurt addition led to a significantimprovement on bread quality properties, increasing the volume and crumb softness and loweringthe staling rate, with a good nutritional contribution in terms of proteins and minerals, to improvethe daily diet of celiac people.
Keywords: gluten-free bread; yogurt; rheology
1. Introduction
Celiac disease is an immune enteropathy caused by the ingestion of gluten in genetically susceptibleindividuals, and it is estimated to affect about 1–3% of the population worldwide [1].
Currently, the gluten-free (GF) diet is the only option for people suffering from gluten-relateddisorders. For other reasons, a high number of nonceliac individuals are also adopting this diet.Subsequently, there has been a significant increase of research work to improve the functional andnutritional properties of GF products [2,3]. However, several studies stated that the consumers remainunsatisfied with the quality of the GF products in the market [4], highlighted their insufficiency onoverall appearance and nutritional values, compared to the gluten-containing counterparts [5,6].
Gluten-free products, especially breads being mainly based on refined flours and starches,are generally characterized by poor technological quality attributes, including dry, crumbling texture,color, and mouth feel [7], and undergo fast staling [8].
In terms of nutritional profile, normally they present deficient values of protein and minerals andhigher carbohydrates and fat content than recommended [9].
Rice flour has been widely proposed as an alternative for making gluten-free breads (GFB) dueto its hypoallergenic protein, soft taste, and white color [10]. However, rice-based bread presentedlow quality attributes, in terms of volume and hard crumb [11]. Alternative flours from pseudocereal
Foods 2020, 9, 111; doi:10.3390/foods9020111 www.mdpi.com/journal/foods39

Foods 2020, 9, 111
sources, such as amaranth, buckwheat, quinoa, sorghum, and teff, have been applied to improve thenutritional profile of the GFB [12].
In fact, gluten possesses unique viscoelastic properties which are crucial for the water-holdingcapacity of the dough and gas retention during fermentation [13]. To mimic this structure-buildingpotential, hydrocolloids such as hydroxy-propril-methyl-cellulose, carboxy- or methyl-cellulose,locust bean, guar gum, and xanthan gum, as well as enzymes [8,14], are currently used to improve theviscoelastic properties and technological quality of the end-products [15]. Although these functionaladditives contribute to the gas retention during the fermentation process, improving the bread volume,they can be insufficient in terms of desirable bread texture and nutritional value.
Addition of new protein sources, e.g., dairy dry powders incorporation (skim milk powder,dry milk, whey protein concentrate) was shown to improve the volume, appearance, and sensoryaspects of the loaves [16,17]. A previous work [18] showed a positive impact of dairy products addition,such as fresh yogurt, on gluten-containing bread where a significant improvement on functionalproperties and nutritional value was noticeable.
Yogurt (Yg), is considered the most popular dairy product worldwide for its nutritional andhealth benefits, since it is a source of protein (casein), exopolysaccharides (EPS), vitamins (B2, B6,and B12), and minerals (such as Ca, P, and K), representing an interesting alternative for new bakeryproducts [18,19]. In this context, incorporation of fresh Yg in gluten-free bread formulations canbe an interesting approach to mimic the gluten network, while improving the nutritional value ofgluten-free breads.
The aim of the present work was to explore the potential of fresh yogurt addition on GF breadmaking and to overcome the technological challenge involved in gluten removal, improving the GFBquality. Different levels of Yg addition to a GF dough formulation, previously optimized, was tested,and the impact on dough, based on steady shear behavior and oscillatory measurements, was assessed.The effect on GFB quality, by the evolution of the crumb firmness and staling rate, during the storagetime, as well as from bread quality parameters and nutritional profile, was also evaluated.
2. Materials and Methods
2.1. Raw Materials
Gluten-free bread was prepared using rice flour (composition per 100 g: Moisture content 10.9g, protein 7.0 g, lipid content 1.3 g, carbohydrates 80.0 g, fiber 0.5 g), buckwheat flour (compositionper 100 g: Moisture 13.1 g, protein 13.3 g, lipid content 3.4 g, carbohydrates 61.5 g, fiber 10.0 g, salt0.08 g, phosphorus 0.35 g, and magnesium 0.23 g), and potato starch (composition per 100 g: Moisturecontent 17.5 g, protein 0.2 g, lipid content 0.1 g, carbohydrates 80.0 g).
The fresh yoghurt (Yg) used was a commercial product from LongaVida, Portugal (compositionper 100 g: Moisture content 88.5 g, protein 3.7 g, lipid content 3.7 g, carbohydrates 5.5 g, fiber 0.8 g, 0.06 gof salt, and 0.12 g of calcium). The dry extract of Yg was determined from the standard Portuguesemethod: NP.703-1982 (Standard Portuguese Norm), corresponding to 11.5% of dry matter.
Commercial white crystalline saccharose (Sidul, Santa Iria de Azóia, Portugal), sea salt (Vatel,Alverca, Portugal), baker’s dry yeast (Fermipan, Lallemand Iberia, SA, Setúbal, Portugal), vegetableoil (Vegê, Sovena Group, Algês, Portugal), and xanthan gum (Naturefoods, Lisboa, Portugal) werealso used.
2.1.1. Bread Dough’s Preparation and Bread making
Gluten-free bread dough was prepared in a thermo-processor (Bimby-Vorwerk, Cloyes-sur-le-Loir,France), according to the procedure earlier described [20], with some modifications. First, the yeast wasactivated in warm water on the processor cup, during 2 min at position 3. The rest of the ingredientswere added and homogenized during 1 min at position 6, and the kneading was carried out during10 min. Hydroxy-propril-methyl-cellulose (HPMC) was replaced by xanthan gum and the fermentation
40
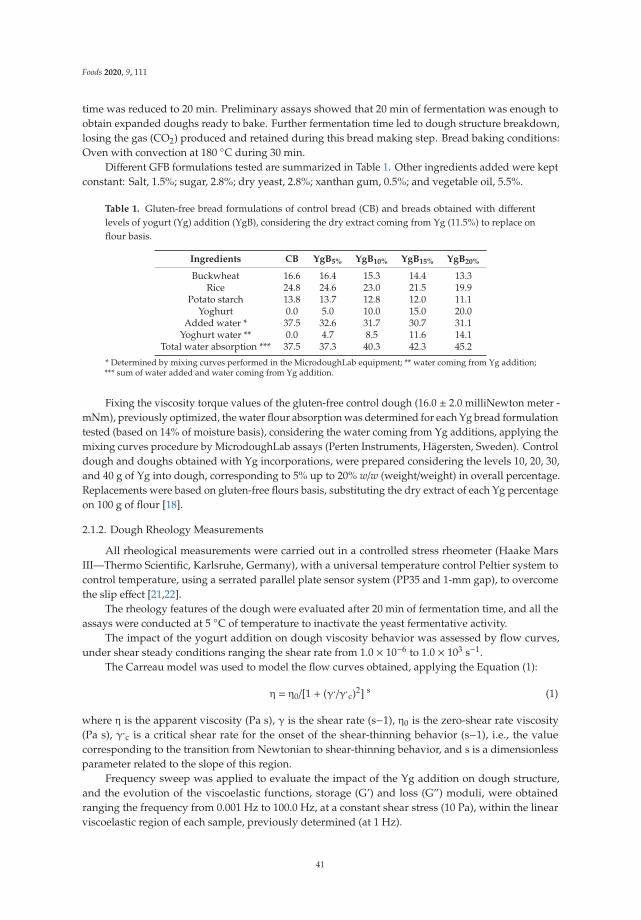
Foods 2020, 9, 111
time was reduced to 20 min. Preliminary assays showed that 20 min of fermentation was enough toobtain expanded doughs ready to bake. Further fermentation time led to dough structure breakdown,losing the gas (CO2) produced and retained during this bread making step. Bread baking conditions:Oven with convection at 180 ◦C during 30 min.
Different GFB formulations tested are summarized in Table 1. Other ingredients added were keptconstant: Salt, 1.5%; sugar, 2.8%; dry yeast, 2.8%; xanthan gum, 0.5%; and vegetable oil, 5.5%.
Table 1. Gluten-free bread formulations of control bread (CB) and breads obtained with differentlevels of yogurt (Yg) addition (YgB), considering the dry extract coming from Yg (11.5%) to replace onflour basis.
Ingredients CB YgB5% YgB10% YgB15% YgB20%
Buckwheat 16.6 16.4 15.3 14.4 13.3Rice 24.8 24.6 23.0 21.5 19.9
Potato starch 13.8 13.7 12.8 12.0 11.1Yoghurt 0.0 5.0 10.0 15.0 20.0
Added water * 37.5 32.6 31.7 30.7 31.1Yoghurt water ** 0.0 4.7 8.5 11.6 14.1
Total water absorption *** 37.5 37.3 40.3 42.3 45.2
* Determined by mixing curves performed in the MicrodoughLab equipment; ** water coming from Yg addition;*** sum of water added and water coming from Yg addition.
Fixing the viscosity torque values of the gluten-free control dough (16.0 ± 2.0 milliNewton meter -mNm), previously optimized, the water flour absorption was determined for each Yg bread formulationtested (based on 14% of moisture basis), considering the water coming from Yg additions, applying themixing curves procedure by MicrodoughLab assays (Perten Instruments, Hägersten, Sweden). Controldough and doughs obtained with Yg incorporations, were prepared considering the levels 10, 20, 30,and 40 g of Yg into dough, corresponding to 5% up to 20% w/w (weight/weight) in overall percentage.Replacements were based on gluten-free flours basis, substituting the dry extract of each Yg percentageon 100 g of flour [18].
2.1.2. Dough Rheology Measurements
All rheological measurements were carried out in a controlled stress rheometer (Haake MarsIII—Thermo Scientific, Karlsruhe, Germany), with a universal temperature control Peltier system tocontrol temperature, using a serrated parallel plate sensor system (PP35 and 1-mm gap), to overcomethe slip effect [21,22].
The rheology features of the dough were evaluated after 20 min of fermentation time, and all theassays were conducted at 5 ◦C of temperature to inactivate the yeast fermentative activity.
The impact of the yogurt addition on dough viscosity behavior was assessed by flow curves,under shear steady conditions ranging the shear rate from 1.0 × 10⁻⁶ to 1.0 × 10³ s−1.
The Carreau model was used to model the flow curves obtained, applying the Equation (1):
η = η0/[1 + (γ./γ.c)2] s (1)
where η is the apparent viscosity (Pa s), γ is the shear rate (s−1), η0 is the zero-shear rate viscosity(Pa s), γ.
c is a critical shear rate for the onset of the shear-thinning behavior (s−1), i.e., the valuecorresponding to the transition from Newtonian to shear-thinning behavior, and s is a dimensionlessparameter related to the slope of this region.
Frequency sweep was applied to evaluate the impact of the Yg addition on dough structure,and the evolution of the viscoelastic functions, storage (G’) and loss (G”) moduli, were obtainedranging the frequency from 0.001 Hz to 100.0 Hz, at a constant shear stress (10 Pa), within the linearviscoelastic region of each sample, previously determined (at 1 Hz).
41

Foods 2020, 9, 111
All rheology determinations were repeated at least three times to ensure the reproducibility ofthe results.
2.2. Quality Assessment of the Gluten-Free Breads
2.2.1. Bread Firmness and Staling Rate
Bread texture was evaluated using a texturometer TA-XTplus (Stable MicroSystems, Surrey, UK)in penetration mode, according to the method earlier described [18,23].
Comparison of the bread texture, with different contents of Yg, was performed in terms offirmness, and the staling rate of the breads was evaluated, measuring the firmness during a storagetime, during 96 h (4 days).
Staling bread rate was described as a function of the Yg incorporation by a linear Equation (2)
Firmness = A × time + B, (2)
where A can be considered the staling rate and B the initial firmness of the bread.
2.2.2. Quality Parameters of the Gluten-Free Bread
Resulting gluten-free breads were evaluated based on after baking quality parameters, such asmoisture, water activity (aw), bake loss (BL), and specific bread volume (SBV) (cm3/g), as earlierdescribed [18].
Bread moisture was determined according to the standard method (American Associationof Cereal Chemists (AACC 44–15.02)). Water activity (aw) variations were determined at roomtemperature (Hygrolab, Rotronic, Bassersdorf, Switzerland). Bread volume was measured by therapeseed displacement standard method AACC 10-05.01, after two hours of bread cooling down.Specific volume (cm3/g) was calculated as the ratio between the volume of the bread and its weight.Weight loss during baking (baking loss) was assessed by weighing the bread forms before and afterbaking. These measurements were carried out in triplicates.
Bread crumb color was recorded using a Minolta colorimeter (Chromameter CR-300,Minolta—Osaka, Japan) after calibration with a white calibration plate (L* = 97.21, a* = −0.14,b* = 1.99). The data collected from three slices of each bread measured at three different locations ofthe slices were averaged and expressed using illuminative D65 by L* a* b* scale, where: L* indicateslightness, a* indicates hue on a green (−) to red (+) axis, and b* indicates hue on a blue (−) to yellow(+) axis.
2.3. Nutritional Composition of the Gluten-Free Breads
Nutritional profile characterization of the gluten-free breads was based on protein (InternationalOrganization for Standardization (ISO-20483:2006)), lipids (NP 4168), ash (AACC Method 08-01.01),carbohydrates (calculated by difference), and total minerals contents (ICP-AES-Inductively CoupledPlasma-Atomic Emission Spectrometry: Thermo System, ICAP-7000 series) as described in a previousstudy [18]. All the experiments were performed in triplicate.
2.4. Statistical Analysis
The experimental data were statistically analyzed by determining the average values and standarddeviation, and the significance level was set at 95% for each parameter evaluated. Statistical analysis(RStudio, Version 1.1.423, Northern Ave, Boston) was performed by applying variance analysis, the onefactor (ANOVA), and post hoc comparisons (Tukey test). Experimental rheology data was fitted tononlinear Carreau model, using the TA Instruments’ TRIOS software.
42

Foods 2020, 9, 111
3. Results and Discussion
3.1. Dough Rheology Measurements
3.1.1. Steady Shear Flow Curves
The effect of the yogurt addition, at different levels, on steady shear behavior of the gluten-freedoughs was evaluated, and the flow curves obtained are presented in Figure 1. It can be observed that allsystems showed a typical shear-thinning behavior: An initial Newtonian region with constant viscosityat low shear rate, and as the shear rate values increase the dough viscosity began to decrease, followinga straight-line decay. Similar results were obtained from the study of the different hydrocolloids’(e.g., xanthan gum) and dairy proteins’ interaction on rheology properties of GFB formulations [17].
η
Figure 1. Flow curves, under steady shear conditions, obtained for control dough (CD) and doughsobtained with different levels of Yg addition (YgD).
The experimental data presented in Figure 1 were fitted well by the Carreau model (R2 > 0.967),and the values of the main parameters that characterize the flow behavior are summarized in Table 2.
Table 2. Carreau model parameters obtained for control dough (CD) and doughs obtained withdifferent levels of Yg addition (YgD) *.
Yg levels (%) η0 (k Pa s) γ.C (s−1) s (slope) R2
CD 290.00 ± 8.4 a 1.70 × 10⁻³ ± 2.50 × 10⁻⁴ a 0.27 ± 0.03 a 0.988YgD5% 295.04 ± 13.4 a 2.20 × 10⁻³ ± 1.41 × 10⁻⁴ a 0.23 ± 0.03 a 0.980YgD10% 41.90 ± 1.8 b 2.52 × 10⁻³ ± 1.34 × 10⁻⁴ a 0.19 ± 0.03 ab 0.977YgD15% 28.70 ± 0.8 c 2.40 × 10⁻³ ± 1.70 × 10⁻⁴ a 0.19 ± 0.04 ab 0.976YgD20% 9.50 ± 0.3 d 1.43 × 10⁻³ ± 1.80 × 10⁻⁴ a 0.17 ± 0.06 b 0.967
* Different letters (a, b, c, d) within the same column indicate significant statistical differences at p ≤ 0.05 (Tukey test)compared with the control bread values.
As it can be observed from the zero-shear rate viscosity values (η0), higher dough viscositieswere obtained for the control dough (CD) and yoghurt dough at 5% (YgD5%, lower level of Yg tested).According to previous works [17,24], GF doughs obtained with xanthan gum (XG) addition showedhigh viscosities and flow behavior indexes due to the complex aggregates formed by strong molecularlinkages. However, a balance must be reached since high viscosity may retain bubbles in the batter,but it may also restrict expansion during baking [25].
43

Foods 2020, 9, 111
Nevertheless, increasing the amounts of Yg resulted in a significant decrease of dough viscosity (ï0),varying from 290.00 k Pa s (CD) to 9.50 k Pa s (YgD20%), representing a reduction of around 96.60%. Onecan suggest that the Yg incorporation promoted a dilution effect of starch–cereal protein–xanthan guminteraction density, decreasing the dough viscosity under shear conditions. In addition, the presenceof the casein and of the exopolysaccharides (EPS) coming from Yg (produced by lactic acid bacteria)impacted the system, improving the lubrication and flexibility of the dough network. These effects canalso be explained by the ability of EPS to bind water and retain moisture, contributing to the increase inthe water-holding capacity [26] and, possibly, reducing the rigidity of the linkages between the differentmolecules of the GF dough matrix. Similar findings were obtained by other authors [27], investigatingthe addition of caseins and albumins on GFB formulations, where a considerable reduction on doughviscosity was obtained.
In terms of critical shear rate, no significant differences were observed. All the dough systems’viscosity began to decrease around 2.0 × 10⁻³ s−1. This behavior suggests that, although the additionof Yg can promote the dilution effect on molecular links density as well as reducing the stiffer complexaggregates, it seems to have no effect on the breakdown of the dough matrix.
3.1.2. Dough Viscoelastic Behavior
The changes on viscoelastic behavior, expressed in terms of elastic (G’) and viscous (G´´) moduli,of the gluten-free doughs, with different levels of Yg addition, were evaluated on fermented doughs,by oscillatory frequency sweep measurements.
The comparison of the mechanical spectra of control dough (CD) and doughs obtained with Ygadditions (YgD) are represented in Figure 2.
Figure 2. Changes in viscoelastic functions, elastic (G´) and viscous (G´´) moduli, promoted by differentlevels of Yg addition, YgD5% up to YgD20%, compared to control dough (CD).
Figure 2 shows that the elastic (G´) and viscous (G´´) moduli values obtained for Yg doughs,from 10% of Yg addition, were lower than control dough (CD), indicating a formation of weakerstructures more like batter. No significant differences in viscoelastic profile for lower values of Ygtested (YgD5%) were observed, comparing with CD.
These results are aligned with those obtained by steady shear flow curves, discussed above,where a significant reduction of dough viscosity was registered from 10% on of Yg addition. Similarresults were obtained by other researchers [10,28], using different gluten-free flours, proteins sources,and hydrocolloids in GFB formulations.
Analyzing in detail the results (Figure 2) at low frequencies, all the dough systems displayed aviscoelastic fluid behavior with values of G” higher than G´, characteristic of an entangled network [29–31],
44
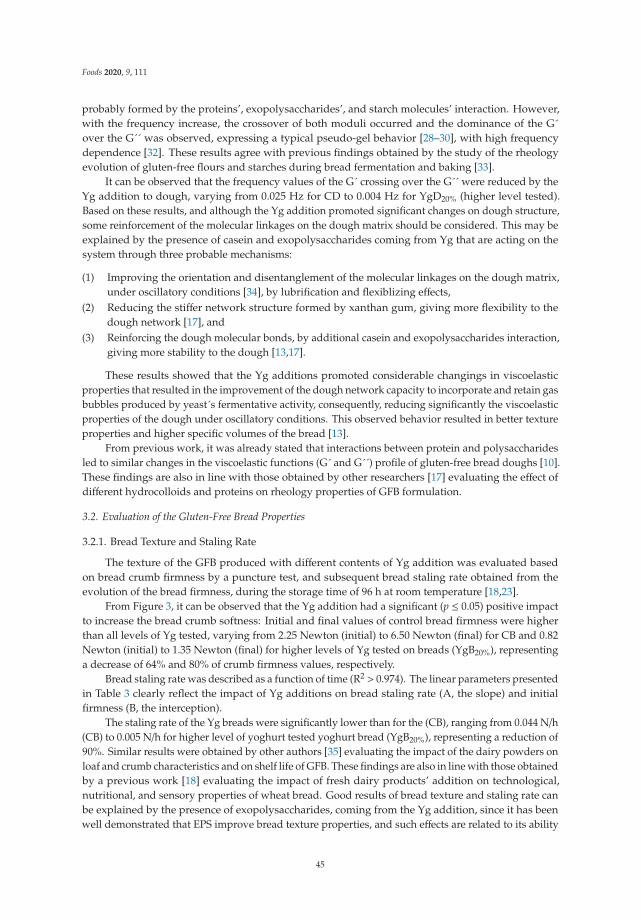
Foods 2020, 9, 111
probably formed by the proteins’, exopolysaccharides’, and starch molecules’ interaction. However,with the frequency increase, the crossover of both moduli occurred and the dominance of the G´over the G´´ was observed, expressing a typical pseudo-gel behavior [28–30], with high frequencydependence [32]. These results agree with previous findings obtained by the study of the rheologyevolution of gluten-free flours and starches during bread fermentation and baking [33].
It can be observed that the frequency values of the G´ crossing over the G´´ were reduced by theYg addition to dough, varying from 0.025 Hz for CD to 0.004 Hz for YgD20% (higher level tested).Based on these results, and although the Yg addition promoted significant changes on dough structure,some reinforcement of the molecular linkages on the dough matrix should be considered. This may beexplained by the presence of casein and exopolysaccharides coming from Yg that are acting on thesystem through three probable mechanisms:
(1) Improving the orientation and disentanglement of the molecular linkages on the dough matrix,under oscillatory conditions [34], by lubrification and flexiblizing effects,
(2) Reducing the stiffer network structure formed by xanthan gum, giving more flexibility to thedough network [17], and
(3) Reinforcing the dough molecular bonds, by additional casein and exopolysaccharides interaction,giving more stability to the dough [13,17].
These results showed that the Yg additions promoted considerable changings in viscoelasticproperties that resulted in the improvement of the dough network capacity to incorporate and retain gasbubbles produced by yeast´s fermentative activity, consequently, reducing significantly the viscoelasticproperties of the dough under oscillatory conditions. This observed behavior resulted in better textureproperties and higher specific volumes of the bread [13].
From previous work, it was already stated that interactions between protein and polysaccharidesled to similar changes in the viscoelastic functions (G´ and G´´) profile of gluten-free bread doughs [10].These findings are also in line with those obtained by other researchers [17] evaluating the effect ofdifferent hydrocolloids and proteins on rheology properties of GFB formulation.
3.2. Evaluation of the Gluten-Free Bread Properties
3.2.1. Bread Texture and Staling Rate
The texture of the GFB produced with different contents of Yg addition was evaluated basedon bread crumb firmness by a puncture test, and subsequent bread staling rate obtained from theevolution of the bread firmness, during the storage time of 96 h at room temperature [18,23].
From Figure 3, it can be observed that the Yg addition had a significant (p ≤ 0.05) positive impactto increase the bread crumb softness: Initial and final values of control bread firmness were higherthan all levels of Yg tested, varying from 2.25 Newton (initial) to 6.50 Newton (final) for CB and 0.82Newton (initial) to 1.35 Newton (final) for higher levels of Yg tested on breads (YgB20%), representinga decrease of 64% and 80% of crumb firmness values, respectively.
Bread staling rate was described as a function of time (R2 > 0.974). The linear parameters presentedin Table 3 clearly reflect the impact of Yg additions on bread staling rate (A, the slope) and initialfirmness (B, the interception).
The staling rate of the Yg breads were significantly lower than for the (CB), ranging from 0.044 N/h(CB) to 0.005 N/h for higher level of yoghurt tested yoghurt bread (YgB20%), representing a reduction of90%. Similar results were obtained by other authors [35] evaluating the impact of the dairy powders onloaf and crumb characteristics and on shelf life of GFB. These findings are also in line with those obtainedby a previous work [18] evaluating the impact of fresh dairy products’ addition on technological,nutritional, and sensory properties of wheat bread. Good results of bread texture and staling rate canbe explained by the presence of exopolysaccharides, coming from the Yg addition, since it has beenwell demonstrated that EPS improve bread texture properties, and such effects are related to its ability
45

Foods 2020, 9, 111
to bind water and retain moisture, retarding the starch crystallization and, hence, the increase of breadfirmness [26,36–38].
Figure 3. Variation of bread crumb firmness during 96 h of storage time, at room temperature, obtainedfor breads with different levels of Yg addition (YgB5% up to YgB20%) compared to control bread (CB).
Table 3. Bread stalling parameters: A, bread staling rate (Newton/h), and B, initial bread firmness (N),obtained for control bread (CB) and breads with different levels of Yg tested (YgB) *.
Yg Levels B—Initial Firmness (N) A—Staling Rate (N/h) R2
CB 2.25 a 0.044 a 0.997YgB5% 1.90 b 0.020 b 0.974YgB10% 0.95 c 0.006 c 0.975YgB15% 0.85 c 0.005 c 0.979YgB20% 0.82 c 0.005 c 0.993
* Different letters (a, b, c) within the same column indicate significant statistical differences at p ≤ 0.05, (Tukey test),compared with the control bread parameters.
It can be stated that the Yg addition increased the bread crumb softness and delayed the stalingrate of the GFB, leading to an increase of shelf life, which is an important industrial advantage.
3.2.2. Quality Parameters of Gluten-Free Bread
The impact of the Yg addition on gluten-free quality parameters, such as crumb color, moisture,water activity (aw), bake loss (%), and specific bread volume (SBV), was evaluated. Results obtainedare summarized in Table 4.
Table 4. Gluten-free bread quality parameters: Crumb color (L*, a*, b*), moisture, water activity (aw),bake loss (BL), and specific bread volume (SBV) of the control bread (CB) and breads produced withdifferent levels of Yg (YgB) addition *.
Samples L* a* b* Moisture (%) aw BL (%) SBV (cm3/g)
CB 59.52 ± 2.85 a 7.81 ± 0.23 a 11.40 ± 0.20 a 42.00 ± 0.33 a 0.959 ± 0.006 a 10.00 ± 0.41 a 1.80 ± 0.08 a
YgB5% 59.93 ± 2.83 a 6.21 ± 0.08 ab 13.61 ± 1.20 a 43.20 ± 0.11 a 0.979 ± 0.001 a 9.35 ± 0.93 a 2.10 ± 0.03 b
YgB10% 62.52 ± 2.75 ab 5.26 ± 0.17 b 19.60 ± 0.75 b 46.40 ± 0.20 b 0.978 ± 0.002 a 8.44 ±1.24 ab 2.40 ± 0.05 c
YgB15% 68.02 ± 1.60 b 4.16 ± 0.11 c 22.90 ± 0.50 bc 48.00 ± 0.04 c 0.981 ± 0.005 a 7.50 ± 0.30 b 2.43 ± 0.08 c
YgB20% 68.60 ± 2.65 b 4.05 ± 0.15 c 25.32 ± 0.73 c 50.00 ± 0.83 d 0.985 ± 0.003 a 7.30 ± 0.94 b 2.50 ± 0.06 d
* Different letters (a, b, c, d) within the same column, for each level of Yg, indicate statistically significant differencesat p ≤ 0.05 (Tukey test), compared with the control bread parameters.
46

Foods 2020, 9, 111
Bread crumb color was significantly changed by Yg addition, giving a lighter color (higher L*values) with more pronounced yellow tone (higher b* values) while the red tone became less dominant(lower a* values).
In terms of bread moisture, an increase in moisture content was observed (from 10% on, of Ygaddition), varying from 42.0 for CB to 50.0 for YgB20% (higher level tested), corresponding to anincrease of 20%. Related to water activity, no significant (p ≥ 0.05) differences were registered for alllevels tested, compared to CB.
The bake loss (BL) represented the amount of water and organic material (CO2 and other volatiles)lost during baking [12]. One can see (Table 4) that increasing the amounts of Yg led to a significantdecrease of BL (p ≤ 0.05), corresponding to an increase of 27% on bread yield, comparing CB withYgB20%. Presumably, as discussed above, the dough network formed by the Yg addition, probablyvia starch molecules, vegetable protein, casein, and EPS (coming from Yg), had a higher ability totrap water and it may cause an increase in water-holding capacity, consequently, a decrease on the BLpercentage [39–41]. These results agree with those published by other authors [26] on the combinationof dairy proteins with transglutaminases on GFB formulation.
Based on specific bread volume (SBV), a significant improvement was observed by Yg additionfrom 10% on, varying between 1.80 cm3/g for CB to 2.50 cm3/g for YgB20%, representing an increase ofaround 40%. These improvements on the SBV were probably due to the increase in water-holdingcapacity, contributing to the starch molecules being more prone to form a uniform continuousstarch–protein matrix, which was further enhanced during baking [12,41]. In addition, the contributionof the caseins and exopolysaccharides, coming from Yg addition, cannot be excluded, probably bybuilding a structured starch–protein–EPS matrix [38,39], improving the flexibility of the dough networkand the capacity to retain the gases produced during the fermentation process, contributing to keepingthe bread structure with uniform gas cell distribution, resulting in better bread volumes than CB, as canbe observed in Figure 4.
YgB5% YgB20%
YgB10%
CB
YgB15%
Figure 4. Control bread (CB) and breads obtained with different levels of Yg addition (YgB): 5, 10, 15,and 20% (w/w- weight/weight).
Our results agree with those published by other authors [26] reporting the effect of dairy proteins(caseins and albumins) with transglutaminase additions on the improvement of crumb texture andbetter SBV.
Resuming, it can be stated that the Yg addition improved the bread quality of the gluten-freebread in all baking quality parameters evaluated.
47
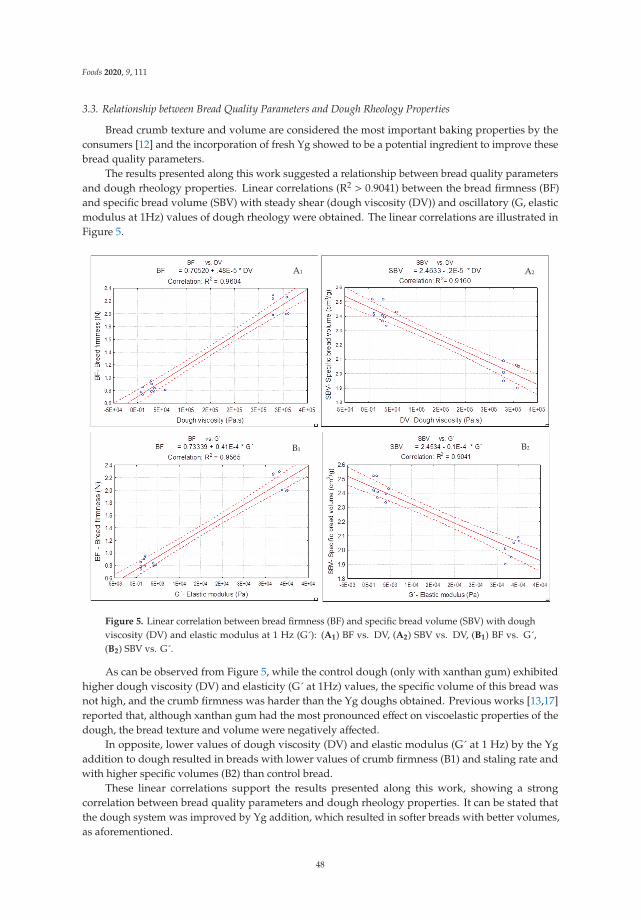
Foods 2020, 9, 111
3.3. Relationship between Bread Quality Parameters and Dough Rheology Properties
Bread crumb texture and volume are considered the most important baking properties by theconsumers [12] and the incorporation of fresh Yg showed to be a potential ingredient to improve thesebread quality parameters.
The results presented along this work suggested a relationship between bread quality parametersand dough rheology properties. Linear correlations (R2 > 0.9041) between the bread firmness (BF)and specific bread volume (SBV) with steady shear (dough viscosity (DV)) and oscillatory (G, elasticmodulus at 1Hz) values of dough rheology were obtained. The linear correlations are illustrated inFigure 5.
A1 A2
B1 B2
Figure 5. Linear correlation between bread firmness (BF) and specific bread volume (SBV) with doughviscosity (DV) and elastic modulus at 1 Hz (G´): (A1) BF vs. DV, (A2) SBV vs. DV, (B1) BF vs. G´,(B2) SBV vs. G´.
As can be observed from Figure 5, while the control dough (only with xanthan gum) exhibitedhigher dough viscosity (DV) and elasticity (G´ at 1Hz) values, the specific volume of this bread wasnot high, and the crumb firmness was harder than the Yg doughs obtained. Previous works [13,17]reported that, although xanthan gum had the most pronounced effect on viscoelastic properties of thedough, the bread texture and volume were negatively affected.
In opposite, lower values of dough viscosity (DV) and elastic modulus (G´ at 1 Hz) by the Ygaddition to dough resulted in breads with lower values of crumb firmness (B1) and staling rate andwith higher specific volumes (B2) than control bread.
These linear correlations support the results presented along this work, showing a strongcorrelation between bread quality parameters and dough rheology properties. It can be stated thatthe dough system was improved by Yg addition, which resulted in softer breads with better volumes,as aforementioned.
48

Foods 2020, 9, 111
These findings disagree with those obtained by other researchers [11,17] evaluating differentgums and emulsifiers on gluten-free bread formulations, where higher dough viscosity and elasticvalues resulted in lower firmness values of the bread. It suggests that the quality of the GFB dependsstrongly on the type of the ingredients used and the interactions between the macromolecules intoplay, to mimic the structure building-like gluten matrix.
These relations between the dough rheology and bread quality can be useful to predict thebehavior of the dough and provide important information for the GF bread making industry.
3.4. Nutritional Composition of the Gluten-Free Breads
The nutritional composition of the gluten-free breads, including the mineral profile, weredetermined for control bread (CB) and breads obtained with 10% and 20% of Yg addition (YgB).A significant (p ≤ 0.05) reinforcement on protein and ash content was observed for both levels ofYg tested. However, a remarkable effect was obtained for 20% (w/w) of Yg addition in both cases,representing an increase of 52% and 55%, respectively. Nutritional composition and minerals profile ofthe gluten-free breads are summarized in Table 5.
Table 5. Proximate nutritional composition and mineral profile for control bread (CB) and breadsenriched with 10% (YgB10%) and 20% (YgB20%) of yogurt *.
g/100 g CB YgB10% YgB20%
Proteins 5.34 ± 0.21 a 6.90 ± 0.02 b 8.10 ± 0.20 c
Lipids 4.83 ± 0.29 a 5.20 ± 0.84 a 5.60 ± 0.22 a
Ash 1.40 ± 0.03 a 1.74 ± 0.17 ab 2.12 ± 0.27 b
Carbohydrates 45.61 ± 1.12 a 39.00 ± 2.25 b 34.20 ± 1.58 c
Kcal 250.30 ± 1.40 a 237.07 ± 2.13 b 226.52 ± 2.89 c
Minerals content mg/100 g 15% RDV (mg/100g) **
Na (g/100 g) 0.41 ± 0.03 a 0.42 ± 0.01 a 0.53 ± 0.02 b
K 412.0 ± 8.02 a 497.30 ± 5.92 b 515.40 ± 16.40 b 300.0P 131.81 ± 5.40 a 133.90 ± 0.90 a 141.24 ± 2.00 b 120.0
Mg 48.70 ± 1.02 a 50.24 ± 0.56 a 52.32 ± 0.82 b 45.0Ca 35.93 ± 2.06 a 52.20 ± 0.81 b 92.60 ± 2.60 c 120.0Fe 6.94 ± 0.12 a 4.74 ± 0.67 b 3.10 ± 0.05 c 2.1Cu 0.23 ± 0.01 a 0.25 ± 0.02 a 0.30 ± 0.03 a 0.2Mn 0.51 ± 0.01 a 0.60 ± 0.02 a 0.70 ± 0.03 b 0.3Zn 1.12 ± 0.01 a 1.05 ± 0.08 a 0.98 ± 0.01 b 2.3
* Different letters used (a, b, c, d) indicate statistically significant differences, within the same row, at p ≤ 0.05(Tukey test), compared with the bread control; ** according to the recommended daily values (RDV) established byRegulation (European Community), N◦ 1924/2006; Directive N◦ 90/494 (CE).
In terms of lipids, no significant (p ≥ 0.05) differences were obtained. Based on carbohydratescontent, a significant decrease for higher levels of Yg tested (20% w/w) was observed, representing adecrease of 25%, due to the dilution effect of the starch content.
Regarding the minerals profile, a significant improvement (p ≤ 0.05) of major (Ca, K, P, Mg)and trace minerals (Fe, Cu, Mn) was obtained, representing, in general, more than 15% of therecommended daily values (Regulation (European community)), No. 1924/2006; Directive No. 90/494(CE). Considering the higher level of Yg tested (YgB20%), a significant increase in Ca (158.0%), K (25.1%),P (7.0%), and Mg (4.1%) can be noticed as well as in Fe (55.3%), Cu (30.4), and Mn (37.3%), comparedto control bread (Table 5). Similar results were obtained by other authors [18] testing the addition ofdairy products on wheat bread.
These results showed that the Yg addition can be used to enhance the nutritional value of theGFB, increasing the amount of protein and minerals profile with a good contribution to reducing thecarbohydrates intake.
49

Foods 2020, 9, 111
4. Conclusions
Gluten-free bread formulations, with different levels of yogurt addition, were evaluated usingdough rheology measurements and baking quality parameters.
The results of the present work showed that the functionality of gluten-free breads, in terms ofbread making performances, quality parameters, and nutritional profile can be successfully improvedby the addition of fresh yogurt.
Although, the yogurt incorporation significantly reduced the rheology properties of doughs,such effects resulted in significant improvements in the overall quality of the corresponding breads.Good linear correlations between bread firmness, specific volume with flow behavior, and viscoelasticfunctions were found, supporting the results obtained.
Resuming, the Yg showed to be a potential ingredient to improve the quality of gluten-free breads,resulting in softer breads with higher volume and lower staling rate, compared to control bread.
Related to the nutritional composition, the addition of Yg revealed to be an attractive ingredient toenhance the nutritional value of GF breads, increasing the protein and mineral contents and reducingthe carbohydrates intake, with a good contribution to improve the daily diet of the celiac people.
Author Contributions: C.G. conceived and planned the experiments; performed all samples preparation, analysis,data analysis, and interpretation of the results; and wrote the manuscript. A.R. and I.S. supervised the researchwork, contributed to the discussion of the data, and revised the manuscript. All authors have read and agreed tothe published version of the manuscript.
Funding: This work was funded by the University of Lisbon (Doctoral Grant reference to C10781w) andby the Portuguese Foundation for Science and Technology (FCT) through the research unit of Universityidentification/Agronomic/04129/2013 (LEAF, Research Center—Linking Landscape, Environment, Agriculture,and Food).
Conflicts of Interest: The authors declare no conflicts of interest.
References
1. Rosell, C.M.; Barro, F.; Sousa, C.; Mena, M.C. Cereals for developing gluten-free products and analyticaltools for gluten detection. J. Cereal Sci. 2014, 59, 354–364. [CrossRef]
2. Capriles, V.D.; Arêas, J.A.G. Novel approaches in gluten-free breadmaking: Interface between food science,nutrition, and health. Compreh. Rev. Food Sci. Food Saf. 2014, 13, 871–890. [CrossRef]
3. Capriles, V.D.; dos Santos, F.G.; Arêas, J.A.G. Gluten-free breadmaking: Improving nutritional and bioactivecompounds. J. Cereal. Sci. 2016, 67, 83–91. [CrossRef]
4. Do Nascimento, A.B.; Fiates, G.M.R.; dos Anjos, A.; Teixeira, E. Gluten-free is not enough – perception andsuggestions of celiac consumers. Int. J. Food Sci. Nutri. 2014, 65, 394–398. [CrossRef] [PubMed]
5. Pellegrini, N.; Agostoni, C. Nutritional aspects of gluten-free products. J. Sci. Food Agric. 2015, 95, 2380–2385.[CrossRef] [PubMed]
6. Calle, J.; Benavent-Gil, Y.; Rosell, C. Development of gluten free breads from Colocasia esculenta flourblended with hydrocolloids and enzymes. Food Hydrocoll. 2020, 98, 105243. [CrossRef]
7. Gallagher, E.; Gormley, T.R.; Arendt, E.K. Crust and crumb characteristics of gluten free breads. J. Food Eng.2003, 56, 153–161. [CrossRef]
8. Ahlborn, G.J.; Pike, O.A.; Hendrix, S.B.; Hess, W.M.; Huber, C.S. Sensory, mechanical, and microscopicevaluation of staling in low-protein and gluten-free breads. Cereal Chem. 2005, 82, 328–335. [CrossRef]
9. Segura, M.E.; Rosell, C.M. Chemical composition and starch digestibility of different gluten-free breads.Plant Foods Hum. Nutr. 2011, 66, 224–230. [CrossRef]
10. Torbica, A.; HadnaCev, M.; Dapcevic, T. Rheological, textural and sensory properties of gluten-free breadformulations based on rice and buckwheat flour. Food Hydrocoll. 2010, 24, 626–632. [CrossRef]
11. Locke, J.; González, L.; Loubes, M.; Tolaba, M. Optimization of rice bread formulation by mixture designand relationship of bread quality to flour and dough attributes. LWT-Food Sci. Technol. 2019, 113, 108299.[CrossRef]
12. Alvarez-Jubete, L.; Arendt, E.; Gallagher, E. Nutritive value of pseudocereals and their increasing use asfunctional gluten-free ingredients. Trends Food Sci. Technol. 2010, 21, 106–113. [CrossRef]
50

Foods 2020, 9, 111
13. Lazaridou, A.; Duta, D.; Papageorgiou, M.; Belc, N.; Biliaderis, C.G. Effects of hydrocolloids on doughrheology and bread quality parameters in gluten-free formulations. J. Food Eng. 2007, 79, 1033–1047.[CrossRef]
14. Pruska-Kedzior, A.; Kedzior, Z.; Goracy, M.; Pietrowska, K.; Przybylska, A.; Spychalska, K. Comparison ofrheological, fermentative and baking properties of gluten-free dough formulations. Eur. Food Res. Technol.2008, 227, 1523–1536. [CrossRef]
15. Masure, H.G.; Fierens, E.; Delcour, J.A. Current and forward-looking experimental approaches in gluten-freebread making research. J. Cereal Sci. 2016, 67, 92–111. [CrossRef]
16. Ziobro, R.; Witczak, T.; Juszczak, L.; Korus, J. Supplementation of gluten-free bread with non-gluten proteins.Effect on dough rheological properties and bread characteristic. Food Hydrocoll. 2013, 32, 213–220. [CrossRef]
17. Demirkesen, I.; Mert, B.; Sumnu, G.; Sahin, S. Rheological properties of gluten-free bread formulations.J. Food Eng. 2010, 96, 295–303. [CrossRef]
18. Graça, C.; Raymundo, A.; Sousa, I. Wheat Bread with Dairy Products—Technology, Nutritional, and SensoryProperties. Appl. Sci. 2019, 9, 4101. [CrossRef]
19. Sharafi, S.; Yousefi, S.; Faraji, A. Developing an innovative textural structure for semi-volume breads basedon interaction of spray-dried yogurt powder and jujube polysaccharide. Int. J. Biol. Macromol. 2017, 104,992–1002. [CrossRef]
20. Martins, R.B.; Fernandes, I.; Nunes, M.C.; Barros, A.; Peres, J.; Raymundo, A. Improving gluten free breadquality using by-products and underexploited resources. In Livro de Resumos do XIV Encontro Luso-Galego deQuímica; Sociedade Portuguesa de Química: Porto, Portugal, 2018.
21. Franco, J.M.; Raymundo, A.; Sousa, I.; Gallegos, C. Influence of processing variables on the rheological andtextural properties of lupin protein-stabilized emulsions. J. Agric. Food Chem. 1998, 46, 3109–3115. [CrossRef]
22. Graça, C.; Raymundo, A.; Sousa, I. Rheology changes in oil-in-water emulsions stabilized by a complexsystem of animal and vegetable proteins induced by thermal processing. LWT-Food Sci. Technol. 2016, 74,263–270. [CrossRef]
23. Graça, C.; Fradinho, P.; Sousa, I.; Raymundo, A. Impact of Chlorella vulgaris on the rheology of wheat flourdough and bread texture. LWT-Food Sci. Technol. 2018, 89, 466–474. [CrossRef]
24. Sworn, G. Xanthan gum. In Handbook of Hydrocolloids, 1st ed.; Philips, G.O., Williams, P.A., Eds.; Woodhead:Cambridge, UK, 2000; pp. 103–115.
25. Gómez, M.; Moraleja, A.; Oliete, B.; Ruiz, E.; Caballero, P.A. Effect of fibre size on the quality of fibre-enrichedlayer cakes. LWT-Food Sci. Technol. 2010, 43, 33–38. [CrossRef]
26. Lynch, K.M.; Coffey, A.; Arendt, E.K. Exopolysaccharides producing lactic acid bacteria: Theirtechno-functional role and potential application in gluten-free bread products. Food Res. Int. 2017,110, 52–61. [CrossRef]
27. Storck, C.; da Rosa Zavareze, E.; Gularte, M.; Elias, M. Protein enrichment and its effects on gluten-free breadcharacteristics. LWT-Food Sci. Technol. 2013, 53, 346–354. [CrossRef]
28. Torbica, A.; Belovic, M.; Tomic, J. Novel breads of non-wheat flours. Food Chem. 2019, 282, 134–140. [CrossRef]29. Hundschell, C.S.; Wagemans, A.M. Rheology of common uncharged exopolysaccharides for food applications.
Cur. Opin. Food Sci. 2019, 27, 1–7. [CrossRef]30. Picout, D. Ross-Murphy, Rheology of Biopolymer Solutions and Gels. Sci. World J. 2003, 3, 105–121.
[CrossRef]31. Marchetti, l.; Andrés, S.; Cerruti, P.; Califano, A. Effect of bacterial nanocellulose addition on the rheological
properties of gluten-free muffin batters. Food Hydrocoll. 2020, 98, 105315. [CrossRef]32. Razmkhah, S.; Razavi, S.; Mohammadifar, M. Dilute solution, flow behavior, thixotropy and viscoelastic
characterization of cress seed (Lepidium sativum) gum fractions. Food Hydrocoll. 2017, 63, 404–413. [CrossRef]33. Martinez, M.; Gómez, M. Rheological and microstructural of the most common gluten-free flours and
starches during bread fermentation and baking. J. Food Eng. 2017, 197, 78–86. [CrossRef]34. Bernaerts, T.; Panozzo, A.; Doumen, V.; Foubert, I.; Gheysen, L.; Goiris, K.; Moldenaers, P.; Hendrickx, M.;
Van Loey, A. Microalgal biomass as a (multi) functional ingredient in food products: Rheological propertiesof microalgal suspensions as affected by mechanical and thermal processing. Algal Res. 2017, 25, 452–463.[CrossRef]
51

Foods 2020, 9, 111
35. Gallagher, E.; Kundel, A.; Gormley, T.R.; Arendt, E.K. The effect of dairy and rice powder addition on loafand crumb characteristics, and on shelf life (intermediate and long-term) of gluten-free breads in a modifiedatmosphere. Eur. Food Res. Technol. 2003, 218, 44–48. [CrossRef]
36. Galle, S.; Schwab, C.; Dal Bello, F.; Coffey, A.; Gänzle, M.G.; Arendt, E.K. Comparison of the impact ofdextran and reuteran on the quality of wheat sourdough bread. J. Cereal. Sci. 2012, 56, 531–537.
37. Wolter, A.; Hager, A.S.; Zannini, E.; Czerny, M.; Arendt, E.K. Influence of dextran producing Weissella cibariaon baking properties and sensory profile of gluten-free and wheat breads. Int. J. Food Microb. 2014, 172,83–91. [CrossRef] [PubMed]
38. Arendt, E.K.; Ryan, L.A.; Dal Bello, F. Impact of sourdough on the texture of bread. Food Microbiol. 2007, 24,165–174. [CrossRef] [PubMed]
39. Moore, M.M.; Heinbockel, M.; Dockery, P.; Ulmer, H.M.; Arendt, E.K. Network formation in gluten-freebread with application of transglutaminase. J. Cereal. Chem. 2006, 83, 28–36. [CrossRef]
40. Renzetti, S.; Bello, F.D.; Arendt, E.K. Microstructure, fundamental rheology and baking characteristics ofbatters and breads from different gluten- free flours treated with a microbial transglutaminase. J. Cereal. Sci.2008, 48, 33–45. [CrossRef]
41. Gallagher, E. Gluten-Free Food Science and Technology, 1st ed.; Wiley Blackwell: Oxford, UK, 2009; pp. 52–81.
© 2020 by the authors. Licensee MDPI, Basel, Switzerland. This article is an open accessarticle distributed under the terms and conditions of the Creative Commons Attribution(CC BY) license (http://creativecommons.org/licenses/by/4.0/).
52

foods
Article
Optimization of the Formula and Processing Factorsfor Gluten-Free Rice Bread with Tamarind Gum
Ye-Eun Hong 1 and Meera Kweon 1,2,*
1 Department of Food Science and Nutrition, Pusan National University, Busan 46241, Korea;[email protected]
2 Kimchi Institute, Pusan National University, Busan 46241, Korea* Correspondence: [email protected]; Tel.: +82-51-510-2716; Fax: +82-51-583-3648
Received: 31 December 2019; Accepted: 28 January 2020; Published: 1 February 2020
Abstract: The formula and processing parameters for gluten-free rice bread were optimized using afactorial design, including a center point. Gum concentration (GC), water amount (WA), mixing time(MT), and fermentation time (FT) were selected as factors, and two levels were used for each factor:1 and 2% for GC; 80 and 100 g for WA; 5 and 10 min for MT; and 30 and 60 min for FT. The WA and FTwere identified as the most significant factors in determining the quality of gluten-free rice bread withtamarind gum. Thus, the optimized formula and processing conditions for maximizing bread volumeand minimizing bread firmness were 1% gum, 100 g water, 5 min MT, and 60 min FT. The addition of ananti-staling enzyme reduced the increase in bread firmness and the enthalpy of starch retrogradation,suggesting its potential for successful application in commercially manufactured rice bread withtamarind gum.
Keywords: gluten-free; rice bread; tamarind gum; factorial design; optimization; formula;processing factor
1. Introduction
In Korea, with increasing personal income and the westernization of dietary patterns,the consumption of rice is decreasing, while the use of wheat is increasing [1]. Wheat containsglutenin and gliadin, which are unique protein components that form the viscoelastic gluten essentialfor bread-making. However, omega gliadin, present in wheat, is a major component that causes celiacdisease, which is an autoimmune disease caused by ingesting gluten, and its main symptoms includechronic diarrhea, vomiting, and abdominal distension in young infants [2]. Patients with celiac diseaseare advised to consume gluten-free foods from grains that do not contain gliadin. Rice is one suchgrain commonly used for gluten-free products. Thus, the development of gluten-free foods using riceflour is considered to be a suitable strategy to increase rice consumption [3].
Considerable research on the development of gluten-free foods using rice has been activelyconducted worldwide [4–6], and various gluten-free products are being sold commercially. Baked goodsare popular, and many studies have been performed to develop gluten-free rice bread. However,the improvement of the pseudo-viscoelasticity imparted by rice flour dough is still needed to developa gluten-free rice product whose volume and texture are similar to those of bread made of wheatflour. Many types of grains, protein sources, and gums have been studied to improve the quality ofgluten-free bread [7,8].
Several gums, such as xanthan gum, guar gum, pectin, carrageenan, and hydroxyl methylcellulose(HPMC), have been studied [9–13], and, recently, tamarind gum has been reported for its suitability inthe manufacturing of rice bread [14]. Tamarind gum is a xyloglucan and can improve bread-makingby increasing the stability of the dough and loaf volume [15]. The majority of studies on gluten-freeproducts have investigated the ingredients and formulation, with less focus on the processing conditions.
Foods 2020, 9, 145; doi:10.3390/foods9020145 www.mdpi.com/journal/foods53

Foods 2020, 9, 145
Therefore, in-depth research on the formulation and processing conditions of gluten-free rice bread,with the added tamarind gum, is needed for its successful application.
In this study, a factorial design was used to identify and optimize significant factors in theformulation and processing conditions of gluten-free rice bread with the addition of tamarind gum.Gum concentration (GC), water amount (WA), mixing time (MT), and fermentation time (FT) were thefour factors selected, and two levels were set for each factor. Quality characteristics of the gluten-freerice bread were evaluated by measuring the pH of batter before and after fermentation, moisture,volume, and crumb texture of the bread. The effect of an anti-staling enzyme on gluten-free rice bread atthe optimal formulation and processing conditions, selected through the experiment, was analyzed forquality changes during cold storage by measuring moisture, texture, and the retrogradation enthalpyof the rice bread by differential scanning calorimetry (DSC).
2. Materials and Methods
2.1. Materials
The rice flour used (Nongsim, Seoul, Korea) was a wet mill product purchased from a local market.Tamarind gum was obtained from a manufacturing company (Socius Ingredients LLC, Evanston,IL, USA), and sugar (CJ CheilJedang Corp, Seoul, Korea), soy milk powder (Benesoy, Rock City,IL, USA), canola oil (Beksul, Seoul, Korea), salt (Haepyo, Seoul, Korea), and dry yeast (Lesaffre,Marcqen–Baroeul, France) were purchased from a local market. The anti-staling enzyme Novamyl10,000 BG, used in the storage experiments, was obtained from a manufacturing company (Novozymes,Bagsvaerd, Denmark).
2.2. Preparation of Rice Bread
The Design Expert (Minneapolis, MN, USA) program was used for the factorial design toidentify and optimize the significant factors of the formulation and processing conditions. The fourfactors—concentration of gum, amount of water, mixing time, and fermentation time—were selected,with each factor consisting of two levels: gum concentration at 1 and 2%; water at 80 and 100 g; mixingtime at 5 and 10 min; and fermentation time at 30 and 60 min. The basic ingredients and formulationused were 100 g of rice flour, 5 g of canola oil, 7 g of sugar, 3 g of soy milk powder, 2 g of salt, and 3 gof yeast, according to the combined method described by Hera et al. [16] and Jang et al. [14]. The ricebread was prepared as per the method described by Jang [17].
Pre-weighed dry ingredients, including rice flour and tamarind gum, were tumbled in a jar with alid for uniform blending and transferred to a mixer bowl (Pin Mixer, National Mfg. Co., Lincoln, NE,USA). Oil (5 g) and water (amount set as per the experimental design shown in Table 1) were addedand mixed for a set time. Batter (190 g) was placed in a baking pan (a non-stick mini loaf pan, 14.6 cm× 8.3 cm × 5.7 cm; Chicago Metallic, Lake Zurich, IL, USA). The baking pan containing the batter wasplaced in a fermenter (Samjung, Gyeonggi, Korea) for a set time at 30 ◦C and 85% relative humidity.Batter appearance, before and after fermentation, was photographed using a digital camera (Canon,Tokyo, Japan). After fermentation, 10 g of the batter was removed for pH measurement, and theremaining batter was baked in an oven (Phantom M301 Combi, Samjung, Gyeonggi, Korea) at 215 ◦Cfor 20 min. After cooling at room temperature (25–30 ◦C) for 20 min, the bread was taken out of thebaking tray. It was further cooled for 40 min before quality analysis. Bread baking was repeated twicefor each condition.
54

Foods 2020, 9, 145
Table 1. Experimental conditions tested by a full factorial design for preparing gluten-free rice bread.
StdOrder
RunOrder
Gum(%)
Water(g)
Mixing Time(min)
Fermentation Time(min)
1 12 1 80 5 302 14 2 80 5 303 9 1 100 5 304 16 2 100 5 305 3 1 80 10 306 5 2 80 10 307 10 1 100 10 308 17 2 100 10 309 13 1 80 5 6010 7 2 80 5 6011 11 1 100 5 6012 2 2 100 5 6013 1 1 80 10 6014 6 2 80 10 6015 4 1 100 10 6016 15 2 100 10 6017 8 1.5 90 7.5 45
2.3. Analysis of Batter Property of Rice Bread
To measure the specific gravity of the batter, 5 g of the batter was placed in a 50 mL beaker, and itsvolume was marked. After removing the batter, water was poured up to the mark, and the volumeand weight of the water were measured. The specific gravity of the batter was calculated.
To measure the pH before and after fermentation of the batter, 5 g of batter and 50 g of distilledwater were mixed in a blender (SFM-7700JJH, Sinil, Korea) for 20 s to ensure uniform dispersion,and the batter suspension was transferred to a beaker. The pH of the suspension was measured usinga pH meter (Mettler Toledo SevenEasy pH meter S20, Columbus, OH, USA).
2.4. Evaluation of Rice Bread Quality
Bread weight, height, and volume were measured according to the method described by Jang etal. [14]. To measure bread volume, millet seeds were used in the seed replacement method. The density(g/mL) of millet, used for converting weight into volume, was determined by filling a 1.5 L plasticcontainer with millet. A loaf of bread was placed in the container filled with millet, and the weightof millet that was pushed out of the container (g) was measured. The volume of the bread (mL) wascalculated based on the calculated density.
According to the AACC Approved Method 74–09.01 [18] and that described by Jang et al. [14],bread firmness was measured using a Texture Analyzer (Brookfield CT3, Middleboro, MA, USA).The measurement conditions were set as follows: mode, measure force in compression; pre-testspeed, 2.0 mm/s; test speed, 2.0 mm/s; post-test speed, 5.0 mm/s; probe, a 3.6 cm diameter cylinder;and penetration distance, 15 mm. One loaf of bread was cut from the centre into two pieces with athickness of 2 cm; its firmness was measured by compressing the centre of the cross-section of the bread.
The moisture content of the bread samples was measured using the AACC Approved Method44–15.02 [18]. Approximately 3 g of pre-weighed breadcrumbs in an aluminium container was placedin a hot-air drying oven (FO 600-M, Jeio Tech, Daejeon, Korea), dried at 130 ◦C for 1 h, and cooled atroom temperature in a desiccator for 30 min. The moisture content of the bread was calculated fromthe weight reduced after drying.
2.5. Evaluation of the Effect of an Anti-staling Enzyme on the Staling of Rice Bread during Storage
To evaluate the effect of an anti-staling enzyme on bread staling during storage, bread wasprepared as per the formulation and processing conditions were selected as the most desirable in the
55

Foods 2020, 9, 145
optimization experiment conducted in this study. An anti-staling enzyme, Novamyl 10,000 BG, wasadded to the bread formulation at 0.005, 0.01, and 0.015%, and mixed well with the dry ingredientsused to prepare the rice bread as per the abovementioned process. Control bread, for comparison,was made without adding the enzyme. One loaf of bread was cut from the centre into three pieceswith a thickness of 2 cm. One piece was used as the fresh sample (0 days); the other two pieces weresealed in aluminium foil packaging to avoid moisture loss during storage and placed in a refrigeratorat 4 ◦C. Measurements of firmness, moisture content, and enthalpy of starch retrogradation of bread byDSC during storage were performed on 0, 1, and 4 days of storage after baking.
The temperature and enthalpy of starch retrogradation of bread were measured by DSC (DSC6000, Perkin–Elmer Co., Waltham, MA, USA). Breadcrumbs and water were mixed well at a ratio of 1:1(w/w). Then, 40 mg of the mixture was sealed in a stainless steel pan and heated at 10 ◦C/min of heatingrate from 10 ◦C to 140 ◦C using a differential scanning calorimeter. The temperature and enthalpy ofstarch retrogradation of bread were analyzed using Pyris Software (ver. 11, Perkin–Elmer Co.).
2.6. Statistical Analysis
All results were evaluated by two or more repeated experiments and analyzed using the DesignExpert program to identify significant factors, as well as to optimize the formulation and processingconditions. The SPSS statistical program (ver. 22.0, IBM Corp., Armonk, NY, USA) was used for theANOVA and the Duncan’s multiple range test at a significance threshold of p < 0.05.
3. Results and Discussion
3.1. Characteristics of the Batter of Rice Bread
The appearance of the batter, prepared according to the experimental design, is presented inFigure 1. With the high WA in the formulation, the batter was thin. Within the same WA in theformulation, the batter with the high GC was relatively thicker. With the increasing WA and FT,the expanded volume of the batter after fermentation increased. The most significant increase in battervolume after fermentation was observed in batters #11, 12, 15, and 16, which were formulated with100 g of water and fermented for 60 min, and #17, the center point with 90 g of water for 45 minof fermentation. Increasing the FT could break the dough structure by weakening the hydrocolloidnetwork in which starch granules or flour particles are embedded, resulting in less resistance tostrain [19]. The extent of volume expansion between these batter samples was not significantly differentby varying the MT. However, when the GC was less, the batter looked thin, which might have resultedin easy expansion. A lower batter consistency is preferred for good performance during leavening [20].Thus, the appearance of the batter might be linked to the bread volume.
The pH of the rice bread batter, before and after fermentation, is shown in Table 2.After fermentation, the pH of all the samples decreased, which was considered to be the resultof acidic substances, such as lactic acid and acetic acid, that were produced during fermentation [21].The pH change during fermentation was 0.3–0.7. The batter samples (#1–8), fermented for 30 min,showed a pH of 5.7–5.9 after the fermentation, resulting in a pH change of 0.3–0.5, whereas the samples(#9–16), fermented for 60 min, showed a pH of 5.4–5.6 after fermentation, resulting in a pH changeof 0.5–0.7. As a result, it is suggested that the fermentation time affected the batter pH, whereas theGC, WA, and MT did not show any significant effects on batter pH. Jang et al. [14] reported thatchanges in batter pH during fermentation were different between various gums used at 4%. However,no significant difference was observed at the 1–2% concentration of tamarind gum that was used inthis study in order to follow the U.S. Food and Drug Administration (FDA) regulation.
56

Foods 2020, 9, 145
Figure 1. Appearance of batter prepared as per the designed formula and processing conditions before(left) and after (right) fermentation.
The specific gravity of all of the batter samples was 1.1 g/cc, which indicated no significantdifference in aeration during mixing due to a negligible difference (1 and 2%) in the viscosity of the gum.But, Jang [17] observed differences in the specific gravity of the batter depending on the type of gumused in the gluten-free rice bread. When the hydroxypropyl methylcellulose (HPMC) concentrationwas increased from 1 to 4% in the formulation of rice bread, the specific viscosity of the batter wassignificantly increased because of the increased thickness that caused less aeration during mixing.
3.2. Quality Characteristics of Rice Bread
The cross-section of the rice bread is shown in Figure 2. The #9–16 bread samples with 60 minof fermentation exhibited a relatively higher volume than the #1–8 bread samples with 30 min offermentation, reflecting the effect of FT on the bread volume. The impact of the WA was morepronounced at a longer FT, and the #11, 12, 15, and 16 bread samples exhibited relatively largecross-sectional volumes of bread. Among the bread samples, #11 (1% gum, 100 g of water, 5 min MT,and 60 min FT) was selected as the most desirable bread that was similar to commercial bread, basedon crumb pore size and symmetrical shape.
The weight of the bread was affected significantly by the high WA with 60 min FT but not with30 min FT. The weight of the former bread per loaf was 144.1–145.6 g, whereas that of the latter was150.3–153.2 g (Table 2). When the WA was high and the FT long, the batter could expand quicklyduring the baking process, resulting in an increase in volume and moisture loss during baking [5, 16].The volume of rice bread was also affected significantly by the FT with high WA. At 60 min offermentation, the volume of bread was 338.3–380.0 mL, whereas, at 30 min, the volume of breadwas 270.6–293.5 mL (Table 2). When the WA was low, the effect of the FT on bread volume wasnot significant.
57

Foods 2020, 9, 145
Figure 2. Cross-sections of gluten-free rice bread tested by a full factorial design.
The moisture content and firmness of the breadcrumbs are shown in Table 2. The moisture contentof the breadcrumbs correlated with the amount of water in the formulation. Regardless of the FT,the water content of the crumbs was 44.4–46.3% when a small amount of water was added to theformulation and 49.3–51.3% when a large amount of water was added to the formulation. The firmnessof the breadcrumbs showed a significant relationship with the moisture content of the breadcrumbsin the bread samples prepared with the same FT. When the FT is long (60 min) and the WA is large,the bread volume is large and the firmness of the bread crumb is significantly low [5,16,22]. Overall,the quality of bread was affected by the WA and FT, which were the significant factors, but was notaffected by the GC and MT.
58

Foods 2020, 9, 145
Table 2. pH of batter before and after fermentation and gluten-free rice bread characteristics tested by afull factorial design.
StdOrder
Batter Bread
pH beforeFermentation
pH afterFermentation
Weight(g)
Volume(mL)
MoistureContent
(%)
Firmness(N)
1 6.2 ± 0.1 a,* 5.9 ± 0.1 a 153.8 ± 0.2 b,c 289.8 ± 11.5 b 46.2 ± 0.0 a 9.8 ± 1.1 e,f
2 6.3 ± 0.2 a 5.9 ± 0.2 a 154.1 ± 0.5 b,c 300.1 ± 0.9 b 45.3 ± 0.3 a 8.9 ± 0.1 d,e,f
3 6.2 ± 0.0 a 5.9 ± 0.1 a 150.7 ± 0.2 b,c 273.2 ± 5.0 a,b 50.0 ± 0.6 c 7.0 ± 1.2 b,c,d,e
4 6.3 ± 0.2 a 5.9 ± 0.2 a 153.2 ± 0.7 b,c 370.1 ± 6.0 d,e 49.9 ± 0.5 c 6.8 ± 1.2 b,c,d,e
5 6.0 ± 0.1 a 5.7 ± 0.1 a 152.9 ± 0.9 b,c 295.2 ± 5.0 b 45.6 ± 0.7 a 8.5 ± 0.9 c,d,e
6 6.0 ± 0.1 a 5.7 ± 0.2 a 154.6 ± 1.1 c 276.2 ± 14.1 a,b 44.4 ± 0.3 a 8.8 ± 1.0 d,e,f
7 6.2 ± 0.0 a 5.8 ± 0.0 a 152.3 ± 0.8 b,c 258.3 ± 4.5 a 51.3 ± 0.1 c 7.0 ± 0.6 b,c,d,e
8 6.3 ± 0.3 a 5.8 ± 0.2 a 152.2 ± 1.4 b,c 274.3 ± 8.8 a,b 50.6 ± 0.8 c 7.0 ± 0.2 b,c,d,e
9 6.2 ± 0.0 a 5.5 ± 0.0 a 151.1 ± 0.3 b,c 282.7 ± 3.5 a,b 46.3 ± 0.3 a 7.9 ± 1.0 c,d,e
10 6.1 ± 0.2 a 5.5 ± 0.2 a 152.0 ± 0.1 b,c 270.6 ± 6.2 a,b 44.4 ± 0.2 a 9.9 ± 1.1 e,f
11 6.2 ± 0.1 a 5.6 ± 0.0 a 145.3 ± 1.1 a 338.3 ± 3.8 c 50.6 ± 0.7 c 4.0 ± 0.1 a,b
12 6.1 ± 0.2 a 5.5 ± 0.1 a 145.2 ± 0.6 a 360.0 ± 12.4 c,d,e 50.4 ± 1.0 c 5.5 ± 0.4 a,b,c
13 6.0 ± 0.1 a 5.5 ± 0.1 a 153.2 ± 4.1 b,c 293.5 ± 12.8 b 45.2 ± 1.3 a 12.0 ± 2.0 f
14 6.0 ± 0.1 a 5.4 ± 0.2 a 150.3 ± 0.6 b 275.3 ± 0.8 a,b 44.4 ± 0.2 a 8.5 ± 0.9 c,d,e
15 6.1 ± 0.1 a 5.4 ± 0.2 a 144.1 ± 0.2 a 349.1 ± 8.0 c,d 49.3 ± 0.3 b,c 3.1 ± 0.3 a
16 6.3 ± 0.3 a 5.6 ± 0.2 a 145.6 ± 1.0 a 380.0 ± 10.9 e 50.6 ± 0.3 c 4.0 ± 1.2 a,b
17 6.0 ± 0.2 a 5.5 ± 0.2 a 149.9 ± 0.5 b 365.6 ± 18.8 c,d,e 47.0 ± 2.4a,b 5.8 ± 1.1 a,b,c,d
* Results are expressed as the mean ± standard deviation. Values with the same letter within the same column arenot significantly different (p < 0.05), according to Duncan’s multiple range test.
3.3. Significant Factors Affecting the Quality Characteristics of Rice Bread
The results of the statistical analysis of the batter characteristics and bread quality characteristicsof gluten-free rice bread prepared based on the full factorial design of a factor analysis method areshown in Table 3. The three-dimensional plots of the six characteristics of gluten-free rice batter andbread with tamarind gum are presented as a function of the two independent variables among GC,WA, MT, and FT in response to their significance in Figure 3.
Table 3. Significant factors for the batter and bread characteristics of gluten-free rice bread tested by afull factorial design.
Sample Response Significant Factor p-Value Significance
Batter Specific gravity - - -pH before fermentation - - -pH after fermentation Fermentation time (FT) 0.0002 Negative
Bread Weight Fermentation time <0.0001 NegativeWater amount (WA) <0.0001 Positive
WA × FT 0.0024 PositiveVolume Fermentation time 0.0207 Positive
WA × FT 0.0097 PositiveMoisture content Water amount 0.0002 Positive
Firmness Water amount <0.0001 Negative
With regard to the batter characteristics, no significant factors affected the specific gravity(Figure 3A) or pH before fermentation; however, FT was a significant factor that was negativelycorrelated with the pH after fermentation. It was predicted that the pH of the batter decreased afterfermentation with the increase in the FT (Figure 3B).
With regard to the quality characteristics of bread, the WA and FT were the significant factorsnegatively correlated with the weight of bread. The weight of the bread decreased as the WA and FTincreased (Figure 3C). However, FT was positively correlated with bread volume, confirming thatthe FT needs to be controlled to increase the volume. Interaction of WA and FT also had a positiveeffect on bread volume. Thus, the bread volume increased as the WA and FT increased (Figure 3D).The moisture content of breadcrumbs was positively correlated with the WA, whereas the firmness
59

Foods 2020, 9, 145
of the breadcrumbs was negatively correlated with the WA (Figure 3E,F). These results reflected theimportance of the WA for bread quality. Hera et al. [16] and Mancebo et al. [5] reported the effect ofwater content on gluten-free bread quality; the bread specific volume increased and the crumb textureimproved by increasing dough hydration, which was similar to our results.
Figure 3. Three-dimensional plots on the characteristics of batter (A,B) and bread (C–F) affected bysignificant factors of the formula and processing conditions in the preparation of gluten-free rice breadwith tamarind gum.
3.4. Effect of an Anti-staling Enzyme on the Quality of Rice Bread during Storage
The moisture content and firmness of bread after adding an anti-staling enzyme during storage at4 ◦C and its retrogradation tendency measured by DSC are shown in Figure 4 and Table 4. The controlrice bread without the added enzyme showed a significant increase in firmness during storagecompared to the bread with the added enzyme. The results of the control bread were consistent withthe storage test of rice bread with tamarind gum reported by Jang et al. [14]. Gluten-free rice breadhas a higher starch percentage than wheat bread, and numerous attempts to retard staling have beenreported [23,24].
(a) (b)
Figure 4. Changes in the moisture content (a) and firmness (b) of bread with anti-staling enzyme atdifferent concentrations during storage at 4 ◦C.
60

Foods 2020, 9, 145
Table 4. Thermal characteristics of gluten-free rice bread prepared with #11 (1% gum, 100 g of water, a5 min mixing time, and a 60 min fermentation time) during storage at 4 ◦C.
EnzymeConcentration
(%)
Storage Time(day)
Tonset(◦C)
Tpeak(◦C)
Tend(◦C)
Heat ofTransition(ΔQ, J/g)
0 0 40.1 ± 0.1 a,* 48.1 ± 0.1 a 66.9 ± 1.1 c,d,e,f 0.35 ± 0.0 a
1 40.0 ± 0.0 a 53.4 ± 0.1 b 64.8 ± 0.2 b,c,d,e 0.82 ± 0.0 c
4 40.8 ± 0.9 a 52.8 ± 0.4 b 65.1 ± 0.6 b,c,d,e 1.43 ± 0.1 e
0.005 0 40.0 ± 0.0 a 48.0 ± 0.1 a 67.8 ± 0.9 e,f 0.28 ± 0.0 a
1 40.0 ± 0.0 a 52.8 ± 0.6 b 64.6 ± 0.0 b,c,d 0.60 ± 0.0 b
4 40.7 ± 0.3 a 52.8 ± 0.6 b 64.6 ± 0.7 b,c,d 1.11 ± 0.1 d
0.010 0 40.18 ± 0.1 a 48.7 ± 0.1 a 68.4 ± 0.3 f 0.37 ± 0.0 a
1 40.0 ± 0.0 a 52.7 ± 0.2 b 61.0 ± 0.8 a 0.40 ± 0.1 a
4 40.47 ± 0.1 a 51.4 ± 2.1 b 64.6 ± 0.6 b,c,d 1.02 ± 0.1 d
0.015 0 40.0 ± 0.0 a 48.5 ± 1.2 a 67.6 ± 2.4 d,e,f 0.25 ± 0.0 a
1 40.0 ± 0.0 a 53.0 ± 0.5 b 63.8 ± 0.7 a,b,c 0.36 ± 0.1 a
4 40.79 ± 0.7 a 52.7 ± 0.8 b 63.5 ± 0.0 a,b 0.73 ± 0.0 b,c
* Results are expressed as the mean ± standard deviation. Values with the same letter within the same column arenot significantly different (p < 0.05), according to Duncan’s multiple range test.
The firmness of the control rice bread before refrigerated storage was 4.6 N and that of thebread with the added enzyme was slightly less (2.3–3.9 N) (Figure 4). With the increasing amountof enzyme, the firmness of the bread decreased. With the increasing storage period, the firmnessincreased. The difference between the control and the enzyme addition group was more significant onday four. The firmness of bread after refrigerated storage increased from 4.6 to 50.5 N for the controlgroup, from 3.9 to 16.2 N for the 0.005% enzyme group, from 2.6 to 9.1 N for the 0.010% enzyme group,and from 2.3 to 9.1 N for the 0.015% enzyme group. As the amount of enzyme increased, the extent ofthe increase in firmness during storage significantly decreased (p < 0.05), demonstrating the effectiveanti-staling impact of the enzyme. The reaction of maltogenic amylase is known to hydrolyze starch inthe batter during mixing and baking and reduce the size of amylose and amylopectin. Shorter amyloseand amylopectin cannot rearrange easily, resulting in retardation of starch retrogradation [25].
The moisture content of the rice bread during refrigerated storage was 51.1–49.2% (Figure 4),which was the most favorable condition for starch retrogradation [26]. During storage, it showed aslight change on the fourth day for all samples, indicating the excellent packaging of the bread duringstorage. The bread with the enzyme showed less of an increase in firmness than the control bread,demonstrating the anti-staling effect of the enzyme during storage.
The enthalpy of starch retrogradation of bread with and without the enzyme during storage,measured by DSC, was compared (Table 4). As the storage period increased, the peak of the controlbread in the DSC thermogram increased significantly; however, that of the bread with the enzyme didnot increase dramatically. Moreover, as the amount of enzyme increased, the increase in peak sizeduring storage decreased. The enthalpy of starch retrogradation of bread increased with an increase inthe storage period. The control bread showed the highest increase in enthalpy, whereas that with theenzyme showed a less significant increase in enthalpy. The extent of the increase in enthalpy decreasedas the amount of added enzyme increased. The retrogradation enthalpy on the fourth day of storagewas 1.43, 1.11, 1.02, and 0.73 J/g for the control bread and 0.005, 0.010, and 0.015% enzyme added bread,respectively. α-Amylase hydrolyzes starch while increasing sugars, which can be fermented by theyeast. The enzyme reaction increases the bread volume, improves the color and flavor of the bread crust,and extends the shelf life by retarding staling [27]. In this study, the addition of the enzyme inhibitedthe increase in firmness of gluten-free rice bread during storage, indicating the excellent anti-stalingeffect. This finding suggests its potential for successful application in commercially manufacturedrice bread.
61

Foods 2020, 9, 145
4. Conclusions
A factorial analysis was used to identify and optimize significant factors in the formulation andprocessing conditions of rice bread with tamarind gum. Four factors—gum concentration, wateramount, mixing time, and fermentation time—were selected and two levels for each factor were set,making a total of 17 conditions, including the center point. Although WA and FT significantly affectedthe quality of gluten-free rice bread, GC and MT did not. Overall, the WA and FT were identified asthe significant factors in the production of gluten-free rice bread. Therefore, proper control over WAand FT can maximize the bread volume and minimize the firmness of the bread. Among the variousexperimental conditions, 1% tamarind gum, 100 g of water, 5 min of mixing, and 60 min of fermentationwere determined to be the optimal conditions. The addition of the anti-staling enzyme was effective inretarding the increase in retrogradation enthalpy and bread firmness. Using an optimized formulaand processing factors for gluten-free rice bread with the combined addition of tamarind gum and ananti-staling enzyme can be applied successfully in commercially manufactured gluten-free rice bread.
Author Contributions: Concepturalization, Y.-E.H. and M.K.; Data curation, Y.-E.H.; Data analysis, Y.-E.H. andM.K.; Writing—original draft, Y.-E.H.; Writing—review & editing, M.K. All authors have read and agreed to thepublished version of the manuscript.
Acknowledgments: We thank Stevan Angalat at Angalat Group International LLC for his kind support inrequesting the soy milk powder and the tamarind gum from the manufacturers for the study.
Conflicts of Interest: The authors declare no conflicts of interest.
References
1. Statistic Korea. Annual Trends of Food Grain Consumption in 2018. Available online: http://kostat.go.kr/portal/eng/pressReleases/1/index.board?bmode=read&aSeq=373404 (accessed on 1 December 2019).
2. Green, P.H.R.; Jabri, B. Coeliac disease. Lancet 2003, 362, 383–391. [CrossRef]3. Kim, J.M. Characteristics of Rice Flours Prepared from Different Rice Varieties and Development of Gluten-Free
Bakery Products Using Them. Ph.D. Thesis, Chonnam National University, Gwangju, Korea, February 2016.4. Han, H.M.; Cho, J.H.; Kang, H.W.; Koh, B.K. Rice varieties in relation to rice bread quality. J. Sci. Food Agric.
2012, 92, 1462–1467. [CrossRef]5. Mancebo, C.M.; Miguel, M.A.S.; Martinez, M.M.; Gomez, M. Optimisation of rheological properties of
gluten-free doughs with HPMC, psyllium and different levels of water. J. Cereal Sci. 2015, 61, 8–15. [CrossRef]6. Mohammadi, M.; Sadeghnia, N.; Azizi, M.H.; Neyestani, T.R.; Mortazavian, A.M. Development of guten-free
flat bread using hydrocolloids: Xanthan and CMC. J. Ind. Eng. Chem. 2014, 20, 1812–1818. [CrossRef]7. Masure, H.G.; Fierens, E.; Delcour, J.A. Current and forward looking experimental approaches in gluten-free
bread making research. J. Cereal Sci. 2016, 67, 92–111. [CrossRef]8. Witczak, M.; Ziobro, R.; Juszczak, L.; Korus, J. Starch and starch derivatives in gluten-free systems—A review.
J. Cereal Sci. 2016, 67, 46–57. [CrossRef]9. Anton, A.A.; Artifield, S.D. Hydrocolloids in gluten-free breads: A review. Inter. J. Food Sci. Nutr. 2008, 59,
11–23. [CrossRef] [PubMed]10. Lazaridou, A.; Duta, D.; Papageorgiou, M.; Belc, N.; Biliaderis, C.G. Effects of hydrocolloids on dough
rheology and bread quality parameters in gluten-free formulations. J. Food Eng. 2007, 79, 1033–1047.[CrossRef]
11. Mir, S.A.; Shah, M.A.; Naik, H.R.; Zargar, I.A. Influence of hydrocolloids on dough handling and technologicalproperties of gluten-free breads. Trends Food Sci. Tech. 2016, 51, 49–57. [CrossRef]
12. Nishita, K.D.; Roberts, R.L.; Bean, M.M. Development of a yeast-leavened rice-bread formula. Cereal Chem.1976, 53, 626–635.
13. Sciarini, L.S.; Ribotta, P.D.; León, A.E.; Pérez, G.T. Effect of hydrocolloids on gluten- free batter propertiesand bread quality. Int. J. Food Sci. Tech. 2010, 45, 2306–2312. [CrossRef]
14. Jang, K.J.; Hong, Y.E.; Moon, Y.J.; Jeon, S.J.; Angalat, S.; Kweon, M. Exploring the applicability of tamarindgum for making gluten-free rice bread. Food Sci. Biotechnol. 2018, 27, 1639–1648. [CrossRef] [PubMed]
62

Foods 2020, 9, 145
15. Maeda, T.; Yamashita, H.; Morita, N. Application of xyloglucan to improve the gluten membrane onbreadmaking. Carbohydr. Polym. 2007, 68, 658–664. [CrossRef]
16. Hera, E.; Martinez, M.; Gomez, M. Influence of flour particle size on quality of gluten-free rice bread.LWT—Food Sci. Technol. 2013, 54, 199–206. [CrossRef]
17. Jang, K.J. Effect of Tamarind Gum on Gluten-Free Rice Batter Properties and Bread Quality. Master’s Thesis,Pusan National University, Busan, Korea, February 2018.
18. AACC. Method 44-15.02, Method 74-09.01.2010. In Approved Methods of Analysis, 11th ed.; AmericanAssociation of Cereal Chemists: St. Paul, MN, USA.
19. Martinez, M.M.; Gomez, M. Rheological and microstructural evolution of the most common gluten-freeflours and starches during bread fermentation and baking. J. Food Eng. 2017, 197, 78–86. [CrossRef]
20. Cappa, C.; Lucisano, M.; Mariotti, M. Influence of Psyllium, sugar beet fibre and water on gluten-free doughproperties and bread quality. Carbohydr. Polym. 2013, 98, 1657–1666. [CrossRef]
21. Blanco, C.A.; Ronda, F.; Pérez, B.; Pando, V. Improving gluten-free bread quality by enrichment with acidicfood additives. Food Chem. 2011, 127, 1204–1209. [CrossRef]
22. Tsatsaragkou, K.; Gounaropoulos, G.; Mandala, I. Development of gluten free bread containing carob flourand resistant starch. LWT—Food Sci. Technol. 2014, 58, 124–129. [CrossRef]
23. Bollain, C.; Collar, C. Dough viscoelastic response of hydrocolloid/ enzyme/surfactant blends assessed byuni- and bi-axial extension measurements. Food Hydrocoll. 2004, 18, 499–507. [CrossRef]
24. Gujral, H.S.; Rosell, C.M. Improvement of the breadmaking quality of rice flour by glucose oxidase. Food Res.Int. 2004, 37, 75–81. [CrossRef]
25. Ribotta, P.D.; Perez, G.T.; Leon, A.E.; Anon, M.C. Effect of emulsifier and guar gum on micro structural,rheological and baking performance on frozen bread dough. Food Hydrocoll. 2004, 18, 305–313. [CrossRef]
26. Zeleznak, K.J.; Hoseney, R.C. The role of water in the retrogradation of wheat starch gels and bread crumb.Cereal Chem. 1986, 63, 407–411.
27. Collar, C.; Bollain, C.; Angioloni, A. Significance of microbial transglutaminase on the sensory, mechanicaland crumb grain pattern of enzyme supplemented fresh pan breads. J. Food Eng. 2005, 70, 479–488. [CrossRef]
© 2020 by the authors. Licensee MDPI, Basel, Switzerland. This article is an open accessarticle distributed under the terms and conditions of the Creative Commons Attribution(CC BY) license (http://creativecommons.org/licenses/by/4.0/).
63


foods
Article
Physical and Dynamic Oscillatory Shear Properties ofGluten-Free Red Kidney Bean Batter and CupcakesAffected by Rice Flour Addition
Pavalee Chompoorat 1,*, Napong Kantanet 1, Zorba J. Hernández Estrada 2,3 and
Patricia Rayas-Duarte 2
1 Faculty of Engineering and Agro-Industry, Maejo University, Chiang Mai 50290, Thailand;[email protected]
2 Robert M Kerr Food & Agricultural Products Center, Department of Biochemistry and Molecular Biology,Oklahoma State University, Stillwater, OK 74078, USA; [email protected] (Z.J.H.E.);[email protected] (P.R.-D.)
3 Tecnológico Nacional de México/I.T. Veracruz, Calz. Miguel Angel de Quevedo No. 2779 Col. FormandoHogar, Veracruz 91860, Mexico
* Correspondence: [email protected]; Tel.: +669-3576-3571
Received: 31 March 2020; Accepted: 7 May 2020; Published: 11 May 2020
Abstract: Red kidney bean (RKB) flour is a nutrient-rich ingredient with potential use in bakeryproducts. The objective of this study was to investigate the viscoelastic properties and key qualityparameters of a functional RKB flour in gluten-free cupcakes with different rice flour levels. A 10 gmodel batter was developed for analyzing the viscoelastic properties of RKB with rice incorporation,in a formula containing oil, liquid eggs, and water. Rice flour was added at five levels 0%, 5%, 10%,15%, and 25% (w/w, g rice flour/100 g RKB flour). Rice flour increased RKB batter consistency, solid-and liquid-like viscoelastic behavior and revealed a heterogeneous structure, based on the sweepfrequency test. Rice flour at the 25% level increased the shear modulus and activation energy ofgelatinization, compared to 0% rice flour addition. Rice flour levels in the RKB batter decreased theinflection gelation temperature from 63 to 56 ◦C. In addition, the texture of RKB cupcakes with 25%rice flour were 46% softer, compared to the control. The scores from all sensory attributes of cupcakesincreased with the addition of rice flour. Rice flour addition improved solid- and liquid-like behaviorof the RKB batter and improved the cupcake’s macro-structural characteristics. Overall, 25% riceflour addition performed better than the lower levels. This study confirmed the potential of RKB as afunctional ingredient and its improvement in cupcake application with the addition of rice flour.
Keywords: dynamic oscillatory shear test; non-isothermal kinetic modeling; gluten-free cupcake; redkidney bean
1. Introduction
Red kidney bean (Phaseolus vulgaris L.) is a good source of vegetable protein, insoluble andsoluble fiber, and is overall a nutrient-rich food ingredient with a great potential for different foodapplications [1]. Thermal properties, water and oil retention as well as the emulsifying properties offlour of red kidney bean have been reported. Processing including vacuuming and soaking decreasethe beany flavor profile of the RKB flour. [2]. However, more studies are needed to fully understand therheological and sensory properties of the red kidney bean flour and its potential use in bakery products.
Commonly, gluten-free products are low in nutritional value [3,4], with high carbohydrate,low fiber, high glycemic index, as well as saturated and hydrogenated fatty acids [4]. An example ofalternative flours and ingredients that increase the protein and bioactive compounds is germinated
Foods 2020, 9, 616; doi:10.3390/foods9050616 www.mdpi.com/journal/foods65

Foods 2020, 9, 616
brown rice flour; a 48 h germination time increases the γ-aminobutyric acid (GABA), polyphenolslevels, and antioxidant activity [5]. Unhusked buckwheat flour enhances the fiber content and textureproperties of gluten-free bread [6]. However, the use of this ingredient is limited due to its highinsoluble fiber from husk, which affects the sensory properties of bread [6]. Rice and tapioca floursare widely used as the main ingredients in gluten-free bakery products due to their neutral color andflavor [7,8].
There is an increased interest in using pulses in food ingredients, including FAO declaring 2016as the International Year of Pulses with the goal of encouraging researchers around the world toinvestigate more applications of pulses. Pea and chickpea flours have been proposed as alternative flouringredients in the formulation of gluten-free products [9]. Protein isolates from kidney bean, field pea,and amaranth incorporated in rice-based gluten-free muffins increased the batter viscoelasticity andimproved the specific volume and texture [9]. Two types of cowpea protein isolate used in rice flourmuffins affected the gluten-free muffin volume differently [10]. The incorporation of the white cowpeaprotein isolate improved the volume of gluten-free muffin while red cowpea protein isolate decreasedthe volume [10]. Studies on a mechanistic model to provide a better understanding of baking wasaddressed by other researchers, including heat and mass transfer during baking and a model for bakingof leavened aerated food [11–13]. It was proposed that bubble growth during heating showed a lagtime before the exponential growth phase, which is related to an expanded inner region of more orless uniform density. The study of rheometric non-isothermal gelatinization kinetics also proposed tomodel an alteration of gluten-free muffin batter and found that zero-order reaction kinetics can be usedto explain batter gelatinization [14]. To the best of our knowledge, the use of the whole red kidney beanflour in gluten-free cupcakes with rice flour has not been investigated. Therefore, the aim of this workwas to examine the effect of rice flour on gluten-free RKB batter rheological properties and cupcakequality properties, as well as the interrogation of possible correlations between these properties.
2. Materials and Methods
2.1. Flour Preparation
Red kidney beans and rice flour were purchased in a local market in Chiang Mai, Thailand. Redkidney beans (RKB) were rinsed, boiled in water for 20 min, strained, and dried for 4 h at 80 ◦C using aconvection oven. These conditions were selected from Chompoorat et al. (2018) [15]. The resultingbeans were ground into flour with a hammer mill (W.J. Fit Company, Chicago, IL, USA) to a particlesize less than 250 μm (stainless steel sieve # 60, W.S. Tyler Co., Mentor, OH, USA). The RKB flourwas stored in polyethylene bags at 4 ◦C, until needed. RKB flour had 20.5% protein and 14.7% fiber,as previously reported [15]; while, rice flour had 80% carbohydrate, 3.5% protein, and 0.89% fat,according to USDA [16].
2.2. Cupcake Preparation
Gluten-free RKB cupcakes were prepared with ingredients purchased from a local market andRKB flour produced in the laboratory. The cupcake formula expressed as a weight percent of RKB flourbase (100%) contained granulated white sugar (65%), baking powder (1.9%), baking soda (1.1%), cocoapowder (10%), salt (1%), guar gum (0.5%), vegetable oil (37%), egg (65%), water (150%), and vanillaextract (3%). Commercial rice flour was added at 0%, 5%, 10%, 15%, and 25% based on RKB flour.The control sample contained 100% RKB flour.
The cupcakes were prepared by mixing all dry ingredients (KitchenAid, St. Joseph, MI, USA) for1 min at the lowest speed (setting# 1), using a paddle attachment. Wet ingredients (vegetable oil, egg,water, and vanilla) were added, mixed for 2 min at low speed (setting #1), followed by 5 min at highspeed (setting # 6). Cupcake batter aliquots (40 g) were placed into paper-lined molds and baked in aconvection oven at 195 ◦C for 20 min. The cupcakes were removed from the mold, allowed to cool for
66

Foods 2020, 9, 616
60 min at room temperature, and immediately transferred for analysis of firmness inside a cupcakecardboard box.
2.3. Batter Consistency
Batter aliquot (100 g) was used for consistency measurements with a Bostwick consistometer (CSCScientific Company, Inc., Fairfax, VA, USA), following manufacturer’s directions. The cupcake batterwas transferred to the consistometer chamber, the gate was released, and the batter flow rate (cm permin) was recorded. Batter flow rate was inversely proportional to consistency. Measurements weremade in three replicates per treatment.
2.4. Fundamental Viscoelastic Properties of Batter
2.4.1. Dynamic Oscillatory Test
A model batter sample was prepared containing all the ingredients listed in Section 2.2, scaleddown to 10 g total. A model batter was freshly prepared for each replicate. The model batter wasmixed for 5 min at 100 rpm, using a modified 10-g bowl rotary pin mixer (National Manufacturing,Lincoln, NE, USA). An oscillatory frequency sweep test was based on Hesso et al. (2015) withmodifications [17]. An AR-1000N rheometer (TA Instruments, New Castle, DE, USA) was used with a25-mm plate geometry (cross-hatched to minimize slippage) and a gap of 1 mm at 25 ◦C. During thetest, the plate geometry and batter sample area was covered with a trap to prevent drying or moistureloss. The sample was allowed to recover for 1 min before starting the test. Test conditions included 0.1to 10 Hz at 0.5% strain, within the linear viscoelastic region. G′ (storage modulus), G” (loss modulus),and tan delta (δ) were determined by this dynamic oscillatory measurement. Analyses were performedin three independent samples.
2.4.2. Temperature-Ramp Test
A non-isothermal method was applied to study gelation of the batter [18–20]. Model battersamples were prepared, as described in Section 2.4.1. Non-isothermal heating of a small amplitudeoscillatory shear test (temperature ramp) was measured with an AR-1000N rheometer (TA Instruments,New Castle, DE, USA). A recovering period of 1 min was used before starting the test. Test conditionsincluded a temperature range of 25 to 90 ◦C, at a heating rate of 5 ◦C per min, with a constantfrequency at 1 Hz and 0.5% strain within the linear viscoelastic region, in which the stress was directlyproportional to strain. Analyses were done in three independent samples. Parameters recorded wereG′ (elastic modulus, Pa), the stored energy in each batter sample or recoverable cycle of deformationand G” (viscous modulus, Pa), the loss energy in each batter sample or viscous dissipation per cycleof deformation. Complex shear modulus (G*) was calculated (Equation 1, where i represented animaginary unit) to record the overall resistance to flow and deformation of the samples. G* is a usefulproperty as it is a direct measure of the rigidity of soft solid structure of a material, when exposed tostresses below the yield stress [20,21]. High value of G*, means more solid structure or more resistanceto deformation of the samples.
G* =G′ + iG′ (1)
The kinetic parameters of the model (Equation (2)) were obtained by numerical methods, accordingto Alvarez et al. (2017); it was performed with the numerical derivative of the elastic moduli withrespect to time. Where T0 temperature (K) at the minimum value of dG′/dt, a, b, and c are the constantsof the model, and c can be used to calculate the Ea (kJ.mol−1) activation energy (Equation (3)), where Ris 8.314 J mol−1 K−1 (the universal gas constant). Activation energy (Ea) revealed the energy requiredfor gelatinization [14].
dG′dt
= a + be−c( 1T− 1
T0) (2)
Ea = cR (3)
67
Foods 2020, 9, 616
2.5. Firmness of Red-Kidney-Bean–Rice Cupcakes
Cupcake firmness is among the key texture parameters that influence consumer sensory perceptionand acceptance. After the cupcake samples were cooled to ambient temperature (25 ◦C), firmness wasmeasured using a TA-XT2 Texture Analyzer (Texture Technologies Corp., Hamilton, MA, USA/StableMicro Systems, Godalming, Surrey, UK). Analysis was performed following the Approved Methodoutlined by the American Association of Cereal Chemists (AACC 74-10.02) for bread, using a25-mm diameter cylindrical probe and 40% compression. Cupcake firmness was performed with 12independent replicates per sample.
2.6. Sensory Evaluation of Red-Kidney-Bean–Rice Cupcakes
Organoleptic properties of red kidney bean-rice cupcakes were evaluated with a 9-point hedonicscale ranging from ‘dislike extremely’ (1) to ‘like extremely’ (9). Cupcakes were tested after beingcooled for 60 min. The samples labeled with random 3-digit codes were scored by twenty untrainedpanelists, students of the Postharvest Technology at Maejo University, Thailand. The sensory attributesincluded flavor, taste, texture, and overall quality.
2.7. Statistical Analysis
Results are expressed as mean values ± standard deviation of the minimum three independentanalyses, unless otherwise described, such as cupcake firmness (n = 12) and sensory evaluation (n = 20).Mean comparison for significant differences of each treatment was tested by Duncan’s New MultipleRange, using the SAS program (Version 9.1 SAS Institute Inc., Cary, NC, USA). Correlations of the riceflour level effect on batter and cupcake properties were estimated with Principal Component Analysis(PCA) by Canoco for the Windows 5 software (Centre for Biometry, Wageningen, The Netherlands).
3. Results and Discussion
3.1. Effect of Rice Flour Addition on Red Kidney Bean Batter Consistency
Consistency was estimated with a 100 g-aliquot of full formula batter by measuring the flow ratein a consistometer, as used in the industry for quality control. The test was simple, fast, and providedenough information for consistency standardization. The levels of rice flour significantly decreasedthe flow rate (increased consistency) of gluten-free RKB cupcake batter, starting at 10% rice flouraddition (Table 1). Rice flour addition of 10%, 15%, and 25% significantly decreased the flow rate ofthe gluten-free cupcake batter by 4%, 12%, and 20%, respectively, compared to the control sample.Data fitted a second-degree polynomial (y = −0.0022x2−0.0659x + 14.163, R2 = 0.955) reflecting negativeslopes starting at 10% rice level. Increased consistency of the batter matrix could be explained inpart by the increase in air entrainment forming air bubbles, which increase the elastic character ofthe batter [22]. This might have been favored by rice flour properties and specifically of rice starch.We speculated that the continuous viscous phase of batter containing rice flour has more organizedhydrogen bonds with water molecules, resulting in increased consistency, as observed by a decreasedflow rate. A study of rice flour and starch showed that water-binding capacity of rice flour was higherthan rice starch, which were 128% and 100%, respectively [23]. The value of rice was within the rangeof red kidney bean flour, with 125% water absorption [24]. Starch damage in the rice flour might alsohave contributed to an increased water-holding capacity [25,26]. The results agreed with reports of aflow rate study of rice flour and wheat flour, which proposed that a decrease in flow rate in batter wasdue in part to the rate of flour water absorption [27,28]. Previous studies have showed that amylosecontent is negatively correlated with water absorption, swelling power, and damaged starch [29–31].Rice flour has amylose content approximately 15% lower than red kidney bean flour [32,33]. Thus, thislow amylose content of rice flour could impact the consistency of batter.
68

Foods 2020, 9, 616
Table 1. Batter and cupcake characteristics of gluten-free red kidney bean flour with rice flour addition a,b.
Rice Flour Level c
(%)
Batter Characteristics Cupcake Characteristic
Consistency T0 Ea Firmness(cm/min) (◦C) (kJ mol−1) (g)
0 14.3 ± 0.3 a 63.0 ± 2.5 a 165 ± 3 b 2970 ± 5 a
5 14.0 ± 0.1 a 60.2 ± 2.3 b 191 ± 2 a,b 2767 ± 4 a
10 13.2 ± 0.3 b 56.8 ± 2.5 c 177 ± 2 b 1709 ± 3 b
15 12.3 ± 0.3 c 56.7 ± 2.3 c 206 ± 4 a,b 1871 ± 3 b
25 11.2 ± 0.3 d 56.0 ± 2.5 c 237 ± 2 a 1619 ± 3 b
a Consistency (flow rate), Temperature ramp test: T0, inflection temperature of gelation and Ea, activation energy ofthe batter measured as flow rate. Firmness, cake texture. b Mean values (n = 3 ± SD) followed by a different letterwithin a column are significantly different, Duncan test (p < 0.05). c Rice flour addition to red kidney bean flour.
3.2. Effect of Rice Flour Addition on Red Kidney Bean Batter Viscoelastic Properties
3.2.1. Frequency Sweep Test of Batter
G′ (storage modulus) and G” (loss modulus) increased as the levels of rice flour increased in thefrequency range of 0.1 to 10 Hz (Figure 1). Elastic behavior dominated in all gluten-free RKB cupcakebatter samples (G′ > G”). Cake batter is considered a wet foam with contributions to its bulk rheologyfrom the continuous viscous phase and the discontinuous bubble phase (elastic effect) introducedduring mixing and the production of gas from leavening agents [22]. At 1 Hz and 0.5% strain, tan δ
of the batter with 25% rice addition decreased by 18%, compared to the control (data not shown),suggesting that the solid character (stiffness) of the batter increased by 18%. From Figure 1, a 2.3 foldincrease in the solid-like behavior (G′) of the batter (22.4 Pa for control up to 50.7 Pa for 25% rice flour)was higher than the 1.3 fold increase of the liquid-like behavior (G”) (17.6 Pa for control and up to22.1 Pa for 25% rice flour) (Figure 1). Adequate viscosity is a factor contributing to the containmentof the bubbles. Structural visualization studies are needed to identify the distribution of the starch(specifically the separation of small and large starch granules), proteins, and fat, as well as the size ofthe bubbles in the batter. Hesso et al. (2015) reported that air incorporation increased with an increasein batter viscosity [17]. It is also postulated that the rice starch might align in the interphase of oil inthe batter [23]. The results are in overall support of the increase in consistency of the full formulabatter described in Section 3.1, as it decreased the flow rate after rice addition. In agreement to thisstudy, a report of rice-based gluten-free batter for muffins with different levels of cowpea proteinisolates found that the elastic behavior increased more than the viscous behavior [25]. In our study,enhanced viscoelasticity of the RKB gluten-free batter with increased levels of rice flour suggested theformation of composite matrix structures with enhanced water-binding capacity, as mentioned earlier(Section 3.1). We speculated that a decrease in free water availability for other ingredients, mainlyprotein and fiber that form more disorganized structures, would result in a more organized matrix.The levels of rice flour in the RKB batter system improved the gel rigidity and the network of RKBbatter [7]. In addition, the results showed a solid-like behavior (G′) for the batter; when the rice flourcontent varied from 5% to 15%, the rice flour showed a similar behavior.
Figure 2 depicted the log–log plots of G′ and G” that were used to evaluate if the elastic andstorage moduli followed a power law relationship in the RKB batter samples, with different rice flourlevels. If the response was linear, then the relationship followed a power law, suggesting that a constantincrease of G′ led to a constant increase in G”. The same plot, known as the Han plot, was used todetermine the compatibility of polymer blends [34,35]. Overall, the separation of the curve containing25% rice flour from the control RKB flour was observed as a shift to higher elasticity (G’), comparedto the control (p = 0.05) (Figure 2). The tracings of 0% to 15% rice converged, suggesting that theyare compatible. At the terminal area, all the curves merge (0% to 25% rice flour), suggesting that at ahigher frequency, the lines would have similar correlation. [35]. The 25% rice flour curve separatesby shifting to a rise in elasticity compared from the other rice levels, suggesting the formation of
69

Foods 2020, 9, 616
more heterogeneous structures compared to the other samples, through the polymers present in theflours [36,37]. The increased values for G′ with G′ in 25% rice flour compared to other levels mightbe a contribution of the multiple structures, where less protein and fiber from the RKB flour andoverall more starch from the rice flour formed a new continuous network with a higher organization(lower enthalpy), as compared to the control RKB flour and other rice levels. Our previous studyof RKB batter with different heat-moisture treatments showed that the high temperature altered theviscoelastic properties of the RKB batter; however, their structures were homogenous [15]. Thus,Figure 2 confirmed the heterogeneous nature of the RKB batter containing rice flour.
Figure 1. Moduli (G′ and G”) as a function of frequency of red kidney bean gluten-free batter withdifferent rice flour levels.
Figure 2. Log–log plot of G′ as a function of G” of red kidney bean gluten-free batter with different riceflour levels.
3.2.2. Temperature Ramp Test of Batter
The viscoelastic properties of the RKB batter with and without rice during heating from 25 ◦Cto 90 ◦C with constant values of frequency and strain indicated that the complex shear modulus (G*)increased as the tan δ decreased (Figure 3). The almost linear response of the complex shear moduluschanged to an upward curve after the gelation onset, indicating an increase in gel rigidity duringheating, which reached up to a 94% increase (at 90 ◦C) with 25% rice flour, compared to the starting
70

Foods 2020, 9, 616
temperature of 25 ◦C. RKB batter with different rice flour levels showed overall similar rising gelrigidity (G*) trends after 50 ◦C (Figure 3) suggesting similar viscoelastic patterns, during gelatinization.
Figure 3. Complex modulus G* (left axis) and tan (δ) (right axis) as a function of the temperature of thered kidney bean gluten-free batter with different rice flour levels. Filled symbols, complex modulus G*;and open symbols tan δ.
The tracing curves of tan δ showed two (rice flour additions) and three (RKB flour) clear inflectionpoints, suggesting different changes of structures (phase transitions) as a function of increasingtemperature (Figure 3). Rice flour at 25% had a significantly (p = 0.05) lower tan δ at the initialstages of heating before the gelation onset, compared to the rest of the samples, suggesting a highersolid-like character (G′) in this sample. That higher solid-like behavior was conserved up to around50 ◦C, where the decrease of tan δ accelerated, suggesting a rapid increase in solid-like behavior.This was attributed to the starch and protein hydration, resulting in gel rigidity onset. Tan δ curvescrossed-over the G* curves at around 60 ◦C (rice flour additions) and 65 ◦C (RKB flour control),suggesting more rapid changes occurring in the structures. Most likely these changes were relatedto the denaturation of proteins and the rapid starch granule swelling at those temperatures [29,30].The predominant formation of hydrogen bonds with water and additional hydrophobic interactionsfrom protein aggregation and starch swelling account for the increase G* and decrease tan δ (Figure 3),in the continuous phase of the batter.
Activation energy (Ea) was used as an indication of the energy used for the critical gel rigidityduring gelatinization, while the inflection temperature (T0) was used for the point at which the batterviscoelasticity increased at the initial stage of gel point. T0 is normally associated with batter densityand level of gelatinization [14]. Initiation of gelatinization in all RKB batter samples was in the rangeof 56 to 63 ◦C (Table 1). These observations agreed with literature reports where onset temperaturevariation during starch gelatinization from four kidney bean cultivars was in the range of 61.4–66.9 ◦C,while the onset temperature for rice starch gelatinization was 61 ◦C, measured by differential scanningcalorimetry (DSC) [38,39]. Reported gelatinization range (70 to 85 ◦C) for basmati rice starch measuredby an increase in G′ was higher than the values of our study [39]. Increase in rice flour contentdecreased the RKB batter inflection gelation temperature (T0) from 63 to 56 ◦C, with no significant(p = 0.05) change in the activation energy (Ea). Significant difference (p = 0.05) in activation energywas observed only between the control RKB flour and 25% rice addition, where a 44% increase wasneeded to reach the critical gel rigidity (Table 1). Activation energy is related to phase transitionsduring gelatinization of starch, glass transition of starch granules in the amorphous region, and meltingtransition in the crystalline region [39]. Thus, the addition of rice flour induced gelation at lower
71

Foods 2020, 9, 616
temperatures and the process required a higher activation energy, only when rice flour was addedat 25% (p < 0.05). This could be partially explained by the smaller starch granule size of rice flour(3–8 μm), compared to the kidney bean starch (16–60 μm), increase in overall starch content in thesystem, and RKB flour protein reduction [32,33]. Literature reports for rice and kidney bean flourgelatinization enthalpy, individually, are in a similar range 7.5–15.6 J/g for rice flour and 10.8–15.4 J/gfor kidney bean flour, respectively [40,41]. Activation energy (Ea) from this non-isothermal heating ofsmall amplitude oscillatory shear test could be useful to indicate the changes during gelatinization.
3.3. Effect of Rice Flour Addition on Red Kidney Bean Cupcake Firmness
Cupcake texture estimated by firmness is one of the most important parameters for consumeracceptance. As the level of rice flour increased, the RKB cupcakes firmness decreased, reaching a 45.5%reduction with 25% rice flour, compared to the control (Table 1). These observations agreed with areduced (50% lower) firmness of a rice-based, gluten-free muffin, compared to muffins containingwhite cowpea protein isolate at 12% level [10]. A decrease in cupcake firmness might be attributed tothe factors discussed earlier including the smaller starch granule size of rice, compared to RKB anddifferent molecular organization of rice, lowering the overall protein content in cupcakes, combinedwith a redistribution of water availability in the gluten-free cupcake. Water absorption and proteincontent were 2.1 and 2.8 times higher in RKB flour, compared to rice flour (2.6 and 1.23 g/g and 20.5%and 7.4%, for RKB and rice flour, respectively) [15,40]. The incorporation of rice flour changed thestructural order of the batter by diluting the proteins and lowering the firmness of gluten-free RKB ricecupcake. Amylose content in rice (average 25%) is lower than kidney bean flour (34% to 41%) andwould result in less retrogradation after baking [33,40]. Thus, diluting the amylose content of kidneybean flour by rice flour addition reduced gluten-free cupcake hardness. Previous studies showed thatan increase in batter viscosity allowed gas entrapped within the batter structure. This resulted in highercake volume, crumb with increased airy structure, thinner walls, and thus lower firmness [42,43].
3.4. Effect of Rice Flour Addition on Red Kidney Bean Cupcake Sensory Properties
Rice flour impacted the organoleptic properties of red kidney bean cupcake, with higher sensoryscores observed with the samples containing rice flour. The red-kidney-bean–rice cupcakes werescored from ‘like slightly’ to ‘like moderately’ (Table 2). There was no change in the sensory scoresat the 5% rice flour level. Scores for flavor and taste attributes of the red-kidney-bean–rice cupcakeswere higher when rice flour was added at 10%. All attributes had a highest score with 25% rice flour.It was interesting to note that the sensory panelists did not observe changes in texture until 25% riceflour level, when they scored the cupcakes higher, while the overall quality score was improved at15% rice flour. The nutritional value of the RKB cupcakes of 100 g serving size included 404 Kcal, 18 gtotal fat, of which 4 g were saturated fat, 104 mg cholesterol, 187 mg sodium, 48 g total carbohydrates,9 g dietary fiber, 27 g sugar, and 14 g of protein. No significant differences in nutritional value wereobserved with addition of rice flour at up to 25%.
Table 2. Sensory properties for red-kidney-bean–rice cupcakes a,b.
Rice Flour Level (%) b Flavor Taste Texture Overall Quality
0 6.1 ± 0.1 b 6.2 ± 0.2 b 6.2 ± 0.5 b 6.1 ± 0.1 b
5 6.2 ± 0.2 b 6.3 ± 0.1 b 6.1 ± 0.2 b 6.0 ± 0.2 b
10 7.1 ± 0.3 a 7.2 ± 0.2 a 6.2 ± 0.1 b 6.1 ± 0.1 b
15 7.3 ± 0.4 a 7.1 ± 0.0 a 6.1 ± 0.2 b 7.1 ± 0.1 a
25 7.1 ± 0.3 a 7.1 ± 0.2 a 7.1 ± 0.1 a 7.2 ± 0.2 a
a Mean values (n = 20 ± SD) followed by a different letter within a column are significantly different, Duncan test(p < 0.05). Evaluated by a 9-point hedonic scale ranging from ‘dislike extremely’ (1) to ‘like extremely’ (9). b Riceflour level addition to red kidney bean flour.
72

Foods 2020, 9, 616
3.5. Variation of Red Kidney Bean Batter and Cupcake Properties with Rice Flour Addition
Total explained variance from all variables was 92.4% (Figure 4). Principal component 1 (PC1)had the majority of explained variance (80.3%), while the contribution of principal component 2 (PC2)was only 12.1% (Figure 4). The main contributors of PC1 (first coordinate axis) were batter complexshear modulus, activation energy of gelatinization, and tan δ. The main contributor to PC2 was thesample with 10% rice addition—situated almost at the top, at 90 degrees, at the center of the graph.However, only one parameter (G” viscous behavior) moved slightly to the horizontal PC2, meaning ithad some variations explained by it. The fact that 10% rice addition was almost in a direction oppositeto the viscous behavior also suggest that it was inversely correlated to 10% rice addition. However, asthe contribution to the variance was low—only 12.1%—compared to 80.3% contribution to the varianceof PC1, it was better to highlight the contributions of PC1. Notice how all parameters were alongPC1. The vectors aligned in opposite direction revealed negative correlation, while the vectors in thesame direction were positively correlated. The results from the loading plot (Figure 4) revealed thatcupcake firmness was positively correlated with batter consistency, tan δ (TanDelta in the graph) andinflection temperature (T0) of gelation, and the treatments associated with those parameters were 0%and 5% rice levels. Complex modulus G*, solid (G′) and viscous (G”) moduli were positively correlatedwith the activation energy (Ea) of gelatinization and the highest rice flour level (25%), which was thefarthest away from the center of the graph. Rice flour addition to RKB flour was negatively correlatedto cupcake firmness. These results confirmed that the most variation was observed at the highest ricelevel (25%). This study also revealed that the gelation of the batter and its consistency were goodindicators of quality control for gluten-free RKB–rice flour cupcakes.
Figure 4. Redundancy analysis of red kidney bean gluten-free batter with and without rice flour with 8indicators of the viscoelastic properties of gluten (definitions in Table 1), showing the effect of five riceflour levels (0%, 5%, 10%, 15%, and 25%). Symbols: 0%—circle, 5%—diamond, 10%—star, 15%—uptriangle, and 25%—square.
73

Foods 2020, 9, 616
4. Conclusions
The level of rice flour addition improved the viscoelastic properties of gluten-free RKB batter andcupcake softness. With 25% of rice flour addition in gluten-free RKB flour, the system increased thebatter’s solid-like and viscous behavior, batter consistency, inflection of gelatinization and temperature,and produced a softer cupcake texture. The RKB batter with rice followed a power law and had aheterogeneous structure based on the log–log plot of G′ vs G”. In addition, the activation energy ofgelatinization increased with 25% rice incorporation. This study described an improvement of theRKB batter and cupcake macro-structural characteristics with addition of rice.
Author Contributions: P.C. designed experiments and wrote original draft preparation. N.K. performed researchwork. Z.J.H.E. developed sample preparation, data analysis and revised manuscript. P.R.-D. acquired funding,supervised the research work, discussed the data, reviewed and edited manuscript. All authors have read andagreed to the published version of the manuscript.
Funding: This research was funded by the Agricultural Research Development Agency (ARDA, PublicOrganization), Thailand, Oklahoma State University, and the U.S. Department of Agriculture–National Institute ofFood and Agriculture (USDA–NIFA).
Conflicts of Interest: The authors declare no conflict of interest.
References
1. Wani, I.A.; Sogi, D.S.; Wani, A.A.; Gill, B.S. Physico-chemical and functional properties of flours from Indiankidney bean (Phaseolus vulgaris L.) cultivars. LWT Food Sci. Technol. 2013, 53, 278–284. [CrossRef]
2. Mishra, P.K.; Tripathi, J.; Gupta, S.; Variyar, P.S. Effect of cooking on aroma profile of red kidney beans(Phaseolus vulgaris) and correlation with sensory quality. Food Chem. 2017, 215, 401–409. [CrossRef][PubMed]
3. Jnawali, P.; Kumar, V.; Tanwar, B. Celiac disease: Overview and considerations for development of gluten-freefoods. Food Sci. Hum. Wellness 2016, 5, 169–176. [CrossRef]
4. Vici, G.; Belli, L.; Biondi, M.; Polzonetti, V. Gluten free diet and nutrient deficiencies: A review. Clin. Nutr.2016, 35, 1236–1241. [CrossRef]
5. Cornejo, F.; Caceres, P.J.; Martínez-Villaluenga, C.; Rosell, C.M.; Frias, J. Effects of germination on the nutritivevalue and bioactive compounds of brown rice breads. Food Chem. 2015, 173, 298–304. [CrossRef]
6. Capriles, V.D.; Arêas, J.A.G. Novel Approaches in Gluten-Free Breadmaking: Interface between Food Science,Nutrition, and Health. Compr. Rev. Food Sci. Food Saf. 2014, 13, 871–890. [CrossRef]
7. Matos, M.E.; Sanz, T.; Rosell, C.M. Establishing the function of proteins on the rheological and qualityproperties of rice based gluten free muffins. Food Hydrocoll. 2014, 35, 150–158. [CrossRef]
8. Torbica, A.; Hadnađev, M.; Dapcevic, T. Rheological, textural and sensory properties of gluten-free breadformulations based on rice and buckwheat flour. Food Hydrocoll. 2010, 24, 626–632. [CrossRef]
9. Shevkani, K.; Singh, N. Influence of kidney bean, field pea and amaranth protein isolates on the characteristicsof starch-based gluten-free muffins. Int. J. Food Sci. Technol. 2014, 49, 2237–2244. [CrossRef]
10. Shevkani, K.; Kaur, A.; Kumar, S.; Singh, N. Cowpea protein isolates: Functional properties and applicationin gluten-free rice muffins. LWT Food Sci. Technol. 2015, 63, 927–933. [CrossRef]
11. Fan, J.; Mitchell, J.R.; Blanshard, J.M.V. A model for the oven rise of dough during baking. J. Food Eng. 1999,41, 69–77. [CrossRef]
12. Zhang, J.; Datta, A.K. Mathematical modeling of bread baking process. J. Food Eng. 2006, 75, 78–89. [CrossRef]13. Narsimhan, G. A mechanistic model for baking of leavened aerated food. J. Food Eng. 2014, 143, 80–89.
[CrossRef]14. Alvarez, M.D.; Cuesta, F.J.; Herranz, B.; Canet, W. Rheometric Non-Isothermal Gelatinization Kinetics of
Chickpea Flour-Based Gluten-Free Muffin Batters with Added Biopolymers. Foods 2017, 6, 3. [CrossRef]15. Chompoorat, P.; Rayas-Duarte, P.; Hernández-Estrada, Z.J.; Phetcharat, C.; Khamsee, Y. Effect of heat
treatment on rheological properties of red kidney bean gluten free cake batter and its relationship withcupcake quality. J. Food Sci. Technol. 2018, 55, 4937–4944. [CrossRef]
16. USDA. Food Composition Brand Golden Tropics, Ltd. 2019. Available online: https://fdc.nal.usda.gov/fdc-app.html#/food-details/402558/nutrients (accessed on 5 January 2020).
74

Foods 2020, 9, 616
17. Hesso, N.; Garnier, C.; Loisel, C.; Chevallier, S.; Bouchet, B.; Le-Bail, A. Formulation effect study on batterand cake microstructure: Correlation with rheology and texture. Food Struct. 2015, 5, 31–41. [CrossRef]
18. Ahmed, J.; Ramaswamy, H.S.; Ayad, A.; Alli, I. Thermal and dynamic rheology of insoluble starch frombasmati rice. Food Hydrocoll. 2008, 22, 278–287. [CrossRef]
19. Yoon, W.; Gunasekaran, S.; Park, J. Characterization of thermorheological behavior of Alaska pollock andPacific whiting surimi. J. Food Sci. 2004, 69, 338–343. [CrossRef]
20. Leroy, V.; Pitura, K.M.; Scanlon, M.G.; Page, J.H. The complex shear modulus of dough over a wide frequencyrange. J. Non-Newton. Fluid Mech. 2010, 165, 475–478. [CrossRef]
21. Wang, H.; Liu, X.; Zhang, H.; Apostolidis, P.; Erkens, S.; Skarpas, A. Micromechanical modelling of complexshear modulus of crumb rubber modified bitumen. Mater. Des. 2020, 188, 108467. [CrossRef]
22. Meza, B.E.; Chesterton, A.K.; Verdini, R.A.; Rubiolo, A.C.; Sadd, P.A.; Moggridge, G.D.; Wilson, D.I.Rheological characterisation of cake batters generated by planetary mixing: Comparison between untreatedand heat-treated wheat flours. J. Food Eng. 2011, 104, 592–602. [CrossRef]
23. Falade, K.O.; Christopher, A.S. Physical, functional, pasting and thermal properties of flours and starches ofsix Nigerian rice cultivars. Food Hydrocoll. 2015, 44, 478–490. [CrossRef]
24. Chompoorat, P.; Phimphimol, J. Development of a Highly Nnutritional and Functional Gluten Free Cupcakewith Red Kidney Bean Flour for Older Adults. Food Appl. Biosci. J. 2019, 7, 16–26.
25. Kim, J.M.; Shin, M. Effects of particle size distributions of rice flour on the quality of gluten-free rice cupcakes.LWT Food Sci. Technol. 2014, 59, 526–532. [CrossRef]
26. Vandeputte, G.; Delcour, J. From sucrose to starch granule to starch physical behaviour: A focus on ricestarch. Carbohydr. Polym. 2004, 58, 245–266. [CrossRef]
27. Majzoobi, M.; Imani, B.; Sharifi, S.; Farahnaky, A. The effect of particle size and level of rice bran on the batterand sponge cake properties. J. Agr. Sci. Tech. 2013, 15, 1175–1184.
28. Mukprasirt, A.; Herald, T.; Flores, R. Rheological characterization of rice flour-based batters. J. Food Sci. 2000,65, 1194–1199. [CrossRef]
29. Horstmann, S.W.; Belz, M.C.; Heitmann, M.; Zannini, E.; Arendt, E.K. Fundamental study on the impact ofgluten-free starches on the quality of gluten-free model breads. Foods 2016, 5, 30. [CrossRef]
30. Donovan, J.W. A study of the baking process by differential scanning calorimetry. J. Sci. Food Agric. 1977, 28,571–578. [CrossRef]
31. Sasaki, T.; Matsuki, J. Effect of wheat starch structure on swelling power. Cereal Chem. 1998, 75, 525–529.[CrossRef]
32. Hoover, R.; Hughes, T.; Chung, H.; Liu, Q. Composition, molecular structure, properties, and modification ofpulse starches: A review. Food Res. Int. 2010, 43, 399–413. [CrossRef]
33. Zhou, Z.; Robards, K.; Helliwell, S.; Blanchard, C. Composition and functional properties of rice. Int. J. FoodSci. Technol. 2002, 37, 849–868. [CrossRef]
34. Walha, F.; Lamnawar, K.; Maazouz, A.; Jaziri, M. Rheological, morphological and mechanical studies ofsustainably sourced polymer blends based on poly (lactic acid) and polyamide 11. Polymers 2016, 8, 61.[CrossRef]
35. Han, C.D.; Kim, J. Rheological technique for determining the order–disorder transition of block copolymers.J. Polym. Sci. Pol. Phys. 1987, 25, 1741–1764. [CrossRef]
36. Ahmed, J.; Almusallam, A.S.; Al-Salman, F.; AbdulRahman, M.H.; Al-Salem, E. Rheological propertiesof water insoluble date fiber incorporated wheat flour dough. LWT Food Sci. Technol. 2013, 51, 409–416.[CrossRef]
37. Ahmed, J.; Auras, R.; Kijchavengkul, T.; Varshney, S.K. Rheological, thermal and structural behavior of poly(ε-caprolactone) and nanoclay blended films. J. Food Eng. 2012, 111, 580–589. [CrossRef]
38. Hager, A.S.; Arendt, E.K. Influence of hydroxypropylmethylcellulose (HPMC), xanthan gum and theircombination on loaf specific volume, crumb hardness and crumb grain characteristics of gluten-free breadsbased on rice, maize, teff and buckwheat. Food Hydrocoll. 2013, 32, 195–203. [CrossRef]
39. Rangelov, A.; Arnaudov, L.; Stoyanov, S.; Spassov, T. Gelatinization of industrial starches studied by DSCand TG. Bulg. Chem. Commun. 2017, 49, 422–429.
40. Fujita, S.; Fujiyama, G. The Study of Melting Temperature and Enthalpy of Starch from Rice, Barley, Wheat,Foxtail and Proso millets. Starch Stärke 1993, 45, 436–441. [CrossRef]
75

Foods 2020, 9, 616
41. Feizollahi, E.; Mirmoghtadaie, L.; Mohammadifar, M.A.; Jazaeri, S.; Hadaegh, H.; Nazari, B.; Lalegani, S.Sensory, digestion, and texture quality of commercial gluten-free bread: Impact of broken rice flour type.J. Texture Stud. 2018, 49, 395–403. [CrossRef]
42. Shelke, K.; Faubion, J.M.; Hoseney, R.C. The dynamics of cake baking as studied by a combination ofviscometry and electrical resistance oven heating. Cereal Chem. 1990, 67, 575–580.
43. Wilderjans, E.; Pareyt, B.; Goesaert, H.; Brijs, K.; Delcour, J.A. The role of gluten in a pound cake system: Amodel approach based on gluten–starch blends. Food Chem. 2008, 110, 909–915. [CrossRef]
© 2020 by the authors. Licensee MDPI, Basel, Switzerland. This article is an open accessarticle distributed under the terms and conditions of the Creative Commons Attribution(CC BY) license (http://creativecommons.org/licenses/by/4.0/).
76

foods
Article
Bioactive Compounds, Antioxidant Activity, andSensory Analysis of Rice-Based Extruded Snacks-LikeFortified with Bean and Carob Fruit Flours
Claudia Arribas 1, Blanca Cabellos 1, Carmen Cuadrado 1, Eva Guillamón 2 and
Mercedes M. Pedrosa 1,*
1 Food Technology Department, SGIT-INIA, Ctra de La Coruña, Km 7.5., 28040 Madrid, Spain2 Centre for the Food Quality, INIA, C/Universidad s/n, 42004 Soria, Spain* Correspondence: [email protected]
Received: 3 July 2019; Accepted: 27 August 2019; Published: 2 September 2019
Abstract: Generally, extruded gluten-free foods are mostly phytochemically deficient. In this studyinositol phosphates, α-galactosides, lectins, protease inhibitors, and phenols, their antioxidantactivity and sensorial analysis of some rice/bean/whole carob fruit flour blends were determinedin unprocessed (controls) and extruded formulations. The fortification of rice-based extrudateswith both legumes has a positive influence on both their bioactive compound content and theiracceptability by consumers. The extruded formulations contained around twice as much (p < 0.05)total α-galactosides than their unprocessed counterparts. Extrusion significantly reduced the phyticacid content (10%) and significantly increased the less phosphorylated forms (16%–70%). Afterextrusion, the lectins and protease inhibitors were eliminated. The different phenolic compoundsmostly increased (11%–36%), notably in the formulations with carob fruit. The antioxidant activityand the different groups of phenols showed a positive correlation in the extrudates. All theexperimental extrudates had higher amounts of bioactive compounds than the commercial extrudedrice. Considering the amount of phytochemicals determined in the novel gluten-free extrudates andthe scores of sensorial analysis, formulations containing 20%–40% bean and 5% carob fruit could beadequate in promoting health-related functions, helping to increase pulse consumption, and allowingthe food industry to satisfy consumers’ requirement for functional foods.
Keywords: legumes enrichment; galactosides; phytate; protease inhibitors; phenols
1. Introduction
Nowadays, consumers demand ‘free-from’ foods to improve their health and wellbeing. Amongthe free-from foods, gluten-free (GF) products have become very popular, mainly because consumersperceive these GF foods as healthier than the corresponding gluten-containing counterparts. However,it has been reported that a GF diet might not be recommended for the general population due to thenutritional deficiencies associated with GF diets [1].
There are different, naturally whole GF grains that have shown to contain good nutritional qualityand good bioactive compound content, which are intrinsically related to healthy benefits. Dehuskedrice (Oryza sativa L.) is reckoned as the most appropriate ingredient for the formulation of a wide varietyof GF foods, such as breakfast cereals, cereal-based snacks, or dietetic foods. However, although wholerice can supply many bioactive compounds, after dehusking and polishing, the obtained white riceloses many phytochemicals, such as phytate, polyphenols, and protease inhibitors [2]. Beans, like otherpulses, are well-known sources of phytochemicals (e.g., α-galactosides, phytates, protease inhibitors,phenols, or lectins), which are traditionally considered as antinutritional factors since they can reducethe digestion/absorption of some nutritive compounds or cause intestinal discomfort. Nevertheless,
Foods 2019, 8, 381; doi:10.3390/foods8090381 www.mdpi.com/journal/foods77

Foods 2019, 8, 381
nowadays, some of these compounds are recognised as bioactive compounds that provide beneficialhealth effects (prebiotic, anti-tumour, or anti-inflammatory effects), playing a pivotal role in reducingthe risk or the prevention of heart diseases, some cancers, obesity, type 2 diabetes, and Parkinson’sdisease [3–6]. However, their antinutrient or pro-nutrient effect has been related to the amount presentin foods, as well as to interactions with other compounds present in the diet [4,5]. The fruits of thecarob tree (Ceratonia siliqua L.), an underutilised leguminous tree from the Mediterranean region, havebeen traditionally exploited as a feed ingredient. The carob seeds are mostly utilised for the productionof locus bean gum or carob bean gum (E-410), which is of great importance for the food industry asa stabiliser or thickener. The seedless pods (named kibble) have mainly been utilised for feed andas a cocoa substitute in cakes, breads, confectionery, or drinks because of its high content of dietaryfibre and soluble sugars [7]. Furthermore, carob fruits contain a range of phytochemicals, mainlypolyphenols and dietary fibre, as well as low amounts of α-galactosides and inositol phosphates [7,8].
Recent evidence suggests that a GF diet reduced beneficial gut bacteria as a result of the reducedintake of oligosaccharides from wheat (such as oligofructose and inulin) with a prebiotic action [1],therefore, the use of legumes, such as bean and carob fruit, would be of great interest as functionalingredients to formulate pro-health or functional foods, providing bioactive compounds to white-ricebased products, and increasing the protein and dietary fibre content in these foods [2]. Moreover,the new food products fortified with legumes would lead to increasing pulse consumption and promotea healthy Mediterranean diet.
Extrusion is a versatile technique used by the industry that enables the formulation of differenttypes of ready-to-eat products such as snacks and breakfast cereals with a high rate of consumption,mainly by young people. They are mainly based in rice or corn flours and/or starches and tend tohave low nutritional quality and high calorie content [9,10]. A recommended solution to enhance theirnutritional quality is the enrichment of rice flour with legume flours [2]. Different pulses (beans, peas,lentils, chickpeas, soy, etc.) have been treated by extrusion/cooking, though they are generally blendedwith rice or corn starch to develop good expanded products [11–14]. It has been reported that extrusionis an efficient process to modify the content of some phytochemicals, although with ambivalent results,since the extrusion conditions as well as the raw materials used can increase or reduce the amountof these compounds [3,11,13,15,16], therefore, it is necessary to determine these changes to obtainmaximum health benefits in novel extrudates.
Although Ravindran, et al. [17] described the use of carob bean gum to enhance the characteristicsof extruded rice-pea formulas, to the best of our knowledge, there is little information [3,10] aboutthe utilisation of carob fruit flours in the preparation of extruded foods. Furthermore, according tothe literature consulted, there is no information on the bioactive compound composition of novel GFextrudates based on the linked use of rice, whole carob fruit, and bean flours.
Therefore, the main aim of this research was to study the extrusion effect on some phytochemicalscontent (α-galactosides, inositol phosphates, lectins, protease inhibitors, and phenolic compounds),as well as the antioxidant activity of various rice-based blends enriched with bean and whole carobfruit flours. The data obtained from the extrudates was compared with their unprocessed equivalents(controls) and with a commercial extruded rice. The results will update the knowledge related to thepresence of bioactive compounds in innovative GF products made from legume formulations.
2. Materials and Methods
2.1. Raw Materials and Formulated Flours
The ingredients used for the formulation of the extrudates were white rice (O. sativa var.Montsianell), bean (Phaseolus vulgaris var. Almonga), and whole carob fruit (Ceratonia siliqua var Negretaand Roja). The ingredients were obtained from Cámara Arrocera de Amposta (Tarragona, Spain), a localfarmer (Benjamín Rodríguez Álvarez, León, Spain), and Armengol Hermanos (Tarragona, Spain),respectively. The seeds and fruits were powdered using a Retsch SK1 mill (Haan, Germany) fitted
78

Foods 2019, 8, 381
with a 1 mm sieve. Different percentages of rice (50%–80%), bean (20% or 40%), and whole carobfruit (5% or 10%) flours were mixed to produce six formulations coded as 20.0, 20.5, 20.10, 40.0, 40.5,and 40.10. The codes used correspond to the following: The first number corresponds to the beanpercentage and the second one to the carob fruit percentage included in the blends. The results fromthe extrudates were compared to an extruded rice sample (100%) obtained in the market.
2.2. Extrusion Process
A Clextral EVOLUM 25 twin-screw extruder (Clextral, Firminy, France) from CARTIF (Valladolid,Spain) was utilised. The extruder was equipped with a 25 mm screw diameter and a 600 mm barrellength. The mixtures were added to the extruder at a rate of 25 kg/h. The last barrel temperature was 125◦C. The screw speed was 900 rpm for 20% bean formulations and 950 rpm for 40% bean formulations.The rate of water addition was 2.5, 3.0, and 3.2 kg/h for samples without carob fruit flour, with 5%carob fruit flour, and with 10% carob fruit flour, respectively. The extrudates were reduced to flourusing a Tecator mill (Cyclotec 1093, Höganäs, Sweden) equipped with a 1 mm screen and stored atroom temperature in polyethylene bags until the analysis was performed.
2.3. Analysis of Bioactive Compounds
The analysis of raw materials, unprocessed mixtures (as controls), and extruded samples, as wellas the commercial extruded sample was performed.
2.3.1. Soluble Sugars and α-Galactosides
Sugars were extracted and then analysed with a HPLC system coupled to a refractive indexdetector (Beckman System Gold Instrument, Los Angeles, CA, USA) following the method describedby Pedrosa, et al. [18]. A total of 20 μL of each sample was injected in a spherisorb-5-NH2 column(250 × 4.6 mm i.d., Waters, Milford, MA, USA) equilibrated with acetonitrile/water (60:40, v/v)at a flow rate of 1 mL/min. Each individual sugar was identified and quantified by using thecorresponding calibration curves from external standards (Sigma, St. Louis, MO, USA). Ciceritolwas obtained from Dr. A. I. Piotrowicz-Cieslak (Olsztyn-Kortowo, Poland). A linear response wasobserved in the range (0–4 mg/mL), with a correlation coefficient of 0.99. The curves obtained were:Sucrose (y = 0.193x − 0.001), galactinol (y = 0.227x − 0.014), raffinose (y = 0.193x + 0.003), ciceritol(y = 0.295x + 0.030), and stachyose (y = 0.217x − 0.008). Original HPLC chromatograms of sugars andgalactosides of all the analysed samples are presented in supplementary Figure S3.
2.3.2. Inositol Phosphates
Individual inositol phosphates (IP3–IP6) were extracted and determined by HPLC and refractiveindex detection according to Burbano, et al. [19]. A total of 10 μL of Aliquots were injected on a PRP-1column (150 × 4.1 mm i.d., 5 μm, Hamilton, Reno, Nevada, USA), and was maintained at 45 ◦C.The mobile phase was a mixture of methanol/water (52/48, v/v) with 0.8% of tetrabutyl ammoniumhydroxide (40% in water, Sigma, St. Louis, MO, USA), 0.05% of 91% formic acid (Sigma, St. Louis,MO, USA), 100 μL of a phytic acid hydrolysate (6 mg/mL), and the pH was adjusted to 4.3 with 5 M ofsulphuric acid. The flow rate was 1 mL/min. The quantification was developed by using a calibrationcurve obtained from sodium phytate (0–5 mg/g, y = 0.144x + 0.016, R2 = 0.99) (Sigma, St. Louis,MO, USA). Original HPLC chromatograms of IP3-IP6 of all the analysed samples are presented insupplementary Figure S4.
2.3.3. Protease Inhibitors
The trypsin inhibitors (TI) and chymotrypsin inhibitors (CI) were obtained following the methoddescribed by Pedrosa, et al. [20]. The trypsin inhibitor units (TIU) per mg of flour were determinedas described by Welham and Domoney [21]. One TIU was defined as that which gave a reduction in
79

Foods 2019, 8, 381
absorbance units measured at 410 nm of 0.01 relative to the trypsin control reaction in a 10 mL assayvolume. Chymotrypsin inhibitor units (CIU) per mg of flour were determined according to Sathe andSalunkhe [22]. One CIU was defined as an increase of 0.01 absorbance units at 256 nm of the reactionmixture relative to the chymotrypsin control reaction.
2.3.4. Lectins
The lectin content in the raw materials was determined using a haemagglutination assaywith trypsin-treated rat blood cells (Wistar rats, Animal-housing unit of Complutense University,Madrid, Spain). To quantify the P. vulgaris lectin (PHA) in raw bean- and bean-containing formulations,a competitive indirect ELISA assay was carried out according to Pedrosa, Cuadrado, Burbano, Muzquiz,Cabellos, Olmedilla-Alonso, and Asensio-Vegas [20]. One haemagglutination unit (HU) was definedas the amount of material (mg) causing 50% agglutinated erythrocytes. The values were expressed asHU/kg flour for the haemagglutination assay, and as a % PHA for the ELISA assay. In each ELISA assay,two bean cultivars (Procesor and Pinto) were included as positive and negative controls, respectively.The calibration curve of a standard PHA (0–500 ng/mL) used for quantification of bean lectins wasy = −0.4311Ln(x) + 2.711 (R2 = 0.98).
2.3.5. Phenolic Compounds
Phenolic compounds were extracted twice using a mixture of methanol-HCl (1000/1)/water(80:20, v/v) at room temperature for 16 h [23]. A total of 1 mL of the combined extracts was mixedwith 1.5 mL of a solution of 2% HCl in ethanol/water (80/20, v/v). These solutions were utilised for thequantification of anthocyanins, flavonoles, tartaric esters, and total phenols by a spectrophotometricmethod (Beckman DU-640, Los Angeles, CA, USA) that monitored the absorbance at 520, 360,320, and 280 nm, respectively [24]. The extracts were also utilised for the determination of theantioxidant activity by using the ORAC method [25]. Calibration curves obtained from commercialcyanidin-3-glucoside (C3Glc) (0–20 μg/mL; y = 0.060x + 0.060; R2 = 0.99) (Extrasynthèse, Germay,France), quercetin (Q) (0–80 μg/mL; y = 0.059x + 0.083; R2 = 0.99), caffeic acid (CA) (0–30 μg/mLy = 0.095x + 0.009; R2 = 0.99), and catechin (C) (0–200 μg/mL y = 0.012x + 0.005; R2 = 0.99) (Aldrich,Munich, Germany) were utilised to quantify anthocyanins, flavonols, tartaric esters, and total phenols,respectively, according to Oomah, et al. [24].
2.4. Sensory Evaluation
The 6 extrudates (Ex-20.0, Ex-20.5, Ex-20.10, Ex-40.0, Ex-40.5, and Ex-40.10) were evaluated by10 semi-trained panellists. Samples were codified with random numbers, placed in small plastic boxes,and given to the panellists. They were instructed to cleanse their mouth with water between eachsample evaluated and they were provided with written instructions. Extrudates were evaluated forcolour, odour (intensity, roasted, cooked pulse, nuts, unpleasant odours), flavour (intensity, salty, pulses,unpleasant flavours), texture (crunchiness, hardness, adhesivity, fracture, chewiness), and overallquality, according to a nine-point scale where 9 = extremely like or high intensity and 1 = extremelydislike or low intensity).
2.5. Statistical Analysis
A representative and homogeneous amount (25 kg) of each formulation was split into in two partsand then extruded. The chemical analyses of raw materials, unprocessed, and extruded samples andthe commercial sample were carried out in quadruplicate. Data are reported as mean ± standard error.A prior analysis of the normality and homogeneity of variance of all variables was performed usingShapiro–Wilks and Levenes’s test, respectively. One-way ANOVA and a Duncan’s multiple range testwere used to analyse data at the 95% confidence level (p< 0.05). Pearson’s correlation coefficients betweenthe different bioactive compounds and the ORAC values were determined. Moreover, a principalcomponent analysis (PCA) of the standardised data of the measured variables was performed to ensure
80

Foods 2019, 8, 381
their reliability and to obtain meaningful interpretations of the results (Supplementary Materials). Allthe statistical analyses were developed using Statgraphics Centurion XVII.II software (GraphicsSoftware System, Rockville, MD, USA).
3. Results and Discussion
3.1. Effect of Bean and Whole Carob Flour Fortification on the Content of Some Bioactive Compounds ofRice-Based Unprocessed Formulations
As observed in Tables 1–4, raw bean flour showed the highest content of α-galactosides(raffinose and stachyose), inositol phosphates (IP3–IP6), and protease inhibitors. Raw carob fruit flourcontained the lowest amount of total inositol phosphates but also the highest sucrose, total phenols,and antioxidant activity. Regarding the haemagglutination activity measured using trypsin-treated ratblood cells (data not shown), raw bean flour showed the highest lectin content (10 HU/kg), followed bycarob fruit (0.32 HU/kg), and rice (0.16 HU/kg). Moreover, raw rice contained low amounts of sucroseand TI. The bioactive compound content established in the raw materials was close to that reported inthe literature [3,4,25,26].
Table 1. Effect of extrusion treatment on the soluble sugars, ciceritol, and α-galactosides (mg/g dry weight)content of raw materials, the non-extruded (NE-) and the extruded (Ex-) flour formulations, and thecommercial sample.
Sample Sucrose Galactinol Raffinose Ciceritol StachyoseTotal
α-Galactosides
Bean 30.00 ± 0.95 e,f,g 2.29 ± 0.05 a,b 5.92 ± 0.09 c 0.34 ± 0.01 a 26.85 ± 0.25 g 32.77± 0.25 g
Carob fruit 150.46 ± 10.04 h n.d. * 5.84 ± 0.02 c n.d. n.d. 5.84 ± 0.02 a
Rice 2.98 ± 0.15 a n.d. n.d. n.d. n.d. n.d.NE-20.0 ** 8.65 ± 0.15 a,b,A 2.53 ± 0.10 a,b,c,A 2.84 ± 0.13 a,A 0.78 ± 0.04 b,A 8.55 ± 0.40 a,A 11.39 ± 0.55 b,A
NE-20.5 16.85 ± 0.29 c,d,A 2.97 ± 0.06 b,c,d,e,A 3.08 ± 0.03 a,A 0.90 ± 0.02 b,c,A 7.59 ± 0.17 a,A 10.67 ± 0.15 b,A
NE-20.10 29.91 ± 0.96 g,h,A 3.30 ± 0.07 c,d,e,A 3.14 ± 0.04 a,A 0.94 ± 0.03 b,c,d,A 8.61 ± 0.40 a,A 11.76 ± 0.45 b,A
NE-40.0 12.44 ± 0.15 c,A 3.58 ± 0.03 d,e,A 3.87 ± 0.04 b,A 1.14 ± 0.05 c,d,e,A 11.82 ± 0.23 c,A 15.69 ± 0.25 c,A
NE-40.5 22.83 ± 0.73 d,e,f,A 3.11 ± 0.13 b,c,d,e,A 3.97 ± 0.08 b,A 1.19 ± 0.05 d,e,A 13.37 ± 0.40 d,A 17.34 ± 0.49 d,A
NE-40.10 30.06 ± 0.41 h,A 1.87 ± 0.09 a,A 3.89 ± 0.09 b,A 1.25 ± 0.04 e,A 12.37 ± 0.28 c,d,A 16.26 ± 0.48 c,d,A
Ex-20.0 10.27 ± 0.08 a,b,A 2.84 ± 0.11 b,c,d,A 9.46 ± 0.35 e,B 5.44 ± 0.07 f,B 10.30 ± 0.43 b,B 19.76 ± 0.78 e,B
Ex-20.5 22.10 ± 0.19 d,e,B 10.27 ± 0.34 h,B 7.60 ± 0.27 d,B 5.64 ± 0.15 f,B 11.51 ± 0.50 c,B 19.10 ± 0.81 e,B
Ex-20.10 34.62 ± 0.10 e,f,g,A 9.71 ± 0.44 h,B 8.12 ± 0.26 d,B 5.42 ± 0.07 f,B 13.36 ± 0.07 d,B 21.48 ± 0.33 f,B
Ex-40.0 17.84 ± 0.16 c,d,A 3.81 ± 0.10 e,A 12.21 ± 0.24 f,B 8.92 ± 0.07 h,B 20.91 ± 0.13 e,B 33.13 ± 0.50 g,h,B
Ex-40.5 31.64 ± 0.05 f,g,A 5.31 ± 0.25 f,B 12.16 ± 0.15 f,B 8.93 ± 0.13 h,B 22.14 ± 0.20 f,B 34.30 ± 0.28 h,B
Ex-40.10 41.60 ± 0.07 e,f,g,B 7.31 ± 0.33 g,B 12.05 ± 0.34 f,B 8.41 ± 0.01 g,B 20.98 ± 0.20 e,f,B 33.03 ± 0.14 g,h,B
Commercialextruded rice
71.40 ± 1.31 g n.d. n.d. n.d. n.d. n.d.
p value <0.0001 <0.001 <0.0001 <0.001 <0.0001 <0.001
* n.d. not detected. Values are mean ± standard error (n = 4); mean values in the same column followed by a differentsuperscript are significantly (p < 0.05) different; small superscript letters mean differences between all the samplesanalysed, whereas capital superscript letters mean differences due to extrusion treatment for the same formulation.** Sample codes: 20.0 (20% bean; 0% whole carob fruit); 20.5 (20% bean; 5% whole carob fruit); 20.10 (20% bean;10% whole carob fruit); 40.0 (40% bean; 0% whole carob fruit); 40.5 (40% bean; 5% whole carob fruit); and 40.10(40% bean; 10% whole carob fruit).
To study the extrusion effect on the phytochemical content of the novel formulations,the unprocessed (NE-) formulations were used as controls. The rice/legume blends are a complexmatrix that can affect the extraction of bioactive compounds [12,18,20], therefore, it is necessary toknow the amount of different phytochemicals in the unprocessed samples.
The addition of whole carob fruit and bean flour had a positive impact on the phytochemicalcomposition of non-extruded (NE-) mixtures. The higher legume percentage produced moreα-galactosides (Table 1) and inositol phosphates (Table 2) content in the NE-blends, with stachyose andphytic acid (IP6) being the main compounds detected. The amount of sugars in the NE-blends showed,in general, the following pattern: Sucrose > stachyose > raffinose > galactinol > ciceritol. The totalamount of galactosides, on average, was 11.27 mg/g in the blends with 20% bean and 16.43 mg/gin the blends with 40% bean. A considerable increase in sucrose (Table 1) and phenolic compounds(Table 4) content was detected in the NE-samples containing carob fruit flour (NE-20.5, NE-20.10,
81

Foods 2019, 8, 381
NE-40.5, and NE-40.10) due to the high content of both compounds determined in raw whole carobfruit. In relation to the protease (trypsin and chymotrypsin) inhibitor content (Table 3), the lowestactivities corresponded to the formulations with 20% bean and the highest values coincided with the40% blends. The addition of carob fruit flour did not produce significant changes (p > 0.05) in theprotease inhibitor activities analysed. The content of lectin (PHA) in the different NE-formulations,evaluated by competitive ELISA did not show significant (p > 0.05) differences, ranging from 0.035% to0.108% PHA. As carob fruit contained higher amounts of phenols than bean and rice, the levels ofthe different phenolic compounds in NE-blends increased as a function of increasing the proportionof carob. The same tendency was found for the ORAC. A positive correlation was observed amongtotal phenols and ORAC (R2 = 0.58, p < 0.05) and flavonols and ORAC (R2 = 0.59, p < 0.05). Moreover,the incorporation of carob fruit and bean in the formulation of different rice-based blends had a positiveimpact on the bioactive compound content. This was also observed by other authors who addeddifferent legumes (navy bean, kidney bean, small red bean, pea, faba bean, or chickpea) to unprocessedformulations based on starch or flour from corn or rice [2,11,14,25,27].
Table 2. Effect of extrusion treatment on the inositol phosphate content (mg/g dry weight) of rawmaterials, the non-extruded (NE-) and the extruded (Ex-) flour formulations, and the commercial sample.
Sample IP3 IP4 IP5 IP6Total InositolPhosphates
Bean 0.26 ± 0.01 e 0.42 ± 0.01 e 1.39 ± 0.03 g 10.12 ± 0.03 j 12.20 ± 0.04 h
Carob n.d. * 0.15 ± 0.01 b 0.36 ± 0.04 b 0.15 ± 0.01 a 0.66 ± 0.03 a
Rice 0.10 ± 0.01 b,c 0.03 ± 0.03 a 0.22 ± 0.01 a 1.53 ± 0.05 b 1.88 ± 0.03 b
NE-20.0 ** 0.22 ± 0.01 d,e,A 0.24 ± 0.01 c,A 0.53 ± 0.02 c,A 3.32 ± 0.11 e,f,A 4.31 ± 0.12 f,g,A
NE-20.5 0.22 ± 0.01 d,e 0.25 ± 0.01 c,A 0.53 ± 0.01 c,A 3.28 ± 0.12 e,A 4.27 ± 0.10 f,A
NE-20.10 0.22 ± 0.01 d,e 0.27 ± 0.01 c,A 0.57 ± 0.01 c,A 3.88 ± 0.01 h,i,A 4.93 ± 0.02 h,A
NE-40.0 0.22 ± 0.01 d,e,A 0.27 ± 0.01 c,A 0.71 ± 0.01 d,A 4.08 ± 0.06 i,j,A 5.28 ± 0.07 i,A
NE-40.5 0.22 ± 0.01 d,e,A 0.27 ± 0.01 c,A 0.75 ± 0.01 d,A 4.18 ± 0.09 h,A 5.42 ± 0.10 i,A
NE-40.10 0.22 ± 0.01 d,e,A 0.24 ± 0.01 c,A 0.90 ± 0.03 e,A 4.54 ± 0.04 i,A 5.90 ± 0.07 j,A
Ex-20.0 0.05 ± 0.01a,b,B 0.29 ± 0.01 c,A 0.69 ± 0.02 d,B 2.61 ± 0.03 c,B 3.65 ± 0.09 d,B
Ex-20.5 n.d. 0.29 ± 0.01 c,A 0.71 ± 0.02 d,B 2.98 ± 0.11 d,B 3.98 ± 0.14 e,B
Ex-20.10 n.d. 0.27 ± 0.01 c,A 0.74 ± 0.01 d,B 3.56 ± 0.12 f,g,B 4.56 ± 0.16 g,B
Ex-40.0 0.05 ± 0.01 a,b,B 0.37 ± 0.02 d,e,B 1.20 ± 0.05 e,B 3.89 ± 0.03 g,h,B 5.51 ± 0.08 i,A
Ex-40.5 0.05 ± 0.01 a,b,B 0.41 ± 0.01 e,B 1.21 ± 0.06 e,f,B 3.74 ± 0.06 g,h,B 5.41 ± 0.06 i,A
Ex-40.10 0.16 ± 0.01 c,d,A 0.35 ± 0.01 d,B 1.27 ± 0.02 f,B 4.33 ± 0.14 h,i,A 6.11 ± 0.15 j,A
Commercialextruded rice
0.12 ± 0.01 b,c 0.30 ± 0.01 c 0.75 ± 0.01 d 1.01 ± 0.05 b 2.25 ± 0.03 c
p value <0.0001 <0.0001 <0.0001 <0.0001 <0.0001
* n.d. not detected. Values are mean ± standard error (n = 4); mean values in the same column followed by a differentsuperscript are significantly (p < 0.05) different; small superscript letters mean differences between all the samplesanalysed, whereas capital superscript letters mean differences due to extrusion treatment for the same formulation.** Sample codes: 20.0 (20% bean; 0% whole carob fruit); 20.5 (20% bean; 5% whole carob fruit); 20.10 (20% bean; 10%whole carob fruit); 40.0 (40% bean; 0% whole carob fruit); 40.5 (40% bean; 5% whole carob fruit); and 40.10 (40%bean; 10% whole carob fruit).
82

Foods 2019, 8, 381
Table 3. Effect of extrusion treatment on trypsin inhibitors (TIU/mg dry weight), chymotrypsininhibitors (CIU/mg dry weight), and lectin content (%PHA *) in raw materials, the non-extruded (NE-)and the extruded (Ex-) flour formulations, and the commercial sample.
Sample Trypsin Inhibitors Chymotrypsin Inhibitors Lectins
Bean 23.21 ± 0.66 e 7.74 ± 0.28 d 0.297 ± 0.012 C
Carob fruit 0.30 ± 0.02 a n.d. ** n.d.Rice 0.15 ± 0.01 a n.d. n.d.
NE-20.0 *** 4.10 ± 0.09 b,A 1.97 ± 0.09 a,b,A 0.035 ± 0.002 a
NE-20.5 4.16 ± 0.06 b,A 1.44 ± 0.08 a,A 0.045 ± 0.002 a,b
NE-20.10 5.53 ± 0.20 c,A 1.66 ± 0.08 a,b,A 0.052 ± 0.002 a,b
NE-40.0 7.83 ± 0.11 d,B 5.65 ± 0.17 c,B 0.108 ± 0.005 a,b
NE-40.5 7.73 ± 0.30 d,B 5.93 ± 0.28 c,B 0.103 ± 0.005 b
NE-40.10 7.34 ± 0.29 d,B 5.76 ± 0.25 c,B 0.101 ± 0.005 a,b
Ex-20.0 n.d. n.d. n.d.Ex-20.5 n.d. n.d. n.d.
Ex-20.10 n.d. n.d. n.d.Ex-40.0 n.d. n.d. n.d.Ex-40.5 n.d. n.d. n.d.
Ex-40.10 n.d. n.d. n.d.Commercial extruded rice 0.09 ± 0.01 a n.d. n.d.
p value <0.0001 <0.0001 <0.0001
* PHA = Phaseolus vulgaris lectin. ** n.d. not detected. Values are mean ± standard error (n = 4); mean values in thesame column followed by a different superscript are significantly (p < 0.05) different; small superscript letters meandifferences between all the samples analysed, whereas capital superscript letters mean differences due to extrusiontreatment for the same formulation. *** Sample codes: 20.0 (20% bean; 0% whole carob fruit); 20.5 (20% bean;5% whole carob fruit); 20.10 (20% bean; 10% whole carob fruit); 40.0 (40% bean; 0% whole carob fruit); 40.5 (40% bean;5% whole carob fruit); and 40.10 (40% bean; 10% whole carob fruit).
Table 4. Effect of extrusion on the anthocyanins (μg C3GlcE */g dry weight), flavonols (μg QE/g dryweight), tartaric esters (mg CAE/g dry weight), and total phenols (mg (+) CE/g dry weight) content andantioxidant activity (μmoles Trolox/g dry weight) of raw materials, the non-extruded (NE-) and theextruded (Ex-) flour formulations, and the commercial sample.
Sample Anthocyanins Flavonols Tartaric Esters Total PhenolsAntioxidant
Activity (ORAC)
Bean 36.96 ± 0.24 i 0.08 ± 0.001 c 0.21 ± 0.01 i 2.88 ± 0.02 g 24.33 ± 0.07 i
Carob fruit 18.00 ± 0.15 e 0.75 ± 0.001 b,c 0.72 ± 0.01 b,c 20.73 ± 0.10 i 69.89 ± 1.62 j
Rice 18.70 ± 0.83 f 0.03 ± 0.001 b 0.02 ± 0.001 a 0.90 ± 0.03 a,b 3.80 ± 0.30 a
NE-20.0 ** 10.32 ± 0.07 a 0.02 ± 0.001 a 0.06 ± 0.001 b,A 0.71 ± 0.03 a,A 8.35 ± 0.04 b
NE-20.5 11.00 ± 0.03 a,b,A 0.04 ± 0.001 a,b,c 0.09 ± 0.001 c,d,A 1.38 ± 0.03 c, A 9,66 ± 0.45 c,d,e
NE-20.10 12.42 ± 0.23 a,A 0.07 ± 0.001 b,c 0.11 ± 0.001 e,f,A 2.26 ± 0.01 e,f,A 10.22 ± 0.50 d,e
NE-40.0 15.23 ± 0.24 c 0.03 ± 0.001 a,b,A 0.09 ± 0.001 c,d,A 1.10 ± 0.03 b,A 9.41 ± 0.45 b,c,d
NE-40.5 15.45 ± 0.36 c,d,A 0.06 ± 0.001 a,b,c 0.11 ± 0.001 e,f,A 1.80 ± 0.03 d,A 11.57 ± 0.50 f,g,h
NE-40.10 17.08 ± 0.36 e,A 0.08 ± 0.001 c 0.14 ± 0.001 g,h,A 2.35 ± 0.02 e,f,A 12,36 ± 0.58 h,A
Ex-20.0 12.41 ± 052 b 0.02 ± 0.001 a 0.07 ± 0.001 b,B 0.92 ± 0.03 b,B 8.92 ± 0.38 b,c
Ex-20.5 16.78 ± 0.31 d,e,B 0.05 ± 0.001 a,b,c 0.10± 0.001 d,e,B 2.16 ± 0.01 e,B 9.32 ± 0.42 b,c,d
Ex-20.10 17.13 ± 0.13 e,B 0.08 ± 0.001 b,c 0.14 ± 0.001 g,B 3.25 ± 0.06 h,B 10.29 ± 0.30 d,e
Ex-40.0 18.13 ± 0.32 e 0.08 ± 0.001 c,B 0.08 ± 0.001 b,c,B 1.33 ± 0.04 c,B 10.49 ± 0.49 d,e,f
Ex-40.5 21.19 ± 0.09 f,B 0.06 ± 0.001 a,b,c 0.13 ± 0.001 f,g,B 2.37 ± 0.11 f,B 11.89 ± 0.48 g,h
Ex-40.10 23.30 ± 0.65 g,B 0.08 ± 0.001 c 0.16 ± 0.001 h,B 3.17 ± 0.01 h,B 10.86 ± 0.50 e,f,g,B
Commercialextruded rice
15.59 ± 0.25 e,f 0.06 ± 0.001 a,b,c 0.14 ± 0.001 g 1.96 ± 0.10 e 8.81 ± 0.18 b,c
p value <0.0001 <0.001 <0.0001 <0.0001 <0.0001
* C3GlcE (cyanidin-3-glucoside equivalents); QE (quercitin equivalents); CAE (caffeic acid equivalents);and CE ((+) catechin equivalents). Values are mean ± standard error (n = 4); mean values in the same columnfollowed by a different superscript are significantly (p < 0.05) different; small superscript letters mean differencesbetween all the samples analysed, whereas capital superscript letters mean differences due to extrusion treatmentfor the same formulation. ** Sample codes: 20.0 (20% bean; 0% whole carob fruit); 20.5 (20% bean; 5% whole carobfruit); 20.10 (20% bean; 10% whole carob fruit); 40.0 (40% bean; 0% whole carob fruit); 40.5 (40% bean; 5% wholecarob fruit); and 40.10 (40% bean; 10% whole carob fruit).
83

Foods 2019, 8, 381
3.2. Extrusion Cooking Impact on the Bioactive Compounds of Rice-Based Formulations
3.2.1. Soluble Sugars and α-Galactosides
The amount of soluble sugars and α-galactosides in the different experimental extrudates and thecommercial extruded rice is presented in Table 1. Similar to the unprocessed (NE-) blends, the mainsugars found in all the extrudates were sucrose, raffinose, and stachyose. In general, the sugar contentpattern in the extrudates was the same as in the NE-counterparts. Extrusion produced an increase(p < 0.05) in all the analysed sugars. Regarding the total α-galactosides content, the extrudates with 20%(Ex-20) and 40% (Ex-40) bean presented, on average, 1.78 and 2.03-folds more α-galactosides than theirequivalent NE-counterpart (NE-20 and NE-40), respectively. This increase could mostly be attributed tothe release of carbohydrates linked to other macromolecules as well as to a mechanical alteration of thestructure of the food matrix during extrusion, including cell wall damage, which increased the porosity,thus enhancing the diffusion of the extracting solvent within the food matrix, and subsequentlyimproving the sugar extraction [12,18]. These results were similar to those described for extruded peaand lentil flours [3,12]. However, a reduction in the sugar content of extruded legumes has also beenreported [28–30] although these authors reported that the extrusion effect on the galactosides contentdepends on the moisture and temperature of the extrusion process, as well as the seed and/or theformulation used in the development of the extruded products.
The commercial sample did not contain α-galactosides. Compared to the commercial sample,extrudates without carob fruit flour contained between four and seven times less sucrose,while the extrudates containing 5%–10% carob flour showed, on average, between 1.72 (Ex-40.10) and3.23 (Ex-20.5) times more sucrose because of the high sucrose amount provided by this raw material.
From a physiological perspective, sugars of the raffinose family are recognised as accounting forflatulence associated with legume consumption. However, different studies have reported that thesegalactosides can be considered as prebiotics [4,5,31]. Their presence in the diet has been associatedwith prebiotic activity, increasing the bifidobacterias population in the human colon, stimulating theimmune system, and reducing diarrhoea or constipation. Moreover, the colonic flora can ferment thesesugars, producing a mixture of short fatty acid that reduces glycaemic symptoms and cholesterol onceassimilated into the intestine [5,6]. Therefore, the increase in the total amount of α-galactosides afterextrusion can be considered as an added-value attribute of the extrudates and allows bean and carobfruit be taken into account as an added-value component in the extruded formulations.
3.2.2. Inositol Phosphates
It is known that inositol hexakisphosphate, phytate, or phytic acid (IP6) form complexes withsome minerals (iron, zinc, or calcium), which negatively affects their absorption. However, the lowerphosphorylated forms (IP–IP4) are considered to have a significant function in human health, boostingthe assimilation of minerals, preventing the formation of kidney stones, and performing key roles insome disorders, such as type 2 diabetes, some types of cancer, and irritable bowel syndrome [4–6,32].
As observed in the NE-blends, IP6 was the principal inositol phosphate detected in all theextrudates (Table 2). Extrusion cooking reduced (p < 0.05), on average, 10% of the IP6 content, leadingto less phosphorylated forms [3,12,32]. After extrusion, IP4 and IP5 showed a significant increase(16%–52% and 30%–70%, respectively) compared to their corresponding NE-equivalents. A reduction(p < 0.05) in the total IP content was also found (7%–15%) for the Ex-20 samples compared to theirrespective unprocessed formulations, mostly due to the IP6 reduction. These results were in accordancewith those described for extruded faba bean, pea, kidney bean, and chickpea [11,25,29,30]. AlthoughIP6 was reduced (5%–10%) in the Ex-40 samples, the total IP content of these samples showed a slightincrease (3%–4%), which did not differ significantly from their NE-40 blends, similar to the results ofLombardi-Boccia, et al. [33] for extruded bean, faba bean, chickpea, and lentil. The extent of the changeson the inositol phosphate content is dependent on the raw materials and/or the composition of theformulations, as well as the extrusion conditions used in the formulation of the extrudates [14,30,32].
84

Foods 2019, 8, 381
Regarding these results, extrusion might be considered a good processing technology to reduce IP6content by retaining the advantageous lower phosphorylated forms in the innovative extrudates.
The commercial extruded rice contained 1.6 to 2.7 times less total IP and 3–5 times less IP6 thanthe Ex-formulations. This could be due to inositol phosphates (in the experimental extrudates) thatwere mainly provided by the bean flour.
3.2.3. Protease Inhibitors and Lectins
As shown in Table 3, the extrusion process eliminated TI and CI activities, as well as lectin contentin all the extruded blends, which corroborated the heat-sensitive nature of both phytochemicals.Similarly, several authors found a reduction of TI and lectins by 100% in extruded corn/bean, pea,chickpea, kidney bean, and faba bean [11,12,25,27,34]. The commercial extruded rice showed a smallTI activity (0.09 TIU/mg), while CI activity and lectins were not detected. It has been reported thatprotease inhibitors and lectins are key parameters in establishing food quality [4,26,32], since theyhamper protein digestion and the assimilation of nutrients, respectively. Therefore, the absence of bothcompounds in all the extrudates may improve their nutritional quality [25,26,32]. Moreover, as PHAis considered a toxic compound (causing vomiting, bloating, or diarrhoea in humans) [32], from theperspective of lectin toxicity, these results demonstrate that all the extrudates are safe.
3.2.4. Phenolic Compounds and Antioxidant Activity
Phenolic compounds are considered to be natural antioxidants that can extend the shelf-life of foodproducts [30,35]. The phenolic compound (anthocyanins, flavonols, tartaric esters, and total phenols)content and the antioxidant activity (ORAC) of the extrudates is shown in Table 4. The extrusionprocess affected the studied phenolic groups to a different extent. In general, the Ex-formulationshowed a significant increase in the tartaric esters (on average 11%), anthocyanins (24%), and totalphenols (36%) content compared to their NE-counterpart, while the flavonols content in the extrudatesdid not vary significantly from their NE-formulations. The observed increase could be related to thelack of effluents during extrusion, unlike traditional processing (soaking and/or cooking or autoclaving)that prevent the leaching of water-soluble phenols [20,30]. As expected, the highest increases in totalphenols (30%–56%) corresponded to the extrudates that included carob bean flour in their composition(Ex-20.5, Ex-20.10, Ex-40.5, and Ex-40.10). The carob fruit pods are high in phenolic compounds boundto the dietary fibres and the extrusion could lead to the release of some non-available phenols bound tothe cell wall, thus growing their extractability [3,15].
Regarding the ORAC, the greatest values were found in the extrudates containing 40% bean and5%–10% carob fruit. The majority of the extruded formulations showed a slight increase (on average5.4%) in ORAC, albeit, in general, the differences between the ORAC values of each correspondingpair of NE/Ex-formulations were not significant (p > 0.05). A positive correlation was determinedamong anthocyanins, tartaric esters, and ORAC (R2 = 0.63 and 0.58, p < 0.05, respectively). However,the antioxidant activity is conditioned by the type of compound and its amount in the sample [24].The increase found in ORAC values after extrusion might also be attributable to the existence ofother food components (e.g., proteins or aromatic compounds) or to the creation of Maillard reactionproducts throughout the extrusion that contribute to the antioxidant activity analysed [3,11,27].
As reported by different authors [11,14,15,34], extrusion can produce rises or decreases in both thephenol content and the ORAC of many pulses, and they concluded that extrusion at moderately lowmoisture (<14%) and temperatures below 120 ◦C retained higher amounts of phenols and showedgreater antioxidant activity.
Compared to the commercial sample, the Ex-20.10, Ex-40.5, and Ex-40.10 formulations presenteda higher (p< 0.05) amount of total phenols (approximately 1.5 times) and anthocyanins (around 1.6 times),as well as a higher ORAC value (from 1.2 times to 1.4 times).
Various studies reported health benefits associated with different phenols and their antioxidantcapacity, such as a lower risk for inflammatory processes or colon cancer [16,23,35]. Therefore,
85
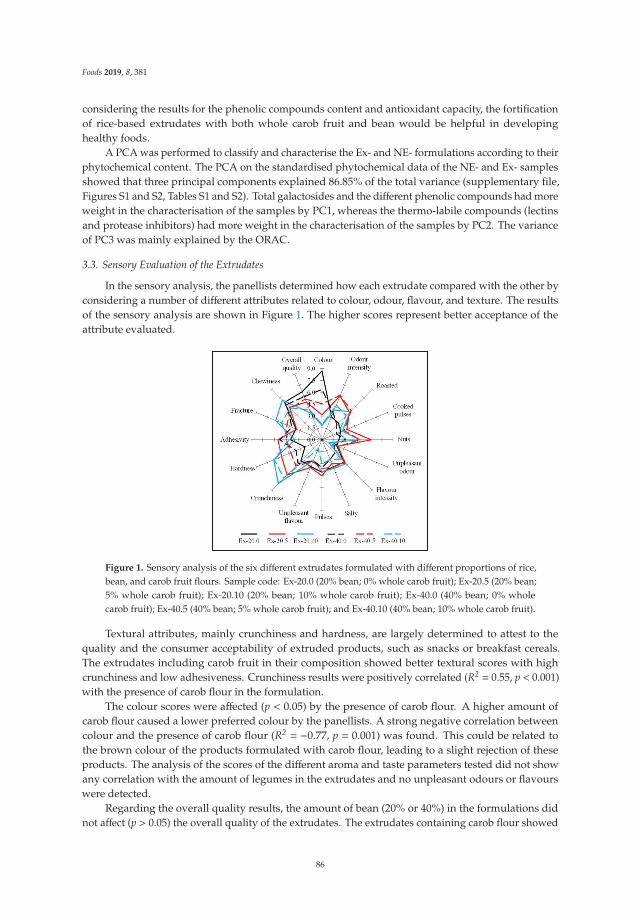
Foods 2019, 8, 381
considering the results for the phenolic compounds content and antioxidant capacity, the fortificationof rice-based extrudates with both whole carob fruit and bean would be helpful in developinghealthy foods.
A PCA was performed to classify and characterise the Ex- and NE- formulations according to theirphytochemical content. The PCA on the standardised phytochemical data of the NE- and Ex- samplesshowed that three principal components explained 86.85% of the total variance (supplementary file,Figures S1 and S2, Tables S1 and S2). Total galactosides and the different phenolic compounds had moreweight in the characterisation of the samples by PC1, whereas the thermo-labile compounds (lectinsand protease inhibitors) had more weight in the characterisation of the samples by PC2. The varianceof PC3 was mainly explained by the ORAC.
3.3. Sensory Evaluation of the Extrudates
In the sensory analysis, the panellists determined how each extrudate compared with the other byconsidering a number of different attributes related to colour, odour, flavour, and texture. The resultsof the sensory analysis are shown in Figure 1. The higher scores represent better acceptance of theattribute evaluated.
Figure 1. Sensory analysis of the six different extrudates formulated with different proportions of rice,bean, and carob fruit flours. Sample code: Ex-20.0 (20% bean; 0% whole carob fruit); Ex-20.5 (20% bean;5% whole carob fruit); Ex-20.10 (20% bean; 10% whole carob fruit); Ex-40.0 (40% bean; 0% wholecarob fruit); Ex-40.5 (40% bean; 5% whole carob fruit); and Ex-40.10 (40% bean; 10% whole carob fruit).
Textural attributes, mainly crunchiness and hardness, are largely determined to attest to thequality and the consumer acceptability of extruded products, such as snacks or breakfast cereals.The extrudates including carob fruit in their composition showed better textural scores with highcrunchiness and low adhesiveness. Crunchiness results were positively correlated (R2 = 0.55, p < 0.001)with the presence of carob flour in the formulation.
The colour scores were affected (p < 0.05) by the presence of carob flour. A higher amount ofcarob flour caused a lower preferred colour by the panellists. A strong negative correlation betweencolour and the presence of carob flour (R2 = −0.77, p = 0.001) was found. This could be related tothe brown colour of the products formulated with carob flour, leading to a slight rejection of theseproducts. The analysis of the scores of the different aroma and taste parameters tested did not showany correlation with the amount of legumes in the extrudates and no unpleasant odours or flavourswere detected.
Regarding the overall quality results, the amount of bean (20% or 40%) in the formulations didnot affect (p > 0.05) the overall quality of the extrudates. The extrudates containing carob flour showed
86

Foods 2019, 8, 381
lower scores, however, the differences between them were not significant (p > 0.05). The extrudateselaborated only with rice and bean showed the highest scores, although the addition of 5% carobfruit flour did not significantly affect the overall quality of these extrudates, and therefore these novelextrudates would be well accepted by consumers.
4. Conclusions
From the results obtained, it can be seen that the fortification of rice-based GF puffed productswith carob fruit and bean flours had a positive impact on their bioactive compound content.The fortification with carob fruit flour improved their textural attributes and did not significantly affecttheir overall quality.
The extrusion process affected the studied phytochemicals to a different extent. While totalα-galactosides and phenols increased, the IP6 was reduced, and the lectins and protease inhibitorswere eliminated. The content of bioactive compounds present in these extrudates might be enoughto promote health-associated functions. Moreover, the absence of lectins and protease inhibitorsenhanced the nutritional quality of the extrudates. Compared to the commercial extruded rice, all theexperimental extrudates showed a higher content of bioactive compounds. Therefore, the formulationof these products would be of interest to both health-conscious consumers and the food industry,allowing it to meet consumers’ requirement for functional foods with acceptable sensory attributes.
Supplementary Materials: The following are available online at http://www.mdpi.com/2304-8158/8/9/381/s1.Table S1. Values of the Principal Components (PC1, PC2, and PC3) coefficients for each formulation. Table S2.Component weight of each bioactive compound in relation to the Principal Components (PC1, PC2, and PC3).Figure S1. Principal component analysis (PCA) projection of the two first principal components. NE- (non-extrudedformulations). Ex- (extruded formulations). Parameters: Total inositol phosphates (Total IP), sucrose, totalgalactosides, trypsin Inhibitors (TIU), chymotrypsin inhibitors (CIU), lectins (PHA), anthocyanins, flavonols,tartaric esters, total phenols, and ORAC. Figure S2. Principal component analysis (PCA) projection of the firstand third principal components. NE- (non-extruded formulations). Ex- (extruded formulations). Parameters:Total inositol phosphates (Total IP), sucrose, total galactosides, trypsin Inhibitors (TIU), chymotrypsin inhibitors(CIU), lectins (PHA), anthocyanins, flavonols, tartaric esters, total phenols, and ORAC. Figure S3. Original HPLCChromatograms of sucrose, galactinol, raffinose, ciceritol, and stachyose of the three raw materials, the sixnon-extruded (NE-), the six extruded (Ex-) flour formulations, and the extruded commercial sample. Figure S4.Original HPLC Chromatograms of inositol phosphates (IP3, IP4, IP5, and IP6) of the three raw samples, the sixnon-extruded (NE-), the six Extruded (EX-) flour formulations, and the extruded commercial sample.
Author Contributions: M.M.P. conceived and designed research experiments. C.A., B.C., C.C., E.G., and M.M.P.performed the experiments. C.A., B.C., C.C., E.G., and M.M.P. analysed the data. C.A., B.C., C.C., E.G., and M.M.P.wrote, reviewed, and edited the paper. The manuscript was critically revised and approved by all authors.
Funding: The Spanish Ministry of Economy and Competitiveness (Project RTA2012-00042-C02) supported thiswork. C.A. was supported by a contract (CPR2014-0068) from INIA, and co-financed by the European RegionalDevelopment Fund (FEDER) and the European Social Fund (FSE).
Conflicts of Interest: The authors declare no conflict of interest.
References
1. Gaesser, G.A.; Angadi, S.S. Gluten-free diet: Imprudent dietary advice for the general population? J. Acad.Nutr. Diet. 2012, 112, 1330–1333. [CrossRef] [PubMed]
2. Dalbhagat, C.G.; Mahato, D.K.; Mishra, H.N. Effect of extrusion processing on physicochemical, functionaland nutritional characteristics of rice and rice-based products: A review. Trends Food Sci. Technol. 2019, 85,226–240. [CrossRef]
3. Arribas, C.; Cabellos, B.; Cuadrado, C.; Guillamón, E.; Pedrosa, M. The effect of extrusion on the bioactivecompounds and antioxidant capacity of novel gluten-free expanded products based on carob fruit, pea andrice blends. Innov. Food Sci. Emerg. Technol. 2019, 52, 100–107. [CrossRef]
4. Muzquiz, M.; Varela, A.; Burbano, C.; Cuadrado, C.; Guillamon, E.; Pedrosa, M.M. Bioactive compounds inlegumes: Pronutritive and antinutritive actions. Implications for nutrition and health. Phytochem. Rev. 2012,11, 227–244. [CrossRef]
87

Foods 2019, 8, 381
5. Lajolo, F.M.; Genovese, M.I.; Pryme, I.F.; Dale, T.M. Beneficial (antiproliferative) effects of different substances.In Recent Advances of Research in Antinutritional Factors in Legume Seeds and Oilseeds; Muzquiz, M., Hill, G.D.,Cuadrado, C., Pedrosa, M.M., Burbano, C., Eds.; EAAP Publication: Toledo, Spain, 2004; pp. 123–137.
6. Singh, B.; Singh, J.P.; Shevkani, K.; Singh, N.; Haur, A. Bioactive constituents in pulses and their healthbenefits. J. Food Sci. Technol. 2017, 54, 858–870. [CrossRef] [PubMed]
7. Goulas, V.; Stylos, E.; Chatziathanasiadou, M.V.; Mavromoustakos, T.; Tzakos, A.G. Functional Componentsof Carob Fruit: Linking the Chemical and Biological Space. Int. J. Mol. Sci. 2016, 17, 1875. [CrossRef]
8. Nasar-Abbas, S.M.; Huma, Z.-E.; Vu, T.-H.; Khan, M.K.; Esbenshade, H.; Jayasena, V. Carob Kibble:A Bioactive-Rich Food Ingredient. Compr. Rev. Food Sci. Food Saf. 2016, 15, 63–72. [CrossRef]
9. Bouvier, J.M.; Campanella, O.H. Extrusion Technology and Process Intensification. In Extrusion ProcessingTechnology; John Wiley & Sons, Ltd.: Hoboken, NJ, USA, 2014; pp. 465–506.
10. Arribas, C.; Cabellos, B.; Sanchez, C.; Cuadrado, C.; Guillamon, E.; Pedrosa, M.M. The impact of extrusionon the nutritional composition, dietary fiber and in vitro digestibility of gluten-free snacks based on rice, peaand carob flour blends. Food Funct. 2017, 8, 3654–3663. [CrossRef]
11. Anton, A.A.; Gary Fulcher, R.; Arntfield, S.D. Physical and nutritional impact of fortification of cornstarch-based extruded snacks with common bean (Phaseolus vulgaris L.) flour: Effects of bean addition andextrusion cooking. Food Chem. 2009, 113, 989–996. [CrossRef]
12. Morales, P.; Berrios, J.; Varela, A.; Burbano, C.; Cuadrado, C.; Muzquiz, M.; Pedrosa, M.M. Novel fiber-richlentil flours as snack-type functional foods: An extrusion cooking effect on bioactive compounds. Food Funct.2015, 6, 3135–3143. [CrossRef]
13. Berrios, J. Extrusion Cooking: Legume Pulses. In Encyclopedia of Agricultural, Food, and Biological Engineering,2nd ed.; CRC Press: Boca Raton, FL, USA, 2010; pp. 453–464.
14. Carvalho, A.; de Andrade Mattietto, R.; Bassinello, P.; Nakamoto Koakuzu, S.; Rios, A.; Maciel, R.;Nunes Carvalho, R. Processing and characterization of extruded breakfast meal formulated with broken riceand bean flour. Food Sci. Technol. 2012, 32, 515–524. [CrossRef]
15. Brennan, C.; Brennan, M.; Derbyshire, E.; Tiwari, B.K. Effects of extrusion on the polyphenols, vitamins andantioxidant activity of foods. Trends Food Sci. Technol. 2011, 22, 570–575. [CrossRef]
16. Morales, P.; Cebadera-Miranda, L.; Cámara, R.M.; Reis, F.S.; Barros, L.; Berrios, J.; Ferreira, I.C.F.R.; Cámara, M.Lentil flour formulations to develop new snack-type products by extrusion processing: Phytochemicals andantioxidant capacity. J. Funct. Foods 2015, 19 Pt A, 537–544. [CrossRef]
17. Ravindran, G.; Carr, A.; Hardacre, A. A comparative study of the effects of three galactomannans on thefunctionality of extruded pea–rice blends. Food Chem. 2011, 124, 1620–1626. [CrossRef]
18. Pedrosa, M.M.; Cuadrado, C.; Burbano, C.; Allaf, K.; Haddad, J.; Gelencsér, E.; Takács, K.; Guillamón, E.;Muzquiz, M. Effect of instant controlled pressure drop on the oligosaccharides, inositol phosphates, trypsininhibitors and lectins contents of different legumes. Food Chem. 2012, 131, 862–868. [CrossRef]
19. Burbano, C.; Muzquiz, M.; Ayet, G.; Cuadrado, C.; Pedrosa, M.M. Evaluation of antinutritional factors ofselected varieties of Phaseolus vulgaris. J. Sci. Food Agric. 1999, 79, 1468–1472. [CrossRef]
20. Pedrosa, M.M.; Cuadrado, C.; Burbano, C.; Muzquiz, M.; Cabellos, B.; Olmedilla-Alonso, B.; Asensio-Vegas, C.Effects of industrial canning on the proximate composition, bioactive compounds contents and nutritionalprofile of two Spanish common dry beans (Phaseolus vulgaris L.). Food Chem. 2015, 166, 68–75. [CrossRef][PubMed]
21. Welham, T.; Domoney, C. Temporal and spatial activity of a promoter from a pea enzyme inhibitor gene andits exploitation for seed quality improvement. Plant Sci. 2000, 159, 289–299. [CrossRef]
22. Sathe, S.K.; Salunkhe, D.K. Studies on trypsin and chymotrypsin inhibitory activities, hemagglutinatingactivity, and sugars in the great northern beans (Phaseolus vulgaris L). J. Food Sci. 1981, 46, 626–629. [CrossRef]
23. Dueñas, M.; Fernández, M.L.; Hernández, T.; Estrella, I.; Muñoz, R. Bioactive phenolic compounds of cowpeas(Vigna sinensis L.). Modifications by fermentation with natural microflora and with Lactobacillus plantarumATCC 14917. J. Sci. Food Agric. 2005, 85, 297–304.
24. Oomah, B.D.; Cardador-Martínez, A.; Loarca-Piña, G. Phenolics and antioxidative activities in commonbeans (Phaseolus vulgaris L.). J. Sci. Food Agric. 2005, 85, 935–942. [CrossRef]
25. Alonso, R.; Aguirre, A.; Marzo, F. Effect of extrusion and traditional processing methods on antinutrients andin vitro digestibility of protein and starch in faba and kidney beans. Food Chem. 2000, 68, 159–165. [CrossRef]
88

Foods 2019, 8, 381
26. Roy, F.; Boye, J.I.; Simpson, B.K. Bioactive proteins and peptides in pulse crops: Pea, chickpea and lentil.Food Res. Int. 2010, 43, 432–442. [CrossRef]
27. Delgado-Licon, E.; Ayala, A.L.; Rocha-Guzman, N.E.; Gallegos-Infante, J.A.; Atienzo-Lazos, M.; Drzewiecki, J.;Martinez-Sanchez, C.E.; Gorinstein, S. Influence of extrusion on the bioactive compounds and the antioxidantcapacity of the bean/corn mixtures. Int. J. Food Sci. Nutr. 2009, 60, 522–532. [CrossRef] [PubMed]
28. Berrios, J.; Pan, J. Evaluation of extruded black bean (Phaseolus vulgaris L.) processed under different screwspeeds and particle sizes. In Proceedings of the Annual Meeting of the Institute of Food Technologist,New Orleans, LA, USA, 23–27 June 2001; p. 30.
29. Varela, A.; Guillamón, E.; Cuadrado, C.; Marzo, F.; Burbano, C.; Muzquiz, M.; Pedrosa, M.M. Changes innutritional active factors and protein in different legumes by extrusion/cooking. In Proceedings of the 6thEuropean Conference on Grain Legumes, Lisboa, Portugal, 16–17 November 2007; p. 56.
30. Pedrosa, M.; Cuadrado, C. The nutritional and Nutraceutical Values od Some ready-to-Eat Expanded LegumeProducts. In Legumes for Global Food Secutiry; Clemente, A., Jimenez-Lopez, J.C., Eds.; Nova Science, Inc.:New York, NY, USA, 2017; pp. 157–182.
31. Tosh, S.M.; Yada, S. Dietary fibres in pulse seeds and fractions: Characterization, functional attributes,and applications. Food Res. Int. 2010, 43, 450–460. [CrossRef]
32. Nikmaram, N.; Leong, S.Y.; Koubaa, M.; Zhu, Z.; Barba, F.J.; Greiner, R.; Oey, I.; Roohinejad, S. Effect ofextrusion on the anti-nutritional factors of food products: An overview. Food Control 2017, 79, 62–73.[CrossRef]
33. Lombardi-Boccia, G.; Lullo, G.D.; Carnovale, E. In-vitro iron dialysability from legumes: Influence of phytateand extrusion cooking. J. Sci. Food Agric. 1991, 55, 599–605. [CrossRef]
34. El-Hady, E.A.; Habiba, R.A. Effect of soaking and extrusion conditions on antinutrients and proteindigestibility of legume seeds. LWT Food Sci. Technol. 2003, 36, 285–293. [CrossRef]
35. Aguilera, Y.; Dueñas, M.; Estrella, I.; Hernandez, T.; Benitez, V.; Esteban, R.M.; Martin-Cabrejas, M.A.Phenolic profile and antioxidant capacity of chickpeas (Cicer arietinum L.) as affected by a dehydrationprocess. Plant Foods Hum. Nutr. 2011, 66, 187–195. [CrossRef]
© 2019 by the authors. Licensee MDPI, Basel, Switzerland. This article is an open accessarticle distributed under the terms and conditions of the Creative Commons Attribution(CC BY) license (http://creativecommons.org/licenses/by/4.0/).
89


foods
Article
Study of the Effects Induced by Ball MillingTreatment on Different Types of Hydrocolloids ina Corn Starch–Rice Flour System
Luca Nuvoli 1, Paola Conte 2,*, Sebastiano Garroni 1, Valeria Farina 1, Antonio Piga 2
and Costantino Fadda 2
1 Department of Chemistry and Pharmacy, University of Sassari and INSTM, Via Vienna 2, 07100 Sassari, Italy;[email protected] (L.N.); [email protected] (S.G.); [email protected] (V.F.)
2 Department of Agriculture, University of Sassari, Viale Italia 39/A, 07100 Sassari, Italy; [email protected] (A.P.);[email protected] (C.F.)
* Correspondence: [email protected]; Tel.: +39-079-229-277
Received: 20 March 2020; Accepted: 16 April 2020; Published: 20 April 2020
Abstract: The effects of ball milling treatment on both the structure and properties of guar gum (GG),tara gum (TG), and methylcellulose (MC) were analyzed prior to assessing their potential interactionswith starch components when they are used alone or in blends in a corn starch–rice flour system. X-raydiffraction profiles showed that the ball milling caused a reduction in the crystallin domain and, in turn,a diminished viscosity of the GG aqueous solutions. Despite an increase in its viscosity properties,effects on TG were minimal, while the milled MC exhibited reduced crystallinity, but similar viscosity.When both milled and un-milled hydrocolloids were individually added to the starch–flour system,the pasting properties of the resulting mixtures seemed to be affected by the type of hydrocolloidadded rather than the structural changes induced by the treatment. All hydrocolloids increased thepeak viscosity of the binary blends (especially pure GG), but only milled and un-milled MC showedvalues of setback and final viscosity similar to those of the individual starch. Ball milling seemed to bemore effective when two combined hydrocolloids (milled GG and MC) were simultaneously used. Nosignificant differences were observed in the viscoelastic properties of the blends, except for un-milledGG/starch, milled TG/starch, and milled MC/milled TG/starch gels.
Keywords: ball milling; hydrocolloids; starch–flour system; X-ray diffraction; pasting profile;viscoelastic properties
1. Introduction
The use of starch and its ability to gelatinize make it a necessary ingredient in food systems [1].Starch is a macroconstituent of many foods and it is composed of amylopectin and amylose.The organization of the crystalline lamellae within granules is due to the packing of amylopectin intocrystallites and this phenomenon is influenced by amylose. The amylopectin structure and the roleof amylose are important for the water swelling of starch granules, the thermal properties and gelformation (in water solution) [2]. However, when starch is subjected to processes, such as cooking,shear stress, and cooling, it tends to exhibit syneresis, retrogradation, and breakdown, suggestingthat its use as a main ingredient in food may be difficult [3]. To overcome these issues, hydrophiliccolloids are often used to modify the functionality of starch [4]. Hydrophilic colloids, commonlyknown as “hydrocolloids”, are substances consisting of long chains that have a high molecular weightand an affinity for water, which, in a water-based system, generate gels or highly viscous suspensions.Typically, hydrocolloids are polysaccharides, composed of single or multiple units of sugar, repeatedover the entire length of the polymer. Their properties are then influenced by external units, such as
Foods 2020, 9, 517; doi:10.3390/foods9040517 www.mdpi.com/journal/foods91

Foods 2020, 9, 517
sulfate groups, methyl ether groups or carboxyl groups, linked to the main chain [5,6]. The abilityto form networks, once dispersed in a solution, and their biocompatibility, makes them excellentadditives and/or substituents in food chemistry for the control of microstructure, texture, flavor, andshelf-life [7,8]. Among others, the naturally occurring polysaccharides, such as galactomannans, as wellas the chemically synthesized cellulose derivatives, have been widely used in the food industry fortheir suitable functional properties. In particular, the cellulose derivative methylcellulose has manyapplications in food systems such as an emulsifier and texturing agent, as well as a thickener andgelling additive [9], whereas galactomannans, such as guar gum and tara gum, are well known to havethickening, binding, and stabilizing abilities [10]. These two galactomannans, however, despite a verysimilar molecular structure—composed of a β-(1–4)-d-mannan backbone with a single d-galactosebranch linked α-(1–6)—differ from each other in the molar ratio of mannose to galactose (3:1 fortara and 2:1 for guar gum), which is responsible for the significant changes in their viscosity andsolubility properties, as well as in their interactions with other polysaccharides [10]. The authorsof [3] explored the interactions of rice starch with guar gam, hydroxypropylmethylcellulose (HPMC),and xanthan gum to improve the pasting, viscoelastic, and swelling properties of starch–hydrocolloidmixtures. To determine the network stability, the effects of repeated heating–cooling cycles werealso analyzed. They found that the tested rice starch–hydrocolloid mixtures (8%, w/w) exhibiteddifferent pasting, viscoelastic, and swelling properties depending on the type of hydrocolloid added,as well as the concentration levels (0.2%–0.8% w/w) used. The authors of [11], when investigating theswelling and pasting properties of non-waxy rice starch–hydrocolloid mixtures using both commercialand laboratory-generated hydrocolloids, observed a strong dependence between the hydrocolloidconcentration and swelling power of the rice starch–hydrocolloid blends. They found that theswelling behavior was depressed at low concentrations of hydrocolloids (0%–0.05%), but it increasedlinearly with increasing hydrocolloid concentrations (0.05%–0.1%). Other hydrocolloids (e.g., alginate,k-carrageenan, xanthan) were investigated by [12] with two different techniques. Recently, it wasdemonstrated that the use of mechanical treatments, such as ball milling, can alter the functionality ofhydrocolloids, influencing, in turn, their interactions with the starch or its constituents [13–15]. Changesin hydrocolloid functionality are probably due to the changes induced by the milling treatment ontheir structural conformation, thermal properties, particle size distributions, and rheological properties,enhancing the amorphization of the system at the expense of the crystalline structure. The authorsof [16] investigated the effects of ball milling on the structural, thermal, and rheological properties ofoat bran protein flour. They observed modifications in the structural conformation of both protein andstarch as a consequence of the reduction of the particle size and the suppression of the amylose–lipidcomplex helical structure. The authors of [17] proved that the cellulose crystallite size decreased asa function of increasing milling time.
It has been recognized that the blending of hydrocolloids and cereal starches of various origin,apart from the main above-mentioned standard applications, also plays a critical role in improvingboth the structure and texture of yeast-leavened baked products for celiac patients. In such products,in which starch is the main component, two of the most used ingredients, due to their wide availability,low price, and desirable rheological properties, are corn and rice (both flour and starch) [7]. In thiscontext, with the aim to achieve suitable functional properties in the development of optimizedgluten-free products, it was decided to use rice flour and corn starch as basic ingredients of thestarch–flour system.
Starting from these points, the objectives of this study were to explore the interactions of threedifferent hydrocolloids, namely, guar gum, tara gum, and methylcellulose, with starch componentswhen they are used alone or in blends in a corn starch–rice flour system and to analyze the effect of theball milling treatment on the structure and viscosity of these different hydrocolloids. With this aim, X-raydiffraction (XRD) experiments were carried out to evaluate the potential changes in the conformationalstructure induced by the ball milling treatment, while the gelling capacity test was conducted todetermine potential changes in the viscosity of hydrocolloid aqueous solutions. Viscometric and small
92
Foods 2020, 9, 517
deformation rheological measurements were conducted in binary and ternary starch–hydrocolloidmixtures and were compared with the basic starch–flour system (used as a reference sample) to studythe potential changes in hydrocolloid functionality in such a complex system.
2. Materials and Methods
2.1. Raw Materials
Rice flour, corn starch, and guar gum (GG) were provided by Chimab (Chimab Food IngredientSolutions, Campodarsego, PD, Italy); tara gum (TG), under its commercial name AGLUMIX 01, wasobtained from Silvateam Food Ingredients (Silvateam Food Ingredients S.r.l., San Michele Mondovì,CN, Italy); methylcellulose (MC) was purchased from Sigma–Aldrich.
2.2. Ball Milling Treatment
Ball milling was performed using a Mixer/Mill 8000 (SPEX SamplePrep, Metuchen, NJ, USA) witha zirconia jar and two zirconia balls (2 g each); 15 g of hydrocolloids was introduced in the vial andmilled for 1 h at 875 rpm under air.
2.3. X-ray Diffraction Experiments
The X-ray diffraction patterns of both milled and un-milled hydrocolloids were collected usinga SmartLab X-ray powder diffractometer (Rigaku, Tokyo, Japan) aligned according to Bragg–Brentanogeometry with Cu Kα radiation (λ = 1.54178 Å) and a graphite monochromator in the diffracted beam.Since the polymers showed broad haloes typical of an amorphous condition, the reciprocal spaceinvestigation was deliberately restricted in the angular range from 5◦ to 60◦ in 2θ, which allows us todetermine the main shape features of patterns.
2.4. Fourier Transform Infrared Analysis
Fourier transform infrared (FTIR) analysis was performed on the examined hydrocolloids,both before and after milling, using an infrared Vertex 70 interferometer (Bruker, Billerica, MA, USA).All samples were ground with ultra-dry KBr (potassium bromide), at a ratio of 1:100, and then pressedinto the shape of pellets by applying a uniaxial pressure using a hydraulic press. The spectra wererecorded on the hydrogels after drying at 80 ◦C for 24 h, in transmission mode, in the 400–4000 cm−1
range by averaging 64 scans with 4 cm−1 resolution. The background was evaluated by measuring thesignals of dried air.
2.5. Gelling Capacity of Hydrocolloids
The gelling properties of both milled and un-milled hydrocolloids were determined by a RapidVisco Analyzer (RVA-4, Newport Scientific, Warriewood, NSW, Australia) using the official methodRVA 41.02. Before staring the test, both guar and tara gums (0.28 g) were thoroughly dispersed in 28 mLof distilled water at room temperature, while the methylcellulose aqueous solution was prepared bydispersing the powder in hot water (80 ◦C) until complete solubilization was reached. The coolingprofile used to describe the gelling/thickening behavior of the obtained hydrocolloid aqueous solutionswas as follows: samples were held at 80 ◦C for 5 min, gradually cooled to 20 ◦C at a rate of 1 ◦C/min,and finally kept at 20 ◦C for 5 min. All experiments were performed in duplicate.
2.6. Starch/Flour–Hydrocolloid Blend Preparation
To verify changes in the hydrocolloid functionality induced by the ball milling treatment,both milled and un-milled hydrocolloids were added to a starch-based system composed of cornstarch and rice flour (50:50). To this end, twelve different hydrocolloid–starch combinations, whichincluded six binaries and six ternary mixtures, were obtained (Table 1). Firstly, each milled andun-milled hydrocolloid was individually added to the basic starch–flour system to obtain six binary
93

Foods 2020, 9, 517
mixtures; secondly, blends of two hydrocolloids, which were obtained by combining the gelling agentmethylcellulose (both milled and un-milled) with each of the two thickening agents (both milled andun-milled), were added to the basic starch–flour system to obtain six ternary mixtures. The cornstarch–rice flour system alone was used as a reference sample (Table 1).
Table 1. Formulations used to prepare the starch/flour-hydrocolloid blends.
SamplesCorn Starch
(g)Rice Flour
(g)
Guar Gum(g)
Tara Gum(g)
Methylcellulose(g) Water
(mL)UN M UN M UN M
Corn starch–rice flour 1.75 1.75 - - - - - - 25
Binary mixturesstarch–flour + UN-GG 1.75 1.75 0.25 - - - - - 25starch–flour +M-GG 1.75 1.75 - 0.25 - - - - 25
starch–flour + UN-TG 1.75 1.75 - - 0.25 - - - 25starch–flour +M-TG 1.75 1.75 - - - 0.25 - - 25
starch–flour + UN-MC 1.75 1.75 - - - - 0.25 - 25starch–flour +M-MC 1.75 1.75 - - - - - 0.25 25
Ternary mixturesstarch–flour + UN-MC +
UN-GG 1.75 1.75 0.125 - - - 0.125 - 25
starch–flour + UN-MC +M-GG 1.75 1.75 - 0.125 - - 0.125 - 25
starch–flour +M-MC +M-GG 1.75 1.75 - 0.125 - - - 0.125 25
starch–flour + UN-MC +UN-TG 1.75 1.75 - - 0.125 - 0.125 - 25
starch–flour + UN-MC +M-TG 1.75 1.75 - - - 0.125 0.125 - 25
starch–flour +M-MC +M-TG 1.75 1.75 - - - 0.125 - 0.125 25
UN: un-milled; M: milled; GG: guar gum; TG: tara gum; MC: methylcellulose.
To maintain a constant concentration of starch in both reference and experimental samples, thusallowing comparison among them, the starch–hydrocolloid composites were obtained by addition.The blending of a single hydrocolloid and starch–flour was prepared by firstly suspending thehydrocolloid powder (0.25 g) in 25 mL of distilled water at room temperature and under magneticstirring, before adding 3.5 g of corn starch–rice flour (50:50). The ternary mixtures were prepared inthe same way but, in this case, both hydrocolloids (0.125 g + 0.125 g) were simultaneously suspendedin the distilled water before adding the starch powder (Table 1). On the contrary, for all the mixturescontaining MC, the hydrocolloid solutions were prepared by dispersing the powder in hot water(80 ◦C) until a complete solubilization of the particles was achieved; then, the obtained hydrocolloidaqueous solutions were cooled to room temperature and subsequently mixed with the corn starch–riceflour powder. Two different batches of each mixture were prepared, and all the measurements wereperformed in duplicate.
2.7. Pasting Properties of Starch/Flour–Hydrocolloid Blends
Viscosity profiles of the starch–flour system alone and the starch/flour-hydrocolloid aqueoussolutions were determined by a Rapid Visco Analyzer (RVA-4, Newport Scientific, Warriewood, NSW,Australia) according to the International Association of Cereal Science and Technology (ICC) Standardmethod 162. Before starting the test, the slurries were heated at 50◦C and stirred for 5 min at a rotationspeed of 960 rpm to achieve complete homogenization. Then, the slurries were held at 50 ◦C for 1 min,gradually heated to 95 ◦C, held at this temperature for 2 min 30 s, and finally cooled to 50 ◦C and heldat this temperature for 2 min. The pasting temperature (◦C), peak time (when peak viscosity occurred;min), peak viscosity (maximum hot paste viscosity), breakdown (peak viscosity minus holding strengthor minimum hot paste viscosity), setback (final viscosity minus holding strength or minimum hot paste
94

Foods 2020, 9, 517
viscosity), and final viscosity (end of the test after cooling to 50 ◦C and holding at this temperature)were determined. All the viscosity parameters are expressed in mPa·s.
2.8. Viscoelastic Properties of Starch/Flour–Hydrocolloid Blends
Immediately after pasting, the obtained starch–flour and starch/flour–hydrocolloid gels weresubjected to small deformation rheological measurements using an MCR 92 rotational rheometer(Anton Paar GmbH, Inc., Graz, Austria) equipped with a Peltier-temperature-controlled system,as previously suggested by [18]. The test was performed at 50 ◦C using a 60 mm serrated plate–plategeometry with a 2 mm gap between plates. After lowering the upper plate, the excess sample wastrimmed off and a thin layer of silicon oil was used to cover the exposed surface to prevent moisturelosses during the test. Prior to starting the test, the experimental gels were rested for 5 min betweenplates to allow sample relaxation. The frequency sweep test was carried out over the range 0.1–10 Hzat 50 ◦C using a target strain of 0.01%, which fell within the linear viscoelastic region previouslydetermined by running a strain sweep test at a constant frequency of 10 Hz and with a strain thatvaried over the range 0.001–100. Values of storage modulus (G′), loss modulus (G′′), and loss tangent(tan δ) were recorded at a frequency of 1 Hz.
2.9. Statistical Analysis
The experimental data obtained from viscometric and rheological measurements were analyzedusing one-way analysis of variance (ANOVA). Fisher’s least significant differences (LSD) test wasapplied to determine the difference between each pair of means with 95% confidence (p < 0.05).Statistical analysis of the results was performed using Statistica v10.0 software (StatSoft, Inc., Tulsa,OK, USA).
3. Results and Discussion
3.1. Structural and Viscosity Properties of the Single Hydrocolloids
Guar, tara, and methylcellulose powders were analyzed by a wide-angle X-ray diffractiontechnique in order to evaluate the effect of the mechanical treatment on the structural evolution of thethree hydrocolloids (Figure 1).
The XRD patterns of the un-milled GG (UN-GG) and milled GG (M-GG) powders are presentedin Figure 1A. Both guar systems exhibited a typical XRD profile with very low crystallinity (2θ = 17.02and 20.11◦) with respect to the amorphous counterpart (broad peak centered at 18.1◦ in 2θ). After theball milling, a pronounced reduction in crystallinity (see peak at 17.02◦), which could be ascribable tothe partial hydrogen bonds breaking the guar structure, is observed [19,20].
Figure 1B depicts the XRD pattern of the TG before and after milling. The two broad peakscentered at 18.6 and 39.8◦ in 2θ are typical of an amorphous pattern. The effect of milling on thesepowders was not comparable with the previous system: the analysis of the peak shape and broadeningrevealed an increase of the amorphous component of 2%–4% for the milled sample. For this reason,a clear effect of the mechanical treatment cannot be shown by X-ray diffraction for the TG sample. FT-IRanalysis, not shown here, seemed to confirm the experimental evidence achieved by X-ray diffraction.
XDR patterns for MC samples are shown in Figure 1C. The observed diffraction peaks for bothmaterials can be attributed to the crystalline scattering and the diffuse background of the disorderedregions. The diffractogram corresponding to the un-milled MC (UN-MC) sample showed maximumdiffraction peaks at the 8.1◦ and 20.2◦ 2θ angles, while 8.1◦ and 19.7◦ 2θ angles were recorded for theball milled MC (M-MC). Comparing the XRD patterns, it is possible to observe a shift versus a lower2θ angle of the main peak for the ball-milled system. This indicates an increase of the inter-planardistance compared to the original MC, due to the generation of disorder when the MC is ball milled.The maximum, around 20◦, present in the MC sample, is commonly known as van der Waals halo,which appears for many polymers and corresponds to the polymeric chain packing due to van der
95

Foods 2020, 9, 517
Waals forces [21]. Also, the maximum around 8◦, which is known as the halo of low van der Waals,occurs for some amorphous polymers due to the existence of regions with aggregates of segmentsof parallel chains. The peak broadening (b–violet curve) is a direct consequence of the mechanicaltreatment which induces a further decrease of the crystallinity of the MC powders (35%). In the case ofthe native MC, this maximum is much more defined, conferring this sample a more semicrystallinecharacter (46%).
0 10 20 30 40 50 60
Inte
nsity
(a.u
.)
Scattering angle 2
UN-GG M-GG
0 10 20 30 40 50 60
Inte
nsity
(a.u
.)
Scattering angle 2
UN-MC M-MC
A
Inte
nsity
(a.u
.)Scattering angle 2
UN-TG M-TG
C
B
Figure 1. X-ray diffraction patterns of un-milled (continuous dark line) and milled (continuous greyline) hydrocolloids: guar gum (A), tara gum (B), and methylcellulose (C). UN: un-milled; M: milled;GG: guar gum; TG: tara gum; MC: methylcellulose.
The gelling behavior of the investigated hydrocolloids, both before and after milling, were thenanalyzed as a function of the time to determine potential changes in the viscosity properties of thehydrocolloid aqueous solutions.
The difference in viscosity due to the ball milling treatment is clearly visible in Figure 2. In thiscase, the effect of ball milling on the guar gum resulted in a diminished viscosity due to the factthat the crystalline domains decreased in length and therefore the chains flowed better (Figure 2A).On the contrary, the greater affinity due to the overexposure of OH groups of the hydrocolloid chainsturned out to be the dominant effect in tara gum aqueous solutions, which showed increased values ofviscosity (Figure 2B).
Methylcellulose appeared to have an intermediate behavior between the two effects, as if theywere subjected to compensation. In fact, there was no substantial difference between the UN-MC andthe M-MC. The RVA analysis graph (Figure 2C) showed an important characteristic of methylcellulose:its lower critical solution temperature (LCST). LCST is a change in the MC microstructure, passing froma hydrophilic to a hydrophobic state as a consequence of a change of temperature [22]. The behavior ofthis hydrocolloid is not monotonous when the temperature varies; the viscosity of an MC solution
96

Foods 2020, 9, 517
slightly decreases below a critical temperature value over which the viscosity regime increases [23].In the RVA graph, the change in viscosity was between 40 and 50 ◦C.
0
20
40
60
80
100
0
400
800
1200
1600
0 5 10 15 20 25 30 35 40 45 50 55 60 65
Tem
pera
ture
(C
)
Vis
cosi
ty (m
Pa⋅s
)
Time (min)UN-GG M-GG Temperature
A
0
20
40
60
80
100
0
400
800
1200
1600
0 5 10 15 20 25 30 35 40 45 50 55 60 65
Tem
pera
ture
(°C
)
Vis
cosi
ty (m
Pa⋅s
)
Time (min)UN-TG M-TG Temperature
B
0
20
40
60
80
100
0
400
800
1200
1600
0 5 10 15 20 25 30 35 40 45 50 55 60 65Te
mpe
ratu
re (°
C)
Vis
cosi
ty (m
Pa⋅s
)
Time (min)UN-MC M-MC Temperature
C
Figure 2. Gelling/thickening profiles of the three un-milled (continuous line) and milled (discontinuousline) hydrocolloids: guar gum (A), tara gum (B), and methylcellulose (C). UN: un-milled; M: milled;GG: guar gum; TG: tara gum; MC: methylcellulose.
3.2. Properties of Binary Hydrocolloid–Starch Blends
The viscometric properties of a corn starch-rice flour system in the absence and presence of milledand un-milled hydrocolloids are reported in Table 2. The effects of both pure hydrocolloids and theball milling treatment are explored first, prior to analyzing the influence of different combinations ofpairs of hydrocolloids on the pasting profiles of the resulting starch–hydrocolloid blends.
Among the tested samples, the starch–flour system alone exhibited lower values of peak viscosity,breakdown, setback, and final viscosity than those observed when the single hydrocolloids were addedto the starch paste. Only the MC, irrespective of whether it had been treated or not, showed values ofsetback and final viscosity during the gelling/cooling stage similar to those of the individual starch(Table 2). A possible explanation for such an increase in viscosity could be that starch–hydrocolloiddispersions are complex biphasic systems composed of a suspension of swollen granules dispersed ina continuous medium in which amylose, low-molecular-weight amylopectin molecules and the addedhydrocolloids are located [24,25]. As gelatinization and pasting proceed, the starch granules continueto swell and, in turn, to absorb and bind more water, leading to a reduction of the volume occupied bythe hydrocolloids that, being more concentrated, cause a rise in the viscosity of the entire system [24].Furthermore, the thickening ability of hydrocolloids as well as interactions between hydrocolloids andswollen starch granules and/or leached amylose may also be involved as other concurrent factors [26].However, while the addition of both milled and un-milled hydrocolloids was significant in promotingthe viscosity levels, each hydrocolloid affected the pasting properties of the starch system in a differentway (Figure 3). In fact, during gelatinization and pasting, the viscosity profiles of the starch/GG
97

Foods 2020, 9, 517
mixtures were higher than those shown by the other galactomannan TG regarding peak viscosityand breakdown, whereas intermediate viscosity values were observed with the addition of the MC,in which the values of peak viscosity were significantly higher than those of the TG mixtures, but thevalues of breakdown were significantly lower than those of guar gum blends. Discussing the resultsmore in depth, it can be observed that within each tested hydrocolloid, the effect of the ball millingtreatment was found to be significant only in the case of GG, in which the mechanochemical treatmentseemed to have some detrimental effect on peak viscosity (Table 2). However, the UN-GG was thehydrocolloid that most strongly affected both peak viscosity and breakdown of the starch–flour mixture.This result could be explained by assuming that, during pasting, this hydrocolloid is not able to coveror interact with starch granules, but persists in the macromolecular medium which forms a sheetstructure [27]; in this way, it does not hinder the swelling of the starch granules, which are free to swell,leading to a great increase in peak viscosity. After that, the more fragile swollen granules, becomingless resistant to the mechanical shearing, lose their integrity, leading to a severe drop (the so-calledbreakdown) in the viscosity of the system that becomes, in turn, less stable [25]. The M-GG, on thecontrary, when added to the corn starch-rice flour mixture behaved in a different way, resulting ina lower and flatter peak viscosity. To better understand this different behavior, it must be borne in mindthat, due to the reduction of the crystalline domains caused by the ball milling treatment, the M-GGexhibited more fluidity than the UN-GG. Therefore, it can be hypothesized that this decrease in peakviscosity (in line with the results obtained in the gelling capacity analysis) may be due to the smoothflow that the M-GG molecules exhibit in the continuous phase without interacting with the leachedamylose and amylopectin [28]. Similar conclusions were reported by [28] to explain the decrease in thepeak viscosity observed when low-molecular-weight GG was added to a corn starch–rice flour system.
0102030405060708090100
0
2000
4000
6000
8000
10000
12000
14000
0 2 4 6 8 10 12 14
Tem
pera
ture
(°C
)
Vis
cosi
ty (m
Pa⋅s
)
Time (min)
Starch-flour UN-MC M-MC UN-GGM-GG UN-TG M-TG Temperature
Figure 3. Viscometric profiles of the corn starch/rice flour system in the absence and presence ofsingle milled and un-milled hydrocolloids. UN: un-milled; M: milled; GG: guar gum; TG: tara gum;MC: methylcellulose.
98
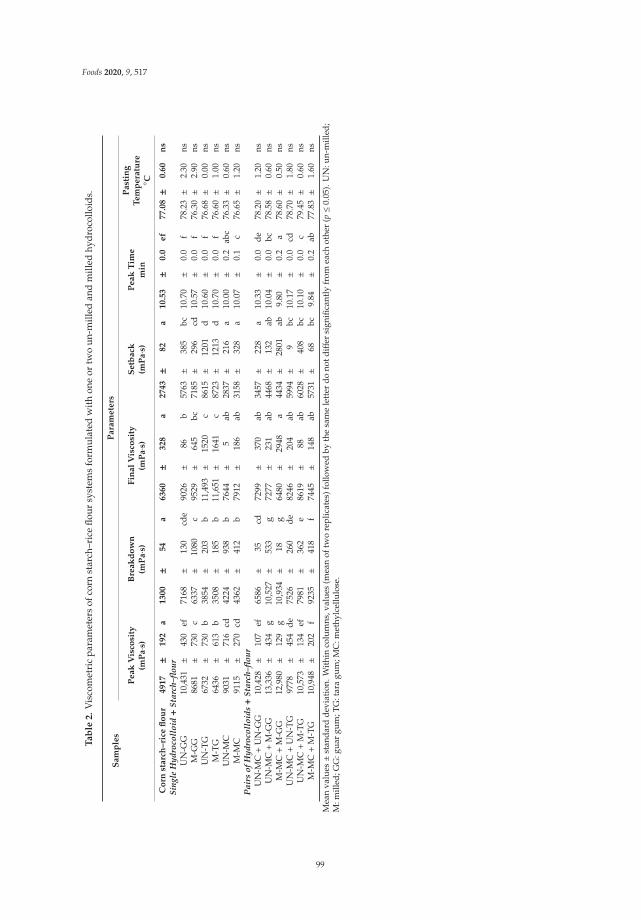
Foods 2020, 9, 517
Ta
ble
2.
Vis
com
etri
cpa
ram
eter
sof
corn
star
ch–r
ice
flour
syst
ems
form
ulat
edw
ith
one
ortw
oun
-mill
edan
dm
illed
hydr
ocol
loid
s.
Sam
ple
sP
ara
mete
rs
Peak
Vis
cosi
ty(m
Pa·s)
Bre
ak
do
wn
(mP
a·s)
Fin
al
Vis
cosi
ty(m
Pa·s)
Setb
ack
(mP
a·s)
Peak
Tim
em
in
Past
ing
Tem
pera
ture
◦ CC
orn
starc
h–ri
cefl
ou
r4917±
192
a1300±
54
a6360±
328
a2743±
82
a10.5
3±
0.0
ef
77.0
8±
0.6
0n
sSi
ngle
Hyd
roco
lloi
d+
Star
ch–fl
our
UN
-GG
10,4
31±
430
ef71
68±
130
cde
9026
±86
b57
63±
385
bc10
.70±
0.0
f78
.23±
2.30
nsM
-GG
8681
±73
0c
6337
±10
80c
9529
±64
5bc
7185±
296
cd10
.57±
0.0
f76
.30±
2.90
nsU
N-T
G67
32±
730
b38
54±
203
b11
,493±
1520
c86
15±
1201
d10
.60±
0.0
f76
.68±
0.00
nsM
-TG
6436
±61
3b
3508
±18
5b
11,6
51±
1641
c87
23±
1213
d10
.70±
0.0
f76
.60±
1.00
nsU
N-M
C90
31±
716
cd42
24±
938
b76
44±
5ab
2837±
216
a10
.00±
0.2
abc
76.3
3±
0.60
nsM
-MC
9115
±27
0cd
4362
±41
2b
7912
±18
6ab
3158±
328
a10
.07±
0.1
c76
.65±
1.20
nsP
airs
ofH
ydro
coll
oids+
Star
ch–fl
our
UN
-MC+
UN
-GG
10,4
28±
107
ef65
86±
35cd
7299
±37
0ab
3457±
228
a10
.33±
0.0
de78
.20±
1.20
nsU
N-M
C+
M-G
G13
,336±
434
g10
,527±
533
g72
77±
231
ab44
68±
132
ab10
.04±
0.0
bc78
.58±
0.60
nsM
-MC+
M-G
G12
,980±
129
g10
,934±
18g
6480
±29
48a
4434±
2801
ab9.
80±
0.2
a78
.60±
0.50
nsU
N-M
C+
UN
-TG
9778
±45
4de
7526
±26
0de
8246
±20
4ab
5994±
9bc
10.1
7±
0.0
cd78
.70±
1.80
nsU
N-M
C+
M-T
G10
,573±
134
ef79
81±
362
e86
19±
88ab
6028±
408
bc10
.10±
0.0
c79
.45±
0.60
nsM
-MC+
M-T
G10
,948±
202
f92
35±
418
f74
45±
148
ab57
31±
68bc
9.84
±0.
2ab
77.8
3±
1.60
ns
Mea
nva
lues±s
tand
ard
dev
iati
on.W
ithi
nco
lum
ns,v
alue
s(m
ean
oftw
ore
plic
ates
)fol
low
edby
the
sam
ele
tter
do
notd
iffer
sign
ifica
ntly
from
each
othe
r(p≤0
.05)
.UN
:un-
mill
ed;
M:m
illed
;GG
:gua
rgu
m;T
G:t
ara
gum
;MC
:met
hylc
ellu
lose
.
99

Foods 2020, 9, 517
As in the case of the GG, the TG, irrespective of whether it had been treated or not, also increasedthe peak viscosity, but the extent of this increase was significantly lower than that observed for GG(Table 2). Furthermore, while the TG showed a lower breaking viscosity during heating, it promotedhigher stability of the system. The authors of [26], when studying the interactions between wheatstarch and both guar and tara gums, reported opposite results to our findings. In fact, these authorsobserved higher values of peak viscosity using the TG, whereas they found similar values of breakdownand setback in the TG-containing samples compared to the guar gum mixtures. This contrastingbehavior, however, may be due to the different type of starch and/or to the different method of samplepreparation used. Furthermore, in contrast to what was previously reported for the gelling capacity ofthe milled TG (M-TG) dispersed in an aqueous environment, the ball milling treatment seemed to haveno effect on the pasting properties of the TG-starch blend. Presumably, in a complex system such asstarch–hydrocolloid mixtures, the overexposure of the hydroxyl groups previously hypothesized forthe TG as a consequence of the ball milling treatment, was counterbalanced by the competition forwater with the starch granules.
When hot pastes are cooled to 50 ◦C, a transition from a viscous liquid to a gel, the so-called setback,takes place, leading to an increase in the viscosity of the system primarily due to the re-associationof amylose molecules [29]. During this stage, the values of setback and final viscosity were foundto be higher than those of the individual starch system for both GG and TG, suggesting that bothgalactomannans may have a marked tendency to promote starch retrogradation (Table 2). In the case ofthe UN-GG, however, the extent of such an increase was significantly lower (Figure 3). The differencesin the molecular structure of these two galactomannans, especially in terms of the mannose/galactoseratio (3:1 for TG and 2:1 for GG) [10], could explain the differences in the gelling properties of theresulting starch–hydrocolloids blends. In fact, as reported by [30], the presence of a higher number ofgalactose side chains, which impart molecular flexibility, may facilitate intermolecular associationsbetween guar gum and starch components, delaying, in turn, starch retrogradation of the resultingblends. Moreover, an increase in the effective concentration of amylose in the continuous phase, whichleads to faster amylose gelation, could be considered as one of the main factors involved in promotingstarch retrogradation [25,26].
Unlike the galactomannans, the addition of the cellulose derivative MC, irrespective of whetherit had been treated or not, affected the pasting properties of the starch–flour system only during theheating stage (Figure 3). In fact, values of setback and final viscosity were found to be similar to thoseof the starch–flour system alone. As previously seen for both the GG and TG, the MC also increasedthe peak viscosity but, in this case, the amount of time to reach the peak was shorter (Table 2).
However, considering that the MC has the unique property needed to forming gels at temperaturesabove 60 ◦C [9], this early increase in the peak viscosity might be related to the hydrocolloid gelationrather than to an effective ability of the MC to assist granule swelling during heating. On the contrary,as previously observed by [31] in potato starch-MC composites, the ability of the MC to preventstarch retrogradation could be explained due to its water solubility. Presumably, the MC, acting asa water binder, could cause either the reduction of the available water required by amylose for therecrystallization process to occur or the inhibition of the possible cross-links between the hydrocolloidand the amylose molecules.
In summary, it can be said that both a cellulose derivative and galactomannans modified thegelatinization and retrogradation behavior of the corn starch–rice flour system in ways that varydepending on their different molecular structure and functionality. On the contrary, the conformationalchanges induced by mechanochemical treatment have not proven to be effective in changing thebehavior of the tested hydrocolloids, except in the case of guar gum.
3.3. Pasting Properties of Ternary Hydrocolloid–Hydrocolloid–Starch Blends
Considering that, in many food systems, the inclusion of a single hydrocolloid might be notsufficient to develop final products with specific attributes in terms of structure, viscosity, stability,
100

Foods 2020, 9, 517
and functionality, the effects of combinations of two hydrocolloids on the viscometric properties ofa corn starch–rice flour system were also analyzed. It is common agreement that the blending of twohydrocolloids with different functionality in food systems, such as gelling and thickening agents, canhave synergistic effects, conferring enhanced viscosity and improved or induced gelation [32,33]. In thisregard, six different combinations of both treated and un-treated hydrocolloids were studied: firstly,the UN-MC was combined with each of the two tested galactomannans either before and after the ballmilling treatment and, secondly, the M-MC was combined with each of the milled galactomannans.
As reported in Figure 4, the addition of two hydrocolloids, instead of one, significantly changedthe viscometric profile of the starch–flour system during both heating and cooling cycles, not onlywhen compared to the individual starch, but also in comparison with the binary blends (Table 2).Among the tested samples, no significant differences were observed only in the pasting temperatureparameter, whereas, as stated above, the decreased times to reach the peak viscosity observed in allthe experimental blends prepared with the addition of MC were probably due to the thermogelationproperties of this cellulose derivative.
0
20
40
60
80
100
02000400060008000
100001200014000
0 2 4 6 8 10 12 14
Tem
pera
ture
(°C
)
Vis
cosi
ty (m
Pa⋅s
)
Time (min)
UN-MC + UN-GG UN-MC + M-GG M-MC + M-GG Starch-flour Temperature
0
20
40
60
80
100
02000400060008000
100001200014000
0 2 4 6 8 10 12 14
Tem
pera
ture
(C
)
⋅
Time (min)
UN-MC + UN-TG UN-MC + M-TG M-MC + M-TG Starch-flour Temperature
B
A
Figure 4. Viscometric profiles of the corn starch-rice flour system in the absence and presence of twomilled and un-milled hydrocolloids. MC-GG-starch/flour (A) and MC-TG-starch/flour (B) ternarymixtures. UN: un-milled; M: milled; GG: guar gum; TG: tara gum; MC: methylcellulose.
Analyzing the results more in depth, it can be observed that the highest peak viscosity andbreakdown were obtained in those blends in which the milled guar gum was combined with both theM- and UN-MC (Table 2). These results, being even higher than those that occurred in each hydrocolloidindividually, suggested additive interactions between these two gums. A possible explanation for suchan increase in viscosity could be that the MC, acting as a gelling agent, is able to build up a networkin which the GG, acting as thickening agent, fills up the spaces [32]; in this way, the concentration ofthe continuous phase increases, causing, in turn, a rise in viscosity of the entire system. Moreover,considering that such an increase was less pronounced when the two hydrocolloids were combinedin their native form, it can be hypothesized that the structural changes induced by the ball millingtreatments (especially for guar gum) may have facilitated such heterotypic interactions. In addition,
101

Foods 2020, 9, 517
during the cooling stage, the values of setback and final viscosity, being lower than those observedfor the M-GG/starch mixture, suggested that the addition of both the M- and UN-MC may promotea marked tendency to prevent starch retrogradation of the resulting ternary blends.
As in the case of the M-GG, the TG used in combination with both the M- and UN-MC alsoincreased peak viscosity and breakdown of the starch–flour system, but the effect was less pronouncedwhen the two hydrocolloids were combined in their native form (Figure 4B). During the cooling stage,however, lower values of final viscosity and setback were observed as compared to the binary mixturewith added the M-TG, but higher values of setback and similar values of final viscosity were obtainedas compared to the binary mixture with both the M- and UN-MC (Table 2). On the basis of theseresults, it can be hypothesized that, although there have been additive interactions between the twohydrocolloids, the blending of MC and GG seemed to be more effective in modifying the viscometricprofile of the corn starch–rice flour system.
3.4. Viscoelastic Properties of Hydrocolloids Starch Gels
The viscoelastic parameters of the corn starch/rice flour system in the absence and presence ofmilled and un-milled hydrocolloids were measured at 50 ◦C immediately after pasting.
In all the tested samples, the storage modulus (G′), the elastic component of the material, washigher than the loss modulus (G′′), the viscous part of the material, indicating that all the starchpastes had a solid, elastic-like behavior typical of a biopolymer gel (Table 1). However, for all thetested mixtures, values of both dynamic moduli did not differ significantly from those of the starchalone, except for the UN-GG/starch and M-TG/starch gels, in the case of the binary mixtures, andthe M-MC/M-TG/starch gels, in the case of the ternary mixtures. Such increases in the viscoelasticproperties observed in both mixtures prepared with the M-TG, as well as in the binary mixture preparedwith the UN-GG, may be attributed to an increase in the viscoelastic properties of the individual gums.However, the mechanochemical treatment seemed to affect the galactomannans behavior in oppositeways. In fact, in the case of GG, the elastic properties of the starch-hydrocolloid system were found tobe higher than those of the individual starch only when the gum was added in its pure form, suggestingthat the mechanochemical treatment might have lowered the tendency of the GG to form gels, probablyas a result of increased synergistic interactions. On the contrary, in the blends obtained by addingthe UN-TG, considering that no differences in the values of both dynamic moduli (apart from a slightincrease in the binary mixture) were observed in comparison to the individual starch (Table 3), it canbe assumed that the ball milling treatment may have favorably affected the hydrocolloid behavior inthis complex system.
Moreover, analyzing the results more in depth, it can be observed that the addition of the M-TGinto the starch–flour system led to an increase in G” values more pronounced than that observedin G’, indicating that this galactomannan was more effective in increasing the viscous properties ofthe system rather than the elastic properties (Table 3). A possible explanation for these results couldbe related to the phase separation between starch components and galactomannan that takes placein the dispersed phase as a result of thermodynamic incompatibility between these two chemicallydissimilar polymers [24]. In this way, intramolecular interactions may be energetically promoted incomparison with intermolecular associations, modifying the viscoelastic properties of the resultingstarch–hydrocolloid gels. Similar conclusions were reported by [34] to explain the increase in the viscousproperties of a rice starch–flour system when increasing concentration levels of the TG (0.2%–0.6%) areadded to it. In addition, although no significant differences were observed in the tan δ values of all thehydrocolloid-starch pastes with respect to the individual starch, the highest values of the ratio G′′/G′shown by both the M-TG starch mixtures seemed to further confirm the results described above.
102

Foods 2020, 9, 517
Table 3. Viscoelastic properties of corn starch–rice flour systems formulated with one or two un-milledand milled hydrocolloids.
SamplesStorage Modulus
G′ (Pa)Loss Modulus
G′′ (Pa)Loss Tangent
tan δ
Corn starch–rice flour 1449 ± 191 abc 147 ± 0 a 0.103 ± 0.013 ns
Single Hydrocolloid +Starch–flour
UN-GG 2024 ± 320 d 234 ± 12 ab 0.117 ± 0.012 nsM-GG 1222 ± 227 a 151 ± 31 a 0.124 ± 0.002 ns
UN-TG 1785 ± 105 cd 315 ± 66 ab 0.176 ± 0.026 nsM-TG 2887 ± 173 e 635 ± 335 c 0.217 ± 0.103 ns
UN-MC 1254 ± 161 ab 212 ± 20 ab 0.170 ± 0.005 nsM-MC 1287 ± 230 ab 239 ± 66 ab 0.185 ± 0.018 ns
Pairs of Hydrocolloids+ Starch–flour
UN-MC + UN-GG 1594 ± 101 abcd 245 ± 50 ab 0.153 ± 0.021 nsUN-MC +M-GG 1705 ± 201 bcd 252 ± 3 ab 0.149 ± 0.016 nsM-MC +M-GG 1816 ± 34 cd 284 ± 37 ab 0.157 ± 0.018 ns
UN-MC + UN-TG 1379 ± 14 abc 237 ± 6 ab 0.172 ± 0.002 nsUN-MC +M-TG 1751 ± 523 cd 312 ± 113 ab 0.177 ± 0.012 nsM-MC +M-TG 1942 ± 26 d 399 ± 110 b 0.206 ± 0.059 ns
Mean values ± standard deviation. Within columns, values (mean of two replicates) followed by the same letterdo not differ significantly from each other (p ≤ 0.05). UN: un-milled; M: milled; GG: guar gum; TG: tara gum;MC: methylcellulose.
4. Conclusions
On the basis of the data obtained by XRD experiments and gelling tests, it could be said thatthe ball milling treatment affected the structure of the tested hydrocolloids and, in turn, the viscosityof their aqueous solutions in different ways. On the one hand, in the case of the GG, the reductionof the crystalline domains and the consequent increase in the fluidity of the system induced by themechanochemical treatment seemed to be the main causes of the decrease in viscosity observed whenthe M-GG aqueous solutions were compared with those prepared with the UN-GG; on the other hand,in the case of the TG, the larger exposure of the hydroxyl groups seemed to justify the increase inviscosity observed in the M-TG aqueous solutions when compared to those prepared with the UN-TG,even if it was not possible to confirm this effect with XRD and IR analysis. On the contrary, the MCseemed to have an intermediate behavior between the two effects, leading to aqueous solutions withthe same viscosity.
When each hydrocolloid was individually combined with a starch–flour system, these same trendswere observed in the viscometric profiles of the starch–hydrocolloid systems, with the exception ofstarch-TG blends in which no differences between blends containing the M- and the UN-forms wereobserved. However, considering that the conformational changes induced by the mechanochemicaltreatment seemed to be effective only in the case of the GG, it could be assumed that the differentpasting properties observed in the binary starch–hydrocolloid mixtures in comparison to the starchalone might be due to the type of hydrocolloid added rather than to structural changes induced bythe treatment. On the contrary, the ball milling treatment seemed to be more effective when twocombined hydrocolloids, especially when they were both in the milled form, were simultaneouslyadded to the starch–flour system. On the contrary, the dynamic moduli of the cornstarch–rice flour gelswere significantly affected by the addition of the hydrocolloids only in the case of the UM-GG/starch,M-TG/starch, and M-MC/M-TG/starch blends, indicating that the ball milling treatment was involvedin promoting phase separation between starch and M-TG molecules in the dispersed phase to a greaterextent in comparison to the guar systems.
This study represents a preliminary attempt to understand how the effects induced by the ballmilling treatment on different types of hydrocolloids may change their functionality not only when
103

Foods 2020, 9, 517
they are used alone, but also when they are included in a complex system, such as a starch–floursystem. Further experiments are needed to analyze more in depth which intra- and inter-molecularinteractions, occurring between starch and treated hydrocolloids and within the same hydrocolloidmolecules, may be involved in changing the paste and gel behavior of starch–hydrocolloid systems.
Author Contributions: Conceptualization, L.N., P.C., and C.F.; methodology, L.N., P.C., S.G., A.P., and C.F.; formalanalysis, L.N., P.C., and V.F.; data curation, L.N., P.C., S.G., V.F., A.P., and C.F.; writing—original draft preparation,L.N., P.C., S.G., V.F., A.P., and C.F.; writing—review and editing, L.N., P.C., S.G., V.F., A.P., and C.F.; supervision,C.P., A.P., and C.F.; project administration, C.F.; funding acquisition, C.F. All authors have read and agreed to thepublished version of the manuscript.
Funding: This research was funded by Sardegna Ricerche (Capitale Umano ad Alta Qualificazione”, 2015—L.R.n◦7, 7 agosto 2007). Project title: “Studio di nuovi ingredienti per il miglioramento delle proprietà tecnologiche,sensoriali e nutrizionali di prodotti da forno gluten-free”. Valeria Farina and Dr. Luca Nuvoli are supportedby a PhD program in a collaborative scheme between the University of Sassari and Cagliari of Italy, which isendorsed by the Autonomous Regional Administration of Sardinia (RAS).
Acknowledgments: The authors acknowledge the support of CeSAR UNISS, “Centro Servizi di Ateneo per laRicerca” of the University of Sassari, for making the XRD apparatus (SmartLab Rigaku) available to carry outmaterial characterization.
Conflicts of Interest: The authors declare no conflict of interest.
References
1. Biliaderis, C.G.; Arvanitoyannis, I.; Izydorczyk, M.S.; Prokopowich, D.J. Effect of hydrocolloids ongelatinization and structure formation in concentrated waxy maize and wheat starch gels. Starch/Staerke1997, 49, 278–283. [CrossRef]
2. Copeland, L.; Blazek, J.; Salman, H.; Tang, M.C. Form and functionality of starch. Food Hydrocoll. 2009, 23,1527–1534. [CrossRef]
3. Rosell, C.M.; Yokoyama, W.; Shoemaker, C. Rheology of different hydrocolloids-rice starch blends. Effect ofsuccessive heating-cooling cycles. Carbohydr. Polym. 2011, 84, 373–382. [CrossRef]
4. Gao, Z.; Fang, Y.; Cao, Y.; Liao, H.; Nishinari, K.; Phillips, G.O. Hydrocolloid-food component interactions.Food Hydrocoll. 2017, 68, 149–156. [CrossRef]
5. Burey, P.; Bhandari, B.R.; Howes, T.; Gidley, M.J. Hydrocolloid gel particles: Formation, characterization, andapplication. Crit. Rev. Food Sci. Nutr. 2008, 48, 361–377. [CrossRef]
6. Liu, X.; Mu, T.; Sun, H.; Zhang, M.; Chen, J.; Fauconnier, M.L. Influence of different hydrocolloids on doughthermo-mechanical properties and in vitro starch digestibility of gluten-free steamed bread based on potatoflour. Food Chem. 2018, 239, 1064–1074. [CrossRef]
7. Conte, P.; Fadda, C.; Drabinska, N.; Krupa-Kozak, U. Technological and nutritional challenges, and noveltyin gluten-free breadmaking: A review. Pol. J. Food Nutr. Sci. 2019, 69, 5–21. [CrossRef]
8. Dickinson, E. Hydrocolloids as emulsifiers and emulsion stabilizers. Food Hydrocoll. 2009, 23, 1473–1482.[CrossRef]
9. Nasatto, P.L.; Pignon, F.; Silveira, J.L.M.; Duarte, M.E.R.; Noseda, M.D.; Rinaudo, M. Methylcellulose,a cellulose derivative with original physical properties and extended applications. Polymers 2015, 7, 777–803.[CrossRef]
10. Prajapati, V.D.; Jani, G.K.; Moradiya, N.G.; Randeria, N.P.; Nagar, B.J.; Naikwadi, N.N.; Variya, B.C.Galactomannan: A versatile biodegradable seed polysaccharide. Int. J. Biol. Macromol. 2013, 60, 83–92.[CrossRef]
11. Song, J.Y.; Kwon, J.Y.; Choi, J.; Kim, Y.C.; Shin, M. Pasting properties of non-waxy rice starch–hydrocolloidmixtures. Starch/Staerke 2006, 58, 223–230. [CrossRef]
12. Rojas, J.A.; Rosell, C.M.; Benedito De Barber, C. Pasting properties of different wheat flour-hydrocolloidsystems. Food Hydrocoll. 1999, 13, 27–33. [CrossRef]
13. Abbaszadeh, A.; Macnaughtan, W.; Foster, T.J. The effect of ball milling and rehydration on powderedmixtures of hydrocolloids. Carbohydr. Polym. 2014, 102, 978–985. [CrossRef]
14. Lu, X.; Zhang, H.; Li, Y.; Huang, Q. Fabrication of milled cellulose particles-stabilized Pickering emulsions.Food Hydrocoll. 2018, 77, 427–435. [CrossRef]
104

Foods 2020, 9, 517
15. Tian, Y.; Zhang, K.; Zhou, M.; Wei, Y.J.; Cheng, F.; Lin, Y.; Zhu, P.X. High-Performance Starch Films ReinforcedWith Microcrystalline Cellulose Made From Eucalyptus Pulp via Ball Milling and Mercerization. Starch/Staerke2019, 71, 1800218. [CrossRef]
16. Ramadhan, K.; Foster, T.J. Effects of ball milling on the structural, thermal, and rheological properties of oatbran protein flour. J. Food Eng. 2018, 229, 50–56. [CrossRef]
17. Avolio, R.; Bonadies, I.; Capitani, D.; Errico, M.E.; Gentile, G.; Avella, M. A multitechnique approach toassess the effect of ball milling on cellulose. Carbohydr. Polym. 2012, 87, 265–273. [CrossRef]
18. Martínez, M.M.; Macias, A.K.; Belorio, M.L.; Gómez, M. Influence of marine hydrocolloids on extruded andnative wheat flour pastes and gels. Food Hydrocoll. 2015, 43, 172–179. [CrossRef]
19. Gong, H.; Liu, M.; Chen, J.; Han, F.; Gao, C.; Zhang, B. Synthesis and characterization of carboxymethyl guargum and rheological properties of its solutions. Carbohydr. Polym. 2012, 88, 1015–1022. [CrossRef]
20. Mudgil, D.; Barak, S.; Khatkar, B.S. X-ray diffraction, IR spectroscopy and thermal characterization of partiallyhydrolyzed guar gum. Int. J. Biol. Macromol. 2012, 50, 1035–1039. [CrossRef]
21. Oliveira, R.L.; Vieira, J.G.; Barud, H.S.; Assunção, R.M.N.; Filho, G.R.; Ribeiro, S.J.L.; Messadeqq, Y. Synthesisand characterization of methylcellulose produced from bacterial cellulose under heterogeneous condition.J. Braz. Chem. Soc. 2015, 26, 1861–1870. [CrossRef]
22. Mariani, A.; Nuvoli, L.; Sanna, D.; Alzari, V.; Nuvoli, D.; Rassu, M.; Malucelli, G. Semi-interpenetratingpolymer networks based on crosslinked poly (N-isopropyl acrylamide) and methylcellulose prepared byfrontal polymerization. J. Polym. Sci. Part A Polym. Chem. 2018, 56, 437–443. [CrossRef]
23. Hirrien, M.; Chevillard, C.; Desbrières, J.; Axelos, M.A.V.; Rinaudo, M. Thermogelation of methylcelluloses:New evidence for understanding the gelation mechanism. Polymer (Guildf) 1998, 39, 6251–6259. [CrossRef]
24. Alloncle, M.; Doublier, J.L. Viscoelastic properties of maize starch/hydrocolloid pastes and gels. Top. Catal.1991, 5, 455–467. [CrossRef]
25. Bemiller, J.N. Pasting, paste, and gel properties of starch–hydrocolloid combinations. Carbohydr. Polym. 2011,86, 386–423. [CrossRef]
26. Funami, T.; Kataoka, Y.; Omoto, T.; Goto, Y.; Asai, I.; Nishinari, K. Effects of non-ionic polysaccharides on thegelatinization and retrogradation behavior of wheat starch. Food Hydrocoll. 2005, 19, 1–13. [CrossRef]
27. Chaisawang, M.; Suphantharika, M. Effects of guar gum and xanthan gum additions on physical andrheological properties of cationic tapioca starch. Carbohydr. Polym. 2005, 61, 288–295. [CrossRef]
28. Funami, T.; Kataoka, Y.; Omoto, T.; Goto, Y.; Asai, I.; Nishinari, K. Food hydrocolloids control the gelatinizationand retrogradation behavior of starch. 2a. Functions of guar gums with different molecular weights on thegelatinization behavior of corn starch. Food Hydrocoll. 2005, 19, 15–24. [CrossRef]
29. Collar, C.; Conte, P.; Fadda, C.; Piga, A. Gluten-free dough-making of specialty breads: Significance ofblended starches, flours and additives on dough behaviour. Food Sci. Technol. Int. 2015, 21, 523–536.[CrossRef]
30. Funami, T. Functions of Food Polysaccharides to Control the Gelatinization and Retrogradation Behaviors ofStarch in an Aqueous System in Relation to the Macromolecular Characteristics of Food Polysaccharides.Food Sci. Technol. Res. 2010, 15, 557–568. [CrossRef]
31. Kohyama, K.; NIshinari, K. Cellulose Derivatives Effects on Gelatinization and Retrogradation of SweetPotato Starch. J. Food Sci. 1992, 57, 128–131. [CrossRef]
32. Hoefler, A.C. Hydrocolloids; Eagan Press Handbook Series, St.: Paul, MN, USA, 2004.33. Saha, D.; Bhattacharya, S. Hydrocolloids as thickening and gelling agents in food: A critical review. J. Food
Sci. Technol. 2010, 47, 587–597. [CrossRef] [PubMed]34. Lee, H.Y.; Jo, W.; Yoo, B. Rheological and microstructural characteristics of rice starch–tara gum mixtures.
Int. J. Food Prop. 2017, 20, 1879–1889. [CrossRef]
© 2020 by the authors. Licensee MDPI, Basel, Switzerland. This article is an open accessarticle distributed under the terms and conditions of the Creative Commons Attribution(CC BY) license (http://creativecommons.org/licenses/by/4.0/).
105


foods
Article
Dough Rheological Behavior and MicrostructureCharacterization of Composite Dough with Wheatand Tomato Seed Flours
Silvia Mironeasa and Georgiana Gabriela Codină *
Faculty of Food Engineering, Stefan cel Mare University of Suceava, 720229 Suceava, Romania;[email protected]* Correspondence: [email protected]; Tel.: +40-745460727
Received: 27 October 2019; Accepted: 25 November 2019; Published: 30 November 2019
Abstract: The rheological and microstructural aspects of the dough samples prepared from wheatflour and different levels of tomato seed flour (TSF) were investigated by rheology methods throughthe Mixolab device, dynamic rheology and epifluorescence light microscopy (EFLM). The Mixolabresults indicated that replacing wheat flour with TSF increased dough development time, stability, andviscosity during the initial heating-cooling cycle and decreased alpha amylase activity. The dynamicrheological data showed that the storage modulus G’ and loss modulus G” increased with the level ofTSF addition. Creep-recovery tests of the samples indicated that dough elastic recovery was in a highpercentage after stress removal for all the samples in which TSF was incorporated in wheat flour.Using EFLM all the samples seemed homogeneous showing a compact dough matrix structure. Theparameters measured with Mixolab during mixing were in agreement with the dynamic rheologicaldata and in accordance with the EFLM structure images. These results are useful for bakery producersin order to develop new products in which tomato seed flour may be incorporated especially for wheatflours of a good quality for bread making and high wet gluten content. The addition of TSF may havea strength effect on the dough system and will increase the nutritional value of the bakery products.
Keywords: tomato seed flour; wheat flour; dough rheology; microstructure
1. Introduction
Tomato (Lycopersicon esculentum) is one of the most consumed vegetables, as raw (fresh), cooked,in food preparations and as processed products such as tomato juice, puree, paste, ketchup, sauceand canned tomato. Due to its nutritional and bioactive components, the foods products in whichtomato is incorporated represents a valuable source of minerals, vitamins and antioxidants, namelylycopene, which varies according to the tomato variety, maturity and agro-environmental factorsduring growth [1,2]. Post-harvest storage conditions [3,4] and processing technology [5] also influencethe tomatoes and tomato-based food products. Dietary intake of tomatoes and processed tomatoproducts has been associated with a decrease in susceptibility to chronic diseases such as various type ofcancers and cardiovascular diseases [6]. The medical or health benefits of tomato intake are attributedto the natural antioxidant compounds present in tomato such as ascorbic acid, carotenoids (mainlylycopene) and phenolic compounds which play a crucial role in the health protection mechanisms byscavenging free radicals [7].
Processing of tomatoes leads to a high amount of by-products, about 3–7% of the tomatoweight [8,9] that generates serious environmental problems for the industry concerned due to thedisposal of the organic material. Tomato pomace, the major part of the by-products, includes mainlyseeds and peels in various proportions and a small amount of pulp [10]. Some amounts of by-productsare used in animal feed or as soil fertilizers [11]. However, today there is an increasing trend of
Foods 2019, 8, 626; doi:10.3390/foods8120626 www.mdpi.com/journal/foods107

Foods 2019, 8, 626
using this by-product as a source of functional components in different products knowing that thetomato pomace is a rich source of valuable compounds which can be recovered and used in food,pharmaceutical and cosmetic industries as natural ingredients [12,13]. In the chemical compositionof tomato pomace high level of total dietary fibers, proteins, fats and medium amounts of ash arefound [14].
The peel and seed by-products of tomato pomace represents approximately 20–50 g·kg−1 of theinitial weight of tomatoes and can be used individually or combined [14]. Regarding the combinedutilization, the literature reports that, due to the significant amounts of bioactive phytochemicals fromtomato pomace, it can be used as natural antioxidants for the formulation of functional foods, or asadditives in food systems to extend their shelf-life [15–17]. Other studies showed that tomato pomacecan be considered a good source of some macroelements, such as potassium, manganese and calciumand microelements, i.e., copper and zinc, which are cofactors of the antioxidant enzymes [15]. Asindividual part of by products, many studies [16–19] highlighted the possibility of using the tomatopeels as a source of carotenoids and antioxidants to enrich various foods products or to produce newfunctional ones. The other part of tomato by-product, tomato seeds, account for approximately 10%of the fruit and 60% of the total by-product and contain a high amount for protein, fat and mineralelements such as potassium, calcium, iron, manganese, zinc and copper [14,20]. Tomato seed proteinspresent adequate properties to form a good emulsion in a food system [21]. An improved proteinquality for bread supplemented with 10% seed meal was reported by Sogi et al. [22]. According toKramer and Kwee [23] the nutritive value of tomato seed protein is lower than of casein but equivalentor higher than of other plant proteins. The net protein retention (NPR) of whole tomato seed meal,defatted tomato seed meal and tomato seed protein concentrate was reported as 2.65%, 2.52% and2.51%, respectively which were lower but comparable with those obtained for casein, 2.91% (drybasis) [24].
High levels of essential amino-acids present in tomato seeds showed that this by-product presentshigh quality proteins, with a high amount of lysine (3.4–5.9%) [25–27]. The amount of lysine in tomatoseed is approximately 13% higher than the amount found in the soy protein [28]. Therefore, the tomatoseed may be recommended to fortify various low-lysine food products that are deficient in this aminoacid. One of these products are the bakery ones of which the base raw material is wheat flour whichcontains low amounts of lysine. In addition, compared to other seed sources, no anti-nutritionalconstituents have been reported in tomato seeds [29], a fact that make them a better source of proteinscompared to other non-conventional sources.
The use of tomato seeds in order to improve the quality of food products were less studied.These studies were focused especially on the use of the dried pomace [30,31] or tomato peels in foodproducts [32,33]. However, the use of tomato seed in bread making has been previously reportedin a few studies [34–36] which were especially referring to the tomato seed addition effect on breadquality. To our knowledge, the information on the effect of partial substitution of wheat flour withwhole tomato seed flour on dough rheological properties are missing. No studies have been made onthe effect of wheat flour substitution with tomato seed flour at the levels of 5%, 10%, 15% and 20%on dough rheological properties and its microstructure. The use of this kind of methodology, whichinvestigates both empirical and fundamental rheological properties on this subject, is not frequent.Also, the investigation of dough microstructure through a modern device namely epifluorescence lightmicroscopy (EFLM) helped us to better understand the wheat flour dough behavior with differentlevels of tomato seed flour (TSF) addition during the bread making technological process. The objectiveof this study was: (1) to evaluate the physicochemical characteristics for the wheat–tomato seedcomposite flours; (2) to investigate the changes that occur in the dough formed by the wheat–tomatoseed composite flours during mixing as well as the quality of starch and protein from the doughsystem by using the Mixolab device; (3) to analyze the effect of tomato seed flour addition (TSF) onthe fundamental dough rheological properties by using a rheometer on which oscillatory frequency
108

Foods 2019, 8, 626
test and creep recovery test was performed; (4) to analyze the effect of TSF on dough microstructure,further analyzed through epifluorescence light microscopy (EFLM).
2. Materials and Methods
2.1. Flour Samples
One commercial refined wheat flour type 650 was used. The wheat flour was provided by S.C.Mopan S.A. Company (Suceava, Romania), a local milling company. Tomato seed flour was collectedfrom tomatoes (Solanum lycopersicum) cultivated in Suceava County, Romania. The tomato seeds wereseparated and cleaned after our own developed procedure from the tomato by-product (peel, pulp andseeds) with water, at the temperature of 24 ◦C, after which they were dried in a tray dryer (MemmertUF30, City, Schwabach, Germany) at 50 ◦C until its moisture content reached less than 10% (wet basis).This was to limit the loss of available bioactive compounds which are still available even at high levelsof drying temperature, namely 60 ◦C according to Nour et al. [15] or 70 ◦C according to Sogi et al. [22].After cooling, the tomato seed were ground in an electrical mill (Heinner, Navy 150, GuangdongCity, China). Sieving was made on sieves using a vibratory shaker (Retsch Vibratory Sieve Shaker AS200 basic, Haan, Germany) in order to obtain particle sizes lower than 500 μm. The raw materialswere analyzed according to the international or Romanian standard methods. The moisture contentwas determined according to International Association for Cereal Chemistry (ICC) method 110/1, ashcontent according to ICC 104/1, protein content according to ICC 105/2, fat content according to ICC136. The wheat flour mixes (blends) were analyzed also for the falling number value according toICC 107/1. The gluten deformation and wet gluten content were analyzed according to the Romanianstandard SR 90/2007.
2.2. Flour Composites
Flour composites were obtained from the wheat flours which were substituted by tomato seedflour at the levels of 0%, 5%, 10%, 15% and 20%. The wheat–tomato seed composite flours wereanalyzed for their moisture content according to ICC 110/1, fat content according to ICC 136, proteincontent according to 105/2, ash content according to ICC 104/1 and falling number according to ICC107/1. According to previously studies [15] it seems that the incorporation of tomato pomace in wheatflour up to 10% level did not have a negative effect on the acceptability of bread. Also, according toCarlson et al. [34], from the technological point of view, high levels of 20% tomato seed flour additionin wheat flour increased loaf volume of bread. However, higher levels such as 25% tomato pomaceaddition in wheat flour presented a negative effect on the flavor quality of bakery products as Bhat andAhsan [30] reported.
2.3. Evaluation of Wheat–Tomato Seed Composite Flours on Mixolab Dough Rheological Properties
The Mixolab device (Chopin, Tripette et Renaud, Paris, France) was used to analyze the mixingand pasting behavior of wheat–tomato seed composite flours according to ICC standard methodNo.173. The tests were made for each sample in order to achieve the optimum dough consistencyof 1.1 Nm. The evaluated parameters from the Mixolab curve were the water absorption capacity(WA), dough development time (DT), dough stability (ST), minimum torque value corresponding tothe initial heating (C2), maximum torque value corresponding to the heating stage (C3), torque valuecorresponding to the stability of hot starch paste (C4), torque value corresponding to the final starchpaste viscosity after cooling (C5) and the difference between Mixolab torques C1 and C2 (C1-2), C2 andC3 (C3-2), C3 and C4 (C3-4), C4 and C5 (C5-4).
109

Foods 2019, 8, 626
2.4. Evaluation of Wheat–Tomato Seed Composite Flours on Rheological Properties
Oscillatory and creep and recovery tests were performed at 25 ◦C using a HAAKE MARS 40rheometer (Termo-HAAKE, Karlsruhe, Germany) with non-serrated parallel plate geometry with adiameter of 40 mm and a gap width of 2 mm.
The dough samples were prepared at optimum Farinograph water absorption by mixing untilfull dough development by using a Brabender Farinograph®-E with a 300 g capacity (BrabenderOHG, Duisburg, Germany). The composite flour of 14% moisture basis was kept in the Farinographbowl and during mixing water was added from the burette to give a dough consistency of 500 BU.Then, the sample prepared was placed between plates and rested for 5 min to allow relaxation andtemperature stabilization. The mechanical spectra were measured in a range of linear viscoelasticity, atconstant stress of 15 Pa, in frequency sweeps from 1 to 20 Hz. The range of linear viscoelasticity wasestablished based on the dependence of storage modulus (G’) and loss modulus (G”) on stress in theregion 0.01–100 Pa, at constant oscillation frequency of 1 Hz. The experimental data acquired weredescribed by the power model [37,38]:
G′(ω) = K′ ·ωn′ (1)
G′′ (ω) = K′′ ·ωn′′ (2)
where: G’ is storage modulus (Pa), G” is loss modulus (Pa), ω is angular frequency (rad/s), K’, K”(Pa·sn’), n’, n” are experimental constants.
Creep-recovery tests were performed in the range of the linear viscoelasticity at constant stress of50 Pa. The creep stage time was of 60 s, and the recovery stage was 180 s. The obtaining data of strainas a function of time were expressed in the form of compliance using the following equation [39]:
J(t) = γ(t)/σ (3)
where J (Pa−1) is compliance, γ is the strain and σ is the constant stress applied during the creep test(Pa−1).
Experimental data from creep and recovery tests were analyzed by means of a compliancerheological parameter and fitted to the parameter Burger model [40,41] using the Equation (4) for thecreep phase and Equation (5) for the recovery phase.
J(t) = JCo + JCm (1 − exp(−t/λC)) + t/μCo (4)
J(t) = Jmax − JRo − JRm(1 − exp(−t/λR)) (5)
where Jio (Pa−1) is the instantaneous compliance, Jim (Pa−1) is the retarded elastic compliance orviscoelastic compliance, t (s) is the phase time, λi (s) is the retardation time, μCo (Pa·s) is the zero shearviscosity and Jmax (Pa−1) is the maximum creep compliance obtained at the end of the creep test. Therecovery compliance, Jr (Pa−1), evaluated where dough recovery reached equilibrium, is calculatedby the sum of JRo and JRm. The relative elastic part of the maximum creep compliance, expressed aspercent recovery was determined using Equation (6) [42,43]:
Recovery (%) =Jr
Jmax· 100 (6)
where: Jmax is the maximum creep compliance value in the creep phase for the 60 s, which correspondsto the maximum deformation, and Jr is the compliance value at the end of the recovery phase.
110

Foods 2019, 8, 626
2.5. Microstructure of Flour Composite Dough
Epifluorescence light microscopy (EFLM) was used to characterize the microstructure of wheatflour dough with different levels of tomato seed flour addition. Dough microstructure was analyzedusing a Motic AE 31 inverted microscope (Motic, Optic Industrial Group, Xiamen, China) operatedby catadioptric objectives LWD PH 203 (N.A. 0.4). A thin portion was cut from the dough sampleand dipped in a fixing solution composed of 1% rhodamine B and 0.5% fluorescein (FITC) in2-methoxyethanol obtained from Sigma-Aldrich, Germany for at least 1 h. Fluorescein and rhodamineB was used as two fluorescent dyes specific for detecting starch and proteins in the dough samples.Fluorescein detects starch and rhodamine B proteins from the dough system. The EFLM images wereanalyzed using ImageJ (v. 1.45, National Institutes of Health, Bethesda, MD, USA) software accordingto Peighambardoust et al. [44] and Codină and Mironeasa [45,46].
2.6. Statistical Analysis
The experimental data and fitting parameters of the employed models were statistically evaluatedby one-way analysis of variance (ANOVA) followed by the least significant difference (LSD) test atsignificance level of 0.05 using SPSS software (trial version, IBM, Armonk, NY, USA). The goodness offit of the models was assessed using the corresponding determination coefficients (R2).
3. Results and Discussions
3.1. Flour Characteristics
The analytical characteristics of wheat flour samples were as following: 8.00 mm glutendeformation index, 58.50–62.90% water absorption, 14.50% moisture, 33.00% wet gluten and 0.65%ash content. According to the wheat flour analytical data these were of a very good quality for breadmaking [47]. The wheat flour used in our study presented high FN values (445 s) indicating that theyhad a low α amylase activity.
The tomato seed flour presented the following chemical characteristics (dry basis): 6.94/100gmoisture content, 29.50/100g protein content, 19.50/100g fat content and 3.92/100g ash content.According to the data obtained, the tomato seed flour was rich in fat and proteins, these values beingin agreement with those reported by Mechmeche et al. [25] and Del Valle et al. [9] for tomato seeds.
3.2. Wheat–Tomato Seed Composite Flours Physicochemical Characteristics
The physicochemical characteristics of the wheat–tomato seed composite flours are shown inTable 1. As it may be seen in the composite flours the fat, protein and ash increased with the increaseof tomato seed flour addition level whereas the moisture decreased. This was expectable due to thefact that tomato seed flour has a higher amount of fat, proteins and ash and a lower moisture valuecompared to wheat flour. For the samples in which 20% tomato seed flour was incorporated the valuesof the fat and ash content were tripled and doubled compared to the control sample whereas theprotein content values increased by 27.5%.
The Falling Number (FN) values increased at an addition level up to 10% tomato seed after whichits values slightly decreased. This fact indicates that when high levels of TSF were added in wheat flourthe blend flour slurry viscosity began to decrease probably due to the decreased viscosity of the starchamount from the samples. It is well known that the flour slurry given by the FN is inversely correlatedwith α amylase activity [48]. At low levels of TSF addition, the flour mixes viscosity increased and athigh levels it slightly decreased, leading to different FN values.
111

Foods 2019, 8, 626
Table 1. Physicochemical characteristics for the wheat–tomato seed composite flours.
Sample Protein (%) Lipids (%) Ash (%)Moisture
(%)Falling
Number (s)
Control 12.40 a(0.20)
1.60 a(0.10)
0.65 a(0.01)
14.50 a(0.30)
445.00 a(14.00)
TSF_5 13.25 b(0.19)
2.49 b(0.09)
0.80 a(0.00)
13.83 a(0.29)
467.00 ab(14.00)
TSF_10 14.11 c(0.18)
3.39 c(0.09)
0.97 a(0.00)
13.47 d(0.27)
478.00 b(12.00)
TSF_15 14.96 d(0.17)
4.28 d(0.09)
1.13 a(0.00)
13.11 c(0.25)
445.00 a(15.00)
TSF_20 15.82 e(0.16)
5.18 e(0.08)
1.30 b(0.00)
12.74 b(0.24)
434.00 ac(16.00)
Values in parentheses are standard deviations. abcde Values with the same letter are not significantly differentaccording to the least significant difference (LSD) test (p < 0.05).
3.3. Influence of Tomato Seed Flour on Mixolab Dough Rheological Properties
The addition of tomato seed flour (TSF) to wheat flour dough decreased the water absorptionvalues (Table 2) which were 6.2% lower for the dough sample with 20% TSF addition compared to thecontrol. This decrease of the wheat–tomato seed composite flours water absorption may be attributedto the decrease of the gluten content in the blends, which needs less hydration as a result of TSFincorporation, which is gluten free flour [49]. Also, lipids from TSF may partially coat the starchgranules and gluten proteins, decreasing the water absorption during mixing [50]. In the mixingstage, both Mixolab parameters dough development time (DT) and stability (ST) increased for theTSF addition up to 20% and 10% respectively. Contrary, a decrease of the farinograph parameters,dough development and stability was reported by Majzoobi et al. [51]. The increase of DT and STwas significant (p < 0.05) and may be attributed to the TSF capacity of foaming and emulsifyingproperties [5]. This will favor the foaming and emulsifying activity of proteins from the dough system,leading to a more stable three-dimensional network structure [52]. The TSF contains a high amount oflipids which interact with proteins and starch. These interactions are facilitated by TSF emulsifyingcapacity which can bridge the lipids to the gluten proteins or to the starch granules helping the doughto become more stable and structured [53]. However, at levels higher than 10% TSF addition to wheatflour the ST started to decrease probably due to the gluten dilution from the dough system. Comparedto the control sample, the dough weakening was insignificant since for all the samples with TSFaddition the ST values were higher.
Table 2. Water absorption and Mixolab parameters of tomato seed–wheat flour blends.
Sample WA (%)ST
(min)DT
(min)C2
(N-m)C1-2
(N-m)C3
(N-m)C3-2
(N-m)C4
(N-m)C3-4
(N-m)C5
(N-m)C5-4
(N-m)
Control 60.70 a(2.20)
8.53 a(0.01)
3.85 a(0.62)
0.49 a(0.02)
0.60 a(0.02)
1.82 a(0.07)
1.33 a(0.06)
1.55 a(0.09)
0.27 a(0.02)
2.36 a(0.06)
0.81 a(0.03)
TSF_5 59.20 e(0.02)
8.73 e(0.02)
3.98 d(0.03)
0.54 b(0.03)
0.64 b(0.03)
1.73 d(0.06)
1.19 d(0.03)
1.59 d(0.07)
0.14 c(0.02)
2.81 b(0.05)
1.22 b(0.02)
TSF_10 58.50 d(2.20)
9.18 b(0.02)
4.05 c(0.05)
0.55 b(0.03)
0.62 c(0.01)
1.67 c(0.02)
1.12 c(0.01)
1.57 d(0.04)
0.10 b(0.02)
2.78 b(0.05)
1.21 b(0.01)
TSF_15 57.60 c(2.20)
9.08 c(0.01)
4.32 b(0.17)
0.53 c(0.02)
0.64 b(0.02)
1.52 b(0.05)
0.99 b(0.03)
1.35 b(0.03)
0.17 c(0.02)
2.57 c(0.05)
1.22 b(0.02)
TSF_20 56.80 b(2.20)
8.90 d(0.10)
4.55 b(0.01)
0.53 c(0.02)
0.65 b(0.01)
1.50 b(0.03)
0.97 b(0.01)
1.40 c(0.01)
0.10 b(0.02)
2.53 d(0.04)
1.13 c(0.03)
WA, water absorption; Mixolab parameters: ST, stability; DT, development time; C3, C5, maximum consistencyduring stage 3, stage 5; C2, C4, minimum consistency during stage 2, stage 4; C1-2, difference of the points C1 andC2; C3-2, difference of the points C3 and C2; C3-4, difference of the points C4 and C3; C5-4, difference of the pointsC5 and C4. Values in parentheses are standard deviations. a,b,c,d,e Values with the same letter are not significantlydifferent according to the LSD test (p < 0.05).
112

Foods 2019, 8, 626
The Mixolab parameters related to protein weakening (C2 and difference between the points C1and C2) were higher for the samples in which tomato seed flour was incorporated (Table 2). Theseresults indicated the fact that dough samples with TSF were stronger than the control sample. Howeverat high levels of TSF addition the C2 value slightly decreased compared to the control sample, probablydue to the high gluten dilution of the composite flours.
Tomato seed proteins contain high levels of the globulin fraction [54] which during heating mightexpose hydrophobic groups which can generate some interaction between proteins, leading to theiraggregation [55]. Also, during heating TSF proteins are capable of gel formation leading to a moreelastic dough with a more compact protein network [56] which can be breakdown less, a fact reflectedby the increased C2 values.
The Mixolab parameters (C3, C4, C5 and the difference between the points C2 and C3 (C3-2), C3and C4 (C3-4), C4 and C5 (C5-4) are significantly related to the starch behavior during the differentheating and cooling phases [57]. The Mixolab C3 and C3-2 values are associated with the starchgelatinization process. The decrease of these values with the increase level of TSF addition showedthat the gelatinization capacity of the dough samples decreased (Table 2). This may be attributed tolower starch content from the wheat–tomato seeds composite flour samples. As the amount of TSFin wheat flour increased, the non-starch component from the dough system decreased, leading to adecrease of the dough viscosity when temperature increased above the starch gelatinization.
The C4 torque reflects the hot starch stability paste was slightly increased by 2.58% at levels up to5% TSF (Table 2). The initial increase of C4 was an expectable one since this value is related to theamylolitic activity from the dough system which decreased with the amount of increased TSF addition.This fact leads to an increased dough viscosity and thus to an increase of the C4 value. Also, comparedto the control sample, the difference between C3 and C4 value (C3-4) presented lower values for thesamples with TSF addition, a fact that reflects a decrease of the starch degradation rate. This, along withthe C4 increase, indicates a more stable gel [58]. However, at high levels of TSF addition the C4 valuedecreased, this value being 9.67% lower than of the control sample when 20% TSF was incorporated inthe dough system. These results may be associated to the protein denaturation from the TSF whichaccording to Sarkar et al. [55] are optimum in the temperature range of 80–90 ◦C. According to previousreports [55] at the temperature of 87 ◦C the tomato seed protein showed significant denaturationcaused by its globular and non-globular protein components. The protein denaturation from TSF willlead to changes in the dough system conformation of which viscosity begins to decrease. Also, byits denaturation the TSF proteins lose their capacity to retain water. This can be retained in a higheramount by the starch granules of which the gelatinization process becomes more complete, a fact thatmay favor its amylolitic atacability.
For the dough samples in which TSF were added in wheat flour, C5 and the difference betweenthe C5 and C4 peaks (C5-4) presented higher values than for the control (Table 2). This fact indicatedthat by TSF addition in wheat flour the degree of starch retrogradation increased. However, when highlevels of TSF were added, the C5 and C5-4 began to decrease probably due to the lipid content of theTSF which may have interacted with starch and proteins from the dough system, favoring less starchretrogradation [59].
3.4. Influence of Tomato Seed Flour on Dynamic Dough Rheological Properties
Figure 1 shows the mechanical spectra of dough samples formulated with TSF at different levels.Both G’ and G” moduli values increased with the increase of TSF level addition in wheat flour. Theincrease of the dynamic moduli can be due to the limited plasticization effect and to the TSF emulsifyingproperties [5] and its lipids contents which favor gluten aggregation and gives rise to a more elasticbehavior [60]. The TSF proteins are not similar to the gluten proteins and thus by TSF addition the G”values also increased indicating a more viscous behavior of the dough samples, probably due to thedilution effect on gluten proteins. A similar trend for the dynamic moduli was also found when wheatflour was substituted with grape seeds flour [42]. However, for all the analyzed samples the G’/G”
113

Foods 2019, 8, 626
values were higher than 1, indicating a solid elastic-like behavior of dough [61] with and without TSFaddition in wheat flour.
Figure 1. Mechanical spectra of control dough (C) and dough samples with different levels (5%, 10%,15% and 20%) of tomato seeds flour (TSF). Presented data are mean values.
The parameters for power-law equations which were used to describe the dependence of modulion the oscillation frequency are shown in Table 3. As it may be seen, the dependency of G’ and G”dynamic moduli on the oscillation frequency was well modeled by Equations (1,2) in the range oftested frequency from 1 to 20 Hz. The coefficient of determination (R2) values was higher than 0.999and 0.960 for G’ and G”, respectively, showing that the power law model was adequate in modelingthe viscoelastic properties of dough samples. The obtained values of K’, K”, n’ and n” parametersadequate to G’ and G” are shown in Table 3.
Table 3. Parameters of power law models, Equations (1,2) describing the dependence of storage (G’)and loss (G”) moduli on the frequency.
SampleG’ = K’·ωn” G” = K”·ωn”
K’ (Pa sn’) n’ K” (Pa sn”) n”
Control 65,707.45 a(7373.07)
0.168 a(0.008)
21,489.72 a(3403.12)
0.196 a(0.008)
TSF_5 73,158.88 a(3875.74)
0.167 a(0.001)
22,721.65 a(439.82)
0.199 a(0.001)
TSF_10 73,711.68 a(2893.63)
0.172 a(0.004)
23,469.96 a(2119.38)
0.197 a(0.005)
TSF_15 77,350.93 b(2412.14)
0.177 c(0.002)
24,470.72 a(1762.34)
0.205 b(0.003)
TSF_20 85,702.71 c(7512.53)
0.182 b(0.002)
26,867.43 b(2610.38)
0.198 a(0.004)
Values in parentheses are standard deviations. a,b,c Values with the same letter are not significantly differentaccording to the LSD test (p < 0.05).
The values of K’ and K” increased with the increase of TSF addition level in wheat flour. Significantincreases (p < 0.05) were noticed especially between the control sample and samples in which 15% and20% TSF were incorporated. The highest values of K’ and K” were obtained for the dough sample withthe highest level of TSF addition in wheat flour. The results obtained indicated that the TSF additionled to a stronger dough compared to the control sample. This effect on the viscoelastic properties canbe related to the TSF emulsifying properties which act as a filler in the dough viscoelastic matrix [62]causing strong bonds which lead to higher modulus values.
114

Foods 2019, 8, 626
The results obtained for the G’ slope represented by n’ presented lower values than n” for theG” slope (Table 3). The TSF addition in wheat flour dough favors the binding of lipids from TSF togluten proteins by hydrophobic interactions during mixing. Also, due to the TSF emulsifying capacitythe gluten proteins charge decreased, favoring their aggregation, leading to an increase of the n’ andn” parameters values compared to the control sample. The additional level of TSF had a significanteffect (p < 0.05) on n’ at level of 15% and 20%, while on n” only at the level of 15%. Proximate n’ and n”values (n’ = 0.22–0.12; n” = 0.23–0.181) were found by Chouaibi et al. [63] for wheat flour dough withcommercial tomato products addition.
Figure 2 showed creep and recovery curves for wheat flour dough with different levels of TSFaddition in wheat flour. The replacement of wheat flour with TSF caused an increase of the deformationcompliance only for the sample with 15% TSF addition, as compared to control. The other blendssamples showed lower compliance values during the creep test, indicating lower deformability thanthe control wheat flour dough. The lowest deformation compliance obtained for the sample with20% TSF addition in wheat flour shows a lower deformability and therefore a stronger matrix for thedough structure.
Figure 2. Creep and recovery curves of control sample (C) and dough samples with different levels(5%, 10%, 15% and 20%) of tomato seed flour (TSF). Presented data are mean values.
The experimental data of compliance were well adjusted (R2 > 0.97) to the Burgers model,Equations (4,5). The parameters of Burgers model are shown in Table 4. In general, the levels of TSFaddition exert a significant effect on the creep parameter values. The highest value of instantaneouscompliance was observed in the case of the control sample, indicating a more elastic nature and higherrecovery. An addition of TSF led to a decreased of JCo, except for the sample with 15% TSF whichshowed a slightly increase of the instantaneous compliance. This increase can be related to a slightfirmness improvement of dough structure, in according to the result reported by Mis [64]. The highestchange on JCo was found for the sample with 20% TSF, indicating a significantly (p < 0.05) decrease ofthe instantaneous elasticity. In respect to the retardation times obtained for the creep and recoveryphase, the results showed that the TSF addition levels exhibit significance changes (p < 0.05) on λparameter. The increase of λC values for the samples with levels higher than 5% TSF addition in wheatflour is significant, showing that the retarded elastic creep took place more slowly. The decrease of λRvalues with the increase of TSF addition level in wheat flour to 15% and 20% showed that the retardedelastic recovery took place more rapidly. A significant higher viscosity, μCo was found in the all sampleswith TSF addition, except the sample when 15% TSF was incorporated in wheat flour, indicating ahigher dough resistance to flow deformability than the control sample. Therefore, the samples with15% TSF addition in wheat flour presented lower opposition to deformation than the dough sampleswith 5%, 10% and 20% TSF. This behavior is correlated to the maximum creep compliance value (9.41)
115

Foods 2019, 8, 626
obtained for sample with 15% TSF. Compared to other samples with TSF addition, this effect can berelated to the gluten dilution in dough. The decrease of gluten proteins by TSF addition at constantstress led to an increase of creep compliance, whereas the elastic contribution decreased [65].
Table 4. Parameters of Burger’s model.
Sample Creep Phase Recovery Phase
JCo· 105
(Pa−1)JCm· 105
(Pa−1)λC (s)
μCo· 10−6
(Pa · s)Jmax· 105
(Pa-1)JRo· 105
(Pa−1)JRm· 105
(Pa−1)λR (s)
Jr· 105
(Pa−1)Jr/Jmax
(%)
Control 2.50 a(0.16)
8.13 a(0.04)
36.97 a(0.48)
1.48 a(0.01)
9.13 a(0.33)
2.30 a(0.20)
3.90 a(0.29)
38.19 a(3.47)
6.20 a(0.10)
67.98 a(3.50)
TSF_5 2.45 b(0.03)
7.80 b(1.07)
36.60 b(2.93)
1.60 b(0.24)
8.80 d(0.61)
2.62 b(1.28)
3.61 b(0.45)
37.10b(9.63)
6.22 b(0.83)
70.37 a(4.55)
TSF_10 2.32 e(0.12)
7.69 c(0.64)
37.95 c(0.21)
1.54 c(0.14)
8.51 a(0.54)
2.42 e(0.16)
3.60 a(0.54)
39.11 c(4.74)
6.01 a(0.39)
70.66 a(0.14)
TSF_15 2.51 c(0.36)
8.64 d(1.24)
38.56 e(0.96)
1.45 e(0.22)
9.41 b(1.32)
3.32 c(0.28)
3.49 a(0.74)
36.02d(3.66)
6.81 c(1.02)
72.27 a(0.70)
TSF_20 2.04 d(0.15)
8.41 e(1.60)
42.54 d(3.33)
1.54 d(0.26)
8.48 c(1.27)
4.51 d(2.04)
2.32 c(0.45)
22.48 e(17.21)
6.83 d(1.59)
79.56 a(6.89)
Values in parentheses are standard deviations. abcde Values with the same letter are not significantly differentaccording to the LSD test (p < 0.05).
The recovery data obtained (Table 4) shows the elasticity variation of dough samples with TSFaddition at different levels to wheat flour. The level of TSF has a significant influence (p < 0.05) onthe instantaneous recovery compliance and the retardation time, but not on the recovery parameter(Jr/Jmax). The control dough showed the lowest elasticity. The highest elasticity was found in the samplewith 20% TSF addition, which could be associated with its higher JRo value. A higher complianceelasticity during recovery suggested higher recoverable energy stored by a more cross-linked glutenthan the control sample. This fact may be due to the increased aggregation between gluten proteins inthe dough system with TSF addition [66]. Among samples with TSF, the highest elasticity was foundfor the samples in which 15% and 20% TSF were incorporated in wheat flour.
3.5. Influence of Tomato Seed on Dough Microstructure
Dough samples with different levels of tomato seed flour addition were analyzed with EFLM(Figure 3A–E). All the samples were labeled with a solution of 1% rhodamine B and 0.5% fluorescein(FITC) in 2-methoxyethanol. In a dough system rhodamine B will label protein in red and FITC willlabel starch in green. Figure 3A shows a dough sample without tomato seed flour addition. In thissample, the presence of a very high amount of starch granules that were connected to the proteinnetwork which was squeezed in the starch matrix was observed. Comparing the structure imagesobtained for the dough samples with different levels of tomato seed addition a significant differencemay be seen between the amount of starch granules and protein. When the level of tomato seedaddition increased in wheat flour a less green area was seen and a more red area was present in thedough system (Figure 3B–E). This fact indicated that the starch granules became fewer and the proteincontent higher. Taking into account that tomato seeds present more than double the amount of proteinscompared to wheat flour, it was expectable that the starch content began to decrease and the protein toincrease from the dough matrix with the increase of tomato seed level addition. When low levels oftomato seed flour were incorporated in the dough system the starch granules were glued together inthe matrix.
116

Foods 2019, 8, 626
Figure 3. Microstructure taken by epifluorescence light microscopy (EFLM) of wheat dough withtomato seed flour (TSF) at different levels: 0% (A), 5% (B), 10% (C), 15% (D) and 20% (E). Green, starchgranules; red, protein.
At high levels of tomato seed flour addition the starch granules appeared separated surroundedby the protein network. However, all the samples analyzed seemed to be homogeneous, with no blackregions in the matrix, meaning that the dough did not become too weak even when higher levelsof tomato seeds were incorporated. The results obtained from EFLM were in accordance with therheological data. Even if the wheat flour substitution level with TSF was of 20% the Mixolab stabilityof the dough system was higher than the stability of the control samples whereas the both modulivalues G’ and G” increased with the level of TSF addition increase indicating that dough with TSF wasa stronger and compact one.
4. Conclusions
In conclusion, the wheat-tomato seed composite flours parameters analyzed, namely protein, fatand ash, increased with the level of tomato seed addition increase in wheat flour, indicating the factthat bread with TSF will present a higher nutritional and energetic value for consumers. Accordingto the rheological data, all the dough samples with TSF addition were more stable and strengthenedcompared to the control sample presenting higher values for dough stability and development time.This fact indicates to the bakers that the dough with TSF addition presents a higher capacity to keep itsshape during proofing and therefore, it may be fermented for a longer period of time. Also, doughwith TSF addition will present a higher ability to retain the gas formed during the fermentationprocess, a fact that will influence bread porosity. The higher dough strength for the samples withTSF indicated that the bread obtained presented a more firm texture. Regarding the mixing behaviorfor the dough samples with TSF addition, it seemed that according to the Mixolab data the bakersshould mix the composite flour for a longer period of time and must introduce less water amountin order to obtain an optimum dough consistency. At high levels of TSF addition in wheat flour, allthe Mixolab parameters torques related to the starch behavior (C3, C4, C5) decreased probably dueto the decrease of the starch content from the wheat–tomato seed flour samples. At low levels ofaddition, TSF seemed to integrate very well into the dough system increasing its starch stability paste.
117

Foods 2019, 8, 626
Also, the FN increased when low levels of TSF were incorporated and decreased when high levelsof TSF were added in dough samples. This, along with starch behavior recorded with the Mixolabdevice, showed that the addition of α amylase may be recommended for wheat flour with high FNvalues without affecting in a negatively way the dough stability, a fact that will lead to good bakeryproducts quality. It must been mention that when high levels of TSF were added the C5 and C5-4begin to decrease, favoring less starch retrogradation, indicating the fact that bakery products obtainedwith TSF addition will present a higher shelf life than the control sample. The dynamic rheologicaldata showed that with the increase of TSF addition level in wheat flour the dough samples presentedhigher viscoelastic solid properties. Creep–recovery tests showed that TSF addition in wheat flourled to dough with higher resistance to deformation, smaller creep strain values and higher recovery,indicating stronger dough with greater elasticity. This indicated that during the technological processthe dough samples with TSF addition presented the capability to maintain their form, a fact that willcreate the possibility to prolong the fermentation phase due to a higher ability to retain the gas formedduring this process. Also, after baking the bakery products may present higher loaf volumes andporosity due to the fact that by prolonging the fermentation process the amount of the gas released willincrease and may be retained by the dough system due to it high elasticity. The results obtained fromEFLM were in accordance with the rheological data. All the analyzed samples were homogeneous,with a compact dough matrix, showing that the dough samples were strong even when high levels ofTSF were incorporated. According to the data obtained, we concluded that tomato seed, as a wholeflour form, can be used in bread making by blending with wheat flour even at high levels of up to 20%,as an alternative for developing new bakery products. The TSF addition increased the dough strengthwhich makes us recommend its use for wheat flour of a good quality for bread making with a highcontent of wet gluten. In the case of its addition in wheat flour with high FN values we recommendthe addition of α amylase in the dough system, a fact that will increase the amount of the gas formedin the dough system, gas that dough with TSF addition is capable of retaining.
Author Contributions: Contributed equally to the study design, collection of data, development of the sampling,analyses, interpretation of results, and preparation of the paper, S.M. and G.G.C. All authors read and approvedthe final manuscript.
Acknowledgments: This work was supported from contract no. 18PFE/16.10.2018 funded by the Ministryof Research and Innovation within Program 1—Development of national research and development system,Subprogram 1.2—Institutional Performance—RDI excellence funding projects.
Conflicts of Interest: The authors declare no conflict of interest.
References
1. Adalid, A.M.; Roselló, S.; Nuez, F. Evaluation and selection of tomato accessions (Solanum section Lycopersicon)for content of lycopene, β-carotene and ascorbic acid. J. Food Compos. Anal. 2010, 23, 613–618. [CrossRef]
2. Bajerska, J.; Chmurzynska, A.; Mildner-Szkudlarz, S.; Drzymala-Czyz, S. Effect of rye bread enriched withtomato pomace on fat absorption and lipid metabolism in rats fed a high-fat diet. J. Sci. Food Agric. 2015, 95,1918–1924. [CrossRef] [PubMed]
3. Vinkovic Vrcek, I.; Samobor, V.; Bojic, M.; Medic-Saric, M.; Vukobratovic, M.; Erhatic, R.; Horvat, D.;Matotan, Z. The effect of grafting on the antioxidant properties of tomato (Solanum lycopersicum L.). Span. J.Agric. Res. 2011, 9, 844–851. [CrossRef]
4. Maršic, N.K.; Gasperlin, L.; Abram, V.; Budic, M.; Vidrih, R. Quality parameters and total phenolic content intomato fruits regarding cultivar and microclimatic conditions. Turk. J. Agric. For. 2011, 35, 185–194.
5. Shao, D.; Atungulu, G.; Pan, Z.; Yue, T.; Zhang, A.; Fan, Z. Characteristics of isolation and functionality ofprotein from tomato pomace produced with different industrial processing methods. Food Bioprocess Technol.2014, 7, 532–541. [CrossRef]
6. Borguini, R.G.; Ferraz da Silva Torres, E.A. Tomatoes and tomato products as dietary sources of antioxidants.Food Rev. Int. 2009, 25, 313–325. [CrossRef]
7. Ray, R.C.; El Sheikha, A.F.; Panda, S.H.; Montet, D. Anti-oxidant properties and other functional attributes oftomato: An overview. Int. J. Food Ferment. Technol. 2011, 1, 139–148.
118

Foods 2019, 8, 626
8. Zuorro, A.; Fidaleo, M.; Lavecchia, R. Enzyme-assisted extraction of lycopene from tomato processing waste.Enzym. Microb. Technol. 2011, 49, 567–573. [CrossRef]
9. Del Valle, M.; Camara, M.; Torija, M.E. The nutritionaland functional potential of tomato by-products. ActaHortic. 2007, 758, 165–172. [CrossRef]
10. Celma, A.R.; Cuadros, F.; López-Rodríguez, F. Characterisation of industrial tomato by-products frominfrared drying process. Food Bioprod. Process. 2009, 87, 282–291. [CrossRef]
11. Migalatiev, O. Optimisation of operating parameters for supercritical carbon dioxide extraction of lycopenefrom industrial tomato waste. Ukr. Food J. 2017, 6, 698–716. [CrossRef]
12. Sarkar, A.; Kaul, P. Evaluation of Tomato Processing By-Products: A Comparative Study in a Pilot ScaleSetup. J. Food Process Eng. 2014, 37, 299–307. [CrossRef]
13. Kumar, K.; Yadav, A.N.; Kumar, V.; Vyas, P.; Dhaliwal, H.S. Food waste: A potential bioresource for extractionof nutraceuticals and bioactive compounds. Bioresour. Bioprocess. 2017, 4, 18. [CrossRef]
14. Knoblich, M.; Anderson, B.; Latshaw, D. Analyses of tomato peel and seed byproducts and their use as asource of carotenoids. J. Sci. Food Agric. 2005, 85, 1166–1170. [CrossRef]
15. Nour, V.; Ionica, M.E.; Trandafir, I. Bread enriched in lycopene and other bioactive compounds by additionof dry tomato waste. J. Food Sci. Technol. 2015, 52, 8260–8267. [CrossRef] [PubMed]
16. Kalogeropoulos, N.; Chiou, A.; Pyriochou, V.; Peristeraki, A.; Karathanos, V.T. Bioactive phytochemicals inindustrial tomatoes and their processing byproducts. LWT-Food Sci. Technol. 2012, 49, 213–216. [CrossRef]
17. Mehta, D.; Prasad, P.; Sangwan, R.S.; Yadav, S.K. Tomato processing byproduct valorization in bread andmuffin: Improvement in physicochemical properties and shelf life stability. J. Food Sci. Technol. 2018, 55,2560–2568. [CrossRef]
18. Papaioannou, E.H.; Karabelas, A.J. Lycopene recovery from tomato peel under mild conditions assisted byenzymatic pre-treatment and non-ionic surfactants. Acta Biochim. Pol. 2012, 59, 71–74. [CrossRef]
19. Stajcic, S.; Cetkovic, G.; Canadanovic-Brunet, J.; Djilas, S.; Mandic, A.; Cetojevic-Simin, D. Tomato waste:Carotenoids content, antioxidant and cell growth activities. Food Chem. 2015, 172, 225–232. [CrossRef]
20. Gupta, G.; Parihar, S.S.; Ahirwar, N.K.; Snehi, S.K.; Singh, V. Plant growth promoting rhizobacteria (PGPR):Current and future prospects for development of sustainable agriculture. J. Microb. Biochem. Technol. 2015, 7,096–102.
21. Sogi, D.S.; Garg, S.K.; Bawa, A.S. Functional properties of seed meals and protein concentrates fromtomato-processing waste. J. Food Sci. 2002, 67, 2997–3001. [CrossRef]
22. Sogi, D.S.; Sidhu, J.S.; Arora, M.S.; Garg, S.K.; Bawa, A.S. Effect of tomato seed meal supplementation on thedough and bread characteristics of wheat (PBW 343) flour. Int. J. Food Prop. 2002, 5, 563–571. [CrossRef]
23. Kramer, A.; Kwee, W.H. Functional and nutritional properties of tomato protein concentrates. J. Food Sci.1977, 42, 207–211. [CrossRef]
24. Sogi, D.S.; Bhatia, R.; Garg, S.K.; Bawa, A.S. Biological evaluation of tomato waste seed meals and proteinconcentrate. Food Chem. 2005, 89, 53–56. [CrossRef]
25. Mechmeche, M.; Kachouri, F.; Chouabi, M.; Ksontini, H.; Setti, K.; Hamdi, M. Optimization of extractionparameters of protein isolate from tomato seed using response surface methodology. Food Anal. Methods2017, 10, 809–819. [CrossRef]
26. Latlief, S.J.; Knorr, D. Tomato seed protein concentrates: Effects of methods of recovery upon yield andcompositional characteristics. J. Food Sci. 2010, 48, 1583–1586. [CrossRef]
27. Majzoobi, M.; Ghavi, F.S.; Farahnaky, A.; Jamalian, J.; Mesbahi, G. Effect of tomato pomace powder on thephysicochemical properties of flat bread (barbari bread). J. Food Process. Preserv. 2011, 35, 247–256. [CrossRef]
28. Brodowski, D.; Geisman, J.R. Protein content and amino acid composition of protein of seeds from tomatoesat various stages of ripeness. J. Food Sci. 1980, 45, 228–229. [CrossRef]
29. Rahma, E.H.; Moharram, Y.G.; Mostafa, M.M. Chemical Characterisation of Tomato Seed Protein (Var.Pritchard). Egypt. J. Food Sci. 1986, 14, 221–230.
30. Bhat, M.A.; Ahsan, H. Physico-chemical characteristics of cookies prepared with tomato pomace powder.J. Food Process. Technol. 2016, 7. [CrossRef]
31. Savadkoohi, S.; Hoogenkamp, H.; Shamsi, K.; Farahnaky, A. Color, sensory and textural attributes ofbeef frankfurter, beef ham and meat-free sausage containing tomato pomace. Meat Sci. 2014, 97, 410–418.[CrossRef] [PubMed]
119

Foods 2019, 8, 626
32. Wang, Q.; Xiong, Z.; Li, G.; Zhao, X.; Wu, H.; Ren, Y. Tomato peel powder as fat replacement in low-fatsausages: Formulations with mechanically crushed powder exhibit higher stability than those with airflowultra-micro crushed powder. Eur. J. Lipid Sci. Technol. 2016, 118, 175–184. [CrossRef]
33. Grassino, A.N.; Halambek, J.; Djakovic, S.; Brncic, S.R.; Dent, M.; Grabaric, Z. Utilization of tomato peelwaste from canning factory as a potential source for pectin production and application as tin corrosioninhibitor. Food Hydrocoll. 2016, 52, 265–274. [CrossRef]
34. Carlson, B.L.; Knorr, D.; Watkins, T.R. Influence of tomato seed addition on the quality of wheat-flour breads.J. Food Sci. 1981, 46, 1029–1031. [CrossRef]
35. Mironeasa, S.; Codina, G.G.; Oroian, M.A. Bread quality characteristics as influenced by the addition oftomato seed flour. Bull. Univ. Agric. Sci. Vet. Med. 2016, 73, 77–84. [CrossRef]
36. Mironeasa, S.; Codină, G.G.; Mironeasa, C. Effect of Composite Flour Made from Tomato Seed and Wheat of650 Type of a Strong Quality for Bread Making on Bread Quality and Alveograph Rheological Properties.Int. J. Food Eng. 2018, 4, 22–26. [CrossRef]
37. Kowalczewski, P.Ł.; Walkowiak, K.; Masewicz, Ł.; Bartczak, O.; Lewandowicz, J.; Kubiak, P.; Baranowska, H.M.Gluten-Free Bread with Cricket Powder—Mechanical Properties and Molecular Water Dynamics in Doughand Ready Product. Foods 2019, 8, 240. [CrossRef]
38. Korus, J.; Juszczak, L.; Ziobro, R.; Witczak, M.; Grzelak, K.; Sójka, M. Defatted strawberry and blackcurrantseeds as functional ingredients of gluten-free bread. J. Texture Stud. 2012, 43, 29–39. [CrossRef]
39. Steffe, J.F. Rheological Methods in Food Process Engineering; Freeman Press: East Lansing, MI, USA, 1996;pp. 294–348.
40. Mironeasa, S.; Iuga, M.; Zaharia, D.; Mironeasa, C. Rheological analysis of wheat flour dough as influencedby grape peels of different particle sizes and addition levels. Food Bioprocess Technol. 2019, 12, 228–245.[CrossRef]
41. Moreira, R.; Chenlo, F.; Torres, M.D. Rheology of gluten-free doughs from blends of chestnut and rice flours.Food Bioprocess Technol. 2013, 6, 1476–1485. [CrossRef]
42. Iuga, M.; Mironeasa, C.; Mironeasa, S. Oscillatory rheology and creep-recovery behaviour of grape seed-wheatflour dough: Effect of grape seed particle size, variety and addition level. Bull. Univ. Agric. Sci. Vet. Med.Cluj-Napoca Food Sci. Technol. 2019, 76, 37–45. [CrossRef]
43. Abebe, W.; Ronda, F.; Villanueva, M.; Collar, C. Effect of tef [Eragrostis tef (Zucc.) Trotter] grain flour additionon viscoelastic properties and stickiness of wheat dough matrices and bread loaf volume. Eur. Food Res.Technol. 2015, 241, 469–478. [CrossRef]
44. Peighambardoust, S.H.; Dadpour, M.R.; Dokouhaki, M. Application of epifluorescence light microscopy(EFLM) to study the microstructure of wheat dough: A comparison with confocal scanning laser microscopy(CSLM) technique. J. Cereal Sci. 2010, 51, 21–27. [CrossRef]
45. Codina, G.G.; Mironeasa, S. Influence of mixing speed on dough microstructure and rheology. Food Technol.Biotechnol. 2013, 51, 509–519.
46. Codină, G.G.; Mironeasa, S. Use of response surface methodology to investigate the effects of brown andgolden flaxseed on wheat flour dough microstructure and rheological properties. J. Food Sci. Technol. 2016,53, 4149–4158. [CrossRef]
47. Ionescu, V.; Stoenescu, G.; Vasilean, I.; Aprodu, I.; Banu, I. Comparative evaluation of wet gluten quantityand quality through different methods. Food Technol. 2010, 34, 44–48.
48. Struyf, N.; Verspreet, J.; Courtin, C.M. The effect of amylolytic activity and substrate availability on sugarrelease in non-yeasted dough. J. Cereal Sci. 2016, 69, 111–118. [CrossRef]
49. Kundu, H.; Grewal, R.B.; Goyal, A.; Upadhyay, N.; Prakash, S. Effect of incorporation of pumpkin (Cucurbitamoshchata) powder and guar gum on the rheological properties of wheatflour. J. Food Sci. Technol. 2014, 51,2600–2607. [CrossRef]
50. Chin, N.L.; Goh, S.K.; Rahman, R.A.; Hashim, D.M. Functional effect of fullyhydrogenated palm oil-basedemulsifiers on baking performance of whitebread. Int. J. Food Eng. 2007, 3. [CrossRef]
51. Majzoobi, M.; Mesbahi, G.; Farahnaky, A.; Jamalian, J.; Sariri, F. Effects of tomato pulp and sugar beet pulppowders on the farinograph properties of bread dough. Food Sci. Technol. 2011, 8, 1–9.
52. Guo, H.; Lin, Y.H.; Wan, S.W.; Guo, S.Y. Application of emulsifier in baking food. Mod. Food Sci. Technol.2006, 22, 297–298.
120

Foods 2019, 8, 626
53. Pareyt, B.; Finnie, S.M.; Putseys, J.A.; Delcour, J.A. Lipids in bread making. Sources, intercations and impacton bread quality. J. Cereal Sci. 2011, 54, 266–279. [CrossRef]
54. Piyakina, G.A.; Maksimov, V.V.; Yunusov, T.S. Some properties of the protein fractions of tomato seeds. Chem.Nat. Compd. 1998, 34, 492–495. [CrossRef]
55. Sarkar, A.; Kamaruddin, H.; Bentley, A.; Wang, S. Emulsion stabilization by tomato seed protein isolate:Influence of pH, ionic strength and thermal treatment. Food Hydrocoll. 2016, 57, 160–168. [CrossRef]
56. Savadkoohi, S.; Farahnaky, A. Dynamic rheological and thermal study of the heat-induced gelation oftomato-seed proteins. J. Food Eng. 2012, 113, 479–485. [CrossRef]
57. Moza, J.; Gujral, S. Influence of barley non-starchy polysaccharides on selected quality attributes of spongecakes. LWT-Food Sci. Technol. 2017, 85, 252–261. [CrossRef]
58. Gujral, H.S.; Sharma, B.; Khatri, M. Influence of replacing wheat bran with barley bran on dough rheology,digestibility and retrogradation behavior of chapatti. Food Chem. 2018, 240, 1154–1160. [CrossRef]
59. Wang, S.; Li, C.; Copeland, L.; Niu, Q.; Wang, S. Starch retrogradation: A comprehensive review. Compr. Rev.Food Sci. Food Saf. 2015, 14, 568–585. [CrossRef]
60. Watanabe, A.; Yokomizo, K.; Eliasson, A.-C. Effect of physical states of nonpolar lipids on rheology,ultracentrifugation, and microstructure of wheat flour dough. Cereal Chem. 2003, 80, 281–284. [CrossRef]
61. Guadarrama-Lezama, A.Y.; Carillo-Navas, H.; Vernon-Carter, E.J.; Alverez-Ramirez, J. Rheological andthermal properties of dough and textural and microstructural features of bread obtained from nixtamalizedcorn/wheat flour blends. J. Cereal Sci. 2016, 69, 158–165. [CrossRef]
62. Uthayakumaran, S.; Newberry, M.; Phan-Thien, N.; Tanner, R. Small and large strain rheology of wheatgluten. Rheol. Acta 2002, 41, 162–172. [CrossRef]
63. Chouaibi, M.; Rezig, I.; Boussaid, A.; Hamdi, S. Insoluble tomato-fiber effect on wheat dough rheology andcookies’quality. Ital. J. Food Sci. 2018, 31. [CrossRef]
64. Mis, A. Interpretation of mechanical spectra of carob fibre and oat wholemeal-enriched wheat dough usingnon-linear regression models. J. Food Eng. 2011, 102, 369–379. [CrossRef]
65. Wang, F.C.; Sun, X.S. Creep-recovery of wheat flour doughs and relationship to other physical dough testsand breadmaking performance. Cereal Chem. 2002, 70, 567–571. [CrossRef]
66. Chompoorat, P.; Ambardekar, A.; Mulvaney, S.; Rayas-Duarte, P. Rheological characteristics of gluten aftermodified by DATEM, ascorbic acid, urea and DTT using creep-recovery test. J. Mod. Phys. 2013, 4, 1–8.[CrossRef]
© 2019 by the authors. Licensee MDPI, Basel, Switzerland. This article is an open accessarticle distributed under the terms and conditions of the Creative Commons Attribution(CC BY) license (http://creativecommons.org/licenses/by/4.0/).
121


MDPISt. Alban-Anlage 66
4052 BaselSwitzerland
Tel. +41 61 683 77 34Fax +41 61 302 89 18
www.mdpi.com
Foods Editorial OfficeE-mail: [email protected]
www.mdpi.com/journal/foods


MDPI St. Alban-Anlage 66 4052 Basel Switzerland
Tel: +41 61 683 77 34 Fax: +41 61 302 89 18
www.mdpi.com ISBN 978-3-0365-0505-3