Pedigree assessment using RAPD-DGGE in cereal crop species
9
Theor Appl Genet (1993) 85:497-505 ~ ~~.~,r Springer-Verlag 1993 Pedigree assessment using RAPD-DGGE in cereal crop species Ismail Dweikat 1, Sally Mackenzie 1, Morris Levy 2 and Herbert Ohm 1 1 Department of Agronomy, Purdue University, West Lafayette, IN 47907, USA 2 Department of Biological Sciences, Purdue University, West Lafayette, IN 47907, USA Received June 25, 1992; Accepted September 28, 1992 Communicated by P.L. Pfahler Summary. The introduction of molecular biology methodologies to plant improvement programs offers an invaluable opportunity for extensive germplasm charac- terization. However, the detection of adequate DNA polymorphism in self-pollinating species remains on ob- stacle. We have optimized a denaturing-gradient-gel elec- trophoresis (DGGE) system which, when used in combi- nation with random amplified polymorphic DNA (RAPD) analysis, greatly facilitates the detection of re- producible DNA polymorphism among closely related plant lines. We have used this approach to estimate pedi- gree relationships among a spectrum of plant materials in wheat, barley and oat. Based on analysis with one or two primers, we were able to distinguish soft from hard win- ter wheat, and 2-rowed from 6-rowed barley. Further analysis with additional primers allowed resolution of polymorpisms even among closely related lines in highly selected populations. We placed 17 cultivars of oat into two distinct clusters that differed significantly from pre- vious oat pedigree assessments. We believe that DGGE- RAPD is a superior method for detecting DNA polymor- phism when compared to RFLP, agarose-RAPD, or polyacrylamide-RAPD methods. Key words: DNA polymorphism - DNA fingerprinting - Oat - Barley - Wheat Introduction Assessment of the degree of relatedness among lines or populations of a crop species provides a useful parameter for evaluating the effects of selection over time. Accurate pedigree evaluation also serves as a basis for the selection Correspondence to: I. Dweikat of appropriate parents in the development of crossing schemes. Methods for the evaluation of relatedness have in the past been based primarily on plant breeding records and plant phenotype (St. Martin 1982; Delannay etal. 1983; Rodgers etal. 1983; Cox et al. 1985a)or on biochemical markers (Wrigley 1970; Price et al. 1984; Cox et al. 1985b; Landry et al. 1987; Bonierbale et al. 1988; Tanksley et al. 1988). Here we present a DNA fin- gerprinting method that offers greatly enhanced resolu- tion of genotypic variation even among closely related lines of self-pollinating plant species. Diversity among 167 cultivars of North American spring barley was previously evaluated by a coefficient of parentage method (Martin et al. 1992 a). Cluster analysis based on a coefficient of parentage matrix produced 30 distinct clusters. Similarly, Souza and Sorrells (1988, 1989) performed a predigree analysis of oat cultivars released from 1951 to 1985, grouping them into seven major groups. Using soft and hard winter wheat cultivars in cluster analysis produced two major groups with 13 subgroups (Murphy et al. 1986). Because of the extent of available pedigree information, we have selected these three crop species for a comparative pedigree assessment using a DNA-based method. One of the most common biochemical marker meth- ods used for genetic fingerprinting and the estimation of genetic diversity in plants utilizes restriction fragment length polymorphism (RFLP) analysis. In combination with the development of a well-defined RFLP map, one is then able to identify the regions of the genome that account for the greatest genetic diversity. RFLP-based mapping efforts are ongoing in oat, barley and wheat. The development of such a map in self-pollinated crops is often complicated by the lack of polymorphism detect- ed among closely related plant lines. The introduction of polymerase chain reaction (PCR) technologies (Saiki
-
Upload
independent -
Category
Documents
-
view
0 -
download
0
Transcript of Pedigree assessment using RAPD-DGGE in cereal crop species
Theor Appl Genet (1993) 85:497-505 ~ ~ ~ . ~ , r
�9 Springer-Verlag 1993
Pedigree assessment using RAPD-DGGE in cereal crop species
Ismail Dweikat 1, Sally Mackenzie 1, Morr is Levy 2 and Herbert Ohm 1
1 Department of Agronomy, Purdue University, West Lafayette, IN 47907, USA 2 Department of Biological Sciences, Purdue University, West Lafayette, IN 47907, USA
Received June 25, 1992; Accepted September 28, 1992 Communicated by P.L. Pfahler
Summary. The introduction of molecular biology methodologies to plant improvement programs offers an invaluable opportunity for extensive germplasm charac- terization. However, the detection of adequate DNA polymorphism in self-pollinating species remains on ob- stacle. We have optimized a denaturing-gradient-gel elec- trophoresis (DGGE) system which, when used in combi- nation with random amplified polymorphic DNA (RAPD) analysis, greatly facilitates the detection of re- producible DNA polymorphism among closely related plant lines. We have used this approach to estimate pedi- gree relationships among a spectrum of plant materials in wheat, barley and oat. Based on analysis with one or two primers, we were able to distinguish soft from hard win- ter wheat, and 2-rowed from 6-rowed barley. Further analysis with additional primers allowed resolution of polymorpisms even among closely related lines in highly selected populations. We placed 17 cultivars of oat into two distinct clusters that differed significantly from pre- vious oat pedigree assessments. We believe that DGGE- RAPD is a superior method for detecting DNA polymor- phism when compared to RFLP, agarose-RAPD, or polyacrylamide-RAPD methods.
Key words: DNA polymorphism - DNA fingerprinting - Oat - Barley - Wheat
Introduction
Assessment of the degree of relatedness among lines or populations of a crop species provides a useful parameter for evaluating the effects of selection over time. Accurate pedigree evaluation also serves as a basis for the selection
Correspondence to: I. Dweikat
of appropriate parents in the development of crossing schemes. Methods for the evaluation of relatedness have in the past been based primarily on plant breeding records and plant phenotype (St. Martin 1982; Delannay etal. 1983; Rodgers etal. 1983; Cox et al. 1985a)or on biochemical markers (Wrigley 1970; Price et al. 1984; Cox et al. 1985b; Landry et al. 1987; Bonierbale et al. 1988; Tanksley et al. 1988). Here we present a DNA fin- gerprinting method that offers greatly enhanced resolu- tion of genotypic variation even among closely related lines of self-pollinating plant species.
Diversity among 167 cultivars of North American spring barley was previously evaluated by a coefficient of parentage method (Martin et al. 1992 a). Cluster analysis based on a coefficient of parentage matrix produced 30 distinct clusters. Similarly, Souza and Sorrells (1988, 1989) performed a predigree analysis of oat cultivars released from 1951 to 1985, grouping them into seven major groups. Using soft and hard winter wheat cultivars in cluster analysis produced two major groups with 13 subgroups (Murphy et al. 1986). Because of the extent of available pedigree information, we have selected these three crop species for a comparative pedigree assessment using a DNA-based method.
One of the most common biochemical marker meth- ods used for genetic fingerprinting and the estimation of genetic diversity in plants utilizes restriction fragment length polymorphism (RFLP) analysis. In combination with the development of a well-defined RFLP map, one is then able to identify the regions of the genome that account for the greatest genetic diversity. RFLP-based mapping efforts are ongoing in oat, barley and wheat. The development of such a map in self-pollinated crops is often complicated by the lack of polymorphism detect- ed among closely related plant lines. The introduction of polymerase chain reaction (PCR) technologies (Saiki

498
et al. 1988) has offered alternative methods for enhanc- ing po lymorph ism detected and, therefore, for applying these mapping methodologies to p lant breeding. Will iams et al. (1990) and Welsh and McClel land (1990) have described a r andom amplified po lymorphie D N A (RAPD) analysis technique based on the amplif icat ion of multiple, r andom segments of the genome using a rb i t ra ry primers. R A P D analysis has proven valuable in plant genotype f ingerprinting (Welsh and McClel land 1990; Caetano-Anol les et al. 1991; Hu and Quiros 1991), popu- lat ion and pedigree analyses (Van Heusden and Bachman 1992), phylogenetic studies (Halward et al. 1992), and genetic mapping (Williams e ta l . 1990; Mar t in et al. 1991 b; Michelmore et al. 1991; Reiter et al. 1992). Many of these studies utilized R A P D analysis in combinat ion with agarose- or polyacrylamide-gel electrophoresis. However, for studies involving some self-pollinating spe- cies, this approach does not yield levels of po lymorph ism adequate for dist inguishing closely related lines. Recent- ly, we have adapted a denaturing-gradient-gel elec- t rophoresis ( D G G E ) system (Fisher and Lerman 1983) for use in combina t ion with R A P D analysis to efficiently detect unusually high levels of D N A polymorph ism in wheat (He et al. 1992). Here we extend the use of this system for high resolut ion pedigree assessment of wheat, barley and oat.
Materials and methods
Plant materials
The spring oat, spring barley, and red winter wheat lines used in this study were selected based on previous pedigree assessment studies (Murphy et al. 1986; Souza and Sorrells 1988, 1989; Martin et al. 1991 a) and are listed in Table 1. Spring barley lines were kindly provided by Dr. Tom Blake (Montana State Univer- sity) and Dr. J. Franckowiak (North Dakota State University).
DNA isolation
Leaf tissues from 2-week-old seedlings grown in a growth cham- ber were collected and immediately frozen in liquid nitrogen. DNA was isolated from 1 gm of fresh tissue by the modified procedures of Gawel and Jarret (1991). The tissues were ground in liquid nitrogen and suspended in 15 ml of extraction buffer (100 mM Tris-HC1, pH 8.0, 3.0% hexadecyltrimethylammoni- um bromide, 20mM EDTA, 1 mM 1,10 o-phenanthroline, 1.4 M NaC1 and 0.1% beta-mercaptoethanol). The slurry was incubated for 60 rain at 60 ~ The lysate was extracted with an equal volume of chloroform/isoamyl alcohol (24:1) and the aqueous fraction mixed with an equal volume of isopropanol. Precipitated DNA was removed from solution using a glass rod, washed in 80% ethanol and 15 mM ammonium acetate, and dissolved in 10 mM Tris-HC1, 1 mM EDTA; pH 8.0.
PCR conditions
Oligonucleotide primers (10-mers) were purchased from Operon Technologies (Alameda, Calif.). The PCR reaction conditions were optimized for this study. Reaction mixtures (75 gl total volume) consisted of 10 mM Tris-HCl, pH 8.8 at 25 ~ 50 mM
Table 1. List of lines from wheat, oat and barley used for RAPD-DGGE analysis
Crop Type Lines
Wheat Soft red (Triticum aestivum L) winter
Barley (Hordeum vulgare L)
Hard red winter
2-rowed
Oats (Avena sativa L)
6-rowed
Arthur, Abe, Oasis, Beau, Adder, Monon, Benhur, Fillmore, Caldwell, Omega, Pioneer 2550, Ruler, Knox, Blueboy
Parker 76, Newton
Gallatin, Harrington, Klages, Betzes, Bowman, Bonus, Bearpaw, Hector, Clark, Lewis, CI2376
Bonanza, Morex, Larker, Atlas 68, Steptoe, Chevron
Tippecanoe, Stout, Clint- land 64, Putnam 61, Ogle, Tyler, Clinton, Clinton 59, Hazel, Clintford, Dubois, Norline, Allen, Noble, Albion, Dal, Porter
One line of Arena strigosa included
KC1, 1.5 mM MgCI z, nucleotides dATP, dTTP, dCTP, and dGTP (200 gM each), 0.2 I~M primer, 100 ng template DNA, and 1.5 units of Taq DNA polymerase (Promega). The reaction mixture was overlain with 80 gl of light mineral oil. Amplifica- tions were carried out in a Genetic Thermocycler (Precision) programmed for 45 cycles of I rain at 94 ~ 30 s at 36 ~ 1 rain at 72 ~ and ending with 10 rain at 72 ~ The primers were used individually or in combinations of two (see Table 2).
Gel electrophoresis
The PCR products (25 I J) were fractionated by denaturing-gra- dient-gel electrophoresis on a Hoefer vertical-gel apparatus (SE600). Gels consisted of 12% acrylamide (37.5:1 acry- lamide:bisacrylamide) in TAE buffer (40raM Tris-acetate, 20 mM sodium acetate, 1 mM EDTA; pH 7.7). The gel denatu- rant gradient of 10-50% (100% denaturant concentration of 7 M urea, 40% formamide) was prepared with a gradient maker (Hoefer). Gels were 0.75 mm in thickness. Electrophoresis con- ditions were 130 V for 5 h at 60~ To maintain 60~ condi- tions, the circulating water bath temperature was set at 65 ~ Gels were then stained in ethidium bromide (1 gg/ml) for 10 rain, destained in deionized water for 1 h, and photographed over a long wave UV light source.
Agarose-gel electrophoresis consisted of 1.2% agarose in 0.5 TBE buffer (0.045 M Tris-borate and 1.0 mM EDTA pH 8.0), at 4 V/cm for 3 h. Polyacrylamide gel conditions were identical to those for DGGE excluding the denaturant. Gels were run at room temperature.
Data analysis
RAPD profiles were scored visually. Variation among samples was evaluated from pair-wise comparisons of the proportion of shared fragments among samples, i.e., two times the number of shared fragments divided by the total number in the profiles
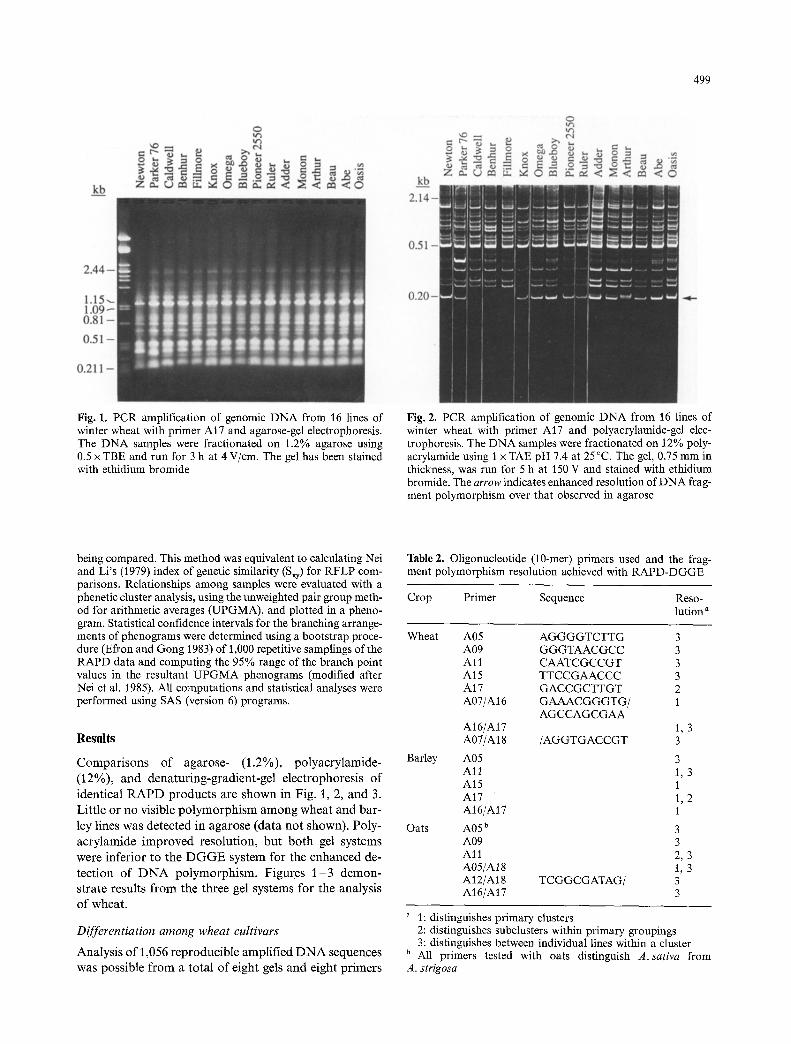
499
Fig. 1. PCR amplification of genomic DNA from 16 lines of winter wheat with primer AI7 and agarose-gel electrophoresis. The DNA samples were fractionated on 1.2% agarose using 0.5 x TBE and run for 3 h at 4 V/cm. The gel has been stained with ethidium bromide
Fig. 2. PCR amplification of genomic DNA from 16 lines of winter wheat with primer A17 and polyacrylamide-gel elec- trophoresis. The DNA samples were fractionated on 12% poly- acrylamide using t x TAE pH 7.4 at 25~ The gel, 0.75 mm in thickness, was run for 5 h at 150 V and stained with ethidium bromide. The arrow indicates enhanced resolution of DNA frag- ment polymorphism over that observed in agarose
being compared. This method was equivalent to calculating Nei and Li's (1979) index of genetic similarity (S~y) for RFLP com- parisons. Relationships among samples were evaluated with a phenetic cluster analysis, using the unweighted pair group meth- od for arithmetic averages (UPGMA), and plotted in a pheno- gram. Statistical confidence intervals for the branching arrange- ments of phenograms were determined using a bootstrap proce- dure (Efron and Gong 1983) of 1,000 repetitive samplings of the RAPD data and computing the 95% range of the branch point values in the resultant UPGMA phenograms (modified after Nei et al. 1985). All computations and statistical analyses were performed using SAS (version 6) programs.
Results
Compar isons of agarose- (1.2%), polyacrylamide- (12%), and denaturing-gradient-gel electrophoresis of identical R A P D products are shown in Fig. 1, 2, and 3. Little or no visible po lymorphism among wheat and bar- ley lines was detected in agarose (data not shown). Poly- acrylamide improved resolution, but both gel systems were inferior to the D G G E system for the enhanced de- tection of D N A polymorphism. Figures 1 - 3 demon- strate results from the three gel systems for the analysis of wheat.
Differentiation among wheat cultivars
Analysis of 1,056 reproducible amplified D N A sequences was possible f rom a total of eight gels and eight primers
Table 2. Oligonucleotide (10-met) primers used and the frag- ment polymorphism resolution achieved with RAPD-DGGE
Crop Primer Sequence Reso- lution a
Wheat A05 AGGGGTCTTG 3 A09 GGGTAACGCC 3 A11 CAATCGCCGT 3 A15 TTCCGAACCC 3 A17 GACCGCTTGT 2 A07/AI6 GAAACGGGTG/ 1
AGCCAGCGAA A16/A17 1, 3 A07/AI 8 /AGGTGACCGT 3
Barley A05 3 A l l l, 3 A15 1 A/7 1, 2 A16/A17 1
Oats A05 b 3 A09 3 A l l 2, 3 AO5/A18 1, 3 A12/A18 TCGGCGATAG/ 3 A16/A17 3
a 1: distinguishes primary clusters 2: distinguishes subclusters within primary groupings 3: distinguishes between individual lines within a cluster
b All primers tested with oats distinguish A. sativa from A. strigosa
500
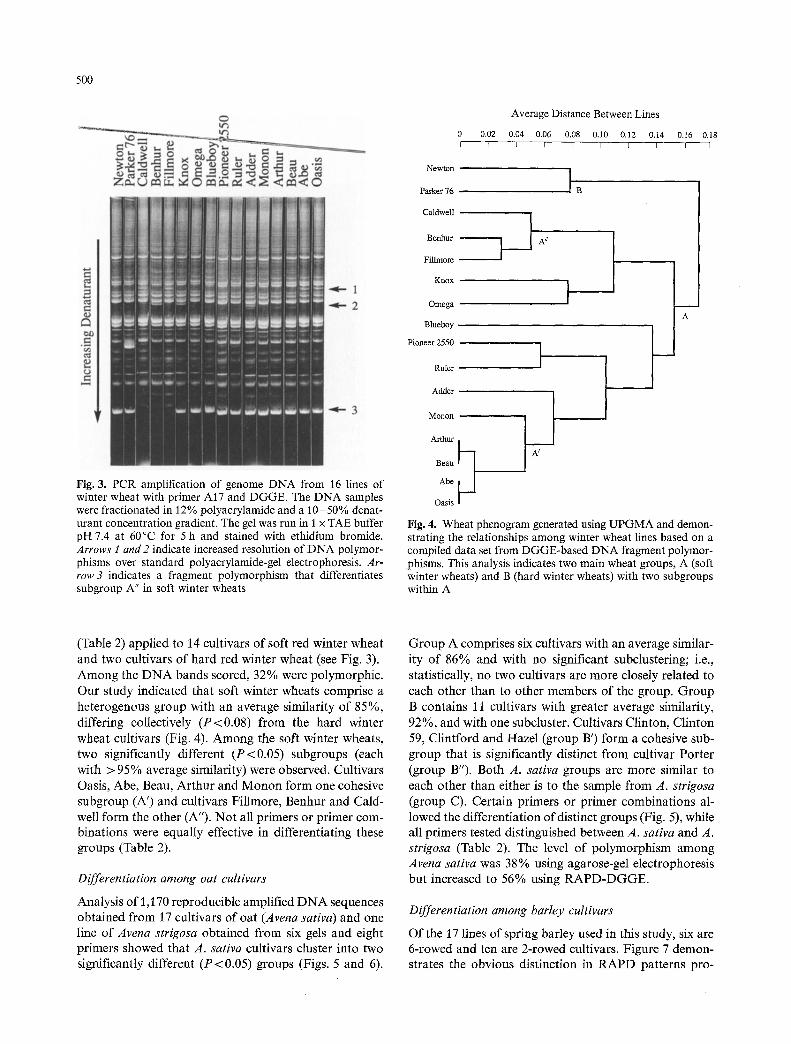
Fig. 3. PCR amplification of genome DNA from 16 lines of winter wheat with primer A17 and DGGE. The DNA samples were fractionated in l 2 % polyacrylamide and a 10-50 % denat- urant concentration gradient. The gel was run in I x TAE buffer pH 7.4 at 60~ for 5 h and stained with ethidium bromide. Arrows 1 and 2 indicate increased resolution of DNA polymor- phisms over standard polyacrylamide-gel electrophoresis. Ar- row 3 indicates a fragment polymorphism that differentiates subgroup A" in soft winter wheats
0.02
Average Distance Between Lines
0.04 0.06 0.08 0.I0 0 .12 0.14 l I I I I I
0.16 0.18 I I
Newton
Parker 76
CaldweU
Benhur
Fillmore
Knox
Omega
Blueboy
Pioneer 2550
Ruler
A ~
I Adder
Monon
Arthur
BeauAbe ~ A/
Oasis
Fig. 4. Wheat phenogram generated using UPGMA and demon- strating the relationships among winter wheat lines based on a compiled data set from DGGE-based DNA fragment polymor- phisms. This analysis indicates two main wheat groups, A (soft winter wheats) and B (hard winter wheats) with two subgroups within A
(Table 2) applied to 14 cultivars of soft red winter wheat and two cultivars of hard red winter wheat (see Fig. 3). Among the DNA bands scored, 32% were polymorphic. Our study indicated that soft winter wheats comprise a heterogenous group with an average similarity of 85%, differing collectively (P<0.08) from the hard winter wheat cultivars (Fig. 4). Among the soft winter wheats, two significantly different (P<0.05) subgroups (each with > 95% average similarity) were observed. Cultivars Oasis, Abe, Beau, Arthur and Monon form one cohesive subgroup (A') and cultivars Fillmore, Benhur and Cald- well form the other (A"). Not all primers or primer com- binations were equally effective in differentiating these groups (Table 2).
Differentiation among oat cultivars
Analysis of 1,170 reproducible amplified DNA sequences obtained from 17 cultivars of oat (Arena sativa) and one line of Avena strigosa obtained from six gels and eight primers showed that A. sativa cultivars cluster into two significantly different ( P < 0.05) groups (Figs. 5 and 6).
Group A comprises six cultivars with an average similar- ity of 86% and with no significant subclustering; i.e., statistically, no two cultivars are more closely related to each other than to other members of the group. Group B contains 11 cultivars with greater average similarity, 92%, and with one subcluster. Cultivars Clinton, Clinton 59, Clintford and Hazel (group B') form a cohesive sub- group that is significantly distinct from cultivar Porter (group B'). Both A. sativa groups are more similar to each other than either is to the sample from A. strigosa (group C). Certain primers or primer combinations al- lowed the differentiation of distinct groups (Fig. 5), while all primers tested distinguished between A. sativa and A. strigosa (Table 2). The level of polymorphism among Avena sativa was 38% using agarose-gel electrophoresis but increased to 56% using RAPD-DGGE.
Differentiation among barley cultivars
Of the 17 lines of spring barley used in this study, six are 6-rowed and ten are 2-rowed cultivars. Figure 7 demon- strates the obvious distinction in RAPD patterns pro-

501
Fig. 5. Amplification products from genomic DNA of 17 lines of oat, A. sativa, and one line of diploid oat, A. strigosa, using primer combination A05/A18. The amplification products were fractionated by DGGE. The arrow indicates a DNA polymor- phism associated with group B and absent from group A or C
Fig. 7. PCR amplification of genomic DNA from 17 lines of barley using primer combination A16/A17. Arrows 1, 2, and 3 indicate polymorphisms that distinguish 2-rowed types from 6-rowed varieties
0 I
Avena strigosa
Porter
Dal
Albion
Noble
Allen
Norline
Dubois
Clintford
Hazel
Clinton 59
Clinton
Tyler
Ogle
Putnam 61
Clintland 64
Stout
Tippecanoe
Average Distance Between Lines
0.1 0.2 0.3 0.4 I I L I
0.5 I
C
B// y B
D-
J A
0.6 I
Fig. 6. Oat phenogram demonstrating the rela- tionships among oat lines based on a compiled data set recorded from DNA fragment polymor- phisms with DGGE. This analysis places 18 lines of oat into three groups, A, B, and C. Two sub- groups were distinguished within group B

502
0 [
Gallatin
Harrington
Klages
Betzes
Bowman
Bonus
Bearpaw
Hector
Clark
Lewis
C12376
Bonanza
Morex
Larker
Atlas 68
Steptoe
Chevron
Average Distance Between Lines
0.025 0 .05 0.075 0.1 0 .125 0 .15 0.175 I I I I I I I
0.2 0.225 0.25 I I 1
9J C
Fig. 8. Barley phenogram demonstrating the rela- tionships among spring barlery lines based on compiled DGGE-based fragment polymorphism data. The analysis distinguished 6-rowed barley varieties into group A and 2-rowed barleys to groups B and C. One subgroup was identified with- in group A and two subgroups within group B
duced by these two groups. Cluster analysis of 986 DNA amplified sequences obtained from five gels and five primers (Table 2) indicated that all the barley cultivars tested comprise a single heterogenous group with sub- stantial subgrouping (Fig. 8). Most of the 2-rowed culti- vars (subgroup B', > 95% average similarity) are signifi- cantly different from all of the 6-rowed cultivars (group A) and from the 2-rowed landrace CI 12376. Among the 6-rowed cultivars, Larker, Morex and Bonanza form a cohesive subgroup (A') that also differs from CI 12376. Treating all of the 2-rowed cultivars collectively, and comparing to CI 12376, the two groups are differentiated from one another only marginally (P < 0.20). Among the 2-rowed cultivars, Lewis, Clark, Hector, Bearpaw and Bonus form a cohesive subgroup (B") that differs from cultivar Gallatin. The level of polymorphism observed among the barley lines was 41%.
All DNA bands scored in this study were reproduced two to three times. The level of reproducibility was 100% for all intense bands visualized as described previously (He et al. 1992).
Discussion
The most commonly used gel matrix for the resolution of RAPD-based polymorphism is agarose. The complexity
of patterns obtained with DGGE suggests that a large number of different DNA species are contained within a single band resolved on agarose. Consequently, the use of polyacrylamide greatly enhances resolution of the multiple amplification products (Caetano-Anolles et al. 1991). With the addition of a gradient of denaturant to the gel system, added resolution of DNA sequence poly- morphisms is achieved (He et al. 1992; demonstrated in Figs. 2 and 3).
Denaturing-gradient-gel electrophoresis is designed to allow the resolution of sequence differences among fragments of similar or identical size (Fisher and Lerman 1983; Myers et al. 1987). The procedure takes advantage of the fact that even single base-pair differences will alter fragment melting properties (Tin), thus resulting in al- tered gel migration rate. DGGE as an alternative method for detecting DNA polymorphism has been successfully used in a number of plant and animal systems (Riedel et al. 1990; Burmeister et al. 1991; Gray et al. 1991; Lessa 1992). It should be pointed out, however, that other dif- ficulties inherent in the PCR technique that influence reproducibility (Saiki et al. 1988) are not necessarily re- duced by modifying the gel system.
A comparison of the derived wheat pedigree present- ed by Murphy et al. (1986) and that based on RAPD- DGGE indicated good agreement (Table 3). The high degree of similarity (85%) among the soft winter wheat
503
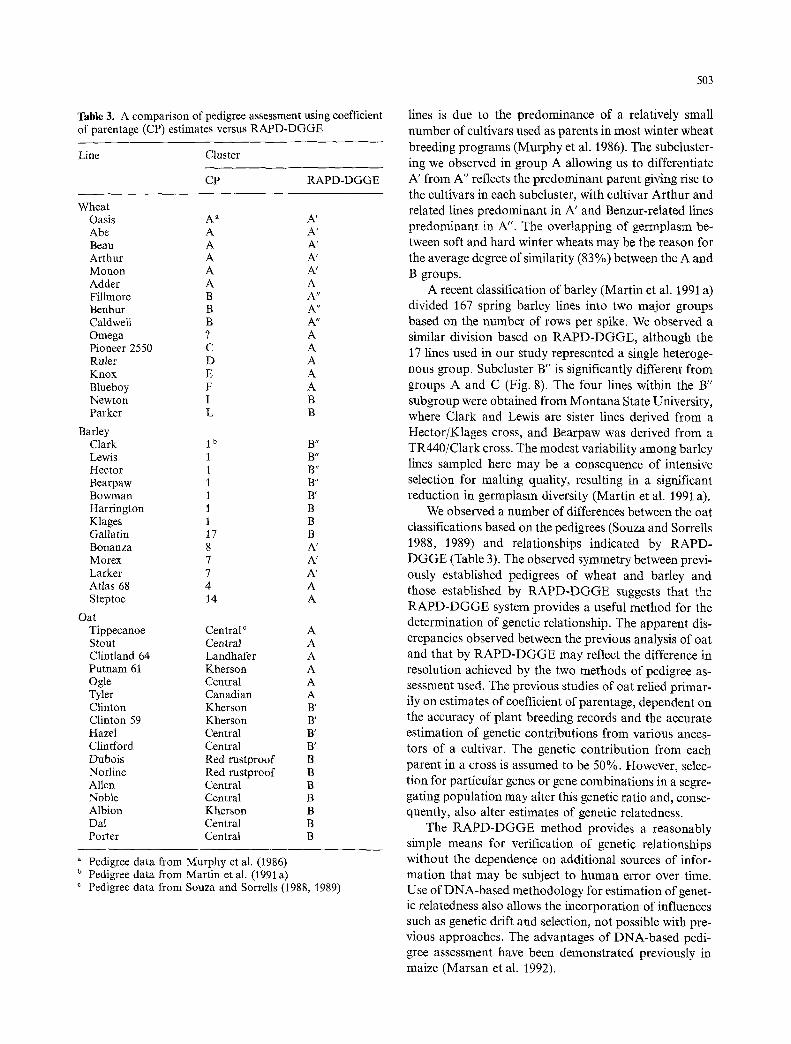
Table 3. A comparison of pedigree assessment using coefficient of parentage (CP) estimates versus RAPD-DGGE
Line Cluster
CP RAPD-DGGE
Wheat Oasis A ~ A' Abe A A' Beau A A' Arthur A A' Monon A A' Adder A A Fillmore B A" Benhur B A" Caldwell B A" Omega ? A Pioneer 2550 C A Ruler D A Knox E A Blueboy F A Newton I B Parker L B
Barley Clark 1 b B" Lewis 1 B" Hector I B" Bearpaw 1 B" Bowman 1 B' Harrington 1 B Klages 1 B Gallatin 17 B Bonanza 8 A' Morex 7 A' Larker 7 A' Atlas 68 4 A Steptoe 14 A
Oat Tippecanoe Central ~ A Stout Central A Clintland 64 Landhafer A Putnam 61 Kherson A Ogle Central A Tyler Canadian A Clinton Kherson B' Clinton 59 Kherson B' Hazel Central B' Clintford Central B' Dubois Red rustproof B Norline Red rustproof B Allen Central B Noble Central B Albion Kherson B Dal Central B Porter Central B
Pedigree data from Murphy et al. (1986) b Pedigree data from Martin et al. (1991 a)
Pedigree data from Souza and Sorrells (1988, 1989)
lines is due to the predominance of a relatively small number of cultivars used as parents in most winter wheat breeding programs (Murphy et al. 1986). The subcluster- ing we observed in group A allowing us to differentiate A' from A" reflects the predominant parent giving rise to the cultivars in each subcluster, with cultivar Arthur and related lines predominant in A' and Benzur-related lines predominant in A". The overlapping of germplasm be- tween soft and hard winter wheats may be the reason for the average degree of similarity (83 %) between the A and B groups.
A recent classification of barley (Martin et al. 1991 a) divided 167 spring barley lines into two major groups based on the number of rows per spike. We observed a similar division based on RAPD-DGGE, although the 17 lines used in our study represented a single heteroge- nous group. Subcluster B" is significantly different from groups A and C (Fig. 8). The four lines within the B" subgroup were obtained from Montana State University, where Clark and Lewis are sister lines derived from a Hector/Klages cross, and Bearpaw was derived from a TR440/Clark cross. The modest variability among barley lines sampled here may be a consequence of intensive selection for malting quality, resulting in a significant reduction in germplasm diversity (Martin et al. 1991 a).
We observed a number of differences between the oat classifications based on the pedigrees (Souza and Sorrells 1988, 1989) and relationships indicated by RAPD- DGGE (Table 3). The observed symmetry between previ- ously established pedigrees of wheat and barley and those established by RAPD-DGGE suggests that the RAPD-DGGE system provides a useful method for the determination of genetic relationship. The apparent dis- crepancies observed between the previous analysis of oat and that by RAPD-DGGE may reflect the difference in resolution achieved by the two methods of pedigree as- sessment used. The previous studies of oat relied primar- ily on estimates of coefficient of parentage, dependent on the accuracy of plant breeding records and the accurate estimation of genetic contributions from various ances- tors of a cultivar. The genetic contribution from each parent in a cross is assumed to be 50%. However, selec- tion for particular genes or gene combinations in a segre- gating population may alter this genetic ratio and, conse- quently, also alter estimates of genetic relatedness.
The RAPD-DGGE method provides a reasonably simple means for verification of genetic relationships without the dependence on additional sources of infor- mation that may be subject to human error over time. Use of DNA-based methodology for estimation of genet- ic relatedness also allows the incorporation of influences such as genetic drift and selection, not possible with pre- vious approaches. The advantages of DNA-based pedi- gree assessment have been demonstrated previously in maize (Marsan et al. 1992).

504
The primers used in this s tudy provided different lev- els of resolution. Some primers allowed the dist inction between major groups, while others al lowed detection of subgroups, and some allowed identif icat ion of genetic differences between very closely related lines. I t is impor- tant to note that , using this approach, we were able to resolve D N A polymorphisms among every line in our study. Our invest igat ion was not extensive enough to determine those features of primers critical to success in detection of polymorphism. However, it is clear that use of the R A P D - D G G E system is effective at allowing the genetic dist inction between even the most closely related lines such as wheat cultivars Abe and Ar thur , presumed to share over 94% of their genornes in common. The R A P D - D G G E system, therefore, provides an oppor tu- nity not previously available in certain self-pollinated species to directly apply D N A - b a s e d technologies to- ward germplasm evaluations, gene mapping, and mark- er-assisted selection in plant improvement programs.
Acknowledgements. We express our gratitude to Dr. Larry Dun- kle and Dr. Greg Shaner for their critical review of the manuscript. This work was funded in part by a grant to S. M. and H. O. from Midwest Plant Biotechnology Consortium, Pub- lic Varieties of Indiana and The Quaker Oats Company. This is journal series article no. 13461 from the Indiana Agricultural Experiment Station.
References
Bonierbale MW, Plaisted RL, Tanksley SD (1988) RFLP maps based on a common set of clones reveal modes of chromoso- mal evolution in potato and tomato. Genetics 120:1095- 1103
Burmeister M, diSibio G, Cox DR, Myers RM (1991) Identifica- tion of polymorphisms by genomic denaturing-gradient-gel electrophoresis: application to the proximal region of human chromosome 21. Nucleic Acids Res 19:1475-1481
Caetano-Anolles G, Bassam BJ, Gresshoff PM (1991) DNA amplification fingerprinting using very short arbitrary oligonucleotide primers. Biotechnology 9:553-557
Cox TS, Kiang YT, Gorman MB, Rodgers DM (1985 a) Rela- tionship between coefficient of parentage and genetic simi- larity indices in the soybean. Crop Sci 25:529-532
Cox TS, Lookhart GL, Walker DE, Harrell LG, Albers LD, Rodgers DM (1985 b) Genetic relationships among hard red winter wheat cultivars as evaluated by pedigree analysis and gliadin polyacrylamide-gel electrophoretic patterns. Crop Sci 25:1058-1063
Delannay X, Rodgers DM, Palmer RG (1983) Relative genetic contributions among ancestral lines to North American soy- bean cultivars. Crop Sci 23:944-949
Efron B, Gong G (1983) A leisurely look at the bootstrap, the jackknife, and crossvalidation. Am Stat 37:36-48
Fisher SG, Lerman LS (1983) DNA fragments differing by sin- gle base-pair substitutions are separated in denaturing-gra- dient gels: correspondence with melting theory. Proc Natl Acad Sci USA 80:1579-1583
Gawel NJ, Jarrett RL (1991) A modified CTAB DNA-extrac- tion procedure for Musa and Ipomoea. Plant Mol Biol Rep 91: 262- 266
Gray M, Charpentier A, Walsh K, Wu P, Bender W (1991) Mapping point mutations in the Drosophila rosy locus using denaturing-gradient-gel Nots. Genetics 127:139-149
Halward T, Stalker T, LaRue E, Kochert G (1992) Use of single- primer DNA amplification in genetic studies of peanut (Arachis hypogaea L). Plant Mol Biol 18:315-325
He S, Ohm H, Mackenzie S (1992) Detection of sequence poly- morphism among wheat varieties. Theor Appl Genet (in press)
Hu J, Quiros C (1991) Identification of broccoli and cauliflower cultivars with RAPD markers. Plant Cell Rep 10:505-511
Landry BS, Kesseli RV, Farrara B, Michelmore RW (1987) A genetic map of lettuce (Lactuca sativa L) with restriction fragment length polymorphisms, isozyme, disease resistance and morphological markers. Genetics 116.331-337
Lessa EP (1992) Rapid surveying of DNA sequence variation in natural populations. Mol Biol Evol 9:323-330
Marsan PA, Livini C, Messmer MM, Mechinger E, Frances- chini P, Monfredini G, Motto M (1992) Comparison be- tween cluster analyses from RFLP and pedigree data of inbred lines related to stiff stalk synthetic heterotic group. Maize Genet Coop Newslett 66:18-20
Martin JM, Black TK, Hoekett EA (1991 a) Diversity among North American spring barley eultivars based on coefficients of parentage. Crop Sci 31:1131-1137
Martin GB, Williams JG, Tanksley SD (1991 b) Rapid identifi- cation of markers near a Pseudomonas resistance gene in tomato using random primers and near-isogenic lines. Proc Natl Acad Sci USA 80:2336-2340
Michelmore RW, Paran I, Kesseli RV (1991) Identification of markers linked to disease-resistance genes by bulked segre- gant analysis. A rapid method to detect markers in specific genomic regions by using segregating populations. Proc Natl Acad Sci USA 88:9828-9832
Murphy JP, Cox TS, Rodgers DM (1986) Cluster analysis of red winter wheat cultivars based upon coefficients of parentage. Crop Sci 26:672-676
Myers RM, Maniatis T, Lerman LS (1987) Detection and local- ization of single base changes by denaturing-gradient-gel electrophoresis. Methods Enzymol 155:501-527
Nei M, Li W-H (1979) Mathematical model for studying genetic variation in terms of restriction endonucleases. Proc Natl Acad Sci USA 76:5269-5273
Nei M, Shephens J, Saitou N (1985) Methods for computing the standard errors of branching points in an evolutionary tree and their application to molecular data from humans and apes. Mol Biol Evol 2:66-85
Price S, Shumaker KM, Kahler AL, Allard RW, Hill JE (1984) Estimates of population differentiation obtained from en- zyme polymorphism and quantitative characters. J. Hered 72:141 - 142
Reiter RS, Williams J, Feldmann K, Rafalski JA, Tingey SV, Scolnik P (1992) Global and local genome mapping in Ara- bidopsis thaliana by using recombinant inbred lines and ran- dom amplified polymorphic DNAs. Proc Natl Acad Sci USA 89:1477-1481
Riedel GE, Swanberg SL, Kuranda KD, Marquette K, LaPan P, Bledsoe P, Kennedy A, Lin B-Y (1990) Denaturing-gradi- ent-gel electrophoresis identifies genomie DNA polymor- phism with high frequency in maize. Theor Appl Genet 80:1-10
Rodgers DM, Murphy JP, Frey KJ (1983) Impact of plant breeding on the grain yield and genetic diversity of spring oats. Crop Sci 23:737-740

505
Saiki RK, Gelfand DH, Stoffel S, Scharf S, Higuchi RH, Horn GT, Mullis KB, Elrich HA (1988) Primer-directed enzymatic amplification of DNA with a thermostable DNA poly- merase. Science 239:487-491
Souza E, SorreUs M (1988) Coefficients-of-parentage for North American oat cultivars released from 1951 to 1985. Search: agriculture no. 33. Cornell Univ Agric Exp Stn, Ithaca, New York
Souza E, Sorrells M (1989) Coefficients-of-parentage for North American oat cultivars released from 1951 to 1985. Crop Sci 29:595-601
St. Martin SK (1982) Effective population size for the soybean improvement program in maturity groups 00 to IV. Crop Sci 22:151-152
Tanksley SD, Bernatsky R, Lapitan NL, Prince JP (1988) Con- servation of gene repertoire but not gene order in pepper and tomato. Proc Natl Acad Sci USA 85:6419-6423
Van Heusden AW, Bachmann K (1992) Genotype relationships in Microseris-Elegans (Asteraceae, Lactuceae) revealed by DNA amplification from arbitrary primers RAPDs. Plant Syst Evol 179:221-233
Welsh J, McClelland M (1990) Fingerprinting genomes using PCR with arbitrary primers. Nucleic Acids Res 189:7213- 7218
Wilde J, Waugh R, Powell W (1992) Genetic fingerprinting of Theobroma clones using randomly amplified polymorphic DNA markers. Theor Appl Genet 83:871-887
Williams JG, Kublik AR, Livak KJ, Rafalski JA, Tingey SV (1990) DNA polymorphisms amplified by arbitrary primers are useful as genetic markers. Nucleic Acids Res 18: 6531- 6535
Wrigley CW (1970) Protein mapping by combined gel electrofo- cusing and electrophoresis: application to the study of geno- typic variation in wheat gliadins. Biochem. Genet 4: 509- 516