Genetic variation of Indian potato (Solanum tuberosum L.) genotypes using chromosomal and RAPD...
9
238 Crop Breeding and Applied Biotechnology 10: 238-246, 2010 Crop Breeding and Applied Biotechnology 10: 238-246, 2010 Brazilian Society of Plant Breeding. Printed in Brazil Received 20 November 2009 Accepted 6 March 2010 Genetic variation of Indian potato ( Genetic variation of Indian potato ( Genetic variation of Indian potato ( Genetic variation of Indian potato ( Genetic variation of Indian potato ( Solanum tuberosum Solanum tuberosum Solanum tuberosum Solanum tuberosum Solanum tuberosum L.) L.) L.) L.) L.) genotypes using chromosomal and RAPD markers genotypes using chromosomal and RAPD markers genotypes using chromosomal and RAPD markers genotypes using chromosomal and RAPD markers genotypes using chromosomal and RAPD markers Anath Bandhu Das 1* , Iswar Chandra Mohanty 1 , Dawanidhi Mahapatra 1 , Suprava Mohanty 2 and Ashutosh Ray 3 ABSTRACT - Genetic diversity in thirty Indian potatoes were analyzed employing karyotype, genome size and RAPD markers. Chromosome analysis revealed 2n = 4x = 48 except cv. K. Chandramukhi (2n = 4x + 2 = 50). Total genomic chromosome length and chromosome volume varied from 21.14μm in cv. K. Pukhraj to 31.91μm in cv. MS/89-60 and 14.31μm 3 in cv. MS/92-1090 to 33.16μm 3 in cv. JW-160 respectively. 4C DNA content was significantly varied from 3.640 pg (~891 Mbp) in cv. MS/92-1090 to 11.12 pg (~2747 Mbp) in cv. K. Chandramukhi. RAPD revealed 131 amplified DNA fragments (300 to 2200 bp) with 79 unique bands (7 to 71% polymorphism) among the genotypes. Similarity coefficients (ranged from 0.29 to 0.93) and cluster analysis reflected the expected trends in relationships of the full and half-sib potato genotypes. Genetic distances obtained from a dendrogram could help breeders to choose the diverse parents for a breeding program aimed at varietal improvement. Key words: 4C DNA content, DNA markers, genotypes, potato, somatic chromosome. INTRODUCTION Potatoes are a high yielding short duration crop that produces high dry matter and protein per unit area and unit time among the major food crops. In terms of quantity, potatoes are the fourth on the list of the crop species after rice, wheat, and corn which are important for human nutrition worldwide. Thus, potatoes have a great potential to meet the increasing food demand world. The nutrient value of potatoes is high and provides carbohydrates, proteins, minerals, vitamin C, a number of B-group vitamins and high quality dietary fibres (Gopalan et al. 1972). Cultivar identification and techniques to assess cultivar homogeneity are important for seed production, germplasm maintenance, crop certification and registration. The new potato cultivars created from the restricted gene pool are likely to be genetically quite similar and hence difficult to differentiate morphologically. Therefore, genetic identification of cultivars and varieties are useful in maintaining a germplasm and planning of breeding programs for new cultivar production to meet the demand of this crop to grow in different agroclimatic environments. Karyotype analysis provides valuable information related to the mechanisms of genome evolution. There are few cytological studies on potatoes because of small and relatively numerous chromosomes (Wilkinson 1994). The somatic chromosome number of S. tuberosum reported is 2n = 4x = 48 (Fish and Karp 1986, Howard 1960, Swaminathan 1 Orissa University of Agriculture and Technology, College of Agriculture, Department of Agricultural Biotechnology, Bhubaneswar, 751003, Orissa, India. *E-mail: [email protected] 2 Regional Plant Resource Centre, Cytogenetics Laboratory, Nayapalli, Bhubaneswar, 751015, Orissa, India. 2 Orissa University of Agriculture and Technology, College of Agriculture, Department of Plant Breeding and Genetics, Bhubaneswar, 751003, Orissa, India.
Transcript of Genetic variation of Indian potato (Solanum tuberosum L.) genotypes using chromosomal and RAPD...
238 Crop Breeding and Applied Biotechnology 10: 238-246, 2010
AB Das et al.
Crop Breeding and Applied Biotechnology 10: 238-246, 2010
Brazilian Society of Plant Breeding. Printed in Brazil
Received 20 November 2009
Accepted 6 March 2010
Genetic variation of Indian potato (Genetic variation of Indian potato (Genetic variation of Indian potato (Genetic variation of Indian potato (Genetic variation of Indian potato (Solanum tuberosum Solanum tuberosum Solanum tuberosum Solanum tuberosum Solanum tuberosum L.)L.)L.)L.)L.)genotypes using chromosomal and RAPD markersgenotypes using chromosomal and RAPD markersgenotypes using chromosomal and RAPD markersgenotypes using chromosomal and RAPD markersgenotypes using chromosomal and RAPD markers
Anath Bandhu Das1*, Iswar Chandra Mohanty1, Dawanidhi Mahapatra1, Suprava Mohanty2 and Ashutosh Ray3
ABSTRACT - Genetic diversity in thirty Indian potatoes were analyzed employing karyotype, genome size and RAPD markers.Chromosome analysis revealed 2n = 4x = 48 except cv. K. Chandramukhi (2n = 4x + 2 = 50). Total genomic chromosome lengthand chromosome volume varied from 21.14μm in cv. K. Pukhraj to 31.91μm in cv. MS/89-60 and 14.31μm3 in cv. MS/92-1090 to33.16μm3 in cv. JW-160 respectively. 4C DNA content was significantly varied from 3.640 pg (~891 Mbp) in cv. MS/92-1090 to11.12 pg (~2747 Mbp) in cv. K. Chandramukhi. RAPD revealed 131 amplified DNA fragments (300 to 2200 bp) with 79 uniquebands (7 to 71% polymorphism) among the genotypes. Similarity coefficients (ranged from 0.29 to 0.93) and cluster analysisreflected the expected trends in relationships of the full and half-sib potato genotypes. Genetic distances obtained from a dendrogramcould help breeders to choose the diverse parents for a breeding program aimed at varietal improvement.
Key words: 4C DNA content, DNA markers, genotypes, potato, somatic chromosome.
INTRODUCTION
Potatoes are a high yielding short duration crop thatproduces high dry matter and protein per unit area andunit time among the major food crops. In terms of quantity,potatoes are the fourth on the list of the crop species afterrice, wheat, and corn which are important for humannutrition worldwide. Thus, potatoes have a great potentialto meet the increasing food demand world. The nutrientvalue of potatoes is high and provides carbohydrates,proteins, minerals, vitamin C, a number of B-group vitaminsand high quality dietary fibres (Gopalan et al. 1972).Cultivar identification and techniques to assess cultivarhomogeneity are important for seed production,
germplasm maintenance, crop certification and registration.The new potato cultivars created from the restricted genepool are likely to be genetically quite similar and hencedifficult to differentiate morphologically. Therefore,genetic identification of cultivars and varieties are usefulin maintaining a germplasm and planning of breedingprograms for new cultivar production to meet the demandof this crop to grow in different agroclimatic environments.Karyotype analysis provides valuable information relatedto the mechanisms of genome evolution. There are fewcytological studies on potatoes because of small andrelatively numerous chromosomes (Wilkinson 1994). Thesomatic chromosome number of S. tuberosum reported is2n = 4x = 48 (Fish and Karp 1986, Howard 1960, Swaminathan
1 Orissa University of Agriculture and Technology, College of Agriculture, Department of Agricultural Biotechnology, Bhubaneswar, 751003, Orissa, India.*E-mail: [email protected]
2 Regional Plant Resource Centre, Cytogenetics Laboratory, Nayapalli, Bhubaneswar, 751015, Orissa, India.2 Orissa University of Agriculture and Technology, College of Agriculture, Department of Plant Breeding and Genetics, Bhubaneswar, 751003, Orissa, India.

Crop Breeding and Applied Biotechnology 10: 238-246, 2010 239
Genetic variation of Indian potato (Solanum tuberosum L.) genotypes using chromosomal and RAPD markers
1954, Swaminathan and Howard 1953, Swaminathan andMagron 1961) with meiotic chromosome analysis (Yeh andPeloquin 1965). Genome size is an important character offundamental significance that provides useful data in manycytotaxonomic and evolution studies (Price 1976). It playsan important role in tolerance/resistance to low temperaturesand in responses to ozone depletion or to the effect ofglobal warming (Bennett and Leitch 1995). DNA markersgenerated from randomly amplified polymorphic DNA(RAPD) is used to assess and characterize genetic variationsamong plant genotypes of interest at the DNA level(Williams et al. 1990), which is not necessarily expressedas differences in phenotype. In the present investigation,an attempt has been made to utilize the above mentionedtechniques of a genetic variation assessment in 30genotypes of Solanum tuberosum and subsequentlyinterpret their phylogeny and affinities in the context of anefficient breeding partner selection.
MATERIAL AND METHODS
Thirty genotypes of Solanum tuberosum L.including cultivars and advanced breeding lines wereobtained from the Central Potato Research Institute, Shimla,India through the All India Coordinated Potato ImprovementProject, Orissa University of Agriculture and Technology(OUAT), Bhubaneswar (Table 1) and were grown in theexperimental green house of OUAT, Bhubaneswar.
Karyotype analysis
Fresh healthy root tips from the sprouted tubers werepre-treated in a saturated solution of para-dichlorobenzenewith aesculine for 3 h at 18oC followed by an overnightfixation in 1:3 acetic acid : alcohol. Chromosomes werestained overnight in 2% aceto-orcine after cold hydrolysisin 5N HCl for 5 min and were squashed in 45% propionicacid. Ten well scattered metaphase plates from each genotypewere selected for karyotype analysis. The detail karyotypeanalysis was performed according to Das and Mallick(1993). The mean values of total genomic chromosomelength and total genomic chromosome volume withstandard error were calculated.
4C nuclear DNA content and genome size
For the Feulgen cytophotometric estimation of 4CDNA content, ten fixed root-tips from each genotypes werefixed in 1:3 acetic acid:ethyl alcohol overnight at roomtemperature, hydrolysed in 1N HCl for 12 min at 60oC.
Hydrolysed root tips were washed in distilled water andstained in Schiff’s reagent for 2h at 14oC. Each root-tipsquash was prepared in 45% acetic acid. In situ nuclearDNA content was estimated from metaphase chromosomesusing a Nikon Optiphot microscope fitted with amicrospectrophotometer using monochromatic light at 550nm following the Sharma and Sharma method (1980). DNAcontent was obtained on the basis of optical density, whichwas converted to picograms (pg) using the 4C nuclearDNA values (67.1 pg) for Allium cepa var. Deshi (VantHof 1963) as a standard. The genome size of differentgenotypes was calculated from their 4C DNA values andaccording to their ploidy level. Genome size = (4C DNAvalue / ploidy level) pg × 980 Mbp = value in pg × 980Mbp. To find out the significant differences in genomesize among different species, if any, the analysis of variance(ANOVA) test (Sokal and Rohlf 1973) was performed.
Isolation of DNA
Genomic DNA was isolated from young expandingleaves using the method of Saghai and Maroof et al. (1984).Leaves (5g) were ground to fine powder in liquid nitrogenand suspended in 20 ml of CTAB (Cetryl trimethylammonium bromide) buffer containing 2% CTAB, 100 mMTris-HCl, pH 8, 20 mM EDTA, 1.4 M NaCl, and 1% b-mercaptoethanol. The suspension was incubated at 60oCfor 1 h in a water bath. The DNA was extracted in chloroform-isoamyl alcohol (49:1) and centrifuged at 5000i×ig for 20min at 10oC. The aqueous phase was transferred to a newsterile 50 ml tube and the DNA was precipitated with adouble volume of chilled iso-propanol, and hung out anddried with a vacuum concentrator after rinsing it in 70%ethanol. Dried DNA was dissolved in a minimum amountof T10E1 (10 mM Tris-HCl, 1mM EDTA; pH 8). IsolatedDNA was further purified by treating with RNAse at 37oCfor 1h followed by chloroform: isoamyl alcohol extractionand ethanol precipitation in the presence of 0.3 M sodiumacetate (pH 5.2). The DNA was spooled out, washed in70% ethanol, air dried and dissolved in a T10E1 buffer andthe DNA concentration was estimated using VersaflourTM Fluorometer (Bio-Rad, USA) using Hoechst 33258 asthe fluorimetric dye. The DNA was diluted to a finalconcentration of 25 ng mL-1 using T10E1 buffer, to use as atemplate for RAPD analysis.
PCR amplification and gel electrophoresis
RAPD profiles were generated by using single decamerrandom oligonucleotide primers (Operon Technologies,

240 Crop Breeding and Applied Biotechnology 10: 238-246, 2010
AB Das et al.
Alameda, USA) in polymerase chain reaction (PCR)following the standard protocol of Williams et al. (1990).Each reaction mixture (25 mL) for PCR amplification wasprepared with 25 ng genomic template DNA, 200 mM eachof dNTP, 25 ng primer, 0.5 unit Taq DNA Polymerase(Bangalore Genei Pvt. Ltd., Bangalore, India) and 10 ́ PCRassay buffer (50 mM KCl, 10 mM Tris-HCl, 1.5 mM MgCl2,pH 9.0). The PCR reaction was carried out in a Gene AmpPCR 2400 thermal cycler (Perkin Elmer, USA) programmedfor 45 cycles using 20 primers each of OP-A, OP-D andPO-N series. The first cycle was programmed for 5 min at94oC for denaturation, 1 min at 37oC for primer annealingand 2 min at 72oC for DNA polymerisation. In the next 44cycles the period of denaturation was maintained at 1 minwhile the primer annealing and DNA polymerization wasthe same as in the first cycle. An additional cycle of 15 minat 72oC was used for primer extension. The amplifiedsamples were stored at 4oC and separated by electrophoresisin 1.5% agarose gel in 1´TAE buffer for 3h at 55V. GeneRuler 100bp DNA ladder plus (MBI Fermantas, Lithuania)was used as a marker to determine the size of the amplicons.Amplified products were visualized by staining the gelwith ethidium bromide and the image was captured in animage analyser Gel Doc-G 700 (Bio-Rad, USA) fordocumentation and analysis. Only those amplificationproducts that appeared consistently in three replicationswere scored for further analysis.
RAPD data analysis
In the RAPD analysis, the presence or absence ofthe bands was taken into consideration and the differencein the intensity of the band was ignored. Index of diversitywas calculated from the frequency of RAPD bands withineach genotype. From the RAPD data a binary matrix wasobtained. The matrix was elaborated utilizing the multivariateanalysis NTSYS-pc (Rohlf 1993). The binary matrix wastransformed in a similarity matrix using the Jaccard’scoefficient. The cluster analysis was carried out using theUPGMA (Unweighted pair group mean average) method(Sneath and Sokal 1973).
RESULTS AND DISCUSSION
Chromosome characteristics
Detailed analysis of somatic chromosomes of 30genotypes of S. tuberosum showed somatic chromosomenumber 2n = 4x = 48 in all the genotypes except cv. K.
Chandramukhi (K.C.M.) where an aneusomatic set ofchromosomes (2n = 4x = 48 + 2) was found (Figures 1b-h).On the basis of the size of the chromosome and the positionof the constrictions, a number of chromosome types werefound common with the genotypes studied though theydiffered from each other in the minute structural details ofthe karyotype. A general description of the representativetypes of chromosomes (Figure 1a) is given below:
Figure 1. a. Standard types of chromosomes; b-h. Somatic metaphasechromosomes of different potato genotypes (×1942). 1b = K. Badshah2n = 48, 1c = K. Sutlej (2n = 48), 1d = K. Jawahar (2n = 48), 1e = JW-160 (2n = 48), 1f = MTP-I (2n = 48), 1g = 92 PT-27 (2n = 48), 1h = K.Chandramukhi (2n = 50). Magnification 2950X.
Type A - Chromosomes are large to medium sizedwith two constrictions in nearly median to median andnearly sub median to sub median in position respectively.
Type B - Large to medium sized chromosomes withtwo constrictions comprised with nearly sub median tosub median positions respectively.
Type C - Chromosomes are medium to small withnearly median to median primary constrictions.
Type D - Chromosomes are medium to smallchromosomes with nearly sub median to sub median primaryconstrictions.

Crop Breeding and Applied Biotechnology 10: 238-246, 2010 241
Genetic variation of Indian potato (Solanum tuberosum L.) genotypes using chromosomal and RAPD markers
Detailed analysis of the somatic compliments andthe different genomic characteristics showed genotypespecific variations in chromosome numbers and structures(Table 1). The karyotype formula of all the genotypesrevealed definite differences in the chromosome structure.Type A chromosomes were present in all the genotypeswhere as Type B were present in 10 genotypes (Table 1).Type C chromosomes were the most numerous in all thegenotypes that varied from 24 in EX/A-680-16 to 40 in K.Jyoti, JW-160 and K. Jawahar. Type D chromosomes variedfrom 4 to 20 among the studied genotypes; the highestnumber of Type D chromosomes found in the genotypeEX/A-680-16. The type of chromosomes and the numberof secondary constricted chromosomes varied significantlywith the genotypes. Type A, C and D chromosomes werecommon in all the genotypes, with high variability in termsof chromosomes in each category. Furthermore, withrespect of the karyotype formula, there were no differencesbetween K. Pukhraj and K. Sutlej; DTP-I and DTP-II; JW-160 and K. Jawahar; 92PT-27 and MTP-I. In contrast, thegenotype chromosome length and volume varied significantly.Karyotype analysis revealed the preponderance of TypeC chromosomes in all the genotypes studied. The totalgenomic chromosome length varied from 21.14 μm in K.Pukhraj to 31.91 μm in MS/89-60 and the total genomicchromosome volume varied from 14.31μm3 in MS/92-1090to 33.16 μm3 in JW-160. The average length of chromosomesvaried from 1.76 μm in K. Pukhraj to 2.66 μm in MS/89-60.The popular cultivar K. Chandramukhi showed comparativelylarger chromosomes (2.49 μm) than any other releasedcultivars. Minute observations showed a proportionalincrease in chromosome length with an increase inchromosome volume. A significant positive correlation (r= 0.69) was found between the total chromosome lengthand total chromosome volume suggesting a highinterdependence between them at the cultivar level. Thesefacts indicate the predetermined genetic control ofchromosome coiling. Evidently, differences in chromosomelength or chromosome volume were due to differentialcondensation and spiralization of the chromosome arms.In addition, the genotype specific compaction of DNAthreads along with nucleosomes or the additional genesequences with altered non-histone proteins in thechromosome played an important role in the chromosomalarchitecture of the genotypes (Chattopadhyay and Sharma1990).
Total F% analysis showed symmetric karyotypes ashaving median to nearly median chromosomes with a
moderate fluctuation of F% values from 34.48% to 48.62%in MF-I and K. Jyoti respectively. The gradual alterationsand shifting of TF% values might be due to the chromosomalalteration in the genome. The structural alterations in thechromosome morphology as well as variations of secondaryconstricted chromosomes in the genotypes might be dueto the duplication of chromosomes or translocations betweenthe chromosomes with or without secondary constrictionsat a very early stage of evaluation (Das 2008).
Diversification in genome size
The haploid genome size varied significantly from~890 bp in MS/92-1090 to ~2750 bp in Khupri Chandramukhi(K.C.M.). The aneusomatic cv. K. Chandramukhi had amuch larger genome size as compared to others whichmight be due to the extra pair of chromosomes as well aslarge chromosome sizes as revealed in the karyotype. Thevariability in the genome size in different genotypes mightbe attributed to the loss or addition of many repeats in thegenome through alterations in the micro- and macro-environment during evolution in the selection of newcultivars (Price et al. 1980). The correlation coefficientbetween total chromosome length and genome size showedsignificant correlation (r = 0.521). This clearly suggeststhat the genome size is positively correlated with the totalchromosome length. Such variations are in agreement withthe findings of other works (Das and Das 1994, Das 2008).The analysis of genome size at the cultivar level in repeatedexperiments revealed the stable genome size in eachgenotype. On the other hand the genome size differedsignificantly among the genotypes. Flavell et al. (1997)reported that differences in genome size depend on therepetitive DNA amount. We agree that variability ofgenome size can be attributed to the loss or addition ofhighly repetitive DNA sequences rather than the AT- orGC-rich sequences in a genome (Martel et al. 1997) whichreached a certain level and became stabilized during micro-evolution and gradual selection.
RAPD analysis
Out of the total 60 primers (OPA, OPD, OPN) used,the 13 most informative ones were selected (Table 2).Figures 2a and b depict the RAPD profiles of 30 genotypesamplified by OPA-03 and OPA-05 respectively that showeddistinct RAPD profiles of each genotype. Each RAPDmarker locus was expressed as two alleles; a presence orabsence of the band. The frequency of polymorphic lociwas estimated in various potato genotypes considering

242 Crop Breeding and Applied Biotechnology 10: 238-246, 2010
AB Das et al.
three criteria for primer selection (1) reproducibility (2)number of polymorphic loci per assay and (3) levels ofpolymorphism detected in a specific group of genotypes.Some of the analyzed potato genotypes had a characteristicRAPD pattern consisting of 6 to 10 major fragments withtheir size ranging from 300 bp to 2200 bp. A total of 113amplification products were obtained out of which 79 werepolymorphic. Similarity index values ranged from 0.29 to0.93 with a standard deviation of 0.21 indicating a widegenetic base of the potato germplasm used in the analysis.The percentage of polymorphism among the genotypes
varied from 7.0% between K. Sutlej and MTP-I to 71.0%between JX-90 and 85P-670 respectively. As thepolymorphisms were detected as the presence or absenceof a particular band, RAPDs scored were dominant markers.Therefore, the genotypes heterozygous or dominanthomozygous for a particular locus showed similar bandsand thus didn’t show polymorphism. Thus, RAPD usedhere did not detect possible changes in allele frequenciesexcept when the allele detected as the RAPD band wascompletely lost (Bamberg et al. 2001). Monomorphic bandsof the same molecular weight present in all the genotypes
Table 1. Comparative genomic parameters and genome size in 30 genotypes of Solanum tuberosum
NSC: Number of secondary constricted chromosomes; pg: pictogram; Mbp: Mega base pair.
Crop Breeding and Applied Biotechnology 10: 238-246, 2010 243
Genetic variation of Indian potato (Solanum tuberosum L.) genotypes using chromosomal and RAPD markers
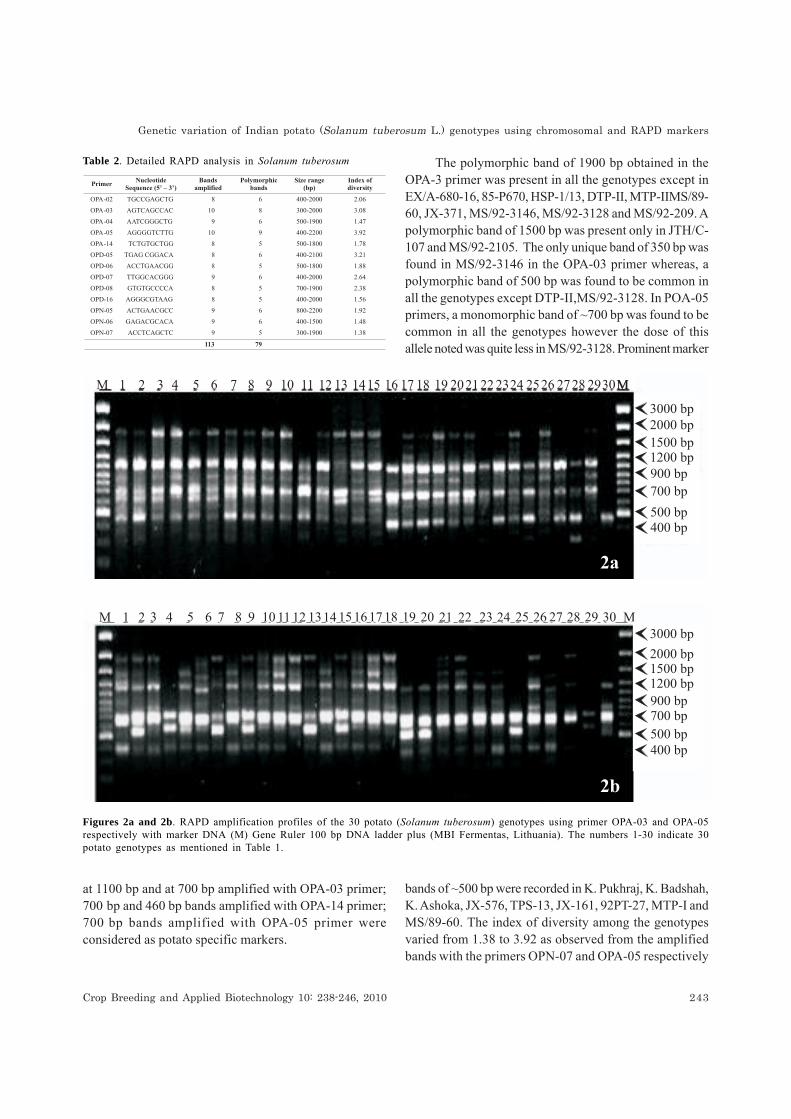
at 1100 bp and at 700 bp amplified with OPA-03 primer;700ibp and 460 bp bands amplified with OPA-14 primer;700ibp bands amplified with OPA-05 primer wereconsidered as potato specific markers.
The polymorphic band of 1900 bp obtained in theOPA-3 primer was present in all the genotypes except inEX/A-680-16, 85-P670, HSP-1/13, DTP-II, MTP-IIMS/89-60, JX-371, MS/92-3146, MS/92-3128 and MS/92-209. Apolymorphic band of 1500 bp was present only in JTH/C-107 and MS/92-2105. The only unique band of 350 bp wasfound in MS/92-3146 in the OPA-03 primer whereas, apolymorphic band of 500 bp was found to be common inall the genotypes except DTP-II,MS/92-3128. In POA-05primers, a monomorphic band of ~700 bp was found to becommon in all the genotypes however the dose of thisallele noted was quite less in MS/92-3128. Prominent marker
Table 2. Detailed RAPD analysis in Solanum tuberosum
Figures 2a and 2b. RAPD amplification profiles of the 30 potato (Solanum tuberosum) genotypes using primer OPA-03 and OPA-05respectively with marker DNA (M) Gene Ruler 100 bp DNA ladder plus (MBI Fermentas, Lithuania). The numbers 1-30 indicate 30potato genotypes as mentioned in Table 1.
bands of ~500 bp were recorded in K. Pukhraj, K. Badshah,K. Ashoka, JX-576, TPS-13, JX-161, 92PT-27, MTP-I andMS/89-60. The index of diversity among the genotypesvaried from 1.38 to 3.92 as observed from the amplifiedbands with the primers OPN-07 and OPA-05 respectively

244 Crop Breeding and Applied Biotechnology 10: 238-246, 2010
AB Das et al.
(Table 2). All total 11 unique genetic markers were producedin different genotypes of potatoes. The genotype MTP-Iproduced 2 unique amplified DNA markers of 750 bp inOPD-16 and 2200 bp in OPN-05 primer. A maximum of 3unique markers were amplified with primer OPA-03 at 300bp in MS/92-3146; 750 bp in TPS-13; 700 bp in EX/A-680-16; OPA-04 and OPD-08 produced 1 and 2 unique markersrespectively in K. Ashoka of 1500 bp to 2000 bp fragmentsize and at 850 bp in 92PT-27. These specific markersobtained by RAPD amplification could be sequenced andspecific primers could also be designed to amplify onlythe band of interest which might be used as cultivarspecific markers for cultivar identification. The geneticvariability obtained in the Indian potato genotypes arealso in accordance with the findings of Genlou et al (2003)in estimating the genetic diversity of 45 deploid potatohybrids and Abbas et al. (2008) in six potato cultivars fromPakistan using RAPD markers. The findings also supportthe reports on grapes (Lima et al. 2006) and in coffee(Teixeira-Cabral et al. 2004).
The dendrogram obtained on the basis of the geneticdistances radically separated the 30 genotypes into twomajor clusters each having 15 genotypes. First clusterhaving all comparatively close genetic affinity which werefurther divided into two sub groups K. Badshah and JX-576 found very closely related genotypes. In the secondcluster advanced clone 92PT-27 and MTP-I found theclosest genetic affinity while advanced breeding line MS/92-209 formed out a group with wide genetic variabilityfrom the rest of the genotypes. The advanced breedinglines MS/89-60, MS/92-3146, MTP-II remain close to eachother and hence treated as clonal duplications while MS/92-3128 showed some degree of genetic distance. Thiscluster analysis could be helpful in plant breeding to makedecisions regarding the selection of diverse parents frominter clusters for breeding programs in order to maximizethe expression of heterosis for any desired character ofagronomic importance.
Figure 3. Dendrogram generated from RAPD markers obtained in different primers using the UPGMA algorithm.

Crop Breeding and Applied Biotechnology 10: 238-246, 2010 245
Genetic variation of Indian potato (Solanum tuberosum L.) genotypes using chromosomal and RAPD markers
ACKNOWLEDGEMENTSWe acknowledge the help of the Director, Central
Potato Research Institute, Shimla, India for providing the
germplasm used in this investigation. We also thank theDirector, Regional Plant Resource Centre, Bhubaneswarfor facilitating the laboratory work for this investigation.
Variação genética entre genótipos de batata (Variação genética entre genótipos de batata (Variação genética entre genótipos de batata (Variação genética entre genótipos de batata (Variação genética entre genótipos de batata (SolanumSolanumSolanumSolanumSolanumtuberosumtuberosumtuberosumtuberosumtuberosum L.) usando cromossomos e marcadores RAPD L.) usando cromossomos e marcadores RAPD L.) usando cromossomos e marcadores RAPD L.) usando cromossomos e marcadores RAPD L.) usando cromossomos e marcadores RAPD
RESUMO - A diversidade genética entre 30 genótipos indianos de batata foi analisada por meio de cariótipo, tamanho dogenoma e marcadores RAPD. Análise cromossômica revelou 2n=4x=48, exceto para a cv. K. Chandramukhi (2n=4x+2=50).O tamanho e o volume cromossômico total variaram de 21,14μm no cv. K. Pukhraj a 31,91μm no cv. MS/89-60 e de14,31μm3 no cv. MS/92-1090 a 33,16μm3 no cv. JW-160, respectivamente. O conteúdo 4C de DNA variou significativamentede 3,64 pg (~891 Mbp) no cv. MS/92-1090 a 11,12 pg (~2747 Mbp) no cv. K. Chandramukhi. Marcadores RAPD revelaram131 bandas de DNA (300 a 2200 bp) sendo 79 delas exclusivas (7 a 71% de polimorfismo) entre os genótipos. Coeficientesde similaridade (variando de 0,29 a 0,93) e análise de cluster refletiram as tendências esperadas em relação a genótiposmeios-irmãos e irmãos completos. Distâncias genéticas contempladas no dendrograma poderão auxiliar melhoristas aescolher parentais diversos para programas de melhoramento visando melhoramento varietal.
Palavras-chave: Contéudo 4C de DNA, marcadores de DNA, genótipos, batata, cromossomo somático.
REFERENCES
Abbas SJ, Rasool G, Shah SRU and Iqbal A (2008) Analysis ofgenetic diversity in Pakistani potato cultivars by using randomlyamplified polymorphic DNA (RAPD) primers. American-Eurasian Journal of Sustainable Agriculture 2: 50-53.
Bamberg JB, Kiru SD and del Rio AH (2001) RAPD comparison ofreputed duplicate populations in the Russion and US potatogenebanks. American Journal on Potato Research 78: 365-369.
Bennett M and Leitch I (1995) Nuclear DNA Amounts inAngiosperms. Annals of Botany 76: 113-176.
Chattopadhyay D and Sharma AK (1990) Chromosome studiesand microspectro-photometric estimation of nuclear DNA indifferent strains of Coriandum sativum L. Cytobios 64: 43-51.
Das AB and Mallick R (1993) Nuclear DNA chromosome changeswithin the tribe Ammineae. Cytobios 74: 197-207.
Das AB and Das P (1994) Estimation of 4C DNA content andkaryotype analysis in edible varieties of banana (Musaacuminata). Cytobios 78: 213-20.
Das AB (2008) Assessment of genetic diversity and phylogeneticanalysis of ‘Star Cactus’ (Astrophytum) through chromosomeand RAPD markers. Cytologia 73: 179-188.
Fish N and Karp A (1986) Improvements in regeneration fromprotoplasts of potato and studies on chromosome stability.Theoretical and Aplied Genetics 72: 405-412.
Flavell RB, Rinpau J and Smith DB (1997) Repeated sequenceDNA relationships in four cereal genomes. Chromosome 63:205-22.
Genlou S, Wang-pruski G, Mayich M and Jong H (2003) RAPD andpedigree-based genetic diversity estimates in cultivated diploidpotato hybrids. Theoretical and Applied Genetics 107: 110-115.
Gopalan C, Ramashashtri BV and Balsubramanian SC (1972)Nutritive value of Indian Foods. National Institute ofNutrition (Indian Council of Medical Research), Hyderabad,210p.
Howard HW (1960) Potato cytology and genetics 1952-59.Biblphia Genetics 19: 87-216.
Levan A, Fredyak Sandberg A (1964) Nomenclature for centromericposition on chromosome. Heredita 52: 201-220.
Lima JC, Crippa A, Garrido LR, Camargo UA and Oliveria PRD(2006) Molecular analysis of the seedlessness character in grapusing RAPD markers. Crop Breeding and AppliedBiotechnology 6: 209-214.
Martel E, Denay D, Siljakyakovtev S, Brown S and Sarr A (1997)Genome size variation and basic chromosome number in pearlmillet and fourteen related Pennisetum species. Journal ofHeredity 88: 139-43.
Price HJ (1976) Evaluation of DNA content in plants. BotanicalReview 42: 27-52.

246 Crop Breeding and Applied Biotechnology 10: 238-246, 2010
AB Das et al.
Price HJ, Bachman K, Cihambers KL and Riggs J (1980) Detectionof intraspecific variation in nuclear DNA content of Microserisdouglasii. Botanical Gazette 141: 195-198.
Rohlf FJ (1993) Ntsys-PC. Numerical taxonomy andmultivariate analysis system, version 1.80. Exeter Software,NY, 887p.
Saghai-Maroof MA, Sliman KM, Jorgens RA and Allard RW (1984)Ribosomal DNA spacer-length polymorphisms in barley:Mendelian inheritance, chromosomal location, and populationdynamics. Proceedings of the National Academy of Scienceof the United States of America 81: 8014-8018.
Sneath PHA and Sokal R (1973) Numerical taxonomy. Freeman,San Francisco, 573p.
Sharma AK and Sharma A (1980) Chromosome techniques:theory and practice. 3rd ed., Butteruorths, London, 724p.
Sokal PR and Rohlf FJ (1973) Introduction to Biostatistics.Freeman, San Francisco, 368p.
Swaminathan MS and Howard HW (1953) The cytology andgenetics of the potato (Solanum tuberosum) and related species.Biblphia Genetics 16: 1-192.
Swaminathan MS (1954) Nature of polyploidy in some 48chromosome species of the genus Solanum section Tuberarium.Genetics 39: 59-76.
Swaminathan MS and Magron ML (1961) Origin and cytogeneticsof the commercial potato. Advances in genetics 10: 217-256.
Teixeira-Cabral TA, Sakiyama NS, Zambolim L, Pereirs AA, BarrosEG and Silva DG (2004) Characterization of differential coffeetree hosts for Hemileia vastatrix Berk. Et Br. with RAPDmarkers. Crop Breeding and Applied Biotechnology 4:68-73.
Van’t Hof J and Sparrow AH (1963) A relationship between DNAcontent, nuclear volume, and minimum mitotic cycle time.Proceedings of the National Academy of Science of theUnited States of America 49: 897-902.
Wilkinson MJ (1994) Genome evolution in potatoes. In: J. E.Bradshaw and G. R. Mackay (eds) Potato genetics. UniversityPress, UK, p. 43-70.
Williams JGK, Kubelik AR, Livak KJ, Rafalski JA and Tingey SV(1990) DNA polymorphisms amplified by arbitrary primers areuseful as genetic markers. Nucleic Acids Research 18: 6531-6535.
Yeh BP and Peloquin SJ (1965) Pachytene chromosomes of thepotato (Solanum tuberosum subsp. Andigena). AmericanJournal of Botany 52: 1014-1020.