Tomato (Solanum lycopersicum L.) in the service of ... - CORE
Upload
independentCategory
view
1download
0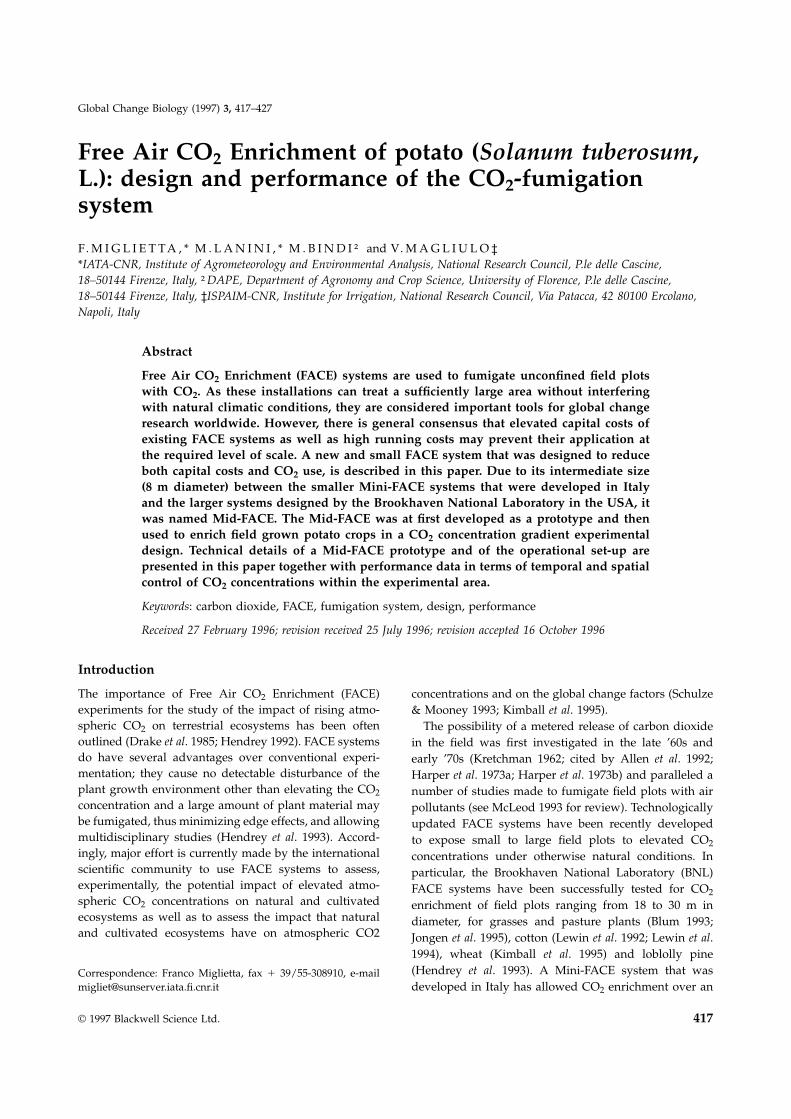
Global Change Biology (1997) 3, 417–427
Free Air CO2 Enrichment of potato (Solanum tuberosum,L.): design and performance of the CO2-fumigationsystem
F. M I G L I E T T A , * M . L A N I N I , * M . B I N D I † and V. M A G L I U L O ‡*IATA-CNR, Institute of Agrometeorology and Environmental Analysis, National Research Council, P.le delle Cascine,18–50144 Firenze, Italy, †DAPE, Department of Agronomy and Crop Science, University of Florence, P.le delle Cascine,18–50144 Firenze, Italy, ‡ISPAIM-CNR, Institute for Irrigation, National Research Council, Via Patacca, 42 80100 Ercolano,Napoli, Italy
Abstract
Free Air CO2 Enrichment (FACE) systems are used to fumigate unconfined field plotswith CO2. As these installations can treat a sufficiently large area without interferingwith natural climatic conditions, they are considered important tools for global changeresearch worldwide. However, there is general consensus that elevated capital costs ofexisting FACE systems as well as high running costs may prevent their application atthe required level of scale. A new and small FACE system that was designed to reduceboth capital costs and CO2 use, is described in this paper. Due to its intermediate size(8 m diameter) between the smaller Mini-FACE systems that were developed in Italyand the larger systems designed by the Brookhaven National Laboratory in the USA, itwas named Mid-FACE. The Mid-FACE was at first developed as a prototype and thenused to enrich field grown potato crops in a CO2 concentration gradient experimentaldesign. Technical details of a Mid-FACE prototype and of the operational set-up arepresented in this paper together with performance data in terms of temporal and spatialcontrol of CO2 concentrations within the experimental area.
Keywords: carbon dioxide, FACE, fumigation system, design, performance
Received 27 February 1996; revision received 25 July 1996; revision accepted 16 October 1996
Introduction
The importance of Free Air CO2 Enrichment (FACE) concentrations and on the global change factors (Schulzeexperiments for the study of the impact of rising atmo- & Mooney 1993; Kimball et al. 1995).spheric CO2 on terrestrial ecosystems has been often The possibility of a metered release of carbon dioxideoutlined (Drake et al. 1985; Hendrey 1992). FACE systems in the field was first investigated in the late ’60s anddo have several advantages over conventional experi- early ’70s (Kretchman 1962; cited by Allen et al. 1992;mentation; they cause no detectable disturbance of the Harper et al. 1973a; Harper et al. 1973b) and paralleled aplant growth environment other than elevating the CO2 number of studies made to fumigate field plots with airconcentration and a large amount of plant material may pollutants (see McLeod 1993 for review). Technologicallybe fumigated, thus minimizing edge effects, and allowing updated FACE systems have been recently developedmultidisciplinary studies (Hendrey et al. 1993). Accord- to expose small to large field plots to elevated CO2ingly, major effort is currently made by the international concentrations under otherwise natural conditions. Inscientific community to use FACE systems to assess, particular, the Brookhaven National Laboratory (BNL)experimentally, the potential impact of elevated atmo- FACE systems have been successfully tested for CO2spheric CO2 concentrations on natural and cultivated enrichment of field plots ranging from 18 to 30 m inecosystems as well as to assess the impact that natural diameter, for grasses and pasture plants (Blum 1993;and cultivated ecosystems have on atmospheric CO2 Jongen et al. 1995), cotton (Lewin et al. 1992; Lewin et al.
1994), wheat (Kimball et al. 1995) and loblolly pine(Hendrey et al. 1993). A Mini-FACE system that wasCorrespondence: Franco Miglietta, fax 1 39/55-308910, e-mail
[email protected] developed in Italy has allowed CO2 enrichment over an
© 1997 Blackwell Science Ltd. 417
418 F. M I G L I E T T A et al.
Fig. 1 Sketch diagram showing the assemblage of the differentMid-FACE components (see text for explanation).
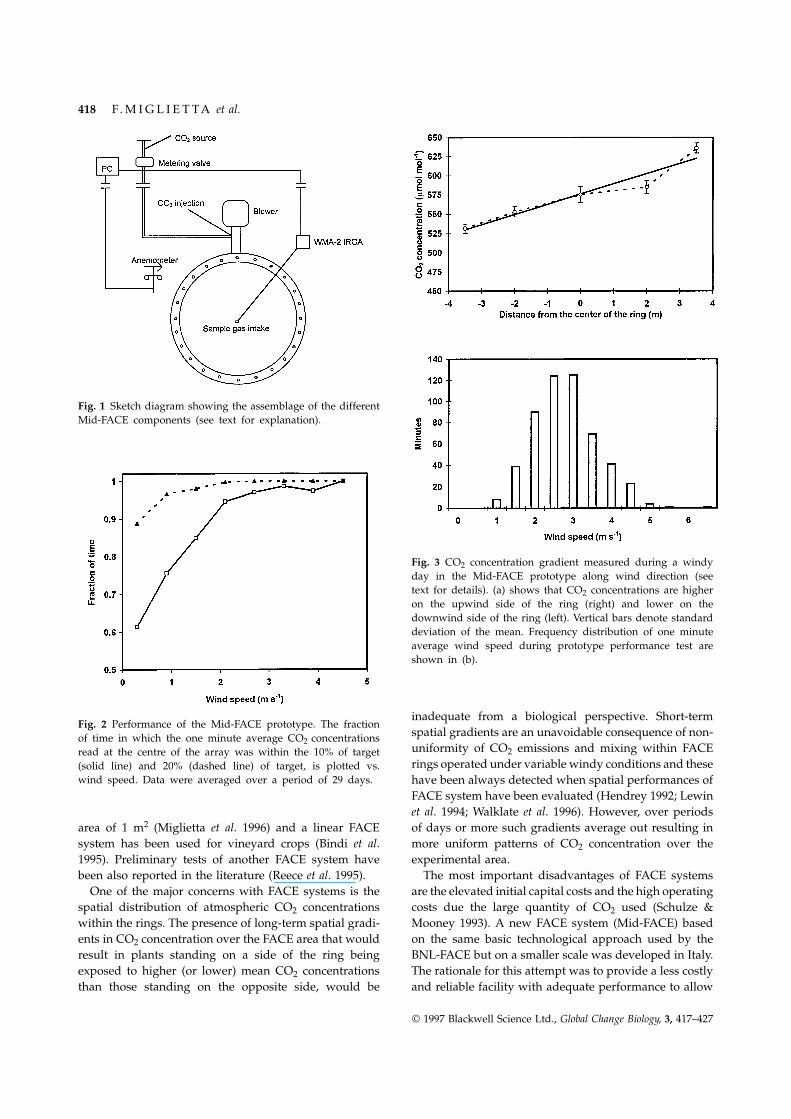
Fig. 3 CO2 concentration gradient measured during a windyday in the Mid-FACE prototype along wind direction (seetext for details). (a) shows that CO2 concentrations are higheron the upwind side of the ring (right) and lower on thedownwind side of the ring (left). Vertical bars denote standarddeviation of the mean. Frequency distribution of one minuteaverage wind speed during prototype performance test areshown in (b).
inadequate from a biological perspective. Short-termFig. 2 Performance of the Mid-FACE prototype. The fraction
spatial gradients are an unavoidable consequence of non-of time in which the one minute average CO2 concentrationsuniformity of CO2 emissions and mixing within FACEread at the centre of the array was within the 10% of targetrings operated under variable windy conditions and these(solid line) and 20% (dashed line) of target, is plotted vs.
wind speed. Data were averaged over a period of 29 days. have been always detected when spatial performances ofFACE system have been evaluated (Hendrey 1992; Lewinet al. 1994; Walklate et al. 1996). However, over periodsof days or more such gradients average out resulting inarea of 1 m2 (Miglietta et al. 1996) and a linear FACE
system has been used for vineyard crops (Bindi et al. more uniform patterns of CO2 concentration over theexperimental area.1995). Preliminary tests of another FACE system have
been also reported in the literature (Reece et al. 1995). The most important disadvantages of FACE systemsare the elevated initial capital costs and the high operatingOne of the major concerns with FACE systems is the
spatial distribution of atmospheric CO2 concentrations costs due the large quantity of CO2 used (Schulze &Mooney 1993). A new FACE system (Mid-FACE) basedwithin the rings. The presence of long-term spatial gradi-
ents in CO2 concentration over the FACE area that would on the same basic technological approach used by theBNL-FACE but on a smaller scale was developed in Italy.result in plants standing on a side of the ring being
exposed to higher (or lower) mean CO2 concentrations The rationale for this attempt was to provide a less costlyand reliable facility with adequate performance to allowthan those standing on the opposite side, would be
© 1997 Blackwell Science Ltd., Global Change Biology, 3, 417–427
D E S I G N A N D P E R F O R M A N C E O F A F A C E S Y S T E M 419
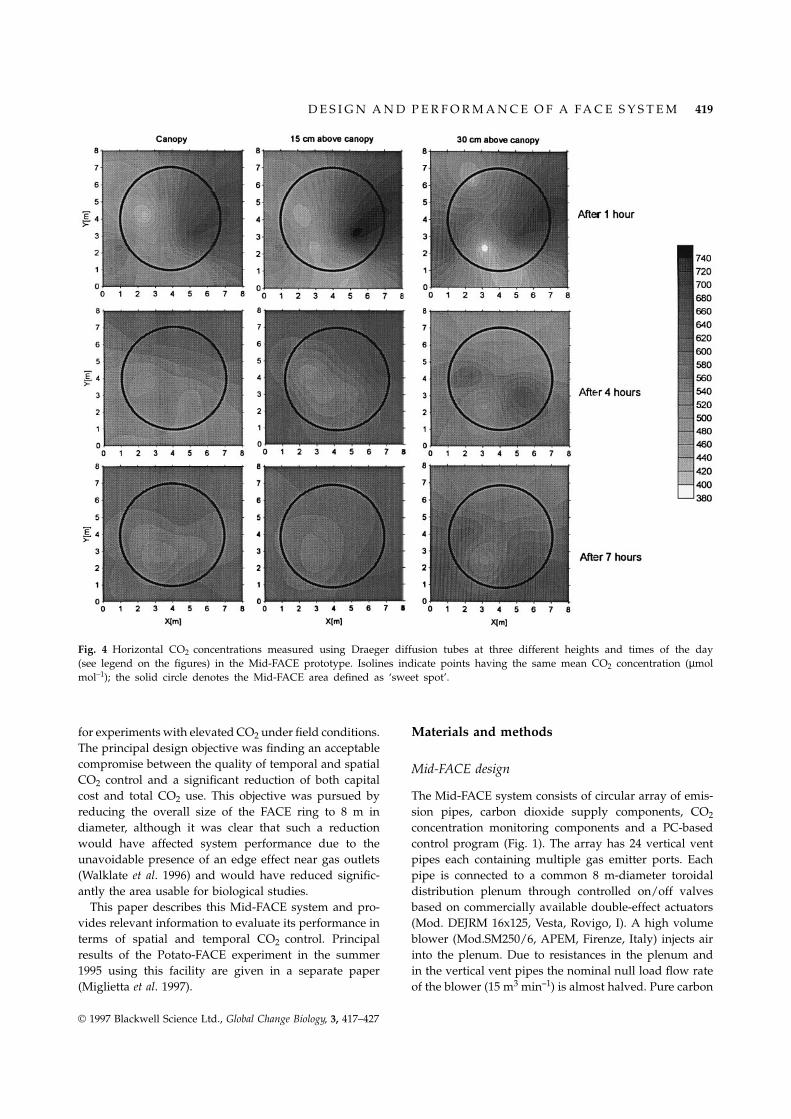
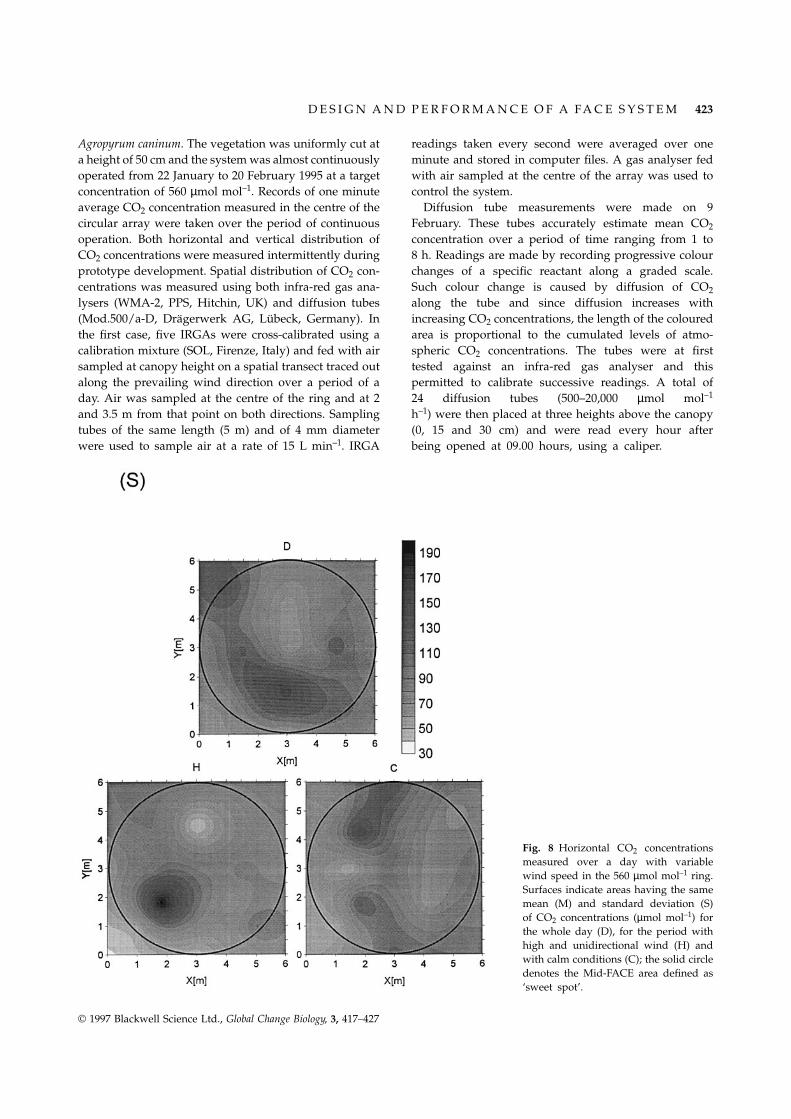
Fig. 4 Horizontal CO2 concentrations measured using Draeger diffusion tubes at three different heights and times of the day(see legend on the figures) in the Mid-FACE prototype. Isolines indicate points having the same mean CO2 concentration (µmolmol–1); the solid circle denotes the Mid-FACE area defined as ‘sweet spot’.
for experiments with elevated CO2 under field conditions. Materials and methodsThe principal design objective was finding an acceptablecompromise between the quality of temporal and spatial Mid-FACE designCO2 control and a significant reduction of both capitalcost and total CO2 use. This objective was pursued by The Mid-FACE system consists of circular array of emis-
sion pipes, carbon dioxide supply components, CO2reducing the overall size of the FACE ring to 8 m indiameter, although it was clear that such a reduction concentration monitoring components and a PC-based
control program (Fig. 1). The array has 24 vertical ventwould have affected system performance due to theunavoidable presence of an edge effect near gas outlets pipes each containing multiple gas emitter ports. Each
pipe is connected to a common 8 m-diameter toroidal(Walklate et al. 1996) and would have reduced signific-antly the area usable for biological studies. distribution plenum through controlled on/off valves
based on commercially available double-effect actuatorsThis paper describes this Mid-FACE system and pro-vides relevant information to evaluate its performance in (Mod. DEJRM 16x125, Vesta, Rovigo, I). A high volume
blower (Mod.SM250/6, APEM, Firenze, Italy) injects airterms of spatial and temporal CO2 control. Principalresults of the Potato-FACE experiment in the summer into the plenum. Due to resistances in the plenum and
in the vertical vent pipes the nominal null load flow rate1995 using this facility are given in a separate paper(Miglietta et al. 1997). of the blower (15 m3 min–1) is almost halved. Pure carbon
© 1997 Blackwell Science Ltd., Global Change Biology, 3, 417–427
420 F. M I G L I E T T A et al.
dioxide is mixed with ambient air by placing the outletimmediately after the blower at the level of a flexiblepipe which connects the blower to the plenum. CO2
injection rate is controlled by a motorized metering valve(Zonemaster Mod.VZX4404-KW2.0 and Mod.AVUE2304,Satchwell Control System, Milano, Italy). The plenumand the vertical vent pipes are made of polyvinyl chloride(PVC) with internal diameters of 20 and 6.5 cm, respect-ively. Each vent pipe has a height of 60 cm above groundand has triple-jet gas emission ports; each port points atthe array centre and 60 degrees to either side. The heightof triple ports (Lewin et al. 1994) may be increased bymeans of short PVC extensions that can be insertedimmediately after the plenum-vertical vent pipe connec-tion This permits to follow growth of the vegetation andallow for CO2 fumigation just above the top of the plantcanopy. On/off valves connecting the vertical pipes to theplenum are pneumatically actuated to allow or prevent airentering from the plenum to the vertical pipe. Actuationis ensured by computer-controlled two-way electrovalves(Mod.8404 V, Rexroth Italiana, Milano, Italy) which arelocated at some distance from the ring. Compressed gasis used to open and close the on/off valves and the
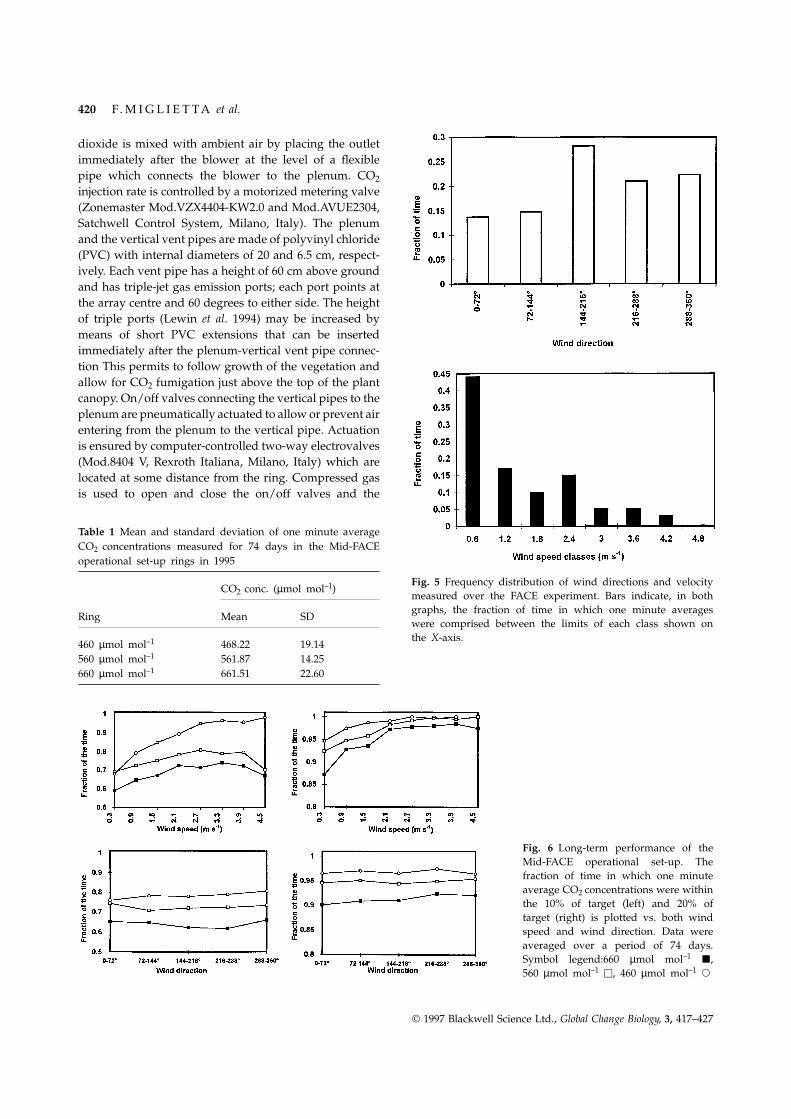
Table 1 Mean and standard deviation of one minute averageCO2 concentrations measured for 74 days in the Mid-FACEoperational set-up rings in 1995
Fig. 5 Frequency distribution of wind directions and velocityCO2 conc. (µmol mol–1)
measured over the FACE experiment. Bars indicate, in bothgraphs, the fraction of time in which one minute averages
Ring Mean SDwere comprised between the limits of each class shown onthe X-axis.
460 µmol mol–1 468.22 19.14560 µmol mol–1 561.87 14.25660 µmol mol–1 661.51 22.60
Fig. 6 Long-term performance of theMid-FACE operational set-up. Thefraction of time in which one minuteaverage CO2 concentrations were withinthe 10% of target (left) and 20% oftarget (right) is plotted vs. both windspeed and wind direction. Data wereaveraged over a period of 74 days.Symbol legend:660 µmol mol–1 j,560 µmol mol–1 u, 460 µmol mol–1 s
© 1997 Blackwell Science Ltd., Global Change Biology, 3, 417–427
D E S I G N A N D P E R F O R M A N C E O F A F A C E S Y S T E M 421
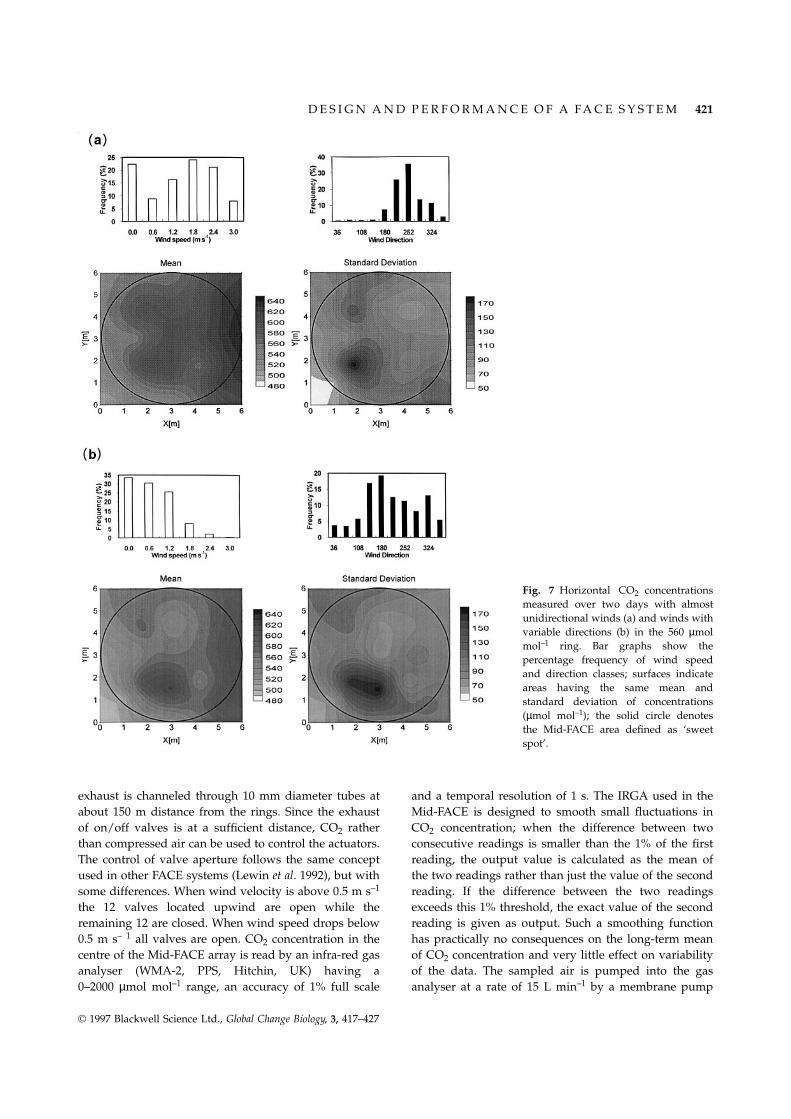
Fig. 7 Horizontal CO2 concentrationsmeasured over two days with almostunidirectional winds (a) and winds withvariable directions (b) in the 560 µmolmol–1 ring. Bar graphs show thepercentage frequency of wind speedand direction classes; surfaces indicateareas having the same mean andstandard deviation of concentrations(µmol mol–1); the solid circle denotesthe Mid-FACE area defined as ‘sweetspot’.
exhaust is channeled through 10 mm diameter tubes at and a temporal resolution of 1 s. The IRGA used in theMid-FACE is designed to smooth small fluctuations inabout 150 m distance from the rings. Since the exhaust
of on/off valves is at a sufficient distance, CO2 rather CO2 concentration; when the difference between twoconsecutive readings is smaller than the 1% of the firstthan compressed air can be used to control the actuators.
The control of valve aperture follows the same concept reading, the output value is calculated as the mean ofthe two readings rather than just the value of the secondused in other FACE systems (Lewin et al. 1992), but with
some differences. When wind velocity is above 0.5 m s–1 reading. If the difference between the two readingsexceeds this 1% threshold, the exact value of the secondthe 12 valves located upwind are open while the
remaining 12 are closed. When wind speed drops below reading is given as output. Such a smoothing functionhas practically no consequences on the long-term mean0.5 m s– 1 all valves are open. CO2 concentration in the
centre of the Mid-FACE array is read by an infra-red gas of CO2 concentration and very little effect on variabilityof the data. The sampled air is pumped into the gasanalyser (WMA-2, PPS, Hitchin, UK) having a
0–2000 µmol mol–1 range, an accuracy of 1% full scale analyser at a rate of 15 L min–1 by a membrane pump
© 1997 Blackwell Science Ltd., Global Change Biology, 3, 417–427
422 F. M I G L I E T T A et al.
located at the centre of the Mid-FACE array at a height Mid-FACE systems that have been used for prototypedevelopment and for subsequent field experiments usedof 5 cm above the top of plant canopy. Sampled air is
channelled through 5 m of polyethylene tubing of 4 mm CO2 rising from a deep geological source (Miglietta et al.1993). The supply of CO2 is available at the Rapolanointernal diameter so that, taking into account the turbu-
lence which is created into the pipe, the time for the field station, Siena, Central Italy. After purification, theCO2 was supplied to the Mid-FACE arrays throughsample to go from the centre of the plot to the gas
analyser is in the order of few seconds (less than 3 s). a 1400 m-long pipeline made up of 75 mm-diameterpolyethylene tubes. The gas was maintained at a pressureWindspeed and direction (R.M.Young Company, Traverse
City, USA) are continuosly monitored during Mid-FACE of 300 kPa and CO2 was used both to feed the flowcontrollers and to actuate pneumatic valves. This avoidedoperations.
The same Proportional Integral Differential (PID) algo- the use of an air compressor to control the aperture ofvertical vent pipes. This was possible because the outletrithm described by Lewin et al. (1994) is used to regulate
the amount of CO2 which is metered into the plenum. of gas exhaust of the on/off valves was sufficiently farfrom the rings to avoid any interference.This algorithm makes use of both mass horizontal flow
based on wind velocity and a PID component based onCO2 concentrations read in the centre of the array to
System performancescalculate output voltage used to control the meteringvalves. Wind velocity is a direct mass-horizontal-trans- (a) Mid-FACE prototype. The Mid-FACE prototype was
assembled in late November 1994 and tested fromport component of the algorithm, and the PID adjuststhe deviations to achieve a closer fit to the CO2 concentra- December 1994 to early February 1995. A Mid-FACE ring
was mounted over a natural grassland dominated bytion set points.
© 1997 Blackwell Science Ltd., Global Change Biology, 3, 417–427
D E S I G N A N D P E R F O R M A N C E O F A F A C E S Y S T E M 423
Agropyrum caninum. The vegetation was uniformly cut at readings taken every second were averaged over oneminute and stored in computer files. A gas analyser feda height of 50 cm and the system was almost continuously
operated from 22 January to 20 February 1995 at a target with air sampled at the centre of the array was used tocontrol the system.concentration of 560 µmol mol–1. Records of one minute
average CO2 concentration measured in the centre of the Diffusion tube measurements were made on 9February. These tubes accurately estimate mean CO2circular array were taken over the period of continuous
operation. Both horizontal and vertical distribution of concentration over a period of time ranging from 1 to8 h. Readings are made by recording progressive colourCO2 concentrations were measured intermittently during
prototype development. Spatial distribution of CO2 con- changes of a specific reactant along a graded scale.Such colour change is caused by diffusion of CO2centrations was measured using both infra-red gas ana-
lysers (WMA-2, PPS, Hitchin, UK) and diffusion tubes along the tube and since diffusion increases withincreasing CO2 concentrations, the length of the coloured(Mod.500/a-D, Dragerwerk AG, Lubeck, Germany). In
the first case, five IRGAs were cross-calibrated using a area is proportional to the cumulated levels of atmo-spheric CO2 concentrations. The tubes were at firstcalibration mixture (SOL, Firenze, Italy) and fed with air
sampled at canopy height on a spatial transect traced out tested against an infra-red gas analyser and thispermitted to calibrate successive readings. A total ofalong the prevailing wind direction over a period of a
day. Air was sampled at the centre of the ring and at 2 24 diffusion tubes (500–20,000 µmol mol–1
h–1) were then placed at three heights above the canopyand 3.5 m from that point on both directions. Samplingtubes of the same length (5 m) and of 4 mm diameter (0, 15 and 30 cm) and were read every hour after
being opened at 09.00 hours, using a caliper.were used to sample air at a rate of 15 L min–1. IRGA
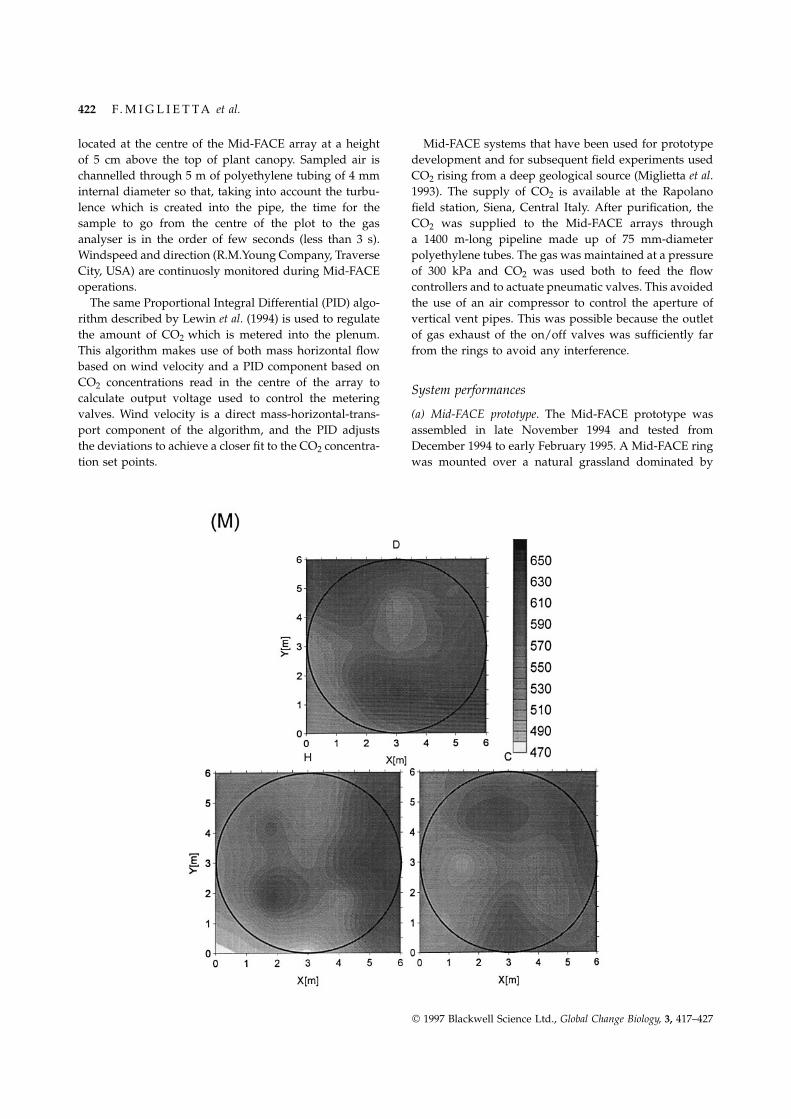
Fig. 8 Horizontal CO2 concentrationsmeasured over a day with variablewind speed in the 560 µmol mol–1 ring.Surfaces indicate areas having the samemean (M) and standard deviation (S)of CO2 concentrations (µmol mol–1) forthe whole day (D), for the period withhigh and unidirectional wind (H) andwith calm conditions (C); the solid circledenotes the Mid-FACE area defined as‘sweet spot’.
© 1997 Blackwell Science Ltd., Global Change Biology, 3, 417–427
424 F. M I G L I E T T A et al.
growth, but it then remained unchanged at a heightof 58 cm from late June to harvest.
Mid-FACE performances were evaluated throughoutthe experimental season both by continuously recordingin computer files one minute average CO2 concentrationsmeasured in the centre of each array and by performingmeasurements of spatial distribution of CO2 concentra-tion within the FACE plot. Spatial distribution measure-ments were made from 20 August to 9 September inthe different Mid-FACE rings. During this period airwas sampled from 16 different positions within eachCO2 enriched array. Spatial arrangement of samplingpoints was defined on the basis of prototype perform-ance data by defining two concentric circles enclosing56% (outer circle) and 14% (inner circle) of the totalFACE plot area. The area defined by the outer circlewas supposed to correspond to the ‘sweet spot’ sensuLewin et al. (1992) in which CO2 concentration wereminimally affected by wind speed and direction. Airsampling was made using a membrane pump and anautomatic multiport sampling device (ALD, Massa-Carrara). Air was sampled for 10 consecutive minutesfrom each port and fed into a gas analyser. Measure-ments were made for the three CO2 enriched rings bymoving the multiport sampler between them. Beforeeach series of measurements the gas analysers werecalibrated using a gas calibration cylinder. The multiportdevice and the gas analyser were both connected tothe central control computer and both one minute CO2
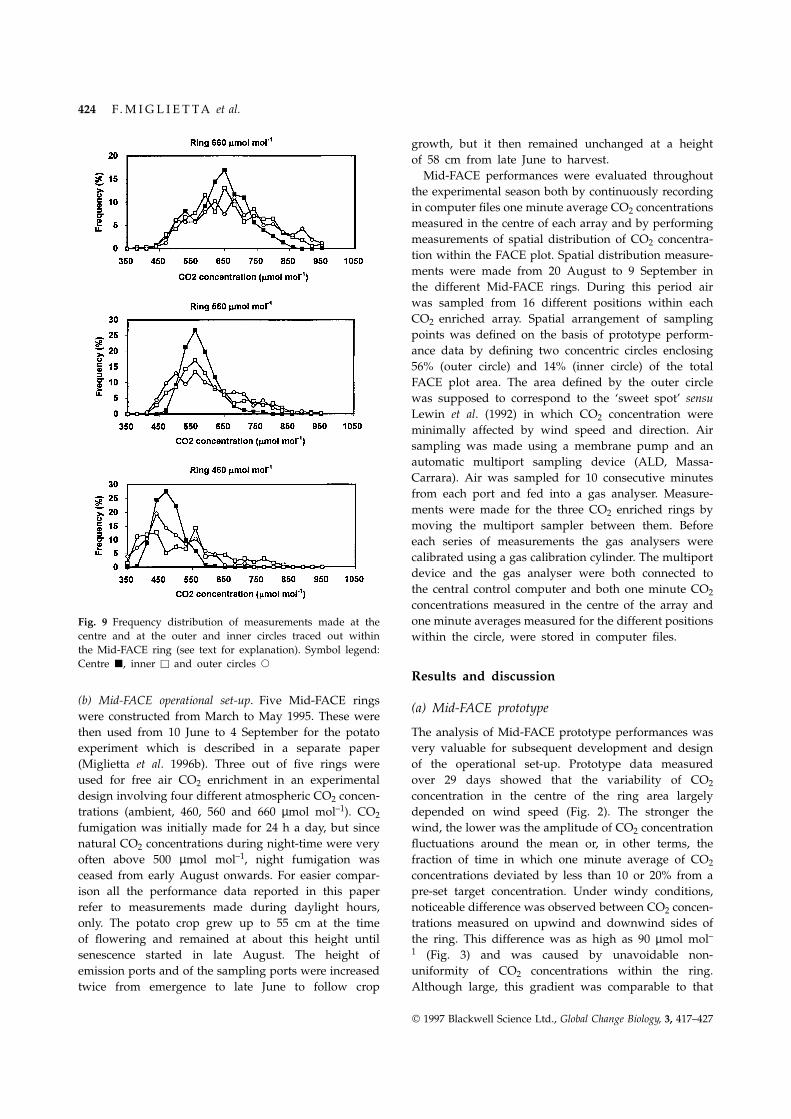
concentrations measured in the centre of the array andone minute averages measured for the different positionsFig. 9 Frequency distribution of measurements made at the
centre and at the outer and inner circles traced out within within the circle, were stored in computer files.the Mid-FACE ring (see text for explanation). Symbol legend:Centre j, inner u and outer circles s
Results and discussion
(b) Mid-FACE operational set-up. Five Mid-FACE rings(a) Mid-FACE prototype
were constructed from March to May 1995. These werethen used from 10 June to 4 September for the potato The analysis of Mid-FACE prototype performances was
very valuable for subsequent development and designexperiment which is described in a separate paper(Miglietta et al. 1996b). Three out of five rings were of the operational set-up. Prototype data measured
over 29 days showed that the variability of CO2used for free air CO2 enrichment in an experimentaldesign involving four different atmospheric CO2 concen- concentration in the centre of the ring area largely
depended on wind speed (Fig. 2). The stronger thetrations (ambient, 460, 560 and 660 µmol mol–1). CO2
fumigation was initially made for 24 h a day, but since wind, the lower was the amplitude of CO2 concentrationfluctuations around the mean or, in other terms, thenatural CO2 concentrations during night-time were very
often above 500 µmol mol–1, night fumigation was fraction of time in which one minute average of CO2
concentrations deviated by less than 10 or 20% from aceased from early August onwards. For easier compar-ison all the performance data reported in this paper pre-set target concentration. Under windy conditions,
noticeable difference was observed between CO2 concen-refer to measurements made during daylight hours,only. The potato crop grew up to 55 cm at the time trations measured on upwind and downwind sides of
the ring. This difference was as high as 90 µmol mol–of flowering and remained at about this height untilsenescence started in late August. The height of 1 (Fig. 3) and was caused by unavoidable non-
uniformity of CO2 concentrations within the ring.emission ports and of the sampling ports were increasedtwice from emergence to late June to follow crop Although large, this gradient was comparable to that
© 1997 Blackwell Science Ltd., Global Change Biology, 3, 417–427
D E S I G N A N D P E R F O R M A N C E O F A F A C E S Y S T E M 425
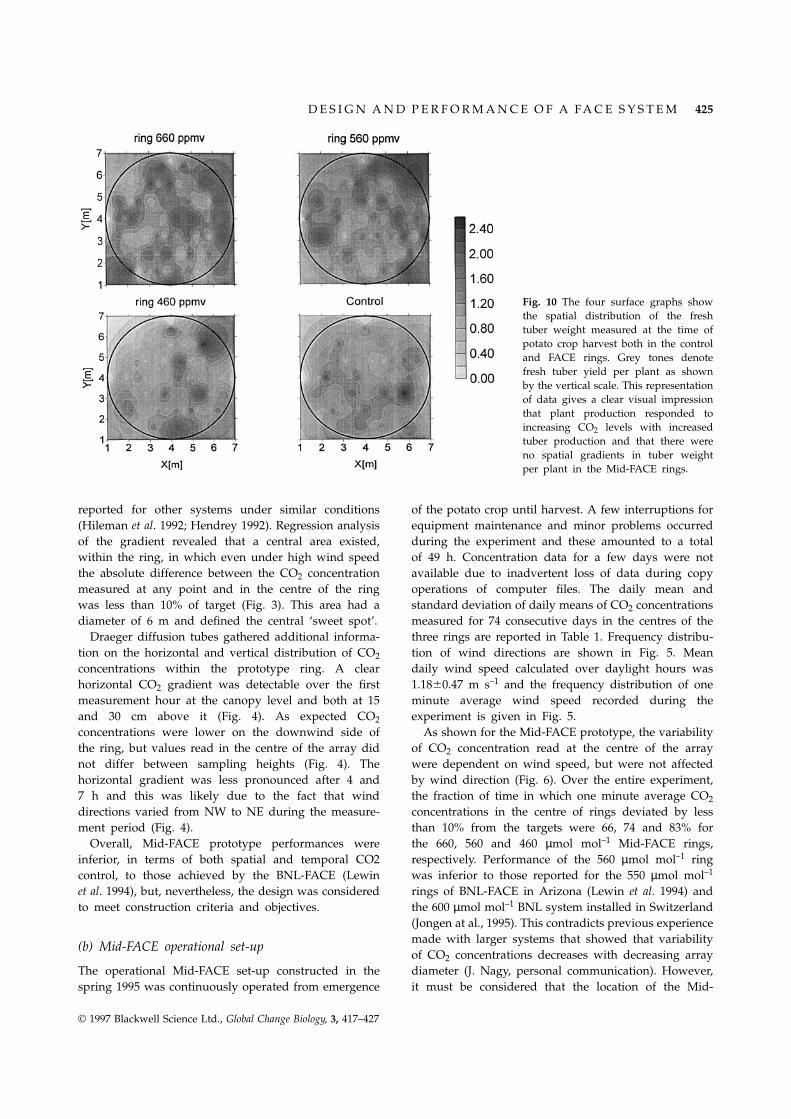
Fig. 10 The four surface graphs showthe spatial distribution of the freshtuber weight measured at the time ofpotato crop harvest both in the controland FACE rings. Grey tones denotefresh tuber yield per plant as shownby the vertical scale. This representationof data gives a clear visual impressionthat plant production responded toincreasing CO2 levels with increasedtuber production and that there wereno spatial gradients in tuber weightper plant in the Mid-FACE rings.
reported for other systems under similar conditions of the potato crop until harvest. A few interruptions forequipment maintenance and minor problems occurred(Hileman et al. 1992; Hendrey 1992). Regression analysis
of the gradient revealed that a central area existed, during the experiment and these amounted to a totalof 49 h. Concentration data for a few days were notwithin the ring, in which even under high wind speed
the absolute difference between the CO2 concentration available due to inadvertent loss of data during copyoperations of computer files. The daily mean andmeasured at any point and in the centre of the ring
was less than 10% of target (Fig. 3). This area had a standard deviation of daily means of CO2 concentrationsmeasured for 74 consecutive days in the centres of thediameter of 6 m and defined the central ‘sweet spot’.
Draeger diffusion tubes gathered additional informa- three rings are reported in Table 1. Frequency distribu-tion of wind directions are shown in Fig. 5. Meantion on the horizontal and vertical distribution of CO2
concentrations within the prototype ring. A clear daily wind speed calculated over daylight hours was1.1860.47 m s–1 and the frequency distribution of onehorizontal CO2 gradient was detectable over the first
measurement hour at the canopy level and both at 15 minute average wind speed recorded during theexperiment is given in Fig. 5.and 30 cm above it (Fig. 4). As expected CO2
concentrations were lower on the downwind side of As shown for the Mid-FACE prototype, the variabilityof CO2 concentration read at the centre of the arraythe ring, but values read in the centre of the array did
not differ between sampling heights (Fig. 4). The were dependent on wind speed, but were not affectedby wind direction (Fig. 6). Over the entire experiment,horizontal gradient was less pronounced after 4 and
7 h and this was likely due to the fact that wind the fraction of time in which one minute average CO2
concentrations in the centre of rings deviated by lessdirections varied from NW to NE during the measure-ment period (Fig. 4). than 10% from the targets were 66, 74 and 83% for
the 660, 560 and 460 µmol mol–1 Mid-FACE rings,Overall, Mid-FACE prototype performances wereinferior, in terms of both spatial and temporal CO2 respectively. Performance of the 560 µmol mol–1 ring
was inferior to those reported for the 550 µmol mol–1control, to those achieved by the BNL-FACE (Lewinet al. 1994), but, nevertheless, the design was considered rings of BNL-FACE in Arizona (Lewin et al. 1994) and
the 600 µmol mol–1 BNL system installed in Switzerlandto meet construction criteria and objectives.(Jongen at al., 1995). This contradicts previous experiencemade with larger systems that showed that variability
(b) Mid-FACE operational set-upof CO2 concentrations decreases with decreasing arraydiameter (J. Nagy, personal communication). However,The operational Mid-FACE set-up constructed in the
spring 1995 was continuously operated from emergence it must be considered that the location of the Mid-
© 1997 Blackwell Science Ltd., Global Change Biology, 3, 417–427
426 F. M I G L I E T T A et al.
FACE experiment was subjected to a high variability 20% of the target for more than 65 and 97% of thetime, respectively.in wind directions and high turbulence caused by the
topography of the site, the presence of a forested hill, Spatial uniformity of CO2 concentrations over theexperimental areas was adequate despite the unavoid-a vineyard and a number of isolated trees located in
the vicinity of the experimental field. able presence of short-term concentration gradientsunder windy conditions. Hopefully, the distribution ofSpatial performance of the operational set-up was
comparable to that of the prototype. As expected, an wind directions over the period of the experiment didcompensate, in the long term, these short-term gradientshorizontal concentration gradient was detected during
a day of almost unidirectional wind of variable speed so that CO2 effects on tuber growth were uniformlydistributed within FACE areas (Fig. 10).(Fig. 7a), whereas no clear horizontal gradients were
apparent during a day in which wind had variable It is important to outline that the Mid-FACE allowedto perform a FACE experiment with a limited budget.direction (Fig. 7b). A special case is reported in Fig. 8
where spatial distribution of CO2 concentrations is This was possible as a low cost system was developedand used, on average, less than 1800 kg CO2 per dayshown for a day with variable winds by comparing
performance data under windy (. 2 m s–1) and non- for the three rings during daylight hours. Cost reductionin the Mid-FACE, as compared to other larger FACEwindy periods (, 0.8 m s–1). The graphs clearly show
the existence of a spatial gradient during windy systems, did not result from the simple scaling-downof the size. Low cost material used for assembling theconditions which disappears when the wind is calm.
When calculated over a period of a week, the rings, the simplified design of on/off valves, the useof low cost flow controllers, IRGAs and meteorologicalfrequency distribution of one minute average CO2
concentrations measured at the level of the outer circle instrumentation allowed total capital cost for the facility(3 FACE rings plus controls) of less than US$ 40, 000.of the sweet spot did not differ from that measured
at the level of the inner circle, thus suggesting that Together with the previously developed Mini-FACEsystem (Miglietta et al. 1996), the Mid-FACE designwind direction varied either uniformly or randomly
during the period of measurements. This was true for provided evidence that small FACE systems are indeedapplicable in field experiments. Further system tuningthe 660, 560 and 460 µmol mol–1 rings (Fig. 9).
Nevertheless, the fact that CO2 concentrations measured and technological advances as those suggested byWalklate et al. (1996) have the potential to improve theboth in the outer and in the inner circle deviated more
from the mean than those measured in the centre of performances of these small systems further and toincrease their efficiency in CO2 use.the array, indicated that significant CO2 concentration
gradients did occur during wind episodes (Fig. 9).Overall, spatial distribution data that were presented
Acknowledgementssuggested that all the plants within the sweet spot ofthe Mid-FACE rings were exposed to the same mean Authors wish to thank Fabio and Mauro Menegoli of GEOGASlong-term CO2 level. Conclusive evidence for this is spa for financial and technical support to this research.
Suggestions, recommendations and conversations made withpresented in Fig. 10 where tuber yields (fresh weight)John Nagy, George Hendrey, Keith Lewin and Andy McLeodmeasured at harvest on individual plants grown withinhave been very valuable in the design of the fumigationthe Mid-FACE sweet spots are presented. Data showdevice. Lucilla Cerio, Vincenzo Lo Duca, Francesco Vaccari,
very clearly that the mean potato yield was increased Aldo Salvadori, Giacomo Tagliaferri, Gennaro Dibonito, Filippoin response to increasing aerial CO2 concentration and Busiello are also acknowledged for their technical assistance
during prototype development and the experiment. This workthat such an increase was uniformly distributed overcontributes to the GCTE Core Project (Focus 3, Potato Network)the entire CO2 enriched areas. No spatial gradients inwhich is a part of the International Geosphere-Biospheretuber yield were detectable in any of the rings.Programme (IGBP). It also partly contributes to CROPCH-ANGE, a research project funded by the EU-ENVIRONMENTProgramme (Contract n. EV5VCT920169)
Conclusions
ReferencesThe principal design objectives of the Mid-FACE weremet, although performance data analysis suggested that
Allen LH, Drake BG, Rogers HH, Shinn JH (1992) Fieldthere is still margin to improve the quality of CO2 techniques for exposure of plants and ecosystems tocontrol. Nevertheless, CO2 control over the enriched elevated CO2 and other trace gases. Critical Reviews inarea in the Mid-FACE was, overall, satisfactory as even Plant Sciences, 11, 85–119.in the case of the 660 µmol mol–1 ring, CO2 concentra- Bindi M, Fibbi L, Gozzini B, Orlandini S, Miglietta F
(1995) Mini Free Air Carbon Dioxide Enrichment (FACE)tions at the centre of the ring where within 10 and
© 1997 Blackwell Science Ltd., Global Change Biology, 3, 417–427
D E S I G N A N D P E R F O R M A N C E O F A F A C E S Y S T E M 427
experiments on grapevine. In: Climate Change and Agriculture Productivity and water use of wheat under free-air CO2
enrichment. Global Change Biology, 1, 429–442.in Europe: assessment of impacts and adaptation (eds HarrisonLewin KF, Hendrey G, Nagy J, LaMorte RL (1994) DesignPA, Butterfield RE, Downing TE), pp. 125–137.
and application of a free air carbon dioxide facility.Environmental Change Unit, Research Report 9, Oxford.Agricultural and Forest Meteorology, 70, 15–29.Blum H (1993) The response of CO2 related processes in
Lewin KF, Hendrey G, Kolber Z (1992) Brookhaven Nationalgrassland ecosystems in a three-year FACE study. In: DesignLaboratory Free-Air Carbon Dioxide Enrichment facility.and Execution of Experiments on CO2 Enrichment (eds SchulzeCritical Reviews in Plant Sciences, 11, 135–141.ED, Mooney HA), pp. 367–370. Proceedings of a Workshop
McLeod AR (1993) Open-Air Exposure Systems for Airheld at Weidenberg, Germany 26–30 October 1992.Pollution Studies – Their Potentials and Limitations. In:Ecosystem Research Report 6. Commission of the EuropeanDesign and Execution of Experiments on CO2 Enrichment (edsCommunities/E Guyot SA, Brussels, BelgiumSchulze ED, Mooney HA), pp. 353–366. Proceedings of aDrake BG, Rogers HH, Allen LHJr (1985) Methods of exposingWorkshop held at Weidenberg, Germany 26–30 Octoberplants to elevated carbon dioxide. In: Direct Effects of1992. Ecosystem Research Report 6. Commission of theIncreasing Carbon Dioxide on Vegetation (eds Strain BR, CureEuropean Communities/E Guyot SA, Brussels, Belgium.JD), Vol. DOE/Er-0238, pp. 11–31. Department od Energy,
Miglietta F, Raschi A, Badiani M, van Gardingen P (1993)Office of Energy Research, Carbon Dioxide ResearchCarbon Dioxide Springs and their Use for Experimentation.Division, Washington, DC.In: Design and Execution of Experiments on CO2 EnrichmentHarper LA, Baker DN, Box JEJr, Hesketh JD (1973a) Carbon(eds Schulze ED, Mooney HA), pp. 381–392. Proceedingsdioxide and the photosynthesis of field crops: A meteredof a Workshop held at Weidenberg, Germany 26–30 Octobercarbon dioxide release in cotton under field conditions.1992. Ecosystem Research Report 6. Commission of theAgronomy Journal, 65, 7–11.European Communities/E Guyot SA, Brussels, Belgium.Harper LA, Baker DN, Box JEJr, Hesketh JD (1973b) Carbon
Miglietta F, Giuntoli A, Bindi M (1996) The effect of free airdioxide and the photosynthesis of field crops: A tracercarbon dioxide enrichment (FACE) and soil nitrogenexamination of turbulent transport theory. Agronomy Journal,availability on the photosynthetic capacity of wheat.
65, 574–578.Photosynthesis Research, 47, 281–290.
Hendrey GR (1992) FACE: Free Air CO2 Enrichment for PlantMiglietta F, Magliulo V, Cerio L, Vaccari F, Bindi M, LoDuca
Research in the Field. CRC Press, Boca Raton, FL, USA,V (1997) Free-air CO2 enrichment of potato (Solanum
308 pp.tuberosum L.): growth, development and yield. Global Change
Hendrey G, Lewin K, Nagy J (1993) Control of Carbon DioxideBiology, (in press).
in unconfined field plots. In: Design and Execution of Reece CF, Krupa SV, Jager HJ, Roberts SW, Hastings SJ, OechelExperiments on CO2 Enrichment (eds Schulze ED, Mooney WC (1995) Evaluating the effects of elevated levels ofHA), pp. 309–327. Proceedings of a Workshop held at atmospheric trace gases on herbs and shrubs. a prototypeWeidenberg, Germany 26–30 October 1992. Ecosystem dual array field exposure system. Environmental Pollution,Research Report 6. Commission of the European 90, 25–31.Communities/E Guyot SA, Brussels, Belgium Schulze ED, Mooney HA (1993) Comparative View on Design
Hileman DR, Bhattacharya NC, Ghosh PP, Biswas PK, Allen and Execution of Experiments at Elevated CO2. In: DesignLH, Lewin KF, Hendrey G (1992) Distribution of carbon and Execution of Experiments on CO2 Enrichment (eds Schulzedioxide within and above a cotton canopy growing in the ED, Mooney HA), pp. 407–414. Proceedings of a WorkshopFACE system. Critical Reviews in Plant Sciences, 11, 187–194. held at Weidenberg, Germany 26–30 October 1992.
Jongen M, Jones MB, Hebeisen T, Blum H, Hendrey G (1995) Ecosystem Research Report 6. Commission of the EuropeanThe effects of elevated CO2 concentration on the root Communities/E Guyot SA, Brussels, Belgiumgrowth of Lolium perenne and Trifolium repens grown in a Walklate PJ. Xu ZG, McLeod AR (1995) A new gas injectionFACE system. Global Change Biology, 1, 361–371. method to enhance spatial utilization within a Free-Air
Kimball BA, Pinter PJ, Garcia RL, Lamorte RL, Wall GW, CO2 Enrichment (FACE) system. Global Change Biology, 2,75–78Unsaker DJ, Wechsung G, Wechsung F, Kartschall (1995)
© 1997 Blackwell Science Ltd., Global Change Biology, 3, 417–427
Copyright © 2022 FDOKUMEN