The potato value chain in Bihar
51
0 January 2011 Prepared by: Bart Minten IFPRI, New Delhi, India Thomas Reardon MSU, East Lansing, USA K.M. Singh ICAR, Patna, India Rajib Sutradhar JNU, New Delhi, India This study was financed by IFAD and NAIP as part of a support program for the implementation of the National Agricultural Innovation Project (NAIP) in India. The potato value chain in Bihar: An assessment and policy implications
-
Upload
pusavarsity -
Category
Documents
-
view
4 -
download
0
Transcript of The potato value chain in Bihar
0
January 2011
Prepared by:
Bart Minten
IFPRI, New Delhi, India
Thomas Reardon
MSU, East Lansing, USA
K.M. Singh
ICAR, Patna, India
Rajib Sutradhar
JNU, New Delhi, India
This study was financed by IFAD and NAIP as part of a support program for the implementation of the National Agricultural Innovation Project (NAIP) in India.
The potato value chain in Bihar:
An assessment and policy implications

1
Executive Summary
Introduction. As part of the National Agricultural Innovation Project (NAIP), a potato value
chain study was organized in Bihar, in collaboration between the Indian Council of Agricultural
Research (ICAR) in Patna, the International Fund for Agricultural Development (IFAD) and the
International Food Policy Research Institute (IFPRI), as potatoes are one of the core crops that
the NAIP project in Bihar are focusing on. Primary surveys were fielded with producers, traders,
cold storages, and retailers at the end of 2009 on the rural-urban potato value chain in Bihar,
more in particular from the disadvantaged districts part of the NAIP project (Vaishali and
Samastipur) to urban consumers in Patna. The most salient findings are presented below.
Upstream. First, potato production in Bihar is largely in the hands of smallholders: farmers from
the smallest half of potato producers cultivate 0.5 acres of potato. This compares to 1.8 acres for
farmers from the largest group. Second, farmers suffer from an important late blight disease
problem. Actual potato yields in 2009 were two-thirds lower than the expected yields due to that
disease. Despite the incidence of this disease, reported potato yields in the districts are as high as
the national level, casting doubts on the national agricultural statistics in vogue which consider
Bihar a lagging potato state. Third, farmers rely relatively little on seed markets and almost all
farmers store their own seeds in cold storages. Only on 18% of the plots were purchased seeds
used, indicating that seed replacement ratios are about 1 out of 5 years. However, larger farmers
replace seed more often. Fourth, despite the low use of seed input markets, important changes
have happened over time and the white potato variety has now become much more important
than the traditional red variety that was usually grown. Especially the larger farmers have
switched relatively more to the white variety. Fifth, larger farmers are able to obtain higher
yields, possibly because of their more intense use of inputs. Sixth, 70% of the potato farmers are
now empowered by a mobile phone. While some farmers use it to do market transactions, this is
still only a minority (20%). Seventh, sales in the harvest season are almost all to a village broker
while in the off-season, potatoes are mostly sold to traders at the cold storage. Wholesale market
sales by the farmers are of less importance. Eight, an important reason why a number, and
especially the smaller, farmers sell after harvest is the urgent need of money. Little credit or
advances are used in market transactions and the major reason for the choice of a trader is when

2
he pays immediately. Ninth, while almost all farmers participate in cold storages as to store their
seeds, larger farmers store relatively much more for sale at an expected higher price in the off-
season.
Midstream. First, an important boom in cold storage capacity - and thus in potato production -
has happened in the two studied districts. The number of cold storages in the last decade doubled
or tripled and rapid up-scaling of cold storages led to an even faster total capacity expansion, i.e.
a triple and five-fold increase over the same period. Second, the boom is associated with
increasing commercialization of potatoes from the two districts as the share of storage for seed
potatoes is relatively on the decline. Third, several triggers explain the boom in this area. The
rapid emergence of cold storage is linked with the better provision of public goods (such as
roads, electricity, and governance), the deregulation of the cold storage sector, the investment
subsidies given by national and state government, and the availability and spread of new
technologies. Third, the rapid emergence and the up-scaling of cold storages are explained by
important profit opportunities and high rates of returns to investments. However, cold storages
charge prices that are significantly higher than those practiced in the neighboring state UP (1.5
Rs/kg versus 0.9 Rs/kg) and charges are similar to those practiced in Bangladesh where no
subsidies to cold storage investments exist and where input costs (e.g. electricity and diesel) are
significantly higher. While the government subsidies might have helped the farmers to have
more access to cold storages, the availability of subsidies has thus not brought down the effective
price paid for storage by farmers, or traders. Fourth, cold storages are currently little involved in
input and credit markets with farmers and despite linkages with the banking system, little credit
flows down to the farmers directly. It seems that most of the advances given by the cold storages
using potatoes as collateral are thus with traders.
Downstream. First, Bihar is still relying on potato imports from other states, especially UP and
West Bengal but also from the Punjab, to supply potatoes to their retail markets in the off-season.
Second, consumers in Bihar prefer red over white potatoes and are willing to pay a price
premium for that quality. Third, potato prices in 2009 were characterized by significant
variability with retail prices in the off-season twice as high as on-season. While prices in the off-
season are always higher, the price hike this season was exceptional. Fourth, as the APMC has

3
been repealed in Bihar, potato sales have moved away from auctions to direct on-on-one deals
with traders.
The value chain as a whole. First, wastage levels are estimated to be - and potentially have
become - lower than most conventional estimates done before. The wastage level in the value
chain is evaluated at 8% in the harvest period and 9.3% in the off-season. While public policies
have encouraged the setting up of cold storage to bring down wastage, this might however be
only one factor in influencing overall wastage levels. Farmers are often making conscious
choices on the wastage they will incur and varieties that show higher wastage levels might be
preferred by some farmers (because of a preference of shorter-duration cultivation periods or of
varieties with less dry matter and higher yields). Second, the cost of the cold storage in the final
price contributes less than 10% of the final retail price paid off-season by consumers in Patna.
The most important contributor to the final retail price in the off-season is a reward to storage,
which account for 40% of the final retail price. Third, the farmers’ share in the final retail price is
as high as two-thirds in the harvest period, much higher than conventional estimates. This
however drops to one-third in the off-season, except for these farmers that are able to postpone
sales through storage.
Way forward. First, the study has shown the importance of appropriate policies as to stimulate
the take-off of agricultural businesses in Bihar. These policies should focus foremost on the
provision of public goods such as reliable electricity, road infrastructure, and good governance.
Given the still existing large deficiencies, Bihar should make further investments in this area as
to allow private business to further flourish and to allow farmers in these disadvantaged districts
to become better integrated in the market economy. Second, policy makers should further
stimulate increased investments in the cold storage sector, but not necessarily through subsidies.
More competition in the cold storage sector is desirable as to drive down the cost of storage. The
further spread of cold storages as intermediaries in the potato value chains might also open some
important opportunities towards upgrading the potato value chains as cold storages can serve as
focal points for the distribution of better seed varieties, extension advice, marketing advice, etc.
This could especially benefit smaller farmers who, because of liquidity constraints, are less
willing to sell after storage and benefit from the higher prices off-season. Third, Bihar might
further be a good area for the cultivation of processing varieties given its unique agro-ecological

4
potential for those. As it is one of the areas in India where the growing period is later and where
the minimum temperature during the production period is relatively high, leading to the required
higher production of dry matter, the region is better suited for processing varieties than most
other states in India. Given such comparative advantage, it seems that the state could benefit
from the increased presence of the private sector interested in potato processing. However, some
of the processing companies that are currently active in India are bringing in potato varieties (e.g.
Lady Roseta, Atlantic) which might be prone to diseases that might be more difficult to control
in the Indian setting. Close collaboration with local research stations as to introduce the most
appropriate varieties seems thus called for. Fourth, our data illustrate the devastating effects that
the late blight disease has in Bihar. The development and spread of better suited varieties by
public or private research institutions seem thus of utmost importance.

5
1. Introduction
Important changes are occurring in traditional agricultural value chains in several developing
countries. These changes are noted upstream at the farm level, midstream with traders and
processors, and downstream in retail markets, but the impacts of these changes are not well
understood. Especially technology changes and innovations have been the driver for large
productivity increases, and real price decreases, in agriculture over time and most documented
innovations have thus been linked to production technologies such as irrigation and improved
seeds (e.g. Spielman and Pandy-Lorch, 2009; Evenson and Gollin, 2003). While innovations
midstream and downstream in the value chain might also have significant impacts on agricultural
performance and thus on producers and consumers alike, relatively little research has been done
in this area. However, the subject is receiving more attention in recent literature, e.g. Swinnen
(2007), Dries et al. (2009), Reardon et al. (2009).
We present here the case of innovations and investments in post-harvest management and show
how it is associated with important changes in the agricultural sector. More in particular, we
document in this study the rapid emergence of cold storages in Bihar, an area characterized by a
large number of smallholders. The number of cold storages increased in Bihar overall by 67% in
the last decade. In the two disadvantaged districts that were studied, the number of cold storages
in the last decade doubled or tripled and rapid up-scaling of cold storages led to an even faster
total capacity expansion, i.e. a triple and five-fold increase over the same period. These cold
storages are almost exclusively used for the storage of potato, the most important vegetable in
India and in Asia more general. The effect of their emergence is not well understood and has led
to charges of market power and price manipulation (e.g. Basu, 2010; Moazzem and Fujita,
2004).
To document the role that cold storages play, we rely on different sources of information. First,
we conducted key informant interviews with several stakeholders in the value chain. Then, we
implemented a detailed structured questionnaire with different players in the value chain
including cold storage owners, producers, local collectors, wholesalers, and retailers. This gives
us unique - qualitative and quantitative - insights on the role that the cold storages play in the
potato value chains.
6
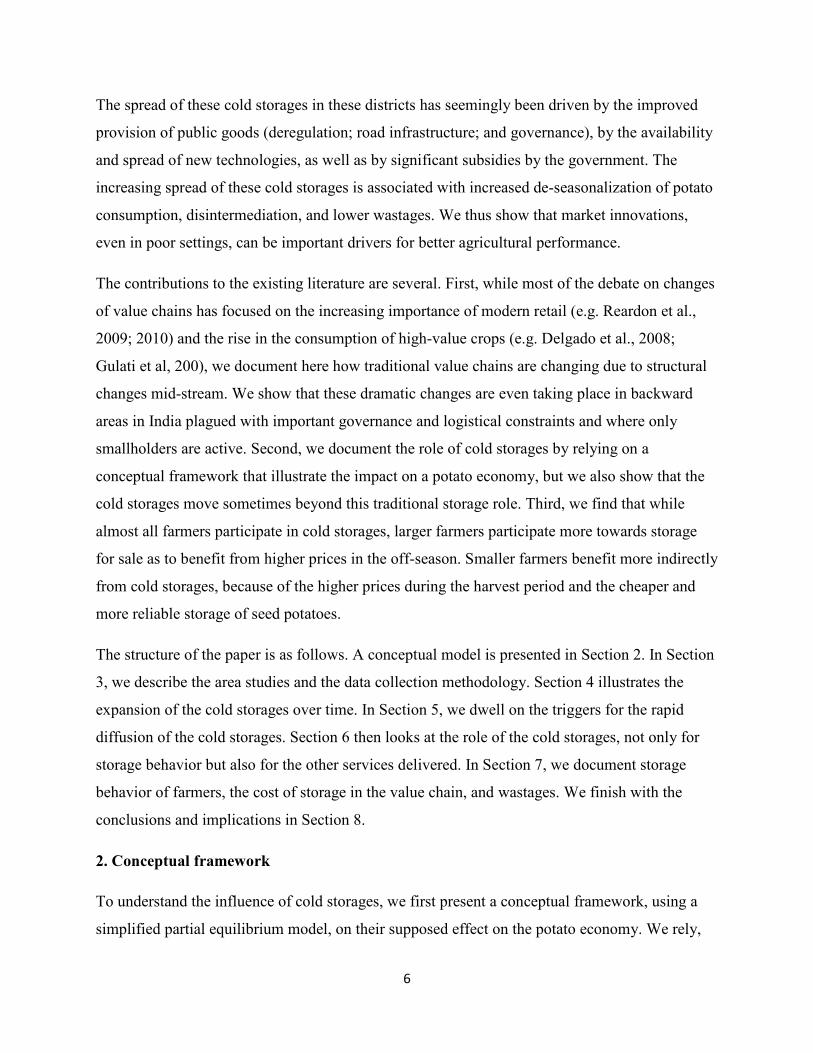
The spread of these cold storages in these districts has seemingly been driven by the improved
provision of public goods (deregulation; road infrastructure; and governance), by the availability
and spread of new technologies, as well as by significant subsidies by the government. The
increasing spread of these cold storages is associated with increased de-seasonalization of potato
consumption, disintermediation, and lower wastages. We thus show that market innovations,
even in poor settings, can be important drivers for better agricultural performance.
The contributions to the existing literature are several. First, while most of the debate on changes
of value chains has focused on the increasing importance of modern retail (e.g. Reardon et al.,
2009; 2010) and the rise in the consumption of high-value crops (e.g. Delgado et al., 2008;
Gulati et al, 200), we document here how traditional value chains are changing due to structural
changes mid-stream. We show that these dramatic changes are even taking place in backward
areas in India plagued with important governance and logistical constraints and where only
smallholders are active. Second, we document the role of cold storages by relying on a
conceptual framework that illustrate the impact on a potato economy, but we also show that the
cold storages move sometimes beyond this traditional storage role. Third, we find that while
almost all farmers participate in cold storages, larger farmers participate more towards storage
for sale as to benefit from higher prices in the off-season. Smaller farmers benefit more indirectly
from cold storages, because of the higher prices during the harvest period and the cheaper and
more reliable storage of seed potatoes.
The structure of the paper is as follows. A conceptual model is presented in Section 2. In Section
3, we describe the area studies and the data collection methodology. Section 4 illustrates the
expansion of the cold storages over time. In Section 5, we dwell on the triggers for the rapid
diffusion of the cold storages. Section 6 then looks at the role of the cold storages, not only for
storage behavior but also for the other services delivered. In Section 7, we document storage
behavior of farmers, the cost of storage in the value chain, and wastages. We finish with the
conclusions and implications in Section 8.
2. Conceptual framework
To understand the influence of cold storages, we first present a conceptual framework, using a
simplified partial equilibrium model, on their supposed effect on the potato economy. We rely,

7
as a starting point, on the framework developed by Fuglie (1995). In a simplified two-period
model, we compare the situation where no cold storage exists with two alternative scenarios
where cold storages become available, one without and one with subsidies, and compare the
effects of these on consumer and producer surplus. In an initial situation without storage options,
no consumption is taking place in the second period and demand and supply equilibrate
themselves at a low price pa in period 1 (Figure 1).
In a second scenario where cold storages become available at an unsubsidized rate, part of the
production is stored and consumed in the second period. In this case, prices in the first period
increase and equate themselves between the two periods, with the differential of the prices
between the first and the second period reflecting the costs of storage c1 (including physical costs
and opportunity costs of money). As illustrated on Figure 1, prices will equate in period 1 at p1
and at (p1+c1) in period 2. A quantity q1 will be stored in cold storages. Potato production will go
up compared to the ‘autarky’ situation and total production will increase to the level q10.
In a third scenario, cold storages are subsidized. This leads to lower costs of storage, i.e. a
reduction from c1 to c2. Compared to the unsubsidized situation, prices in the first period go up
from p1 to p2 while quantities stored increase from q1 to q2. The producer surplus increases by the
area dbp1p2 and total production expands to the level of q20. Because of the subsidy, consumers
in the first period face a higher price p2 and reduce their consumption. Their consumer surplus is
reduced by the area acp2p1 compared to the second scenario. However, as consumers in the
second period now benefit from cheaper potatoes, their benefits increase by the area
(p1+c1)(p2+c2)ij. The costs for the government are the subsidies for all stored potatoes,
amounting to (c1-c2)*q2. This subsidy leads to dead-weight losses for the economy as a whole.
The sizes of these efficiency losses are areas kij+ghl.
The lower costs of cold storage would lead to changes in price levels, i.e. an upward pressure in
the harvest period and a downward pressure in the off-season. It is interesting to note that
contrary to conventional arguments, the increased presence of cold storage would in this
simplified conceptual framework not lead to lower or higher price volatility, induced by
production shortfall or oversupply, as would be depicted by a shift of the supply curve S1. Such a
shift would lead to equal absolute price changes, with or without the presence of cold storages.

8
This is an important point for a sector where price volatility is often high, seemingly driven by
cyclical price movements (because of Nerlovian arguments).
While this simplified model gives us some useful insights on the economic impacts of cold
storages, there are some obvious caveats to the partial equilibrium model, such as the lack of
consideration for general equilibrium effects. We will also see later on that the effects of cold
storages in practice can go beyond the storage function solely.
Figure 1: Conceptual framework
3. Case study area, data and methodology
3.1. Background
Potato is an important crop in India. India is ranked third in production in the world after China
and Russia. Potato is estimated to be the largest vegetable crop counting for 23% of all area
planted under vegetables (Kumar, 2009). Potato consumption is widespread in India and it is
estimated that 92% of the people eat it (Das Gupta et al., 2010). Annual consumption was
evaluated at 18 kgs per person per year in 2007 (Faostat). Das Gupta et al. (2010) report that
potato processing is limited: the share of fresh potatoes in potato consumption is about 95% and
the importance of processed potatoes (for chips, French fries, etc.) is still minor (5%).
A major challenge in India is potato storage as potato production, that takes place in the cold
months of October-November to February-March (about four-fifths of total production) is
followed by hot summer months which makes refrigeration necessary for storage. Cold storage
takes place on a large scale and it is estimated that there were about 3,400 cold storage facilities
in the beginning of the 2000s in India (CIP, 2006) but they had increased to 5,386 units in 2008
that could store over eighteen million tons of crops (www.Indiastat.com).1
1 Cold storage is usually referred to as a refrigerated warehouse space as to preserve food products. Storage conditions and length of time in storage influence the quality of the products and their consequent susceptibility to handling. By lowering the temperature during storage of food products, they can be stored for longer periods and can then marketed during periods of the year when no production is possible. Cold storage of table and seed potatoes is usually done at a temperature of 2-4 C. However, this temperature induces the conversion of starch to sugar, leading to the sweetening of potatoes that are less desired in the market place. Customers are thus usually willing to pay a premium for ‘fresh’ potatoes, potatoes that have not gone through cold storage.
CIP (2006) estimates
that approximately three-fifths of potatoes in cold storages are ware potatoes, intended for
9
consumption, while the other two-fifths are used for seed. Using average storage charges from
our survey and 80% of cold storage use by potatoes, it is estimated that about 0.4 billion USD is
spent yearly by traders and farmers on storage for these potatoes in India, indicating the large
size of this business.
Bihar, the state where our study was done, is considered one of the lagging states in India. Its per
capita income, at about 160$, is one of the lowest in India and its economic growth in the last
decades has not kept pace with the rest of India (World Bank, 2005). Its performance seems to
have improved in recent years and Bihar has registered between 2005 and 2010 one of the
highest economic growth rates at the Indian state level. However, there remains discussion on
what has been driving this growth (Nagara and Rahman, 2010). Given its bad economic
performance over a long period, poverty levels in Bihar are high and about 37 million of its 90
million people are estimated to be poor. Agriculture is a major economic sector in Bihar and it is
estimated that about three-quarters of its workforce is employed in agriculture and that the
agricultural sector makes up 35% of the state domestic product (World Bank, 2007).
Although there are questions on the reliability of production statistics of potatoes, official
production numbers of the National Horticulture Board (NHM) indicate that Bihar is the third
biggest potato producing state in India, coming after Uttar Pradesh and West Bengal. In 2007-08,
it was estimated that the biggest producing state was Uttar Pradesh with a share of 32.2%, second
was West Bengal with a share of 28.7%, and third was Bihar with a share of 19.1%, producing
just above 6 million tons. The average yield in Bihar was evaluated in 2007-08 at 19.1 tons per
ha, equal to the Indian average.2
Red potatoes are preferred and widely consumed by consumers in Bihar and a price premium is
paid for them. It is estimated at the state level that 60% and 40% of the potato production are
respectively white and red-skinned. Currently no formal potato processing sector is present in
Bihar. Different varieties are being cultivated in Bihar. Their adoption and dis-adoption seem
related to different important factors
3
2 Agricultural Statistics at a Glance (2008) put the potato production and productivity in Bihar at seemingly unrealistically low levels, as confirmed by stakeholder interviews. These data are thus disregarded.
: 1/ Resistance against the late blight disease. This
important disease is leading to the increasing disadoption of the Kufri Senduri variety; 2/
3 Personal communications with Dr. R.P. Rai, Central Potato Research Station

10
Duration of the growing period. Varieties that grow for shorter periods (90 days instead of 120
days) can be better intercropped with maize, which matures after the potato crop, after 6 months
on average, and thus the land can be more intensively used. Shorter-duration varieties can also be
sold earlier on the market and might thus fetch a premium because of that. On the other hand,
shorter-duration varieties contain less dry matter, making it more prone to rotting; 3/ Trade-off
between yields and dry matter. Lower yield varieties are often associated with higher dry matter,
making it better suited for storage. The higher the dry matter, the lower the likelihood of rotting
becomes.
3.2. Data collection
Surveys were implemented with funds from the National Agricultural Innovation Project
(NAIP). One of the components of this project aimed to improve agricultural performance, and
more particularly so in disadvantaged districts of India. Based on several indicators (agricultural
productivity per worker, agricultural wage rates, and share of the scheduled caste/tribe in total
population), 150 districts were thus assigned to the ‘disadvantaged district’ status by the
Planning Commission of India. The NAIP project in Bihar had activities in four of these
disadvantaged districts. The two districts where potato production was important, i.e. Vaishali
and Samastipur, were subsequently selected to field the surveys. Different types of surveys were
set up at the end of 2009 as to understand the role of cold storages, storage behavior of farmers,
and the role of storage in potato marketing in Bihar. They included surveys with potato
producers and a village survey, wholesale and retail trader surveys, and a cold storage survey.
The trader survey was set up as follows. First, two village trader/collectors were interviewed that
the households in that village sell to. Second, 30 traders were interviewed from the local
wholesale market that the households in the villages sell to. Third, 20 urban wholesale traders
and 164 retailers in Patna were interviewed.4
4 10 retailers were interviewed additionally on pricing specifically in May 2009.
To implement the cold storage survey, a list of all
the cold storages in the district of Samastipur/Vaishali was obtained from the Horticulture
Department. A random selection of 27 was done and detailed surveys were conducted. For all
cold storages that were not visited for a detailed survey, the date of establishment was collected

11
through key informant interviews. This information allows us to analyze their emergence over
time.
The village and household survey was set up as follows. For potato farm households, the most
important potato producing tehsil in each of Vaishali and Samastipur was selected. Given that
Samastipur is a bigger potato producing area than Vaishali, more villages were selected in the
former.5
3.3. Empirical strategy
In each selected village, a village questionnaire was implemented. In each selected
village, a census of households was conducted to enumerate the potato producers. Using the
census questionnaire, a list of all the households in the village has to be made. Each household
was asked questions on their total land cultivation and potato cultivation in particular and if they
were a seller of potato. 18 households in 14 villages were then randomly selected in the village,
half from the largest farm group and half of them from the smallest farm group as to reflect their
importance in the potato value chain. 254 potato farm households were thus interviewed in total.
Building on the model developed by Fafchamps and Vargas-Hill (2005), we posit that a farmer
will decide to put his potatoes that he wants to sell in storage when the expected price after
storage is higher than the cost c that he will incur for that storage (physical costs as well as the
opportunity costs of money). We define the pf as the price that the farmer gets if produce is sold
immediately after harvest and E(pc) as the price obtained after storage. The farmer will chose to
store produce if pf < E(pc) – c. If the difference between the two is defined as D = E(pc) - c - pf ,
it follows that the bigger the D is for a household, the more likely it will be to forego immediate
sales and sell later.
To test such a model, a variable Y can be defined that reflects the timing of the sales decision,
with Y=1 if sold after storage and Y=0 if sold immediately after harvest. Such a decision
depends on a latent variable D*=D + µ (where µ is an error term). We would have M=1 if D*≥0
5 The sample in Samastipur was done as follows. In a tehsil, Gram Panchyats (GPs) were ranked from big, medium to low producing GPs (three terciles). 3 GPs was randomly selected from the big producing GPs, 1 GP will be selected from the medium producing GP, and 1 GP will be selected from the low producing GPs. In each selected GP, two villages will be selected at random. For the GP of the lowest producing tercile, only 1 village was selected. In Vaishali, the following strategy was used. Gram Panchyats (GPs) were ranked from big, medium to low producing GPs (three terciles). 1 GPs was randomly selected from the big producing GPs, 1 GP was randomly selected from the medium producing GP, and 1 GP was selected from the low producing GPs. In each selected GP, two villages were selected at random. For the GP of the lowest producing tercile, only 1 village was selected.

12
and M=0 otherwise. Factors that raise D, such as transactions costs - often linked to the size of
the lot sold (e.g. Fafchamps and Vargas-Hill, 2005) - and opportunity costs of money – often
linked with the wealth of farmers leading to different time preferences (e.g. Pearce and Watford,
1993) - make farmers more likely to sell after storage. Given the expected importance of the size
of the lot and the wealth of the farmer in determining this choice, we will especially focus on
these factors in the regression analysis. It is hypothesized that especially the wealth of the farmer
is a significant determinant of the ability of farmers to be able and willing to postpone sales as it
is an important indicator of people’s discount rates (e.g. O’Donoghue and Rabin, 1988; Pearce
and Warford, 1993). Such a model can then empirically be estimated trough a probit regression.
3.4. Descriptive statistics
We first present some descriptive statistics on the different surveys implemented (Tables 1 and
2). Given that the sample was divided between large and small farmers, most of the statistics at
the farm level will be presented that way. The potato farmers in the survey are on average 55
years old (Table 1a). They have a household of about 7.4 family members and 98% of the heads
of households are reported to be male. 10% of the potato farming households are illiterate,
significantly lower than the average at the state level as 53% of the population was estimated to
be illiterate in the national census of 2001. This might indicate that these farmers are better
endowed than other farmers in Bihar. The value of the land of these farmers – their most
important asset – is estimated at 2.6 million Rs or 59,000 USD. The value of land assets owned
by larger farmers is almost three times as high for the larger farmers than for the smaller ones.
Potato farmers that were selected in these two districts are in general small, as they only
cultivated 2.23 acres in total, of which 0.95 acres are allocated to potatoes. The smaller farmers
cultivated 0.5 acres of potato while the larger group cultivates 1.82 acres, almost four times as
much. An average potato farmer cultivates 3.2 potato plots. 90% of the cultivated potato land is
owned by the farmer and 10% of the land is rented in. The share of rental land is much more
important for the smaller farmer (16%) than for the larger ones (8%).
A small farmer produced last year 2.2 tons of potatoes while a large farmer produced almost 12
tons. The bottom of the Table 1a further shows that most of the produced potatoes are used
towards sales, indicating the importance of potatoes as a cash crop for these households. About

13
two-thirds of the potato production is estimated to be sold while 30% is kept towards seed use
and own consumption. It is estimated that 5% of the production is wasted before, during, or after
storage. As could be expected, potato sales are estimated to be relatively much more important
for the larger than the smaller farmers.
Table 1a: Characteristics of potato farmers
In Table 1b, input use and production statistics are presented at the plot level. An average plot is
0.20 acres for the small farmer compared to 0.55 acres for the large one. The average production
over the surveyed plots in 2009 was 10.9 tons acre for the large farmer and 9.0 tons per acre for
the small farmer. On 81% of the plots own seeds of the farmers were used. Exchanged seeds
from other farmers accounted for another 2%. Purchased seeds were applied on only 18% of the
plots but they were more used by larger farmers (23%) than by smaller ones. The data further
show that almost all the farmers used chemical fertilizer and pesticides for their potato
production. The most important expenditures were those done on compost/oilcakes and on
chemical fertilizer, amounting to 4,476 and 6,472 Rs/acre respectively. Larger farmers spend
significant more money on inputs than smaller ones, except for irrigation possibly because they
have better access to own irrigation facilities.
Table 1b further shows the type of technologies that were used on the potato plots in 2009.
Almost all farmers relied on tractor use on the plot. The widespread use of the tractors is
seemingly in a significant way associated with the spread of potato in Bihar given the seeming
difficulty of plowing by animal traction in the districts studied. Almost a quarter of the farmers
also used a rotar vetter on their field. This was mostly done by larger farmers. The rotar vetter
has also increasingly spread in recent years, presumably because of important subsidies by the
government.6
While the small farmers were growing red potatoes on 41% of their fields, this was as low as
28% for the large farmers. The most prevalent red variety in use was the Kufri
Senduri/C1/C140/C40 variety (a long-duration variety, released in 1967 by ICAR). The most
6 The increased use of tractors and rotar vetter might also be the result of the rollout of the NREGA (Mahatma Gandhi National Rural Employment Guarantee Act) in rural areas in India as this Act guarantees hundred days of wage-employment in a financial year to a rural household whose adult members volunteer to do unskilled manual work. The increasing competition for rural wage labor might have led to more capital intensive agriculture.

14
prevalent white variety in the two districts was Kufri Jyoti. Farmers were also asked on the type
of shocks that they had in the last season on their plot. While few farmers complained about
droughts, floods, or other weather shocks, the most common complaint was the problem of late
blight. 58% and 31% of the farmers reported that the impact in the last production season was
much worse or worse than expected. This disease probably explains the large gap between
expected and realized production in the previous year, as only two-thirds of the expected yield
was achieved. This illustrates the important further role of research in the development of new
varieties that are better resistant to this disease.
Table 1b: Potato production in 2009, averages per plot
Table 2 shows some statistics of the other agents that were interviewed in the value chain. 27
cold storage owners, 65 wholesalers, and 164 retailers were interviewed in total. The results
show the significantly larger capital that cold storages must have at their disposal. The value of a
cold storage in the surveyed region amounts to about 1 million USD. This compares to a value
of assets (and working capital) of wholesalers and retailers of 1,250 USD (3,390 USD) and 190
USD (430 USD) for wholesalers and retailers respectively. Of all agents in the value chain, the
retailers seem to have least capital at their disposal for their business. The turnover of
wholesalers is estimated to be almost five times as much as that of retailers, i.e. 635 and 130 kgs
per day respectively.
Table 2: Descriptive statistics agents value chain surveys
4. The expansion of potato production and of cold storages
Data from the village surveys show to what extent the value chain of potatoes has changed in the
last ten years. Village leaders were asked to evaluate different indicators related to potato
production and marketing in these 14 villages (Table 3). The number of households that are
involved in potato production has increased significantly over the last year. The percentage of
producers increased from 71 ten years ago to 83 in 2009. We also see a switch from red potato
(55% and 38% of the total production ten years ago and now respectively) to white potato. The
number of village traders also increased significantly over that period. While the median number
of village traders was 2 in 1999, it increased to more than 5 in 2009. Finally, the estimated

15
percentage of potato production going through cold storages increased from 39% in 1999 to 62%
in 2009.
Table 3: Evolution in potato production and marketing, as reported by village leaders
Building on a list of cold storages distributed by the National Horticultural Board, we evaluated
through key informant interviews, as well as formal surveys, the evolution in the number and the
capacity of cold storages. It is estimated that the number of cold storages in Bihar overall
increased between 2000 and 2009 from 195 to 320, an increase of 64%.7
Figure 2 shows the
expansion of such cold storages in the two districts. It shows that there were 20 cold storages in
each of the districts. The graph shows how the growth of the cold storages has mostly happened
in the last decade or even more recently. The district of Samastipur only had 10 cold storages in
2005 but this doubled since then. Before 1998, there were only 4 cold storages in the district as a
whole. The growth in Vaishali was much smoother as cold storages ‘only’ doubled in the last
decade.
Source: Authors’ calculations 7 Indiastat and personal communication, Bihar Horticultural Department
0
2
4
6
8
10
12
14
16
18
20
1965
1967
1969
1971
1973
1975
1977
1979
1981
1983
1985
1987
1989
1991
1993
1995
1997
1999
2001
2003
2005
2007
2009
Num
ber o
f col
d st
orag
es
Figure 2: Expansion in number of cold storages in 2 districts in Bihar (1965-2009)
Vaishali district
Samastipur district

16
While the number of cold storages increased dramatically, these graphs do not take into
consideration the increase in expansion of the existing cold storages. As we implemented a
survey with these cold storages and questions were asked on their capacity expansion over time,
this allows us to show complete capacity expansion in these two districts. The average capacity
per cold storage was between 1,000 and 2,000 tons in the beginning of the seventies but at the
time of the survey, this was as high as 5,142 tons in the district of Vaishali and 8,350 tons in the
district of Samastipur. Combing the growth of capacity per cold storage with the total number of
cold storages gives us the total cold storage capacity expansion in the two districts. As expected,
the results (Figure 3) show an even more dramatic increase as in the previous graph. In the last
decade, total cold storage capacity expanded almost three-fold in the case of Vaishali while it
expanded more than five times in the case of Samastipur. Total cold storage capacity in 2009
was just over 100,000 tons in Vaishali and about 170,000 tons in Samastipur. When all capacity
of the cold storages would be used, this involves an approximate yearly business or revenue of
just below 10 million $ in the two districts combined.8
Source: Authors’ calculations 8 A charge per bag stored of 33.2 USD/ton, i.e. 75 Rs per bag of 50 kgs, would amount to 8.9 million tons of storage costs.
0
20000
40000
60000
80000
100000
120000
140000
160000
180000
1965
1967
1969
1971
1973
1975
1977
1979
1981
1983
1985
1987
1989
1991
1993
1995
1997
1999
2001
2003
2005
2007
2009
Tons
Figure 3: Capacity expension of cold storages in 2 districts in Bihar (1965-2009)
Vaishali district
Samastipur district

17
5. Triggers for the expansion
Based on in-depth discussions with cold store owners, several factors were identified that
contributed to the boom of cold storages in these disadvantaged districts. The three triggers relate
to the provision of public goods by the state government, subsidies towards cold storage
investments by the national and state governments, and the availability and spread of new
technologies.
The first trigger was a series of improvements in Bihar in the last decade in public good
provision - creating a better business environment - that allowed the boom to happen. Three
factors were crucial. First, deregulation of the sector seems to have given an important impetus.
Key informants indicated that there were a few cold storages in both the districts in the period of
1960s through 1980s but they were hardly sufficient to meet the demand, which often led to a
scramble among the farmers for space in the cold storages.9
Before the deregulation period, Bihar had a separate Cold Storage Order, which was not
governed by Central Cold Storage Order.
During the regulatory period, cold
storages were supposed to be used only for seed potatoes. Each cold storage was assigned a
certain number of blocks by the district horticulture department, with the number of blocks
assigned to be determined by the capacity of the cold storage. Getting quota in the cold storage
was an onerous task for a farmer in those days as he had to submit his land documents to the
block officer who would verify his area of potato cultivation and then assign a certain quota,
based on the seed requirement of the farmer.
10
9 Though Bihar was not regulated by the Cold Storage order 1964 promulgated by the Ministry of Agriculture under section 3 of the Essential Commodities Act (1955) the state had its own regulation with which it has persisted even after the Cold Storage Order was repealed by the Central Government in 1997.
However, one of the requirements to benefit from the
national subsidy scheme provided by the National Horticulture Board (NHB) was to abolish this
state Cold Storage Order. The state issued a new Cold Storage Act in the year 2003, though it
had several flawed regulations including the fixing of the cold storage fees by the state
government. The government of Mr. Nitish Kumar removed that clause from the Act in the year
2007 and left it to the cold storage association of each district to fix the storage fees before the
beginning of each harvesting season.
10 like the states of UP, Punjab and West Bengal.

18
Second, Bihar has suffered from the lack of public infrastructure provision and has been ranked
poorly with the rest of India on this. However, the government that came to power at the end of
2005 in Bihar has made - and is further planning - significant investments in road infrastructure,
improving the marketing of agricultural products from the more remote and disadvantaged
districts. Making improved road infrastructure as one of its key priorities, it was planned that the
government would spend more than 3 billion USD on road construction in three years
(Government of Bihar, 2006). It has been estimated that between 2005 and 2009, 6,800
kilometers of roads and 1,600 bridges have been constructed (ToI, 2010).
Third, Bihar has been known for large governance issues and for a lack of law and order,
discouraging businesses from locating in Bihar, especially so in rural areas (World Bank, 2005).
This seemed to have changed in recent years with the new government and might have attracted
new investments. For example, only 317 kidnappings for ransom were reported between 2006
and 2009. This compares to 1,393 in the previous four (ToI, 2010).
The second trigger was the doling out of subsidies by the Indian government in an effort to
stimulate innovation in the horticultural sector. In its 1999-2000 budget, the Central Government
proposed a subsidy scheme for the construction of cold storages. It is estimated that between
1999/00 and January 2005 the National Horticultural Board provided financial support
amounting to Rs 3.1 billion for the establishment of 1,242 cold storages in the country, covering
23 states (Patnaik, 2005). This expanded cold storage capacity by 4.9 million mt nationally. Uttar
Pradesh accounted for the largest share in terms of additional capacity created (2.2 million mt),
number of facilities (464 cold storages), and subsidies (Rs1.4 billion). Maharashtra (216,000 mt)
came second and Bihar (225,000 mt) third in additional capacity created. The cold storages in
Bihar started receiving the subsidies only late compared to the rest of the country, due to the
reluctance of the state government to change the Cold Storage Order. On top the subsidies of the
center, the new state Government gave additional incentives that seemingly stimulated the rapid
diffusion of cold storages. In addition to the 25 % subsidies given by the NHB, the state
government reportedly gave another 15 % subsidies, including 10% by the State Industrial
Promotion Board.
The third trigger was the availability and spread of new technologies. First, the introduction of
high speed compressors in the cold storage operations in the beginning of the years 2000 meant

19
that less time was required to bring down the temperature and that electricity consumption was
significantly reduced, which according to some of the interviewed owners, led to a reduction of
cost of operation by almost 20 to 30 %. Second, investments were done by the research and
extension system as to improve the spread of potato varieties that were apt for storage given that
the traditional red potato that was commonly grown in Bihar was much more difficult to store for
longer periods than most varieties of white potato.
Given lack of exact data over time, it is an impossible task to unravel the exact contribution of
each of these factors. To qualitatively get at the importance of some of the triggers for the boom,
cold storages owners were asked to indicate what reasons they considered important for the most
recent investments in their cold storages. We calculate simple percentage over cold storages and
also present the numbers weighted by the size of the cold storages. The results are shown in
Table 4.
The results show that the subsidies that were provided by the government were seen as a very
important trigger for the investments done. When given the choice between ‘very important’,
‘less important’ and ‘not true’, 84% of the cold storage owners considered this a very important
trigger. Cold storage owners were further asked on the importance of these subsidies. 78% of the
cold storage owners declared to have received this subsidy. The majority of them (75%) declared
to have received 25% subsidy for their investments while a quarter of them declared to have
received more (between 30% and 35%). None seemed to have received the full subsidy, i.e. the
25% provided by the center and 15% provided by the state. This might seemingly have been
linked to the difficulty of having access to all these subsidies, given the bureaucratic hassle
involved.11
Table 4: Answers importance of triggers
Asked on other triggers for investments, the liberalization of the rates at the cold
storages was viewed by 35% of the cold storage owners as a very important trigger for their
investments. The importance of governance and road access was evaluated to be mostly ‘less
important’. Having access to reliable electricity was not seen as a major reason for the
investment.
11 Key informants indicated that subsidies would also be paid very late in the investment process.

20
6. Role of the cold storages
6.1. Storage behavior
The strong seasonality in potato production and sales in Bihar is illustrated in Figure 4. It
illustrates how the number of bags stored in an average cold storage changed monthly over the
12 months prior to the survey. Most of the bags are brought in during the month of March and
April. They are then taken out during the months of September and October for use as seed
potatoes or for sales in the market. Most of the cold storages close during the months of
December and January. No sales are done during that period as the early harvest from other parts
of the country (especially Punjab) is then coming in and putting downwards pressure on prices
and making further storage unprofitable.
0100002000030000400005000060000700008000090000
100000
Oct Nov Dec Jan Feb Mar Apr May Jun Jul Aug Sep Oct
Num
ber o
f 50
kgs
bags
Figure 4: Average number of bags stored per cold storage (October 2008 - October 2009)
Cold storage owners were asked questions on the type of people that store potatoes in the cold
storage. The numbers illustrate the large number of farmers that rely on them. It is estimated that
about 2,245 people store potatoes in an average cold storage. 91% of the users of cold storages
are farmers. An average cold storage contained in the last year almost 100,000 50 kg bags. Two-
thirds of the stored bags belonged to farmers. 31% of the bags belonged to traders, indicating that
the average quantity stored by traders is significantly higher than those stored by farmers: an

21
average farmer would store 33 bags; this compares to 144 bags on average per trader. The
number of bags stored by the cold storage owner himself is estimated to be significantly less
important in total (0.3% of all the bags stored) but he would still be considered a big trader
himself as he sells double the quantity of an average trader.
Table 5: Characteristics of cold storages
Storage behavior is changing quickly over time. First, we see an important process of up-scaling
of these cold storages. While a cold storage was holding 4,200 tons at start-up (on average in
1996), this had increased to 6,300 tons at the time of the survey. If a cold storage was started up
before 2000, its storage capacity was on average only 3,600 tons. If started up after 2000, this
was as high as 5,100 tons. Second, the type of potatoes that are stored has changed. While more
than two-thirds of all potato storage 10 years ago was towards seed potatoes, this has now been
reduced to about half of the potatoes in storage. The other half of the potatoes are now stored
towards sales as table varieties, indicating the increasing of commercialization of potato in the
district. This increasing commercialization seems to lead to an increasing importance of the role
of traders and cold storage owners over time in potato storage, e.g. while traders owned 8% of all
stored potatoes in 1999, this share had increased to 16% in 2009.
Table 6: Evolution in storage behavior over the last decade
As the costs of storage have been liberalized in Bihar, all cold storages are allowed to set rates as
they please. In the survey, we find that there is however only a small variation in the rates that
are being applied to the farmers. Farmers are required to pay 82 Rs/bag on average (the median
is 75 Rs/bag). Traders are usually given slightly lower rates, on average 5% lower. Interest rates
are asked for from those farmers or traders that received input advances from the cold storages
(see below). However, the rates asked for are low (4.2% interest rates over the period of storage).
Further questions were asked on all costs for running the cold storages, as well as on investment
costs. This information allows for the calculation of an internal rate of return (IRR) of these
investments. It is estimated that the IRR amounts to 19% for the current capacity of the cold
storage (at the time of the survey, cold storages were estimated to have used 92% of their
capacity). Table 7 further shows the sensitivity of the investments with respect to capacity use as
the IRR drops quickly if cold storages are unable to fill up capacity. As profitability was
22
calculated using unsubsidized investments, these profits are higher in reality for those cold
storages that benefited from the government subsidy.12
Table 7: Cost and profit analysis of cold storages
The high capacity use during a year when
production was bad, the relatively high prices charged (50% higher than in neighboring UP,
possibly partly driven by the higher costs due to more unreliable electricity in Bihar, and the
same as in Bangladesh where no investment subsidies are given) and the high profitability rates
for these investments all point to a need for further needed investments in this area in Bihar as to
ensure a more competitive environment that would further drive down prices.
6.2. Other services
The emergence of the cold storages might not only have implications on better storage conditions
of the potatoes, seemingly leading to lower wastages overall in the value chain and de-
seasonalization of the consumption over time. Given deregulation and the spatial spread of cold
storages and the increasing competition between them, cold storages are seemingly becoming
more involved in potato input and output markets and offering more services to farmers (Das
Gupta et al., 2010).
Cold storage owners were asked questions on the type of services that they provide to the
farmers (Table 6). While some cold storages arrange access to potato seeds, chemicals and
pesticides for some farmers, the importance of this service seems still very limited (8% of the
cold storages). Few cold storages also provide advance payments before storage or extension
services. However, the large majority of the cold storages (80%) report to provide credit to the
users that store there, using the potato bags as collateral. It is estimated by the cold storage
owners that they gave credit to 25% of the users of their cold storage. When taking into account
the size of the cold storage, this percentage is as high as 29. The credit given per bag is uniform
for all the cold storage in the sample and amounts to 50% of the value of a bag. Most storage
owners reported that they have a link with a bank to provide for this credit.
Cold storage owners are also involved in the output market linkages. More than half of the cold
storage owners reported that they contacted buyers and arranged transactions with users of the
12 The subsidies are often also credit linked. The loans given are treated as a priority sector loan, with interest rates at approximately 7% per year. These numbers are not taken into account in the IRR calculations.

23
cold storage on their behalf. It is estimated that in the cold storages where the owners did provide
these services, about 40% of the cold storage users would use these contacts. Most of the cold
storage owners (93%) reported that they would not ask any commission for this. Half of the cold
storages also offered grading and sorting services. Some of them were further involved in
providing transport services from farm to cold storage (5%) and from cold storage to buyers
(11%). These numbers thus illustrate that these cold storages provide services in the potato sector
that go beyond the storage function, and but they seem to be doing this less in Bihar than found
in other states, possibly because of their relatively recent rise (Das Gupta et al., 2010).13
Table 8: Services provided by cold storages
7. Cold storages and the potato value chain
7.1. Farmers’ participation in cold storages
Farmers in our survey were asked different questions with respect to changes in potato
production and marketing in the last ten years (Table 9). Overall, we see that there has been a
shift over time to the white potato variety. It was estimated to make up 58% of overall
production in 1999 but this had increased in 69% at the time of the survey. While the bigger
farmers started off with a lower share of red potatoes, they however have seen the biggest shift
towards white potatoes over the last ten years (from 51% of production to 71% of the
production). The reported yields of red as well as white potato had gone up over time. However,
the reported current yield is highest for the white potatoes, especially so for the large farmers.
We also note a small change in the type of varieties grown by farmers with especially a noted
decline of the red – Rajender 1/2 variety. The biggest uptake over the years is seen for the white
– Kufri Jyoti variety.
Farmers were further asked on the dynamics in input markets as well as in storage behavior. The
importance of other farmers as a source of potato seeds has gone down significantly over time.14
13 Key informant interviews revealed that in many cases, services provided by the cold storage depend on the local production levels and depend by year as these services are seemingly driven by the incentive to ensure maximum capacity utilization. The general pattern seems to be that in a good production season, such incentives are not strong or disappear. However, in a bad production season, these services are offered in that increasingly competitive environment.
14 Potatoes are amenable to different viral diseases, leading to the degeneration of potato stock over time. It is thus important for farmers to regularly replace their seeds.
24
While almost half (47%) of the farmers relied on them ten years ago, this had come down to 34%
at the time of the survey. Most of the seeds for potatoes were obtained from wholesale market
traders and private retailers. Cold storages were reported to be the main seed supplier for 8% of
the farmers. When asked about changes with respect to cold storages, farmers reported that there
was now easier access to cold storages (from 88% of the farmers in 1999 to 98% in 2009).
However, there is seemingly over time no change in the involvement of cold storages in input
markets. The biggest change is seen for some farmers who rely more on them to put them in
contact with potential buyers (from 6% to 12%).
Table 9: Perceived changes in potato production and marketing
Detailed information was asked on farmers’ storage behavior in the year prior to the survey
(Table 10). 92% of the farmers reported that they had stored potatoes in 2009. For those who did
not store potatoes, they mostly reported that they could not store because they needed money
urgently after the harvest. For those that stored, they reported to have done so because they
expected the price of potatoes to rise (35%) or because they were storing for seed potatoes
(62%). All the farmers that stored potatoes in 2009, used cold storages to do so and it thus seems
that traditional storage schemes have disappeared over time.
To understand the functioning of cold storages, questions were asked on the importance of
reasons for choosing a cold storage. The most important reason why farmers choose a particular
cold storage is linked to the distance to the cold storage as well as the quality of the cold storage.
Access to input markets and financial services are judged to be less important. In the bottom of
the Table, statistics are presented on the storage transactions in the year 2009. An average farmer
would store 111 bags in cold storage. This would mostly be done in the month of March while
the majority of the stored crop would be taken out in the month of October. Only a small
minority of the farmers reported that they received inputs from the cold storage or that the cold
storage owner put them in contact with a buyer. Most of the farmers stored for a combined
reason of having access to seeds for the next harvest as well as sales in the off-season.
Table 10: Storage of potato farmers
Table 11 reports the descriptives of marketing behavior of these potato farmers. Most of the
transactions involve rather large quantities, of almost 5 tons on average (or half a truck). 41% of

25
the sales are done after storage in cold storage, 2% after traditional storage, and the rest was sold
fresh. The larger farmers sell relatively more after cold storage. The buyer is in 50% of the cases
a collector in the village. Interestingly, wholesalers on wholesale markets as direct buyers play a
relatively minor role and only 5% of the farmers reported to directly sell to them. The lesser
importance of such wholesalers might be linked to the repeal of the APMC Act in Bihar, as the
lesser importance of direct wholesalers is an important contrast with the marketing of produce in
other states in India (Fachamps et al., 2005). Interestingly, most of the sales in off-season seem
to be happening at the cold storage as 35% of the transactions were done with a trader at the cold
storage.
A major reason why farmers settle on a particular buyer is linked to immediate payments. 60%
of the farmers give this as a major reason why they chose him. This is seen in the importance of
cash and immediate payments as 97% of the transactions are paid for immediately and in cash.
Only 20% settles on buyers because he gives him high prices. Most of the transactions concern
non-seed potatoes. As found in the production pattern, most the transactions also involve white
potatoes. There are seldom input advances given to farmers. Only in 1% of the cases did farmers
report that input advances were given.
An important change in the last decade is the emergence of the mobile phone in rural areas.
However, it is often not well understood what the impact of this is on rural households. 70% of
the potato farmers report to own a mobile phone, i.e. 88% of the large farmers and 61% of the
smaller ones. This is a relatively recent phenomenon. About 60% of the farmers that owned a
mobile phone reported to have owned it since 2006 or more recently. Farmers estimate that 11%
of the cost of the phone is used towards the potato business and most of the phone use is thus
towards other effects. About 20% of the farmers estimated that they contacted the buyer by
phone in the last transaction. This was much more prevalent in the case of the large farmers than
smaller ones. In the case that a phone was used, a price was agreed upon on the phone in 61% of
the cases. This illustrates to what extent access to mobile phones might be changing rural
marketing behavior in Bihar. This has also been shown in other settings (e.g. Jensen, 2007; Aker,
2008; Labonne and Chase, 2009).
Table 11: Marketing by potato farmers
26
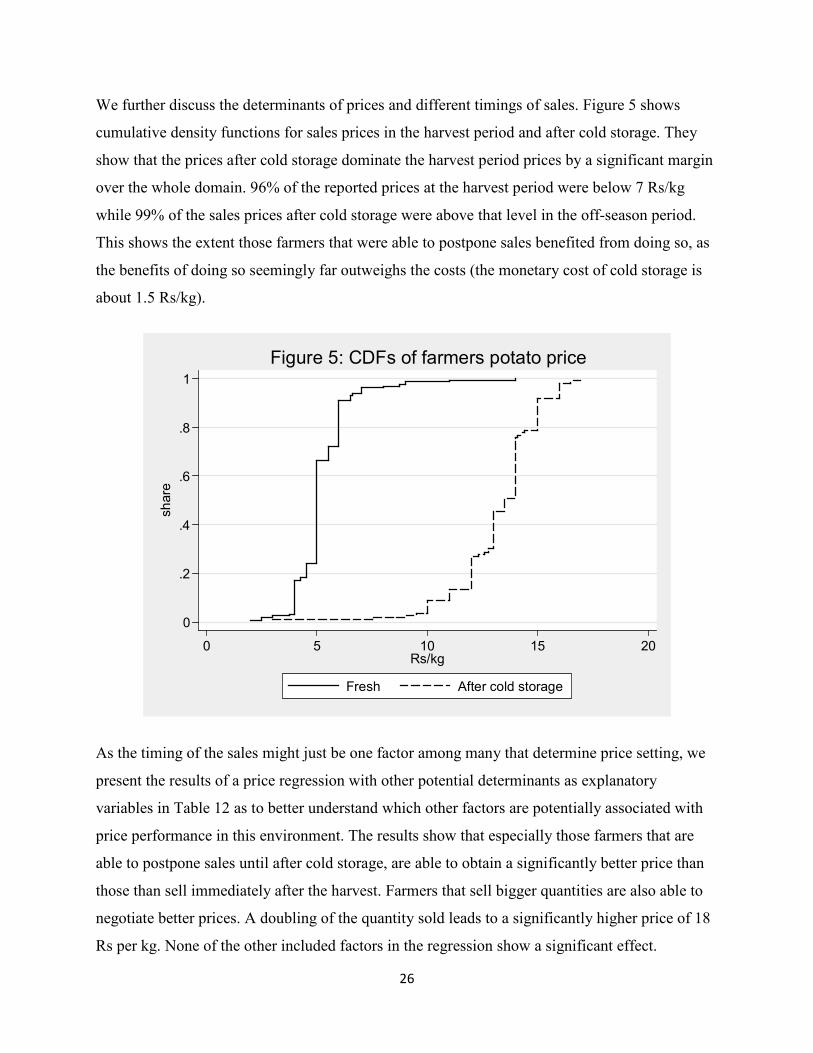
We further discuss the determinants of prices and different timings of sales. Figure 5 shows
cumulative density functions for sales prices in the harvest period and after cold storage. They
show that the prices after cold storage dominate the harvest period prices by a significant margin
over the whole domain. 96% of the reported prices at the harvest period were below 7 Rs/kg
while 99% of the sales prices after cold storage were above that level in the off-season period.
This shows the extent those farmers that were able to postpone sales benefited from doing so, as
the benefits of doing so seemingly far outweighs the costs (the monetary cost of cold storage is
about 1.5 Rs/kg).
As the timing of the sales might just be one factor among many that determine price setting, we
present the results of a price regression with other potential determinants as explanatory
variables in Table 12 as to better understand which other factors are potentially associated with
price performance in this environment. The results show that especially those farmers that are
able to postpone sales until after cold storage, are able to obtain a significantly better price than
those than sell immediately after the harvest. Farmers that sell bigger quantities are also able to
negotiate better prices. A doubling of the quantity sold leads to a significantly higher price of 18
Rs per kg. None of the other included factors in the regression show a significant effect.
0
.2
.4
.6
.8
1
shar
e
0 5 10 15 20Rs/kg
Fresh After cold storage
Figure 5: CDFs of farmers potato price

27
Table 12: Price determinants
To illustrate how farmers spread their sales over time and who benefits from these higher prices
in the off-season, we present a graph on the importance of sales for small and large farmers over
the course of the year, simply aggregating sales over the (un-weighted) sample (Figure 6). About
55% of the potatoes are sold fresh (defined as the period from February until June) and 45% of
the sold potatoes have gone through cold storage (from July until November). Small as well as
large farmers sell a significant portion of their potatoes fresh as well as after cold storage.
However, the importance of the sales in off-season is relatively more important for the larger
farmers. While the quantities sold in fresh and cold period are the same for the large households,
small farmers sell half of quantity of the fresh period in the off-season.
Given the importance of the timing of the sales for farmers’ income, we would like to understand
better the determinants that are associated with sales after cold storage. To analyze this, we build
on the regression approach used by Fafchamps and Hill-Vargas (2005) and Shilpi and Umali-
Deininger (2008). The dependent variable takes on a value of one if the farmer sold after cold
storage and zero otherwise. We estimate probit models given the binary nature of our dependent
variable. Standard errors are estimated after accounting for within cluster (village) correlations
0
10
20
30
40
50
60
Fresh Off-season
Figure 6: Importance of timing of sales for small and large farmers (100%=total sales over the years)
Small
Large

28
and possible heteroskedasticity. A district dummy is also included to control for possible
location-wise unobserved heterogeneity.
In the first regression reported in Table 13, we present the results of a standard probit regression.
Two variables are included that are assumed to be linked with sales after storage, i.e. wealth
(because of different time preferences) and the quantity sold (because of changes in transaction
costs).15
As it can be argued that the quantity sold is endogenous to the time of sale (as stored produce is
usually taken out at once, generating large quantities for sale), we instrument the quantity sold in
the transaction by using the total quantity sold by the household as an instrument. This
instrument is valid as shown by the significant results of an F-test at the bottom of the Table. We
follow the approach suggested by Smith and Blundell (1986) and River and Voung (1988) and
include the residual of the instrumenting regression in the second stage regression. The
significance of the coefficient on the residual provides a test of the endogeneity of the quantity
sold. In this specification, most of the determinants come out non-significant. However, the
coefficient on the residual of the instrumenting regression is not significant indicating that we do
not have an endogeneity problem in our specification. We thus proceed with un-instrumented
specifications.
The results indicate that an increase of wealth of the farmer has an important significant
effect on the timing of the sale. The quantity of the sale is not associated with the timing of sales.
In a second regression, we control for possible omitted variables. In this specification, the wealth
variable still stays largely significant. Another variable that comes out significant is the variable
that measures if the head of household has access to a source of off-farm income. Those farmers
that have such sources are more likely to postpone their sales. This might indicate that those
households might be less driven by liquidity constraints to do their sales. None of the other
variables are significant.
In two further regressions, we interact the wealth of the household with the quantity sold. In this
case, we find that the richer the households and the more he has to sell, the more likely he will
postpone the sales of potatoes until after cold storage. These results hold even when we control
for different other factors that might be related to the timing of the sales. Based on the
15 If a farmer has only a small quantity to sell, he is less likely to bear the transactions costs to bring produce to the cold storage as these costs usually go up by unit the smaller the lot (Fafchamps and Vargas-Hill, 2006).

29
descriptive as well as the regression analysis, we thus conclude that the wealthier farmers use
cold storages significantly more as to capture the benefits of the price rise of potatoes in the off-
season.
Table 13: Determinants of sales transactions after cold storage
7.2. Cost of storage in the value chain
Questions were asked on the price evolution over the last year at different points in the value
chain (producers, cold storage owners, wholesalers in urban and rural areas, and urban retailers
in Patna). This price information allows us to make deductions on the price composition and the
importance of the size of the margins in the value chain. Figure 7 shows the (red) potato price
evolution in the 12 months prior to the survey at each level of the value chain as calculated from
recall questions from a representative number of interviews at each level. As commonly is the
case, prices rise after the harvest period due to storage costs and the opportunity costs of money.
In the 2008-2009 season, potato retail prices in Patna rose from a low of 7.5 Rs/kg during the
month of March to a high of 15.3 Rs/kg during the period of September.
It is estimated that during the harvest period, the share of the producer in the two districts
interviewed in the final consumer price in Patna was 68%. The cost of marketing a kg of potatoes
from producers to urban consumers was about 2.4 Rs/kg during that period. The share of
producers that were willing and able to store potatoes for sales increased to 82% of the final
price by the month of September when most of the potatoes that were held in cold storages are
taken out. This share is significantly higher than those conventionally found in horticultural
value chains in India. This might reflect the better options that potato producers have as they are
not obliged to sell immediately and this in contrast with other more perishable crops. Potatoes
are also less perishable than most other fruits and vegetables.
The results further show that the storage costs are only a minor cost in the potato value chain.
The costs accounted for less than 10% of the final retail price that the consumer in Patna paid for
the potatoes in the off-season. A big share in the final retail is explained by the rewards to
storage, accounting for 40% of the final retail price. However, it is important to note that 2009
was an exceptional year where potato prices were significantly higher than normal and thus the
rewards are significantly inflated compared to a regular year. The high producer share in the final
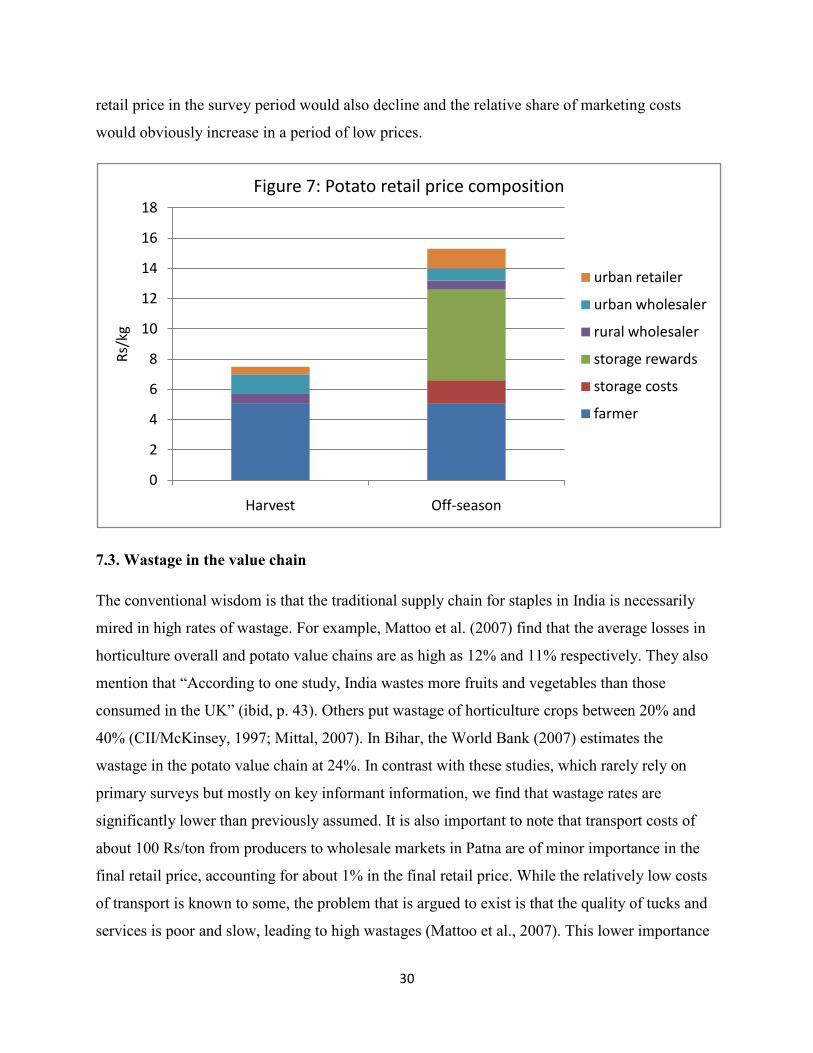
30
retail price in the survey period would also decline and the relative share of marketing costs
would obviously increase in a period of low prices.
7.3. Wastage in the value chain
The conventional wisdom is that the traditional supply chain for staples in India is necessarily
mired in high rates of wastage. For example, Mattoo et al. (2007) find that the average losses in
horticulture overall and potato value chains are as high as 12% and 11% respectively. They also
mention that “According to one study, India wastes more fruits and vegetables than those
consumed in the UK” (ibid, p. 43). Others put wastage of horticulture crops between 20% and
40% (CII/McKinsey, 1997; Mittal, 2007). In Bihar, the World Bank (2007) estimates the
wastage in the potato value chain at 24%. In contrast with these studies, which rarely rely on
primary surveys but mostly on key informant information, we find that wastage rates are
significantly lower than previously assumed. It is also important to note that transport costs of
about 100 Rs/ton from producers to wholesale markets in Patna are of minor importance in the
final retail price, accounting for about 1% in the final retail price. While the relatively low costs
of transport is known to some, the problem that is argued to exist is that the quality of tucks and
services is poor and slow, leading to high wastages (Mattoo et al., 2007). This lower importance
0
2
4
6
8
10
12
14
16
18
Harvest Off-season
Rs/k
g
Figure 7: Potato retail price composition
urban retailer
urban wholesaler
rural wholesaler
storage rewards
storage costs
farmer

31
of wastage and transport costs that we find might be due to the development of better
infrastructure (cold storage and road infrastructure) but might also reflect lack of evidence in
other studies on the actual situation on the ground given lack of primary data.
Farmers were also asked on the responsibility on potential losses that might occur during storage.
The majority of the farmers reported that they alone are responsibly, even when losses during
storage would exceed 10%. However, in the latter case, 31% of farmers believe that the owner of
the cold storage would somehow compensate them. Compared to traditional storage schemes,
there is thus an insurance scheme provided by the cold storage that puts a floor under the losses
that at least some farmers would have to bear.
To get at the level of total wastages in potato value chains, we asked the different agents how
much was wastage in storage, between the process of obtaining and selling potatoes, and during
their last transaction when potatoes might have been transported. This should give us a
reasonable approximation of the total waste in the value chain. We find that the total quantities
of potatoes wasted, and not used for consumption, are equal to 8.0% in the harvest period and
9.3% in the off-season of all the quantities that enter the value chain (Table 12). Such a
performance might even be better than developed countries, where quality and cosmetic criteria
are more severe (Kader, 2005; Parfitt et al., 2010). While some have argued that the cuts in
electricity leads to major losses for potato cold storage, in our surveys, all cold storages have
diesel generators that keep the storages cool at times of electricity cuts, at admittedly higher
costs. Because of the availability of cold storages, wastage levels seem to have come down as
these wastage numbers are significantly lower than those done in previous estimates.
Table 14: Wastage in the value chain
8. Conclusions and policy implications
We present here the case of innovations and investments in post-harvest management and show
how it is associated with important changes in the agricultural sector. More in particular, we
document in this study the rapid emergence of cold storages in poor disadvantaged districts in
Bihar, an area characterized by a large number of smallholders. In the two disadvantaged
districts that were studied, the number of cold storages in the last decade doubled or tripled and
32
rapid up-scaling of cold storages led to an even faster total capacity expansion, i.e. a triple and
five-fold increase over the same period.
The spread of these cold storages in these districts has seemingly been driven by the improved
provision of public goods (deregulation; road infrastructure; and governance), by the availability
and spread of new technologies, as well as by significant subsidies by the government. The
increasing spread of these cold storages is associated with increased de-seasonalization of potato
consumption, disintermediation, and lower wastages. We thus show that market innovations,
even in poor settings, can be important drivers for better agricultural performance.
While the small potato producers participate relatively less so for the storage of potatoes for sale,
they also seem to have benefited from the diffusion processes of cold storages. First, small
farmers that do not participate in cold storages can still gain from the existence of these. As
prices are smoothened due to the availability of an extra marketing channel (the storage option),
it can be expected that prices, on average, during the harvest period will be increased. For those
farmers that sell directly after the harvest, they will benefit from these relatively higher prices.
Second, the evidence in this paper shows that a large number of even relatively small farmers
participate directly in the cold storages. Because of better storage conditions of their seeds, they
benefit directly from the existence of these cold storages and from the existence of this extra
market channel.
The analysis thus illustrates how improvements in post-harvest management can have large
impacts on value chains. However, as there was high capacity use during a year when potato
production was bad, as the prices charged were still relatively high, and as there are high
profitability rates for these investments, this all points to a need for further needed investments in
this area in Bihar as to ensure a more competitive environment that would further drive down
prices. While the subsidies that were given out by the government have helped to stimulate the
setting up of cold storages in Bihar, it has however not (yet) led to the lower storage costs that
one would expect.
Finally, the results of our study point to several important policy implications. First, the study
has shown the importance of appropriate policies as to stimulate the take-off of agricultural
businesses in Bihar. These policies should focus foremost on the provision of public goods such

33
as reliable electricity, road infrastructure, and good governance. Given the still existing large
deficiencies, Bihar should make further investments in this area as to allow private business to
further flourish and to allow farmers in these disadvantaged districts to become better integrated
in the market economy. Second, policy makers should further stimulate increased investments in
the cold storage sector, but not necessarily through subsidies. More competition in the cold
storage sector is desirable as to drive down the cost of storage. The further spread of cold
storages as intermediaries in the potato value chains might also open some important
opportunities towards upgrading the potato value chains as cold storages can serve as focal
points for the distribution of better seed varieties, extension advice, marketing advice, etc. This
could especially benefit smaller farmers who, because of liquidity constraints, are less willing to
sell after storage and benefit from the higher prices off-season. Third, Bihar might further be a
good area for the cultivation of processing varieties given its unique agro-ecological potential for
those. As it is one of the areas in India where the growing period is later and where the minimum
temperature during the production period is relatively high, leading to the required higher
production of dry matter, the region is better suited for processing varieties than most other states
in India. Cold storage investments would have to adjust to processing demands also though as
processing varieties have different temperature requirements than table varieties. Given its
comparative advantage, it seems that the state could benefit from the increased presence of the
private sector interested in the processing of such varieties. However, some of the processing
companies that are currently active in India are bringing in potato varieties (e.g. Lady Roseta,
Atlantic) which might be prone to diseases that might be more difficult to control in the Indian
setting. Close collaboration with local research stations as to introduce the most appropriate
varieties seems thus called for. Fourth, our data illustrate the devastating effects that the late
blight disease has in Bihar. The development and spread of better suited varieties by public or
private research institutions seem thus of utmost importance.
While we have only looked at the benefits of the improved storage possibilities for potato
farmers and on the participation effect of different farmers to be involved in this storage scheme,
we have shied away on the costs effect and thus the sense of the investment subsidy. In section 2,
we have shown that the subsidies introduce dead-weight losses in the economy because
production factors do not reflect their true costs. A proper economic cost – benefit analysis for
such a policy intervention is however left for future research.

34
References
Aker, Jenny C. (2008) “Does Digital Divide or Provide? The Impact of Cell Phones on Grain Markets in Niger”, University of California, Berkeley Aset (2003), Estimation of loss of horticulture products due to non-availability of post-harvest and food processing facilities in Bihar and UP, New Delhi, mimeo
Basu, J.P. (2010), Efficiency in wholesale, retail and village markets: A study of potato markets in West Bengal, Journal of South Asian Development, 5(1):85-112
CII (Conferederation of Indian Industry)/McKinsey (1997), Modernizing the Indian Food Chain, New Delhi CIP (International Potato Center) (2006), India, World Potato Atlas. Das Gupta, S., Reardon, T., Minten, B., Singh, S. (2010), The transforming potato value chain in India: Potato pathways from a commercialized-agriculture zone (Agra) to Delhi, IFPRI-ADB, mimeo Delgado, C.L., Narrod, C.A., Tiongco, M. (2008), Determinants and implications of the growing scale of livestock farms in four fast-growing developing countries, Research Report 157. Washington, D.C. International Food Policy Research Institute (IFPRI) Dries, L., Germenji, E., Noev, N., Swinnen, J. (2009), Farmers, Vertical Coordination, and the Restructuring of Dairy Supply Chains in Central and Eastern Europe, World Development, 37(11): 1742-1758 Evenson, R.E. and D. Gollin (2003), Crop Variety Improvement and Its Effect on Productivity: The Impact of International Agricultural Research, Wallingford, UK: CAB International. Fafchamps, M., Hill-Vargas, R. (2005), Selling at the Farmgate or Traveling to Market, American Journal of Agricultural Economics, 87(3): 717-734 Fafchamps, M., Vargas-Hill, R., Minten, B. (2008), Quality Control in Non-Staple Food Markets: Evidence from India, Agricultural Economics, 38: 251-266 Fuglie, K.O. (1995), Measuring welfare benefits from improvements in storage technology with an application to Tunesian potatoes, American Journal of Agricultural Economics, 77: 162-173 Government of Bihar (2006), Bihar: Approach to the 11th Five Year Plan: Vision for Accelerated Inclusive Growth, Planning and Development Department, Patna Gulati, A., Minot, N., Delgado, C., Bora, S. (2007), Growth in High-Value Agriculture in Asia and the Emergence of Vertical Links with Farmers, In: Swinnen, J.F.M. (ed). Global Supply Chains, Standards and the Poor. CABI Publishing, Oxford.

35
Jensen, R. (2007), The Digital Provide: Information (Technology), Market Performance, and Welfare in the South Indian Fisheries Sector, Quarterly Journal of Economics, vol. 127, no. 3, pp. 879-924 Kader, A.A. (2005), Increasing food availability by reducing postharvest losses of fresh produce, Acta Horticultura, 682:2169-2175 Kumar, B. (2009), Indian Horticulture Database 2008, National Horticulture Board, New Delhi Labonne, J., Chase, R. S. (2009), The Power of Information – The Impact of Mobile Phones on Farmers’ Welfare in the Philippines. Policy Research Working Paper 4996, Washington, DC, United States: World Bank. Mattoo, A., Mishra, D., Narain, A. (2007), From competition at home to competing abroad. World Bank, Washington Dc. Mittal, S. (2007), Strengthening backward and forward linkages in horticulture: Some successful initiatives, Agricultural Economics Research Review, 20, 457-469 Moazzem, K.G., Fujita, K. (2004), The potato marketing system and its changes in Bangladesh: From the perspective of a village study in Comilla District, The Developing Economies, XLII-1, pp. 63-94
Nagara, J.R., Rahman, A. (2010), Booming Bihar: Fact or Fiction, Economic and Political Weekly, XLV(8): 10-11
O’Donoghue, T., Rabin, M. (1999), Doing it now or later, American Economic Review, 89(1): 103-124
Pearce, D. W., Warford, J. J. (1993), World without end—economics, environment and sustainable development, New York: Oxford University Press.
Patnaik, G. (2005), Review of Government of India Agricultural Marketing/Processing Policies and Programs, Global AgriSystems Pvt. Ltd, New Delhi. Mimeo
Reardon, T., Barrett, C., Berdegué, J., Swinnen, J.F.M. (2009). "Agrifood Industry Transformation and Small Farmers in Developing Countries," World Development, 37(11):1717-1727. Reardon, T., Timmer, P., Minten, B. (2010), The Supermarket Revolution in Asia and Emerging Development Strategies to Include Small Farmers, Proceedings of the National Academy of Science, forthcoming. Shilpi, F., Umali-Deininger, D. (2008), Market facilities and agricultural marketing: evidence from Tamil Nadu, India, Agricultural Economics, 39(3): 281-294 Smith, R., Blundell, R. (1986), An exogeneity test for a simultaneous equation tobit model with an application to labor supply, Econometrica, 54: 679-685
36
Spielman, D.J., Pandy-Lorch, R. (2009), Millions Fed: Proven Successes in Agricultural Development, IFPRI
Parfitt, J., Barthel, M., MacNaughton, S. (2010), Food waste within food supply chains: Quantification and potential for change to 2050, Philosophical Transactions of the Royal Society, 365:3065-3081 Reardon, T., C.B. Barrett, J.A. Berdegue, J. Swinnen (2009), Agrifood Industry Transformation and Farmers in Developing Countries, World Development, 37(11): 1717-1727 Rivers, D., Young, Q.H. (1988), Limited information estimators and exogeneity tests for simultaneous tobit models, Journal of Econometrics, 39(3):347-366 Sharma, A.N. (2005), Agrarian relations and socio-economic change in Bihar, Economic and Political Weekly, March 5, pp. 960-972 Swinnen, J. (editor) (2007). Global Supply Chains, Standards and the Poor. Wallingford: CABI Publishing. World Bank (2007), Bihar agriculture: Building on emerging models of “success”, Agriculture and Rural Development Sector Unit, South Asian Region, Discussion Paper Series, Report No.4, Washington DC World Bank (2005), Bihar: Towards a Development Strategy, Washington DC Williams, J.C., Wright, B.D. (1991), Storage and Commodity Markets, Cambridge University Press, Cambridge

0
Figure 1: Conceptual Framework
h
g
C1 C2
P P
D2
ES2
S1
D1
Q Q
a
c
b
d
e
f
Pa
P0
P2
P1
PERIOD 2 PERIOD 1
i
j
k
l
q1
q2
h
q10
h
h
q20
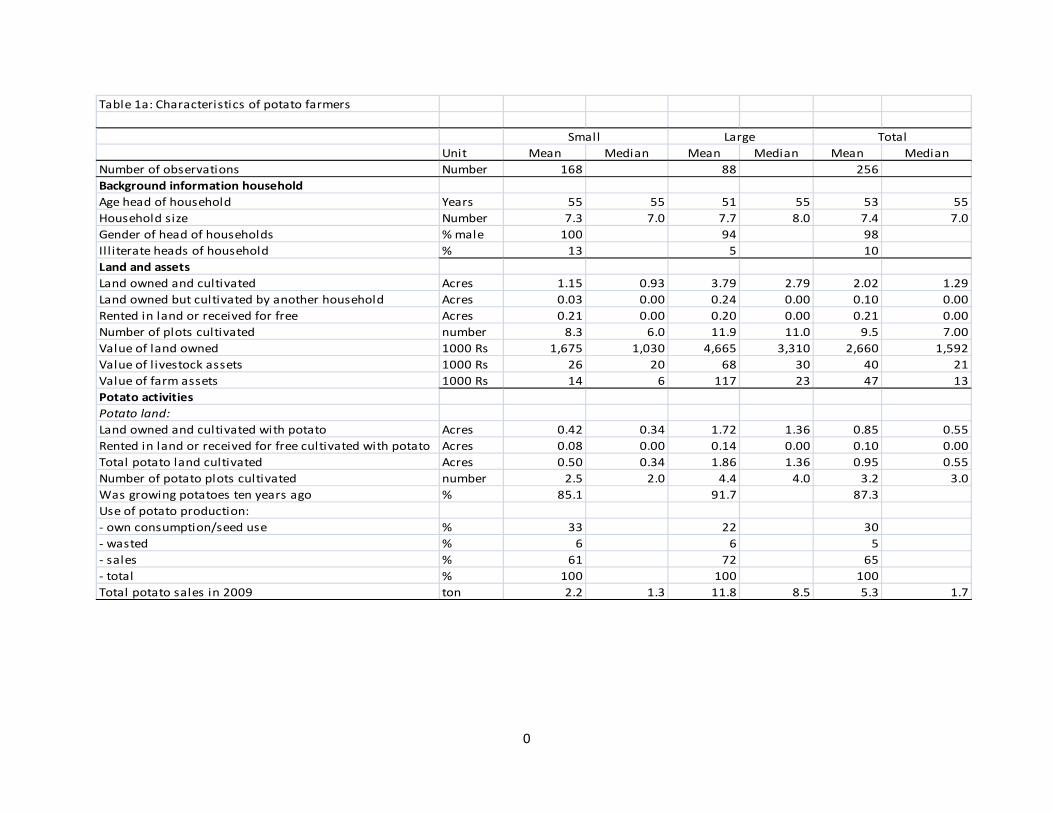
0
Table 1a: Characteristics of potato farmers
Unit Mean Median Mean Median Mean MedianNumber of observations Number 168 88 256Background information household Age head of household Years 55 55 51 55 53 55Household size Number 7.3 7.0 7.7 8.0 7.4 7.0Gender of head of households % male 100 94 98Ill iterate heads of household % 13 5 10Land and assetsLand owned and cultivated Acres 1.15 0.93 3.79 2.79 2.02 1.29Land owned but cultivated by another household Acres 0.03 0.00 0.24 0.00 0.10 0.00Rented in land or received for free Acres 0.21 0.00 0.20 0.00 0.21 0.00Number of plots cultivated number 8.3 6.0 11.9 11.0 9.5 7.00Value of land owned 1000 Rs 1,675 1,030 4,665 3,310 2,660 1,592Value of l ivestock assets 1000 Rs 26 20 68 30 40 21Value of farm assets 1000 Rs 14 6 117 23 47 13Potato activitiesPotato land:Land owned and cultivated with potato Acres 0.42 0.34 1.72 1.36 0.85 0.55Rented in land or received for free cultivated with potato Acres 0.08 0.00 0.14 0.00 0.10 0.00Total potato land cultivated Acres 0.50 0.34 1.86 1.36 0.95 0.55Number of potato plots cultivated number 2.5 2.0 4.4 4.0 3.2 3.0Was growing potatoes ten years ago % 85.1 91.7 87.3Use of potato production:- own consumption/seed use % 33 22 30- wasted % 6 6 5- sales % 61 72 65- total % 100 100 100Total potato sales in 2009 ton 2.2 1.3 11.8 8.5 5.3 1.7
Small Large Total

1
Table 1b: Potato production in 2009, averages per plot
Unit Mean Median Mean Median Mean MedianNumber of observations Number 409 240 649Size and overall productionSize of the plot acres 0.20 0.16 0.55 0.47 0.33 0.22production per plot tons 17.98 15.00 60.89 40.00 33.82 18.00expected production (during cultivation) per plot tons 28.13 20.00 92.32 60.00 51.83 30.00yield tons/acre 9.01 9.68 10.94 9.68 9.73 9.68Input useOwn potato seeds used on plot share 0.83 0.78 0.81Exchanged seeds used on plot share 0.02 0.03 0.02Purchased seeds used on plot share 0.15 0.23 0.18Total expenditures on seeds Rs/acre 180 0 298 0 224 0Chemical ferti l izer used on plot share 1.00 0.99 1.00Total expenditures on chemical ferti l izer Rs/acre 3803 3710 5624 4008 4476 3742Pesticides-herbicides used on plot share 0.94 1.00 0.96Total expenditures on pesticides-herbicides Rs/acre 1770 1290 2108 1561 1895 1371Total expenditures on irrigation Rs/acre 1499 1129 1097 968 1350 1097Total expenditures on compost/oilcakes Rs/acre 5205 5161 8631 6712 6472 5806Technology adoptionAnimal traction used on plot share 0.05 0.03 0.04Total expenditures on animal traction Rs/acre 122 0 7 0 80 0Tractor/harvester/tresher used on plot share 0.91 0.88 0.90Total expenditures on tractor/harvester/tresher Rs/acre 1925 1935 1843 1935 1894 1935Rotar vetter used on plot share 0.18 0.33 0.23Total expenditures on rotar vetter Rs/acre 335 0 893 0 541 0Variety use- White - Kufri Jyoti % 30 35 32- White - Kufri Pokhraj % 7 15 10- White - TPS % 6 4 6- White - Kufri Ashoka % 4 14 8- White - other % 12 4 9- Red - Kufri Senduri/C1/C40/C140 % 33 22 29- Red - other % 8 6 6- Total % 100 100 100Shocks in 2009Incidence of late blight much worse than expected % 58 55 58Incidence of late blight worse than expected % 32 30 31Incidence of late blight normal or better than expected % 10 15 11Floods normal % 100 100 100Droughts normal % 98 100 99Other weather shocks normal % 82 81 82
Small Large Total

2
Table 2: Descriptive statistics agents value chain surveys
Unit Mean MedianCold storageNumber of observations Number 27Capacity of cold storage Tons 6,288 6,000Value of cold storage 1000 USD 1,140 1,064WholesalersNumber of observations Number 65Quanitities procured daily kgs/day 635 170Value of assets 1000 USD 1.25 0.24Working capital 1000 USD 3.39 1.94Traditional retailersNumber of observations Number 164Quanitities procured daily kgs/day 130Value of assets 1000 Rs 8.6 1.3Value of assets 1000 USD 0.19 0.03Working capital 1000 Rs 19.3 10.0Working capital 1000 USD 0.43 0.22
Table 3: Changes in the potato economy, as reported by vil lage focus groups
1999 2009% of households growing potatoes Mean 71 83
Median 70 90Of the potato grown in the vil lage,- % white potato Mean 49 62
Median 35 60- % red potato Mean 55 38
Median 70 40Number of vil lage traders that buy up potato in the vil lage itself Mean 10 14
Median 2 6% of potatoes produced in vil lage that is stored in cold storage Mean 39 62
Median 27 67
% of answers

3
Table 4: Importance of triggers for investments in cold storages, as reported by owners
Unit Very Less Not Totalimportant important true
"The governance in the state improved" Simple 0 58 42 100Weighed 0 49 51 100
"Access to reliable electricity improved" Simple 8 27 65 100Weighed 5 17 78 100
"Access to roads improved" Simple 13 79 8 100Weighed 10 81 9 100
"Rates at cold storages were l iberalized" Simple 35 61 4 100Weighed 37 57 7 100
"Subsidies of the government were there" Simple 84 12 4 100Weighed 84 11 6 100
Government subsidies for investments% of cold storages that received % 78If received subsidy, amount of subsidy received-25% % 75-30% % 13-33% % 8-35% % 4Total % 100
% of answers
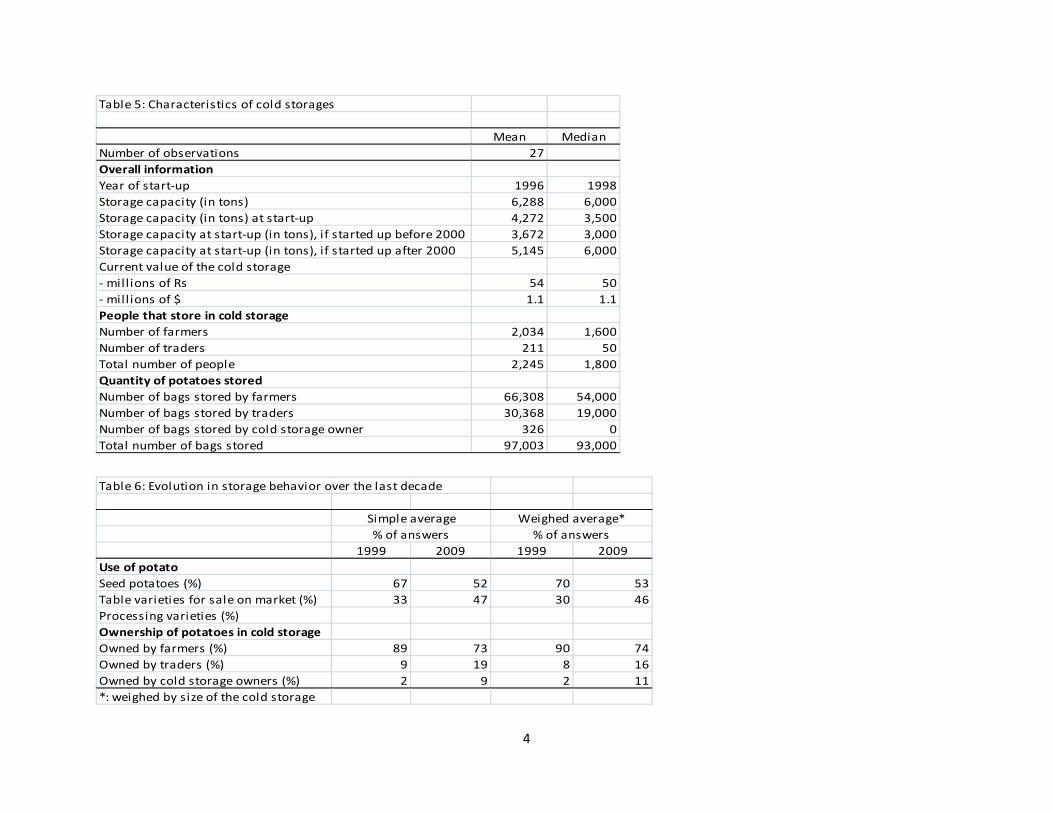
4
Table 5: Characteristics of cold storages
Mean MedianNumber of observations 27Overall informationYear of start-up 1996 1998Storage capacity (in tons) 6,288 6,000Storage capacity (in tons) at start-up 4,272 3,500Storage capacity at start-up (in tons), if started up before 2000 3,672 3,000Storage capacity at start-up (in tons), if started up after 2000 5,145 6,000Current value of the cold storage- mill ions of Rs 54 50- mill ions of $ 1.1 1.1People that store in cold storageNumber of farmers 2,034 1,600Number of traders 211 50Total number of people 2,245 1,800Quantity of potatoes storedNumber of bags stored by farmers 66,308 54,000Number of bags stored by traders 30,368 19,000Number of bags stored by cold storage owner 326 0Total number of bags stored 97,003 93,000
Table 6: Evolution in storage behavior over the last decade
1999 2009 1999 2009Use of potatoSeed potatoes (%) 67 52 70 53Table varieties for sale on market (%) 33 47 30 46Processing varieties (%)Ownership of potatoes in cold storageOwned by farmers (%) 89 73 90 74Owned by traders (%) 9 19 8 16Owned by cold storage owners (%) 2 9 2 11*: weighed by size of the cold storage
Simple average Weighed average*% of answers % of answers

5
Table 7: Cost and profit analysis of cold storages
Unit Mean MedianCost to farmerAverage charge per bag to farmers who store Rs/bag 82 75Average charge per bag to traders who store Rs/bag 78 70Average interest rate paid on advance % 4.2 2.0Cost to cold storagesLabor costsPermanent employees persons 11.7 10Yearly costs of permanent employees 1000 Rs 502 480Number of temporary employees man-months 157 131Yearly costs of temporary employees 1000 Rs 1,028 905Operating costsElectricity 1000 Rs 2882 2000Diesel 1000 Rs 972 500Other 1000 Rs 580 357Total 1000 Rs 4,434 2,857Internal rate of return*- at current capacity (92%) % 19.0 14.7- at full capacity (100%) % 21.2 16.5- at 80% capacity % 15.6 11.9- at 70% capacity % 12.8 9.6*: using a charge of 80 Rs/bag for mean; 72.5 Rs/bag for medianinvestment values evaluated at 5000 Rs/ton (from key informant interviews)no costs of providing access to input/output markets or financial services includedaverage storage capacity and costs numbers per those reported in tables

6
Table 8: Services provided by cold storages
Unit Simple average Weighed average*Cold storages that arrange farmers access to seed % yes 7 8Cold storages that arrange farmers access to chemicals/pesticides % yes 8 8Cold storages that provide agricultural extension services to farmers % yes 4 4Cold storages that provide advance payments before storage % yes 5 6Cold storages that provide advance payments after storage % yes 79 78If yes, number of users that cold storages give advances to % 25 29If yes, advance given per bag %/bag 50% 50%% of bags that credit was given for (using bags as collateral) % 29 32If yes, to provide credit, do you have l inkage with Bank? % yes 83 84Cold storages contact buyers and arrange transactions for storers % yes 56 51If yes, number of users put in contact with buyers % 40 40% of cold storages that charge commission for contacts with buyers % 7 8Cold storages provide grading and sorting services % yes 50 52Cold storages provide transport services from farm to cold storage % yes 5 5Cold storages provide transport services from cold storage to buyer % yes 11 18*: weighed by size of the cold storage
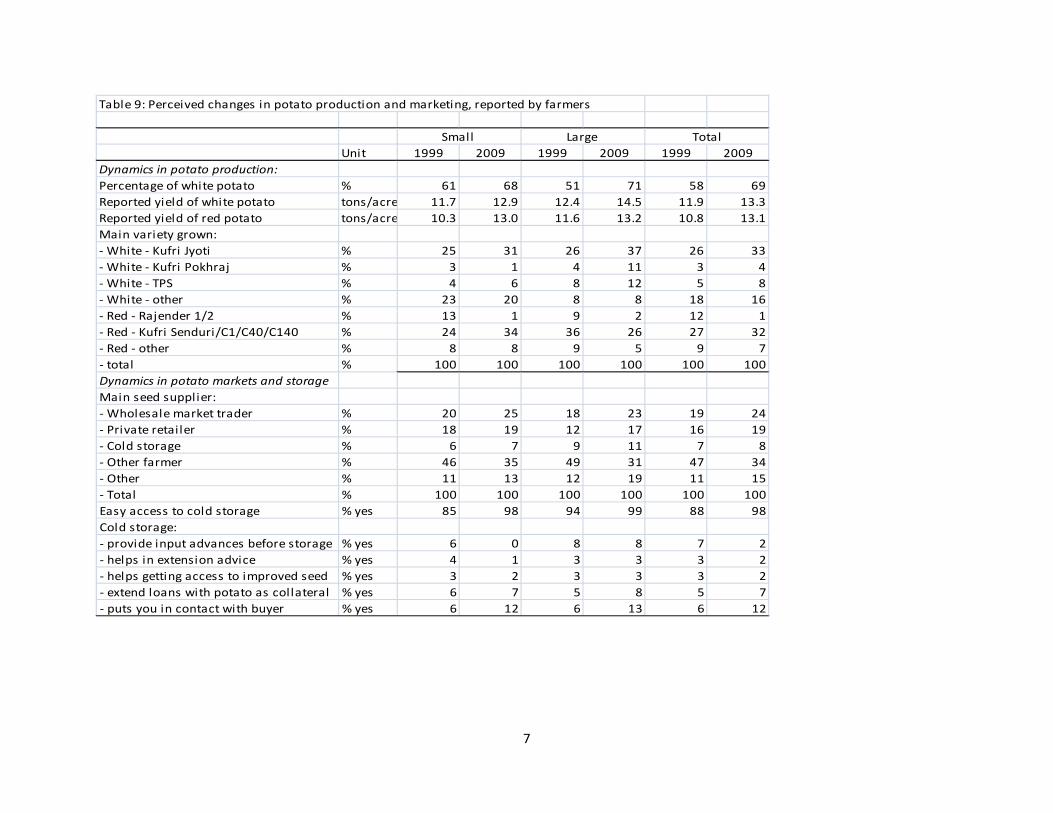
7
Table 9: Perceived changes in potato production and marketing, reported by farmers
Unit 1999 2009 1999 2009 1999 2009Dynamics in potato production:Percentage of white potato % 61 68 51 71 58 69Reported yield of white potato tons/acre 11.7 12.9 12.4 14.5 11.9 13.3Reported yield of red potato tons/acre 10.3 13.0 11.6 13.2 10.8 13.1Main variety grown:- White - Kufri Jyoti % 25 31 26 37 26 33- White - Kufri Pokhraj % 3 1 4 11 3 4- White - TPS % 4 6 8 12 5 8- White - other % 23 20 8 8 18 16- Red - Rajender 1/2 % 13 1 9 2 12 1- Red - Kufri Senduri/C1/C40/C140 % 24 34 36 26 27 32- Red - other % 8 8 9 5 9 7- total % 100 100 100 100 100 100Dynamics in potato markets and storageMain seed supplier:- Wholesale market trader % 20 25 18 23 19 24- Private retailer % 18 19 12 17 16 19- Cold storage % 6 7 9 11 7 8- Other farmer % 46 35 49 31 47 34- Other % 11 13 12 19 11 15- Total % 100 100 100 100 100 100Easy access to cold storage % yes 85 98 94 99 88 98Cold storage:- provide input advances before storage % yes 6 0 8 8 7 2- helps in extension advice % yes 4 1 3 3 3 2- helps getting access to improved seed % yes 3 2 3 3 3 2- extend loans with potato as collateral % yes 6 7 5 8 5 7- puts you in contact with buyer % yes 6 12 6 13 6 12
Small Large Total

0
Table 10: Storage by potato farmersUnit Small Large Total
Storage behaviorDid store potatoes in 2009 % yes 91 94 92If no storage, why not?
- I need the money urgently after harvest % 88 82 87- I expected the price of potatoes to fall % 9 9 9- Storing is costly % 2 9 4- Total % 100 100 100
If storage, why?- I need the money later in the year % 3 3 3- I expect the price of potatoes to rise % 31 46 35- I store for seed potatoes % 66 51 62- Total 100 100 100
% of farmers that stored and that used cold storages in 2009 % 99 100 99If use of cold storage"Very important" or "A bit important" reason for choosing a cold storage
- Low cost storage % 48 38 44- Quality of storage % 92 90 91- Distance to cold storage % 92 90 91- Access to quality seeds % 44 43 43- Access to extension advice % 26 14 22- Access to chemicals % 20 18 19- Access to input advances before storage % 15 10 14- Credit given at time of storage % 24 21 23- Finding a buyer % 27 22 26
Cold storage transactions in 2009Quantity stored Bags 40 251 111Month of deposit (% of farmers that deposited in March) % 71 82 75Received input advances from cold storage % 1 4 2Bought potato seeds through the cold storage % 1 3 2Cold storage extended loan % 1 4 2Month taken out (% of farmers that took bags out in October) % 58 66 60Potatoes that were wasted during storage % 5.7 5.6 5.6Major use of potatoes
- Own seeds % 36 25 32- Own consumption % 0 0 0- Sales % 6 8 7- Combination % 58 67 61
Amount paid for storage Rs/bag 77 78 77Cold storage put farmer in touch with buyer % 4 8 5

1
Table 11: Marketing by potato farmers (% of transactions)
Unit Small Large TotalQuantity sold tons 2.37 7.99 4.88Price Rs/kg 8.1 9.1 8.6Timing of sales
- Fresh from field without drying % 56.2 42.3 50.0- Without storage after drying % 5.9 8.9 7.3- After traditional storage % 2.6 1.6 2.2- In/after cold storage % 35.3 47.2 40.6
First buyer- Trader collector in vil lage (outside wholesale market) % 54.6 43.1 49.5- Wholesaler on wholesale market % 1.3 8.9 4.7- Cold storage owner % 0.0 4.9 2.2- Trader at cold storage % 32.2 35.0 33.5- Traditional retailer % 9.2 7.3 8.4- Consumer % 1.3 0.8 1.1- Other % 1.3 0.0 0.7
Major reason for the choice of buyer- He gives high prices % 15.0 26.0 19.9- He accepts large quantities % 0.6 1.6 1.1- He accepts small quantities % 2.6 0.0 1.4- He gives advances when needed % 2.6 1.6 2.2- He pays immediately % 68.0 51.2 60.5- He is close by % 1.3 1.6 1.5- No other option % 0.0 0.0 0.0- Combination of the above % 9.9 18.0 13.4
Transaction time on location sale hours 1.2 1.9 1.5Type of potato
- Seed potato % 9.0 20.0 14.0- Non-seed potato % 91.0 80.0 86.0
Color potato- Red % 39.0 23.0 32.0- White % 61.0 77.0 68.0
Location of sale- Farmer's field or vil lage % 63.4 50.4 57.7- Cold storage % 32.0 37.2 34.3- Wholesale market + others % 4.6 12.4 8.0
% paid cash and immediately % 98.5 94.8 96.8Input advances given % yes 1.0 2.0 1.0% of farmers that own a cell phone % 61 88 70Year since they own phone - 2008 or later % 28 17 23- 2006 or 2007 % 30 42 35- 2004 or 2005 % 19 15 18- before 2004 % 23 26 24Of all calls made, how many related to potato business % 8 13 11Use of phone in last transaction Farmers who were in contact with buyer per phone % yes 9 37 19If used, …Famers agreed upon price on the phone % yes 56 64 61

0
Table 12: Price determinants
Dependent variable = Rs/kg* Coefficient t-valueTiming of sales - Fresh from field without drying (default) - Without storage after drying yes=1 -0.162 -0.470
- After traditional storage yes=1 3.639 5.240- In/after cold storage yes=1 6.451 7.990
Seed potatoes yes=1 -0.467 -1.930Sold to broker in vil lage yes=1 -0.412 -1.600Quantity sold log() 0.178 2.400Red potato yes=1 0.045 0.230Sold to trader at cold storage yes=1 0.529 0.760Sold at cold storage yes=1 1.107 1.620% paid cash and immediately % 0.007 0.860Intercept 4.631 3.980Number of obs 269F( 11, 14) 1206Prob > F 0.00R-squared 0.87Root MSE 1.58* standard errors estimated after accounting for within cluster(vil lage) correlationsdistrict dummy included but not reported
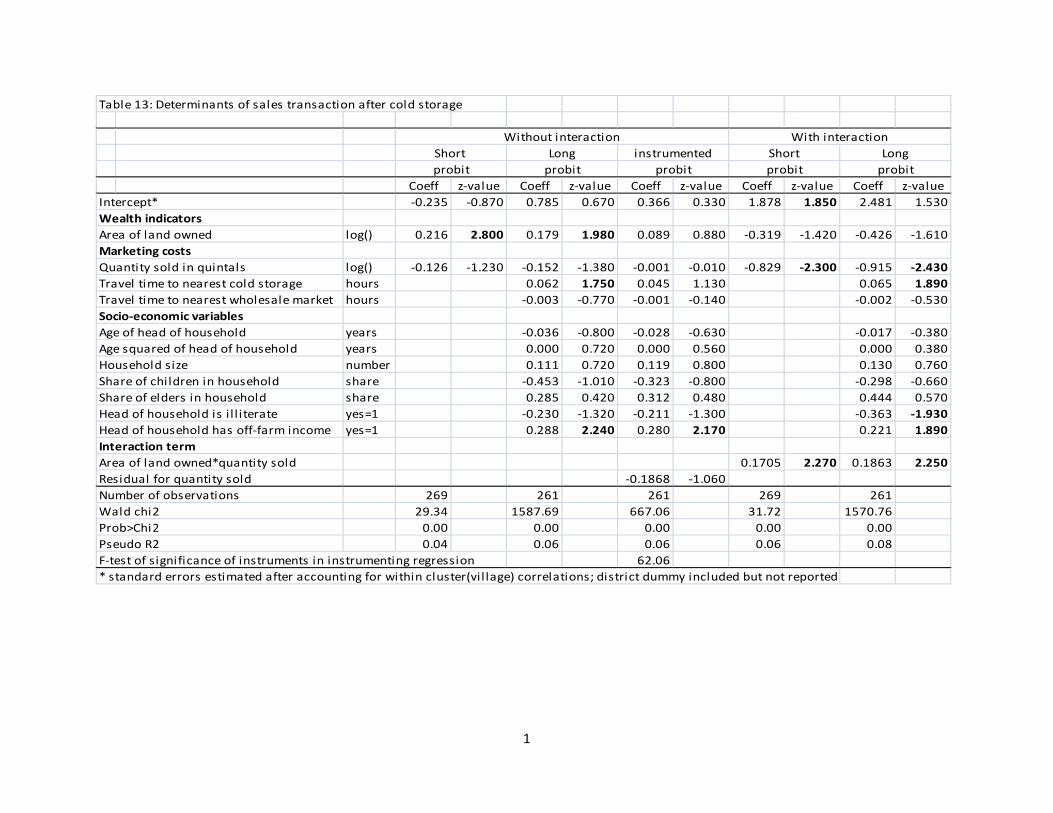
1
Table 13: Determinants of sales transaction after cold storage
Coeff z-value Coeff z-value Coeff z-value Coeff z-value Coeff z-valueIntercept* -0.235 -0.870 0.785 0.670 0.366 0.330 1.878 1.850 2.481 1.530Wealth indicatorsArea of land owned log() 0.216 2.800 0.179 1.980 0.089 0.880 -0.319 -1.420 -0.426 -1.610Marketing costsQuantity sold in quintals log() -0.126 -1.230 -0.152 -1.380 -0.001 -0.010 -0.829 -2.300 -0.915 -2.430Travel time to nearest cold storage hours 0.062 1.750 0.045 1.130 0.065 1.890Travel time to nearest wholesale market hours -0.003 -0.770 -0.001 -0.140 -0.002 -0.530Socio-economic variablesAge of head of household years -0.036 -0.800 -0.028 -0.630 -0.017 -0.380Age squared of head of household years 0.000 0.720 0.000 0.560 0.000 0.380Household size number 0.111 0.720 0.119 0.800 0.130 0.760Share of children in household share -0.453 -1.010 -0.323 -0.800 -0.298 -0.660Share of elders in household share 0.285 0.420 0.312 0.480 0.444 0.570Head of household is i l l iterate yes=1 -0.230 -1.320 -0.211 -1.300 -0.363 -1.930Head of household has off-farm income yes=1 0.288 2.240 0.280 2.170 0.221 1.890Interaction termArea of land owned*quantity sold 0.1705 2.270 0.1863 2.250Residual for quantity sold -0.1868 -1.060Number of observations 269 261 261 269 261Wald chi2 29.34 1587.69 667.06 31.72 1570.76Prob>Chi2 0.00 0.00 0.00 0.00 0.00Pseudo R2 0.04 0.06 0.06 0.06 0.08F-test of significance of instruments in instrumenting regression 62.06* standard errors estimated after accounting for within cluster(vil lage) correlations; district dummy included but not reported
Short ShortWithout interaction With interaction
probitLong
probitprobitLong
probitinstrumented
probit

2
Table 14: Wastages in the potato value chain
Unit Harvest Off-seasonWastages during marketing and storageProducer before storage* % 2.4 2.4Cold storage** % 0.0 1.3Producer after storage* % 2.1 2.1Rural wholesaler***# % 0.7 0.7Urban wholesaler*** % 0.4 0.4Urban retailer*** % 2.4 2.4Total wastage post-harvest % 8.0 9.3If potatoes damaged, who bears losses? If losses less than 10%?
- Myself % 97- The owner of the cold storage % 2- Joint responsibil ity % 1
If potatoes damaged, who bears losses? If losses more than 10%?- Myself % 68- The owner of the cold storage % 29- Joint responsibil ity % 3
* wastage reported during marketing in last transaction* from farmer surveys; cold storage only;*** based on last transaction information# average of off-market and on-market rural wholesaler