Organization, differential expression and methylation of rDNA in artificial Solanum allopolyploids

Hindawi Publishing CorporationInternational Journal of Plant GenomicsVolume 2008, Article ID 926090, 18 pagesdoi:10.1155/2008/926090
Research ArticleA Solanum lycopersicum× Solanum pimpinellifoliumLinkage Map of Tomato Displaying GenomicLocations of R-Genes, RGAs, andCandidate Resistance/Defense-Response ESTs
Arun Sharma,1 Liping Zhang,2 David Nino-Liu,3 Hamid Ashrafi,4 and Majid R. Foolad5
1 Institute for Plant Genomics and Biotechnology, Texas A&M University, College Station, TX 77843, USA2 Nephrology Division, Department of Medicine, Baylor College of Medicine, Houston, TX 77030, USA3 Monsanto Canada Inc., 3-75 Scurfield Boulevard Winnipeg, Manitoba, Canada R3Y 1P64 Department of Plant Sciences, University of California-Davis, One Shields Avenue, Davis, CA 95616, USA5 Department of Horticulture, The Intercollege Graduate Degree Program in Genetics, The Pennsylvania State University,University Park, PA 16802, USA
Correspondence should be addressed to Majid R. Foolad, [email protected]
Received 29 July 2008; Accepted 20 October 2008
Recommended by Chunji Liu
We have identified an accession (LA2093) within the tomato wild species Solanum pimpinellifolium with many desirablecharacteristics, including biotic and abiotic stress tolerance and good fruit quality. To utilize the full genetic potential of LA2093 intomato breeding, we have developed a linkage map based on an F2 population of a cross between LA2093 and a tomato breedingline, using 115 RFLP, 94 EST, and 41 RGA markers. The map spanned 1002.4 cM of the 12 tomato chromosomes with an averagemarker distance of 4.0 cM. The length of the map and linear order of the markers were in good agreement with the published mapsof tomato. The ESTs were chosen based on their sequence similarities with known resistance or defense-response genes, signal-transduction factors, transcriptional regulators, and genes encoding pathogenesis-related proteins. Locations of several ESTs andRGAs coincided with locations of several known tomato resistance genes and quantitative resistance loci (QRLs), suggesting thatcandidate-gene approach may be effective in identifying and mapping new R genes. This map will be useful for marker-assistedexploitation of desirable traits in LA2093 and other S. pimpinellifolium accessions, and possibly for utilization of genetic variationwithin S. lycopersicum.
Copyright © 2008 Arun Sharma et al. This is an open access article distributed under the Creative Commons Attribution License,which permits unrestricted use, distribution, and reproduction in any medium, provided the original work is properly cited.
1. INTRODUCTION
The tomato Solanum species (Solanum subsection Lycop-ersicon) include the cultivated tomato, S. lycopersicum L.(formerly Lycopersicon esculentum Miller), and more than10 related wild species (http://www.sgn.cornell.edu/about/solanum nomenclature.pl). It is estimated that S. lycop-ersicum accounts for only about 5% of the total geneticvariability in the tomato gene pool [1]. Conversely, thetomato wild species bear a wealth of genetic variabilityfor many agriculturally and biologically important char-acteristics. During the past several decades, tomato wildspecies have been utilized extensively in traditional breedingprograms, however, mainly for improvement of simply
inherited traits such as vertical disease resistance. Geneticvariation in the wild species for complex traits such astolerance to environmental stresses, quantitative diseaseresistance, and fruit yield and quality has remained largelyunexploited [2]. This is mainly due to the inadequacy oftraditional breeding protocols to identify, select, and suc-cessfully transfer genes controlling such complex traits. Theidentification of genes underlying quantitative charactersis often difficult, particularly if their phenotypic effectsare unrecognizable from the phenotype [3]. Furthermore,transfer of desirable genes from wild species into elitebreeding lines is not without inherent difficulties. Uponinterspecific hybridization, a major task becomes eliminatingthe great bulk of undesirable exotic genes while maintaining

2 International Journal of Plant Genomics
and selecting for desirable characteristics. These limitations,however, may no longer be insurmountable with the adventof molecular biology tools such as genetic markers andmaps and marker-assisted selection (MAS). Among variousadvantages, molecular markers and maps can facilitatedetermination of the number, chromosomal location, andindividual and interactive effects of genes (or quantitativetrait loci (QTL)) that affect complex traits. Following theiridentification, desirable genes or QTLs can be introgressedinto the cultigen and undesirable characteristics eliminatedby foreground and background MAS.
During the past few decades, several molecular linkagemaps of tomato have been developed mainly based oninterspecific crosses between the cultivated and relatedwild species of tomato (for a complete list see Foolad2007). The first molecular linkage map of tomato waspublished in 1986, which included 18 isozyme and 94DNA markers [4]. The high-density linkage map oftomato, which originally was developed based on an F2
population of a S. lycopersicum × S. pennellii cross and1030 molecular markers [5], currently comprises morethan 2000 markers with intermarker spacing of ≤1 cM(http://www.sgn.cornell.edu/cview/map.pl?map id=9). Thehigh level of molecular marker polymorphism betweenS. lycopersicum and S. pennellii facilitated the developmentof this high-density map. With this genetic map, it is likelythat any gene of interest would be within one to a fewcentiMorgan (cM). However, many important agriculturaltraits are not segregating in this population and many of themarkers in this map are not polymorphic in other popula-tions of tomato, in particular those derived from intraspecificcrosses within the cultigen or between the cultigen andclosely related wild species such as S. pimpinellifolium L.(formerly L. pimpinellifolium (L.) Miller) and S. cheesmaniae(L. Riley) Fosberg (formerly L. cheesmaniae L. Riley). Forexample, it has been determined that only∼30% of the RFLPmarkers in the high-density map detect polymorphism inS. lycopersicum × S. pimpinellifolium populations followingdigestion of genomic DNAs with many restriction enzymes[6, 7]. In a more recent study, only less than 15% of the RFLPmarkers from the high-density map detected polymorphismbetween a Mexican accession of S. pimpinellifolium and aS. lycopersicum breeding line (MR Foolad et al., unpubl.).Such low levels of marker polymorphism necessitated thedevelopment of several species-specific molecular maps, aslisted elsewhere [2]. Among the different wild species oftomato, however, genetic maps developed based on crossesbetween the cultivated tomato and S. pimpinellifolium wouldbe more useful for practical purposes, as described below.
S. pimpinellifolium is the only red-fruited wild species oftomato and the only species from which natural introgres-sion into the cultivated tomato has been detected [8]. Inaddition, during the past several decades, extensive geneticintrogressions from this species into the cultivated tomatohave been made through plant breeding [8–10]. Accessionswithin S. pimpinellifolium are highly self-compatible andbidirectionally cross-compatible with the cultivated tomato.Because of the close phylogenetic relationships between thetwo species, there is little or no difficulty in initial crosses
or in subsequent generations of prebreeding and breedingactivities. Furthermore, S. pimpinellifolium harbors numer-ous desirable horticultural and agronomic characteristics,including disease resistance [11–13], abiotic stress tolerance[14, 15], and good fruit quality [2, 16], and much fewerundesirable traits than most other wild species of tomato.However, to utilize the full genetic potential of this species, itis necessary to detect molecular polymorphisms between thisspecies and the cultivated tomato. Detection or developmentof polymorphic markers, in particular functional markers(see below), and construction of new molecular linkagemaps based on desirable S. lycopersicum × S. pimpinelli-folium crosses are a step toward genetic exploitation of thisspecies. Furthermore, because of extensive introgressionsfrom S. pimpinellifolium into modern cultivars of tomato,such markers and maps will also be useful when exploitingthe available genetic variation within the cultigen.
Most of the previous genetic linkage maps of tomatowere constructed based on random genetic markers suchas RFLPs, RAPDs, AFLPs, and SSRs. Recently, however,DNA sequences based on expressed sequence tags (ESTs)and resistance gene analogs (RGAs) have become avail-able, which can be used to develop genetic markers andmaps or used as candidates to identify functional genes.Development of markers and maps based on informativesequences will be useful for identification and potentiallycloning of genes and QTLs of agricultural and biolog-ical significance. ESTs are generally derived from cDNAclones and may have applications in gene sighting, genomemapping, and identification of coding regions in genomicsequences. While ESTs can serve the same purposes asrandom DNA markers, they provide the additional fea-ture of pointing directly to expressed genes and thus canexpedite gene discovery and comparative genomics. Thegrowing EST databases in different plant species, includingtomato, have provided valuable resources for developmentof EST-based markers. The association of EST markerswith phenotypes can lead to a better understanding ofbiochemical pathways and mechanisms affecting impor-tant traits. Identification and characterization of RGAshas also been proposed as a candidate-gene approach toidentify genes potentially related to disease resistance [17–21]. Although not all amplified products may correspondto functional disease resistance genes [21], RGA primershave been shown to amplify the conserved sequences ofleucine-rich repeats (LRR), nucleotide-binding sites (NBS),or serine/threonine protein kinases (PtoKin), thereby tar-geting genes and gene families for disease resistance,defense response, or other important signal transductionprocesses [22]. Thus, RGAs have been considered usefulnot only as genetic markers but also as potential thatleads to the identification of important genes. Duringthe past decade, RGAs have been used for mapping ofQTLs for many important characters, including diseaseresistance.
Recently, we identified several accessions of S. pimpinelli-folium (including LA2093) with desirable horticultural char-acteristics such as disease resistance, abiotic stress tolerance,and good fruit quality. To facilitate genetic characterization

Arun Sharma et al. 3
and exploitation of LA2093, and possibly other accessions,we have developed a genetic linkage map based on an F2
population of a cross between LA2093 and tomato breedingline NCEBR-1 using 250 DNA markers, including RFLPs,ESTs, and RGAs. Previously, two molecular linkage maps oftomato based on different crosses between S. lycopersicum(denoted as L) and S. pimpinellifolium (denoted as PM)were reported by Grandillo and Tanksley [6] (referred toas L × PM1 map) and Chen and Foolad [7] (referred toas L × PM2 map). The map presented here (referred to asL × PM3) is different but complementary to the previoustwo L × PM maps, as it contains a large number of ESTs andRGAs along with some new RFLP anchor markers that canfacilitate molecular investigation and exploitation of this andother accessions of S. pimpinellifolium. We have comparedthe L × PM3 map with other molecular linkage maps oftomato and discussed similarities and differences in relationto phylogenetic relationships between parents of the variousmapping populations.
2. MATERIALS AND METHODS
2.1. Plant materials and mapping population
Inbred sources of NCEBR-1 (S. lycopersicum) and LA2093 (S.pimpinellifolium) were hybridized and F1 progeny produced.NCEBR-1 (PVP) is a horticulturally superior, multiple dis-ease resistant, advanced tomato breeding line received fromRG Gardner, University of North Carolina, Fletcher, NC,USA. A single F1 hybrid plant was self-fertilized to produceF2 seed. A total of 900 F2 individuals were grown under fieldconditions and screened for various characteristics. Amongother traits, the population was segregating for growth habit(determinate versus indeterminate). Indeterminate growthhabit is an undesirable characteristic with confoundingeffects on other characteristics such as disease resistanceand fruit quality. To obtain a population suitable for QTLmapping and breeding purposes, indeterminate plants wereeliminated. A total of 172 F2 individuals, hereafter referredto as the L × PM3 F2 population, were chosen and grown tomaturity and used to construct the molecular linkage map.
2.2. RFLP analysis
Nuclear DNA was extracted from approximately 10 g of leaftissue from each of the parental lines and F2 individualsusing standard protocols for tomato [23, 24]. GenomicDNAs were treated with RNase and digested with eightrestriction enzymes, including DraI, EcoRI, EcoRV, HaeIII,HindIII, RsaI, Sca1, and Xba1 following manufacturers’instructions, and parental polymorphism survey blots wereprepared. To identify sufficient number of polymorphicanchor RFLP markers to develop a framework linkagemap, parental survey blots were probed with a total of340 random tomato genomic (TG) or cDNA (CD or CT)clones, originally chosen from the high-density molecularlinkage map of tomato [25]. Agarose gel electrophoresis,Southern blotting, hybridizations, and autoradiography wereconducted as described elsewhere [26]. Probes were labeled
with [32P]dCTP by primer extension [27]. Following iden-tification of polymorphic RFLP markers (see Section 3 forrates of polymorphism), genomic DNAs of the 172 F2
individuals were digested with the 8 restriction enzymes andmultiple sets of Southern blots were prepared. Blots werehybridized with clones detecting polymorphism and a totalof 115 RFLP markers were scored in the F2 population.
2.3. EST analysis
A set of unique ESTs was selected from the tomato geneindex sources maintained by The Institute for GenomicResearch (TIGR; http://www.tigr.org/) (now at the Com-putational Biology and Functional Genomics Laboratoryat Harvard University; http://compbio.dfci.harvard.edu/tgi/cgi-bin/tgi/est report.pl). Each EST represents a valid(partial or complete) copy of a transcribed functional allele.We selected 140 ESTs from a diverse array of candidate genesand gene families, many of which are known or assumed toplay roles in disease-resistance or defense-response mecha-nisms. Among them we included ESTs with homology toresistance (R) genes, signal transduction genes, transcrip-tional regulator factors, and genes encoding pathogenesis-related proteins. We used this targeted strategy to obtaina set of potentially functional markers for marker-assistedselection in our tomato-breeding program. The 140 ESTclones, purchased from the Clemson University GenomicsInstitute (http://www.genome.clemson.edu/), Clemson, SC,USA, were used as RFLP probes to identify polymorphismbetween the two parents. Among them, 96 provided poly-morphic alleles (Table 1). The polymorphic ESTs were usedas RFLP probes to genotype the F2 individuals, examine theirsegregation, and map onto the tomato chromosomes.
2.4. RGA analysis
2.4.1. Selection of primers
Ten pairs of oligonucleotide primers, previously designedbased on conserved LRR, NBS, and PtoKin motifs of severalresistance genes, were used (Table 2; [28]). Some primerswere chosen to be degenerate at the redundant third position(3′ end) in the codons to cover a range of possible sequencesencoding the motifs, and thus to increase the efficiency ofPCR amplification [19, 29]. Only one pair of primers wasused for each PCR amplification.
2.4.2. PCR amplification
PCR conditions for amplification of RGAs were describedelsewhere [11]. Briefly, each amplification was performedin a 25-μL volume consisting of 300 μM each of dATP,dCTP, dGTP, and dTTP, 5 mM of MgCl2, 1 unit of TaqDNA polymerase, 2.5 μL of 10X buffer (PCR Core systemI; Promega, Madison, Wis, USA), 2 μL of each primer, and40 ng of genomic DNA that was used as template. For controlreactions, the template was substituted with sterile, nuclease-free ddH2O. All PCR mixtures were overlaid with mineraloil and carried out in a Perkin Elmer DNA Thermal Cycler

4 International Journal of Plant Genomics
Table 1: Listof ESTs mapped in the Solanum lycopersicum × S. pimpinellifolium F2 population, their putative function, chromosomallocation, and copy number.
EST clone aSGN-ID bPutative function Chr. cCopy no.
cTOF3A14 C146883 Cytosolic Cu, Zn Superoxide dismutase, S. lycopersicum 1 2
cTOE7J7a C139397 Endo-1,4-beta-glucanase, S. lycopersicum 1 6
cLED27E12 C19568 Cold acclimation protein WCOR413-like protein form, O. sativa 1 2
cTOE6F10 C139034 Lipoxygenase, S. lycopersicum 1 5
cLEG9N2 C45935 Subunit A of ferredoxin-thioredoxin reductase, S. tuberosum 1 1
cLES9N20 C79709 ASC1 (Alternaria stem canker resistance protein), S. lycopersicum 1 1
cLEC6O2 C11013 Polyamine oxidase, A. thaliana 1 1
cTOF20P4 C142906 Carotenoid cleavage dioxygenase 1-2, S. lycopersicum 1 5
cLEZ11K12 C98684 Snakin2 precursor, S. lycopersicum 1 1
cTOA9E13 C117653 Squalene synthase, C. annuum 1 5
cTOA9C11 C117644 Similar to WRKY transcription factor Nt-SubD48, N. tabacum 2 1
cLET10E15 C79822 Acidic 26kDa endochitinase precursor, S. lycopersicum 2 1
cTOF19J9 C142319 Phosphoribosylanthranilate isomerase, A. thaliana 2 1
cLEY1K9 C97179 Pathogen-inducible alpha-dioxygenase, N. attenuata 2 4
cLEW11E20 C89000 Resistance complex protein I2C-3, S. lycopersicum 2 7
cTOF16A9 C141311 Calmodulin 3 protein, S. lycopersicum 3 9
cLER17H16 C71298 Elicitor-inducible cytochrome P450, N. tabacum 3 1
cTOF18P1 C142154 Serine palmitoyltransferase, S. tuberosum 3 3
cLEX12O16 C92852 Ethylene response factor 5, S. lycopersicum 3 6
cTOE2F15 C137984 Catalase isozyme 1, S. lycopersicum 3 1
cTOF29J22 C145412 4-coumarate-coA ligase 1, S. tuberosum 3 2
cLEX10F20 C92172 Ethylene response factor 1, S. lycopersicum 3 4
cTOF14B17 C141010 Anthocyanin 5-O-glucosyltransferase, S. sogarandinum 4 1
cLED15E5 C16128 Shikimate kinase chloroplast precursor, S. lycopersicum 4 1
cLEN13D5 C66215 Chorismate synthase 1 precursor, S. lycopersicum 4 4
cTOS21D12 C163577 Similar to heat shock factor, N. tabacum 4 3
cTOF10N11 C140057 Myo-inositol-1-phosphate synthase, S. lycopersicum 4 4/5
cLEW24M21 C90911 TMV disease resistance protein-like protein, Cicer arietinum 4 2
cLEW22D11b C90352 4-coumarate:coenzyme A ligase, N. tabacum 4 10
cLER5E19 C73560 Phospholipase PLDb1, S. lycopersicum 5 1
cTOC2J14a C127676 Disease resistance gene homolog Mi-copy1, S. lycopersicum 5 9
cTOC2J14b C127676 Disease resistance gene homolog Mi-copy1, S. lycopersicum 5 9
cTOF26E9 C144413 Prf, S. pimpinellifolium 5 2
cTOE1K1 C136851 Spermidine synthase, S. lycopersicum 5 4
cTOE7J7b C139397 Endo-1,4-beta-glucanase, S. lycopersicum 5 6
cTOF29B13 C145236 Metallothionein-like protein type 2 a, S. lycopersicum 5 2
cTOF33C3 C146601 Serine/threonine protein kinase Pto, S. lycopersicum 5 10
cTOF23J19 C143585 Heat shock protein 90, S. lycopersicum 5 4
cLEG32E10 C34795 Lipoxygenase B, S. lycopersicum 6 6
cTOF8F19 C148467 Ascorbate peroxidase, S. lycopersicum 6 2
cLEZ16H16 C99197 Contains similarity to disease resistance response protein, Pisum sativum 6 1
cLED11A2 C15134 Mitogen-activated protein (MAP) kinase 3, C. annuum 6 2
cLEW22D11a C90352 4-coumarate:coenzyme A ligase, N. Tabacum 6 10
cLEY21L21 C97473 Disease resistance gene homolog Mi-copy1, S. lycopersicum 6 6
cLEW22N22 C90504 Ethylene-responsive element binding factor 6-N. sylvestris 6 3
cTOF34C13 C146804 Peroxiredoxin Q-like protein, A. thaliana 7 1
cLEN14F9 C66474 Sucrose-phosphate synthase, S. lycopersicum 7 1
cTOF21F12 C142982 Dehydroquinate dehydratase/shikimate, NADP oxidoreductase, S. lycopersicum 7 9
cLEN13G22 C66246 1-aminocyclopropane-1-carboxylate oxidase, S. lycopersicum 7 4
cLEY22L20 C97674 Peroxidase precursor, S. lycopersicum 7 3

Arun Sharma et al. 5
Table 1: Continued.
EST clone aSGN-ID bPutative function Chr. cCopy no.
cTOE15M9 C136013 MYB-related transcription factor VlMYBB1-1, Vitis labrusca × V. vinifera 7 6
cLEG34O20 C35423 UDP-glucose:salicylic acid glucosyltransferase, N. tabacum 7 4
cLEN14C8 C66419 PR-related protein, PR P23 (salt-induced protein), S. lycopersicum 8 3
cTOF9D16 C148734 Pathogenesis-related protein 5-1, S. lycopersicum 8 1
cTOF28D12 C144993 Polyphenol oxidase E, chloroplast precursor, S. lycopersicum 8 7
cLEN10H3 C65539 Heat shock factor protein HSF8 (Heat shock transcription factor 8), S. lycopersicum 8 2
cLEI16E21 C47449 Cold-induced glucosyl transferase, S. lycopersicum 8 3
cTOF2N15 C145786 Osmotin-like protein OSML13 precursor (PA13), S. lycopersicum 8 3
cTOE23J12 C137767 Monodehydroascorbate reductase, S. lycopersicum 8 3
cLED27C20 C19537 DNADPH oxidase; gp91-phox homolog, S. lycopersicum 8 1
cLER14J12 C70373 WRKY transcription factor IId-1 splice variant 2, S. lycopersicum 8 1
cTOF2L16 C145747 Phenylalanine ammonia-lyase (PAL), S. lycopersicum 8 1
cTOD3N7 C132799 Endo-1,4-beta-glucanase, S. lycopersicum 8 2
cLEX11E19 C92435 Putative NADH-ubiquinone oxireductase, A. thaliana 9 1
cTOE10J18 C134749 PR protein sth-2, S. Tuberosum 9 3
cLEC13E21 C1592 P14 (PR-Protein), S. lycopersicum 9 3
cLEC6M14 C10964 PR-protein sth-2, S. Tuberosum 9 5
cLER14J6 C70387 Hexose transporter, S. lycopersicum 9 1
cTOF19O3 C142383 Hydroxyproline-rich glycoprotein homolog, A. thaliana 9 3
cLEZ6E21b C100278 Ubiquitin, S. lycopersicum 10 4/5
cLED18G6 C17041 Similar to WRKY-like drought-induced protein, Retama raetam 10 6
cTOD4I20 C133021 Tyrosine aminotransferase, A. thaliana 10 2
cLHT11J12 C100975 Diacylglycerol kinase, S. lycopersicum 10 2
cLER4F5 C73337 Ferredoxin-I chloroplast precursor S. lycopersicum 10 4
cTOF30K21 C146034 Chloroplast ferredoxin I, S. lycopersicum 10 >10
cTOF22M16 C143336 NADH-ubiquinone oxidoreductase 23 kDa subunit, S. lycopersicum 10 1
cLEN14K6 C66563 Multiresistance protein homolog, A. thaliana 10 3/2
cLEX10N16 C92314 PR protein, S. lycopersicum 10 >10
cLEC18O1 C3034 Basic 30kDa endochitinase precursor, S. lycopersicum 10 >10
cTOF31H10 C146231 Catechol O-methyltransferase, N. tabacum 10 8
cLEN9P2 C69374 Multiresistance protein homolog, A. thaliana 10 2
cLED13I7 C15652 Resistance complex protein I2C-1, S. lycopersicum 11 7
cTOF28I23 C145097 Resistance complex protein I2C-5, S. pimpinellifolium 11 >10
cLEZ6E21a C100278 Ubiquitin, S. lycopersicum 11 4/5
cTOF29F6b C145330 10-hydroxygeraniol oxidoreductase, -S. lycopersicum 11 7
cLEC14I18a C1998 Resistance complex protein I2C-2, S. lycopersicum 11 >10
cLEC14I18b C1998 Resistance complex protein I2C-2, S. lycopersicum 11 >10
cLEM22K17 C62708 9-cis-epoxycarotenoid dioxygenase, S. lycopersicum 11 7
cLED23K21 C18512 Resistance complex protein I2C-5, S. lycopersicum 11 >10
cLES18N16 C76694 Phosphatidylinositol 4-kinase, S. tuberosum 11 2
cTOS21D14 C163579 WRKY transcription factor IId-2, S. lycopersicum 12 1
cLPT1G11 C109877 S-adenosyl-l-homocysteine hydrolase, S. lycopersicum 12 4
cLEZ15E8 C98979 Extensin class I, S. Lycopersicum 12 >10
cLEW25D9 C90989 Glutamine synthetase, S. lycopersicum 12 3aSolanaceae Genome Network (SGN) can be accessed at http://www.sgn.cornell.edu/.bThe putative function of each EST has been derived from Computational Biology and Functional Genomics Laboratory web site (http://compbio.dfci.harvard.edu/tgi/cgi-bin/tgi/est report.pl), used to be maintained at The Institute for Genomic Research (TIGR). (Computational Biology and FunctionalGenomics Laboratory).cThe exact or approximate copy number of ESTs in tomato genome was determined based on the number of hybridized bands on Southern blot gels and maybe varied in different labs. Where there is a “/” sign, the figures in the left side denote the number of copies in S. lycopersicum parent and those in the right sidedenote the number of copies in S. pimpinellifolium parent.
6 International Journal of Plant Genomics
Table 2: Oligonucleotide primers designed based on the conserved amino acid sequences within the LRR, NBS, and Pto protein domainsencoded by various R-genes.
Group Primers Sequences (5′-3′)a Design basis References
LRR
CLRR for TTTTCGTGTTCAACGACG LRR domain of the tomato Cf -9 geneconferring resistance to Cladosporiumfulvum
[30]
CLRR rev TAACGTCTATCGACTTCT
NLRR for TAGGGCCTCTTGCATCGT LRR domain of the tobacco N geneconferring resistance to TMVNLRR rev TATAAAAAGTGCCGGACT
RLRR for CGCAACCACTAGAGTAAC LRR domain in the RPS2 gene conferringresistance to Pseudomonas syringae inArabidopsis
RLRR rev ACACTGGTCCATGAGGTT
XLRR for CCGTTGGACAGGAAGGAG LRR domain of the rice Xa21 geneconferring resistance to Xanthomonascampestris pv oryzae
XLRR rev CCCATAGACCGGACTGTT
NBS
ANo. 2 TATAGCGGCCGCIARIGCIARIGGIARNCC Conserved P-loop and hydrophobic NBSregions of the N and RPS2 genes fromtobacco and Arabidopsis respectively
[29]ANo. 3 ATATGCGGCCGCGGIGGIGTIGGIAARACNAC
S1 GGTGGGGTTGGGAAGACAACG Hydrophobic domain and P-loop ofconserved NBSs from the N and RPS2 genesfrom Arabidopsis and the L6 gene from flaxconferring resistance to rust
[18, 31]S2 GGIGGIGTIGGIAAIACIAC
AS1 CAACGCTAGTGGCAATCC
AS3 IAGIGCIAGIGGIAGICC
PtoKin
Ptokin1 GCATTGGAACAAGGTGAA Serine/threonine protein kinase domain ofthe Pto gene conferring resistance to thebacterial pathogen Pseudomonas syringae pvtomato in tomato
[30]Ptokin2 AGGGGGACCACCACGTAG
Ptokin3 TAGTTCGGACGTTTACAT
Ptokin4 AGTGTCTTGTAGGGTATC
RLK for GAYGTNAARCCIGARAA Serine/threonine kinase sequencesubdomains of the wheat Lr10 geneconferring resistance to Puccinia recondita
[20]RLK rev TCYGGYGCRATRTANCCNGGITGICC
aCode for mixed bases: D = A/G/T; I = Inosine; N = A/G/C/T; R = A/G; Y = C/T.
480 (Perkin Elmer, Foster City, Calif, USA), programmedfor 4 minutes at 94◦C for an initial denaturation, and 36cycles of 1 minute at 94◦C (DNA denaturation), 1 minute at50◦C (primer annealing), and 1.5 minutes at 72◦C (primerextension), followed by a final 7-minute extension at 72◦C.
2.4.3. Gel electrophoresis and silver staining
Denaturing polyacrylamide gel electrophoresis (PAGE)was used to separate and detect individual RGA bands[30]. Briefly, a denaturing gel (7 M Urea—6% poly-acrylamide) was prepared in a sequencing gel apparatus(420 × 330 × 0.4 mm; Fisher Biotech, Springfield, NJ, USA)using Bind- and Repel-Silane (Promega). After polymer-ization, the gel was prerun in 1X Tris-borate-EDTA (TBE)buffer for 30 minutes at 40 W (∼1400 V) to reach a geltemperature of 50◦C. Twelve μL of loading buffer (10 MUrea—0.08% xylene cyanole) were added to each 25 μLamplified DNA sample and the mixture was denatured at95◦C for 5 minutes and immediately put on ice. Aftercleaning the gel-loading surface, a 0.4 mm-thick shark comb(Fisher Biotech, Springfield, NJ, USA) was inserted into thegel. Subsequently, 7 μL of each PCR-amplified sample were
loaded. Each gel accommodated 60 DNA samples and threeDNA size markers (1 Kb, 100 bp, 50 bp). The gel was runat 35 W (∼1350 V) for 3.5–4 hours. After electrophoresis,the gel, fixed to the Bind-Silane surface of one glass plate,was silver stained following the manufacturer’s protocol(Promega). The gel was air dried at room temperatureovernight and stored in dark for future scoring and scanning.All amplifications and gel electrophoresis procedures wererepeated at least once.
2.4.4. Identification of informative RGA markers
Following gel electrophoresis and staining, polymorphic andmonomorphic bands were observed. Polymorphic bandswere directly scored as dominant markers and used forgenetic mapping. To determine whether monomorphicbands could detect polymorphism if used as RFLP probes,they were excised from the gel (as described in [28, 32]),purified with the QIAgene quick Gel Extraction Kit (QIA-GEN, Valencia, Calif, USA), labeled with 32P-dCTP, and usedto hybridize the parental survey blots. Probes which detectedpolymorphism between the two parents were then used tohybridize Southern blots of the F2 population, and scored as
Arun Sharma et al. 7
either dominant or codominant markers. Overall, a total of43 RGA markers were successfully scored and mapped ontothe 12 tomato chromosomes.
2.4.5. Size determination of RGA fragments
PAGE polymorphic and monomorphic fragments wereexcised from the dried polyacrylamide gel and reamplified,by using a needle scratching and PCR reamplificationmethod [32]. The reamplified products and DNA size mark-ers (1 Kb, 100 bp, and 50 bp) were run on a 1.0% agarosegel, stained with ethidium bromide, and photographed todetermine the size.
2.5. Statistical and mapping analyses
Segregation of the 250 DNA markers (115 RFLPs, 94 ESTs,and 41 RGAs) in the F2 population was tested for deviationfrom the expected Mendelian genotypic ratios of 1 : 2 : 1(for codominant) or 1 : 1 (for dominant markers) usingchi-square (χ2) goodness-of-fit analysis. Multipoint linkageanalysis of the genetic markers in the F2 population wasperformed using the MapMaker program v. 3.0 [33] and agenetic linkage map was constructed. Briefly, the group com-mand was used to assign markers into linkage groups using aminimum LOD score of 3.0 and a maximum recombinationfraction of 0.20. Three-point linkage analysis was performedto determine the maximum likelihood recombination frac-tion and the associated LOD score for each combination ofloci. The “order” and “compare” commands were used tofind the best order of loci within each group, followed byusing the “ripple” command to verify the order. Markerswere included within the framework map only if the LODvalue for the ripple was greater than 3.0. Once the linearorder of markers along each chromosome was determined,recombination frequencies between markers were estimatedwith multipoint linkage analyses. The Kosambi mappingfunction [34] was used to convert recombination frequenciesto map distances in cM. The distribution of percentage ofthe S. lycopersicum genome (L) in the F2 population wasestimated using the computer program Qgene [35].
3. RESULTS AND DISCUSSION
3.1. RFLP polymorphism between S. lycopersicumand S. pimpinellifolium
RFLP clones were chosen from two sources, a previouslypublished S. lycopersicum (NC84173) × S. pimpinellifolium(LA722) linkage map (L × PM2) [7] and the high-densityS. lycopersicum (VF36 -Tm2a) × S. pennellii (LA716) linkagemap of tomato (L × P) [25]. Of the 152 RFLP cloneschosen from the L × PM2 map, 82 (54%) were polymorphicbetween the two parents (NCEBR-1 and LA2093) in thepresent study. Of the 120 clones that were chosen based onthe high-density L × P map, 40 (30%) were polymorphicbetween NCEBR-1 and LA2093. The latter level of polymor-phism was similar to those previously reported by Grandilloand Tanksley [6] and Chen and Foolad [7] for different
S. lycopersicum × S. pimpinellifolium crosses. A lower levelof DNA polymorphism between S. lycopersicum and S.pimpinellifolium compared to that between S. lycopersicumand S. pennellii was expected as S. pimpinellifolium isphylogenetically much closer to the cultivated tomato [1,36, 37]. The high-density map of tomato was constructedbased on A S. lycopersicum × S. pennellii cross mainlybecause of the presence of high level of marker polymor-phism between the two species. However, identification ofpolymorphic markers and development of maps based S.lycopersicum × S. pimpinellifolium crosses are essential tofacilitate marker-assisted exploitation of genetic variationpresent in S. pimpinellifolium. Such information may alsobe useful for exploitation of intraspecific variation within S.lycopersicum. This is because of frequent introgressions fromS. pimpinellifolium into the cultivated tomato,which haveoccurred both naturally and deliberately via plant breeding[8]. In the present study, a total of 117 polymorphic RFLPclones were used to construct the backbone linkage map.
3.2. EST polymorphism between S. lycopersicumand S. pimpinellifolium
From a total of 140 tomato ESTs examined, 91 (65%)were polymorphic between the two parents. Five of 91 ESTclones produced more than one polymorphic band, thusresulting in the detection of a total of 96 polymorphic ESTloci, including 91 codominant (sim95%) and 5 dominantmarkers. Of the 96 EST markers, 94 were successfully scoredin the F2 population and mapped onto the 12 tomatochromosomes using the 115 RFLP anchor markers. Thenumber of EST markers per chromosome ranged from4 (on chr. 12) to 12 (on chr. 10). Observation of ahigh level of polymorphism in EST markers between S.lycopersicum and S. pimpinellifolium was unexpected, butencouraging. This high level of polymorphism could bedue to various reasons including high copy number of ESTbands (compared to the often single-copy RFLP markers)and the nature of the genes or gene families from whichESTs were selected. As indicated earlier, most ESTs werechosen based on their sequence similarities with genesor proteins related to disease resistance. It is likely thatchromosomal regions containing resistance gene familiesaccumulate a great deal of variation during their evolution,thus increasing the frequency of restriction sites, which are abasis for polymorphism. Because modern breeding lines havereceived frequent introgressions from different tomato wildspecies, in particular for disease resistance, presence of suchintrogressions in NCEBR-1 could have contributed to thehigh level of observed polymorphism. Further inspections ofthe chromosomal locations of ESTs support this submission,as discussed below. However, the observation of high level ofEST polymorphism is promising as larger number of ESTsare becoming available.
3.3. Marker segregation
Of the 250 marker loci scored in the L × PM3 F2 population,41 (16.4%) exhibited significant deviation from the expected

8 International Journal of Plant Genomics
1 : 2 : 1 (codominant) or 1 : 1 (dominant) segregation ratiosat P ≤ .01. Markers with skewed segregation were located onchromosomes 1, 3, 4, 5, and 6, with those on chromosome6 exhibiting the highest level of skewness (Table 3). Markerson chromosomes 1, 3, and 4 exhibited distortion in favorof S. pimpinellifolium alleles whereas those on chromosomes5 and 6 were in favor of S. lycopersicum. Observation ofextensive segregation distortion for markers on chromosome6 was not unexpected and could be attributed to the selectionof determinate F2 plants (as described in Section 2) andthe presence of self-pruning (sp) locus on this chromosome(∼3 cM from RFLP marker TG279) [6]. Skewed segregationfor markers on this chromosome was previously reportedin other interspecific crosses of tomato, where phenotypicselection (PS) or MAS was employed to remove indetermi-nate plants from mapping populations [28, 38, 39]. However,in the present study, despite skewed segregation for markerson chromosome 6, no major differences in genetic mapdistances were observed when they were compared withthe high-density map of tomato [39] or the previous S.lycopersicum × S. pimpinellifolium maps [6, 7], where nosuch selections were practiced.
Skewed segregation has been reported in many inter-specific crosses of tomato, with the extent of skewnessbeing greater in wider crosses compared to crosses betweenclosely related species, and also generally greater in F2 thanin backcross populations [6, 40–45]. A survey of recentlypublished results of interspecific crosses of tomato indicatedthat skewed segregation was 8.3% in the L × PM1 BC1
population [6], 9.9% in the L × PM2 BC1 population [7],51% in a S. lycopersicum × S. cheesmaniae (L × CH) F2
population [42], 69% in a S. lycopersicum × S. chmielewskii(L × CL) BC1 population [46], 15% in a S. lycopersicum × S.habrochaites (L × H1) BC1 population [38], 62% in theL × H2 BC1 population [28], and 80% in a S. lycop-ersicum × S. pennellii (L × P) F2 population [47]. TheL × PM populations exhibited less overall skewed segre-gation than the other interspecific crosses, consistent withthe close phylogenetic relationship between S. lycopersicumand S. pimpinellifolium. However, the relatively high levelof skewed segregation in the L × CH F2 population [42]and the low level of skewed segregation in the L × H1 BC1
populations [38] were unordinary because S. cheesmaniae isa closely related and S. habrochaites is a distantly related wildspecies of tomato [1, 9, 10, 48, 49]. Skewed segregation ininterspecific crosses of tomato has been attributed to variouscauses, including self-incompatibility (SI), unilateral incon-gruity, and gametophytic, zygotic, and viability selectionin segregating populations, as discussed elsewhere [44, 50–52].
3.4. Genome composition of the F2 population
The genomic compositions of the 172 F2 individualswere determined based on the 220 codominant markersusing qgene program. On average, the F2 population wasinferred to contain 51.5% of its genome from the S.lycopersicum parent (L alleles), which is very close to
60
50
40
30
20
10
0
Freq
uen
cy
Min =41.4%
Mean=51.5%
Max =98.1%
43 46 49 52 55 58 61 64 100
Percent S. lycopersicum genome-F2 population
Figure 1: Distribution of percent Solanum lycopersicum genome inthe F2 population, estimated based on 220 codominant markers.
the expected 50%. The percent L genome of individ-ual F2 plants ranged from 41.4% to 97.8% (Figure 1),indicating the high level of variation in the F2 popu-lation. This analysis clearly demonstrates the power ofmarker genotyping for precise determination of the genomiccomposition of individual plants in breeding populations.Such information can facilitate the selection of suitableplants and introgression of desirable and elimination ofundesirable chromosomal segments in genetic populationsderived via backcross breeding. For example, in the presentpopulation, individuals with ≥65% L genome (Figure 1)could be returned to nearly 100% L genome within 2–4 backcrosses, far more rapid than the 4–6 backcrossesroutinely needed to eliminate donor genome without MAS.Alternatively, in a pedigree-type breeding program, markeranalysis (if economically feasible) can facilitate inbreedingto homozygosity by selecting progeny at each generationwhich are homozygous over a maximal proportion of thegenome.
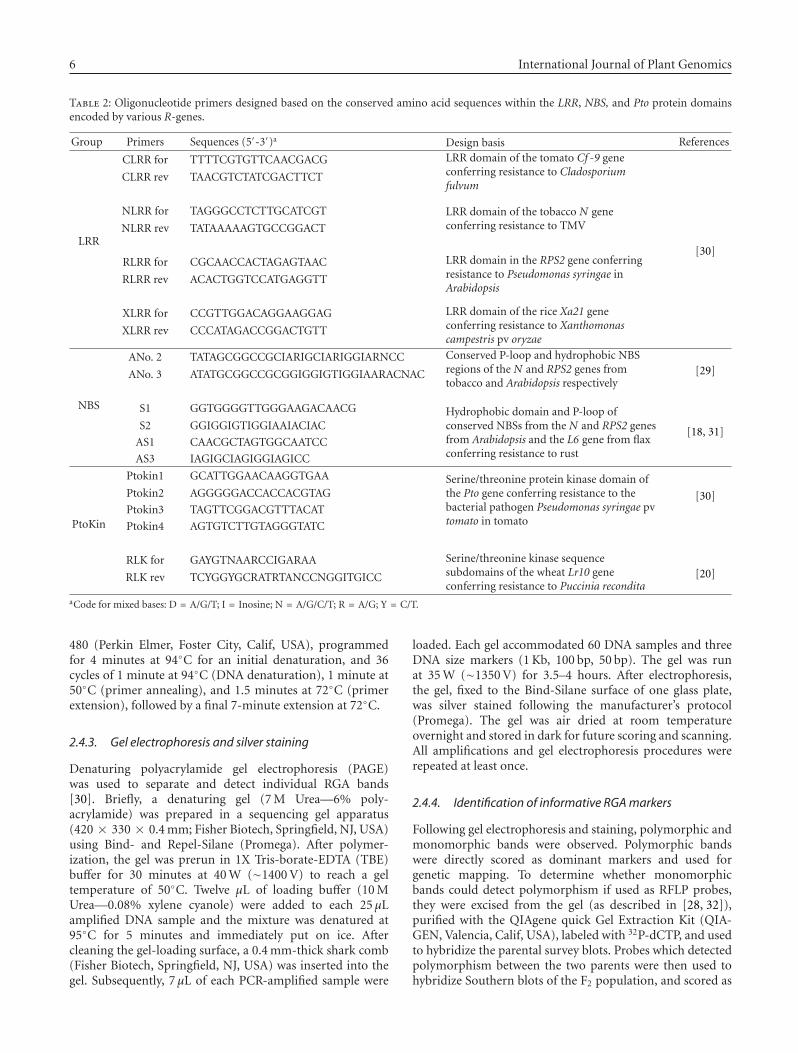
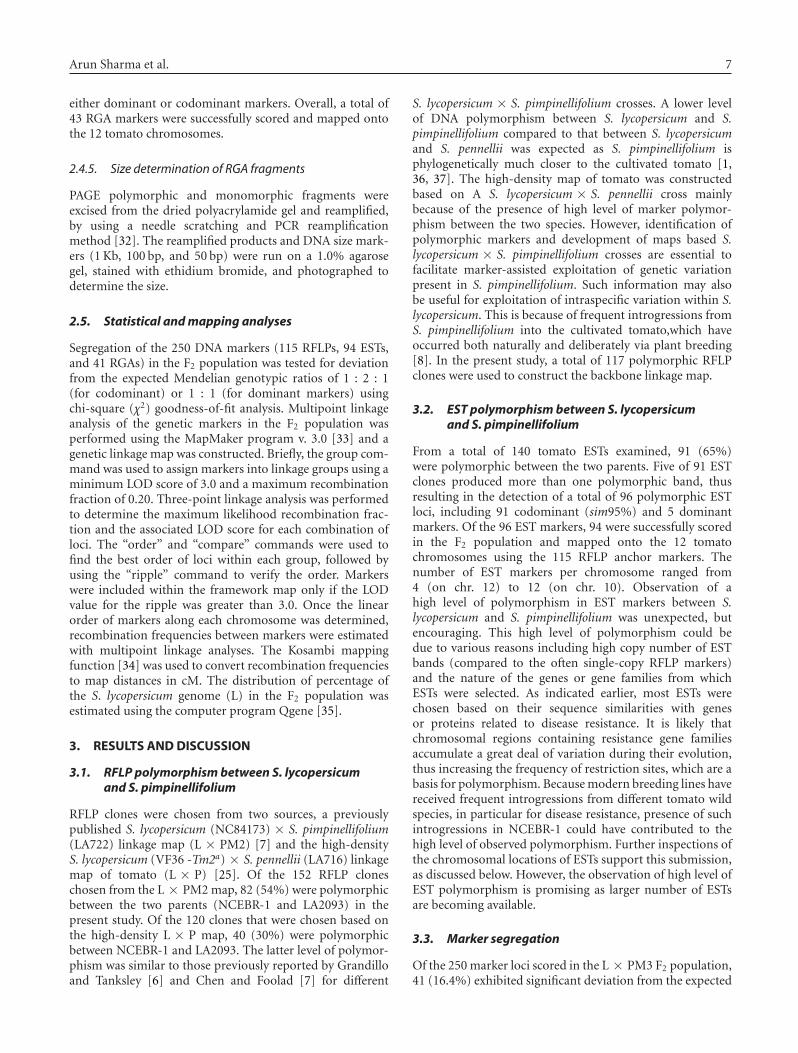
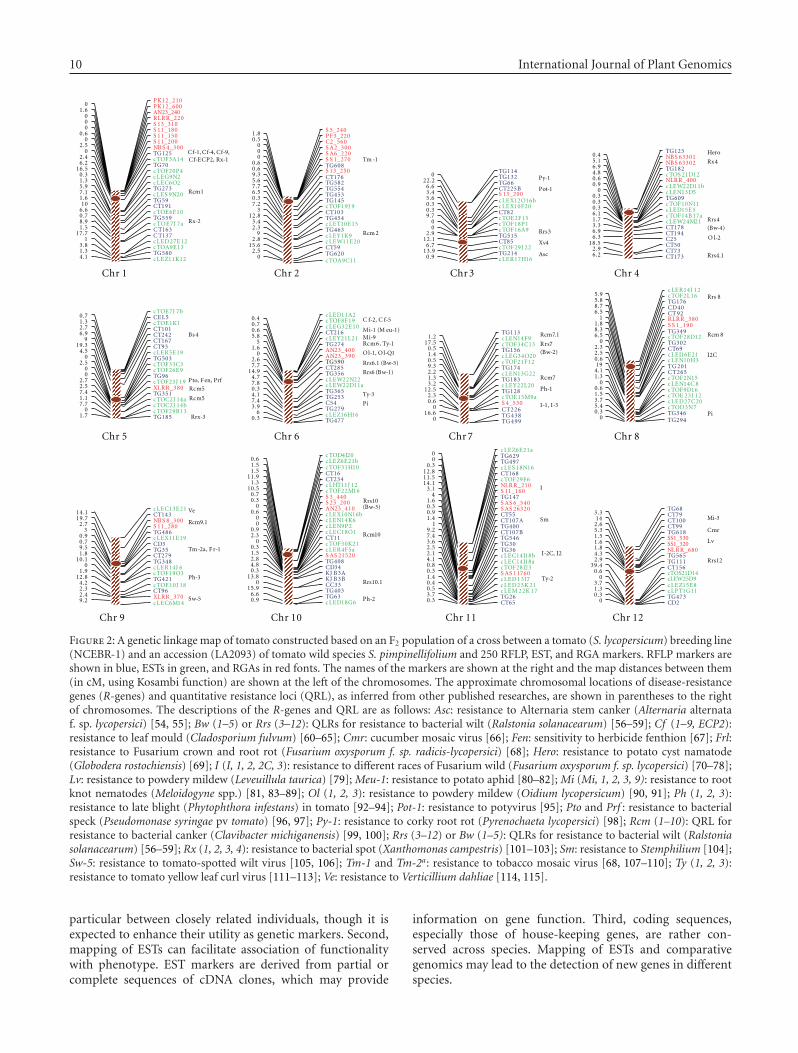
3.5. Construction of the linkage map
A genetic linkage map was constructed based on 115 RFLP,94 EST, and 41 RGA loci using the F2 population of 172individuals. The present map (L × PM3) spanned 1002.4 cMof tomato genome with an average marker interval length of4.0 cM (Figure 2). The number of markers per chromosomeranged from 16 (chrs. 3 and 7) to 28 (chr. 1). Chromosome1 had the largest linkage group (102.9 cM) followed bychromosomes 9 and 2 (96.1 and 92.6 cM, resp.), whereaschromosome 7 had the smallest one (69.8 cM), precededby chromosomes 4 and 5 (72.2 and 70.6 cM, resp.). Onlytwo regions, on chromosomes 3 and 12, contained markerintervals larger than 20 cM (Figure 2), and this was mainlybecause of the low level of polymorphism between the twoparents of this mapping population for markers on thesechromosomes. This map was compared with several othermolecular linkage maps of tomato for marker order, recom-bination frequencies, and total map length, as describedbelow.

Arun Sharma et al. 9
Table 3: Significant deviations from the expected 3 : 1 and 1 : 1 ratios in the Solanum lycopersicum × S. pimpinellifolium F2 population (L:lycopersicum allele, PM: pimpinellifolium allele).
Locus ChromosomeGenotype
L/L L/PM PM/PM PM/− L/− χ2∗
AN23 240 1 16 0 0 141 0 18.36
S13 310 1 16 0 0 139 0 17.81
S11 180 1 16 0 0 140 0 18.09
S11 150 1 17 0 0 139 0 16.55
S11 200 1 17 0 0 139 0 16.55
NBS4 300 1 18 78 40 0 0 10.06
TG125 1 18 84 43 0 0 12.27
cTOF3A14 1 20 91 43 0 0 11.96
TG132 3 28 85 57 0 0 9.89
TG66 3 22 90 44 0 0 9.90
CT225B 3 15 91 34 0 0 17.76
cLEX10F20 3 24 97 36 0 0 10.55
CT82 3 24 98 38 0 0 10.55
cLER17H16 3 56 69 32 0 0 9.64
cLEW24M21 4 36 63 55 0 0 9.78
CT178 4 35 74 60 0 0 10.01
C25 4 35 67 56 0 0 9.23
CT73 4 42 67 58 0 0 9.59
CT93 5 51 98 17 0 0 19.35
cLER5E19 5 0 0 16 0 138 17.53
TG503 5 50 87 17 0 0 16.74
cTOF33C3 5 45 86 14 0 0 18.28
cTOF26E9 5 51 100 16 0 0 21.19
TG96 5 50 79 14 0 0 19.70
cTOF23J19 5 35 82 13 0 0 16.34
XLRR380 5 0 0 14 0 143 21.66
TG351 5 44 87 18 0 0 13.27
cTOC2J14a 5 34 99 12 0 0 26.05
cTOC2J14b 5 59 79 13 0 0 28.35
cTOF29B13 5 59 78 14 0 0 26.99
TG185 5 46 75 12 0 0 19.56
CT285 6 61 72 27 0 0 16.05
TG356 6 82 53 16 0 0 71.11
cLEW22D11a 6 92 44 13 0 0 108.74
cLEW22N22 6 103 39 6 0 0 160.26
TG365 6 118 41 7 0 0 190.95
TG253 6 132 30 4 0 0 265.08
C54 6 154 11 2 0 0 402.59
TG279 6 156 4 1 0 0 443.84
cLEZ16H16 6 142 22 1 0 0 329.72
TG477 6 135 24 1 0 0 302.85∗All χ2 values significant at P < .01.
3.6. Mapping of ESTs
The use of the 115 RFLP anchor markers facilitated mappingof the 94 EST loci onto the 12 tomato chromosomes. Thenumber of ESTs per chromosome ranged from 4 (chr. 12) to12 (chr. 10) (Figure 2). The use of ESTs as genetic markers
has several advantages. First, they can be used as codominantmarkers for genetic mapping and QTL identification [53].Although ESTs were used as RFLP markers, that is, throughSouthern hybridization, technically they can be convertedto PCR-based markers adapted to high-throughput anal-ysis. Such conversion may reduce polymorphism level, in
10 International Journal of Plant Genomics
,9-fC ,4-fC ,1-fC1-xR ,2PCE-fC
1mcR
2-xR
41M6CELc2.9073_RRLX4.2
69TC3.281J01EOTc2.4
124GT8.213O91FOTc9.16J41RELc0
843GT1.01972TC8.1
53GT5.93DC7.0
91E11XELc9.0684GT3
082_11S7.2003_8SBN7.91
341TC1.4112E31CELc
1-rF ,a2-mT
eV
Rcm9.1
5-wS
3-hP
21 rhC11 rhC01 rhC9 rhC
4 rhC3rhC2 rhC1 rhC
371TC2.637TC9.205TC5.81
52C3.6491TC9.6871TC3.3
12M42WELc7.1a71B41FOTc1.6
5E51DELc3.011N01FOTc3.0
906GT3.05D31NELc0
b11D22WELc9.0004_RRLN6.0
21D12SOTc8.4281GT9.6
20336SBN1.510336SBN4.0
321GT oreH
2-lO
)4-wB(
1.4srR
4xR
4srR
012_21KP
21K11ZELc1.4085GT3.1
31E9AOTc8.321E72DELc1
731TC7.71361TC5.1
a7J7EOTc9.8955GT7.0
01F6EOTc6.6191TC01
95GT6.102N9SELc1.7
372GT9.52O6CELc3.12N9GELc3.04P02FOTc5.61
07GT2.641A3FOTc4.2
521GT0003_4SBN5.2
002_11S0051_11S6.0081_11S0013_31S0
022_RRLR0AN23_2406.1
006_21KP0
11C9AOTc0 026GT5.2
95TC6.5102E11WELc8.2 9K1YELc9
364GT3.251E01TELc4.3 454GT8.21 301TC3
9J91FOTc2.7541GT3.0 354GT5.6455GT7.7285GT6.5 671TC3.9
052_31S6.0 806GT6.0072_1SS0 022_6AS0003_2AS0
065_2C5.0022_3FP8.1
042_5S
1-mT
2mcR
61H71RELc9.0412GT9.31
22J92FOTc7.658TC1.21
515GT9.29A61FOTc01P81FOTc051F2EOTc7.9
28TC3.002F01XELc3.0
b61O21XELc6.5002_31S4.3
B522TC6.666GT2.22
231GT0411GT
csA
1-yP
1-toP
3srR
4vX
8 rhC7rhC6 rhC5 rhC
581GT7.131B92FOTc0b41J2COTc7.7a41J2COTc1.1
153GT4.7083_RRLX5.291J32FOTc7.2
69GT09E62FOTc03C33FOTc5.2
305GT091E5RELc5.4
39TC3.91761TC9242TC9.6101TC7.2
1K1EOTc3.15LEC7.0
b7J7EOTc
frP ,neF ,otP
3-xrR
4sB
m5cR
m5cR
774GT3.0 61H61ZELc6972GT9.3
45C4.7352GT1.4563GT3.0
a11D22WELc8.722N22WELc7.4
653GT9.41582TC7.7095GT6.2
093_32NA0004_32NA6.1
472GT512L12YELc8.5
612TC6.001E23GELc7.0
91F8FOTc4.02A11DELc
5-fC ,2-fC
)1-ueM( 1-iM9-iM
1-yT ,6mcR
1Q-lO ,1-lO
)5-wB( 1.6srR
)1-wB( s6rR
3-yT
iP
6.61
5.21
5.71
0
06.03.2
2.33.12.23.95.04.15.0
2.1
994GT834GT622TC035_4S
a9M51EOTc821GT
02L22YELc381GT
22G31NELc471GT
21F12FOTc02O43GELc
651GT31C43FOTc
9F41NELc311GT
3-I ,1-I
1-hP
1.7mcR
s7rR)2-wB(
m7cR
492GT
7.321J32EOTc5.1
61D9FOTc6.08C41NELc051N2FOTc3.1
562TC1.4102GT91
3H01NELc6.012E61IELc5.2
96TC3.2203GT0
21D82FOTc5.6943GT3.8
091_1SS8.1083_RRLR1
29TC5.604DC7.8671GT8.5
61L2FOTc9.521J41RELc
0643GT3.0
7N3DOTc4.502C72DELc
8srR
C2I
8mcR
iP
01srR
6G81DELc9.0 36GT6.6304GT9.51 33CC0 B3BJK8.31A3BJK3.0 43DC8.4 804GT8.2
02512SAS5.1 a5F4RELc3.0 12K03FOTc0 11TC3.2 1O81CELc9.0 2P9NELc0 6K41NELc0 b61N01XELc6.0 014_32NA0 002_32S3.0 044_3S7.0 61M22FOTc5.0121J11THLc3.1 432TC9.11 61TC5.101H13FOTc5.1b12E6ZELc6.0
02I4DOTc
)3-wB(
01mcR
2-hP
1.01srR
1.415.118.21
56TC3.062GT7.3
71K22MELc5.012K32DELc4.0
7I31DELc4.106711SAS3.032I82FOTc8.0
a81I41CELc1.4b81I41CELc1.2
63GT5.203GT6.3
645GT4.7B701TC2.9
004GT1 A701TC4.155TC9.0
02362SAS3.0045_6SAS6.1
741GT4061_11S1.3
012_RRLN6F92FOTc
861TC61N81SELc3.0
794GT0926GT0
a12E6ZELc
I
2I ,C2-I
mS
2-yT
CD20374GT3.0
11G1TPLc3.18E51ZELc7.3
0cTOS21D14cLEW25D9
6.0651TC4.93111GT9.2565GT3.4
086_RRLN8.16.1
SS1_530SS1_320
5.1816GT3.5
99TC6.2001TC41
97TC3.386GT
3-iM
vL
21srR
rmC
Figure 2: A genetic linkage map of tomato constructed based on an F2 population of a cross between a tomato (S. lycopersicum) breeding line(NCEBR-1) and an accession (LA2093) of tomato wild species S. pimpinellifolium and 250 RFLP, EST, and RGA markers. RFLP markers areshown in blue, ESTs in green, and RGAs in red fonts. The names of the markers are shown at the right and the map distances between them(in cM, using Kosambi function) are shown at the left of the chromosomes. The approximate chromosomal locations of disease-resistancegenes (R-genes) and quantitative resistance loci (QRL), as inferred from other published researches, are shown in parentheses to the rightof chromosomes. The descriptions of the R-genes and QRL are as follows: Asc: resistance to Alternaria stem canker (Alternaria alternataf. sp. lycopersici) [54, 55]; Bw (1–5) or Rrs (3–12): QLRs for resistance to bacterial wilt (Ralstonia solanacearum) [56–59]; Cf (1–9, ECP2):resistance to leaf mould (Cladosporium fulvum) [60–65]; Cmr: cucumber mosaic virus [66]; Fen: sensitivity to herbicide fenthion [67]; Frl:resistance to Fusarium crown and root rot (Fusarium oxysporum f. sp. radicis-lycopersici) [68]; Hero: resistance to potato cyst namatode(Globodera rostochiensis) [69]; I (I, 1, 2, 2C, 3): resistance to different races of Fusarium wild (Fusarium oxysporum f. sp. lycopersici) [70–78];Lv: resistance to powdery mildew (Leveuillula taurica) [79]; Meu-1: resistance to potato aphid [80–82]; Mi (Mi, 1, 2, 3, 9): resistance to rootknot nematodes (Meloidogyne spp.) [81, 83–89]; Ol (1, 2, 3): resistance to powdery mildew (Oidium lycopersicum) [90, 91]; Ph (1, 2, 3):resistance to late blight (Phytophthora infestans) in tomato [92–94]; Pot-1: resistance to potyvirus [95]; Pto and Prf : resistance to bacterialspeck (Pseudomonase syringae pv tomato) [96, 97]; Py-1: resistance to corky root rot (Pyrenochaeta lycopersici) [98]; Rcm (1–10): QRL forresistance to bacterial canker (Clavibacter michiganensis) [99, 100]; Rrs (3–12) or Bw (1–5): QLRs for resistance to bacterial wilt (Ralstoniasolanacearum) [56–59]; Rx (1, 2, 3, 4): resistance to bacterial spot (Xanthomonas campestris) [101–103]; Sm: resistance to Stemphilium [104];Sw-5: resistance to tomato-spotted wilt virus [105, 106]; Tm-1 and Tm-2a: resistance to tobacco mosaic virus [68, 107–110]; Ty (1, 2, 3):resistance to tomato yellow leaf curl virus [111–113]; Ve: resistance to Verticillium dahliae [114, 115].
particular between closely related individuals, though it isexpected to enhance their utility as genetic markers. Second,mapping of ESTs can facilitate association of functionalitywith phenotype. EST markers are derived from partial orcomplete sequences of cDNA clones, which may provide
information on gene function. Third, coding sequences,especially those of house-keeping genes, are rather con-served across species. Mapping of ESTs and comparativegenomics may lead to the detection of new genes in differentspecies.

Arun Sharma et al. 11
Inspections of the distribution of ESTs on different chro-mosomes indicated that in some cases they were clustered,for example, ESTs on chromosomes 4, 8, 10, and 11. Furtherinspections indicated that chromosomal locations of someclustered or individual ESTs were colocalized with approx-imate locations of some major disease-resistance genes (R-genes) or quantitative resistance loci (QRLs), as inferredfrom other published researche (see Figure 2). While suchcolocalization suggests that these ESTs may be geneticallyrelated to resistance genes or QRL, their actual functionalityrelationships can only be determined by further analysessuch as isolation and sequencing of full EST sequences andfunctional genomic studies.
Currently, there are more than 214 000 ESTs identifiedin tomato (http://compbio.dfci.harvard.edu/tgi/cgi-bin/tgi/gimain.pl?gudb=tomato), of which only a small percentagehas been mapped onto the tomato chromosomes(http://www.sgn.cornell.edu/cgi-bin/search/direct search.pl?search=EST). The ESTs were derived from more than23 cDNA libraries [116, 117] and their sequencesare available on Solanaceae Genome Network (SGN;http://www.sgn.cornell.edu/). All but four (cLET10E15,cLER4F5, cLEC6O2, and cLEG9N2) of the ESTs mappedin the present study were not previously mapped ontotomato chromosomes. Moreover, of the four that werepreviously mapped, different members of the correspondingcontigs were mapped onto the same or different tomatochromosomes as in the present study. For example,cLET10E15 and cLER4F5 have overlap sequences withcLET1A5 and cLET3F16, respectively, and were mappedon the same chromosomes (http://www.sgn.cornell.edu/)as in the present study. cLEC6O2, which was mappedto chromosome 1 in the present study, was mapped tochromosome 8 and named cLPT1J10 (SGN: F2 popula-tion ofa cross S. lycopersicum LA925 × S. pennelliiLA716). EST clone cLEG9N2, which was mapped tochromosome 1 in this study, was previously mapped undercLET20B4 but with no known chromosomal position(http://www.sgn.cornell.edu/). Also, as indicated earlier,five of the EST clones resulted in two pairs of polymorphicbands each. For two of these clones, the two polymorphicbands were mapped onto two linked loci, that is, cTOC2J14aand cTOC2J14b on chromosome 5 and cLEC14I18a andcLEC14I18b on chromosome 11. Others were mappedonto different chromosomes; for example, cLEW22D11awas mapped to chromosome 6 whereas cLEW22D11b tochromosome 4, and cTOE7J7a was mapped to chromosome1 whereas cTOE7J7b to chromosome 5.
3.7. Mapping of RGAs
PCR amplification using the 10 pairs of RGA primers(Table 2) followed by denaturing PAGE resulted in thedetection of a few hundred polymorphic and monomorphicbands. As described in Section 2, of the detected bands,41 were strong and verifiable and thus were scored in theF2 population. The amplified fragment size of these RGAbands ranged from 150 to 760 bp. Linkage analysis indicatedthat the 41 RGA markers were located on the 12 tomato
chromosomes, ranging in number from 1 (on chrs. 3, 5, and7) to 9 (on chr. 1) (Figure 2). The results indicated that RGAloci could be used as genetic markers for genome mapping,consistent with previous suggestions [28, 30]. In severalcases, RGA loci were clustered, similar to that observedfor R-genes in various plant species [17, 19, 29, 60, 118–120]. For example, on each of chromosomes 1, 2, 9, 10,11, and 12, three or more RGA loci that were amplifiedfrom the same or different primer pairs mapped to the sameor nearby positions (Figure 2). This observation indicatedthat different primers might initiate amplification of closelylinked RGA loci that might be members of the same ordifferent gene families.
Map positions of RGA loci were compared with chromo-somal positions of known tomato R-genes and major QRL,whose positions were inferred from the previously publishedmaps, as displayed and described in Figure 2. Most positionswere inferred based on linkage to reference markers and thusshould be considered best approximations. Colocalizationof RGA loci with R-genes and QRLs were observed on afew chromosomes, including regions on chromosomes 1,2, 7, 8, 9, 10, 11, and 12 (Figure 2). These observationssuggest the possibility of the presence of R or DR genesat the locations of RGAs, though this hypothesis couldbe confirmed only by extensive mapping and functionalanalysis of RGAs. Specifically, mapping of the associatedRGAs in populations segregating for the colocalized R-genes and cloning and molecular characterization of RGAsare necessary before any functional relationship could beestablished.
The map positions of the RGA loci in the present map(L × PM3) were compared with those reported in a S.lycopersicum × S. habrochaites (L × H2) map [28]. Therewere 19 common RGA loci between the two populations and13 (68%) of which mapped to the same locations in the twomaps, suggesting consistent and reproducible positions ofRGAs across populations.
3.8. Comparison of the map with other molecularlinkage maps of tomato
The present map (L × PM3) was compared with twopreviously developed S. lycopersicum × S. pimpinellifoliummaps, including L × PM1 [6] and L × PM2 [7] as wellas the high-density S. lycopersicum × S. pennellii (L × P)map of tomato [25]. The present map is different butcomplementary to L × PM1 and L × PM2 maps in severalways. First, different S. lycopersicum and S. pimpinellifoliumparents and pretty much different molecular markers wereused in the construction of the three maps. The L × PM1was constructed based on a cross between a processingtomato cultivar (M82-1-7) and S. pimpinellifolium accessionLA1589 using∼120 RFLP and RAPD markers. The L × PM2was constructed based on a cross between a fresh markettomato breeding line (NC84173) and S. pimpinellifoliumaccession LA722 using 151 RFLP markers. The current map(L × PM3) was constructed based on 250 RFLP, EST, andRGA markers using superior parental lines, as describedearlier. It is expected that this map will have great utilities,

12 International Journal of Plant Genomics
Table 4: Comparison of map distances based on common marker intervals between three molecular linkage maps of tomatoa.
Interval Chr.Marker interval map distance (cM)
(L × PM3)b (L × PM2)c (L × PM3)/(L × PM2) (L × P)d (L × PM3)/(L × P)
TG70-TG273 1 24.3 23.8 1.0 8.9 2.7∗
TG554-TG453 2 6.6 — — 0.0 NA∗
TG453-TG145 2 0.4 — — 6.8 0.1∗
TG145-CT103 2 10.3 — — 10.1 1.0
CT176-TG582 2 5.6 18.9 0.3∗ 15.5 0.4∗
CT59-TG620 2 2.6 7.0 0.4∗ 0.0 NA∗
TG114-TG132 3 0.0 8.9 N/A∗ 15.4 NA∗
TG66-CT225B 3 6.6 — — 1.8 3.7∗
CT225B-CT82 3 9.8 — — 6.3 1.6
CT82-TG515 3 12.7 14.8 0.9 3.9 3.3∗
TG123-TG182 4 12.5 — — 14.2 0.9
TG182-TG609 4 6.7 — — 5.5 1.2
TG609-CT178 4 11.8 — — 11.1 1.1
CT167-CT93 5 19.3 8.9 2.2∗ 12.9 1.5
TG503-TG96 5 2.5 — — 3.2 0.8
TG274-TG590 6 4.6 — — 10.4 0.4∗
TG356-TG365 6 13.0 11.9 1.1 4.1 3.2∗
C54-TG279 6 4.0 10.2 0.4∗ — NA
TG183-TG128 7 15.7 — — 2.3 6.8∗
TG128-CT226 7 3.1 3.5 0.9 1.6 1.9
TG128-TG174 7 19.3 13.6 1.4 10.7 1.8
TG176-CD40 8 8.7 — — 0.0 NA∗
CT265-TG294 8 12.8 9.6 1.3 13.1 1.0
TG486-CD3 9 1.7 — — 1.3 1.3
CD3-CT279 9 11.3 — — 5.6 2.0∗
CT279-TG35 9 1.9 — — 0.0 NA
TG408-CD34 10 4.9 — — 22.9 0.2∗
CD34-TG403 10 30.1 37.5 0.8 7.4 4.1∗
TG629-TG497 11 0.0 — — 0.0 NA
TG30-CT65 11 16.7 — — 3.9 4.3∗
TG68-CT79 12 3.3 6.7 0.5∗ 14.4 0.2∗
CT99-TG618 12 5.4 — — 0.8 6.8∗
TG618-TG111 12 12.5 — — 6.1 2.0∗
TG111-TG565 12 3.0 — — 0.0 NA∗
CT156-TG473 12 6.1 — — 19.1 0.3∗
TG473-CD2 12 0.0 — — 1.8 0.0aOnly common marker intervals that were different in length by at least twofold between L × PM1 and either L × PM2 or L × P linkage maps are shown.bL × PM3: Solanum lycopersicum (NCEBR-1) × S. pimpinellifolium (LA2093) map (present map).cL × PM2: S. lycopersicum (NC84173) × S. pimpinellifolium (LA722) map [7] .dL × P: S. lycopersicum (VF36-Tm2) × S. pennellii (LA716) map [25] .∗Difference in interval length by at least twofold. Dashes (—) indicate no common interval for comparison. NA indicates a number divided by 0.0, 0.0 over anumber, or no comparison was made.
including exploitation of the genetic potential of LA2093 andother S. pimpinellifolium accessions.
The second point of difference is that relatively a smallpercentage of the markers used in the present study were
used in the previous two S. lycopersicum × S. pimpinelli-folium linkage maps. Specifically, a new set of RFLP clonesthat detect polymorphism between S. lycopersicum and S.pimpinellifolium has been identified in the present study,

Arun Sharma et al. 13
Table 5: Pairwise comparison of the present map (L × PM3) with other maps of tomato for individual chromosome lengths based onorthologous markers.
Chromosome length (cM)
Linkage mapa 1 2 3 4 5 6 7 8 9 10 11 12 Average Total
L × PM3 102.9 92.6 85.3 72.2 70.6 74.6 69.8 86.6 96.1 80.6 88.3 83.4 83.6 1003.0
L × PM2 129.7 121.9 133.8 108 94.1 82.8 91.3 64.4 104.8 84.9 78.2 92.6 98.9 1186.5
L × PM1 149.6 98.2 116.6 97.2 108.2 85.2 116.4 86.1 104.2 101.5 107 105.2 106.3 1275.4
L × P 133.5 124.2 126.1 124.8 97.4 101.9 91.6 94.9 111 90.1 88 93.1 106.4 1276.6
L × PM3/L × PM2 0.8 0.8 0.6 0.7 0.8 0.9 0.8 1.3 0.9 0.9 1.1 0.9 0.8
L × PM3/L × PM1 0.7 0.9 0.7 0.7 0.7 0.9 0.6 1.0 0.9 0.8 0.8 0.8 0.8
L × PM3/L × P 0.8 0.7 0.7 0.6 0.7 0.7 0.8 0.9 0.9 0.9 1.0 0.9 0.8∗L × PM3, S. lycopersicum (NCEBR-1) × S. pimpinellifolium (PSLP125) map (the present map); L × PM2, S. lycopersicum (NC84173) × S. pimpinellifolium(LA722) map [7]; L × PM1, S. lycopersicum (M82-1-7) × S. pimpinellifolium (LA1589) map [6]; E × P, S. lycopersicum (VF36-Tm2) × S. pennellii (LA716)map [25].
beyond those that were identified in the construction of theprevious two maps. However, an important observation isthat markers that are polymorphic in one L × PM crossusually have a greater chance of being polymorphic in otherL × PM crosses, compared to markers directly chosen fromthe high-density L × P map. Nonetheless, the observationthat only 54% of the mapped RFLP clones in the L × PM2population were polymorphic in the L × PM3 populationindicates the presence of considerable DNA sequence varia-tion among S. pimpinellifolium accessions. The overall resultssuggest that while for each S. pimpinellifolium accessionnew polymorphic markers need to be identified, the mostuseful sources would be those markers that have alreadybeen mapped in other S. lycopersicum × S. pimpinellifoliumcrosses. Third, unlike in the previous two L × PM maps,in the present map, “functional” markers such as ESTsand RGAs were used. Such markers may be more usefulthan random genetic markers for identification of candidategenes. The use of a large number of markers and theincorporation of functional markers in the present mapextends its practical value in various genetics and breedingstudies. However, the availability of three L × PM maps withrather different molecular markers should facilitate marker-assisted exploitation of these and other S. pimpinellifoliumaccessions.
When the current map was compared with L × PM1 [6],L × PM2 [7], and the high-density L × P map [25], it wasdetermined that the linear order of the common markerswere generally the same. However, there were differences ininterval lengths for several adjacent markers. For example,of 13 common marker intervals between L × PM3 andL × PM2 maps, 6 intervals on chromosomes 2, 3, 5, 6,and 12 differed in length by 2-3 fold, of which 1 intervalwas expanded in L × PM3 map. The difference between thetwo maps in marker interval lengths was not unexpectedgiven the use of different type populations (F2 versus BC1),rather small size populations (172 and 119) and differentnumber of markers (250 versus 151), all of which could haveaffected the occurrence and detection of recombination indifferent intervals. When the L × PM3 was compared with
the high-density L × P map, which was constructed basedon >1 000 genetic markers and 67 F2 plants, genetic distancesdiffered markedly for a large number of marker intervals. Forexample, for 36 common marker intervals, genetic distancesdiffered between the two maps by at least twofold; of these,7 intervals (23%) showed decreased and 13 (36%) showedincreased recombination in the L × PM3 map. Greaterdifferences in marker interval lengths between L × PM3and L × P maps compared to that between L × PM3 andL × PM2 maps was not unusual considering the relativelyclose phylogenetic relationships between the L × PM3 andL × PM2 mapping populations.
When comparing the L × PM3 map with the high-density L × P map, the most striking differences in geneticdistances were observed in centromeric regions of chro-mosomes 3, 4, and 9, where substantial expansions inmap distances were observed in the L × PM3 map, andin two locations on chromosome 12, where substantialcontractions were observed in the L × PM3 map (Table 4and Figure 1). The decrease in recombination frequenciesin the centromeric regions of tomato chromosomes waspreviously attributed to the centromeric suppression ofrecombination [5, 121, 122]. Such suppression was suggestedto be more frequent in wider crosses than in intraspecificcrosses and crosses between closely related species. Furtherinspections indicated that the differences in genetic distancesbetween the two maps across the rest of the genome weregenerally interval specific and not a characteristic of individ-ual chromosomes. For example, for chromosomes 2, 3, 6, 10,11, and 12, the L × PM3 map exhibited expansion in someintervals and contraction in others (Table 4). As indicatedearlier, such differences were due in part to the detectionof chance recombination given the limited population sizesused in these studies.
Comparisons were also made across the four maps(L × PM3, L × PM2, L × PM1, and L × P) in terms ofindividual chromosome and total map lengths. The totallength of the current map (1002 cM) was comparable withthat of the L × P (1277 cM), L × PM1 (1275 cM), and theL × PM2 (1186 cM) maps. Furthermore, across the maps

14 International Journal of Plant Genomics
the length of each chromosome in the current map wascomparable to the corresponding chromosome in the othermaps (Table 5).
4. CONCLUSION
A medium-density molecular linkage map of tomatois developed based on a cross between S. lycopersicumand S. pimpinellifolium, two phylogenetically closely relatedspecies. The parents of this map are superior genotypes andare expected to be useful for tomato crop improvement.This map will provide a basis for the identification, char-acterization, and introgression of useful genes and QTLspresent in LA2093 and other S. pimpinellifolium accessions.It will also facilitate studies of gene and genome organizationand evolution, dissection of complex traits, and targetedgene cloning. The map includes different types of molecularmarkers and provides a basis for identifying and adding othermarkers. The genomic locations of several EST and RGAmarkers coincided with locations of several known tomatoR-genes or QRL, suggesting that candidate gene approachmay be an effective means of identifying and mapping newR-genes and defining the genetic content of specific chromo-somal regions. Because of the close phylogenetic relationshipbetween the two species and the past frequent introgressionof DNA from S. pimpinellifolium into S. lycopersicum, thismap is expected to be particularly useful to breedingprograms that exploit intraspecific variability within thecultivated tomato. The combined information from thisand the two previously published S. lycopersicum × S.pimpinellifolium maps will facilitate further identificationand exploitation of genetic variation within S. pimpinelli-folium, S. lycopersicum var. cerasiforme, and S. lycopersicum.
ACKNOWLEDGMENTS
This research was supported in part by The Agricul-tural Research Funds administered by The PennsylvaniaDepartment of Agriculture, The Pennsylvania VegetableMarketing and Research Program, and College of Agricul-tural Sciences, The Pennsylvania State University.
REFERENCES
[1] J. C. Miller and S. D. Tanksley, “RFLP analysis of phylogeneticrelationships and genetic variation in the genus Lycopersi-con,” Theoretical and Applied Genetics, vol. 80, no. 4, pp. 437–448, 1990.
[2] M. R. Foolad, “Genome mapping and molecular breeding oftomato,” International Journal of Plant Genomics, vol. 2007,Article ID 64358, 52 pages, 2007.
[3] S. D. Tanksley and S. R. McCouch, “Seed banks andmolecular maps: unlocking genetic potential from the wild,”Science, vol. 277, no. 5329, pp. 1063–1066, 1997.
[4] R. Bernatzky and S. D. Tanksley, “Towards a saturated linkagemap in tomato based on isozymes and random cDNAsequences,” Genetics, vol. 112, pp. 887–898, 1986.
[5] S. D. Tanksley, M. W. Ganal, J. P. Prince, et al., “High densitymolecular linkage maps of the tomato and potato genomes,”Genetics, vol. 132, no. 4, pp. 1141–1160, 1992.
[6] S. Grandillo and S. D. Tanksley, “Genetic analysis of RFLPs,GATA microsatellites and RAPDs in a cross between L.esculentum and L. pimpinellifolium,” Theoretical and AppliedGenetics, vol. 92, no. 8, pp. 957–965, 1996.
[7] F. Q. Chen and M. R. Foolad, “A molecular linkage map oftomato based on a cross between Lycopersicon esculentum andL. pimpinellifolium and its comparison with other molecularmaps of tomato,” Genome, vol. 42, no. 1, pp. 94–103, 1999.
[8] C. M. Rick, “The potential of exotic germplasm for tomatoimprovement,” in Plant Improvement and Somatic CellGenetics, I. K. Vasil, W. R. Scowcroft, and K. J. Frey, Eds., pp.1–28, Academic Press, New York, NY, USA, 1982.
[9] J. D. Palmer and D. Zamir, “Chloroplast DNA evolution andphylogenetic relationships in Lycopersicon,” Proceedings of theNational Academy of Sciences of the United States of America,vol. 79, no. 16, pp. 5006–5010, 1982.
[10] S. J. Warnock, “A review of taxonomy and phylogeny of thegenus Lycopersicon,” HortScience, vol. 23, pp. 669–673, 1988.
[11] M. R. Foolad, L. P. Zhang, A. A. Khan, D. Nino-Liu, andG. Y. Lin, “Identification of QTLs for early blight (Alternariasolani) resistance in tomato using backcross populations of aLycopersicon esculentum∞L. hirsutum cross ,” Theoretical andApplied Genetics, vol. 104, no. 6-7, pp. 945–958, 2002.
[12] M. R. Foolad, A. Sharma, H. Ashrafi, and G. Y. Lin, “Geneticsof early blight resistance in tomato,” Acta Hort, vol. 695, pp.397–406, 2005.
[13] M. R. Foolad, H. L. Merk, H. Ashrafi, and M. P. Kinkade,“Identification of new sources of late blight resistance intomato and mapping of a new resistance gene,” in Proceedings21st Annual Tomato Disease Workshop, North Carolina StateUniversity, Fletcher NC, USA, November 2006.
[14] M. R. Foolad, “Recent advances in genetics of salt tolerancein tomato,” Plant Cell, Tissue and Organ Culture, vol. 76, no.2, pp. 101–119, 2004.
[15] M. R. Foolad, “Breeding for abiotic stress tolerances intomato,” in Abiotic Stresses: Plant Resistance Through Breedingand Molecular Approaches, M. Ashraf and P. J. C. Harris, Eds.,pp. 613–684, Haworth Press, New York, NY, USA, 2005.
[16] F. Q. Chen, M. R. Foolad, J. Hyman, D. A. St. Clair, and R.B. Beelaman, “Mapping of QTLs for lycopene and other fruittraits in a Lycopersicon esculentum×L. pimpinellifolium crossand comparison of QTLs across tomato species,” MolecularBreeding, vol. 5, no. 3, pp. 283–299, 1999.
[17] V. Kanazin, L. F. Marek, and R. C. Shoemaker, “Resistancegene analogs are conserved and clustered in soybean,”Proceedings of the National Academy of Sciences of the UnitedStates of America, vol. 93, no. 21, pp. 11746–11750, 1996.
[18] D. Leister, A. Ballvora, F. Salamini, and C. Gebhardt, “A PCR-based approach for isolating pathogen resistance genes frompotato with potential for wide application in plants,” NatureGenetics, vol. 14, no. 4, pp. 421–429, 1996.
[19] Y. G. Yu, G. R. Buss, and M. A. Maroof, “Isolation of asuperfamily of candidate disease-resistance genes in soybeanbased on a conserved nucleotide-binding site,” Proceedingsof the National Academy of Sciences of the United States ofAmerica, vol. 93, no. 21, pp. 11751–11756, 1996.
[20] C. Feuillet, G. Schachermayr, and B. Keller, “Molecularcloning of a new receptor-like kinase gene encoded at theLr10 disease resistance locus of wheat,” Plant Journal, vol. 11,no. 1, pp. 45–52, 1997.
[21] D. O. Nino-Liu, L. Zhang, and M. R. Foolad, “Sequence com-parison and characterization of DNA fragments amplified byresistance gene primers in tomato,” Acta Horticulturae, vol.625, pp. 49–58, 2003.
Arun Sharma et al. 15
[22] A. F. Bent, “Plant disease resistance genes: function meetsstructure,” Plant Cell, vol. 8, no. 10, pp. 1757–1771, 1996.
[23] R. Bernatzky and S. D. Tanksley, “Mehtods for detection ofsingle or low copy sequences in tomato on Southern blots,”Plant Molecular Biology Reporter, vol. 4, no. 1, pp. 37–41,1986.
[24] M. R. Foolad and R. A. Jones, “Mapping salt-tolerance genesin tomato (Lycopersicon esculentum) using trait-based markeranalysis,” Theoretical and Applied Genetics, vol. 87, no. 1-2,pp. 184–192, 1993.
[25] K. Pillen, O. Pineda, C. Lewis, and S. D. Tanksley, “Status ofgenome mapping tools in the taxon Solanaceae,” in GenomeMapping in Plants, A. Paterson, Ed., pp. 281–308, R. G.Landes, Austin, Tex, USA, 1996.
[26] M. R. Foolad, S. Arulsekar, V. Becerra, and F. A. Bliss,“A genetic map of Prunus based on an interspecific crossbetween peach and almond,” Theoretical and Applied Genet-ics, vol. 91, no. 2, pp. 262–269, 1995.
[27] A. P. Feinberg and B. Vogelstein, “A technique for radi-olabelling fragments to high specific activity,” AnalyticalBiochemistry, vol. 132, no. 1, pp. 6–13, 1983.
[28] L. P. Zhang, A. Khan, D. Nino-Liu, and M. R. Foolad, “Amolecular linkage map of tomato displaying chromosomallocations of resistance gene analogs based on a Lycopersiconesculentum×Lycopersicon hirsutum cross ,” Genome, vol. 45,no. 1, pp. 133–146, 2002.
[29] E. Speulman, D. Bouchez, E. B. Holub, and J. L. Beynon,“Disease resistance gene homologs correlate with diseaseresistance loci of Arabidopsis thaliana,” Plant Journal, vol. 14,no. 4, pp. 467–474, 1998.
[30] X. M. Chen, R. F. Line, and H. Leung, “Genome scanning forresistance-gene analogs in rice, barley, and wheat by high-resolution electrophoresis,” Theoretical and Applied Genetics,vol. 97, no. 3, pp. 345–355, 1998.
[31] R. Mago, S. Nair, and M. Mohan, “Resistance gene analoguesfrom rice: cloning, sequencing and mapping,” Theoretical andApplied Genetics, vol. 99, no. 1-2, pp. 50–57, 1999.
[32] G. Stumm, “A simple method for isolation of PCR fragmentsfrom silver-stained polyacrylamide gels by scratching with afine needle,” Elsevier Trends Journals Technical Tips, 1997.
[33] E. S. Lander, P. Green, J. Abrahamson, et al., “MAPMAKER:an interactive computer package for constructing primarygenetic linkage maps of experimental and natural popula-tions,” Genomics, vol. 1, no. 2, pp. 174–181, 1987.
[34] D. D. Kosambi, “The estimation of map distances fromrecombination values,” Annals of Eugenics, vol. 12, pp. 172–175, 1944.
[35] J. C. Nelson, “QGENE: software for marker-based genomicanalysis and breeding,” Molecular Breeding, vol. 3, no. 3, pp.239–245, 1997.
[36] C. M. Rick, “Natural variability in wild species of Lycopersi-con and its bearing on tomato breeding,” Genetica Agraria,vol. 30, pp. 249–259, 1976.
[37] C. M. Rick, “Transgression for exserted stigma in a crosswith L. pimpinellifolium,” Report of the Tomato GeneticsCooperative, vol. 33, pp. 13–14, 1983.
[38] D. Bernacchi and S. D. Tanksley, “An interspecific backcrossof Lycopersicon esculentum×L. hirsutum linkage analysis anda QTL study of sexual compatibility factors and floral traits,”Genetics, vol. 147, no. 2, pp. 861–877, 1997.
[39] L. Pnueli, L. Carmel-Goren, D. Hareven, et al., “The SELF-PRUNING gene of tomato regulates vegetative to reproduc-tive switching of sympodial meristems and is the ortholog
of CEN and TFL1,” Development, vol. 125, no. 11, pp. 1979–1989, 1998.
[40] C. M. Rick, “Disturbed segregation in progenies of L.esculentum∞L. chilense,” in Proceedings 10th InternationalCongress of Genetics, vol. 2, pp. 232–233, Montreal, Canada,August 1958.
[41] C. M. Rick, “Search for S locus,” Report of the Tomato GeneticsCooperative, vol. 13, pp. 22–23, 1963.
[42] A. H. Paterson, S. Damon, J. D. Hewitt, et al., “Mendelianfactors underlying quantitative traits in tomato: comparisonacross species, generations, and environments,” Genetics, vol.127, no. 1, pp. 181–197, 1991.
[43] R. Bernatzky, “Genetic mapping and protein product diver-sity of the self-incompatibility locus in wild tomato (Lycop-ersicon peruvianum),” Biochemical Genetics, vol. 31, no. 3-4,pp. 173–184, 1993.
[44] R. T. Chetelat and J. W. DeVerna, “Expression of unilat-eral incompatibility in pollen of Lycopersicon pennellii isdetermined by major loci on chromosomes 1, 6 and 10,”Theoretical and Applied Genetics, vol. 82, no. 6, pp. 704–712,1991.
[45] M. R. Foolad, “Unilateral incompatibility as a major causeof skewed segregation in the cross between Lycopersiconesculentum and L. pennellii,” Plant Cell Reports, vol. 15, no.8, pp. 627–633, 1996.
[46] A. H. Paterson, E. S. Lander, J. D. Hewitt, S. Peterson, S.E. Lincoln, and S. D. Tanksley, “Resolution of quantitativetraits into Mendelian factors by using a complete linkage mapof restriction fragment length polymorphisms,” Nature, vol.335, no. 6192, pp. 721–726, 1988.
[47] M. C. DeVicente and S. D. Tanksley, “QTL analysis oftransgressive segregation in an interspecific tomato cross,”Genetics, vol. 134, no. 2, pp. 585–596, 1993.
[48] C. M. Rick, J. F. Fobes, and S. D. Tanksley, “Evolutionof mating systems in Lycopersicon hirsutum as deducedfrom genetic variation in electrophoretic and morphologicalcharacters,” Plant Systematics and Evolution, vol. 132, no. 4,pp. 279–298, 1979.
[49] C. M. Rick, “Potential improvement of tomatoes by con-trolled introgression of genes from wild speies,” in Proceed-ings of the Conference on Broadening the Genetic Base of Crops,pp. 167–173, Wageningen, The Netherlands, July 1979.
[50] C. M. Rick and W. H. Dempsey, “Position of the stigma inrelation to fruit setting of the tomato,” Botanical Gazette, vol.130, no. 3, pp. 180–186, 1969.
[51] M. R. Foolad, “Genetic analysis of salt tolerance duringvegetative growth in tomato, Lycopersicon esculentum Mill.,”Plant Breeding, vol. 115, no. 4, pp. 245–250, 1996.
[52] B. R. Trognitz and P. E. Schmiediche, “A new look at theincompatibility relationships in higher plants,” Sexual PlantReproduction, vol. 6, no. 3, pp. 183–190, 1993.
[53] N. Yamanaka, S. Ninomiya, M. Hoshi, et al., “An informativelinkage map of soybean reveals QTLs for flowering time,leaflet morphology and regions of segregation distortion,”DNA Research, vol. 8, no. 2, pp. 61–72, 2001.
[54] E. A. van der Biezen, T. Glagotskaya, B. Overduin, H. J.J. Nijkamp, and J. Hille, “Inheritance and genetic mappingof resistance to Alternaria alternata f. sp. lycopersici inLycopersicon pennellii,” Molecular and General Genetics, vol.247, no. 4, pp. 453–461, 1995.
[55] L. A. Mesbah, T. J. A. Kneppers, F. L. W. Takken, P. Laurent, J.Hille, and H. J. J. Nijkamp, “Genetic and physical analysis ofa YAC contig spanning the fungal disease resistance locus Asc

16 International Journal of Plant Genomics
of tomato (Lucopersicon esculentum),” Molecular and GeneralGenetics, vol. 261, no. 1, pp. 50–57, 1999.
[56] D. Danesh, S. Aarons, G. E. McGill, and N. D. Young,“Genetic dissection of oligogenic resistance to bacterial wiltin tomato,” Molecular Plant-Microbe Interactions, vol. 7, no.4, pp. 464–471, 1994.
[57] P. Thoquet, J. Olivier, C. Sperisen, P. Rogowsky, H. Later-rot, and N. Grimsley, “Quantitative trait loci determiningresistance to bacterial wilt in tomato cultivar Hawaii7996,”Molecular Plant-Microbe Interactions, vol. 9, no. 9, pp. 826–836, 1996.
[58] P. Thoquet, J. Olivier, C. Sperisen, et al., “Polygenic resistanceof tomato plants to bacterial wilt in the French West Indies,”Molecular Plant-Microbe Interactions, vol. 9, no. 9, pp. 837–842, 1996.
[59] B. Mangin, P. Thoquet, J. Olivier, and N. H. Grimsley,“Temporal and multiple quantitative trait loci analyses ofresistance to bacterial wilt in tomato permit the resolutionof linked loci,” Genetics, vol. 151, no. 3, pp. 1165–1172, 1999.
[60] C. M. Thomas, M. S. Dixon, M. Parniske, C. Golstein, andJ. D. G. Jones, “Genetic and molecular analysis of tomato Cfgenes for resistance to Cladosporium fulvum,” PhilosophicalTransactions of the Royal Society B, vol. 353, no. 1374, pp.1413–1424, 1998.
[61] J. G. van der Beek, R. Verkerk, P. Zabel, and P. Lindhout,“Mapping strategy for resistance genes in tomato based onRFLPs between cultivars: Cf9 (resistance to Cladosporiumfulvum) on chromosome 1,” Theoretical and Applied Genetics,vol. 84, no. 1-2, pp. 106–112, 1992.
[62] D. A. Jones, M. J. Dickinson, P. J. Balint-Kurti, M. S. Dixon,and J. D. G. Jones, “Two complex resistance loci revealed intomato by classical and RFLP mapping of Cf-2, Cf-4, Cf-5, and Cf-9 genes for resistance to Cladosporium fulvum,”Molecular Plant-Microbe Interactions, vol. 6, pp. 348–357,1993.
[63] P. J. Balint Kurti, M. S. Dixon, D. A. Jones, K. A. Norcott,and J. D. G. Jones, “RFLP linkage analysis of the Cf-4 andCf-9 genes for resistance to Cladosporium fulvum in tomato,”Theoretical and Applied Genetics, vol. 88, no. 6-7, pp. 691–700, 1994.
[64] R. Lauge, A. P. Dmitriev, M. H. A. J. Joosten, and P. J. G. M.de Wit, “Additional resistance gene(s) against Cladosporiumfulvum present on the Cf-9 introgression segment areassociated with strong PR protein accumulation,” MolecularPlant-Microbe Interactions, vol. 11, no. 4, pp. 301–308, 1998.
[65] J. P. W. Haanstra, R. Lauge, F. Meijer-Dekens, G. Bonnema, P.J. G. M. de Wit, and P. Lindhout, “The Cf-ECP2 gene is linkedto, but not part of, the Cf-4/Cf-9 cluster on the short arm ofchromosome 1 in tomato,” Molecular and General Genetics,vol. 262, no. 4-5, pp. 839–845, 1999.
[66] B. S. Stamova and R. T. Chetelat, “Inheritance and geneticmapping of cucumber mosaic virus resistance introgressedfrom Lycopersicon chilense into tomato,” Theoretical andApplied Genetics, vol. 101, no. 4, pp. 527–537, 2000.
[67] G. B. Martin, A. Frary, T. Wu, et al., “A member of the tomatoPto gene family confers sensitivity to fenthion resulting inrapid cell death,” The Plant Cell, vol. 6, no. 11, pp. 1543–1552,1994.
[68] D. J. Vakalounakis, H. Laterrot, A. Moretti, E. K. Ligoxigakis,and K. Smardas, “Linkage between Frl (Fusarium oxysporumf.sp. radicis-lycopersici resistance) and Tm-2 (tobacco mosaicvirus resistance-2) loci in tomato (Lycopersicon esculentum),”Annals of Applied Biology, vol. 130, no. 2, pp. 319–323, 1997.
[69] M. W. Ganal, R. Simon, S. Brommonschenkel, et al., “Geneticmapping of a wide spectrum nematode resistance gene(Hero) against Globodera rostochiensis in tomato,” MolecularPlant-Microbe Interactions, vol. 8, no. 6, pp. 886–891, 1995.
[70] B. L. Bournival, J. W. Scott, and C. E. Vallejos, “An isozymemarker for resistance to race 3 of Fusarium oxysporum f. sp.lycopersici in tomato,” Theoretical and Applied Genetics, vol.78, no. 4, pp. 489–494, 1989.
[71] B. L. Bournival, C. E. Vallejos, and J. W. Scott, “Geneticanalysis of resistances to races 1 and 2 of Fusarium oxysporumf. sp. lycopersici from the wild tomato Lycopersicon pennellii,”Theoretical and Applied Genetics, vol. 79, no. 5, pp. 641–645,1990.
[72] M. Sarfatti, J. Katan, R. Fluhr, and D. Zamir, “An RFLPmarker in tomato linked to the Fusarium oxysporum resis-tance gene I2,” Theoretical and Applied Genetics, vol. 78, no.5, pp. 755–759, 1989.
[73] M. Sarfatti, M. Abu-Abied, J. Katan, and D. Zamir, “RFLPmapping of I1, a new locus in tomato conferring resistanceagainst Fusarium oxysporum f. sp. lycopersici race 1,” Theoret-ical and Applied Genetics, vol. 82, no. 1, pp. 22–26, 1991.
[74] S. D. Tanksley and W. Costello, “The size of the L. pennelliichromosome 7 segment containing the I-3 gene in tomatobreeding lines measured by RFLP probing,” Report of theTomato Genetics Cooperative, vol. 41, p. 60, 1991.
[75] G. Segal, M. Sarfatti, M. A. Schaffer, N. Ori, D. Zamir, andR. Fluhr, “Correlation of genetic and physical structure inthe region surrounding the I2 Fusarium oxysporum resistancelocus in tomato,” Molecular and General Genetics, vol. 231,no. 2, pp. 179–185, 1992.
[76] N. Ori, Y. Eshed, I. Paran, et al., “The l2c family from the wiltdisease resistance locus l2 belongs to the nucleotide binding,leucine-rich repeat superfamily of plant resistance genes,”The Plant Cell, vol. 9, no. 4, pp. 521–532, 1997.
[77] G. Simons, J. Groenendijk, J. Wijbrandi, et al., “Dissection ofthe fusarium I2 gene cluster in tomato reveals six homologsand one active gene copy,” The Plant Cell, vol. 10, no. 6, pp.1055–1068, 1998.
[78] J. W. Scott, H. A. Agrama, and J. P. Jones, “RFLP-based analy-sis of recombination among resistance genes to fusarium wiltraces 1, 2, and 3 in tomato,” Journal of the American Societyfor Horticultural Science, vol. 129, no. 3, pp. 394–400, 2004.
[79] J. Chungwongse, T. B. Bunn, C. Crossman, J. Jiang, andS. D. Tanksley, “Chromosomal localization and molecularmarker tagging of the powdery mildew resistance gene (Lv)in tomato,” Theoretical and Applied Genetics, vol. 89, no. 1,pp. 76–79, 1994.
[80] I. Kaloshian, W. H. Lange, and V. M. Williamson, “An aphid-resistance locus is tightly linked to the nematode-resistancegene, Mi, in tomato,” Proceedings of the National Academy ofSciences of the United States of America, vol. 92, no. 2, pp. 622–625, 1995.
[81] I. Kaloshian, J. Yaghoobi, T. Liharska, et al., “Genetic andphysical localization of the root-knot nematode resistancelocus Mi in tomato,” Molecular and General Genetics, vol. 257,no. 3, pp. 376–385, 1998.
[82] M. Rossi, F. L. Goggin, S. B. Milligan, I. Kaloshian, D. E.Ullman, and V. M. Williamson, “The nematode resistancegene Mi of tomato confers resistance against the potatoaphid,” Proceedings of the National Academy of Sciences of theUnited States of America, vol. 95, no. 17, pp. 9750–9754, 1998.
[83] R. Klein-Lankhorst, P. Rietveld, B. Machiels, et al., “RFLPmarkers linked to the root knot nematode resistance gene Mi

Arun Sharma et al. 17
in tomato,” Theoretical and Applied Genetics, vol. 81, no. 5,pp. 661–667, 1991.
[84] J. M. M. J. G. Aarts, J. G. J. Hontelez, P. Fischer, R. Verkerk, A.van Kammen, and P. Zabel, “Acid phosphatase-11, a tightlylinked molecular marker for root-knot nematode resistancein tomato: from protein to gene, using PCR and degenerateprimers containing deoxyinosine,” Plant Molecular Biology,vol. 16, no. 4, pp. 647–661, 1991.
[85] V. M. Williamson, J.-Y. Ho, F. F. Wu, N. Miller, andI. Kaloshian, “A PCR-based marker tightly linked to thenematode resistance gene, Mi, in tomato,” Theoretical andApplied Genetics, vol. 87, no. 7, pp. 757–763, 1994.
[86] J. Yaghoobi, I. Kaloshian, Y. Wen, and V. M. Williamson,“Mapping a new nematode resistance locus in Lycopersiconperuvianum,” Theoretical and Applied Genetics, vol. 91, no. 3,pp. 457–464, 1995.
[87] S. Doganlar, A. Frary, and S. D. Tanksley, “Production ofinterspecific F1 hybrids, BC1, BC2 and BC3 populationsbetween Lycopersicon esculentum and two accessions ofLycopersicon peruvianum carrying new root-knot nematoderesistance genes,” Euphytica, vol. 95, no. 2, pp. 203–207, 1997.
[88] J. C. Veremis, A. W. van Heusden, and P. A. Roberts,“Mapping a novel heat-stable resistance to Meloidogyne inLycopersicon peruvianum,” Theoretical and Applied Genetics,vol. 98, no. 2, pp. 274–280, 1999.
[89] J. S. S. Ammiraju, J. C. Veremis, X. Huang, P. A. Roberts, andI. Kaloshian, “The heat-stable root-knot nematode resistancegene Mi-9 from Lycopersicon peruvianum is localized onthe short arm of chromosome 6,” Theoretical and AppliedGenetics, vol. 106, no. 3, pp. 478–484, 2003.
[90] J. G. van der Beek, G. Pet, and P. Lindhout, “Resistanceto powdery mildew (Oidium lycopersicum) in Lycopersiconhirsutum is controlled by an incompletely dominant gene Ol-1 on chromosome 6,” Theoretical and Applied Genetics, vol.89, no. 4, pp. 467–473, 1994.
[91] Y. Bai, C.-C. Huang, R. van der Hulst, F. Meijer-Dekens,G. Bonnema, and P. Lindhout, “QTLs for tomato powderymildew resistance (Oidium lycopersici) in Lycopersicon parv-iflorum G1.1601 co-localize with two qualitative powderymildew resistance genes,” Molecular Plant-Microbe Interac-tions, vol. 16, no. 2, pp. 169–176, 2003.
[92] L. C. Pierce, “Linkage test with Ph conditioning resistance torace 0,” Report of the Tomato Genetics Cooperative, vol. 21, p.30, 1971.
[93] P. Moreau, P. Thoquet, J. Olivier, H. Laterrot, and N.Grimsley, “Genetic mapping of Ph-2, a single locus control-ling partial resistance to Phytophthora infestans in tomato,”Molecular Plant-Microbe Interactions, vol. 11, no. 4, pp. 259–269, 1998.
[94] J. Chunwongse, C. Chunwongse, L. Black, and P. Hanson,“Mapping of Ph-3 gene for late blight from L. pimpinelli-folium L3708,” Report of the Tomato Genetics Cooperative, vol.48, pp. 13–14, 1998.
[95] G. Parrella, S. Ruffel, A. Moretti, C. Morel, A. Palloix, andC. Caranta, “Recessive resistance genes against potyvirusesare localized in colinear genomic regions of the tomato(Lycopersicon spp.) and pepper (Capsicum spp.) genomes,”Theoretical and Applied Genetics, vol. 105, no. 6-7, pp. 855–861, 2002.
[96] G. B. Martin, S. H. Brommonschenkel, J. Chunwongse, etal., “Map-based cloning of a protein kinase gene conferringdisease resistance in tomato,” Science, vol. 262, no. 5138, pp.1432–1436, 1993.
[97] J. M. Salmeron, G. E. D. Oldroyd, C. M. T. Rommens, etal., “Tomato Prf is a member of the leucine-rich repeat classof plant disease resistance genes and lies embedded withinthe Pto kinase gene cluster,” Cell, vol. 86, no. 1, pp. 123–133,1996.
[98] S. Doganlar, J. Dodson, B. Gabor, T. Beck-Bunn, C. Cross-man, and S. D. Tanksley, “Molecular mapping of the py-1gene for resistance to corky root rot (Pyrenochaeta lycopersici)in tomato,” Theoretical and Applied Genetics, vol. 97, no. 5-6,pp. 784–788, 1998.
[99] J. M. Sandbrink, J. W. van Ooijen, C. C. Purimahua, etal., “Localization of genes for bacterial canker resistancein Lycopersicon peruvianum using RFLPs,” Theoretical andApplied Genetics, vol. 90, no. 3-4, pp. 444–450, 1995.
[100] A. W. van Heusden, M. Koornneef, R. E. Voorrips, etal., “Three QTLs from Lycopersicon peruvianum confer ahigh level of resistance to Clavibacter michiganensis ssp.michiganensis,” Theoretical and Applied Genetics, vol. 99, no.6, pp. 1068–1074, 1999.
[101] Z. H. Yu, J. F. Wang, R. E. Stall, and C. E. Vallejos, “Genomiclocalization of tomato genes that control a hypersensitivereaction to Xanthomonas campestris pv. vesicatoria (Doidge)dye,” Genetics, vol. 141, no. 2, pp. 675–682, 1995.
[102] G. Astua-Monge, G. V. Minsavage, R. E. Stall, C. E. Vallejos,M. J. Davis, and J. B. Jones, “Xv4-vrxv4: a new gene-for-geneinteraction identified between Xanthomonas campestris pv.vesicatoria race T3 and the wild tomato relative Lycopersiconpennellii,” Molecular Plant-Microbe Interactions, vol. 13, no.12, pp. 1346–1355, 2000.
[103] A. Ballvora, M. Pierre, G. van den Ackerveken, et al.,“Genetic mapping and functional analysis of the tomato Bs4locus governing recognition of the Xanthomonas campestrispv. vesicatoria AvrBs4 protein,” Molecular Plant-MicrobeInteractions, vol. 14, no. 5, pp. 629–638, 2001.
[104] J. Behare, H. Laterrot, M. Sarfatti, and D. Zamir, “RFLPmapping of the Stemphylium resistance gene in tomato,”Molecular Plant-Microbe Interactions, vol. 4, pp. 489–492,1991.
[105] M. R. Stevens, E. M. Lamb, and D. D. Rhoads, “Mappingthe Sw-5 locus for tomato spotted wilt virus resistance intomatoes using RAPD and RFLP analyses,” Theoretical andApplied Genetics, vol. 90, no. 3-4, pp. 451–456, 1995.
[106] S. H. Brommonschenkel and S. D. Tanksley, “Map-basedcloning of the tomato genomic region that spans the Sw-5tospovirus resistance gene in tomato,” Molecular and GeneralGenetics, vol. 256, no. 2, pp. 121–126, 1997.
[107] N. D. Young, D. Zamir, M. W. Ganal, and S. D. Tanksley, “Useof isogenic lines and simultaneous probing to identify DNAmarkers tightly linked to the Tm-2a gene in tomato,” Genetics,vol. 120, no. 2, pp. 579–589, 1988.
[108] H. Levesque, F. Vedel, C. Mathieu, and A. G. L. de Courcel,“Identification of a short rDNA spacer sequence highly spe-cific of a tomato line containing Tm-1 gene introgressed fromLycopersicon hirsutum,” Theoretical and Applied Genetics, vol.80, no. 5, pp. 602–608, 1994.
[109] T. Ohmori, M. Murata, and F. Motoyoshi, “Molecularcharacterization of RAPD and SCAR markers linked to theTm-1 locus in tomato,” Theoretical and Applied Genetics, vol.92, no. 2, pp. 151–156, 1996.
[110] S. D. Tanksley, D. Bernachi, T. Beck-Bunn, et al., “Yieldand quality evaluations on a pair of processing tomato linesnearly isogenic for the Tm2a gene for resistance to thetobacco mosaic virus,” Euphytica, vol. 99, no. 2, pp. 77–83,1998.

18 International Journal of Plant Genomics
[111] D. Zamir, I. Ekstein-Michelson, Y. Zakay, et al., “Mappingand introgression of a tomato yellow leaf curl virus tolerancegene, TY-1,” Theoretical and Applied Genetics, vol. 88, no. 2,pp. 141–146, 1994.
[112] V. Chague, J. C. Mercier, M. Guenard, A. de Courcel, andF. Vedel, “Identification of RAPD markers linked to a locusinvolved in quantitative resistance to TYLCV in tomato bybulked segregant analysis,” Theoretical and Applied Genetics,vol. 95, no. 4, pp. 671–677, 1997.
[113] P. M. Hanson, D. Bernacchi, S. Green, et al., “Mapping a wildtomato introgression associated with tomato yellow leaf curlvirus resistance in a cultivated tomato line,” Journal of theAmerican Society for Horticultural Science, vol. 125, no. 1, pp.15–20, 2000.
[114] N. Diwan, R. Fluhr, Y. Eshed, D. Zamir, and S. D. Tanksley,“Mapping of Ve in tomato: a gene conferring resistance tothe broad-spectrum pathogen, Verticillium dahliae race 1,”Theoretical and Applied Genetics, vol. 98, no. 2, pp. 315–319,1999.
[115] L. M. Kawchuk, J. Hachey, and D. R. Lynch, “Development ofsequence characterized DNA markers linked to a dominantverticillium wilt resistance gene in tomato,” Genome, vol. 41,no. 1, pp. 91–95, 1998.
[116] R. van der Hoeven, C. Ronning, J. Giovannoni, G. Martin,and S. Tanksley, “Deductions about the number, organiza-tion, and evolution of genes in the tomato genome basedon analysis of a large expressed sequence tag collection andselective genomic sequencing,” Plant Cell, vol. 14, no. 7, pp.1441–1456, 2002.
[117] S. Moore, J. Vrebalov, P. Payton, and J. Giovannoni, “Use ofgenomics tools to isolate key ripening genes and analyse fruitmaturation in tomato,” Journal of Experimental Botany, vol.53, no. 377, pp. 2023–2030, 2002.
[118] M. G. M. Aarts, B. T. L. Hekkert, E. B. Holub, J. L. Beynon,W. J. Stiekema, and A. Pereira, “Identification of R-genehomologous DNA fragments genetically linked to diseaseresistance loci in Arabidopsis thaliana,” Molecular Plant-Microbe Interactions, vol. 11, no. 4, pp. 251–258, 1998.
[119] T. Ashfield, J. R. Danzer, D. Held, et al., “Rpg1, a soybean geneeffective against races of bacterial blight, maps to a clusterof previously identified disease resistance genes,” Theoreticaland Applied Genetics, vol. 96, no. 8, pp. 1013–1021, 1998.
[120] W. De Jong, A. Forsyth, D. Leister, C. Gebhardt, and D.C. Baulcombe, “A potato hypersensitive resistance geneagainst potato virus X maps to a resistance gene cluster onchromosome 5,” Theoretical and Applied Genetics, vol. 95, no.1-2, pp. 246–252, 1997.
[121] C. M. Rick, “Controlled introgression of chromosomes ofSolanum pennellii into Lycopersicon esculentum: segregationand recombination,” Genetics, vol. 62, no. 4, pp. 753–768,1969.
[122] C. M. Rick, “Further studies on segregation and recombi-nation in backcross derivatives of a tomato species hybrid,”Biologisches Zentralblatt, vol. 91, pp. 209–220, 1972.
Copyright © 2022 FDOKUMEN