Genetic Structure of Lycopersicon pimpinellifolium (Solanaceae) Populations Collected after the ENSO...
19
Genetic structure of Lycopersicon pimpinellifolium (Solanaceae) populations collected after the ENSO event of 1997–1998 A. Sifres, B. Pico´, J.M. Blanca, R. De Frutos and F. Nuez* Instituto de Conservacio ´n y Mejora de la Agrodiversidad Valenciana (COMAV), Universidad Polite ´cnica de Valencia, Camino de Vera 14, Valencia 46022, Spain; *Author for correspondence (e-mail: [email protected]; phone: +34-6-96-3879425; fax: +34-6-96-3877429) Received 27 April 2005; accepted in revised form 2 December 2005 Key words: AFLPs, ENSO, Genetic structure, Lycopersicon pimpinellifolium, Northern Peru, SSRs Abstract The greatest extent of genetic variation and outcrossing for Lycopersicon pimpinellifolium occurs in northern Peru. This is also the area most affected by EI Nin˜o Southern Oscillation (ENSO). Using mor- phological and the molecular markers SSRs and AFLPs, we studied the genetic structure of L. pimpinel- lifolium populations collected after the ENSO event of 1997–1998. This was the most intense in the last century and caused a vast increase in the size of L. pimpinellifolium populations. Populations in the area surveyed were not regionally differentiated. We did not find any cline or eco-geographic association for genetic diversity, and positive correlations between genetic and geographic distances were found only at very short distances. Flooding and water streams caused by ENSO might have facilitated a periodical seed migration from distant areas. Gene flow between populations could then occur, facilitated by the increase in the population sizes of plants and pollinators and by the high levels of stigmatic exsertion. Results revealed a significant lack of heterozygotes in comparison with those expected in a panmictic population without consanguinity. A high degree of endogamy was found in all populations. In this context, endogamy can be explained by the occurrence of crosses between relatives rather than by autogamy. In an area intensely disturbed by ENSO, we found a population that had not been reported by earlier collectors in this region. This yellow-fruited population remained morphologically and molecularly differentiated from all L. pimpinellifolium and L. esculentum populations analyzed. Introduction The Currant tomato, Lycopersicon pimpinellifolium (Jusl.) Mill., is a colored-fruited wild species, included in the Lycopersicon subgenus (cf. Mu¨ller 1940). The fruit and the plant resemble those of the L. esculentum Mill., but they are substantially smaller. All populations of L. pimpinellifolium described to date are self-compatible. This species can be reciprocally hybridized with L. esculentum and has served as a valuable source of germplasm for tomato breeders (Rick and Chetelat 1995; Galiana-Balaguer et al. 2001). Lycopersicon pimpinellifolium is typically in coastal areas of Ecuador and Peru usually at ele- vations below 1000 m, becoming increasingly rare as altitude is gained following the river valleys to the east (Taylor 1986; Warnock 1991). This species was initially regarded as a relatively invariable species. The first populations characterized were Genetic Resources and Crop Evolution (2006) ȑ Springer 2006 DOI 10.1007/s10722-005-5725-4
Transcript of Genetic Structure of Lycopersicon pimpinellifolium (Solanaceae) Populations Collected after the ENSO...

Genetic structure of Lycopersicon pimpinellifolium (Solanaceae) populations
collected after the ENSO event of 1997–1998
A. Sifres, B. Pico, J.M. Blanca, R. De Frutos and F. Nuez*Instituto de Conservacion y Mejora de la Agrodiversidad Valenciana (COMAV), Universidad Politecnica deValencia, Camino de Vera 14, Valencia 46022, Spain; *Author for correspondence (e-mail: [email protected];phone: +34-6-96-3879425; fax: +34-6-96-3877429)
Received 27 April 2005; accepted in revised form 2 December 2005
Key words: AFLPs, ENSO, Genetic structure, Lycopersicon pimpinellifolium, Northern Peru, SSRs
Abstract
The greatest extent of genetic variation and outcrossing for Lycopersicon pimpinellifolium occurs innorthern Peru. This is also the area most affected by EI Nino Southern Oscillation (ENSO). Using mor-phological and the molecular markers SSRs and AFLPs, we studied the genetic structure of L. pimpinel-lifolium populations collected after the ENSO event of 1997–1998. This was the most intense in the lastcentury and caused a vast increase in the size of L. pimpinellifolium populations. Populations in the areasurveyed were not regionally differentiated. We did not find any cline or eco-geographic association forgenetic diversity, and positive correlations between genetic and geographic distances were found only atvery short distances. Flooding and water streams caused by ENSO might have facilitated a periodical seedmigration from distant areas. Gene flow between populations could then occur, facilitated by the increasein the population sizes of plants and pollinators and by the high levels of stigmatic exsertion. Resultsrevealed a significant lack of heterozygotes in comparison with those expected in a panmictic populationwithout consanguinity. A high degree of endogamy was found in all populations. In this context, endogamycan be explained by the occurrence of crosses between relatives rather than by autogamy. In an areaintensely disturbed by ENSO, we found a population that had not been reported by earlier collectors in thisregion. This yellow-fruited population remained morphologically and molecularly differentiated from allL. pimpinellifolium and L. esculentum populations analyzed.
Introduction
The Currant tomato, Lycopersicon pimpinellifolium(Jusl.) Mill., is a colored-fruited wild species,included in the Lycopersicon subgenus (cf. Muller1940). The fruit and the plant resemble those of theL. esculentum Mill., but they are substantiallysmaller. All populations of L. pimpinellifoliumdescribed to date are self-compatible. This speciescan be reciprocally hybridized with L. esculentum
and has served as a valuable source of germplasmfor tomato breeders (Rick and Chetelat 1995;Galiana-Balaguer et al. 2001).
Lycopersicon pimpinellifolium is typically incoastal areas of Ecuador and Peru usually at ele-vations below 1000 m, becoming increasingly rareas altitude is gained following the river valleys tothe east (Taylor 1986; Warnock 1991). This specieswas initially regarded as a relatively invariablespecies. The first populations characterized were
Genetic Resources and Crop Evolution (2006) � Springer 2006
DOI 10.1007/s10722-005-5725-4

highly uniform in gross morphology and tended toreproduce autogamously. However, the detailedstudies conducted by Rick et al. (1977, 1978) on 43populations, using morphological variants andallozymes, revealed varying degrees of geneticvariation and rates of outcrossing (0–40%) withinits range of distribution. Central populations dis-played a typically allogamous floral morphology,whereas peripheral populations were less variableand tended to be autogamous (Georgiady et al.2002).
The knowledge of the tomato genome has in-creased significantly in the two last decades andmolecular tools that facilitate genetic studies havebeen developed. Different DNA-marker systemsare being routinely employed for the constructionof genetic maps of tomato (Arens et al. 1995;Broun and Tanksley 1996; Haanstra et al. 1999;Saliba-Colombani et al. 2000; Areshchenkova andGanal 2002; Bonnema et al. 2002), for phyloge-netic studies with Lycopersicon species Miller andTanksley 1990; Alvarez et al. 2001; Marshall et al.2001; Spooner et al. 2005), for identification ofcultivars and for studies of genetic diversity withinL. esculentum (Williams and St Clair 1993; Villandet al. 1998; Baudry et al. 2001; Bredemeijer et al.2002; He et al. 2003). Some of these studies includea few accessions of L. pimpinellifolium as refer-ences together with other wild Lycopersicon spe-cies. To our knowledge, DNA-markers havenot been used in population genetic studies ofL. pimpinellifolium beyond to those by Rick et al.(1977, 1978).
Rick et al. (1977) found the highest levels ofvariability in central populations of L. pimpinel-lifolium from the northwest coast of Peru. Rainfallis non-existent in much of this area and as a con-sequence natural populations are frequently com-posed of a few scattered individuals that grow inthe more humid areas. However, an exceptionalincrease in the size of L. pimpinellifolium popula-tions occurred in the summer of 1998 due to theeffect of El Nino Southern Oscillation (ENSO).The ENSO is a weak southerly flow of warm waterto approximately 6�S that develops annually alongthe coast, usually in winter. This phenomenon be-comes more extensive and intense at highly irreg-ular intervals. The ENSO of 1997–1998 was themost intense in the last century. It was associatedwith heavy rainfall and flooding on the northwestcoast of Peru (WMO 1999), where it caused a
significant increase in the spontaneous vegetationand vast areas were found densely covered withplants of L. pimpinellifolium. The Institute forConservation and Breeding of Agricultural Diver-sity (COMAV) of the Universidad Politecnica deValencia (UPV), in co-operation with the Uni-versidad Nacional de Loja (Ecuador) and theUniversidad Nacional de Piura (Peru), conducted acollecting expedition (ENSO98) to the area mostaffected by the climatic change after the 1997–1998event. This expedition provided the largest L. pim-pinellifolium germplasm collection reported to datefrom this area.
In this paper, we present a detailed study of thegenetic structure of L. pimpinellifolium from thecentral area of its natural range with morpholog-ical traits and two molecular marker systems(Amplified Fragment Length Polymorphisms,AFLPs, and Simple Sequence Repeats, SSRs). Thepossible effect of ENSO on population structureby favoring plant migration and the subsequentgene flow among populations is also discussed.
Materials and methods
Areas surveyed
The expedition ENSO98 followed the FAOguidelines that encourage rational collectionactivities (Jaramillo and Baena 2000). The collab-oration of local institutions facilitated the collec-tion. The University of Loja and Piura hold seedsamples of all accessions, so all the scientific andtechnical information obtained from the germ-plasm could be transferred, sharing the benefitsderived from these resources.
The collection was performed in northwesternPeru in the areas most affected by the ENSO event(latitude 4–6 �S; longitude 79–81 �W) (Figure 1).The area surveyed corresponds with the centralarea of the L. pimpinellifolium range of distribu-tion, where the greatest extent of genetic variationand outcrossing has been reported (Rick et al.1977, 1978). The intense rain and floods enhancedthe growth of L. pimpinellifolium in previously aridor semi-arid areas (Figure 2). This situationallowed us to collect a large number of samples oraccessions (the collections were designated PLcollections, from the Universities of Piura andLoja). Each sample or accession consisted of a
mixture of seeds coming from fruits collected fromdifferent plants randomly selected among thosegrowing in a specific site. Each specific site wasidentified with passport data, including the geo-graphic coordinates determined using a globalpositioning system (GPS) (Table 1). For the dif-ferent analyses, the accessions were grouped intosubpopulations (A, B, C, D, E, and F) accordingto both geographic and agro-ecologic criteria(Figure 1 and Table 1). The northernmost collec-tion site was the desert coastal plain near TamboGrande and Sullana, on the roadside from Piura toTalara (A). Southwards, we surveyed the lowerPiura watershed, from Piura to Sechura (B, C).These areas provided a semi-xerophytic habitattypical of this Peruvian coast. Lycopersicon pim-pinellifolium populations were also collected fol-lowing the upper Piura watershed, on roadsidesfrom Piura to Huancabamba (D). Here the envi-ronment changed, becoming more humid andfoggy as altitude increased. Lycopersicon pimpi-nellifolium also abundant on the roadside fromPiura to Olmos, in the department of Lambayeque(E). The ENSO had a great impact in this area andeven a small lagoon had appeared as a conse-quence of the flooding. Here the collection wasvery intense as the land was completely coveredwith L. pimpinellifolium associated to other nativespecies adapted to xerophytic climates such asProsopis pallida L. (‘mesquite’ or ‘algarrobo’),Luffa operculata Mill. (‘esponja vegetal’) orCucumis dipsaceus Ehrenb. ex Spach. (‘jaboncillo’)(Figure 2). This amount of L. pimpinellifolium inthe Sechura dessert and in the ‘Pampa de Olmos’was already reported by Holle et al. (1978). Theseauthors commented on the urgent need of col-lecting these populations, since it can be collectedonly in one of those rare years when the desertregion gets sufficient moisture. Finally, morpho-logically diverse specimens of L. pimpinellifoliumand L. esculentum occurred sympatrically in asmall canyon in the surroundings of Olmostowards Jaen (F).
Plant material
Sixty-four accessions of L. pimpinellifolium wereanalyzed (Table 1). Fifty of them belonged to thePL collection. Other groups on previous expedi-tions conducted in the same area collected the
remainder. Those fourteen accessions were pro-vided by the Tomato Genetics Resource Center(TGRC, University of California, Davis, CA) thathosts one of the world’s largest germplasm collec-tions of L. pimpinellifolium. Nine accessions of L.esculentum, also collected at the ENSO98 expedi-tion, were included in the assays. These were mostlylandraces and naturalized cultivars found growingsympatrically with L. pimpinellifolium in areasintensely disturbed by ENSO. We also includedin the molecular assays, ten Spanish tomato land-races, seven accessions of the wild form of tomato,L. esculentum var. cerasiforme (Dun.) A. Gray,from different origins, and representatives of otherwild species i.e.L. cheesmaniaeRiley,L. parviflorumRick, Kesicki, Fobes and Holle, L. peruvianum (L.)Mill., L. chilense Dun. and L. pennellii (Corr.)D’Arcy (Table 1).
Culture management
Five plants were grown from seeds of each acces-sion. These were cultivated under uniform condi-tions in the greenhouses of the COMAV, socomparisons could be made that were not feasiblein the wild. Plants were randomly arranged in thegreenhouse (spaced at 30 · 50 cm). The assay wasconducted during the spring–summer growingseason.
Morphological characterization
Morphological traits included those in two tomatodescriptors (UPOV 1976; IPGRI 1996), andadditional traits selected from previous experi-ences with wild species management, were scoredper plant. The scored qualitative and quantitativetraits are listed in Table 2.
Isolation of DNA
Young leaf tissue was sampled from the five plantsper accession used in the morphological charac-terization. Genomic DNA was isolated from thistissue using the modified CTAB (hexadecyltrimethylammonium bromide) method describedin Ferriol et al. (2003). For AFLP analysis, geno-mic DNA from the five plants per accession was

Table 1. List of L. pimpinellifolium and L. esculentum accessions collected in northwestern Peru during the ENSO98 expedition.
Accession number Area
code
Department or
province (Country)cCollection sited Latitude
(S)
Longitude
(W)
Altitude
(m)
Year of
collection
L. pimpinellifolium
PL603a A Piura (P) Road Piura–Talara 4�51¢37¢¢ 80�47¢07¢¢ 75 1998
PL604 Road Piura–Talara 4�51¢01¢¢ 80�50¢57¢¢ 25 1998
PL660 San Isidro 4�48¢37¢¢ 80�17¢46¢¢ 200 1998
PL561 Tambo Grande 4�53¢32¢¢ 80�22¢31¢¢ 100 1998
PL650 Tambo Grande 4�53¢32¢¢ 80�22¢31¢¢ 100 1998
PL560 Tambo Grande 4�55¢00¢¢ 80�20¢35¢¢ 100 1998
PL562 El Pedregal 4�56¢02¢¢ 80�32¢22¢¢ 100 1998
LA2652b Road Sullana 4�53¢ 80�41¢ 100 1984
LA2653 S. Fco de Chocan 4�45¢ 80�35¢ 50 1984
LA1688 El Pedregal 4�55¢ 80�22¢ �112 1976
PL567 B Piura (P) Piura 5�11¢13¢¢ 80�37¢33¢¢ 40 1998
PL568 Piura 5�11¢13¢¢ 80�37¢33¢¢ 40 1998
PL575 Catacaos 5�16¢54¢¢ 80�41¢03¢¢ 25 1998
PL576 Catacaos 5�16¢54¢¢ 80�41¢03¢¢ 25 1998
PL647 Montesion 5�17¢00¢¢ 80�41¢14¢¢ 50 1998
PL577 Montesion 5�19¢20¢¢ 80�42¢49¢¢ 35 1998
LA1689 Piura, Castilla 5�12¢ 80�36¢ �152 1976
LA1690e Piura, Castilla 5�13¢ 80�38¢ �152 1976
PL578 C Piura (P) Sechura 5�26¢03¢¢ 80�45¢35¢¢ 75 1998
PL579 Sechura 5�31¢52¢¢ 80�49¢13¢¢ 30 1998
PL580 Sechura 5�31¢52¢¢ 80�49¢13¢¢ 30 1998
LA1683 Miramar 5�31¢ 80�50¢ �7 1976
PL563 D Piura (P) Morropon 5�09¢15¢¢ 80�10¢05¢¢ 110 1998
PL564 Morropon 5�14¢39¢¢ 80�06¢03¢¢ 75 1998
PL565 Buenos Aires 5�17¢14¢¢ 79�57¢29¢¢ 175 1998
PL566 Buenos Aires 5�17¢14¢¢ 79�57¢15¢¢ 175 1998
PL569 Buenos Aires 5�17¢56¢¢ 79�56¢35¢¢ 160 1998
PL570 Buenos Aires 5�19¢46¢¢ 79�55¢06¢¢ 150 1998
PL571 Victor Raul 5�20¢46¢¢ 79�50¢57¢¢ 190 1998
PL574 Chanchape 5�25¢59¢¢ 79�44¢32¢¢ 225 1998
PL573 Chanchape 5�26¢07¢¢ 79�44¢37¢¢ 225 1998
PL572 Chanchape 5�26¢11¢¢ 79�44¢41¢¢ 275 1998
LA0400 Hacienda Buenos Aires 5�15¢ 79�58¢ �146 1976
LA1684 Chulucanas 5�07¢¢ 80�00¢ �140 1976
PL581 E Piura (P) Road Piura–Olmos Km. 68 5�16¢42¢¢ 80�06¢21¢¢ 200 1998
PL582 Road Piura–Olmos Km. 84 5�23¢26¢¢ 80�03¢24¢¢ 190 1998
PL583 Road Piura–Olmos Km. 90 5�26¢24¢¢ 80�01¢54¢¢ 150 1998
PL658 Road Piura-Olmos Km. 98 5�29¢13¢¢ 80�00¢36¢¢ 160 1998
PL585 Road Piura–Olmos Km. 104 5�33¢14¢¢ 79�58¢41¢¢ 240 1998
PL586 Road Piura–Olmos Km. 104 5�33¢14¢¢ 79�58¢41¢¢ 240 1998
LA1380 Chanchape 5�16¢ 80�03¢ �199 1971
PL588 Lambayeque (P) Road Piura-Olmos Km. 111 5�35¢54¢¢ 79�57¢06¢¢ 210 1998
PL589 Road Piura–Olmos Km. 111 5�35¢54¢¢ 79�57¢06¢¢ 210 1998
PL587 Road Piura-Olmos Km. 08 5�35¢21¢¢ 79�58¢13¢¢ 325 1998
PL591 Road Piura-Olmos Km. 140 5�49¢05¢¢ 79�49¢59¢¢ 150 1998
PL592 Road Piura-Olmos Km. 140 5�49¢05¢¢ 79�49¢59¢¢ 150 1998
PL593 Road Piura-Olmos Km.140 5�49¢05¢¢ 79�49¢59¢¢ 150 1998
PL594 Road Piura-Olmos Km. 156 5�55¢28¢¢ 79�46¢29¢¢ 200 1998
PL595 Road Piura–Olmos Km. 156 5�55¢28¢¢ 79�46¢29¢¢ 200 1998
LA1381 Naupe 5�36¢ 79�54¢ �168 1971
LA1469 El Pilar, Olmos 5�52¢ 79�47¢ �229 1971

Table 1. Continued.
Accession number Area
code
Department or
province (Country)cCollection sited Latitude
(S)
Longitude
(W)
Altitude
(m)
Year of
collection
PL516 F Lambayeque (P) Road Olmos-Jaen 5�59¢42¢¢ 79�43¢03¢¢ 230 1998
PL517 Road Olmos-Jaen 5�59¢42¢¢ 79�43¢03¢¢ 230 1998
PL596 Road Olmos-Jaen 5�59¢42¢¢ 79�43¢03¢¢ 230 1998
PL597 Road Olmos-Jaen 5�59¢42¢¢ 79�43¢03¢¢ 230 1998
PL598 Road Olmos-Jaen 5�59¢42¢¢ 79�43¢03¢¢ 230 1998
PL599 Road Olmos-Jaen 5�59¢42¢¢ 79�43¢03¢¢ 230 1998
PL600 Road Olmos-Jaen 5�59¢42¢¢ 79�43¢03¢¢ 230 1998
PL601 Road Olmos-Jaen 5�59¢42¢¢ 79�43¢03¢¢ 230 1998
PL602 Road Olmos-Jaen 5�59¢42¢¢ 79�43¢03¢¢ 230 1998
PL655 Road Olmos-Jaen 5�59¢41¢¢ 79�43¢03¢¢ 230 1998
LA 1470 Motupe direction Olmos-Bagua 6�01¢ 79�41¢ �241 1971
LA1471 Motupe to Jayanca 6�19¢ 79�45¢ �76 1971
LA2915 Olmos 5�59¢ 79�44¢ �241 1987
L. esculentum
PL508 Loja (E) Zapotebamba 4�02¢23¢¢ 79�47¢19¢¢ 950 1998
PL509 Zapotebamba 4�02¢23¢¢ 79�47¢19¢¢ 950 1998
PL510 Zapotebamba 4�02¢23¢¢ 79�47¢19¢¢ 950 1998
PL511 Zapotebamba 4�02¢23¢¢ 79�47¢19¢¢ 950 1998
PL515 Piura (P) Huancabamba 5�16¢48¢¢ 79�28¢16¢¢ 2280 1998
PL648 Dos Pueblos 5�27¢34¢¢ 80�45¢57¢¢ 25 1998
PL518 Lambayeque (P) Road Olmos-Jaen 5�59¢42¢¢ 79�43¢03¢¢ 230 1998
PL519 Road Olmos-Jaen 5�59¢42¢¢ 79�43¢03¢¢ 230 1998
PL520 Road Olmos-Jaen 5�59¢42¢¢ 79�43¢03¢¢ 230 1998
AN-L-42 Tomate morado Andalucıa (S) Cadiz – – – –
CA-L-96 Tomate canario Canarias (S) Santa Cruz de Tenerife – – – –
C-L-120 Tomate de penjar Cataluna (S) Barcelona – – – –
CM-L-133 Tomate gordo C. La mancha (S) Cuenca – – – –
E-L-22 Tomate rosa Extremadura (S) Badajoz – – – –
MU-L-20 Cuarenteno Murcia (S) Murcia – – – –
MU-L-31 Muchamiel Murcia (S) Murcia – – – –
VL-115 Valenciano C. Valenciana (S) Castellon – – – –
VL-264 Valenciano C. Valenciana (S) Valencia – – – –
VL-268 Amarillo Gordo C. Valenciana (S) Valencia – – – –
L. esculentum var. cerasiforme
Mex 0012 Yucatan (M) Cansahcab to Dizdzautum 21� 89� <100 –
Mex 0070 Puebla (M) Huenchinango 20� 98� 1.500 –
Mex 0120 Nayarit (M) Santispac 22� 105� <100 –
ECU78 Zam-Chinchip(E) Timbara 4�01¢ 78�33¢ 975
LA1307 Ayacucho(P) San Francisco 12�35¢ 73�49¢ 600 –
LA1312 Cuzco(P) Paisanato – – 600 –
LA1388 Junın(P) San Ramon 11�07¢N 75�19¢ 700 –
GLP-65 L cheesmanii Baltra(E) Canal Norte 0�24¢52¢¢ 90�17¢04¢¢ 10 –
LA1960 L. chilense Moquegua(P) Road Moquegua to Torata 17�05¢00¢¢ 70�52¢00¢¢ 1850 –
LA0247 L. parviflorum Huanco(P) Chavinillo 9�46¢00¢¢ 76�32¢00¢¢ 3802 –
PE-45 L. pennellii Ancash(P) Road Santa-Huaraz 9�04¢00¢¢ 77�59¢00¢¢ 350 –
PE-16 L. peruvianum Cajamarca(P) San Jose 7�03¢00¢¢ 78�16¢00¢¢ 2370 –
Lycopersicon pimpinellifolium accessions provided by the Tomato Genetics Resource Center, Spanish tomato landraces held at the
COMAV genebank and accessions of other wild Lycopersicon spp., used as reference in the analysis, are also included.aPL: The code PL refers to the institutions (University of Piura and Loja) that participate in the ENSO98 expedition.bLA: Accessions provided by the Tomato Genetics Resource Center.cP: Peru; E: Ecuador; M: Mexico; S: Spain.dLocality closest to the collection site.eThe underlined accessions were also assayed in Rick et al. (1977).
pooled, whereas plants were individually analyzedwith SSRs.
Amplified fragment length polymorphism (AFLP)analysis
The protocol described previously for AFLPs wasfollowed (Ferriol et al. 2003; Nuez et al. 2004). The
re-selective amplification of theAFLP techniquewasconducted using the primers EcoRI+A (5¢ – GACTGC GTA CCA ATT CA – 3¢) and MseI+C(5¢ – GAT GAG TCC TGA GTA AC – 3¢). Sixdifferent primer combinations were used in theselective amplification (EcoRI-AAC/MseI-CAC,EcoRI-ACA/MseI-CAC, EcoRI-AGG/MseI-CAC,EcoRI-ACG/MseI-CTA, EcoRI-ACT/MseI-CAA,EcoRI-AGC/MseI-CAA). Electrophoresis was
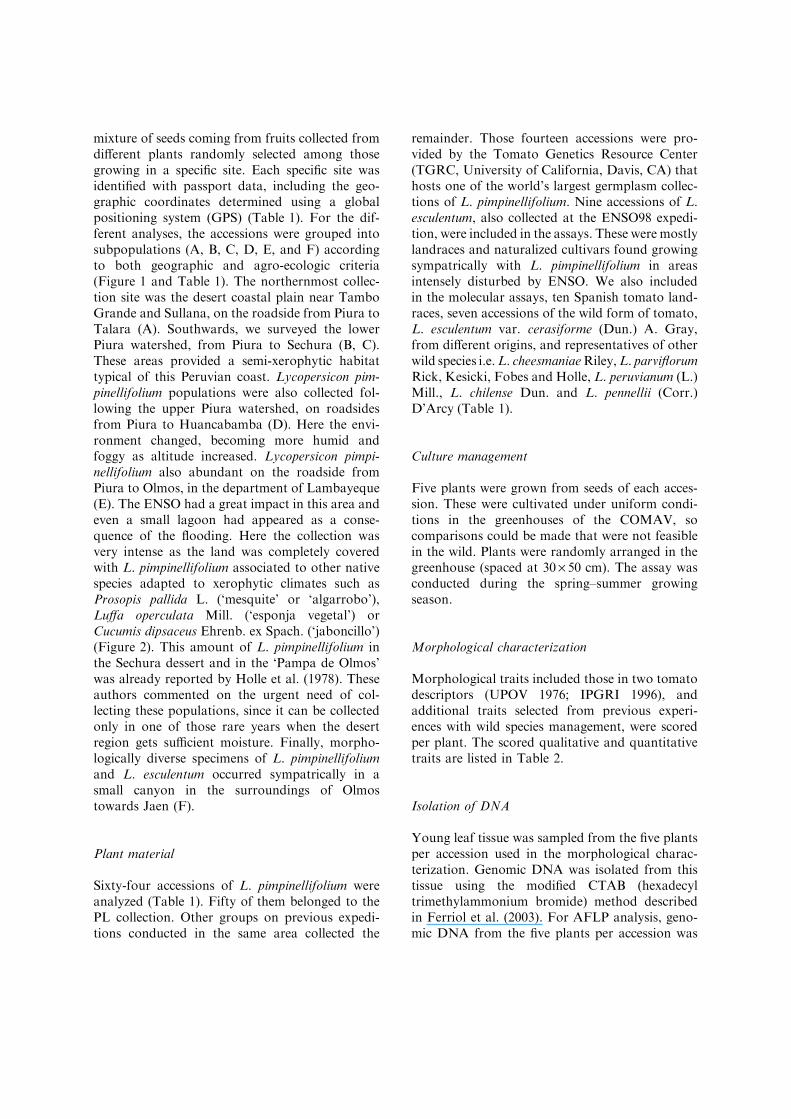
Figure 1. Map of the north-western region of Peru. The areas surveyed during the ENSO 98 expedition are indicated and named with a
letter code.
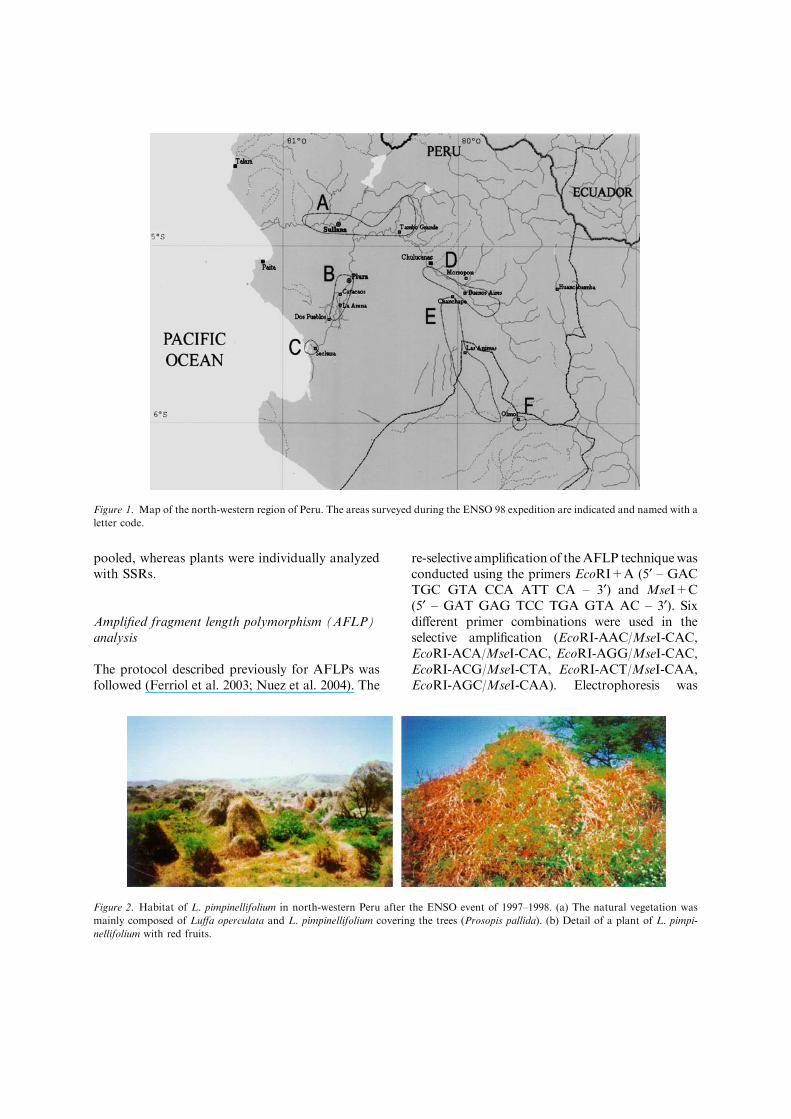
Figure 2. Habitat of L. pimpinellifolium in north-western Peru after the ENSO event of 1997–1998. (a) The natural vegetation was
mainly composed of Luffa operculata and L. pimpinellifolium covering the trees (Prosopis pallida). (b) Detail of a plant of L. pimpi-
nellifolium with red fruits.

conducted using an ABI PRISM 310 Genetic Ana-lyzer (Applied Biosystems, Foster City, CA). Rawdata were analyzed with GeneScan 3.1.2 analysissoftware (Applied Biosystems) and the resultingGeneScan trace files were imported into Genogra-pher 1.6.0. (http://hordeum.oscs.montana.edu/genographer/). The AFLP fragments from 60 to380 bp were scored in Genographer as present (1) orabsent (0).
Simple sequence repeats (SSR) analysis
In the present study, we use 15 primer pairs(LE2A11, LE20592, LE21085, LEATPACAa,LEATPACAb, LECAB9, LECHI3, LEGAST1,LEGTOM5, LEILV1B, LELEUZIP, LEMDDNb,
LESSF, LEWIPIG, LPHFS24), selected fromthose reported by Smulders et al. (1997) as poly-morphic within the wild Lycopersicon species andwith a high number of alleles. These SSRs representdifferent types of repetitions. PCR reactions wereperformed according to the procedure reported bythese authors. The forward primers were labeledwith different fluorescent dyes and 6 loci weresimultaneously detected using an ABI PRISM 310Genetic Analyzer.
Data analysis
Pearson correlation coefficients (r) and partialcorrelations (rp) were calculated among quantita-tive traits. Principal Components Analysis (PCA)
Table 2. Qualitative and quantitative traits used in the morphological characterization of the accessions collected in northwestern Peru
during the ENSO98 expedition.
Plant Flower and inflorescence Fruit
Quantitative traits
Stem width (cm) SW Number of petals NP Fruit length (cm) FL
Height of the 3rd
inflorescence (cm) H3I
Number of sepals NSp Fruit width (cm) FW
Number of leaves between
inflorescences NLI
Number of stamens NSt Pedicel length (mm) PeL
Number of leaflets per
leaf NLe
Petal length PL Pedicel length from the abscission
layer (mm) PeLA
Number of small leaflets per
leaf NSLe
Petal width (mm) PW Number of locules NL
Leaf length (cm) LL Sepal length (mm) SpL Width of pedicel scar (mm) WPS
Leaf width (cm) LW Sepal width (mm) SpW Fruit pubescence (0–4) FP
Leaflet length (cm) LeL Style length (mm) SL Intensity of external colour (0–4) IEC
Leaflet width (cm) LeW Stigam exsertion beyond the
anther tube (mm) SE
Intensity of flesh colour (0–4) IFC
Stem pubescence density
(scored from 0 to 4) SPD
Stamen length (mm) StL Lightness L
Stem pubescence length
(0–4) SPL
Anther cone width (mm) ACW Hue angle (arctg (b/a)) TAN
Leaflet pubescence density
(0–4) LePD
Style hairiness (0–4) SH
Number of flowers per truss NFT
Inflorescence peduncle length (cm) IPL
Inflorescence length (cm) IL
Number of branches per inflorescence NBI
Qualitative traits
Plant growth type (determinate,
semi-determinate, indeterminate)
Style position (inserted, same level as
stamens, slightly exserted, highly exserted)
Fruit color (green, yellow, orange, red)
Stipules on the leaves
(presence, absence)
Style shape (simple, fasciated, divided) Epidermis color (colorless, yellow)
Anthocyanin coloration of stems
(presence, absence)
Ovary shape (simple, slightly fasciated,
fasciated)
Jointless pedicel (presence, absence)
Anthocyanin coloration of leaf veins
(presence, absence)
Inflorescence type
(uniparous, multiparous)
was performed with the standardized morpholog-ical quantitative data ((Zij = Xij�CMINi)/(CMAXi�CMINi), where Xij is the value of thei trait for the j accession, CMINi is the minimumvalue and CMAXi the maximum value of thej accessions for the i trait) to obtain a graphicrepresentation of the relationship structure of thecharacterized accessions (NTSYSpc v.2.02, Rohlf1998). A unifactorial analysis of the variance(ANOVA) and a Duncan test for means compar-ison was conducted using the more outstandingtraits (Statgraphics plus v 4.0).
In AFLP molecular analysis, the Dice similaritycoefficient among accessions was calculated (Dice1945). The similarity matrix was subjected to aPrincipal Coordinate Analysis (PCoA) (NTSYSpcv.2.02). The percentage of polymorphic loci (Pp), thegene diversity (Nei 1973) in each subpopulation, Ds,and in the global collection, Dt), and the differenti-ation coefficient (Nei 1977), GST = ((Dt�Ds)/Dt),were also calculated (Popgene v.1.32, Yeh et al.1997).
Genetic distances of Cavalli-Sforza and Ed-wards (1967) between accessions were calculatedwith SSRs data and used to construct a distancematrix. Previous studies showed that this distanceis adequate for the analysis of intra-specific var-iability with SSR markers (Takezaki and Nei1996). To compare the genetic distance calculatedwith the different marker systems we used aMantel test (Mantel 1967) (NTSYSpc v.2.02).The data from the SSR analysis were also sub-jected to a Factorial Correspondence Analysis(FCA) (Escofier and Pages 1990) to determine therelationships among the different plants. Themean number of alleles (Nm) and the polymor-phic information content (Pic) per locus, theexpected heterozygosity (He), assuming Hardy–Weinberg equilibrium, the observed heterozygos-ity (H0), and the percentage of polymorphic loci(Pp) (per accession, in different subpopulationsand per species) were also calculated. The geneticstructure of populations was analyzed by usingthe Wright F parameters, FIS, FIT y FST,according to Weir and Cockerham (1984)(Genetix v.4.04, Belkhir et al. 1996–2002). Aspatial autocorrelation analysis (Smouse andPeakall 1999), using 99 permutations, was per-formed with SSR data to study the correlationbetween genetic and geographic distance. Thisanalysis allows the study of genetic structures at
much shorter distances than other estimates ofgenetic differentiation, such as FST.
Results
Variability of qualitative traits
All plants displayed an indeterminate growth ha-bit, leaves without stipules, anthocyaninless stemsand leaves, simple styles and ovaries, uniparousinflorescences, and jointless pedicels as conformsto the standard L. pimpinellifolium phenotype(Taylor 1986). Variability was found for the colorof the fruit flesh and epidermis. L. pimpinellifoliumis typically a red-fruited species, but some PLaccessions from the Lambayeque department(PL592 and PL593 from the area E, and PL597,PL598, PL599, PL601 and PL602 from the area F)exhibited orange or yellow fruits, a trait deter-mined by the common r mutant, yellow fruit flesh.Furthermore, in most of the areas surveyed, plantscarrying the recessive y mutation, colorless fruitepidermis that results in absence of pigment in thefruit epidermis, were found growing with plantswith fruits of yellow epidermis. The percentage ofplants with colorless fruits in the different areasranged from 3 to 60%. The accession PL602 wasmutant for traits y and r. The PL collection wasalso highly variable for the style position. Mostaccessions had flowers with slightly to highlyexserted stigmas. However, a high proportion ofplants with stigmas at the same level as the sta-mens were found among the accessions collected atthe area F.
Correlations between traits
Significant positive correlations were foundbetween traits measuring leaf size, such as lengthand width of leaves and leaflets (r/rpLW�LL=0.70/0.70, r/rpLW�LeL=0.88/0.23, r/rpLW�LeW=0.81/0.73, r/ rpLL�LeL =0.68/0.48, r/rpLL�LeW=0.58/0.58, r/rpLeL�LeW=0.72/0.64), between traits re-lated to flower size and display, such as length andwidth of petals and sepals, stamens and stylelength, and stigma exsertion (r/rpPL�PW=0.84/0.76, r/rpPL�SpW=0.75/0.08, r/rpPL�SpL=0.64/0.34, r/rpPL�StL=0.76/0.16, r/rpPL�SE=0.61/0.14,r/rpPW�StL=0.60/0.30, r/rpPW�SpW=0.86/0.40,

r/rpPW�SpL=0.71/0.51, r/rpSE�StL = 0.44/0.69),between traits related to inflorescence size anddisplay, such as number of flowers per trussand inflorescence length (r/rpNFT�IL=0.83/0.75,r/rpIL�IPL=0.62/0.71), and between the traitsmeasuring fruit size, such as fruit length and width(r/rpFW�FL=0.95/0.96).
Morphological multivariate analysis
A Principal Component Analysis was conductedusing the quantitative data of all PL accessions,L. pimpinellifolium and L. esculentum (Figure 3a,b). The first and the second components ac-counted for 32.3% and 15.3% of the total vari-ation. The first component separated theaccessions of the two species Figure 3b). L. es-culentum accessions displayed large and multi-loculated fruits (FW, FL, WPS, NL, PeL andPeLA), flowers with a variable number of petals,sepals and stamens (from 5 to 6) (NSp, NP andNSt), and with sepals larger than petals, a wideanther cone and a short style with inserted stigma(SpW, ACW, SpL). Furthermore, the plants ofthe cultivated species were shorter, although morerobust, than those of L. pimpinellifolium, anddeveloped larger and more densely pubescentleaves (LW, LL, LeL, Lew).
Lycopersicon pimpinellifolium accessions weregrouped on the basis of the first component, dis-playing typical characteristics of wild species, suchas slender plants (H3I), and long inflorescenceswith a larger number of flowers (IL, NFT, IPL).The accessions of this species were distributedalong the axis of the second component. This dis-tribution was concordant with a gradual variationin the size of floral structures. The majority of thered-fruited accessions were distributed in the upperhalf of the graph, displaying attractive flowers withlarge petals (PL, PW), long styles and stamens(StL, SL), and stigmas exserted beyond the anthercone (SE). The degree of stigmatic exsertion ofthese red-fruited accessions was variable in all theareas surveyed (A=1.4–3.4 mm, B=1.1–2.7 mm,C=2.3–3.8 mm, D=0.8–2.5 mm, E=2.1–4.3 mm,F=1.8–2.3 mm). The accessions PL577, PL579,PL587, collected in different areas (B, C, and E),grouped separately from the others due to theirlarge flowers with highly exserted.
The only yellow-fruited accessions from the areaE (PL592 and PL593) appeared interspersed withother red-fruited accessions. However, most of theyellow-fruited accessions from the area F (PL598,PL599, PL601 and PL602) were grouped separatelyfrom the other in the lower part of the graph. Inaddition to fruit color differences, the yellow-fruitedaccessions were more pubescent, had smallerflowers with a lower degree of stigmatic exsertion,inflorescences with a lower number of flowers, andlarger fruits (Table 3).
In general, the accessions of L. pimpinellifoliumdid not group according to their geographicalorigins. Similar morphological types were col-lected from the different areas. The accessionsfrom the area F were the more variable. The dif-ferent morphological types collected at this areaappeared scattered in the PCA (Figure 3b). Therealso were no clinal patterns. We did not find anyassociation between the morphological distribu-tion observed in the PCA and different parameterssuch as altitude, latitude, longitude and distance tothe coast.
Molecular polymorphism
Between 73 and 157 reproducible fragments wereamplified per AFLPs primer combination, with anaverage of 111 bands per combination. For all thespecies together, a total of 665 bands were ampli-fied, of which 622 (93%) were polymorphic.Among them, 447 fragments were amplified inL. pimpinellifolium, of which 337 (75%) werepolymorphic. Simple sequence repeats were morepolymorphic than AFLPs, as expected due to thehigher mutation rates of the microsatellite regions.All the assayed SSR loci were polymorphic amongLycopersicon spp. An average of 11.5 SSRs allelesper locus were found in all the species, rangingfrom 3 to 24, whereas an average of 6.7 alleles,ranging from 2 to 20, were identified in L. pimpi-nellifolium (Table 4). LE2A11, LEATPACAa,LECAB9, LELEUZIP, LEMDDNb, LEWIPIG,LEGAST1 and LPHFS24 were polymorphicwithin L. pimpinellifolium, but had one allele muchmore frequent than the others. The remaining lociwere highly polymorphic within this species.
Certain alleles were present inmostL. esculentumcultivars and in accessions of the var. cerasiforme,but absent in L. pimpinellifolium. Also, some

Figure 3. Principal Components Analysis (PCA) performed with the standardized quantitative morphological data of the L. pimpi-
nellifolium and L. esculentum accessions collected at the ENSO98 expedition. (a) Diagram showing the relationships among the
quantitative characters. The codes of the quantitative traits are included in Table 2. (b) Phenetic morphological structure among the
nine accessions of L. esculentum (�) and the 50 accessions of L. pimpinellifolium. (Figure symbols: A (r), B (n), C (n), D (•), red-fruitedE (m), yellow-fruited E (m), red-fruited F (·), and yellow-fruited F (+)) .
alleles abundant in L. pimpinellifolium and wereabsent or rare in L. esculentum.
Molecular multivariate analysis
Principal Coordinates Analysis (PCoA) of AFLPdata differentiated the green-fruited species(L. pennellii, L. parviflorum, L. peruvianum andL. chilense) from those red–orange and yellow-fruited (L. esculentum, L. esculentum var. cerasi-forme, L. pimpinellifolium and L. cheesmanii) (datanot shown).
Multivariate analyses, PCoA with AFLPs andFCA with SSRs, were also performed using onlydata from L. pimpinellifolium accessions, both PLand TGRC (Figure 4a, b). The two principalfactors accounted for 10.2% and 8%, and 4.4%
and 3.7% of the total variation, for AFLPs andSSRs, respectively. The correlation between thegenetic distance matrices obtained with AFLPsand SSRs was 0.48 (p<0.05) (Mantel 1967).Despite the differences found with the two markersystems, there were several common aspects toboth analysis: (a) TGRC accessions were inter-spersed with PL accessions from different collec-tion areas, but they did not represent all thedifferent types included in the PL collection; (b) Aswith the results obtained previously with themorphological traits, PL accessions groupedindependently of their origin. Similar moleculartypes were found even in different river basins, inareas separated by large geographic distances; (c)According to the two principal axes of variation ofPCoA and FCA, the yellow-fruited accessionscollected in the area F (PL597, PL598, PL599,
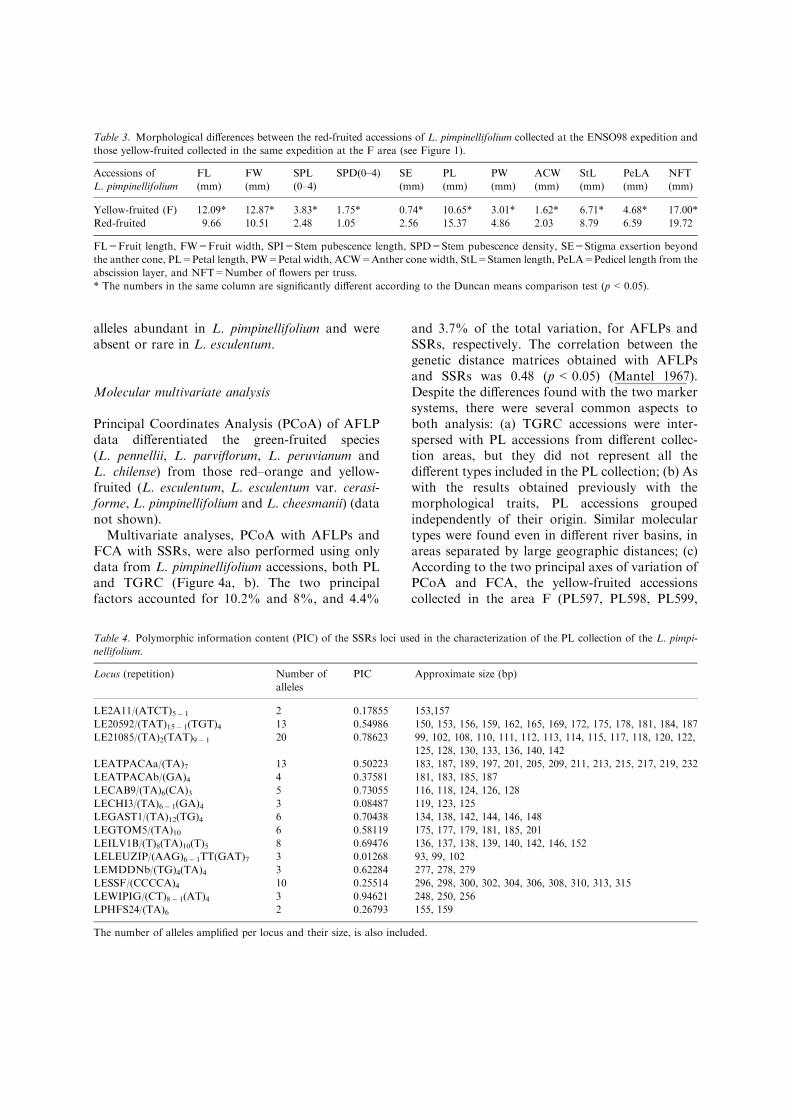
Table 4. Polymorphic information content (PIC) of the SSRs loci used in the characterization of the PL collection of the L. pimpi-
nellifolium.
Locus (repetition) Number of
alleles
PIC Approximate size (bp)
LE2A11/(ATCT)5� 1 2 0.17855 153,157
LE20592/(TAT)15� 1(TGT)4 13 0.54986 150, 153, 156, 159, 162, 165, 169, 172, 175, 178, 181, 184, 187
LE21085/(TA)2(TAT)9� 1 20 0.78623 99, 102, 108, 110, 111, 112, 113, 114, 115, 117, 118, 120, 122,
125, 128, 130, 133, 136, 140, 142
LEATPACAa/(TA)7 13 0.50223 183, 187, 189, 197, 201, 205, 209, 211, 213, 215, 217, 219, 232
LEATPACAb/(GA)4 4 0.37581 181, 183, 185, 187
LECAB9/(TA)6(CA)3 5 0.73055 116, 118, 124, 126, 128
LECHI3/(TA)6� 1(GA)4 3 0.08487 119, 123, 125
LEGAST1/(TA)12(TG)4 6 0.70438 134, 138, 142, 144, 146, 148
LEGTOM5/(TA)10 6 0.58119 175, 177, 179, 181, 185, 201
LEILV1B/(T)8(TA)10(T)5 8 0.69476 136, 137, 138, 139, 140, 142, 146, 152
LELEUZIP/(AAG)6� 1TT(GAT)7 3 0.01268 93, 99, 102
LEMDDNb/(TG)4(TA)4 3 0.62284 277, 278, 279
LESSF/(CCCCA)4 10 0.25514 296, 298, 300, 302, 304, 306, 308, 310, 313, 315
LEWIPIG/(CT)8� 1(AT)4 3 0.94621 248, 250, 256
LPHFS24/(TA)6 2 0.26793 155, 159
The number of alleles amplified per locus and their size, is also included.
Table 3. Morphological differences between the red-fruited accessions of L. pimpinellifolium collected at the ENSO98 expedition and
those yellow-fruited collected in the same expedition at the F area (see Figure 1).
Accessions of
L. pimpinellifolium
FL
(mm)
FW
(mm)
SPL
(0–4)
SPD(0–4) SE
(mm)
PL
(mm)
PW
(mm)
ACW
(mm)
StL
(mm)
PeLA
(mm)
NFT
(mm)
Yellow-fruited (F) 12.09* 12.87* 3.83* 1.75* 0.74* 10.65* 3.01* 1.62* 6.71* 4.68* 17.00*
Red-fruited 9.66 10.51 2.48 1.05 2.56 15.37 4.86 2.03 8.79 6.59 19.72
FL=Fruit length, FW=Fruit width, SPI=Stem pubescence length, SPD=Stem pubescence density, SE=Stigma exsertion beyond
the anther cone, PL=Petal length, PW=Petal width, ACW=Anther cone width, StL=Stamen length, PeLA=Pedicel length from the
abscission layer, and NFT=Number of flowers per truss.
* The numbers in the same column are significantly different according to the Duncan means comparison test (p<0.05).
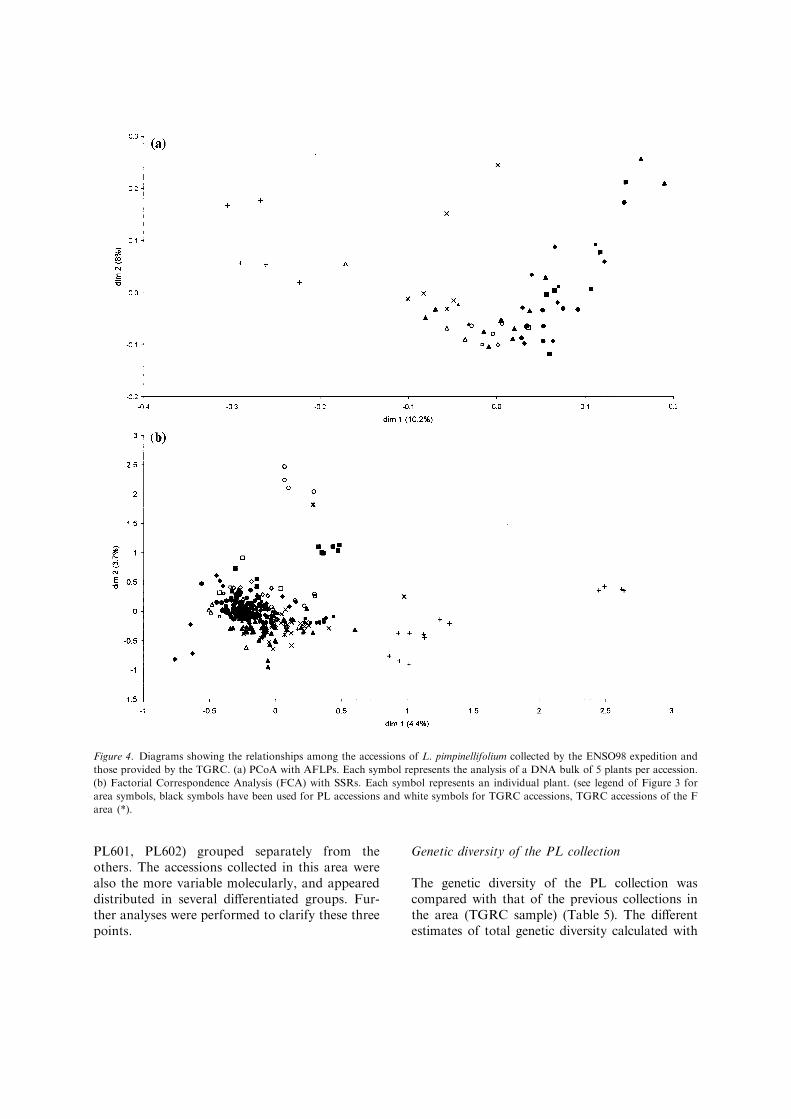
PL601, PL602) grouped separately from theothers. The accessions collected in this area werealso the more variable molecularly, and appeareddistributed in several differentiated groups. Fur-ther analyses were performed to clarify these threepoints.
Genetic diversity of the PL collection
The genetic diversity of the PL collection wascompared with that of the previous collections inthe area (TGRC sample) (Table 5). The differentestimates of total genetic diversity calculated with
Figure 4. Diagrams showing the relationships among the accessions of L. pimpinellifolium collected by the ENSO98 expedition and
those provided by the TGRC. (a) PCoA with AFLPs. Each symbol represents the analysis of a DNA bulk of 5 plants per accession.
(b) Factorial Correspondence Analysis (FCA) with SSRs. Each symbol represents an individual plant. (see legend of Figure 3 for
area symbols, black symbols have been used for PL accessions and white symbols for TGRC accessions, TGRC accessions of the F
area (*).
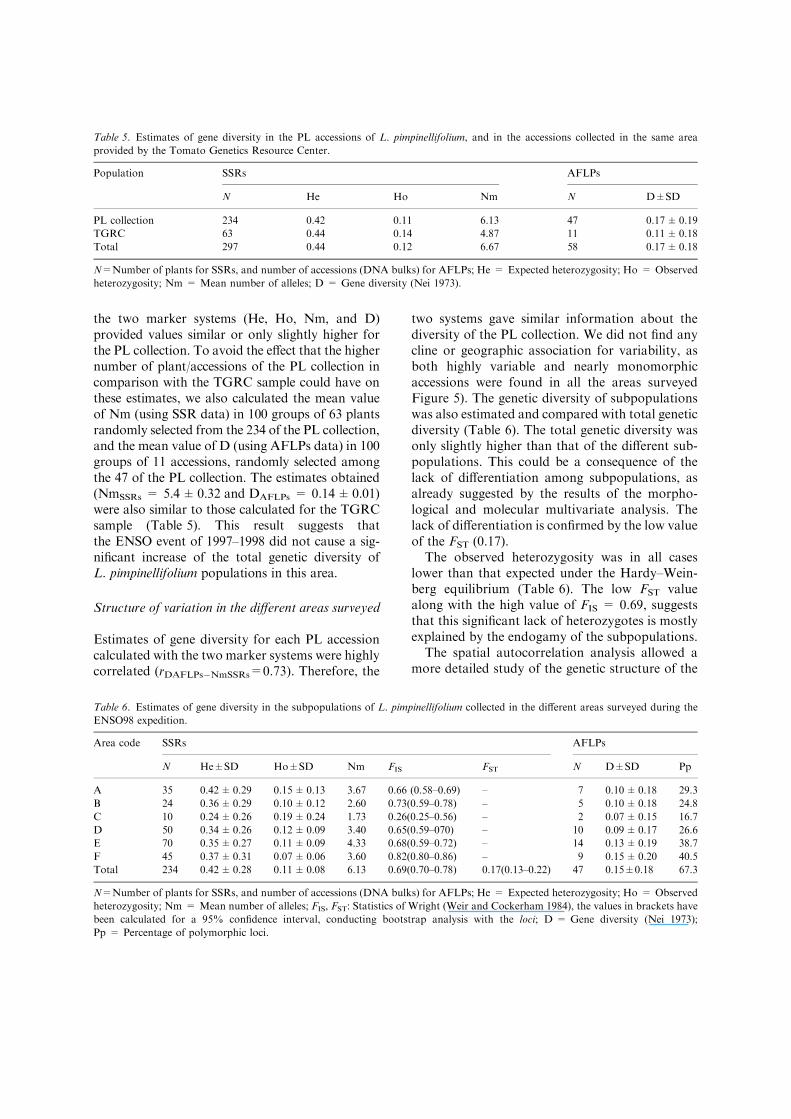
the two marker systems (He, Ho, Nm, and D)provided values similar or only slightly higher forthe PL collection. To avoid the effect that the highernumber of plant/accessions of the PL collection incomparison with the TGRC sample could have onthese estimates, we also calculated the mean valueof Nm (using SSR data) in 100 groups of 63 plantsrandomly selected from the 234 of the PL collection,and the mean value of D (using AFLPs data) in 100groups of 11 accessions, randomly selected amongthe 47 of the PL collection. The estimates obtained(NmSSRs = 5.4±0.32 and DAFLPs = 0.14±0.01)were also similar to those calculated for the TGRCsample (Table 5). This result suggests thatthe ENSO event of 1997–1998 did not cause a sig-nificant increase of the total genetic diversity ofL. pimpinellifolium populations in this area.
Structure of variation in the different areas surveyed
Estimates of gene diversity for each PL accessioncalculated with the two marker systems were highlycorrelated (rDAFLPs�NmSSRs=0.73). Therefore, the
two systems gave similar information about thediversity of the PL collection. We did not find anycline or geographic association for variability, asboth highly variable and nearly monomorphicaccessions were found in all the areas surveyedFigure 5). The genetic diversity of subpopulationswas also estimated and compared with total geneticdiversity (Table 6). The total genetic diversity wasonly slightly higher than that of the different sub-populations. This could be a consequence of thelack of differentiation among subpopulations, asalready suggested by the results of the morpho-logical and molecular multivariate analysis. Thelack of differentiation is confirmed by the low valueof the FST (0.17).
The observed heterozygosity was in all caseslower than that expected under the Hardy–Wein-berg equilibrium (Table 6). The low FST valuealong with the high value of FIS = 0.69, suggeststhat this significant lack of heterozygotes is mostlyexplained by the endogamy of the subpopulations.
The spatial autocorrelation analysis allowed amore detailed study of the genetic structure of the
Table 5. Estimates of gene diversity in the PL accessions of L. pimpinellifolium, and in the accessions collected in the same area
provided by the Tomato Genetics Resource Center.
Population SSRs AFLPs
N He Ho Nm N D±SD
PL collection 234 0.42 0.11 6.13 47 0.17±0.19
TGRC 63 0.44 0.14 4.87 11 0.11±0.18
Total 297 0.44 0.12 6.67 58 0.17±0.18
N=Number of plants for SSRs, and number of accessions (DNA bulks) for AFLPs; He = Expected heterozygosity; Ho = Observed
heterozygosity; Nm = Mean number of alleles; D = Gene diversity (Nei 1973).
Table 6. Estimates of gene diversity in the subpopulations of L. pimpinellifolium collected in the different areas surveyed during the
ENSO98 expedition.
Area code SSRs AFLPs
N He±SD Ho±SD Nm FIS FST N D±SD Pp
A 35 0.42±0.29 0.15±0.13 3.67 0.66 (0.58–0.69) – 7 0.10±0.18 29.3
B 24 0.36±0.29 0.10±0.12 2.60 0.73(0.59–0.78) – 5 0.10±0.18 24.8
C 10 0.24±0.26 0.19±0.24 1.73 0.26(0.25–0.56) – 2 0.07±0.15 16.7
D 50 0.34±0.26 0.12±0.09 3.40 0.65(0.59–070) – 10 0.09±0.17 26.6
E 70 0.35±0.27 0.11±0.09 4.33 0.68(0.59–0.72) – 14 0.13±0.19 38.7
F 45 0.37±0.31 0.07±0.06 3.60 0.82(0.80–0.86) – 9 0.15±0.20 40.5
Total 234 0.42±0.28 0.11±0.08 6.13 0.69(0.70–0.78) 0.17(0.13–0.22) 47 0.15±0.18 67.3
N=Number of plants for SSRs, and number of accessions (DNA bulks) for AFLPs; He = Expected heterozygosity; Ho = Observed
heterozygosity; Nm = Mean number of alleles; FIS, FST: Statistics of Wright (Weir and Cockerham 1984), the values in brackets have
been calculated for a 95% confidence interval, conducting bootstrap analysis with the loci; D = Gene diversity (Nei 1973);
Pp = Percentage of polymorphic loci.

PL population (Figure 6). Positive correlationsbetween genetic and geographic distances werefound at short distances, with a maximum valuefor the correlation coefficient of 0.17. For dis-tances under 30 km, the accessions collected atnearer sites were similar and genetic distanceincreased with geographic distance. For largedistances, the correlations were not significant.
Differentiation within L. pimpinellifolium
The yellow-fruited accessions collected at the area Fdisplayedadegreeof polymorphismmuch lower thatmost of the red-fruited accessions of L. pimpinellifo-lium, even lower than some L. esculentum cultivars(Figure 5). Two of themwere monomorphic (PL599and PL601). This group of accessions also showed alow degree of heterozygosity (HoPL597 = 0.033±0.129, HoPL598 = 0.053±0.207, HoPL599 = 0,HoPL601 = 0, HoPL602 = 0.081±0.177), in com-parison with the mean value of the red-fruitedaccessions of L. pimpinellifolium (Ho=0.120±
0.194) andL. esculentum (Ho=0.072±0.113). Alsonotable is the high degree of fixation(FIS = 0.899) of this subpopulation in compari-son with the TGRC sample (FIS = 0.682) and thePL red-fruited subpopulations (FIS = 0.707).These accessions appear to be nearly pure lines.
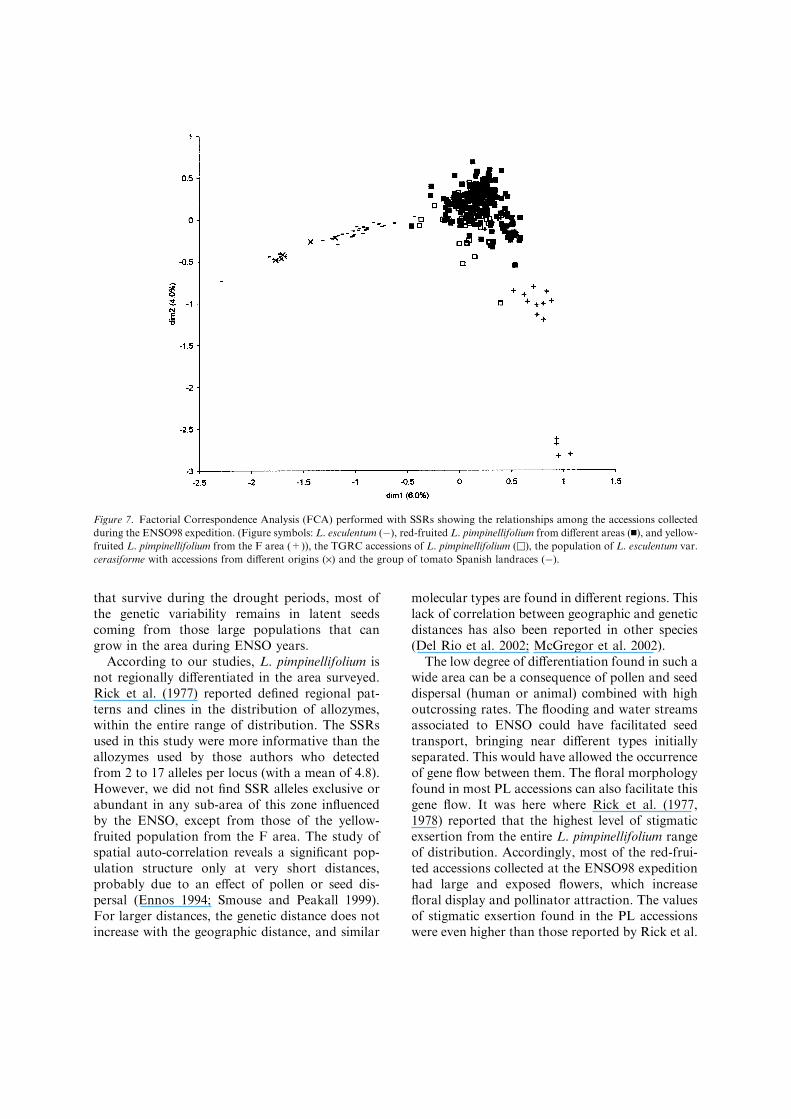
To clarify the nature of this group of accessions,a FCA was conducted using the SSRs data fromall PL accessions, L. pimpinellifolium and L. escu-lentum. Since the PL accessions of L. esculentumwere found growing sympatrically with the wildL. pimpinellifolium accessions, they could sharesome of its alleles due to introgression. For thisreason, we included in this analysis several Spanishlandraces of tomato and a group of accessions ofL. esculentum var. cerasiforme from different ori-gins (Figure 7). Results are coherent with themorphological analysis as FCA separated theyellow-fruited accessions from the other PLL. pimpinellifolium accessions and also from thoseof the L. e. var. cerasiforme, that were interspersedwith the Spanish tomato landraces and with thePL tomato accessions. The degree of differentia-
Figure 5. Percentage of polymorphic SSRs loci in the different accessions of L. pimpinellifolium and L. esculentum collected during the
ENSO98 expedition. Striped circles represent L. esculentum accessions, solid circles represent accessions of L. pimpinellifolium, and
dotted circles the yellow-fruited accessions of L. pimpinellifolium collected at the area F. The light color indicates the percentage of
polymorphic loci.

tion of the yellow-fruited subpopulation fromL. esculentum and L. e. var. cerasiforme was muchhigher than that of the red-fruited PL accessions ofL. pimpinellifolium from the cultivated species(Table 7).
Discussion
Our morphological and molecular characteriza-tion of this extensive assemblage of germplasm hasprovided the most complete study published to
date on the genetic structure of the populations ofL. pimpinellifolium from the central area of itsdistribution range, where the highest levels ofvariation occur. The effect of a periodical climaticphenomenon such as the ENSO on these popula-tions has also been studied for the first time.
The ENSO event of 1997–1998 increasedexceptionally the size of the L. pimpinellifoliumpopulations. However, this increase was notassociated with a significant increase in the totalgenetic diversity of this species in the area. Thissuggests that, despite the small number of plants
Table 7. Differentiation of the PL populations collected during the ENSO98 expedition (L. esculentum, red-fruited L. pimpinellifolium
(from different areas) and yellow-fruited L. pimpinellifolium (collected at the F area)) from the population of L. esculentum var.
cerasiforme (including accessions from different origins) and the group of accessions of L. pimpinellifolium provided by the Tomato
Genetics Resource Center.
TGRC L. pimp. PL L. pimp. red-fruited PL L. pimp. yellow-fruited I L. e. cerasiforme
PL L. esculentum 0.34/0.39a 0.35/0.32 0.59/0.47 0.29/–
TGRC L. pimpinellifolium – 0.07/0.09 0.27/0.27 0.38/–
PL L. pimpinellifolium red-fruited – – 0.25/0.23 0.46/–
PL L. pimp. yellow-fruited F – – – 0.67/–
aThe first number refers to the FST Wright statistics (Weir and Cockerham 1984), calculated using the SSRs data, and the second refers
to the Nei differentiation coefficient (Nei 1977), GST = (Dt�Ds)/Dt, calculated using AFLPs data.
Figure 6. Diagram showing the variation of the coefficient of genetic correlation (r) among the accessions of L. pimpinellifolium
collected by the ENSO 98 expedition with the geographic distance (km). The dotted lines indicate the limits of the confidence interval
(95%) of the null hypothesis of absence of correlation.
that survive during the drought periods, most ofthe genetic variability remains in latent seedscoming from those large populations that cangrow in the area during ENSO years.
According to our studies, L. pimpinellifolium isnot regionally differentiated in the area surveyed.Rick et al. (1977) reported defined regional pat-terns and clines in the distribution of allozymes,within the entire range of distribution. The SSRsused in this study were more informative than theallozymes used by those authors who detectedfrom 2 to 17 alleles per locus (with a mean of 4.8).However, we did not find SSR alleles exclusive orabundant in any sub-area of this zone influencedby the ENSO, except from those of the yellow-fruited population from the F area. The study ofspatial auto-correlation reveals a significant pop-ulation structure only at very short distances,probably due to an effect of pollen or seed dis-persal (Ennos 1994; Smouse and Peakall 1999).For larger distances, the genetic distance does notincrease with the geographic distance, and similar
molecular types are found in different regions. Thislack of correlation between geographic and geneticdistances has also been reported in other species(Del Rio et al. 2002; McGregor et al. 2002).
The low degree of differentiation found in such awide area can be a consequence of pollen and seeddispersal (human or animal) combined with highoutcrossing rates. The flooding and water streamsassociated to ENSO could have facilitated seedtransport, bringing near different types initiallyseparated. This would have allowed the occurrenceof gene flow between them. The floral morphologyfound in most PL accessions can also facilitate thisgene flow. It was here where Rick et al. (1977,1978) reported that the highest level of stigmaticexsertion from the entire L. pimpinellifolium rangeof distribution. Accordingly, most of the red-frui-ted accessions collected at the ENSO98 expeditionhad large and exposed flowers, which increasefloral display and pollinator attraction. The valuesof stigmatic exsertion found in the PL accessionswere even higher than those reported by Rick et al.
Figure 7. Factorial Correspondence Analysis (FCA) performed with SSRs showing the relationships among the accessions collected
during the ENSO98 expedition. (Figure symbols: L. esculentum (�), red-fruited L. pimpinellifolium from different areas (n), and yellow-
fruited L. pimpinellifolium from the F area (+)), the TGRC accessions of L. pimpinellifolium (u), the population of L. esculentum var.
cerasiforme with accessions from different origins (·) and the group of tomato Spanish landraces (�).
in their populations from Piura and Lambayeque(1.5–2.2 mm). Furthermore, the increase in thepopulation size and the probable increase in thenumber and kinds of pollinator insects caused bythe ENSO could have increased the rate of out-crossing.
The high degree of endogamy found in thepopulations does not stand in contradiction to theexistence of outcrossing. The endogamy can be aconsequence of the existence of autogamy, but itcould also be due to the occurrence of crossesbetween sibs or between close relatives. In fact,despite the high endogamy (high FIS values), thesepopulations are not totally fixed.
The PL collection included accessions mor-phologically and molecularly different to thosecollected in previous expeditions. As an example,Rick et al. (1977) did not report the occurrence ofthe r mutation in this area, and the y mutationonly appeared in their populations from Lam-bayeque (the wild allele + was fixed in the pop-ulations from Piura). We collected sevenaccessions with yellow or orange fruits. The twoaccessions collected at the E area (PL592 and PL593) only differ from some red-fruited accessionsin the fruit color. A similar situation was foundfor other yellow-fruited accessions of L. pimpi-nellifolium collected further north, in the area ofSanta Isabel (Ecuador), by the COMAV(F. Nuez, unpublished results). However, theyellow-fruited accessions from the area F dis-played differential morphological characteristicsand were molecularly different from the remain-ing PL accessions and the TGRC collections.Their values of stigmatic exsertion and heterozy-gosity are only comparable to those reportedpreviously in the accessions of L. pimpinellifoliumfrom the departments of Ancash or Lima, farsouth of Lambayeque, and in the accessions ofmore northerly areas, such as Tumbes (Ecuador)(Rick et al. 1977).
This yellow flesh color, characteristic of the firsttomatoes cultivated in Europe (Mathiolus 1544),has been reported in two different genetic back-grounds of the tomato ancestor L. esculentum var.cerasiforme, in the majority of the Bolivian and incertain Mexican accessions (Rick and Holle 1990).An independent mutational origin of r in Centraland South America has been suggested. CertainMexican accessions of L. esculentum var. cerasi-forme, locally named ‘coyote’, display a combina-
tion of r and y that results in a pale tawny yellowfruit color, as occurs in the accession PL602. Someof the morphological characteristics exhibited bythe F accessions make them similar to var.cerasiforme. For example, the low degree of stig-matic exsertion, the reduced flower size, and thebigger fruits (although fruit diameter was alwaysless than 15 mm, the limit used to differentiate L.pimpinellifolium from var. cerasiforme (Rick et al.1990). Moreover, molecular analyses indicatedthat these accessions are near to being pure lines,similarly to the var. cerasiforme that tends to behighly autogamous. It is difficult to set any mor-phological limits that clearly distinguish L. e. var.cerasiforme from L. pimpinellifolium. Intergradesof many sort exists, not only for fruit size, but alsofor fruit shape, leaf shape, pubescence, and num-ber of flowers per truss. These forms are frequentin the north and northeast margins of the L.pimpinellifolium distribution, where classification issometimes arbitrary (Rick et al. 1977; Widrlechner1987). The FST and GST values indicated that thisis a subpopulation of L. pimpinellifolium and doesnot belong to the cultivated species, L. esculentum.The degree of differentiation of these yellow-frui-ted accessions from the red L. pimpinellifolium(FST = 0.27� 0.25) is similar to the differentiationdegree of the L. e. var. cerasiforme from L. escu-lentum (FST = 0.29).
This subpopulation was not present in priorcollections. It is possible that it was simply over-looked by earlier collectors, but it is also possiblethat this population had been transported fromanother area by ENSO or other causes. In fact, ifthis population had been growing here for a longtime, genetic flow between this subpopulation andthe other yellow- and red-fruited accessions hadlikely occurred. Although, the identity of thepopulation could have been maintained due to itshigh autogamy, insects would have dispersed itspollen. However, our results indicate the absenceof recent and intense genetic flow between thispopulation and the remainder accessions form thearea. In any case, further studies including L. es-culentum accessions from the entire distributionrange are necessary in order to determine the ori-gin of this population and its unique alleles. Theaccession PL598 of this subspecies has providedresults of particular interest to us because of itsremarkably high content of vitamin C (Galiana-Balaguer et al. 2001).
Acknowledgements
The authors thank the members of the ENSO98expedition Dr Rafael A. Morales, Maximo Enca-lada (Universidad Nacional de Loja-Ecuador),Roberto Mendoza and Javier Leon (UniversidadNacional de Piura-Peru), Dr Pascual Fernandez deCordova and Dr Juan J. Ruiz (COMAV), andtheir corresponding institutions, for their help incollecting materials, as well as Javier Herraiz(COMAV) for his technical assistance. Theauthors also thank TGRC for supplying some ofthe accessions used in this study.
References
Alvarez A.E., van de Wiel C.C.M., Smulders M.J.M. and
Vosman B. 2001. Use of microsatellites to evaluate genetic
diversity and species relationships in the genus Lycopersicon.
Theor. Appl. Genet. 103: 1283–1292.
Areshchenkova T. and Ganal M.W. 2002. Comparative anal-
ysis of polymorphism and chromosomal location of tomato
microsatellite markers isolated from different sources. Theor.
Appl. Genet. 104: 229–235.
Arens P., Odinot P., van Exuden A.W., Lindhout P. and
Vosman B. 1995. GATA- and GACA-repeats are not evenly
distributed throughout the tomato genome. Genome 38:
84–90.
Baudry E., Kerdelhue C., Innan H. and Stephan W. 2001.
Species and recombination effects on DNA variability in the
tomato genus. Genetics 158: 1725–1735.
Belkhir K., Borsa P., Chikhi L., Ranfaste N. and Bonhomme T.
1996–2002. Genetix.4.04. Logiciel sous windowsTM pour la
genetique des populations. Laboratoire Genome, Popula-
tions, Interactions, Universite de Montpellier II, Montpellier.
Bonnema G., van der Berg P. and Lindhout P. 2002. AFPLs
mark different genomic regions compared with RFLPs: a case
study in tomato. Genome 45: 217–221.
Bredemeijer G.M.M., Cooke R.J., Ganal M.W., Peeters R.,
Isaac P., Noordijk Y., Rendell S., Jackson J., Roder M. S.,
Wendehake K., Dijcks M., Amelaine M., Wickaert V., Ber-
trand L. and Vosman B. 2002. Construction and testing of a
microsatellite database containing more than 500 tomato
varieties. Theor. Appl. Genet. 105: 1019–1026.
Broun P. and Tanksley S.D. 1996. Characterization and genetic
mapping of single repeat sequences in the tomato genome.
Mol. Gen. Genet. 250: 39–49.
Cavalli-Sforza L.L. and Edwards A.W.F. 1967. Phylogenetic
analysis: models and estimation procedures. Evolution 32:
550–570.
Del Rio A.H. and Bamberg J.B. 2002. Lack of association
between genetic and geographical origin characteristics for
the wild potato Solanum sucrense. Amer. J. Potato Res. 79:
335–338.
Dice L.R. 1945. Measures of the amount of ecologic association
between species. Ecology 26: 297–302.
Ennos R.A. 1994. Estimating the relative rates of pollen
and seed migration among plant populations. Heredity 72:
250–259.
Escofier B. and Pages J. 1990. Analyses factorielles simples et
multiples. Dumond, Paris.
Ferriol M., Pico B. and Nuez F. 2003. Genetic diversity of a
germplasm collection of Cucurbita pepo using SRAP and
AFLP markers. Theor. Appl. Genet. 107: 271–282.
Galiana-Balaguer L., Rosello S., Herrero-Martınez J.M.,
Maqueira A. and Nuez F. 2001. Determination of L-ascorbic
acid in Lycopersicon fruits by capillary zone electrophoresis.
Anal. Biochem. 296: 218–224.
Georgiady M.S., Whitkus R.M. and Lord E.M. 2002. Genetic
analysis of traits distinguishing outcrossing and self-
pollinating forms of currant tomato, Lycopersicon pimpinel-
lifolium (Juss.) Mill. Genetics 161: 333–344.
Haanstra J.P.W., Wye C., Verbakel H., Meijer-Dekens F., Van
den Berg P., Odinot P., Van Exuden A.W., Tanksley S.,
Lindhout P. and Peleman J. 1999. An integrated high-density
RFLP–AFLP map of tomato based on two Lycopersicon
esculentum·L. pennellii F2 populations. Theor. Appl. Genet.
99: 254–271.
He C., Poysa V. and Yu K. 2003. Development and charac-
terization of simple sequence repeat (SSR) markers and
their use in determining relationship among Lycopersicon
esculentum cultivars. Theor. Appl. Genet. 106: 363–373.
Holle M., Rick C.M. and Hunt D.G. 1978. Catalog of collec-
tions of green-fruited Lycopersicon species and Solanum
pennellii found in watersheds of Peru. TGC Report 28: 50–78.
IPGRI 1996. Descriptors for tomato (Lycopersicon). Interna-
tional Plant Genetic Resources Institute, Rome.
Jaramillo S. and Baena M. 2000. Material de apoyo a la ca-
pacitacion en conservacion ex situ de recursos fitogeneticos.
Instituto Internacional de Recursos Fitogeneticos, Cali.
Mantel N. 1967. The detection of disease clustering and a
generalized regression approach. Cancer Res. 27: 209–220.
Marshall J.A., Knapp S., Davey M.R., Power J.B., Cocking
E.C., Bennett M.D. and Cox A.V. 2001. Molecular system-
atics of Solanum section Lycopersicon (Lycopersicon) using
the nuclear ITS rDNA region. Theor. Appl. Genet. 103:
1216–1222.
Matthiolus P.A. 1544. Di Pedacio Dioscoride Anarzabeo libri
cinque della historia et material medicinale trodotte in lingua
volgare Italiana. Venice.
McGregor C.E., van Treuren R., Hoekstra R. and van Hintum
T.J.L. 2002. Analysis of the wild potato germplasm of the
series Acaulia with AFLPs: implications for ex situ conser-
vation. Theor. Appl. Genet. 104: 146–156.
Miller J.C. and Tanksley S.D. 1990. RFLP analysis of phylo-
genetic relationships and genetics variation in the genus
Lycopersicon. Theor. Appl. Genet. 80: 437–448.
Muller C. H. 1940. A revision of the genus Lycopersicon.
USDA Misc. Publication 382: 29.
Nei M. 1973. Analysis of gene diversity in subdivided popula-
tions. Proc. Nat. Acad. Sci. USA 70: 3321–3323.
Nei M. 1977. F-statistic and analysis of gene diversity in sub-
divided populations. Ann. Hum. Genet. 41: 225–233.
Nuez F., Prohens J. and Blanca J.M. 2004. Relationships, ori-
gin, and diversity of Galapagos tomatoes: implications for
the conservation of natural populations. Am. J. Bot. 91:
86–99.

Rick C.M. and Chetelat R.T. 1995. Utilization of related wild
species for tomato improvement. Acta Hortic. 412: 21–38.
Rick C.M. and Holle M. 1990. Andean Lycopersicon esculen-
tum var. cerasiforme: genetic variation and its evolutionary
significance. Econ. Bot. 44: 69–78.
Rick C.M., Fobes J.F. and Holle M. 1977. Genetic variation in
Lycopersicon pimpinellifolium. Evidence of evolutionary
change in mating systems. Plant Syst. Evol. 127: 139–170.
Rick C.M., Holle M. and Thorp R.W. 1978. Rates of cross-
pollination in Lycopersicon pimpinellifolium: Impact of
genetic variation in floral characters. Plant Syst. Evol 129:
31–44.
Rick C.M., Laterrot H. and Philouze J. 1990. A revised key for
the Lycopersicon species. TGC Report 40: 31.
Rohlf F.J. 1998. NTSYS-pc: numerical taxonomy and multi-
variate analysis system, version 2.0, user guide. Exeter
Software, New York.
Saliba-Colombani V., Causse M., Gervais L. and Philouze J.
2000. Efficiency of RFLP, RAPD, and AFLP markers for the
construction of an intraspecific map of the tomato genome.
Genome 43: 29–40.
Smouse P.E. and Peakall R. 1999. Spatial autocorrelation
analysis of the individual multiallele and multilocus genetic
structure. Heredity 82: 561–573.
Smulders M.J.M., Bredemeijer G., Rus-Kortekaas W., Arens P.
and Vosman B. 1997. Use of short microsatellites from
database sequences to generate polymorphisms among
Lycopersicon esculentum cultivars and accessions of other
Lycopersicon species. Theor. Appl. Genet. 97: 264–272.
Spooner D.M., Peralta I.E. and Knapp S. 2005. Comparison of
AFLPs with other markers for phylogenetic inference in wild
tomatoes [Solanum L. section Lycopersicon (Mill.) Wettst.].
Taxon 54: 43–61.
Takezaki N. and Nei M. 1996. Genetic distances and recon-
struction of phylogenetics trees from microsatellites DNA.
Genetics 144: 389–399.
Taylor I.B. 1986. Biosystematics of the tomato. In: Atherton
J.G. and Ridich J. (eds), The Tomato Crop. A Scientific Basis
for Improvement. Chapman and Hall, London and New
York, pp. 1–34.
UPOV 1976. Guidelines for the conduct of tests for distinctness,
homogeneity and stability. Tomato (Lycopersicon lycopersi-
cum (L.) Karst. ex Farw.). UPOV, Geneva.
Villand J., Skroch P.W., Lai T., Hanson P., Kuo C.G. and
Nienhuis J. 1998. Genetic variation among tomato accessions
from primary and secondary centres of diversity. Crop Sci.
38: 1339–1347.
Warnock S.J. 1991. Natural habitats of Lycopersicon species.
HortScience 26: 446–471.
Weir B.S. and Cockerham C.C. 1984. Estimating F-statistics
for the analysis of population structure. Evolution 38:
1358–1370.
Widrlechner M.P. 1987. Variation in the breeding system of
Lycopersicon pimpinellifolium: implication for germplasm
maintenance. Plant Gen. Res. Newsl. 70: 38–43.
Williams C.E. and St Clair D.A. 1993. Phenetic relationships
and levels of variability detected by restriction fragment
length polymorphism and random amplified polymorphic
DNA analysis of cultivated and wild accessions of L. escu-
lentum. Genome 36: 619–630.
WMO/UNESCO/UNEP/ICSU 1999. The 1997–98 El Nino: a
scientific and technical retrospective. WMONo. 905, Geneva.
Yeh F.C., Yang R.C., Boyle T.B.J., Ye Z.H. and Mao J.X.
1997. POPGENE, the user-friendly shareware for population
genetic analysis. Molecular Biology and Biotechnology
Centre, University of Alberta, Alberta.