Comparison of CE-SSCP and DGGE for monitoring a complex microbial community remediating mine...
13
Comparison of CE-SSCP and DGGE for monitoring a complex microbial community remediating mine drainage Hyunsuk Hong a , Amy Pruden a, ⁎ , Kenneth F. Reardon b a Department of Civil and Environmental Engineering, Colorado State University, Fort Collins, Colorado, USA b Department of Chemical and Biological Engineering, Colorado State University, Fort Collins, Colorado, USA Received 23 September 2006; received in revised form 25 November 2006; accepted 25 November 2006 Available online 16 January 2007 Abstract Capillary electrophoresis single-strand conformation polymorphism (CE-SSCP) is a promising high-throughput tool for profiling complex bioremediation communities, but has not been well characterized with respect to other methods such as denaturing gradient gel electrophoresis (DGGE). The purpose of this study was to compare CE-SSCP with DGGE with respect to: 1) overall representation of the community in terms of the dominant species identified and corresponding Shannon diversity indices; 2) reproducibility and resolution; and 3) artifacts, using a complex sulfate-reducing community remediating mine drainage as a model system. Some of the dominant microorganisms were detected by both methods, but there were also differences in the reported community compositions, and more phylogenetic groups were detected by CE-SSCP. CE-SSCP Shannon diversity indices were slightly higher than those determined from DGGE data, and differed in terms of the time point at which the community was reported to have the highest diversity. Both methods had high reproducibility, but CE-SSCP resolution was higher in terms of the total number of peaks resolved, reduced co-migration of distinct DNA sequences, and length and legibility of the DNA sequencing data of clones used to identify peaks. Ten double bands in the same lane representing the same species were found by DGGE, whereas only one such artifact was observed by CE-SSCP. Finally, less overall sample preparation and analysis time was required for CE-SSCP than for DGGE. The results suggest that CE-SSCP offers several advantages over DGGE, especially for high-throughput monitoring. © 2006 Elsevier B.V. All rights reserved. Keywords: DGGE; CE-SSCP; Microbial community fingerprint; Mine drainage remediation 1. Introduction There is significant need for high-throughput tools for monitoring microbial communities involved in bioremediation. Nucleic acid “fingerprinting” techniques using universal polymerase chain reaction (PCR) primers targeting 16S rRNA genes, such as denaturing gradient gel electrophoresis (DGGE), offer a major advantage in that they provide a convenient snapshot of the overall community that can be compared with time (Muyzer et al., 1996). Furthermore, fingerprinting techniques are relatively less labor-intensive than other profiling approaches, such as cloning and sequencing, and thus many samples can be processed and compared in parallel. This is a critical attribute for bioremediation monitoring, which typically has a restricted budget and requires continued measurements of several parameters with time. Since DGGE was first reported by Muyzer et al. (1993), the original work has been cited in over 2000 studies (Web of Science “DGGE” keyword search, November, 2006). Since then, several other fingerprinting techniques have been described and applied, including terminal restriction fragment length polymorphism (tRFLP) (Clement et al., 1998), length heterogeneity PCR (LH- PCR) (Suzuki et al., 1998), and single-strand conformation polymorphism (SSCP) (Lee et al., 1996). Although these fingerprinting methods have had a clear impact on the field of molecular microbial ecology, there still is no clear “gold standard” community fingerprinting method. Each method carries with it various advantages and disadvantages in terms of specificity, resolution, throughput, and corresponding sequence length and Journal of Microbiological Methods 69 (2007) 52 – 64 www.elsevier.com/locate/jmicmeth ⁎ Corresponding author. Mailing address: Department of Civil and Environ- mental Engineering, 1372 Campus Delivery, Colorado State University, Fort Collins, CO 80523 USA. Tel.: +1 970 491 8814; fax: +1 970 491 8671. E-mail address: [email protected] (A. Pruden). 0167-7012/$ - see front matter © 2006 Elsevier B.V. All rights reserved. doi:10.1016/j.mimet.2006.11.016
Transcript of Comparison of CE-SSCP and DGGE for monitoring a complex microbial community remediating mine...

9 (2007) 52–64www.elsevier.com/locate/jmicmeth
Journal of Microbiological Methods 6
Comparison of CE-SSCP and DGGE for monitoring a complexmicrobial community remediating mine drainage
Hyunsuk Hong a, Amy Pruden a,⁎, Kenneth F. Reardon b
a Department of Civil and Environmental Engineering, Colorado State University, Fort Collins, Colorado, USAb Department of Chemical and Biological Engineering, Colorado State University, Fort Collins, Colorado, USA
Received 23 September 2006; received in revised form 25 November 2006; accepted 25 November 2006Available online 16 January 2007
Abstract
Capillary electrophoresis single-strand conformation polymorphism (CE-SSCP) is a promising high-throughput tool for profiling complexbioremediation communities, but has not been well characterized with respect to other methods such as denaturing gradient gel electrophoresis(DGGE). The purpose of this study was to compare CE-SSCP with DGGE with respect to: 1) overall representation of the community in terms ofthe dominant species identified and corresponding Shannon diversity indices; 2) reproducibility and resolution; and 3) artifacts, using a complexsulfate-reducing community remediating mine drainage as a model system. Some of the dominant microorganisms were detected by both methods,but there were also differences in the reported community compositions, and more phylogenetic groups were detected by CE-SSCP. CE-SSCPShannon diversity indices were slightly higher than those determined from DGGE data, and differed in terms of the time point at which thecommunity was reported to have the highest diversity. Both methods had high reproducibility, but CE-SSCP resolution was higher in terms of thetotal number of peaks resolved, reduced co-migration of distinct DNA sequences, and length and legibility of the DNA sequencing data of clonesused to identify peaks. Ten double bands in the same lane representing the same species were found by DGGE, whereas only one such artifact wasobserved by CE-SSCP. Finally, less overall sample preparation and analysis time was required for CE-SSCP than for DGGE. The results suggestthat CE-SSCP offers several advantages over DGGE, especially for high-throughput monitoring.© 2006 Elsevier B.V. All rights reserved.
Keywords: DGGE; CE-SSCP; Microbial community fingerprint; Mine drainage remediation
1. Introduction
There is significant need for high-throughput tools formonitoring microbial communities involved in bioremediation.Nucleic acid “fingerprinting” techniques using universalpolymerase chain reaction (PCR) primers targeting 16S rRNAgenes, such as denaturing gradient gel electrophoresis (DGGE),offer a major advantage in that they provide a convenientsnapshot of the overall community that can be compared withtime (Muyzer et al., 1996). Furthermore, fingerprintingtechniques are relatively less labor-intensive than other profilingapproaches, such as cloning and sequencing, and thus many
⁎ Corresponding author. Mailing address: Department of Civil and Environ-mental Engineering, 1372 Campus Delivery, Colorado State University, FortCollins, CO 80523 USA. Tel.: +1 970 491 8814; fax: +1 970 491 8671.
E-mail address: [email protected] (A. Pruden).
0167-7012/$ - see front matter © 2006 Elsevier B.V. All rights reserved.doi:10.1016/j.mimet.2006.11.016
samples can be processed and compared in parallel. This is acritical attribute for bioremediation monitoring, which typicallyhas a restricted budget and requires continued measurements ofseveral parameters with time.
Since DGGE was first reported by Muyzer et al. (1993), theoriginal work has been cited in over 2000 studies (Web of Science“DGGE” keyword search, November, 2006). Since then, severalother fingerprinting techniques have been described and applied,including terminal restriction fragment length polymorphism(tRFLP) (Clement et al., 1998), length heterogeneity PCR (LH-PCR) (Suzuki et al., 1998), and single-strand conformationpolymorphism (SSCP) (Lee et al., 1996). Although thesefingerprinting methods have had a clear impact on the field ofmolecular microbial ecology, there still is no clear “gold standard”community fingerprinting method. Each method carries with itvarious advantages and disadvantages in terms of specificity,resolution, throughput, and corresponding sequence length and
53H. Hong et al. / Journal of Microbiological Methods 69 (2007) 52–64
quality available for identifying dominants. Artifacts, such as onespecies being represented by more than one band or peak, are alsocommonly cited problems.
Capillary electrophoresis SSCP (CE-SSCP) (Delbes et al.,2000) may offer several advantages over existing methods.However, this method has not been well characterized withrespect to more commonly applied fingerprinting approaches,such as DGGE. In CE-SSCP, fluorescently labeled blunt-endedPCR products are obtained from the highly variable V3 regionof the 16S rRNA gene, denatured at high temperature, and thenrapidly cooled to form unique single-strand conformations,which are separated based on their electrophoretic mobility in apolymer-filled capillary. The identity of peaks is determined byanalyzing a clone library generated from the same sample inparallel and sequencing clones that correspond to peaks in thecommunity. A major advantage of CE-SSCP over gel-basedtechniques is the high-throughput nature that allows parallelprocessing of multiple samples. Also, problems with gel-to-gelvariation are avoided by using a sensitive capillary andstandardized reagents (Hebenbrock et al., 1995). Whencompared to other high-throughput capillary-based techniques,such as tRFLP, a significant improvement is that CE-SSCP doesnot require restriction digestion of the templates, which hasbeen reported to result in incomplete digestion and subsequentformation of multiple peaks per operational taxonomic unit(OTU) (Clement et al., 1998; Mills et al., 2003). CE-SSCP hasrecently been applied in the study of complex communities(Dabert et al., 2005; Peu et al., 2006), but its potential for suchapplications has not been established. In a recent study by Kinget al. (2005), the resolution capability of CE-SSCP wasexplored using pure cultures and mixtures of pure cultures,however, there is a need to better characterize the method forapplications to complex communities.
The purpose of this study was to compare CE-SSCP withDGGE for profiling a complex microbial community. Asulfate-reducing mine drainage treatment community wasconsidered to be a particularly suitable model for this studybecause of its known complexity, and the requirement ofmultiple microbial functional groups for its overall success insulfate reduction and precipitation of heavy metals. Columnswere used to simulate sulfate-reducing permeable reactivezones (SR-PRZs), which are typically provided with acomplex slow-release carbon substrate, such as wood chips(Hulshof et al., 2006). A fully-functioning SR-PRZ commu-nity of the type studied here includes anaerobic cellulosedegraders, cellobiose degraders, fermenters, and sulfate re-ducers (Logan et al., 2005).
CE-SSCP and DGGE were used to monitor SR-PRZ columncommunities at three time points and the following aspects ofthe results were compared: 1) overall representation of thecommunity in terms of the dominant species identified andcorresponding Shannon diversity indices; 2) reproducibility andresolution; and 3) artifacts. The expected results were that thetwo approaches would provide complementary information interms of the species identified and diversity, but that CE-SSCPwould have higher resolution and be less susceptible to artifacts,with less labor and overall analysis time.
2. Materials and methods
2.1. Sample collection and characteristics
Sampleswere collected fromSR-PRZ columns constructed andoperated at the Colorado School of Mines (Golden, Colorado).Pairs of duplicate columns were sacrificed at different times(Logan et al., 2005) and column samples from each pair werecombined in equal proportions, thus yielding three samples for thisstudy: B17, collected after 41 days of operation when sulfate-reducing activity was high (“performance”); B34, collected after99 days of operation when the sulfate-reduction rate had decreasedby about half (“decline”); and B56, collected after about a year ofoperation when flow became hindered due to clogging(“hindered”).
2.2. DNA extraction
DNA extraction was carried out using the FastDNA Spin Kitfor Soil (Q-BIOGene, Irvine, CA) according to the manufac-turer's protocol using approximately 500 mg (wet weight) ofcolumn material. The concentration of extracted DNA wasmeasured by absorbance at 260 nm using an 8452A diode arrayspectrophotometer (Hewlett-Packard, Houston, TX).
2.3. Denaturing gradient gel electrophoresis (DGGE)
Two DGGE analyses were performed in this study on thevariable V3 region of the bacterial 16S rDNA. The first DGGE(DGGE1) was carried out on samples B17 and B34 with nestedPCR products, and the second (DGGE2) was carried out on allthree samples with un-nested PCR products. Conducting both anested and an un-nested DGGE provided a means to identify anypotential effects of PCR primers and protocols on the resultsobtained. Also, the effect of nested PCR on community finger-prints remains a topic of significant interest, and in some casesnested PCR protocols have been found to result in a broaderdetection of bacterial groups (Mahmood et al., 2006).
For the nested DGGE, the bacterial forward primer 8F anduniversal reverse primer 1492R (Table 1) were used for the firststep. Universal bacterial primers I-341-FGC and I-533R(Table 1) were then used to obtain products for both DGGEanalyses. PCR conditions, including denaturing, annealing andextension temperatures, number of cycles, and polymeraseapplied, are summarized in Table 1. For the un-nested PCR, thenumber of cycles was kept at 25 for direct comparison to CE-SSCP, whereas for the nested PCR, the number of cycles waschosen as recommended by Watanabe et al. (2001).
DGGE was carried out at 57 °C with a D-Code UniversalMutation Detection System (Bio-Rad Laboratories, Hercules,CA). Eight percent (w/v) polyacrylamide gels with a denaturinggradient from 20 to 55% (100%=40% (v/v) deionizedformamide and 42% (w/v) urea) were loaded with 23 μL ofPCR product, and a voltage of 45 V was applied for 20 h. In thesecond DGGE, the gradient was narrowed to the range of 35 to50% to improve band resolution. The gels were stained with 1XSYBR Gold (Molecular Probes, Eugene, OR) and documented

Table1
PrimersandPCRcondition
sappliedin
thisstud
ya
Primerb
Sequence5′-3′c,
dMetho
dAnn
ealtemp.
(°C)
Prod.
size
(bp)
#Cyclese
Reference
8-F
AGAGTTTGATCCTGGCTCAG
Cloning/NestedDGGE
5014
8535
/35
Weisburget
al.(19
91)
1492
-RGGTTA
CCTTGTTA
CGACTT
Weisburget
al.(19
91)
I-341-FGC
CGCCCGCCGCGCGCGGCGGGCGGGGCGGGGGCACGGGGGG-
IGGCIG
CA
Nested/
Un-nested
DGGE
47–52
193
10touchd
ownfollo
wed
by35
/25
Watanabeet
al.(20
01)
I-533-R
Watanabeet
al.(20
01)
329-F(w
49)
ACGGTCCAGACT
CE-SSC
P61
205
25(D
elbeset
al.,20
01;
Peu
etal.,20
06)
533-R(w
104)
(Delbeset
al.,20
01;
Peu
etal.,20
06)
a Eppendorf(H
amburg,G
ermany)
MasterTaq
polymeraseandbuffersused
forallPCRs,except
CE-SSCP,in
which
Stratagene(LaJolla,CA)Pfu
blun
t-endedpo
lymeraseandbu
ffer
was
used.
bPrimer
names
incorporatenu
mbercorrespo
nding16
Sgene
positio
nforEscherichia
coli.
c Ambiguities:R(G
orA);Y
(Cor
T);K
(Gor
T);M
(Aor
C);S(G
orC);W
(Aor
T).
dOverlapping
region
sarehigh
lighted
forforw
ardandreverseprim
ers,respectiv
ely.
e Allprotocolsim
plem
ented2min
initial
denaturing
at94
°Cand7min
finalincubatio
nat
theextensiontemperature
(68–
72°C
).
54 H. Hong et al. / Journal of Microbiological Methods 69 (2007) 52–64
using the UVP BioChemi System and Labworks software(UVP, Upland, CA). Visible bands were excised, stored in 35 μLsterile water, and re-amplified using I-341-FGC and I-533-Rprimers using the same conditions described above. PCR prod-ucts were purified using a GeneClean Spin Kit (Q-BIOGene)and sequenced off-site by Davis Sequencing (Davis, CA) orSeqWright (Houston, TX).
2.4. Capillary electrophoresis single-strand conformationpolymorphism (CE-SSCP)
CE-SSCP PCR amplification was carried out using theprimers described in Table 1. As was the case in DGGE, theseprimers targeted the variable V3 region of the 16S rRNA gene.The reverse primer was identical to that applied in DGGE, exceptthat it carried 6-carboxyfluorescein (6FAM) at the 5′ end, and theprimer in DGGE had several inosine base substitutions, whichhave been reported to improve the range of detection (Watanabeet al., 2001). The CE-SSCP and DGGE forward primers had 8 bpof overlap (Table 1), with the DGGE primer carrying a 40 bp GCclamp and two inosine base substitutions. The Pfu DNApolymerase applied in CE-SSCP provides blunt-ended PCRproducts, which avoids interference of random adenylation inmutation analyses (Hu, 1993). The template was either microbialcommunity DNA extract or M13 PCR product obtained fromclones from sample B17 (see Section 2.5).
Because of the high sensitivity of CE-SSCP, it was necessaryto dilute all PCR products before analysis. The dilutions appliedresolved the highest peak within the range of 85–95% of theupper detection limit (peak saturation) for CE-SSCP. Onemicroliter of the diluted PCR product was mixed with 18.8 μLdeionized formamide and 0.2 μL GeneScan-400 ROX internalsize standard (Applied Biosystems, Foster City, CA). Thesamples were denatured for 5min at 95 °C and placed directly ona mixture of ice and water for 15 min. The single-stranded DNAconformations were separated by capillary electrophoresis usingan ABI Prism 310 Genetic Analyzer (Applied Biosystems)equipped with a capillary (47 cm×50 μm) filled with a polymerconsisting of 5.6% GeneScan Polymer (Applied Biosystems),10% glycerol, and 1× TBE (Tris-Borate-EDTA). The resultsobtained were analyzed using GeneMapper v3.0 (AppliedBiosystems) (Chackhiani et al., 2004). The analysis temperaturewas kept constant at 37 °C. Because the ABI 310 is onlyequipped with a warmer and not a chiller, it was necessary tomaintain ambient temperature at 70 °F or less for the analysis toproceed without an error warning.
To identify peaks, the microbial community PCR productswere analyzed in parallel with PCR products obtained from aclone library of sample B17 (described in Section 2.5). Forconsistency, the community DNA from sample B17 was in-cluded with every run, and the average and standard deviationof the relative migration distance (RMD) of all peaks weredetermined. The purified M13 PCR products from clones thatmatched community peaks were sequenced at the CSUMacromolecular Resources Facility (Colorado State Univer-sity, Fort Collins, CO). In the case of multiple matching clonesper peak, a conservative approach was taken by selecting the
55H. Hong et al. / Journal of Microbiological Methods 69 (2007) 52–64
clones with the highest and lowest RMDs in order to identifypossible mixed sequences per peak. For example, if two clonesmatched a peak, then both were sequenced, if three or fourmatched, then the two with the highest and lowest RMD weresequenced, if five or six matched, then the clones with thehighest and lowest and the median RMD were sequenced(three total). In the remaining cases of 9, 17, and 31 matches, 4,5, and 6 clones were sequenced, respectively, representing thehighest, lowest, and median RMDs. An evolutionary distancedendrogram of the resulting sequences was constructed (asdescribed in Section 2.6) in order to verify clustering of clonescorresponding to the same peak and to identify peaks withmultiple matching clones.
2.5. Construction of clone libraries
Near full-length 16S rDNA was amplified with bacterialforward primer 8F and universal reverse primer 1492R (Table 1)from column B17 DNA extract, which had the most peaksaccording to CE-SSCP and was obtained from columns with thehighest level of sulfate-reducing activity. The PCR productswere cloned using the TOPO TA Cloning Kit for Sequencing(Invitrogen, Carlsbad, CA) according to the manufacturer'sprotocol. The inserts were PCR amplified from random coloniesusing M13 forward (−20) and M13 reverse primers. A library of159 M13 PCR products was obtained from the clones and 54were sequenced according to the above criteria. Legible datawere obtained from 46 of these; in the remaining cases, the lackof quality data was likely due to insufficient PCR productavailable for sequencing. Legibility refers generally to therelative infrequency of ambiguous (N) base pairs. The length of
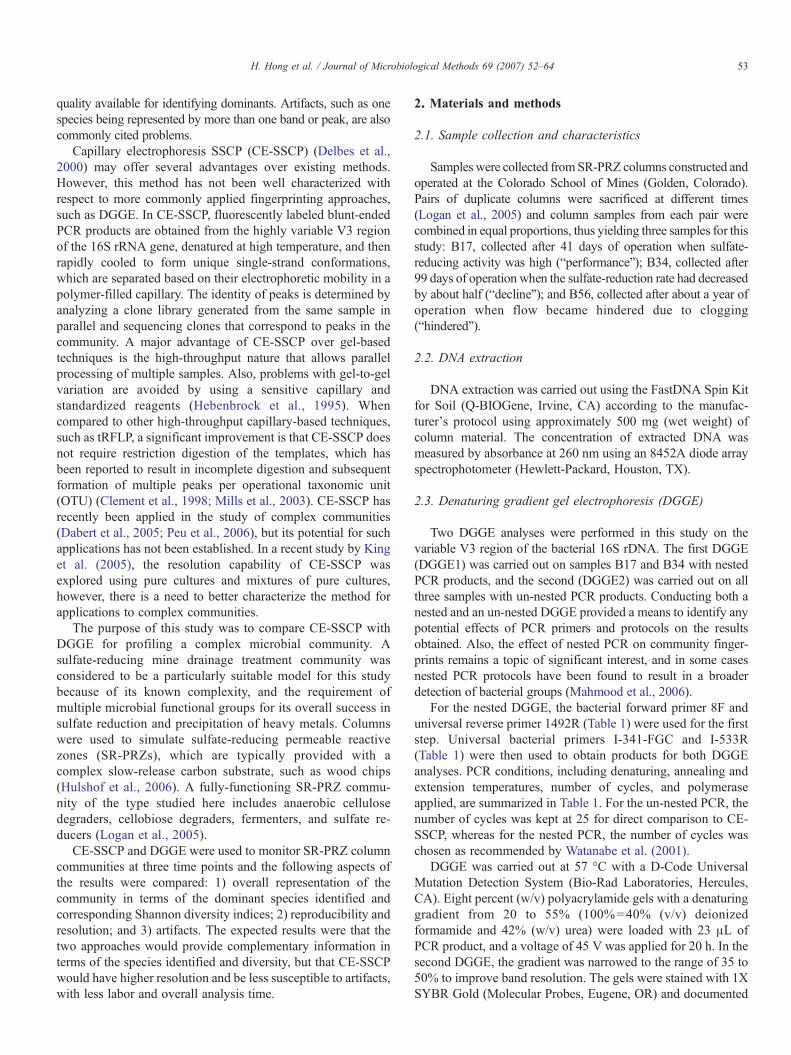
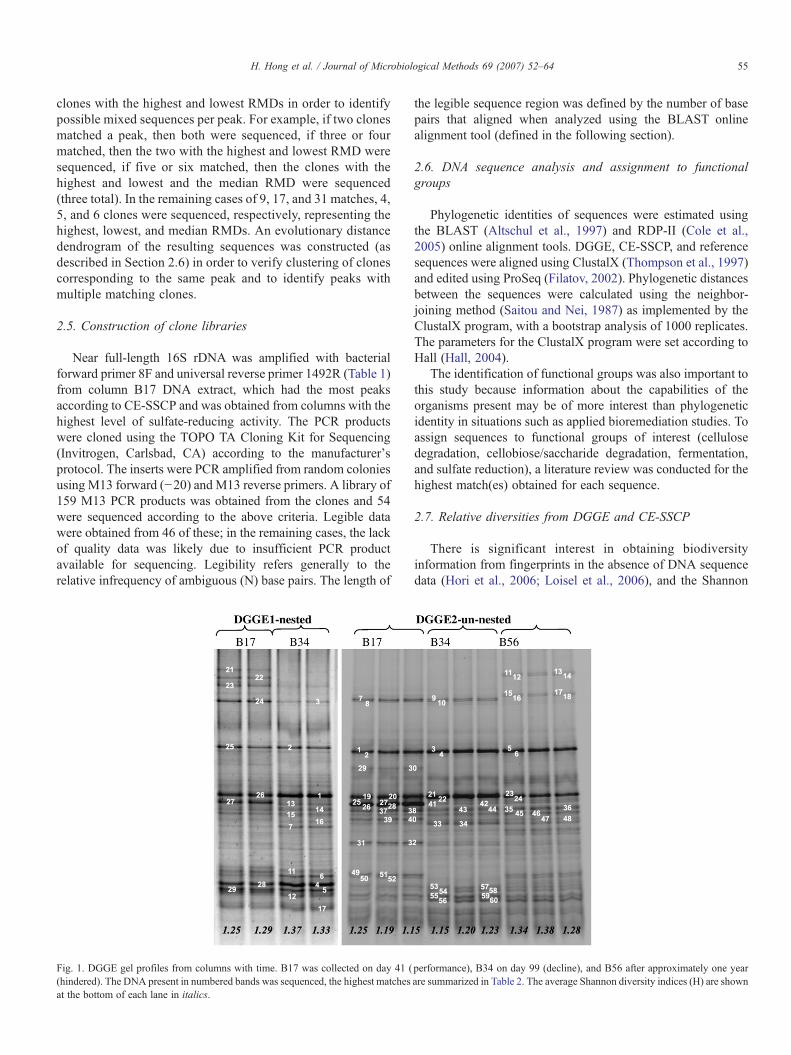
Fig. 1. DGGE gel profiles from columns with time. B17 was collected on day 41 ((hindered). The DNA present in numbered bands was sequenced, the highest matchesat the bottom of each lane in italics.
the legible sequence region was defined by the number of basepairs that aligned when analyzed using the BLAST onlinealignment tool (defined in the following section).
2.6. DNA sequence analysis and assignment to functionalgroups
Phylogenetic identities of sequences were estimated usingthe BLAST (Altschul et al., 1997) and RDP-II (Cole et al.,2005) online alignment tools. DGGE, CE-SSCP, and referencesequences were aligned using ClustalX (Thompson et al., 1997)and edited using ProSeq (Filatov, 2002). Phylogenetic distancesbetween the sequences were calculated using the neighbor-joining method (Saitou and Nei, 1987) as implemented by theClustalX program, with a bootstrap analysis of 1000 replicates.The parameters for the ClustalX program were set according toHall (Hall, 2004).
The identification of functional groups was also important tothis study because information about the capabilities of theorganisms present may be of more interest than phylogeneticidentity in situations such as applied bioremediation studies. Toassign sequences to functional groups of interest (cellulosedegradation, cellobiose/saccharide degradation, fermentation,and sulfate reduction), a literature review was conducted for thehighest match(es) obtained for each sequence.
2.7. Relative diversities from DGGE and CE-SSCP
There is significant interest in obtaining biodiversityinformation from fingerprints in the absence of DNA sequencedata (Hori et al., 2006; Loisel et al., 2006), and the Shannon
performance), B34 on day 99 (decline), and B56 after approximately one yearare summarized in Table 2. The average Shannon diversity indices (H) are shown
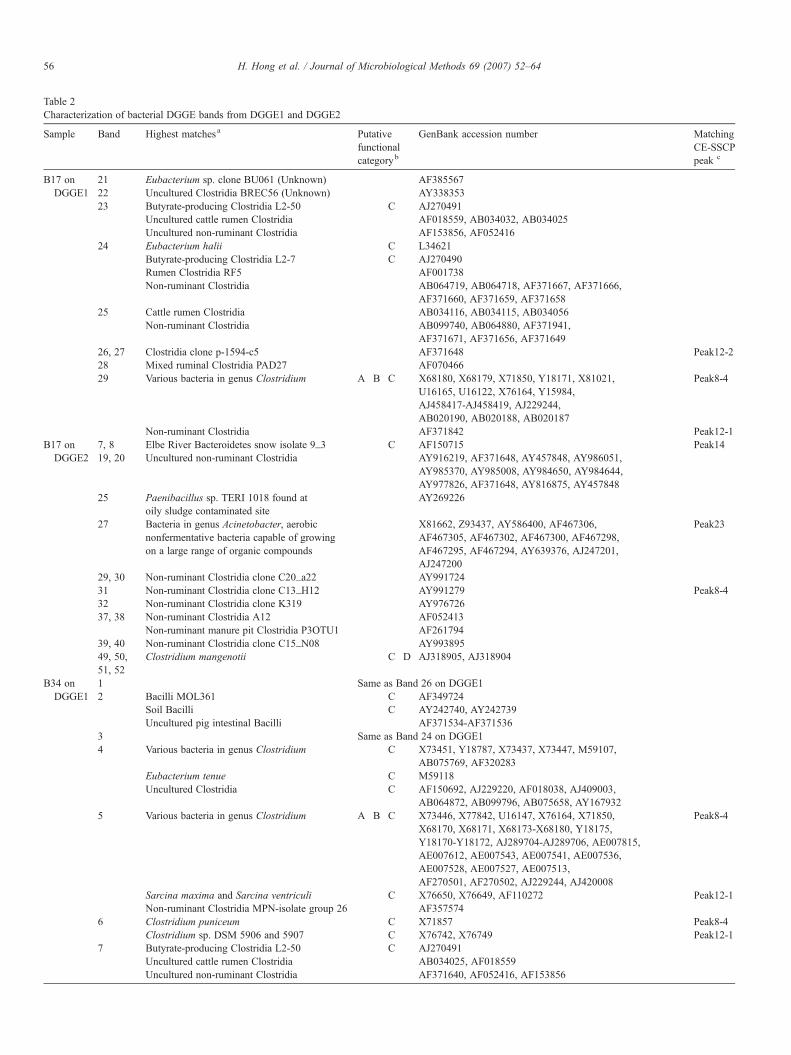
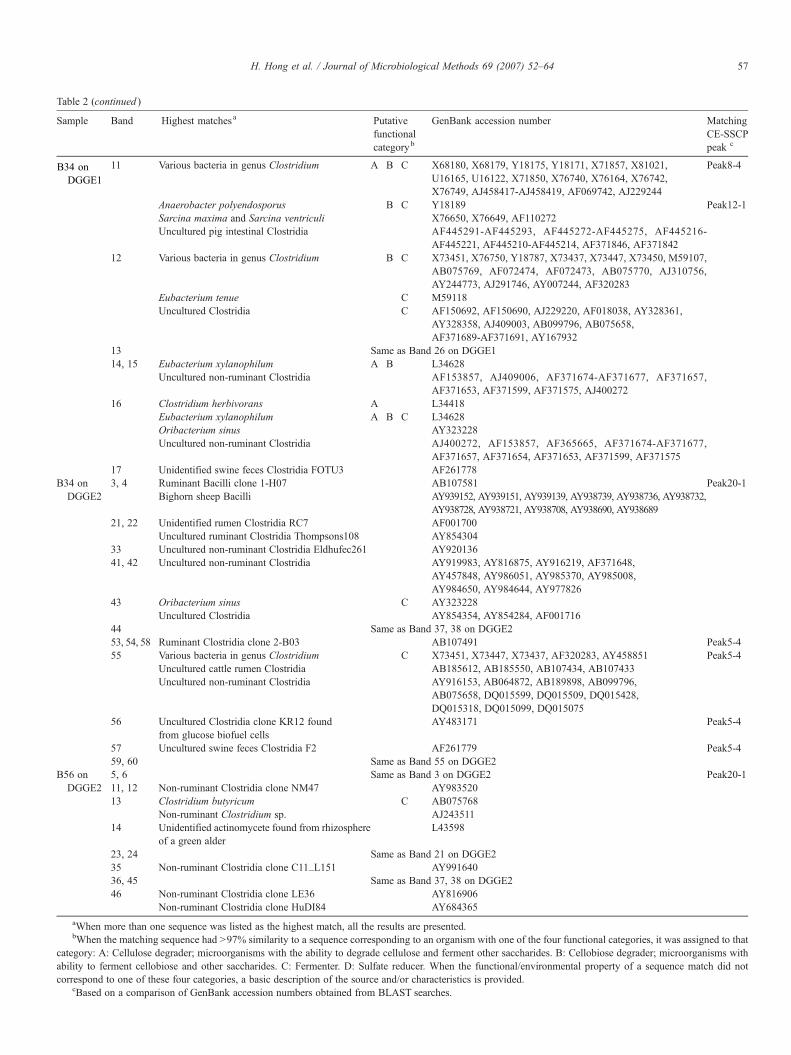
Table 2Characterization of bacterial DGGE bands from DGGE1 and DGGE2
Sample Band Highest matchesa Putativefunctionalcategoryb
GenBank accession number MatchingCE-SSCPpeak c
B17 onDGGE1
21 Eubacterium sp. clone BU061 (Unknown) AF38556722 Uncultured Clostridia BREC56 (Unknown) AY33835323 Butyrate-producing Clostridia L2-50 C AJ270491
Uncultured cattle rumen Clostridia AF018559, AB034032, AB034025Uncultured non-ruminant Clostridia AF153856, AF052416
24 Eubacterium halii C L34621Butyrate-producing Clostridia L2-7 C AJ270490Rumen Clostridia RF5 AF001738Non-ruminant Clostridia AB064719, AB064718, AF371667, AF371666,
AF371660, AF371659, AF37165825 Cattle rumen Clostridia AB034116, AB034115, AB034056
Non-ruminant Clostridia AB099740, AB064880, AF371941,AF371671, AF371656, AF371649
26, 27 Clostridia clone p-1594-c5 AF371648 Peak12-228 Mixed ruminal Clostridia PAD27 AF07046629 Various bacteria in genus Clostridium A B C X68180, X68179, X71850, Y18171, X81021,
U16165, U16122, X76164, Y15984,AJ458417-AJ458419, AJ229244,AB020190, AB020188, AB020187
Peak8-4
Non-ruminant Clostridia AF371842 Peak12-1B17 onDGGE2
7, 8 Elbe River Bacteroidetes snow isolate 9_3 C AF150715 Peak1419, 20 Uncultured non-ruminant Clostridia AY916219, AF371648, AY457848, AY986051,
AY985370, AY985008, AY984650, AY984644,AY977826, AF371648, AY816875, AY457848
25 Paenibacillus sp. TERI 1018 found atoily sludge contaminated site
AY269226
27 Bacteria in genus Acinetobacter, aerobicnonfermentative bacteria capable of growingon a large range of organic compounds
X81662, Z93437, AY586400, AF467306,AF467305, AF467302, AF467300, AF467298,AF467295, AF467294, AY639376, AJ247201,AJ247200
Peak23
29, 30 Non-ruminant Clostridia clone C20_a22 AY99172431 Non-ruminant Clostridia clone C13_H12 AY991279 Peak8-432 Non-ruminant Clostridia clone K319 AY97672637, 38 Non-ruminant Clostridia A12 AF052413
Non-ruminant manure pit Clostridia P3OTU1 AF26179439, 40 Non-ruminant Clostridia clone C15_N08 AY99389549, 50,51, 52
Clostridium mangenotii C D AJ318905, AJ318904
B34 onDGGE1
1 Same as Band 26 on DGGE12 Bacilli MOL361 C AF349724
Soil Bacilli C AY242740, AY242739Uncultured pig intestinal Bacilli AF371534-AF371536
3 Same as Band 24 on DGGE14 Various bacteria in genus Clostridium C X73451, Y18787, X73437, X73447, M59107,
AB075769, AF320283Eubacterium tenue C M59118Uncultured Clostridia C AF150692, AJ229220, AF018038, AJ409003,
AB064872, AB099796, AB075658, AY1679325 Various bacteria in genus Clostridium A B C X73446, X77842, U16147, X76164, X71850,
X68170, X68171, X68173-X68180, Y18175,Y18170-Y18172, AJ289704-AJ289706, AE007815,AE007612, AE007543, AE007541, AE007536,AE007528, AE007527, AE007513,AF270501, AF270502, AJ229244, AJ420008
Peak8-4
Sarcina maxima and Sarcina ventriculi C X76650, X76649, AF110272 Peak12-1Non-ruminant Clostridia MPN-isolate group 26 AF357574
6 Clostridium puniceum C X71857 Peak8-4Clostridium sp. DSM 5906 and 5907 C X76742, X76749 Peak12-1
7 Butyrate-producing Clostridia L2-50 C AJ270491Uncultured cattle rumen Clostridia AB034025, AF018559Uncultured non-ruminant Clostridia AF371640, AF052416, AF153856
56 H. Hong et al. / Journal of Microbiological Methods 69 (2007) 52–64
11 Various bacteria in genus Clostridium A B C X68180, X68179, Y18175, Y18171, X71857, X81021,U16165, U16122, X71850, X76740, X76164, X76742,X76749, AJ458417-AJ458419, AF069742, AJ229244
Peak8-4
Anaerobacter polyendosporus B C Y18189 Peak12-1Sarcina maxima and Sarcina ventriculi X76650, X76649, AF110272Uncultured pig intestinal Clostridia AF445291-AF445293, AF445272-AF445275, AF445216-
AF445221, AF445210-AF445214, AF371846, AF37184212 Various bacteria in genus Clostridium B C X73451, X76750, Y18787, X73437, X73447, X73450, M59107,
AB075769, AF072474, AF072473, AB075770, AJ310756,AY244773, AJ291746, AY007244, AF320283
Eubacterium tenue C M59118Uncultured Clostridia C AF150692, AF150690, AJ229220, AF018038, AY328361,
AY328358, AJ409003, AB099796, AB075658,AF371689-AF371691, AY167932
13 Same as Band 26 on DGGE114, 15 Eubacterium xylanophilum A B L34628
Uncultured non-ruminant Clostridia AF153857, AJ409006, AF371674-AF371677, AF371657,AF371653, AF371599, AF371575, AJ400272
16 Clostridium herbivorans A L34418Eubacterium xylanophilum A B C L34628Oribacterium sinus AY323228Uncultured non-ruminant Clostridia AJ400272, AF153857, AF365665, AF371674-AF371677,
AF371657, AF371654, AF371653, AF371599, AF37157517 Unidentified swine feces Clostridia FOTU3 AF261778
B34 onDGGE2
3, 4 Ruminant Bacilli clone 1-H07 AB107581 Peak20-1Bighorn sheep Bacilli AY939152, AY939151, AY939139, AY938739, AY938736, AY938732,
AY938728, AY938721, AY938708, AY938690, AY93868921, 22 Unidentified rumen Clostridia RC7 AF001700
Uncultured ruminant Clostridia Thompsons108 AY85430433 Uncultured non-ruminant Clostridia Eldhufec261 AY92013641, 42 Uncultured non-ruminant Clostridia AY919983, AY816875, AY916219, AF371648,
AY457848, AY986051, AY985370, AY985008,AY984650, AY984644, AY977826
43 Oribacterium sinus C AY323228Uncultured Clostridia AY854354, AY854284, AF001716
44 Same as Band 37, 38 on DGGE253, 54, 58 Ruminant Clostridia clone 2-B03 AB107491 Peak5-455 Various bacteria in genus Clostridium C X73451, X73447, X73437, AF320283, AY458851 Peak5-4
Uncultured cattle rumen Clostridia AB185612, AB185550, AB107434, AB107433Uncultured non-ruminant Clostridia AY916153, AB064872, AB189898, AB099796,
AB075658, DQ015599, DQ015509, DQ015428,DQ015318, DQ015099, DQ015075
56 Uncultured Clostridia clone KR12 foundfrom glucose biofuel cells
AY483171 Peak5-4
57 Uncultured swine feces Clostridia F2 AF261779 Peak5-459, 60 Same as Band 55 on DGGE2
B56 onDGGE2
5, 6 Same as Band 3 on DGGE2 Peak20-111, 12 Non-ruminant Clostridia clone NM47 AY98352013 Clostridium butyricum C AB075768
Non-ruminant Clostridium sp. AJ24351114 Unidentified actinomycete found from rhizosphere
of a green alderL43598
23, 24 Same as Band 21 on DGGE235 Non-ruminant Clostridia clone C11_L151 AY99164036, 45 Same as Band 37, 38 on DGGE246 Non-ruminant Clostridia clone LE36 AY816906
Non-ruminant Clostridia clone HuDI84 AY684365aWhen more than one sequence was listed as the highest match, all the results are presented.bWhen the matching sequence had N97% similarity to a sequence corresponding to an organism with one of the four functional categories, it was assigned to that
category: A: Cellulose degrader; microorganisms with the ability to degrade cellulose and ferment other saccharides. B: Cellobiose degrader; microorganisms withability to ferment cellobiose and other saccharides. C: Fermenter. D: Sulfate reducer. When the functional/environmental property of a sequence match did notcorrespond to one of these four categories, a basic description of the source and/or characteristics is provided.
cBased on a comparison of GenBank accession numbers obtained from BLAST searches.
B34 onDGGE1
Table 2 (continued )
Sample Band Highest matchesa Putativefunctionalcategoryb
GenBank accession number MatchingCE-SSCPpeak c
57H. Hong et al. / Journal of Microbiological Methods 69 (2007) 52–64

58 H. Hong et al. / Journal of Microbiological Methods 69 (2007) 52–64
diversity index is a common approach for accomplishing this. Inthis study, the Shannon diversity index were calculated as:
H ¼ −X ni
Nlog
niN
� �h ið1Þ
where H is the Shannon diversity index, ni is the intensity orheight of the individual DGGE bands or CE-SSCP peaks, andN is the sum of intensity or height of all the bands or peaks(Cox, 1972; Xia et al., 2005). CE-SSCP peaks were definedusing ABI GeneMapper Software (Foster City, CA) with theminimum value for the width of a peak at half the maximum
Fig. 2. CE-SSCP community profiles with time. Each sample was analyzed in triplicatafter approximately one year (hindered). The Y-axes of each electropherogram was scafor which matching clones were found are numbered (identified in Table 3). The va
height set to a value of 5. This same definition was alsoapplied in defining DGGE bands by converting the gel imagein each lane to a saturation profile using UVP LabworksSoftware (Upland, CA). This approach provided a means ofdirectly comparing the numbers of peaks and bands detectedby the two methods.
2.8. Cluster analysis
The reproducibility of DGGE and CE-SSCP profiles wascompared using cluster analysis. Intensity data from each lane
e. B17 was collected on day 41 (performance), B34 on day 99 (decline), and B56led to its maximum to compare relative peak heights. Only distinguishable peakslues of Shannon diversity index (H) are shown at the left of each in italics.

59H. Hong et al. / Journal of Microbiological Methods 69 (2007) 52–64
or electropherogram was obtained using Labworks (UVP,Upland, CA) for DGGE or extracted from GeneMapper usingDigitizeIt (Ingo Bormann, Braunschweig, Germany) for CE-SSCP. Cluster analyses were performed using SPSS forWindows (SPSS Inc., Chicago) and the dendrograms weredrawn using the squared Euclidean distance and Ward'smethod.
3. Results and discussion
3.1. Overall representation of the community
The community profiles obtained by DGGE (Fig. 1) includea few distinct bands and a high background signal, an indicationof community complexity. For sample B17, 16 distinguishablebands were observed in the nested DGGE and 15 were observedin the un-nested DGGE. From excised bands across all samplesand gels, it was possible to assign an identity to 80 of 97 totalsequences (Table 2). Judging by the number of peaks and therelative height of the baseline, the CE-SSCP patterns alsorevealed a complex community (Fig. 2). However, for sampleB17, 23 distinct peaks were observed and matching clones werefound for 17 of these (Table 3). The average sequence similarityto the highest matches was 94.9%±4.7 for the DGGE bands and93.6%±3.8 for CE-SSCP peaks, and the length of legiblesequence ranged from 49 to 169 base pairs (average=103 bp)for DGGE bands and 408 to 705 base pairs (average=652 bp)for clones matching CE-SSCP peaks. It was also notedgenerally that the DNA sequences obtained from the nestedDGGE were of higher quality in terms of overall legibility thanthose obtained from the un-nested DGGE.
There were some similarities and some differences observedbetween the two methods in comparing the communitycompositions. Only six CE-SSCP peaks were found to havethe same identity as DGGE bands (Tables 2, 3). Both methodsdetected several Clostridia and a few Bacilli, Bacteroidetes, andGamma Proteobacteria. However, DGGE failed to detect AlphaProteobacteria, Beta Proteobacteria, and Delta Proteobacteria,which were all detected by CE-SSCP (Table 4). Both methodsrevealed that Bacteria belonging to the class Clostridia were themost common in all columns (Table 4). In terms of functionalgroups, both methods detected bacteria with high similarities tocellulose degraders, fermenters, cellobiose degraders, sulfatereducers, or which had unrelated or unknown function. In-terestingly, although sulfate reduction was the main function ofthe columns, each method detected only one sulfate reducer(Table 4).
Peak heights were also compared as representative of relativedominance. Fig. 3 is a plot of the number of matching clonesversus peak height, with an R2 value of 0.727. Therefore,cloning results, which are commonly used to obtain semi-quantitative information about communities, were in goodagreement with CE-SSCP results. The fact that there weresix CE-SSCP peaks that could not be identified after screening159 random clones (e.g., Peak 22) is likely a result of thedifferent primers applied in cloning and CE-SSCP (Table 1).However, applying different primer sets is a useful way to
provide validation between the two methods and also to obtainlonger DNA sequences. A comparison of the CE-SSCP andDGGE, results reveals that the most intense band and peak forboth methods corresponded to Acinetobacter sp., and was onlypresent in sample B17 according to both methods. CE-SSCPpeaks 5 and 8 had the next highest intensities, and all matches tothese peaks corresponded to Clostridia. Sequences from severalhigh intensity DGGE bands were also found to have highmatches with various Clostridia.
There is currently interest in estimating diversity directlyfrom community fingerprints without the requirement forDNA sequencing (Hori et al., 2006; Loisel et al., 2006). In thisstudy, the Shannon diversity index revealed differences be-tween the relative diversities estimated by CE-SSCP andDGGE. The Shannon indices determined from the un-nestedDGGE community profiles indicated that column B56 had thehighest diversity (1.33±0.05) and that the diversity in columnsB17 and B34 were not significantly different (1.19±0.05 and1.19±0.04, respectively). The nested DGGE yielded a slightlyhigher diversity estimate for column B34, likely because morebands were detected in the nested PCR product. Diversity indi-ces determined for B34 from CE-SSCP profiles (1.23±0.03)were not significantly different from those determined fromDGGE profiles, but were higher for B17 (1.44±0.07) and B56(1.38±0.01). The higher resolution of CE-SSCP, which re-sulted in the detection of more peaks than DGGE bands, is thelikely cause of the higher diversity estimates obtained fromCE-SSCP data. It is also of interest to note that DGGE diver-sity estimates were lower than those of CE-SSCP in spite of thefact that sequencing data revealed the presence of severaldouble bands in the DGGE profiles with the same identity,whereas this was not an issue with CE-SSCP (discussed furtherin Section 3.3).
3.2. Reproducibility and resolution
The reproducibility of the DGGE and CE-SSCP methods wasdetermined using cluster analysis. For DGGE, PCR replicates runon the same gel were highly reproducible (Fig. 4). While thenested and un-nested DGGE profiles visually appeared to besimilar (Fig. 1), the cluster analysis showed that B17 and B34were more similar to each other on the nested DGGE gel thanthey were to the same sample on the un-nested gel (Fig. 4). Infact, on the un-nested gel, B34 was distinct from B17 and wasmore similar to B56. Therefore, though there were more bandsdetected and the sequence data was of higher quality, the nestedPCR protocol had a clear impact on the character of the DGGEprofile.
Cluster analysis of the CE-SSCP profiles also suggested thatB34 was more similar to B56, and that there is some reductionin reproducibility when the sample is not analyzed using thesame capillary (e.g., sample B17-1), although the profiles stillcluster together. Though it was not the focus of this study, ithas been noted in our broader analyses with the ABI 310 thatwhile most capillaries are consistent with respect to overallmobility, different capillary lot numbers differ with respect totheir relative sensitivities. Therefore, the PCR product dilutions
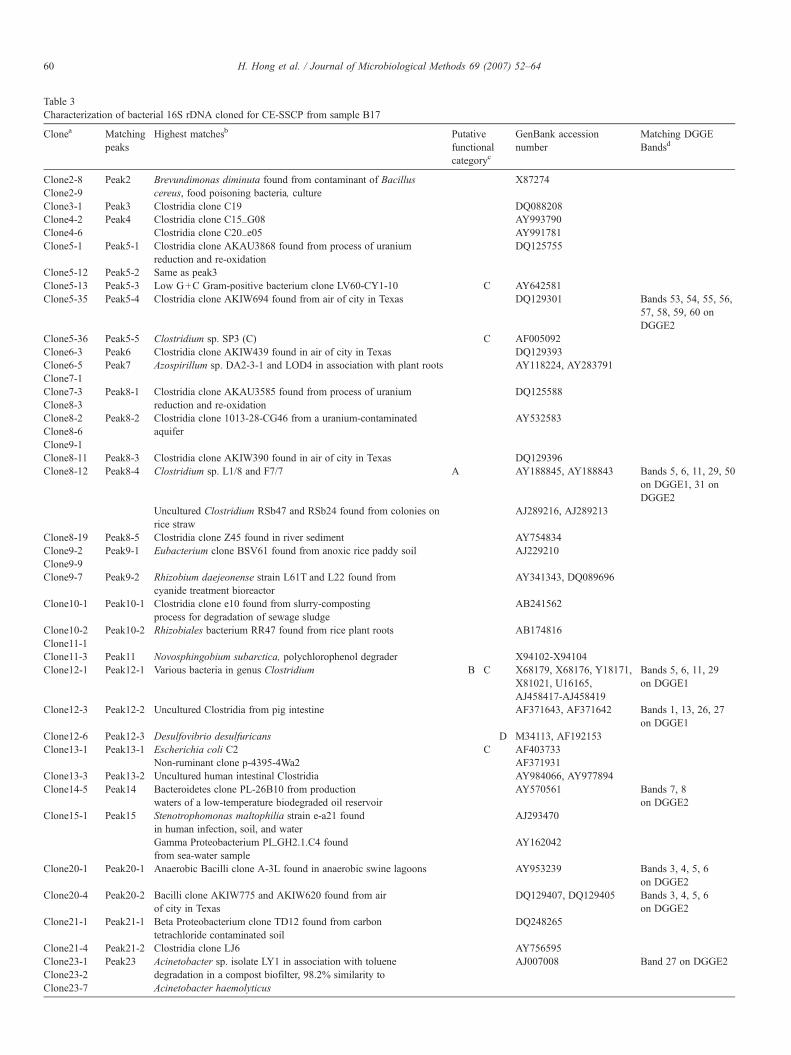
Table 3Characterization of bacterial 16S rDNA cloned for CE-SSCP from sample B17
Clonea Matchingpeaks
Highest matchesb Putativefunctionalcategoryc
GenBank accessionnumber
Matching DGGEBandsd
Clone2-8 Peak2 Brevundimonas diminuta found from contaminant of Bacilluscereus, food poisoning bacteria, culture
X87274Clone2-9Clone3-1 Peak3 Clostridia clone C19 DQ088208Clone4-2 Peak4 Clostridia clone C15_G08 AY993790Clone4-6 Clostridia clone C20_e05 AY991781Clone5-1 Peak5-1 Clostridia clone AKAU3868 found from process of uranium
reduction and re-oxidationDQ125755
Clone5-12 Peak5-2 Same as peak3Clone5-13 Peak5-3 Low G+C Gram-positive bacterium clone LV60-CY1-10 C AY642581Clone5-35 Peak5-4 Clostridia clone AKIW694 found from air of city in Texas DQ129301 Bands 53, 54, 55, 56,
57, 58, 59, 60 onDGGE2
Clone5-36 Peak5-5 Clostridium sp. SP3 (C) C AF005092Clone6-3 Peak6 Clostridia clone AKIW439 found in air of city in Texas DQ129393Clone6-5 Peak7 Azospirillum sp. DA2-3-1 and LOD4 in association with plant roots AY118224, AY283791Clone7-1Clone7-3 Peak8-1 Clostridia clone AKAU3585 found from process of uranium
reduction and re-oxidationDQ125588
Clone8-3Clone8-2 Peak8-2 Clostridia clone 1013-28-CG46 from a uranium-contaminated
aquiferAY532583
Clone8-6Clone9-1Clone8-11 Peak8-3 Clostridia clone AKIW390 found in air of city in Texas DQ129396Clone8-12 Peak8-4 Clostridium sp. L1/8 and F7/7 A AY188845, AY188843 Bands 5, 6, 11, 29, 50
on DGGE1, 31 onDGGE2
Uncultured Clostridium RSb47 and RSb24 found from colonies onrice straw
AJ289216, AJ289213
Clone8-19 Peak8-5 Clostridia clone Z45 found in river sediment AY754834Clone9-2 Peak9-1 Eubacterium clone BSV61 found from anoxic rice paddy soil AJ229210Clone9-9Clone9-7 Peak9-2 Rhizobium daejeonense strain L61T and L22 found from
cyanide treatment bioreactorAY341343, DQ089696
Clone10-1 Peak10-1 Clostridia clone e10 found from slurry-compostingprocess for degradation of sewage sludge
AB241562
Clone10-2 Peak10-2 Rhizobiales bacterium RR47 found from rice plant roots AB174816Clone11-1Clone11-3 Peak11 Novosphingobium subarctica, polychlorophenol degrader X94102-X94104Clone12-1 Peak12-1 Various bacteria in genus Clostridium B C X68179, X68176, Y18171,
X81021, U16165,AJ458417-AJ458419
Bands 5, 6, 11, 29on DGGE1
Clone12-3 Peak12-2 Uncultured Clostridia from pig intestine AF371643, AF371642 Bands 1, 13, 26, 27on DGGE1
Clone12-6 Peak12-3 Desulfovibrio desulfuricans D M34113, AF192153Clone13-1 Peak13-1 Escherichia coli C2 C AF403733
Non-ruminant clone p-4395-4Wa2 AF371931Clone13-3 Peak13-2 Uncultured human intestinal Clostridia AY984066, AY977894Clone14-5 Peak14 Bacteroidetes clone PL-26B10 from production
waters of a low-temperature biodegraded oil reservoirAY570561 Bands 7, 8
on DGGE2Clone15-1 Peak15 Stenotrophomonas maltophilia strain e-a21 found
in human infection, soil, and waterAJ293470
Gamma Proteobacterium PI_GH2.1.C4 foundfrom sea-water sample
AY162042
Clone20-1 Peak20-1 Anaerobic Bacilli clone A-3L found in anaerobic swine lagoons AY953239 Bands 3, 4, 5, 6on DGGE2
Clone20-4 Peak20-2 Bacilli clone AKIW775 and AKIW620 found from airof city in Texas
DQ129407, DQ129405 Bands 3, 4, 5, 6on DGGE2
Clone21-1 Peak21-1 Beta Proteobacterium clone TD12 found from carbontetrachloride contaminated soil
DQ248265
Clone21-4 Peak21-2 Clostridia clone LJ6 AY756595Clone23-1 Peak23 Acinetobacter sp. isolate LY1 in association with toluene
degradation in a compost biofilter, 98.2% similarity toAcinetobacter haemolyticus
AJ007008 Band 27 on DGGE2Clone23-2Clone23-7
60 H. Hong et al. / Journal of Microbiological Methods 69 (2007) 52–64
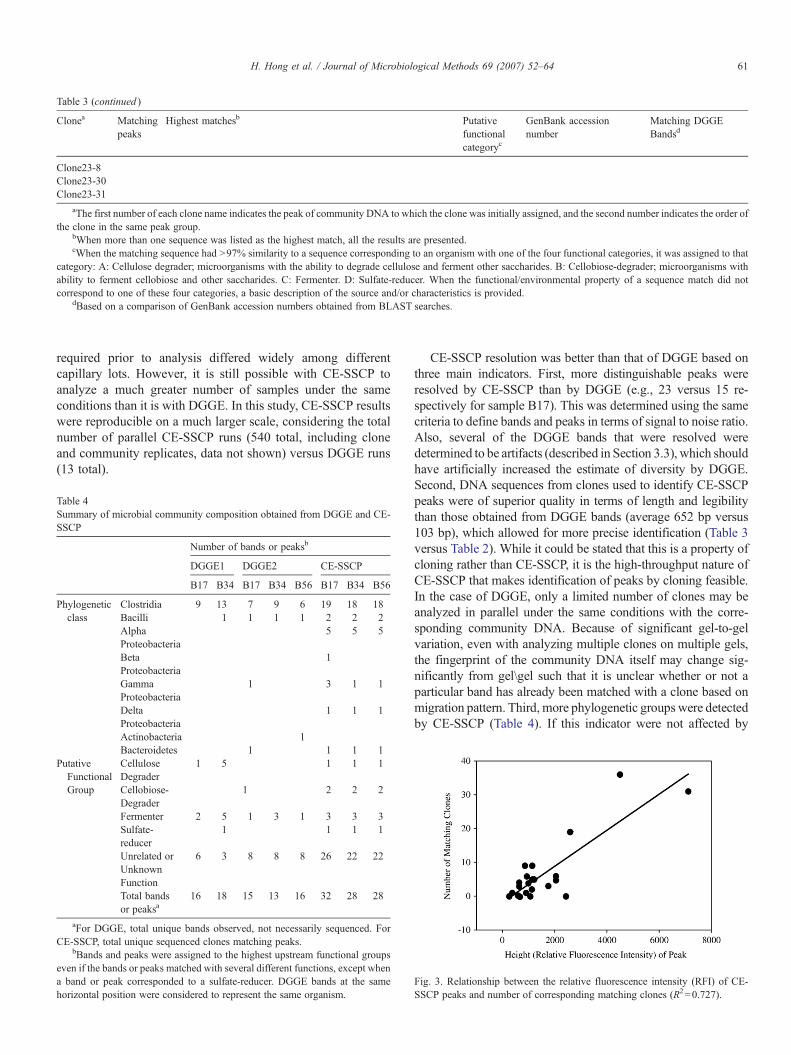
Table 3 (continued )
Clonea Matchingpeaks
Highest matchesb Putativefunctionalcategoryc
GenBank accessionnumber
Matching DGGEBandsd
Clone23-8Clone23-30Clone23-31
aThe first number of each clone name indicates the peak of community DNA to which the clone was initially assigned, and the second number indicates the order ofthe clone in the same peak group.
bWhen more than one sequence was listed as the highest match, all the results are presented.cWhen the matching sequence had N97% similarity to a sequence corresponding to an organism with one of the four functional categories, it was assigned to that
category: A: Cellulose degrader; microorganisms with the ability to degrade cellulose and ferment other saccharides. B: Cellobiose-degrader; microorganisms withability to ferment cellobiose and other saccharides. C: Fermenter. D: Sulfate-reducer. When the functional/environmental property of a sequence match did notcorrespond to one of these four categories, a basic description of the source and/or characteristics is provided.
dBased on a comparison of GenBank accession numbers obtained from BLAST searches.
61H. Hong et al. / Journal of Microbiological Methods 69 (2007) 52–64
required prior to analysis differed widely among differentcapillary lots. However, it is still possible with CE-SSCP toanalyze a much greater number of samples under the sameconditions than it is with DGGE. In this study, CE-SSCP resultswere reproducible on a much larger scale, considering the totalnumber of parallel CE-SSCP runs (540 total, including cloneand community replicates, data not shown) versus DGGE runs(13 total).
Table 4Summary of microbial community composition obtained from DGGE and CE-SSCP
Number of bands or peaksb
DGGE1 DGGE2 CE-SSCP
B17 B34 B17 B34 B56 B17 B34 B56
Phylogeneticclass
Clostridia 9 13 7 9 6 19 18 18Bacilli 1 1 1 1 2 2 2AlphaProteobacteria
5 5 5
BetaProteobacteria
1
GammaProteobacteria
1 3 1 1
DeltaProteobacteria
1 1 1
Actinobacteria 1Bacteroidetes 1 1 1 1
PutativeFunctionalGroup
CelluloseDegrader
1 5 1 1 1
Cellobiose-Degrader
1 2 2 2
Fermenter 2 5 1 3 1 3 3 3Sulfate-reducer
1 1 1 1
Unrelated orUnknownFunction
6 3 8 8 8 26 22 22
Total bandsor peaksa
16 18 15 13 16 32 28 28
aFor DGGE, total unique bands observed, not necessarily sequenced. ForCE-SSCP, total unique sequenced clones matching peaks.
bBands and peaks were assigned to the highest upstream functional groupseven if the bands or peaks matched with several different functions, except whena band or peak corresponded to a sulfate-reducer. DGGE bands at the samehorizontal position were considered to represent the same organism.
CE-SSCP resolution was better than that of DGGE based onthree main indicators. First, more distinguishable peaks wereresolved by CE-SSCP than by DGGE (e.g., 23 versus 15 re-spectively for sample B17). This was determined using the samecriteria to define bands and peaks in terms of signal to noise ratio.Also, several of the DGGE bands that were resolved weredetermined to be artifacts (described in Section 3.3), which shouldhave artificially increased the estimate of diversity by DGGE.Second, DNA sequences from clones used to identify CE-SSCPpeaks were of superior quality in terms of length and legibilitythan those obtained from DGGE bands (average 652 bp versus103 bp), which allowed for more precise identification (Table 3versus Table 2). While it could be stated that this is a property ofcloning rather than CE-SSCP, it is the high-throughput nature ofCE-SSCP that makes identification of peaks by cloning feasible.In the case of DGGE, only a limited number of clones may beanalyzed in parallel under the same conditions with the corre-sponding community DNA. Because of significant gel-to-gelvariation, even with analyzing multiple clones on multiple gels,the fingerprint of the community DNA itself may change sig-nificantly from gel\gel such that it is unclear whether or not aparticular band has already been matched with a clone based onmigration pattern. Third, more phylogenetic groups were detectedby CE-SSCP (Table 4). If this indicator were not affected by
Fig. 3. Relationship between the relative fluorescence intensity (RFI) of CE-SSCP peaks and number of corresponding matching clones (R2=0.727).

Fig. 4. Cluster analyses of DGGE lanes and CE-SSCP electropherograms: DGGE1=DGGE gel run with nested PCR products, DGGE2=DGGE gel run with un-nested PCR products, B17=composite sample from columns 1 and 7 (performance), C34=composite sample from columns 3 and 4 (decline), C56=mixed samplefrom columns 5 and 6 (hindered). Numbered suffixes indicate the order of lanes from the left to right for DGGE (Fig. 1) and patterns from the top to the bottom for CE-SSCP (Fig. 2). Note that CE-SSCP-B17-1 was analyzed on a separate capillary than the other samples. The dashed scale bar indicates relative distance for each cluster.
62 H. Hong et al. / Journal of Microbiological Methods 69 (2007) 52–64
resolution, then a correlation between the number of clones orDGGE bands sequenced and the number of phylogeneticgroups detected would be expected. In this study, the oppositetrend was observed, and though more DGGE bands wereanalyzed, fewer phylogenetic groups were detected. Althoughthe sequence quality of the DGGE bands was poorer, 80 of 97sequenced could readily be assigned to phylogenetic class, yetfewer classes were identified. This difference could be an effectof the primers (Table 1); however, the DGGE primers weredesigned incorporating inosine base pairs in order to provide abroader range of detection (Watanabe et al., 2001). Therefore,the differences in detection of phylogenetic groups are likelydue to the actual separation mechanism. Also, fewer phyloge-netic groups were detected by DGGE regardless of the nested orun-nested protocol, suggesting that it was not a result of PCRconditions, but rather the separation mechanism itself. In-terestingly, Hori et al. (2006) also noted higher resolution whencomparing gel-based SSCP to DGGE, which supports theseresults. The main effect of the nested PCR conditions appearedto be that the dominant bands increased in intensity and thatDNA sequence quality was generally better (data not shown),suggesting enrichment of dominants, but also the likelihood ofPCR bias effects.
A comparison of resolution in terms of co-migration of bandsand peaks was more difficult to make. While DGGE bandsyielding illegible sequence data were likely due to the presenceof multiple co-migrating sequences (e.g., 17 of 90 sequenced),the sequence quality for remaining DGGE bands was generallypoor and required significant editing of ambiguous base pairs
compared to sequences used to identify CE-SSCP peaks.Recently, a method termed gel-expansion DGGE (DGGEGE)(Gafan and Spratt, 2005) has been described for re-resolvingexcised DGGE bands. However, it was considered that thisapproach would defeat the purpose of a high-throughput com-parison of the methods. Since that the vast majority of DGGEbands were closely related and matched Clostridia, it is highlypossible that many of the bands were in fact the result of co-migration of similar species that manifested as a noisy, butlegible sequence. This may help to explain the common obser-vation that bands at the same horizontal position in the DGGEgels only represented the same organism in about half of thecases. In contrast, though just under half of the dominant CE-SSCP peaks were the result of co-migration (Table 2), thesecould be clearly characterized because the sequence informationwas obtained from clones. In order to definitively identifymultiple sequences present in DGGE bands, it would benecessary to clone each band or to apply the DGGEGEapproach, either of whichwould greatly add to the cost and labor.
3.3. Artifacts
A common critique of community fingerprinting techniques isthe potential for artifacts, such as one organism yielding more thanone band or peak (Gelsomino et al., 1999; Tiedje et al., 1999). Thiskind of artifact was clearly more problematic for DGGE than CE-SSCP. Ten pairs of DGGE bands from DGGE2 were observed astwo separate bands in the same lane, but had the same sequencingresults. Interestingly, all of these appeared as “double bands”

63H. Hong et al. / Journal of Microbiological Methods 69 (2007) 52–64
adjacent to each other, rather than having distinct migrationpatterns (all entries in Table 2 in which two bands are listed on thesame line). In the CE-SSCP results there was one sequence thatmatched with more than one peak (peak 3 and 5-2, Table 3), butthese were not present as “double peaks” as observed in DGGE.This suggests that CE-SSCP is less likely to produce artifacts in theform of double peaks. One potential reason why more doublebands were observed in DGGE was because Taq polymerase wasused, which does not have 100% efficiency in adenylating PCRproducts. Thus, partial adenylation could have yielded two bandsfrom one microorganism with highly similar migration patterns.The blunt-ended polymerase applied in CE-SSCP may havehelped to avoid this problem. In this study, sequences with thesame DNA sequence identity found in different bands or peakswere assumed to be artifacts. However, strictly speaking, it is alsopossible that two closely related strains could legitimately formdistinct bands or peaks that were not distinguished based on theDNA sequence information. Therefore, future studies aresuggested to investigate the migration behavior of 16S rRNAgenes from pure cultures.
Another artifact that has been cited is that bands and peaks fromdifferent samples at the same position do not always represent thesame microorganism. In this study, only about half of the DGGEbands that were at the same position from different samples col-lectedwith time revealed the same results from the databases (13 of25 bands thatwere sequenced at the same horizontal position). Thisconfirmed that for complex communities, it cannot always beassumed that bands appearing at the same horizontal positionacross samples represent the same organism, and therefore it isgood protocol to sequence multiple bands for each position in acomplex community. In CE-SSCP, sequences were only obtainedfrom B17, so this type of artifact was not characterized. However,as discussed above, CE-SSCP peaks containing sequences withmultiple identities can be readily characterized.
A third artifact typically associated with DGGE is the effectof heteroduplexes. The mismatched base pairs of heterodu-plexes cause the strands to denature readily, and thus, these cantypically be observed at the top of the DGGE gel and aredistinguishable from true bands. In this study, it was noted thatthere were several bands at the top of the DGGE gel when nestedproducts were analyzed, but not when un-nested products wereanalyzed. These suspect heteroduplexes were therefore avoidedin downstream analyses (this section of the gel is not shown inFig. 1). Because single strands of DNA are analyzed using CE-SSCP, heteroduplex artifacts are entirely avoided.
3.4. Labor and analysis time
The actual labor time per sample, including any necessary PCR,cloning, or electrophoresis preparation steps, was estimated to besimilar between CE-SSCP and DGGE. In terms of total analysistime per sample, which was determined as the time that passedstarting when the first PCR reaction was prepared and endingwhensamples were processed for sequencing, CE-SSCP required 25%less time (27 h) than DGGE (36 h). For more than 16 samples,DGGE gel preparation time increases because two gels have to beprepared. For more than 32 samples, DGGE total analysis time
doubles because only two gels can be run at one time, while CE-SSCP analysis time increases only linearly in this range. It is alsoimportant to consider that gel-to-gel variation is likely to be aproblem for DGGE with more than 16 samples, and also that thetwo outer wells of each gel tend to have skewedmigration patterns.DNA sequence analysis time for clones was significantly shorterthan for DGGE bands because of the quality and length of thesequences obtained.
4. Conclusions
This study provides a detailed comparison of DGGE versusCE-SSCP for profiling a complex sulfate-reducing communityinvolved in bioremediation of mine drainage. Overall, CE-SSCP was found to be superior to DGGE in terms of thedetection range of different phylogenetic groups, resolution,susceptibility to artifacts, and labor and analysis time. Thus,CE-SSCP holds promise for high-throughput monitoring ofbioremediation communities.
Acknowledgments
The authors thank EPA STAR grant number R8395101-0 forfunding this project through the Region 8 Hazardous SubstanceResearch Center (HSRC) at Colorado State University. Theauthors would also like to thank Miranda Logan and LindaFigueroa for providing the column samples and relevantinformation about the column experiments, as well as LauraInman and Carmen Sans for their help in sample preparation.
References
Altschul, S.F., Madden, T.L., Schaffer, A.A., Zhang, J., Zhang, Z., Miller, W.,Lipman, D.J., 1997. Gapped BLAST and PSI-BLAST: a new generation ofprotein database search programs. Nucleic Acids Research 25, 3389–3402.
Chackhiani, M., Dabert, P., Abzianidze, T., Partskhaladze, G., Tsiklauri, L.,Dudauri, T., Godon, J.J., 2004. 16S rDNA characterisation of bacterial andarchaeal communities during start-up of anaerobic thermophilic digestion ofcattle manure. Bioresource Technology 93, 227–232.
Clement, B.G., Kehl, L.E., DeBord, K.L., Kitts, C.L., 1998. Terminal restrictionfragment patterns (TRFPs), a rapid, PCR-based method for the comparisonof complex bacterial communities. Journal of Microbiological Methods 31(3), 135–142.
Cole, J.R., Chai, B., Farris, R.J., Wang, Q., Kulam, S.A., McGarrell, D.M.,Garrity, G.M., Tiedje, J.M., 2005. The Ribosomal Database Project (RDP-II): sequences and tools for high-throughput rRNA analysis. Nucleic AcidsResearch 33, D294–D296.
Cox, G.W., 1972. Laboratory Manual of General Ecology. W.C. Brown,Dubuque, Iowa, pp. 120–124.
Dabert, P., Delgenes, J.P., Godon, J.-J., 2005. Monitoring the impact ofbioaugmentation on the start up of biological phosphorus removal in alaboratory scale activated sludge ecosystem. Applied Microbiology andBiotechnology 66 (5), 575–588.
Delbes, C., Moletta, R., Godon, J.J., 2000. Monitoring of activity dynamics ofan anaerobic digester bacterial community using 16S rRNA polymerasechain reaction–single-strand conformation polymorphism analysis. Envi-ronmental Microbiology 2 (5), 506–515.
Delbes, C., Moletta, R., Godon, J.J., 2001. Bacterial and archaeal 16S rDNA and16S rRNA dynamics during an acetate crisis in an anaerobic digestorecosystem. FEMS Microbiology, Ecology 35, 19–26.
Filatov, D.A., 2002. PROSEQ: a software for preparation and evolutionaryanalysis of DNA sequence data sets. Molecular Ecology Notes 2, 621–624.

64 H. Hong et al. / Journal of Microbiological Methods 69 (2007) 52–64
Gafan, G.P., Spratt, D.A., 2005. Denaturing gradient gel electrophoresis gelexpansion (DGGEGE)— an attempt to resolve the limitations of co-migration in the DGGE of complex polymicrobial communities. FEMSMicrobiology Letters 253 (2), 303–307.
Gelsomino, A., Keijzer-Wolters, A.C., Cacco, G., van Elsas, J.D., 1999.Assessment of bacterial community structure in soil by polymerase chainreaction and denaturing gradient gel electrophoresis. Journal of Microbio-logical Methods 38, 1–15.
Hall, B.G., 2004. Tutorial: Create a Tree!, Phylogenetic Trees Made Easy: AHow-To Manual, 2nd edition. Sinauer Associates, Sunderlandm, Massa-chusetts, pp. 9–60.
Hebenbrock, K., Williams, P.M., Karger, B.L., 1995. Single-strand conforma-tional polymorphism using capillary electrophoresis with 2-dye laser-induced fluorescence detection. 16 (8), 1429–1436.
Hori, T., Haruta, S., Ueno, Y., Ishii, M., Igarashi, Y., 2006. Direct comparison ofsingle-strand conformation polymorphism (SSCP) and denaturing gradient gelelectrophoresis (DGGE) to characterize a microbial community on the basis of16S rRNA gene fragments. Journal of Microbiological Methods 66 (1),165–169.
Hu, G.X., 1993. DNA polymerase-catalyzed addition of nontemplated extranucleotides to the 3′ end of a DNA fragment. DNA and Cell Biology 12,763–770.
Hulshof, A.H.M., Blowes, D.W., Gould, W.D., 2006. Evaluation of in situ layersfor treatment of acid mine drainage: a field comparison.Water Research 40 (9),1816–1826.
King, S., McCord, B.R., Riefler, R.G., 2005. Capillary electrophoresis single-strand conformation polymorphism analysis for monitoring soil bacteria.Journal of Microbiological Methods 60 (1), 83–92.
Lee, D.H., Zo, Y.G., Kim, S.J., 1996. Nonradioactive method to study geneticprofiles of natural bacterial communities by PCR-single-strand-conforma-tion polymorphism. Applied and Environmental Microbiology 62 (9),3112–3120.
Logan, M.V., Reardon, K.F., Figueroa, L.A., McLain, J.E.T., Ahmann, D.M.,2005. Microbial community activities during establishment, performance,and decline of bench-scale passive treatment systems for mine drainage.Water Research 39, 4537–4551.
Loisel, P., Harmand, J., Zemb, O., Latrille, E., Lobry, C., Delgenes, J.P., Godon,J.-J., 2006. Denaturing gradient electrophoresis (DGE) and single-strandconformation polymorphism (SSCP) molecular fingerprintings revisited bysimulation and used as a tool to measure microbial diversity. EnvironmentalMicrobiology 8 (4), 720–731.
Mahmood, S., Freitag, T.E., Prosser, J.I., 2006. Comparison of PCR primer-based strategies for characterization of ammonia oxidizer communities inenvironmental samples. FEMS Microbiology, Ecology 56 (3), 482–493.
Mills, D.K., Fitzgerald, K., Litchfield, C.D., Gillevet, P.M., 2003. A comparisonof DNA profiling techniques for monitoring nutrient impact on microbialcommunity composition during bioremediation of petroleum-contaminatedsoils. Journal of Microbiological Methods 54 (1), 57–74.
Muyzer, G., DeWaal, E.C., Uitterlinden, A.G., 1993. Profiling of complexmicrobial-populations by denaturing gradient gel electrophoresis analysis ofpolymerase chain reaction-amplified genes-coding for 16S ribosomal-RNA.Applied and Environmental Microbiology 59 (3), 695–700.
Muyzer, G., Hottentrager, S., Teske, A., Wawer, C., 1996. Denaturing gradient gelelectrophoresis of PCR-amplified 16S rDNA— a new molecular approach toanalyse the genetic diversity of mixed microbial communities. In: Akkermans,A.D.L., vanElsas, J.D., deBruijn, F.J. (Eds.), Molecular Microbial EcologyManual. Kluwer Academic Publishers, Dordrecht, pp. 3.4.4./1–3.4.4./23.
Peu, P., Brugere, H., Pourcher, A.M., Kerouredan, M., Godon, J.-.J., Delgenes,J.P., Dabert, P., 2006. Dynamics of a pig slurry microbial community duringanaerobic storage and management. Applied and Environmental Microbi-ology 72 (5), 3578–3585.
Saitou, N., Nei, M., 1987. The neighbor-joining method— a new method forreconstructing phylogenetic trees. Molecular Biology and Evolution 4,406–425.
Suzuki, M., Rappe, M.S., Giovannoni, S.J., 1998. Kinetic bias in estimates ofcoastal picoplankton community structure obtained by measurements ofsmall-subunit rRNA gene PCR amplicon length heterogeneity. Applied andEnvironmental Microbiology 64 (11), 4522–4529.
Thompson, J.D., Gibson, T.J., Plewniak, F., Jeanmougin, F., Higgins, D.G.,1997. The CLUSTAL_X windows interface: flexible strategies for multiplesequence alignment aided by quality analysis tools. Nucleic Acids Research25, 4876–4882.
Tiedje, J.M., Asuming-Brempong, S., Nusslein, K., Marsh, T.L., Flynn, S.J.,1999. Opening the black box of soil microbial diversity. Applied SoilEcology 13, 109–122.
Watanabe, K., Kodama, Y., Harayama, S., 2001. Design and evaluation of PCRprimers to amplify bacterial 16S ribosomal DNA fragments used forcommunity fingerprinting. Journal of Microbiological Methods 44,253–262.
Weisburg, W.G., Barns, S.M., Pelletier, D.A., Lane, D.J., 1991. 16s ribosomalDNA amplification for phylogenetic study. Journal of Bacteriology 173,697–703.
Xia, S.Q., Shi, Y., Fu, Y.G., Ma, X.M., 2005. DGGE analysis of 16S rDNA ofammonia-oxidizing bacteria in chemical–biological flocculation andchemical coagulation systems. Applied Microbiology and Biotechnology69, 99–105.