Molecules article of mine
18
Molecules 2014, 19, 11178-11195; doi:10.3390/molecules190811178 molecules ISSN 1420-3049 www.mdpi.com/journal/molecules Article Effects of Subacute Hypothyroidism on Metabolism and Growth-Related Molecules Yen-Jui Chang 1,2 , Chii-Min Hwu 3 , Chii-Chang Yeh 4 , Paulus S. Wang 1,5,6,7,†, * and Shyi-Wu Wang 8,†, * 1 Department of Physiology, School of Medicine, National Yang-Ming University, Taipei 11221, Taiwan 2 Department of Surgery, Yangming Branch, Taipei City Hospital, Taipei 11146, Taiwan 3 Departments of Internal Medicine and Medical Research and Education, Taipei Veterans General Hospital, Taipei 11217, Taiwan 4 Department of Internal Medicine, Yangming Branch, Taipei City Hospital, Taipei 11146, Taiwan 5 Department of Medical Research and Education, Taipei Veterans General Hospital, Taipei 11217, Taiwan 6 Medical Center of Aging Research, China Medical University Hospital, Taichung 40402, Taiwan 7 Department of Biotechnology, College of Health Science, Asia University, Taichung 41354, Taiwan 8 Department of Physiology and Pharmacology, Chang Gung University, Taoyuan 33333, Taiwan † These authors contributed equally to this work. * Authors to whom correspondence should be addressed; E-Mails: [email protected] (P.S.W.); [email protected] (S.-W.W.); Tel.: +886-2-2826-7082 (P.S.W.); +886-3-2118800 (ext. 5253) (S.-W.W.); Fax: +886-2-2826-4049 (P.S.W.); +886-3-2118700 (S.-W.W.). Received: 15 April 2014; in revised form: 14 July 2014 / Accepted: 17 July 2014 / Published: 30 July 2014 Abstract: Thyroid hormones are crucial hormones that primarily regulate the metabolism of entire body cells. In this study, Sprague-Dawley rats were grouped into sham thyroidectomy (Sham Tx), thyroidectomy (Tx), Tx with thyroxine replacement (Tx + T4), and PTU injection (PTU) groups. Metabolic parameters were measured by means of metabolic cages for 14 days. After 14 days, the rats were sacrificed while the levels of plasma or serum TSH and growth-related molecules, such as active and total ghrelin, GH, and IGF-1, were assayed. The results revealed that hypothyroid rats tended to eat less food and experienced substantial body weight gain, whereas the rats with T4 replacement tended to eat more food OPEN ACCESS
Transcript of Molecules article of mine

Molecules 2014, 19, 11178-11195; doi:10.3390/molecules190811178
molecules ISSN 1420-3049
www.mdpi.com/journal/molecules
Article
Effects of Subacute Hypothyroidism on Metabolism and Growth-Related Molecules
Yen-Jui Chang 1,2, Chii-Min Hwu 3, Chii-Chang Yeh 4, Paulus S. Wang 1,5,6,7,†,* and Shyi-Wu Wang 8,†,*
1 Department of Physiology, School of Medicine, National Yang-Ming University, Taipei 11221,
Taiwan 2 Department of Surgery, Yangming Branch, Taipei City Hospital, Taipei 11146, Taiwan 3 Departments of Internal Medicine and Medical Research and Education, Taipei Veterans General
Hospital, Taipei 11217, Taiwan 4 Department of Internal Medicine, Yangming Branch, Taipei City Hospital, Taipei 11146, Taiwan 5 Department of Medical Research and Education, Taipei Veterans General Hospital,
Taipei 11217, Taiwan 6 Medical Center of Aging Research, China Medical University Hospital, Taichung 40402, Taiwan 7 Department of Biotechnology, College of Health Science, Asia University, Taichung 41354, Taiwan 8 Department of Physiology and Pharmacology, Chang Gung University, Taoyuan 33333, Taiwan
† These authors contributed equally to this work.
* Authors to whom correspondence should be addressed;
E-Mails: [email protected] (P.S.W.); [email protected] (S.-W.W.);
Tel.: +886-2-2826-7082 (P.S.W.); +886-3-2118800 (ext. 5253) (S.-W.W.);
Fax: +886-2-2826-4049 (P.S.W.); +886-3-2118700 (S.-W.W.).
Received: 15 April 2014; in revised form: 14 July 2014 / Accepted: 17 July 2014 /
Published: 30 July 2014
Abstract: Thyroid hormones are crucial hormones that primarily regulate the metabolism of
entire body cells. In this study, Sprague-Dawley rats were grouped into sham thyroidectomy
(Sham Tx), thyroidectomy (Tx), Tx with thyroxine replacement (Tx + T4), and PTU
injection (PTU) groups. Metabolic parameters were measured by means of metabolic cages
for 14 days. After 14 days, the rats were sacrificed while the levels of plasma or serum TSH
and growth-related molecules, such as active and total ghrelin, GH, and IGF-1, were
assayed. The results revealed that hypothyroid rats tended to eat less food and experienced
substantial body weight gain, whereas the rats with T4 replacement tended to eat more food
OPEN ACCESS

Molecules 2014, 19 11179
while continuing to lose weight. In hypothyroid rats, the growth-related molecules, such as
active ghrelin and total ghrelin secretion, were enhanced, and the ghrelin receptors were also
up-regulated. However, circulating GH levels were not elevated and IGF-1 secretion was
inhibited in hypothyroid rats. In the Tx + T4 group, the changes of active ghrelin, total
ghrelin, GHS-R expression, and IGF-1 were reversed, whereas the GH secretion was higher
than that of the Sham Tx group and hypothyroid groups. This study resulted in the novel
finding that the ghrelin/GHS-R axis and GH/IGF-1 axis are interrupted in hypothyroid rats.
Keywords: hypothyroidism; thyroxine; growth-related molecules; ghrelin; insulin-like
growth factor-1; growth hormone
1. Introduction
Thyroid hormones are secreted by follicular cells in the thyroid gland. A thyroid-stimulating
hormone (TSH) stimulates the secretion of thyroid hormones, including triiodothyronine (T3) and
thyroxine (T4). In plasma, the ratio of T4 and T3 is approximately 20:1. The half-life of T4 is longer
than that of T3. Thyroxine is converted to T3 in peripheral tissue by deiodinases (5'-iodinase).
However, the potency of T3 is three to four times that of T4. T3 and T4 can be decarboxylated or
deiodinated to produce iodothyronamine (T1a) and thyronamine (T0a) [1,2]. Thyroid hormones act on
almost all cells in the body with various functions, including increasing the basal metabolic rate,
affecting protein synthesis, and regulating the metabolism of protein, lipids, and carbohydrates.
Through synergy with the growth hormone, thyroid hormones modulate the growth of long bones and
the differentiation of neurons. They also enhance tissue sensitivity to catecholamines, such as adrenalin
and noradrenalin [3].
Thyroid dysfunctions may also have metabolic consequences. They can be divided into
hyperthyroidism and hypothyroidism. In contrast to hypothyroidism, the typical symptoms of
hyperthyroidism are increased basal metabolic rate, body weight loss, and tachycardia. Various animal
models for thyroid dysfunctions have been used in rats. The thyroid glands are resected through
thyroidectomy or destroyed by propylthiouracil (PTU) and methimazole. The circulating thyroid
hormones are metabolized and cleaned after 2 weeks. Rats without thyroid hormone replacement
exhibit hypothyroidism, and those administered 300 μg/kg or more of T4 exhibit hyperthyroidism [4].
Thyroid hormones are administrated subcutaneously, intraperitoneally, or orally [5–8].
The surgical removal of the thyroid gland involves the removal of the calcitonin-secreting
parafollicular cells and the parathyroid gland. Therefore, it alters the homeostasis of circulating
calcium. Conversely, chemical destruction of the thyroid gland by PTU alters hematopoiesis, the
secretion of gastric inhibitory peptide, and steroidogenesis [9–12]. We used both surgical and chemical
methods to destroy the thyroid gland tissue in order to examine the effects of hypothyroidism.
Several circulating molecules are involved in physical growth. Smith et al. found that small
synthetic molecules can stimulate the secretion of growth hormones. These molecules bind to a
G-protein-coupled receptor called the growth-hormone secretagogue receptor (GHS-R) to achieve this
effect [13]. Kojima et al. isolated a molecule from the stomachs of rats that specifically binds to

Molecules 2014, 19 11180
GHS-R and has the most potent stimulating effect on growth hormone secretion among those
molecules. This endogenous ligand to GHS-R is called ghrelin [14]. Ghrelin is composed of 28 amino
acids and has two major forms: active n-octanoyl-modified ghrelin and inactive des-acyl ghrelin. The
active ghrelin is n-octanoyl-modified in serine 3. Only active ghrelin has bioactivities [15] that trigger
the secretion of growth hormones and enhance appetite [16–18]. The growth hormone stimulates the
production of insulin-like growth factor-1 (IGF-1) in hepatocytes. IGF-1 has growth-promoting effects
on almost all cells in the body, particularly skeletal muscle, bone, cartilage, liver, kidney, nerve, skin,
hematopoietic tissue, and lung cells [19].
Plasma ghrelin levels may be altered through various factors, such as diet [20,21] or environmental
hormones [22]. Previous studies have indicated that thyroid dysfunctions alter the secretion and
clearance of other hormones, such as the luteinizing hormone (LH) [23], gonadotropin-releasing
hormone (GnRH), prolactin [24], insulin, and gastric inhibitory polypeptide [7]. Several studies have
indicated that ghrelin levels in the blood decrease in hyperthyroid patients. The ghrelin levels return to
the reference range after anti-hyperthyroid medicine treatments [25,26]. By contrast, ghrelin levels
increase in hypothyroid patients [27]. However, previous studies have not examined the effects of
thyroid dysfunction on GHS-R in the hypothalamus and the anterior pituitary gland. The alteration of
ghrelin may also affect the secretion and interactions of downstream substances, growth hormones
(GH), and IGF-1.
In this study, we measured the metabolic parameters of rats, such as body weight, food intake, feces
output, water consumption, and urine output, as well as active ghrelin and total ghrelin secretion in
circulation and GHS-R in the anterior pituitary gland and hypothalamus. Furthermore, the circulating
downstream hormones GH and IGF-1 were also measured to investigate the changes under
hypothyroid conditions.
2. Results and Discussion
2.1. Changes in Body Weight and Metabolism
The body weights of rats during the 2 weeks housing period in metabolic cages in each group are
shown in Figure 1. In the Sham Tx group, the body weights increased gradually from 323 ± 8 to 355 ± 14 g
(p < 0.05). In the Tx group from Day 1 to Day 10, the body weight dropped from 338 ± 7 to 315 ± 11
(p < 0.05) g and subsequently increased to 329 ± 13 g at the end. In the thyroidectomy with T4 replacement
(Tx + T4) group, the body weight dropped from 339 ± 13 to 296 ± 15 g (p < 0.05). In the PTU group, the
rats had the highest steady body weight of 369 ± 6 g at the beginning and 380 ± 9 g at the end.
Water consumption and urine output varied daily with no consistent increases or decreases in any
group (Figure 2d,e). The amount of food intake in the Sham Tx group increased from 9.7 ± 2.7 to
22.6 ± 1.5 g/d (p < 0.01) (Figure 2a). The number of feces balls increased non-significantly from
24.8 ± 10.9 to 41.0 ± 2.6 balls/d (Figure 2b), and feces weight increased from 6.2 ± 0.6 to 10.4 ± 0.5 g/d
(p < 0.01) (Figure 2c). In the Tx group, the values of food intake slowly increased from 5.3 ± 2.5 to
15.7 ± 1.1 g/d (p < 0.01) (Figure 2b). Feces balls and weight increased from 14.2 ± 3.7 to 28.9 ± 5.7 balls/d
(p < 0.01) (Figure 2b) and 3.4 ± 1.0 to 7.3 ± 1.7 g/d (Figure 2c), respectively. In the Tx + T4 group,
the amount of food intake, feces balls, and feces weight increased substantially from 2.9 ± 1.5 to

Molecules 2014, 19 11181
21.2 ± 3.5 g/d (p < 0.01) (Figure 2a), 8.3 ± 3.2 to 41.0 ± 8.5 balls/d (p < 0.01) (Figure 2b), and
2.1± 0.5 to 11.2 ± 2.2 g/d (p < 0.01) (Figure 2c), respectively.
In the PTU group, the food intake, feces balls, and feces weight increased considerably to the highest
values by Day 4, from 14.0 ± 2.2 to 25.3 ± 0.9 g/d (p < 0.01) (Figure 2a), 25.6 ± 6.5 to 46.3 ± 5.8 balls/d
(p < 0.05) (Figure 2b), and 6.9 ± 1.0 to 11.6 ± 1.5 g/d (p < 0.05) (Figure 2c), respectively. After Day 4,
all of the values dropped and approached those of the Tx group. At the end, the values were
18.7 ± 1.2 g/d (p < 0.05, compared with Day 1) (Figure 2a), 30.2 ± 4.8 balls/d (Figure 2b), and
8.4 ± 1.1 g/d (Figure 2c).
Figure 1. The changes of body weight in rats (N = 8). After surgeries, all rats were allowed
to rest for 3 days. The rats in the PTU group were injected with 20 mg/kg of PTU since Day
minus 3. After a 3 days resting period, all rats were housed in metabolic cages for
investigation. The Sham Tx and Tx groups were injected with 1 mL/kg alkaline saline for
14 days. Rats in the Tx + T4 group were injected with 20 μg T4/kg for 14 days. On Day 1,
lower body weight in the Sham Tx, Tx, and Tx + T4 groups than that in the PTU group was
observed because of the operation conducted 3 days prior. The BW of the Sham Tx group
increased considerably compared with that on Day 1. The BW of the Tx group decreased
during the first 10 days and subsequently increased. The BW of the Tx + T4 group decreased
during the experimental period. The PTU group maintained their body weight without any
remarkable increase. * p < 0.05 compared with the value of Day 1 of each group.

Molecules 2014, 19 11182
Figure 2. The metabolic profiles of rats measured after housing in metabolic cages (N = 8).
The amount of food intake (a), feces balls (b), feces weight (c), water consumption (d), and
urine output (e) were measured daily. Each figure is divided into 2 columns by means of
hypothyroidism or not. The left column demonstrates non-hypothyroid groups such as Sham
Tx and Tx + T4 groups whereas the right column demonstrates hypothyroid groups such as
Tx and PTU groups. * p < 0.05, ** p < 0.01 compared with the other group on the same
block of figure.
2.2. Effects of Hypothyroidism on Thyroid-Stimulating Hormone (TSH)
The average serum levels of the thyroid-stimulating hormone (TSH) in the Sham Tx group were
0.2 ± 0.1 ng/mL. However, in the Tx group and PTU group, the average serum TSH levels were as high
as 7.2 ± 0.5 ng/mL and 7.1 ± 0.4 ng/mL, respectively (p < 0.01, compared with Sham Tx group). The
results indicated that, in the Tx and PTU groups, the thyroid hormone was low and considerable TSH
was secreted to compensate. In the Tx + T4 group, the TSH levels were suppressed by T4 replacement to
0.2 ± 0.1 ng/mL, which were close to those of the Sham Tx group (Figure 3a).

Molecules 2014, 19 11183
Figure 3. (a) The serum concentrations of the thyroid stimulating hormone (TSH) in rats.
When the thyroid gland was destroyed by either thyroidectomy or PTU, the serum TSH
levels elevated considerably, which indicated hypothyroidism in the Tx and PTU groups. (b)
The plasma active ghrelin concentrations of rats. In the Tx and PTU groups, the plasma
active ghrelin levels elevated significantly, whereas T4 replacement suppressed the levels of
active ghrelin similar to that of the Sham Tx group. (c) The plasma total ghrelin
concentrations of rats. In the Tx and PTU groups, the plasma total ghrelin levels are elevated.
In the Tx + T4 group, administration of T4 suppressed the levels of total ghrelin to that of the
Sham Tx group.
** p < 0.01 compared with the Sham Tx group.
2.3. Effects of Hypothyroidism on Active Ghrelin, Total Ghrelin, and Ghrelin Receptors in the Anterior
Pituitary (AP)
The average plasma levels of active ghrelin in the Sham Tx group were 1.1 ± 0.1 ng/mL. In the Tx
group and PTU group, the active ghrelin levels were as high as 1.9 ± 0.2 ng/mL and 2.4 ± 0.2 ng/mL,
respectively (p < 0.01, compared with Sham Tx group). In the Tx + T4 group, the average plasma active
ghrelin levels were suppressed by T4 replacement to 0.8 ± 0.2 ng/mL, which was non-significant
compared to that of the Sham Tx group (Figure 4).

Molecules 2014, 19 11184
Figure 4. The GHS-R1 expression in the anterior pituitary gland (AP). (a) Specific
expression of GHS-R1 presented as western blotting. The GHS-R1 expressed only in
anterior pituitary (AP) but not medial basal hypothalamus (MBH). (b) Expression of
GHS-R1 presented as western blotting in AP. (c) Expression of GHS-R1 in AP represented
as GHS-R1/β-Actin ratio. In the Tx and PTU groups, the expression of GHS-R1 was
enhanced. Replacement of T4 partially suppressed the GHS-R1 expression in AP.
* p < 0.05, ** p < 0.01 compared with the Sham Tx group. + p < 0.05, + + p < 0.01 compared with the Tx group.
The average plasma levels of total ghrelin in the Sham Tx group were 2.7 ± 0.3 ng/mL. In the Tx and
PTU groups, the total ghrelin levels were as high as 4.7 ± 0.5 ng/mL and 4.7 ± 0.8 ng/mL, respectively
(p < 0.01, compared with the Sham Tx group). In the Tx + T4 group, the average plasma total ghrelin
levels were suppressed again by T4 replacement to 2.2 ± 0.1 ng/mL, which was non-significant
compared to the Sham Tx group (Figure 3b,c).
The GHS-R1 expressed in AP, but not in the medial basal hypothalamus (MBH) (Figure 4a). In the
Tx group, the expression of GHS-R1 was 1.8 ± 0.1 times higher than that of the Sham Tx group
(p < 0.01). In the PTU group, the expression of GHS-R1 was 1.4 ± 0.1 times higher than that of the Sham
Tx group (p < 0.05). In the Tx + T4 group, the expression of GHS-R1 decreased to 1.3 ± 0.1; however, it
differed from that of the Sham Tx group (p < 0.05) (Figure 4b,c).
Molecules 2014, 19 11185
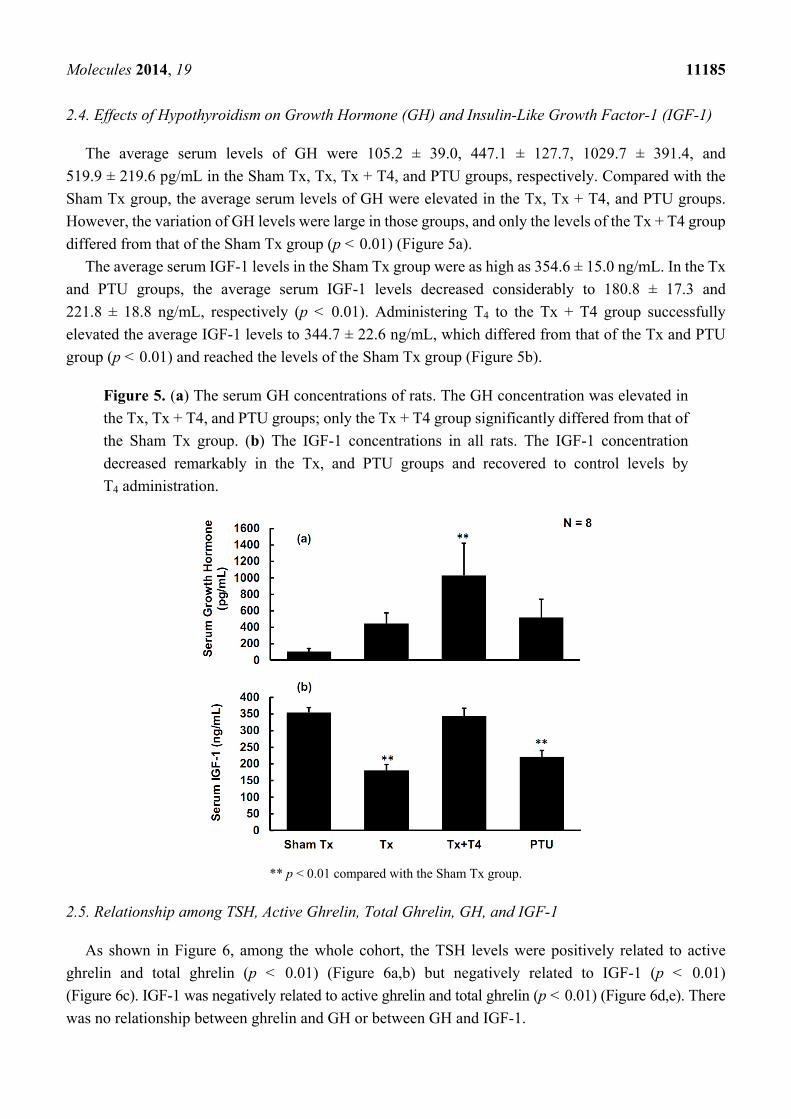
2.4. Effects of Hypothyroidism on Growth Hormone (GH) and Insulin-Like Growth Factor-1 (IGF-1)
The average serum levels of GH were 105.2 ± 39.0, 447.1 ± 127.7, 1029.7 ± 391.4, and
519.9 ± 219.6 pg/mL in the Sham Tx, Tx, Tx + T4, and PTU groups, respectively. Compared with the
Sham Tx group, the average serum levels of GH were elevated in the Tx, Tx + T4, and PTU groups.
However, the variation of GH levels were large in those groups, and only the levels of the Tx + T4 group
differed from that of the Sham Tx group (p < 0.01) (Figure 5a).
The average serum IGF-1 levels in the Sham Tx group were as high as 354.6 ± 15.0 ng/mL. In the Tx
and PTU groups, the average serum IGF-1 levels decreased considerably to 180.8 ± 17.3 and
221.8 ± 18.8 ng/mL, respectively (p < 0.01). Administering T4 to the Tx + T4 group successfully
elevated the average IGF-1 levels to 344.7 ± 22.6 ng/mL, which differed from that of the Tx and PTU
group (p < 0.01) and reached the levels of the Sham Tx group (Figure 5b).
Figure 5. (a) The serum GH concentrations of rats. The GH concentration was elevated in
the Tx, Tx + T4, and PTU groups; only the Tx + T4 group significantly differed from that of
the Sham Tx group. (b) The IGF-1 concentrations in all rats. The IGF-1 concentration
decreased remarkably in the Tx, and PTU groups and recovered to control levels by
T4 administration.
** p < 0.01 compared with the Sham Tx group.
2.5. Relationship among TSH, Active Ghrelin, Total Ghrelin, GH, and IGF-1
As shown in Figure 6, among the whole cohort, the TSH levels were positively related to active
ghrelin and total ghrelin (p < 0.01) (Figure 6a,b) but negatively related to IGF-1 (p < 0.01)
(Figure 6c). IGF-1 was negatively related to active ghrelin and total ghrelin (p < 0.01) (Figure 6d,e). There
was no relationship between ghrelin and GH or between GH and IGF-1.

Molecules 2014, 19 11186
Figure 6. Relationship among TSH, active ghrelin, total ghrelin, GH, and IGH-1 in rats.
N = 32 for the whole cohort. Serum TSH levels positively correlated with plasma active
ghrelin and total ghrelin levels (a, b). Conversely, serum IGF-1 levels negatively correlated
with plasma TSH, active ghrelin, and total ghrelin levels (c, d, e).
2.6. Relationship of Food Intake/Body Weight (BW) to Active Ghrelin, TSH, and IGF-1
Results of correlating the food intake/body weight to TSH, active ghrelin, total ghrelin, GH, and
IGF-1 (Figure 7) revealed that the food intake/BW of all rats negatively correlated with plasma levels of
active ghrelin (p < 0.05) (Figure 7a) and serum levels of TSH (p < 0.05) (Figure 7b). Conversely, the
food intake/BW positively correlated with serum levels of IGF-1 (p < 0.01) (Figure 7c).

Molecules 2014, 19 11187
Figure 7. Relationship of food intake/body weight (BW) against active ghrelin, TSH, and
IGF-1 in rats. N = 32 for the whole cohort. The food intake/BW negatively correlated with
plasma active ghrelin and serum TSH levels (a, b). In contrast, it negatively correlated with
IGF-1 serum levels (c).
2.7. Discussion
After surgery, the rats in the Sham Tx, Tx, and Tx + T4 groups were observed and allowed to rest for
3 days before injection of a vehicle or T4. In the PTU group, the thyroid function was destroyed
chemically and no surgery was performed. Therefore, the Tx group and PTU group can be easily
compared to eradicate the effects of surgeries or chemicals. As shown in our results, the results showed
that the hormone profiles of the Tx and PTU groups were consistent. According to the definition from
the McGraw-Hill Concise Dictionary of Modern Medicine, the conditions in the experiment over the
two weeks period can be referred to as subacute conditions. T3 or T4 levels were not measured because
T3 and T4 have bound and unbound form with thyroxine-binding globulin. The thyroxine-binding
globulin is easily interfered by corticosteroid levels [28]. TSH levels have been widely applied in
clinical practice to represent the thyroid function directly [29], thus TSH levels were measured in the
present study.
Following the 3 days resting period, the four groups of rats lived in metabolic cages for 14 days
before being sacrificed. During this period, the Sham Tx group rats gained 10% weight (p < 0.05). The
BW of the Tx group decreased by 8% during the first 10 days (p < 0.05) and subsequently increased. The
BW of the Tx + T4 group decreased by 13% during the monitoring period (p < 0.05). The body weights
of rats in the PTU group were maintained with minimal increase (Figure 1). The loss in body weight
among the Sham Tx, Tx, and Tx + T4 groups within several days after surgery is reasonable. Body
weights eventually increased in the Sham Tx and Tx groups, reflecting the recovery from the

Molecules 2014, 19 11188
post-operatic stage. Despite the injected dose of T4 20 μg/kg correcting the hypothyroid condition, the
body weight of the Tx + T4 group decreased continuously. This may be a result of an increase in the
basal metabolic rate due to unregulated circulating of T4, thus reducing body weight while increasing
food intake. The food intake of the Sham Tx, Tx, Tx + T4, and PTU groups increased 2.3 (p < 0.01),
3.0 (p < 0.01), 7.2 (p < 0.01), and 1.3 (p < 0.05)-fold, respectively, during monitoring period (Figure 2a).
The Tx + T4 had the highest increase of food intake. Thyroid hormones not only increase the basal
metabolic rate, but also subject appetite. Ishii et al. reported that subcutaneous injection of T3 4.5
nmol/kg to male rats induced hyperphagia through phosphorylating hypothalamic AMPK, whereas the
AMPK inhibitor compound C blocked the T3-induced hyperphagia [30].
In the beginning of the experiment, the amount of food intake among Sham Tx and PTU groups was
similar, as well as that of the Tx and Tx + T4 groups. However, the line plot of the PTU group declined
after Day 4, intersected with the Tx group on Day 11, and subsequently approached the Tx group. In
contrary, the line plot of food intake in the Tx + T4 group intersected with that of the Sham Tx group on
Day 11 and subsequently proceeded along with that of the Sham Tx group (Figure 2a). Similar trends
were also found for the number of feces balls and feces weight (Figure 2b,c). Apparently, these results
reveal that in the first days of observation, the food intake/feces behaviors were similar between
minor-surgery (Sham Tx) and non-surgery (PTU) groups and between major-surgery (Tx and Tx + T4)
groups. During the last 4 days before being sacrificed, the food intake/feces behaviors of true euthyroid
(Sham Tx) and non-hypothyroid (Tx + T4) groups became similar, as well as those of hypothyroid
(Tx and PTU) groups. It is reasonable that hypothyroid rats in the Tx and PTU groups had similar
metabolic features, as well as those of non-hypothyroid rats in the subacute stage. Interestingly, in the
PTU group, the amount of food intake and fecal excreta increased in the first 4 days, followed by a
substantial decrease until Day 12. This phenomenon demonstrated that the PTU gradually destroyed
thyroid gland and the residual thyroid hormones persisted in physiological functions for 8 days
before vanishing.
Pu et al. found that PTU inhibits the production of aldosterone through the cAMP, Ca2+, and
steroidogenic enzymes activities in male rats [11]. Hsu et al. also found that the release of atrial
natriuretic peptide induced by 165 mM of sodium ion decreased in PTU-induced hypothyroid rats [31].
However, surgery or PTU injection had no obvious effects on water consumption or urine output in all
groups of the present study (Figure 2d,e).
In 1999, Kojima et al. purified n-octanoyl ghrelin from rat stomachs and examined its effects on in
vivo dispersed anterior pituitary cells in rats. The authors found that n-octanoyl ghrelin is the active
form, and is the most potent ligand for growth-hormone secretagogue receptors (GHS-R) to stimulate
the secretion of GH by increasing intracellular calcium concentration. The GH-releasing activity of
ghrelin is as potent as that of the hypothalamic growth-hormone-releasing hormone (GHRH) [14]. The
ghrelin/GHS-R axis [32,33] possesses diverse physiological functions, such as stimulating secretion of
GH and enhancing food intake. Tschöp et al. reported that intracerebroventricular administration of
ghrelin 1.2 nmol/kg/day and 12 nmol/kg/day for 7 days demonstrated ghrelin-dose-dependent hyperphagia
in rats. Wren et al. infused ghrelin 5.0 pmol/kg/min intravenously to non-obese human subjects for 270
min. The infusion of ghrelin increased energy intake by 28% ± 3.9% [34]. In the hypothyroidism groups
of Tx and PTU, the active ghrelin increased by 79% (p < 0.01) and 124% (p < 0.01), respectively, and the
total ghrelin increased by 75% (p < 0.01) and 75% (p < 0.01), respectively. T4 replacement suppressed

Molecules 2014, 19 11189
active ghrelin and total ghrelin levels to those of the Sham Tx group (Figures 3b,c). The serum TSH
levels were positively correlated with plasma active ghrelin and total ghrelin (Figure 6a,b).
Hypothyroidism also up-regulated the expression of GHS-R1 in the anterior pituitary, whereas T4
replacement partially suppressed the expression of GHS-R1 (Figure 4b,c). Total excision of thyroid
gland in rats would cut off parathyroid gland and calcitonin-secreting cells at the same time, and
circulating calcium homeostasis will be deteriorated. Apparently, GHS-R was substantially affected by
T4 but the effects were partially interfered. The most possible cause for this interference is
hypocalcemia that certainly occurs in total thyroidectomy rats. Kosowicz et al. compared 24
thyrotoxicosis patients, 25 hypothyroid patients after total thyroidectomy, and 17 normal subjects. The
results revealed that hyperthyroid patients had higher circulating ghrelin levels, whereas hypothyroid
patients had lower circulating ghrelin levels [35]. Several articles have presented similar
findings [36,37], which are consistent with the results obtained in the present study.
As described above, the two major physiological functions of the ghrelin/GHS-R axis are stimulating
secretion of GH and enhancing food intake. However, in the current study, the increased ghrelin levels
and up-regulation of its receptors in hypothyroid rats did not substantially enhance the secretion of GH.
By contrast, the Tx + T4 group achieved the highest levels of GH (p < 0.05) (Figure 5a). T3 was reported
to stimulate GH release in rats [38], but to inhibit GH release in humans [39] and in
bovines [40]. This suggests that action of the thyroid hormones on GH various among mammalian
species. Apparently, the ghrelin/GHS-R axis is interfered with in the present study. Boulenger et al.
reported that GHRH receptors in the anterior pituitary were down-regulated in hypothyroid rats [41].
Mulloy et al. found that intraperitoneal T4 (20 μg/kg/day) increased GH synthesis and GHRH-related
GH release in Tx rats [42]. Therefore, alterations to functions of GHRH or its receptors in the anterior
pituitary might surpass the ghrelin/GHS-R effects on GH secretion observed in the current study.
Further, the food intake/BW negatively correlated with plasma active ghrelin (Figure 7a) and serum
TSH levels (Figure 7b). Interestingly, the value of food intake/BW positively correlated with the serum
levels of IGF-1 (Figure 7c). Further experiments should be performed to investigate this relationship.
The hyperphagic effects of ghrelin seem to be overwhelmed by the hypothyroidism or increased IGF-1.
Altogether, although hypothyroidism elevates the plasma ghrelin, this study presents novel finding that
hypothyroidism disrupts the ghrelin/GHS-R axis in stimulating GH secretion and increasing food intake.
The GH/IGF-1 axis refers to the primary binding of circulating GH binds to its receptors in the liver,
leading to the production of IGF-1, IGF-1 binding protein 3 (IGFBP-3), and other proteins through the
JAK2-STAT pathway, the PI3K/Akt pathway, and the RAS/MAPK pathway [43]. Surprisingly, our
results revealed that IGF-1 serum levels decreased by 51% (p < 0.01) and 63% (p < 0.01) in the Tx and
PTU groups, respectively, and replacing T4 in the Tx + T4 group successfully increased the IGF-1 levels
to control levels. The serum levels of IGF-1 did not correlate with its major stimulator, GH. On the
contrary, the IGF-1 serum levels negatively correlated with serum or plasma levels of TSH (Figure 6c),
active ghrelin (Figure 6d), and total ghrelin (Figure 6e). Romero et al. compared hypothyroid
(thyroidectomized), thyroxine-treated thyroidectomized, and euthyroid control rats and found that the
GH receptor mRNA in the liver decreased in male rats [44]. The changes could be prevented by
thyroxine administration. Therefore, the decrease of GH receptors in the liver might cause the
elimination of the release of IGF-1. Akin et al. investigated subclinical hypothyroid and subclinical
hyperthyroid patients, among whom IGF-1 serum concentration was lower in subclinical hypothyroid

Molecules 2014, 19 11190
patients, but not in hyperthyroid patients. Levothyroxine administration in proper dosage corrected this
abnormalities [45]. Schmid et al. also indicated that T4 therapy in patients with primary or central
hypothyroidism elevates the serum concentration of IGF-1 [46]. All these articles further support our
findings and the novel conclusion that the GH/IGF-1 axis is disrupted again in hypothyroid rats.
3. Experimental Section
3.1. Animals
Male Sprague-Dawley rats aged 8 weeks weighing 350–400 g were housed in a
temperature-controlled room (22 ± 1 °C) with 14 h of artificial illumination daily (06:00 AM to 8:00
PM). Food and water were provided ad libitum. The use of animals was approved by the Institutional
Animal Care and Use Committee of National Yang-Ming University. All animals received human care
in compliance with the principles of the Committee.
3.2. Chemicals, Antibodies, and Assay Kits
Triton X-100 was obtained from Riedel-deHaen (56029, Seelze, Germany) and sodium azide was
obtained from Kokusan Chemical Works (Tokyo, Japan). L-Thyroxine (T2376), 6-propyl-2-thiouracil
(PTU), bovine serum albumin (crystallized, A-4378, and RIA grade, A-7888), potassium chloride
(P-4504), sodium chloride, IGEPAL® CA-630, sodium deoxycholate, sodium dodecyl sulfate (SDS),
tris hydrochloride (Tris), protease inhibitor cocktail, and boric acid (B-6768) were obtained from
Sigma (St. Louis, MO, USA). The active ghrelin (GHRA-88HK) and total ghrelin (GHRA-89HK) kits
were obtained from Linco Research (St. Charles, MS, USA). Growth hormone (GH) ELISA kits
(KAP1081) and thyroid-stimulating hormone (TSH) IRMA kits (KIP1891) were purchased from
Diasource (Nivelles, Belgium). The insulin-like growth factor-1 (IGF-1) ELISA Kit (EMI1001-1) was
purchased from Assaypro (St. Charles, MO, USA). The antibodies against GHS-R1 (SC-10362) were
purchased from Santa Cruz Biotechnology (Santa Cruz, CA, USA). The secondary rabbit antibodies
against goat IgG (AP106P) were purchased from Millipore (Darmstadt, Germany). The protein
molecular weight standard (SM0671) for western blotting was purchased from Fermentas International
Incorporated (Burlinton, ON, Canada).
3.3. In Vivo Experiments: Hypothyroidism Induction and Thyroxine Replacement
The thyroidectomy and sham thyroidectomy procedures were performed as described previously [6]. In
the sham thyroidectomy group (Sham Tx), the thyroid glands of ether-anesthetized rats were touched
using cotton swabs. In the thyroidectomy group (Tx), the two lobes of the thyroid glands were
carefully removed to preserve the capsule with the embedded parathyroid glands. The post-operated
rats were observed for 3 days. Subsequently, all rats were housed in metabolic cages for 2 weeks. The
rats of the Sham Tx and Tx groups were injected subcutaneously with 1 mL/kg alkaline saline with pH
11.0 at 9:00 AM daily. In the thyroxine replacement group (Tx + T4), we dissolved L-thyroxine in
alkaline saline to yield a concentration of 20 μg/mL. The thyroidectomized rats were subcutaneously
injected with 1 mL/kg of T4 saline at 9:00 AM daily to correct the hypothyroid status. In the
6-propyl-2-thiouracil treatment group (PTU), we dissolved PTU in alkaline saline to yield a

Molecules 2014, 19 11191
concentration of 20 mg/mL. The rats that did not undergo an operation were subcutaneously injected
with 1 mL/kg of PTU saline at 9:00 AM daily starting from the day when thyroidectomy was
performed on the other groups.
The rats were decapitated at 9:00 AM after the final injections. Trunk blood samples were collected
as serum for following TSH, growth hormone assays, and IGF-1 or plasma for active ghrelin and total
ghrelin assays. The rat medial basal hypothalamus (MBH) block was dissected from the region between
the rostral borders of the mammillary bodies and optic chiasma with a maximal depth of 2 mm. The
anterior pituitary glands (AP) were also collected.
3.4. Western Blotting
The blocks of MBH and AP were homogenized in 200 μL of a lysis buffer (1.5%
Na-lauroyl-sacrosine, 2.5 mM Tris base, 1 mM EDTA, and 0.1% PMSF, pH 7.8), and the protein was
extracted. The aliquots (50 μg protein) of tissue lysates were used for electrophoresis on a 12% mini
gel using standard SDS-PAGE procedures, and electrotransferred to polyvinylidene difluoride (PVDF)
membranes (NEN Life Science Products, Boston, MA, USA) using a semi-dry transfer cell (Bio-Rad).
The membranes were blocked in a blocking buffer (TBS-T buffer containing 5% skim milk) at room
temperature for 120 min. The membranes were subsequently incubated with anti-GHS-R1 (1:1000)
and anti-β-actin (1:10,000) overnight. After being washed 3 times with a TBS-T buffer for 5 min, the
membranes were incubated with a horseradish peroxidase-conjugated secondary antibody (1:10000)
for 2 h. Specific signals were detected using chemiluminescence (ECL, western blotting detection
reagents, Amersham International, Buckinghamshire, UK). The bands located on the molecular weight
of 44 kDa indicated GHS-R1, and those on 43 kDa indicated β-actin for internal control. The bands
from western blotting were analyzed using ImageJ software (Version 1.45S, National Institutes of
Health, USA). The integrated density in pixels of GHS-R1 was divided by that of β-actin. The quotient
of GHS-R1/β-actin in the Sham Tx group was set to 1.
3.5. Statistical Analysis
All data are presented as mean ± SEM. SPSS 15.0 (IBM, Armonk, NY, USA) was used for statistical
analyses [47]. The Student’s t-test was used for comparison between the two groups. The data from the
four groups were processed using one-way analysis of variance (ANOVA) with post-hoc comparisons
by Fisher's least significant difference (LSD). Pearson correlation coefficients were used to evaluate the
relationship between hormones. Differences among groups were considered significant when p < 0.05
and highly significant when p < 0.01.
4. Conclusions
Surgical and chemical-induced hypothyroid rats had lower food intake and a steady body weight. In
regard to growth-related molecules, the active ghrelin and total ghrelin secretion was enhanced and the
expression of GHS-R was up-regulated in hypothyroid rats. However, IGF-1 secretion was inhibited by
hypothyroidism. Replacement of T4 in the hypothyroid rats increased food intake and reduced body
weight. The secretion of active ghrelin, total ghrelin, and GHS-R expression were suppressed by the
Molecules 2014, 19 11192
administration of T4. The physiological functions of the ghrelin/GHS-R axis, namely stimulating GH
release and increasing food intake, are interrupted, while the GH/IGF-1 axis operates independently
from hypothyroidism.
Acknowledgments
This work was supported by grants from the National Science Council
(NSC-100-2314-B-075-029-MY2, and NSC-101-2320-B-010-043) and Taipei City Hospital
(2013 No. 49), Taiwan, ROC. We deeply appreciate Dr. Ralph Kirby, Dale Albanese, and Fifi Chang
for their thorough English editing of this manuscript.
Author Contributions
Yen-Jui Chang collected and analyzed the data as well as wrote the manuscript. Chii-Min Hwu helped
interpret the data. Paulus S. Wang and Shyi-Wu Wang cooperatively designed and conducted the study.
Conflicts of Interest
The authors declare no conflict of interest.
References
1. Wiener, C.M. Harrison’s Principles of Internal Medicine Self-Assessment and Board Review. 17th ed.;
McGraw-Hill, Medical: New York, NY, USA, 2008; p. 1166.
2. Berne, R.M.; Koeppen, B.M. Berne & Levy Physiology, 6th ed.; Mosby/Elsevier: Philadelphia,
PA, USA, 2010; pp. 721–723.
3. Werner, S.C.; Ingbar, S.H.; Braverman, L.E.; Utiger, R.D. Werner & Ingbar’s the Thyroid: A
Fundamental and Clinical Text, 9th ed.; Lippincott Williams & Wilkins: Philadelphia, PA, USA,
2005; p. 1166.
4. Quesada, A.; Sainz, J.; Wangensteen, R.; Rodriguez-Gomez, I.; Vargas, F.; Osuna, A. Nitric oxide
synthase activity in hyperthyroid and hypothyroid rats. Eur. J. Endocrinol. 2002, 147, 117–122.
5. Chen, J.J.; Wang, S.W.; Chien, E.J.; Wang, P.S. Direct effect of propylthiouracil on progesterone
release in rat granulosa cells. Br. J. Pharmacol. 2003, 139, 1564–1570.
6. Chiao, Y.C.; Lee, H.Y.; Wang, S.W.; Hwang, J.J.; Chien, C.H.; Huang, S.W.; Lu, C.C.; Chen, J.J.;
Tsai, S.C.; Wang, P.S. Regulation of thyroid hormones on the production of testosterone in rats.
J. Cell Biochem. 1999, 73, 554–562.
7. Doong, M.L.; Wang, J.W.; Chung, S.C.; Liu, J.Y.; Hwang, C.; Hwang, C.Y.; Day, C.H.; Liu, Y.F.;
Young, T.K.; Ho, L.L.; et al. Regulation of thyroid hormones in the secretion of insulin and
gastric inhibitory polypeptide in male rats. Metabolism 1997, 46, 154–158.
8. Fernandez-Lamo, I.; Montero-Pedrazuela, A.; Delgado-Garcia, J.M.; Guadano-Ferraz, A.; Gruart, A.
Effects of thyroid hormone replacement on associative learning and hippocampal synaptic
plasticity in adult hypothyroid rats. Eur. J. Neurosci. 2009, 30, 679–692.

Molecules 2014, 19 11193
9. Shrader, R.E.; Keen, C.L.; Hurley, L.S.; Zeman, F.J. Hematologic and trace element alterations
following chronic maternal ingestion of propylthiourea. Exp. Hematol. 1982, 10, 44–55.
10. Chen, M.C.; Wang, S.W.; Kan, S.F.; Tsai, S.C.; Wu, Y.C.; Wang, P.S. Stimulatory effects of
propylthiouracil on pregnenolone production through upregulation of steroidogenic acute
regulatory protein expression in rat granulosa cells. Toxicol. Sci. 2010, 118, 667–674.
11. Pu, H.F.; Lin, C.W.; Lee, H.W.; Wang, P.S. Effects of propylthiouracil on the production of
aldosterone in rat zona glomerulosa cells. Adapt. Med. 2012, 4, 245–250.
12. Yo, P.L.; Lee, W.H.; Huang, W.J.; Wang, P.S. Adaptation of the secretion of gastric acid and
gastric inhibitory peptide in response to propylthiouracil. Adapt. Med. 2011, 3, 106–111.
13. Smith, R.G.; Cheng, K.; Schoen, W.R.; Pong, S.S.; Hickey, G.; Jacks, T.; Butler, B.; Chan, W.W.;
Chaung, L.Y.; Judith, F.; et al. A nonpeptidyl growth hormone secretagogue. Science 1993, 260,
1640–1643.
14. Kojima, M.; Hosoda, H.; Date, Y.; Nakazato, M.; Matsuo, H.; Kangawa, K. Ghrelin is a
growth-hormone-releasing acylated peptide from stomach. Nature 1999, 402, 656–660.
15. Cheng, K.; Chan, W.W.; Butler, B.; Wei, L.; Schoen, W.R.; Wyvratt, M.J., Jr.; Fisher, M.H.;
Smith, R.G. Stimulation of growth hormone release from rat primary pituitary cells by l-692,429,
a novel non-peptidyl gh secretagogue. Endocrinology 1993, 132, 2729–2731.
16. Briatore, L.; Andraghetti, G.; Cordera, R. Acute plasma glucose increase, but not early insulin
response, regulates plasma ghrelin. Eur. J. Endocrinol. 2003, 149, 403–406.
17. Parker, B.A.; Doran, S.; Wishart, J.; Horowitz, M.; Chapman, I.M. Effects of small intestinal and
gastric glucose administration on the suppression of plasma ghrelin concentrations in healthy
older men and women. Clin. Endocrinol. 2005, 62, 539–546.
18. Sato, T.; Fukue, Y.; Teranishi, H.; Yoshida, Y.; Kojima, M. Molecular forms of hypothalamic
ghrelin and its regulation by fasting and 2-deoxy-D-glucose administration. Endocrinology 2005,
146, 2510–2516.
19. Molina, P.E. Endocrine Physiology, 3rd ed.; McGraw-Hill Medical: New York, NY, USA, 2010;
p. 303.
20. Chang, Y.J.; Chen, C.M.; Chang, F.Y.; Wang, P.S. Radioimmunoassay for ghrelin: Evaluation of
method and the effect of fasting in rats. Adapt. Med. 2010, 2, 108–112.
21. Gannon, M.C.; Nuttall, F.Q. Effect of a high-protein diet on ghrelin, growth hormone, and
insulin-like growth factor-i and binding proteins 1 and 3 in subjects with type 2 diabetes mellitus.
Metabolism 2011, 60, 1300–1311.
22. Chang, Y.J.; Huang, W.J.; Lin, H.W.; Chang, L.L.; Chang, F.Y.; Wang, P.S. A radioimmunoassay
for rat ghrelin: Evaluation of method and effects of nonylphenol on ghrelin secretion in force-fed
young rats. Chin. J. Physiol. 2011, 54, 324–331.
23. Romano, R.M.; Bargi-Souza, P.; Brunetto, E.L.; Goulart-Silva, F.; Avellar, M.C.; Oliveira, C.A.;
Nunes, M.T. Hypothyroidism in adult male rats alters posttranscriptional mechanisms of
luteinizing hormone biosynthesis. Thyroid 2013, 23, 497–505.

Molecules 2014, 19 11194
24. Dittrich, R.; Beckmann, M.W.; Oppelt, P.G.; Hoffmann, I.; Lotz, L.; Kuwert, T.; Mueller, A.
Thyroid hormone receptors and reproduction. J. Reprod. Immunol. 2011, 90, 58–66.
25. Gimenez-Palop, O.; Gimenez-Perez, G.; Mauricio, D.; Berlanga, E.; Potau, N.; Vilardell, C.;
Arroyo, J.; Gonzalez-Clemente, J.M.; Caixas, A. Circulating ghrelin in thyroid dysfunction is
related to insulin resistance and not to hunger, food intake or anthropometric changes. Eur. J.
Endocrinol. 2005, 153, 73–79.
26. Riis, A.L.; Hansen, T.K.; Moller, N.; Weeke, J.; Jorgensen, J.O. Hyperthyroidism is associated
with suppressed circulating ghrelin levels. J. Clin. Endocrinol. Metab. 2003, 88, 853–857.
27. Caminos, J.E.; Seoane, L.M.; Tovar, S.A.; Casanueva, F.F.; Dieguez, C. Influence of thyroid status
and growth hormone deficiency on ghrelin. Eur. J. Endocrinol. 2002, 147, 159–163.
28. Faix, J.D. Principles and pitfalls of free hormone measurements. Best Pract. Res. Clin. Endocrinol.
Metab. 2013, 27, 631–645.
29. Dayan, C.M. Interpretation of thyroid function tests. Lancet 2001, 357, 619–624.
30. Ishii, S.; Kamegai, J.; Tamura, H.; Shimizu, T.; Sugihara, H.; Oikawa, S. Triiodothyronine (t3)
stimulates food intake via enhanced hypothalamic amp-activated kinase activity. Regul. Pept.
2008, 151, 164–169.
31. Sarati, L.I.; Toblli, J.E.; Martinez, C.R.; Uceda, A.; Feldman, M.; Balaszczuk, A.M.; Fellet, A.L.
Nitric oxide and aqp2 in hypothyroid rats: A link between aging and water homeostasis.
Metabolism 2013, 62, 1287–1295.
32. Lawnicka, H.; Melen-Mucha, G.; Motylewska, E.; Mucha, S.; Stepien, H. Modulation of ghrelin
axis influences the growth of colonic and prostatic cancer cells in vitro. Pharmacol. Rep. 2012, 64,
951–959.
33. Goldstein, J.L.; Zhao, T.J.; Li, R.L.; Sherbet, D.P.; Liang, G.; Brown, M.S. Surviving starvation:
Essential role of the ghrelin-growth hormone axis. Cold Spring Harb. Symp.Quant. Biol. 2011, 76,
121–127.
34. Wren, A.M.; Seal, L.J.; Cohen, M.A.; Brynes, A.E.; Frost, G.S.; Murphy, K.G.; Dhillo, W.S.;
Ghatei, M.A.; Bloom, S.R. Ghrelin enhances appetite and increases food intake in humans. J. Clin.
Endocrinol. Metab. 2001, 86, 5992–5995.
35. Kosowicz, J.; Baumann-Antczak, A.; Ruchala, M.; Gryczynska, M.; Gurgul, E.; Sowinski, J.
Thyroid hormones affect plasma ghrelin and obestatin levels. Horm. Metab. Res. 2011, 43,
121–125.
36. Gjedde, S.; Vestergaard, E.T.; Gormsen, L.C.; Riis, A.L.; Rungby, J.; Moller, N.; Weeke, J.;
Jorgensen, J.O. Serum ghrelin levels are increased in hypothyroid patients and become
normalized by l-thyroxine treatment. J. Clin. Endocrinol. Metab. 2008, 93, 2277–2280.
37. Sawicka, B.; Bossowski, A.; Szalecki, M.; Wysoka, J.; Koput, A.; Zelazowska-Rutkowska, B.;
Tobolczyk, J.; Rogowski, F.; Luba, M. Relationship between metabolic parameters and thyroid
hormones and the level of gastric peptides in children with autoimmune thyroid diseases.
J. Pediatr. Endocrinol. Metab. 2010, 23, 345–354.

Molecules 2014, 19 11195
38. Evans, R.M.; Birnberg, N.C.; Rosenfeld, M.G. Glucocorticoid and thyroid hormones
transcriptionally regulate growth hormone gene expression. Proc. Natl. Acad. Sci. USA 1982, 79,
7659–7663.
39. Cattini, P.A.; Anderson, T.R.; Baxter, J.D.; Mellon, P.; Eberhardt, N.L. The human growth
hormone gene is negatively regulated by triiodothyronine when transfected into rat pituitary
tumor cells. J. Biol. Chem. 1986, 261, 13367–13372.
40. Silverman, B.L.; Kaplan, S.L.; Grumbach, M.M.; Miller, W.L. Hormonal regulation of growth
hormone secretion and messenger ribonucleic acid accumulation in cultured bovine pituitary cells.
Endocrinology 1988, 122, 1236–1241.
41. Boulanger, L.; Andersen, P.H.; Gaudreau, P. Development of a site-directed polyclonal antibody
against the pituitary growth hormone-releasing hormone receptor and its use to estimate ghrh
receptor concentration in normal and hypothyroid rats. Neuroendocrinology 1999, 70, 117–127.
42. Mulloy, A.L.; Smith, T.J.; Stachura, M.E. Comparative effects of thyroxine and/or retinoic acid
treatment in vivo on growth hormone synthesis and release by pituitaries from thyroidectomized
rats. Horm. Metab. Res. 1992, 24, 466–470.
43. Vottero, A.; Guzzetti, C.; Loche, S. New aspects of the physiology of the gh-igf-1 axis.
Endocr. Dev. 2013, 24, 96–105.
44. Romero, G.S.; Stephan, D.A.; Sperling, M.A.; Menon, R.K. Distinct sexual dimorphism in the
effect of hypothyroidism on the expression of the growth hormone receptor and growth
hormone-binding protein gene in rat liver. Horm. Res. 1996, 45, 273–278.
45. Akin, F.; Yaylali, G.F.; Turgut, S.; Kaptanoglu, B. Growth hormone/insulin-like growth factor axis
in patients with subclinical thyroid dysfunction. Growth Horm. IGF Res. 2009, 19, 252–255.
46. Schmid, C.; Zwimpfer, C.; Brandle, M.; Krayenbuhl, P.A.; Zapf, J.; Wiesli, P. Effect of thyroxine
replacement on serum igf-i, igfbp-3 and the acid-labile subunit in patients with hypothyroidism
and hypopituitarism. Clin. Endocrinol. 2006, 65, 706–711.
47. Steel, R.G.D.; Torrie, J.H. Principles and Procedures of Statistics: A Biometrical Approach, 2nd ed.;
McGraw-Hill: Auckland, Newzealand, 1980; p. 633.
Sample Availability: Not available.
© 2014 by the authors; licensee MDPI, Basel, Switzerland. This article is an open access article
distributed under the terms and conditions of the Creative Commons Attribution license
(http://creativecommons.org/licenses/by/3.0/).