River acid mine drainage: sediment and water mapping through hyperspectral Hymap data
30
For Peer Review Only River acid mine drainage : sediment and water mapping through hyperspectral Hymap data Journal: International Journal of Remote Sensing Manuscript ID: TRES-PAP-2011-0276.R1 Manuscript Type: IJRS Research Paper Date Submitted by the Author: n/a Complete List of Authors: Riaza, Asuncion; Instituto Geologico y Minero de España, Geología y Geofísica Buzzi, Jorge; Instituto Geologico y Minero de España, Geologia y Geofísica Garcia-Melendez, Eduardo; Universidad de León, Facultad de Ciencias Ambientales Carrere, Veronique; Université de Nantes, Laboratoire de Planétologie et Géodynamique de Nantes Sarmiento, Aguasanta; Universidad de Huelva, Geology Mueller, Andreas; German Aerospace Research Centre, German Remote Sensing Data Center Keywords: GEOLOGY, HYPERSPECTRAL DATA, MINERAL MAPPING Keywords (user defined): acid mine drainage, pyrite weathering http://mc.manuscriptcentral.com/tres Email: [email protected] International Journal of Remote Sensing
-
Upload
unversidadexternadodecolombia -
Category
Documents
-
view
2 -
download
0
Transcript of River acid mine drainage: sediment and water mapping through hyperspectral Hymap data
For Peer Review O
nly
River acid mine drainage : sediment and water mapping
through hyperspectral Hymap data
Journal: International Journal of Remote Sensing
Manuscript ID: TRES-PAP-2011-0276.R1
Manuscript Type: IJRS Research Paper
Date Submitted by the Author:
n/a
Complete List of Authors: Riaza, Asuncion; Instituto Geologico y Minero de España, Geología y Geofísica Buzzi, Jorge; Instituto Geologico y Minero de España, Geologia y Geofísica Garcia-Melendez, Eduardo; Universidad de León, Facultad de Ciencias Ambientales Carrere, Veronique; Université de Nantes, Laboratoire de Planétologie et Géodynamique de Nantes Sarmiento, Aguasanta; Universidad de Huelva, Geology Mueller, Andreas; German Aerospace Research Centre, German Remote Sensing Data Center
Keywords: GEOLOGY, HYPERSPECTRAL DATA, MINERAL MAPPING
Keywords (user defined): acid mine drainage, pyrite weathering
http://mc.manuscriptcentral.com/tres Email: [email protected]
International Journal of Remote Sensing
For Peer Review O
nly
River acid mine drainage: sediment and water mapping through hyperspectral Hymap data
A. RIAZA§*, J. BUZZI§, E. GARCÍA-MELÉNDEZ†, V. CARRÈRE‡, A.
SARMIENTO∫ and A. MÜLLER∞
§Geological Survey of Spain (IGME), La Calera 1, 28760 Tres Cantos, Madrid, Spain. † Facultad de Ciencias Ambientales, Universidad de Leon, Campus de Vegazana s/n,
24071, Leon, Spain. ‡ Laboratoire de Planétologie et Géodynamique de Nantes, 2 rue de la Houssinière, BP
92208, 44322 Nantes cedex 3 France France. ∫ Geology Department, Facultad de Ciencias Experimentales, Universidad de Huelva,
Av. Fuerzas Armadas s/n, E-21071 Huelva, Spain. ∞ German Aerospace Research Centre, German Remote Sensing Data Center, Imaging
Spectroscopy Group, P.O. Box 1116, 82230 Wessling, Germany. *Corresponding author. Email: [email protected].
Page 1 of 29
http://mc.manuscriptcentral.com/tres Email: [email protected]
International Journal of Remote Sensing
123456789101112131415161718192021222324252627282930313233343536373839404142434445464748495051525354555657585960
For Peer Review O
nly
River acid mine drainage sink by coastal tides:
sediment and water mapping through hyperspectral
Hymap data
A. RIAZA§*, J. BUZZI§, E. GARCÍA-MELÉNDEZ†, V. CARRÈRE‡, A. SARMIENTO∫ and A. MÜLLER∞
§Geological Survey of Spain (IGME), La Calera 1, 28760 Tres Cantos, Madrid, Spain. † Facultad de Ciencias Ambientales, Universidad de Leon, Campus de Vegazana s/n,
24071, Leon, Spain. ‡ Laboratoire de Planétologie et Géodynamique de Nantes, 2 rue de la Houssinière, BP
92208, 44322 Nantes cedex 3 France France. ∫ Geology Department, Facultad de Ciencias Experimentales, Universidad de Huelva,
Av. Fuerzas Armadas s/n, E-21071 Huelva, Spain. ∞ German Aerospace Research Centre, German Remote Sensing Data Center, Imaging
Spectroscopy Group, P.O. Box 1116, 82230 Wessling, Germany. *Corresponding author. Email: [email protected]. Abstract: The Odiel River carries acidic water originating from mine waste contamination, including massive sulfide ore deposits. As the river approaches the coastal estuary, tidal factors influence both sediment and water dynamics. As water velocity decreases, sediment load transport capacity also decreases, building river bars consisting of boulders upstream and sands downstream. Saltwater near the estuary affects river water chemistry by neutralizing acidity derived from mine wastes. The occurrence of pyrite mud and hydrated iron sulfate efflorescence, precipitated from acidic waters, is plugged by marine water with chloride, which precipitates from the salt water. Hymap airborne hyperspectral data were used to evaluate tidal influence using spectral features. Grain size variations on river pebble bars, localized crusts of variably-hydrated iron sulfate and oxides, and cation exchange with chloride salts in the lower river segment as it enters the estuary, were spectrally described and mapped. The presence of vegetation proved particularly problematic for the spectral identification of contamination products as well as the precise delineation of inundated areas along the river. The transition from dry to wet zones is the crucial challenge in using spectral imagery to identify and track contaminants in the river and along its flood plain. The use of a reference mineralogical spectral library, developed in the laboratory, requires a careful geological context evaluation to provide efficient environmental information on contamination parameters.Based on the hyperspectral analyses of critical spectral features, river locations that may be key for tracing significant, future contaminant fluctuations were identified.
Page 2 of 29
http://mc.manuscriptcentral.com/tres Email: [email protected]
International Journal of Remote Sensing
123456789101112131415161718192021222324252627282930313233343536373839404142434445464748495051525354555657585960
For Peer Review O
nly
1. Introduction
Imaging spectroscopy is an effective tool for the study of mine waste deposits that can produce acid mine drainage (AMD). By acquiring data from waste deposits containing different kinds and proportions of minerals and representing variable characteristics, spectral libraries are formed that allow for relatively rapid assessment of ephemeral thin crusts originating from acidic mine water (Crowley et al., 2003).
The Odiel River (Huelva, southwest Spain) runs through the Iberian Pyrite Belt, a wide geological unit within the Hesperian Massif containing massive sulfide deposits that have been exploited for at least 5000 years (see figure 1). Pyrite is abundant both on mine waste and rock outcrops, and acid mine drainage (AMD) is present in most drainages throughout the region (Sarmiento et al., 2009). The Pyrite Belt consists of a thick sequence of vulcanoclastic sediments with interstratified quartzite, sandstones and slates, at the foot of the northern Sierra de Aracena, characterized by numerous igneous outcrops. The landscape is a smooth ridge-valley alternation, with an average elevation difference of 100 m.
The Odiel River flows across various strata in a low sinuosity channel controlled by floodplain lithology. The general flow path is linear with minor deviations when crossing more competent rock layers, where water retention and diversion walls from historic watermills are abundant. Depositional bars develop along the length of the river, increasing in size downstream. The Odiel River can be considered a bedload transport stream with low sinuosity but considerable lateral mobility. The channels shift into different paths, resulting in braided side channels separated by sand and gravel bars. In the furthest downstream reaches, immediately before the estuarine marshes, the banks tend to be steeper and the braided bars demonstrate a systematic grain size sediment pattern.
Typically, bars in the lower river reaches display a top of coarse, heterogeneous rocks less than 10 cm in diameter. As the river approaches the estuary at the Atlantic Ocean, hydrodynamic changes occur that result in a thinning of the size of bar sediments, dominated by sands with reduced pebble tops. As the river channels widen the bars become more stable with vegetation growth, and larger areas of mud bars develop.
In the lower reaches of the river, tides move salt water in and out of the estuarine segments. The marine water is characterized by a basic pH that influences AMD and resulting mineral growth. The present study investigated how hyperspectral imagery can detect the tidal influence on both sediments and river water before entering the estuarine marshes.
2. Acid mine drainage on the River Odiel
Precipitation in Huelva consists of intense, short rain events in autumn, relatively dry winters, and dry spring and summer. The river carries AMD from solubilized iron sulfide that occurs during flash floods. After the annual main flash flood in October, sediments lose water and oxidize continuously during the winter, spring and summer.
The majority of the sulfate and metal materials released through mine waste remain as particulates within the river basin (Sanchez España, 2005). As a general trend in the river basin, the concentrations of heavy metals increase during the dry season and decrease during the wet season (Sarmiento et al., 2009). However, immediately after the intense rains of autumn the concentration of some elements increases in the lower part of the river as a result of dissolution of soluble salts. The mineral saturation indices also vary with season, depending on longitudinal river location (Sarmiento et al., 2009; Olias et al., 2006). In the estuary, the most conservative elements, including SO4, Al, Cd, Co, Li, Mn, Ni and Zn, generally reach maximum concentrations in autumn and minimum concentrations in winter, respectively, with a steady concentration recovery through spring and summer (Canovas et al., 2007). Arsenic is somewhat different, with lowest values in the summer.
Metals and metalloids drop out to the estuarine sediments due to pH and salinity changes (Nieto et al., 2007). Contaminants are more available in the fresh water environment. Ribbons of different minerals precipitate out of acidic water, forming crusts over the sediments. Most of
Page 3 of 29
http://mc.manuscriptcentral.com/tres Email: [email protected]
International Journal of Remote Sensing
123456789101112131415161718192021222324252627282930313233343536373839404142434445464748495051525354555657585960
For Peer Review O
nly
those minerals are unstable and are dissolved or transported during intense rain events. If significant oxidation occurs, they can be transformed to more stable minerals such as goethite or hematite, acting as a permanent cement-like of fluvial sediments, sealing the river bottom to water infiltration.
This study focuses on the furthest downstream reach of the river before it enters the estuary, where the average pH is 3.5 (Sarmiento et al., 2009), and tidal influence is already apparent.
3. Data set
Hymap data were acquired on 1 August 2008 along the main channel of the Odiel River. Hymap is a hyperspectral airborne scanner provided with 128 bands across the reflective solar wavelenght region of 0.45-2.5 µm with continous coverage (except in the atmospheric water vapour bands), and band widths between 15-20 nm. The spatial resolution of the flight is 4 m.The raw Hymap data were system-corrected by HyVista (Cocks et al., 1998). The raw digital numbers were corrected for dark current, and converted to physical units of at-sensor radiance (unit: uW /cm2 sr nm) using laboratory radiometric calibration and in-flight measurements of on-board calibration sources.
The imagery was geocoded at the German Space Agency (DLR) using parametric-based software. The viewing geometry for each pixel was determined based on sensor-specific parameters, flight parameters (e.g. sensor position and attitude (i.e. roll, pitch, true heading)), and additional terrain information from a digital terrain model (DEM); typical accuracy was about 2 pixels (Schläpfer and Richter, 2002). ATCOR4 was used for atmospheric correction (Richter and Schläpfer, 2002). This physically-based approach, using the MODTRAN radiative transfer code, corrects for atmospheric effects as well as adjacency scattering; it also provides BRDF compensation in order to derive nadir-normalized ground reflectance. Topographic correction for different terrain illumination was also applied.
Using ground measurements as a reference target taken during the overflight, an additional vicarious calibration was conducted. Based on field spectroscopic measurements of large and spectrally homogeneous targets, the image reflectance values were validated against the field measurements and adjusted, if necessary.
About 500 field spectral measurements were made from in September 2008 (Riaza and Carrère, 2009) , and from June 2009 to August 2009 with an ASD FieldSpec 3 Spectrometer (ASD Inc, Boulder, CO, USA) for thematic purposes. The interpretation of field spectra relied on a previous field campaign conducted in parallel with a 17 June 2005 Hymap flight (Riaza and Müller, 2010).
Field-collected samples were measured with an ASD FieldSpec3 spectrometer in the dark room using an artificial light source. The interpretation of laboratory spectra on field samples collected in 2006 (Riaza et al., 2010 and 2007; Buzzi et al., 2009) provided a basis for interpretation of both field and laboratory spectral data collected in 2009. Representative samples were also selected and submitted for X-ray diffraction analysis.
4. Building a map through hymap image processing
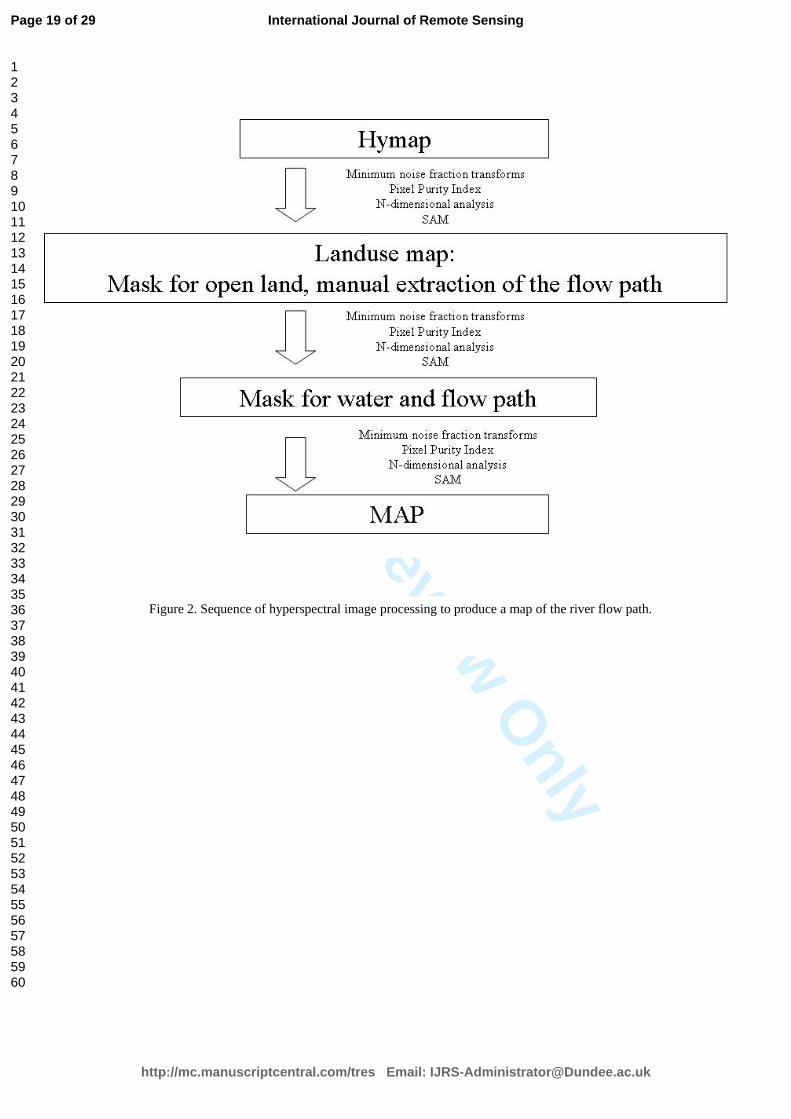
Hyperspectral imagery can be used in many ways to map complex surface features, by offering high dimensionality of data, if a low signal to-noise-ratio and good spatial resolution are ensured (Hubbard and Crowley, 2005). For the current research, the procedure for feature extraction for thematic purposes was an interpreter-oriented sequential spectral separation method using standard algorithms, leading to a spatial pattern and spectral identification for pixels within the scene, displayed as a map. Data dimensionality was reduced through various image processing steps tailored to the particular scene. The resulting map describes river sediments as a framework for minewaste contamination transport and ephemeral storage (see figure 2).
The standard sequence of algorithms is Minimum Noise Fraction Transforms (MNFT), Pixel Purity Index and n-dimensional Analysis to extract significant statistical populations (RSI, 2000). The reality of a particular land cover is determined by the spectral response of the
Page 4 of 29
http://mc.manuscriptcentral.com/tres Email: [email protected]
International Journal of Remote Sensing
123456789101112131415161718192021222324252627282930313233343536373839404142434445464748495051525354555657585960
For Peer Review O
nly
regions of interest that correspond to the resulting populations. A land use map was computed first with Spectral Angle Mapper (Kruse, 1993) using the appropriate end members.
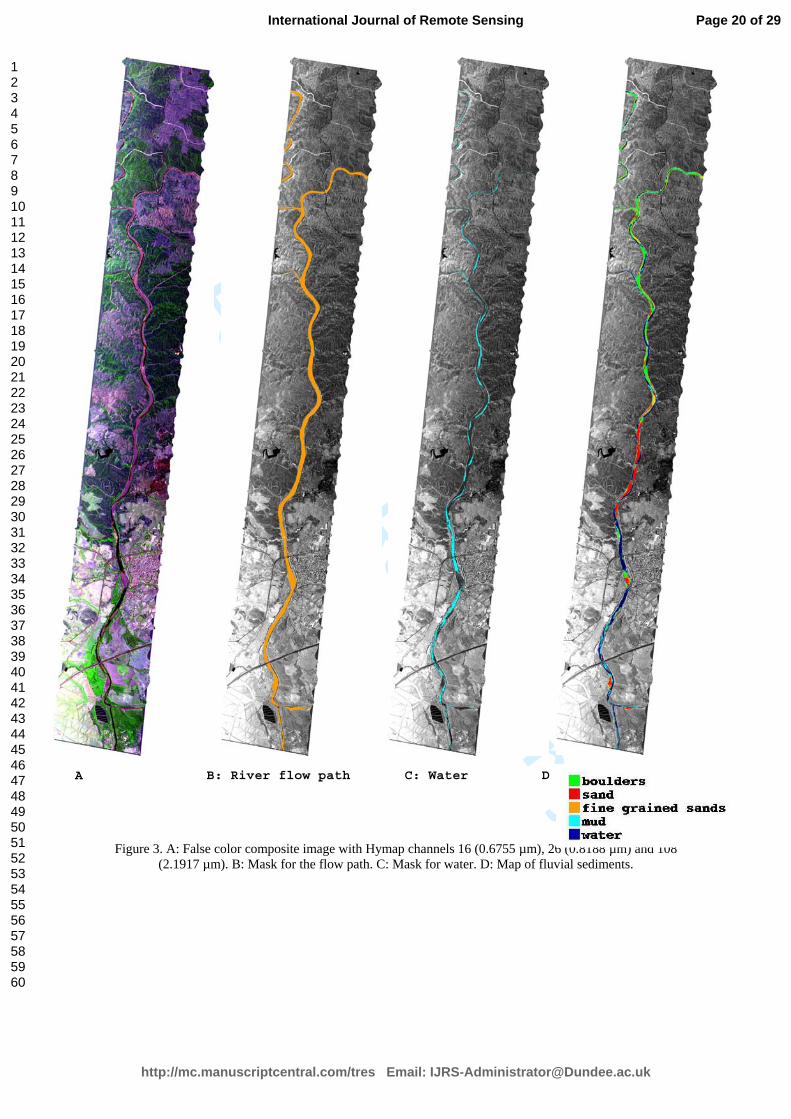
A second MNFT was computed on the geometrically- and atmospherically-corrected Hymap image that isolated relatively open land devoid of vegetation. The flow path was precisely drawn, with some areas strongly disturbed by forests or quarries. For those areas, a mask was built and the flow path was manually extracted as a mask to be used during further processing (see figure 3B). MNFTs were again computed on the Hymap imagery for the area masked for the flow path. The resulting pattern displayed the sinuous shapes typically associated with river geomorphology.
Identification of correct water types is critical to the mapping process. The spectral signature of acidic water can be misidentified as a number of hydrated pyrite weathering products. Moreover, margins of pebble river bars are often fine-grained sands covered with wet pyrite mud, narrow belts of efflorescent salts, or drying vegetation, all of which have significant spectral features which can be misinterpreted if not carefully evaluated. A false color composite using a channel in the blue wavelength range, a channel at the maximum vegetation spectral response, and a channel between 2.2 µm and 2.3 µm (see figure 3A) helps to identify water among the wavy shades coming from the MNFTs on the masked flow path.
The seventh MNFT computed from the whole Hymap image identifies efficiently water; a mask was then built from those data (see figure 3C). The flow path mask and the water mask were combined into a single mask used to map emerged (un-inundated) river sediments. MNFTs were again computed under this flow path, excluding water (see figure 2). After the Pixel Purity Index procedure and n-dimensional analysis, the populations which are going to be the end members for input to the Spectral Angle Mapper were identified and the final map of the river flow path was constructed. Using the same procedure for subscenes within a scene yields somewhat different results. A general map was built for the flight line (see figure 3D). This map suggested that the river path can be divided into three sections, according to sedimentology (see figure 5A).
5. Spectral evaluation
5.1. Hymap imagery
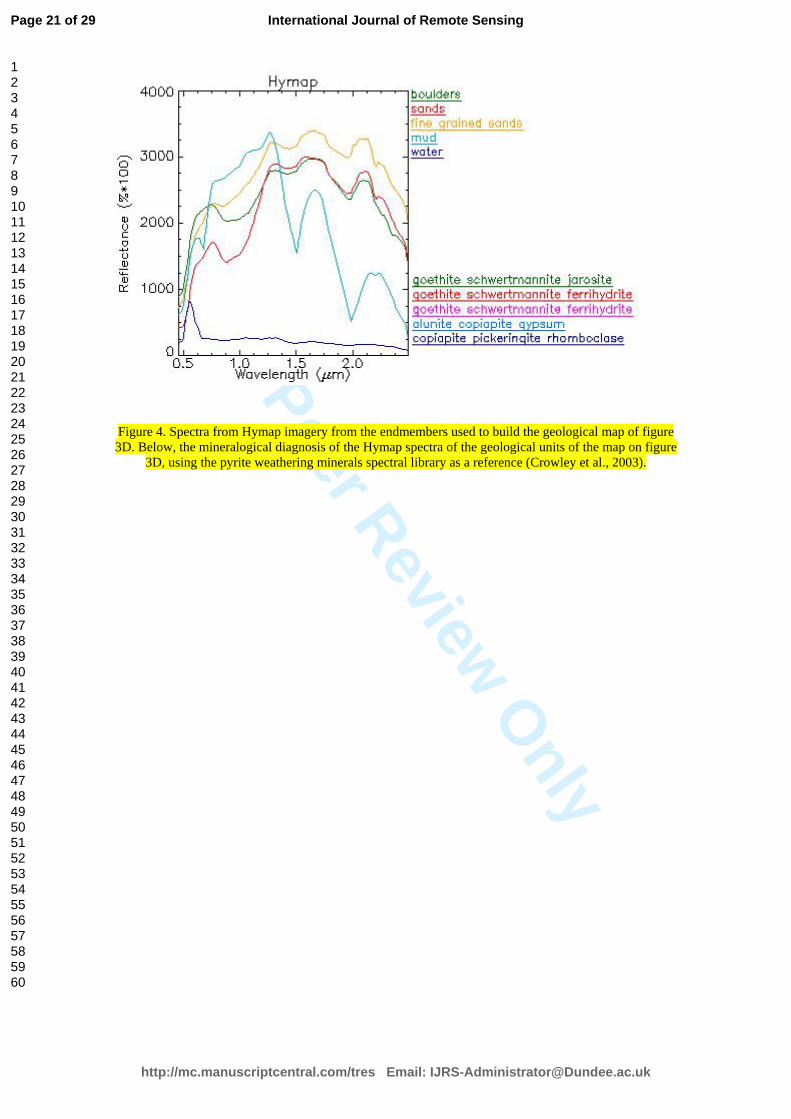
5.1.1. General pattern The Hymap imagery displays a spectral response directly related to the grain size of the river
sediments (see figure 4). Boulders and sands tend to have higher overall reflectance. Mud shows a high overall reflectance in the visible range, but decreases at longer wavelength ranges. Boulders display a spectral response with a shoulder at 0.76 µm, a wide depression with a low point at 0.86 µm up to 1.27 µm and a more horizontal progression with wide depressions at water vapor absorption bands at 1.49 µm and 1.98 µm. From 2.13 µm the spectral response descends towards longer wavelength ranges with a sharp minimum at 2.2 µm.
Sands follow the same trend, with a lower overall reflectance. Red iron quartz grains are abundant. The influence of iron is shown by a wide concavity from 0.60 µm to 0.76 µm and a bending point at 0.67 µm. Fine grain sands show a smooth bending from 0.60 µm to 0.76 µm, lack the sharp absorption at 2.2 µm and display weak shoulders at 2.2 µm and 2.33 µm. While the last two absorption points (2.2 µm and 2.33 µm ) are generally considered to be related to the presence of muscovite (a detrital heritage from igneous rocks of the Sierra de Aracena at the river headwaters), this mineral is absent in the lower reaches of the river.
The most striking spectral feature of mud is a sharp absorption at 0.67 µm. The presence of rooted emergent or floating vegetation over the mud is responsible for this feature. This general spectral shape is repeated with variable overall reflectance in wet areas or areas close to the water’s edge which have been recently submerged.
Odiel River sediments were covered with mineral crusts precipitated from acidic water. Using the USGS reference spectral library for pyrite weathering products (Crowley et al., 2003;
Page 5 of 29
http://mc.manuscriptcentral.com/tres Email: [email protected]
International Journal of Remote Sensing
123456789101112131415161718192021222324252627282930313233343536373839404142434445464748495051525354555657585960
For Peer Review O
nly
Riaza et al., 2010), mineralogical diagnosis of the river sediment spectra identified goethite (see figure 4), the dominant mineral covering the river bars, as an iron hydroxide. Mud was identified as hydrated iron sulfate. Initial mineralogical analysis identified water as copiapite, another hydrated iron sulfate. These misinterpretations are examples of how careful mineralogical diagnosis must be. Water is certainly not covered by a crust of copiapite, but the spectra is a typical response to acidic water. The importance of ground-truthing and correct interpretation within the context of the study area should not be under-estimated.
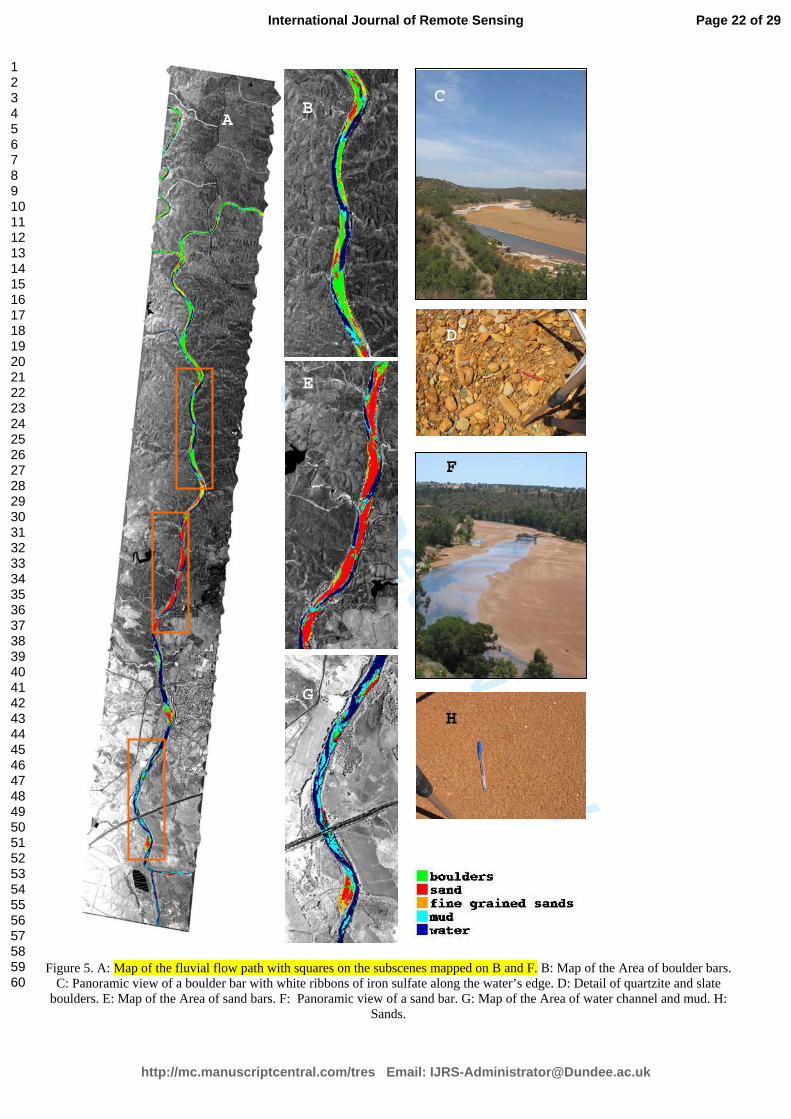
5.1.2. Sediments on subscenes Hymap imagery detected a different sediment pattern in three sections of the river, which
were designated (upstream to downstream): Area of boulder bars, Area of sandy bars, and Area of water channel and mud. Moving from upstream to downstream, the imagery shows a general reduction sediment size of river bar grain size (see figure 5A). In the upstream reaches where both gradient and velocity are higher, large rocks or boulders are abundant (see figure 5B-D), river bars tend to be long (see figure 5B), and sand and mud deposition, when present, is restricted to the downstream ends of the bars. Width of the upstream channel is comparatively wider than between river bars in the middle river section.
In the downstream river segment, as tidal influence becomes more important, sand-dominated river bars widen, taking up more of the river channel area. The channels themselves become narrower, in some cases to a degree that the free-flow of water between the bars is restricted. Downstream bar ends are more consolidated and dominated by mud in complex patterns (see figures 5E-H).
Downstream of those wide sand bars the extent of river sediments decreases dramatically (see figure 5G). The channel occupies most of the river bed, with sparse sandy bars surrounded by wide mud spaces. The inner structure of the river bars is disrupted, with traces of alternating lingoidal shapes.
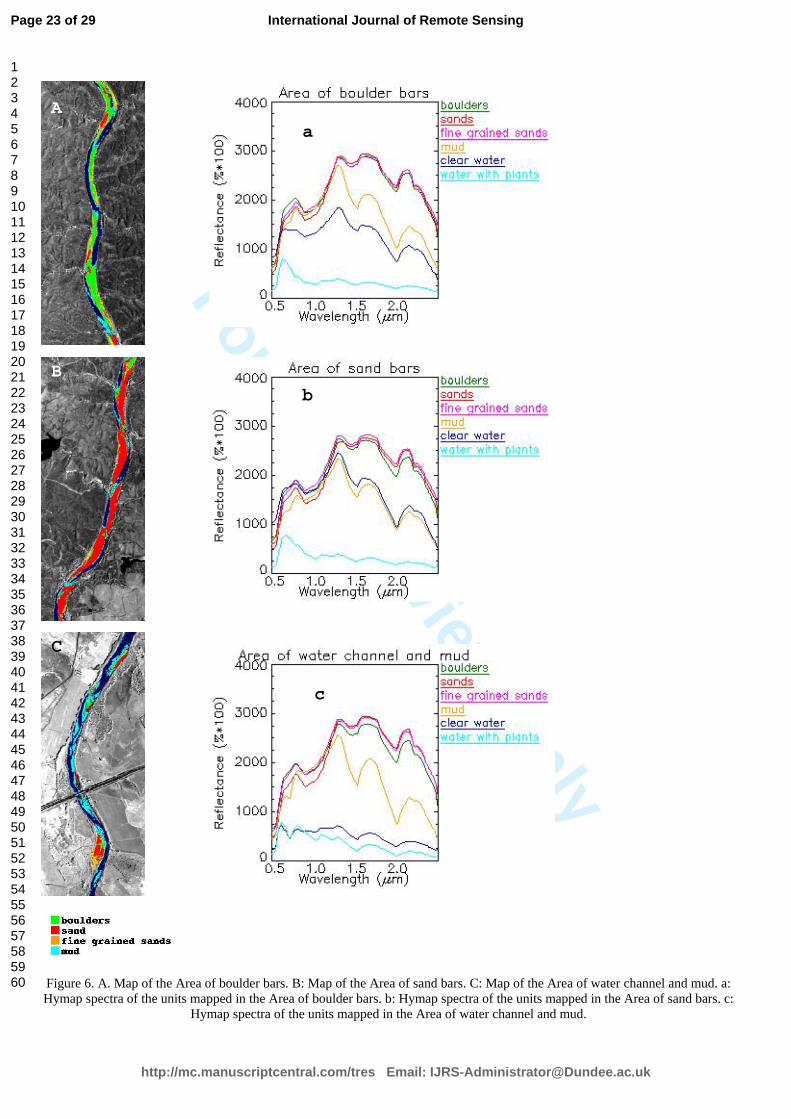
Hymap spectra show that the three river sections are geomorphologically distinct, and also demonstrate that boulders, sand and fine grained sands on river bars are spectrally similar (see figures 6a, 6b and 6c). Absorption at 0.677 µm is in response to mud plugging and encasing the river bars, which increases in the downstream reaches. Acidic water that supports rooted or floating vegetation shows an absorption at 0.74 µm, shifting to 0.67 µm downstream (see figures 6a-c). The spectra of non-vegetated water was reminiscent of upstream mud spectra and developed into a mixed water and vegetation signature with a deep, 0.67 µm absorption and higher overall reflectance on longer wavelength ranges (see figures 6a-c).
Wet areas of the river bars, and the water itself, provide the most dramatic spectral change along the length of of the river. The minimum absorption at 0.677 µm deepens with the mud near the estuary, and the spatial extent of mud also increases downstream (see figure 6c).
5.1.3. Water The spectral signature of upstream water reflects its acidic characteristics with a maximum at
0.589 µm and a rapid decrease to 1.0 µm (see figure 6b). The downstream water signature is mixed, influenced by floating or rooted vegetation (see figure 6c). Higher turbidity in the downstream water increases noise, yielding a slightly higher overall reflectance in the near infrared (NIR), repeating the general absorptions of sand and pebble bars. Spectral shifts near the estuary are caused by salt water.
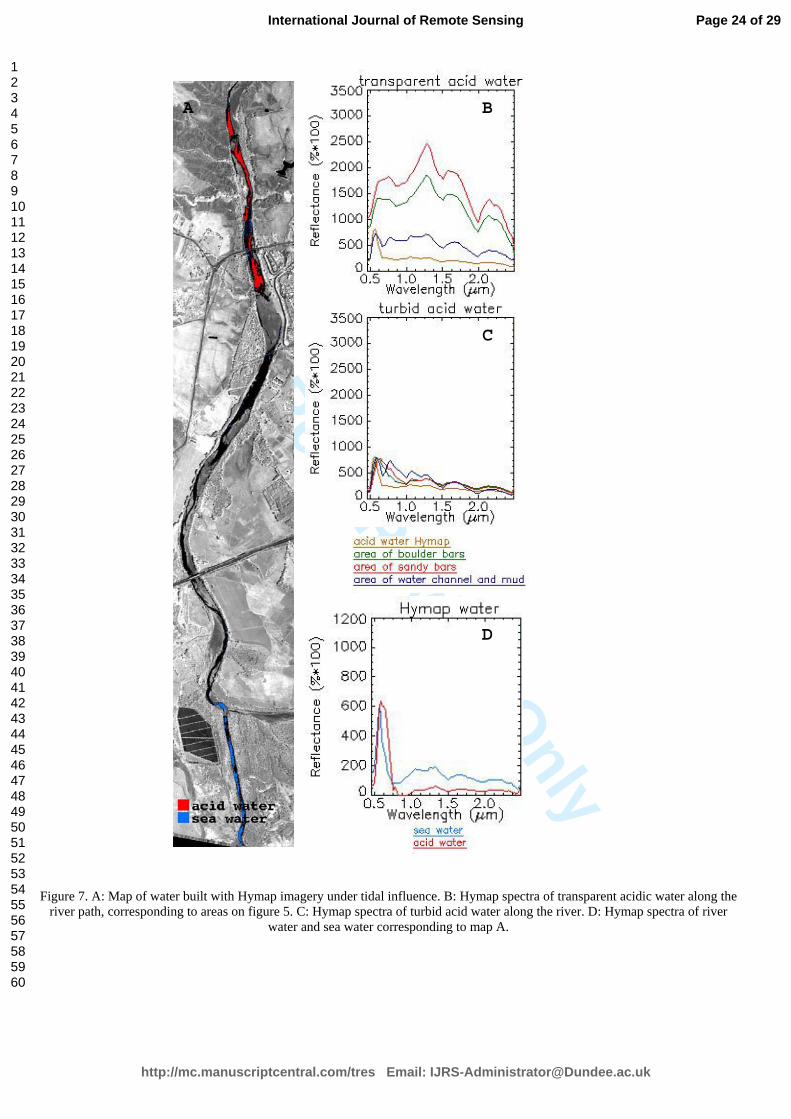
Hymap distinguishes two kinds of water in the river (see figures 7B-C). Transparent acidic water is located along the shallower channel borders uspstream and extends more broadly across the channel near the estuary. The spectral signature of the transparent water is similar to mud upstream (see figure 7B and 6a), decreasing its overall reflectance and approaching the signature of turbid acid water downstream.
In contrast, the spectra of turbid water is closer to that of general acidic water upstream, and becomes less clear and closer to that of turbid water as it approaches the estuary (see figure 7C; and 6C). The influence of vegetation on the spectral signature of turbid water is stronger downstream.
Page 6 of 29
http://mc.manuscriptcentral.com/tres Email: [email protected]
International Journal of Remote Sensing
123456789101112131415161718192021222324252627282930313233343536373839404142434445464748495051525354555657585960
For Peer Review O
nly
Downstream, both transparent and turbid acidic water more consistently display a peak reflectance at 0.589 µm, ending at 0.66 µm. This reflectance, near the estuary, is comparatively wavier and higher, skewing towards longer wavelength ranges than occurred upstream where there was no saltwater mixing. It must be assumed that marine water favors the spectral contribution of vegetation and turbidity.
For river water influenced by tides (see figure 7A ), two areas are clearly distinguished. The spectra of the northern river acidic water, with weak marine water influence, shows a maximum at 0.589 µm and a rapid descent to 1.0 µm, and low response on longer wavelength ranges (see figure 7D). In the southern area, close to the marshes, spectra are strongly influenced by saltwater. The peak at 0.589 µm persists (see figure 7D), but the NIR wavelengthes display higher overall reflectance and weakened spectral features similar to transparent water, as in See figure 7B.
5. 2. Field spectra
Precipitates derived from acidic water are present all along the river channel. Both the thicker white and green crusts become progressively redder as they oxidize. It is also present widespread intense yellow dust, concentrated at knick points. Knick points on the Odiel River consist of natural hard rock outcrop “walls” that cross the river, or watermill walls, which were built advantageously along the pre-existing natural outcrops. Turbulence caused by water passing over or descending from the knick points increases oxygenation. The passages between alternating river bars also act as knick points at low water. Rocks and sand are stained by acidic water precipitates, the intensity of which depends on water oxidation levels associated to flooding, precipitatiom and desiccation.
The color of the outer weathered layer of a boulder is caused by the rock lithology. Quartzite boulders tend to develop dark red colors associated with goethite or hematite. Sandstone boulders have a faded pink appearance due to their porous nature which attracts remnant precipitated minerals.
Slate only retains pyrite oxidation products at knick points, when it is covered by dust or a crust. Otherwise, it is a fine-grained dark rock with low porosity which minimizes precipitate accumulation. When precipitates are present, they lower the overall reflectance. Slate on fine-grained sand is often mobilized by the wind on the upper surface. In this situation, the sand appears reddish from red quartz grains on the upper surface, but greyish underneath due to the presence of slate grains.
5.2.1. Area of boulder bars This area of the river channel, dominated by bars consisting of large rounded rocks, begins at
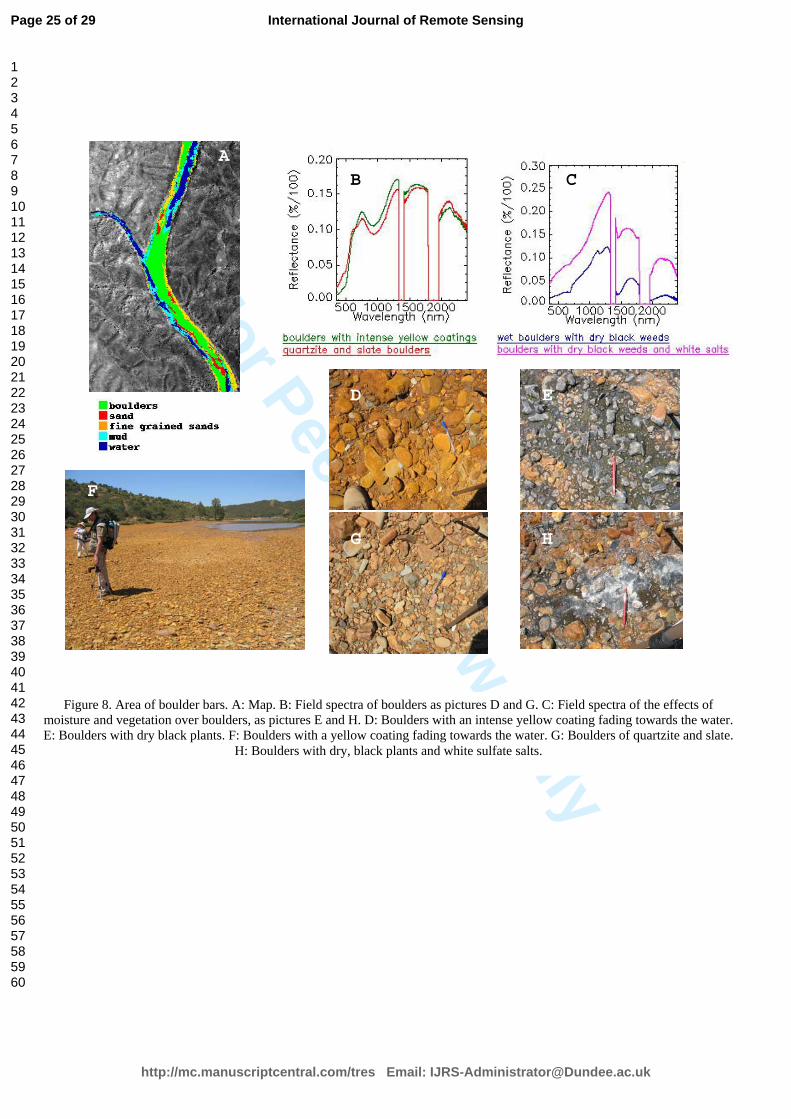
the confluence of the Odiel and Oraque Rivers. The latter river carries contamination from the abandoned mines of Tharsis, one of the three main mine sites in the Iberian Pyrite Belt (see figure 8A). The confluence of these two rivers results in a change in water chemistry (increasing acidity as well as other mine-related contaminants) and in grain size of predominant particulates. Deposition becomes more common as changing chemistry causes precipitate formation, and fluctuating velocities promote settling of certain materials. Yellow sulfate precipitates occur on upstream boulders; the intensity of the yellow colour of precipitate decreases toward the edge of the inundated area (see figure 8F). Finer-grained sediments were not observed in the upstream reaches. The spectral features of boulders with yellow or red coatings are very similar (See figure 8B). A well-developed intense yellow coating increases the overall reflectance (see figure 8D).
Near the water’s edge, boulders are covered by dry, black vegetation (see figures 8E and 8H). The spectral response is typical of the wet areas found on Hymap imagery, with distinct, acute absorption at 0.68 µm, and another at 1.15 µm; both are assumed to be related to vegetation (see figure 8C). The absorption at 1.15 µm coincides with well-developed, hydrated sulfate crusts both at river knick points and geomorphologically favorable areas on mine dumps. Oxidised sulfate materials may redisolve into the water column, only to be reprecipitated over already more oxidised sulphate phases.
Page 7 of 29
http://mc.manuscriptcentral.com/tres Email: [email protected]
International Journal of Remote Sensing
123456789101112131415161718192021222324252627282930313233343536373839404142434445464748495051525354555657585960
For Peer Review O
nly
5.2.2. Area of sand bars As gradient and velocity decreases in the middle river reaches, there is greater opportunity
for settling of smaller, sandy particulates, resulting in thick sand bars with occasional rocks that were small enough to be pushed on by the current. Channel area is reduced (see figure 9A). Muddy areas plugging bars and connecting braided water channels between alternating sand bars are generally wider than what was present further upstream in the boulder area.
Tidal influences can reach this section of the river and affect water velocity, thus contributing to the dropout of sand. Tide is also responsible for the mitigation of mining-derived coatings, crusts and dusts, which are not visually apparent but are spectrally present on the mud and wet areas. A change in the mineral composition of the salt efflorescence is anticipated because of the much higher chloride concentration of salt water.
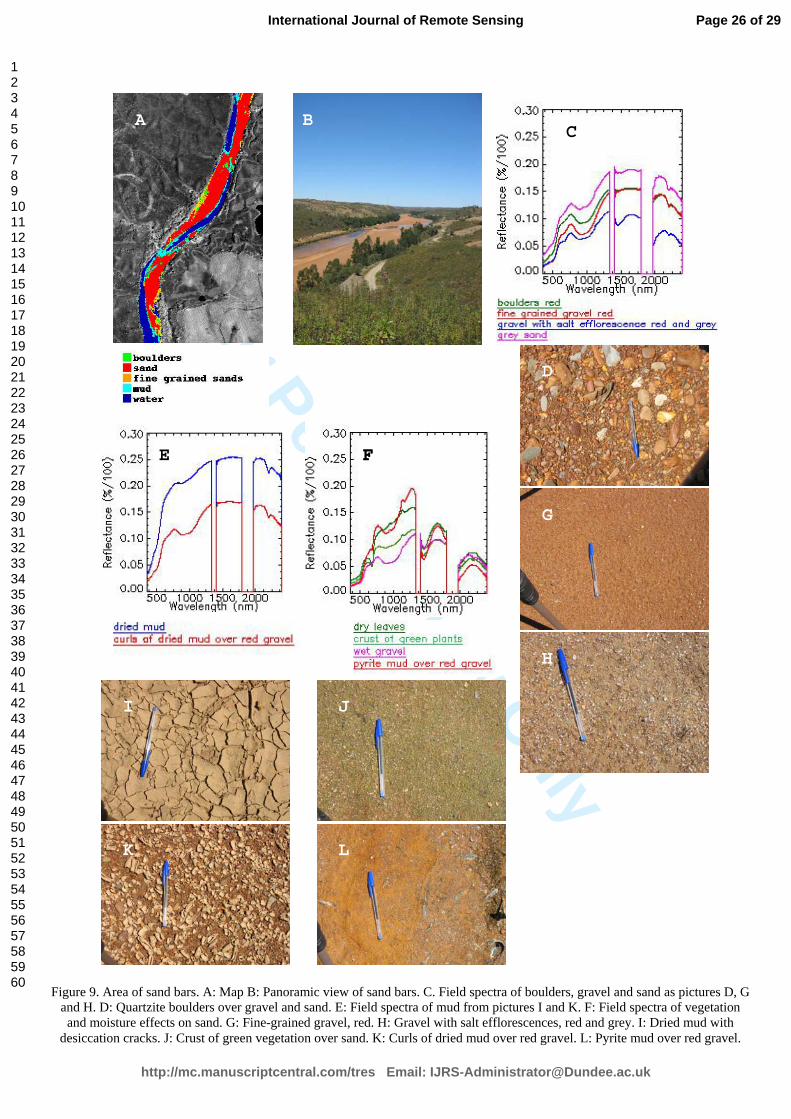
The spectra from boulders and sands in the field (see figure 9B) follow the same trends as shown in Hymap imagery (see figure 9C). Fine grained red sands display a wide bending from 0.60 µm to 0.76 µm, with an inflexion point at 0.67 µm in the visible range; the spectral response in the NIR is similar.
If salt efflorescence dusts red or grey sand, some minor features will betray the influence of moisture (se figures 9C, 9D, 9G, and 9H). While absorption at 0.68 µm is clearly present, there is also a suggestion of absorption at 1.15 µm which is indicative of hydrated sulfate.
Spectral features of desiccated mud are similar to boulders, with smooth, iron-related features and higher overall reflectance (see figures 9E and 9I). When the thin layer of mud dries, cracks and curls, underlying red sand is revealed (see figure 9K), the overall reflectance decreases, and iron-related absorptions deepen (see figure 9E). There are occasional remnants of bright orange pyrite mud (see figure 9L), with distinct and overwhelmingly clear spectral features typical of hydrated sulfate (see figure 9F), that is, sharp absorption at 0.68 µm and 1.15 µm, and steep descent to longer wavelengths with clear water vapor absorptions and high overall reflectance. The same features associated with hydrated sulfate are present on sand covered by dry leaves, crusts of green vegetation over sand (see figure9J), or inundated red sand (see figure 9F). Once again, there is a strong similarity between these abiotic features and green vegetation, which leads to questions about which feature is being mapped in any particular location.
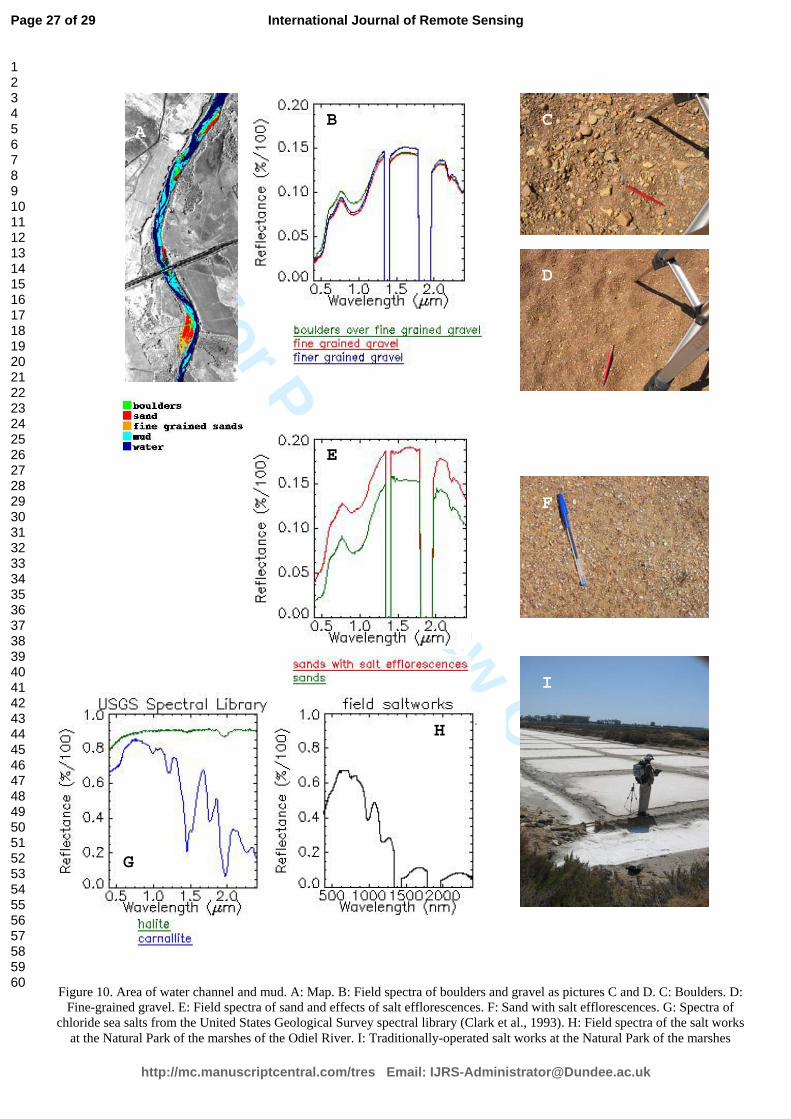
5.2.3. Area of water channel and mud As the river enters the furthest downstream segment near marshes and the estuary, bars
become scarce, isolated primarily along bends in the channel (see figure 10A). Very low water velocity limits suspended materials to very fine-grained particles that are deposited as mud. The few sand bars that are present are small, displaying a reminiscent lingoid shape. Boulders are generally present only on the top of bars (greatest elevation) or close to the channel border, that is, areas which are only inundated during elevated river and velocity levels when transport capacity is at its greatest.
The spectral features of sand and boulders that form the majority of river bars are quite similar (see figure 10B). Overall reflectance increases with decreasing grain size. Both boulders and sand often underlay a delicate cover of efflorescent salt (see figure 10F), although the presence of the salt efflorescence does not seem to influence spectral behavior of the two substates (see figure 10E) in the lower river segment. The spectra of salt water precipitates may be having a significant influence.
In contrast to the presence of chloride precipitates in the lower river segment that appeared to have a substantial effect on substrate spectral data, there was no evidence of sulfate precipitates in the downstream sand bars. Some thin belts of salt efflorescence are present near the water’s edge but field data did not indicate an influence on spectral response. Saltwater neutralizes the acidic fresh water, and typical sulfate precipitates initially appear to be absent. Halite (ClNa) produces a high, but flat overall spectral response; carnallite, on the other hand, may fit some of the observed spectral response profiles (see figure 10G). Field spectra were measured at the salt works (see figure10H), traditionally operated as a dehydration and salt recovery operation located in the natural park of the marshes of the Odiel River (See figure 10I). The resulting spectra were reminiscent of carnallite (KMgCl3.6H2O) (see figure 10G), with
Page 8 of 29
http://mc.manuscriptcentral.com/tres Email: [email protected]
International Journal of Remote Sensing
123456789101112131415161718192021222324252627282930313233343536373839404142434445464748495051525354555657585960
For Peer Review O
nly
absorption features at 1.0 µm and 1.20 µm, and a reduction in overall reflectance from 1.3 µm towards longer wavelength ranges. The hydrated iron sulfate profile has also been shown to demonstrate this overall reduction in reflectance, starting at 1.00 µm (Crowley et al., 2003). However, unlike carnallite, the salt works show a deep and wide absorption pattern focused at 0.85 µm.
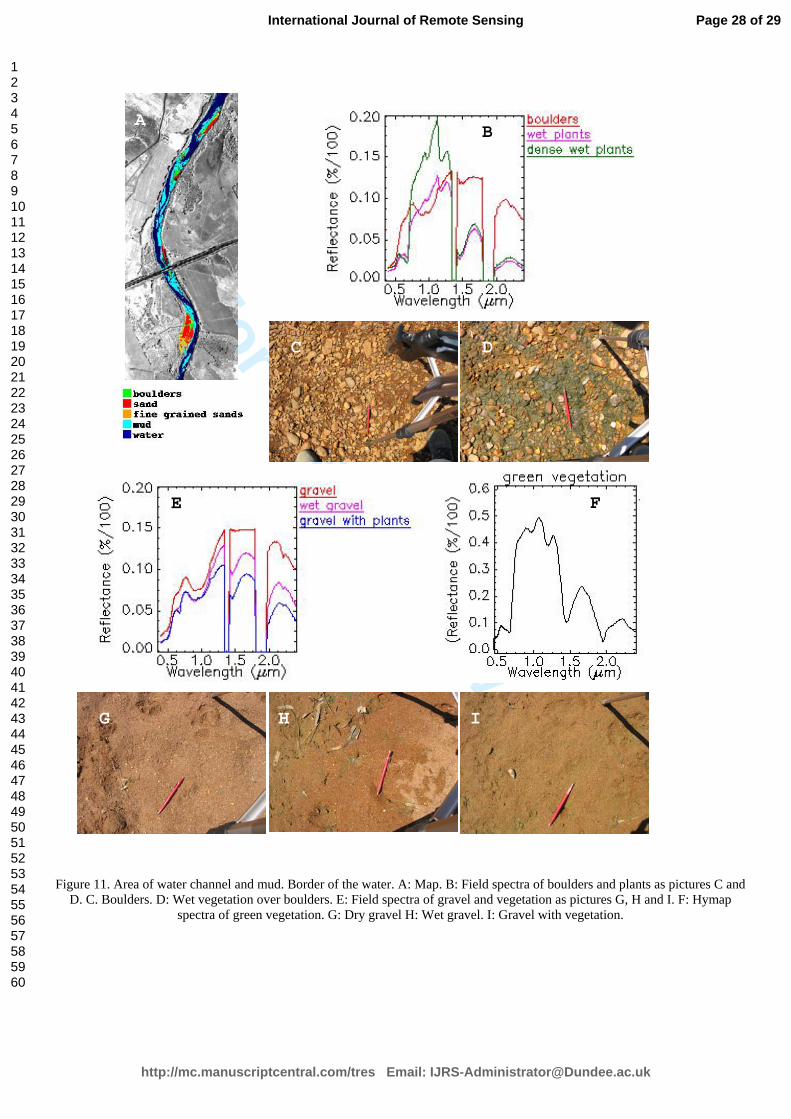
Approaching on a sand bar water showed significant alterations in its spectral profile (see figure 11E). The spectra of both boulders (see figure 11B) and red gravel (apparently dry) (see figure 11G) near water was characterized by very small 0.957 µm features. As moisture content and vegetation composition increased, 0.68 and 1.15 µm absorptions were evident (see figures 11B and 11E). Both absorptions are typical of green and growing vegetation (see figure 11F). There is a strong indication that vegetation dominates the spectral response of sediments, regardless of their grain size, when they become wet and are able to support plant growth, even in small voids among fine-grained gravel or sand. The presence of vegetation may confound identification of certain sediments, a problem further antagonized by pyrite mud which al µm so shows very similar absorption features.
5.2.4. Field spectral features on river sediments and water precipitates: summary The above spectral description offers a variety of mixed spectral responses which is summarized on table 1. Using those simplified evaluations of absorption features should be used with care. Following table 1, all sediments have similar spectral responses with similar absorption features, mainly related to iron bearing minerals contents in the visible wavelength range (0.68 µm). The overall reflectance decreases with increasing grain size and decrease of iron coatings. All the absorption features are sharpened on the intense yellow pyrite mud, whether by the presence of hydrated sulphate or microscopic vegetation growing on wet environments. If vegetation is dominant, the sharp absorption at 2.2 µm disappears. The same three absorption features are enhanced on the white hydrated sulphate crusts, but the 2.2 µm absorption seems enhanced compared to the spectra of intense yellow pyrite mud. The presence of powders of hydrated sulphate at the edge of the water increases the overall reflectance if the precipitate over vegetation, and decrease it if they occur over sediments. The powders of efflorescence of marine salts (chlorides) over sediments increase the overall reflectance, and smooth the 0.68 µm iron bearing minerals absorption feature. When vegetation is present, regardless of the grain size of the sediments it covers, the 0.68 µm and 1.15 µm sharpen, and the 2.2 µm feature smooths or disappears.
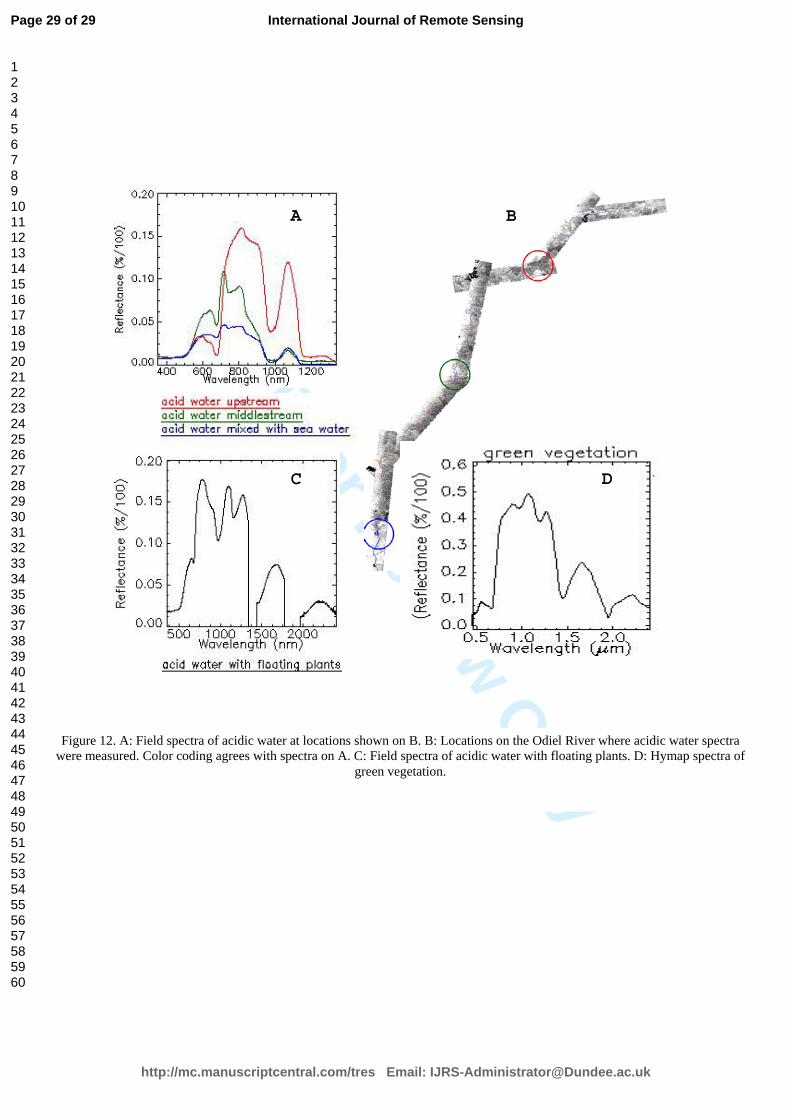
5.2.5. Water Spectra were measured in the field near the water’s edge at several points along the river (see
figure 12B). The measurement locations upstream and in the middle segment correspond to knick points receiving highly contaminated water from nearby mine sites. Near the mouth of the river, water spectra were measured near an isolated pebble bar surrounded by wide channels.
The spectra of acidic water measured in the field typically yield absorptions at 0.677 µm, 0.978 µm and 1.151 µm, which are also present in the spectra of green vegetation (see figures 12A and 12D). Additionally, there is an absorption at 0.741 µm in very acidic river water in the neighbourhood of mine waste drainage. This acidic water also displays a shoulder from 0.835 µm to 0.913 µm (see figure 12A).
Acidic water on Hymap data shows a reflectance peak from 0.400 µm to 0.662 µm, which levels out near the longer wavelength ranges (see figures 4 and 7), or develops noise if water is turbid. This feature is certainly stronger on the field spectra from upstream acidic water than from downstream river water that has been mixed with seawater. When acidic water contains floating vegetation, the resulting spectra (see figure 12C) are a mixture of acidic water and green vegetation signatures (see figures 12A and 12D).
Page 9 of 29
http://mc.manuscriptcentral.com/tres Email: [email protected]
International Journal of Remote Sensing
123456789101112131415161718192021222324252627282930313233343536373839404142434445464748495051525354555657585960
For Peer Review O
nly
6. Discussion
Obtaining accurate coordinates of mining-derived contamination along a river channel must initially include the mapping of river sediments and the location of critical contamination points, both of which are strongly influenced by river micro-geomorphology and sedimentology. A major task is to isolate and define the location of water-filled main and side channels where water is located, to avoid misinterpreting landcover features related to contamination. Acidic water in particular can be confused with several hydrated iron sulfates that are typical of pyrite oxidation.
Once the general map is drawn and the general sediment pattern is identified, further image processing on every subscene defined by changes in sediment reveals spectral deviations from the general pattern. In the present study, the spectral pebble bar differences were enhanced through analysis of the river channel along the whole flight line, whereas the spectral differences of water were enhanced on the subscenes.
Lithology, grain size and river geomorphology are the main parameters controlling river sediments that were mapped. Development of the larger areas of sulfate crusts was concentrated at knick points. These locations can be used as indicators of mineralogical evolution associated with seasonal and climate conditions.
Hymap spectra do not detect so much spectral detail. Only mud is outstandingly spectrally different from the rest of sediments on spectra derived from maps built from Hymap data. But even though field spectra do not show outstanding spectral differences on the geological units mapped with Hymap, the imagery is able to depict distinct maps without difficulty when the area covered is wide enough. We must assume that Hymap data would map with the same efficiency wider areas of hydrated sulphate crusts, or powdered white efflorescence if present.
The edge of the water, depositional areas for finer sediments, degree of moisture (wetness), mud, dry or wet vegetative cover, very shallow water with floating vegetation and the spectral influence of the river bottom are the most critical areas relative to the significant display of contamination products and border precipitates, whether from acidic fresh water or marine water. Most hydrated iron sulfate precipitates derived from acidic freshwater can be spectrally confused with potassium and magnesium chloride (carnallite) precipitated from saltwater. When halite (sodium chloride) efflorescence, which is spectrally flat, is present saltwater precipitates are harder to detect. Decreasing acidity may be better detected by the absence of the typical iron sulfate crusts and intense yellow pyrite mud.
Mapping the quality of water is confounded by vegetation, dry or wet, rooted or floating, on the adjacent sediments. The features of acidic water in the field revealed the spectral influence of green vegetation. In the present study it was found that the mixing of saltwater with acidic freshwater resulted in substantial spectral changes related to water chemistry. In particular, acidic water was neutralized by the alkaline, high ionic strength seawater. The influx of the saltwater caused overall reflectance to drop and spectral traces of turbid water in the NIR range with longer wavelengths.
7. Conclusion
Mapping the presence or impact of contamination originating from sulfide mine waste along a river course requires careful mapping of the river sediments and topographical features that, though minor, can influence water dynamics. These minor features are indicative of locations that would be advantageous for monitoring potential contaminant impacts.
The spectral features of acidic water are altered when it encounters and mixes with saltwater, resulting in a smoothing and reduction in overall reflectance. Interestingly, the presence of marine salt precipitates on sediments is not spectrally outstanding. However, under the influence of tides, distinct spectral features become apparent for mud.
The presence of vegetation proved particularly problematic for the spectral identification of contamination products as well as the precise delineation of inundated areas along the river. The
Page 10 of 29
http://mc.manuscriptcentral.com/tres Email: [email protected]
International Journal of Remote Sensing
123456789101112131415161718192021222324252627282930313233343536373839404142434445464748495051525354555657585960

For Peer Review O
nly
transition from dry to wet zones is the crucial challenge in using spectral imagery to identify and track contaminants in the river and along its flood plain.
The use of a reference mineralogical spectral library, developed in the laboratory, requires a careful geological context evaluation to provide efficient environmental information on contamination parameters. This study provided important data leading to a practical, utilitarian spectral library.
Page 11 of 29
http://mc.manuscriptcentral.com/tres Email: [email protected]
International Journal of Remote Sensing
123456789101112131415161718192021222324252627282930313233343536373839404142434445464748495051525354555657585960

For Peer Review O
nly
Acknowledgements
This research was funded by the National Research Plan of Spain (PNI, projects number
CGL2005-02462, CGL2006-01544/CLI and CGL2007-60004/CLI). J.M. Moreira and A. Gil
contributed with information about mine inventories and regional environmental databases. The
Andalusian Regional Government, the Junta de Andalucía, permitted entry to the abandoned
mine site of Sotiel at the border of the river. Local industries also allowed access to the river
through their facilities. E. Bellido and J.A. Martin Rubí are thanked for their interpretation of X-
Ray analysis. J. Farifteh helped to calibrate Hymap data for collection of field spectra. J. P.
Calvo and R. Rodriguez made possible the application of research funds through their
encouragement of the inner dynamics of the Geological Survey of Spain (IGME). Thanks also
to F. Avalos and J.M. Pernia for their assistance in the administration of the project funds.
Page 12 of 29
http://mc.manuscriptcentral.com/tres Email: [email protected]
International Journal of Remote Sensing
123456789101112131415161718192021222324252627282930313233343536373839404142434445464748495051525354555657585960
For Peer Review O
nly
References
BUZZI, J., GARCIA-MELENDEZ, E., RIAZA, A., 2009, Cartografía con espectroscopía de imágenes de productos de oxidación de piritas en la mina de Sotiel (Huelva, España) con el sensor Hymap, Segundas Jornadas de Investigadores en
formación en Ciencias de la Tierra, Madrid, 10-13 Noviembre 2009, 53-54. CÁNOVAS, C.R., OLÍAS, M., NIETO, J.M., SARMIENTO, A., CERON, J.C., 2007, Hydrogeochemical characteristics of the Tinto and Odiel Rivers (SW Spain).Factors controlling metal contents, Science of the Total Environment 373, 363-382. Clark, R.N., Swayze, G.A., Gallagher, A., King, T.V.V., Calvin, W.M., 1993, The U.S. Geological Survey Digital Spectral Library: Version 1: 0.2 to 3.0 mm. U.S. Geological
Survey, Open File Report 93-5 92. COCKS, T., JENSSEN, R., STEWART, A., WILSON, I., SHIELDS, T., 1998, The HymapTM Airborne Hyperspectral Sensor: The system, calibration and performance. Proceedings 1st EARSEL Workshop on Imaging Spectroscopy, Zürich, October 1998. CROWLEY, J.K., WILLIAMS, D.E., HAMMARSTROM, J.M., PIATAK, N., CHOU, I-M. AND MARS, J.C., 2003, Spectral reflectance properties (0.4–2.5 m) of secondary Fe-oxide, Fe-hydroxide, and Fe-sulphate-hydrate minerals associated with sulphide-bearing mine wastes. Geochemistry: Exploration, Environment, Analysis, 3- 3, 219-228(10). HUBBARD, B.E., CROWLEY, J.K., 2005, Mineral mapping on the Chilean-Bolivian Altiplano using co-orbital ALI, ASTER and Hyperion imagery, Data dimensionality issues and solutions. Remote Sensing of Environment 99:173-186. KRUSE, F.A., LEBKOFF, A.B., BOARDMAN, J.B., HEIDEBRECHT, K.B., SHAPIRO, A.T., BARLOON, P.J., GOETZ, A.F.H., 1993, The Spectral Imaging Processing System (SIPS) – Interactive Visualization and Analysis of Imaging Spectrometer Data. Remote Sensing of Environment 44:145-163. OLÍAS, M., CÁNOVAS, C.R., NIETO, J.M., SARMIENTO, A., 2006, Evaluation of the dissolved contaminant load transported by the Tinto and Odiel rivers (SouthWest Spain), Applied Geochemistry 21, 1733-1749. PLUMLEE, G.S., 1999, The environmental geology of mineral deposits. Part A: Processes, Techniques, and Health Issues. Reviews in Economic Geology, 6A, 71-116. NIETO, J.M., SARMIENTO, A., OLÍAS, M., CÁNOVAS, C.R., RIBA, I., KALMAN, J., DELVALLS, A., 2007, Acid mine drainage pollution in the Tinto and Odiel rivers (Iberian Pyrite Belt, SW Spain) and bioavailability of the transported metals to the Huelva Estuary, Environment International, 33, 445-455. RIAZA, A., GARCIA-MELENDEZ, E., MUELLER, A., 2010, Spectral identification of pyrite mud weathering products: a field and laboratory evaluation, International
Journal of Remote Sensing, 32: 1, 185-208. doi: 10.1080/01431160903439957 . RIAZA, A., MÜLLER, A., 2010. Hyperspectral Remote Sensing monitoring of Pyrite Mine Wastes: A record of climate variability (Pyrite Belt, Spain), Environmental Earth
Sciences, 61-3, 575. doi:10.1007/s12665-009-0368-y. RIAZA, A., CARRERE, V., 2009, Monitoring of superficial contamination produced by massive sulphide mine waste along the Odiel River (Andalousia, Spain) using hyperspectral data, IGARSS 2009, 13th-17th July 2009, Cape Town (South Africa), Geoscience and Remote Sensing Symposium, 2009, IEEE International, IGARSS 2009, 3, III-1701-III-1704, ISBN: 978-1-4244-3394-0. DOI: 10.1109/IGARSS.2009.5417966. RIAZA, A., ONG, C., MÜLLER, A., 2007, Pyrite mine wastes hyperspectral monitoring as a tool to detect Climate Change, Proceedings 10th Intl. Symposium on
Physical Measurements and Signatures in Remote Sensing, ISPMSRS07, WG VII/1, March 12-14, 2007, Davos, Switzerland, 228-233.
Page 13 of 29
http://mc.manuscriptcentral.com/tres Email: [email protected]
International Journal of Remote Sensing
123456789101112131415161718192021222324252627282930313233343536373839404142434445464748495051525354555657585960
For Peer Review O
nly
RICHTER, R., SCHLÄPFER, D., 2002, Geo-atmospheric processing of airborne imaging spectrometry data. Part 2: atmospheric/topographic correction. International Journal of Remote Sensing 23, 2631-2649. RSI, 2000, ENVI User´s Guide. Research Systems Inc. Publications SANCHEZ ESPAÑA, J., LOPEZ PAMO, E., SANTOFIMIA, E., ADUVIRE, O., REYES, J., BARETTINO, D., 2005, Acid mine drainage in the Iberian Pyrite Belt (Odiel river watershed, Huelva, SW Spain): Geochemistry, mineralogy and environmental implications, Applied Geochemistry, 20, 1320-1356. SARMIENTO, A., OLÍAS, M., NIETO, J.M., CÁNOVAS, C.R., GALVÁN, L., 2006, La degradación de la cuenca del río Odiel (Huelva, España) por drenaje ácido de mina (Huelva, España). V Congreso Ibero, Gestao e Planeamiento da Agua. Faro, Portugal. SARMIENTO, A.M., NIETO, J.M., OLÍAS, M., CÁNOVAS, C.R., 2009, Hydrochemical characteristics and seasonal influence on the pollution by acid mine drainage in the Odiel river Basin (SW Spain), Applied Geochemistry 24, 697-714. SCHLÄPFER, D., RICHTER, R. 2002, Geo-atmospheric processing of airborne imaging spectrometry data. Part 1: parametric orthorectification. International Journal
of Remote Sensing 23, 2609-2630.
Page 14 of 29
http://mc.manuscriptcentral.com/tres Email: [email protected]
International Journal of Remote Sensing
123456789101112131415161718192021222324252627282930313233343536373839404142434445464748495051525354555657585960
For Peer Review O
nly
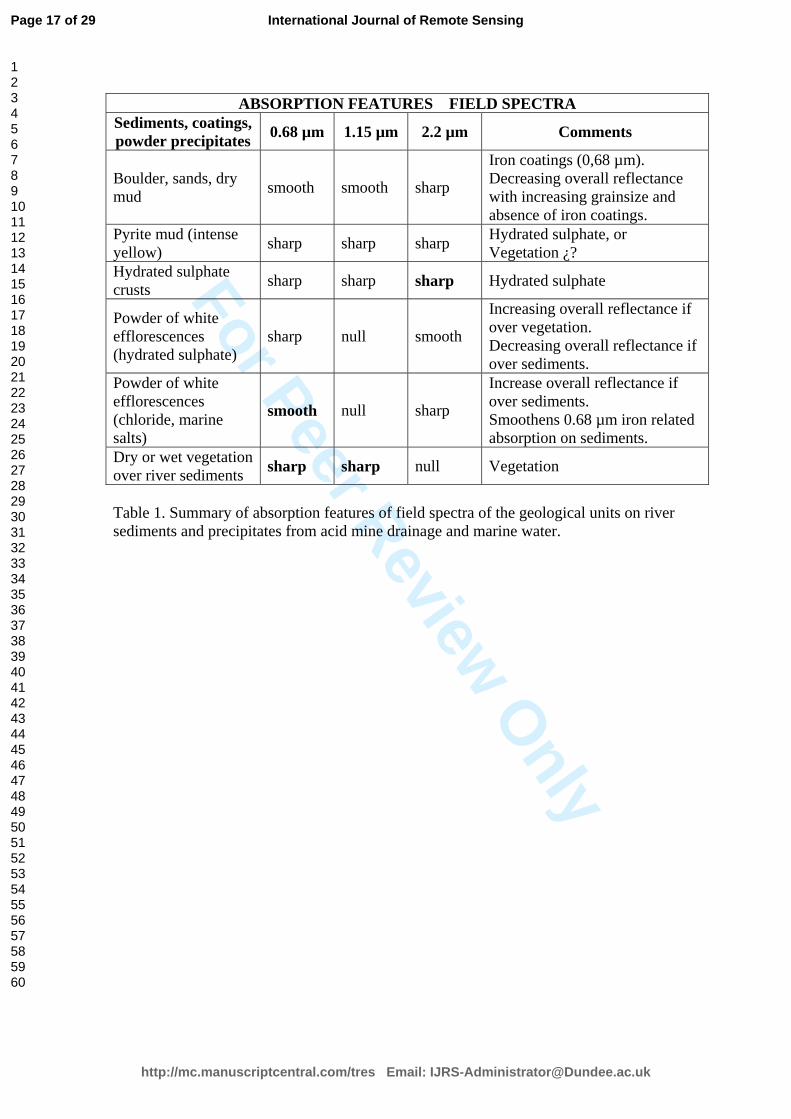
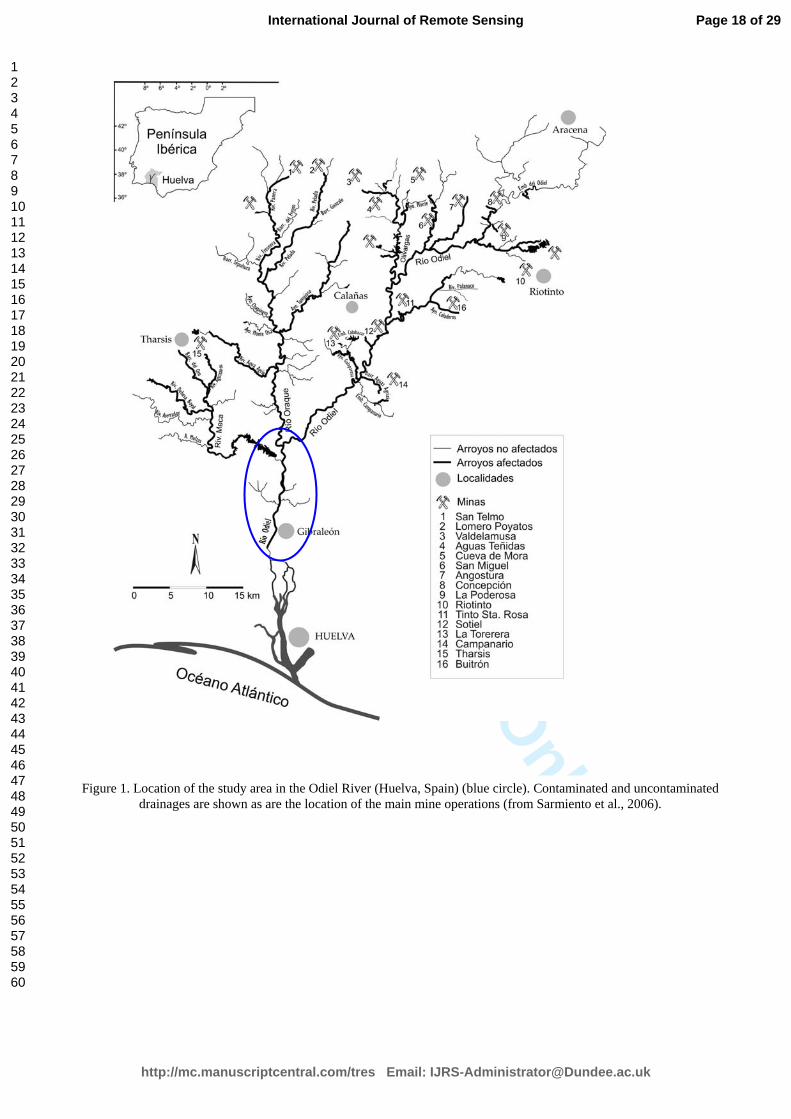
CAPTIONS Table 1. Summary of absorption features of field spectra of the geological units on river sediments and precipitates from acid mine drainage and marine water. Figure 1. Location of the study area in the Odiel River (Huelva, Spain) (blue circle). Contaminated and uncontaminated drainages are shown as are the location of the main mine operations (from Sarmiento et al., 2006). Figure 2. Sequence of hyperspectral image processing to produce a map of the river flow path. Figure 3. A: False color composite image with Hymap channels 16 (0.6755 µm), 26 (0.8188 µm) and 108 (2.1917 µm). B: Mask for the flow path. C: Mask for water. D: Map of fluvial sediments. Figure 4. Spectra from Hymap imagery from the endmembers used to build the geological map of figure 3D. Below, the mineralogical diagnosis of the Hymap spectra of the geological units of the map on figure 3D, using the pyrite weathering minerals spectral library as a reference (Crowley et al., 2003). Figure 5. A: Map of the fluvial flow path with squares on the subscenes mapped on B and F. B: Map of the Area of boulder bars. C: Panoramic view of a boulder bar with white ribbons of iron sulfate along the water’s edge. D: Detail of quartzite and slate boulders. E: Map of the Area of sand bars. F: Panoramic view of a sand bar. G: Map of the Area of water channel and mud. H: Sands. Figure 6. A. Map of the Area of boulder bars. B: Map of the Area of sand bars. C: Map of the Area of water channel and mud. a: Hymap spectra of the units mapped in the Area of boulder bars. b: Hymap spectra of the units mapped in the Area of sand bars. c: Hymap spectra of the units mapped in the Area of water channel and mud. Figure 7. A: Map of water built with Hymap imagery under tidal influence. B: Hymap spectra of transparent acidic water along the river path, corresponding to areas on figure 5. C: Hymap spectra of turbid acid water along the river. D: Hymap spectra of river water and sea water corresponding to map A. Figure 8. Area of boulder bars. A: Map. B: Field spectra of boulders as pictures D and G. C: Field spectra of the effects of moisture and vegetation over boulders, as pictures E and H. D: Boulders with an intense yellow coating fading towards the water. E: Boulders with dry black plants. F: Boulders with a yellow coating fading towards the water. G: Boulders of quartzite and slate. H: Boulders with dry, black plants and white sulfate salts. Figure 9. Area of sand bars. A: Map B: Panoramic view of sand bars. C. Field spectra of boulders, gravel and sand as pictures D, G and H. D: Quartzite boulders over gravel and sand. E: Field spectra of mud from pictures I and K. F: Field spectra of vegetation and moisture effects on sand. G: Fine-grained gravel, red. H: Gravel with salt efflorescences, red and grey. I: Dried mud with desiccation cracks. J: Crust of green
Page 15 of 29
http://mc.manuscriptcentral.com/tres Email: [email protected]
International Journal of Remote Sensing
123456789101112131415161718192021222324252627282930313233343536373839404142434445464748495051525354555657585960
For Peer Review O
nly
vegetation over sand. K: Curls of dried mud over red gravel. L: Pyrite mud over red gravel. Figure 10. Area of water channel and mud. A: Map. B: Field spectra of boulders and gravel as pictures C and D. C: Boulders. D: Fine-grained gravel. E: Field spectra of sand and effects of salt efflorescences. F: Sand with salt efflorescences. G: Spectra of chloride sea salts from the United States Geological Survey spectral library (Clark et al., 1993). H: Field spectra of the salt works at the Natural Park of the marshes of the Odiel River. I: Traditionally-operated salt works at the Natural Park of the marshes. Figure 11. Area of water channel and mud. Border of the water. A: Map. B: Field spectra of boulders and plants as pictures C and D. C. Boulders. D: Wet vegetation over boulders. E: Field spectra of gravel and vegetation as pictures G, H and I. F: Hymap spectra of green vegetation. G: Dry gravel H: Wet gravel. I: Gravel with vegetation. Figure 12. A: Field spectra of acidic water at locations shown on B. B: Locations on the Odiel River where acidic water spectra were measured. Color coding agrees with spectra on A. C: Field spectra of acidic water with floating plants. D: Hymap spectra of green vegetation.
Page 16 of 29
http://mc.manuscriptcentral.com/tres Email: [email protected]
International Journal of Remote Sensing
123456789101112131415161718192021222324252627282930313233343536373839404142434445464748495051525354555657585960
For Peer Review O
nly
ABSORPTION FEATURES FIELD SPECTRA Sediments, coatings, powder precipitates 0.68 µm 1.15 µm 2.2 µm Comments
Boulder, sands, dry mud smooth smooth sharp
Iron coatings (0,68 µm). Decreasing overall reflectance with increasing grainsize and absence of iron coatings.
Pyrite mud (intense yellow) sharp sharp sharp Hydrated sulphate, or
Vegetation ¿? Hydrated sulphate crusts sharp sharp sharp Hydrated sulphate
Powder of white efflorescences (hydrated sulphate)
sharp null smooth
Increasing overall reflectance if over vegetation. Decreasing overall reflectance if over sediments.
Powder of white efflorescences (chloride, marine salts)
smooth null sharp
Increase overall reflectance if over sediments. Smoothens 0.68 µm iron related absorption on sediments.
Dry or wet vegetation over river sediments sharp sharp null Vegetation
Table 1. Summary of absorption features of field spectra of the geological units on river sediments and precipitates from acid mine drainage and marine water.
Page 17 of 29
http://mc.manuscriptcentral.com/tres Email: [email protected]
International Journal of Remote Sensing
123456789101112131415161718192021222324252627282930313233343536373839404142434445464748495051525354555657585960
For Peer Review O
nly
Figure 1. Location of the study area in the Odiel River (Huelva, Spain) (blue circle). Contaminated and uncontaminated drainages are shown as are the location of the main mine operations (from Sarmiento et al., 2006).
Page 18 of 29
http://mc.manuscriptcentral.com/tres Email: [email protected]
International Journal of Remote Sensing
123456789101112131415161718192021222324252627282930313233343536373839404142434445464748495051525354555657585960
For Peer Review O
nly
Figure 2. Sequence of hyperspectral image processing to produce a map of the river flow path.
Page 19 of 29
http://mc.manuscriptcentral.com/tres Email: [email protected]
International Journal of Remote Sensing
123456789101112131415161718192021222324252627282930313233343536373839404142434445464748495051525354555657585960
For Peer Review O
nly
Figure 3. A: False color composite image with Hymap channels 16 (0.6755 µm), 26 (0.8188 µm) and 108
(2.1917 µm). B: Mask for the flow path. C: Mask for water. D: Map of fluvial sediments.
B: River flow path C: WaterA D
Page 20 of 29
http://mc.manuscriptcentral.com/tres Email: [email protected]
International Journal of Remote Sensing
123456789101112131415161718192021222324252627282930313233343536373839404142434445464748495051525354555657585960
For Peer Review O
nly
Figure 4. Spectra from Hymap imagery from the endmembers used to build the geological map of figure 3D. Below, the mineralogical diagnosis of the Hymap spectra of the geological units of the map on figure
3D, using the pyrite weathering minerals spectral library as a reference (Crowley et al., 2003).
Page 21 of 29
http://mc.manuscriptcentral.com/tres Email: [email protected]
International Journal of Remote Sensing
123456789101112131415161718192021222324252627282930313233343536373839404142434445464748495051525354555657585960
For Peer Review O
nly
A
I
B
F
D
C
E
GH
Figure 5. A: Map of the fluvial flow path with squares on the subscenes mapped on B and F. B: Map of the Area of boulder bars. C: Panoramic view of a boulder bar with white ribbons of iron sulfate along the water’s edge. D: Detail of quartzite and slate
boulders. E: Map of the Area of sand bars. F: Panoramic view of a sand bar. G: Map of the Area of water channel and mud. H: Sands.
Page 22 of 29
http://mc.manuscriptcentral.com/tres Email: [email protected]
International Journal of Remote Sensing
123456789101112131415161718192021222324252627282930313233343536373839404142434445464748495051525354555657585960
For Peer Review O
nly
A a
C
B
c
b
Figure 6. A. Map of the Area of boulder bars. B: Map of the Area of sand bars. C: Map of the Area of water channel and mud. a: Hymap spectra of the units mapped in the Area of boulder bars. b: Hymap spectra of the units mapped in the Area of sand bars. c:
Hymap spectra of the units mapped in the Area of water channel and mud.
Page 23 of 29
http://mc.manuscriptcentral.com/tres Email: [email protected]
International Journal of Remote Sensing
123456789101112131415161718192021222324252627282930313233343536373839404142434445464748495051525354555657585960
For Peer Review O
nly
A B
C
D
Figure 7. A: Map of water built with Hymap imagery under tidal influence. B: Hymap spectra of transparent acidic water along the river path, corresponding to areas on figure 5. C: Hymap spectra of turbid acid water along the river. D: Hymap spectra of river
water and sea water corresponding to map A.
Page 24 of 29
http://mc.manuscriptcentral.com/tres Email: [email protected]
International Journal of Remote Sensing
123456789101112131415161718192021222324252627282930313233343536373839404142434445464748495051525354555657585960
For Peer Review O
nly
A
G
F
ED
B
H
C
Figure 8. Area of boulder bars. A: Map. B: Field spectra of boulders as pictures D and G. C: Field spectra of the effects of moisture and vegetation over boulders, as pictures E and H. D: Boulders with an intense yellow coating fading towards the water. E: Boulders with dry black plants. F: Boulders with a yellow coating fading towards the water. G: Boulders of quartzite and slate.
H: Boulders with dry, black plants and white sulfate salts.
Page 25 of 29
http://mc.manuscriptcentral.com/tres Email: [email protected]
International Journal of Remote Sensing
123456789101112131415161718192021222324252627282930313233343536373839404142434445464748495051525354555657585960
For Peer Review O
nly
A
C
H
G
B
D
JI
FE
K L
F
Figure 9. Area of sand bars. A: Map B: Panoramic view of sand bars. C. Field spectra of boulders, gravel and sand as pictures D, G and H. D: Quartzite boulders over gravel and sand. E: Field spectra of mud from pictures I and K. F: Field spectra of vegetation and moisture effects on sand. G: Fine-grained gravel, red. H: Gravel with salt efflorescences, red and grey. I: Dried mud with
desiccation cracks. J: Crust of green vegetation over sand. K: Curls of dried mud over red gravel. L: Pyrite mud over red gravel.
Page 26 of 29
http://mc.manuscriptcentral.com/tres Email: [email protected]
International Journal of Remote Sensing
123456789101112131415161718192021222324252627282930313233343536373839404142434445464748495051525354555657585960
For Peer Review O
nly
C
A
H
G
B
D
I
F
E
Figure 10. Area of water channel and mud. A: Map. B: Field spectra of boulders and gravel as pictures C and D. C: Boulders. D: Fine-grained gravel. E: Field spectra of sand and effects of salt efflorescences. F: Sand with salt efflorescences. G: Spectra of
chloride sea salts from the United States Geological Survey spectral library (Clark et al., 1993). H: Field spectra of the salt works at the Natural Park of the marshes of the Odiel River. I: Traditionally-operated salt works at the Natural Park of the marshes
Page 27 of 29
http://mc.manuscriptcentral.com/tres Email: [email protected]
International Journal of Remote Sensing
123456789101112131415161718192021222324252627282930313233343536373839404142434445464748495051525354555657585960
For Peer Review O
nly
C
A
IH
B
D
G
E F
Figure 11. Area of water channel and mud. Border of the water. A: Map. B: Field spectra of boulders and plants as pictures C and D. C. Boulders. D: Wet vegetation over boulders. E: Field spectra of gravel and vegetation as pictures G, H and I. F: Hymap
spectra of green vegetation. G: Dry gravel H: Wet gravel. I: Gravel with vegetation.
Page 28 of 29
http://mc.manuscriptcentral.com/tres Email: [email protected]
International Journal of Remote Sensing
123456789101112131415161718192021222324252627282930313233343536373839404142434445464748495051525354555657585960
For Peer Review O
nly
A
A B
C D
Figure 12. A: Field spectra of acidic water at locations shown on B. B: Locations on the Odiel River where acidic water spectra were measured. Color coding agrees with spectra on A. C: Field spectra of acidic water with floating plants. D: Hymap spectra of
green vegetation.
Page 29 of 29
http://mc.manuscriptcentral.com/tres Email: [email protected]
International Journal of Remote Sensing
123456789101112131415161718192021222324252627282930313233343536373839404142434445464748495051525354555657585960