Solution calorimetry on minerals related to acid mine drainage
13
171 Solution calorimetry on minerals related to acid mine drainage – methodology, checks, and balances Institute of Geosciences, Carl-Zeiss-Promenade 10, Friedrich-Schiller University, D-07745 Jena, Germany Abstract: Solution calorimetry is an established technique to measure thermodynamic properties of solids. Two common options for the solvents and measurement regimes include acid-solution calorimetry with aqueous solvents at temperatures between 0–100 °C and high temperature oxide-melt calorimetry, with oxide solvents at 700–1000 °C. The usual outcome of a set of solution calorimetry experiments is the enthalpy of formation of a phase studied, calculated from a thermochemi- cal cycle with a set of reference phases. Thermochemical cycles apply the Hess’ law in a form of linear equations. In this paper, the choice and pitfalls of various reference phases is discussed, with a focus on oxysalts (oxides, sulfates, arsenates) related to acid mine drainage. The accuracy and precision in the systems H 2 O and Fe 2 O 3 –H 2 O is documented by a number of control thermochemical cycles, summarized in this work. Calorimetry on systems including Ca, Cu, Al, As, Sb, Na, and K is also deliberated. For As, X-ray absorption spectroscopy showed that the final oxidation state of arsenic is identical ir- respective of the initial oxidation state. In general, the statistical uncertainty of the calorimetric experiments is smaller than the precision of the data, as judged from enthalpies of various reactions. The accuracy of the data, however, does not suffer with due care. Hence, solution calorimetry, with its advantages and disadvantages, is an important method that delivers high-quality thermodynamic data. Key words: Calorimetry, Thermodynamics, Enthalpies of formation, Mine drainage Juraj Majzlan 1. INTRODUCTION Solution calorimetry is an established technique to measure thermodynamic properties of solids (Nordstrom & Munoz, 1994). ere are different types of calorimeters, employing different solvents. e traditional acid-solution calorimetry uses hydrofluoric acid (Hovis et al., 2009), hydrochloric acid (e.g., Majzlan et al., 2016 b ), sulfuric acid (Charykova et al., 2017), but also pure water or bases. When needed, less common solvents, such as metallic alloys (Misra et al., 1971), organic solvents (e.g., Jessup, 1959), or molten salts (KOH/NaOH at 210 ºC, Knauth & Schwitzgebel, 1988) can be also used. High-temperature calorimetry uses melts of lead borate, alkali borate, or sodium molybdate (Navrotsky, 1977), or silicate melts (Wilding & Navrotsky, 2000). e purpose of this paper is to review the methodology for the solution calorimetry of acid-mine drainage related oxides, sulfates, and arsenates. e accuracy of the data is evaluated from thermochemical cycles used to test the per- formance of the calorimeter and the quality of the tabulated thermodynamic data. ese checks are scaered in my papers over the last 20 years and can be used to judge the quality of the data. ey can help others interested in such experi- ments to test their results and not to start building up the experiments from the scratch. In addition, this paper sum- marizes discrepancies and deviations among the procedures and results from my group over the last 20 years; the results will be, however, corrected in another work that will use the data for modeling of acid mine drainage. is publication is currently in preparation. 2. CONSTRUCTION OF THE CALORIMETERS Nowadays, unlike many years ago, calorimeters of various de- signs are manufactured and marketed by commercial enterprises. In the earlier days, many instruments were home-built but the transfer of the development to the commercial sphere and the elimination of many machine shops at the universities essentially stopped this practice. e design of the high-temperature oxide-melt calorimeters has been described by Navrotsky (1977, 1997, 2014). In principle, nothing has changed in the design over many years, although incremental changes have made these calorimeters more sensi- tive and more versatile. Acid-solution calorimeters also underwent many changes and profited from the improvement of other technologies. In our laboratory, we are using a commercial IMC-4400 calorimeter (Calorimetry Sciences Corporation), modified for the purposes of acid-solution calorimetry. e liquid (water) bath of the calo- rimeter is held at a constant temperature of 298.15 K with very small fluctuations. e temperature of the bath can be varied and other liquids, such as oils, could be also used. e calorimetric solvent is contained in a polyetheretherk- etone (PEEK) cup with a total volume of 60 mL (Fig. 1). is material was chosen because of good machinability and resist- ance to many aqueous liquids. Earlier aempts showed that Teflon is also a possibility but Teflon cups tend to deform and leak aſter some time. e PEEK cup is then closed with a PEEK screw lid and inserted into the calorimeter well. e calorimeter stabilizes for about 8 hours. During the stabilization and the ex- periment, the solvent is stirred by a SiO 2 glass stirrer by a motor acta geologica slovaca, 9(2), 2017, 171–183 Manuscript received: 2017-05-29 Revised version accepted: 2017-07-17
-
Upload
khangminh22 -
Category
Documents
-
view
6 -
download
0
Transcript of Solution calorimetry on minerals related to acid mine drainage

171
Solution calorimetry on minerals related to acid mine drainage – methodology, checks, and balancesInstitute of Geosciences, Carl-Zeiss-Promenade 10, Friedrich-Schiller University, D-07745 Jena, Germany
Abstract: Solution calorimetry is an established technique to measure thermodynamic properties of solids. Two common options for the solvents and measurement regimes include acid-solution calorimetry with aqueous solvents at temperatures between 0–100 °C and high temperature oxide-melt calorimetry, with oxide solvents at 700–1000 °C. The usual outcome of a set of solution calorimetry experiments is the enthalpy of formation of a phase studied, calculated from a thermochemi-cal cycle with a set of reference phases. Thermochemical cycles apply the Hess’ law in a form of linear equations. In this paper, the choice and pitfalls of various reference phases is discussed, with a focus on oxysalts (oxides, sulfates, arsenates) related to acid mine drainage. The accuracy and precision in the systems H2O and Fe2O3–H2O is documented by a number of control thermochemical cycles, summarized in this work. Calorimetry on systems including Ca, Cu, Al, As, Sb, Na, and K is also deliberated. For As, X-ray absorption spectroscopy showed that the final oxidation state of arsenic is identical ir-respective of the initial oxidation state. In general, the statistical uncertainty of the calorimetric experiments is smaller than the precision of the data, as judged from enthalpies of various reactions. The accuracy of the data, however, does not suffer with due care. Hence, solution calorimetry, with its advantages and disadvantages, is an important method that delivers high-quality thermodynamic data.Key words: Calorimetry, Thermodynamics, Enthalpies of formation, Mine drainage
Juraj Majzlan
1. INTRODUCTION
Solution calorimetry is an established technique to measure thermodynamic properties of solids (Nordstrom & Munoz, 1994). There are different types of calorimeters, employing different solvents. The traditional acid-solution calorimetry uses hydrofluoric acid (Hovis et al., 2009), hydrochloric acid (e.g., Majzlan et al., 2016b), sulfuric acid (Charykova et al., 2017), but also pure water or bases. When needed, less common solvents, such as metallic alloys (Misra et al., 1971), organic solvents (e.g., Jessup, 1959), or molten salts (KOH/NaOH at 210 ºC, Knauth & Schwitzgebel, 1988) can be also used. High-temperature calorimetry uses melts of lead borate, alkali borate, or sodium molybdate (Navrotsky, 1977), or silicate melts (Wilding & Navrotsky, 2000).
The purpose of this paper is to review the methodology for the solution calorimetry of acid-mine drainage related oxides, sulfates, and arsenates. The accuracy of the data is evaluated from thermochemical cycles used to test the per-formance of the calorimeter and the quality of the tabulated thermodynamic data. These checks are scattered in my papers over the last 20 years and can be used to judge the quality of the data. They can help others interested in such experi-ments to test their results and not to start building up the experiments from the scratch. In addition, this paper sum-marizes discrepancies and deviations among the procedures and results from my group over the last 20 years; the results will be, however, corrected in another work that will use the data for modeling of acid mine drainage. This publication is currently in preparation.
2. CONSTRUCTION OF THE CALOR IMETERS
Nowadays, unlike many years ago, calorimeters of various de-signs are manufactured and marketed by commercial enterprises. In the earlier days, many instruments were home-built but the transfer of the development to the commercial sphere and the elimination of many machine shops at the universities essentially stopped this practice.
The design of the high-temperature oxide-melt calorimeters has been described by Navrotsky (1977, 1997, 2014). In principle, nothing has changed in the design over many years, although incremental changes have made these calorimeters more sensi-tive and more versatile.
Acid-solution calorimeters also underwent many changes and profited from the improvement of other technologies. In our laboratory, we are using a commercial IMC-4400 calorimeter (Calorimetry Sciences Corporation), modified for the purposes of acid-solution calorimetry. The liquid (water) bath of the calo-rimeter is held at a constant temperature of 298.15 K with very small fluctuations. The temperature of the bath can be varied and other liquids, such as oils, could be also used.
The calorimetric solvent is contained in a polyetheretherk-etone (PEEK) cup with a total volume of 60 mL (Fig. 1). This material was chosen because of good machinability and resist-ance to many aqueous liquids. Earlier attempts showed that Teflon is also a possibility but Teflon cups tend to deform and leak after some time. The PEEK cup is then closed with a PEEK screw lid and inserted into the calorimeter well. The calorimeter stabilizes for about 8 hours. During the stabilization and the ex-periment, the solvent is stirred by a SiO2 glass stirrer by a motor
acta geologica slovaca, 9(2), 2017, 171–183
Manuscript received: 2017-05-29Revised version accepted: 2017-07-17
172
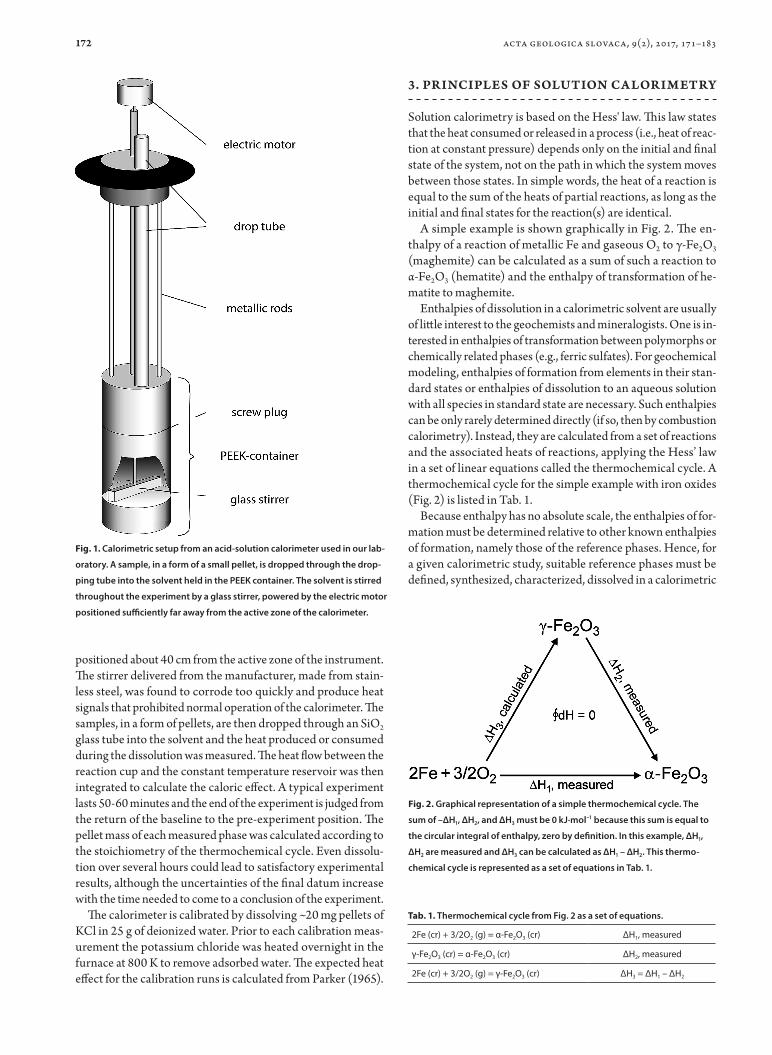
positioned about 40 cm from the active zone of the instrument. The stirrer delivered from the manufacturer, made from stain-less steel, was found to corrode too quickly and produce heat signals that prohibited normal operation of the calorimeter. The samples, in a form of pellets, are then dropped through an SiO2 glass tube into the solvent and the heat produced or consumed during the dissolution was measured. The heat flow between the reaction cup and the constant temperature reservoir was then integrated to calculate the caloric effect. A typical experiment lasts 50-60 minutes and the end of the experiment is judged from the return of the baseline to the pre-experiment position. The pellet mass of each measured phase was calculated according to the stoichiometry of the thermochemical cycle. Even dissolu-tion over several hours could lead to satisfactory experimental results, although the uncertainties of the final datum increase with the time needed to come to a conclusion of the experiment.
The calorimeter is calibrated by dissolving ~20 mg pellets of KCl in 25 g of deionized water. Prior to each calibration meas-urement the potassium chloride was heated overnight in the furnace at 800 K to remove adsorbed water. The expected heat effect for the calibration runs is calculated from Parker (1965).
3. PR INCIPLES OF SOLUTION CALOR IMETRY
Solution calorimetry is based on the Hess' law. This law states that the heat consumed or released in a process (i.e., heat of reac-tion at constant pressure) depends only on the initial and final state of the system, not on the path in which the system moves between those states. In simple words, the heat of a reaction is equal to the sum of the heats of partial reactions, as long as the initial and final states for the reaction(s) are identical.
A simple example is shown graphically in Fig. 2. The en-thalpy of a reaction of metallic Fe and gaseous O2 to γ-Fe2O3 (maghemite) can be calculated as a sum of such a reaction to α-Fe2O3 (hematite) and the enthalpy of transformation of he-matite to maghemite.
Enthalpies of dissolution in a calorimetric solvent are usually of little interest to the geochemists and mineralogists. One is in-terested in enthalpies of transformation between polymorphs or chemically related phases (e.g., ferric sulfates). For geochemical modeling, enthalpies of formation from elements in their stan-dard states or enthalpies of dissolution to an aqueous solution with all species in standard state are necessary. Such enthalpies can be only rarely determined directly (if so, then by combustion calorimetry). Instead, they are calculated from a set of reactions and the associated heats of reactions, applying the Hess’ law in a set of linear equations called the thermochemical cycle. A thermochemical cycle for the simple example with iron oxides (Fig. 2) is listed in Tab. 1.
Because enthalpy has no absolute scale, the enthalpies of for-mation must be determined relative to other known enthalpies of formation, namely those of the reference phases. Hence, for a given calorimetric study, suitable reference phases must be defined, synthesized, characterized, dissolved in a calorimetric
Fig. 1. Calorimetric setup from an acid-solution calorimeter used in our lab-
oratory. A sample, in a form of a small pellet, is dropped through the drop-
ping tube into the solvent held in the PEEK container. The solvent is stirred
throughout the experiment by a glass stirrer, powered by the electric motor
positioned sufficiently far away from the active zone of the calorimeter.
Fig. 2. Graphical representation of a simple thermochemical cycle. The
sum of –ΔH1, ΔH2, and ΔH3 must be 0 kJ·mol–1 because this sum is equal to
the circular integral of enthalpy, zero by definition. In this example, ΔH1,
ΔH2 are measured and ΔH3 can be calculated as ΔH1 – ΔH2. This thermo-
chemical cycle is represented as a set of equations in Tab. 1.
Tab. 1. Thermochemical cycle from Fig. 2 as a set of equations.
2Fe (cr) + 3/2O2 (g) = α-Fe2O3 (cr) ΔH1, measured
γ-Fe2O3 (cr) = α-Fe2O3 (cr) ΔH2, measured
2Fe (cr) + 3/2O2 (g) = γ-Fe2O3 (cr) ΔH3 = ΔH1 – ΔH2
acta geologica slovaca, 9(2), 2017, 171–183
173
solvent, and their dissolution enthalpies must be measured. This situation also automatically implies that any systematic error, either in the dissolution enthalpies of the reference phases or their formation enthalpies from the literature, will translate into a systematic error on the formation enthalpy of the phase studied. Hence, the selection of a set of reference phases is an important step, critical for a success of any solution calorimetry work.
4. PROPAGATION AND R EPORTING OF UNCERTAINTIES
Statistical uncertainty of repeated calorimetric measurements under the same conditions is reported as standard deviation(s) of the mean, as recommended by the International Union of Pure and Applied Chemistry (IUPAC, 1981). In our work, we report two standard deviations of the mean, i.e, the 95 % con-fidence interval. The uncertainties of one series of calorimetric measurements are usually small. For the case of rapid sample dissolution and moderate to large signal-to-noise ratio, they are about 0.5 % for acid solution calorimetry and 1 % for the high-temperature calorimetry. For low signal-to-noise ratios, when the intrinsic thermal instability of the instrument plays the major role, uncertainties of 0.1 kJ·mol–1 for acid solution calorimetry and 0.5 kJ·mol–1 for high temperature calorimetry can be attained. Rapid sample dissolution means that the baseline returns to its pre-experiment position about an hour after the sample was dropped into the calorimeter. Longer dissolution times compromise the uncertainties.
The necessity of using reference phase has consequences for the uncertainty of the enthalpy of formation of a studied phase. The uncertainties of the enthalpies of dissolution and enthalpies of formation of each reference phase must be propagated and included in the final datum determined by a thermochemical cycle. Propagation of the errors is a simple matter in this case and has been described by IUPAC (1981) and explained in
statistical textbooks, for example Taylor (1982).As an example, the enthalpy of dissolution of butlerite, Fe(SO4)
(OH)·2H2O, was measured as –3.06±0.08 kJ·mol–1 (Majzlan et al., 2017b). The enthalpy of formation of this phase, calculated via the thermochemical cycle in Tab. 2, is –1758.0±1.7 kJ·mol–1. The Gibbs free energy of formation of butlerite, calculated from this datum and experimentally measured entropy with the ap-propriate error propagation, is –1492.7±1.8 kJ·mol–1. The Gibbs free energy of a dissolution reaction
Fe(OH)(SO4)·2H2O + H+ = Fe3+ + SO42– + 3H2O
is 21.0±2.0 kJ·mol–1, the error being again larger because of the inclusion of the uncertainties on the formation properties of the aqueous ions and liquid water. The solubility product is then log Ksp = –3.69±0.34. In terms of solubility, this means variation from 6.5 (for log Ksp = –3.35) to 1.9 (for log Ksp = –4.03) mmol of Fe3+ in the aqueous phase in equilibrium with butlerite (calculated at pH = 3.5).
Another example are the thermodynamic properties of scoro-dite, FeAsO4·2H2O. The calorimetric measurements and error propagation gave log Ksp = –25.83±0.52 (Majzlan et al., 2012a). For log Ksp = –25.83, the solubility of arsenic is predicted to be 40 ppb (at pH = 4). Within the error stated, the calculated solu-bility varies from 22 to 75 ppb. Although such variations may seem large, the accuracy of the log Ksp datum is believed to be very good, because of its agreement with log Ksp determined in a number of solubility studies (see Majzlan et al., 2012a for details).
5. CHOICE OF METHODS AND SOLVENTS
For the acid-solution calorimetry, the aqueous solvents are usu-ally acids of given molality, depending on the samples studied. The high-temperature oxide melts are generated by melting of lead borate, 2PbO·B2O3 (Navrotsky, 1977), an amorphous
compound that changes into heavy, viscous liq-uid at calorimetric temperature, or a near-eutectic mixture of MoO3 and Na2MoO4 (Navrotsky & Kleppa, 1967), referred to in this paper as sodium molybdate. Other high-temperature solvents were summarized and discussed by Navrotsky (1977).
For the solution calorimetry, the primary choice depends on the solvent that dissolves a given sam-ple. If a sample is soluble only in a single solvent, not much flexibility remains in the selection pro-cess. The high-temperature solvents are in general more aggressive, meaning that they dissolve also refractory phases (e.g., Al2O3, ZrO2). On the other hand, the magnitude of the heat signals in the high-temperature calorimetry is smaller than in the acid-solution calorimetry. The sodium molybdate melt is able to tolerate and drive redox reactions, the acids commonly maintain the oxidation state of the ele-ments from the sample because of very low rates of inorganic oxidation of a number of ions in the acids. For the high-temperature calorimetry, the samples
Tab. 2. An example of a thermochemical cycle for ferric sulfates with acid-solution
calorimetry, based on γ-FeOOH and α-MgSO4 as the reference phases, with 5 N HCl as the
solvent. Thermochemical cycle for butlerite, Fe(SO4)(OH)·2H2O, from Majzlan et al. (2017b).
All reactants and products at 298 K. The enthalpies ΔH5 through ΔH9 were experimentally
measured. For details, see Majzlan et al. (2017b).
H2O (l) = H2O (aq) ΔH4
MgO (cr) + 2H+ (aq) = Mg2+ (aq) + H2O (aq) ΔH5
γ-FeOOH·0.162H2O (cr) + 3H+ (aq) = Fe3+ (aq) + 2.162H2O (aq) ΔH6
α-MgSO4 (cr) = Mg2+ (aq) + SO42– (aq) ΔH7
γ-FeOOH·0.162H2O (cr) = γ-FeOOH (cr) + 0.162H2O (l) ΔH8
Fe(SO4)(OH)·2H2O + H+ = Fe3+ (aq) + SO42– (aq) + 3H2O (aq) ΔH9
Mg (cr) + 1/2O2 (g) = MgO (cr) ΔH10 = ΔfHo(MgO)
Fe (cr) + O2 (g) + 1/2H2 (g) = γ-FeOOH (cr) ΔH11 = ΔfHo(γ-FeOOH)
Mg (cr) + S (cr) + 2O2 (g) = α-MgSO4 (cr) ΔH12 = ΔfHo(α-MgSO4)
H2 (g) + 1/2O2 (g) = H2O (l) ΔH13 = ΔfHo(H2O, l)
Fe (cr) + S (cr) + 3.5O2 (g) + 2.5H2 (g) = Fe(SO4)(OH)·2H2O (cr) ΔH14 = ΔfHo(butlerite)
ΔfHo (butlerite) = ΔH14 = 2ΔH4 – ΔH5 + ΔH6 + ΔH7 – ΔH8 – ΔH9 – ΔH10 + ΔH11 + ΔH12 + 2ΔH13
Solution calorimetry on miner als related to acid mine dr ainage – methodology, checks, and balances

174
rich in water or other volatiles (e.g., CO2) must be sufficiently stable to persist during the fall into the calorimeter. Although this process takes less than a second, samples are known to pick up heat in the temperature gradient of the calorimeter; sensitive samples could undergo changes even at such short time scales. The ability to measure the content of volatiles accurately may limit the accuracy of the calorimetric data. Some water-rich samples react violently, for example explode, in the contact with the melt. Amazingly, such reactions produce occasionally data with good precision; of course, the data are completely inaccu-rate. The heat content of H2O, from liquid at room temperature to a gas at 975 K, is 69 kJ·mol–1. On the other hand, the enthalpy of dissolution of H2O in 5 N HCl is –0.54 kJ·mol–1. For heavily hydrated samples, acid-solution calorimetry is obviously a better choice because the enthalpy related to 1 mole of H2O is much smaller than in the high-temperature oxide-melt calorimetry. Possible parasitic reactions must be considered. For example, the reaction of CO2 with H2O (to H2CO3) in an aqueous solvent (e.g., hydrochloric acid) is sluggish and may compromise the accuracy of the data, if unnoticed.
In my calorimetric work, the low-temperature solvent of choice is 5 N HCl. This solvent is capable of dissolving many inorganic oxysalts with Fe and other metals. It is not lethally dangerous as the HF solutions. The downside of this solvent are the fumes which damage the calorimeter during the long-term use. The normality of the acid corresponds to its molarity, meaning that 5 N HCl is 5 M HCl. For calculation of thermodynamic properties, such as enthalpy of dilution, molality is needed. In our case, 5 N HCl corresponds to 5.5735 m HCl which could be also expressed as (HCl + 9.9594H2O) or HCl·9.96H2O. The latter formula will be used in some of the following sections.
6. TYPES OF EXPER IMENTS
There are different types of experiments possible in solution calorimetry. A solution experiment consists of the dissolu-tion of a sample thermally equilibrated with the solvent. For simplicity, this equilibration is usually done in the vessel that holds the calorimetric solvent. That means, however, that the sample must be resistant to the vapor of the solvent or must be protected against it. For the high-temperature oxide-melt calorimetry, the sample must also persist without changes until the experiment commences. This requirement excludes sam-ples that contain volatiles for these measurements but other, seemingly inert phases may also undergo subtle changes. For example, cation ordering in some phases (e.g., feldspar) may change quickly at high temperatures, and the thermodynamic properties measured do not refer to the sample characterized at room temperature. In acid-solution calorimetry, the samples should not undergo rapid changes as a function of humidity or be sensitive to the vapor (fumes) of the acids.
A drop solution experiment consists of dropping the sample through a dropping tube into the solvent (Fig. 1). The measured heat effect is a sum of two enthalpies, namely, the enthalpy of dissolution in the solvent and the enthalpy needed to change the temperature of the sample from the outside temperature (usually
room temperature) to the temperature of the solvent. The second enthalpy change is called the heat content and is relevant only for the high-temperature calorimetry. The room temperature is usually maintained closely to 298.15 K (in our laboratory in Jena at 297.85 K) and no corrections are made for the deviation from the nominal 298.15 K. The obvious advantage of a drop solution experiment is that the sample does not have to endure high temperatures or the action of solvent vapor. A minor dif-ficulty associated with this type of experiment is that the sample must be fairly compact, so that it falls quickly and reaches the solvent with its full mass as measured by a microbalance. The rapid descent through the dropping tube is especially critical for the high-temperature calorimetry where the sample is known to pick up heat in the temperature gradient of the calorimeter. Different types of containers have been tested (see e.g., Nav-rotsky, 1977) but the best container is no container; the sample is pressed with a small die into a pellet, weighed, and dropped.
A transposed temperature drop experiment consists of dropping the pellets into an empty crucible, without a solvent. What is measured is the heat content of the sample between room temperature and calorimeter temperature. This type of experi-ment is used for calibration of the high-temperature calorimeters and rarely for other specific purposes. A reversed transposed temperature drop experiment, meaning dropping hot samples into a cold calorimeter, is used to determine heat contents and heat capacities of samples in the ice calorimeter (e.g., Bouhifd et al., 1999).
7. CALOR IMETRY ON PHASES R ELATED TO ACID MINE DR AINAGE
7.1. The system H2O
Most of the oxides, sulfates, and arsenates related to acid mine drainage are hydrous phases (in our work, the only anhydrous examples were Fe2(SO4)3, Majzlan et al., 2005; and FeAsO4, Majzlan et al., 2012a). Therefore, water is a necessary reference phase whose thermodynamic properties are known well. Our calorimeter, however, is not adapted for the measurement of liquid samples. In addition, the enthalpies of dilution of hydro-chloric acid are small but, fortunately, known well (van Nyus 1943; Parker 1965).
In our earlier work, we have used the value for ΔdilutionH of –0.40 kJ·mol–1. This is the enthalpy of dilution for 5 m HCl. After the kind advise of R. Lemire (oral communication), we have recalculated the concentration of 5 N HCl as 5.5735 m HCl. The enthalpy of dilution for 5.5735 m HCl is –0.54 kJ·mol–1 and this value was used in our later work (starting with Ackermann et al., 2009). Hence, the earlier results are in a need of correction for this small difference.
7.2. The system Fe2O3
Hematite (α-Fe2O3) is an ideal reference phase for ferric oxysalts. It can be easily made, maintained and handled. It is stoichiomet-ric in terms of Fe/O ratio and oxidation state (exclusively Fe3+)
acta geologica slovaca, 9(2), 2017, 171–183
175
and can be fired to high temperatures to remove water. Hematite dissolves rapidly in molten lead borate and sodium molybdate, but not in cold acids.
An internal check for the high-temperature calorimetry is a sum of reactions whose initial and final states are identical. This is a sum of solution, drop solution, and transposed-temperature drop experiments. By definition of a state function, the sum must be 0 kJ·mol–1. Majzlan et al. (2002) performed this check for he-matite and the sodium molybdate solvent. The thermochemical cycle is in Tab. 3. Taking ΔH15 = 96.86±0.45 kJ·mol–1 (Majzlan, unpublished data), ΔH16 = –2.05±0.21 kJ·mol–1 (Navrotsky & Kleppa, 1968), and ΔH17 = 95.63±0.50 kJ·mol–1 (Majzlan et al., 2002), the sum ΔH15 + ΔH16 + ΔH17 = –0.8±0.7 kJ·mol–1. The result shows that the experimental uncertainties slightly underestimate the deviation of the final value from the expected one (0 kJ·mol–1).
The advantage of sodium molybdate is its ability to tolerate redox reactions that drive elements rapidly into their high oxida-tion states. For iron, this means that Fe3+ predominates in the melt and the solvent could be used for the determination of enthalpies of formation of mixed-valence (e.g., magnetite) or ferrous (e.g., wüstite) oxides. It has, indeed, have been used for magnetite (Laberty & Navrotsky, 1998) but their results can be euphemistically termed as flawed.
Lead borate, on the other hand, is sensitive to redox reactions. Phases that tend to oxidize (e.g., magnetite) do so but reduce Pb at the same time. Not only does this parasitic reaction invali-date the calorimetric results, it could also damage the platinum crucibles as metallic lead droplets alloy with platinum at high temperatures. Recently, however, Lilova et al. (2012) found that with a significant flushing and bubbling of gaseous O2 through the solvent, even lead borate melt may be used in calorimetric experiments involving redox reactions.
Hematite dissolves very slowly in cold acids and cannot be therefore used as a reference compounds for acid-solution calo-rimetry performed at room temperature. Another phase must be sought for this purpose. Hematite does dissolve well in acids at elevated temperatures (e.g., 70 ºC, Majzlan et al., 2003b) but drop solution experiments at this temperature are not possible because of the fumes of the acids. Hence, only solution experi-ments are possible but they exclude most of the ferric sulfates and arsenates which may decompose already at such temperatures.
7.3. System Fe2O3–H2O
Thermodynamics of the phases in this system was summarized by Navrotsky et al. (2008), including the effect of surface area on the measured properties. The available data were critically reviewed by Lemire et al. (2013). For the purposes of this publica-tion, only goethite (α-FeOOH) and lepidocrocite (γ-FeOOH) are
of interest. The other phases in this system are poorly crystalline, difficult to characterize fully, with great variations in their water content and concentration and nature of defects.
Thermodynamic properties of goethite and lepidocrocite were investigated by Majzlan et al. (2003a,b) who also discussed earlier results. They measured ΔfHo of goethite by high-temperature transposed temperature drop and acid-solution calorimetry as –559.5±1.1 and –560.7±1.2 kJ·mol–1, respectively. The reference phase in both cases was hematite; note that the acid-solution calorimetry was performed in a specially modified calorimeter at T = 343 K. Because acid-solution calorimetry is much less sensi-tive to water content (see above), for phases with variable water content, this method is deemed to be more reliable, leading to preference for the datum of –560.7±1.2 kJ·mol–1. Mathematical programming analysis (MAP) gave –561.9 kJ·mol–1 and –561.4 kJ·mol–1 for the brackets of Baneyeva & Bendeliani (1973) and Voigt & Will (1981), respectively. MAP failed to consider the magnetic transition in goethite. Cautiously, the inaccuracy of the enthalpy of values for goethite could be judged to be 1-2 kJ·mol–1. Lemire et al. (2013) have chosen –560.46±1.99 kJ·mol–1 as the best value, considering all available literature data.
Of the simple ferric oxyhydroxides that dissolve rapidly in acids at room temperature, lepidocrocite is the most crystal-line phase. Therefore, I have decided to use this phase as the reference phase for acid-solution calorimetry with 5 N HCl. As will be discussed below, this choice produced accurate data for a number of ferric oxysalts. In our first study (Majzlan et al., 2004a), we measured ΔdissH of lepidocrocite in 5 N HCl as –46.54±0.23 kJ·mol–1. Later (Majzlan et al., 2004b), the value was re-measured as –46.15±0.23 kJ·mol–1. We have used this datum in several investigations until the move of the calorimeter to Jena where the value was measured again as –46.62±0.13 kJ·mol–1 (for the first time used in Majzlan et al., 2012a). The reasons for these variations are not clear but they show that the precision of the calorimetric data is slightly worse than the statistical un-certainties calculated from the repeated experiments. Lemire et al. (2013) have chosen –549.0±2.0 kJ·mol–1 as the best value for enthalpy of formation of lepidocrocite, considering all available literature data. In our work, we have used consistently the value of –549.4±1.4 kJ·mol–1 (from Majzlan et al., 2003b), safely within the error bars of the best value of Lemire et al. (2013).
Enthalpy of water desorption from the surface of lepidocrocite was determined experimentally by Majzlan et al. (2007). Prior to this study, we assumed that water desorbs from the surface of lepidocrocite as bulk water. The correction associated with water desorption is 1.41±0.17 kJ·mol–1 (Majzlan et al., 2012a). This correction should be applied also to our earlier data.
Ferrihydrite dissolves even faster than lepidocrocite but its poor crystallinity, variable water content, and general difficulty for a reproducible product from a synthesis dismiss this material as a reference phase for calorimetry. Using lepidocrocite as a reference phase for the thermochemical properties of ferrihy-drite (Majzlan et al., 2004a), data have been obtained that are in agreement with later solubility measurements (Stefánsson, 2007) and advanced data treatment (Hiemstra, 2015). Our work on iron oxides was concluded by a summary and critical review of the data by Navrotsky et al. (2008).
Tab. 3. Thermochemical cycle for hematite in sodium molybdate
α-Fe2O3 (cr, 298 K) = α-Fe2O3 (cr, 975 K) (ΔH15 = H975–H298)
α-Fe2O3 (cr, 975 K) = Fe2O3 (sol, 975 K) (ΔH16 = ΔHsol)
Fe2O3 (sol, 975 K) = α-Fe2O3 (cr, 298 K) (ΔH17 = –ΔHdsol)
Solution calorimetry on miner als related to acid mine dr ainage – methodology, checks, and balances
176
7.4. Calorimetry on sulfates
For acid-solution and high-temperature oxide-melt calorimetry, the determination of enthalpies of formation of sulfates is pos-sible but not without problems. A suitable reference phase or phases must be chosen, synthesized, characterized, and mea-sured. Such phase should be a sulfate; because of the ability and tolerance of sodium molybdate with respect to redox reactions, one could consider also a sulfide but this would be an unneces-sary complication of the matters.
The difficulty with the sulfates is that unless one uses sulfate of the same cation as the samples (in my work, mostly Fe3+), the thermochemical cycle must include another phase to compen-sate for that cation. In a simple example, if the chosen reference phase were K2SO4, a sulfate that could be perfect for calorimetry because of the ease of preparation, handling, inertness, and rapid dissolution, the thermochemical cycle would have to include K2O or KOH to compensate for the potassium in K2SO4. It will be shown later in this paper that KCl is a viable choice but was not used for reasons outlined in the later section. The need to work with oxides or hydroxides of alkali metals excludes the alkali sulfates as reasonable reference phases for acid-solution calorimetry.
For the high-temperature calorimetry, several sulfates were tested as possible reference phases (Majzlan et al., 2002). Sodium molybdate was thoroughly checked for the complete retention of sulfate by chemical analyses and on-line infrared spectros-copy and found to be usable for this type of calorimetry. Yet, the calorimetry on CaSO4, BaSO4, SrSO4, and PbSO4 gave scattered data for the ΔdsolH(SO3) (Tab. 4).
The scatter reflects the possible problems inherent to that study (sample preparation and quality) and the accuracy of the data in the literature. Among the four anhydrous sulfates, the best known enthalpy-of-formation value is probably that for CaSO4, because the pair gypsum-anhydrite is of broader geo-logical interest and received more research attention. Calcium from CaSO4 can be compensated by CaO in the thermodynamic cycle, a phase that can be prepared and maintained dry with due attention. Recently, Majzlan et al. (2017b) obtained data for Fe(OH)SO4 with this method (cycle in Tab. 5). These data were found to produce reasonable phase topologies in different types of phase diagrams (Majzlan et al., 2017b).
The same enigma exists for the acid-solution calorimetry. Here, one could use H2SO4 solutions as a reference phase but it would require special modifications to accommodate the hygroscopic, etching liquid in the calorimeter. Drop solution experiments with such solutions would not be possible.
After long deliberation, I decided to use α-MgSO4 as the refer-ence sulfate phase. It can be made pure and magnesium can be compensated by MgO. Both phases dissolve very quickly in HCl. On the other hand, they are both hygroscopic, MgSO4 much more than MgO. In our first study using MgSO4, the sample was prepared in a special apparatus that allowed its transfer into a glove box without any contact with the ambient atmosphere (Majzlan et al., 2004a). In that work, ΔdissH for α-MgSO4 was measured as –51.84±0.99 kJ·mol–1. A re-measurement of that value, already in the following work (Majzlan et al., 2004b), gave
–53.50±0.48 kJ·mol–1, and we have adopted this value as the more precise and presumably the more accurate one.
One could attempt to use Fe2(SO4)3 as a reference phase for the ferric sulfates. This phase, however, has a bizarre combination of properties, being both hygroscopic and dissolving in aqueous media extremely slowly. We have measured the enthalpy of for-mation of this phase (Majzlan et al., 2005), using γ-FeOOH and α-MgSO4 as the reference phases, with the result (–2585.2±4.9 kJ·mol–1) being fairly close to the –2582.0±2.9 kJ·mol–1, measured and corrected by Barany & Adami (1965) and DeKock (1982), respectively. Hence, further studies on ferric sulfates used always γ-FeOOH and α-MgSO4 as the reference phases, such as in the example in Tab. 2.
There are several pieces of evidence that document, with a different degree of certainty, that the ΔdissH values for MgO and α-MgSO4 are accurate. In a study of MgSO4·nH2O phases
Tab. 4. Enthalpy of drop solution of SO3 (ΔHdsol(SO3)) (kJ·mol–1) calculated
from calorimetric data for individual sulfate-carbonate and sulfate-oxide
pairs (for details, see Majzlan et al., 2002). All experiments done by high-
temperature oxide-melt calorimetry in sodium molybdate. Three different
barite samples were used in these experiments.
Sulfate-carbonate or sulfate-oxide ΔHdsol(SO3)
anglesite-litharge –207.0±2.9
anhydrite-lime –203.7±4.5
arcanite-K2CO3 –203.7±4.0
celestine-strontianite –204.1±4.9
barite-witherite –211.8±4.1
barite-witherite –212.1±4.1
barite-witherite –198.2±4.1
Tab. 5. An example of a thermochemical cycle for ferric sulfates with high-
temperature oxide-melt calorimetry, based on α-Fe2O3 and CaSO4 as the
reference phases, with sodium molybdate as the solvent. Thermochemical
cycle for Fe(SO4)(OH) (Majzlan et al., 2017b). Temperatures of reactants and
products in K. The enthalpies ΔH18 and ΔH20, ΔH21, and ΔH22 were experi-
mentally measured. For details, see Majzlan et al. (2017b).
α-Fe2O3 (cr,298) = Fe2O3 (sol,975) ΔH18
H2O (l,298) = H2O (g,975) ΔH19
CaSO4 (cr,298) = CaO (sol,975) + SO3 (sol,975) ΔH20
CaO (cr,298) = CaO (sol, 975) ΔH21
Fe(SO4)(OH) (cr,298) = 0.5Fe2O3 (sol,975) + SO3
(sol,975) + 0.5H2O (g,975)ΔH22
0.5O2 (g,298) + H2 (g,298) = H2O (l,298) ΔH23 = ΔfHo(H2O, l)
Ca (cr,298) + 0.5O2 (g,298) = CaO (cr,298) ΔH24 = ΔfHo(CaO)
Ca (cr,298) + S (cr,298) + 2O2 (g,298) = CaSO4 (cr,298) ΔH25 = ΔfHo(CaSO4)
2Fe (cr,298) + 1.5O2 (g,298) = Fe2O3 (hematite, 298) ΔH26 = ΔfHo(α-Fe2O3)
Fe (cr,298) + S (cr,298) + 0.5H2 (g,298) + 2.5O2 (g,298)
= Fe(SO4)(OH) (cr,298)ΔH27 = ΔfHo(Fe(SO4)(OH))
ΔfHo(Fe(SO4)(OH)) = ΔH27 = 0.5ΔH18 + 0.5ΔH19 + ΔH20 – ΔH21 – ΔH22 + 0.5ΔH23 – ΔH24 + ΔH25 – 0.5ΔH26
acta geologica slovaca, 9(2), 2017, 171–183
177
(Grevel & Majzlan, 2009), we used α-MgSO4 as the reference phase. Our calorimetric data for MgSO4·7H2O (epsomite), the best known phase in the system MgSO4–H2O, deviated only 1.0 kJ·mol–1 from the value optimized by mathematical program-ming analysis based on several sets of known equilibrium data. Furthermore, the calorimetric datum falls within a fairly tight cluster of ΔfHo values for epsomite from Wagman et al. (1982), DeKock (1986), and Palaban & Pitzer (1987).
A thermochemical cycle involving CaO, MgO, CaSO4, MgSO4 was constructed (Majzlan et al., 2017b) to further test the va-lidity of the ΔdissH for α-MgSO4 by calculating enthalpies of a simple reaction
CaO + α-MgSO4 = MgO + CaSO4
Table 6 shows the measured and tabulated values of the partici-pating phases. From these, we obtain ΔRHexperimental = 110.4±1.8 kJ·mol–1 and ΔRHcalculated = 112.1±4.3 kJ·mol–1 for the formation enthalpies from Robie & Hemingway (1995). The difference of 1.7 kJ·mol–1 (Robie & Hemingway, 1995 versus our data) is not excellent but satisfactory, even though the results from the measured and tabulated data overlap within their uncertainties.
Another possibility to test the ΔdissH value for α-MgSO4 is a thermochemical cycle for the reaction
2HCl·9.96H2O + K2SO4 + MgO = 20.92H2O + α-MgSO4 + 2KCl
Such cycle was constructed by Majzlan (2011) by measure-ments of the enthalpies of dissolution for the individual phases in 5 N HCl. Using the ΔdissH(MgSO4) of –53.50±0.48 kJ·mol–1 (note that in that paper, the ‘old’ value of –51.84 kJ·mol–1 was used) and the ΔdissH(K2SO4) of 37.39±0.16 kJ·mol–1, the resulting ΔRH is –83.17±0.81 kJ·mol–1. This value is in a fair agreement with ΔRH = –85.66±3.00 kJ·mol–1 calculated from the published enthalpies of formation for the phases in this reaction (Tab. 7). The difference of 2.5 kJ·mol–1 is not satisfactory but the source of the discrepancy is not obvious.
7.5. System CuO
For the measurement of thermodynamic properties of cupric phases relevant to acid mine drainage, a suitable reference phase must be also defined. In our work, this is CuO, a simple oxide that can be handled and measured. This phase dissolves easily in acids (e.g., hydrochloric acid) as well as in the high-temperature oxide-melt solvents.
A thermochemical cycle designed to test the accuracy of the calorimetric data for CuO can be constructed, using MgO and α-MgSO4 described in the previous section. The ΔdissH data for the cupric phases were taken from Majzlan et al. (2015a). The reaction of interest here is
5H2O + α-MgSO4 + CuO = CuSO4·5H2O + MgO
with the corresponding data summarized in Tab. 8. The ΔRH for this reaction, calculated from the experimental data, is –7.75±0.81 kJ·mol–1, in a very good agreement to the ΔRH value
calculated from tabulated enthalpies of formation of –7.0±4.0 kJ·mol–1.
Recently, we have derived thermodynamic data sets for copper sulfates, arsenates, and phosphates (Zittlau et al., 2013; Majzlan et al., 2015a; Majzlan et al., 2017a) that reproduce the previously reported solubility products well. This, even though only cir-cumstantial evidence, hints also at the good accuracy of the calorimetric data for the reference compound CuO.
7.6. Systems containing alkali metals Na and K
For oxysalts with potassium or sodium, the use of additional phases as references is necessary. This was the case for the mea-surements of enthalpies of formation of K-Cu and Na-Cu sulfates
Tab. 6. Enthalpies of dissolution (ΔdissH) in 5 N HCl and enthalpies of
formation (ΔfHo) for Ca and Mg oxides and sulfates. All values in kJ·mol–1,
all reactants and products at 298 K. All dissolution enthalpies measured in
our laboratory. For references and details, see text.
ΔdissH ΔfHo
CaO –195.86±1.64 –635.1±0.9 (Robie & Hemingway, 1995)
CaSO4 10.76±0.21 –1434.4±4.2 (Robie & Hemingway, 1995)
MgO –149.69±0.60 –601.6±0.3 (Robie & Hemingway, 1995)
α-MgSO4 –53.50±0.48 –1288.8±0.5 (DeKock, 1986)
Tab. 7. Enthalpies of dissolution (ΔdissH) in 5 N HCl (=HCl·9.96H2O) and
enthalpies of formation (ΔfHo) for selected phases. All values in kJ·mol–1,
all reactants and products at 298 K. The dissolution enthalpies, unless
marked otherwise, were measured in our laboratory. For references and
details, see text.
ΔdissH ΔfHo
HCl·9.96H2O 0a –3007.9±1.0 (see Majzlan, 2011)
K2SO4 37.39±0.19 –1437.7±0.5 (Robie & Hemingway, 1995)
MgO –149.69±0.60 –601.6±0.3 (Robie & Hemingway, 1995)
H2O –0.54b –285.8±0.1 (Robie & Hemingway, 1995)
α-MgSO4 –53.50±0.48 –1288.8±0.5 (DeKock, 1986)
KCl 17.69±0.06 –436.5±0.2 (Robie & Hemingway, 1995)a zero by definitionb calculated from Parker (1965)
Tab. 8. Enthalpies of dissolution (ΔdissH) in 5 N HCl and enthalpies of forma-
tion (ΔfHo) for selected phases. All values in kJ·mol–1, all reactants and
products at 298 K. The dissolution enthalpies, unless marked otherwise,
were measured in our laboratory. For references and details, see text.
ΔdissH ΔfHo
MgO –149.69±0.60 –601.6±0.3 (Robie & Hemingway, 1995)
α-MgSO4 –53.50±0.48 –1288.8±0.5 (DeKock, 1986)
CuO –51.53±0.16 –156.1±2.0 (Robie & Hemingway, 1995)
CuSO4·5H2O 49.71±0.19 –2279.5±3.4 (Grevel & Majzlan, 2011)
H2O –0.54a –285.8±0.1 (Robie & Hemingway, 1995)a calculated from Parker (1965)
Solution calorimetry on miner als related to acid mine dr ainage – methodology, checks, and balances
178
(Majzlan et al., 2015a). At the moment, we are contemplating measurements of thermodynamic properties of the minerals of the voltaite group and of the jarosite group where the alkali cations are also present.
Thénardite (Na2SO4) and arcanite (K2SO4) dissolve easily in water or HCl. The tendency of thénardite to hydrate, however, may introduce a possible source of systematic error for Na-con-taining oxysalts. To eliminate this issue, we have constructed a thermochemical cycle involving Na2SO4, K2SO4, NaCl, and KCl (Tab. 9) for the reaction
Na2SO4 + 2KCl = K2SO4 + 2NaCl
The reaction enthalpy (ΔRH) calculated from available ther-modynamic data is 0.50±0.78 kJ·mol–1 (Robie & Hemingway, 1995) and agrees well with the experimentally measured dis-solution enthalpy of 0.33±0.27 kJ·mol–1.
7.7. Systems containing arsenic
Arsenic is a central element to many investigations on acid mine drainage. The element is toxic and well known to public, there-fore attracting attention and funding. Thermodynamic data on the compounds of arsenic are needed to model the mobility of arsenic in the environment. Arsenic occurs in nature in the reduced, intermediate (+3) or oxidized (+5) form. All three forms are represented in phases relevant to acid mine drainage and, therefore, all of them need to be addressed by calorimetry.
For high-temperature calorimetry, there were only a few stud-ies on arsenical compounds. Forray et al. (2014) measured the ΔdsolH of both As2O3 and As2O5. Both phases were handled under argon in a glove-box and their purity was meticulously tested by X-ray diffraction. Using an appropriate thermochemical cycle, they have shown that the ΔdsolH values are internally consistent. This means that the ΔfHo of As2O5, calculated from the data for As2O3, agrees well with the previously published ΔfHo values for this phase. They also tested the gas escaping from the calorimeter for the presence of arsenic, although the sensitivity of this method for such purposes could be questioned. Using these and other data, Forray et al. (2014) determined the enthalpies of formation of a suite of Pb-Zn-Cu-As jarosite phases.
This study established that calorimetry on arsenical com-pounds is possible, in principle, but left also questions open.
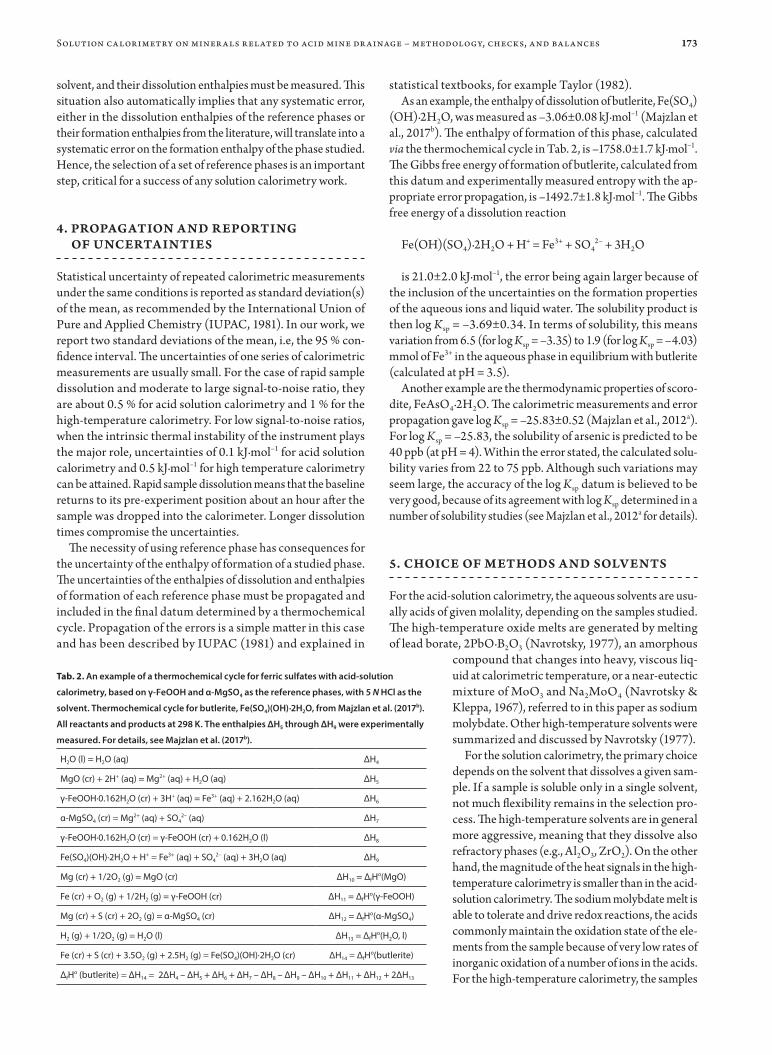
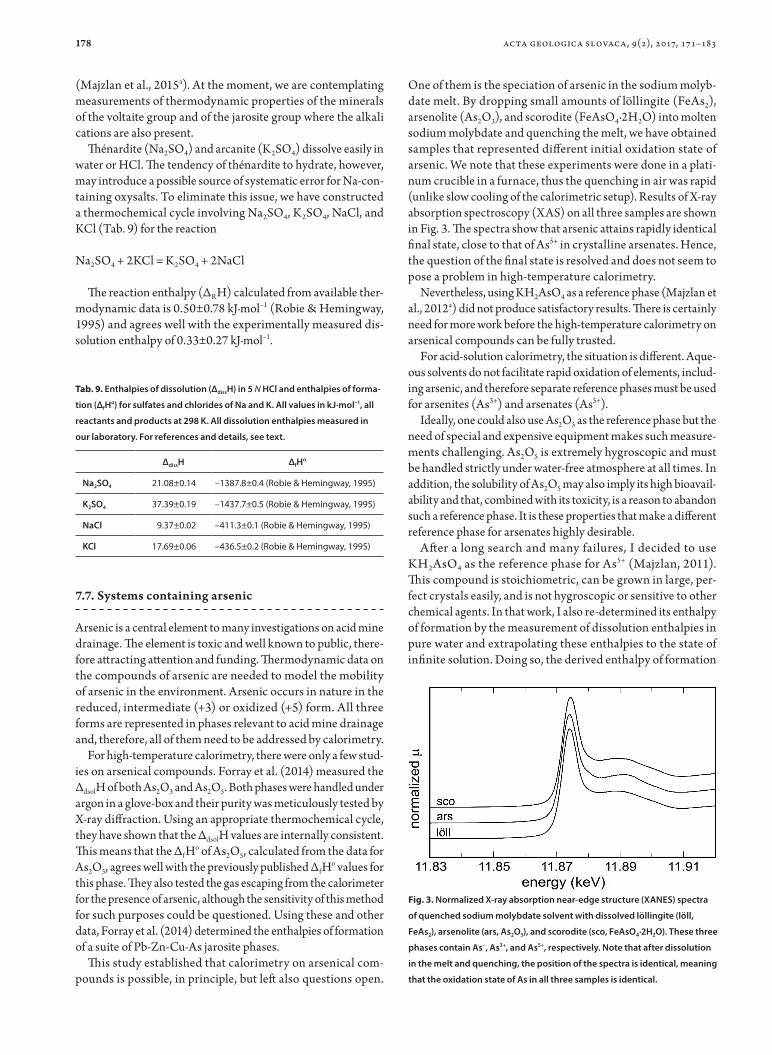
One of them is the speciation of arsenic in the sodium molyb-date melt. By dropping small amounts of löllingite (FeAs2), arsenolite (As2O3), and scorodite (FeAsO4·2H2O) into molten sodium molybdate and quenching the melt, we have obtained samples that represented different initial oxidation state of arsenic. We note that these experiments were done in a plati-num crucible in a furnace, thus the quenching in air was rapid (unlike slow cooling of the calorimetric setup). Results of X-ray absorption spectroscopy (XAS) on all three samples are shown in Fig. 3. The spectra show that arsenic attains rapidly identical final state, close to that of As5+ in crystalline arsenates. Hence, the question of the final state is resolved and does not seem to pose a problem in high-temperature calorimetry.
Nevertheless, using KH2AsO4 as a reference phase (Majzlan et al., 2012a) did not produce satisfactory results. There is certainly need for more work before the high-temperature calorimetry on arsenical compounds can be fully trusted.
For acid-solution calorimetry, the situation is different. Aque-ous solvents do not facilitate rapid oxidation of elements, includ-ing arsenic, and therefore separate reference phases must be used for arsenites (As3+) and arsenates (As5+).
Ideally, one could also use As2O5 as the reference phase but the need of special and expensive equipment makes such measure-ments challenging. As2O5 is extremely hygroscopic and must be handled strictly under water-free atmosphere at all times. In addition, the solubility of As2O5 may also imply its high bioavail-ability and that, combined with its toxicity, is a reason to abandon such a reference phase. It is these properties that make a different reference phase for arsenates highly desirable.
After a long search and many failures, I decided to use KH2AsO4 as the reference phase for As5+ (Majzlan, 2011). This compound is stoichiometric, can be grown in large, per-fect crystals easily, and is not hygroscopic or sensitive to other chemical agents. In that work, I also re-determined its enthalpy of formation by the measurement of dissolution enthalpies in pure water and extrapolating these enthalpies to the state of infinite solution. Doing so, the derived enthalpy of formation
Tab. 9. Enthalpies of dissolution (ΔdissH) in 5 N HCl and enthalpies of forma-
tion (ΔfHo) for sulfates and chlorides of Na and K. All values in kJ·mol–1, all
reactants and products at 298 K. All dissolution enthalpies measured in
our laboratory. For references and details, see text.
ΔdissH ΔfHo
Na2SO4 21.08±0.14 –1387.8±0.4 (Robie & Hemingway, 1995)
K2SO4 37.39±0.19 –1437.7±0.5 (Robie & Hemingway, 1995)
NaCl 9.37±0.02 –411.3±0.1 (Robie & Hemingway, 1995)
KCl 17.69±0.06 –436.5±0.2 (Robie & Hemingway, 1995)
Fig. 3. Normalized X-ray absorption near-edge structure (XANES) spectra
of quenched sodium molybdate solvent with dissolved löllingite (löll,
FeAs2), arsenolite (ars, As2O3), and scorodite (sco, FeAsO4·2H2O). These three
phases contain As–, As3+, and As5+, respectively. Note that after dissolution
in the melt and quenching, the position of the spectra is identical, meaning
that the oxidation state of As in all three samples is identical.
acta geologica slovaca, 9(2), 2017, 171–183
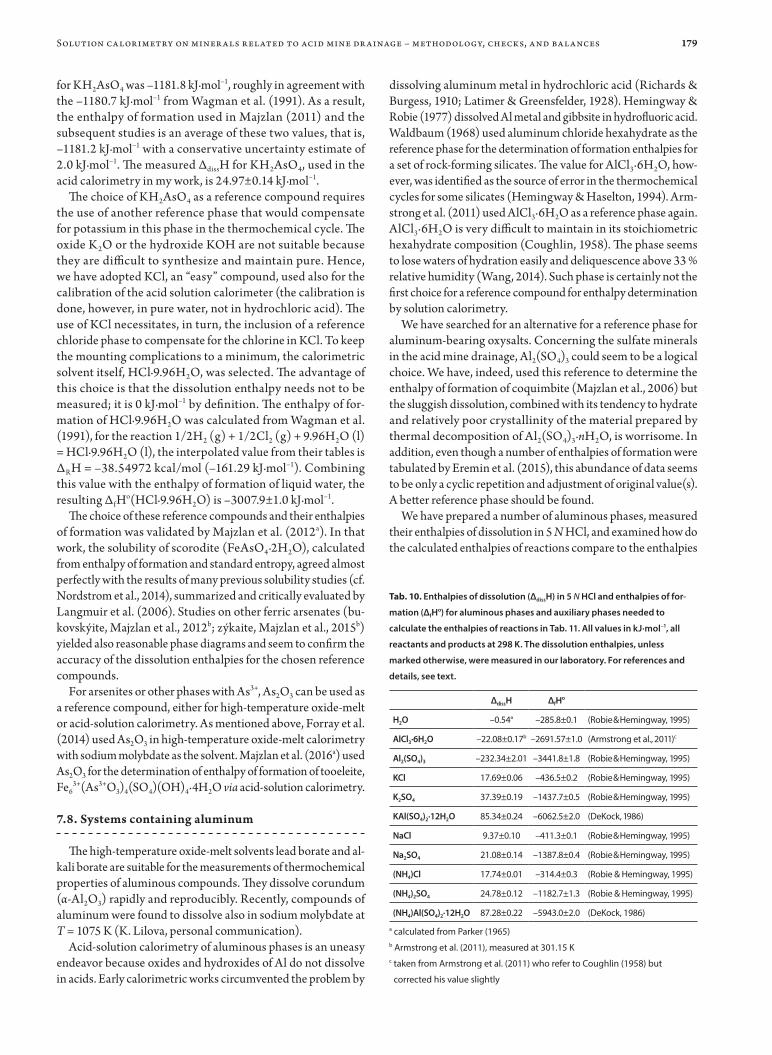
179
for KH2AsO4 was –1181.8 kJ·mol–1, roughly in agreement with the –1180.7 kJ·mol–1 from Wagman et al. (1991). As a result, the enthalpy of formation used in Majzlan (2011) and the subsequent studies is an average of these two values, that is, –1181.2 kJ·mol–1 with a conservative uncertainty estimate of 2.0 kJ·mol–1. The measured ΔdissH for KH2AsO4, used in the acid calorimetry in my work, is 24.97±0.14 kJ·mol–1.
The choice of KH2AsO4 as a reference compound requires the use of another reference phase that would compensate for potassium in this phase in the thermochemical cycle. The oxide K2O or the hydroxide KOH are not suitable because they are difficult to synthesize and maintain pure. Hence, we have adopted KCl, an “easy” compound, used also for the calibration of the acid solution calorimeter (the calibration is done, however, in pure water, not in hydrochloric acid). The use of KCl necessitates, in turn, the inclusion of a reference chloride phase to compensate for the chlorine in KCl. To keep the mounting complications to a minimum, the calorimetric solvent itself, HCl·9.96H2O, was selected. The advantage of this choice is that the dissolution enthalpy needs not to be measured; it is 0 kJ·mol–1 by definition. The enthalpy of for-mation of HCl·9.96H2O was calculated from Wagman et al. (1991), for the reaction 1/2H2 (g) + 1/2Cl2 (g) + 9.96H2O (l) = HCl·9.96H2O (l), the interpolated value from their tables is ΔRH = –38.54972 kcal/mol (–161.29 kJ·mol–1). Combining this value with the enthalpy of formation of liquid water, the resulting ΔfHo(HCl·9.96H2O) is –3007.9±1.0 kJ·mol–1.
The choice of these reference compounds and their enthalpies of formation was validated by Majzlan et al. (2012a). In that work, the solubility of scorodite (FeAsO4·2H2O), calculated from enthalpy of formation and standard entropy, agreed almost perfectly with the results of many previous solubility studies (cf. Nordstrom et al., 2014), summarized and critically evaluated by Langmuir et al. (2006). Studies on other ferric arsenates (bu-kovskýite, Majzlan et al., 2012b; zýkaite, Majzlan et al., 2015b) yielded also reasonable phase diagrams and seem to confirm the accuracy of the dissolution enthalpies for the chosen reference compounds.
For arsenites or other phases with As3+, As2O3 can be used as a reference compound, either for high-temperature oxide-melt or acid-solution calorimetry. As mentioned above, Forray et al. (2014) used As2O3 in high-temperature oxide-melt calorimetry with sodium molybdate as the solvent. Majzlan et al. (2016a) used As2O3 for the determination of enthalpy of formation of tooeleite, Fe6
3+(As3+O3)4(SO4)(OH)4·4H2O via acid-solution calorimetry.
7.8. Systems containing aluminum
The high-temperature oxide-melt solvents lead borate and al-kali borate are suitable for the measurements of thermochemical properties of aluminous compounds. They dissolve corundum (α-Al2O3) rapidly and reproducibly. Recently, compounds of aluminum were found to dissolve also in sodium molybdate at T = 1075 K (K. Lilova, personal communication).
Acid-solution calorimetry of aluminous phases is an uneasy endeavor because oxides and hydroxides of Al do not dissolve in acids. Early calorimetric works circumvented the problem by
dissolving aluminum metal in hydrochloric acid (Richards & Burgess, 1910; Latimer & Greensfelder, 1928). Hemingway & Robie (1977) dissolved Al metal and gibbsite in hydrofluoric acid. Waldbaum (1968) used aluminum chloride hexahydrate as the reference phase for the determination of formation enthalpies for a set of rock-forming silicates. The value for AlCl3·6H2O, how-ever, was identified as the source of error in the thermochemical cycles for some silicates (Hemingway & Haselton, 1994). Arm-strong et al. (2011) used AlCl3·6H2O as a reference phase again. AlCl3·6H2O is very difficult to maintain in its stoichiometric hexahydrate composition (Coughlin, 1958). The phase seems to lose waters of hydration easily and deliquescence above 33 % relative humidity (Wang, 2014). Such phase is certainly not the first choice for a reference compound for enthalpy determination by solution calorimetry.
We have searched for an alternative for a reference phase for aluminum-bearing oxysalts. Concerning the sulfate minerals in the acid mine drainage, Al2(SO4)3 could seem to be a logical choice. We have, indeed, used this reference to determine the enthalpy of formation of coquimbite (Majzlan et al., 2006) but the sluggish dissolution, combined with its tendency to hydrate and relatively poor crystallinity of the material prepared by thermal decomposition of Al2(SO4)3·nH2O, is worrisome. In addition, even though a number of enthalpies of formation were tabulated by Eremin et al. (2015), this abundance of data seems to be only a cyclic repetition and adjustment of original value(s). A better reference phase should be found.
We have prepared a number of aluminous phases, measured their enthalpies of dissolution in 5 N HCl, and examined how do the calculated enthalpies of reactions compare to the enthalpies
Tab. 10. Enthalpies of dissolution (ΔdissH) in 5 N HCl and enthalpies of for-
mation (ΔfHo) for aluminous phases and auxiliary phases needed to
calculate the enthalpies of reactions in Tab. 11. All values in kJ·mol–1, all
reactants and products at 298 K. The dissolution enthalpies, unless
marked otherwise, were measured in our laboratory. For references and
details, see text.
ΔdissH ΔfHo
H2O –0.54a –285.8±0.1 (Robie & Hemingway, 1995)
AlCl3·6H2O –22.08±0.17b –2691.57±1.0 (Armstrong et al., 2011)c
Al2(SO4)3 –232.34±2.01 –3441.8±1.8 (Robie & Hemingway, 1995)
KCl 17.69±0.06 –436.5±0.2 (Robie & Hemingway, 1995)
K2SO4 37.39±0.19 –1437.7±0.5 (Robie & Hemingway, 1995)
KAl(SO4)2·12H2O 85.34±0.24 –6062.5±2.0 (DeKock, 1986)
NaCl 9.37±0.10 –411.3±0.1 (Robie & Hemingway, 1995)
Na2SO4 21.08±0.14 –1387.8±0.4 (Robie & Hemingway, 1995)
(NH4)Cl 17.74±0.01 –314.4±0.3 (Robie & Hemingway, 1995)
(NH4)2SO4 24.78±0.12 –1182.7±1.3 (Robie & Hemingway, 1995)
(NH4)Al(SO4)2·12H2O 87.28±0.22 –5943.0±2.0 (DeKock, 1986)
a calculated from Parker (1965)b Armstrong et al. (2011), measured at 301.15 Kc taken from Armstrong et al. (2011) who refer to Coughlin (1958) but
corrected his value slightly
Solution calorimetry on miner als related to acid mine dr ainage – methodology, checks, and balances
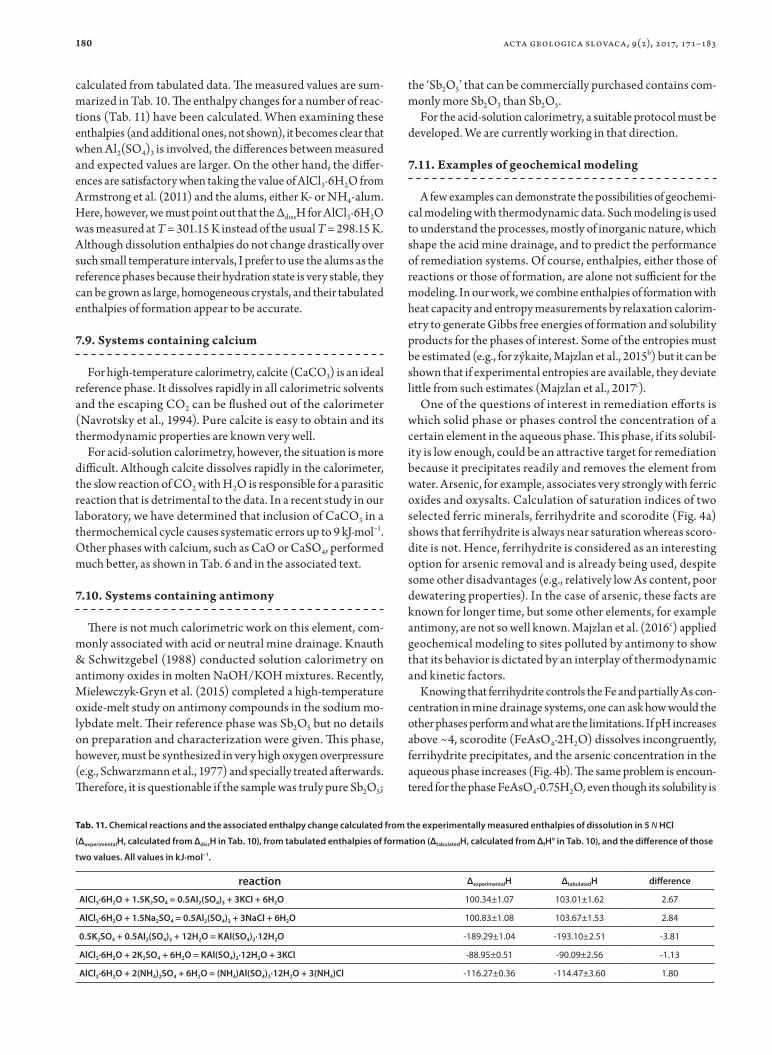
180
calculated from tabulated data. The measured values are sum-marized in Tab. 10. The enthalpy changes for a number of reac-tions (Tab. 11) have been calculated. When examining these enthalpies (and additional ones, not shown), it becomes clear that when Al2(SO4)3 is involved, the differences between measured and expected values are larger. On the other hand, the differ-ences are satisfactory when taking the value of AlCl3·6H2O from Armstrong et al. (2011) and the alums, either K- or NH4-alum. Here, however, we must point out that the ΔdissH for AlCl3·6H2O was measured at T = 301.15 K instead of the usual T = 298.15 K. Although dissolution enthalpies do not change drastically over such small temperature intervals, I prefer to use the alums as the reference phases because their hydration state is very stable, they can be grown as large, homogeneous crystals, and their tabulated enthalpies of formation appear to be accurate.
7.9. Systems containing calcium
For high-temperature calorimetry, calcite (CaCO3) is an ideal reference phase. It dissolves rapidly in all calorimetric solvents and the escaping CO2 can be flushed out of the calorimeter (Navrotsky et al., 1994). Pure calcite is easy to obtain and its thermodynamic properties are known very well.
For acid-solution calorimetry, however, the situation is more difficult. Although calcite dissolves rapidly in the calorimeter, the slow reaction of CO2 with H2O is responsible for a parasitic reaction that is detrimental to the data. In a recent study in our laboratory, we have determined that inclusion of CaCO3 in a thermochemical cycle causes systematic errors up to 9 kJ·mol–1. Other phases with calcium, such as CaO or CaSO4, performed much better, as shown in Tab. 6 and in the associated text.
7.10. Systems containing antimony
There is not much calorimetric work on this element, com-monly associated with acid or neutral mine drainage. Knauth & Schwitzgebel (1988) conducted solution calorimetry on antimony oxides in molten NaOH/KOH mixtures. Recently, Mielewczyk-Gryn et al. (2015) completed a high-temperature oxide-melt study on antimony compounds in the sodium mo-lybdate melt. Their reference phase was Sb2O5 but no details on preparation and characterization were given. This phase, however, must be synthesized in very high oxygen overpressure (e.g., Schwarzmann et al., 1977) and specially treated afterwards. Therefore, it is questionable if the sample was truly pure Sb2O5;
the ‘Sb2O5’ that can be commercially purchased contains com-monly more Sb2O3 than Sb2O5.
For the acid-solution calorimetry, a suitable protocol must be developed. We are currently working in that direction.
7.11. Examples of geochemical modeling
A few examples can demonstrate the possibilities of geochemi-cal modeling with thermodynamic data. Such modeling is used to understand the processes, mostly of inorganic nature, which shape the acid mine drainage, and to predict the performance of remediation systems. Of course, enthalpies, either those of reactions or those of formation, are alone not sufficient for the modeling. In our work, we combine enthalpies of formation with heat capacity and entropy measurements by relaxation calorim-etry to generate Gibbs free energies of formation and solubility products for the phases of interest. Some of the entropies must be estimated (e.g., for zýkaite, Majzlan et al., 2015b) but it can be shown that if experimental entropies are available, they deviate little from such estimates (Majzlan et al., 2017c).
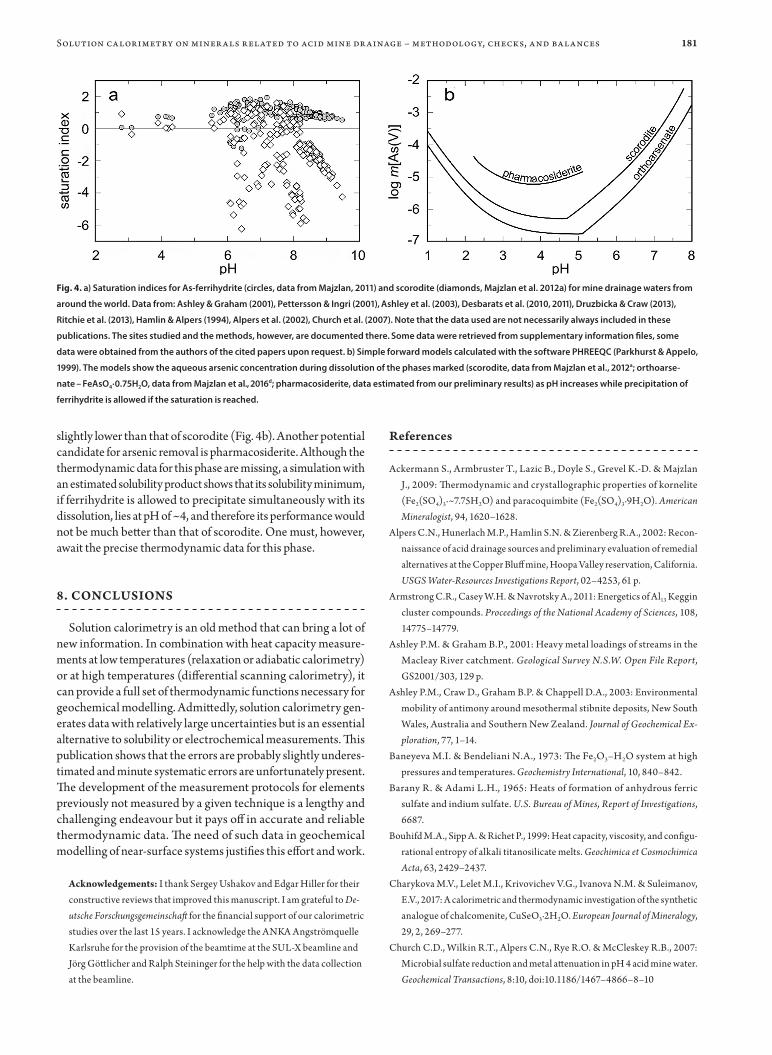
One of the questions of interest in remediation efforts is which solid phase or phases control the concentration of a certain element in the aqueous phase. This phase, if its solubil-ity is low enough, could be an attractive target for remediation because it precipitates readily and removes the element from water. Arsenic, for example, associates very strongly with ferric oxides and oxysalts. Calculation of saturation indices of two selected ferric minerals, ferrihydrite and scorodite (Fig. 4a) shows that ferrihydrite is always near saturation whereas scoro-dite is not. Hence, ferrihydrite is considered as an interesting option for arsenic removal and is already being used, despite some other disadvantages (e.g., relatively low As content, poor dewatering properties). In the case of arsenic, these facts are known for longer time, but some other elements, for example antimony, are not so well known. Majzlan et al. (2016c) applied geochemical modeling to sites polluted by antimony to show that its behavior is dictated by an interplay of thermodynamic and kinetic factors.
Knowing that ferrihydrite controls the Fe and partially As con-centration in mine drainage systems, one can ask how would the other phases perform and what are the limitations. If pH increases above ~4, scorodite (FeAsO4·2H2O) dissolves incongruently, ferrihydrite precipitates, and the arsenic concentration in the aqueous phase increases (Fig. 4b). The same problem is encoun-tered for the phase FeAsO4·0.75H2O, even though its solubility is
Tab. 11. Chemical reactions and the associated enthalpy change calculated from the experimentally measured enthalpies of dissolution in 5 N HCl
(ΔexperimentalH, calculated from ΔdissH in Tab. 10), from tabulated enthalpies of formation (ΔtabulatedH, calculated from ΔfHo in Tab. 10), and the difference of those
two values. All values in kJ·mol–1.
reaction ΔexperimentalH ΔtabulatedH difference
AlCl3·6H2O + 1.5K2SO4 = 0.5Al2(SO4)3 + 3KCl + 6H2O 100.34±1.07 103.01±1.62 2.67
AlCl3·6H2O + 1.5Na2SO4 = 0.5Al2(SO4)3 + 3NaCl + 6H2O 100.83±1.08 103.67±1.53 2.84
0.5K2SO4 + 0.5Al2(SO4)3 + 12H2O = KAl(SO4)2·12H2O -189.29±1.04 -193.10±2.51 -3.81
AlCl3·6H2O + 2K2SO4 + 6H2O = KAl(SO4)2·12H2O + 3KCl -88.95±0.51 -90.09±2.56 -1.13
AlCl3·6H2O + 2(NH4)2SO4 + 6H2O = (NH4)Al(SO4)2·12H2O + 3(NH4)Cl -116.27±0.36 -114.47±3.60 1.80
acta geologica slovaca, 9(2), 2017, 171–183
181
slightly lower than that of scorodite (Fig. 4b). Another potential candidate for arsenic removal is pharmacosiderite. Although the thermodynamic data for this phase are missing, a simulation with an estimated solubility product shows that its solubility minimum, if ferrihydrite is allowed to precipitate simultaneously with its dissolution, lies at pH of ~4, and therefore its performance would not be much better than that of scorodite. One must, however, await the precise thermodynamic data for this phase.
8. CONCLUSIONS
Solution calorimetry is an old method that can bring a lot of new information. In combination with heat capacity measure-ments at low temperatures (relaxation or adiabatic calorimetry) or at high temperatures (differential scanning calorimetry), it can provide a full set of thermodynamic functions necessary for geochemical modelling. Admittedly, solution calorimetry gen-erates data with relatively large uncertainties but is an essential alternative to solubility or electrochemical measurements. This publication shows that the errors are probably slightly underes-timated and minute systematic errors are unfortunately present. The development of the measurement protocols for elements previously not measured by a given technique is a lengthy and challenging endeavour but it pays off in accurate and reliable thermodynamic data. The need of such data in geochemical modelling of near-surface systems justifies this effort and work.
Acknowledgements: I thank Sergey Ushakov and Edgar Hiller for their constructive reviews that improved this manuscript. I am grateful to De-utsche Forschungsgemeinschaft for the financial support of our calorimetric studies over the last 15 years. I acknowledge the ANKA Angströmquelle Karlsruhe for the provision of the beamtime at the SUL-X beamline and Jörg Göttlicher and Ralph Steininger for the help with the data collection at the beamline.
References
Ackermann S., Armbruster T., Lazic B., Doyle S., Grevel K.-D. & Majzlan J., 2009: Thermodynamic and crystallographic properties of kornelite (Fe2(SO4)3·~7.75H2O) and paracoquimbite (Fe2(SO4)3·9H2O). American Mineralogist, 94, 1620–1628.
Alpers C.N., Hunerlach M.P., Hamlin S.N. & Zierenberg R.A., 2002: Recon-naissance of acid drainage sources and preliminary evaluation of remedial alternatives at the Copper Bluff mine, Hoopa Valley reservation, California. USGS Water-Resources Investigations Report, 02–4253, 61 p.
Armstrong C.R., Casey W.H. & Navrotsky A., 2011: Energetics of Al13 Keggin cluster compounds. Proceedings of the National Academy of Sciences, 108, 14775–14779.
Ashley P.M. & Graham B.P., 2001: Heavy metal loadings of streams in the Macleay River catchment. Geological Survey N.S.W. Open File Report, GS2001/303, 129 p.
Ashley P.M., Craw D., Graham B.P. & Chappell D.A., 2003: Environmental mobility of antimony around mesothermal stibnite deposits, New South Wales, Australia and Southern New Zealand. Journal of Geochemical Ex-ploration, 77, 1–14.
Baneyeva M.I. & Bendeliani N.A., 1973: The Fe2O3–H2O system at high pressures and temperatures. Geochemistry International, 10, 840–842.
Barany R. & Adami L.H., 1965: Heats of formation of anhydrous ferric sulfate and indium sulfate. U.S. Bureau of Mines, Report of Investigations, 6687.
Bouhifd M.A., Sipp A. & Richet P., 1999: Heat capacity, viscosity, and configu-rational entropy of alkali titanosilicate melts. Geochimica et Cosmochimica Acta, 63, 2429–2437.
Charykova M.V., Lelet M.I., Krivovichev V.G., Ivanova N.M. & Suleimanov, E.V., 2017: A calorimetric and thermodynamic investigation of the synthetic analogue of chalcomenite, CuSeO3·2H2O. European Journal of Mineralogy, 29, 2, 269–277.
Church C.D., Wilkin R.T., Alpers C.N., Rye R.O. & McCleskey R.B., 2007: Microbial sulfate reduction and metal attenuation in pH 4 acid mine water. Geochemical Transactions, 8:10, doi:10.1186/1467–4866–8–10
Fig. 4. a) Saturation indices for As-ferrihydrite (circles, data from Majzlan, 2011) and scorodite (diamonds, Majzlan et al. 2012a) for mine drainage waters from
around the world. Data from: Ashley & Graham (2001), Pettersson & Ingri (2001), Ashley et al. (2003), Desbarats et al. (2010, 2011), Druzbicka & Craw (2013),
Ritchie et al. (2013), Ham lin & Alpers (1994), Alpers et al. (2002), Church et al. (2007). Note that the data used are not necessarily always included in these
publications. The sites studied and the methods, however, are documented there. Some data were retrieved from supplementary information files, some
data were obtained from the authors of the cited papers upon request. b) Simple forward models calculated with the software PHREEQC (Parkhurst & Appelo,
1999). The models show the aqueous arsenic concentration during dissolution of the phases marked (scorodite, data from Majzlan et al., 2012a; orthoarse-
nate – FeAsO4·0.75H2O, data from Majzlan et al., 2016d; pharmacosiderite, data estimated from our preliminary results) as pH increases while precipitation of
ferrihydrite is allowed if the saturation is reached.
Solution calorimetry on miner als related to acid mine dr ainage – methodology, checks, and balances

182
Coughlin J.P., 1958: Heats of formation and hydration of anhydrous aluminum chloride. Journal of Physical Chemistry, 62, 419–421.
DeKock C.W., 1982: Thermodynamic properties of selected metal sulfates and their hydrates. U.S. Bureau of Mines, Information Circular, 8910, 45 p.
DeKock C.W., 1986: Thermodynamic properties of selected metal sulfates and their hydrates. U.S. Bureau of Mines Information Circular, 9081, 59 p.
Desbarats A.J., Parsons M.B., Percival J.B., Kwong Y.T.J. & Beauchemin S., 2010: Characterization of the flow and chemistry of adit drainage, Bralorne Mine, Bralorne, B.C. Geological Survey of Canada, Open File 6345, Ottawa.
Desbarats A.J., Parsons M.B., Percival J.B., Beauchemin S. & Kwong Y.T.J., 2011: Geochemistry of mine waters draining a low-sulfide, gold-quartz vein deposit, Bralorne, British Columbia. Applied Geochemistry, 26, 1990–2003.
Druzbicka J. & Craw D., 2013: Evolving metalloid signatures in waters draining from a mined orogenic gold deposit, New Zealand. Applied Geochemistry, 31, 251–264.
Eremin O.V., Rusal’ O.S., Bychinskii V.A., Chudnenko K.V., Fomichev S.V. & Krenev V.A., 2015: Calculation of the standard thermodynamic potentials of aluminum sulfates and basic aluminum sulfates. Theoretical Inorganic Chemistry, 60, 1048–1055.
Forray F.L., Smith A.M.L., Navrotsky A., Wright K., Hudson-Edwards K.A. & Dubbin W.E., 2014: Synthesis, characterization and thermochemistry of synthetic Pb–As, Pb–Cu and Pb–Zn jarosites. Geochimica et Cosmochimica Acta, 127, 107–119.
Jessup R.S., 1959: Heat of mixing of polybutadiene and benzene. Journal of Research of the National Bureau of Standards, 62, 1–5.
Grevel K.–D. & Majzlan J., 2009: Internally consistent thermodynamic data for magnesium sulfate hydrates. Geochimica et Cosmochimica Acta, 73, 6805–6815.
Grevel, K.–D. & Majzlan, J., 2011: Thermodynamics of divalent metal sulfates. Chemical Geology, 286, 301–306.
Hamlin S.N. & Alpers C.N., 1994: Hydrogeology and geochemistry of acid mine drainage in ground water in the vicinity of Penn mine and Camanche reservoir, Calaveras county, California: First-year summary. USGS Water-Resources Investigations Report, 94–4040, 50 p.
Hemingway B.S. & Haselton H.T. Jr., 1994: A reevaluation of the calorimetric data for the enthalpy of formation of some K- and Na-bearing silicate mine-rals. U.S. Geological Survey Open-file Report, 94–576, 35 p.
Hemingway B.S. & Robie R.A., 1977: Enthalpies of formation of low albite, NaAlSi3O8, gibbsite, Al(OH)3, and NaAlO2: Revised values for ΔHo
f,298 and ΔGo
f,298 of some aluminosilicate minerals. U.S. Geological Survey Journal of Research, 5, 413–429.
Hiemstra T., 2015: Formation, stability, and solubility of metal oxide nanopar-ticles: Surface entropy, enthalpy, and free energy of ferrihydrite. Geochimica et Cosmochimica Acta, 158, 179–198.
Hovis G.L., Mott A.V. & Roux J., 2009: Thermodynamic, phase equilibrium, and crystal chemical behavior in the nepheline-kalsilite system. American Journal of Science, 309, 397–419.
IUPAC, 1981: A report of IUPAC Commission I.2 on Thermodynamics Assignment and presentation of uncertainties of the numerical results of thermodynamic measurements. Journal of Chemical Thermodynamics, 13, 603–622.
Knauth P. & Schwitzgebel G., 1988: E.M.F. and calorimetric investigations of antimony oxides. Berichte der Bunsengesellschaft für physikalische Chemie, 92, 32–35.
Laberty C. & Navrotsky A., 1998: Energetics of stable and metastable low-temperature iron oxides and oxyhydroxides. Geochimica et Cosmochimica Acta, 62, 2905–2913.
Langmuir D., Mahoney J. & Rowson J., 2006: Solubility products of amorphous ferric arsenate and crystalline scorodite (FeAsO4·2H2O) and their applica-tion to arsenic behavior in buried mine tailings. Geochimica et Cosmochimica Acta, 70, 2942–2956.
Latimer W.M. & Greensfelder B.S., 1928: The heat capacity and entropy of cesium alum from 18º to 300º absolute. The entropy of aluminum ion. The potential of the aluminum electrode from thermal data. American Chemical Society Journal, 50, 2202–2213.
Lemire R.J., Berner U., Palmer D.A., Tochiyama O., Musikas C. & Taylor P., 2013: Chemical Thermodynamics of Iron. Nuclear Energy Agency of OECD, 1082 pp.
Lilova K.I., Xu F., Rosso K.M., Pearce C.I., Kamali S. & Navrotsky A., 2012: Oxide melt solution calorimetry of Fe2+-bearing oxides and application to the magnetite–maghemite (Fe3O4–Fe8/3O4) system. American Mineralogist, 97, 164–175.
Majzlan J., 2011: Thermodynamic stabilization of hydrous ferric oxide by adsorption of phosphate and arsenate. Environmental Science & Technology, 45, 4726–4732.
Majzlan J., Navrotsky A. & Neil J.M., 2002: Energetics of anhydrite, barite, celestine, and anglesite: A high-temperature and differential scanning calo-rimetry study. Geochimica et Cosmochimica Acta, 66, 1839–1850.
Majzlan J., Lang B.E., Stevens R., Navrotsky A., Woodfield B.F. & Boerio-Goates J., 2003a: Thermodynamics of iron oxides: Part I. Standard entropy and heat capacity of goethite (γ-FeOOH), lepidocrocite (γ-FeOOH), and maghemite (γ-Fe2O3). American Mineralogist, 88, 846–854.
Majzlan J., Grevel K.-D. & Navrotsky A., 2003b: Thermodynamics of iron oxides: Part II. Enthalpies of formation and relative stability of goethite (α-FeOOH), lepidocrocite (γ-FeOOH), and maghemite (γ-Fe2O3). American Mineralogist, 88, 855–859.
Majzlan J., Navrotsky A. & Schwertmann U., 2004a: Thermodynamics of iron oxides. Part III. Enthalpies of formation and stability of ferrihydrite (~Fe(OH)3), schwertmannite (~FeO(OH)3/4(SO4)1/8), and ε-Fe2O3. Geo-chimica et Cosmochimica Acta, 68, 1049–1059.
Majzlan J., Stevens R., Boerio-Goates J., Woodfield B.F., Navrotsky A., Craw-ford M., Burns P. & Amos T.G., 2004b: Thermodynamic properties, low-temperature heat capacity anomalies, and single crystal X-ray refinement of hydronium jarosite, (H3O)Fe3(SO4)2(OH)6. Physics and Chemistry of Minerals, 31, 518–531.
Majzlan J., Navrotsky A., Stevens R., Donaldson M., Woodfield B.F. & Boerio-Goates J., 2005: Thermodynamics of monoclinic Fe2(SO4)3. Journal of Chemi-cal Thermodynamics, 37, 802–809.
Majzlan J., Navrotsky A., McCleskey B. & Alpers C.N., 2006: Thermodynamic properties and crystal structure refinement of ferricopiapite, coquimbite, rhomboclase, and Fe3(SO4)2(H2O)5. European Journal of Mineralogy, 18, 175–186.
Majzlan J., Mazeina L. & Navrotsky A., 2007: Enthalpy of water adsorption and surface enthalpy of lepidocrocite (γ-FeOOH). Geochimica et Cosmochimica Acta, 71, 615–623.
Majzlan J., Drahota P., Filippi M., Grevel K.-D., Kahl W.-A., Plášil J., Woodfield B.F. & Boerio-Goates J., 2012a: Thermodynamic properties of scorodite and parascorodite (FeAsO4·2H2O), kaňkite (FeAsO4·3.5H2O), and FeAsO4. Hydrometallurgy, 117–118, 47–56.
Majzlan J., Lazic B., Armbruster T., Johnson M.B., White M.A., Fisher R.A., Plášil J., Loun J., Škoda R. & Novák M., 2012b: Crystal structure, ther-modynamic properties, and paragenesis of bukovskýite, Fe2(AsO4)(SO4)(OH)·9H2O. Journal of Mineralogical and Petrological Sciences (Japan), 107, 133–148.
acta geologica slovaca, 9(2), 2017, 171–183
183
Majzlan J., Zittlau A., Grevel K.–D., Schliesser J., Woodfield B.F., Dachs E., Števko M., Plášil J. & Milovská S., 2015a: Thermodynamic properties and phase equilibria of the secondary copper minerals libethenite, olivenite, pseudomalachite, kröhnkite, cyanochroite, and devilline. Canadian Min-eralogist, 53, 937–960.
Majzlan J., Amoako F.Y., Kindlová H. & Drahota P., 2015b: Thermodynamic properties of zýkaite, a ferric sulfoarsenate. Applied Geochemistry, 61, 294–301.
Majzlan J., Dachs E., Bender Koch C., Bolanz R., Göttlicher J. & Steininger R., 2016a: Thermodynamic properties of tooeleite, Fe6
3+(As3+O3)4(SO4)(OH)4·4H2O. Chemie der Erde – Geochemistry, 76, 419–428.
Majzlan J., Plášil J., Dachs E., Benisek A. & Koch C.B., 2016b: Crystal structure, hydrogen bonding, Mössbauer spectroscopy, and thermodynamic properties of botryogen. Neues Jahrbuch für Mineralogie, 193/2, 147–159.
Majzlan J., Števko M. & Lánczos T., 2016c: Soluble secondary minerals of antimony in Pezinok and Kremnica (Slovakia) and the question of mobility or immobility of antimony in mine waters. Environmental Chemistry, 13, 6, 927–935, doi: 10.1071/EN16013 104.
Majzlan J., Dachs E., Benisek A. & Drahota P., 2016d: Thermodynamic proper-ties of FeAsO4·0.75H2O. Hydrometallurgy, 164, 136–140.
Majzlan J., Števko M., Dachs E., Benisek A., Plášil J. & Sejkora J., 2017a: Thermo-dynamics, stability, crystal structure, and phase relations among euchroite, Cu2(AsO4)(OH) ·3H2O, and related minerals. European Journal of Mineral-ogy, 29, 5–16.
Majzlan J., Dachs E., Benisek A., Plášil J. & Sejkora J., 2017b: Thermodynamics, crystal chemistry and structural complexity of the Fe(SO4)(OH)(H2O)x phases: Fe(SO4)(OH), metahohmannite, butlerite, parabutlerite, amarantite, hohmannite, and fibroferrite. European Journal of Mineralogy, doi: 10.1127/ejm/2017/0029–2677
Majzlan J., Grevel K.–D., Kiefer B., Nielsen U.G., Grube E., Dachs E., Benisek A., White M.A. & Johnson M., 2017c: Thermodynamics and crystal chemistry of rhomboclase, (H5O2)Fe(SO4)2·2H2O, and the phase (H3O)Fe(SO4)2. American Mineralogist, 102, 643–654.
Mielewczyk–Gryn A., Wachowski S., Lilova K.I., Guo X., Gazda M. & Nav-rotsky A., 2015: Influence of antimony substitution on spontaneous strain and thermodynamic stability of lanthanum orthoniobate. Ceramics Inter-national, 41, 2128–2133.
Misra S., Rao G.S. & Singh H.P., 1971: A calorimetric investigation of long-range ordering in the cadmium-mercury system. Acta Metallurgica, 19, 331–336.
Navrotsky A., 1977: Progress and new directions in high temperature calorim-etry. Physics and Chemistry of Minerals, 2, 89–104.
Navrotsky A., 1997: Progress and new directions in high temperature calorim-etry revisited. Physics and Chemistry of Minerals, 24, 222–241.
Navrotsky A., 2014: Progress and new directions in calorimetry: A 2014 per-spective. Journal of the American Ceramic Society, 97, 11, 3349–3359, doi: 10.1111/jace.13278
Navrotsky A. & Kleppa O.J. 1967: A calorimetric study on molten Na2MoO4-MoO3 mixtures at 970 ºK. Inorganic Chemistry, 6, 2119–2121.
Navrotsky A. & Kleppa O.J., 1968: Thermodynamics of formation of simple spinels. Journal of Inorganic and Nuclear Chemistry, 30, 479–498.
Navrotsky A., Rapp R.P., Smelik E., Burnley P., Circone S., Chai L., Bose K. & Westrich H.R., 1994: The behavior of water and carbon dioxide in high temperature lead borate solution calorimetry of volatile-bearing phases. American Mineralogist, 79, 1099–1109.
Navrotsky A., Mazeina L. & Majzlan J., 2008: Size-driven structural and ther-modynamic complexity in iron oxides. Science, 319, 1635–1638.
Nordstrom D.K. & Munoz J.L., 1994: Geochemical Thermodynamics. Second edition, Blackwell Scientific Publications, 504 p.
Nordstrom D.K., Königsberger E. & Majzlan J., 2014: Thermodynamic pro-perties for arsenic minerals and aqueous species. Reviews in Mineralogy and Geochemistry, 79, 217–255.
Pabalan R.T. & Pitzer K.S., 1987: Thermodynamics of concentrated electroly-te mixtures and the prediction of mineral solubilities to high temperatures for mixtures in the system Na-K-Mg-Cl-SO4-OH-H2O. Geochimica et Cosmochimica Acta, 51, 2429–2443.
Parker V.B., 1965: Thermal properties of uni-univalent electrolytes. National Standard Reference Data Series, National Bureau of Standards, 2, 66 p.
Parkhurst D.L. & Appelo C.A.J., 1999: User’s guide to PHREEQC (Version 2)--a computer program for speciation, batch-reaction, one-dimensional transport, and inverse geochemical calculations. US Geological Survey Water-Resources Investigations Report, 99–4259, 312 p.
Pettersson U.T. & Ingri J., 2001: The geochemistry of Co and Cu in the Kafue River as it drains the Copperbelt mining area, Zambia. Chemical Geology, 177, 399–414.
Richards T.W. & Burgess L.L., 1910: The adiabatic determination of the heats of solution of metals in acids. American Chemical Society Journal, 32. 431–460.
Ritchie V.J., Ilgen A.G., Mueller S.H., Trainor T.P. & Goldfarb R.J., 2013: Mobility and chemical fate of antimony and arsenic in historic mining environments of the Kantishna Hills district, Denali National Park and Preserve, Alaska. Chemical Geology, 335, 172–188.
Robie R.A. & Hemingway B.S., 1995: Thermodynamic properties of minerals and related substances at 298.15 K and 1 bar (105 pascals) and at higher temperatures. US Geological Survey Bulletin, 2131, 461 p.
Schwarzmann E., Rumpel H. & Berndt W., 1977: Synthese von Diantimon-pentoxid Sb2O5. Zeitschrift für Naturforschung B, 32, 617–618.
Stefánsson A., 2007: Iron(III) hydrolysis and solubility at 25 ºC. Environ-mental Science & Technology, 41, 6117–6123.
Taylor J.R., 1982: An Introduction to Error Analysis. The Study of Uncertain-ties in Physical Measurements. Oxford University Press, 270 p.
van Nuys C.C., 1943: Enthalpy and heats of dilution of the system HCl-H2O. Transactions of the American Institute of Chemical Engineers, 39, 663–678.
Voigt R. & Will G., 1981: Das System Fe2O3-H2O unter hohen Drücken. Neues Jahrbuch für Mineralogie, Monatshefte, 2, 89–96.
Wagman D.D., Evans W.H., Parker V.B., Schumm R.H., Halow I., Bailey S.M., Churney K.L. & Nuttall R.L., 1982: The NBS tables of chemical thermodynamic properties. Selected values for inorganic and C1 and C2 organic substances in SI units. Journal of Physical and Chemical Reference Data, 11, Suppl. 2, 371 p.
Wagman D.D., Evans W.H., Parker V.B., Halow I., Bailey S.M. & Schumm, R.H., 1991: Selected values of chemical thermodynamic properties. Tables for the first thirty-four elements in the standard order of arrangement. NBS Technical Note, 270–3, 264 p.
Waldbaum D.R., 1968: High-temperature thermodynamic properties of alkali feldspars. Contributions to Mineralogy and Petrology, 17, 71–77.
Wang A., 2014: Source materials, processes, and rates for recurring slope lineae (RSL) generation on Mars. In: Eighth International Conference on Mars, July 14–18, 2014, Pasadena, California. Book of abstracts, p.1093
Wilding M.C. & Navrotsky A., 2000: High temperature calorimetric studies of the heat of solution of La2O3 in silicate liquids. Journal of Non-Crystalline Solids, 265, 238–251.
Zittlau A., Shi Q., Boerio-Goates J., Woodfield B. & Majzlan J., 2013: Thermo-dynamics of the basic copper sulfates antlerite, posnjakite, and brochantite. Chemie der Erde – Geochemistry, 73, 39–50.
Solution calorimetry on miner als related to acid mine dr ainage – methodology, checks, and balances