Investigating Phosphorus Sorption onto Kaolinite Using Isothermal Titration Calorimetry
Upload
independentCategory
view
2download
0
Journal of Biotechnology, 29 (1993) 205-215 205 © 1993 Elsevier Science Publishers B.V. All rights reserved 0168-1656/93/$06.00
BIOTEC 00874
Shor t C o m m u n i c a t i o n
Monitoring synchronized oscillating yeast cultures by calorimetry
Lil l ian C.M. A u b e r s o n 1 Ti t ia K a n b i e r and U r s von S tocka r
Institute of Chemical Engineering, Swiss Federal Institute of Technology, Lausanne, Switzerland
(Received 23 June 1992; revision accepted 16 September 1992)
Summary
Synchronized oscillating cultures of Saccharomyces cerevis&e CBS 426 exhibit periodic oxido-reductive metabolism. The changing metabolism is detectable by in situ heat-flux calorimetry in the BSC 81, which was operated as a chemostat in these experiments. The measured metabolic heat flux oscillated in phase and with the same period as the other monitored process variables (CER, OUR and DO) at the dilution rates studied (0.12 and 0.14 h - l ) . There was a difference of 2 W 1-1 between the minima and maxima of the oscillating heat flux. During these synchrony oscillations, the proportionality constant between heat dissipation and oxygen consumption was not constant, but reached a maximum value during each cycle. Data gathered from a separate experiment with the same strain in a standard laboratory bioreactor (D = 0.071 h-1) clearly corroborated the biological nature of the oscillations. The oscillatory character of metabolism is none other than a reflection of the cell cycle, which is punctuated by specific landmark events. Based on these results, we propose a correlation between the heat dissipation and the specific cell cycle classes.
Oscillations; Yeast; Calorimetry; Hea t flux; Chemostat; Cell cycle; Saccharomyces cerevisiae
Correspondence to: U. von Stockar, Inst. Chemical Engineering, Swiss Federal Institute of Technology, CH-1015 Lausanne, Switzerland. 1 Present address: Department of Chemical Engineering, University of California, Berkeley, CA
94720-9989, USA.

206
Introduction
The reproductive budding cycle is an intrinsic oscillatory property of Saccha- romyces-type yeasts, where cells oscillate between the budded and unbudded states. In going from one state to the other, cells accomplish a specific sequence of cell cycle events dedicated to creating two organisms from one (Fig. 1). These events are associated with different degrees of metabolic activity and can be followed in part by monitoring the oxygen uptake rate (OUR), the carbon dioxide evolution rate (CER) or the dissolved oxygen level (DO). It is only with synchronized cultures that we can truly appreciate the periodicity and the organization of the cell division cycle.
For cell cycle studies, self-synchronizing systems have an overriding advantage over induced systems, where the method of synchrony induction could lead to profound changes in cellular physiology and subsequent modifications in cell cycle behavior (Hartwell, 1974). Saccharomyces-type yeasts are used for this purpose since they have a tendency to self-synchronize at low dilution rates in glucose- limited continuous cultures.
Fig. 1. Saccharomyces cerevisiae reproductive budding cycle. The yeast reproductive budding cycle is divided into four phases. GI: In this phase, the mother cell grows to a certain 'critical' size in order to initiate the budding cycle. The end of this phase is marked by the formation of a bud. S: DNA is synthesized during this phase, which constitutes about 25% of the total cell cycle time (Hartwell, 1974). G2: The second 'gap' phase; the end of this phase is marked by the migration of the nucleus to the 'neck', where the first stage of nuclear division takes place. M: The daughter cell separates from the mother cell during the mitotic phase. Cell division is asymmetrical; the daughter cell at division is always smaller than the mother cell. The daughter cell must grow to the critical size before it can
initiate a bud.

207
In continuous cultures of yeast, growth is limited by the rate at which flesh medium is provided to the culture. The low residual substrate (usually glucose) levels signal a starvation-type condition to the cells, causing them to accumulate internal energy reserves in the form of glycogen and trehalose (Lillie and Pringle, 1980). In synchronized cultures, endogenous reserves are stored and degraded periodically. The degradation of these reserves (von Meyenburg, 1969) is concomi- tant with an increase in the number of budded members in the synchronized population and is necessary for supporting the high energetic expenditure of bud formation. It has been postulated that the endogenous reserves serve as storage fuel for propelling the cell through the budding cycle in a constant time, regardless of the growth rate (von Meyenburg, 1969).
The release and subsequent consumption of ethanol during endogenous metabolism is responsible for the long term stability of synchronized cultures. Ethanol is secreted at the beginning of the budding cycle and serves as additional substrate for the neighboring cells. As the critical budding size for growth on ethanol is lower than for growth on glucose, small unbudded cells are induced to bud. The presence of ethanol therefore amplifies random fluctuations in the age distribution of the culture (Str~ssle, 1988).
The catabolism of endogenous substrates proceeds mainly through glycolysis and the Krebs cycle (Eaton, 1963) where the oxidative and reductive metabolic rates for the degradation of reserve carbohydrates depend on the degree of saturation of the respiratory capacity (Rieger et al., 1983). One of the landmark events of synchrony oscillations is the secretion of ethanol into the culture medium just prior to budding. The CER signal peaks at this moment, testifying to the increasing contribution of reductive metabolic activity. The periodic oxido-reduc- tive behavior exhibited by an oscillating culture is an extension of a cyclic metabolic switching mechanism, whose triggering mechanism is still not under- stood.
We have monitored sustained spontaneous oscillations in continuous cultures of Saccharomcyes cerevisiae CBS 426 at low glucose feeding rates (0.071, 0.12 and 0.14 h-a). These oscillations began upon depletion of the ethanol accumulated during the batch start-up phase, after continuous feeding had already commenced. Process variables such as CER, OUR and heat all oscillated in phase with the same period and frequency. The oscillations were verified to be the consequence of a partially synchronized cell population through the undulating nature of the bud- ding index. Sometimes, the decay of the oscillations occurred naturally and led to non-oscillating steady states at the same dilution rate.
Our main objective was to continuously monitor the heat given off by syn- chronously oscillating cultures of S. cerevisiae, and in so doing, gain insight into the heat production during the budding cycle. Calorimetric measurements are usually non-specific and rather insensitive to energy changes on a single cell basis. We have cultivated S. cerevisiae CBS 426 cells in a heat-flux calorimeter in order to take advantage of the pseudo-segregated state of synchronized cultures, and were able to detect the changing metabolic states resulting from the storage and breakdown of internal cell reserves during the cell cycle.

208
Material and Methods
Organism and medium The strain used in these studies was Saccharomyces cerevisiae CBS 426. It was
grown on a semi-synthetic medium (Birou, 1986) with the following composition per liter of water: 20 g glucose, 6 g (NH4)2PO4, 2.00 g KH2PO4, 0.40 g MgSO 4 • 7 H 20 , 0.2 g CaC12, 0.50 g NaC1, 1.00 g Difco yeast extract, 1.00 mg H3BO3, 1.00 mg ZnSO 4 • 7 H20, 1.00 mg MnC12, 0.5 mg FeCI 3 • 6 H20, 0.1 mg CuSO 4 • 5 H20, 1.0 mg Na2MoO4, 0.1 mg KI, 0.007 mg biotin, 25 mg myo-inositol, 2.5 mg /3-alanine, 0.002 mg folic acid, 0.2 mg para-amino-benzoic acid, 0.4 mg nicotinic acid, 0.4 mg pyridoxin/HC1, 0.4 mg thiamin/HCl, 0.2 mg riboflavin.
Sampling During synchrony oscillations, all of the cellular parameters change very rapidly.
The quality of the results is directly linked to the speed of sampling. Approxi- mately 5 ml of sample was withdrawn from the calorimeter, of which: 2 ml were immediately filtered for later glucose and ethanol analyses; 2 ml were centrifuged for dry weight determination; and 1 ml was fixed in 200 txl of a 20% formaldehyde solution (Pringle and Mor, 1975) for determining the budding index.
Analyses The dry weight was assessed by centrifuging two 2 ml samples followed by
washing and oven-drying to constant weight. The ethanol was analyzed by injection into a gas-liquid chromatograph (GC-14A, Shimadzu, Kyoto, Japan). Residual glucose was analyzed enzymatically (Gluc-DH-Method, Merck, Darmstadt, FRG) using a flow injection analysis system (Technicon, Domont, France).
The concentration of CO 2 and ethanol in the off-gases were detected by IR (PSA-402 series, Servomex, Crowborough, UK); 0 2 was detected by paramag- netism (ll00A, Servomex, Crowborough, UK). These gas detection apparatuses were mounted in a prototype model with a heated gas distribution system (Servomex), so that condensation in the gas stream could be avoided in order to accurately determine the gaseous ethanol concentrations. To this end, the sample line from the reactor was also heat traced.
Reactors The continuous culture experiments were performed in the modified Bench
Scale Calorimeter, BSC 81, (Ciba Geigy AG, Basel, CH) based on a heat flux measurement. Details on the structure and working principle of the calorimeter have been given previously (Marison and yon Stockar, 1985, 1986). The calorimeter was equipped with pH, dissolved oxygen and temperature probes and had a working volume of 1.2 1. The air flow rate to the calorimeter was regulated with a mass flow meter (5850 TR, Brooks Instrument B.V., Veenendaal, NL). A standard laboratory bioreactor (KLF-2000, Bioengineering AG, Wald, CH) was also used in these experiments.

209
Budding index Cells from the 1 ml sample fraction were kept at 4°C. These prepared ceils
could not be kept indefinitely due to spontaneous cell lysis. Three times a total of 250 to 300 cells were counted at 1000 × magnification.
Cells with buds smaller than 2 / 3 the size of the mother cell were counted as budded cells. No distinction was made between the different stages of the bud. All other cells were counted as single cells.
This method provides a rapid estimation of the percentage of budded members in a cell population. There are, however, certain drawbacks: It is difficult to distinguish between two adjacent single cells and one budded cell with a mature bud. Also, buds not in the plane of the slide are missed. Although cell clumping was not a major problem with the strain used, one should be aware that clumping can mask budded cells.
Results and Discussion
We have investigated oscillations in continuous cultures of Saccharomcyes cerevisiae CBS 426 with two types of bioreactors: a heat flux calorimeter and a standard laboratory bioreactor. Oscillations appeared only for oxidative dilution rates, where fully oxidative metabolism normally prevails. The dilution rates were 0.14 h -1 in the calorimeter and 0.071 h -1 in the bioreactor.
Monitored process variables (CER, OUR and DO) spontaneously began oscillating with a constant period after exhaustion of the ethanol accumulated during the batch start-up phase (Figs. 2 and 3). A typical thermogram with oscillations is shown in Fig. 4, where the start of continuous feeding began in the late exponen-
44.0
4 0 . 0 ~ - ~ CER
I J._~ ~- - ~ 36.0 UR
"~ -~ 32.o
~ 28.0
~ 24.0
20.0 ~ " % Budde~d Cells
16.0 0 ~ ' ~
Time (h) Fig. 2. Cyclic carbon dioxide production, oxygen uptake and % budded cells for synchrony oscillations
at 0.14 h -1 in the calorimeter. The budded cell curve is out of phase with the CER and OUR.

210
85
84
83
,...- 82
t~0 81
© 80
> 79
78
77
76
75 0 2 4 6
Time (h) Fig. 3. Dissolved oxygen for synchrony oscillations at 0.14 h - 1 in the calorimeter.
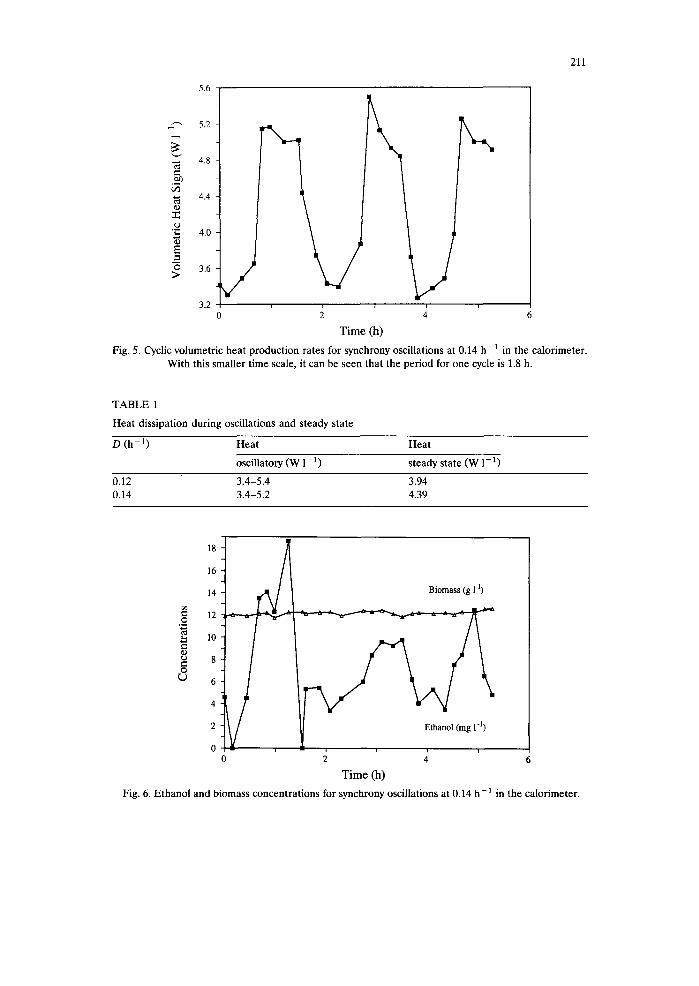
tial ethanol growth phase of the batch culture. The smaller time scale for the same thermogram shows that the period for one cycle of heat production is 1.8 h at a dilution rate of 0.14 h -1 (Fig. 5). There are 2 W of difference between the maxima and minima of the volumetric heat production curve. The corresponding non-oscil- lating steady state values were measured when the oscillations damped out naturally (Table 1). Ethanol production also oscillated in phase with the other process variables, whereas the biomass concentration remained constant (Fig. 6).
At low dilution rates, the cycle period is longer as shown in Figs. 7-8 for synchrony oscillations observed in a standard laboratory bioreactor. Details of the
B
2
0
0 2o 40 60 80 i o o
Time (h) Fig. 4. Thermogram showing the initiation and dampening of synchrony oscillations. Oscillations begin spontaneously when continuous feeding (arrow) to the batch culture begins in the late ethanol growth
phase.
211
'T
©
E
>
5.6
5.2
4.8
4.4
4.0
3.6 ~ , /
3.2 0
T ime (h)
\
Y i i
4 6
Fig. 5. Cyclic volumetric heat production rates for synchrony oscillations at 0.14 h-1 in the calorimeter. With this smaller time scale, it can be seen that the period for one cycle is 1.8 h.
TABLE 1
Heat dissipation during oscillations and steady state
D ( h - l) Heat Heat
oscillatory (W 1-1) steady state (W 1-1)
0.12 3.4-5.4 3.94 0.14 3.4-5.2 4.39
18
16
14 Biomass (g 1-1)
12 "-" a ± 0
o 8
~ 6
4
2
0 o ~ ' ~ '
Time (h)
Fig. 6. Ethanol and biomass concentrations for synchrony oscillations at 0.14 h-1 in the calorimeter.

212
6O
55
50
3= 45
- - 40
~ 3o N OUR
25
15 ~. ,,i .~
10 . . . . o 6 8
Time (h) Fig. 7. Carbon dioxide production and oxygen uptake rates for synchrony oscillations at 0.071 h -1 in a
standard laboratory bioreactor. The details of the curves are much sharper at the lower dilution rate.
oscillations become much clearer at the lower dilution rate. Of note is the sharp burst in the carbon dioxide evolution rate, corresponding to the short period of enhanced ethanol formation. Concurrent with the ethanol formation, there is a small increase in the glucose concentration for which the maximum is achieved at the same time as the maximum of the budded cell curve. The biological nature of
110
100
90
Ethanol
,~" 80
~ 60
"*., 50
40
~ 30
r) 20
0 0 2 4 6
Time (h) Fig. 8. Ethanol, glucose and % budded cells for synchrony oscillations at 0.071 h - I in a standard laboratory bioreactor. A significant amount of ethanol is produced at the start of the cycle. The
maximum in the glucose and budded cell curves peak out of phase with the ethanol concentration.

213
600
O
580
560
540
520
500
480
460 I I
4
Time (h) Fig. 9. Cycling in the oxy-caloric equivalent for synchrony oscillations at 0.14 h - I in the calorimeter.
The heat production and oxygen uptake are uncoupled during the synchrony oscillations.
these oscillations is manifest in the measurement of the population budding index whose undulating characteristic indicated that part of the population had synchro- nized (Figs. 2 and 8). The budding curve is out of phase with the other oscillating variables, showing a maximum when the others show a minimum.
The heat production by synchronized cell populations is an adaptable indicator for the periodically changing metabolic and physiological states of the cells. One of the landmark events of synchrony oscillations is the formation of ethanol from the partial oxidation of endogenous reserves. This event precedes budding and is characterized by a period of intense metabolic activity with high rates of carbon dioxide evolution, oxygen uptake and high heat turnover rates (Figs. 2 and 8). Although intracellular concentrations of glycogen and trehalose were not mea- sured in these experiments, we could still assess the relative importance of reductive metabolism through the heat measurement. In the plot of the calculated oxy-caloric equivalent as a function of time (Fig. 9), an uncoupling effect is seen between the heat generated and the oxygen uptake rate. The value of the oxy-caloric equivalent is normally constant at 460 kJ (mol 02)-1 for fully oxidative carbohydrate metabolism (Roels, 1983). The three peaks of this curve coincide with the periodic ethanol formation from the reductive pathway, uncoupling the relationship between the heat output and the oxygen uptake rate. Brettel (1977) has observed the same increased values of the oxy-caloric equivalent due to reductive metabolism.
We can address the issue of the heat dissipation during the different phases of the cell cycle, due to the segregated nature of synchronized cultures. Unbudded cells (see Material and Methods) can be considered as stationary phase cells or resting cells (Hartwell, 1974). The heat generation rate of resting yeast cells has

214
been measured and corresponds to 5 mW g-1 (Birou and von Stockar, 1988). The 2 W of difference between the minima and maxima of the heat oscillation could not be solely attributed to the resting subpopulation. At the maxima, the heat generation rate is 0.5 W g-1 of cells, twice the value for an exponentially growing yeast culture of 0.25 W g-1 (Marison and von Stockar, 1987). The budding index achieves its maximum when the heat dissipation is at the lowest; therefore, the budded state per se is not the most energy-demanding. Rather, energy expendi- tures are highest at the commencement of budding in the population.
Miinch et al. (1990) have applied flow cytometry techniques to similar synchrony oscillations in order to obtain finer details regarding the population distribution throughout the different cell cycle classes. They found that the number of budded cells in the S phase oscillated in phase and with the same period as the CER signal (given as a reference). The budded cells of the G 2 and M phases were combined together into one cell class whose membership peaked one half cycle out of phase with the CER signal, similar to the budding index curve in our experiments. If we could superpose these cell distribution studies to our heat measurements, it would mean that the budded cells of the S-phase are the most energetically demanding. Calorimetric measurements of synchronously growing yeasts have been performed previously using flow calorimetry techniques (Brettel, 1977; Poole and Lloyd, 1973), however no attempt was made to determine the heat production per specific cell cycle phase.
Conclusions
Cyclic metabolic patterns in synchronously growing S. cerevisiae cells can be detected by heat flux calorimetry. The heat production in spontaneously synchro- nized populations oscillates in phase and with the same period as the CER and OUR. Periodic ethanol formation from the partial oxidation of endogenous reserves uncouples the relationship of heat production to oxygen uptake. The oxy-caloric equivalent is consequently higher than the value of 460 kJ (mol 02) -1 for fully oxidative carbohydrate metabolism (Roels, 1983).
Heat production is periodic for one cell cycle, but is not the same for all of the cell cycle phases. The maximum in the budding index is concomitant with the minimum in heat production rate, leading to the hypothesis that the budded state per se is not the most energy-demanding. Some event at the commencement of budding, overlapping perhaps the S-phase, is the reason for vigourous metabolic activity and consequent heat dissipation.
Acknowledgements
This work was supported by a grant from the Swiss National Foundation for Scientific Research (FNRS). A subsidy from the Commission for Encouragement of Scientific Research (CERS) is also gratefully acknowledged.

NOMENCLATURE
215
CER carbon dioxide evolution rate mol 1-1 s-1 D dilution rate h - 1 DO dissolved oxygen % OUR oxygen uptake rate mol l - 1 s - 1 q volumetric heat dissipation rate W l-1 YQ/O oxy-caloric equivalent kJ (mol 0 2 ) - 1
References
Birou, B. (1986) Etude de la chaleur d6gag6e par des cultures microbiennes dans un fermenteur de laboratoire. Thesis 612, EPF, Lausanne, Switzerland.
Birou, B. and yon Stockar, U. (1988) Applications of bench-scale calorimetry to chemostat cultures. Enzyme Microb. Technol. 11, 12-16.
Brettel, R. (1977) Microcalorimetric measurements of the heat production in partially synchronous cultures of baker's yeast. In: Lamprecht, I. and Schaarschmidt, B. (Eds.), Proc. Int. Conf., Berlin. W. de Gruyter, Berlin, pp. 129-138.
Eaton, R.E. (1963) Endogenous metabolism of reserve deposits in yeast. Ann. N.Y. Acad. Sci. 102, 678-687.
Hartwell, L.H. (1974) Saccharomyces cerevisiae cell cycle. Bacteriol. Rev. 38, 164-198. Lillie, S.H. and Pringle, J.R. (1980) Reserve carbohydrate metabolism in Saccharomyces cerevisiae:
responses to nutrient limitation. J. Bacteriol. 143, 1384-1394. Marison, I.W. and von Stockar, U. (1985) A novel bench-scale calorimeter for biological process
development work. Thermochim. Acta 85, 493-496. Marison, I.W. and yon Stockar, U. (1986) The application of a novel heat flux calorimeter for studying
the growth of E. coli W in aerobic batch culture. Biotechnol. Bioeng. 28, 1780-1793. Marison, I.W. and von Stockar, U. (1987) A calorimetric investigation of the aerobic cultivation of
1Quyveromyces fragilis on various substrates. Enzyme Microb. Technol. 9, 33-43. Meyenburg, H.K. von (1969) Energetics of the budding cycle of Saccharomyces cerevisiae during glucose
limited aerobic growth. Arch. Microbiol. 66, 289-303. Miinch, T., Sonnleitner, B. and Fiechter, A. (1990) Poster presented at the 2nd Int. Symp. Biochemical
Engineering, 5-7 March, Stuttgart, Germany. Poole, R.K. and Lloyd, K. (1973) Respiratory oscillations and heat evolution in synchronously dividing
cultures of the fission yeast Schizosaccharomyces pombe 972h-. J. Gen. Microbiol. 77, 209-220. Pringle, J.R. and Mor, J.-R. (1975) Methods for monitoring the growth of yeast cultures and for dealing
with the clumping problem. In: Prescott, D.M. (Ed.), Methods in Cell Biology, Academic Press, New York, pp. 131-168.
Rieger, M., Kiippeli, O. and Fiechter, A. (1983) The role of limited respiration in the incomplete oxidation of glucose by Saccharomyces cerevisiae. J. Gen. Microbiol. 129, 653-661.
Roels, J.A. (1983) Energetics and Kinetics in Biotechnology. Elsevier, Amsterdam. Str~issle, C.A. (1988) Modell zu Spontansynchronisation von Saccharomyces cerevisiae. Thesis 8598,
ETH-Ziirich.
Copyright © 2022 FDOKUMEN