Monitoring synchronized oscillating yeast cultures by calorimetry
Upload
independentCategory
view
1download
0
arX
iv:a
stro
-ph/
9704
127v
1 1
4 A
pr 1
997
Mon. Not. R. Astron. Soc. 000, 000–000 (1997) Printed 1 February 2008 (MN LATEX style file v1.4)
The supercluster–void network II.
An oscillating cluster correlation function
J. Einasto1, M. Einasto1, P. Frisch 2, S. Gottlober3, V. Muller3, V. Saar1,
A.A. Starobinsky4, E. Tago1, D. Tucker3,5, and H. Andernach6,7
1 Tartu Observatory, EE-2444 Toravere, Estonia2 Gottingen University Observatory, D-37083 Gottingen, Germany3 Astrophysical Institute Potsdam, An der Sternwarte 16, D-14482 Potsdam, Germany4 Landau Institute Theoretical Physics, Moscow, Russia5 Fermilab, Batavia, IL 60510, USA6 INSA; ESA IUE Observatory, E–28080 Madrid, Spain7 Depto. de Astronomıa, Univ. Guanajuato, Guanajuato, Mexico
Accepted Received ; in original form 1996
ABSTRACT
We use rich clusters of galaxies in the Northern and Southern Galactic hemispheresup to a redshift z = 0.12 to determine the cluster correlation function for a separationinterval ≈ 650 h−1 Mpc (h is the Hubble constant in units of 100 km s−1 Mpc−1).We show that superclusters of galaxies and voids between them form a moderatelyregular network. As a result the correlation function determined for clusters locatedin rich superclusters oscillates: it has a series of regularly spaced secondary maximaand minima. The scale of the supercluster-void network, determined from the periodof oscillations, is P = 115 ± 15 h−1 Mpc. Five periods are observed. The correlationfunction found for clusters in poor and medium rich superclusters is zero on largescales. The correlation functions calculated separately for the Northern and SouthernGalactic hemispheres are similar. The amplitude of oscillations for clusters in theSouthern hemisphere is larger by a factor of about 1.5.
We investigate the influence of possible errors in the correlation function. Theamplitude of oscillations for clusters in very rich superclusters is about 3 times largerthan the estimated error. We argue that the oscillations in the correlation functionare neither due to the double-cone shape of the observed volume of space, nor to theinaccuracy in the selection function.
We compare the observed cluster correlation function with similar functions de-rived for popular models of structure formation, as well as for simple geometricalmodels of cluster distribution. We find that the production of the observed clustercorrelation function in any model with a smooth transition of the power spectrumfrom a Harrison-Zeldovich regime with positive spectral index on long wavelengths toa negative spectral index on short wavelengths is highly unlikely. The power spectrummust have an extra peak located at the wavelength equal to the period of oscillations ofthe correlation function. The relative amplitude of the peak over the smooth spectrumis probably of the order of a factor of at least 1.25.
These quantitative tests show that high-density regions in the Universe markedby rich clusters of galaxies are distributed more regularly than expected. Thus ourpresent understanding of structure formation needs revision.
Key words: cosmology; observations – clusters of galaxies; clustering – large-scalestructure of the universe; theory – galaxies
1 INTRODUCTION
A fundamental property of the distribution of galaxies isclustering, manifested by the presence of groups and clus-

2 J. Einasto et al.
ters of galaxies and quantitatively measured by the correla-tion function. Due to clustering the correlation function ofgalaxies has a large positive value at small separations. Ata separation of ∼ 30 h−1 Mpc the correlation function ap-proaches (or crosses) zero and remains small on larger scales.A correlation function of zero has been interpreted as an in-dication of a random distribution of galaxies. This picture –clustering on small scales and a random scale-free distribu-tion on larger scales – formed the classical paradigm of thelarge-scale distribution of galaxies and clusters of galaxies.
The discovery of superclusters consisting of clustersand filaments of galaxies and huge voids between them haschanged this classical paradigm. According to available datasuperclusters reside in chains and walls, separated by voidsof diameters of about 100 h−1 Mpc, and form a rather regu-lar network (Einasto et al. 1994, Einasto et al. 1997c, here-after Paper I). This raises a question about the existence ofsome regularity in the distribution of superclusters of galax-ies, and, if so, about the presence of a related scale in theUniverse.
The first clear demonstration for the possible presenceof a regularity in the distribution of galaxies on very largescales came from a deep pencil-beam survey of galaxies byBroadhurst et al. (1990). This survey covers small areas nearthe North and South Galactic poles and has a depth of about700 h−1 Mpc in both directions. The galaxy density showsperiodic peaks separated by ∼128 h−1 Mpc. In total over 10peaks have been observed. Bahcall (1991) explained high-density regions in the distribution of galaxies by the presenceof superclusters.
There has been much discussion regarding the implica-tion of this result. Kaiser and Peacock (1991) have arguedthat a peak in the one-dimensional spectrum can arise with-out any large-scale feature in the three-dimensional distribu-tion of galaxies. Dekel et al. (1992) investigated the problemand showed that this periodicity is barely compatible withGaussian fluctuations in the framework of CDM-type sce-narios of structure formation. Thus, the initial reaction tothe observation of Broadhurst et al. was that there is noneed to change the classical paradigm on the distribution ofmatter on large scales.
However, other independent data on the possible pres-ence of some regularity in the distribution of matter on largescales in the Universe have accumulated. In the 70ies Shvarz-man and Kopylov initiated a program to study the large-scale distribution of matter. They used Abell (1958) clus-ters of galaxies of richness R ≥ 2, and rich, compact clustersfrom the list of Zwicky et al. (1961–69); redshifts were de-termined for clusters up to z ≈ 0.3 in a region around theNorthern Galactic pole. This survey indicated the presenceof a secondary peak in the correlation function at ≈ 125h−1 Mpc (Kopylov et al. 1984, 1988). Later the survey wasextended to the Southern Galactic hemisphere, and a peakin the correlation function on the same scale was found (Feti-sova et al. 1993). Mo et al. (1992a, b) and Einasto & Gra-mann (1993) used a different method to analyse the clustercorrelation function, and the presence of a feature at ∼ 130h−1 Mpc was confirmed. Similar scale was found in the dis-tribution of clusters using other methods like the void andpencil-beam analysis (Einasto et al. 1994, Paper I).
Landy et al. (1996) derived the 2D power spectrum ofthe Las Campanas Redshift Survey and found a peak at
a wavelength 100 h−1 Mpc. The peak is due to numerousdensity enhancements located at this characteristic mutualseparation. The same redshift survey was analysed also byTucker et al. (1995, 1997) and Doroshkevich et al. (1996)who also found characteristic features on similar scales. A∼ 100 h−1 Mpc scale has also been seen in the distributionof QSO absorption line systems (Quashnock, Vanden Berk& York, 1996).
During the past few years the number of redshifts de-termined for rich clusters of galaxies has rapidly increased.This makes a new analysis of cluster data worthwhile, asthe Abell-ACO cluster sample is the deepest almost full-skysurvey available at present. In this paper we study the corre-lation function for clusters of galaxies using a recent compi-lation of available data on clusters of galaxies by Andernach,Tago, & Stengler-Larrea (1995, 1997). Our study follows ap-proaches by Bahcall and Soneira (1983) and more recentlyby Peacock and West (1992) and Einasto et al. (1993). How-ever, in contrast to all previous studies we concentrate hereon large scales, i.e. well beyond 100 h−1 Mpc. To do thiswe consider the whole dataset of clusters now available forboth the northern and southern Galactic hemispheres as asingle sample of depth ≈ 700 h−1 Mpc. The same datasethas been used in Paper I to derive a catalogue of super-clusters of galaxies and to study the spatial distribution ofclusters, by Jaaniste et al. (1997) to investigate the orienta-tion and shape of superclusters of galaxies, and by Saar etal. (1995) to determine the correlation function with a novelmethod. Methodical problems connected with the determi-nation and interpretation of the correlation function on largescales are discussed separately by Einasto et al. (1997b, here-after Paper III). The power spectrum for our cluster samplewas found and discussed by Einasto et al. (1997a, hereafterE97).
The paper is structured as follows. In Section 2 we de-scribe the observational data used and the selection func-tions of the data. Section 3 is devoted to the analysis of thecorrelation function of clusters of galaxies on large scales.We determine the correlation function for the whole sampleas well as for subsamples of clusters in the Northern andSouthern Galactic hemispheres, and for cluster populationslocated in rich and poor superclusters. In Section 4 we dis-cuss the influence of the smoothing length, inaccuracy of theselection function, and other factors on our results. In Sec-tion 5 we compare our results with simulations using simplegeometrical models and results of N-body calculations forthe CDM model and a double power-law model. In Section 6we derive the possible cluster power spectrum from models.A summary of the main results is given in Section 7.
We use a Hubble constant ofH0 = 100 hkm s−1 Mpc−1.
2 DATA
The Abell–ACO catalogue of clusters of galaxies (Abell1958, Abell, Corwin, & Olowin 1989) is presently the largestavailable source of the large-scale distribution of matter inthe Universe covering the whole sky outside the Milky Wayzone of avoidance. We use for the present study a recentcompilation of measured redshifts for these clusters by An-dernach, Tago, & Stengler-Larrea (1997). This compilationgives redshifts for a total of about 2000 Abell–ACO clusters

Oscillating correlation function 3
Table 1. Selection function parameters
Sample s0 d0N d1N d0S d1S
ACO.R.H8 0.38 1.00 0.80 1.00 0.80ACO.R.L8 0.12 1.00 0.80 1.00 0.80ACO.A.H8 0.36 1.00 0.50 1.00 0.50ACO.A.L8 0.14 0.78 0.36 1.00 0.52
(including supplementary, or S-clusters). We used the 1995version of the compilation, omitted all S-clusters and usedonly clusters with measured redshifts up to z = 0.12. To thissample we added all clusters with photometric redshift esti-mates zest ≤ 0.12. Our full sample contains 1304 Abell–ACOclusters of galaxies, 869 of which have measured redshifts.
We have included clusters of richness class 0 in ourstudy. About half of all clusters in the nearby region studiedare of this richness class and the number of objects is crucialin the present work. Abell clusters of richness class 0 are X-ray emitters and hosts of cD galaxies with extended haloesas often as clusters of higher richness. Both facts suggestthat these clusters are physical objects which can be usedto trace the large-scale structure. Possible projection effectsdiscussed by Sutherland (1988), Dekel et al. (1989) and oth-ers are not crucial for the present study as we are mostlyinterested in the distribution of clusters on large scales. Asmall excess of cluster pairs on small separations noted bySutherland and Dekel et al. can be considered as an addi-tional selection effect.
This sample was used in Paper I to derive a new cat-alogue of superclusters and to study their spatial distribu-tion. In the present paper we use both the cluster sampleand the supercluster catalogue. The use of the superclus-ter catalogue gives us the possibility to analyse the distri-bution of clusters in different environments. Superclusterswere determined using a “friends-of-friends” technique withneighbourhood radius 24 h−1 Mpc. This radius was chosenon the basis of the multiplicity function which shows thatindividual superclusters start to become evident at a neigh-bourhood radius of about 16 h−1 Mpc; at radii larger than30 h−1 Mpc superclusters begin to join into huge agglom-erates with dimensions exceeding the characteristic scale ofthe supercluster-void network. Thus the neighbourhood ra-dius must lie within these boundaries. The influence of thisradius on our results for the correlation function shall bestudied below (Section 4.3).
In Paper I superclusters were divided into richnessclasses according to their multiplicity (the number of mem-ber clusters in superclusters). It was also shown that theoverall distribution of superclusters of different richness israther similar: superclusters are located in chains that forma fairly regular network. The mean diameter of voids be-tween superclusters is ∼ 100 h−1 Mpc. The skeleton of thesupercluster-void network is formed by very rich superclus-ters. Poor and medium rich superclusters as well as isolatedclusters are scattered around them, leaving void interiorsempty of rich clusters. The distribution of superclusters invoid walls depends on the supercluster richness: the meanseparation between poor and medium rich superclusters issmall and has a smooth distribution whereas the separationbetween very rich superclusters is much larger and its dis-tribution is peaked: over 75 % of very rich superclusters are
located at separations 110− 150 h−1 Mpc on opposite sidesof voids.
This finding motivated us to study the correlation func-tion of clusters of galaxies located in superclusters of differ-ent richness. As in Paper I we divide cluster samples intopopulations using the supercluster richness as the param-eter which determines the mean density of the large-scale
environment of clusters (see Frisch et al. 1995). In contrastto Paper I we divide superclusters into only two richnessclasses with variable richness threshold. We shall use the fol-lowing nomenclature of cluster samples. The first 3 capitalletters ACO denote clusters from the Abell–ACO catalogue(excluding S-clusters); the following capital letter indicateswhether we use the sample of all clusters (A) or the sampleof clusters with measured redshifts (R); the following capitalletter denotes cluster samples in high-, or low-density envi-ronments (respectively H or L); the last number indicatesthe limiting multiplicity Ncl of superclusters used to dividethe sample into high- and low-density populations. Clustersbelonging to superclusters with at least Ncl members wereattributed to the high-density population, and isolated clus-ters as well as clusters in superclusters with less than Ncl
members to the low-density population.
To calculate the correlation function of clusters of galax-ies we generate Poisson samples of test particles with thesame shape and selection function as the real samples. Theselection effects depend on Galactic absorption, on the diffi-culty to find lower richness clusters at large distances, on thedecrease in the fraction of clusters with measured redshiftswith distance, the differences in the mean density of clustersin the Abell and ACO catalogues, etc.
Poisson samples must be generated with all these ef-fects taken into account. We have calculated the selectionfunction as a function of two variables, the Galactic lati-tude b, and the distance from the observer r, separately forthe Northern and Southern Galactic hemispheres. We deter-mined selection functions for clusters populating rich andpoor superclusters, using a threshold richness of Ncl = 8.The influence of the choice of the threshold richness Ncl
shall be discussed in the next Section.
In Figure 1 we show the results of the determination ofthe selection function for clusters of galaxies with measuredredshifts. The number of clusters vs. the Galactic latitudewas determined as a function of sin b. Differences betweenthe two hemispheres are small, thus in Figure 1 we presentthe mean of both hemispheres. Data are normalised to unitdensity at sin b = 1. We see an almost linear decrease of thenumber density of clusters with sin b. This linear regression,D(b) = (sin b − sin b0)/(1 − sin b0), is given by the values0 = sin b0 where the density of cluster reaches 0, and itwas used to calculate Poisson samples for the correlationfunction.
To determine the distance dependence of the selectionfunction the spatial density of clusters of galaxies was calcu-lated in concentric spherical shells of thickness 20 h−1 Mpc,for each hemisphere separately. Fluctuations are ratherlarge, thus for this sample of clusters the mean regressionwas derived for both hemispheres. The spatial density canbe represented by a linear law: D(r) = d0 − d1(r/r1), whered0 and d1 are constants, and r1 is the outer radius of thesample. Values of the selection function parameters d0, and
4 J. Einasto et al.
Figure 1. Selection functions for clusters of galaxies. The volume density of clusters is shown as function of the sine of Galactic latitudeb (upper panels) and as function of distance r from the observer (lower panels). In the upper panels the density is given in units ofthe density near the Galactic pole (i.e. sin b = 1); in the lower panels in arbitrary units. In the left panels only clusters with measuredredshifts were used; in the right panels we used all clusters. Dashed lines are for clusters located in low-density environments (isolatedclusters and clusters in superclusters with less than 8 members); solid lines are for high-density regions (clusters in superclusters with atleast 8 members). Dashed and solid straight lines represent linear approximations of the selection function.
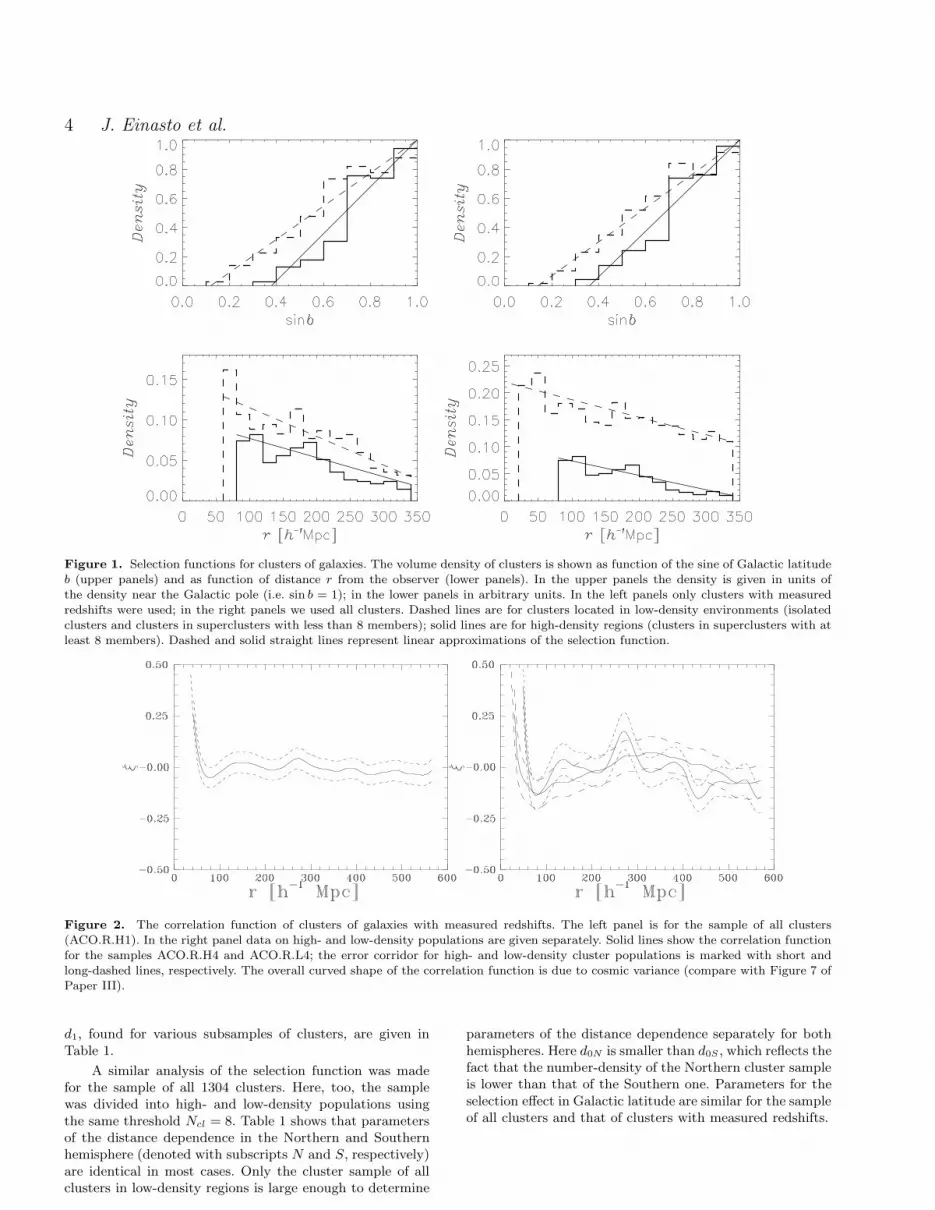
Figure 2. The correlation function of clusters of galaxies with measured redshifts. The left panel is for the sample of all clusters(ACO.R.H1). In the right panel data on high- and low-density populations are given separately. Solid lines show the correlation functionfor the samples ACO.R.H4 and ACO.R.L4; the error corridor for high- and low-density cluster populations is marked with short andlong-dashed lines, respectively. The overall curved shape of the correlation function is due to cosmic variance (compare with Figure 7 ofPaper III).
d1, found for various subsamples of clusters, are given inTable 1.
A similar analysis of the selection function was madefor the sample of all 1304 clusters. Here, too, the samplewas divided into high- and low-density populations usingthe same threshold Ncl = 8. Table 1 shows that parametersof the distance dependence in the Northern and Southernhemisphere (denoted with subscripts N and S, respectively)are identical in most cases. Only the cluster sample of allclusters in low-density regions is large enough to determine
parameters of the distance dependence separately for bothhemispheres. Here d0N is smaller than d0S , which reflects thefact that the number-density of the Northern cluster sampleis lower than that of the Southern one. Parameters for theselection effect in Galactic latitude are similar for the sampleof all clusters and that of clusters with measured redshifts.

Oscillating correlation function 5
Figure 3. The correlation function for all clusters (samples ACO.A.H8 and ACO.A.L8 in the left panel), and for clusters with measuredredshifts (samples ACO.R.H8 and ACO.R.L8 in the right panel). Solid, dashed, and dotted lines have the same meaning as in Figure 2.
3 THE CLUSTER CORRELATION
FUNCTION
3.1 Deep cluster samples
In this Section we discuss the correlation function of Abell–ACO clusters of galaxies in various environments. As notedabove, clusters in high-density environment (rich super-clusters) form a fairly regular three-dimensional network,whereas clusters in low-density environment (isolated clus-ters and clusters in poor and medium rich superclusters, orsimply poor superclusters) are located in their vicinity moreirregularly (Paper I). To determine which limiting richnessNcl divides clusters naturally into high- and low-density en-vironment, we calculated the correlation functions for bothpopulations using limiting richnesses between Ncl = 1 andNcl = 8. For Ncl = 1 per definition there are no clustersin the low-density population (since low-density populationconsists of clusters in superclusters of multiplicity less thanNcl). Results for Ncl = 1, 4, and 8 are shown in Figures 2and 3 for clusters with measured redshifts.
These Figures show that the correlation function of clus-ters in rich superclusters has a number of quasi-regularlyspaced secondary maxima and minima (in addition to themain maximum at small separation). This phenomenon isthe main finding of the present paper and we shall refer toit as the oscillation of the correlation function.
In contrast to the correlation function of clusters in richsuperclusters the correlation function of clusters in poor su-perclusters approaches zero smoothly after the initial max-imum. The nearest neighbour test and void analysis show(Paper I) that clusters in poor superclusters are locatedmore irregularly in void walls between rich superclusters andthus secondary peaks of the correlation function due to in-dividual poor superclusters cancel each other out.
Parameters of the oscillations of the correlation func-tion for clusters in rich superclusters are given in Table 2: Nis the number of clusters in the sample; rmin is the locationof the first secondary minimum of the correlation function;rmax is the location of the first secondary maximum; Amax
is the amplitude, which is defined as half of the difference ofthe value of the correlation function between the first sec-ondary maximum and minimum; σξ is the mean 1σ errorof the correlation function, which determines the width of
the error corridor; ∆21 and ∆32 are distances between sec-ondary maxima indicated by respective indices; and ∆mean
is the mean separation of the secondary maxima, and ofthe secondary minima. Positions of the maxima and min-ima and differences between them are given in h−1 Mpc.The mean error was calculated from Eq. (16) of Paper III.Essentially the error is determined by the cosmic variance(i.e. the variation of the correlation function in different vol-umes of space):
σξc =b√N, (1)
where b is a parameter introduced in Paper III to describethe dependence of the error on the character of the large-scale distribution of clusters of galaxies. It must be deter-mined from mock samples. We have done this (for details seePaper III) and found that b ≈ 1.5, see also the discussion inSect. 4. As we see from the above equation, the width of theerror corridor for the cosmic variance is constant.
We see from Table 2 that the amplitude of oscillationsincreases with the increase of the minimum superclusterrichness Ncl. This leads us to the conclusions that, for lowvalues of Ncl, we actually have a mixture of populationsin the high-density population, and that the proper divi-sion of populations occurs at the highest minimum richness,Ncl = 8. To check this result we have calculated the correla-tion function separately for clusters located in superclustersof medium richness, from Ncl = 4 to Ncl = 7. The corre-lation function of this subpopulation shows only marginalsigns of oscillations. Thus we can accept Ncl = 8 as thelimiting richness to select the regularly distributed popula-tion of clusters in rich superclusters. This analysis confirmsresults found in Papers I and III: a smooth distribution invoid walls leads to a non-oscillating correlation function inthe case of clusters in poor superclusters; oscillations occuronly in the case if rich superclusters are located in a quasi-regular rectangular lattice.
In Table 2 we give parameters of the oscillating correla-tion function for the cluster population with measured red-shifts. The sample of all clusters was also divided into high-and low-density populations, and parameters of the corre-lation function were determined. Results for samples withmeasured redshifts and for all clusters are given in Figure 3.In this case we see that, on large scales, clusters in rich super-

6 J. Einasto et al.
clusters have an oscillating correlation function and clustersin poor superclusters have a zero correlation. Parameters ofthe oscillations of clusters in rich superclusters have valuesvery close to values for the sample of clusters with measuredredshifts; only the amplitude of oscillations is smaller by afactor of about 1.5. A smaller amplitude for the sample of allclusters is likely due to the larger observational errors in thephotometric redshifts, which smooth out features slightly inthe correlation function.
Now we compare the error in the correlation functionfor subsamples with various limiting richness Ncl. We seethat the amplitude of oscillations for the sample ACO.R.H8is approximately three times larger than the error; i.e., weare able to establish the presence of oscillations at a 3σlevel. For the sample of clusters of all richness classes takentogether (ACO.R.H1) the error is approximately equal tothe amplitude of oscillations. This shows that the division ofclusters into high- and low-density populations is crucial to
demonstrate the presence of oscillations. (We note, however,that the power spectrum of the cluster population in richsuperclusters is almost identical in shape to the spectrum ofthe whole cluster population.)
3.2 Cluster samples in the Northern and
Southern hemispheres
Now we determine the cluster correlation function separatelyfor the Northern and Southern Galactic hemispheres. To in-crease the number of clusters we use the sample of all clus-ters, and divide this sample again into rich and poor super-clusters using the limiting richness Ncl = 8. Figure 4 showsthe correlation function of clusters located in rich superclus-ters separately for both Galactic hemispheres. We see thatthere are some differences between the correlation functions.
The oscillatory behaviour is very clear in both cases,and the period of oscillations is identical (see Table 2). Thebasic difference lies in the amplitude, which is smaller for theNorthern hemisphere. This suggests that the supercluster-void network is less regular in the Northern hemisphere. It isinteresting to note that Landy et al. (1996) have determinedthe power spectrum of galaxies in the deep Las CampanasRedshift Survey separately for the Northern and SouthernGalactic hemispheres. The Southern samples have a strongpeak at a wavelength ≈ 100 h−1 Mpc, whereas in North-ern samples this feature is much weaker. The similarity ofthese independent measures of the regularity of the struc-ture suggests, first of all, that both methods (the correla-tion and spectral analyses) work and that they measure thelarge-scale regularity of the structure. Secondly, these resultsindicate that there are small-but-definite differences in thelarge-scale distribution of high-density regions in the nearbyUniverse. In other words, Northern and Southern samples,taken separately, do not form fair samples of the Universe.
3.3 Mean parameters of oscillations
The grid size of the supercluster-void network can be deter-mined from data given in Table 2 using relations betweenthe grid size and parameters given in Paper III. All scalingparameters depend on the period P which is equal to thegrid size of the supercluster-void network (see Section 4.4
of Paper III). The most accurate value of the period comesfrom the relation P = ∆mean/1.01; here ∆mean is the meanseparation between maxima and between minima. We get
P = 115 ± 15 h−1Mpc. (2)
The variance of the mean period is given mainly by the errorof positions of the last maximum and minimum. The error inthe location of the outermost extrema is 25 h−1 Mpc whichcontributes an error of 5 h−1 Mpc in P . The actual erroris larger as we must take into account also possible cosmicscatter of the grid size in different volumes. Comparison ofdifferent subsamples yields the error estimate given in (2).We note that the value of the period of oscillations is veryclose to the mean separation between rich superclusters lo-cated on opposite sides of voids. The latter separation wasfound to be 120 h−1 Mpc in Paper I.
The amplitude of oscillations is given by the amplitudeof the first secondary maximum for clusters with measuredredshifts located in rich superclusters:
A = 0.28 ± 0.05. (3)
The error of the amplitude is estimated on the basis of thescatter of estimates of the amplitude for different subsamplesand of the Poisson error of data.
3.4 The parameters of the correlation function
Here we determine the numerical relations between variousparameters of the correlation function. As demonstrated inPaper III, the separation of the first secondary maximum ofthe correlation function from zero is always larger than theperiod of oscillations, and the difference between the secondand first secondary maximum is always larger than the dif-ference between the third and second secondary maximum.
Using the observed correlation function parameters inTable 2 we found the following relations: f1 = rmax/P =1.20; f21 = ∆21/P = 1.16; and f32 = ∆32/P = 0.84; where∆21 and ∆32 are mean separations of respective maximaof the correlation function. A comparison of numerical val-ues for these parameters with respective values found formodel samples in Paper III shows rather close agreement.This agreement is an additional argument indicating the re-ality of our results.
3.5 The correlation length
In this paper the major emphasis is on the study of the cor-relation function of clusters of galaxies on large scales. Ourdata contain information also on the correlation function onsmall scales, and in this Section we discuss our results forthe determination of the correlation length. This parameteris defined as the value of the separation r = r0 at whichthe correlation function ξ(r0) = 1. This parameter dependscritically on the characteristic size of superclusters.
We determined the correlation length using non-smoothed correlation functions since smoothing increases it.As for other parameters, the correlation length was foundseparately for cluster samples in rich and poor superclusters.Results are interesting: for clusters in rich superclusters thecorrelation length is
r0 = 46 ± 5 h−1Mpc, (4)

Oscillating correlation function 7
Figure 4. The correlation function calculated separately for the Northern (left panel) and Southern (right panel) Galactic hemispheresfor all clusters located in rich superclusters. Error corridors are also given.
Table 2. Parameters of the correlation function for various cluster samples
Sample N rmin rmax Amax σξ ∆21 ∆32 ∆mean
ACO.R.H1 869 78 144 0.056 0.051 126 116 122ACO.R.H2 624 79 131 0.056 0.060 137 117 122
ACO.R.H4 433 78 136 0.134 0.072 134 108 123ACO.R.H6 331 83 140 0.200 0.082 132 108 120ACO.R.H8 261 88 138 0.279 0.093 133 104 116
ACO.A.H8N 152 94 133 0.069 0.130 132 103 118ACO.A.H8S 167 97 143 0.275 0.124 140 105 118
and for clusters in poor superclusters
r0 = 17 ± 3 h−1Mpc. (5)
The errors are estimated on the basis of the scatter fromsamples for various minimum multiplicity. Differences in thecorrelation function at small scales are seen also in Figures 2and 3, although the smoothing makes the correlation lengthappear larger.
These differences are expected when we take into ac-count the geometric meaning of the correlation length – it isclose to the mean minor diameter of systems of clusters. Poorsuperclusters are small, but rich ones have much larger di-ameters (Jaaniste et al. 1997). Similar differences are foundalso for clusters in rich and poor superclusters in models(Paper III). These calculations show that there exists nounique correlation length for clusters; it is in fact a functionof cluster environment (the size of superclusters).
4 TESTING THE REALITY OF
OSCILLATIONS
The presence of oscillations in the cluster correlation func-tion was first established by one of us (VS) in December1994 and presented in a preprint by Saar et al. (1995). Sincethen we have discussed this result at several conferences andseminars. During these discussions a number of questionswere raised: Perhaps the local minima and maxima of thecorrelation function are just a random noise or due to se-lection effects, supercluster definition, smoothing, or someother disturbing effect? And if oscillations are real, can theybe reproduced in the framework of conventional CDM cos-mogony with Gaussian initial fluctuations, or do they de-
mand a radical change of our paradigms on the formationof structure in the Universe? To answer these questions wehave performed a number of tests. In this Section we discussthe reality of oscillations.
4.1 Errors in the correlation function
The most serious question is related to errors in the corre-lation function. Often the errors in the correlation functionare calculated from Poisson statistics. Mo, Jing, & Borner(1992) have shown that the cosmic variance is much largerthan the Poisson noise, and our results have confirmed this.Einasto & Gramann (1993) determined the error corridorby a bootstrap procedure. This method is also not very ac-curate since it cannot handle real variance of samples indifferent volumes of space. The only way to get an idea ofthe possible effect of this cosmic variance is to study variousmodels of the cluster distribution.
Results of this study are presented in detail in PaperIII. It is shown that the error corridor of the correlationfunction due to cosmic variance depends on the size of thesample (the number of particles N) and the nature of thedistribution of particles, and can be parameterised by Eq.(1) presented above. The parameter b of this equation has avalue about b ≈ 1.5 in models which have a large-scale distri-bution of clusters similar to the observed distribution. In ourcalculations we have used this value of the error parameter.The amplitude of oscillations of the correlation function forthe subsample of clusters in rich superclusters ACO.R.H8is about 3 times larger than the error; thus cosmic errorsdo not play an important role. If we use the sample of allclusters with redshifts (ACO.R.H1) then the amplitude of

8 J. Einasto et al.
the correlation function is approximately equal to the cos-mic variance (cf. Figure 2). Thus it is essential to divide thecluster sample into two populations with different proper-ties of the spatial distribution to establish the oscillatorybehaviour of the cluster correlation function.
4.2 Sample shape
Since the sample volume has the form of a double cone and isrestricted to a limiting distance, we will now check whetherthe curious shape of the sample can artificially generate os-cillations in the correlation function.
The strongest evidence against such an effect comesfrom the comparison of samples in rich and poor superclus-ters (cf Figures 2, 3). Both samples occupy identical double-cone shaped volume. The only difference lies in the spatialdistribution of clusters within the double conical volume. Itis very difficult to assume a selective influence of the samplevolume shape so that in case of clusters in rich superclustersthe shape generates oscillations in the correlation functionand in case of clusters in poor superclusters it produces asmooth correlation function near zero. The difference mustbe intrinsic.
To check this problem we studied in Paper III the influ-ence of the sample shape on the correlation function. Resultsshow that the double conical sample has about a factor of4 times fewer particles than the whole cubical sample, andthus cosmic variance is larger, but the value of the error pa-rameter b is almost the same as for the whole cubical sample.In the cases in which structural elements (clusters in high-density regions) led to an oscillatory behaviour of the corre-lation function, these were present in sufficient quantity alsowhen restricting the sample volume to a double-cone. If thesize of the conical sample is very small, then characteristicelements which determine the oscillating properties of thecorrelation function are not present in sufficient quantitiesand the correlation function becomes irregular.
4.3 Supercluster selection
The supercluster catalogue used in this study was compiledin Paper I using a neighbourhood radius 24 h−1 Mpc. Is thisradius crucial for the oscillatory behaviour of the correlationfunction?
The dependence of the supercluster catalogue onthe neighbourhood radius was investigated by Einasto etal. (1994). For neighbourhood radii ≥ 32 h−1 Mpc almostall clusters join to form one huge percolating system. Thusit is clear that a meaningful neighbourhood radius must besmaller than this value. If the radius is very small then weselect as superclusters only the highest density peaks of thedistribution of clusters, and the number of clusters in super-clusters becomes too small for the determination of the cor-relation function. To determine the influence of this param-eter we compiled superclusters using a series of values of theneighbourhood radius: 12, 16, and 20 h−1 Mpc. For all casesthe correlation function for clusters was calculated. The re-sults indicate that with decreasing neighbourhood radius theamplitude of oscillations of the correlation function increasessince only very compact superclusters will be selected. How-ever, positions of the maxima are practically the same as
for the adopted neighbourhood radius (24 h−1 Mpc). Thistest shows that the oscillating behaviour and parameters ofoscillations are quite stable and do not depend on the choiceof the neighbourhood radius.
4.4 Smoothing scale
To investigate the influence of the smoothing length on ourresults we calculated the correlation function for one samplewith various values of the dispersion σs. Results are shown inFigure 5. This calculation shows that there is no principaldifference between results for different smoothing lengths.Main parameters of the correlation function (the period andpositions of the maxima and minima) change only within afew per cent. The largest change is in the amplitude of os-cillations, which decreases considerably with the increase ofthe smoothing length. To avoid the influence of the smooth-ing we determined the amplitude from non-smoothed data.In all Figures we have used smoothing length, σs = 13 − 15h−1 Mpc. This almost completely removes the Poisson noise,and is sufficient to investigate details of the correlation func-tion above a scale of 30 h−1 Mpc.
4.5 Selection function
One frequently asked question is the influence of the selec-tion function. If the feature investigated is of the same scaleas the depth of the sample then small errors of the selectionfunction can seriously influence the results. To investigatethe influence of the selection function in our case we calcu-lated the correlation function of one sample for a number ofdifferent selection function parameters used in the calcula-tion of comparison Poisson samples. Results are presentedin Figure 5. In all cases the same procedure was appliedto calculate the selection function (discussed in Section 2above). Only the parameters of the selection function werechanged. As test sample we chose clusters in rich superclus-ters (ACO.R.H8). In this case the number-density of clus-ters decreases very rapidly with increasing distance from theGalactic pole (cf. Figure 1). If we ignore this rapid decreaseand adopt a standard value for the selection parameter (asfor all clusters), s0 = 0.14, then the overall mean slope ofthe correlation function changes. If we change the param-eter which determines the decrease of the number-densityof the sample with distance and adopt too low a value forthe number-density on the far side of the sample (d1 = 0.9instead of the correct value d1 = 0.8), then the whole cor-relation function on large scales increases. Both changes ofselection function parameters have, however, little effect onthe main parameters of the correlation function: none of theparameters quoted in Table 2 change by more than a fewper cent. Thus we can say that small errors of the selectionfunction do not influence our main results. This insensitivityis due to the fact that the size of our sample is much largerthan the scale of interest.
5 COMPARISON WITH MODELS
In this Section we compare our empirical correlation func-tion of clusters of galaxies with correlation functions cal-culated for several models. We use CDM-models of struc-

Oscillating correlation function 9
Figure 5. The influence of procedural artefacts on the correlation function. In the left panel for the sample with redshifts in richsuperclusters dots show the unsmoothed correlation function; dotted, solid, and dashed lines show the correlation function smoothedwith Gaussian dispersion 6.5, 13, and 20 h−1 Mpc, respectively. In the right panel the influence of the selection function in the correlationfunction is given. The dotted line is for the selection function with parameters s0 = 0.14, d0 = 1, d1 = 0.50; the solid line is for selectionfunction s0 = 0.38, d0 = 1, d1 = 0.80 (correct values); and the dashed line for selection function with s0 = 0.38, d0 = 1, d1 = 0.90.
Figure 6. The correlation functions of clusters for CDM models.Solid lines are for clusters in double conical subsamples located inpoor superclusters (with less than 8 members) and dotted linesare for clusters in double conical volumes in rich superclusters(with at least 8 members).
ture evolution, models with a double power-law spectrum,as well as geometrical models with randomly and regularlylocated superclusters. Our main questions are: Can the ob-served correlation function of clusters of galaxies be repro-duced by conventional models of structure evolution? If not,what changes in models are needed to reproduce the ob-served function?
5.1 Comparison with CDM-models
We have calculated several N-body models of structure evo-lution. One model is based on the standard CDM-scenarioof structure formation. It has the structure parameter Γ =Ωh = 0.5, with the Hubble parameter h = 0.5, and thedensity parameter Ω = 1. The second model was calculatedwith a double power-law perturbation spectrum, with spec-tral index n = 1 on large scales (wavenumber k < k0), indexn = −1.5 on small scales (wavenumber k > k0), and tran-
sition at wavelength λ0 = 2π/k0 = 115 h−1 Mpc. Modelswere calculated using a particle-mesh code with 1283 par-ticles and 2563 cells in a cube of size L = 700 h−1 Mpc.Clusters of galaxies were searched with a method similar tothe “friends-of-friends” algorithm. The mass of clusters isdetermined from the number of particles in volumes of en-hanced density. The lower limit of the mass of clusters waschosen so that the total number of clusters in the sample wasin agreement with the mean spatial density of Abell–ACOclusters.
We calculated the correlation function of model clus-ters for the whole box using all clusters and also for doubleconical subsamples of clusters in rich and poor superclus-ters. We applied a supercluster search algorithm identical tothe one used for the search of real superclusters with neigh-bourhood radius 24 h−1 Mpc. In each of our simulationswe constructed three double conical volumes (cone axes di-rected along the three axes) and searched clusters in thesevolumes. Clusters were divided into two populations – one inrich superclusters and the other in poor ones, with limitingrichness Ncl = 8 as in the real case. Correlation functionsfound for the CDM model are plotted in Figure 6.
There are no regular oscillations in the correlation func-tion in rich superclusters in either the whole cubical sampleor in the double conical volumes. The correlation functionsof simulated clusters in the double conical volumes and lo-cated in rich superclusters have several peaks and valleys onlarge scales, but the location and amplitude of these peaks israndom (for details see next subsection). Model clusters inpoor superclusters have a smooth correlation function closeto zero at large scales.
This result is expected as the power spectrum of CDM-models is a smooth function of wavenumber, with a contin-uous change in the slope of the spectrum. For such spectraoscillations of the correlation function are not expected sinceoscillations occur only in the case when the spectrum has apeak and the slope near the peak changes suddenly (Frischet al. 1995, Paper III).
This does not exclude the possibility that, in some re-alizations of a model with a CDM-type perturbation spec-trum, peaks and valleys in the correlation function of clus-

10 J. Einasto et al.
Figure 7. Parameters of oscillations of the correlation function: period, amplitude (left panel), and their scatters, Dperiod, Dampl (rightpanel). The large filled circle shows the observed values for clusters in rich superclusters (sample ACO.R.H8); dots are respective valuesfor 1000 realizations of the random supercluster model, crosses for the standard CDM model, and stars for a low-density CDM modelwith cosmological constant (see Paper III for details). Contours indicate the probability level for random superclusters outside of which1 % of periods and amplitudes are found. To calculate parameters of oscillations for this figure we used smoothed correlation functions.In this case the amplitude of oscillations from observations is A = 0.186 (the value given in Table 2 corresponds to the amplitude of theunsmoothed correlation function).
ters in rich superclusters are located more regularly. Thisoccurs when the perturbation spectrum accidently has anextra peak near its maximum. In the next subsection westudy more closely the possibility of how frequently such apeak can occur.
5.2 Comparison with random supercluster
samples
To investigate the possible generation of regular oscillationsin the correlation function for double conical volumes of clus-ters in rich superclusters we must generate a large number ofrealizations of models. The distribution of clusters in mod-els is determined essentially by medium scale perturbationswhich are still in the linear stage of evolution. Thus it is notnecessary to use conventional N-body calculations of struc-ture evolution. Borgani et al. (1995) have used the Zeldovichapproximation for a similar task. In this paper we shall ap-ply an even simpler procedure to investigate the regularityof the large-scale distribution of clusters.
In the present problem it is not essential to use exactlythe CDM spectrum. What is important is to apply a broadband spectrum with a smooth transition between regionson large and short wavelengths. As demonstrated in PaperIII, the power spectrum of the random supercluster modelis rather similar to the power spectrum of CDM-models, inparticular in the medium wavelength region of interest forthe present study. Correlation functions of these models arealso very similar. We make use of this similarity and generatea large number of realizations for the random superclustermodel to see how frequently such a model can reproduceproperties of the real correlation function.
In this model (for details see Paper III) superclusters arelocated randomly in space. They contain clusters of galaxies
in a number which is in agreement with the observed mul-tiplicity function of superclusters. To imitate the observa-tions we choose a double conical sub-volume from the wholecubical sample and select clusters which belong to rich su-perclusters with at least 8 member clusters. The full sidelength of the cube is taken to be L = 700 h−1 Mpc. Thenumber of superclusters in models is taken to be approx-imately equal to 650; in this case the number of clustersin rich superclusters of double conical subsamples is about300 as in the observed cluster sample in rich superclusters.Our calculations show that the correlation function of thismodel also has maxima and minima, but they are locatedrandomly, similar to the cluster correlation function of CDMmodels. We can characterise oscillations and their regularityby the following parameters: the mean period of oscillations,its rms scatter, the mean amplitude of oscillations, and itsrms scatter.
Results of our calculations for 1000 realizations of therandom supercluster model are shown in Figure 7, separatelyfor the amplitude vs. period and for the scatter of the ampli-tude vs. the scatter of the period. If a point lies outside the1 % contour, it has a probability of occurrence of <1 %. Wesee that for both variable parameter pairs the observationalpoint lies just outside the 1 % contour. In other words, theprobability that our observed sample is taken from the samemodel is approximately 1 % for both variable pairs.
We applied a further test using the fine details of thecorrelation function. As noted above, the position of the firstsecondary maximum of the correlation function, as well asmean differences between the second and first, and betweenthe third and second maxima, are in certain fixed relationswith the period of oscillation. We can define a correlationfunction variance parameter as follows:
ψ2 = (f0 − f00)2 + (f1 − f10)
2 + (f2 − f20)2, (6)

Oscillating correlation function 11
Figure 8. The integrated frequency distribution of the correla-tion function variance parameter ψ. The observed value of ψ isnoted by a vertical bar.
where f0, f1, and f2 are values of parameters defined by Eqs(12) – (14) of Paper III and found for the test model; f00, f10,and f20 are respective values calculated for the geometricmodel with regular structure. As demonstrated in Paper III,these parameters are rather stable and depend only little onmodels with different details of the structure. Essential is thepresence of a regular network of superclusters and voids.Thus we have calculated the correlation function varianceparameter ψ for all our 1000 test models (see Figure 8).
This calculation shows that the mean value of the pa-rameter is ψ = 1.4. The distribution is very asymmetric witha long tail towards large ψ values. The lowest value for these1000 realizations is 0.1. The observed value is ψ ≈ 0.14. Wesee that the probability that the observed case is taken ran-domly from the family of random supercluster model is alsoabout 1 %. All our variables used in these tests are inde-pendent of each other, thus the probability to get all fiveparameters fitted once by the random supercluster modelsimultaneously is much smaller than 1 %.
Even if using the random supercluster model is a fastbut not ideal procedure for calculating these probabilitiesthe main result would be hardly changed by more ingenioussimulations: the probability is very small. Thus we concludethat within standard cosmological models it is difficult togenerate the observed correlation function.
6 POWER SPECTRUM
Which perturbation spectrum can produce the observedcorrelation function of clusters in rich superclusters? An-alytic calculations made in Paper III show that the correla-tion function has an oscillatory behaviour only if the powerspectrum has a peak at the corresponding wavenumber. Inthis paper it was also demonstrated that the sharpness andheight of the peak in the spectrum determines the characterof oscillations of the correlation function.
Here we estimate the possible shape of the spectrum onscales of interest using comparison with models with knownspectra. We shall compare the spectra and correlation func-tions of three models: the standard CDM model, the double
Figure 9. Power spectra for the CDM model, the double power-law model, and the mixed geometrical model, plotted with solid,dotted, and dashed lines, respectively.
power-law model, and a mixed geometrical model consist-ing of two populations, one with superclusters located ran-domly along regularly spaced rods and the other of irregu-larly spaced superclusters (see Paper III for details). Powerspectra of these three models are shown in Figure 9.
We see that the double-power law model and the mixedmodel have rather similar spectra near the maximum. Bothmodels have also similar correlation functions with weak os-cillations (see Figure 4 of Paper III). The oscillations aremore regular in the geometrical model, as expected. How-ever, the differences between models are not large. The max-imal deviation of the spectrum near the maximum from thecorresponding CDM-type spectrum is ∼ 0.2 dex, i.e. abouta factor of 1.25 in amplitude.
These models show that already a modest deviationfrom the standard CDM spectrum produces an oscillatingcorrelation function for clusters in rich superclusters.
The actual power spectrum of our cluster sample has apeak of even higher amplitude (see E97).
7 CONCLUSIONS
We have determined the correlation function for clusters ofgalaxies separately for all clusters and for clusters located inrich and in poor superclusters. The correlation function ofclusters in rich superclusters that form the skeleton of thesupercluster-void network has an oscillatory behaviour witha period of 115 ± 15 h−1 Mpc. Within an interval of ∼ 650h−1 Mpc over which observational data are available, fivesecondary maxima and minima of the correlation functionare seen. The amplitude of oscillations is larger for clusterslocated in very rich superclusters.
The scale of the supercluster-void network found hereon the basis of the cluster correlation function is rather closeto the scale found using other methods, such as void diame-ter analysis, pencil-beam studies, or absorbers in the line-of-sight to QSOs (Quashnock et al. 1996), although the latterapplies to higher redshifts.
The reality of oscillations of the cluster correlation func-tion is supported by the following arguments.

12 J. Einasto et al.
(1) The error corridor of the correlation function de-termined for clusters in rich superclusters is much smallerthan the amplitude of oscillations. (2) Oscillations are seenin cluster samples located in both Galactic hemispheres. (3)Similar oscillations with lower amplitude are observed inthe Las Campanas Redshift Survey of galaxies by Tucker etal. (1995, 1997). (4) In all samples the shape of the oscillat-ing correlation function follows almost exactly the expectedshape for a quasi-regular network of superclusters and voids.(5) The double conical shape of the volume sampled by clus-ters cannot influence the results. (6) Parameters of the os-cillations practically do not depend on the smoothing lengthof the correlation function, nor on the neighbourhood radiusused in supercluster definition, or on errors of the selectionfunction used to calculate the correlation function.
The correlation length of clusters of galaxies dependson the cluster population: for clusters in poor superclustersit is about 17 h−1 Mpc; for clusters in rich superclusters itis about 45 h−1 Mpc.
We have compared the observed correlation functionwith correlation functions calculated for clusters in CDM-models and for models with randomly distributed superclus-ters. These models have a broad-band power spectrum witha smooth transition between the positive spectral index atlong wavelengths and a negative index at small wavelengths.In these models the correlation function of clusters in rich su-perclusters located in double conical volumes also has peaksand valleys, but these peaks and valleys are distributed ran-domly and have random amplitudes. The probability thata model with a broad-band power spectrum has parametersof oscillations of the correlation function similar to observedparameters is very low (≪ 1 %).
Analytical calculations show that oscillations of the cor-relation function appear only in case that the power spec-trum has a peak at the wavelength equal to the period ofoscillations. We have compared spectra and correlation func-tions of models with various heights of the peak in the spec-trum. These calculations show that it is possible to generatean oscillating correlation function for clusters in rich super-clusters if the height of the peak is of the order of a factorof at least 1.25 in amplitude over the conventional smoothspectrum.
The fact that the amplitude of oscillations near the lastmaximum is still rather large suggests that the coherenceof positions of high-density regions extends over very largeseparations (at least 10 % of the diameter of the observableUniverse).Acknowledgements:
This work was supported by Estonian Science Founda-tion grant 182 and International Science Foundation grantLLF100. We thank Bernard Jones, Jerry Ostriker and JimPeebles for discussions. JE and AS were supported by theDeutsche Forschungsgemeinschaft in Potsdam; AS was par-tially supported by the Russian Foundation for Basic Re-search under Grant 96-02-17591.
REFERENCES
Abell, G., 1958, ApJS 3, 211
Abell, G., Corwin, H. & Olowin, R., 1989, ApJS 70, 1 (ACO)
Andernach, H., Tago, E., & Stengler-Larrea, E., 1995, Ap. Lett.&
Comm. 31, 27Andernach, H., Tago, E., & Stengler-Larrea, E., 1997, (in prepa-
ration)Bahcall, N. A., 1991, ApJ 376, 43Bahcall, N. A., Soneira, R.M., 1983, ApJ 270, 20Bond, J.R., & Efstathiou, G., 1984, ApJ 285, L45Borgani, A., Plionis, M., Coles, P., & Moscardini, L., 1995, MN-
RAS 277, 1191Broadhurst, T.J., Ellis, R.S., Koo, D.C., & Szalay, A.S., 1990.,
Nature 343, 726Dekel, A., Blumenthal, G.R., Primack, J.R., & Olivier, S., 1989,
ApJ 338, L5Dekel, A., Blumenthal, G.R., Primack, J.R., & Stanhill, D., 1992,
MNRAS 257, 715Doroshkevich, A. G, Tucker, D. L., Oemler, A., Kirshner, R. P.,
Lin, H., Shectman, S. A., Landy, S.D., & Fong, R., 1996, MN-RAS 283, 1281
Einasto, J., Einasto, M., Gottlober, S., Muller, V., Saar, V.,Starobinsky, A.A., Tago, E., & Tucker, D., Andernach, H.,Frisch, P., 1997a, Nature 385, 139 (E97)
Einasto, J., Einasto, M., Frisch, P., Gottlober, S., Muller, V.,Saar, V., Starobinsky, A.A., Tago, E., & Tucker, D., 1997b,MNRAS (Paper III)
Einasto, J., & Gramann, M., 1993, ApJ 407, 443Einasto, J., Gramann, M., Saar, E. and Tago, E. 1993, MNRAS
260, 705Einasto, M., Einasto, J., Tago, E., Dalton, G., & Andernach, H.,
1994, MNRAS, 269, 301Einasto, M., Tago, E., Jaaniste, J., Einasto, J., & Andernach, H.,
1997c, AA (Paper I, accepted, astro-ph/9610088)Fetisova, T. S., Kuznetsov, D. Y., Lipovetskij, V. A., Starobinsky,
A. A. & Olowin, R. P., 1993, Pis’ma v Astr. Zh. 19, 508 (engl.transl. in Astron. Lett. 19, 198)
Frisch, P., Einasto, J., Einasto, M., Freudling, W., Fricke, K.J.,Gramann, M., Saar, V., & Toomet, O., 1995, AA 296, 611
Jaaniste, J., Tago, E., Einasto, M., Einasto, J., & Andernach, H.,1997, (in preparation)
Kaiser, N., & Peacock, J. A., 1991, ApJ 379, 482Kopylov, A. I., Kuznetsov D. Y., Fetisova T. S. & Shvarzman V.
F., 1984, Astr. Tsirk. 1347, 1Kopylov, A. I., Kuznetsov D. Y., Fetisova T. S. & Shvarzman
V. F., 1988, in Large Scale Structure of the Universe, eds. J.Audouze, M.–C. Pelletan, A. Szalay (Kluwer), 129
Landy, S.D., Shectman, S.A., Lin, H., Kirshner, R.P., Oemler,A.A., & Tucker, D., 1996, ApJ 456, L1
Mo, H.J., Deng, Z.G., Xia, X.Y., Schiller, P., & Borner, G. 1992a,
AA 257, 1Mo, H.J., Jing, Y.P., & Borner, G., 1992c, ApJ 392, 452Mo, H.J., Xia, X.Y., Deng, Z.G., Borner, G., & Fang, L.Z., 1992b,
AA 256, L23Peacock, J.A., & West, M.J., 1992, MNRAS 259, 494Quashnock, J.M., Vanden Berk, D.E. & York D.G., 1996, ApJ
472, L69Saar, V., Tago, E., Einasto, J., Einasto, M. & Andernach, H.,
1995, astro-ph/9505053Sutherland, W., 1988, MNRAS 234, 159Tucker, D.L., Muller, V., Gottlober, S., Oemler, A. Jr., Kirshner,
R.P., Lin, H., Shectman, S.A., Landy, S.D., & Schechter, P.L.,1995, Bull. Amer. Astr. Soc. 27, 1365
Tucker, D.L., Oemler, A. Jr., Kirshner, R.P., Lin, H., Shectman,S.A., Landy, S.D., Schechter, P.L., Muller, V., Gottlober, S.,& Einasto, J., 1997, MNRAS (in press)
Zwicky,F., Wild, P., Herzog, E., Karpowicz M. & Kowal, C.T.,1961-68, Catalogue of Galaxies and of Clusters of Galaxies,Vols. I – VI. Pasadena, California Inst. Tech.
Copyright © 2022 FDOKUMEN