Investigating Phosphorus Sorption onto Kaolinite Using Isothermal Titration Calorimetry
9
560 SSSAJ: Volume 73: Number 2 • March–April 2009 Soil Sci. Soc. Am. J. 73:560-568 doi:10.2136/sssaj2008.0198 Received 4 June 2008. *Corresponding author ([email protected]). © Soil Science Society of America 677 S. Segoe Rd. Madison WI 53711 USA All rights reserved. No part of this periodical may be reproduced or transmitted in any form or by any means, electronic or mechanical, including photocopying, recording, or any information storage and retrieval system, without permission in writing from the publisher. Permission for printing and for reprinting the material contained herein has been obtained by the publisher. P hosphorus retention by soils is important to both agricul- tural production and surface water quality. In regard to sur- face water quality, P is typically the most limiting nutrient in freshwaters, and excessive concentrations can cause eutrophica- tion (Boesch et al., 2001; Correll, 1998). In addition, a major source of this P is from overland flow occurring over soils with elevated P concentrations (Daniel et al., 1998). Therefore, the mechanisms by which P is held onto soil minerals can impact the solubility and bioavailability of P, affecting both crop pro- duction (fertility) and water quality (transport). Phosphorus is dominantly retained onto soils by 1:1 clay minerals and Fe and Al oxides and hydroxides (amorphous and crystalline) and is precipitated as Al, Fe, and Ca phosphates. Phosphorus sorp- tion mechanisms include ligand exchange (adsorption), precip- itation, lattice diffusion, and anion exchange, with the first two mechanisms being the most important (Sparks, 2003). A common method for quantifying and studying the P sorption potential of soils and soil minerals is the sorption isotherm (Bolster and Hornberger, 2007; Altin et al., 1998). Briefly, soil materials are equilibrated with a solute of interest (in this case, P) at various concentrations and the equilibrium solution concentrations are measured. Sorbed and solution concentrations are then typically described using a model such as the Langmuir or Freundlich (Siddique and Robinson, 2003; Zhang et al., 2005), which can provide information such as sorption capacity and binding energy (equilibrium constant) based on a number of assumptions. Many studies have utilized sorption isotherms in making conclusions about mechanisms; however, this is not considered valid (Sparks, 2003). In ad- dition, thermodynamic parameters can also be indirectly de- termined from the results of sorption isotherms. For example, developing sorption isotherms at several different temperatures provides data for estimating the change in enthalpy, entropy, and Gibbs free energy (ΔH, ΔS, and ΔG, respectively) from the Clausius–Claperon, Van Hoff, and Gibbs equations (Horsfall and Spiff, 2005; Trivedi et al., 2004; Khan and Singh, 1987). These estimates are limited, however, by the assumptions of the model chosen to estimate the equilibrium constant in addition to the Clausius–Claperon equation (chemically inert surface and no effect of sorption on the surface). As a result, conclu- sions from studies on P sorption have been inconsistent with regard to enthalpy. For example, Malati et al. (1993) concluded that P sorption onto kaolinite was endothermic at pH < 5 and exothermic at pH > 7; the Langmuir equation was used to de- termine the equilibrium constants. On the other hand, Barrow Chad J. Penn* Jason G. Warren Dep. of Plant and Soil Sciences 367 Agricultural Hall Oklahoma State Univ. Stillwater, OK 74078-1020 SOIL CHEMISTRY Investigating Phosphorus Sorption onto Kaolinite Using Isothermal Titration Calorimetry The mechanism of P sorption onto soils has a strong impact on bioavailability and transport potential. Assessment of sorption energy via isothermal titration calorimetry (ITC) can potentially provide information on P sorption mechanisms. This study used ITC to examine P sorption onto poorly crystalline Georgia kaolinite at pH 4.3 and 6.3. A complementary sorption and desorption isotherm was also conducted at the same kaolinite/solution ratio as the titration experiment. In addition, other ITC experiments were performed to help interpret the kaolinite–P thermograms. Thermograms (measured heat response) for titration of P into pH 4.3 kaolinite indicated initial fast exothermic followed by slower endothermic reactions; both reactions decreased with further P additions. By the eighth titration, the net reaction turned from exothermic to endothermic, indicating that the endothermic reaction now dominated. The complementary sorption isotherm indicated a statistically significant “breakpoint” at this same P addition. In contrast, pH 6.3 kaolinite exhibited only exothermic reactions during P titrations. Based on sorption isotherms, solution thermodynamic modeling, and supporting ITC experiments, the exothermic reaction indicated P sorption onto kaolinite by ligand exchange and dissolution or protonation of kaolinite while the endothermic reaction indicated Al phosphate precipitation. Sequential desorption isotherm results showed that although the pH 4.3 and 6.3 kaolinite desorbed the same amount of P when normalized for initial surface P concentrations, kaolinite at pH 4.3 desorbed P at a greater rate than at pH 6.3. Compared with traditional solid-state techniques, ITC provides continuous data collection as reactions are occurring, rather than discrete observations. Abbreviations: DI, deionized; ICP–AES, inductively coupled plasma atomic emission spectroscopy; ITC, isothermal titration calorimetry.
Transcript of Investigating Phosphorus Sorption onto Kaolinite Using Isothermal Titration Calorimetry
560 SSSAJ: Volume 73: Number 2 • March–April 2009
Soil Sci. Soc. Am. J. 73:560-568doi:10.2136/sssaj2008.0198Received 4 June 2008.*Corresponding author ([email protected]).© Soil Science Society of America677 S. Segoe Rd. Madison WI 53711 USAAll rights reserved. No part of this periodical may be reproduced or transmitted in any form or by any means, electronic or mechanical, including photocopying, recording, or any information storage and retrieval system, without permission in writing from the publisher. Permission for printing and for reprinting the material contained herein has been obtained by the publisher.
Phosphorus retention by soils is important to both agricul-tural production and surface water quality. In regard to sur-
face water quality, P is typically the most limiting nutrient in freshwaters, and excessive concentrations can cause eutrophica-tion (Boesch et al., 2001; Correll, 1998). In addition, a major source of this P is from overland fl ow occurring over soils with elevated P concentrations (Daniel et al., 1998). Therefore, the mechanisms by which P is held onto soil minerals can impact the solubility and bioavailability of P, affecting both crop pro-duction (fertility) and water quality (transport). Phosphorus is dominantly retained onto soils by 1:1 clay minerals and Fe and Al oxides and hydroxides (amorphous and crystalline) and is precipitated as Al, Fe, and Ca phosphates. Phosphorus sorp-tion mechanisms include ligand exchange (adsorption), precip-itation, lattice diffusion, and anion exchange, with the fi rst two mechanisms being the most important (Sparks, 2003).
A common method for quantifying and studying the P sorption potential of soils and soil minerals is the sorption isotherm (Bolster and Hornberger, 2007; Altin et al., 1998). Briefl y, soil materials are equilibrated with a solute of interest (in this case, P) at various concentrations and the equilibrium solution concentrations are measured. Sorbed and solution concentrations are then typically described using a model such as the Langmuir or Freundlich (Siddique and Robinson, 2003; Zhang et al., 2005), which can provide information such as sorption capacity and binding energy (equilibrium constant) based on a number of assumptions. Many studies have utilized sorption isotherms in making conclusions about mechanisms; however, this is not considered valid (Sparks, 2003). In ad-dition, thermodynamic parameters can also be indirectly de-termined from the results of sorption isotherms. For example, developing sorption isotherms at several different temperatures provides data for estimating the change in enthalpy, entropy, and Gibbs free energy (ΔH, ΔS, and ΔG, respectively) from the Clausius–Claperon, Van Hoff, and Gibbs equations (Horsfall and Spiff, 2005; Trivedi et al., 2004; Khan and Singh, 1987). These estimates are limited, however, by the assumptions of the model chosen to estimate the equilibrium constant in addition to the Clausius–Claperon equation (chemically inert surface and no effect of sorption on the surface). As a result, conclu-sions from studies on P sorption have been inconsistent with regard to enthalpy. For example, Malati et al. (1993) concluded that P sorption onto kaolinite was endothermic at pH < 5 and exothermic at pH > 7; the Langmuir equation was used to de-termine the equilibrium constants. On the other hand, Barrow
Chad J. Penn*Jason G. WarrenDep. of Plant and Soil Sciences367 Agricultural HallOklahoma State Univ.Stillwater, OK 74078-1020
SOIL
CH
EMIS
TRY
Investigating Phosphorus Sorption onto Kaolinite Using Isothermal Titration Calorimetry
The mechanism of P sorption onto soils has a strong impact on bioavailability and transport potential. Assessment of sorption energy via isothermal titration calorimetry (ITC) can potentially provide information on P sorption mechanisms. This study used ITC to examine P sorption onto poorly crystalline Georgia kaolinite at pH 4.3 and 6.3. A complementary sorption and desorption isotherm was also conducted at the same kaolinite/solution ratio as the titration experiment. In addition, other ITC experiments were performed to help interpret the kaolinite–P thermograms. Thermograms (measured heat response) for titration of P into pH 4.3 kaolinite indicated initial fast exothermic followed by slower endothermic reactions; both reactions decreased with further P additions. By the eighth titration, the net reaction turned from exothermic to endothermic, indicating that the endothermic reaction now dominated. The complementary sorption isotherm indicated a statistically signifi cant
“breakpoint” at this same P addition. In contrast, pH 6.3 kaolinite exhibited only exothermic reactions during P titrations. Based on sorption isotherms, solution thermodynamic modeling, and supporting ITC experiments, the exothermic reaction indicated P sorption onto kaolinite by ligand exchange and dissolution or protonation of kaolinite while the endothermic reaction indicated Al phosphate precipitation. Sequential desorption isotherm results showed that although the pH 4.3 and 6.3 kaolinite desorbed the same amount of P when normalized for initial surface P concentrations, kaolinite at pH 4.3 desorbed P at a greater rate than at pH 6.3. Compared with traditional solid-state techniques, ITC provides continuous data collection as reactions are occurring, rather than discrete observations.
Abbreviations: DI, deionized; ICP–AES, inductively coupled plasma atomic emission spectroscopy; ITC, isothermal titration calorimetry.
SSSAJ: Volume 73: Number 2 • March –April 2009 561
(1983) and Froelich (1988) showed that P sorption was exother-mic, since an increase in temperature decreased P sorption.
In recent years, solid-state techniques to study sorption mechanisms have become more available to soil scientists. This includes techniques such as resonance spectroscopies (i.e., nuclear magnetic spectroscopy), microscopies (transmission electron microscopy and scanning electron microscopy), and absorption, emission, and relaxation spectroscopies. These methods provide information on the bonding environment and therefore mechanisms of adsorption and chemical trans-formations. Such methods, however, only provide discrete data, in other words, chemical information at that particular mo-ment of “pseudo-equilibrium.” For most samples, this is typi-cally conducted “before” and “after” the reaction has occurred. Thus, there is no data provided during the reaction.
Calorimetry provides a sensitive and direct quantitative measure of the heat of a reaction on a surface, as opposed to indirect assessments by modeling of sorption isotherms. In ad-dition, techniques such as fl ow-through calorimetry and ITC permit the collection of data as a reaction proceeds, rather than at single discrete points. Briefl y, this involves the use of a calo-rimeter for the detection of changes in heat emitted (exotherm) or absorbed (endotherm) as a solute is added to a solution or suspension. Such instruments have been used in the investiga-tion of sorption mechanisms and thermodynamics (Kabengi et al., 2006a; Cai et al., 2006; Kaya, 2004; Rhue et al., 2002; Miltenburg and Golterman, 1998; Zou et al., 1997), ion ex-change (Kabengi et al., 2006b; Appel et al., 2002), and sur-face charge (Kabengi et al., 2006b). Calorimetric techniques are not “stand alone,” however; correct interpretation of the data involves some knowledge of the system being studied and complimentary solution or solid-state data.
The objectives of this study were to: (i) investigate the sorp-tion of P to kaolinite using ITC and a traditional sorption iso-therm; and (ii) determine the potential for ITC to provide infor-mation on the desorption potential of P-amended kaolinite.
MATERIALS AND METHODSIsothermal Titration Calorimetry
All ITC experiments were conducted on a CSC 4200 Isothermal Titration Calorimeter (CSC Inc., Lindon, UT) at 25°C. The ITC had a sensitivity of 0.4 μJ detectable heat effect and a “noise level” of ±0.04 μJ s−1 (deconvoluted signal). All titrations (both solution and kaolinite) entailed 25 titrations at 0.01 mL per titration and 300-s in-tervals. Reaction vessels were stirred during all ITC experiments. For each experiment, a blank was determined by titration of the respective solution into deionized (DI) water under the same conditions used for the actual experiment. Data produced from the blank titrations were subtracted from the sample titrations.
Kaolinite used in all experiments consisted of a poorly crys-talline Georgia kaolinite (Source Clays Repository, West Lafayette, IN). This sample was used “as is” (pH 4.3) and also pH adjusted (pH 6.3). The sample was adjusted to a pH 6.3 by slow addition of 0.01 mol L−1 NaOH to a kaolinite suspension (via a magnetic stir plate) while monitoring the pH with a pH electrode. The moisture in the resulting pH-adjusted sample was evaporated in an oven at 30°C. For all kaolinite ITC experiments, 100 mg of both pH 4.3 and 6.3 ka-olinites were weighed out in a 1.3-mL reaction vessel and suspended in 0.75 mL of DI water. The kaolinite was titrated with the following
solutions: (i) 0.01 mol L−1 NaH2PO4, (ii) 0.01 mol L−1 NH4F, and (iii) 0.1 mol L−1 HCl.
In addition, a 0.01 mol L−1 AlCl3 solution was titrated with 0.01 mol L−1 NaH2PO4 and 0.01 mol L−1 NH4F. For these solution titrations, 1.3 mL of AlCl3 was titrated by displacement; that is for every 0.1 mL of titrant added to the solution, the resulting mixture displaced 0.1 mL into a waste container.
Sorption IsothermA P sorption isotherm was conducted on pH 4.3 and 6.3 kao-
linite samples meant to correspond to the ITC titration experiment. Thus, the isotherm possessed the same number of points as the ITC titrations (plus a control, which received no P). The kaolinite/solution/P added ratios were the same as those utilized in the ITC ex-periment. Samples were shaken for 2 h (the same time period required for all ITC titrations to be completed). Samples were then centrifuged at 2000 rpm for 10 min and fi ltered through a 0.45-μm membrane. Solutions were analyzed for P by inductively coupled plasma atomic emission spectroscopy (ICP–AES). The pH of all solutions was mea-sured with a pH electrode. The amount of P sorbed was calculated based on the amount of P added to the kaolinite samples and the P remaining in solution. These values were applied to a nonlinear Langmuir using the following equation:
=+
max
1S KCSKC
[1]
where S is the sorbed P concentration (mg kg−1), Smax is the maximum sorption capacity of the soil (mg kg−1), K is the Langmuir binding strength coeffi cient (L mg−1), and C is the equilibrium concentration (mg L−1). The best-fi t model parameters for the nonlinear equation were obtained by fi nding the combinations of parameters that provid-ed the best fi t to the observed data. Specifi cally, this was done by using a Microsoft Excel spreadsheet as prepared and described by Bolster and Hornberger (2007). This program was designed to provide K and Smax values, in addition to the “goodness-of-fi t” indicator, model ef-fi ciency (E). An E value of 1 indicates a perfect fi t of the data and E < 0 indicates that taking the average of all measured values would give a better prediction than the model (Bolster and Hornberger, 2007). In addition, the linear form of the Langmuir is also presented for visual comparisons between kaolinite samples and also for estimation of a
“breakpoint,” or change in slope. The linear form is the “Langmuir linearization” described by
= +max max
1C CS S K S
[2]
The data for this version of a linear Langmuir is typically presented by plotting C (x axis) against C/S (y axis). The identifi cation and loca-tion of signifi cant changes in the slope of this relationship (i.e., the breakpoint) was determined using the PROC NLIN procedure of SAS (SAS Institute, 2003).
Desorption IsothermThe P-sorbed samples from the sorption isotherm were subject-
ed to 10 sequential desorptions with DI water. This entailed a 1:10 kaolinite/solution ratio, 1 h of shaking, centrifuging (2000 rpm for 13 min), and fi ltration with a 0.45-μm membrane. Solutions were analyzed for P, Si, and Al by ICP–AES and pH via a pH electrode. Measured solution parameters from the fi rst desorption were used in construction of a double-function solubility diagram. The equilibrium
562 SSSAJ: Volume 73: Number 2 • March–April 2009
K values of kaolinite, quartz, variscite, and alumina were plotted in comparison with the actual data points (Lindsay, 1979). In addition, the release of P with successive extractions is described by a power-law relationship as represented by
( )−=Solution P extraction number ba [3]
Constant a of this relationship represents solution P obtained with a single extraction, while b represents the rate of P release per extrac-tion (Sharpley, 1996). An increase in b indicates a decrease in the rate of P release with successive extractions of soil. This relationship was determined for all samples.
After all samples were subjected to the sequential desorptions, 0.5 g of each air-dried sample was extracted at a 1:40 kaolinte/0.2 mol L−1 acid ammonium oxalate (pH 3) ratio (2 h reaction time in the dark; McKeague and Day, 1966). All extracts were analyzed for P, Al, and Si by ICP–AES. In addition, isotherm samples for both pH 4.3 and 6.3
kaolinite corresponding to titration numbers 0, 1, 2, 3, 23, 24, and 25 were analyzed by x-ray diffraction (powder mount).
RESULTS AND DISCUSSIONPhosphorus Sorption Isotherm
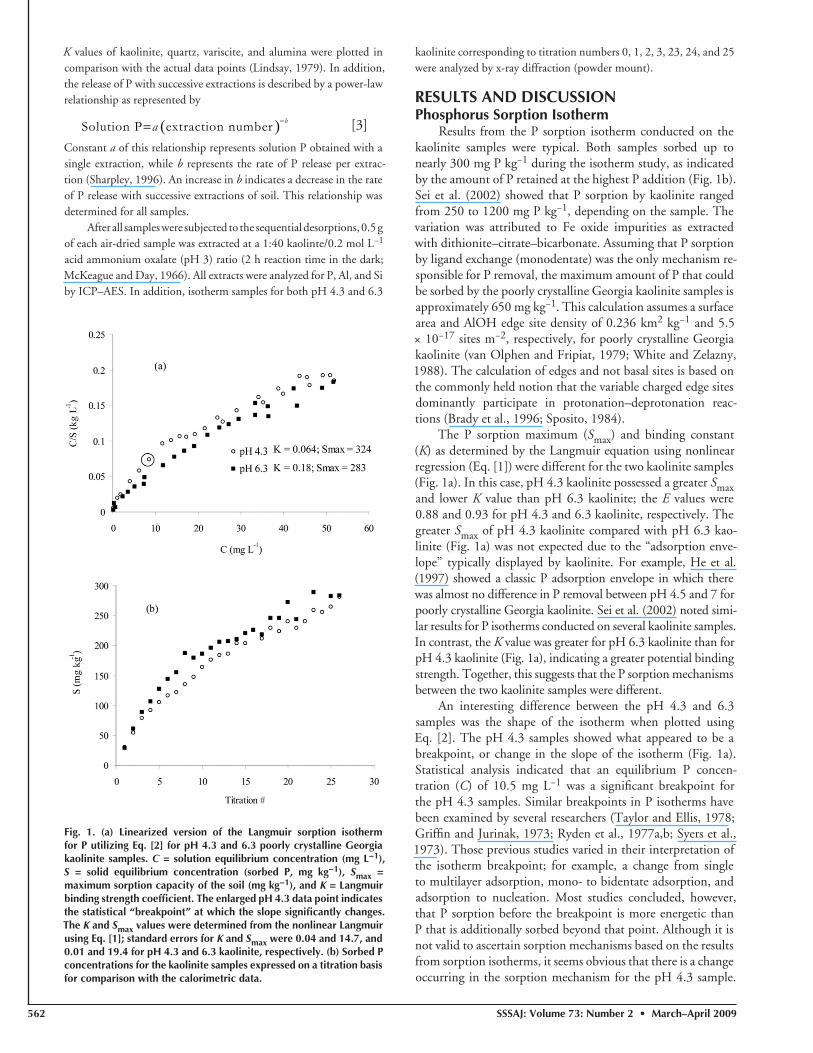
Results from the P sorption isotherm conducted on the kaolinite samples were typical. Both samples sorbed up to nearly 300 mg P kg−1 during the isotherm study, as indicated by the amount of P retained at the highest P addition (Fig. 1b). Sei et al. (2002) showed that P sorption by kaolinite ranged from 250 to 1200 mg P kg−1, depending on the sample. The variation was attributed to Fe oxide impurities as extracted with dithionite–citrate–bicarbonate. Assuming that P sorption by ligand exchange (monodentate) was the only mechanism re-sponsible for P removal, the maximum amount of P that could be sorbed by the poorly crystalline Georgia kaolinite samples is approximately 650 mg kg−1. This calculation assumes a surface area and AlOH edge site density of 0.236 km2 kg−1 and 5.5 × 10⁻¹⁷ sites m−2, respectively, for poorly crystalline Georgia kaolinite (van Olphen and Fripiat, 1979; White and Zelazny, 1988). The calculation of edges and not basal sites is based on the commonly held notion that the variable charged edge sites dominantly participate in protonation–deprotonation reac-tions (Brady et al., 1996; Sposito, 1984).
The P sorption maximum (Smax) and binding constant (K) as determined by the Langmuir equation using nonlinear regression (Eq. [1]) were different for the two kaolinite samples (Fig. 1a). In this case, pH 4.3 kaolinite possessed a greater Smax and lower K value than pH 6.3 kaolinite; the E values were 0.88 and 0.93 for pH 4.3 and 6.3 kaolinite, respectively. The greater Smax of pH 4.3 kaolinite compared with pH 6.3 kao-linite (Fig. 1a) was not expected due to the “adsorption enve-lope” typically displayed by kaolinite. For example, He et al. (1997) showed a classic P adsorption envelope in which there was almost no difference in P removal between pH 4.5 and 7 for poorly crystalline Georgia kaolinite. Sei et al. (2002) noted simi-lar results for P isotherms conducted on several kaolinite samples. In contrast, the K value was greater for pH 6.3 kaolinite than for pH 4.3 kaolinite (Fig. 1a), indicating a greater potential binding strength. Together, this suggests that the P sorption mechanisms between the two kaolinite samples were different.
An interesting difference between the pH 4.3 and 6.3 samples was the shape of the isotherm when plotted using Eq. [2]. The pH 4.3 samples showed what appeared to be a breakpoint, or change in the slope of the isotherm (Fig. 1a). Statistical analysis indicated that an equilibrium P concen-tration (C) of 10.5 mg L−1 was a signifi cant breakpoint for the pH 4.3 samples. Similar breakpoints in P isotherms have been examined by several researchers (Taylor and Ellis, 1978; Griffi n and Jurinak, 1973; Ryden et al., 1977a,b; Syers et al., 1973). Those previous studies varied in their interpretation of the isotherm breakpoint; for example, a change from single to multilayer adsorption, mono- to bidentate adsorption, and adsorption to nucleation. Most studies concluded, however, that P sorption before the breakpoint is more energetic than P that is additionally sorbed beyond that point. Although it is not valid to ascertain sorption mechanisms based on the results from sorption isotherms, it seems obvious that there is a change occurring in the sorption mechanism for the pH 4.3 sample.
Fig. 1. (a) Linearized version of the Langmuir sorption isotherm for P utilizing Eq. [2] for pH 4.3 and 6.3 poorly crystalline Georgia kaolinite samples. C = solution equilibrium concentration (mg L−1), S = solid equilibrium concentration (sorbed P, mg kg−1), Smax = maximum sorption capacity of the soil (mg kg−1), and K = Langmuir binding strength coeffi cient. The enlarged pH 4.3 data point indicates the statistical “breakpoint” at which the slope signifi cantly changes. The K and Smax values were determined from the nonlinear Langmuir using Eq. [1]; standard errors for K and Smax were 0.04 and 14.7, and 0.01 and 19.4 for pH 4.3 and 6.3 kaolinite, respectively. (b) Sorbed P concentrations for the kaolinite samples expressed on a titration basis for comparison with the calorimetric data.
SSSAJ: Volume 73: Number 2 • March –April 2009 563
Considering that the P sorption isotherm was conducted to mimic the P titration procedure using ITC, it is important to note that the pH 4.3 isotherm breakpoint corresponds to P titra-tion no. 6 (Fig. 1b).
Isothermal Titration Calorimetry:Phosphorus Additions
The heat produced or consumed from P titrations is obvi-ously the result of several potential reactions that may be occur-ring in various simultaneous combinations, such as dissolution, precipitation, protonation, deprotonation, ligand exchange, and neutralization. For each reaction, the heat produced is a function of two different factors: the change in the enthalpy of reaction (ΔHr, a constant) and the extent of the reaction. This is expressed as
( )Δ Δ=r , rp pq H n [4]
where qr,p is the quantity of heat due to the reaction from the start of the titration to any point p on the plot, and Δnp is the moles of product formed from the start of the titration to point p (Eatough et al., 1985). Put into the context of this study, high amounts of heat are produced when a large amount of P sorbs onto the mineral surface or when the particular reac-
tion mechanism possesses an elevated ΔHr. Due to the likeli-hood that multiple reactions are occurring simultaneously, ΔHr values for P sorption are not presented. Instead, the amounts of heat produced or consumed from the titrations are used as an indicator of potential changes in reactions occurring during the course of the titrations rather than as a means to estimate ΔHr. These experiments were conducted, however, to mini-mize the differences between the two kaolinite samples with regard to the number of different reactions that could occur on titration with P.
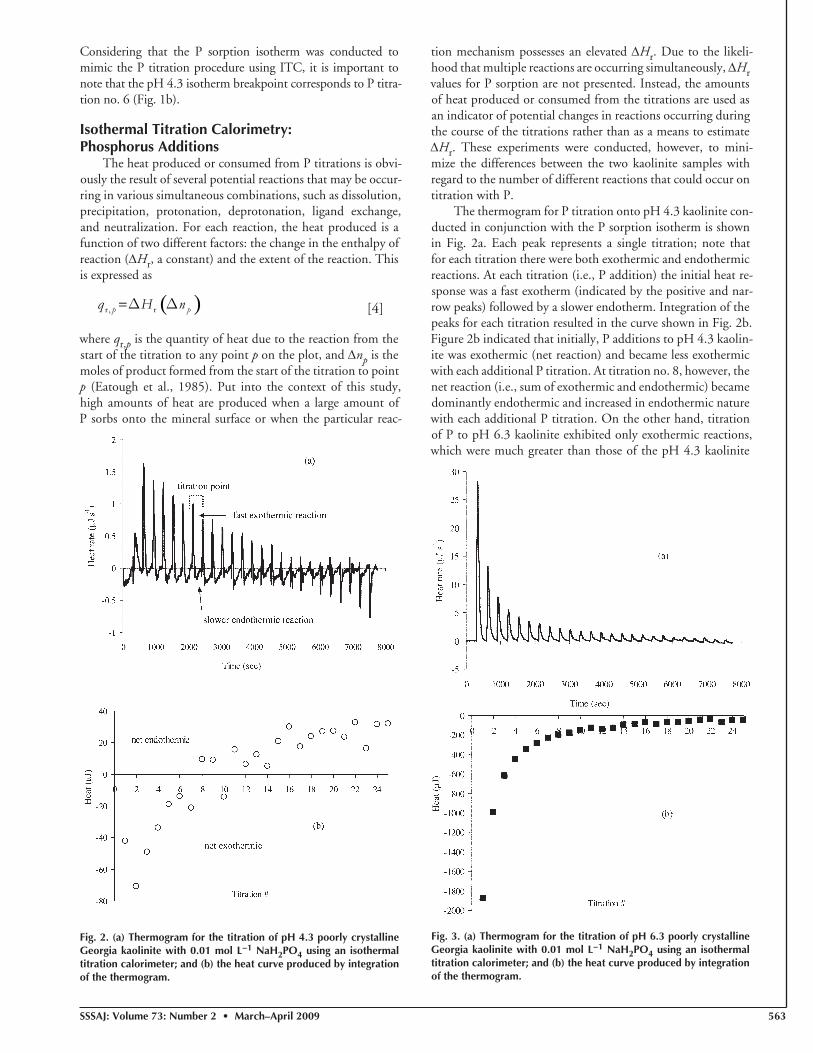
The thermogram for P titration onto pH 4.3 kaolinite con-ducted in conjunction with the P sorption isotherm is shown in Fig. 2a. Each peak represents a single titration; note that for each titration there were both exothermic and endothermic reactions. At each titration (i.e., P addition) the initial heat re-sponse was a fast exotherm (indicated by the positive and nar-row peaks) followed by a slower endotherm. Integration of the peaks for each titration resulted in the curve shown in Fig. 2b. Figure 2b indicated that initially, P additions to pH 4.3 kaolin-ite was exothermic (net reaction) and became less exothermic with each additional P titration. At titration no. 8, however, the net reaction (i.e., sum of exothermic and endothermic) became dominantly endothermic and increased in endothermic nature with each additional P titration. On the other hand, titration of P to pH 6.3 kaolinite exhibited only exothermic reactions, which were much greater than those of the pH 4.3 kaolinite
Fig. 2. (a) Thermogram for the titration of pH 4.3 poorly crystalline Georgia kaolinite with 0.01 mol L−1 NaH2PO4 using an isothermal titration calorimeter; and (b) the heat curve produced by integration of the thermogram.
Fig. 3. (a) Thermogram for the titration of pH 6.3 poorly crystalline Georgia kaolinite with 0.01 mol L−1 NaH2PO4 using an isothermal titration calorimeter; and (b) the heat curve produced by integration of the thermogram.
564 SSSAJ: Volume 73: Number 2 • March–April 2009
(Fig. 3a and 3b). Similar to the pH 4.3 kaolinite, the reaction became less exothermic with each additional P titration (Fig. 3a and 3b). Exothermic heat produced from P sorption reac-tions is expected to decrease (become less negative) with each P addition since the moles of product per titration (sorbed P, Δnp) decrease with each additional titration (Eq. [4]). Using a fl ow microcalorimeter, Kaya (2004) also showed that phenol and pyridine sorption onto kaolinite was exothermic, with heat emission decreasing as the coverage increased. They attributed this to higher energy sites being occupied fi rst followed by low-er energy sites. Using ITC, Miltenburg and Golterman (1998) titrated Fe hydroxide with P, resulting in a thermogram similar to the pH 6.3 kaolinite titration observed in the current study.
Based on the knowledge that there were similar amounts of P sorbed among both kaolinite samples (Δnp; Fig. 1) and assuming that the non-P-sorption reactions occurring in both samples were similar, Eq. [4] suggests that the differences in heat response (qr,p) between pH 4.3 and 6.3 kaolinite was mostly a result of differences in ΔHr. Since this parameter is a constant for each reaction type (i.e., mechanism), it follows that the two
kaolinite samples sorbed P by different mechanisms. Specifi cally, it seems that the exothermic and endothermic reactions were a result of two different P sorption mechanisms. Again, since the amount of P sorption was similar among the kaolinite samples, the appreciably lower amounts of heat produced during the fi rst six titrations of the pH 4.3 kaolinite compared with the pH 6.3 kaolinite (Fig. 2b and 3b) suggests that both exother-mic and endothermic P sorption reactions were occurring si-multaneously on the pH 4.3 kaolinite. This is clearly shown in the thermogram for pH 4.3 kaolinite (Fig. 2a), as discussed above. Note that this change from dominantly exothermic sorption to endothermic sorption occurred at approximately the same titration point as the “breakpoint” determined from the P sorption isotherm (Fig. 1 and 2). Furthermore, based on the fact that the exothermic reaction occurred much faster than the following endothermic reaction (Fig. 2a; the exotherms are more narrow peaks than the endotherms), we hypothesize that the exothermic P sorption reaction is a ligand exchange mecha-nism while the endothermic reaction is mostly precipitation of Al phosphate.
Phosphorus Sorption: Ligand Exchange vs. Precipitation
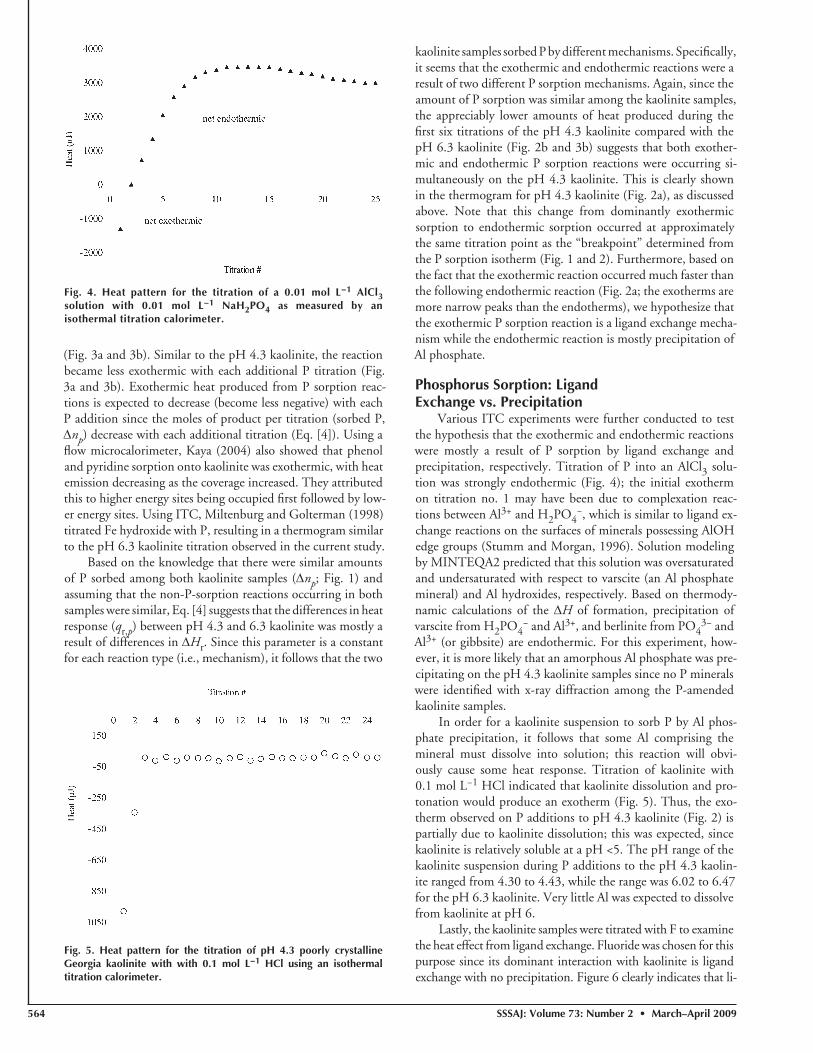
Various ITC experiments were further conducted to test the hypothesis that the exothermic and endothermic reactions were mostly a result of P sorption by ligand exchange and precipitation, respectively. Titration of P into an AlCl3 solu-tion was strongly endothermic (Fig. 4); the initial exotherm on titration no. 1 may have been due to complexation reac-tions between Al3+ and H2PO4
−, which is similar to ligand ex-change reactions on the surfaces of minerals possessing AlOH edge groups (Stumm and Morgan, 1996). Solution modeling by MINTEQA2 predicted that this solution was oversaturated and undersaturated with respect to varscite (an Al phosphate mineral) and Al hydroxides, respectively. Based on thermody-namic calculations of the ΔH of formation, precipitation of varscite from H2PO4
− and Al3+, and berlinite from PO43− and
Al3+ (or gibbsite) are endothermic. For this experiment, how-ever, it is more likely that an amorphous Al phosphate was pre-cipitating on the pH 4.3 kaolinite samples since no P minerals were identifi ed with x-ray diffraction among the P-amended kaolinite samples.
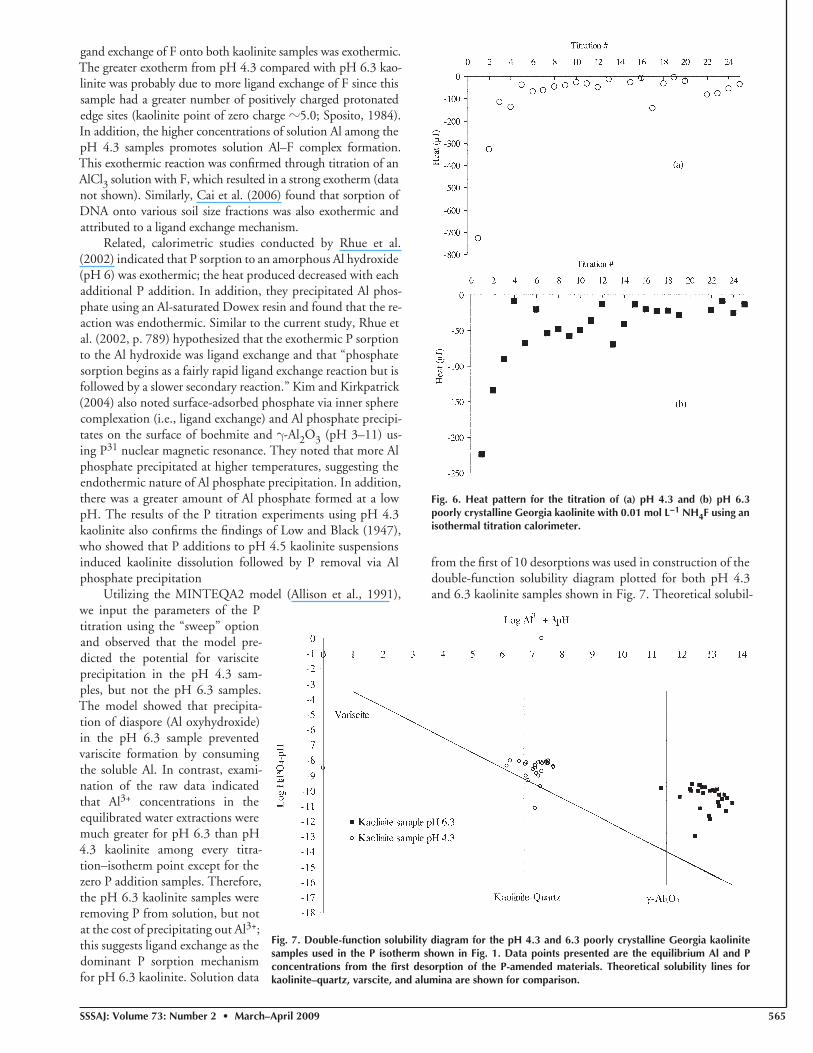
In order for a kaolinite suspension to sorb P by Al phos-phate precipitation, it follows that some Al comprising the mineral must dissolve into solution; this reaction will obvi-ously cause some heat response. Titration of kaolinite with 0.1 mol L−1 HCl indicated that kaolinite dissolution and pro-tonation would produce an exotherm (Fig. 5). Thus, the exo-therm observed on P additions to pH 4.3 kaolinite (Fig. 2) is partially due to kaolinite dissolution; this was expected, since kaolinite is relatively soluble at a pH <5. The pH range of the kaolinite suspension during P additions to the pH 4.3 kaolin-ite ranged from 4.30 to 4.43, while the range was 6.02 to 6.47 for the pH 6.3 kaolinite. Very little Al was expected to dissolve from kaolinite at pH 6.
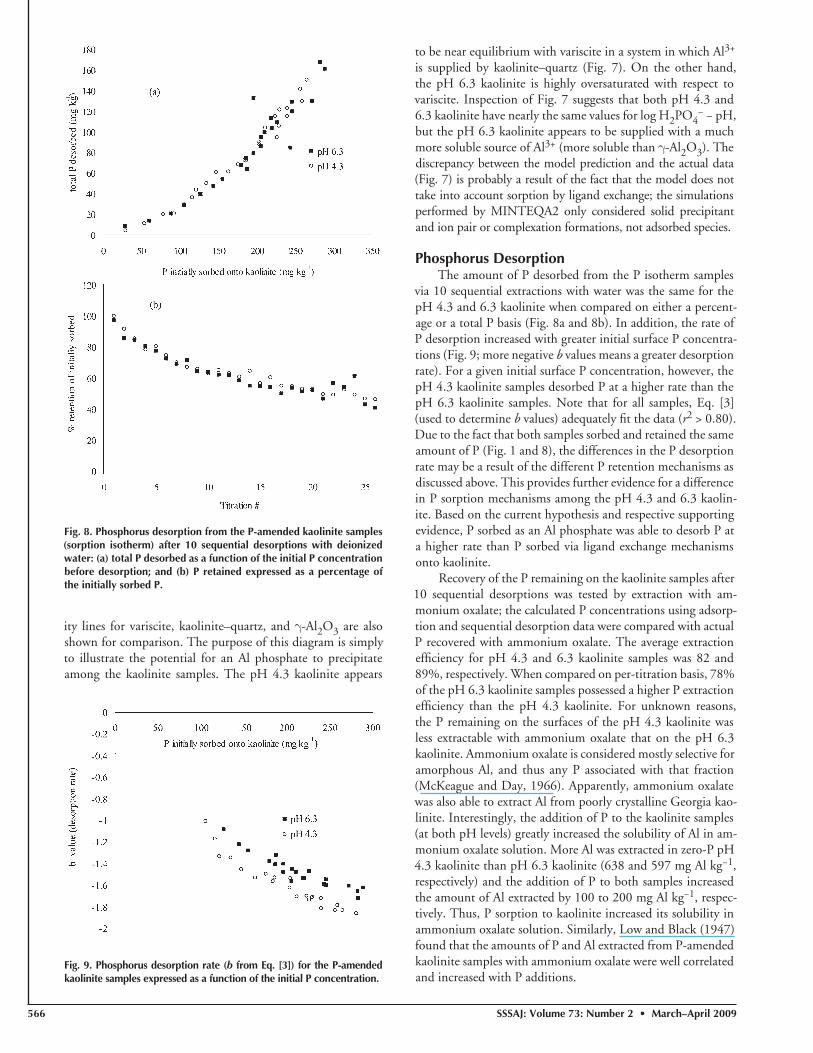
Lastly, the kaolinite samples were titrated with F to examine the heat effect from ligand exchange. Fluoride was chosen for this purpose since its dominant interaction with kaolinite is ligand exchange with no precipitation. Figure 6 clearly indicates that li-
Fig. 4. Heat pattern for the titration of a 0.01 mol L−1 AlCl3 solution with 0.01 mol L−1 NaH2PO4 as measured by an isothermal titration calorimeter.
Fig. 5. Heat pattern for the titration of pH 4.3 poorly crystalline Georgia kaolinite with with 0.1 mol L−1 HCl using an isothermal titration calorimeter.
SSSAJ: Volume 73: Number 2 • March –April 2009 565
gand exchange of F onto both kaolinite samples was exothermic. The greater exotherm from pH 4.3 compared with pH 6.3 kao-linite was probably due to more ligand exchange of F since this sample had a greater number of positively charged protonated edge sites (kaolinite point of zero charge ?5.0; Sposito, 1984). In addition, the higher concentrations of solution Al among the pH 4.3 samples promotes solution Al–F complex formation. This exothermic reaction was confi rmed through titration of an AlCl3 solution with F, which resulted in a strong exotherm (data not shown). Similarly, Cai et al. (2006) found that sorption of DNA onto various soil size fractions was also exothermic and attributed to a ligand exchange mechanism.
Related, calorimetric studies conducted by Rhue et al. (2002) indicated that P sorption to an amorphous Al hydroxide (pH 6) was exothermic; the heat produced decreased with each additional P addition. In addition, they precipitated Al phos-phate using an Al-saturated Dowex resin and found that the re-action was endothermic. Similar to the current study, Rhue et al. (2002, p. 789) hypothesized that the exothermic P sorption to the Al hydroxide was ligand exchange and that “phosphate sorption begins as a fairly rapid ligand exchange reaction but is followed by a slower secondary reaction.” Kim and Kirkpatrick (2004) also noted surface-adsorbed phosphate via inner sphere complexation (i.e., ligand exchange) and Al phosphate precipi-tates on the surface of boehmite and γ-Al2O3 (pH 3–11) us-ing P31 nuclear magnetic resonance. They noted that more Al phosphate precipitated at higher temperatures, suggesting the endothermic nature of Al phosphate precipitation. In addition, there was a greater amount of Al phosphate formed at a low pH. The results of the P titration experiments using pH 4.3 kaolinite also confi rms the fi ndings of Low and Black (1947), who showed that P additions to pH 4.5 kaolinite suspensions induced kaolinite dissolution followed by P removal via Al phosphate precipitation
Utilizing the MINTEQA2 model (Allison et al., 1991), we input the parameters of the P titration using the “sweep” option and observed that the model pre-dicted the potential for variscite precipitation in the pH 4.3 sam-ples, but not the pH 6.3 samples. The model showed that precipita-tion of diaspore (Al oxyhydroxide) in the pH 6.3 sample prevented variscite formation by consuming the soluble Al. In contrast, exami-nation of the raw data indicated that Al3+ concentrations in the equilibrated water extractions were much greater for pH 6.3 than pH 4.3 kaolinite among every titra-tion–isotherm point except for the zero P addition samples. Therefore, the pH 6.3 kaolinite samples were removing P from solution, but not at the cost of precipitating out Al3+; this suggests ligand exchange as the dominant P sorption mechanism for pH 6.3 kaolinite. Solution data
from the fi rst of 10 desorptions was used in construction of the double-function solubility diagram plotted for both pH 4.3 and 6.3 kaolinite samples shown in Fig. 7. Theoretical solubil-
Fig. 6. Heat pattern for the titration of (a) pH 4.3 and (b) pH 6.3 poorly crystalline Georgia kaolinite with 0.01 mol L−1 NH4F using an isothermal titration calorimeter.
Fig. 7. Double-function solubility diagram for the pH 4.3 and 6.3 poorly crystalline Georgia kaolinite samples used in the P isotherm shown in Fig. 1. Data points presented are the equilibrium Al and P concentrations from the fi rst desorption of the P-amended materials. Theoretical solubility lines for kaolinite–quartz, varscite, and alumina are shown for comparison.
566 SSSAJ: Volume 73: Number 2 • March–April 2009
ity lines for variscite, kaolinite–quartz, and γ-Al2O3 are also shown for comparison. The purpose of this diagram is simply to illustrate the potential for an Al phosphate to precipitate among the kaolinite samples. The pH 4.3 kaolinite appears
to be near equilibrium with variscite in a system in which Al3+ is supplied by kaolinite–quartz (Fig. 7). On the other hand, the pH 6.3 kaolinite is highly oversaturated with respect to variscite. Inspection of Fig. 7 suggests that both pH 4.3 and 6.3 kaolinite have nearly the same values for log H2PO4
− − pH, but the pH 6.3 kaolinite appears to be supplied with a much more soluble source of Al3+ (more soluble than γ-Al2O3). The discrepancy between the model prediction and the actual data (Fig. 7) is probably a result of the fact that the model does not take into account sorption by ligand exchange; the simulations performed by MINTEQA2 only considered solid precipitant and ion pair or complexation formations, not adsorbed species.
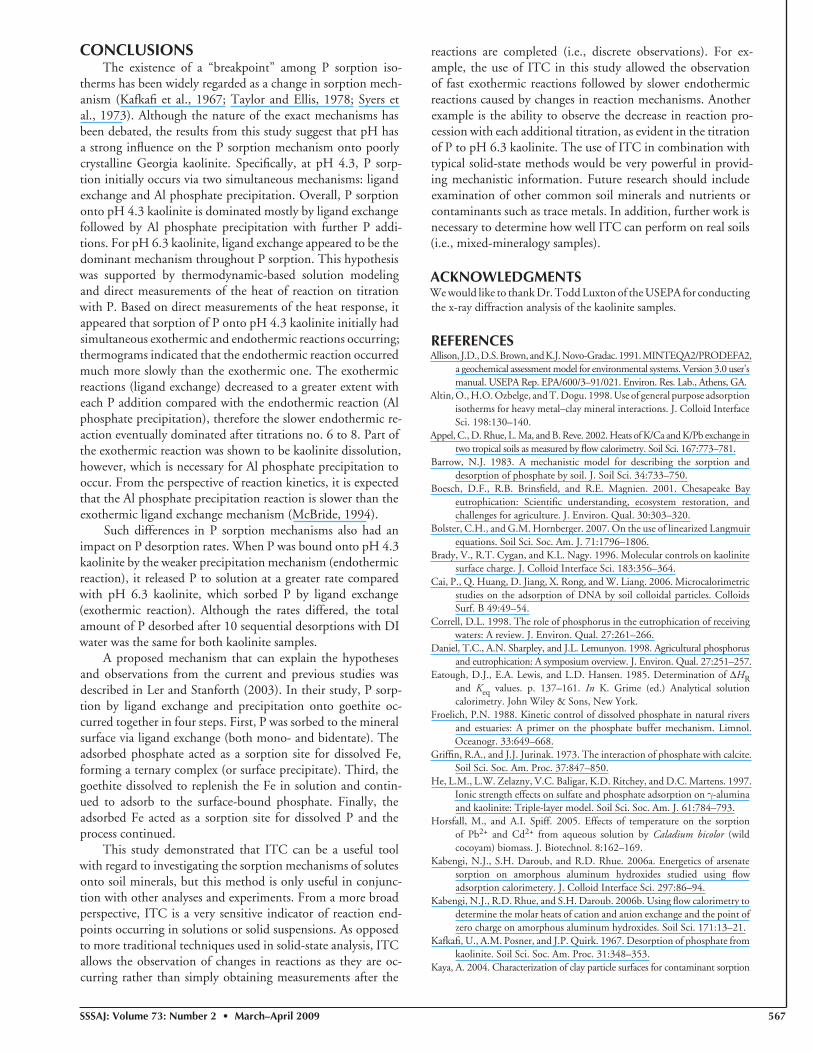
Phosphorus DesorptionThe amount of P desorbed from the P isotherm samples
via 10 sequential extractions with water was the same for the pH 4.3 and 6.3 kaolinite when compared on either a percent-age or a total P basis (Fig. 8a and 8b). In addition, the rate of P desorption increased with greater initial surface P concentra-tions (Fig. 9; more negative b values means a greater desorption rate). For a given initial surface P concentration, however, the pH 4.3 kaolinite samples desorbed P at a higher rate than the pH 6.3 kaolinite samples. Note that for all samples, Eq. [3] (used to determine b values) adequately fi t the data (r2 > 0.80). Due to the fact that both samples sorbed and retained the same amount of P (Fig. 1 and 8), the differences in the P desorption rate may be a result of the different P retention mechanisms as discussed above. This provides further evidence for a difference in P sorption mechanisms among the pH 4.3 and 6.3 kaolin-ite. Based on the current hypothesis and respective supporting evidence, P sorbed as an Al phosphate was able to desorb P at a higher rate than P sorbed via ligand exchange mechanisms onto kaolinite.
Recovery of the P remaining on the kaolinite samples after 10 sequential desorptions was tested by extraction with am-monium oxalate; the calculated P concentrations using adsorp-tion and sequential desorption data were compared with actual P recovered with ammonium oxalate. The average extraction effi ciency for pH 4.3 and 6.3 kaolinite samples was 82 and 89%, respectively. When compared on per-titration basis, 78% of the pH 6.3 kaolinite samples possessed a higher P extraction effi ciency than the pH 4.3 kaolinite. For unknown reasons, the P remaining on the surfaces of the pH 4.3 kaolinite was less extractable with ammonium oxalate that on the pH 6.3 kaolinite. Ammonium oxalate is considered mostly selective for amorphous Al, and thus any P associated with that fraction (McKeague and Day, 1966). Apparently, ammonium oxalate was also able to extract Al from poorly crystalline Georgia kao-linite. Interestingly, the addition of P to the kaolinite samples (at both pH levels) greatly increased the solubility of Al in am-monium oxalate solution. More Al was extracted in zero-P pH 4.3 kaolinite than pH 6.3 kaolinite (638 and 597 mg Al kg−1, respectively) and the addition of P to both samples increased the amount of Al extracted by 100 to 200 mg Al kg−1, respec-tively. Thus, P sorption to kaolinite increased its solubility in ammonium oxalate solution. Similarly, Low and Black (1947) found that the amounts of P and Al extracted from P-amended kaolinite samples with ammonium oxalate were well correlated and increased with P additions.
Fig. 8. Phosphorus desorption from the P-amended kaolinite samples (sorption isotherm) after 10 sequential desorptions with deionized water: (a) total P desorbed as a function of the initial P concentration before desorption; and (b) P retained expressed as a percentage of the initially sorbed P.
Fig. 9. Phosphorus desorption rate (b from Eq. [3]) for the P-amended kaolinite samples expressed as a function of the initial P concentration.
SSSAJ: Volume 73: Number 2 • March –April 2009 567
CONCLUSIONSThe existence of a “breakpoint” among P sorption iso-
therms has been widely regarded as a change in sorption mech-anism (Kafkafi et al., 1967; Taylor and Ellis, 1978; Syers et al., 1973). Although the nature of the exact mechanisms has been debated, the results from this study suggest that pH has a strong infl uence on the P sorption mechanism onto poorly crystalline Georgia kaolinite. Specifi cally, at pH 4.3, P sorp-tion initially occurs via two simultaneous mechanisms: ligand exchange and Al phosphate precipitation. Overall, P sorption onto pH 4.3 kaolinite is dominated mostly by ligand exchange followed by Al phosphate precipitation with further P addi-tions. For pH 6.3 kaolinite, ligand exchange appeared to be the dominant mechanism throughout P sorption. This hypothesis was supported by thermodynamic-based solution modeling and direct measurements of the heat of reaction on titration with P. Based on direct measurements of the heat response, it appeared that sorption of P onto pH 4.3 kaolinite initially had simultaneous exothermic and endothermic reactions occurring; thermograms indicated that the endothermic reaction occurred much more slowly than the exothermic one. The exothermic reactions (ligand exchange) decreased to a greater extent with each P addition compared with the endothermic reaction (Al phosphate precipitation), therefore the slower endothermic re-action eventually dominated after titrations no. 6 to 8. Part of the exothermic reaction was shown to be kaolinite dissolution, however, which is necessary for Al phosphate precipitation to occur. From the perspective of reaction kinetics, it is expected that the Al phosphate precipitation reaction is slower than the exothermic ligand exchange mechanism (McBride, 1994).
Such differences in P sorption mechanisms also had an impact on P desorption rates. When P was bound onto pH 4.3 kaolinite by the weaker precipitation mechanism (endothermic reaction), it released P to solution at a greater rate compared with pH 6.3 kaolinite, which sorbed P by ligand exchange (exothermic reaction). Although the rates differed, the total amount of P desorbed after 10 sequential desorptions with DI water was the same for both kaolinite samples.
A proposed mechanism that can explain the hypotheses and observations from the current and previous studies was described in Ler and Stanforth (2003). In their study, P sorp-tion by ligand exchange and precipitation onto goethite oc-curred together in four steps. First, P was sorbed to the mineral surface via ligand exchange (both mono- and bidentate). The adsorbed phosphate acted as a sorption site for dissolved Fe, forming a ternary complex (or surface precipitate). Third, the goethite dissolved to replenish the Fe in solution and contin-ued to adsorb to the surface-bound phosphate. Finally, the adsorbed Fe acted as a sorption site for dissolved P and the process continued.
This study demonstrated that ITC can be a useful tool with regard to investigating the sorption mechanisms of solutes onto soil minerals, but this method is only useful in conjunc-tion with other analyses and experiments. From a more broad perspective, ITC is a very sensitive indicator of reaction end-points occurring in solutions or solid suspensions. As opposed to more traditional techniques used in solid-state analysis, ITC allows the observation of changes in reactions as they are oc-curring rather than simply obtaining measurements after the
reactions are completed (i.e., discrete observations). For ex-ample, the use of ITC in this study allowed the observation of fast exothermic reactions followed by slower endothermic reactions caused by changes in reaction mechanisms. Another example is the ability to observe the decrease in reaction pro-cession with each additional titration, as evident in the titration of P to pH 6.3 kaolinite. The use of ITC in combination with typical solid-state methods would be very powerful in provid-ing mechanistic information. Future research should include examination of other common soil minerals and nutrients or contaminants such as trace metals. In addition, further work is necessary to determine how well ITC can perform on real soils (i.e., mixed-mineralogy samples).
ACKNOWLEDGMENTSWe would like to thank Dr. Todd Luxton of the USEPA for conducting the x-ray diffraction analysis of the kaolinite samples.
REFERENCESAllison, J.D., D.S. Brown, and K.J. Novo-Gradac. 1991. MINTEQA2/PRODEFA2,
a geochemical assessment model for environmental systems. Version 3.0 user’s manual. USEPA Rep. EPA/600/3–91/021. Environ. Res. Lab., Athens, GA.
Altin, O., H.O. Ozbelge, and T. Dogu. 1998. Use of general purpose adsorption isotherms for heavy metal–clay mineral interactions. J. Colloid Interface Sci. 198:130–140.
Appel, C., D. Rhue, L. Ma, and B. Reve. 2002. Heats of K/Ca and K/Pb exchange in two tropical soils as measured by fl ow calorimetry. Soil Sci. 167:773–781.
Barrow, N.J. 1983. A mechanistic model for describing the sorption and desorption of phosphate by soil. J. Soil Sci. 34:733–750.
Boesch, D.F., R.B. Brinsfi eld, and R.E. Magnien. 2001. Chesapeake Bay eutrophication: Scientifi c understanding, ecosystem restoration, and challenges for agriculture. J. Environ. Qual. 30:303–320.
Bolster, C.H., and G.M. Hornberger. 2007. On the use of linearized Langmuir equations. Soil Sci. Soc. Am. J. 71:1796–1806.
Brady, V., R.T. Cygan, and K.L. Nagy. 1996. Molecular controls on kaolinite surface charge. J. Colloid Interface Sci. 183:356–364.
Cai, P., Q. Huang, D. Jiang, X. Rong, and W. Liang. 2006. Microcalorimetric studies on the adsorption of DNA by soil colloidal particles. Colloids Surf. B 49:49–54.
Correll, D.L. 1998. The role of phosphorus in the eutrophication of receiving waters: A review. J. Environ. Qual. 27:261–266.
Daniel, T.C., A.N. Sharpley, and J.L. Lemunyon. 1998. Agricultural phosphorus and eutrophication: A symposium overview. J. Environ. Qual. 27:251–257.
Eatough, D.J., E.A. Lewis, and L.D. Hansen. 1985. Determination of ΔHR and Keq values. p. 137–161. In K. Grime (ed.) Analytical solution calorimetry. John Wiley & Sons, New York.
Froelich, P.N. 1988. Kinetic control of dissolved phosphate in natural rivers and estuaries: A primer on the phosphate buffer mechanism. Limnol. Oceanogr. 33:649–668.
Griffi n, R.A., and J.J. Jurinak. 1973. The interaction of phosphate with calcite. Soil Sci. Soc. Am. Proc. 37:847–850.
He, L.M., L.W. Zelazny, V.C. Baligar, K.D. Ritchey, and D.C. Martens. 1997. Ionic strength effects on sulfate and phosphate adsorption on γ-alumina and kaolinite: Triple-layer model. Soil Sci. Soc. Am. J. 61:784–793.
Horsfall, M., and A.I. Spiff. 2005. Effects of temperature on the sorption of Pb2+ and Cd2+ from aqueous solution by Caladium bicolor (wild cocoyam) biomass. J. Biotechnol. 8:162–169.
Kabengi, N.J., S.H. Daroub, and R.D. Rhue. 2006a. Energetics of arsenate sorption on amorphous aluminum hydroxides studied using fl ow adsorption calorimetery. J. Colloid Interface Sci. 297:86–94.
Kabengi, N.J., R.D. Rhue, and S.H. Daroub. 2006b. Using fl ow calorimetry to determine the molar heats of cation and anion exchange and the point of zero charge on amorphous aluminum hydroxides. Soil Sci. 171:13–21.
Kafkafi , U., A.M. Posner, and J.P. Quirk. 1967. Desorption of phosphate from kaolinite. Soil Sci. Soc. Am. Proc. 31:348–353.
Kaya, A. 2004. Characterization of clay particle surfaces for contaminant sorption
568 SSSAJ: Volume 73: Number 2 • March–April 2009
in soil barriers using fl ow microcalorimetry. J. Environ. Eng. 130:918–921.Khan, A., and R.P. Singh. 1987. Adsorption thermodynamics of carbofuran on
Sn(IV) arsenosilicate in H+, Na+, and Ca2+ forms. Colloids Surf. 24:33–42.Kim, Y., and R.J. Kirkpatrick. 2004. An investigation of phosphate adsorbed
on aluminium oxyhydroxide and oxide phases by nuclear magnetic resonance. Eur. J. Soil Sci. 55:243–251.
Ler, A., and R. Stanforth. 2003. Evidence for surface precipitation of phosphate on goethite. Environ. Sci. Technol. 37:2694–2700.
Lindsay, W.L. 1979. Chemical equilibrium in soils. John Wiley & Sons, New York.Low, P.F., and C.A. Black. 1947. Reactions of phosphate with kaolinite. Soil
Sci. 70:273–290.Malati, A.M., R.A. Fassam, and I.R. Henderson. 1993. Mechanism of
phosphate interaction with two reference clays and an anatase pigment. J. Chem. Technol. Biotechnol. 58:387–389.
McBride, M.B. 1994. Environmental chemistry of soils. Oxford Univ. Press, New York.
McKeague, J., and J.H. Day. 1966. Dithionite- and oxalate-extractable Fe and Al as aids in differentiating various classes of soils. Can. J. Soil Sci. 46:13–22.
Miltenburg, J.C., and H.L. Golterman. 1998. The energy of the adsorption of o-phosphate onto ferric hydroxide. Hydrobiologia 364:93–97.
Rhue, R.D., C. Appel, and N. Kabengi. 2002. Measuring surface chemical properties of soil using fl ow calorimetry. Soil Sci. 167:782–790.
Ryden, J.C., J.R. McLaughlin, and J.K. Syers. 1977a. Mechanisms of phosphate sorption by soils and hydrous ferric oxide gel. J. Soil Sci. 28:72–92.
Ryden, J.C., J.K. Syers, and J.R. McLaughlin. 1977b. Effects of ionic strength on chemisorption and potential-determining sorption of phosphate by soils. J. Soil Sci. 28:62–71.
SAS Institute. 2003. SAS user’s guide: Statistics. SAS Inst., Cary, NC.Sei, J., J.C. Jumas, J. Olivier-Fourcade, J. Quiquampoix, and S. Staunton.
2002. Role of iron oxides in the phosphate adsorption properties of kaolinites from the Ivory Coast. Clays Clay Miner. 50:217–222.
Sharpley, A.N. 1996. Availability of residual phosphorus in soils. Soil Sci. Soc. Am. J. 60:1459–1466.
Siddique, M.R., and J.S. Robinson. 2003. Phosphorus sorption and availability in soils amended with animal manures and sewage sludge. J. Environ. Qual. 32:1114–1121.
Sparks, D.L. 2003. Environmental soil chemistry. Academic Press, San Diego.Sposito, G. 1984. The surface chemistry of soils. Oxford Univ. Press, New York.Stumm, W., and J.J. Morgan. 1996. Aquatic chemistry. John Wiley & Sons,
New York.Syers, J.K., M.G. Browman, G.W. Smillie, and R.B. Corey. 1973. Phosphate
sorption by soils evaluated by the Langmuir adsorption equation. Soil Sci. Soc. Am. Proc. 37:358–363.
Taylor, R.W., and B.G. Ellis. 1978. A mechanism of phosphate adsorption on soil and anion exchange resin surfaces. Soil Sci. Soc. Am. J. 42:432–436.
Trivedi, P., J.A. Dyer, D.L. Sparks, and K. Pandya. 2004. Mechanistic and thermodynamic interpretations of zinc sorption onto ferrihydrite. J. Colloid Interface Sci. 70:77–85.
van Olphen, H., and J.J. Fripiat. 1979. Data handbook for clay materials and other non-metallic minerals. Pergamon Press, New York.
White, G.N., and L.W. Zelazny. 1988. Analysis and implication of the edge structure of dioctahedral phyllosilicates. Clays Clay Miner. 36:141–146.
Zhang, H., J.L. Schroder, J.K. Fuhrman, N.T. Basta, D.E. Storm, and M.E. Payton. 2005. Path and multiple regression analyses of phosphorus sorption capacity. Soil Sci. Soc. Am. J. 69:96–106.
Zou, L., B. Han, H. Yan, K.L. Kasperski, Y. Xu, and L.G. Hepler. 1997. Enthalpy of adsorption and isotherms for adsorption of naphthenic acid onto clays. J. Colloid Interface Sci. 190:472–475.