Differential scanning calorimetry as a tool to estimate binding parameters in multiligand binding...
8
Differential scanning calorimetry as a tool to estimate binding parameters in multiligand binding proteins M. Soledad Celej a, * , Sergio A. Dassie b , Martı ´n Gonza ´lez c , M. Lucia Bianconi d , Gerardo D. Fidelio a a Departamento de Quı ´mica Biolo ´ gica–CIQUIBIC, Facultad de Ciencias Quı ´micas, Universidad Nacional de Co ´ rdoba, X5000HUA Co ´ rdoba, Argentina b Unidad de Matema ´tica y Fı ´sica–INFIQC and Departamento de Fisicoquı ´mica–INFIQC, Facultad de Ciencias Quı ´micas, Universidad Nacional de Co ´ rdoba, X5000HUA Co ´ rdoba, Argentina c Department of Technology, Talecris Biotherapeutics, Clayton, NC 27520, USA d Programa de Bioquı ´mica e Biofı ´sica Celular, Instituto de Bioquı ´mica Me ´dica, Universidade Federal do Rio de Janeiro, RJ 21941-590 Rio de Janeiro, Brazil Received 11 October 2005 Available online 6 January 2006 Abstract The stability of proteins and their interactions with other molecules is a topic of special interest in biochemistry because many cellular processes depend on that. New methods and approaches are constantly developed to elucidate the energetics of biomolecular recognition. In this sense, the application of the theory of macromolecular unfolding linked to ligand binding to differential scanning calorimetry (DSC) has proved to be a useful tool to simultaneously characterize the energetics of unfolding and binding. Although the general theory is well known, the applicability of DSC to study the interaction of biomolecules is not common. In the current work, we estimated the binding parameters of 8-anilinonaphthalene-1-sulfonic acid to human serum albumin using DSC. This model system was chosen due to both the complex stoichiometry and the moderate binding constants. From DSC curves acquired at different ligand concentrations, we obtained the number of bound ligands, the binding constants, and the binding enthalpy for each independent binding site. Compared with those parameters determined by titration calorimetry, the results highlight the potentiality of DSC to estimate binding parameters in multiligand binding proteins. Ó 2005 Elsevier Inc. All rights reserved. Keywords: Differential scanning calorimetry; Protein–ligand interactions; Ligand binding parameters; Thermodynamics Differential scanning calorimetry (DSC) 1 is an experi- mental technique to measure the heat capacity of a system as a function of temperature in isobaric conditions. It has been widely used to acquire the thermodynamic parameters associated with processes triggered by changing the tem- perature. In biological sciences, cooperative structures such as lipid aggregates, nucleic acids, and proteins that undergo transitions originated from conformational changes, fusion, hydration/dehydration, aggregation/disaggrega- tion, or a combination of these factors are suitable to be studied by DSC [1,2]. Thus, with careful analysis and inter- pretation, DSC gives immediate access to fundamental thermodynamic information about systems of biological relevance. The stability of proteins and their interactions with other molecules is a topic of special interest in biochemistry because many cellular processes depend on that. These interactions have immediate consequences for protein sta- bility, as shown by varying the thermodynamic properties of the system. This fact provides an extra variable to study protein unfolding linked to ligand binding. In this regard, various approaches to describe macromolecular unfolding coupled to ligand binding were reported by several authors many years ago [3–6]. More recently, with the application of 0003-2697/$ - see front matter Ó 2005 Elsevier Inc. All rights reserved. doi:10.1016/j.ab.2005.12.029 * Corresponding author. Fax: +54 351 433 4074. E-mail address: [email protected] (M.S. Celej). 1 Abbreviations used: DSC, differential scanning calorimetry; 2 0 CMP, cytidine-2 0 -monophosphate; HSA, human serum albumin; 1,8-ANS, 8-anilinonaphthalene-1-sulfonic acid; ITC, isothermal titration calorimetry. www.elsevier.com/locate/yabio ANALYTICAL BIOCHEMISTRY Analytical Biochemistry 350 (2006) 277–284
-
Upload
independent -
Category
Documents
-
view
1 -
download
0
Transcript of Differential scanning calorimetry as a tool to estimate binding parameters in multiligand binding...
www.elsevier.com/locate/yabio
ANALYTICAL
BIOCHEMISTRY
Analytical Biochemistry 350 (2006) 277–284
Differential scanning calorimetry as a tool to estimatebinding parameters in multiligand binding proteins
M. Soledad Celej a,*, Sergio A. Dassie b, Martın Gonzalez c, M. Lucia Bianconi d,Gerardo D. Fidelio a
a Departamento de Quımica Biologica–CIQUIBIC, Facultad de Ciencias Quımicas, Universidad Nacional de Cordoba, X5000HUA Cordoba, Argentinab Unidad de Matematica y Fısica–INFIQC and Departamento de Fisicoquımica–INFIQC, Facultad de Ciencias Quımicas,
Universidad Nacional de Cordoba, X5000HUA Cordoba, Argentinac Department of Technology, Talecris Biotherapeutics, Clayton, NC 27520, USA
d Programa de Bioquımica e Biofısica Celular, Instituto de Bioquımica Medica, Universidade Federal do Rio de Janeiro, RJ 21941-590 Rio de Janeiro, Brazil
Received 11 October 2005Available online 6 January 2006
Abstract
The stability of proteins and their interactions with other molecules is a topic of special interest in biochemistry because many cellularprocesses depend on that. New methods and approaches are constantly developed to elucidate the energetics of biomolecular recognition.In this sense, the application of the theory of macromolecular unfolding linked to ligand binding to differential scanning calorimetry(DSC) has proved to be a useful tool to simultaneously characterize the energetics of unfolding and binding. Although the general theoryis well known, the applicability of DSC to study the interaction of biomolecules is not common. In the current work, we estimated thebinding parameters of 8-anilinonaphthalene-1-sulfonic acid to human serum albumin using DSC. This model system was chosen due toboth the complex stoichiometry and the moderate binding constants. From DSC curves acquired at different ligand concentrations, weobtained the number of bound ligands, the binding constants, and the binding enthalpy for each independent binding site. Comparedwith those parameters determined by titration calorimetry, the results highlight the potentiality of DSC to estimate binding parametersin multiligand binding proteins.� 2005 Elsevier Inc. All rights reserved.
Keywords: Differential scanning calorimetry; Protein–ligand interactions; Ligand binding parameters; Thermodynamics
Differential scanning calorimetry (DSC)1 is an experi-mental technique to measure the heat capacity of a systemas a function of temperature in isobaric conditions. It hasbeen widely used to acquire the thermodynamic parametersassociated with processes triggered by changing the tem-perature. In biological sciences, cooperative structures suchas lipid aggregates, nucleic acids, and proteins that undergotransitions originated from conformational changes,fusion, hydration/dehydration, aggregation/disaggrega-
0003-2697/$ - see front matter � 2005 Elsevier Inc. All rights reserved.
doi:10.1016/j.ab.2005.12.029
* Corresponding author. Fax: +54 351 433 4074.E-mail address: [email protected] (M.S. Celej).
1 Abbreviations used: DSC, differential scanning calorimetry; 2 0CMP,cytidine-2 0-monophosphate; HSA, human serum albumin; 1,8-ANS,8-anilinonaphthalene-1-sulfonic acid; ITC, isothermal titration calorimetry.
tion, or a combination of these factors are suitable to bestudied by DSC [1,2]. Thus, with careful analysis and inter-pretation, DSC gives immediate access to fundamentalthermodynamic information about systems of biologicalrelevance.
The stability of proteins and their interactions with othermolecules is a topic of special interest in biochemistrybecause many cellular processes depend on that. Theseinteractions have immediate consequences for protein sta-bility, as shown by varying the thermodynamic propertiesof the system. This fact provides an extra variable to studyprotein unfolding linked to ligand binding. In this regard,various approaches to describe macromolecular unfoldingcoupled to ligand binding were reported by several authorsmany years ago [3–6]. More recently, with the application of
278 Estimating binding parameters in multiligand binding proteins / M.S. Celej et al. / Anal. Biochem. 350 (2006) 277–284
theory, DSC has been proved to be a very useful tool to esti-mate very tight binding constants [7] as well as to character-ize the energetics of binding and unfolding [8,9]. Althoughthe general theory is well known, the applicability of DSCto a study of biomolecular interaction is not widespread.Some examples have been reviewed recently [10,11].
Straume and Freire [9] demonstrated the potentiality oftwo-dimensional DSC (i.e., heat capacity vs. temperaturevs. total ligand concentration) to simultaneously determineprotein stability and ligand interaction parameters by glob-al linkage analysis. Through the analysis of ribonuclease Ainteraction with cytidine-2 0-monophosphate (2 0CMP),these authors determined thermodynamic parameters com-parable to those obtained by direct measurements. Thisapproach has been used successfully to characterize theunfolding and binding energetics of systems such as the gua-nosine-3 0-monophosphate–barnase complex [12], theS-peptide–S-protein complex [13], and the 2 0CMP–mono-deamidated ribonuclease complexes [14]. In all of thesecases, the ligand–protein systems have a 1:1 stoichiometry.In the current work, we used a similar approach to obtainthe binding parameters from DSC experiments in a morecomplex case by using human serum albumin (HSA) inter-acting with 8-anilinonaphthalene-1-sulfonic acid (1,8-ANS)as a model system. Comparing the DSC binding parameterswith those determined by isothermal titration calorimetry(ITC), we demonstrate the potentiality of DSC to evaluatebiomolecular interaction in a ligand–protein system havinga complex stoichiometry and moderate ligand affinity con-stants. The implications for the use of basic informationabout protein thermodynamic and binding properties arecountless as well as very important (e.g., pharmacokineticstudies for new drugs on clinical trials). This work providesan easy method to evaluate such properties that can bereadily applied to several investigational models or specificclinical, pharmaceutical, or biological problems.
Materials and methods
Materials
Fatty acid and globulin-free HSA was obtained fromSigma Chemical (St. Louis, MO, USA), and 1,8-ANSwas obtained from Molecular Probes (Eugene, OR,USA). These reactants were used without further purifica-tion. All other reagents were of analytical grade.
Differential scanning calorimetry
Thermograms were obtained in a MicroCal MC-2Dscanning calorimeter obtained from MicroCal (Northamp-ton, MA, USA). HSA (0.11 mM) was prepared in 100 mMphosphate buffer (pH 7.2). To prevent the formation of airbubbles, samples were degassed exhaustively before fillingthe calorimeter cell. The reference cell was filled with buff-er, and a 2-atm nitrogen pressure was applied to both cells.A scan rate of 60 �C h�1 was used for all of the experi-
ments. The excess molar heat capacity function wasobtained after baseline subtraction, assuming the heatcapacity of the native state as reference. Curve analysiswas performed with the software provided by the manufac-turer, assuming a reversible non-two-state denaturationmodel. The applicability of reversible thermodynamics toapparently irreversible processes has been discussed previ-ously [15] for the case of reversible unfolding followed bya rate-limited irreversible step. Analysis based on equilibri-um unfolding was done after checking that no endothermswere found following reheating cycles and that similar ther-mograms and results were obtained either (i) at differentprotein concentrations; (ii) by heating an HSA solutionup to a temperature just below the midpoint denaturationtemperature, then cooling it to room temperature, and thenreheating it to final denaturation temperature; or (iii) by fit-ting the whole curve using only the first 50% of the exper-imental data from the thermogram.
Isothermal titration calorimetry
ITC measurements were done using an MCS–ITC calo-rimeter from MicroCal. HSA and 1,8-ANS were dissolvedin 100 mM phosphate buffer (pH 7.2). The samples weredegassed under vacuum prior to the titrations. The referencecell was filled with Milli-Q water. The titration of 10 or20 lM HSA with 2,6-ANS involved 36 injections (17 2-llinjections and 19 10-ll injections) of 0.6 mM ligand solution.The ligand solution was injected at 4-min intervals. A 250-llsyringe with a 400-rpm constant rotation was used for all ofthe experiments. The temperature of the titration cell was setat 25, 35, or 45 �C. The heat of ligand dilution in buffer wassubtracted from the titration data of HSA. Raw data wereanalyzed with Origin 5.0 software provided by the manufac-turer. The first injection in each experiment was not takeninto account for the analysis. Three independent experi-ments were analyzed separately, and the fitted parameterswere averaged. The binding heat capacity change wasobtained from the dependence of the binding enthalpy ontemperature, assuming linear behavior.
Acquisition of binding parameters from DSC curves
Representative cases of macromolecular unfoldinglinked to ligand binding applied to DSC have been present-ed previously [7–10,16–18]. A summary of the theoreticalbackground necessary to analyze DSC curves of protein–ligand systems is presented below.
The average excess heat capacity (ÆDCpæ) is the deriva-tive of the average excess enthalpy (ÆDHæ) at constant pres-sure, that is,
hDCpi ¼ddT
Xl
i¼0
hDHi !
P
; ð1Þ
where the summation is over the l relevant conformationalstates of the protein. With ÆDHæ given by
Estimating binding parameters in multiligand binding proteins / M.S. Celej et al. / Anal. Biochem. 350 (2006) 277–284 279
hDHi ¼Xl
i¼0
P iðT ÞDH iðT Þ; ð2Þ
and with Pi(T) being the relative population of the i stateand DHi(T) being the enthalpy change associated with thetransition between the reference state and the i state, Eq.(1) becomes
hDCpi ¼Xl
i¼0
DH iðT ÞdP iðT Þ
dTþXl
i¼0
P iðT ÞdDH iðT Þ
dT; ð3Þ
where the first term corresponds to the transition heatcapacity ðhdCtrs
p iÞ and is responsible for the characteristicpeak(s) of heat absorption, and the second term definesthe shift in the baseline associated with the difference inheat capacity between the final and initial states ðhdCbas
p iÞ.To solve Eq. (3), a specific model must be assumed to ob-tain appropriated expressions for Pi(T) and DHi(T). Thus,our model assumes that (i) all transitions are two-state ones(ii) ligand binds to the native protein state, (iii) bindingsites are independent, (iv) the unfolding and bindingenthalpy present a linear temperature dependence, and(v) no kinetic effects are present.
The following scheme represents the equilibrium for atwo-state protein unfolding with n independent ligandbinding sites on the native state:
oTUK )(
N U
n L NTjbK )(
NLn
where N and U are the native and unfolded states of theprotein, respectively, L is the free ligand, Ko
UðT Þ is the pro-tein unfolding constant in the absence of ligands, andKN
bjðT Þ is the association constant for ligand binding to thejth site of the nN independent sites on the native state.
The relative population of the unfolding state of the pro-tein is
P UðT Þ ¼KUðT Þ
1þ KUðT Þ; ð4Þ
where
KUðT Þ ¼Ko
UðT ÞQnN
j¼0
1þ KNbjðT Þ½L�
� � ; ð5Þ
where [L] is the free ligand concentration.The overall ligand-linked enthalpy change is given by
DH UðT Þ ¼ DHoUðT Þ �
XnN
tNjðT ÞDH N
bjðT Þ; ð6Þ
j¼1where DHoUðT Þ and DH N
bjðT Þ are the intrinsic unfolding andbinding enthalpies for each binding site, respectively, whichare assumed to have linear dependence on temperature,and tN
jðT Þ is the fractional extent of saturation at each tem-perature for the jth site of the native protein and is given by
tNjðT Þ ¼
KNbjðT Þ½L�
1þ KNbjðT Þ½L�
. ð7Þ
The free ligand concentration can be calculated by employ-ing iterative techniques to solve the mass balance equationsfor the system:
½P�tot ¼ ½N�YnN
j¼1
1þ KNbjðT Þ½L�
� �þ Ko
UðT Þ
( )ð8Þ
½L�tot ¼ ½L� þXnN
j¼1
j½NLj�; ð9Þ
where [P]tot and [L]tot are the total protein and ligand con-centration, respectively, and [NLj] is the concentration ofthe jth complex.
The model employed for the analysis combines bothcanonical and grand canonical constraints. Considering aligand binding protein as a system exchanging particleswith the surroundings, a grand canonical ensemble canbe assumed. On the other hand, a canonical ensemblecan be considered because the number of particles remainsconstant in the calorimetric cell [19]. It has been shown thatproper dependence of the heat capacity on temperature isreproduced when both constraints are taken into account.In other words, based on the grand canonical enthalpy (i.e.,under the constant free ligand concentration constraint[Eq. 2]), the heat capacity curves are obtained from numer-ical derivatives at constant total ligand concentration(Eq. 1) [20].
On the basis of this model, we developed a computation-al program to simulate thermograms at different ligandconcentrations. For every temperature, the followingsequence of calculations was used: (i) all parameters thatdepend on temperature were calculated (DHo
UðT Þ, DHNbjðT Þ,
KoUðT Þ, and KN
bjðT Þ); (ii) the free ligand concentration wassolved with mass balance equations (Eqs. 8 and 9); (iii)PU(T) and DHU(T) were computed (Eqs. 4 and 6); and (iv)ÆDCpæ was evaluated by numerical differentiation (Eq. 3).In addition, this program was coupled to the downhill sim-
plex method [21] to get the ligand binding parameters byfitting the experimental thermograms.
The complete computer codes of both the simulationprogram and the fitting routines are available on requestfrom the first author.
Results and discussion
Differential scanning calorimetry
Fig. 1A shows the experimental thermograms for freeHSA and HSA in the presence of increasing concentrations
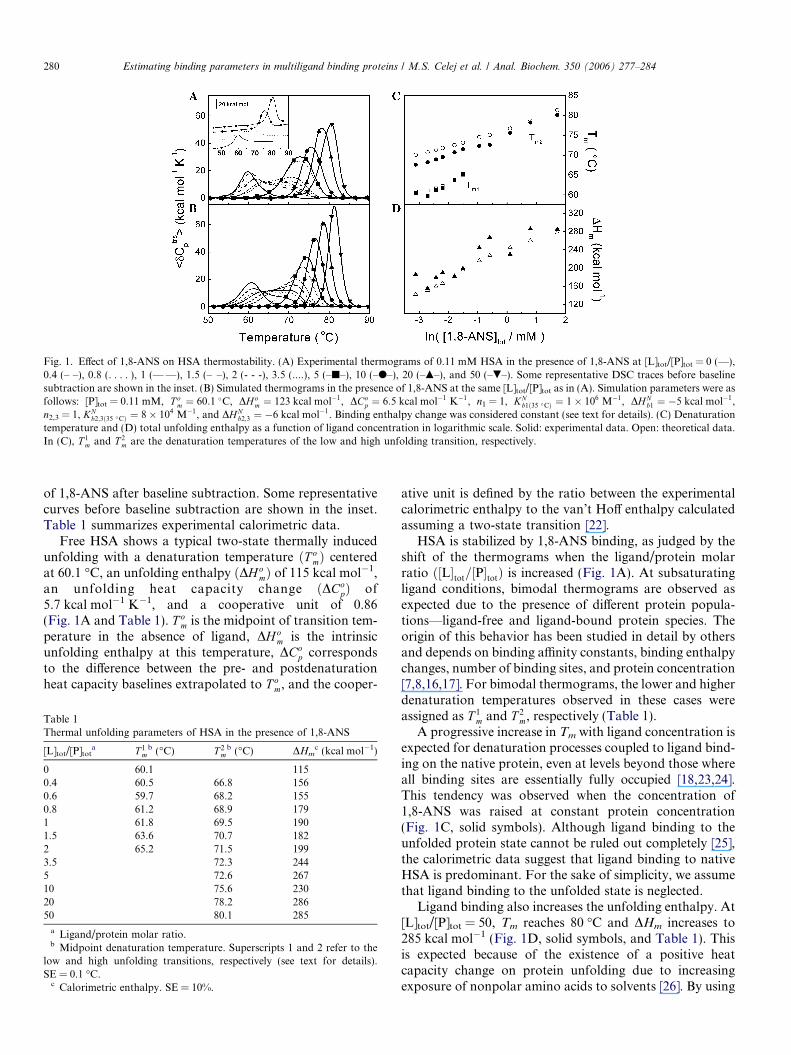
Fig. 1. Effect of 1,8-ANS on HSA thermostability. (A) Experimental thermograms of 0.11 mM HSA in the presence of 1,8-ANS at [L]tot/[P]tot = 0 (—),0.4 (– –), 0.8 (. . . . ), 1 (—Æ—), 1.5 (–ÆÆ–), 2 (- - -), 3.5 (....), 5 (–j–), 10 (–d–), 20 (–m–), and 50 (–.–). Some representative DSC traces before baselinesubtraction are shown in the inset. (B) Simulated thermograms in the presence of 1,8-ANS at the same [L]tot/[P]tot as in (A). Simulation parameters were asfollows: [P]tot = 0.11 mM, T o
m ¼ 60:1 �C, DHom ¼ 123 kcal mol�1, DCo
p ¼ 6:5 kcal mol�1 K�1, n1 = 1, KNb1ð35 �CÞ ¼ 1� 106 M�1, DHN
b1 ¼ �5 kcal mol�1,n2,3 = 1, KN
b2;3ð35 �CÞ ¼ 8� 104 M�1, and DHNb2;3 ¼ �6 kcal mol�1. Binding enthalpy change was considered constant (see text for details). (C) Denaturation
temperature and (D) total unfolding enthalpy as a function of ligand concentration in logarithmic scale. Solid: experimental data. Open: theoretical data.In (C), T 1
m and T 2m are the denaturation temperatures of the low and high unfolding transition, respectively.
280 Estimating binding parameters in multiligand binding proteins / M.S. Celej et al. / Anal. Biochem. 350 (2006) 277–284
of 1,8-ANS after baseline subtraction. Some representativecurves before baseline subtraction are shown in the inset.Table 1 summarizes experimental calorimetric data.
Free HSA shows a typical two-state thermally inducedunfolding with a denaturation temperature ðT o
mÞ centeredat 60.1 �C, an unfolding enthalpy ðDH o
mÞ of 115 kcal mol�1,an unfolding heat capacity change ðDCo
pÞ of5.7 kcal mol�1 K�1, and a cooperative unit of 0.86(Fig. 1A and Table 1). T o
m is the midpoint of transition tem-perature in the absence of ligand, DH o
m is the intrinsicunfolding enthalpy at this temperature, DCo
p correspondsto the difference between the pre- and postdenaturationheat capacity baselines extrapolated to T o
m, and the cooper-
Table 1Thermal unfolding parameters of HSA in the presence of 1,8-ANS
[L]tot/[P]tota T 1
mb (�C) T 2
mb (�C) DHm
c (kcal mol�1)
0 60.1 1150.4 60.5 66.8 1560.6 59.7 68.2 1550.8 61.2 68.9 1791 61.8 69.5 1901.5 63.6 70.7 1822 65.2 71.5 1993.5 72.3 2445 72.6 26710 75.6 23020 78.2 28650 80.1 285
a Ligand/protein molar ratio.b Midpoint denaturation temperature. Superscripts 1 and 2 refer to the
low and high unfolding transitions, respectively (see text for details).SE = 0.1 �C.
c Calorimetric enthalpy. SE = 10%.
ative unit is defined by the ratio between the experimentalcalorimetric enthalpy to the van’t Hoff enthalpy calculatedassuming a two-state transition [22].
HSA is stabilized by 1,8-ANS binding, as judged by theshift of the thermograms when the ligand/protein molarratio ð½L�tot=½P�totÞ is increased (Fig. 1A). At subsaturatingligand conditions, bimodal thermograms are observed asexpected due to the presence of different protein popula-tions—ligand-free and ligand-bound protein species. Theorigin of this behavior has been studied in detail by othersand depends on binding affinity constants, binding enthalpychanges, number of binding sites, and protein concentration[7,8,16,17]. For bimodal thermograms, the lower and higherdenaturation temperatures observed in these cases wereassigned as T 1
m and T 2m, respectively (Table 1).
A progressive increase in Tm with ligand concentration isexpected for denaturation processes coupled to ligand bind-ing on the native protein, even at levels beyond those whereall binding sites are essentially fully occupied [18,23,24].This tendency was observed when the concentration of1,8-ANS was raised at constant protein concentration(Fig. 1C, solid symbols). Although ligand binding to theunfolded protein state cannot be ruled out completely [25],the calorimetric data suggest that ligand binding to nativeHSA is predominant. For the sake of simplicity, we assumethat ligand binding to the unfolded state is neglected.
Ligand binding also increases the unfolding enthalpy. At[L]tot/[P]tot = 50, Tm reaches 80 �C and DHm increases to285 kcal mol�1 (Fig. 1D, solid symbols, and Table 1). Thisis expected because of the existence of a positive heatcapacity change on protein unfolding due to increasingexposure of nonpolar amino acids to solvents [26]. By using
Estimating binding parameters in multiligand binding proteins / M.S. Celej et al. / Anal. Biochem. 350 (2006) 277–284 281
the calorimetric data where only a single transition wasobserved, a linear regression of the DHm versus Tm (notshown) yielded T o
m ¼ 60:1� 0:1 �C, DH om ¼ 126� 23
kcal mol�1, and DCop ¼ 8:5� 1:6 kcal mol�1 K�1, in very
good agreement with those values obtained by fitting thethermogram of free HSA (Table 1) as well as with theDCo
p value reported by Shrake and Ross [27] for thisprotein.
For the denaturation of oligomeric proteins with a con-comitant release of ligand, Sturtevant and coworkers[23,24] developed a relationship among [P]tot, [L]tot, andprotein unfolding parameters when [L]totii[P]tot. At con-stant [P]tot, the equation that entails Tm and [L]tot can beapplied to a monomeric protein:
lnð½L�tot=mMÞ ¼ An�
DHom � DCo
pT om
nR
� �1
T m
þDCo
p lnðT m=T omÞ
nR; ð10Þ
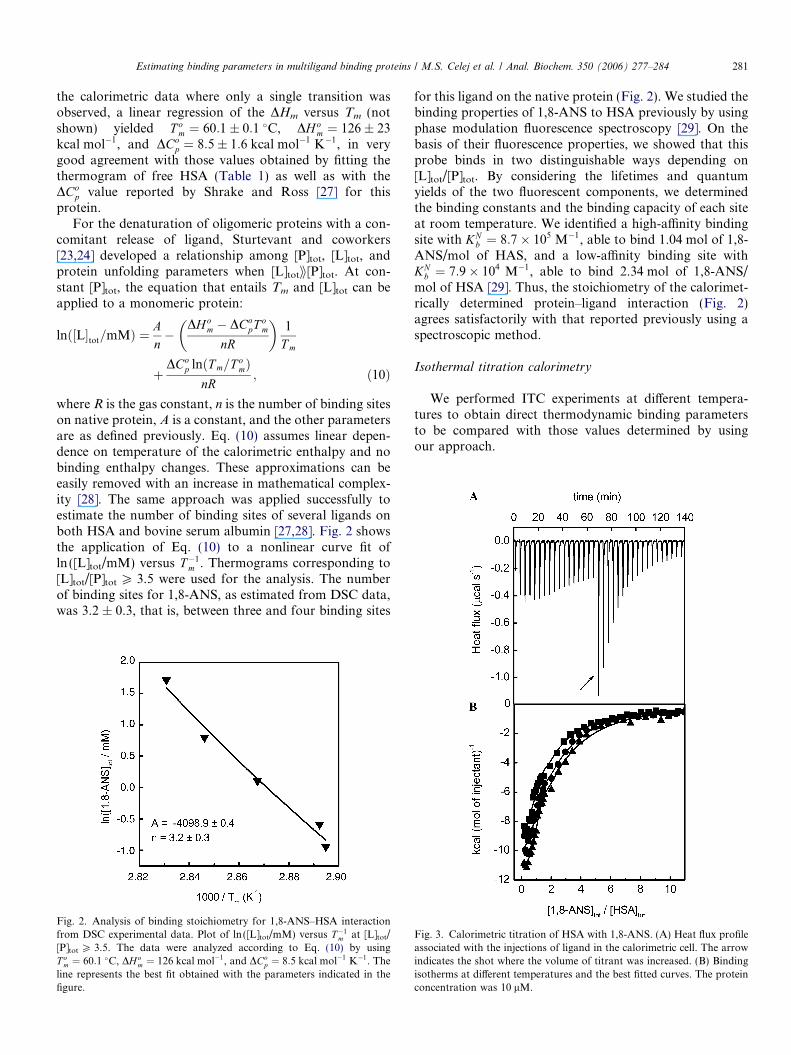
where R is the gas constant, n is the number of binding siteson native protein, A is a constant, and the other parametersare as defined previously. Eq. (10) assumes linear depen-dence on temperature of the calorimetric enthalpy and nobinding enthalpy changes. These approximations can beeasily removed with an increase in mathematical complex-ity [28]. The same approach was applied successfully toestimate the number of binding sites of several ligands onboth HSA and bovine serum albumin [27,28]. Fig. 2 showsthe application of Eq. (10) to a nonlinear curve fit ofln ([L]tot/mM) versus T�1
m . Thermograms corresponding to[L]tot/[P]tot P 3.5 were used for the analysis. The numberof binding sites for 1,8-ANS, as estimated from DSC data,was 3.2 ± 0.3, that is, between three and four binding sites
Fig. 2. Analysis of binding stoichiometry for 1,8-ANS–HSA interactionfrom DSC experimental data. Plot of ln ([L]tot/mM) versus T�1
m at [L]tot/[P]tot P 3.5. The data were analyzed according to Eq. (10) by usingT o
m ¼ 60:1 �C, DH om ¼ 126 kcal mol�1, and DCo
p ¼ 8:5 kcal mol�1 K�1. Theline represents the best fit obtained with the parameters indicated in thefigure.
for this ligand on the native protein (Fig. 2). We studied thebinding properties of 1,8-ANS to HSA previously by usingphase modulation fluorescence spectroscopy [29]. On thebasis of their fluorescence properties, we showed that thisprobe binds in two distinguishable ways depending on[L]tot/[P]tot. By considering the lifetimes and quantumyields of the two fluorescent components, we determinedthe binding constants and the binding capacity of each siteat room temperature. We identified a high-affinity bindingsite with KN
b ¼ 8:7� 105 M�1, able to bind 1.04 mol of 1,8-ANS/mol of HAS, and a low-affinity binding site withKN
b ¼ 7:9� 104 M�1, able to bind 2.34 mol of 1,8-ANS/mol of HSA [29]. Thus, the stoichiometry of the calorimet-rically determined protein–ligand interaction (Fig. 2)agrees satisfactorily with that reported previously using aspectroscopic method.
Isothermal titration calorimetry
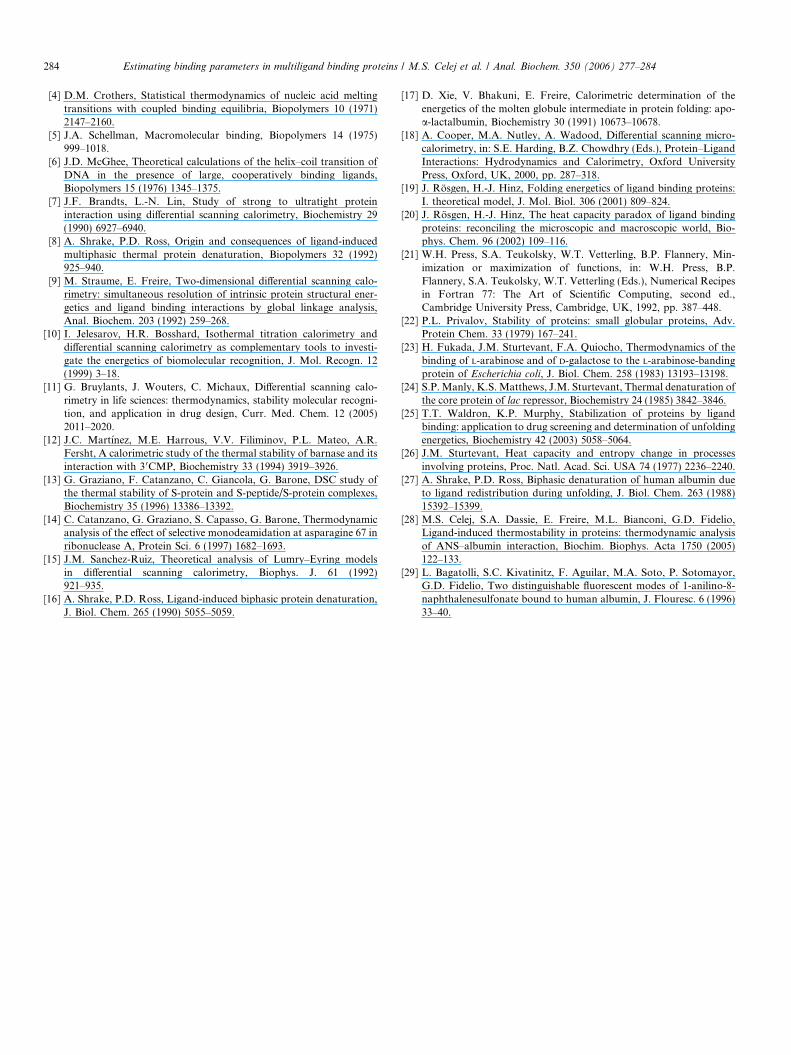
We performed ITC experiments at different tempera-tures to obtain direct thermodynamic binding parametersto be compared with those values determined by usingour approach.
Fig. 3. Calorimetric titration of HSA with 1,8-ANS. (A) Heat flux profileassociated with the injections of ligand in the calorimetric cell. The arrowindicates the shot where the volume of titrant was increased. (B) Bindingisotherms at different temperatures and the best fitted curves. The proteinconcentration was 10 lM.

282 Estimating binding parameters in multiligand binding proteins / M.S. Celej et al. / Anal. Biochem. 350 (2006) 277–284
Fig. 3A depicts a representative exothermic heat ofbinding from successive injections. The discontinuity inthe heat flux profile is due to the differences in injection vol-ume, as indicated by the arrow (see Materials and meth-ods). The peaks show a monotonic decrease with theadded ligand until saturation is achieved. The peak-inte-grated and concentration-normalized enthalpy changes atthree different temperatures versus the ligand/proteinmolar ratio are shown in Fig. 3B. The curve profiles sug-gest two kinds of binding sites for 1,8-ANS on HSA, inagreement with the evidence obtained previously from fluo-rescence spectroscopy [29]. In consequence, data analysiswas carried out by means of a two sets of binding sitesmodel included in the Origin 5.0 software. Results withoutphysical meaning were obtained when the free variation ofn was allowed (not shown). Then the fitting procedure wasperformed by fixing the stoichiometry as one and two forthe two types of independent binding sites, respectively.The binding heat capacity change ðDCN
pbÞ for each sitewas obtained from the dependence of the binding enthalpyon temperature, assuming linear behavior. The bindingthermodynamic parameters of the 1,8-ANS–HSA interac-tion are listed in Table 2.
The high-affinity site binds one molecule of 1,8-ANS,whereas two molecules of ligand associate with the low-af-finity site (Table 2). In both cases, the binding constantsdetermined at 25 �C are close to those reported by Baga-tolli and coworkers [29]. The same results were obtainedwhen the titration experiments were performed with twicethe protein concentration (not shown).
Estimation of binding parameters from DSC experiments
The theoretical model described in Materials andmethods was coupled to a multidimensional optimizationroutine (downhill simplex method) to estimate the thermo-dynamic binding parameters from experimental DSC
Table 2Binding parameters for 1,8-ANS–HSA interaction estimated from ITCdata
Parameter Temperature
25 �C 35 �C 45 �C
High-affinity binding site n1 = 1KN
b1ðT Þ � 10�6 (M�1) 0.83 ± 0.35 1.3 ± 0.2 1.6 ± 0.7
DHNb1ðT Þ (kcal mol�1) �10.3 ± 1.1 �10.5 ± 0.5 �11.4 ± 0.7
TDSNb1ðT Þ (kcal mol�1 K�1) �7.6 �5.7 �7.5
DCNpb (kcal mol�1 K�1)a �0.05 ± 0.02
Low-affinity binding site n2,3 = 1KN
b2;3ðT Þ � 10�4 (M�1) 3.4 ± 0.5 5.4 ± 0.8 4.7 ± 0.1
DHNb2;3ðT Þ (kcal mol�1) �8.8 ± 0.5 �10.0 ± 0.5 �14 ± 1
TDSNb2;3ðT Þ (kcal mol�1 K�1) �6.4 �10.0 �21.5
DCNpb (kcal mol�1 K�1)a �0.28 ± 0.06
Note. Data are mean values of three independent experiments ± standarddeviations.
a Values obtained assuming a linear dependence of DHNbðT Þ on
temperature.
curves acquired at different ligand/protein molar ratio.For that purpose, we have analyzed the heat capacity func-tion of the conformational transition, that is, after baselinesubtraction. However, it should be noted that the unfold-ing heat capacity term still is included in Eq. (3) and there-fore in the analysis procedure.
On the basis of the results presented in the above sec-tions, we assume that native HSA binds three 1,8-ANSmolecules in two kinds of independent binding sites. Inthe fitting procedure, the free variation of DH o
m, DCop,
KNb1ðT Þ, DHN
b1ðT Þ, KNb2;3ðT Þ, and DHN
b1ðT Þ was allowed. Thedependence of binding enthalpies on temperature was notincluded because our DSC data are not precise enough toestimate DCN
pb. The first round of fitting was performedwith the thermogram obtained at [L]tot/[P]tot = 50. As ini-tial inputted values, we used the unfolding parametersobtained from the thermogram of free HSA (see DSC sec-tion) and the binding parameters determined from ITC at35 �C (Table 2). After successful convergence of this fittingrouting, the output parameters were used as initial valuesto fit the thermogram obtained at [L]tot/[P]tot = 20. Thiscycle was applied to fit all of the experimental thermo-grams. Other values can be used as seed inputted parame-ters to initiate the optimization routines. The convergenceof the fitted output parameters is independent of the setof initial parameter values. The experimental and fittedcurves following this optimization procedure are shownin Fig. 4. The fitted parameters and their averaged valuesare listed in Table 3. To measure the quality of agreementbetween the experimental and fitted data, we calculated thestandard deviation (r) of each individual DSC fit. Thesevalues are also included in Table 3. To validate the maxi-mum likelihood values, each parameter was varied, oneat a time, and the new r value was compared with thatobtained originally. The errors associated with eachparameter were on the order of the standard deviation ofthe mean informed in Table 3.
Fig. 4. Resolution of the thermodynamic parameters of both intrinsicprotein unfolding and ligand binding. (A) Experimental thermograms of0.11 mM HSA in the presence of 1,8-ANS at [L]tot/[P]tot = 0.4 (– –), 0.8(� � � � ), and 1 (–Æ–). (B) Experimental thermograms of 0.11 mM HSA inthe presence of 1,8-ANS at [L]tot/[P]tot = 3.5 (����), 5 (–j–), 10 (–d–), 20(–m–), and 50 (–.–). In all cases, (—) represents the best fit obtained withthe parameters listed in Table 3 after performing the multidimensionaloptimization procedure detailed in the text.

Table 3Unfolding and binding parameters estimated from 1,8-ANS–HSA DSC data
[L]tot/[P]tota DHo
m(kcal mol�1)
DCop
(kcal mol�1 K�1)KN
b1ð35 �CÞ � 10�6
(M�1)DH N
b1
(kcal mol�1)KN
b2;3ð35 �CÞ � 10�4
(M�1)DHN
b2;3
(kcal mol�1)rb
(kcal mol�1 K�1)
0.4 152 8.5 5.6 �4.4 15.0 �4.4 0.520.6 126 6.6 1.0 �4.8 20.0 �4.9 0.930.8 143 6.3 0.9 �5.0 14.0 �5.0 0.401.0 148 6.3 1.0 �4.5 11.0 �4.5 0.551.5 133 5.2 0.8 �4.0 5.0 �3.7 0.772.0 128 5.0 0.6 �3.7 4.5 �4.0 1.103.5 123 6.2 1.7 �6.4 4.4 �6.2 2.165 113 6.7 1.4 �7.8 4.1 �7.5 2.48
10 97.7 6.7 1.1 �8.1 4.4 �7.7 0.9420 99.6 7.2 1.8 �8.3 5.5 �7.9 2.1550 97.3 6.5 0.7 �8.0 3.6 �7.6 2.43
Averagec 123 ± 19 6.5 ± 0.9 1 ± 1 �5 ± 2 8 ± 6 �6 ± 2 —
a Ligand/protein molar ratio.b Standard deviation.c Averaged values ± standard deviations.
Estimating binding parameters in multiligand binding proteins / M.S. Celej et al. / Anal. Biochem. 350 (2006) 277–284 283
A comparison between Table 2 and Table 3 revealsexcellent agreement between the average binding thermo-dynamic parameters calculated from DSC data fittingand those measured directly using ITC. In addition, theunfolding parameters listed in Table 3 are very close tothose obtained using DSC (Table 1 and DSC section). Fur-thermore, we used the averaged values in Table 3 to simu-late heat capacity traces at the same experimental range ofligand concentration used previously. The theoretical trac-es and a more detailed comparison between the experimen-tal and simulated global unfolding parameters are shown inFig. 1, where satisfactory agreement can be observed. Thediscrepancies between both maximum heat capacity andpick widths probably are due to the fact that protein dena-turation is not strictly a two-state unfolding transition inthis experimental system as was assumed in the theoreticalmodel. Overall, the global behavior of the system is repro-duced if the averaged parameters obtained from fitting theDSC curves are used to simulate the DSC profiles in thewhole range of ligand concentration.
Conclusions
We successfully obtained ligand binding parameters per-forming DSC experiments of protein unfolding in the pres-ence of different ligand concentrations. By using HSAinteracting with 1,8-ANS as a model system, we obtainedthe number of bound ligands, the binding constants, andthe binding enthalpy for each independent binding site.
Although two-dimensional DSC analysis would be bet-ter to estimate a unique set of thermodynamic parametersthat describe the whole system [9], the simple procedurepresented in this work gave satisfactory results. In thissense, the binding constants determined from fitting indi-vidual DSC curves (Table 3) are in accord with thoseobtained from both isothermal titration calorimetry(Table 2) and fluorescence spectroscopy [29]. In the sameway, the binding enthalpies estimated from both calori-
metric techniques are in agreement with each other(Tables 2 and 3). In addition, the energetics of free pro-tein unfolding determined from global linkage analysis(Table 3) also correlates with those parameters obtainedfrom direct fitting of the DSC curve of free HSA (Table1 and DSC section). In our case, it was not possible toestimate the binding heat capacity change due to the qual-ity of our DSC data. However, with the development ofmore sensitive and stable DSC instruments, this limitationwill be overcome rapidly.
Overall, we applied a simple procedure to a complexexperimental system demonstrating the potentiality ofDSC to estimate binding parameters in multiligand bindingproteins.
Acknowledgments
M. Soledad Celej thanks Consejo Nacional de Investi-gaciones Cientıficas y Tecnologicas (CONICET) for herdoctoral fellowship. Sergio A. Dassie and Gerardo D. Fide-lio are researcher career members of CONICET. This workwas supported by grants from CONICET, Agencia Cordo-ba Ciencia, FONCYT, SeCyT–UNC, International Unionof Pure and Applied Biophysics (IUPAB), Task Force onCapacity Building in Biophysics, and Conselho Nacionalde Desenvolvimento Cientıfico e Tecnologico (CNPq).The authors thank Dr. L. de Meis for ITC facilities.
References
[1] J.M. Sturtevant, Biochemical applications of differential scanningcalorimetry, Annu. Rev. Phys. Chem. 38 (1987) 463–488.
[2] S.A. Leharne, B.Z. Chowdhry, Thermodynamic background todifferential scanning calorimetry, in: J.E. Ladbury, B.Z. Chowdhry(Eds.), Biocalorimetry: Applications of Calorimetry in the BiologicalSciences, Wiley, Chichester, UK, 1998, pp. 157–182.
[3] R. Lumry, R. Biltonen, J.F. Brandts, Validity of the ‘‘two-state’’hypothesis for conformational transitions of proteins, Biopolymers 4(1966) 917–944.
284 Estimating binding parameters in multiligand binding proteins / M.S. Celej et al. / Anal. Biochem. 350 (2006) 277–284
[4] D.M. Crothers, Statistical thermodynamics of nucleic acid meltingtransitions with coupled binding equilibria, Biopolymers 10 (1971)2147–2160.
[5] J.A. Schellman, Macromolecular binding, Biopolymers 14 (1975)999–1018.
[6] J.D. McGhee, Theoretical calculations of the helix–coil transition ofDNA in the presence of large, cooperatively binding ligands,Biopolymers 15 (1976) 1345–1375.
[7] J.F. Brandts, L.-N. Lin, Study of strong to ultratight proteininteraction using differential scanning calorimetry, Biochemistry 29(1990) 6927–6940.
[8] A. Shrake, P.D. Ross, Origin and consequences of ligand-inducedmultiphasic thermal protein denaturation, Biopolymers 32 (1992)925–940.
[9] M. Straume, E. Freire, Two-dimensional differential scanning calo-rimetry: simultaneous resolution of intrinsic protein structural ener-getics and ligand binding interactions by global linkage analysis,Anal. Biochem. 203 (1992) 259–268.
[10] I. Jelesarov, H.R. Bosshard, Isothermal titration calorimetry anddifferential scanning calorimetry as complementary tools to investi-gate the energetics of biomolecular recognition, J. Mol. Recogn. 12(1999) 3–18.
[11] G. Bruylants, J. Wouters, C. Michaux, Differential scanning calo-rimetry in life sciences: thermodynamics, stability molecular recogni-tion, and application in drug design, Curr. Med. Chem. 12 (2005)2011–2020.
[12] J.C. Martınez, M.E. Harrous, V.V. Filiminov, P.L. Mateo, A.R.Fersht, A calorimetric study of the thermal stability of barnase and itsinteraction with 30CMP, Biochemistry 33 (1994) 3919–3926.
[13] G. Graziano, F. Catanzano, C. Giancola, G. Barone, DSC study ofthe thermal stability of S-protein and S-peptide/S-protein complexes,Biochemistry 35 (1996) 13386–13392.
[14] C. Catanzano, G. Graziano, S. Capasso, G. Barone, Thermodynamicanalysis of the effect of selective monodeamidation at asparagine 67 inribonuclease A, Protein Sci. 6 (1997) 1682–1693.
[15] J.M. Sanchez-Ruiz, Theoretical analysis of Lumry–Eyring modelsin differential scanning calorimetry, Biophys. J. 61 (1992)921–935.
[16] A. Shrake, P.D. Ross, Ligand-induced biphasic protein denaturation,J. Biol. Chem. 265 (1990) 5055–5059.
[17] D. Xie, V. Bhakuni, E. Freire, Calorimetric determination of theenergetics of the molten globule intermediate in protein folding: apo-a-lactalbumin, Biochemistry 30 (1991) 10673–10678.
[18] A. Cooper, M.A. Nutley, A. Wadood, Differential scanning micro-calorimetry, in: S.E. Harding, B.Z. Chowdhry (Eds.), Protein–LigandInteractions: Hydrodynamics and Calorimetry, Oxford UniversityPress, Oxford, UK, 2000, pp. 287–318.
[19] J. Rosgen, H.-J. Hinz, Folding energetics of ligand binding proteins:I. theoretical model, J. Mol. Biol. 306 (2001) 809–824.
[20] J. Rosgen, H.-J. Hinz, The heat capacity paradox of ligand bindingproteins: reconciling the microscopic and macroscopic world, Bio-phys. Chem. 96 (2002) 109–116.
[21] W.H. Press, S.A. Teukolsky, W.T. Vetterling, B.P. Flannery, Min-imization or maximization of functions, in: W.H. Press, B.P.Flannery, S.A. Teukolsky, W.T. Vetterling (Eds.), Numerical Recipesin Fortran 77: The Art of Scientific Computing, second ed.,Cambridge University Press, Cambridge, UK, 1992, pp. 387–448.
[22] P.L. Privalov, Stability of proteins: small globular proteins, Adv.Protein Chem. 33 (1979) 167–241.
[23] H. Fukada, J.M. Sturtevant, F.A. Quiocho, Thermodynamics of thebinding of L-arabinose and of D-galactose to the L-arabinose-bandingprotein of Escherichia coli, J. Biol. Chem. 258 (1983) 13193–13198.
[24] S.P. Manly, K.S. Matthews, J.M. Sturtevant, Thermal denaturation ofthe core protein of lac repressor, Biochemistry 24 (1985) 3842–3846.
[25] T.T. Waldron, K.P. Murphy, Stabilization of proteins by ligandbinding: application to drug screening and determination of unfoldingenergetics, Biochemistry 42 (2003) 5058–5064.
[26] J.M. Sturtevant, Heat capacity and entropy change in processesinvolving proteins, Proc. Natl. Acad. Sci. USA 74 (1977) 2236–2240.
[27] A. Shrake, P.D. Ross, Biphasic denaturation of human albumin dueto ligand redistribution during unfolding, J. Biol. Chem. 263 (1988)15392–15399.
[28] M.S. Celej, S.A. Dassie, E. Freire, M.L. Bianconi, G.D. Fidelio,Ligand-induced thermostability in proteins: thermodynamic analysisof ANS–albumin interaction, Biochim. Biophys. Acta 1750 (2005)122–133.
[29] L. Bagatolli, S.C. Kivatinitz, F. Aguilar, M.A. Soto, P. Sotomayor,G.D. Fidelio, Two distinguishable fluorescent modes of 1-anilino-8-naphthalenesulfonate bound to human albumin, J. Flouresc. 6 (1996)33–40.