Multiple-injection affinity capillary electrophoresis to estimate binding constants of receptors to...
13
1118 LCGC NORTH AMERICA VOLUME 24 NUMBER 10 OCTOBER 2006 www.chromatographyonline.com Multiple-Injection Affinity Capillary Electrophoresis Jose Zavaleta, Dinora Chinchilla, Alejandra Ramirez, Violet Calderon, and Frank A. Gomez* Department of Chemistry and Biochemistry, California State University, Los Angeles, Los Angeles, California Please address correspondence to Frank A. Gomez at [email protected]. nteractions between biological species are essential to life and are involved directly in many of the enzyme-based reactions involved in cell division, cell death, and cell transforma- tions. These biological interactions are important in the initiation, progression, and harmful effects of human disease including Parkinson’s, Alzheimer’s, AIDS- HIV, and cancer. Advances in molecular biological tools have yielded a huge array of biological interactions focusing fore- most on receptor–ligand interactions. Similarly, combinatorial chemical tech- niques have generated millions of poten- tial drugs and drug precursors. Com- bined, these two areas of research have made the development of new analytical techniques an important area of research. During the last decade, affinity capil- lary electrophoresis (ACE) has emerged as a useful and sensitive technique for study- ing bimolecular noncovalent interactions and for determining binding and dissoci- ation constants of formed complexes. In 1992, the first reports documenting the use of ACE to study receptor–ligand interactions were published (1–5). Since then, myriad interactions including pro- tein–ligand (6–17), peptide–metal (18,19), peptide–peptide (20–30), pro- tein–peptide (36), protein–antibody (37), polymer–peptide (38), antibody–antigen (39), enzyme–drug (40), and polymer–cyclodextrin (41) have been examined successfully using ACE. For example, Varenne and colleagues used ACE to examine the binding of fucoidan, an anticoagulant polysaccharide of marine origin, to antithrombin (6). Kaddis and colleagues recently determined binding constants for the activator fructose-6- phosphate (F6P) and substrate ATP to the recombinant wild-type (WT) Rhodobacter Sphaeroides adenosine 5’-diphosphate- (ADP)-glucose pyrophosphorylase (ADPGlc PPase) using ACE (7). Finally, Lewis and colleagues described the screen- ing of antimicrobial targets using ACE (30). In ACE, the mobility of a receptor (or ligand) changes upon binding to a lig- and (or receptor) that is present in the electrophoresis buffer. The change in migration time can be correlated to a binding constant via Scatchard analysis or other form of analysis. In general, there are three different types of ACE. In the first type, affinity lig- and and receptor are premixed and an aliquot of the solution analyzed by CE. This form of ACE has been used success- fully in the analysis of DNA–protein, DNA–DNA, and DNA–small molecule interactions because many of these inter- actions have appreciably slow k on and k off rates and premixing of ligand and recep- tor are required for formation of complex. In type two, the sample contains receptor and is injected into a solution containing the ligand. Changes in migration time of Multiple-injection affinity capillary electrophoresis (MIACE) is a versatile analytical technique to probe bimolecular noncovalent interactions and to estimate binding constants between receptors and ligands. In this article, we demonstrate the use of MIACE and several variations to MIACE to determine binding constants between the glycopeptide antibiotics vancomycin, ristocetin, and teicoplanin from Streptomyces orientalis, Nocardia lurida, and Actinoplanes teichomyceticus, respectively, and D-Ala-D-Ala terminus peptides. I
-
Upload
independent -
Category
Documents
-
view
0 -
download
0
Transcript of Multiple-injection affinity capillary electrophoresis to estimate binding constants of receptors to...
1118 LCGC NORTH AMERICA VOLUME 24 NUMBER 10 OCTOBER 2006 www.chromatographyonline.com
Multiple-Injection Affinity CapillaryElectrophoresis
Jose Zavaleta, Dinora Chinchilla,Alejandra Ramirez, VioletCalderon, and Frank A. Gomez*
Department of Chemistry andBiochemistry, California State University,Los Angeles, Los Angeles, California
Please address correspondence to FrankA. Gomez at [email protected].
nteractions between biologicalspecies are essential to life and areinvolved directly in many of the
enzyme-based reactions involved in celldivision, cell death, and cell transforma-tions. These biological interactions areimportant in the initiation, progression,and harmful effects of human diseaseincluding Parkinson’s, Alzheimer’s, AIDS-HIV, and cancer. Advances in molecularbiological tools have yielded a huge arrayof biological interactions focusing fore-most on receptor–ligand interactions.Similarly, combinatorial chemical tech-niques have generated millions of poten-tial drugs and drug precursors. Com-bined, these two areas of research havemade the development of new analyticaltechniques an important area of research.
During the last decade, affinity capil-lary electrophoresis (ACE) has emerged asa useful and sensitive technique for study-ing bimolecular noncovalent interactionsand for determining binding and dissoci-ation constants of formed complexes. In1992, the first reports documenting theuse of ACE to study receptor–ligandinteractions were published (1–5). Sincethen, myriad interactions including pro-tein–ligand (6–17), peptide–metal(18,19), peptide–peptide (20–30), pro-tein–peptide (36), protein–antibody (37),polymer–peptide (38), antibody–antigen(39), enzyme–drug (40), andpolymer–cyclodextrin (41) have been
examined successfully using ACE. Forexample, Varenne and colleagues usedACE to examine the binding of fucoidan,an anticoagulant polysaccharide of marineorigin, to antithrombin (6). Kaddis andcolleagues recently determined bindingconstants for the activator fructose-6-phosphate (F6P) and substrate ATP to therecombinant wild-type (WT) RhodobacterSphaeroides adenosine 5’-diphosphate-(ADP)-glucose pyrophosphorylase(ADPGlc PPase) using ACE (7). Finally,Lewis and colleagues described the screen-ing of antimicrobial targets using ACE(30). In ACE, the mobility of a receptor(or ligand) changes upon binding to a lig-and (or receptor) that is present in theelectrophoresis buffer. The change inmigration time can be correlated to abinding constant via Scatchard analysis orother form of analysis.
In general, there are three differenttypes of ACE. In the first type, affinity lig-and and receptor are premixed and analiquot of the solution analyzed by CE.This form of ACE has been used success-fully in the analysis of DNA–protein,DNA–DNA, and DNA–small moleculeinteractions because many of these inter-actions have appreciably slow kon and koffrates and premixing of ligand and recep-tor are required for formation of complex.In type two, the sample contains receptorand is injected into a solution containingthe ligand. Changes in migration time of
Multiple-injection affinity capillary electrophoresis (MIACE) is a versatileanalytical technique to probe bimolecular noncovalent interactions andto estimate binding constants between receptors and ligands. In thisarticle, we demonstrate the use of MIACE and several variations toMIACE to determine binding constants between the glycopeptideantibiotics vancomycin, ristocetin, and teicoplanin from Streptomycesorientalis, Nocardia lurida, and Actinoplanes teichomyceticus,respectively, and D-Ala-D-Ala terminus peptides.
I
1120 LCGC NORTH AMERICA VOLUME 24 NUMBER 10 OCTOBER 2006 www.chromatographyonline.com
the formed complex are correlated to abinding constant (dissociation constant).In type three, the affinity ligand is immo-bilized to the capillary wall, and beads orother matrix are used as solid support(31–35). Receptor present in solutionthen flows through the capillary and bindsto the immobilized ligand. This techniqueis used primarily to capture and enrich asubstance of interest as well as for clean-ing, desalting, and removing unwantedimpurities. For example, there is consider-able work in the use of immunoaffinityCE for the capture and enrichment ofnumerous analytes. The advantages of thistechnique are small sample volumes,high-throughput, and sample automa-tion. Moreover, the technology has pro-gressed such that limits of detection(LOD) compare favorably to that foundfor HPLC and even the enzyme-linkedimmunosorbent assay (ELISA). The pres-ent paper documents our work using typetwo ACE.
Although ACE has been shown to beeffective in estimating binding parametersof ligands to receptors, in cases in whichonly small quantities of material are avail-
able, analysis by traditional ACE tech-niques is made difficult. In addition,expeditious analysis of the interaction inquestion also can be desirable, particularlywhen combinatorial approaches to drugdesign are utilized. In cases in which bothconditions are needed, modifications inthe standard ACE technique are war-ranted. Herein, we describe our work inthe development of multiple injectionACE (MIACE) to examine the binding ofthree glycopeptide antibiotics to smallpeptides. In this technique, multiple sam-ples of receptor (or ligand) are injectedinto the capillary column and elec-trophoresed in increasing concentrationsof ligand (or receptor). Multiple bindingconstants for the same interaction subse-quently are obtained, thereby shorteningthe ACE experiment. Several variations ofMIACE are detailed that demonstrate theversatility of the technique for evaluatingbinding interactions between receptorsand ligands.
Materials and MethodsChemicals and Reagents: All chemicalswere analytical grade. Vancomycin, D-
(a)
(b)
(c)
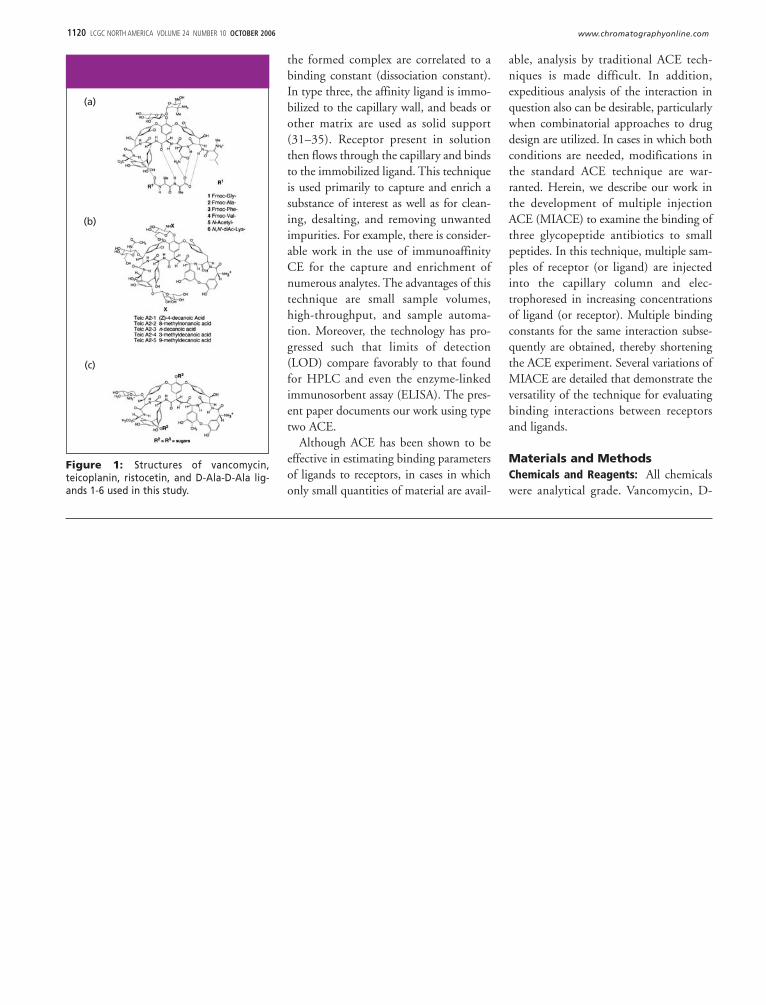
Figure 1: Structures of vancomycin,teicoplanin, ristocetin, and D-Ala-D-Ala lig-ands 1-6 used in this study.
OCTOBER 2006 LCGC NORTH AMERICA VOLUME 24 NUMBER 10 1121www.chromatographyonline.com
Ala-D-Ala, N-acetyl-D-Ala-D-Ala (5),N,N’-diacetyl-Lys-D-Ala-D-Ala (6),nicotinamide adenine dinucleotide(NAD), nicotinamide adenine dinu-cleotide, reduced form (NADH), and 4-carboxybenzenesulfonamide (CBSA) (7)were purchased from Sigma ChemicalCompany (St. Louis, Missouri) and wereused without further purification.Teicoplanin●HCl was purchased fromAdvance Separation Technologies, Inc.(Whippany, New Jersey) and was usedwithout further purification. Ristocetinwas obtained from BioData (Horsham,Pennsylvania) and was used without fur-ther purification. Fmoc-Gly-NHS, Fmoc-Ala-NHS, Fmoc-Phe-NHS, and Fmoc-Val-NHS were purchased from BachemCalifornia, Inc. (Torrance, California).Mesityl oxide was purchased from Cal-biochem (San Diego, California).
MIACE: Stock solutions of van-comycin (0.2 mg/mL), teicoplanin (1.0
mg/mL), and CBSA (0.5 mg/mL) eachwere prepared by dissolving in buffer (20mM phosphate buffer, pH 7.5). Stocksolutions of the N-protected amino acids(4 mM) were prepared by dissolving thecompounds in buffer. Fmoc-Gly-D-Ala-D-Ala (1), Fmoc-Ala-D-Ala-D-Ala (2),Fmoc-Phe-D-Ala-D-Ala (3), and Fmoc-Val-D-Ala-D-Ala (4) were prepared basedupon literature procedures (42).
PMIACE: Stock solutions of van-comycin (0.2 mg/mL), teicoplanin (1.0mg/mL), NAD (0.5 mg/mL), andNADH (0.5 mg/mL), each were preparedby dissolving in buffer (192 mMglycine–25 mM Tris, pH 8.3). Stock solu-tions of the N-protected amino acids (4mM) were prepared by dissolving thecompounds in buffer.
Receptor PFMIACE: Stock solutions ofvancomycin (0.2 mg/mL), teicoplanin(0.2 mg/mL), and horse heart myoglobin(HHM, 1 mg/mL) each were prepared by
Table I: Experimental values of binding constants Kb (103 M-1) of ligands 1–6 to van-comycin and teicoplanin obtained by equations 2 and 4
Antibiotic Ligand Kb
Vancomycin 1 22.3a
Teicoplanin 1 144.0b
Vancomycin 2 15.3c
Teicoplanin 2 21.1d
Vancomycin 3 40.2Vancomycin 4 25.9Vancomycin 5 3.7e
Teicoplanin 5 20.7f
Vancomycin 6 43.0aPrevious estimates (25): Kb � 41.6 � 103 M-1 (pH 7.5).bPrevious estimates (25,26): Kb � 220 � 103 M-1 (pH 8.3), Kb � 21.8 � 103 M-1 (pH 7.5)cPrevious estimate (25): Kb � 174.5 � 103 M-1 (pH 7.5).dPrevious estimate (23): Kb � 185.1 � 103 M-1 (pH 7.5).ePrevious estimate (9,25): Kb � 3.6–5.0 � 103 M-1 (pH 8.3).fPrevious estimate (26): Kb � 44.0 � 103 M-1 (pH 8.3).
Inject
Detector
Time (s)
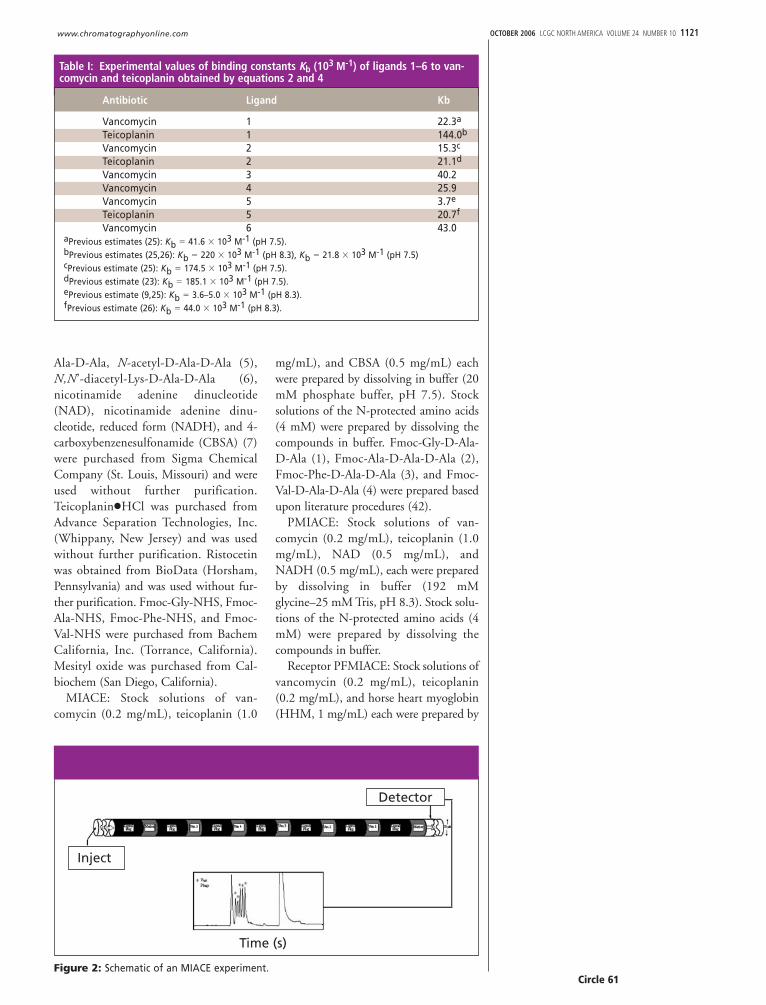
Figure 2: Schematic of an MIACE experiment.Circle 61
1122 LCGC NORTH AMERICA VOLUME 24 NUMBER 10 OCTOBER 2006 www.chromatographyonline.com
dissolving in buffer (192 mM glycine–25mM Tris, pH 8.3). Stock solutions of theN-protected amino acids (4 mM) wereprepared by dissolving the compounds inbuffer. For CAB, stock solutions of CAB(1 mg/mL), HHM (2 mg/mL), MO (100�L/1000 �L buffer) each were preparedby dissolving in buffer (192 mMglycine–25 mM Tris, pH 8.3). Stock solu-tions of ligands 7–11 (1 mg/mL) wereprepared by dissolving the compounds inbuffer.
Peptide PFMIACE: Stock solutions ofvancomycin (0.2 mg/mL), teicoplanin(1.0 mg/mL), ristocetin (1.0 mg/mL),NAD (0.2 mg/mL), and NADH (0.2mg/mL), each were prepared by dissolvingin buffer (192 mM glycine–25 mM Tris;pH 8.3). Stock solutions of the N-pro-tected amino acids (4 mM) were preparedby dissolving the compounds in buffer.
ApparatusMIACE: The CE system used in this
Table II: Experimental values of binding constants Kb (103 M-1) of ligands 1–4 to van-comycin, ristocetin, and teicoplanin obtained by equation 2
Ligand Vancomycin Ristocetin Teicoplanin
1 9.8 (0.931)a 11.7 (0.936)b 237.5 (0.930)c
2 11.4 (0.936)d 17.1 (0.864)e 153.2 (0.913)f
4 171.4 (0.987) 13.0 (0.845)g 21.5 (0.808)3 24.3 (0.808) 25.5 (0.964)h 15.5 (0.877)
aPrevious estimates (23): Kb � 41.6 � 103 M-1 (pH 7.5).bPrevious estimates (28): Kb � 41.4 � 103 M-1 (pH 8.3), Kb � 8.2 � 103 M-1 (pH 7.5)cPrevious estimate (23): Kb � 21.8 � 103 M-1 (pH 7.5).dPrevious estimate (23): Kb � 174.5 � 103 M-1 (pH 7.5).ePrevious estimate (23): Kb � 9.1 � 103 M-1 (pH 8.3); [23] Kb � 52.4 � 103 M-1 (pH 7.5).fPrevious estimate (23): Kb � 185.1 � 103 M-1 (pH 7.5).gPrevious estimate (28): Kb � 25.3 � 103 M-1 (pH 8.3).hPrevious estimate (28): Kb � 16.4 � 103 M-1 (pH 8.3).
Time (s)
150 200 250 300 350
300 �M
75 �M
0 �M
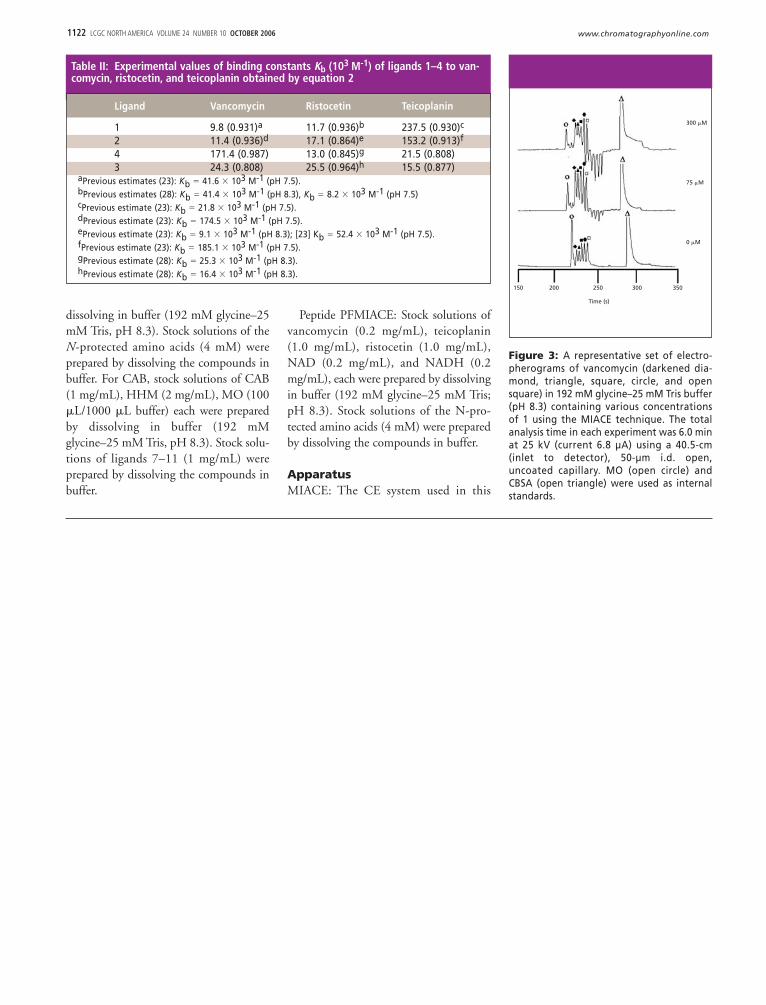
Figure 3: A representative set of electro-pherograms of vancomycin (darkened dia-mond, triangle, square, circle, and opensquare) in 192 mM glycine–25 mM Tris buffer(pH 8.3) containing various concentrationsof 1 using the MIACE technique. The totalanalysis time in each experiment was 6.0 minat 25 kV (current 6.8 µA) using a 40.5-cm(inlet to detector), 50-µm i.d. open,uncoated capillary. MO (open circle) andCBSA (open triangle) were used as internalstandards.
OCTOBER 2006 LCGC NORTH AMERICA VOLUME 24 NUMBER 10 1123www.chromatographyonline.com
study was a Beckman Coulter ModelP/ACE 5510 (Fullerton, California). Thecapillary tubing (Polymicro Technology,Inc., Phoenix, Arizona) used for theexperiment was uncoated fused silica withan internal diameter of 50 �m, lengthfrom inlet to detector of 40.5 cm (49 cmfor teicoplanin and compounds 1 and 2),and a length from detector to outlet of 6.5cm (11 cm for teicoplanin and com-pounds 1 and 2). The conditions used inCE were as follows: for vancomycin andteicoplanin, voltage, 25 kV; current, 6.8�A for vancomycin, 7.9 �A forteicoplanin; detection, 200 nm; tempera-ture, 23.0 � 0.1 °C; for CAB, voltage, 30kV; current, 7.5 �A; detection, 200 nm;temperature, 23.0 � 0.1 °C. Data wascollected and analyzed with Gold or 32Carot software (Beckman).
PMIACEThe CE system used in this study wasMDQ (Beckman). The capillary tubing(Polymicro) used for the experiment wasuncoated fused silica with an internaldiameter of 50 �m, length from inlet todetector of 40.5 cm (49 cm forteicoplanin and compounds 1 and 2), anda length from detector to outlet of 6.5 cm(11 cm for teicoplanin and compounds 1and 2). CE conditions: for vancomycin,ristocetin, and teicoplanin, voltage, 25kV; current, 6.8 �A for vancomycin, 7.9�A for ristocetin and teicoplanin; detec-tion, 200 nm; temperature, 23.0 � 0.1°C. Data were collected and analyzed with32 Carot software (Beckman).
Receptor PFMIACE: The CE systemused in this study was a P/ACE 5510(Beckman). The capillary tubing (Polymi-
Inject
Detector
Time (s)
Inject
Detector
Time (s)
(a)
(b)
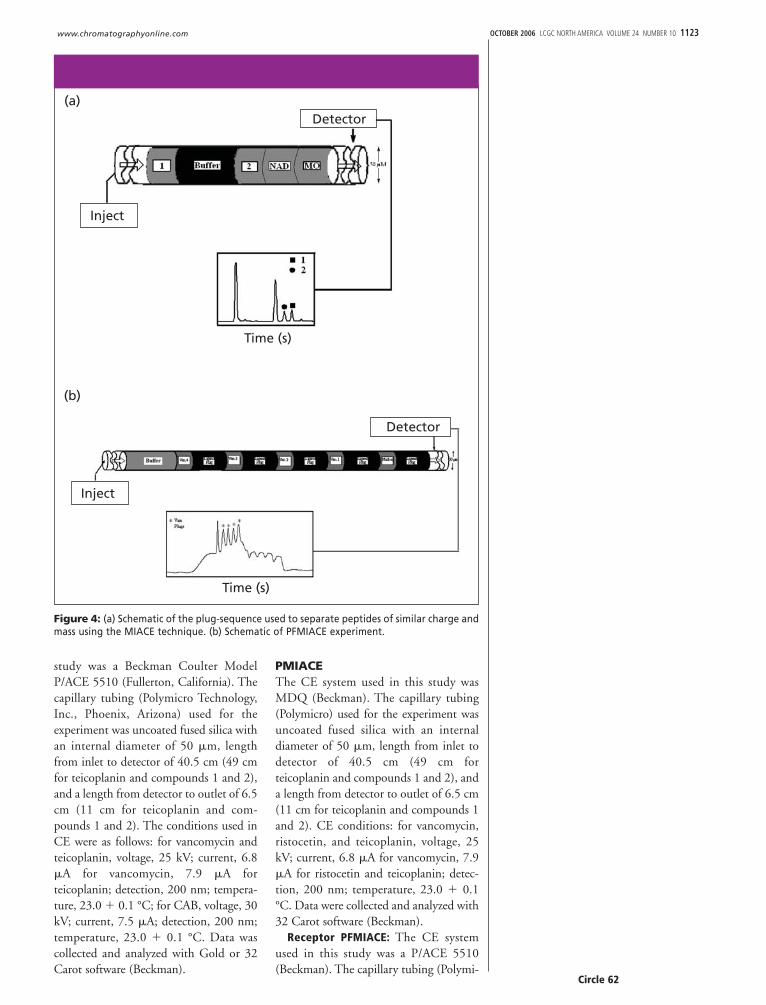
Figure 4: (a) Schematic of the plug-sequence used to separate peptides of similar charge andmass using the MIACE technique. (b) Schematic of PFMIACE experiment.
Circle 62
1124 LCGC NORTH AMERICA VOLUME 24 NUMBER 10 OCTOBER 2006 www.chromatographyonline.com
cro) used for the experiment was uncoatedfused silica with an internal diameter of50 �m, length from inlet to detector of40.5 cm, and a length from detector tooutlet of 6.5 cm. CE conditions: for van-comycin and teicoplanin, voltage, 25 kV;current, 6.7 �A for vancomycin, 7.9 �Afor teicoplanin; detection, 200 nm; tem-perature, 23.0 � 0.1 °C; for CAB, volt-age, 25 kV; current, 8.0 �A; detection,200 nm; temperature, 23.0 � 0.1 °C.Data were collected and analyzed withGold software (Beckman).
Peptide PFMIACE: The CE system usedin this study was the MDQ (Beckman).The capillary tubing (Polymicroused forthe experiment was uncoated fused silicawith an internal diameter of 50 �m,length from inlet to detector of 50.0 cm,and a length from detector to outlet of 11cm. CE conditions: for vancomycin,teicoplanin, and ristocetin, voltage, 25kV; current, 7.8 �A for vancomycin, 7.9�A for teicoplanin and ristocetin; detec-
tion, 200 nm; temperature, 23.0 � 0.1°C. Data were collected and analyzed with32 Karat software (Beckman).ProceduresMIACE: For vancomycin, the capillary firstwas equilibrated with buffer (192 mMglycine–25 mM Tris; pH 8.3) containingincreasing concentrations of peptide(0–100 �M). Separate plugs of samplesolution (3.6 nL each [a 1-s injection ofsample equals 1.2 nL of solution for a 50-�m inner diameter capillary per vendorspecifications]) containing the markerMO, five plugs of vancomycin, and sec-ond marker (CBSA) then were introducedby pressure injection each separated by aplug of buffer (18-s injection). The elec-trophoresis was carried out usingTris–glycine buffer with increasing con-centrations of ligand at 25 kV for 6.0 minto complete the detection of all species.Experimental conditions for teicoplaninand CAB were similar except only threeplugs of receptor were introduced and
experiments were run for 7.0 min toteicoplanin. For CAB, HHM was used asa marker and was introduced directly afterintroduction of the first marker MO.
PMIACEFor analysis of 1 and 2, the capillary wasfirst equilibrated with buffer (192 mMglycine–25 mM Tris, pH 8.3) containingincreasing concentrations of vancomycin(0–230 �M). Separate plugs of samplesolution (3.6 nL) containing the marker(MO), second marker (NAD), 2, buffer(18.0 nL), and 1 were then introduced bypressure injection. The electrophoresiswas carried out using Tris–glycine bufferwith increasing concentrations of van-comycin at 25 kV for 7.0 min to completethe detection of all species. For ristocetinthe markers NAD and NADH were usedfor the studies.
Receptor PFMIACE: For vancomycin,the capillary was first equilibrated with
Table IV: Experimental values of binding constants Kb (103M-1) of ligands 3–6 to Van,Rist, and Teic obtained by equation 2
Ligand Van Kb Rist Teic
1 16.9 (0.977)a 16.6 (0.907)b 68.3 (0.938)c
2 60.5 (0.936)d 16.0 (0.916)e 68.5 (0.887)f
29.3 (ITC)3 81.5 (0.959) 35.4 (0.972)g 108.8 (0.930)
46.9 (ITC)4 273.1 (0.935) 25.7 (0.920)h 13.5 (0.950)
40.0 (ITC)aPrevious estimates [24]: Kb � 41.6 � 103 M-1 (pH 7.5).bPrevious estimates [24,29]: Kb � 41.4 � 103 M-1 (pH 8.3), Kb � 8.2 � 103 M-1 (pH 7.5)cPrevious estimate [24]: Kb � 21.8 � 103 M-1 (pH 7.5).dPrevious estimate [24]: Kb � 174.5 � 103 M-1 (pH 7.5).ePrevious estimate [24,29]: Kb � 9.1 � 103 M-1 (pH 8.3); [23] Kb � 52.4 � 103 M-1 (pH 7.5).fPrevious estimate [24]: Kb � 185.1 � 103 M-1 (pH 7.5).gPrevious estimate [29]: Kb � 16.4 � 103 M-1 (pH 8.3).hPrevious estimate [29]: Kb � 25.3 � 103 M-1 (pH 8.3).
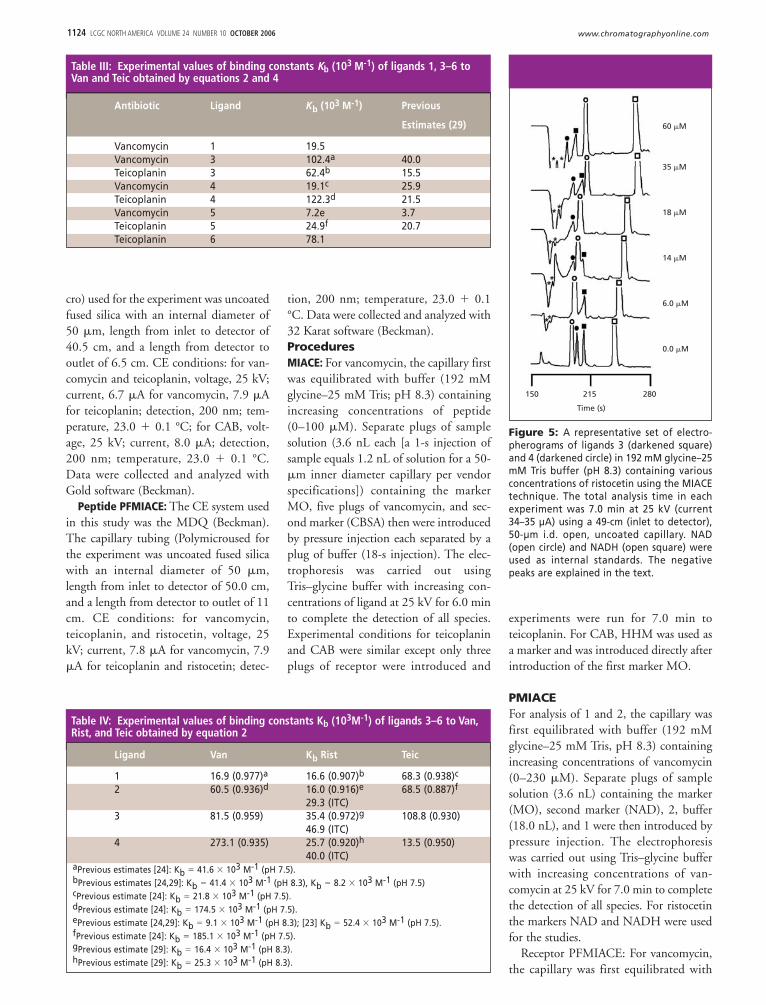
Figure 5: A representative set of electro-pherograms of ligands 3 (darkened square)and 4 (darkened circle) in 192 mM glycine–25mM Tris buffer (pH 8.3) containing variousconcentrations of ristocetin using the MIACEtechnique. The total analysis time in eachexperiment was 7.0 min at 25 kV (current34–35 µA) using a 49-cm (inlet to detector),50-µm i.d. open, uncoated capillary. NAD(open circle) and NADH (open square) wereused as internal standards. The negativepeaks are explained in the text.
Time (s)
150 215 280
60 �M
35 �M
18 �M
14 �M
6.0 �M
0.0 �M
Table III: Experimental values of binding constants Kb (103 M-1) of ligands 1, 3–6 toVan and Teic obtained by equations 2 and 4
Antibiotic Ligand Kb (103 M-1) Previous
Estimates (29)
Vancomycin 1 19.5Vancomycin 3 102.4a 40.0Teicoplanin 3 62.4b 15.5Vancomycin 4 19.1c 25.9Teicoplanin 4 122.3d 21.5Vancomycin 5 7.2e 3.7Teicoplanin 5 24.9f 20.7Teicoplanin 6 78.1
OCTOBER 2006 LCGC NORTH AMERICA VOLUME 24 NUMBER 10 1125www.chromatographyonline.com
buffer (192 mM glycine–25 mM Tris, pH8.3) for 0.5 min. A 0.12-min buffer plugthen is introduced containing increasingconcentration of peptide (0–300 �M).
Separate plugs of sample solution (5-sinjections each, 6 nL) containing themarker MO, four plugs of vancomycin,and a second marker HHM were intro-duced by pressure injection each separatedby a plug of buffer (36-s injection). Theelectrophoresis was carried out usingTris–glycine buffer containing no ligandat 25 kV for 8.0 min to complete thedetection of all species. Experimental con-ditions for teicoplanin were similar exceptthat three injections of teicoplanin wereused, each separated by an 18-s plug ofbuffer.
Peptide PFMIACE: For analysis of 1 and2, separate plugs of solution (3.6 nL) con-taining the marker (MO), 2, buffer (18.0nL), and 1 were introduced by pressureinjection followed by an injection ofantibiotic (96-s at 0.7 psi) and elec-trophoresed at various increasing concen-trations of antibiotic. The electrophoresiswas carried out using Tris–glycine bufferat 25 kV for 7.0 min to complete the
detection of all species. For ristocetin andteicoplanin NADH was used as the non-interacting standard. For CAB, separateplugs of solution of ligand (0.12 min athigh pressure), markers (MO and HHM),buffer, CAB, buffer, CAB, buffer, andCAB, were electrophoresed at increasingconcentrations of ligand. The elec-trophoresis was carried out usingTris–glycine buffer at 25 kV for 8.0 minto complete the detection of all species.
Forms of AnalysisTwo forms of analysis, one using twomarkers (equations 1 and 2) and the otherusing a single marker (equations 3 and 4),were used to estimate Kb. In the dualmarker form of analysis, Kb is estimatedusing two noninteracting standards,which we term the relative migration timeratio (RMTR) (equation 1) (9).
Here, tp, ts, and ts’ are the measuredmigration times of the antibiotic peak (forexample, vancomycin), and two noninter-acting standard peaks (CBSA and MO),
respectively. A Scatchard plot can beobtained via equation 2.
Here, �RMTRP,A is the magnitude ofchange in the RMTR as a function of theconcentration of peptide. In the secondform of analysis, Kb is estimated using onenoninteracting standard that relateschanges in the electrophoretic mobility(�P,L) of, for example, vancomycin oncomplexation with the ligand (L) presentin the buffer to Kb.
Analysis of the magnitude of thechange in mobility ��P,,L as a functionof the concentration [L] of ligand yieldsKb (equation 3).
Here, ��P,L is the change in mobility ofvancomycin as a function of the concen-tration ofbpeptide, tP,L and tm,L are themeasured migration times of vancomycinand a noninteracting standard (for exam-
Circle 63
RMTR � (tp � ts �) / (ts� � ts) [1]
�RMTRP,A /[L]�Kb�RMTRP,A max � Kb�RMTRP,A [2]
�� P,L � � P,L � �P � lc ld / V[(1/tP,L � 1/tm,L) � (1/tP � 1/tm)] [3]
1126 LCGC NORTH AMERICA VOLUME 24 NUMBER 10 OCTOBER 2006 www.chromatographyonline.com
ple, MO or CBSA) at the concentrationof peptide, respectively, lc (cm) is the totallength of the capillary, ld (cm) is thelength of capillary from the inlet end ofthe capillary to the detector, tm (s) is themeasured migration time of the noninter-acting standard, tP is the measured migra-tion time of the vancomycin, and V is thevoltage across the capillary. Equation 4can then be used for Scatchard analysis.
Results and DiscussionMIACE: Receptor as sample: In the firstseries of experiments, we examined thebinding of D-Ala-D-Ala terminus pep-tides to vancomycin using the MIACEtechnique (Figure 1) (29). Vancomycin-group antibiotics are glycopeptides thatkill bacterial cells by inhibiting peptido-glycan biosynthesis (43–49). They func-tion by binding to the terminal D-Ala-D-Ala dipeptide of bacterial cell wallprecursors, thereby, impeding further pro-cessing of these intermediates into pepti-
doglycan. Vancomycin, from Streptomycesorientalis, has been called the antibiotic oflast resort because of its effectiveness intreating infections caused by bacteriaresistant to other antibiotics such asStaphylococcus aureus. Bacteria also haveconferred resistance to vancomycinthrough the substitution of the D-Ala-D-Ala terminus of the peptidoglycan precur-sor by D-Ala-D-Lac (Lac � lactic acid).The great numbers of mutations that haveevolved in bacteria have made it increas-ingly important to develop new van-comycin-group antibiotics, study theirphysicochemical parameters, and toexamine their activity against van-comycin-resistant enterococci (VRE).
In the MIACE technique, a plug ofsample containing the noninteractingstandard MO was injected first into thecapillary column followed by five plugs ofsample containing vancomycin (Figure 2).Between each injection of vancomycinwas placed a small plug of buffer to aid inthe separation of all vancomycin peaks. Afinal plug of the second noninteractingstandard, 4- CBSA, was then injected andelectrophoresed. Upon electrophoresis,individual plugs of sample migratethrough the capillary column to affordseven peaks (five for vancomycin and twofor the standards). Figure 3 shows a repre-sentative series of electropherograms ofvancomycin in a capillary filled withincreasing concentrations of 1 at 200 nm.The peaks for vancomycin are not base-line resolved but can be differentiatedfrom each other easily. As the concentra-tion of 1 was increased (0 to 300 �M) inthe running buffer, the peaks for van-comycin shifted to longer migration timesas the Van-1 complexes are more negativethan vancomycin itself. The invertedpeaks to the right of the vancomycinpeaks are due to the dilution of 1 in therunning buffer upon complexation tovancomycin. Due to the higher mass ofthe newly formed complex upon increas-ing the concentration of 1 the height ofthe peaks for vancomycin increase incomparison to the MO marker.
The average binding constant wasdetermined to be 22.3 � 103M-1. In ourprevious work at pH 7.5 and in phosphatebuffer, we determined a value for Kb of41.6 � 103M-1 (25). Using a similarinjection sequence, we determined thebinding affinities of ligands 2–6 to van-
Time (s)
200 305 410
300 �M
200 �M
150 �M
100 �M
75.0 �M
40.0 �M
20.0 �M
0.00 �M
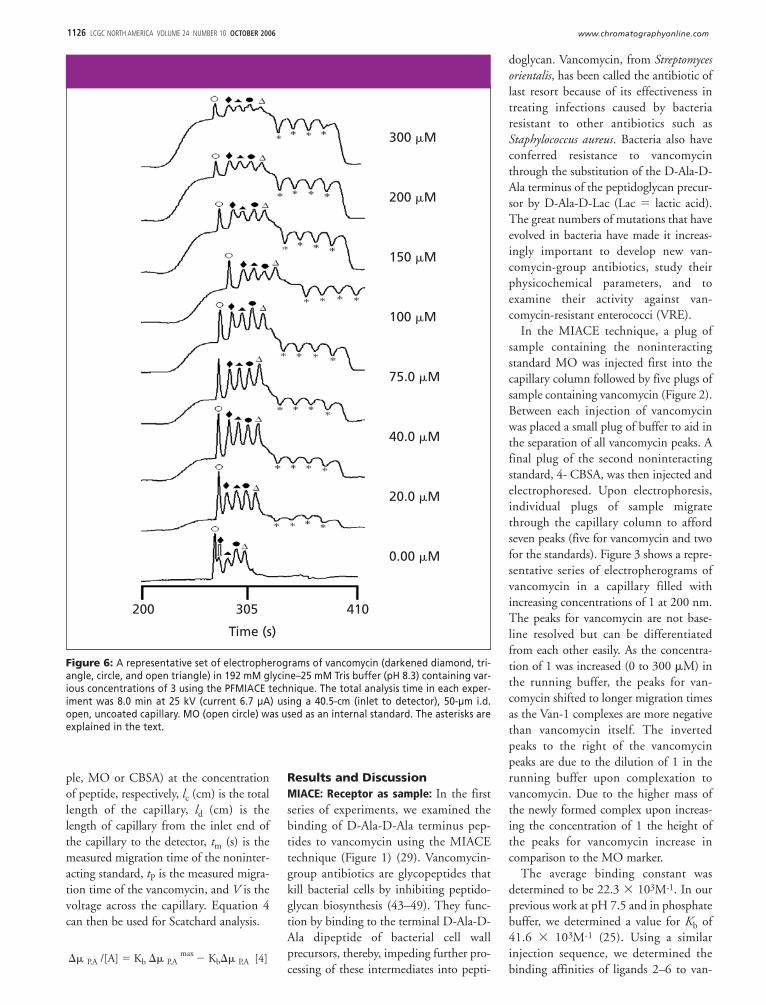
Figure 6: A representative set of electropherograms of vancomycin (darkened diamond, tri-angle, circle, and open triangle) in 192 mM glycine–25 mM Tris buffer (pH 8.3) containing var-ious concentrations of 3 using the PFMIACE technique. The total analysis time in each exper-iment was 8.0 min at 25 kV (current 6.7 µA) using a 40.5-cm (inlet to detector), 50-µm i.d.open, uncoated capillary. MO (open circle) was used as an internal standard. The asterisks areexplained in the text.
�� P,A /[A] � Kb �� P,A max � Kb�� P,A [4]
OCTOBER 2006 LCGC NORTH AMERICA VOLUME 24 NUMBER 10 1127www.chromatographyonline.com
comycin. Table I summarizes the bindingdata obtained for vancomycin and ligands2–6. The binding constants obtainedusing MIACE were comparable to thosedetermined using standard ACE tech-niques (9,23,25,26).
We also examined the binding of sev-eral D-Ala-D-Ala terminus peptides toteicoplanin. Like vancomycin, teicoplaninis a linear heptapeptide, cross-linkedbetween residues 1 and 3, 2 and 4, and 4and 6 by diphenyl ether bridges andbetween residues 5 and 7 by a biphenylbridge. Teicoplanin is a mixture of fiveclosely related analogues, designated T-A1-
1 through T-A1-5. They differ by approxi-mately 20 molecular mass units because ofthe variation of the carbon length andsubstituent groups of the hydrophobicacyl side chain (hydrophobic tail) that isattached to a 2-amino-2-deoxy-�-D-glu-copyranosyl moiety. This hydrophobic tailgives teicoplanin its unique characteris-tics. Table II lists the binding data forteicoplanin and ligands 1, 2, and 5.
MIACE: Ligand as sample: In somecases, the lack of receptors precludes theuse of standard ACE techniques wherebythe receptor is injected as the sample. Fur-thermore, there is sometimes the need forexamining more than one interaction pairat a time, especially when high-through-put screening of potential drug targets iswarranted. In such cases, ligands can beutilized as the sample. Analyzing ligandsof similar charge and nominal differencesin mass can pose problems as their elec-trophoretic mobilities are practically thesame resulting in either a single peak or, atbest, overlap of peaks with little to nobaseline resolution. To remedy this prob-lem, we modified our original MIACEtechniques by utilizing a novel plug injec-tion sequence. Figure 4a shows theschematic of the plug injection used toexamine peptides of similar mass and thesame charge. In this technique, separateplugs of sample containing noninteract-ing standards, peptide one, buffer, andpeptide two, are injected into the capillarycolumn and electrophoresed. Peptidesmigrate through the column at similarelectrophoretic mobilities but remain asdistinct zones due to the buffer plugbetween peptides. Upon electrophoresisall species migrate through the capillary attheir respective electrophoretic mobilities.Because of the buffer plug inserted
between peptides both peptides remain asseparate zones of sample during elec-trophoresis and do not mix during theexperiment.
We first examined the binding of lig-ands 1–4 to ristocetin. Ristocetin, likevancomycin, also inhibits cell wall pepti-doglycan biosynthesis in susceptible bac-teria by binding to key peptidoglycanintermediates. It was clinically employedto treat bacterial infections into the late1950s, but due to undesirable side effects,was discontinued. Recently, the increasingincidence of vancomycin-resistant strains
of infectious bacteria has sparked interestin the synthesis of these new ristocetinderivatives. Figure 5 is a representativeseries of electropherograms of peptides 3and 4 in capillaries filled with ristocetin at200 nm. For clarity, only six electrophero-grams are shown. At ristocetin concentra-tions of 6 and 18 �M ligands 3 and 4migrate at similar electrophoretic mobili-ties as the marker NAD, respectively, andare not observed in the electrophero-grams. As the concentration of ristocetinwas increased in the running buffer thepeaks for 3 and 4 shift to a shorter migra-
Circle 64
1128 LCGC NORTH AMERICA VOLUME 24 NUMBER 10 OCTOBER 2006 www.chromatographyonline.com
tion time on formation of the 3-ristocetinand 4-ristocetin complexes and areobserved clearly in the electropherogram.
The negative peaks to the right of MOare due to the dilution of ristocetin in theelectrophoresis buffer. As can be seen inFigure 5, the greater the concentration ofristocetin the more pronounced the nega-tive peaks are. There is some variation inthe values for Kb between the four ligandsand ristocetin. We also examined thebinding of ligands 1–4 to vancomycinand teicoplanin. Table II lists the bindingdata for teicoplanin and ligands 1–4.
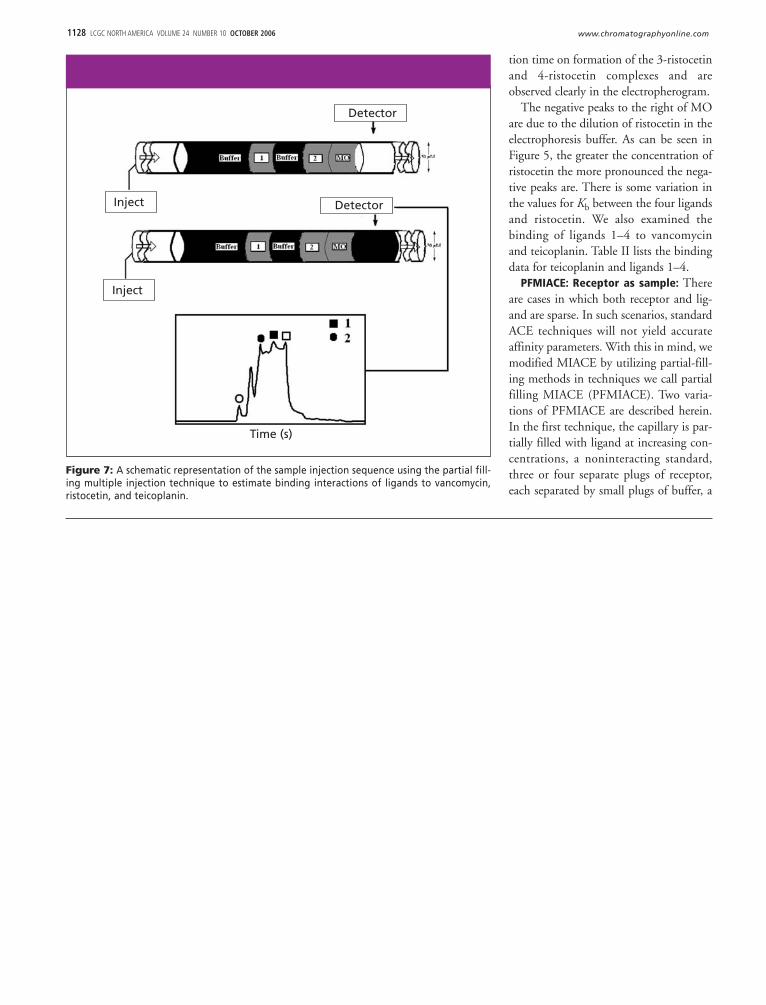
PFMIACE: Receptor as sample: Thereare cases in which both receptor and lig-and are sparse. In such scenarios, standardACE techniques will not yield accurateaffinity parameters. With this in mind, wemodified MIACE by utilizing partial-fill-ing methods in techniques we call partialfilling MIACE (PFMIACE). Two varia-tions of PFMIACE are described herein.In the first technique, the capillary is par-tially filled with ligand at increasing con-centrations, a noninteracting standard,three or four separate plugs of receptor,each separated by small plugs of buffer, a
Figure 7: A schematic representation of the sample injection sequence using the partial fill-ing multiple injection technique to estimate binding interactions of ligands to vancomycin,ristocetin, and teicoplanin.
Inject
Detector
Time (s)
Detector
Inject
OCTOBER 2006 LCGC NORTH AMERICA VOLUME 24 NUMBER 10 1129www.chromatographyonline.com
tide one, buffer, and peptide two, wereinjected into the capillary column. Thecapillary is partially filled with a series ofbuffers containing an antibiotic at increas-ing concentrations and electrophoresed.Peptides migrate through the column atsimilar electrophoretic mobilities becausetheir charge-to-mass ratios are approxi-mately the same but remain as distinctzones due to the buffer plug between pep-tides. Upon electrophoresis, the plug ofantibiotic flows into the peptide plugsaffecting a shift in the migration time ofthe peptides with respect to the noninter-acting standards occurs due to formationof the of the antibiotic-peptide complex.
Figure 7 shows a schematic representa-tion of the injection plug sequence. In thistechnique, separate plugs of sample solu-tion containing the marker (MO), secondmarker (NADH), 2, buffer, and 1 wereintroduced via pressure injection followedby partially filling the capillary with anantibiotic. Upon electrophoresis, the plugof antibiotic migrates into the zones of thetwo ligands due to it having a greater elec-trophoretic mobility. The ligand-antibi-otic complex is then detected by UV–Vis
the vancomycin zones of solution. Uponapplication of a voltage, the individualplugs of sample migrate through the cap-illary and into the zone of 3. Figure 6shows a representative series of electro-pherograms of vancomycin in a capillarypartially filled with increasing concentra-tions of 3. The height of the ligandplateaus present in the electropherogramsincrease as a result of the increasing con-centration of 3 partially filled in the capil-lary. As the concentration of 3 in the cap-illary increases, the peak for thevancomycin species shift to a greatermigration time due to formation of Van-3, which is more negatively charged thanvancomycin alone. Table III summarizesthe binding data obtained for vancomycinand ligand 3 and other ligands used in thisstudy. We also examined the binding ofteicoplanin to ligands 1, 2, 4, and 5. Asimilar injection sequence was used foranalysis of teicoplanin and the ligands andthe values for binding constants listed inTable III.
PFMIACE: Ligand as sample: In the sec-ond technique, separate plugs of samplecontaining noninteracting standards, pep-
plug containing a second noninteractingstandard, and then electrophoresed inbuffer. Upon continued electrophoresis,equilibrium is established between the lig-and and receptors, causing a shift in themigration time of the receptors withrespect to the noninteracting standards.This change in migration time is utilizedfor estimating values for Kb. We firstexamined the binding of 3 to van-comycin. Using the PFMIACE tech-nique, a buffer plug of 3 was introducedat increasing concentrations of ligand, fol-lowed by a sample plug containing thenoninteracting standard MO and thenfour plugs of sample containing van-comycin (Figure 4b). Between each injec-tion of vancomycin was placed a smallplug of buffer to aid in the separation of
Circle 65
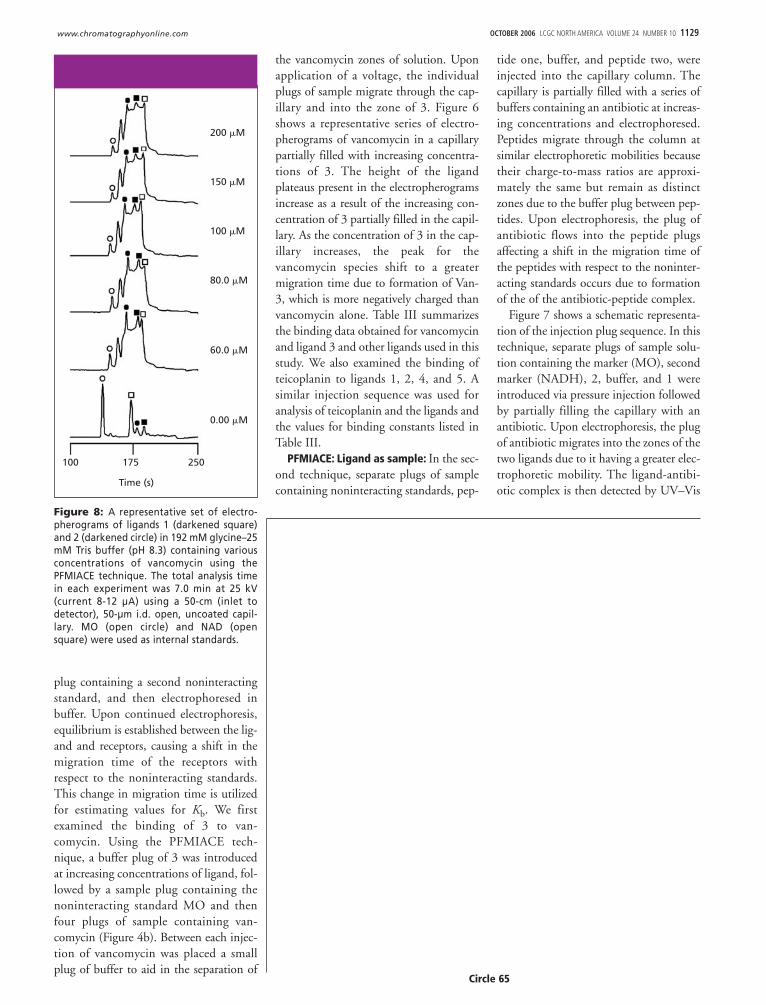
Figure 8: A representative set of electro-pherograms of ligands 1 (darkened square)and 2 (darkened circle) in 192 mM glycine–25mM Tris buffer (pH 8.3) containing variousconcentrations of vancomycin using thePFMIACE technique. The total analysis timein each experiment was 7.0 min at 25 kV(current 8-12 µA) using a 50-cm (inlet todetector), 50-µm i.d. open, uncoated capil-lary. MO (open circle) and NAD (opensquare) were used as internal standards.
Time (s)
100 175 250
200 �M
150 �M
100 �M
80.0 �M
60.0 �M
0.00 �M
1130 LCGC NORTH AMERICA VOLUME 24 NUMBER 10 OCTOBER 2006 www.chromatographyonline.com
absorption. Figure 8 illustrates a represen-tative series of electropherograms of 1, 2,and increasing concentrations of van-comycin partially filled in the capillarycolumn. Upon increasing the concentra-tion of vancomycin, a shift in the migra-tion time of 1 and 2 is observed. Thenewly formed Van-1 and Van-2 com-plexes have different chargeto-mass ratiosthan the unbound species causing a shiftto less migration time relative to the stan-dards. The two markers (MO and NAD)are unaffected during the experiment.Increasing concentrations of vancomycincan be seen as a height increase of the van-comycin plateaus. At the zero concentra-tion of vancomycin, the peaks are baselineresolved clearly showing the separationbetween ligands 1 and 2. At a vancomycinconcentration of 60 �M the peaks for 1and 2 have shifted completely to the leftof the NAD marker. Further increasingthe concentration of vancomycin shiftsthe Van-1 and Van-2 complexes to evenshorter migration time 2. Only six elec-tropherograms were reproduced to grantclarity to Figure 8 although more concen-trations were used to obtain the Kb.
One of the majoradvantages ofPFMIACE overMIACE and otherACE techniques isthe quantity ofsample used in theexperiment.
The dual marker form of analysis wasused to calculate Kb. Table IV lists the val-ues obtained using the PFMIACE tech-nique. Ligands 3 and 4 also were studiedwith vancomycin. Our results show thatdifferent binding constants are obtainedfor 1–4 to vancomycin contrary to previ-ous studies that have shown that modifi-cation at the N-terminus does not signifi-cantly affect binding. It is possible thatupon complexation to vancomycin, theside group of the amino acid alpha to theD-Ala-D-Ala terminus peptide mightcause a structural change to the binding
pocket and changing the proximity of thefive key hydrogen bonds, hence, givingeither a favorable or unfavorable interac-tion. Moreover, interactions such ashydrophilic, hydrophobic, sterics, andothers might also play a role in the differ-ent binding affinities. A series of experi-ments also were conducted with risto-cetin. Table IV illustrates the dataafforded by the PFMIACE technique.
One of the major advantages of PFMI-ACE over MIACE and other ACE tech-niques is the quantity of sample used inthe experiment. Whereas in MIACE mul-tiple zones of vancomycin migratethrough a constant flow of solution con-taining ligand, in PFMIACE the capillaryis only partially filled with ligand. Theamount of ligand used in PFMIACEanalysis for vancomycin and teicoplanin is170 and 89 pmol, respectively; in MIACE592 pmol.
ConclusionWe have demonstrated the developmentof the MIACE technique to estimatebinding constants using as a model systemthe glycopeptide antibiotics vancomycin,
OCTOBER 2006 LCGC NORTH AMERICA VOLUME 24 NUMBER 10 1131www.chromatographyonline.com
teicoplanin and ristocetin. In these tech-niques, multiple injections of sample con-taining receptor (or ligand) was subjectedto an increasing concentration of ligand(or receptor) in the running buffer. Achange in migration time upon formationof complex was used in the Scatchardanalysis and realized multiple bindingconstants comparable to those obtainedusing other ACE techniques and tradi-tional assay methods. The advantages ofMIACE are several fold: One, smallerquantities of ligand are needed to conductthe studies in comparison to other assaytechniques. Two, purification of the sam-ple before injection is not necessary aslong as the component to be analyzed canbe separated from other species. Three,multiple binding constants can beobtained in a series of ACE experimentsshortening the amount of time requiredto conduct the assay. Finally, the commer-cial availibility of automated instrumenta-tion, and high reproducibility of data,make it experimentally convenient.
AcknowledgmentsThe authors gratefully acknowledgefinancial support for this research bygrants from the National Science Founda-tion (CHE-0136724, CHE-0515363 andDMR-0351848), and the National Insti-tutes of Health (1R15 AI055515-01,1R15AI65468-01, and GM54939).
References(1) J.C. Kraak, S. Busch, and H. Poppe, J. Chro-
matogr. 608, 257–264 (1992).
(2) Y.-H. Chu and G.M. Whitesides, J. Org.
Chem. 57, 3524–3525 (1992).
(3) Y.-H. Chu, L.Z. Avila, H.A. Biebuyck, and
G.M. Whitesides, J. Med. Chem. 35,
2915–2917 (1992).
(4) N.H.H. Heegaard and F.A. Robey, Anal.
Chem. 64, 2479–2482 (1992).
(5) Y. Baba, M. Tsuhako, M. Sawa, M. Akashi,
and E. Yashima, Anal. Chem. 64, 1920–1925
(1992).
(6) A. Varenne, P. Gareil, S. Colliec-Jouault, and
R. Daniel, Anal. Biochem. 315, 152–159
(2003).
(7) J. Kaddis, C. Zurita, J. Moran, M. Borra, N.
Polder, C.R. Meyer, and F.A. Gomez, Anal.
Biochem. 327, 252–260 (2004).
(8) D.D. Buchanan, E.E. Jameson, J. Perlette, A.
Malik, and R.T. Kennedy, Electrophoresis 24,
1375–1382 (2004).
(9) E. Mito, Y. Zhang, S. Esquivel, and F.A.
Gomez, Anal. Biochem. 280, 209–215
(2000).
(10) J. Heintz, M. Hernandez, and F.A. Gomez, J.
Chromatogr. A 840, 261–268 (1999).
(11) X-H. Qian and K.B. Tomer, Electrophoresis
19, 415–419 (1998).
(12) D.S. Zhao, E.-S. Kwak, J. Kawaoka, S.
Esquivel, and F.A. Gomez, Amer. Lab., 40–48
(1998).
(13) F.A. Gomez, J.N. Mirkovich, V.M.
Dominguez, K.W. Liu, and D.M. Macias, J.
Chromatogr. A 727, 291–299 (1996).
(14) J.J. Colton, J.D. Carbeck, J. Rao, and G.M.
Whitesides, Electrophoresis 19, 367–382
(1998).
(15) K.L. Rundlett and D.W. Armstrong, Elec-
trophoresis 18, 2194–2202 (1997).
(16) J. Kaddis, E. Mito, J. Heintz, A. Plazas, and
F.A. Gomez, Electrophoresis 24, 1105–1110
(2003).
(17) A. Taga, Y. Yamamoto, R. Maruyama, and S.
Honda, Electrophoresis 25, 876–881 (2004).
(18) M. Castagnola, D.V. Rossetti, R. Inzitari, A.
Lupi, C. Zuppi, T. Cabras, M.B. Fadda, G.
Onnis, R. Petruzzelli, B. Giardina, and I.
Messana, Electrophoresis 25, 846–852 (2004).
(19) H. Meisel and C. Olieman, Anal. Chim. Acta.
372, 291–297 (1998).
(20) J. Liu, K.J. Volk, M.S. Lee, M. Pucci, and S.
Handwerger, Anal. Chem. 66, 2412–2416
(1994).
(21) Y.–H. Chu, Y.M. Dunayevskiy, D.P. Kirby, P.
Vouros, and B.L. Karger, J. Amer. Chem Soc.
118, 7827–7835 (1996).
(22) V. Villareal, A. Brown, A. Gomez, C. Silverio,
and F.A. Gomez, Chromatographia 60, 73–78
(2004).
(23) M. Azad, A. Brown, I. Silva, and F.A. Gomez,
Anal. Bioanal. Chem. 379, 149–155 (2004).
(24) M.A. Azad, J. Kaddis, V. Villareal, L. Her-
nandez, C. Silverio, and F.A. Gomez, in Cap-
illary Electrophoresis of Proteins and Pep-
tides, M. Strege, A. and L. Lagu, Eds.
(Humana Press, Totowa, 2004), pp.
153–168.
(25) Y. Zhang, C. Kodama, C. Zurita, and F.A.
Gomez, J. Chromatogr. A 928, 233–241
(2001).
(26) C.F. Silverio, A. Plazas, J. Moran, and F.A.
Gomez, J. Liq. Chrom. & Rel. Tech. 25
1677–1691 (2002).
(27) C.F. Silverio, M. Azad, and F.A. Gomez, Elec-
trophoresis 24, 808–815 (2003).
(28) M. Azad, L. Hernandez, A. Plazas, M.
Rudolph, and F.A. Gomez, Chromatographia
57, 339–347 (2003).
(29) D. Chinchilla, J. Zavaleta, K.M. Martinez,
and F.A. Gomez, Anal. Bioanal. Chem. 383,
625–631 (2005).
(30) L.M. Lewis, L.J. Engle, W.E. Pierceall, D.E.
Hughes, and K.J. Shaw, J. Biomol. Screen. 9,
303–308 (2004).
(31) T.M. Phillips, Electrophoresis 25, 1652–1659
(2004).
(32) N.A. Guzman and R.J. Stubbs, Electrophore-
sis 22, 3602–3628 (2001).
(33) N.A. Guzman and T.M. Phillips, Anal.
Chem. 77, 61A–67A (2005).
(34) E. Bonneil and K.C. Waldron. J. Chromatogr.
B Biomed. Sci. Appl. 736, 273–287 (1999).
(35) T. Stroink, E. Paarlberg, J.C.M. Waterval, A.
Bult, and W.J.M. Underberg, Electrophoresis
22, 2375–2383 (2001).
(36) A. Brown, R. Desharnais, B.C. Roy, S.
Mallik, and F.A. Gomez, Anal. Chim. Acta.
540, 403–410 (2005).
(37) G. Li, X. Zhou, Y. Wang, A. El-Shafey, N.H.
Chiu, and I.S. Krull, J. Chromatogr. A 1053,
253–262 (2004).
(38) F. Progent, M. Taverna, I. Le Potier, F. Gopee,
and D. Ferrier, Electrophoresis 23, 938–944
(2002).
(39) S. Lin, I.-Y. Hsiao, and S.-M. Hsu, Anal.
Biochem. 254, 9–17 (1997).
(40) S. Kiessig, H. Bang, and F. Thunecke, J.
Chromatogr. A 853, 469–477 (1999).
(41) C. Karakasyan, M. Taverna, and M.–C. Mil-
lot, J. Chromatogr. A, 1032, 159–164 (2004).
(42) G.W. Anderson, J.E. Zimmerman, and F.M.
Callahan, J. Amer. Chem. Soc. 86,1839–1842
(1964).
(43) A.J.R. Heck, P.J. Bonnici, E. Breukink, D.
Morris, and M. Wills, Chem. Eur. J. 7,
910–916 (2001).
(44) N.E. Allen, D.L. LeTourneau, and J.N.
Hobbs Jr., Antimicrob. Agents Chemother. 41,
66–71 (1997).
(45) G. Chiosis and I.G. Boneca, Science 293,
1484–1487 (2001).
(46) D.A. Beauregard, A.J. Maguire, D.H.
Williams, and P.E. Reynolds, Antimicrob.
Agents Chemother. 41, 2418–2423 (1997).
(47) H. Arimoto, K. Nishimura, T. Kinumi, I.
Hayakawa, and D. Uemura, Chem. Commun.
1361–1362 (1999).
(48) W.C. Noble, Z. Virani, and R.G.A. Cree,
FEMS Microbiol. Lett. 93, 195–198 (1992).
(49) R. Kerns, S.D. Dong, S. Fukuzawa, J. Car-
beck, J. Kohler, L. Silver, and D. Kahne, J.
Am. Chem. Soc. 122, 12608–12609 (2000). �