Role of capillary electrophoresis in specialty chemical research
17
Journal of Chromatography, 636 (1993) 153-169 Elsevier Science Publishers B.V., Amsterdam CHROM. 24 739 Role of capillary electrophoresis in specialty chemical research Kenneth P. Evans* and Gillian L. Beaumont Specialties Research Centre, Zeneca Specialiies, P.O. Box 42, Blackley, Manchester MP 3DA (UK) ABSTRACT The use of capillary electrophoresis (CE) for the analysis of a range of specialty chemicals including small ions, agrochemicals, biocides and dyestuffs is reported. Quantitative aspects of the technique are also considered. In general CE is found to be comple- mentary to ion chromatography and high-performance liquid chromatography (HPLC) but offers distinct advantages in terms of speed, resolution, ease of method development and the ability to analyse dyestut% that are difficult by HPLC. INTRODUCTION The potential scope of CE techniques is far reach- ing and CE techniques approp~ate to specialty chemicals have been reported [ 1,2] covering the fol- lowing diverse range of compound types: (i) inor- ganic/small ions + macromolecules -+ submicron particles; (ii) highly polar molecules -+ neutral mol- ecules; (iii) chiral compounds (resolution of enantiomers). In this paper we report a comparison of CE with conventional chromato~aphic techniques for as- says developed in our laboratory involving the de- termination of small ions, agrochemicals, industrial biocides and dyestuffs. Whilst the CE methodolo- gies employed in this study have been extensively reported, there is little published information on their practical application in specialty chemicals re- search. In particular the analysis of anionic and cat- ionic dyestuffs by CE has received little attention [31* EXPERIMENTAL Instrumentation The capillary electrophoresis instrument used * Corresponding author. was a Quanta 4000 (Waters Chromatography, Divi- sion of Millipore, Milford, MA, USA) with a Per- kin-Elmer CLAS data system’ (Perkin-Elmer Cor- poration, Norwalk, CT, USA). The separation cap- illaries used were 60 cm x 75 pm I.D. fused-silica from Polymicro Technologies (Phoenix, AZ, USA). Ion chromatography (IC) was performed using a Dionex (Sunnyvale, CA, USA) 21001 chromato- graph. The IC column system used consisted of a 25 cm x 4.5 mm I.D. Dionex IonPac AS4A anion- exchange column fitted with a 5 cm x 4.5 mm I.D. AS4A guard column. A 5 cm x 4.5 mm I.D. ODS Hypersil precolumn was connected to the anion-ex- change column system to minimise sample fouling. The HPLC inst~ment used consisted of a Hewlett- Packard (Waldbronn, Germany) 109OL and HPLC columns were 25 cm x 4.5 mm I.D. ODS Hypersil (5 pm) (Shandon Scientific, Runcom, UK) or Sphe- risorb ODS-1 (5 pm) (Phase Separation, Deeside, UK). Chemicals, reagents and solvents Pu~fied (18 Ma) water using a Millipore (Bed- ford, MA, USA) Milli Q water purification system was used for all solutions. Sodium chromate tet- rahydrate, concentrated sulphuric acid, lithium hy- droxide, alkyl sulphonates, sodium tetraborate de- cahydrate, sodium carbonate, sodium bicarbonate
-
Upload
independent -
Category
Documents
-
view
1 -
download
0
Transcript of Role of capillary electrophoresis in specialty chemical research
Journal of Chromatography, 636 (1993) 153-169 Elsevier Science Publishers B.V., Amsterdam
CHROM. 24 739
Role of capillary electrophoresis in specialty chemical research
Kenneth P. Evans* and Gillian L. Beaumont Specialties Research Centre, Zeneca Specialiies, P.O. Box 42, Blackley, Manchester MP 3DA (UK)
ABSTRACT
The use of capillary electrophoresis (CE) for the analysis of a range of specialty chemicals including small ions, agrochemicals, biocides and dyestuffs is reported. Quantitative aspects of the technique are also considered. In general CE is found to be comple- mentary to ion chromatography and high-performance liquid chromatography (HPLC) but offers distinct advantages in terms of speed, resolution, ease of method development and the ability to analyse dyestut% that are difficult by HPLC.
INTRODUCTION
The potential scope of CE techniques is far reach- ing and CE techniques approp~ate to specialty chemicals have been reported [ 1,2] covering the fol- lowing diverse range of compound types: (i) inor- ganic/small ions + macromolecules -+ submicron particles; (ii) highly polar molecules -+ neutral mol- ecules; (iii) chiral compounds (resolution of enantiomers).
In this paper we report a comparison of CE with conventional chromato~aphic techniques for as- says developed in our laboratory involving the de- termination of small ions, agrochemicals, industrial biocides and dyestuffs. Whilst the CE methodolo- gies employed in this study have been extensively reported, there is little published information on their practical application in specialty chemicals re- search. In particular the analysis of anionic and cat- ionic dyestuffs by CE has received little attention
[31*
EXPERIMENTAL
Instrumentation The capillary electrophoresis instrument used
* Corresponding author.
was a Quanta 4000 (Waters Chromatography, Divi- sion of Millipore, Milford, MA, USA) with a Per- kin-Elmer CLAS data system’ (Perkin-Elmer Cor- poration, Norwalk, CT, USA). The separation cap- illaries used were 60 cm x 75 pm I.D. fused-silica from Polymicro Technologies (Phoenix, AZ, USA). Ion chromatography (IC) was performed using a Dionex (Sunnyvale, CA, USA) 21001 chromato- graph. The IC column system used consisted of a 25 cm x 4.5 mm I.D. Dionex IonPac AS4A anion- exchange column fitted with a 5 cm x 4.5 mm I.D. AS4A guard column. A 5 cm x 4.5 mm I.D. ODS Hypersil precolumn was connected to the anion-ex- change column system to minimise sample fouling. The HPLC inst~ment used consisted of a Hewlett- Packard (Waldbronn, Germany) 109OL and HPLC columns were 25 cm x 4.5 mm I.D. ODS Hypersil (5 pm) (Shandon Scientific, Runcom, UK) or Sphe- risorb ODS-1 (5 pm) (Phase Separation, Deeside, UK).
Chemicals, reagents and solvents Pu~fied (18 Ma) water using a Millipore (Bed-
ford, MA, USA) Milli Q water purification system was used for all solutions. Sodium chromate tet- rahydrate, concentrated sulphuric acid, lithium hy- droxide, alkyl sulphonates, sodium tetraborate de- cahydrate, sodium carbonate, sodium bicarbonate
154 K. P. Evans and G. L. Beaumont / J. Chromatogr. 636 (1993) 153-169
and tetrapropyl ammonium hydroxide were ob- tained from Aldrich (Gillingham, UK). p-Hydroxy- benzoic acid was obtained from Sigma (Poole, UK). The anion and cation standards were obtained from BDH (Poole, UK). Sodium dodecyl sulphate (SDS) and dicyclohexylamine were supplied by Fluka (Glossop, UK) and orthophosphoric acid from May and Baker (Eccles, UK). HPLC solvents were obtained from Rathburn (Walkerburn, UK). The electroosmotic flow modifiers OFM Anion-BT and UVCat-1 were obtained from Waters.
Ion Analysis, CIA) for the CE determination of small ions using buffer systems containing a num- ber of patented electroosmotic flow modifiers. The range of ions currently amenable to CIE is some 130 comprising inorganic anions, organic acids, small chain anionic surfactants and inorganic cat- ions [4-lo].
RESULTS AND DISCUSSIONS
Capillary ion electrophoresis versus ion chromatog- raphy
Capillary ion electrophoresis (CIE) is a technique introduced by Waters Chromatography Division of Millipore in 1991 (under the trade name Capillary
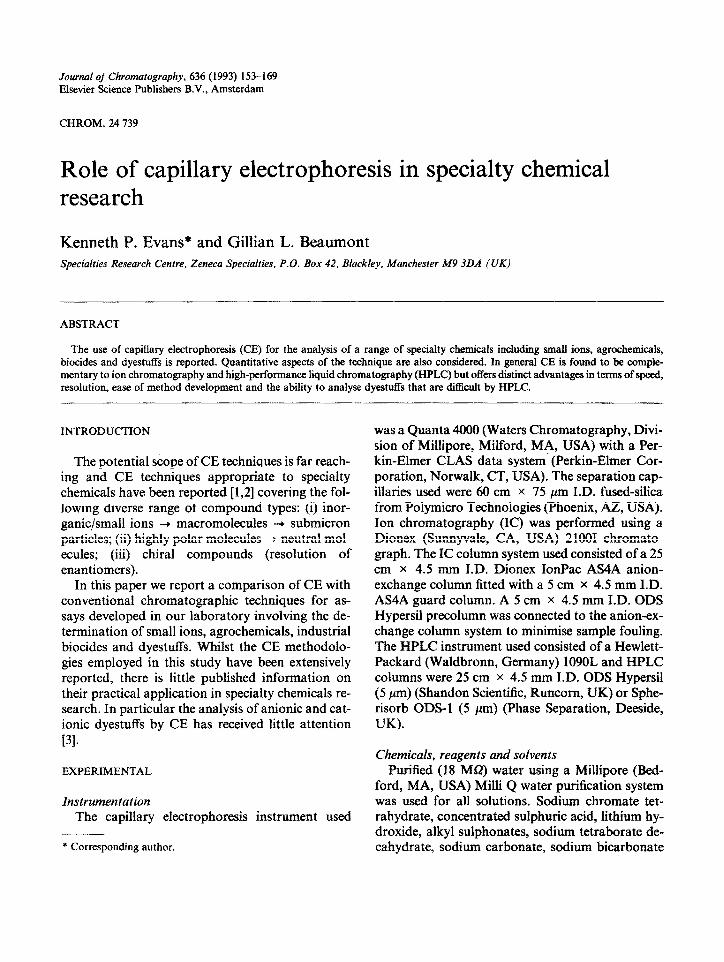
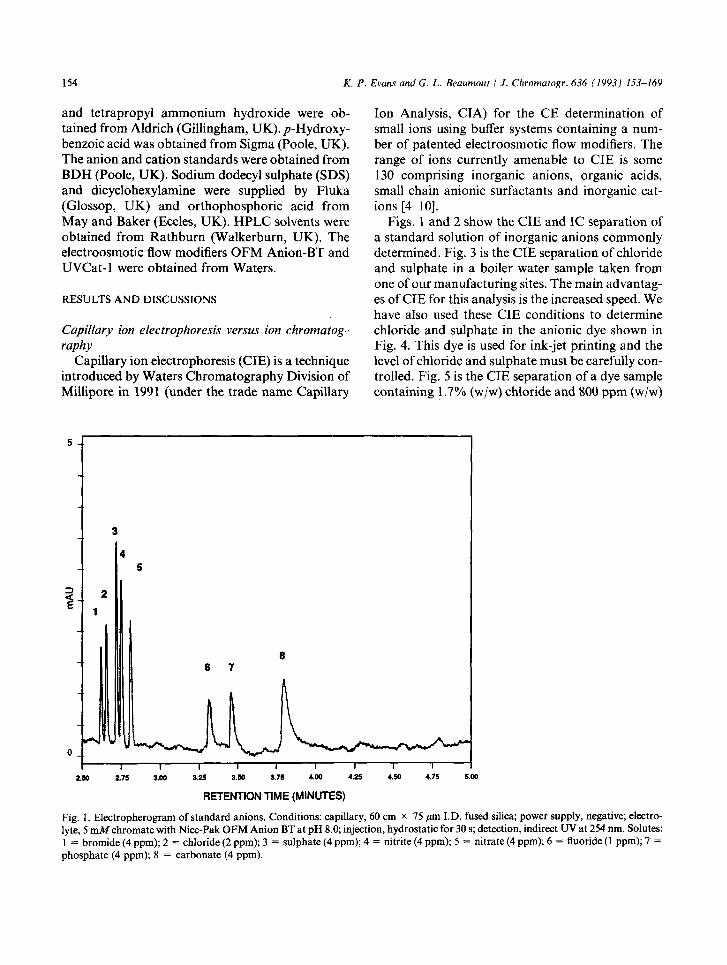
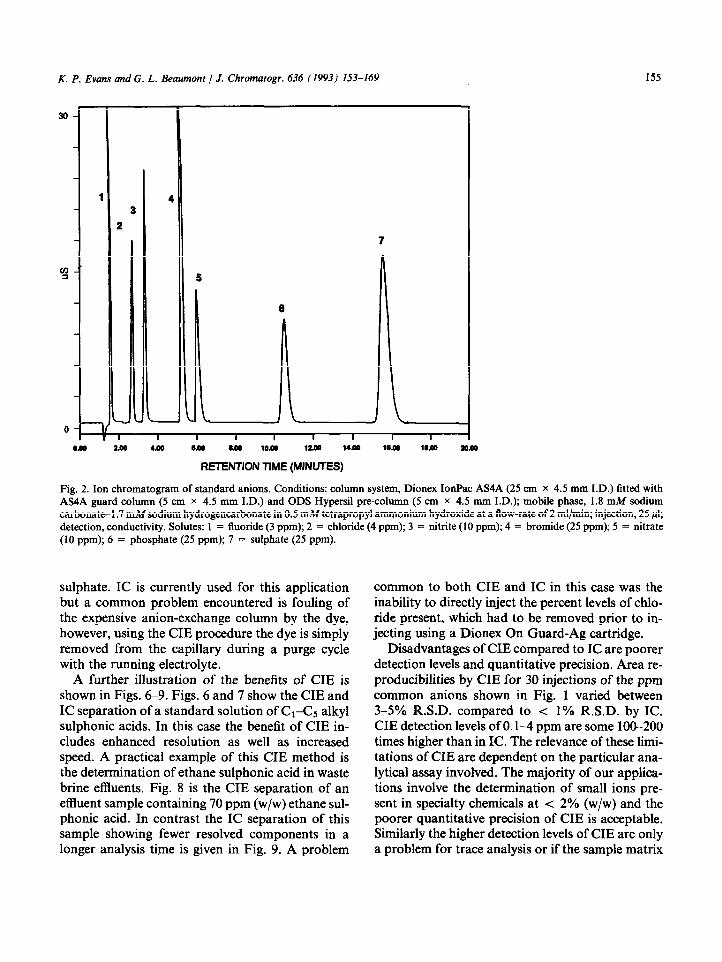
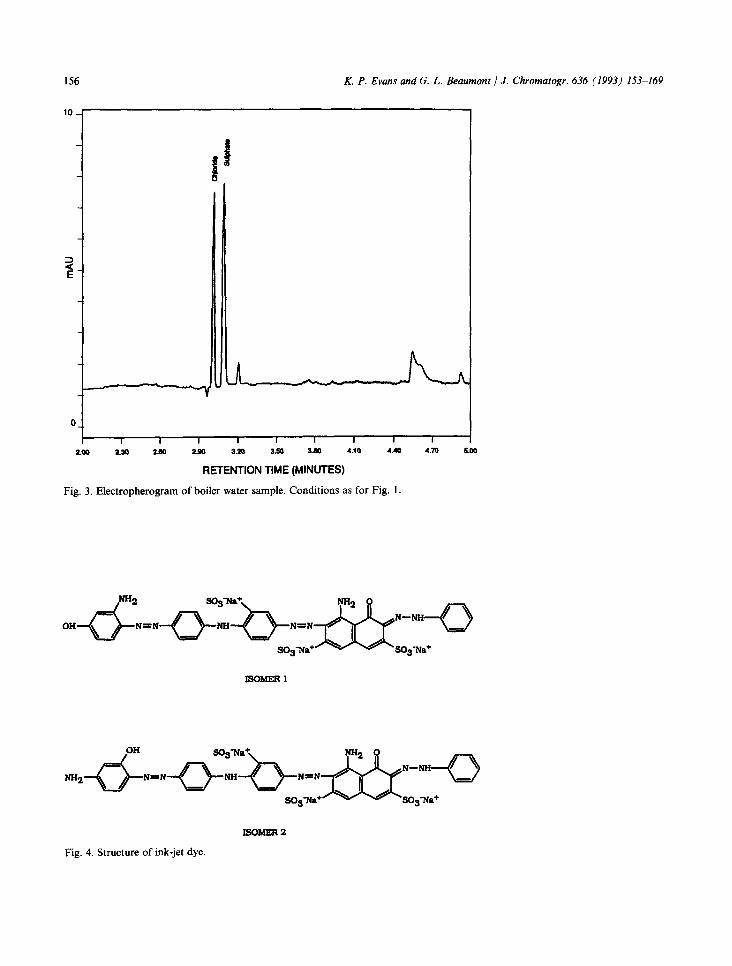
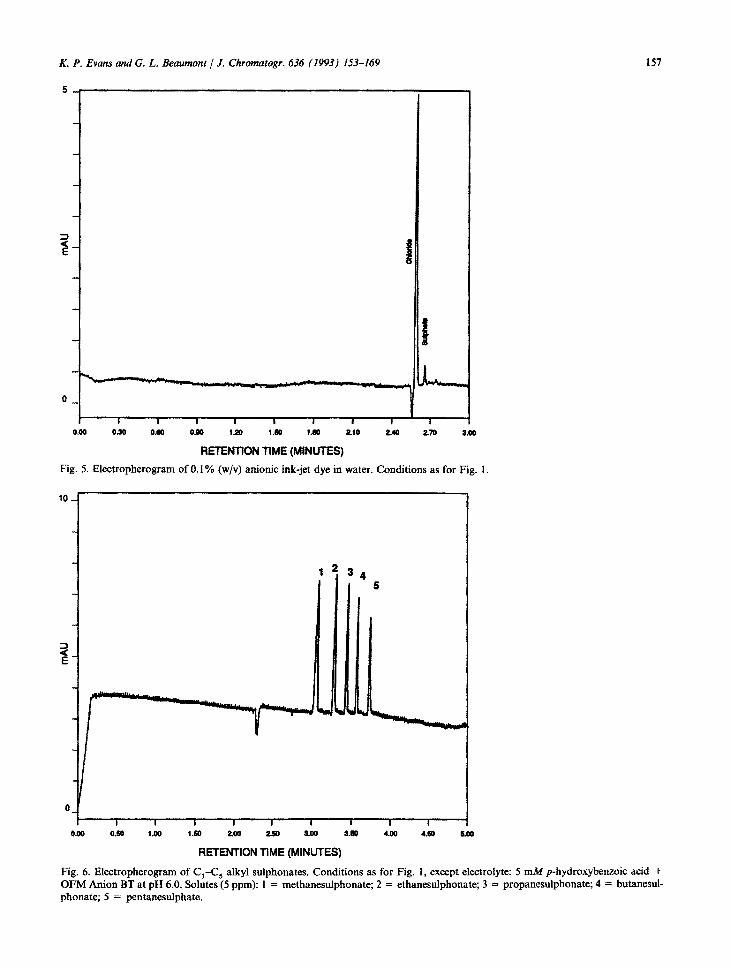
Figs. 1 and 2 show the CIE and IC separation of a standard solution of inorganic anions commonly determined. Fig. 3 is the CIE separation of chloride and sulphate in a boiler water sample taken from one of our manufacturing sites. The main advantag- es of CIE for this analysis is the increased speed. We have also used these CIE conditions to determine chloride and sulphate in the anionic dye shown in Fig. 4. This dye is used for ink-jet printing and the level of chloride and sulphate must be carefully con- trolled. Fig. 5 is the CIE separation of a dye sample containing 1.7% (w/w) chloride and 800 ppm (w/w)
6 6 7
250 275 5.00 3.25 3.w 3.75 4.00 4.25 4.50 4.75 5.00
RETENTION TIME (MINUTES)
Fig. 1. Electropherogram of standard anions. Conditions: capillary, 60 cm x 75 pm I.D. fused silica; power supply, negative; electro- lyte, 5 mMchromate with Nice-Pak OFM Anion BT at pH 8.0; injection, hydrostatic for 30 s; detection, indirect UV at 254 nm. Solutes: 1 = bromide (4 ppm); 2 = chloride (2 ppm); 3 = sulphate (4 ppm); 4 = nitrite (4 ppm); 5 = nitrate (4 ppm); 6 = fluoride (1 ppm); 7 = phosphate (4 ppm); 8 = carbonate (4 ppm).
K. P. Evans and G. L. Beaumont / J. Chromatogr. 636 (1993) 153-169 155
30
%?
0
5
am am 460 Roe MO 10.44 1200 14m 1MO 1884 son4
RETENTION TIME (MINUTES)
Fig. 2. Ion chromatogram of standard anions. Conditions: column system, Dionex IonPac AS4A (25 cm x 4.5 mm I.D.) fitted with AS4A guard column (5 cm X 4.5 mm I.D.) and ODS Hypersil pre-column (5 cm x 4.5 mm I.D.); mobile phase, 1.8 mM sodium carbonate-l .7 mM sodium hydrogencarbonate in 0.5 mM tetrapropyl ammonium hydroxide at a flow-rate of 2 ml/mm; injection, 25 ~1; detection, conductivity. Solutes: 1 = fluoride (3 ppm); 2 = chloride (4 ppm); 3 = nitrite (10 ppm); 4 = bromide (25 ppm); 5 = nitrate (10 ppm); 6 = phosphate (25 ppm); 7 = sulphate (25 ppm).
sulphate. IC is currently used for this application but a common problem encountered is fouling of the expensive anion-exchange column by the dye, however, using the CIE procedure the dye is simply removed from the capillary during a purge cycle with the running electrolyte.
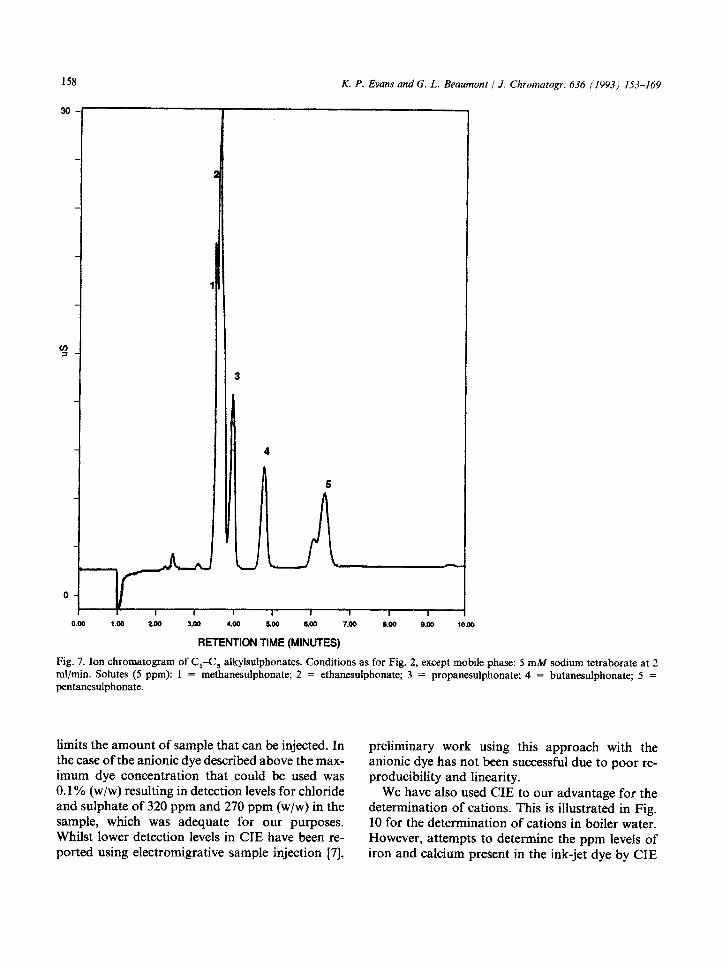
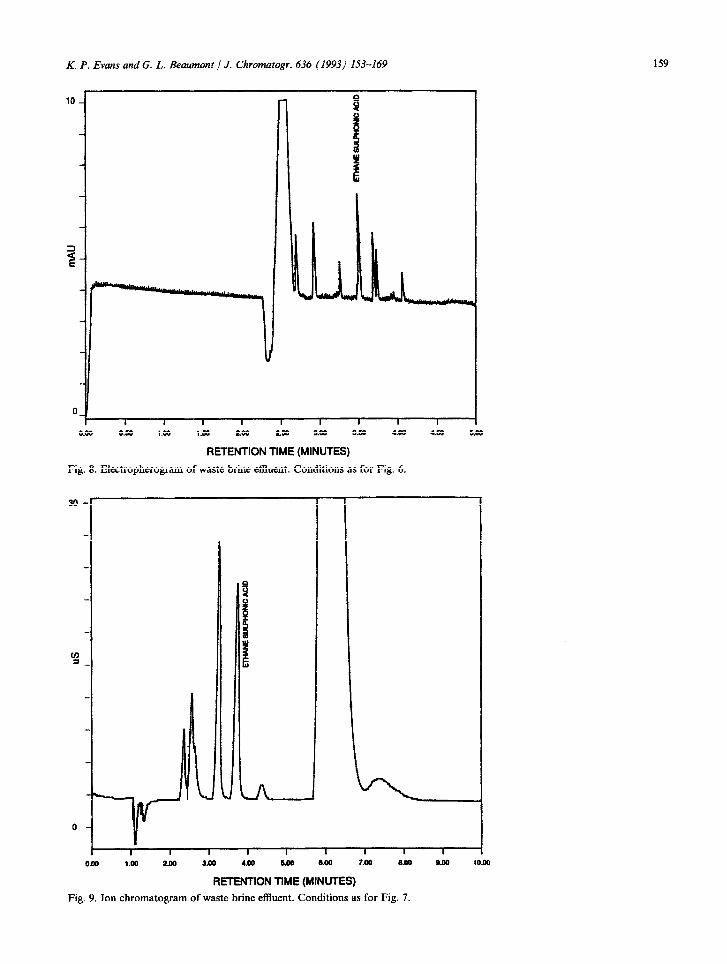
A further illustration of the benefits of CIE is shown in Figs. 69. Figs. 6 and 7 show the CIE and IC separation of a standard solution of C1-Cs alkyl sulphonic acids. In this case the benefit of CIE in- cludes enhanced resolution as well as increased speed. A practical example of this CIE method is the determination of ethane sulphonic acid in waste brine effluents. Fig. 8 is the CIE separation of an effluent sample containing 70 ppm (w/w) ethane sul- phonic acid. In contrast the IC separation of this sample showing fewer resolved components in a longer analysis time is given in Fig. 9. A problem
common to both CIE and IC in this case was the inability to directly inject the percent levels of chlo- ride present, which had to be removed prior to in- jecting using a Dionex On Guard-Ag cartridge.
Disadvantages of CIE compared to IC are poorer detection levels and quantitative precision. Area re- producibilities by CIE for 30 injections of the ppm common anions shown in Fig. 1 varied between 3-5% R.S.D. compared to < 1% R.S.D. by IC. CIE detection levels of 0.1-4 ppm are some 100-200 times higher than in IC. The relevance of these limi- tations of CIE are dependent on the particular ana- lytical assay involved. The majority of our applica- tions involve the determination of small ions pre- sent in specialty chemicals at < 2% (w/w) and the poorer quantitative precision of CIE is acceptable. Similarly the higher detection levels of CIE are only a problem for trace analysis or if the sample matrix
156 K. P. Evans and G. L. Beaumont / J. Chrotnatogr. 636 (1993) 153-169
21y) 2w 2M 2so 3.20 3.50 3.w 4.10 4.40
RETENTION TIME (MINUTES)
Fig. 3. Electropherogram of boiler water sample. Conditions as for Fig. 1.
4.70 6.W I I I I I I I I I I
Fig. 4. Structure of ink-jet dye.
K. P. Evans and G. L. Beaumont / J. Chromatogr. 636 (1993) 153469
0.00 0.30 0.00 0.90 l.!& 1.8 i.00 210 240 270 8x)0
RETENTION TIME (MINCES)
Fig. 5. Electropherogram of 0. I % (w/v) anionic ink-jet dye in water. Conditions as for Fig. 1.
I I I I I I i I I
0.00 0.m 1.00 1.m 200 260 8.00 a.m 4.00 4.60 am
RETENTION TIME (MINUTES)
Fig. 6. Electropherogram of C,-C, alkyl sulphonates. Conditions as for Fig. 1, except electrolyte: 5 mM p-hydroxybenzoic acid + OFM Anion BT at pH 6.0. Solutes (5 ppm): 1 = methanesulphonate; 2 = ethanesulphonate; 3 = propanesulphonate; 4 = butanesul- phonate; 5 = pentanesulphate.
158 K. P. Evans and G. L. Beaumonr / J. Chromatogr. 636 (1993) 153-169
30
3
4
A 5
RETENTION TIME (MINUTES)
Fig. 7. Ion chromatogram of C,-C, alkylsulphonates. Conditions as for Fig. 2, except mobile phase: 5 mM sodium tetraborate at 2 ml/min. Solutes (5 ppm): I = methanesulphonate; 2 = ethanesulphonate; 3 = propanesulphonate; 4 = butanesulphonate; 5 = pentanesulphonate.
limits the amount of sample that can be injected. In the case of the anionic dye described above the max- imum dye concentration that could be used was 0.1% (w/w) resulting in detection levels for chloride and sulphate of 320 ppm and 270 ppm (w/w) in the sample, which was adequate for our purposes. Whilst lower detection levels in CIE have been re- ported using electromigrative sample injection [7],
preliminary work using this approach with the anionic dye has not been successful due to poor re- producibility and linearity.
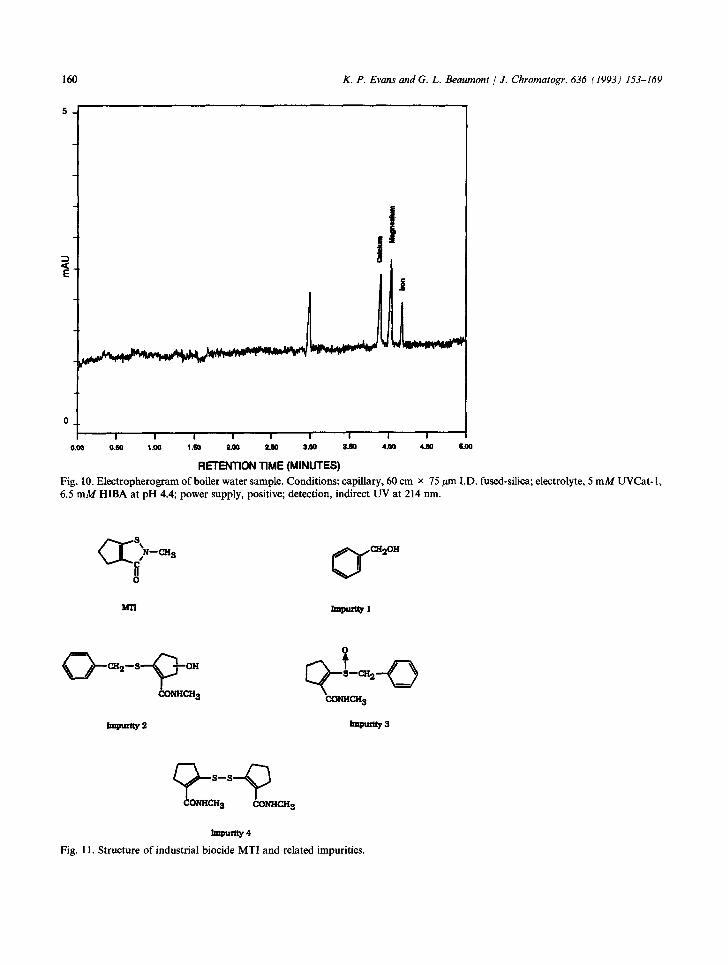
We have also used CIE to our advantage for the dete~ination of cations. This is illustrated in Fig. 10 for the determination of cations in boiler water. However, attempts to determine the ppm levels of iron and calcium present in the ink-jet dye by CIE
K. P. Evans and G. L. Beatcmoni / J. Chromatogr. 636 (1993) 153-169 159
I I I I
0.00 O.SO 1.00 1.# 203 233 203 4.w
RETENTION TIME (MINUTES)
Fig. 8. Electropherogram of waste brine et&e&. Conditions as for Fig. 6.
4.33 3.00
0.W 1.00 200 3.w 4.00 3.33 0.03 7.03 3.00
RETENTION TIME (MINUTES)
Fig. 9. Ion chromatogram of waste brine effluent. Conditions as for Fig. 7.
230 10.03
160 K. P. Evans and G. L. Beaumont 1 J. Chromatogr. 636 (1993) 153-169
0 I I I I I I I I I I I
0.00 0.60 1.00 1.00 3.00 2.w 3.00 3.50 4m 4.m
RETENTION TIME (MINUTES) Fig. 10. Electropherogram of boiler water sample. Conditions: capillary, 60 cm x 75 ,um I.D. fused-silica; electrolyte, 5 mM UVCat- 1, 6.5 mM HIBA at pH 4.4; power supply, positive; detection, indirect UV at 214 nm.
bm -1
Fig. 11. Structure of industrial biocide MT1 and related impurities.
K. P. Evans and G. L. Beaumont / J. Chromatogr. 636 ff993) 123-169
0.00 zoo #Ro om om tom aoo w.oo iom tom 3080
RETENTION TlME (MINUTES)
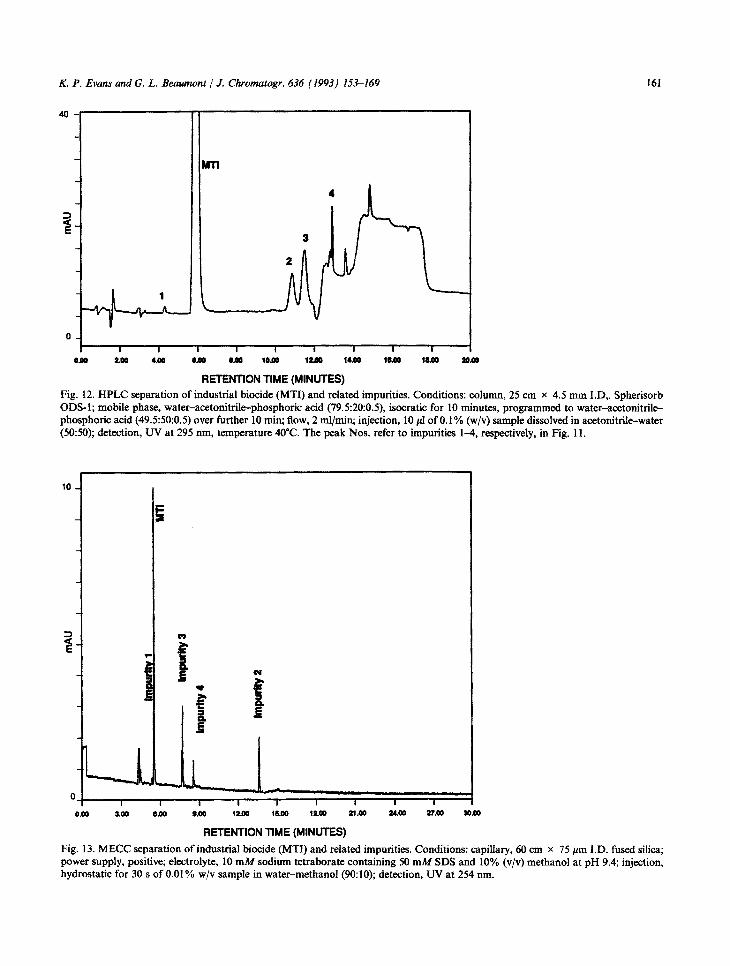
Fig. 12. HPLC separation of industrial biocide (MTI) and related impurities. Conditions: column, 25 cm x 4.5 mm I.D,. Spherisorb ODS-1; mobile phase, water-acetonitrile-phosphoric acid (79.5:20:0.5), isocratic for 10 minutes, programmed to water-acetonitrile- phosphoric acid (49.5:SO:O.S) over further 10 min; flow, 2 ml/mm; injection, 10 pi of 0.1% (w/v) sample dissolved in acetonitrile-water (50~50); detection, UV at 295 nm, temperature WC. The peak Nos. refer to impurities 14, respectively, in Fig. 11.
0.00 3.w 0.w 0.00 IUD lo.00 1200 2l.00 34.00 27.00 wm
REI’ENTION TlME (MINUTES)
Fig. 13. MECC separation of industrial biocide (MTI) and related impurities. Conditions: capillary, 60 cm x 75 Frn I.D. fused silica; power supply, positive; electrolyte, 10 mM sodium tetraborate containing SO mM SDS and 10% (v/v) methanol at pH 9.4; injection, hydrostatic for 30 s of 0.01% w/v sample in water-methanol (9O:lO); detection, UV at 254 nm.
162 K. P. Evans and G. L. Beaumont 1 J. Chromatogr. 636 (1993) 153-169
0
HOOC
SC 1158 hnpurtty A
BCl168 Impurtty B sC1156lmpudtyC
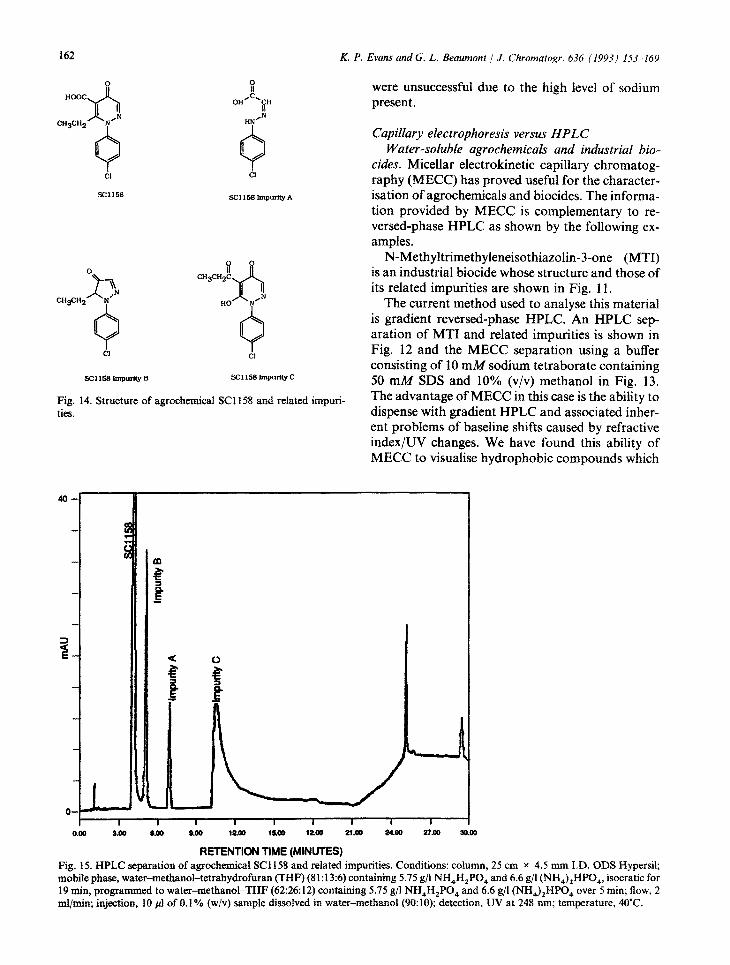
Fig. 14. Structure of agrochemical SC1 iSg and related impuri- ties.
were unsuccessful due to the high level of sodium present.
Capillary electrophoresis versus HPLC Water-soluble ugrochemica& and industrial bio-
tides. Micellar electrokinetic capillary chromatog- raphy (MECC) has proved useful for the character- isation of agrochemicals and biocides. The informa- tion provided by MECC is complementary to re- versed-phase HPLC as shown by the following ex- amples.
N-Methyltrimethyleneisothiazolin-3-one (MTI) is an industrial biocide whose structure and those of its related impurities are shown in Fig. 11.
The current method used to analyse this material is gradient reversed-phase HPLC. An HPLC sep- aration of MT1 and related impu~ties is shown in Fig. 12 and the MECC separation using a buffer consisting of 10 mM sodium tetraborate confining 50 mM SDS and 10% (v/v) methanol in Fig. 13. The advantage of MECC in this case is the ability to dispense with gradient HPLC and associated inher- ent problems of baseline shifts caused by refractive index/UV changes. We have found this ability of MECC to visualise hydrophobic compounds which
0.00 a.00 6.66 6.66 1200 i6.66 1200 n.66 24.66 n.66 36.w
RETENTION TIME (MINUTES) Fig. 15. HPLC separation of agrochemical SC1 158 and related impurities. Conditions: column, 25 cm x 4.5 mm I.D. ODS Hypersil; mobile phase, water-methanol-tetrahydrofuran (THF) (81:13:6) containing 5.75 g/l NH,H,PO, and 6.6 g/l (NH,),HPO,, isocratic for 19 mitt, programmed to water-methanol-THF (62:26: 12) containing 5.75 g/l NH,H,PO, and 6.6 g/l (NHJ,HPO, over 5 mitt; flow, 2 mI/min; injection, 10 ~1 of 0.1% (w~v) sample dissolved in water-methanol (W: 10); detection, UV at 248 nm; temperature, WC.
R P. Evans and G. L. Beaumont 1 J. Chrmnarogr. 636 (1993) 153-169 163
would necessitate gradient elution by HPLC to be a useful chara~te~~tion tool. This behaviour can be attributed to the limited retention window oper- ative in MECC [ 111.
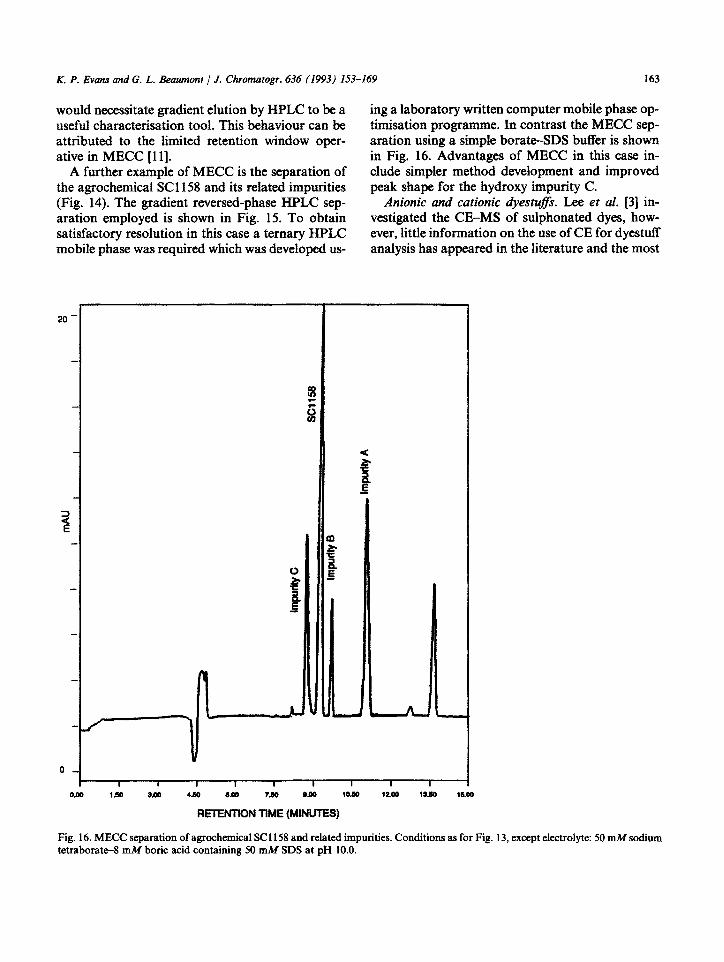
A further example of MECC is the separation of the agrochemical SC1 158 and its related imp~ti~ (Fig. 14). The gradient reversed-phase HPLC sep- aration employed is shown in Fig. 15. To obtain satisfactory resolution in this case a ternary HPLC mobile phase was required which was developed us-
ing a laboratory written computer mobile phase op- ti~~tion programme. In contrast the MECC sep- aration using a simple borate-SDS buffer is shown in Fig. 16. Advantages of MECC in this case in- clude simpler method development and improved peak shape for the hydroxy imp~ty C.
Anionic and cationic dyestufjZs. Lee et al. [3] in- vestigated the CE-MS of sulphonated dyes, how- ever, little information on the use of CE for dyestufT analysis has appeared in the literature and the most
20 -
L J-
O_
i
%
, A
I 1 1 I I I I 1 1 I
ODO 1.W sm 4so 6rn 7.m 0.00 10.50 1200 1250 15.00
R~ TIME (MINI)
Fig. 16. MECC separation of agrochemical SC1 158 and related impurities. Conditions as for Fig. 13, except electrolyte: 50 mM sodium tetraborate-8 mM boric acid containing 50 mM SDS at pH 10.0.
164 K. P. Evans and G. L. Beaumont / J. Chromatogr. 636 (1993) 153-169
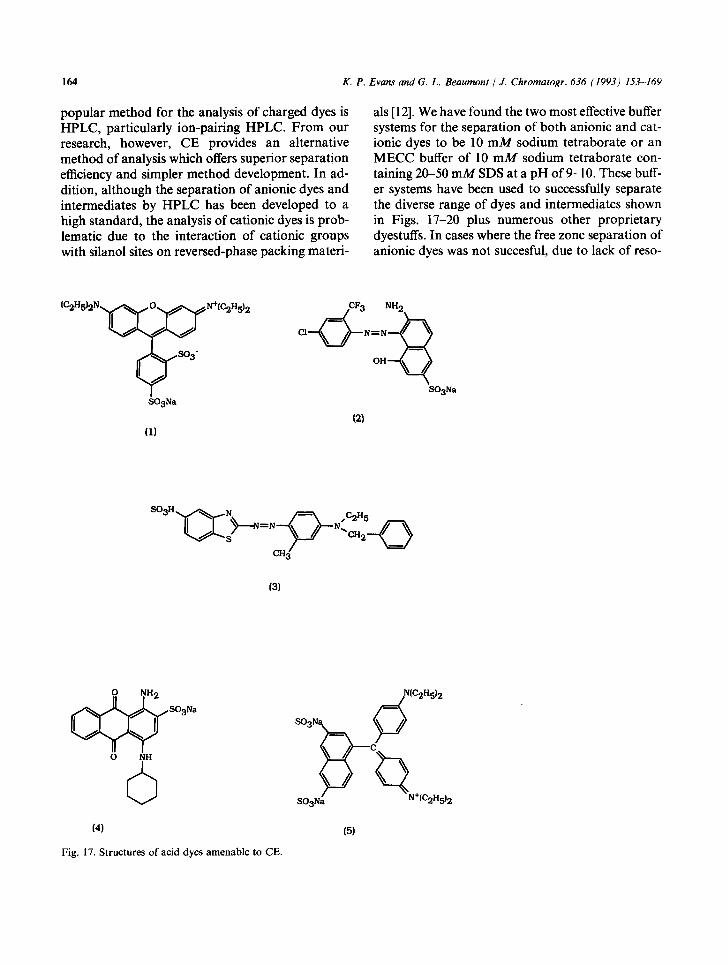
popular method for the analysis of charged dyes is HPLC, particularly ion-pairing HPLC. From our research, however, CE provides an alternative method of analysis which offers superior separation efficiency and simpler method development. In ad- dition, although the separation of anionic dyes and intermediates by HPLC has been developed to a high standard, the analysis of cationic dyes is prob- lematic due to the interaction of cationic groups with silanol sites on reversed-phase packing materi-
SO3Na
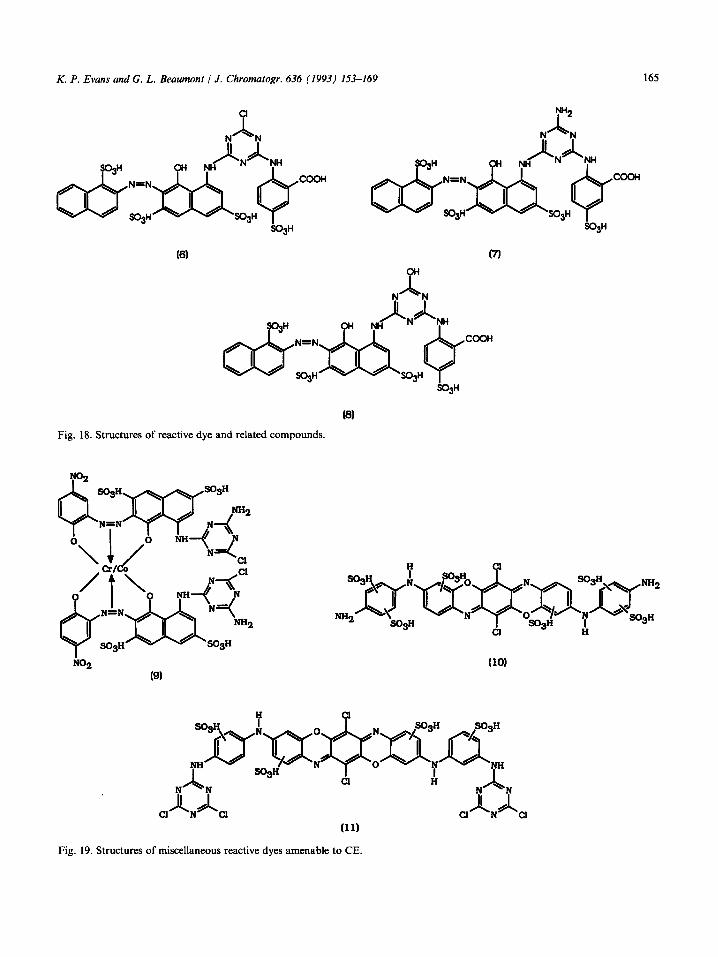
als [ 121. We have found the two most effective buffer systems for the separation of both anionic and cat- ionic dyes to be 10 mA4 sodium tetraborate or an MECC buffer of 10 mM sodium tetraborate con- taining 20-50 mA4 SDS at a pH of 9-10. These buff- er systems have been used to successfully separate the diverse range of dyes and intermediates shown in Figs. 17-20 plus numerous other proprietary dyestuffs. In cases where the free zone separation of anionic dyes was not succesful, due to lack of reso-
N=N
(1)
0 NH I
(4)
Fig. 17. Structures of acid dyes amenable to CE.
K. P. Evans and G. L. Beaumont / J. Chromatogr. 636 (1993) 153-169 165
Fig. 18. Structures of reactive dye and related compounds.
Fig. 19. Structures of miscellaneous reactive dyes amenable to CE.
166 K. P. Evans and G. L. Beaumont 1 J. Chromatogr. 636 (1993) 153-169
lution or badly tailing peaks, MECC using SDS was more effective than MECC using a cationic surfac- tant such as cetyltrimethyl ammonium bromide (CTAB). This may be due to the predominant mechanism with a cationic surfactant being strong ion-pairing or for some other reason.
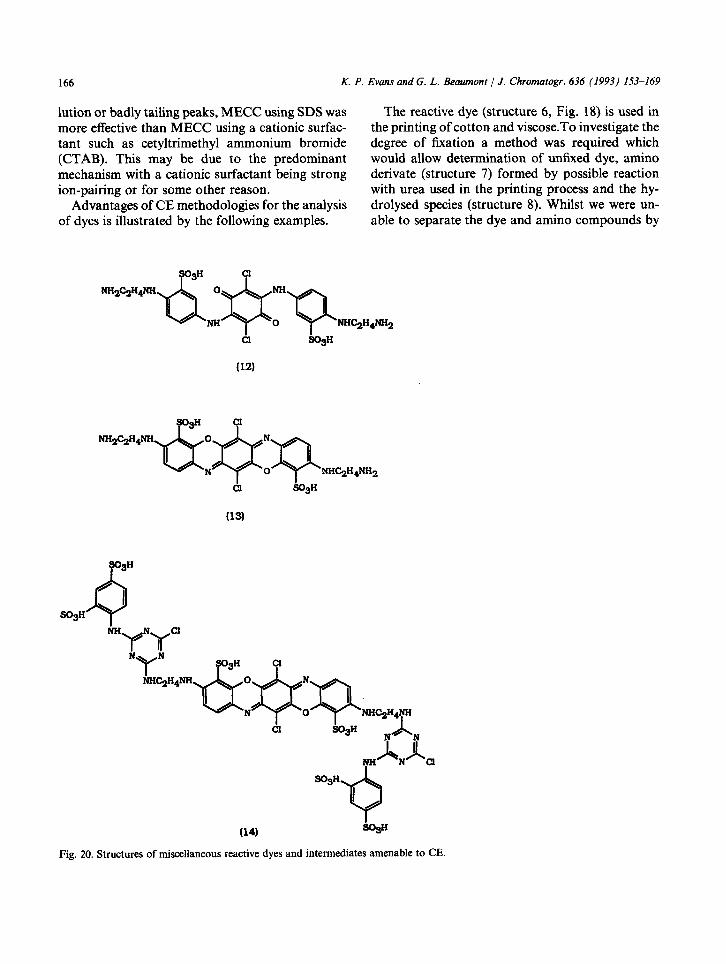
Advantages of CE methodologies for the analysis of dyes is illustrated by the following examples.
The reactive dye (structure 6, Fig. 18) is used in the printing of cotton and viscose.To investigate the degree of fixation a method was required which would allow determination of unfixed dye, amino derivate (structure 7) formed by possible reaction with urea used in the printing process and the hy- drolysed species (structure 8). Whilst we were un- able to separate the dye and amino compounds by
& A h3H ,w,?i, SOgH -Q I
(14) %H
Fig. 20. Structures of miscellaneous reactive dyes and intermediates amenable to CE.
K. P. Evans and G. L. Beaumoni / J. Chromatogr. 636 (1993) 153-169 167
r I II
0.00 1.P 3m 4.60 s.00 7.m s.00 1o.m 1200 18.Q 16.00
RETENTION TIME (MINUTES)
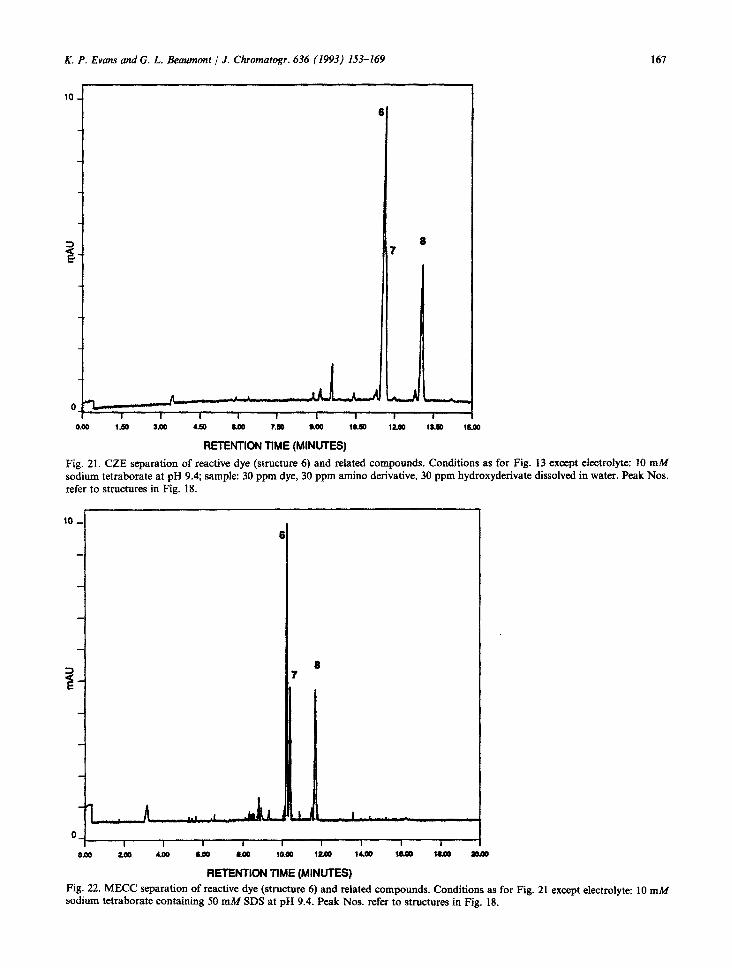
Fig. 21. CZE separation of reactive dye (structure 6) and related compounds. Conditions as for Fig. 13 except electrolyte: 10 mA4 sodium tetraborate at pH 9.4; sample: 30 ppm dye, 30 ppm amino derivative, 30 ppm hydroxyderivate dissolved in water. Peak Nos. refer to structures in Fig. 18.
10 -
%_ E
1.. h I L V-0 I I . -
0 I I I I I I I I I -I
0.W zoo 4.00 0.w em 10.03 lZ# 14.00 m.oo tam mm
RETENTlON TlME (MINUTES)
Fig. 22. MECC separation of reactive dye (structure 6) and related compounds. Conditions as for Fig. 21 except electrolyte: 10 mM sodium tetraborate containing 50 m&f SDS at pH 9.4. Peak Nos. refer to structures in Fig. 18.
168
10 -
2--
K. P. Evans and G. L. Beaumont / J. Chromatogr. 636 (1993) 153-169
0.00 1.00 200 200 4.00 6.00 0.00 7.00 8.00 9.00 1o.w
RETENTION TIME (MINUTES)
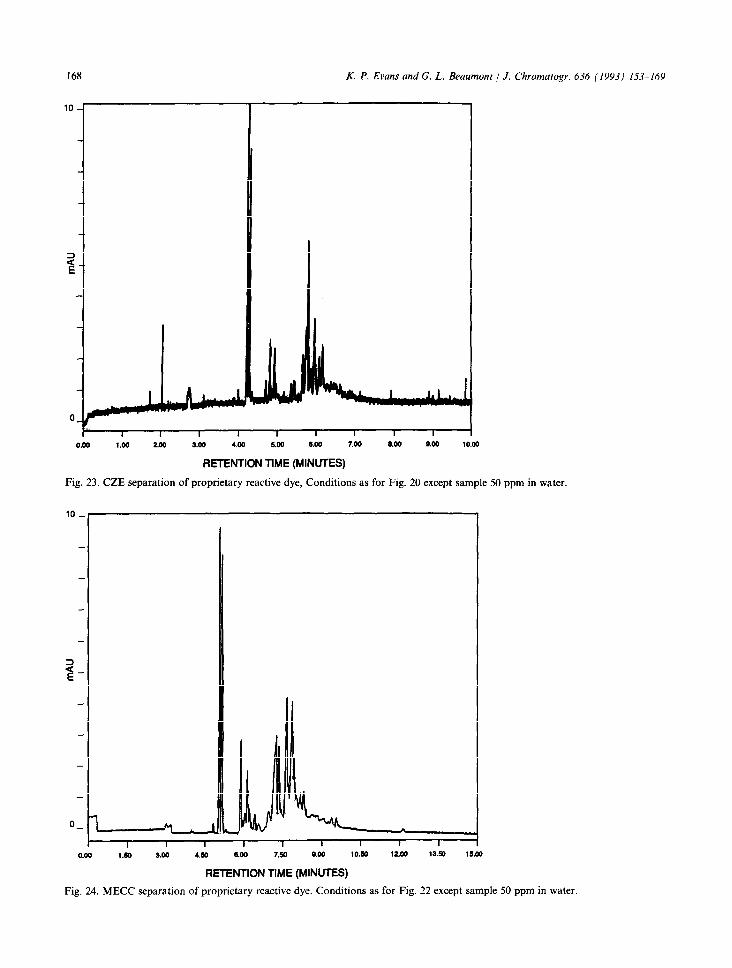
Fig. 23. CZE separation of proprietary reactive dye, Conditions as for Fig. 20 except sample 50 ppm in water.
0.w 1.50 3.00 4.50 0.00 7.50 9.00 10.60 12w 13.50 15.w
RETENTION TIME (MINUTES)
Fig. 24. MECC separation of proprietary reactive dye. Conditions as for Fig. 22 except sample 50 ppm in water.
K. P. Evans and G. L. Beaumont / J. Chromatogr. 636 (1993) 153-169 169
RETENTION TIME (MINUTES)
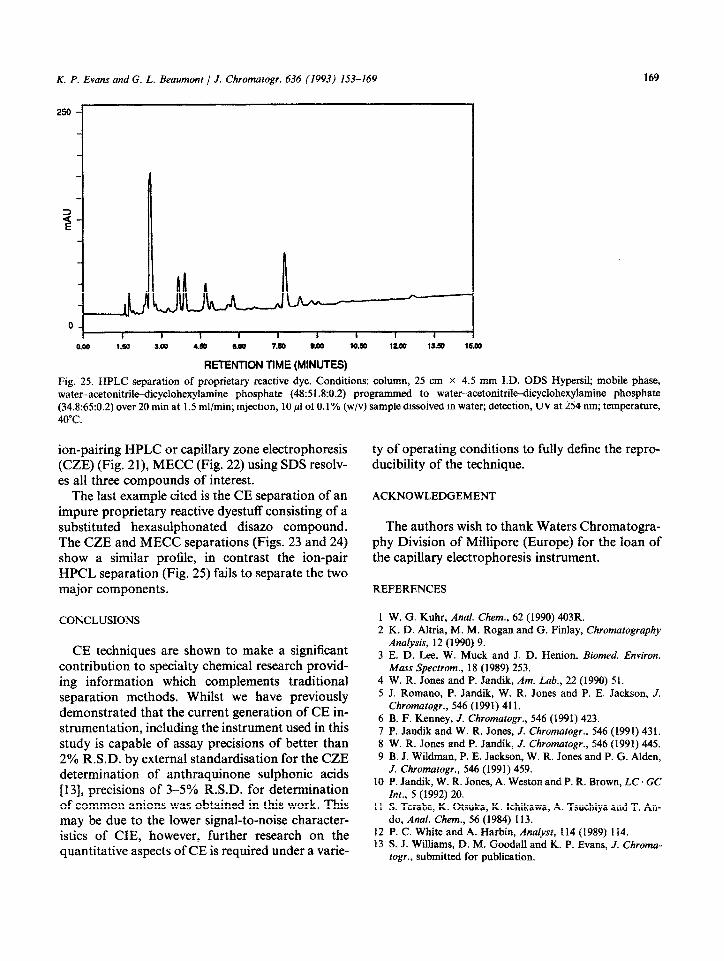
Fig. 25. HPLC separation of proprietary reactive dye. Conditions: column, 25 cm x 4.5 mm I.D. ODS Hype& mobile phase, water-a~tonit~l~i~yclohexyiamine phosphate {48:51.8:0.2) programmed to water-a~tonit~l~icyclohexyl~ine phosphate (34.8:65:0.2) over 20 min at 1.5 ml/mm; injection, 10 ~1 of 0.1% (w/v) sample dissolved in water; detection, UV at 254 nm; temperature, 40°C.
ion-pairing HPLC or capillary zone electrophoresis (CZE) (Fig. 21), MECC (Fig. 22) using SDS resolv- es all three compounds of interest.
The last example cited is the CE separation of an impure proprietary reactive dyestuff consisting of a substituted hexasulphonated disazo compound. The CZE and MECC separations (Figs. 23 and 24) show a similar profile, in contrast the ion-pair HPCL separation (Fig. 25) fails to separate the two major components.
CONCLUSIONS
CE techniques are shown to make a significant contribution to specialty chemical research provid- ing info~ation which complements tractional separation methods. Whilst we have previously demonstrated that the current generation of CE in- strumentation, in&ding the instrument used in this study is capable of assay precisions of better than 2% R.S.D. by external standardisation for the CZE determination of anthraquinone sulphonic acids [13], precisions of 3-S% R.S.D. for determination of common anions was obtained in this work. This may be due to the lower signal-to-noise character- istics of CIE, however, further research on the quantitative aspects of CE is required under a varie-
ty of operating conditions to fully define the repro- ducibility of the technique.
The authors wish to thank Waters Chromatogra- phy Division of Millipore (Europe) for the loan of the capillary electrophoresis instrument.
REFERENCES
1 2
3
4 5
W. G. Kuhr, Anal. Chem., 62 (1990) 403R. K. D. Altria, M. M. Rogan and G. Finlay, Chromatography Analysis, 12 (1990) 9. E. D. Lee, W. Muck and J. D. Henion, Biomed. Environ. Mass Spectrom., 18 (1989) 253. W. R. Jones and P. Jandik, Am. Lab., 22 (1990) 51. J. Romano, P. Jandik, W. R. Jones and P. E. Jackson, J. Chromatogr., 546 (1991) 411. B. F. Kenney, J. Chromatogr., 546 (1991) 423. P. Jandilc and W. R. Jones, J. Chromarogr., 546 (1991) 431. W. R. Jones and P. Jandik, J. Chromatogr., 546 (1991) 445. B. J. Wildman, P. E. Jackson, W. R. Jones and P. G. Alden, J. Chromatogr., 546 (1991) 459. P. Jandik, W. R. Jones, A. Weston and P. R. Brown, LC. GC Znt., 5 (1992) 20. S. Terabe, K. Otsuka, K. Ichikawa, A. Tsuchiya and T. An- do, Anal. Chem., 56 (1984) 113. P. C. White and A. Harbin, Analyst, 114 (1989) 114. S. J. Williams, D. M. Goodall and K. P. Evans, 1. Chroma- togr., submitted for publication.