Simultaneous determination of glutathione and glutathione disulfide in an acid extract of plant...
10
ORIGINAL PAPER Simultaneous determination of glutathione and cysteine concentrations and 2 H enrichments in microvolumes of neonatal blood using gas chromatography– mass spectrometry Alice Küster & Illa Tea & Shawn Sweeten & Jean-Christophe Rozé & Richard J. Robins & Dominique Darmaun Received: 27 October 2007 / Revised: 6 December 2007 / Accepted: 7 December 2007 / Published online: 29 December 2007 # Springer-Verlag 2007 Abstract A method is described whereby the concentra- tions and 2 H isotope enrichment of glutathione (GSH) and cysteine can be simultaneously determined in a single gas chromatography–mass spectrometry run following deriva- tization as their N,S-ethoxycarbonyl methyl esters. Improve- ments of the derivatization protocol and the use of a short gas chromatography column combined with single-ion monitoring allow for rapid quantification of these parameters with acceptable precision and reproducibility (coefficient of variation less than 5%). The method makes possible their quantitative measurement in very small volumes (50 μL) of human umbilical cord blood, and is thus suitable for determining the cysteine and GSH concentrations and 2 H isotope enrichments in blood samples from neonates or in other conditions in which sample size is restricted. It is shown that the fractional synthesis rate of human umbilical erythrocyte lysates in vitro is several-fold greater than that measured in vivo. Keywords Antioxidant . Cysteine . Fractional synthesis rate . Gas chromatography–mass spectrometry . Glutathione . Neonate Introduction Glutathione (GSH, γ-glutamyl-cysteinyl-glycine), a ubiqui- tous tripeptide, is the principal nonprotein thiol involved in antioxidant cellular defence. It detoxifies a number of reactive oxygen species and thereby plays crucial roles in the maintenance of intracellular redox balance and in cellular signalling to activate gene transcription. GSH depletion has been reported in various disease states thought to be mediated by reactive oxygen species [1–5]. The lung is especially vulnerable to oxidative attack, and premature infants are particularly exposed to neonatal lung damage owing to the combined effects of mechanical ventilation, oxygen supple- mentation, and inhaled nitric oxide therapy. Pulmonary and umbilical cord blood GSH levels have been found to be decreased in this population, with the GSH content being lowest in less mature infants [6–12]. Yet, the mechanisms responsible for the observed GSH depletion have not been fully elucidated. In theory, GSH depletion could be a consequence of a number of interde- pendent factors: (1) insufficient recycling from its oxidized Anal Bioanal Chem (2008) 390:1403–1412 DOI 10.1007/s00216-007-1799-5 A. Küster : J.-C. Rozé : D. Darmaun (*) INRA, UMR Physiologie des Adaptations Nutritionnelles, and Université de Nantes, CHU de Nantes, Hotel-Dieu HNB-1, 44093 Nantes Cedex 1, France e-mail: [email protected] A. Küster : J.-C. Rozé Neonatology, and INSERM, Centre d’Investigation Clinique (CIC), Centre Hospitalier Universitaire de Nantes, 5, allée de l’Île Gloriette, 44093 Nantes Cedex 1, France I. Tea : R. J. Robins Laboratoire d’Analyse Isotopique et Electrochimique des Métabolismes (LAIEM), UMR CNRS 6006, 2, rue de la Houssinière, BP 92208, 44322 Nantes Cedex 3, France S. Sweeten : D. Darmaun Research Laboratory, Nemours Children’ s Clinic, Jacksonville, FL 32207, USA
-
Upload
independent -
Category
Documents
-
view
4 -
download
0
Transcript of Simultaneous determination of glutathione and glutathione disulfide in an acid extract of plant...
ORIGINAL PAPER
Simultaneous determination of glutathione and cysteineconcentrations and 2H enrichments in microvolumesof neonatal blood using gas chromatography–mass spectrometry
Alice Küster & Illa Tea & Shawn Sweeten &
Jean-Christophe Rozé & Richard J. Robins &
Dominique Darmaun
Received: 27 October 2007 /Revised: 6 December 2007 /Accepted: 7 December 2007 /Published online: 29 December 2007# Springer-Verlag 2007
Abstract A method is described whereby the concentra-tions and 2H isotope enrichment of glutathione (GSH) andcysteine can be simultaneously determined in a single gaschromatography–mass spectrometry run following deriva-tization as their N,S-ethoxycarbonyl methyl esters. Improve-ments of the derivatization protocol and the use of a shortgas chromatography column combined with single-ionmonitoring allow for rapid quantification of these parameterswith acceptable precision and reproducibility (coefficient ofvariation less than 5%). The method makes possible theirquantitative measurement in very small volumes (50 μL) ofhuman umbilical cord blood, and is thus suitable fordetermining the cysteine and GSH concentrations and 2H
isotope enrichments in blood samples from neonates or inother conditions in which sample size is restricted. It isshown that the fractional synthesis rate of human umbilicalerythrocyte lysates in vitro is several-fold greater than thatmeasured in vivo.
Keywords Antioxidant . Cysteine . Fractional synthesisrate . Gas chromatography–mass spectrometry .
Glutathione . Neonate
Introduction
Glutathione (GSH, γ-glutamyl-cysteinyl-glycine), a ubiqui-tous tripeptide, is the principal nonprotein thiol involved inantioxidant cellular defence. It detoxifies a number of reactiveoxygen species and thereby plays crucial roles in themaintenance of intracellular redox balance and in cellularsignalling to activate gene transcription. GSH depletion hasbeen reported in various disease states thought to be mediatedby reactive oxygen species [1–5]. The lung is especiallyvulnerable to oxidative attack, and premature infants areparticularly exposed to neonatal lung damage owing to thecombined effects of mechanical ventilation, oxygen supple-mentation, and inhaled nitric oxide therapy. Pulmonary andumbilical cord blood GSH levels have been found to bedecreased in this population, with the GSH content beinglowest in less mature infants [6–12].
Yet, the mechanisms responsible for the observed GSHdepletion have not been fully elucidated. In theory, GSHdepletion could be a consequence of a number of interde-pendent factors: (1) insufficient recycling from its oxidized
Anal Bioanal Chem (2008) 390:1403–1412DOI 10.1007/s00216-007-1799-5
A. Küster : J.-C. Rozé :D. Darmaun (*)INRA, UMR Physiologie des Adaptations Nutritionnelles,and Université de Nantes, CHU de Nantes,Hotel-Dieu HNB-1,44093 Nantes Cedex 1, Francee-mail: [email protected]
A. Küster : J.-C. RozéNeonatology, and INSERM, Centre d’Investigation Clinique(CIC), Centre Hospitalier Universitaire de Nantes,5, allée de l’Île Gloriette,44093 Nantes Cedex 1, France
I. Tea :R. J. RobinsLaboratoire d’Analyse Isotopique et Electrochimique desMétabolismes (LAIEM), UMR CNRS 6006,2, rue de la Houssinière, BP 92208,44322 Nantes Cedex 3, France
S. Sweeten :D. DarmaunResearch Laboratory, Nemours Children’s Clinic,Jacksonville, FL 32207, USA
dimeric form; (2) excessive consumption; (3) inadequatede novo synthesis from its constituent amino acids, gluta-mate, cysteine, and glycine. The lattermost could be relatedto an insufficient supply of these substrates, either owing tolow plasma levels or owing to poor transport into theerythrocytes.
In order to get further insight into the regulation of GSHhomeostasis in the neonate, determination of both GSH andcysteine concentrations, as well as assessment of the rate ofGSH synthesis are necessary. Current gas chromatography–mass spectrometry (GC-MS) [13–17], high-performanceliquid chromatography–mass spectrometry [18, 19], and,recently, high-performance liquid chromatography–isotoperatio mass spectrometry [20] methods have allowed theinvestigation of GSH synthesis kinetics in vivo by measur-ing the incorporation of isotopically labelled precursoramino acids into GSH [13–22]. Their application to clinicalinvestigation in infants has, however, been hampered byseveral methodological limitations, including (1) time-consuming sample preparation, (2) the need for a separateanalysis of cysteine and GSH on different gas chromatog-raphy columns [13, 15], and (3) the need for relatively largevolumes of blood, e.g. 1 mL [14], which represents morethan 1% of the total blood volume in a 1-kg preterm infant.
The aim of this study was to develop a rapid and preciseprocedure for the determination of both concentration andstable isotope enrichment in GSH and cysteine in a minimalvolume of blood, thus allowing assessment of the GSHsynthesis rate by monitoring the incorporation of labelledcysteine into GSH in neonatal blood. Samples were obtainedfrom umbilical cord blood. The assay is adapted from apreviously described method [14] using homoglutathione(hGSH) as an internal standard and the derivatization ofGSH and cysteine as their N,S-ethoxycarbonyl methylesters. Improvement of the derivatization protocol allowedthe use of very low sample volumes (50 μL), and rapidquantification was achieved by the use of a single short gaschromatography column. The method was applied to thedetermination of the [2H2]-GSH enrichment kinetics invenous umbilical cord erythrocytes incubated with L-[2H2]cysteine, thereby evaluating the turnover rate of GSH invitro in neonatal erythrocytes.
Experimental
Chemicals and reagents
Ethyl chloroformate, dithiothreitol (DTT), sodium chloride(99.8% purity or better), sulfosalicylic acid, adenosine 5′-triphosphate disodium salt hydrate (ATP), magnesiumchloride, Trizma® hydrochloride, L-glutamate, L-cysteine,D-glucose, and glycine were purchased from Sigma-Aldrich
(St. Louis, MO, USA). hGSH was obtained from BachemBiochimie (Voisins le Bretonneux, France). L-[3,3-2H2]Cysteine (98 atom%) (referred to as L-[2H2]cysteine) wasobtained from Cambridge Isotopes (Andover, USA). Allother reagents were of analytical grade.
Sample preparation of red blood cell lysates
Venous umbilical cord blood samples were collected fromhealthy, full-term infants immediately after birth, priorinformed consent having been obtained from their mothers,according to protocols approved by the local InstitutionalReview Board (CPP des Pays-de-la-Loire, France). Sam-ples were collected in chilled 5-mL EDTA-coated tubes,then centrifuged (5,000 g, 10 min, 4°C) to separate the redcell pellet from plasma. The plasma level was then markedon the tube with a fine indelible line. Plasma was removed,and replaced dropwise with an equal volume of colddistilled water to disrupt erythrocytes. Samples were storedat −80°C for several weeks until further analysis.
Standards preparation for determination of GSHand cysteine concentrations
For preparation of standards, stock solutions of 1 mmol L−1
GSH, cysteine, and hGSH were prepared in 0.2 mol L−1
sodium phosphate buffer (pH 7.5) and stored at −80°C. Fromthese, working standard solutions were prepared by dilutionin the same phosphate buffer. As described in previous work[14], the tripeptide hGSH (γ-glutamyl-cysteinyl-alanine) wasused as an internal standard, taking advantage of itsstructural resemblance to GSH. The calibration curves forthe assay of GSH and cysteine concentrations were preparedby adding graded amounts of GSH (0–300 nmol) andcysteine (0–30 nmol), respectively, to 700 μL of the samephosphate buffer containing 150 nmol of hGSH. The GSH tohGSH and the cysteine to hGSH molar ratios obtainedranged between 0 and 2.0 and 0 and 0.2, respectively.
All calibration curves were obtained by least-squareslinear regression analysis of the GSH to hGSH, [2H2]GSHto hGSH, or cysteine to hGSH peak area ratio versus theGSH, [2H2]GSH or cysteine concentration added to thecalibration sample. The slopes of the calibration curveswere used to calculate the blood cell aminothiol concen-trations (see “Calculations”).
Preparation of [2H2]GSH standard solutionfor determination of GSH 2H enrichment
In order to determine GSH enrichment, a standard solutionof labelled GSH was produced in vitro in the laboratory asfollows. Erythrocyte extracts obtained from the blood ofa healthy human female volunteer by the same procedure
1404 Anal Bioanal Chem (2008) 390:1403–1412
as for the umbilical cord blood samples were incubated at37 °C in 2.5 mL of a L-[2H2]cysteine solution adjusted topH 7.5 with 10 mol L−1 NaOH containing: 110 mg ATP,60 mg DTT, 120 mg MgCl2, 240 mg Trizma® hydrochlo-ride, 45 mg L-glutamate, 25 mg L-[2H2]cysteine, 15 mgglycine, and 35 mg D-glucose in 5 mL distilled water. Theincubation mixture was vortexed every 10 min, for 90 min.Then protein was precipitated by addition of 100 μL of50% (w/v) sulfosalicylic acid and the tubes were centri-fuged (3,000g, 15 min, 4 °C). The supernatant wasremoved, filtered, adjusted to pH 7.5, and stored at −80 °Cuntil used. The GSH concentration and the [2H2]GSH tonatural GSH molar ratio were determined by GC-MS.
For preparation of the calibration curve of enrichedGSH, increasing amounts of the [2H2]GSH solution werespiked with hGSH as an internal standard.
Determination of GSH fractional synthesis rate in vitroin neonatal erythrocytes
For determination of the red blood cell GSH synthesis rate,red blood cells obtained from umbilical cord blood immedi-ately after birth were incubated at 37°C in a shaking bath with2.5 mL of the L-[2H2]cysteine solution described earlier. Theincubation mixture was vortexed every 10 min, for 90 min.Samples (500 μL) were removed at 0, 10, 20, 30, 60, and90 min after the start of incubation and the reaction wasstopped by the addition of 150 μL of 50% (w/v) sulfosalicylicacid and 550 μL of 0.2 mol L−1 sodium phosphate buffer(pH 7.5). Tubes were kept on ice until centrifugation (3,000 gfor 15 min at 4 °C). The supernatant was removed, filtered,and transferred into a 3-mL glass tube for derivatization.
Derivatization procedure
Haemolysed red blood cell extract (50 μL) was transferredto a 5-mL glass tube containing 700 μL of 0.2 mol L−1
sodium phosphate buffer. A 50-μL aliquot of a 1 mmol L−1
hGSH solution was added, followed by 100 μL of a390 mmol L−1 DTT solution (freshly prepared with 60 mgDTT for 1 mL 0.2 mol L−1 phosphate buffer pH 7.5).Samples were left at room temperature for 15 min in orderto achieve GSH reduction. For deproteinization, 375 μL of50% (w/v) sulfosalicylic acid and 375 μL of 0.2 mol L−1
phosphate buffer (pH 7.5) were added, and the sampleswere shaken vigorously until complete homogenizationoccurred. After centrifugation (5,000 g, 15 min, 4 °C), thesupernatant was removed, filtrated, and the pH wasadjusted to 7.5 with 100 μL of 10 mol L−1 NaOH.
The derivatization of the –NH2 and –SH groups of GSH,hGSH, and cysteine to obtain their respective N,S-ethox-ycarbonyl methyl esters was adapted from [13, 23]. Briefly,200 μL ethylchloroformate was added, and the samples
were shaken for 15 min at room temperature. After adjust-ment of the pH to 1.4–1.6 using 90 μL 37% HCl, thesolution was saturated with NaCl (0.5 g) and extractedtwice with 2 mL ethyl acetate. The combined organic phasewas evaporated to dryness under nitrogen gas flux at 50 °C.For derivatization of the –COOH groups, 250 μL of amixture of 1 mol L−1 HCl in methanol (freshly prepared bymixing 500 μL of 37% HCl with 15 mL of pure methanol)was added and the samples were incubated for 20 min at90 °C. After cooling and evaporation, the residue wasdissolved in 400 μL ethyl acetate, for GC-MS analysis.
GC-MS procedure
The concentration and isotopic 2H2 enrichment of GSH andcysteine were determined using an electron impact ioniza-tion gas chromatograph–mass-selective detector (5890series II gas chromatograph coupled to a 5971 mass-selective detector (Agilent Technologies, Massy, France).Aminothiols were separated on a fused poly(5% diphenyl/95% dimethylsiloxane) capillary column (HP-5MS, 15 m×0.25-mm inner diameter, 0.1-μm film thickness, AgilentTechnologies).
The injector and detector temperatures were 270 and290°C, respectively. The column head pressure was set at3.0 psi with a helium flow rate of 1 mL min−1. Splitlessinjection was used with a purge delay of 0.7 min. Injectedvolumes were 1 μL. The oven temperature was initially130°C for 30 s after injection. It was raised first to 170°C ata rate of 15°C min−1, then to 290°C at a rate of 50°C min−1,which was held for 3 min. The total runtime was 8.57 min.
Selected ion monitoring (SIM) mode of the massdetector was used to measure cysteine and GSH enrichmentand concentration. The dwell per ion time was set at100 ms. The ion fragments monitored were as follows:mass-to charge ratio m/z 363 and 365 for the N,S-ethoxycarbonyl methyl ester derivative of natural GSH and[2H2]GSH, m/z 220 and 222 for the N,S-ethoxycarbonylmethyl ester derivative of natural cysteine and [2H2]cysteine, and the ion at m/z 363 for the N,S-ethoxycarbonylmethyl ester derivative of hGSH.
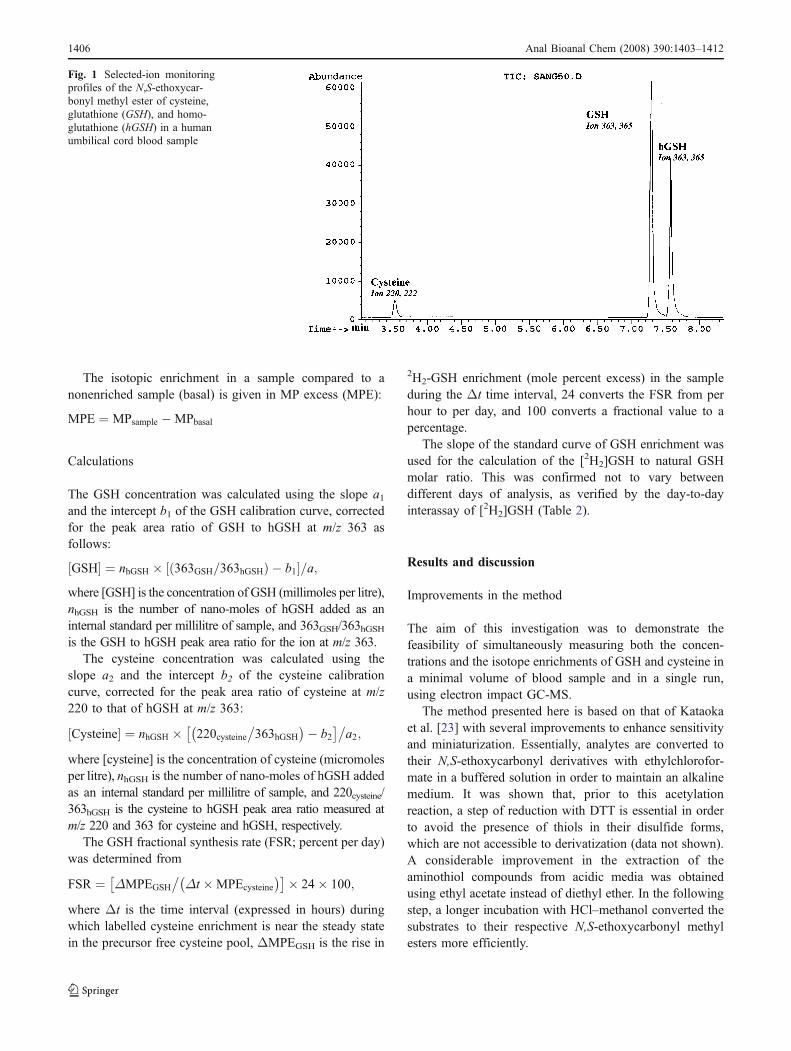
Under these conditions, cysteine, GSH, and hGSH wereeluted at 3.55, 7.3, and 7.6 min (Fig. 1), respectively.
The observed abundance of 2H2 in a sample, given inmole percent (MP) is defined as
MP ¼ 100� M= M þ M þ 2ð Þð Þ½ �;
where M and M+2 represent the abundance of the ions atm/z 220 and 222, respectively, for the N,S-ethoxycarbonylmethyl ester derivative of cysteine, and at m/z 363 and 365for the N,S-ethoxycarbonyl methyl ester derivative of GSH.
Anal Bioanal Chem (2008) 390:1403–1412 1405
The isotopic enrichment in a sample compared to anonenriched sample (basal) is given in MP excess (MPE):
MPE ¼ MPsample �MPbasal
Calculations
The GSH concentration was calculated using the slope a1and the intercept b1 of the GSH calibration curve, correctedfor the peak area ratio of GSH to hGSH at m/z 363 asfollows:
GSH½ � ¼ nhGSH � 363GSH=363hGSHð Þ � b1½ �=a;where [GSH] is the concentration of GSH (millimoles per litre),nhGSH is the number of nano-moles of hGSH added as aninternal standard per millilitre of sample, and 363GSH/363hGSHis the GSH to hGSH peak area ratio for the ion at m/z 363.
The cysteine concentration was calculated using theslope a2 and the intercept b2 of the cysteine calibrationcurve, corrected for the peak area ratio of cysteine at m/z220 to that of hGSH at m/z 363:
Cysteine½ � ¼ nhGSH � 220cysteine�363hGSH
� �� b2� ��
a2;
where [cysteine] is the concentration of cysteine (micromolesper litre), nhGSH is the number of nano-moles of hGSH addedas an internal standard per millilitre of sample, and 220cysteine/363hGSH is the cysteine to hGSH peak area ratio measured atm/z 220 and 363 for cysteine and hGSH, respectively.
The GSH fractional synthesis rate (FSR; percent per day)was determined from
FSR ¼ ΔMPEGSH
�Δt �MPEcysteine
� �� �� 24� 100;
where Δt is the time interval (expressed in hours) duringwhich labelled cysteine enrichment is near the steady statein the precursor free cysteine pool, ΔMPEGSH is the rise in
2H2-GSH enrichment (mole percent excess) in the sampleduring the Δt time interval, 24 converts the FSR from perhour to per day, and 100 converts a fractional value to apercentage.
The slope of the standard curve of GSH enrichment wasused for the calculation of the [2H2]GSH to natural GSHmolar ratio. This was confirmed not to vary betweendifferent days of analysis, as verified by the day-to-dayinterassay of [2H2]GSH (Table 2).
Results and discussion
Improvements in the method
The aim of this investigation was to demonstrate thefeasibility of simultaneously measuring both the concen-trations and the isotope enrichments of GSH and cysteine ina minimal volume of blood sample and in a single run,using electron impact GC-MS.
The method presented here is based on that of Kataokaet al. [23] with several improvements to enhance sensitivityand miniaturization. Essentially, analytes are converted totheir N,S-ethoxycarbonyl derivatives with ethylchlorofor-mate in a buffered solution in order to maintain an alkalinemedium. It was shown that, prior to this acetylationreaction, a step of reduction with DTT is essential in orderto avoid the presence of thiols in their disulfide forms,which are not accessible to derivatization (data not shown).A considerable improvement in the extraction of theaminothiol compounds from acidic media was obtainedusing ethyl acetate instead of diethyl ether. In the followingstep, a longer incubation with HCl–methanol converted thesubstrates to their respective N,S-ethoxycarbonyl methylesters more efficiently.
Fig. 1 Selected-ion monitoringprofiles of the N,S-ethoxycar-bonyl methyl ester of cysteine,glutathione (GSH), and homo-glutathione (hGSH) in a humanumbilical cord blood sample
1406 Anal Bioanal Chem (2008) 390:1403–1412
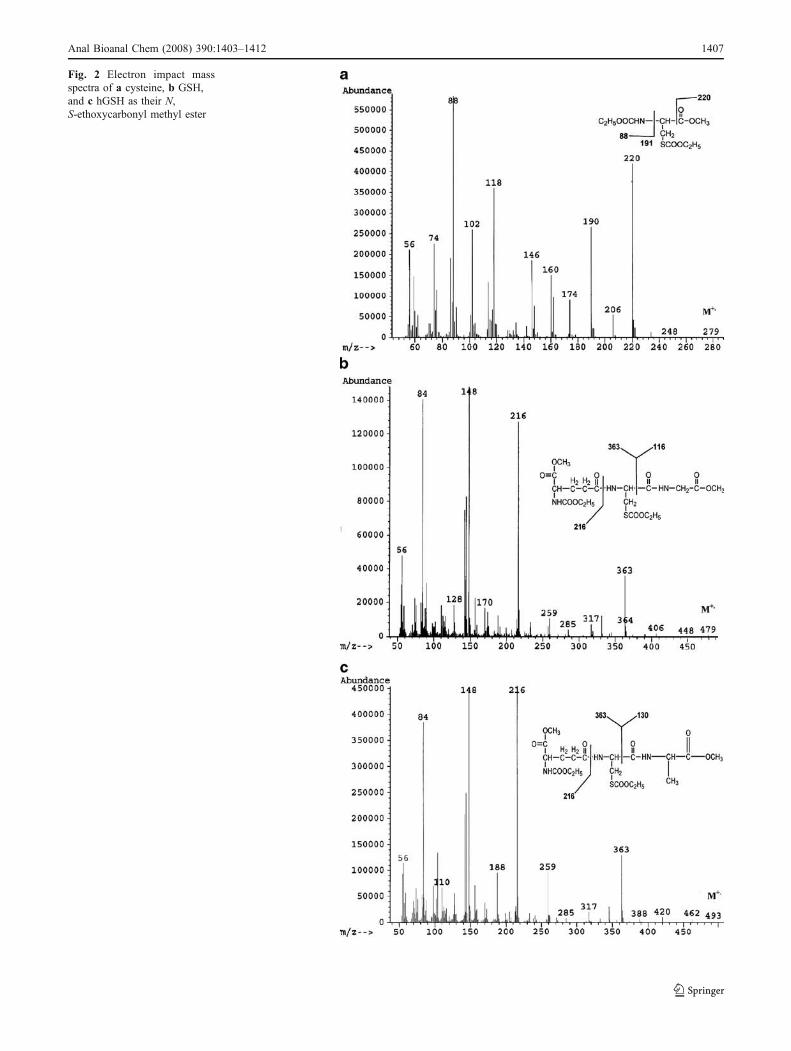
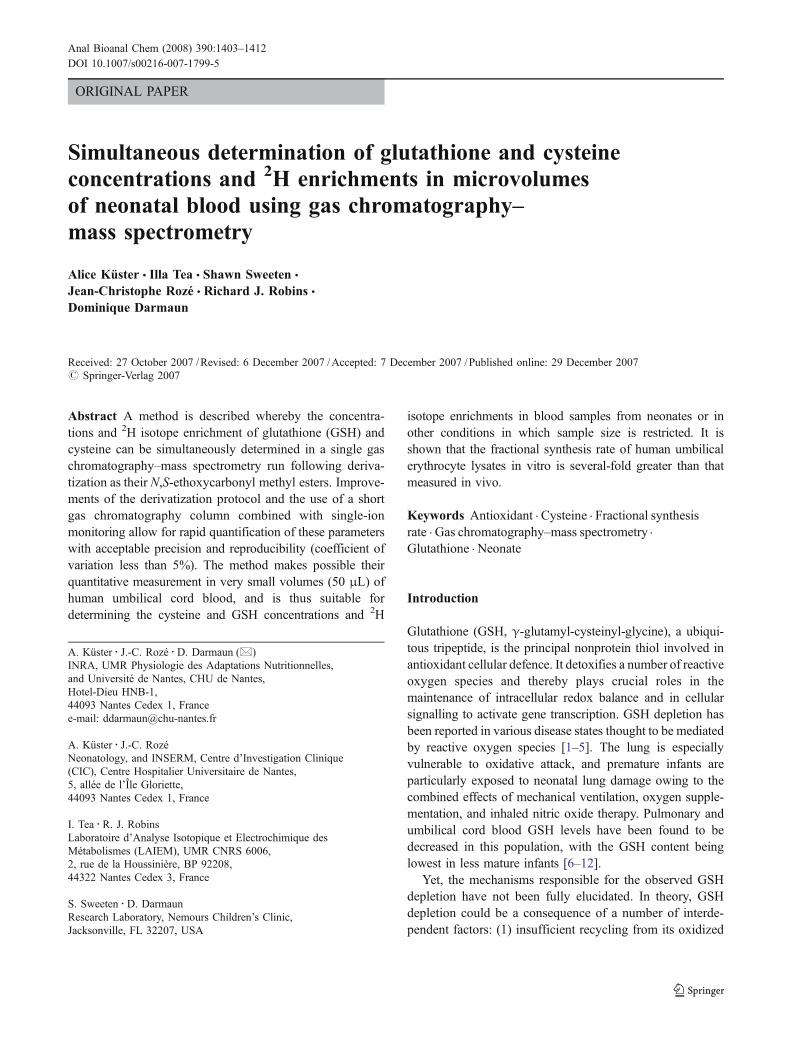
Fig. 2 Electron impact massspectra of a cysteine, b GSH,and c hGSH as their N,S-ethoxycarbonyl methyl ester
Anal Bioanal Chem (2008) 390:1403–1412 1407
The modification of the extraction conditions and theextension of the incubation time for the methylation reactionhas made possible the precise determination of very lowquantities of aminothiols, as found for cysteine in humanblood, where it is present at micromolar concentrations [15,24]. In human umbilical cord blood erythrocytes, the methodenables cysteine concentrations as low as 20 μmol L−1 to bedetected. This sensitivity and specificity is sufficient forapplication to preterm infants, a population in which onlyminimal-volume blood sample collection is allowed.
Analyses were carried out using a short polar column(15 m) because of the high molecular weight of thecompounds [23]. Although a thin (0.1-μm) film was chosento improve column efficiency, adequate resolution was
observed, and stable baselines were obtained in thechromatograms with peaks free from overlapping (Fig. 1).Figure 2 shows the electron ionization mass spectra of theN,S-ethoxycarbonyl methyl ester derivative of cysteine,GSH, and hGSH. For the cysteine derivative (M+, m/z 279),intense fragment ions at m/z 220, 190, 118, and 88 areobserved (Fig. 2a). The fragment at m/z 220 corresponds tothe neutral loss of COOCH3, making this ion appropriatefor the determination of the level of 2H in cysteine. TheGSH derivative (M+, m/z 479) shows intense fragment ionsat m/z 363, 216, 148, and 84 (Fig. 2b). The fragment at m/z363 corresponds to the neutral loss of CONHCH2COOCH3,making this ion appropriate for the determination of thelevel of 2H incorporation into GSH. Similarly, the hGSH
Table 1 Intraday precision of erythrocyte glutathione (GSH) and cysteine concentrations, and their 2H2 enrichments (mole percent excess, MPE)in two aliquots of the same human umbilical cord blood sample
Aliquot volume (μL) GSH Concentration(mmol L-1)
CV (%) Cysteine Concentration(μmol L-1)
CV (%) [2H2]]GSH [2H2]Cysteine
MPE CV (%) MPE CV (%)
50 (n=5) 8.93±0.09 1.1 20.1±0.9 4.7 ND ND100 (n=5) 8.64±0.24 2.8 19.0±0.8 4.2 50.2±1.4 2.9 99.2±0.4 0.4Mean 8.79±0.21 2.3 19.6±0.7 3.8
CV coefficient of variation, ND not determinedValues are the mean ± the standard deviation (SD).CV=(100×SD/mean)
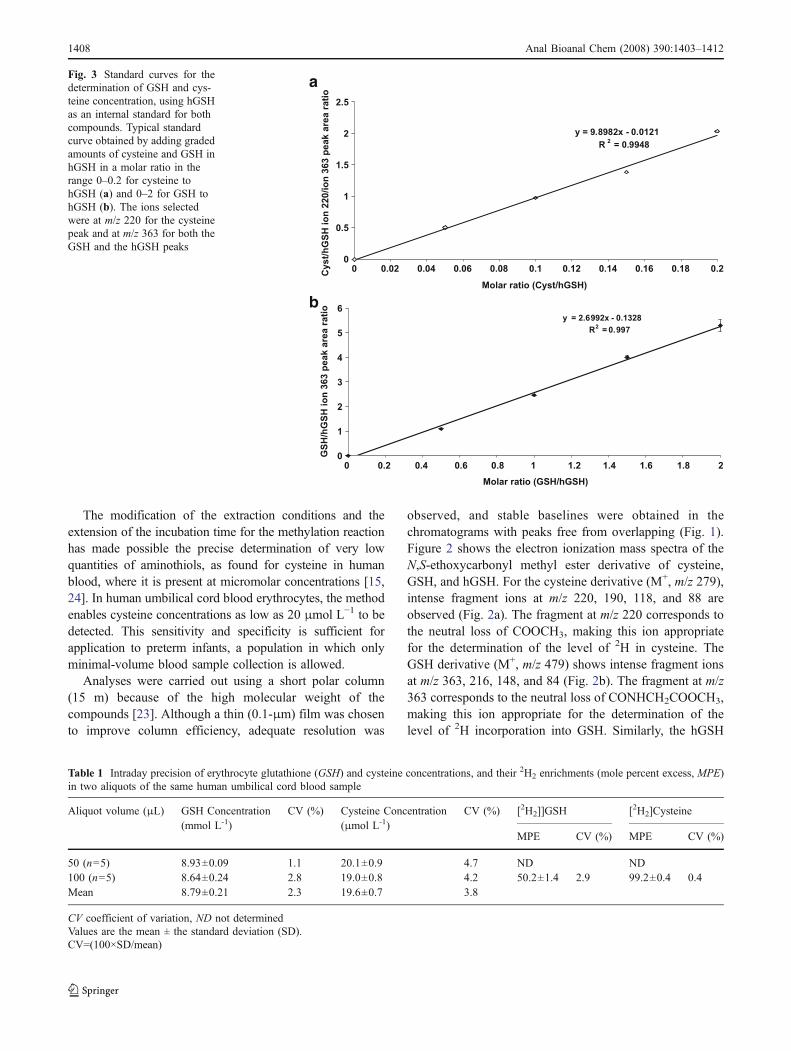
y = 9.8982x - 0.0121
R2 = 0.9948
0
0.5
1
1.5
2
2.5
0 0.02 0.04 0.06 0.08 0.1 0.12 0.14 0.16 0.18 0.2
Molar ratio (Cyst/hGSH)
y = 2.6992x - 0.1328
R2 = 0.997
0
1
2
3
4
5
6
0 0.2 0.4 0.6 0.8 1 1.2 1.4 1.6 1.8 2
Molar ratio (GSH/hGSH)
GS
H/h
GS
H i
on
36
3 p
ea
k a
rea
ra
tio
a
bC
ys
t/h
GS
H i
on
22
0/i
on
36
3 p
ea
k a
rea
ra
tio
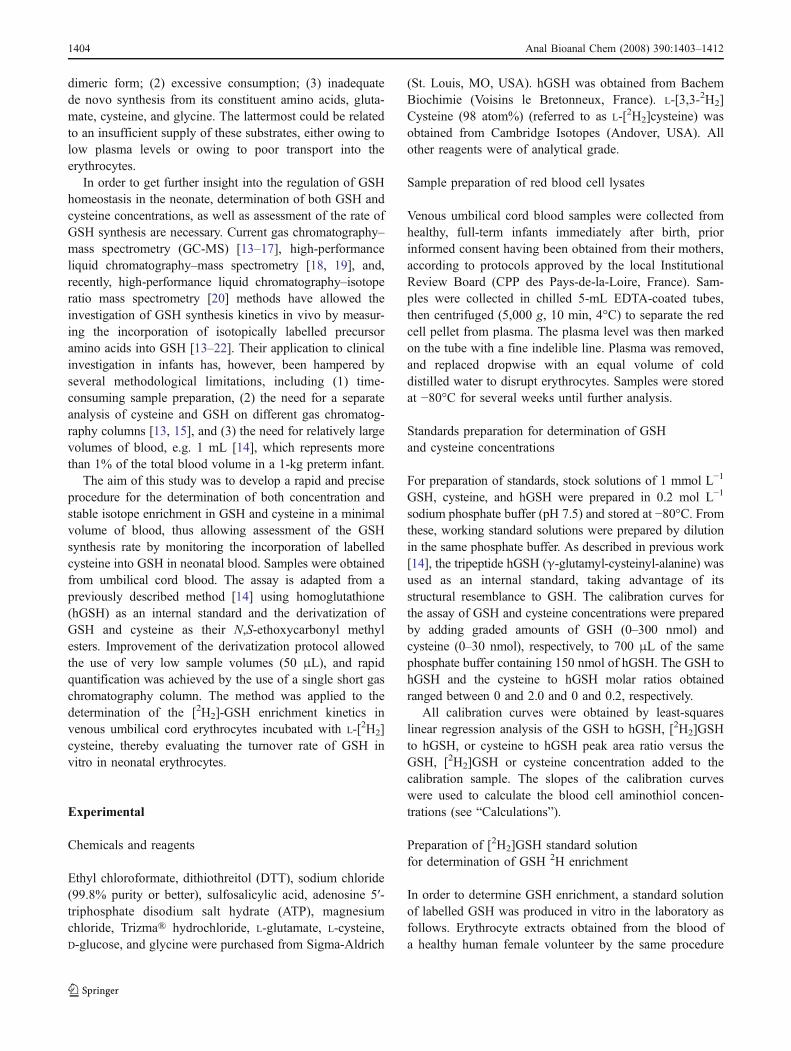
Fig. 3 Standard curves for thedetermination of GSH and cys-teine concentration, using hGSHas an internal standard for bothcompounds. Typical standardcurve obtained by adding gradedamounts of cysteine and GSH inhGSH in a molar ratio in therange 0–0.2 for cysteine tohGSH (a) and 0–2 for GSH tohGSH (b). The ions selectedwere at m/z 220 for the cysteinepeak and at m/z 363 for both theGSH and the hGSH peaks
1408 Anal Bioanal Chem (2008) 390:1403–1412
derivative (M+, m/z 493) shows intense fragment ions at m/z 363, 216, 148, and 84 (Fig. 2 c). The fragment at m/z 363corresponds to the neutral loss of CONHCH(CH3)COOCH3, making this ion suitable as an internal standardto calibrate the intensity of the m/z 363 fragment in GSH.
Selectivity for target analytes is obtained by using SIM,whereby only those ions derived from cysteine, GSH, orhGSH are detected. Mass spectra from cysteine or GSHshowed no difference from those of pure reference com-pounds, indicating no interfering compounds were coelutedwith the target analytes.
Validation of the method
Linearity, sensitivity, and precision
The six-point calibration curves are linear for cysteine tohGSH or GSH to hGSH molar ratios ranging from 0 to 0.2for cysteine (Fig. 3a) and from 0 to 2 for GSH (Fig. 3b).Even though cysteine was eluted at a much earlier retentiontime than either GSH or hGSH (Fig. 1), the linearity of thestandard curves allowed the use of hGSH as a singleinternal standard for both cysteine and GSH. By determin-ing simultaneously the two aminothiols in a single GC-MSrun, the method requires both less blood volume and lesssample handling and preparation. Low concentrations ofcysteine in erythrocytes are reliably detected (Table 1).
The repeatability is shown in Tables 1 and 2: the prep-aration of five aliquots of the same blood extract in parallelunder the same conditions during extraction, derivatization,and GC-MS analysis showed GSH and cysteine concen-trations with intraday coefficients of variation (CV) of lessthan 5% for blood samples with a volume as low as 50 μL(Table 1).
To test the variability in measurement on different days,three samples from the same aliquot of blood were assessedon separate days. The interday repeatability was found to beless than 4% for GSH and less than 5% for cysteine(Table 2).
Furthermore, measurement of 2H2 enrichment of cyste-ine and GSH, produced as described earlier, showed thattheir isotopic enrichment can be determined in adult humanblood samples with a similar intraday and interday precision(CV < 3% and CV < 5%, respectively), as shown in Tables 1and 2. Excellent linearity of the standard curve wasobtained when natural GSH was spiked with increasingamounts of L-[2H2]GSH (slope 0.435±0.005; intercept−1.050±0.016; r=0.994±0.002).
Recovery and accuracy
Recovery was studied by analysing umbilical cord bloodsamples to which known amounts of target thiols had beenadded. The percentages of recovery for blood samples
Table 2 Interday precision of erythrocyte GSH and cysteine concentrations in several aliquots of 50 μL of the same human umbilical cord bloodsample analysed on different days by the gas chromatography–mass spectrometry system, and their 2H2 enrichments (MPE)
Day GSH Concentration(mmol L-1)
CV (%) Cysteine Concentration(μmol L-1)
CV (%) [2H2]GSH [2H2]Cysteine
MPE CV (%) MPE CV (%)
1 (n=3) 8.85±0.12 1.4 19.8±1.1 4.6 50.3±2.1 4.2 98.9±4.0 4.02 (n=5) 8.93±0.09 2.8 20.1±0.9 4.7 52.9±0.2 0.4 99.6±0.2 0.23 (n=3) 8.84±0.33 3.7 18.9±0.7 3.7 51.4±1.7 3.3 99.4±3.6 3.6Mean 8.87±0.05 0.6 19.6±0.6 3.4 51.5±1.3 2.5 99.3±0.4 0.4
Values are the mean ± SD.
Table 3 Recovery of added GSH and cysteine in red blood cell extract
GSH added (nmol) GSH Cysteine added (nmol) Cysteine
Recovery (%) ± SD CV (%) Recovery (%) ± SD CV (%)
25 (n=3) 100.9±4.7 4.7 2.5 (n=3) 105.9±5.3 5.050 (n=3) 95.7±2.5 2.6 5.0 (n=3) 97.6±4.1 4.2100 (n=3) 96.1±5.3 5.5Mean 97.6±2.9 3.0 Mean 101.8±5.9 5.8
Values are the mean ± SD.Recovery of the compound added is defined as R %ð Þ ¼ QM�QE
QA
� �� 100, where QM is the amount of analyte measured in the red blood extract
with added analyte, QE is the amount of analyte measured in the red blood extract without added analyte, and QA is the amount of analyte addedto the red blood extract.
Anal Bioanal Chem (2008) 390:1403–1412 1409
supplemented with 25, 50, and 100 nmol GSH and 2.5 and5.0 nmol cysteine, were 97.6±2.9 and 101.8±5.9%,respectively, insignificantly different from 100 % (Table 3).Only two levels of concentration were tested for cysteine,both near the physiological concentration range of interest.For GSH, three levels were used, as this compound shows awider dynamic range in vivo.
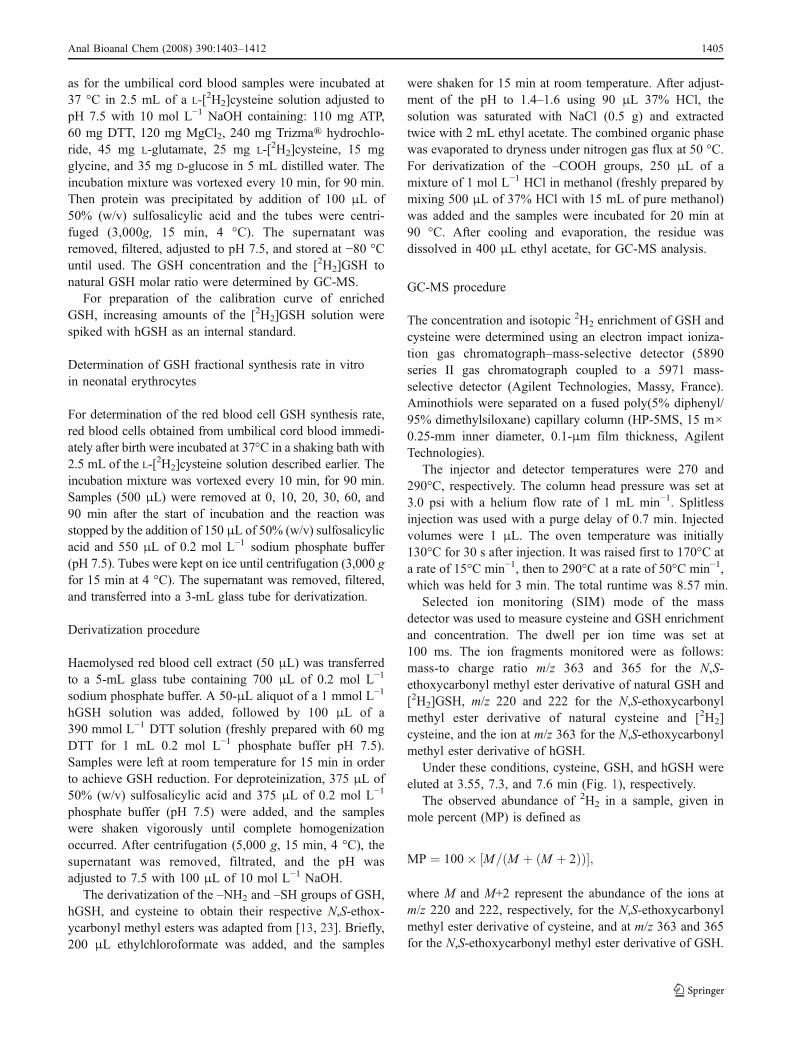
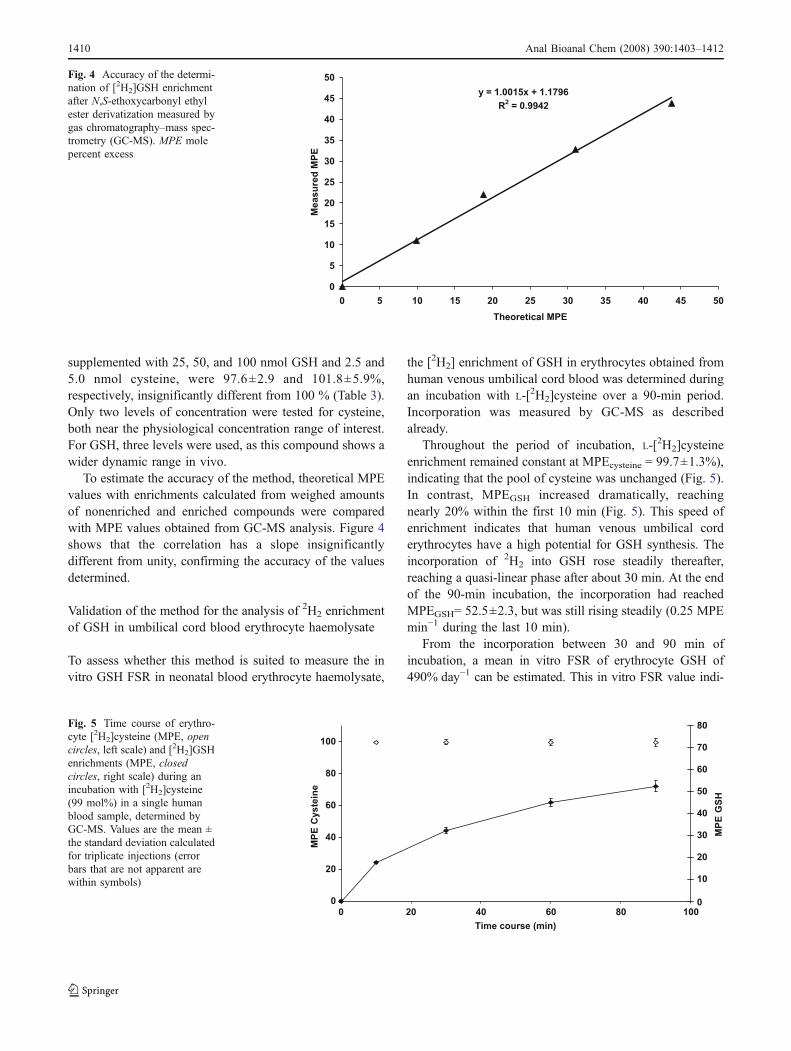
To estimate the accuracy of the method, theoretical MPEvalues with enrichments calculated from weighed amountsof nonenriched and enriched compounds were comparedwith MPE values obtained from GC-MS analysis. Figure 4shows that the correlation has a slope insignificantlydifferent from unity, confirming the accuracy of the valuesdetermined.
Validation of the method for the analysis of 2H2 enrichmentof GSH in umbilical cord blood erythrocyte haemolysate
To assess whether this method is suited to measure the invitro GSH FSR in neonatal blood erythrocyte haemolysate,
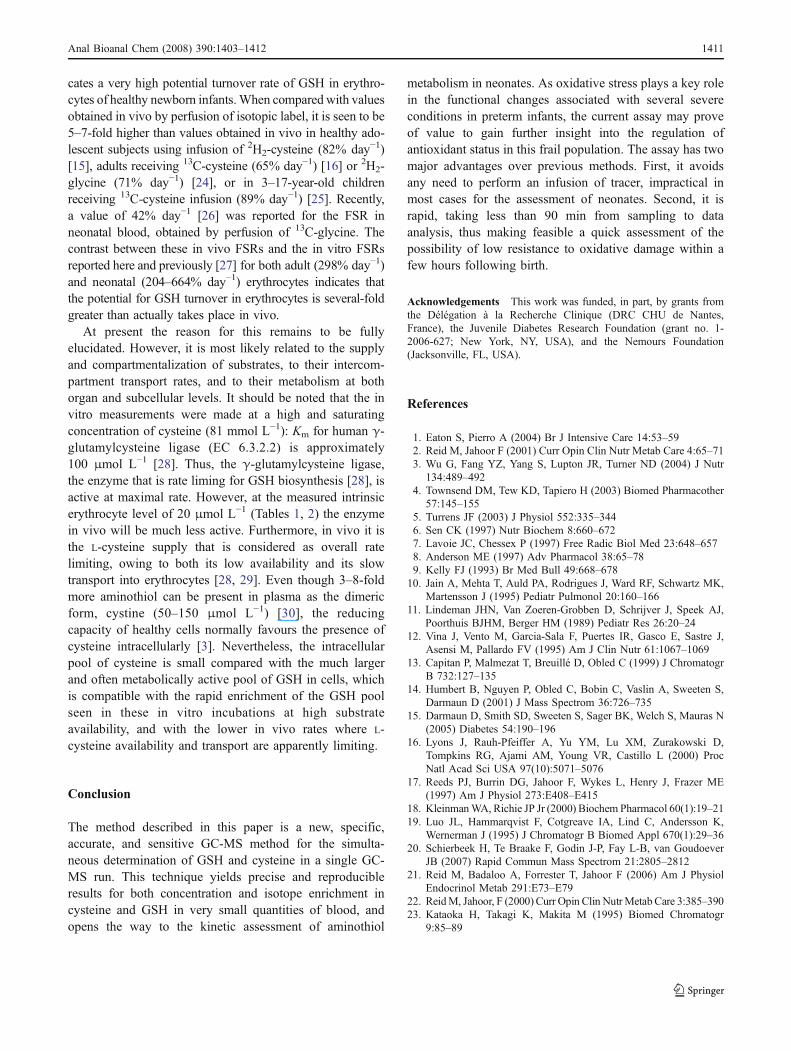
the [2H2] enrichment of GSH in erythrocytes obtained fromhuman venous umbilical cord blood was determined duringan incubation with L-[2H2]cysteine over a 90-min period.Incorporation was measured by GC-MS as describedalready.
Throughout the period of incubation, L-[2H2]cysteineenrichment remained constant at MPEcysteine = 99.7±1.3%),indicating that the pool of cysteine was unchanged (Fig. 5).In contrast, MPEGSH increased dramatically, reachingnearly 20% within the first 10 min (Fig. 5). This speed ofenrichment indicates that human venous umbilical corderythrocytes have a high potential for GSH synthesis. Theincorporation of 2H2 into GSH rose steadily thereafter,reaching a quasi-linear phase after about 30 min. At the endof the 90-min incubation, the incorporation had reachedMPEGSH= 52.5±2.3, but was still rising steadily (0.25 MPEmin−1 during the last 10 min).
From the incorporation between 30 and 90 min ofincubation, a mean in vitro FSR of erythrocyte GSH of490% day−1 can be estimated. This in vitro FSR value indi-
y = 1.0015x + 1.1796
R2 = 0.9942
0
5
10
15
20
25
30
35
40
45
50
0 5 10 15 20 25 30 35 40 45 50
Theoretical MPE M
easu
red
MP
E
Fig. 4 Accuracy of the determi-nation of [2H2]GSH enrichmentafter N,S-ethoxycarbonyl ethylester derivatization measured bygas chromatography–mass spec-trometry (GC-MS). MPE molepercent excess
0
0
20
20
40
40
60
60
80
80
100
100
Time course (min)
MP
E C
yste
ine
0
10
20
30
40
50
60
70
80M
PE
GS
HFig. 5 Time course of erythro-cyte [2H2]cysteine (MPE, opencircles, left scale) and [2H2]GSHenrichments (MPE, closedcircles, right scale) during anincubation with [2H2]cysteine(99 mol%) in a single humanblood sample, determined byGC-MS. Values are the mean ±the standard deviation calculatedfor triplicate injections (errorbars that are not apparent arewithin symbols)
1410 Anal Bioanal Chem (2008) 390:1403–1412
cates a very high potential turnover rate of GSH in erythro-cytes of healthy newborn infants.When compared with valuesobtained in vivo by perfusion of isotopic label, it is seen to be5–7-fold higher than values obtained in vivo in healthy ado-lescent subjects using infusion of 2H2-cysteine (82% day−1)[15], adults receiving 13C-cysteine (65% day−1) [16] or 2H2-glycine (71% day−1) [24], or in 3–17-year-old childrenreceiving 13C-cysteine infusion (89% day−1) [25]. Recently,a value of 42% day−1 [26] was reported for the FSR inneonatal blood, obtained by perfusion of 13C-glycine. Thecontrast between these in vivo FSRs and the in vitro FSRsreported here and previously [27] for both adult (298% day−1)and neonatal (204–664% day−1) erythrocytes indicates thatthe potential for GSH turnover in erythrocytes is several-foldgreater than actually takes place in vivo.
At present the reason for this remains to be fullyelucidated. However, it is most likely related to the supplyand compartmentalization of substrates, to their intercom-partment transport rates, and to their metabolism at bothorgan and subcellular levels. It should be noted that the invitro measurements were made at a high and saturatingconcentration of cysteine (81 mmol L−1): Km for human γ-glutamylcysteine ligase (EC 6.3.2.2) is approximately100 μmol L−1 [28]. Thus, the γ-glutamylcysteine ligase,the enzyme that is rate liming for GSH biosynthesis [28], isactive at maximal rate. However, at the measured intrinsicerythrocyte level of 20 μmol L−1 (Tables 1, 2) the enzymein vivo will be much less active. Furthermore, in vivo it isthe L-cysteine supply that is considered as overall ratelimiting, owing to both its low availability and its slowtransport into erythrocytes [28, 29]. Even though 3–8-foldmore aminothiol can be present in plasma as the dimericform, cystine (50–150 μmol L−1) [30], the reducingcapacity of healthy cells normally favours the presence ofcysteine intracellularly [3]. Nevertheless, the intracellularpool of cysteine is small compared with the much largerand often metabolically active pool of GSH in cells, whichis compatible with the rapid enrichment of the GSH poolseen in these in vitro incubations at high substrateavailability, and with the lower in vivo rates where L-cysteine availability and transport are apparently limiting.
Conclusion
The method described in this paper is a new, specific,accurate, and sensitive GC-MS method for the simulta-neous determination of GSH and cysteine in a single GC-MS run. This technique yields precise and reproducibleresults for both concentration and isotope enrichment incysteine and GSH in very small quantities of blood, andopens the way to the kinetic assessment of aminothiol
metabolism in neonates. As oxidative stress plays a key rolein the functional changes associated with several severeconditions in preterm infants, the current assay may proveof value to gain further insight into the regulation ofantioxidant status in this frail population. The assay has twomajor advantages over previous methods. First, it avoidsany need to perform an infusion of tracer, impractical inmost cases for the assessment of neonates. Second, it israpid, taking less than 90 min from sampling to dataanalysis, thus making feasible a quick assessment of thepossibility of low resistance to oxidative damage within afew hours following birth.
Acknowledgements This work was funded, in part, by grants fromthe Délégation à la Recherche Clinique (DRC CHU de Nantes,France), the Juvenile Diabetes Research Foundation (grant no. 1-2006-627; New York, NY, USA), and the Nemours Foundation(Jacksonville, FL, USA).
References
1. Eaton S, Pierro A (2004) Br J Intensive Care 14:53–592. Reid M, Jahoor F (2001) Curr Opin Clin Nutr Metab Care 4:65–713. Wu G, Fang YZ, Yang S, Lupton JR, Turner ND (2004) J Nutr
134:489–4924. Townsend DM, Tew KD, Tapiero H (2003) Biomed Pharmacother
57:145–1555. Turrens JF (2003) J Physiol 552:335–3446. Sen CK (1997) Nutr Biochem 8:660–6727. Lavoie JC, Chessex P (1997) Free Radic Biol Med 23:648–6578. Anderson ME (1997) Adv Pharmacol 38:65–789. Kelly FJ (1993) Br Med Bull 49:668–678
10. Jain A, Mehta T, Auld PA, Rodrigues J, Ward RF, Schwartz MK,Martensson J (1995) Pediatr Pulmonol 20:160–166
11. Lindeman JHN, Van Zoeren-Grobben D, Schrijver J, Speek AJ,Poorthuis BJHM, Berger HM (1989) Pediatr Res 26:20–24
12. Vina J, Vento M, Garcia-Sala F, Puertes IR, Gasco E, Sastre J,Asensi M, Pallardo FV (1995) Am J Clin Nutr 61:1067–1069
13. Capitan P, Malmezat T, Breuillé D, Obled C (1999) J ChromatogrB 732:127–135
14. Humbert B, Nguyen P, Obled C, Bobin C, Vaslin A, Sweeten S,Darmaun D (2001) J Mass Spectrom 36:726–735
15. Darmaun D, Smith SD, Sweeten S, Sager BK, Welch S, Mauras N(2005) Diabetes 54:190–196
16. Lyons J, Rauh-Pfeiffer A, Yu YM, Lu XM, Zurakowski D,Tompkins RG, Ajami AM, Young VR, Castillo L (2000) ProcNatl Acad Sci USA 97(10):5071–5076
17. Reeds PJ, Burrin DG, Jahoor F, Wykes L, Henry J, Frazer ME(1997) Am J Physiol 273:E408–E415
18. KleinmanWA, Richie JP Jr (2000) Biochem Pharmacol 60(1):19–2119. Luo JL, Hammarqvist F, Cotgreave IA, Lind C, Andersson K,
Wernerman J (1995) J Chromatogr B Biomed Appl 670(1):29–3620. Schierbeek H, Te Braake F, Godin J-P, Fay L-B, van Goudoever
JB (2007) Rapid Commun Mass Spectrom 21:2805–281221. Reid M, Badaloo A, Forrester T, Jahoor F (2006) Am J Physiol
Endocrinol Metab 291:E73–E7922. ReidM, Jahoor, F (2000) Curr Opin Clin NutrMetabCare 3:385–39023. Kataoka H, Takagi K, Makita M (1995) Biomed Chromatogr
9:85–89
Anal Bioanal Chem (2008) 390:1403–1412 1411
24. Jahoor F, Jackson A, Gazzard B, Philips G, Sharpstone D, FrazerME, Heird W (1999) Am J Physiol 276:E205–211
25. Lyons J, Rauh-Pfeiffer A, Ming-Yu Y, Lu XM, Zurakowski D,Curley M, Collier S, Duggan C, Nurko S, Thompson J, Ajami A,Borgonha S, Young VR, Castillo L (2001) Crit Care Med 29:870–877
26. Schierbeek H, Te Braake F, Godin J-P, Fay L-B, van GoudoeverJB (2007) Rapid Commun Mass Spectrom 21:2805–2812
27. Tea I, Ferchaud-Roucher V, Küster A, Darmaun D, Robins RJ(2007) Rapid Commun Mass Spectrom 21:3245–3252
28. Griffith OW (1999) Free Radic Biol Med 27:922–93529. Griffith OW (1981) J Biol Chem 256:4900–490430. Stipanuk MH (2005) In: Shils ME, Shike M, Ros AC, Caballero
B, Cousins RJ (eds) Modern nutrition in health and disease.Lippincott Williams & Wilkins, Philadelphia, pp 545–562
1412 Anal Bioanal Chem (2008) 390:1403–1412