Capillary electrophoresis with capacitively coupled contactless conductivity detection for low...
9
Journal of Chromatography A, 1290 (2013) 82–90 Contents lists available at SciVerse ScienceDirect Journal of Chromatography A j our nal homep age: www.elsevier.com/locate/chroma Capillary electrophoresis with capacitively coupled contactless conductivity detection for the determination of cis/trans isomers of octadec-9-enoic acid and other long chain fatty acids Yong Foo Wong a , Bahruddin Saad a,b,∗ , Ahmad Makahleh a,∗∗ a School of Chemical Sciences, Universiti Sains Malaysia, 11800 Penang, Malaysia b Doping Control Center, Universiti Sains Malaysia, 11800 Penang, Malaysia a r t i c l e i n f o Article history: Received 18 January 2013 Received in revised form 1 March 2013 Accepted 9 March 2013 Available online 16 March 2013 Keywords: CE C 4 D Fatty acid -Cyclodextrins Margarine a b s t r a c t A capillary electrophoresis (CE)–capacitively coupled contactless conductivity detection (C 4 D) method for the simultaneous separation of eleven underivatized fatty acids (FAs), namely, lauric, myristic, tridecanoic (internal standard), pentadecanoic, palmitic, stearic, oleic, elaidic, linoleic, linolenic and arachidic acids is described. The separation was carried out in normal polarity mode at 20 ◦ C, 30 kV and using hydrodynamic injection (50 mbar for 1 s). The separation was achieved in a bare fused-silica capillary (70 cm × 75 m i.d.) using a background electrolyte of methyl--cyclodextrin (∼6 mM) and heptakis-(2,3,6-tri-O-methyl)-- cyclodextrin (∼8 mM) dissolved in a mixture of Na 2 HPO 4 /KH 2 PO 4 (5 mM, pH 7.4):ACN:MeOH:n-octanol (3:4:2.5:0.5, v/v/v/v). C 4 D parameters were set at fixed amplitude of 100 V and frequency of 1000 kHz. The developed method was validated. Calibration curves of the ten FAs were well correlated (r 2 > 0.99) within the range of 5–250 g mL −1 for lauric acid, and 3–250 g mL −1 for the other FAs. The method was simple and sensitive with detection limits (S/N = 3) of 0.9–1.9 g mL −1 and good relative standard deviations of intra- and inter-day for migration times and peak areas (≤9.7%) were achieved. The method was applied to the determination of FAs in margarine samples. The proposed method offers distinct advantages over the GC and HPLC methods, especially in terms of simplicity (without derivatization) and sensitivity. © 2013 Elsevier B.V. All rights reserved. 1. Introduction Fatty acids (FAs) are carboxylic acids with long hydrocarbon chains. They are widely found in nature (e.g. food products, veg- etable oils, and living organisms) and are the basic components of most naturally occurring lipids in both animals and plants. FAs can be categorized according to their degree of saturation, i.e., saturated fatty acids (SFAs) and those with different degrees of unsaturation, from monounsaturated fatty acids (MUFAs) to polyunsaturated fatty acids (PUFAs). The physical and chemical characteristics of FAs are highly dependent on the carbon chain length, number and position of double bonds, and cis–trans isomer conformations. Consumption of fats and their effects on human health have long been an active area of research, thus the profiling of FAs is of great importance from commercial point of view and health impacts (e.g. toward the prevention of diseases) [1–5]. Lately, a considerable ∗ Corresponding author at: School of Chemical Sciences, Universiti Sains Malaysia, 11800 Penang, Malaysia. Tel.: +60 4 653 2544; fax: +60 4 656 9869. ∗∗ Corresponding author. Tel.: +60 4 653 6018; fax: +60 4 657 4857. E-mail addresses: [email protected], las [email protected] (B. Saad), [email protected] (A. Makahleh). increase in the consumption of trans fats from industrial processes has been observed around the world. Trans fatty acid (TFA) is an important quality parameter in the oleofood industry and is routinely measured during the production and storage stages. Gen- erally, TFAs are classified into two groups: ruminant and industrial TFAs. Ruminant TFAs (e.g. vaccenic and conjugated linolenic acids) are hypothesized to have beneficial physiological effects [6–8]. Some studies also revealed that some monounsaturated trans fatty acid, specifically vaccenic acid, could be involved in the production of conjugate linoleic acid (CLA), which are thought to have anti- carcinogenic properties (regulate tumor growth) [9,10]. Elaidic acid is the most common industrial TFA, being responsible for 80–100% of the total TFA found in processed foods [11,12]. The current upsurge in interest of TFA is fueled by the discovery that TFA is associated with increased risk of coronary heart diseases and type two diabetes [13,14]. Furthermore, numerous clinical studies have suggested that the consumption of TFA is associated with lower maternal and neonatal PUFA status, increased fetal loss and low birth weight infants [15–18]. Due to the adverse effects of TFA on humans, several countries (US, Canada, Denmark, etc.) have made it mandatory to include TFA in the labeling of food. The World Health Organization (WHO) has suggested that consumption of trans fat should not exceed 1% of the caloric value of the daily diet [19]. 0021-9673/$ – see front matter © 2013 Elsevier B.V. All rights reserved. http://dx.doi.org/10.1016/j.chroma.2013.03.014
Transcript of Capillary electrophoresis with capacitively coupled contactless conductivity detection for low...
Cco
Ya
b
ARRAA
KCCF�M
1
cembfffFp
bit
1
m
0h
Journal of Chromatography A, 1290 (2013) 82– 90
Contents lists available at SciVerse ScienceDirect
Journal of Chromatography A
j our nal homep age: www.elsev ier .com/ locate /chroma
apillary electrophoresis with capacitively coupled contactlessonductivity detection for the determination of cis/trans isomers ofctadec-9-enoic acid and other long chain fatty acids
ong Foo Wonga, Bahruddin Saada,b,∗, Ahmad Makahleha,∗∗
School of Chemical Sciences, Universiti Sains Malaysia, 11800 Penang, MalaysiaDoping Control Center, Universiti Sains Malaysia, 11800 Penang, Malaysia
a r t i c l e i n f o
rticle history:eceived 18 January 2013eceived in revised form 1 March 2013ccepted 9 March 2013vailable online 16 March 2013
eywords:E4D
a b s t r a c t
A capillary electrophoresis (CE)–capacitively coupled contactless conductivity detection (C4D) method forthe simultaneous separation of eleven underivatized fatty acids (FAs), namely, lauric, myristic, tridecanoic(internal standard), pentadecanoic, palmitic, stearic, oleic, elaidic, linoleic, linolenic and arachidic acids isdescribed. The separation was carried out in normal polarity mode at 20 ◦C, 30 kV and using hydrodynamicinjection (50 mbar for 1 s). The separation was achieved in a bare fused-silica capillary (70 cm × 75 �m i.d.)using a background electrolyte of methyl-�-cyclodextrin (∼6 mM) and heptakis-(2,3,6-tri-O-methyl)-�-cyclodextrin (∼8 mM) dissolved in a mixture of Na2HPO4/KH2PO4 (5 mM, pH 7.4):ACN:MeOH:n-octanol(3:4:2.5:0.5, v/v/v/v). C4D parameters were set at fixed amplitude of 100 V and frequency of 1000 kHz. The
2
atty acid-Cyclodextrinsargarinedeveloped method was validated. Calibration curves of the ten FAs were well correlated (r > 0.99) withinthe range of 5–250 �g mL−1 for lauric acid, and 3–250 �g mL−1 for the other FAs. The method was simpleand sensitive with detection limits (S/N = 3) of 0.9–1.9 �g mL−1 and good relative standard deviations ofintra- and inter-day for migration times and peak areas (≤9.7%) were achieved. The method was appliedto the determination of FAs in margarine samples. The proposed method offers distinct advantages overthe GC and HPLC methods, especially in terms of simplicity (without derivatization) and sensitivity.
. Introduction
Fatty acids (FAs) are carboxylic acids with long hydrocarbonhains. They are widely found in nature (e.g. food products, veg-table oils, and living organisms) and are the basic components ofost naturally occurring lipids in both animals and plants. FAs can
e categorized according to their degree of saturation, i.e., saturatedatty acids (SFAs) and those with different degrees of unsaturation,rom monounsaturated fatty acids (MUFAs) to polyunsaturatedatty acids (PUFAs). The physical and chemical characteristics ofAs are highly dependent on the carbon chain length, number andosition of double bonds, and cis–trans isomer conformations.
Consumption of fats and their effects on human health have long
een an active area of research, thus the profiling of FAs is of greatmportance from commercial point of view and health impacts (e.g.oward the prevention of diseases) [1–5]. Lately, a considerable
∗ Corresponding author at: School of Chemical Sciences, Universiti Sains Malaysia,1800 Penang, Malaysia. Tel.: +60 4 653 2544; fax: +60 4 656 9869.∗∗ Corresponding author. Tel.: +60 4 653 6018; fax: +60 4 657 4857.
E-mail addresses: [email protected], las [email protected] (B. Saad),[email protected] (A. Makahleh).
021-9673/$ – see front matter © 2013 Elsevier B.V. All rights reserved.ttp://dx.doi.org/10.1016/j.chroma.2013.03.014
© 2013 Elsevier B.V. All rights reserved.
increase in the consumption of trans fats from industrial processeshas been observed around the world. Trans fatty acid (TFA) isan important quality parameter in the oleofood industry and isroutinely measured during the production and storage stages. Gen-erally, TFAs are classified into two groups: ruminant and industrialTFAs. Ruminant TFAs (e.g. vaccenic and conjugated linolenic acids)are hypothesized to have beneficial physiological effects [6–8].Some studies also revealed that some monounsaturated trans fattyacid, specifically vaccenic acid, could be involved in the productionof conjugate linoleic acid (CLA), which are thought to have anti-carcinogenic properties (regulate tumor growth) [9,10]. Elaidic acidis the most common industrial TFA, being responsible for 80–100%of the total TFA found in processed foods [11,12]. The currentupsurge in interest of TFA is fueled by the discovery that TFA isassociated with increased risk of coronary heart diseases and typetwo diabetes [13,14]. Furthermore, numerous clinical studies havesuggested that the consumption of TFA is associated with lowermaternal and neonatal PUFA status, increased fetal loss and lowbirth weight infants [15–18]. Due to the adverse effects of TFA on
humans, several countries (US, Canada, Denmark, etc.) have made itmandatory to include TFA in the labeling of food. The World HealthOrganization (WHO) has suggested that consumption of trans fatshould not exceed 1% of the caloric value of the daily diet [19].
matog
meufCrntqtb(hs[lu[eiipflcs9(La
imidelpm[boztfruat
yepHgfla
iyotvowd
Y.F. Wong et al. / J. Chro
Therefore, it is imperative to develop a suitable analyticalethod to determine TFA in view of their widespread pres-
nce in food. Conventionally, analysis of TFA has been performedsing spectroscopic or chromatographic methods. Fourier trans-ormed infrared (FTIR) spectrophotometric method based on theH out-of-plane deformation band observed at 966 cm−1 has beeneported [20]. However, this method is not specific as it doesot provide details on the content of saturated and PUFAs inhe sample. Moreover, the method is considered unreliable whenuantifying trans fat concentrations of less than 5% (as % ofotal fat) [20,21]. The determination of TFAs has been dominatedy chromatographic techniques, especially gas chromatographyGC). The analytically challenging task of separating the isomersas been capitalized by the distinct ability of transition metalsuch as silver to complex with unsaturated organic compounds22–26]. Thus silver ion-impregnated stationary phases for thinayer chromatography (Ag+-TLC) [22,23] and high performance liq-id chromatography (Ag+-HPLC) with ultraviolet (UV) detection24–26] or mass spectrometer (MS) [27] were predominant. How-ver, low reproducibility and contamination by trace silver saltsnto the fractions are some of the major difficulties of using the Ag+-mpregnated stationary phases [28]. Thus reversed-phased higherformance liquid chromatography (RP-HPLC)–UV [23,27–30] oruorescence [31] or MS [27] were also reported. Since FAs lackhromophores, derivatization is often needed to increase the sen-itivity of HPLC analysis. Common derivatization agents such as-(2-hydroxyethyl)-carbazole [32], and 2-(2-naphthoxy)ethyl-2-piperidino)ethane sulfonate [33] have been used. Additionally,C methods also required long analysis time and consume largemounts of solvents.
For GC separations, the use of highly polar (e.g. based ononic liquids [34,35]) and long columns (100 and 120 m) becomes
andatory, and these were used in conjunction with flame ion-zation (FID) [23,26–29,36] or MS [36,37] detectors. For a givenouble bond position on the carbon chain, the trans isomers wereluted before their corresponding cis homologues. However, over-aps and co-elution of the isomers still occur. To overcome thisroblem, fractionation techniques prior to GC and alternative chro-atography techniques (e.g. Ag+-TLC × GC [23,26], Ag+-HPLC × GC
26], RP-HPLC × GC [23], dual column-LC [30] and GC × GC [25,36])ecome necessary. Generally, GC methods involve the separationf either methyl or trimethylsilyl esters derivatives. The derivati-ation procedure (especially for the longer chain FAs) is necessaryo increase the volatility and to overcome adsorption of the polarunctional groups to the GC column [38]. However, derivatizationeactions often produce incomplete conversion of the analyte andndesirable interfering side products. In addition, GC techniquelso increased the risk of isomerization of double bonds as higheremperature was required during the analysis.
CE with indirect UV detection has been developed for the anal-sis of TFAs [39–44]. No derivatization is needed, high separationfficiency, short analysis time, low sample consumption and sim-licity in operation are some notable advantages of the method.owever, the sensitivity of the method is low due to the high back-round noise and the short sample path length. In addition, theuctuating baseline and incomplete separation of the major FAslso make the method unsuitable for routine analysis.
The popularity of capacitively coupled contactless conductiv-ty (C4D) detection has been growing steadily over the last fewears. C4D is a conductometric measuring approach that is basedn the conductivity differences between the sample zones andhe background electrolyte (BGE) [45]. C4D overcomes the disad-
antage of short path length that is encountered by on-columnptical detections. Furthermore, it avoids the direct contact oforking electrodes with BGE in the conventional conductivityetection [45] and eliminates the laborious work of fabricatingr. A 1290 (2013) 82– 90 83
detection cells in potential gradient detection [46]. Other mainadvantages include the capability to detect small organic moleculesand non-chromophoric compounds, using simple electronic cir-cuitry, required low maintenance and also relatively low cost [45].C4D has been applied in determining species including small inor-ganic and organic ions, biochemical species, etc. [45]. The use ofC4D for the determination of long chain FAs in oil samples in com-bination with CE [41,47], HPLC [48] or flow injection analysis (FIA)[49] has been previously reported. The reported CE–C4D methodenables good separation and determination of nine SFAs [47]. How-ever, overlapping between palmitic and oleic acids (common fattyacids) when real samples were analyzed was observed. The addi-tion of Brij 35 to the running buffer had overcome this problem[41]. Recently, HPLC coupled with C4D had been also used to sepa-rate palmitic and oleic acids [48]. However, both of the methods canbe applied for the analysis of a limited number of FAs and the sep-aration of cis/trans forms of octadec-9-enoic acid was not targeted.Therefore, a simple method for the simultaneous determination ofthe most common SFAs, MUFAs, PUFAs and TFAs has yet to be done.
In this paper, we describe a novel CE–C4D method for the rapidanalytical separation and simultaneous determination of elevenFAs (SFAs (lauric, tridecanoic, myristic, pentadecanoic, palmitic andarachidic acids), MUFAs (oleic acid), PUFAs (linoleic and linoleicacids) and TFA (elaidic acid)). The use of different solvent polaritiesand dual cyclodextrins makes this method capable to differentiatethe cis and trans isomers of octadec-9-enoic acid. The method wasvalidated and the analytical practicality of the method was demon-strated in the determination of FAs in a few types of margarinesamples. The chemical structures of the FAs studied are shown inFig. 1.
2. Experimental
2.1. Chemicals and reagents
Lauric (C12:0; ≥99.5%), tridecanoic (C13:0; ≥99%), myristic (C14:0;99%), pentadecanoic (C15:0; ≥99.5%), palmitic (C16:0; ≥99%), stearic(C18:0; ≥99%), oleic (C18:1c; 99%), elaidic (C18:1t; ≥99%), linoleic(C18:2; 99%), linolenic (C18:3; ≥99%), and arachidic (C20:0; ≥99%)acids, monobasic sodium phosphate (NaH2PO4), dibasic sodiumphosphate (Na2HPO4), monobasic potassium phosphate (KH2PO4),methyl-�-cyclodextrin (M�CD), heptakis-(2,3,6-tri-O-methyl)-�-cyclodextrin (TM�CD), 1-propanol (HPLC grade), 1-pentanol(HPLC grade) and n-octanol (HPLC grade) were purchased fromSigma–Aldrich (St. Louis, MO, USA). Sodium hydroxide, boron tri-fluoride (20% solution in MeOH), HPLC grade hexane, methanol(MeOH), 1-hexanol, 1-heptanol and acetonitrile (ACN) were pur-chased from Merck (Darmstadt, Germany). Ethanol (HPLC grade)was purchased from Fisher Scientific (Hampton, New Hamp-shire, USA). HPLC grade 2-propanol and 1-butanol were purchasedfrom Q-Rec (Auckland, New Zealand). Phosphoric acid (85%)was supplied by Univar (Ingleburn, Australia). Ultra pure water(18.2 M� cm−1) was produced by a Milli-Q system (Millipore, MA,USA).
2.2. Instrumentations
2.2.1. CE–C4DSeparations were conducted on a HP3DCE capillary zone elec-
trophoresis system, model 7100 (Agilent Technologies, Waldbronn,
Germany) equipped with C4D (eDAQ, Denistone East, Australia).The separations were performed using a bare fused-silica capil-lary 80.5 cm × 75 �m i.d. (detection length, 10.5 cm from the outletend of the capillary) supplied by Agilent Technologies (Waldbronn,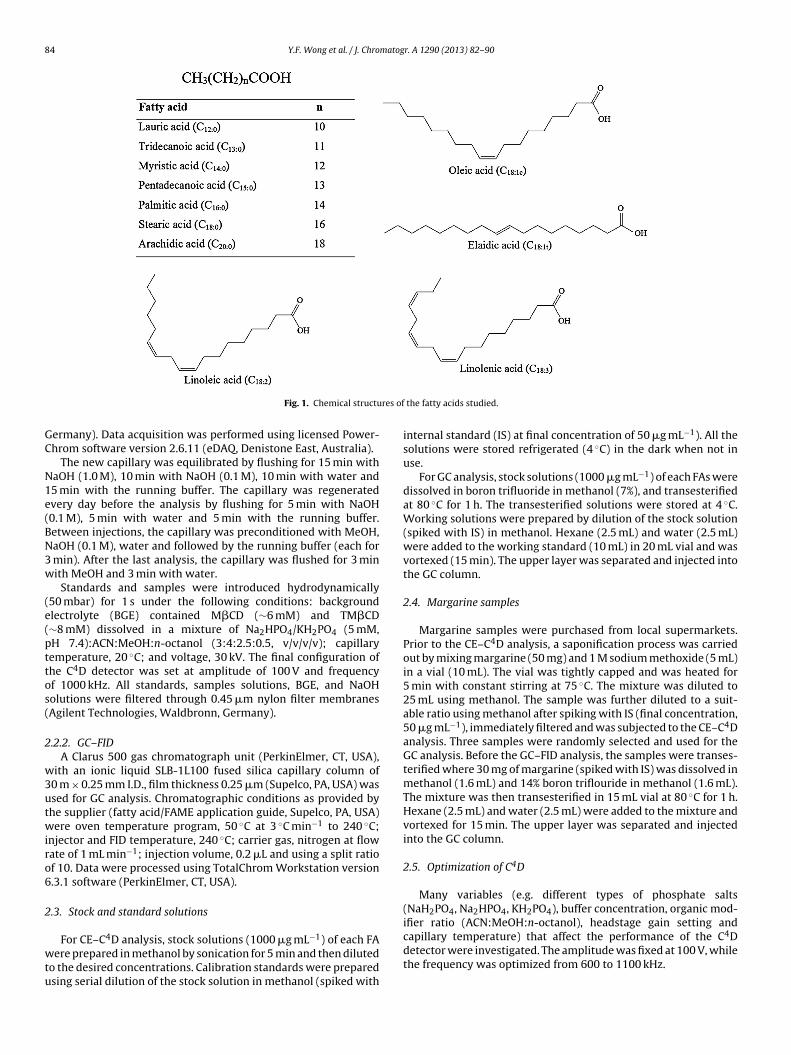
84 Y.F. Wong et al. / J. Chromatogr. A 1290 (2013) 82– 90
res of
GC
N1e(BN3w
(e(pttos(
2
w3utwiro6
2
wtu
Fig. 1. Chemical structu
ermany). Data acquisition was performed using licensed Power-hrom software version 2.6.11 (eDAQ, Denistone East, Australia).
The new capillary was equilibrated by flushing for 15 min withaOH (1.0 M), 10 min with NaOH (0.1 M), 10 min with water and5 min with the running buffer. The capillary was regeneratedvery day before the analysis by flushing for 5 min with NaOH0.1 M), 5 min with water and 5 min with the running buffer.etween injections, the capillary was preconditioned with MeOH,aOH (0.1 M), water and followed by the running buffer (each for
min). After the last analysis, the capillary was flushed for 3 minith MeOH and 3 min with water.
Standards and samples were introduced hydrodynamically50 mbar) for 1 s under the following conditions: backgroundlectrolyte (BGE) contained M�CD (∼6 mM) and TM�CD∼8 mM) dissolved in a mixture of Na2HPO4/KH2PO4 (5 mM,H 7.4):ACN:MeOH:n-octanol (3:4:2.5:0.5, v/v/v/v); capillaryemperature, 20 ◦C; and voltage, 30 kV. The final configuration ofhe C4D detector was set at amplitude of 100 V and frequencyf 1000 kHz. All standards, samples solutions, BGE, and NaOHolutions were filtered through 0.45 �m nylon filter membranesAgilent Technologies, Waldbronn, Germany).
.2.2. GC–FIDA Clarus 500 gas chromatograph unit (PerkinElmer, CT, USA),
ith an ionic liquid SLB-1L100 fused silica capillary column of0 m × 0.25 mm I.D., film thickness 0.25 �m (Supelco, PA, USA) wassed for GC analysis. Chromatographic conditions as provided byhe supplier (fatty acid/FAME application guide, Supelco, PA, USA)ere oven temperature program, 50 ◦C at 3 ◦C min−1 to 240 ◦C;
njector and FID temperature, 240 ◦C; carrier gas, nitrogen at flowate of 1 mL min−1; injection volume, 0.2 �L and using a split ratiof 10. Data were processed using TotalChrom Workstation version.3.1 software (PerkinElmer, CT, USA).
.3. Stock and standard solutions
For CE–C4D analysis, stock solutions (1000 �g mL−1) of each FAere prepared in methanol by sonication for 5 min and then diluted
o the desired concentrations. Calibration standards were preparedsing serial dilution of the stock solution in methanol (spiked with
the fatty acids studied.
internal standard (IS) at final concentration of 50 �g mL−1). All thesolutions were stored refrigerated (4 ◦C) in the dark when not inuse.
For GC analysis, stock solutions (1000 �g mL−1) of each FAs weredissolved in boron trifluoride in methanol (7%), and transesterifiedat 80 ◦C for 1 h. The transesterified solutions were stored at 4 ◦C.Working solutions were prepared by dilution of the stock solution(spiked with IS) in methanol. Hexane (2.5 mL) and water (2.5 mL)were added to the working standard (10 mL) in 20 mL vial and wasvortexed (15 min). The upper layer was separated and injected intothe GC column.
2.4. Margarine samples
Margarine samples were purchased from local supermarkets.Prior to the CE–C4D analysis, a saponification process was carriedout by mixing margarine (50 mg) and 1 M sodium methoxide (5 mL)in a vial (10 mL). The vial was tightly capped and was heated for5 min with constant stirring at 75 ◦C. The mixture was diluted to25 mL using methanol. The sample was further diluted to a suit-able ratio using methanol after spiking with IS (final concentration,50 �g mL−1), immediately filtered and was subjected to the CE–C4Danalysis. Three samples were randomly selected and used for theGC analysis. Before the GC–FID analysis, the samples were transes-terified where 30 mg of margarine (spiked with IS) was dissolved inmethanol (1.6 mL) and 14% boron triflouride in methanol (1.6 mL).The mixture was then transesterified in 15 mL vial at 80 ◦C for 1 h.Hexane (2.5 mL) and water (2.5 mL) were added to the mixture andvortexed for 15 min. The upper layer was separated and injectedinto the GC column.
2.5. Optimization of C4D
Many variables (e.g. different types of phosphate salts(NaH2PO4, Na2HPO4, KH2PO4), buffer concentration, organic mod-ifier ratio (ACN:MeOH:n-octanol), headstage gain setting and
capillary temperature) that affect the performance of the C4Ddetector were investigated. The amplitude was fixed at 100 V, whilethe frequency was optimized from 600 to 1100 kHz.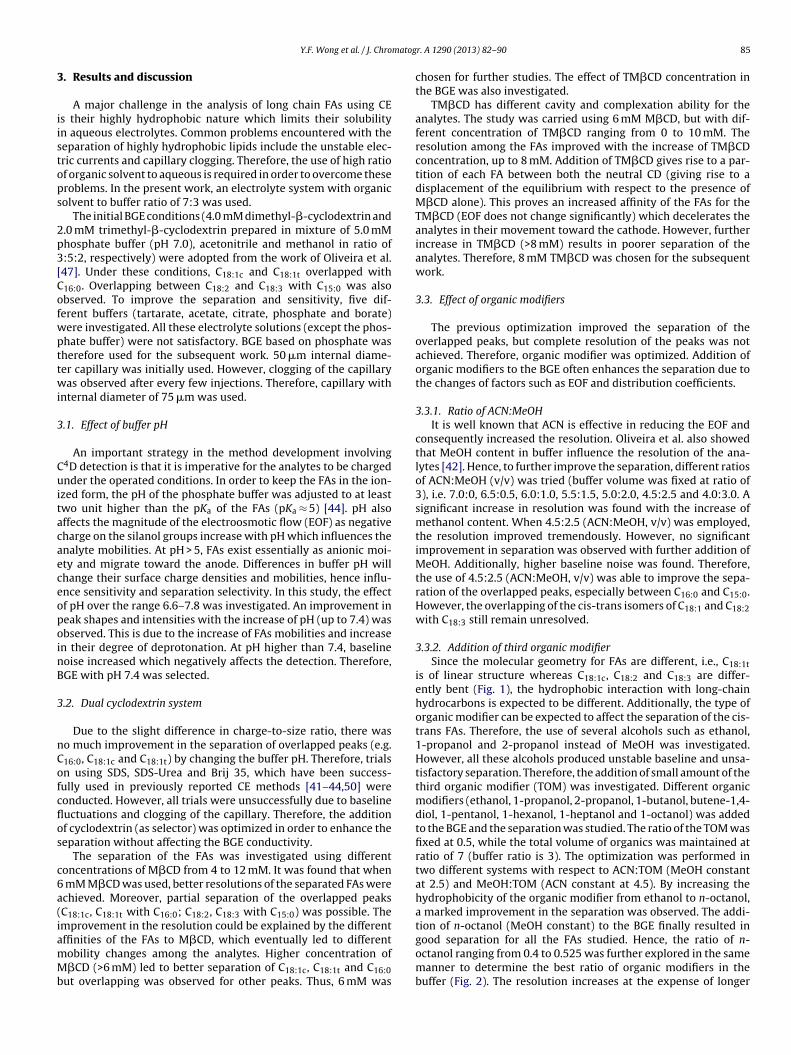
matog
3
iistops
2p3[Cofwpttwi
3
CuitacaeceopoinB
3
nCofcflos
c6a(iamMb
Y.F. Wong et al. / J. Chro
. Results and discussion
A major challenge in the analysis of long chain FAs using CEs their highly hydrophobic nature which limits their solubilityn aqueous electrolytes. Common problems encountered with theeparation of highly hydrophobic lipids include the unstable elec-ric currents and capillary clogging. Therefore, the use of high ratiof organic solvent to aqueous is required in order to overcome theseroblems. In the present work, an electrolyte system with organicolvent to buffer ratio of 7:3 was used.
The initial BGE conditions (4.0 mM dimethyl-�-cyclodextrin and.0 mM trimethyl-�-cyclodextrin prepared in mixture of 5.0 mMhosphate buffer (pH 7.0), acetonitrile and methanol in ratio of:5:2, respectively) were adopted from the work of Oliveira et al.47]. Under these conditions, C18:1c and C18:1t overlapped with16:0. Overlapping between C18:2 and C18:3 with C15:0 was alsobserved. To improve the separation and sensitivity, five dif-erent buffers (tartarate, acetate, citrate, phosphate and borate)ere investigated. All these electrolyte solutions (except the phos-hate buffer) were not satisfactory. BGE based on phosphate washerefore used for the subsequent work. 50 �m internal diame-er capillary was initially used. However, clogging of the capillaryas observed after every few injections. Therefore, capillary with
nternal diameter of 75 �m was used.
.1. Effect of buffer pH
An important strategy in the method development involving4D detection is that it is imperative for the analytes to be chargednder the operated conditions. In order to keep the FAs in the ion-
zed form, the pH of the phosphate buffer was adjusted to at leastwo unit higher than the pKa of the FAs (pKa ≈ 5) [44]. pH alsoffects the magnitude of the electroosmotic flow (EOF) as negativeharge on the silanol groups increase with pH which influences thenalyte mobilities. At pH > 5, FAs exist essentially as anionic moi-ty and migrate toward the anode. Differences in buffer pH willhange their surface charge densities and mobilities, hence influ-nce sensitivity and separation selectivity. In this study, the effectf pH over the range 6.6–7.8 was investigated. An improvement ineak shapes and intensities with the increase of pH (up to 7.4) wasbserved. This is due to the increase of FAs mobilities and increasen their degree of deprotonation. At pH higher than 7.4, baselineoise increased which negatively affects the detection. Therefore,GE with pH 7.4 was selected.
.2. Dual cyclodextrin system
Due to the slight difference in charge-to-size ratio, there waso much improvement in the separation of overlapped peaks (e.g.16:0, C18:1c and C18:1t) by changing the buffer pH. Therefore, trialsn using SDS, SDS-Urea and Brij 35, which have been success-ully used in previously reported CE methods [41–44,50] wereonducted. However, all trials were unsuccessfully due to baselineuctuations and clogging of the capillary. Therefore, the additionf cyclodextrin (as selector) was optimized in order to enhance theeparation without affecting the BGE conductivity.
The separation of the FAs was investigated using differentoncentrations of M�CD from 4 to 12 mM. It was found that when
mM M�CD was used, better resolutions of the separated FAs werechieved. Moreover, partial separation of the overlapped peaksC18:1c, C18:1t with C16:0; C18:2, C18:3 with C15:0) was possible. Themprovement in the resolution could be explained by the different
ffinities of the FAs to M�CD, which eventually led to differentobility changes among the analytes. Higher concentration of�CD (>6 mM) led to better separation of C18:1c, C18:1t and C16:0ut overlapping was observed for other peaks. Thus, 6 mM was
r. A 1290 (2013) 82– 90 85
chosen for further studies. The effect of TM�CD concentration inthe BGE was also investigated.
TM�CD has different cavity and complexation ability for theanalytes. The study was carried using 6 mM M�CD, but with dif-ferent concentration of TM�CD ranging from 0 to 10 mM. Theresolution among the FAs improved with the increase of TM�CDconcentration, up to 8 mM. Addition of TM�CD gives rise to a par-tition of each FA between both the neutral CD (giving rise to adisplacement of the equilibrium with respect to the presence ofM�CD alone). This proves an increased affinity of the FAs for theTM�CD (EOF does not change significantly) which decelerates theanalytes in their movement toward the cathode. However, furtherincrease in TM�CD (>8 mM) results in poorer separation of theanalytes. Therefore, 8 mM TM�CD was chosen for the subsequentwork.
3.3. Effect of organic modifiers
The previous optimization improved the separation of theoverlapped peaks, but complete resolution of the peaks was notachieved. Therefore, organic modifier was optimized. Addition oforganic modifiers to the BGE often enhances the separation due tothe changes of factors such as EOF and distribution coefficients.
3.3.1. Ratio of ACN:MeOHIt is well known that ACN is effective in reducing the EOF and
consequently increased the resolution. Oliveira et al. also showedthat MeOH content in buffer influence the resolution of the ana-lytes [42]. Hence, to further improve the separation, different ratiosof ACN:MeOH (v/v) was tried (buffer volume was fixed at ratio of3), i.e. 7.0:0, 6.5:0.5, 6.0:1.0, 5.5:1.5, 5.0:2.0, 4.5:2.5 and 4.0:3.0. Asignificant increase in resolution was found with the increase ofmethanol content. When 4.5:2.5 (ACN:MeOH, v/v) was employed,the resolution improved tremendously. However, no significantimprovement in separation was observed with further addition ofMeOH. Additionally, higher baseline noise was found. Therefore,the use of 4.5:2.5 (ACN:MeOH, v/v) was able to improve the sepa-ration of the overlapped peaks, especially between C16:0 and C15:0.However, the overlapping of the cis-trans isomers of C18:1 and C18:2with C18:3 still remain unresolved.
3.3.2. Addition of third organic modifierSince the molecular geometry for FAs are different, i.e., C18:1t
is of linear structure whereas C18:1c, C18:2 and C18:3 are differ-ently bent (Fig. 1), the hydrophobic interaction with long-chainhydrocarbons is expected to be different. Additionally, the type oforganic modifier can be expected to affect the separation of the cis-trans FAs. Therefore, the use of several alcohols such as ethanol,1-propanol and 2-propanol instead of MeOH was investigated.However, all these alcohols produced unstable baseline and unsa-tisfactory separation. Therefore, the addition of small amount of thethird organic modifier (TOM) was investigated. Different organicmodifiers (ethanol, 1-propanol, 2-propanol, 1-butanol, butene-1,4-diol, 1-pentanol, 1-hexanol, 1-heptanol and 1-octanol) was addedto the BGE and the separation was studied. The ratio of the TOM wasfixed at 0.5, while the total volume of organics was maintained atratio of 7 (buffer ratio is 3). The optimization was performed intwo different systems with respect to ACN:TOM (MeOH constantat 2.5) and MeOH:TOM (ACN constant at 4.5). By increasing thehydrophobicity of the organic modifier from ethanol to n-octanol,a marked improvement in the separation was observed. The addi-tion of n-octanol (MeOH constant) to the BGE finally resulted in
good separation for all the FAs studied. Hence, the ratio of n-octanol ranging from 0.4 to 0.525 was further explored in the samemanner to determine the best ratio of organic modifiers in thebuffer (Fig. 2). The resolution increases at the expense of longer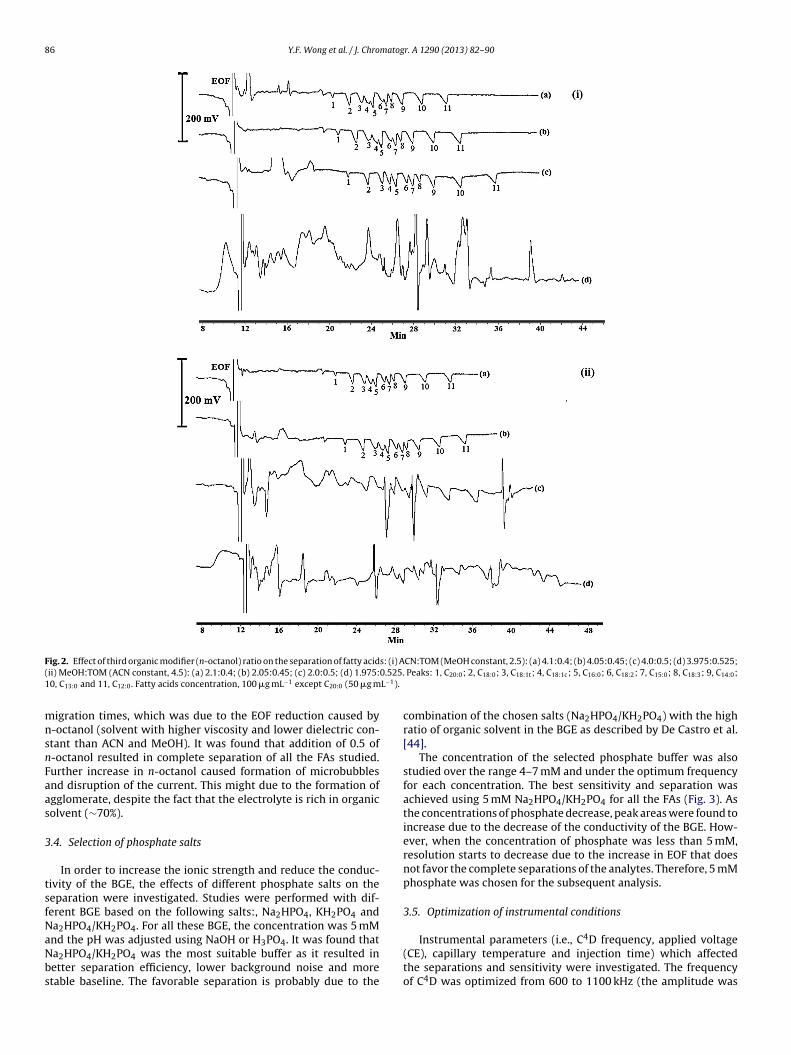
86 Y.F. Wong et al. / J. Chromatogr. A 1290 (2013) 82– 90
F s: (i) A( 0.525.1 L−1).
mnsnFaas
3
tsfNaNbs
ig. 2. Effect of third organic modifier (n-octanol) ratio on the separation of fatty acidii) MeOH:TOM (ACN constant, 4.5): (a) 2.1:0.4; (b) 2.05:0.45; (c) 2.0:0.5; (d) 1.975:0, C13:0 and 11, C12:0. Fatty acids concentration, 100 �g mL−1 except C20:0 (50 �g m
igration times, which was due to the EOF reduction caused by-octanol (solvent with higher viscosity and lower dielectric con-tant than ACN and MeOH). It was found that addition of 0.5 of-octanol resulted in complete separation of all the FAs studied.urther increase in n-octanol caused formation of microbubblesnd disruption of the current. This might due to the formation ofgglomerate, despite the fact that the electrolyte is rich in organicolvent (∼70%).
.4. Selection of phosphate salts
In order to increase the ionic strength and reduce the conduc-ivity of the BGE, the effects of different phosphate salts on theeparation were investigated. Studies were performed with dif-erent BGE based on the following salts:, Na2HPO4, KH2PO4 anda2HPO4/KH2PO4. For all these BGE, the concentration was 5 mM
nd the pH was adjusted using NaOH or H3PO4. It was found thata2HPO4/KH2PO4 was the most suitable buffer as it resulted inetter separation efficiency, lower background noise and moretable baseline. The favorable separation is probably due to theCN:TOM (MeOH constant, 2.5): (a) 4.1:0.4; (b) 4.05:0.45; (c) 4.0:0.5; (d) 3.975:0.525; Peaks: 1, C20:0; 2, C18:0; 3, C18:1t; 4, C18:1c; 5, C16:0; 6, C18:2; 7, C15:0; 8, C18:3; 9, C14:0;
combination of the chosen salts (Na2HPO4/KH2PO4) with the highratio of organic solvent in the BGE as described by De Castro et al.[44].
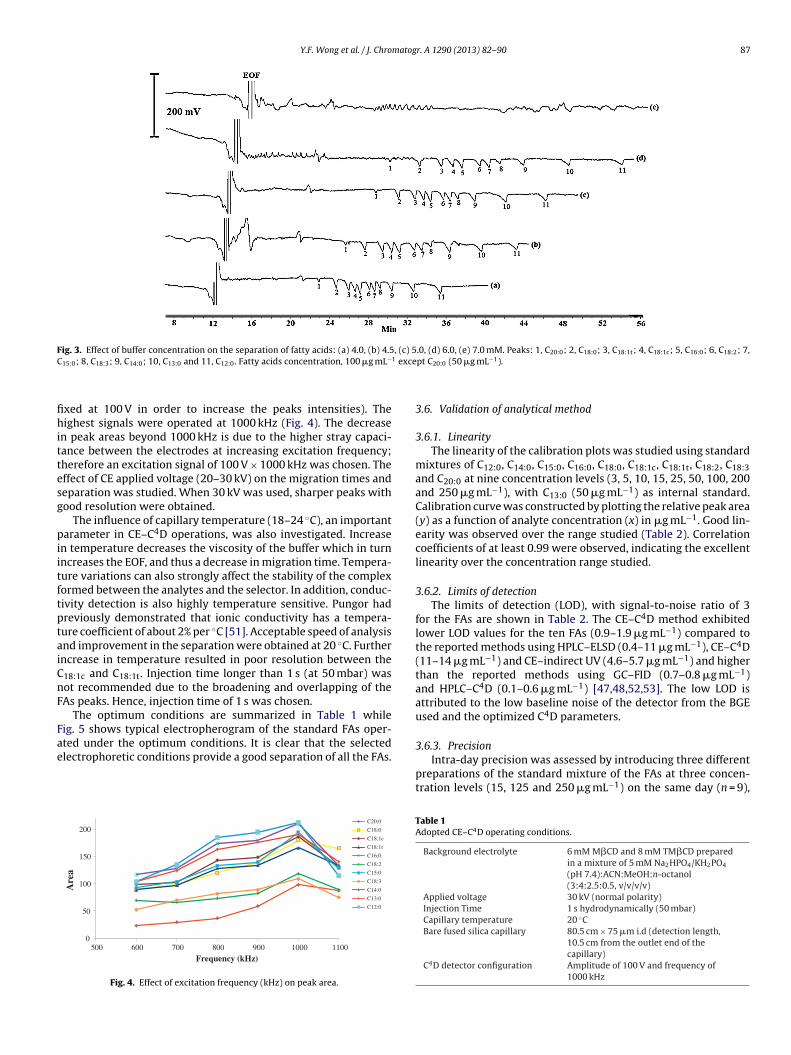
The concentration of the selected phosphate buffer was alsostudied over the range 4–7 mM and under the optimum frequencyfor each concentration. The best sensitivity and separation wasachieved using 5 mM Na2HPO4/KH2PO4 for all the FAs (Fig. 3). Asthe concentrations of phosphate decrease, peak areas were found toincrease due to the decrease of the conductivity of the BGE. How-ever, when the concentration of phosphate was less than 5 mM,resolution starts to decrease due to the increase in EOF that doesnot favor the complete separations of the analytes. Therefore, 5 mMphosphate was chosen for the subsequent analysis.
3.5. Optimization of instrumental conditions
Instrumental parameters (i.e., C4D frequency, applied voltage(CE), capillary temperature and injection time) which affectedthe separations and sensitivity were investigated. The frequencyof C4D was optimized from 600 to 1100 kHz (the amplitude was
Y.F. Wong et al. / J. Chromatogr. A 1290 (2013) 82– 90 87
Fig. 3. Effect of buffer concentration on the separation of fatty acids: (a) 4.0, (b) 4.5, (c) 5.0, (d) 6.0, (e) 7.0 mM. Peaks: 1, C ; 2, C ; 3, C ; 4, C ; 5, C ; 6, C ; 7,C 1 exce
fihittesg
piitftptaiCnF
Fae
15:0; 8, C18:3; 9, C14:0; 10, C13:0 and 11, C12:0. Fatty acids concentration, 100 �g mL−
xed at 100 V in order to increase the peaks intensities). Theighest signals were operated at 1000 kHz (Fig. 4). The decrease
n peak areas beyond 1000 kHz is due to the higher stray capaci-ance between the electrodes at increasing excitation frequency;herefore an excitation signal of 100 V × 1000 kHz was chosen. Theffect of CE applied voltage (20–30 kV) on the migration times andeparation was studied. When 30 kV was used, sharper peaks withood resolution were obtained.
The influence of capillary temperature (18–24 ◦C), an importantarameter in CE–C4D operations, was also investigated. Increase
n temperature decreases the viscosity of the buffer which in turnncreases the EOF, and thus a decrease in migration time. Tempera-ure variations can also strongly affect the stability of the complexormed between the analytes and the selector. In addition, conduc-ivity detection is also highly temperature sensitive. Pungor hadreviously demonstrated that ionic conductivity has a tempera-ure coefficient of about 2% per ◦C [51]. Acceptable speed of analysisnd improvement in the separation were obtained at 20 ◦C. Furtherncrease in temperature resulted in poor resolution between the18:1c and C18:1t. Injection time longer than 1 s (at 50 mbar) wasot recommended due to the broadening and overlapping of theAs peaks. Hence, injection time of 1 s was chosen.
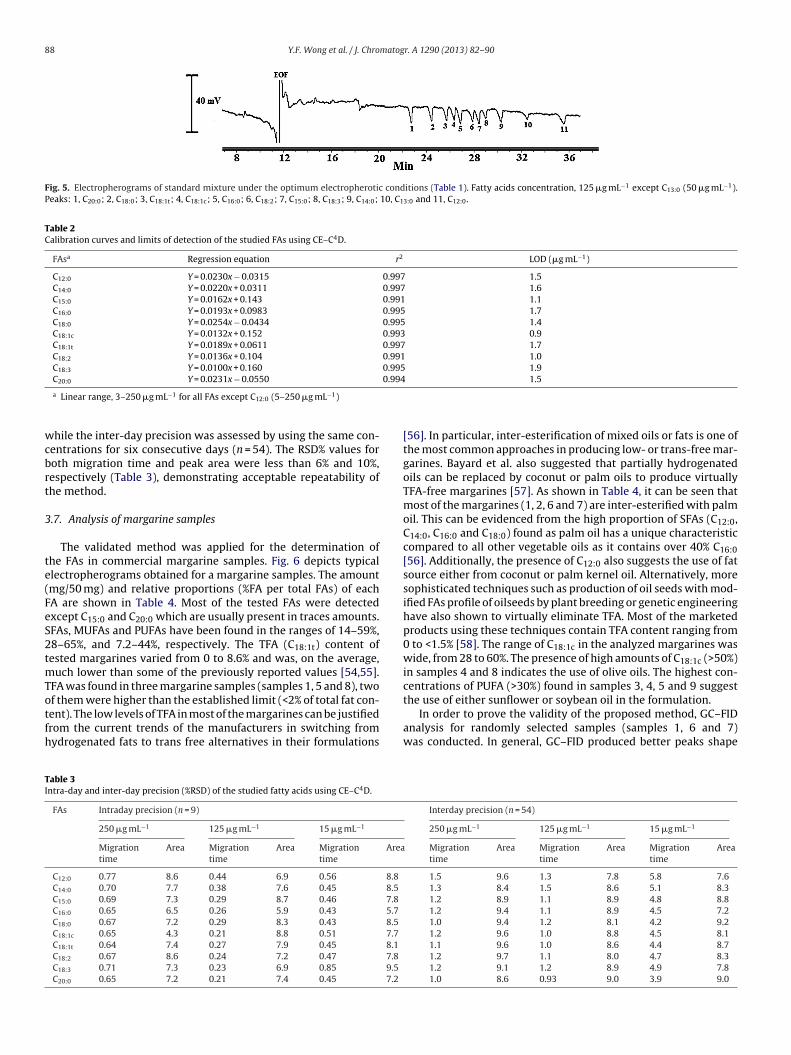
The optimum conditions are summarized in Table 1 whileig. 5 shows typical electropherogram of the standard FAs oper-
ted under the optimum conditions. It is clear that the selectedlectrophoretic conditions provide a good separation of all the FAs.0
50
100
150
200
500 600 700 800 900 1000 1100
Are
a
Frequency (kHz)
C20:0
C18:0
C18:1c
C18:1t
C16:0
C18:2
C15:0
C18:3
C14:0
C13:0
C12:0
Fig. 4. Effect of excitation frequency (kHz) on peak area.
20:0 18:0 18:1t 18:1c 16:0 18:2
pt C20:0 (50 �g mL−1).
3.6. Validation of analytical method
3.6.1. LinearityThe linearity of the calibration plots was studied using standard
mixtures of C12:0, C14:0, C15:0, C16:0, C18:0, C18:1c, C18:1t, C18:2, C18:3and C20:0 at nine concentration levels (3, 5, 10, 15, 25, 50, 100, 200and 250 �g mL−1), with C13:0 (50 �g mL−1) as internal standard.Calibration curve was constructed by plotting the relative peak area(y) as a function of analyte concentration (x) in �g mL−1. Good lin-earity was observed over the range studied (Table 2). Correlationcoefficients of at least 0.99 were observed, indicating the excellentlinearity over the concentration range studied.
3.6.2. Limits of detectionThe limits of detection (LOD), with signal-to-noise ratio of 3
for the FAs are shown in Table 2. The CE–C4D method exhibitedlower LOD values for the ten FAs (0.9–1.9 �g mL−1) compared tothe reported methods using HPLC–ELSD (0.4–11 �g mL−1), CE–C4D(11–14 �g mL−1) and CE–indirect UV (4.6–5.7 �g mL−1) and higherthan the reported methods using GC–FID (0.7–0.8 �g mL−1)and HPLC–C4D (0.1–0.6 �g mL−1) [47,48,52,53]. The low LOD isattributed to the low baseline noise of the detector from the BGEused and the optimized C4D parameters.
3.6.3. PrecisionIntra-day precision was assessed by introducing three different
preparations of the standard mixture of the FAs at three concen-tration levels (15, 125 and 250 �g mL−1) on the same day (n = 9),
Table 1Adopted CE–C4D operating conditions.
Background electrolyte 6 mM M�CD and 8 mM TM�CD preparedin a mixture of 5 mM Na2HPO4/KH2PO4
(pH 7.4):ACN:MeOH:n-octanol(3:4:2.5:0.5, v/v/v/v)
Applied voltage 30 kV (normal polarity)Injection Time 1 s hydrodynamically (50 mbar)Capillary temperature 20 ◦CBare fused silica capillary 80.5 cm × 75 �m i.d (detection length,
10.5 cm from the outlet end of thecapillary)
C4D detector configuration Amplitude of 100 V and frequency of1000 kHz
88 Y.F. Wong et al. / J. Chromatogr. A 1290 (2013) 82– 90
Fig. 5. Electropherograms of standard mixture under the optimum electropherotic conditions (Table 1). Fatty acids concentration, 125 �g mL−1 except C13:0 (50 �g mL−1).Peaks: 1, C20:0; 2, C18:0; 3, C18:1t; 4, C18:1c; 5, C16:0; 6, C18:2; 7, C15:0; 8, C18:3; 9, C14:0; 10, C13:0 and 11, C12:0.
Table 2Calibration curves and limits of detection of the studied FAs using CE–C4D.
FAsa Regression equation r2 LOD (�g mL−1)
C12:0 Y = 0.0230x − 0.0315 0.997 1.5C14:0 Y = 0.0220x + 0.0311 0.997 1.6C15:0 Y = 0.0162x + 0.143 0.991 1.1C16:0 Y = 0.0193x + 0.0983 0.995 1.7C18:0 Y = 0.0254x − 0.0434 0.995 1.4C18:1c Y = 0.0132x + 0.152 0.993 0.9C18:1t Y = 0.0189x + 0.0611 0.997 1.7C18:2 Y = 0.0136x + 0.104 0.991 1.0C18:3 Y = 0.0100x + 0.160 0.995 1.9
0.994
wcbrt
3
te(FeS2tmTotfh
TI
C20:0 Y = 0.0231x − 0.0550
a Linear range, 3–250 �g mL−1 for all FAs except C12:0 (5–250 �g mL−1)
hile the inter-day precision was assessed by using the same con-entrations for six consecutive days (n = 54). The RSD% values foroth migration time and peak area were less than 6% and 10%,espectively (Table 3), demonstrating acceptable repeatability ofhe method.
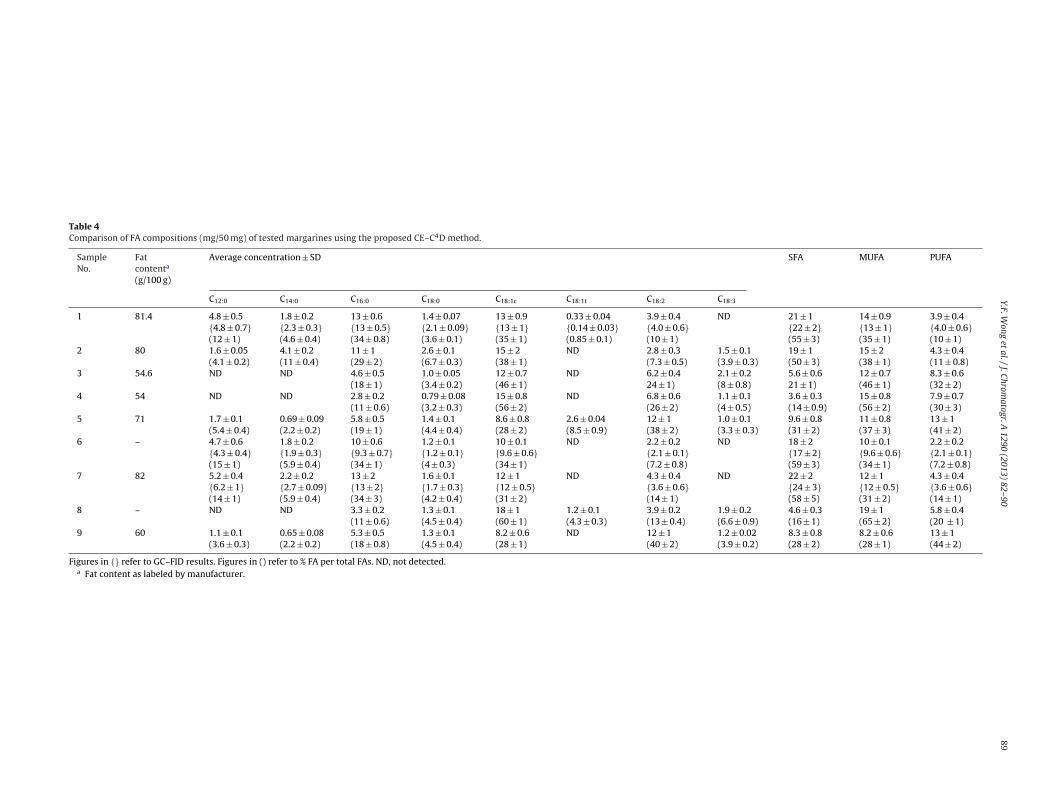
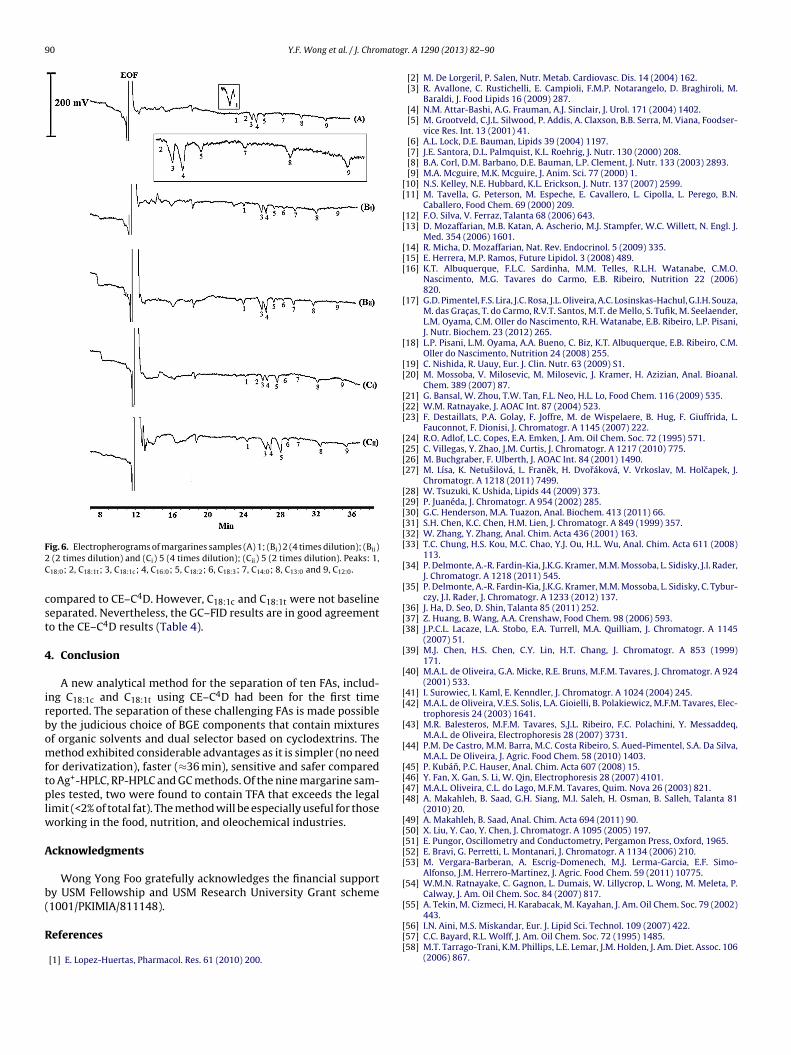
.7. Analysis of margarine samples
The validated method was applied for the determination ofhe FAs in commercial margarine samples. Fig. 6 depicts typicallectropherograms obtained for a margarine samples. The amountmg/50 mg) and relative proportions (%FA per total FAs) of eachA are shown in Table 4. Most of the tested FAs were detectedxcept C15:0 and C20:0 which are usually present in traces amounts.FAs, MUFAs and PUFAs have been found in the ranges of 14–59%,8–65%, and 7.2–44%, respectively. The TFA (C18:1t) content ofested margarines varied from 0 to 8.6% and was, on the average,
uch lower than some of the previously reported values [54,55].FA was found in three margarine samples (samples 1, 5 and 8), two
f them were higher than the established limit (<2% of total fat con-ent). The low levels of TFA in most of the margarines can be justifiedrom the current trends of the manufacturers in switching fromydrogenated fats to trans free alternatives in their formulationsable 3ntra-day and inter-day precision (%RSD) of the studied fatty acids using CE–C4D.
FAs Intraday precision (n = 9)
250 �g mL−1 125 �g mL−1 15 �g mL−1
Migrationtime
Area Migrationtime
Area Migrationtime
Area
C12:0 0.77 8.6 0.44 6.9 0.56 8.8
C14:0 0.70 7.7 0.38 7.6 0.45 8.5
C15:0 0.69 7.3 0.29 8.7 0.46 7.8
C16:0 0.65 6.5 0.26 5.9 0.43 5.7
C18:0 0.67 7.2 0.29 8.3 0.43 8.5
C18:1c 0.65 4.3 0.21 8.8 0.51 7.7
C18:1t 0.64 7.4 0.27 7.9 0.45 8.1
C18:2 0.67 8.6 0.24 7.2 0.47 7.8
C18:3 0.71 7.3 0.23 6.9 0.85 9.5
C20:0 0.65 7.2 0.21 7.4 0.45 7.2
1.5
[56]. In particular, inter-esterification of mixed oils or fats is one ofthe most common approaches in producing low- or trans-free mar-garines. Bayard et al. also suggested that partially hydrogenatedoils can be replaced by coconut or palm oils to produce virtuallyTFA-free margarines [57]. As shown in Table 4, it can be seen thatmost of the margarines (1, 2, 6 and 7) are inter-esterified with palmoil. This can be evidenced from the high proportion of SFAs (C12:0,C14:0, C16:0 and C18:0) found as palm oil has a unique characteristiccompared to all other vegetable oils as it contains over 40% C16:0[56]. Additionally, the presence of C12:0 also suggests the use of fatsource either from coconut or palm kernel oil. Alternatively, moresophisticated techniques such as production of oil seeds with mod-ified FAs profile of oilseeds by plant breeding or genetic engineeringhave also shown to virtually eliminate TFA. Most of the marketedproducts using these techniques contain TFA content ranging from0 to <1.5% [58]. The range of C18:1c in the analyzed margarines waswide, from 28 to 60%. The presence of high amounts of C18:1c (>50%)in samples 4 and 8 indicates the use of olive oils. The highest con-centrations of PUFA (>30%) found in samples 3, 4, 5 and 9 suggest
the use of either sunflower or soybean oil in the formulation.In order to prove the validity of the proposed method, GC–FIDanalysis for randomly selected samples (samples 1, 6 and 7)was conducted. In general, GC–FID produced better peaks shape
Interday precision (n = 54)
250 �g mL−1 125 �g mL−1 15 �g mL−1
Migrationtime
Area Migrationtime
Area Migrationtime
Area
1.5 9.6 1.3 7.8 5.8 7.61.3 8.4 1.5 8.6 5.1 8.31.2 8.9 1.1 8.9 4.8 8.81.2 9.4 1.1 8.9 4.5 7.21.0 9.4 1.2 8.1 4.2 9.21.2 9.6 1.0 8.8 4.5 8.11.1 9.6 1.0 8.6 4.4 8.71.2 9.7 1.1 8.0 4.7 8.31.2 9.1 1.2 8.9 4.9 7.81.0 8.6 0.93 9.0 3.9 9.0
Y.F. W
ong et
al. /
J. Chrom
atogr. A
1290 (2013) 82– 9089
Table 4Comparison of FA compositions (mg/50 mg) of tested margarines using the proposed CE–C4D method.
SampleNo.
Fatcontenta
(g/100 g)
Average concentration ± SD SFA MUFA PUFA
C12:0 C14:0 C16:0 C18:0 C18:1c C18:1t C18:2 C18:3
1 81.4 4.8 ± 0.5{4.8 ± 0.7}(12 ± 1)
1.8 ± 0.2{2.3 ± 0.3}(4.6 ± 0.4)
13 ± 0.6{13 ± 0.5}(34 ± 0.8)
1.4 ± 0.07{2.1 ± 0.09}(3.6 ± 0.1)
13 ± 0.9{13 ± 1}(35 ± 1)
0.33 ± 0.04{0.14 ± 0.03}(0.85 ± 0.1)
3.9 ± 0.4{4.0 ± 0.6}(10 ± 1)
ND 21 ± 1{22 ± 2}(55 ± 3)
14 ± 0.9{13 ± 1}(35 ± 1)
3.9 ± 0.4{4.0 ± 0.6}(10 ± 1)
2 80 1.6 ± 0.05(4.1 ± 0.2)
4.1 ± 0.2(11 ± 0.4)
11 ± 1(29 ± 2)
2.6 ± 0.1(6.7 ± 0.3)
15 ± 2(38 ± 1)
ND 2.8 ± 0.3(7.3 ± 0.5)
1.5 ± 0.1(3.9 ± 0.3)
19 ± 1(50 ± 3)
15 ± 2(38 ± 1)
4.3 ± 0.4(11 ± 0.8)
3 54.6 ND ND 4.6 ± 0.5(18 ± 1)
1.0 ± 0.05(3.4 ± 0.2)
12 ± 0.7(46 ± 1)
ND 6.2 ± 0.424 ± 1)
2.1 ± 0.2(8 ± 0.8)
5.6 ± 0.621 ± 1)
12 ± 0.7(46 ± 1)
8.3 ± 0.6(32 ± 2)
4 54 ND ND 2.8 ± 0.2(11 ± 0.6)
0.79 ± 0.08(3.2 ± 0.3)
15 ± 0.8(56 ± 2)
ND 6.8 ± 0.6(26 ± 2)
1.1 ± 0.1(4 ± 0.5)
3.6 ± 0.3(14 ± 0.9)
15 ± 0.8(56 ± 2)
7.9 ± 0.7(30 ± 3)
5 71 1.7 ± 0.1(5.4 ± 0.4)
0.69 ± 0.09(2.2 ± 0.2)
5.8 ± 0.5(19 ± 1)
1.4 ± 0.1(4.4 ± 0.4)
8.6 ± 0.8(28 ± 2)
2.6 ± 0.04(8.5 ± 0.9)
12 ± 1(38 ± 2)
1.0 ± 0.1(3.3 ± 0.3)
9.6 ± 0.8(31 ± 2)
11 ± 0.8(37 ± 3)
13 ± 1(41 ± 2)
6 – 4.7 ± 0.6{4.3 ± 0.4}(15 ± 1)
1.8 ± 0.2{1.9 ± 0.3}(5.9 ± 0.4)
10 ± 0.6{9.3 ± 0.7}(34 ± 1)
1.2 ± 0.1{1.2 ± 0.1}(4 ± 0.3)
10 ± 0.1{9.6 ± 0.6}(34 ± 1)
ND 2.2 ± 0.2{2.1 ± 0.1}(7.2 ± 0.8)
ND 18 ± 2{17 ± 2}(59 ± 3)
10 ± 0.1{9.6 ± 0.6}(34 ± 1)
2.2 ± 0.2{2.1 ± 0.1}(7.2 ± 0.8)
7 82 5.2 ± 0.4{6.2 ± 1}(14 ± 1)
2.2 ± 0.2{2.7 ± 0.09}(5.9 ± 0.4)
13 ± 2{13 ± 2}(34 ± 3)
1.6 ± 0.1{1.7 ± 0.3}(4.2 ± 0.4)
12 ± 1{12 ± 0.5}(31 ± 2)
ND 4.3 ± 0.4{3.6 ± 0.6}(14 ± 1)
ND 22 ± 2{24 ± 3}(58 ± 5)
12 ± 1{12 ± 0.5}(31 ± 2)
4.3 ± 0.4{3.6 ± 0.6}(14 ± 1)
8 – ND ND 3.3 ± 0.2(11 ± 0.6)
1.3 ± 0.1(4.5 ± 0.4)
18 ± 1(60 ± 1)
1.2 ± 0.1(4.3 ± 0.3)
3.9 ± 0.2(13 ± 0.4)
1.9 ± 0.2(6.6 ± 0.9)
4.6 ± 0.3(16 ± 1)
19 ± 1(65 ± 2)
5.8 ± 0.4(20 ± 1)
9 60 1.1 ± 0.1(3.6 ± 0.3)
0.65 ± 0.08(2.2 ± 0.2)
5.3 ± 0.5(18 ± 0.8)
1.3 ± 0.1(4.5 ± 0.4)
8.2 ± 0.6(28 ± 1)
ND 12 ± 1(40 ± 2)
1.2 ± 0.02(3.9 ± 0.2)
8.3 ± 0.8(28 ± 2)
8.2 ± 0.6(28 ± 1)
13 ± 1(44 ± 2)
Figures in {} refer to GC–FID results. Figures in () refer to % FA per total FAs. ND, not detected.a Fat content as labeled by manufacturer.
90 Y.F. Wong et al. / J. Chromatog
F2C
cst
4
irbomftplw
A
b(
R
[[
[[
[[[
[
[
[[
[[[
[[[[
[[[[[[
[
[
[[[
[
[
[[
[
[
[[[[
[[[[[
[
[
ig. 6. Electropherograms of margarines samples (A) 1; (Bi) 2 (4 times dilution); (Bii) (2 times dilution) and (Ci) 5 (4 times dilution); (Cii) 5 (2 times dilution). Peaks: 1,18:0; 2, C18:1t; 3, C18:1c; 4, C16:0; 5, C18:2; 6, C18:3; 7, C14:0; 8, C13:0 and 9, C12:0.
ompared to CE–C4D. However, C18:1c and C18:1t were not baselineeparated. Nevertheless, the GC–FID results are in good agreemento the CE–C4D results (Table 4).
. Conclusion
A new analytical method for the separation of ten FAs, includ-ng C18:1c and C18:1t using CE–C4D had been for the first timeeported. The separation of these challenging FAs is made possibley the judicious choice of BGE components that contain mixturesf organic solvents and dual selector based on cyclodextrins. Theethod exhibited considerable advantages as it is simpler (no need
or derivatization), faster (≈36 min), sensitive and safer comparedo Ag+-HPLC, RP-HPLC and GC methods. Of the nine margarine sam-les tested, two were found to contain TFA that exceeds the legal
imit (<2% of total fat). The method will be especially useful for thoseorking in the food, nutrition, and oleochemical industries.
cknowledgments
Wong Yong Foo gratefully acknowledges the financial supporty USM Fellowship and USM Research University Grant scheme1001/PKIMIA/811148).
eferences
[1] E. Lopez-Huertas, Pharmacol. Res. 61 (2010) 200.
[[[
r. A 1290 (2013) 82– 90
[2] M. De Lorgeril, P. Salen, Nutr. Metab. Cardiovasc. Dis. 14 (2004) 162.[3] R. Avallone, C. Rustichelli, E. Campioli, F.M.P. Notarangelo, D. Braghiroli, M.
Baraldi, J. Food Lipids 16 (2009) 287.[4] N.M. Attar-Bashi, A.G. Frauman, A.J. Sinclair, J. Urol. 171 (2004) 1402.[5] M. Grootveld, C.J.L. Silwood, P. Addis, A. Claxson, B.B. Serra, M. Viana, Foodser-
vice Res. Int. 13 (2001) 41.[6] A.L. Lock, D.E. Bauman, Lipids 39 (2004) 1197.[7] J.E. Santora, D.L. Palmquist, K.L. Roehrig, J. Nutr. 130 (2000) 208.[8] B.A. Corl, D.M. Barbano, D.E. Bauman, L.P. Clement, J. Nutr. 133 (2003) 2893.[9] M.A. Mcguire, M.K. Mcguire, J. Anim. Sci. 77 (2000) 1.10] N.S. Kelley, N.E. Hubbard, K.L. Erickson, J. Nutr. 137 (2007) 2599.11] M. Tavella, G. Peterson, M. Espeche, E. Cavallero, L. Cipolla, L. Perego, B.N.
Caballero, Food Chem. 69 (2000) 209.12] F.O. Silva, V. Ferraz, Talanta 68 (2006) 643.13] D. Mozaffarian, M.B. Katan, A. Ascherio, M.J. Stampfer, W.C. Willett, N. Engl. J.
Med. 354 (2006) 1601.14] R. Micha, D. Mozaffarian, Nat. Rev. Endocrinol. 5 (2009) 335.15] E. Herrera, M.P. Ramos, Future Lipidol. 3 (2008) 489.16] K.T. Albuquerque, F.L.C. Sardinha, M.M. Telles, R.L.H. Watanabe, C.M.O.
Nascimento, M.G. Tavares do Carmo, E.B. Ribeiro, Nutrition 22 (2006)820.
17] G.D. Pimentel, F.S. Lira, J.C. Rosa, J.L. Oliveira, A.C. Losinskas-Hachul, G.I.H. Souza,M. das Grac as, T. do Carmo, R.V.T. Santos, M.T. de Mello, S. Tufik, M. Seelaender,L.M. Oyama, C.M. Oller do Nascimento, R.H. Watanabe, E.B. Ribeiro, L.P. Pisani,J. Nutr. Biochem. 23 (2012) 265.
18] L.P. Pisani, L.M. Oyama, A.A. Bueno, C. Biz, K.T. Albuquerque, E.B. Ribeiro, C.M.Oller do Nascimento, Nutrition 24 (2008) 255.
19] C. Nishida, R. Uauy, Eur. J. Clin. Nutr. 63 (2009) S1.20] M. Mossoba, V. Milosevic, M. Milosevic, J. Kramer, H. Azizian, Anal. Bioanal.
Chem. 389 (2007) 87.21] G. Bansal, W. Zhou, T.W. Tan, F.L. Neo, H.L. Lo, Food Chem. 116 (2009) 535.22] W.M. Ratnayake, J. AOAC Int. 87 (2004) 523.23] F. Destaillats, P.A. Golay, F. Joffre, M. de Wispelaere, B. Hug, F. Giuffrida, L.
Fauconnot, F. Dionisi, J. Chromatogr. A 1145 (2007) 222.24] R.O. Adlof, L.C. Copes, E.A. Emken, J. Am. Oil Chem. Soc. 72 (1995) 571.25] C. Villegas, Y. Zhao, J.M. Curtis, J. Chromatogr. A 1217 (2010) 775.26] M. Buchgraber, F. Ulberth, J. AOAC Int. 84 (2001) 1490.27] M. Lísa, K. Netusilová, L. Franek, H. Dvoráková, V. Vrkoslav, M. Holcapek, J.
Chromatogr. A 1218 (2011) 7499.28] W. Tsuzuki, K. Ushida, Lipids 44 (2009) 373.29] P. Juanéda, J. Chromatogr. A 954 (2002) 285.30] G.C. Henderson, M.A. Tuazon, Anal. Biochem. 413 (2011) 66.31] S.H. Chen, K.C. Chen, H.M. Lien, J. Chromatogr. A 849 (1999) 357.32] W. Zhang, Y. Zhang, Anal. Chim. Acta 436 (2001) 163.33] T.C. Chung, H.S. Kou, M.C. Chao, Y.J. Ou, H.L. Wu, Anal. Chim. Acta 611 (2008)
113.34] P. Delmonte, A.-R. Fardin-Kia, J.K.G. Kramer, M.M. Mossoba, L. Sidisky, J.I. Rader,
J. Chromatogr. A 1218 (2011) 545.35] P. Delmonte, A.-R. Fardin-Kia, J.K.G. Kramer, M.M. Mossoba, L. Sidisky, C. Tybur-
czy, J.I. Rader, J. Chromatogr. A 1233 (2012) 137.36] J. Ha, D. Seo, D. Shin, Talanta 85 (2011) 252.37] Z. Huang, B. Wang, A.A. Crenshaw, Food Chem. 98 (2006) 593.38] J.P.C.L. Lacaze, L.A. Stobo, E.A. Turrell, M.A. Quilliam, J. Chromatogr. A 1145
(2007) 51.39] M.J. Chen, H.S. Chen, C.Y. Lin, H.T. Chang, J. Chromatogr. A 853 (1999)
171.40] M.A.L. de Oliveira, G.A. Micke, R.E. Bruns, M.F.M. Tavares, J. Chromatogr. A 924
(2001) 533.41] I. Surowiec, I. Kaml, E. Kenndler, J. Chromatogr. A 1024 (2004) 245.42] M.A.L. de Oliveira, V.E.S. Solis, L.A. Gioielli, B. Polakiewicz, M.F.M. Tavares, Elec-
trophoresis 24 (2003) 1641.43] M.R. Balesteros, M.F.M. Tavares, S.J.L. Ribeiro, F.C. Polachini, Y. Messaddeq,
M.A.L. de Oliveira, Electrophoresis 28 (2007) 3731.44] P.M. De Castro, M.M. Barra, M.C. Costa Ribeiro, S. Aued-Pimentel, S.A. Da Silva,
M.A.L. De Oliveira, J. Agric. Food Chem. 58 (2010) 1403.45] P. Kubán, P.C. Hauser, Anal. Chim. Acta 607 (2008) 15.46] Y. Fan, X. Gan, S. Li, W. Qin, Electrophoresis 28 (2007) 4101.47] M.A.L. Oliveira, C.L. do Lago, M.F.M. Tavares, Quim. Nova 26 (2003) 821.48] A. Makahleh, B. Saad, G.H. Siang, M.I. Saleh, H. Osman, B. Salleh, Talanta 81
(2010) 20.49] A. Makahleh, B. Saad, Anal. Chim. Acta 694 (2011) 90.50] X. Liu, Y. Cao, Y. Chen, J. Chromatogr. A 1095 (2005) 197.51] E. Pungor, Oscillometry and Conductometry, Pergamon Press, Oxford, 1965.52] E. Bravi, G. Perretti, L. Montanari, J. Chromatogr. A 1134 (2006) 210.53] M. Vergara-Barberan, A. Escrig-Domenech, M.J. Lerma-Garcia, E.F. Simo-
Alfonso, J.M. Herrero-Martinez, J. Agric. Food Chem. 59 (2011) 10775.54] W.M.N. Ratnayake, C. Gagnon, L. Dumais, W. Lillycrop, L. Wong, M. Meleta, P.
Calway, J. Am. Oil Chem. Soc. 84 (2007) 817.55] A. Tekin, M. Cizmeci, H. Karabacak, M. Kayahan, J. Am. Oil Chem. Soc. 79 (2002)
443.56] I.N. Aini, M.S. Miskandar, Eur. J. Lipid Sci. Technol. 109 (2007) 422.57] C.C. Bayard, R.L. Wolff, J. Am. Oil Chem. Soc. 72 (1995) 1485.58] M.T. Tarrago-Trani, K.M. Phillips, L.E. Lemar, J.M. Holden, J. Am. Diet. Assoc. 106
(2006) 867.