Free-flow electrophoresis for purification of plant mitochondria by surface charge
12
TECHNICAL ADVANCE Free-flow electrophoresis for purification of plant mitochondria by surface charge Holger Eubel 1 , Chun Pong Lee 1,2 , John Kuo 3 , Etienne H. Meyer 1 , Nicolas L. Taylor 1 and A. Harvey Millar 1,* 1 ARC Centre of Excellence in Plant Energy Biology, The University of Western Australia, 35 Stirling Highway, M316, Crawley, WA 6009, Australia, 2 School of Biomedical, Biomolecular and Chemical Sciences, The University of Western Australia, Stirling Highway, M310, Crawley, WA 6009, Australia, and 3 Centre for Microscopy, Characterisation & Analysis, The University of Western Australia, 35 Stirling Highway, M010, Crawley, WA 6009, Australia Received 1 February 2007; revised 2 July 2007; accepted 4 July 2007. * For correspondence (fax +61 8 6488 4401; e-mail [email protected]). Summary Sample purity is the key for a successful in-depth analysis of any given subcellular proteome. The suitability of free-flow electrophoresis to assist conventional, centrifugation-based techniques in the preparation of plant mitochondria from green and non-green tissue was assessed by various means, including functional assays, immunoblots, electron microscopy and differential gel electrophoresis. Results indicated a significant increase in purity of the mitochondrial samples, highlighted specific contaminants previously reported as mitochondrial proteins, and also pointed to new means for separating plastids and peroxisomes from mitochondria in plant organellar extracts by exploiting differences in surface charge. This approach has the potential to allow a deeper and more comprehensive investigation of the Arabidopsis organellar proteomes, by providing a second dimension of separation based on surface charge in addition to conventional centrifugation purification protocols relying on size and density. Keywords: plant mitochondria, proteomics, sample purity, organellar contamination, free-flow electrophoresis, centrifugation. Introduction The purification of a subcellular organelle to the highest possible level is desirable for many experiments. Subcellu- lar proteomics is particularly dependant on the purity of the starting material. As a result of advances in mass spec- trometry, coverage of low-abundance proteins in samples is increasing and often leads to the discovery of impurities in organellar fractions. One solution has been to compare less enriched fractions of a certain compartment with more enriched ones, and to measure the increase or decrease in the abundance of a protein to use it as an indicator for its intracellular localization (Dunkley et al., 2004, 2006; Nelson et al., 2006). Although this provides an elegant way to ana- lyze those compartments that cannot be purified to a high degree for technical reasons, the depth in the analysis appears to suffer. Therefore, if feasible, the purification of a cellular compartment to the highest possible degree is pre- ferred over a differential approach, but the combination of both is likely to be most beneficial. Plant mitochondria have been analyzed frequently by standard proteomic techniques (Bardel et al., 2002; Heazlewood et al., 2003, 2004; Kruft et al., 2001; Millar et al., 2001). But as the number of proteins identified so far in these organelles is significantly lower than expected, from analysis of the Arabidopsis nuclear genome by targeted prediction programs (summarized in Heazlewood et al., 2005), many more proteins probably remain experimentally unidentified. Additionally, according to the compilation of data in the SubCellular Proteomic Database for Arabidopsis (SUBA: http://www.suba.bcs.uwa.edu.au) (Heazlewood et al., 2007), some proteins assigned to mitochondria by these studies ª 2007 The Authors 583 Journal compilation ª 2007 Blackwell Publishing Ltd The Plant Journal (2007) 52, 583–594 doi: 10.1111/j.1365-313X.2007.03253.x
Transcript of Free-flow electrophoresis for purification of plant mitochondria by surface charge
TECHNICAL ADVANCE
Free-flow electrophoresis for purification of plantmitochondria by surface charge
Holger Eubel1, Chun Pong Lee1,2, John Kuo3, Etienne H. Meyer1, Nicolas L. Taylor1 and A. Harvey Millar1,*
1ARC Centre of Excellence in Plant Energy Biology, The University of Western Australia, 35 Stirling Highway, M316,
Crawley, WA 6009, Australia,2School of Biomedical, Biomolecular and Chemical Sciences, The University of Western Australia, Stirling Highway,
M310, Crawley, WA 6009, Australia, and3Centre for Microscopy, Characterisation & Analysis, The University of Western Australia, 35 Stirling Highway, M010,
Crawley, WA 6009, Australia
Received 1 February 2007; revised 2 July 2007; accepted 4 July 2007.*For correspondence (fax +61 8 6488 4401; e-mail [email protected]).
Summary
Sample purity is the key for a successful in-depth analysis of any given subcellular proteome. The suitability of
free-flow electrophoresis to assist conventional, centrifugation-based techniques in the preparation of plant
mitochondria from green and non-green tissue was assessed by various means, including functional assays,
immunoblots, electron microscopy and differential gel electrophoresis. Results indicated a significant increase
in purity of the mitochondrial samples, highlighted specific contaminants previously reported as mitochondrial
proteins, and also pointed to new means for separating plastids and peroxisomes from mitochondria in plant
organellar extracts by exploiting differences in surface charge. This approach has the potential to allow a
deeper and more comprehensive investigation of the Arabidopsis organellar proteomes, by providing a second
dimension of separation based on surface charge in addition to conventional centrifugation purification
protocols relying on size and density.
Keywords: plant mitochondria, proteomics, sample purity, organellar contamination, free-flow electrophoresis,
centrifugation.
Introduction
The purification of a subcellular organelle to the highest
possible level is desirable for many experiments. Subcellu-
lar proteomics is particularly dependant on the purity of the
starting material. As a result of advances in mass spec-
trometry, coverage of low-abundance proteins in samples is
increasing and often leads to the discovery of impurities in
organellar fractions. One solution has been to compare less
enriched fractions of a certain compartment with more
enriched ones, and to measure the increase or decrease in
the abundance of a protein to use it as an indicator for its
intracellular localization (Dunkley et al., 2004, 2006; Nelson
et al., 2006). Although this provides an elegant way to ana-
lyze those compartments that cannot be purified to a high
degree for technical reasons, the depth in the analysis
appears to suffer. Therefore, if feasible, the purification of a
cellular compartment to the highest possible degree is pre-
ferred over a differential approach, but the combination of
both is likely to be most beneficial.
Plant mitochondria have been analyzed frequently
by standard proteomic techniques (Bardel et al., 2002;
Heazlewood et al., 2003, 2004; Kruft et al., 2001; Millar et al.,
2001). But as the number of proteins identified so far in these
organelles is significantly lower than expected, from analysis
of the Arabidopsis nuclear genome by targeted prediction
programs (summarized in Heazlewood et al., 2005), many
more proteins probably remain experimentally unidentified.
Additionally, according to the compilation of data in the
SubCellular Proteomic Database for Arabidopsis (SUBA:
http://www.suba.bcs.uwa.edu.au) (Heazlewood et al., 2007),
some proteins assigned to mitochondria by these studies
ª 2007 The Authors 583Journal compilation ª 2007 Blackwell Publishing Ltd
The Plant Journal (2007) 52, 583–594 doi: 10.1111/j.1365-313X.2007.03253.x
are also claimed in other cell organelles by means of mass
spectrometry and GFP analysis. These proteins may repre-
sent organellar contaminations or proteins targeted to more
than one organelle.
Differential and isopycnic centrifugation using sucrose or
Percoll gradients to separate organelles on the basis of size
and density have been traditionally used in isolation of
mitochondria from plant tissues (Day et al., 1985; Leaver
et al., 1983; Neuburger et al., 1982). These approaches have
also been used in the preparation of mitochondria for
proteomic analysis (Bardel et al., 2002; Heazlewood et al.,
2004; Kruft et al., 2001; Millar et al., 2001). Unfortunately,
based on these parameters, biological variation will always
lead to a degree of overlap between different organelles or
compartments. Free-flow electrophoresis in zone electro-
phoresis mode (ZE-FFE) does not rely on size or density, but
provides separation electrophoretically by using differences
in the surface charge of the organelles. ZE-FFE has success-
fully been employed to purify different cell populations of
the immune system (Baier et al., 1988; Hansen and Hannig,
1982; Hansen et al., 1989; Heidrich and Hannig, 1989), as well
as subcellular particles like endosomes, lysosomes, peroxi-
somes and endoplasmic reticulum (ER) vesicles (Marsh,
1989; Morre et al., 1989; Schmid et al., 1988; Volkl et al.,
1997). To our knowledge, ZE-FFE has been reported once on
plant material for the production of highly purified vesicles
of the Arabidopsis plasma membrane and the tonoplast
(Bardy et al., 1998). Recently, ZE-FFE has been used to purify
yeast mitochondria to an increased homogeneity (Zischka
et al., 2003, 2006). The presence of plastids in plants adds
an additional challenge for any mitochondrial purification
technique, as plastids are known to be the major source of
contamination for mitochondria isolated from photosyn-
thetic material. Here, we present a study employing ZE-FFE
for the purification of plant mitochondria from green
and non-green material, and demonstrate the value of
this approach by identifying impurities in mitochondrial
preparations.
Results and discussion
Visual analysis of the organelle separation
process during FFE
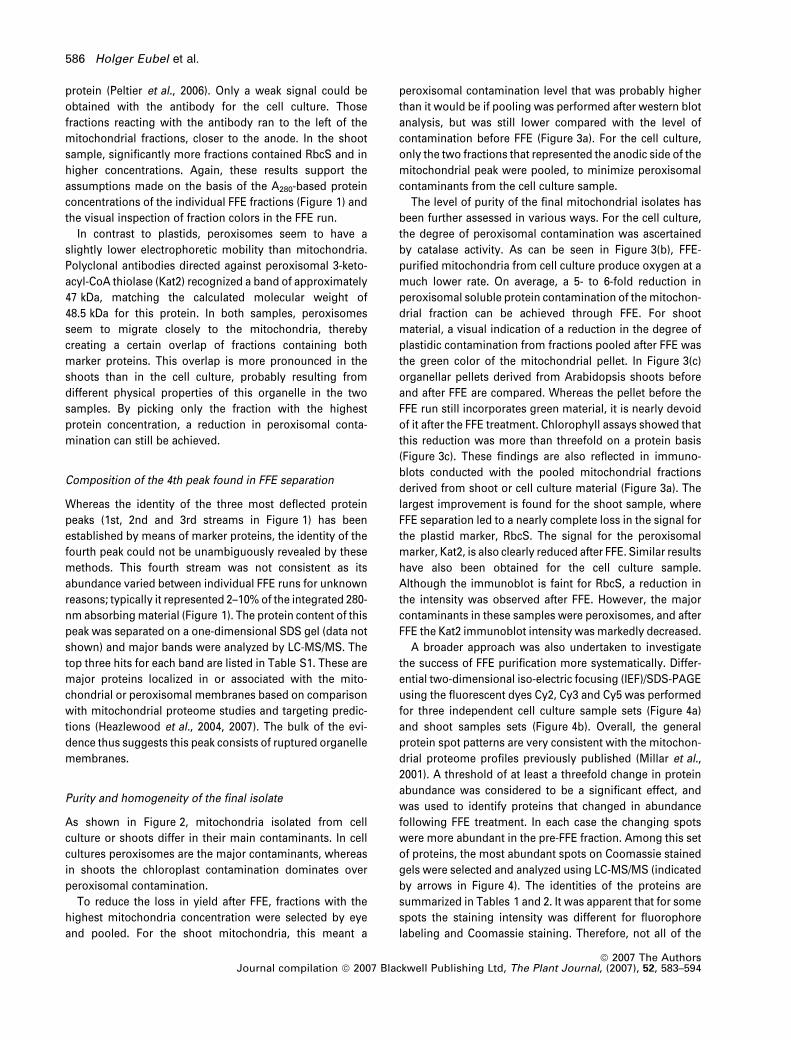
The starting material for FFE separations consisted of an
enriched mitochondrial fraction, produced by differential
centrifugation and Percoll density gradient centrifugation,
from either dark-grown Arabidopsis cell culture or light-
grown Arabidopsis shoots from hydroponic cultures.
Washed and Percoll-free organelles were then injected into
the separation chamber of the instrument, which features
a Perspex top cover. This allowed the observation of the
separation process of the light-scattering, translucent
organelles. At the front end of the chamber, in close
proximity to the cathode stabilization medium, the sample
was injected into the separation chamber (Figure 1, lower
panels). It was taken up by a stream of separation medium
and transported towards the rear end of the chamber. As
soon as the sample entered the zone of the electric field it
became deflected towards the anode. The formerly
homogenous sample stream spread out in a fan-shaped
manner. Usually, two main streams were observed, a
green one to the left and a white/yellow one to the right.
Most probably, the green stream represented the plastid
fraction of the sample (1st streams in Figure 1), whereas
the white/yellow stream represented the bulk of the
(a) (b) Figure 1. Separation of pre-purified mitochon-
drial fractions from Arabidopsis cell cultures (a)
and shoot hydroponic cultures (b) by free-flow
electrophoresis (FFE) (lower panels) into 96-well
plates. The absorbance at a wavelength of
280 nm was measured (upper panels). Arrows
and protein peaks 1–4 represent the four most
abundant and reproducible organelle popula-
tions. SI, sample inlet; ), cathode of the separa-
tion chamber; +, anode of the separation
chamber. Arrows at the bottom represent the
seven media inlets to the separation chamber;
arrows on top represent the 96 outlets of the
fraction collection device. The zones of the
electric fields in the lower panels are colored in
grey.
584 Holger Eubel et al.
ª 2007 The AuthorsJournal compilation ª 2007 Blackwell Publishing Ltd, The Plant Journal, (2007), 52, 583–594

material and was formed by mitochondria (2nd streams in
Figure 1). Often minor streams of both colors can be
observed to the left, to the right and in-between the two
major streams. Each of these minor streams is sharply
focused, and we therefore suspect that they consist of
other organelles, defined associations of organelles or
distinct organelle subpopulations with different surface
charges. Analysis of the minor streams is difficult, because
the sharp resolution observed in the separation chamber is
not reflected by the protein-concentration in the wells of
the 96-well plates used to collect the fractions (Figure 1).
Here, broader distributions were observed that were partly
overlapping. Two minor streams are most often observed,
represented by the 3rd streams in Figure 1 running close
to mitochondria, and the 4th streams that were the least
deflected through the chamber and are usually not sharply
focused by FFE.
General distribution of proteins in FFE fraction
As can be seen in Figure 1 (upper panels), the bulk of the
protein (2nd streams) is deflected during electrophoresis
and is collected on the anionic side of the fraction that is
in-line with the sample injection point. Additional peaks
(from the 1st, 3rd and 4th streams) can be observed to the
left and the right of the major peak, spreading over an area of
40–50 fractions. Thus, assuming that the organelles are still
intact after electrophoresis, it can be concluded that the
cellular components of an enriched mitochondrial fraction
are actually separated during the FFE treatment. Because the
sample consists of an enriched mitochondrial fraction, the
major protein peaks (from 2nd streams) are expected to
represent the mitochondrial components of the samples.
The other peaks are thus suspected to be contaminating cell
components.
Some obvious differences exist between the samples
derived from the cell culture (Figure 1a) and shoot material
(Figure 1b). In shoots, fractions on the anodic side of the
major peak have considerably higher protein contents than
those of the cell culture. Although maintained in the light,
bulking up of the cell culture for the mitochondria prepara-
tion took place in the dark to reduce chloroplast contamina-
tion. Therefore, a major difference between the two samples
is likely to be the level of chloroplast material within the
cells. One can speculate that it is these organelles which are
responsible for the differences in protein concentration on
the anodic side of the main peak between the two samples.
The color of the collected FFE fractions supports this
hypothesis: green fractions are found closer to the anode
(representing the areas of the 1st streams) than those found
in the areas of the 2nd streams, which had a yellow/brown
color (data not shown). The size of peak 3 is another minor
difference between the two samples as it is pronounced in
the cell culture derived sample.
Distribution of marker proteins in FFE fractions
To further establish the distribution of organelles across the
FFE fractions, an aliquot of every second fraction was loaded
onto one-dimensional SDS gels to perform western blots.
Antibodies raised against protein markers for mitochondria,
plastids and peroxisomes were used to probe the blots
(Figure 2).
A monoclonal antibody against maize mitochondrial
HSP70 recognized a protein with a molecular weight of
about 75 kDa, which fits very well with the calculated
molecular weight for this protein (73 kDa). For the cell
culture as well as the shoots, mitochondrial HSP70 is present
in only those fractions containing the bulk of the protein
content, supporting the hypothesis that these fractions
comprise the mitochondrial portion of the sample.
Polyclonal antibodies recognizing the small subunit of
RubisCO (RbcS) detected a protein of 15–16 kDa, which is in
line with the observed molecular weight for the mature
Figure 2. One-dimensional SDS–PAGE and im-
munoblots of every second of the central 30
fractions collected after free-flow electrophoresis
(FFE). The gels were loaded on a volume basis to
monitor the distribution of three marker proteins
for mitochondria (mtHSP70), peroxisomes (3-
ketoacyl-CoA thiolase, Kat2) and plastids (small
subunit of RubisCO, RbcS).
Isolation of plant mitochondria by FFE 585
ª 2007 The AuthorsJournal compilation ª 2007 Blackwell Publishing Ltd, The Plant Journal, (2007), 52, 583–594
protein (Peltier et al., 2006). Only a weak signal could be
obtained with the antibody for the cell culture. Those
fractions reacting with the antibody ran to the left of the
mitochondrial fractions, closer to the anode. In the shoot
sample, significantly more fractions contained RbcS and in
higher concentrations. Again, these results support the
assumptions made on the basis of the A280-based protein
concentrations of the individual FFE fractions (Figure 1) and
the visual inspection of fraction colors in the FFE run.
In contrast to plastids, peroxisomes seem to have a
slightly lower electrophoretic mobility than mitochondria.
Polyclonal antibodies directed against peroxisomal 3-keto-
acyl-CoA thiolase (Kat2) recognized a band of approximately
47 kDa, matching the calculated molecular weight of
48.5 kDa for this protein. In both samples, peroxisomes
seem to migrate closely to the mitochondria, thereby
creating a certain overlap of fractions containing both
marker proteins. This overlap is more pronounced in the
shoots than in the cell culture, probably resulting from
different physical properties of this organelle in the two
samples. By picking only the fraction with the highest
protein concentration, a reduction in peroxisomal conta-
mination can still be achieved.
Composition of the 4th peak found in FFE separation
Whereas the identity of the three most deflected protein
peaks (1st, 2nd and 3rd streams in Figure 1) has been
established by means of marker proteins, the identity of the
fourth peak could not be unambiguously revealed by these
methods. This fourth stream was not consistent as its
abundance varied between individual FFE runs for unknown
reasons; typically it represented 2–10% of the integrated 280-
nm absorbing material (Figure 1). The protein content of this
peak was separated on a one-dimensional SDS gel (data not
shown) and major bands were analyzed by LC-MS/MS. The
top three hits for each band are listed in Table S1. These are
major proteins localized in or associated with the mito-
chondrial or peroxisomal membranes based on comparison
with mitochondrial proteome studies and targeting predic-
tions (Heazlewood et al., 2004, 2007). The bulk of the evi-
dence thus suggests this peak consists of ruptured organelle
membranes.
Purity and homogeneity of the final isolate
As shown in Figure 2, mitochondria isolated from cell
culture or shoots differ in their main contaminants. In cell
cultures peroxisomes are the major contaminants, whereas
in shoots the chloroplast contamination dominates over
peroxisomal contamination.
To reduce the loss in yield after FFE, fractions with the
highest mitochondria concentration were selected by eye
and pooled. For the shoot mitochondria, this meant a
peroxisomal contamination level that was probably higher
than it would be if pooling was performed after western blot
analysis, but was still lower compared with the level of
contamination before FFE (Figure 3a). For the cell culture,
only the two fractions that represented the anodic side of the
mitochondrial peak were pooled, to minimize peroxisomal
contaminants from the cell culture sample.
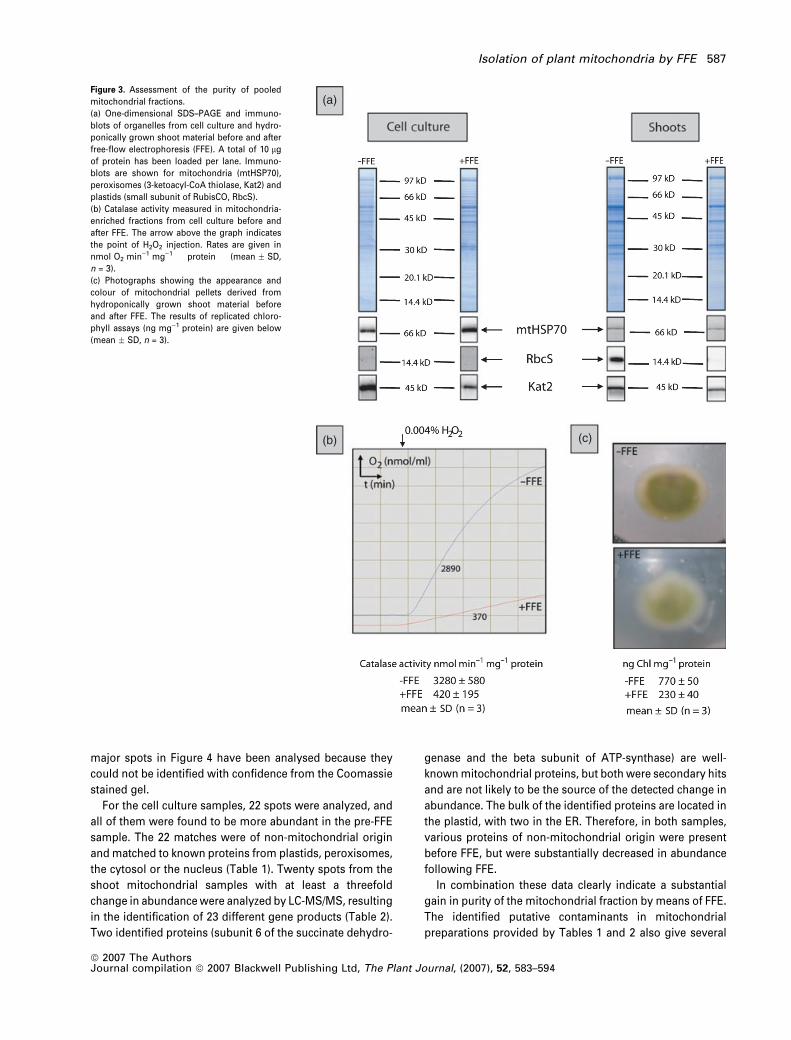
The level of purity of the final mitochondrial isolates has
been further assessed in various ways. For the cell culture,
the degree of peroxisomal contamination was ascertained
by catalase activity. As can be seen in Figure 3(b), FFE-
purified mitochondria from cell culture produce oxygen at a
much lower rate. On average, a 5- to 6-fold reduction in
peroxisomal soluble protein contamination of the mitochon-
drial fraction can be achieved through FFE. For shoot
material, a visual indication of a reduction in the degree of
plastidic contamination from fractions pooled after FFE was
the green color of the mitochondrial pellet. In Figure 3(c)
organellar pellets derived from Arabidopsis shoots before
and after FFE are compared. Whereas the pellet before the
FFE run still incorporates green material, it is nearly devoid
of it after the FFE treatment. Chlorophyll assays showed that
this reduction was more than threefold on a protein basis
(Figure 3c). These findings are also reflected in immuno-
blots conducted with the pooled mitochondrial fractions
derived from shoot or cell culture material (Figure 3a). The
largest improvement is found for the shoot sample, where
FFE separation led to a nearly complete loss in the signal for
the plastid marker, RbcS. The signal for the peroxisomal
marker, Kat2, is also clearly reduced after FFE. Similar results
have also been obtained for the cell culture sample.
Although the immunoblot is faint for RbcS, a reduction in
the intensity was observed after FFE. However, the major
contaminants in these samples were peroxisomes, and after
FFE the Kat2 immunoblot intensity was markedly decreased.
A broader approach was also undertaken to investigate
the success of FFE purification more systematically. Differ-
ential two-dimensional iso-electric focusing (IEF)/SDS-PAGE
using the fluorescent dyes Cy2, Cy3 and Cy5 was performed
for three independent cell culture sample sets (Figure 4a)
and shoot samples sets (Figure 4b). Overall, the general
protein spot patterns are very consistent with the mitochon-
drial proteome profiles previously published (Millar et al.,
2001). A threshold of at least a threefold change in protein
abundance was considered to be a significant effect, and
was used to identify proteins that changed in abundance
following FFE treatment. In each case the changing spots
were more abundant in the pre-FFE fraction. Among this set
of proteins, the most abundant spots on Coomassie stained
gels were selected and analyzed using LC-MS/MS (indicated
by arrows in Figure 4). The identities of the proteins are
summarized in Tables 1 and 2. It was apparent that for some
spots the staining intensity was different for fluorophore
labeling and Coomassie staining. Therefore, not all of the
586 Holger Eubel et al.
ª 2007 The AuthorsJournal compilation ª 2007 Blackwell Publishing Ltd, The Plant Journal, (2007), 52, 583–594
major spots in Figure 4 have been analysed because they
could not be identified with confidence from the Coomassie
stained gel.
For the cell culture samples, 22 spots were analyzed, and
all of them were found to be more abundant in the pre-FFE
sample. The 22 matches were of non-mitochondrial origin
and matched to known proteins from plastids, peroxisomes,
the cytosol or the nucleus (Table 1). Twenty spots from the
shoot mitochondrial samples with at least a threefold
change in abundance were analyzed by LC-MS/MS, resulting
in the identification of 23 different gene products (Table 2).
Two identified proteins (subunit 6 of the succinate dehydro-
genase and the beta subunit of ATP-synthase) are well-
known mitochondrial proteins, but both were secondary hits
and are not likely to be the source of the detected change in
abundance. The bulk of the identified proteins are located in
the plastid, with two in the ER. Therefore, in both samples,
various proteins of non-mitochondrial origin were present
before FFE, but were substantially decreased in abundance
following FFE.
In combination these data clearly indicate a substantial
gain in purity of the mitochondrial fraction by means of FFE.
The identified putative contaminants in mitochondrial
preparations provided by Tables 1 and 2 also give several
(a)
(b) (c)
Figure 3. Assessment of the purity of pooled
mitochondrial fractions.
(a) One-dimensional SDS–PAGE and immuno-
blots of organelles from cell culture and hydro-
ponically grown shoot material before and after
free-flow electrophoresis (FFE). A total of 10 lg
of protein has been loaded per lane. Immuno-
blots are shown for mitochondria (mtHSP70),
peroxisomes (3-ketoacyl-CoA thiolase, Kat2) and
plastids (small subunit of RubisCO, RbcS).
(b) Catalase activity measured in mitochondria-
enriched fractions from cell culture before and
after FFE. The arrow above the graph indicates
the point of H2O2 injection. Rates are given in
nmol O2 min)1 mg)1 protein (mean � SD,
n = 3).
(c) Photographs showing the appearance and
colour of mitochondrial pellets derived from
hydroponically grown shoot material before
and after FFE. The results of replicated chloro-
phyll assays (ng mg)1 protein) are given below
(mean � SD, n = 3).
Isolation of plant mitochondria by FFE 587
ª 2007 The AuthorsJournal compilation ª 2007 Blackwell Publishing Ltd, The Plant Journal, (2007), 52, 583–594

(a)
(b)
Figure 4. DIGE two-dimensional iso-electric
focusing (IEF)/SDS–PAGE of cell culture (a) and
hydroponically grown shoot material (b). Sam-
ples before (labeled with Cy3, shown in red) and
after free-flow electrophoresis (FFE)-treatment
(labeled with Cy5, shown in green) were com-
pared. Upper panels: gel pictures of each fluo-
rescence signal. The abundance of spots
encircled in green or black has been decreased
by at least three times as a result of FFE
treatment. Spots encircled in black were picked
for MS/MS analysis. Lower panel: fluorescence
images were electronically overlaid using IMAGE
QUANT TL� software (GE Healthcare, http://
www.gehealthcare.com). Yellow spots represent
proteins of equal abundance before and after
FFE. Spots that are more abundant in the pre-FFE
sample are green, and those more abundant
in the post-FFE sample are red. Arrows indi-
cate proteins unambiguously identified by MS,
the numbers correlate with Tables 1 and 2,
respectively.
588 Holger Eubel et al.
ª 2007 The AuthorsJournal compilation ª 2007 Blackwell Publishing Ltd, The Plant Journal, (2007), 52, 583–594
new insights into the composition of the mitochondrial
proteome.
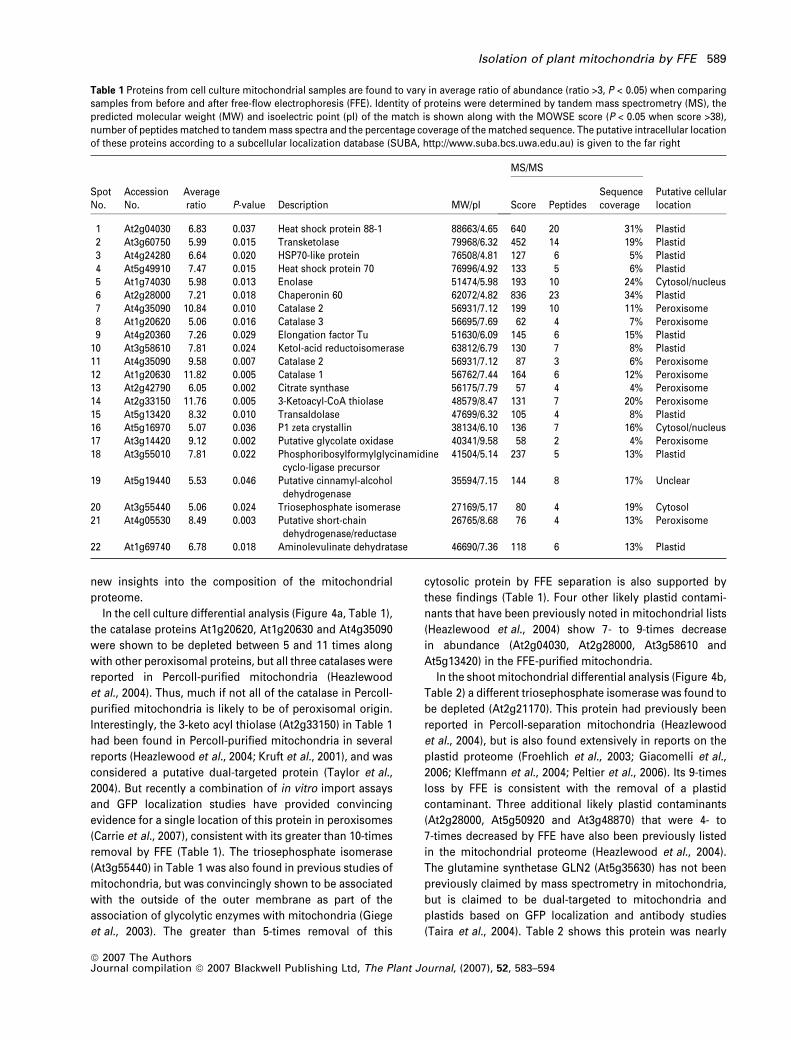
In the cell culture differential analysis (Figure 4a, Table 1),
the catalase proteins At1g20620, At1g20630 and At4g35090
were shown to be depleted between 5 and 11 times along
with other peroxisomal proteins, but all three catalases were
reported in Percoll-purified mitochondria (Heazlewood
et al., 2004). Thus, much if not all of the catalase in Percoll-
purified mitochondria is likely to be of peroxisomal origin.
Interestingly, the 3-keto acyl thiolase (At2g33150) in Table 1
had been found in Percoll-purified mitochondria in several
reports (Heazlewood et al., 2004; Kruft et al., 2001), and was
considered a putative dual-targeted protein (Taylor et al.,
2004). But recently a combination of in vitro import assays
and GFP localization studies have provided convincing
evidence for a single location of this protein in peroxisomes
(Carrie et al., 2007), consistent with its greater than 10-times
removal by FFE (Table 1). The triosephosphate isomerase
(At3g55440) in Table 1 was also found in previous studies of
mitochondria, but was convincingly shown to be associated
with the outside of the outer membrane as part of the
association of glycolytic enzymes with mitochondria (Giege
et al., 2003). The greater than 5-times removal of this
cytosolic protein by FFE separation is also supported by
these findings (Table 1). Four other likely plastid contami-
nants that have been previously noted in mitochondrial lists
(Heazlewood et al., 2004) show 7- to 9-times decrease
in abundance (At2g04030, At2g28000, At3g58610 and
At5g13420) in the FFE-purified mitochondria.
In the shoot mitochondrial differential analysis (Figure 4b,
Table 2) a different triosephosphate isomerase was found to
be depleted (At2g21170). This protein had previously been
reported in Percoll-separation mitochondria (Heazlewood
et al., 2004), but is also found extensively in reports on the
plastid proteome (Froehlich et al., 2003; Giacomelli et al.,
2006; Kleffmann et al., 2004; Peltier et al., 2006). Its 9-times
loss by FFE is consistent with the removal of a plastid
contaminant. Three additional likely plastid contaminants
(At2g28000, At5g50920 and At3g48870) that were 4- to
7-times decreased by FFE have also been previously listed
in the mitochondrial proteome (Heazlewood et al., 2004).
The glutamine synthetase GLN2 (At5g35630) has not been
previously claimed by mass spectrometry in mitochondria,
but is claimed to be dual-targeted to mitochondria and
plastids based on GFP localization and antibody studies
(Taira et al., 2004). Table 2 shows this protein was nearly
Table 1 Proteins from cell culture mitochondrial samples are found to vary in average ratio of abundance (ratio >3, P < 0.05) when comparingsamples from before and after free-flow electrophoresis (FFE). Identity of proteins were determined by tandem mass spectrometry (MS), thepredicted molecular weight (MW) and isoelectric point (pI) of the match is shown along with the MOWSE score (P < 0.05 when score >38),number of peptides matched to tandem mass spectra and the percentage coverage of the matched sequence. The putative intracellular locationof these proteins according to a subcellular localization database (SUBA, http://www.suba.bcs.uwa.edu.au) is given to the far right
SpotNo.
AccessionNo.
Averageratio P-value Description MW/pI
MS/MS
Putative cellularlocationScore Peptides
Sequencecoverage
1 At2g04030 6.83 0.037 Heat shock protein 88-1 88663/4.65 640 20 31% Plastid2 At3g60750 5.99 0.015 Transketolase 79968/6.32 452 14 19% Plastid3 At4g24280 6.64 0.020 HSP70-like protein 76508/4.81 127 6 5% Plastid4 At5g49910 7.47 0.015 Heat shock protein 70 76996/4.92 133 5 6% Plastid5 At1g74030 5.98 0.013 Enolase 51474/5.98 193 10 24% Cytosol/nucleus6 At2g28000 7.21 0.018 Chaperonin 60 62072/4.82 836 23 34% Plastid7 At4g35090 10.84 0.010 Catalase 2 56931/7.12 199 10 11% Peroxisome8 At1g20620 5.06 0.016 Catalase 3 56695/7.69 62 4 7% Peroxisome9 At4g20360 7.26 0.029 Elongation factor Tu 51630/6.09 145 6 15% Plastid
10 At3g58610 7.81 0.024 Ketol-acid reductoisomerase 63812/6.79 130 7 8% Plastid11 At4g35090 9.58 0.007 Catalase 2 56931/7.12 87 3 6% Peroxisome12 At1g20630 11.82 0.005 Catalase 1 56762/7.44 164 6 12% Peroxisome13 At2g42790 6.05 0.002 Citrate synthase 56175/7.79 57 4 4% Peroxisome14 At2g33150 11.76 0.005 3-Ketoacyl-CoA thiolase 48579/8.47 131 7 20% Peroxisome15 At5g13420 8.32 0.010 Transaldolase 47699/6.32 105 4 8% Plastid16 At5g16970 5.07 0.036 P1 zeta crystallin 38134/6.10 136 7 16% Cytosol/nucleus17 At3g14420 9.12 0.002 Putative glycolate oxidase 40341/9.58 58 2 4% Peroxisome18 At3g55010 7.81 0.022 Phosphoribosylformylglycinamidine
cyclo-ligase precursor41504/5.14 237 5 13% Plastid
19 At5g19440 5.53 0.046 Putative cinnamyl-alcoholdehydrogenase
35594/7.15 144 8 17% Unclear
20 At3g55440 5.06 0.024 Triosephosphate isomerase 27169/5.17 80 4 19% Cytosol21 At4g05530 8.49 0.003 Putative short-chain
dehydrogenase/reductase26765/8.68 76 4 13% Peroxisome
22 At1g69740 6.78 0.018 Aminolevulinate dehydratase 46690/7.36 118 6 13% Plastid
Isolation of plant mitochondria by FFE 589
ª 2007 The AuthorsJournal compilation ª 2007 Blackwell Publishing Ltd, The Plant Journal, (2007), 52, 583–594
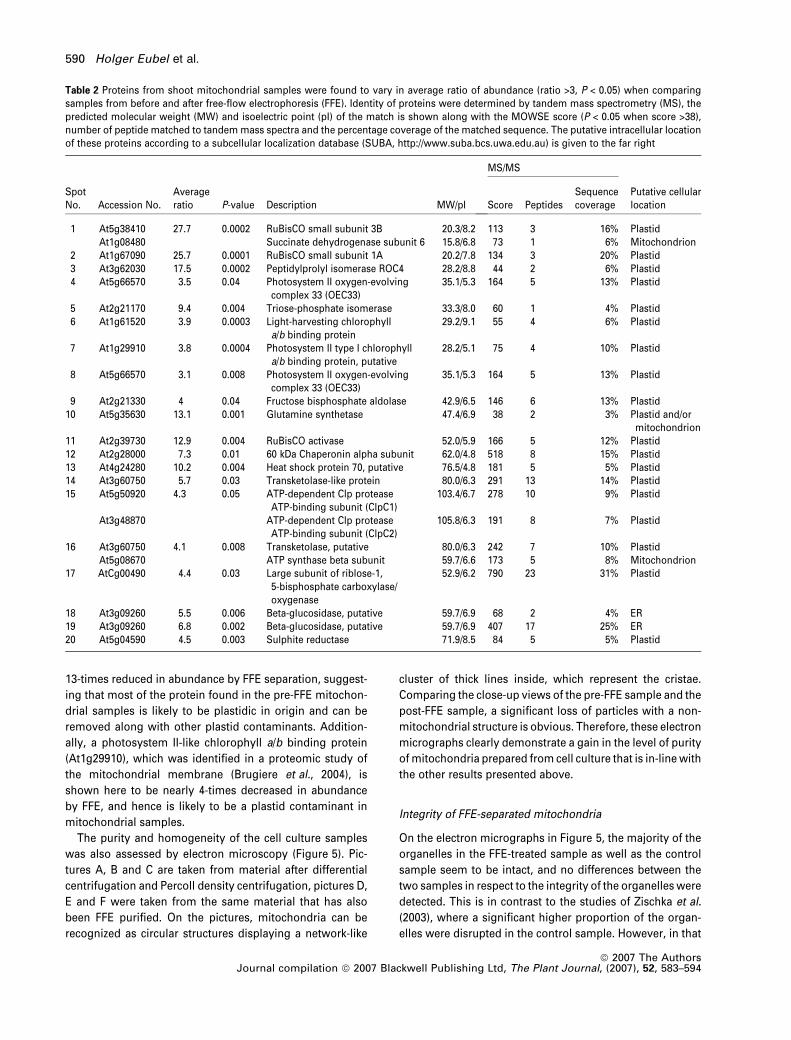
13-times reduced in abundance by FFE separation, suggest-
ing that most of the protein found in the pre-FFE mitochon-
drial samples is likely to be plastidic in origin and can be
removed along with other plastid contaminants. Addition-
ally, a photosystem II-like chlorophyll a/b binding protein
(At1g29910), which was identified in a proteomic study of
the mitochondrial membrane (Brugiere et al., 2004), is
shown here to be nearly 4-times decreased in abundance
by FFE, and hence is likely to be a plastid contaminant in
mitochondrial samples.
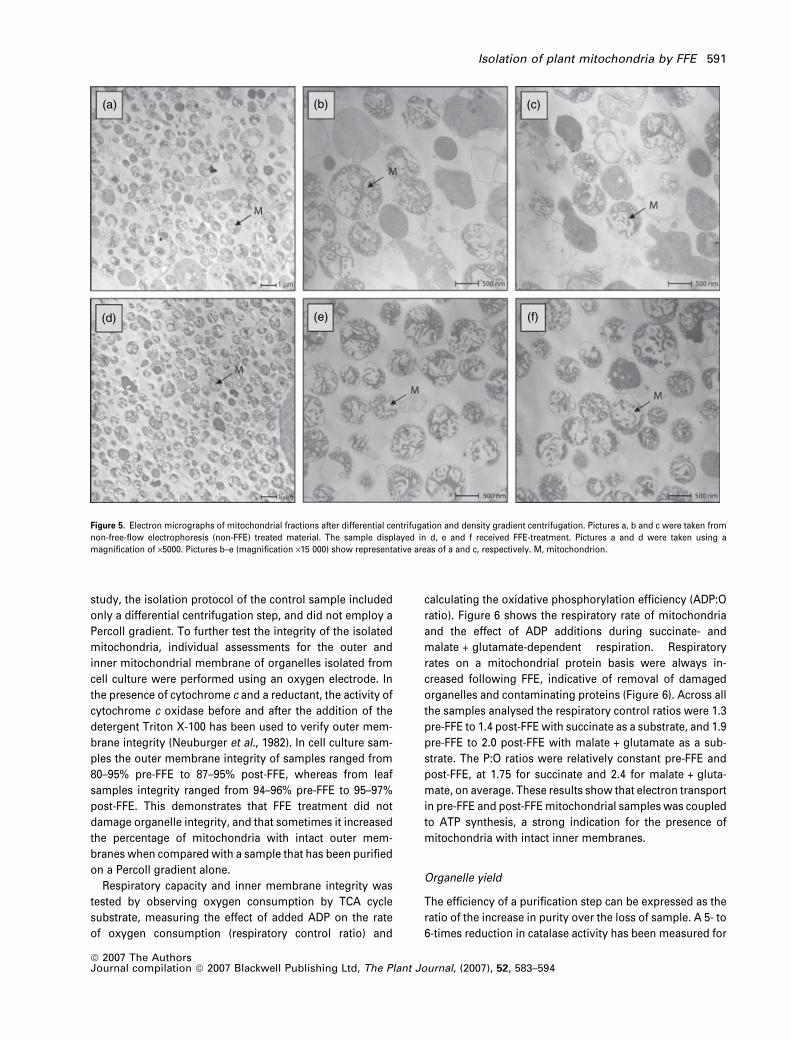
The purity and homogeneity of the cell culture samples
was also assessed by electron microscopy (Figure 5). Pic-
tures A, B and C are taken from material after differential
centrifugation and Percoll density centrifugation, pictures D,
E and F were taken from the same material that has also
been FFE purified. On the pictures, mitochondria can be
recognized as circular structures displaying a network-like
cluster of thick lines inside, which represent the cristae.
Comparing the close-up views of the pre-FFE sample and the
post-FFE sample, a significant loss of particles with a non-
mitochondrial structure is obvious. Therefore, these electron
micrographs clearly demonstrate a gain in the level of purity
of mitochondria prepared from cell culture that is in-line with
the other results presented above.
Integrity of FFE-separated mitochondria
On the electron micrographs in Figure 5, the majority of the
organelles in the FFE-treated sample as well as the control
sample seem to be intact, and no differences between the
two samples in respect to the integrity of the organelles were
detected. This is in contrast to the studies of Zischka et al.
(2003), where a significant higher proportion of the organ-
elles were disrupted in the control sample. However, in that
Table 2 Proteins from shoot mitochondrial samples were found to vary in average ratio of abundance (ratio >3, P < 0.05) when comparingsamples from before and after free-flow electrophoresis (FFE). Identity of proteins were determined by tandem mass spectrometry (MS), thepredicted molecular weight (MW) and isoelectric point (pI) of the match is shown along with the MOWSE score (P < 0.05 when score >38),number of peptide matched to tandem mass spectra and the percentage coverage of the matched sequence. The putative intracellular locationof these proteins according to a subcellular localization database (SUBA, http://www.suba.bcs.uwa.edu.au) is given to the far right
SpotNo. Accession No.
Averageratio P-value Description MW/pI
MS/MS
Putative cellularlocationScore Peptides
Sequencecoverage
1 At5g38410 27.7 0.0002 RuBisCO small subunit 3B 20.3/8.2 113 3 16% PlastidAt1g08480 Succinate dehydrogenase subunit 6 15.8/6.8 73 1 6% Mitochondrion
2 At1g67090 25.7 0.0001 RuBisCO small subunit 1A 20.2/7.8 134 3 20% Plastid3 At3g62030 17.5 0.0002 Peptidylprolyl isomerase ROC4 28.2/8.8 44 2 6% Plastid4 At5g66570 3.5 0.04 Photosystem II oxygen-evolving
complex 33 (OEC33)35.1/5.3 164 5 13% Plastid
5 At2g21170 9.4 0.004 Triose-phosphate isomerase 33.3/8.0 60 1 4% Plastid6 At1g61520 3.9 0.0003 Light-harvesting chlorophyll
a/b binding protein29.2/9.1 55 4 6% Plastid
7 At1g29910 3.8 0.0004 Photosystem II type I chlorophylla/b binding protein, putative
28.2/5.1 75 4 10% Plastid
8 At5g66570 3.1 0.008 Photosystem II oxygen-evolvingcomplex 33 (OEC33)
35.1/5.3 164 5 13% Plastid
9 At2g21330 4 0.04 Fructose bisphosphate aldolase 42.9/6.5 146 6 13% Plastid10 At5g35630 13.1 0.001 Glutamine synthetase 47.4/6.9 38 2 3% Plastid and/or
mitochondrion11 At2g39730 12.9 0.004 RuBisCO activase 52.0/5.9 166 5 12% Plastid12 At2g28000 7.3 0.01 60 kDa Chaperonin alpha subunit 62.0/4.8 518 8 15% Plastid13 At4g24280 10.2 0.004 Heat shock protein 70, putative 76.5/4.8 181 5 5% Plastid14 At3g60750 5.7 0.03 Transketolase-like protein 80.0/6.3 291 13 14% Plastid15 At5g50920 4.3 0.05 ATP-dependent Clp protease
ATP-binding subunit (ClpC1)103.4/6.7 278 10 9% Plastid
At3g48870 ATP-dependent Clp proteaseATP-binding subunit (ClpC2)
105.8/6.3 191 8 7% Plastid
16 At3g60750 4.1 0.008 Transketolase, putative 80.0/6.3 242 7 10% PlastidAt5g08670 ATP synthase beta subunit 59.7/6.6 173 5 8% Mitochondrion
17 AtCg00490 4.4 0.03 Large subunit of riblose-1,5-bisphosphate carboxylase/oxygenase
52.9/6.2 790 23 31% Plastid
18 At3g09260 5.5 0.006 Beta-glucosidase, putative 59.7/6.9 68 2 4% ER19 At3g09260 6.8 0.002 Beta-glucosidase, putative 59.7/6.9 407 17 25% ER20 At5g04590 4.5 0.003 Sulphite reductase 71.9/8.5 84 5 5% Plastid
590 Holger Eubel et al.
ª 2007 The AuthorsJournal compilation ª 2007 Blackwell Publishing Ltd, The Plant Journal, (2007), 52, 583–594
study, the isolation protocol of the control sample included
only a differential centrifugation step, and did not employ a
Percoll gradient. To further test the integrity of the isolated
mitochondria, individual assessments for the outer and
inner mitochondrial membrane of organelles isolated from
cell culture were performed using an oxygen electrode. In
the presence of cytochrome c and a reductant, the activity of
cytochrome c oxidase before and after the addition of the
detergent Triton X-100 has been used to verify outer mem-
brane integrity (Neuburger et al., 1982). In cell culture sam-
ples the outer membrane integrity of samples ranged from
80–95% pre-FFE to 87–95% post-FFE, whereas from leaf
samples integrity ranged from 94–96% pre-FFE to 95–97%
post-FFE. This demonstrates that FFE treatment did not
damage organelle integrity, and that sometimes it increased
the percentage of mitochondria with intact outer mem-
branes when compared with a sample that has been purified
on a Percoll gradient alone.
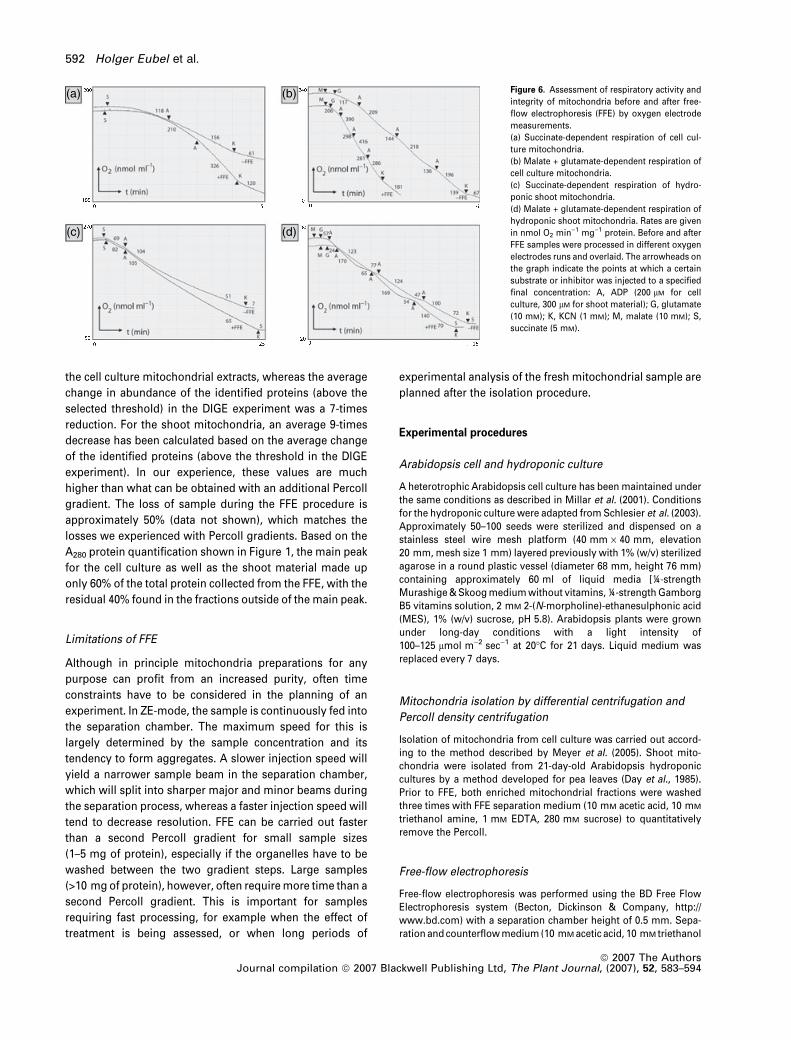
Respiratory capacity and inner membrane integrity was
tested by observing oxygen consumption by TCA cycle
substrate, measuring the effect of added ADP on the rate
of oxygen consumption (respiratory control ratio) and
calculating the oxidative phosphorylation efficiency (ADP:O
ratio). Figure 6 shows the respiratory rate of mitochondria
and the effect of ADP additions during succinate- and
malate + glutamate-dependent respiration. Respiratory
rates on a mitochondrial protein basis were always in-
creased following FFE, indicative of removal of damaged
organelles and contaminating proteins (Figure 6). Across all
the samples analysed the respiratory control ratios were 1.3
pre-FFE to 1.4 post-FFE with succinate as a substrate, and 1.9
pre-FFE to 2.0 post-FFE with malate + glutamate as a sub-
strate. The P:O ratios were relatively constant pre-FFE and
post-FFE, at 1.75 for succinate and 2.4 for malate + gluta-
mate, on average. These results show that electron transport
in pre-FFE and post-FFE mitochondrial samples was coupled
to ATP synthesis, a strong indication for the presence of
mitochondria with intact inner membranes.
Organelle yield
The efficiency of a purification step can be expressed as the
ratio of the increase in purity over the loss of sample. A 5- to
6-times reduction in catalase activity has been measured for
(a)
(d)
(b)
(e)
(c)
(f)
Figure 5. Electron micrographs of mitochondrial fractions after differential centrifugation and density gradient centrifugation. Pictures a, b and c were taken from
non-free-flow electrophoresis (non-FFE) treated material. The sample displayed in d, e and f received FFE-treatment. Pictures a and d were taken using a
magnification of ·5000. Pictures b–e (magnification ·15 000) show representative areas of a and c, respectively. M, mitochondrion.
Isolation of plant mitochondria by FFE 591
ª 2007 The AuthorsJournal compilation ª 2007 Blackwell Publishing Ltd, The Plant Journal, (2007), 52, 583–594
the cell culture mitochondrial extracts, whereas the average
change in abundance of the identified proteins (above the
selected threshold) in the DIGE experiment was a 7-times
reduction. For the shoot mitochondria, an average 9-times
decrease has been calculated based on the average change
of the identified proteins (above the threshold in the DIGE
experiment). In our experience, these values are much
higher than what can be obtained with an additional Percoll
gradient. The loss of sample during the FFE procedure is
approximately 50% (data not shown), which matches the
losses we experienced with Percoll gradients. Based on the
A280 protein quantification shown in Figure 1, the main peak
for the cell culture as well as the shoot material made up
only 60% of the total protein collected from the FFE, with the
residual 40% found in the fractions outside of the main peak.
Limitations of FFE
Although in principle mitochondria preparations for any
purpose can profit from an increased purity, often time
constraints have to be considered in the planning of an
experiment. In ZE-mode, the sample is continuously fed into
the separation chamber. The maximum speed for this is
largely determined by the sample concentration and its
tendency to form aggregates. A slower injection speed will
yield a narrower sample beam in the separation chamber,
which will split into sharper major and minor beams during
the separation process, whereas a faster injection speed will
tend to decrease resolution. FFE can be carried out faster
than a second Percoll gradient for small sample sizes
(1–5 mg of protein), especially if the organelles have to be
washed between the two gradient steps. Large samples
(>10 mg of protein), however, often require more time than a
second Percoll gradient. This is important for samples
requiring fast processing, for example when the effect of
treatment is being assessed, or when long periods of
experimental analysis of the fresh mitochondrial sample are
planned after the isolation procedure.
Experimental procedures
Arabidopsis cell and hydroponic culture
A heterotrophic Arabidopsis cell culture has been maintained underthe same conditions as described in Millar et al. (2001). Conditionsfor the hydroponic culture were adapted from Schlesier et al. (2003).Approximately 50–100 seeds were sterilized and dispensed on astainless steel wire mesh platform (40 mm · 40 mm, elevation20 mm, mesh size 1 mm) layered previously with 1% (w/v) sterilizedagarose in a round plastic vessel (diameter 68 mm, height 76 mm)containing approximately 60 ml of liquid media [¼-strengthMurashige & Skoog medium without vitamins, ¼-strength GamborgB5 vitamins solution, 2 mM 2-(N-morpholine)-ethanesulphonic acid(MES), 1% (w/v) sucrose, pH 5.8). Arabidopsis plants were grownunder long-day conditions with a light intensity of100–125 lmol m)2 sec)1 at 20�C for 21 days. Liquid medium wasreplaced every 7 days.
Mitochondria isolation by differential centrifugation and
Percoll density centrifugation
Isolation of mitochondria from cell culture was carried out accord-ing to the method described by Meyer et al. (2005). Shoot mito-chondria were isolated from 21-day-old Arabidopsis hydroponiccultures by a method developed for pea leaves (Day et al., 1985).Prior to FFE, both enriched mitochondrial fractions were washedthree times with FFE separation medium (10 mM acetic acid, 10 mM
triethanol amine, 1 mM EDTA, 280 mM sucrose) to quantitativelyremove the Percoll.
Free-flow electrophoresis
Free-flow electrophoresis was performed using the BD Free FlowElectrophoresis system (Becton, Dickinson & Company, http://www.bd.com) with a separation chamber height of 0.5 mm. Sepa-ration and counterflow medium (10 mM acetic acid, 10 mM triethanol
(a) (b)
(c) (d)
Figure 6. Assessment of respiratory activity and
integrity of mitochondria before and after free-
flow electrophoresis (FFE) by oxygen electrode
measurements.
(a) Succinate-dependent respiration of cell cul-
ture mitochondria.
(b) Malate + glutamate-dependent respiration of
cell culture mitochondria.
(c) Succinate-dependent respiration of hydro-
ponic shoot mitochondria.
(d) Malate + glutamate-dependent respiration of
hydroponic shoot mitochondria. Rates are given
in nmol O2 min)1 mg)1 protein. Before and after
FFE samples were processed in different oxygen
electrodes runs and overlaid. The arrowheads on
the graph indicate the points at which a certain
substrate or inhibitor was injected to a specified
final concentration: A, ADP (200 lM for cell
culture, 300 lM for shoot material); G, glutamate
(10 mM); K, KCN (1 mM); M, malate (10 mM); S,
succinate (5 mM).
592 Holger Eubel et al.
ª 2007 The AuthorsJournal compilation ª 2007 Blackwell Publishing Ltd, The Plant Journal, (2007), 52, 583–594
amine, 1 mM EDTA, 280 mM sucrose; media inlets 2–6 and counter-flow inlets 1–3) as well as electrode stabilization medium (100 mM
acetic acid, 100 mM triethanol amine, 10 mM EDTA, 200 mM sucrose;media inlets 1 and 7) were injected into the separation chamber at aspeed of 200 ml h–1. Media for anode and cathode circuits consistedof 100 mM acetic acid, 100 mM triethanol amine and 10 mM EDTA. Avoltage of 600 V was applied, which resulted in a current of�103 mA.Before the FFE run, the sample (�10 lg protein ll–1) was subjected toone stroke in a Potter Elvehjem homogenisator. Sample injectionspeed was 3000–3500 ll h–1 depending on the sample and the levelof contamination. Fractions were collected in 2-ml 96-well plates. Theseparation chamber was cooled to 5ºC, and the sample and 96-wellplates were cooled in an ice bath.
One-dimensional SDS–PAGE and immunoblotting
Precast gels [10–20% (w/v) acrylamide, Tris–HCl, 1 mM were used foranalytical purposes and western blotting. Protein assays (Bradford,1976) were performed for pooled FFE fractions. Proteins were trans-ferred onto nitrocellulose membranes and probed with 1:5000 dilu-tion of the primary antibodies (mtHSP70:PM003 from Dr Tom Elthon,Lincoln, NE, USA; Kat2 (Germain et al., 2001); Rbc, raised againsttobacco Rubisco in rabbits, supplied by Dr Spencer Whitney, Aus-tralian National University). Horseradish-peroxidase-conjugatedsecondary antibodies in a dilution of 1:10 000 were used for thechemiluminescent detection of the immune signal.
DIGE two-dimensional IEF/SDS–PAGE
Samples (50 lg) of pre- and post-FFE, as well as 50 lg of a 1:1 mixtureof both samples, were acetone-precipated, re-solubilized in lysisbuffer [7 M urea, 2 M thiourea, 4% (w/v) CHAPS, 40 mM Tris base,pH 8.5] and individually labeled with 400 lM of weight- and pI-mat-ched fluorescent dyes Cy2, Cy3 and Cy5 (GE Healthcare, http://www.gehealthcare.com), combined and separated on IEF strips(pH 3–10NL, 24 cm; GE Healthcare) according to the manufacturer’sinstructions. After a brief wash in 1x gel buffer, the strips weretransferred on top of a 12% acrylamide glycine gel where they werecovered with 1.2% agarose in 1x gel buffer. Two-dimensional gelswere run at 50 mA per gel for 6 h. Proteins were visualized on aTyphoon� laser scanner (GE Healthcare) and image comparison wasperformed using the DECYDER� software package (version 6.5; GEHealthcare). Three independent experiments were performed andeach of the resulting three gel sets were first analysed using the dif-ferential in-gel analysis (DIA) mode DECYDER prior to a comprehen-sive biological variance analysis (BVA) including all three gel sets. Gelspots were filtered according to their presence (in nine out of nine gelimages), average ratio in abundance (either £ )3 or ‡3 times) andStudent’s t-test value (£0.05). Gel pictures were electronically overlaidusing the IMAGE QUANT TL� software (GE Healthcare).
Electron microscopy
Sample preparation for transmission electron microscopy wasperformed as outlined in Usher et al. (2006).
Oxygen electrode and chlorophyll measurements
A Hansatech Oxygraph oxygen electrode (http://www.hansatech-instruments.com) was used for catalase assays and the determina-tion of inner and outer membrane integrity. All measurements wereperformed in 1 ml of mitochondria reaction buffer [0.3 M sucrose,
5 mM KH2PO4, 10 mM TES (N-tris[Hydroxymethyl]methyl-2-ami-noethanesulfonic acid) 10 mM NaCl, 2 mM MgSO4, 0.1% (w/v) BSA,pH 7.2]. For catalase assays, 4 ll of a 1% (v/v) H2O2 solution wasinjected into the chamber and the rate of O2 evolution was measured.Chlorophyll concentrations of isolated mitochondria were estimatedusing an established method (Arnon, 1949). Absorbance readingswere taken at 645 and 663 nm using an ND-1000 spectrophotometer(NanoDrop Technologies, http://www.nanodrop.com).
Mass spectrometry
Protein samples to be analyzed were cut from the gels and werein-gel digested according to the method described by Taylor et al.(2005). Samples were then dried down in a vacuum centrifuge,resuspended in 5% (v/v) acetonitrile and 0.1% (v/v) formic acid andanalysed on an XCT Ultra IonTrap mass spectrometer according tothe method described by Meyer et al. (2007). Results were queriedagainst an in-house Arabidopsis database comprising ATH1.pep(release 6) from the Arabidopsis Information Resource (TAIR, http://www.arabidopsis.org) and the Arabidopsis mitochondrial andplastid protein sets (database contained a total of 30 700 proteinsequences with 12 656 682 residues) using the MASCOT searchengine version 2.1.04 (Matrix Science, http://www.matrixscience.com) using the tolerances and criteria outlined in Meyer et al. (2007).
Acknowledgements
This work was supported by grants from the Australian ResearchCouncil (ARC) through the Discovery Program and the Centres ofExcellence Program. HE is supported as an ARC Australian Post-doctoral Fellow, AHM as an ARC Australian Professorial Fellow, andCPL is supported by an Australian Postgraduate Award.
Supplementary Material
The following supplementary material is available for this articleonline:Table S1. Details of the identity of proteins found in the 4th peakfound in FFE isolations.This material is available as part of the online article from http://www.blackwell-synergy.com
References
Arnon, D.I. (1949) Copper enzymes in isolated chloroplasts. Poly-phenoloxidase in Beta vulgaris. Plant Physiol. 24, 1–15.
Baier, T.G., Weber, G., Hartmann, K., Heinrich, U. and Schonberg, D.
(1988) Preparative separation of human B and T lymphocytes byfree flow electrophoresis. Anal. Biochem. 171, 91–95.
Bardel, J., Louwagie, M., Jaquinod, M., Jourdain, A., Luche, S.,
Rabilloud, T., Macherel, D., Garin, J. and Bourguignon, J. (2002) Asurvey of the plant mitochondrial proteome in relation to devel-opment. Proteomics, 2, 880–898.
Bardy, N., Carrasco, A., Galaud, J.P., Pont-Lezica, R. and Canut, H.
(1998) Free-flow electrophoresis for fractionation of Arabidopsisthaliana membranes. Electrophoresis, 19, 1145–1153.
Bradford, M.M. (1976) A rapid and sensitive method for the quan-titation of microgram quantities of protein utilizing the principleof protein-dye binding. Anal. Biochem. 72, 248–254.
Brugiere, S., Kowalski, S., Ferro, M. et al. (2004) The hydrophobicproteome of mitochondrial membranes from Arabidopsis cellsuspensions. Phytochemistry, 65, 1693–1707.
Isolation of plant mitochondria by FFE 593
ª 2007 The AuthorsJournal compilation ª 2007 Blackwell Publishing Ltd, The Plant Journal, (2007), 52, 583–594
Carrie, C., Murcha, M.W., Millar, A.H., Smith, S.M. and Whelan, J.
(2007) Nine 3-ketoacyl-CoA thiolases (KATs) and acetoacetyl-CoAthiolases (ACATs) encoded by five genes in Arabidopsis thalianaare targeted either to peroxisomes or cytosol but not to mito-chondria. Plant Mol. Biol. 63, 97–108.
Day, D.A., Neuburger, M. and Douce, R. (1985) Biochemical char-acterization of chlorophyll-free mitochondria from pea leaves.Aust. J. Plant Physiol., 12, 219–228.
Dunkley, T.P., Watson, R., Griffin, J.L., Dupree, P. and Lilley, K.S.
(2004) Localization of organelle proteins by isotope tagging(LOPIT). Mol. Cell Proteomics, 3, 1128–1134.
Dunkley, T.P., Hester, S., Shadforth, I.P. et al. (2006) Mapping theArabidopsis organelle proteome. Proc. Natl Acad. Sci. USA, 103,6518–6523.
Froehlich, J.E., Wilkerson, C.G., Ray, W.K., McAndrew, R.S.,
Osteryoung, K.W., Gage, D.A. and Phinney, B.S. (2003) Proteomicstudy of the Arabidopsis thaliana chloroplastic envelopemembrane utilizing alternatives to traditional two-dimensionalelectrophoresis. J. Proteome Res. 2, 413–425.
Germain, V., Rylott, E.L., Larson, T.R., Sherson, S.M., Bechtold, N.,
Carde, J.P., Bryce, J.H., Graham, I.A. and Smith, S.M. (2001)Requirement for 3-ketoacyl-CoA thiolase-2 in peroxisome devel-opment, fatty acid beta-oxidation and breakdown of triacylglyc-erol in lipid bodies of Arabidopsis seedlings. Plant J. 28, 1–12.
Giacomelli, L., Rudella, A. and van Wijk, K.J. (2006) High lightresponse of the thylakoid proteome in Arabidopsis wild type andthe ascorbate-deficient mutant vtc2-2. A comparative proteomicsstudy. Plant Physiol. 141, 685–701.
Giege, P., Heazlewood, J.L., Roessner-Tunali, U., Millar, A.H.,
Fernie, A.R., Leaver, C.J. and Sweetlove, L.J. (2003) Enzymes ofglycolysis are functionally associated with the mitochondrion inArabidopsis cells. Plant Cell, 15, 2140–2151.
Hansen, E. and Hannig, K. (1982) Antigen-specific electrophoreticcell separation (ASECS): isolation by human T and B lymphocytesubpopulations by free-flow electrophoresis after reaction withantibodies. J. Immunol. Methods, 51, 197–208.
Hansen, E., Wustrow, T.P. and Hannig, K. (1989) Antigen-specificelectrophoretic cell separation for immunological investigations.Electrophoresis, 10, 645–652.
Heazlewood, J.L., Howell, K.A., Whelan, J. and Millar, A.H. (2003)Towards an analysis of the rice mitochondrial proteome. PlantPhysiol. 132, 230–242.
Heazlewood, J.L., Tonti-Filippini, J.S., Gout, A.M., Day, D.A.,
Whelan, J. and Millar, A.H. (2004) Experimental analysis of theArabidopsis mitochondrial proteome highlights signaling andregulatory components, provides assessment of targeting pre-diction programs, and indicates plant-specific mitochondrialproteins. Plant Cell, 16, 241–256.
Heazlewood, J.L., Tonti-Filippini, J., Verboom, R.E. and Millar, A.H.
(2005) Combining experimental and predicted datasets fordetermination of the subcellular location of proteins in Arabid-opsis. Plant Physiol. 139, 598–609.
Heazlewood, J.L., Verboom, R.E., Tonti-Filippini, J., Small, I. and
Millar, A.H. (2007) SUBA: the Arabidopsis subcellular database.Nucleic Acids Res. 35, D213–D218.
Heidrich, H.G. and Hannig, K. (1989) Separation of cell populationsby free-flow electrophoresis. Methods Enzymol. 171, 513–531.
Kleffmann, T., Russenberger, D., von Zychlinski, A., Christopher,
W., Sjolander, K., Gruissem, W. and Baginsky, S. (2004) TheArabidopsis thaliana chloroplast proteome reveals pathwayabundance and novel protein functions. Curr. Biol. 14, 354–362.
Kruft, V., Eubel, H., Jansch, L., Werhahn, W. and Braun, H.P. (2001)Proteomic approach to identify novel mitochondrial proteins inArabidopsis. Plant Physiol. 127, 1694–1710.
Leaver, C.J., Hack, E. and Forde, B.G. (1983) Protein synthesis byisolated plant mitochondria. Methods Enzymol. 97, 476–484.
Marsh, M. (1989) Endosome and lysosome purification by free-flowelectrophoresis. Methods Cell Biol. 31, 319–334.
Meyer, E.H., Giege, P., Gelhaye, E., Rayapuram, N., Ahuja, U.,
Thony-Meyer, L., Grienenberger, J.M. and Bonnard, G. (2005)AtCCMH, an essential component of the c-type cytochromematuration pathway in Arabidopsis mitochondria, interacts withapocytochrome c. Proc. Natl Acad. Sci. USA, 102, 16113–16118.
Meyer, E.H., Heazlewood, J.L. and Millar, A.H. (2007) Mitochondrialacyl carrier proteins in Arabidopsis thaliana are predominantlysoluble matrix proteins and none can be confirmed as subunits ofrespiratory complex I. Plant Mol. Biol. 64, 319–327.
Millar, A.H., Sweetlove, L.J., Giege, P. and Leaver, C.J. (2001)Analysis of the Arabidopsis mitochondrial proteome. PlantPhysiol. 127, 1711–1727.
Morre, D.J., Nowack, D.D., Paulik, M., Brightman, A.O., Thornbor-
ough, K., Yim, J. and Auderset, G. (1989) Transitional endoplas-mic-reticulum membranes and vesicles isolated from animalsand plants – homologous and heterologous cell-free membranetransfer to golgi-apparatus. Protoplasma, 153, 1–13.
Nelson, C.J., Hegeman, A.D., Harms, A.C. and Sussman, M.R. (2006)A quantitative analysis of Arabidopsis plasma membrane usingtrypsin-catalyzed O-18 labeling. Mol. Cell Proteomics, 5, 1382–1395.
Neuburger, M., Journet, E.P., Bligny, R., Carde, J.P. and Douce, R.
(1982) Purification of plant-mitochondria by isopycnic centrifu-gation in density gradients of Percoll. Arch. Biochem. Biophys.217, 312–323.
Peltier, J.B., Cai, Y., Sun, Q., Zabrouskov, V., Giacomelli, L., Rudella,
A., Ytterberg, A.J., Rutschow, H. and van Wijk, K.J. (2006) Theoligomeric stromal proteome of Arabidopsis thaliana chlorop-lasts. Mol. Cell Proteomics, 5, 114–133.
Schlesier, B., Breton, F. and Mock, H.P. (2003) A hydroponic culturesystem for growing Arabidopsis thaliana plantlets under sterileconditions. Plant Mol. Biol. Rep. 21, 449–456.
Schmid, S.L., Fuchs, R., Male, P. and Mellman, I. (1988) Two distinctsubpopulations of endosomes involved in membrane recyclingand transport to lysosomes. Cell, 52, 73–83.
Taira, M., Valtersson, U., Burkhardt, B. and Ludwig, R.A. (2004)Arabidopsis thaliana GLN2-encoded glutamine synthetase is dualtargeted to leaf mitochondria and chloroplasts. Plant Cell, 16,2048–2058.
Taylor, N.L., Heazlewood, J.L., Day, D.A. and Millar, A.H. (2004)Lipoic acid-dependent oxidative catabolism of alpha-keto acids inmitochondria provides evidence for branched-chain amino acidcatabolism in Arabidopsis. Plant Physiol. 134, 838–848.
Taylor, N.L., Heazlewood, J.L., Day, D.A. and Millar, A.H. (2005)Differential impact of environmental stresses on the pea mito-chondrial proteome. Mol. Cell Proteomics, 4, 1122–1133.
Usher, K.M., Kuo, J., Fromont, J., Toze, S. and Sutton, D.C. (2006)Comparative morphology of five species of symbiotic and non-symbiotic coccoid cyanobacteria. Eur. J. Phycol. 41, 179–188.
Volkl, A., Mohr, H., Weber, G. and Fahimi, H.D. (1997) Isolation of rathepatic peroxisomes by means of immune free flow electropho-resis. Electrophoresis, 18, 774–780.
Zischka, H., Weber, G., Weber, P.J.A. et al. (2003) Improved prote-ome analysis of Saccharomyces cerevisae mitochondria by free-flow electrophoresis. Proteomics, 3, 906–916.
Zischka, H., Braun, R.J., Marantidis, E.P., Buringer, D., Bornhovd, C.,
Hauck, S.M., Demmer, O.C.J.G., Reichert, A.S., Madeo, F. and
Ueffing, M. (2006) Differential analysis of Saccharomyces cere-visiae mitochondria by free flow electrophoresis. Mol. Cell Pro-teomics, 5, 2185–2200.
594 Holger Eubel et al.
ª 2007 The AuthorsJournal compilation ª 2007 Blackwell Publishing Ltd, The Plant Journal, (2007), 52, 583–594