MECHANISM OF PURIFICATION OF CELLULOSE IN ...
302
MECHANISM OF PURIFICATION OF CELLULOSE IN ACIDIFIED AQUEOUS ACETONE by SALAH EL-DIN EL—SIDDIQUE AWAD EL-KARIM M.Sc., Leningrad Technical Forestry Academy, 1976 M.Sc., University of Manchester, Institute of Science and Technology (UMIST), 1981 A THESIS SUBMITTED IN PARTIAL FULFILMENT OF THE REQUIREMENTS FOR THE DEGREE OF DOCTOR OF PHILOSOPHY in THE FACULTY OF GRADUATE STUDIES THE FACULTY OF FORESTRY Department of Wood Science We accept this thesis as conforming to the required standard THE UNIVERSITY OF BRITISH COLUMBIA June, 1995 © Salah El-Din El-Siddique Awad El-Karim, 1995
-
Upload
khangminh22 -
Category
Documents
-
view
4 -
download
0
Transcript of MECHANISM OF PURIFICATION OF CELLULOSE IN ...

MECHANISM OF PURIFICATION OF CELLULOSE IN
ACIDIFIED AQUEOUS ACETONE
by
SALAH EL-DIN EL—SIDDIQUE AWAD EL-KARIM
M.Sc., Leningrad Technical Forestry Academy, 1976M.Sc., University of Manchester, Institute of Science
and Technology (UMIST), 1981
A THESIS SUBMITTED IN PARTIAL FULFILMENT OF
THE REQUIREMENTS FOR THE DEGREE OF
DOCTOR OF PHILOSOPHY
in
THE FACULTY OF GRADUATE STUDIES
THE FACULTY OF FORESTRY
Department of Wood Science
We accept this thesis as conforming
to the required standard
THE UNIVERSITY OF BRITISH COLUMBIA
June, 1995
© Salah El-Din El-Siddique Awad El-Karim, 1995

in presenting this thesis in partial fulfilment of the requirements for an advanceddegree at the University of British Columbia, I agree that the Library shall make itfreely available for reference and study. I further agree that permission for extensivecopying of this thesis for scholarly purposes may be granted by the head of mydepartment or by his or her representatives. It is understood that copying orpublication of this thesis for financial gain shall not be allowed without my writtenpermission.
(Signature)
Department of W , L c L-C
The University of British ColumbiaVancouver, Canada
Date J.Lj 121 f95
DE-6 (2188)

II
ABSTRACT
This project deals with solvent purification, a new
approach for the preparation of high-yield dissolving pulp
with characteristics similar to those recommended by the
standards. At the same time, the solvent purification
technique aims at removing and recovering chemically
unmodified, low molecular weight sugars that could further
be processed as by—products. In addition, the process offers
a reduction in waste water amounts associated with
dissolving pulp purification and economical reuse of the
solvent. Thus, environmental abatement is also taken into
account. The current technology is unable to achieve these
goals.
The major objective of this work is the elucidation and
characterization of the mechanism of the solvent
purification process, i.e., the acetonation mechanism. In
this thesis a detailed study on the mechanism of
purification of cellulose in acidified aqueous aceton has
been carried out. The mechanism has been proved to be of a
physico—chemical character. The physical phenomenon has been
found to be based on the H-bond disruption/destruction in
crystalline cellulose by acetone as a solvent. On the other
hand, the chemical hypothesis of the mechanism is verified
to be the formation of isopropylidene groups on carbohydrate
chains that leads to disproportionation of the polymer and
protection of the sugar ring. The validity of these

111
hypotheses has been investigated as follows; cotton has been
used throughout this study as a model compound and different
techniques such as DRIFT, Ge, HPLC, C-13 CP/MAS solid state
NMR, X—ray diffraction, GPC, and viscosity measurements have
been employed.
Factors affecting solvent purification treatment such
as acidity, residence time, temperature, type of acid, and
acetone concentration have also been investigated. The
investigation of those factors was conducted in a manner
that has helped elucidation of the acetonation mechanism
rather than optimization of the solvent purification
technique. Their impact on hydrogen bonding (ist hypothesis)
and isopropylidenation (2fld hypothesis) has been observed to
vary considerably.
Results obtained on hydrogen bonding, sugar
derivatives, crystallinity, molecular weight distribution,
and viscosity of cotton residues are in accord with the
above assumptions.
Based on the experimental findings of this work, a
mechanism of purification of cellulose in acidified aqueous
acetone is described.

iv
TABLE OF CONTENTS
Page
ABSTRACT . . . . . . . . . . .
TABLE OF CONTENTS . . . . . . . .
LIST OF TABLES . . . . . . . . .
LIST OF FIGURES . . . . . . . .
LIST OF ABBREVIATIONS . . . . . .
ACKNOWLEDGEMENTS . . . . . . . .
DEDICATION . . . . . . . . . .
1 INTRODUCTION . . . . . . . .
2 LITERATURE REVIEW. . . . . . . .
2.1 Trends of Current Dissolving Pulp
Purification Processes (Pulping and
Bleaching Operations) . . . .
2.1.1 Acid Suiphite Pulping . .
2.1.2 Prehydrolysis Kraft Pulping
2.1.3 Bleaching . . . . . .
2.2 The Hydrogen Bond - Development .
2.2.1 Hydrogen Bonding - H-bond Donor!
Acceptor Solvents . .
2.2.2 Hydrogen Bonding in Cellulosic
Material . . . . .
2.3 Solvent Effect on Stereochemistry and
• . . ii
iv
• . xiii
• . xvi
xxv
xxvii
xxix
• • .1
• . • 10
10
• • . 12
• . . 15
• . . 17
—
. 21
• . . . 21
28
Mechanism . • • . . . . . . . . . 36

V
2.4 Isopropylidene Chemistry - Formation
of Ketals . . . . . . . . . . . . . 41
2.4.1 Derivatives of Pentoses . . . . . . 47
2.4.2 Derivatives of Aldohexoses . . . . . 49
2.4.3 A Study of Sucrose - Disaccharide . . . 58
2.5 Elucidation and Characterization of a
Mechanism . . . . . . . . . . . . . 64
2.5.1 IR Investigation . . . . . . . . 64
2.5.2 Sugar Hydrolysis with the Involvement
of Acetone . . . . . . . . . . 68
2.5.3 The CP/MAS NMR Spectrometric
Investigation . . . . . . . . . 71
2.5.4 X—ray Diffraction Characterization . . 73
2.5.5 Molecular Weight Distribution
Characterization . . . . . . . . 75
3 MPTERIAL AND METHODS . . . . . . . . . . . . 79
3.1 Sample Preparation Procedures . . . . . . . 79
3.1.1 Raw Material . . . . . . . . . . 79
3.1.2 Raw Material Preparation for the
Analysis . . . . . . . . 79
3.1.3 Solvent Extraction of Sugars . . . . . 80
3.1.4 Isolation of Sugars from the Spent
Liquor and their Preparation for
HPLC Analysis . . . . . . . . . . 81

vi
3.1.5 Secondary Hydrolysis of Nonreducing
Sugars and Oligosaccharides . . . . 81
3.1.6 Preparation of Hydrolysate for Gas
Chromatographic Analysis . . . . . . 82
3.1.7 Acetonation of Cotton Hydrolysate
Reducing Sugars . . . . . . . . . 82
3.1.8 Sugar Hydrolysis - Standards
Preparation . . . . . . . . . . 83
3.1.9 Sugar Hydrolysis - Mixture of
Standards Preparation . . . . . . . 83
3.1.10 Sugar Hydrolysis - Isopropylidene
Derivatives of Sugars Standards
Preparation . . . . . . . . . . 84
3.1.11 Solvent Extraction of Cotton using
C—13 Labeled Acetone . . . . . . . 84
3.1.12 Preparation of Cotton Residues for
X—ray Diffraction Analysis . . . . . 85
3.1.13 Cotton Residue Carbanilation . . . . — . 85
3.1.14 Viscosity Determination . . . . . . 86
3.2 Analytical Methods . . . . . . . . . . 88
3.2.1 IR Analysis — Diffuse Reflectance
Infrared Fourier Transformer (DRIFT) . . 88
3.2.2 Detection of Isopropylidene Derivatives
by Gas Chromatography . . . . . 89

vii
3.2.3 Sugar Analysis — High Performance
Liquid Chromatography (HPLC) . . . . . 89
3.2.4 Cotton Solid State Study — C—13
CP/MAS NNR Spectrometry . . . . . . 91
3.2.5 X—ray Diffraction . . . . . . . . 92
3.2.6 Gel Permeation Chromatography . . . . 95
3.2.7 Viscosity Measurement . . . . . . . 96
4 RESULTS AND DISCUSSION . . . . . . . . . . 97
4.1 Mechanism of Purification of Cellulose
in Acidified Aqueous Acetone: Elucidation
and Characterization . . . . . . . . . . 97
4.1.1 Characteristics of the Raw Material
used for the Elucidation of the
Mechanism. . . . . . . . . . . . 97
4.2.1 IR (DRIFT) Study - Hydrogen Bonding
Changes (i.e., hydrogen bond
disruption/destruction) during Solvent
Purification Treatment . . . . . . . 97
4.1.2.1 Acetone Effect on Hydrogen
Bonding of Cotton Residues
during Solvent Purification
Treatment . . . . . . . . . 99

vii’
4.1.2.2 Other Factors Affecting
Hydrogen Bonding of Cotton
Residues during Solvent
Purification Treatment . . . 107
4.1.2.3 Effect of Type of Acid Catalyst
and Acid Concentration on
Hydrogen Bonding of Cotton
Residues during Solvent
Purification Treatment . . . 107
4.1.2.4 Effect of Temperature on
Hydrogen Bonding of Cotton
Residues during Solvent
Purification Treatment . . . 115
4.1.2.5 Effect of Residence Time
on Hydrogen Bonding of Cotton
Residues during Solvent
Purification Treatment . . . 119
4.1.3 Cotton Hydrolysis during Solvent
Purification Treatment . . . . . . 126
4.1.3.1 Gas Chromatographic (GC)
Investigation - Isopropylidene
Derivatives of Sugars,
Identification during Solvent
Purification Treatment . . . 126
4.1.3.2 HPLC Analysis . . . . . . 134

ix
4.1.3.2.1 Deacetonation —
Epimerization . . . 134
4.1.3.2.2 Quantitation — the
Predominance of
Acetonation Sugar
Product Formation
during theSolvent
Purification
Treatment . . . . 150
4.1.3.2.3 Changes in Weight
Loss during Solvent
Purification
Treatment . . . . 153
4.1.4 C—13 CP/MAS solid state NNR
Investigation — Isopropylidene
Intermediates in Residual Cotton
during Solvent Purification
Treatment . . . . . . . . . . . — 168
4.1.5 X-ray Diffraction Analysis - Changes
in Crystallinity and Crystallite
Breadth of Cotton Residues during
Solvent Purification Treatment . . . . 181

x
4.1.5.1 Acetone Effect on Crystallinity
and Crystallite Breadth of
Cotton Residues during Solvent
Purification Treatment . . . 181
4.1.5.2 Effect of Type of Acid Catalyst
and Acid Concentration on
Crystallinity and Crystallite
Breadth of Cotton Residues
during Solvent Purification
Treatment . . . . . . . 190
4.1.5.3 Effect of Temperature on
Crystallinity and Crystallite
Breadth of Cotton Residues
during Solvent Purification
Treatment . . . . . . . . 195
4.1.5.4 Effect of Residence Time on
Crystallinity and Crystallite
Breadth of Cotton Residue
during Solvent Purification
Treatment . . . . . . . . 199
4.1.6 Molecular Weight Distribution (MWD)
Analysis — Changes in Molecular Weight
Distribution of Solvent Purified Cotton
Residues . . . . . . . 203

x
4.1.6.1 Effect of Acid Concentration
and Type of Acid Catalyst on
Molecular Weight Distribution
of Solvent Purified Cotton
Residues . . . . . . . . 204
4.1.6.2 Effect of Temperature on
Molecular Weight Distribution
of Solvent Purified Cotton
Residues . . . . . . . 212
4.1.6.3 Effect of Residence Time on
Molecular Weight Distribution
of Solvent Purified Cotton
Residues . . . . . . . . 220
4.1.7 Viscosity Analysis - Changes in Viscosity
of Cotton Residues during Solvent
Purification Treatment . . . . . . 224
4.1.7.1 Effect of Acetone Concentration
on Viscosity of Cotton Residues
during Solvent Purification
Treatment . . . . . . . . 224
4.1.7.2 Effect of Acid Concentration
on Viscosity of Cotton Residues
during Solvent Purification
Treatment . . . . . . . . 228

xli
4.1.7.3 Effect of Temperature on
Viscosity of Cotton Residues
during Solvent Purification
Treatment . . . . . . . . 232
4.1.7.4 Effect of Residence Time on
Viscosity of Cotton Residues
during Solvent Purification
Treatment . . . . . . . . 235
5 OVERALL MECHANISM OF PURIFICATION OF CELLULOSE
IN ACIDIFIED AQUEOUS ACETONE . . . . 240
6 SUMRY . . . . . . . . . . . 245
7 CONCLUSIONS AND RECOMt4ENDATIONS . . . . . . . 250
7.1 Conclusions . . . . . . . . . . . . 250
7.2 Recommendations . . . . . . 259
8 LITERATURE CITED . . . . . . . . . . 260

xlii
LIST OF TABLES
Table # Page
1.1 Desirable characteristics of dissolvingPulps . . . . . . . . . . . . . . . 4
2.1 Bleaching Sequences for dissolving pulps . . . . 19
4.1.3.2.1 Reducing sugar (primary + secondaryhydrolyses) yield in cotton hydrolysatefollowing the treatment with: acetone:water: 90:10; 2 hr; 0.16 N HC1; 150 °C . . 152
4.1.5.1 Acetone effect on the crystallinity indexand crystallite breadth of cotton residuestreated with different concentrations ofacetone, while other variables were keptconstant (liquor/solid ratio: 10/1; 2 hr;150 °C; no acid catalyst added) . . . . . 188
4.1.5.2 Effect of type of acid catalyst on thecrystallinity and crystallite breadth ofcotton residues treated with differentacid concentrations, while other variableswere kept constant (acetone:water: 90:10;2 hr; 150 °C; TFA) . . . . . . . 193
4.1.5.3 Effect of type of acid catalyst on thecrystallinity and crystallite breadth ofcotton residues treated with differentacid concentrations, while other variableswere kept constant (acetone:water: 90:10;liquor/solid ratio: 10/1;2 hr; 150 °C;HC1) . . . . . . . . . . . . . . 193
4.1.5.4 Effect of temperature on the crystallinityindex and crystallite breadth of cottonresidues treated at different temperatures,while other variables were kept constant(acetone:water: 90:10; liquor/solid ratio:10/1; 2 hr; 1.5 N TFA) . . . . . . . . 198

xiv
4.1.5.5 Effect of residence time on thecrystallinity index and crystallitebreadth of cotton residues treated atdifferent residence times, while othervariables were kept constant(acetone:water: 90:10; liquor/solid ratio:10/1; 150 °C; 1.5 N TFA) . . . . . . . 202
4.1.5.6 Effect of residence time on thecrystallinity and crystallite breadthof cotton residues treated atdifferent residence times, while othervariables were kept constant(acetone:water: 90:10; liquor/solid ratio:10/1; 150 °C; 0.16 NHC1) . . . . . . 202
4.1.6.1 Effect of acid concentration onmolecular weight distribution andpolydispersity of cotton residueswhen TFA was used as catalyst(acetone:water: 90: 10; liquor/solidratio: 10/1; 2 hr; 150 °C, TFA) . . . . . 208
4.1.6.2 Effect of acid concentration onmolecular weight distribution andpolydispersity of cotton residueswhen HC1 was used as catalyst(acetone:water: 90:10; liquor/solidratio: 10/1; 2 hr; 150 °C; HC1) . . . . . 208
4.1.6.3 Effect of temperature on molecularweight distribution and polydispersityof cotton residues when TFA was used ascatalyst (acetone:water: 90:10; liquor/solid ratio: 10/1; 2 hr; 1.5 N TFA) . . . 216
4.1.6.4 Effect of temperature on molecularweight distribution and polydispersityof cotton residues when HC1 was used ascatalyst (acetone:water: 90:10; liquor/solid ratio: 10/1; 1 hr; 0.16 N HC1) . . . 216
4.1.6.5 Effect of temperature on molecularweight distribution and polydispersityof cotton residues when HC1 was used ascatalyst (acetone:water: 90:10; liquor/solid ratio: 10/1; 2 hr; 0.16 N HC1) . . . 218

xv
4.1.6.6 Effect of residence time on molecularweight distribution and polydispersityof cotton residues when TFA was used ascatalyst (acetone:water: 90:10; liquor!solid ratio: 10/1; 130 °C; 1.5 N TFA) . . . 223

xvi
LIST OF FIGURES
Fig. # Page
2.2.1.1 Homo-intermolecular hydrogen bond inalcohols, carboxylic acids and amides(the hydrogen bonds are denoted bydotted lines) . . . . . . . . . . 24
2.2.1.2 2—nitrophenol breaks its intramolecularH-bond to form an intermolecular one . . . 24
2.2.2.1 Unit cell of native cellulose accordingto Meyer and Misch . . . . . . . . . 29
2.2.2.2 Schematic cross—sections of cellulosechains according to Meyer (1942) — ovalsare glucose rings, and small circlesare soda molecules . . . . . . . . . 30
2.2.2.3 Intra—chain hydrogen bonds in cellulose . . 31
2.2.2.4 View of chain segments in cellulose Icrystal . . . . . . . . . . . . . 32
2.2.2.5 End view of cellulose chains in a unitcell . . . . . . 33
2.2.2.6 The two-part mechanisms of conversionof cellulose I into Na—cellulose I . . . . 35
2.3.1 Effect of increasing concentration ofdimethylsulphoxide (DMSO) on thespecific rotations at 25 °C of solutions(about 1%) of methyl 3-deoxy-3-L-erythro—pentopyranoside and of 1,2-0—isopropylidene 4-0-methyl—13-D-sorbopyranoside in ethylene chloride . . . 38
2.4.1 Preparation of 2-methyldioxolane . . . . . 43
2.4.2 c&D-glucose (pyranoid form) . . . . 44
2.4.3 cx—D-glucose (furanoid form) . . 44
2.4.4 j3-D—mannose (pyranoid form) . . 45
2.4.5 —D—mannose (furanoid form) . . . . . . 45

xvii
The formation of a six-membered4,6-dioxane ring . . . . . •
2, 3-O—isopropylidene-D—ribofuranose
1,2:3, 4—di—O—isopropylidene-D—arabinose
1,2:3, 5-di-O-isopropylidene-D-xylose
The formation of 1,2:3,4-di-O-isopropyl idene-a-D-galactopyranoside
The formation of 1,2:5,6—di—O—isopropylidene-a-D—glucofuranose.
Partial hydrolysis of 1,2:5,6—0-i sopropyl idene-D-glucofuranos e .
Formation of an isomeric di-0-isopropylidene-D-glucose in positionthe 1,2:3,5 . . . . . . . .
Formation of 6-chloro-6-deoxy-1,2:3, 5-di—0—isopropylidene—D—glucofuranose . . . . . . .
6—acetyl—1, 2—O-isopropylidene—D—glucofuranose . . . . . . .
Formation of 2,3:5,6—di-0—isopropyl idene-D-mannofuranose .
1,2:3, 4-di-0-isopropylidene-D-galactopyranose . . . . . .
1, 2-0-isopropylidene-D-galactopyranose .
to 9 Synthesis reaction of sucrose .
Acetylation of sucrose . . . .
Scheme for hydration of anhydrosugarsduring the hydrolysis of glycosidicstructures . . . . . . . .
Proposed 0-isopropylidene intermediatesfor cellulose during high temperature inacidified aqueous acetone . . .
• 47
• 48
• 48
• 48
• 50
2.4.6
2.4.1.1
2.4.1.2
2.4.1.3
2.4 .2.1
2.4.2.2
2.4.2.3
2.4.2.4
2.4.2.5
2.4.2.6
2.4.2.7
2.4.2.8
2.4.2.9
2.4.3.1
2.4.3.10
2.4.3.11
2.5.1.1
• 51
• 52
• 53
54
• 55
• 56
• 57
58
62
• 62
63
70
xviii
4.1.2.1 Effect of acetone on hydrogen bondingof cotton residues treated with differentacetone concentrations (liquor/solid ratio:10/1; 150 °C; 2 hr; no acid catalystadded) . . . . . . . . . . . . . 99
4.1.2.2 Effect of acid concentration onhydrogen bonding of solvent purifiedcotton when TFA was used as catalyst(acetone:water: 90:10; liquor/solidratio: 10/1; 2 hr; 150 °C) . . 109
4.1.2.3 Effect of HC1 acid catalystconcentration on hydrogen bondingof solvent purified cotton(acetone:water: 90:10; liquor/solidratio: 10/1; 2 hr; 150 °C) . . . . . . 111
4.1.2.4 Effect of temperature on hydrogenbonding of cotton residues duringsolvent purification treatment(acetone:water: 90:10; liquor/solidratio: 10/1; 1.5 N TFA) . . . . . . 117
4.1.2.5 Effect of temperature on hydrogenbonding of cotton residues duringsolvent purification treatment(acetone:water: 90:10; liquor/solidratio: 10/1; 0.16 N HC1) . . . . . . 118
4.1.2.6 Effect of residence time on hydrogenbonding of cotton residues duringsolvent purification treatment(acetone:water: 90:10; liquor/solidratio: 10/1; 1.5 N TFA) . . . . . . . 121
4.1.2.7 Effect of residence time on hydrogenbonding of cotton residues duringsolvent purification treatment(acetone:water: 90:10; liquor/solidratio: 10/1; 0.16 N HC1) . . . . . . 123
4.1.3.1 1,2—O—isopropylidene—a—D—glucofuranose . . 127
4.1.3.2 1,2:5, 6—di—O—isopropylidene—a—D—glucofuranose . . . . . . . . . . 127
4.1.3.3 2,3:5, 6—di—O—isopropylidene—D—mannofuranose . . . . . . . . 128
xix
4.1.3.4 1,2:3,4—di—O—isopropylidene—a—D—galactopyranose . 128
4.1.3.5 GC chromatogram of nonreducing sugarsof the cotton hydrolysate of solventpurification treatment (acetone :water:90:10; liquor/solid ratio: 10/1; 2 hr;150 °C; 0.16 N HC1) . . . . . . . . 132
4.1.3.6 GC chromatogram of acetonated reducingsugars of cotton hydrolysate of solventpurification treatment (acetone :water:90:10; liquor/solid ratio: 10/1; 2 hr;150 °C; 0.16 N HC1) . . . . . . . . 133
4.1.3.2.1 HPLC sugar chromatogram of cottonhydrolysate obtained at 150 °C (acetone:water: 90:10; liquor/solid ratio: 10/1;2 hr; no acid catalyst) . . . . . . . 137
4.1.3.2.2 HPLC sugar chromatogram of cottonhydrolysate obtained at 130 °C (acetone:water: 90:10; liquor/solid ratio: 10/1;2 hr; 1.5 N TFA) . . . . . . . . . 138
4.1.3.2.3 HPLC sugar chromatogram of cottonhydrolysate obtained at 130 °C (acetone:water: 90:10; liquor/solid ratio; 10/1;2 hr; 0.16 N HC1) . . . . . . . . . 139
4.1.3.2.4 HPLC sugar chromatogram of cottonhydrolysate obtained at 150 °C (acetone:water: 90:10; liquor/solid ratio: 10/1;2 hr; 1.5 N TFA) . . . . . . . . . 140
4.1.3.2.5 HPLC sugar chromatogram of cottonhydrolysate obtained at 150 °C (acetone:water: 90:10; liquor/solid ratio: 10/1;2 hr; 0.16 N HC1) . . . . . . . . . 141
4.1.3.2.6 HPLC sugar chromatogram of cottonhydrolysate obtained at 180 °C (acetone:water: 90:10; liquor/solid ratio: 10/1;1 hr; 1.5 N TFA) . . . . . . . . . 142
4.1.3.2.7 HPLC sugar chromatogram of cottonhydrolysate obtained at 180 °C (acetone:water: 90:10; liquor/solid ratio: 10/1;1 hr; 0.16 N HC1) . . . . . . . . . 143

xx
4.1.3.2.8 HPLC sugar chromatogram of 1,6-anhydroglucose . . . . . . . . 144
4.1.3.2.9 HPLC sugar chromatogram of cottonhydrolysate obtained at 180 °C (acetone:water: 90:10; liquor/solid ratio: 10/1;3hr;1.5NTFA) . . . . . . . . . 146
4.1.3.2.10 HPLC sugar chromatogram of cottonhydrolysate obtained at 180 °C (acetone:water: 90:10; liquor/solid ratio: 10/1;3 hr; 0.16 N HC1) . . . . . . . . . 147
4.1.3.2.11 HPLC sugar chromatogram of cottonhydrolysate obtained at 150 °C (acetone:water: 90:10; liquor/solid ratio: 10/1;2 hr; 0.8 N HC1) . . . . . . . . . 148
4.1.3.2.12 HPLC sugar chromatogram of cottonhydrolysate obtained at 150 °C (acetone:water: 90:10; liquor/solid ratio: 10/1;2 hr; 3 N TFA) . . . . . . . . . . 149
4.1.3.2.3.1 Effect of acetone concentration onthe weight loss of solvent purifiedcotton (150 °C; 2 hr; no acid catalyst) . 156
4.1.3.2.3.2 Effect of temperature on the weightloss of solvent purified cotton(acetone:water: 90:10; liquor/solid ratio:10/1; 1.5 N TFA) . . . . . . . . . 159
4.1.3.2.3.3 Effect of temperature on the weightloss of solvent purified cotton(acetone:water: 90:10; liquor/solid ratio: —
10/1; 0.16 N HC1) . . . . . . . . . 160
4.1.3.2.3.4 Effect of residence time on theweight loss of solvent purified cotton(acetone:water: 90:10; liquor/solid ratio:10/1; 1.5 N TFA) . . . . . . . . . 162
4.1.3.2.3.5 Effect of residence time on theweight loss of solvent purified cotton(acetone:water: 90:10; liquor/solid ratio:10/1; 0.16 N HC1) . . . . . . . . . 163
xd
4.1.3.2.3.6 Effect of acid concentration on theweight loss of solvent purified cotton(acetone:water: 90:10; liquor/solid ratio:10/1; 2 hr; 150 °C; TFA) . . . . . . 166
4.1.3.2.3.7 Effect of acid concentration on theweight loss of solvent purified cotton(acetone:water: 90:10; liquor/solid ratio:10/1; 2 hr; 150 °C; HC1) . . . . . . 167
4.1.4.1 C—13 CP/MIS NMR spectrum of the residualcotton treated with normal acetone(acetone:water: 90:10; liquor/solid ratio:10/1; 2 hr; 150 °C; 0.16 N HC1) . . . . 170
4.1.4.2 C-13 CP/MAS NMR spectrum of untreatedcotton (control) . . . . . . . . . 171
4.1.4.3a C-13 CP/MS NNR spectrum of the residualcotton treated with C-13 labeled acetone(acetone:water: 90:10; liquor/solid ratio:10/1; 2 hr; 150 °C; 0.16 N HC1) . . . . 172
4.1.4.3b Non quaternary carbons NNR Spectrum ofthe residual cotton treated with C—13labeled acetone (acetone:water: 90:10;liquor/solid ratio: 10/1, 2 hr; 150 °C;0.16 N HC1) . . . . . . . . . . . 173
4.1.4.4 Proposed formation of isopropylidenegroups along the cellulose chain . . . . 177
4.1.4.5 Proposed formation of isopropylidenegroups along the cellulose chain athigher temperatures . . . . . . 178
4.1.4.6 Solvent purified cellulose chain ofresidual cotton . . . . . . . 179
4.1.5.1 Comparison of diffraction patterns oftreated (acetone:water: 50:50; liquor!solid ratio: 10/1, 2 hr; 150 °C) withuntreated cotton (control) . . . . . . 185
4.1.5.2 Comparison of diffraction patterns oftreated (acetone:water: 70:30, 80:20,and 90:10; liquor/solid ratio: 10/1;2 hr; 150 °C) with untreated cotton(control) . . . . . . . . . . . 186

xxii
4.1.5.3 Comparison of diffraction patterns oftreated (acetone:water: 90:10; liquor!solid ratio: 10/1; 2 hr; 150 °C) withuntreated cotton (control) . . . . . . 187
4.1.5.4 Comparison of diffraction patterns oftreated cotton at different acidconcentrations (acetone:water: 90: 10;liquor/solid ratio: 10/1; 2 hr; 150 °C;TFA) . . . . . 191
4.1.5.5 Comparison of diffraction patterns oftreated cotton at different acidconcentrations (acetone:water: 90:10;liquor/solid ratio: 10/1; 2 hr; 150 °C;HC1) . . . . 192
4.1.5.6 Comparison of diffraction patterns ofcotton residues treated at differenttemperatures, while other variableswere kept constant (acetone:water: 90:10;liquor/solid ratio: 10/1; 2 hr; 1.5 NTFA) . . . . . . 197
4.1.5.7 Comparison of diffraction patterns ofcotton residues treated at differentresidence times, while other variableswere kept constant (acetone:water: 90:10;liquor/solid ratio: 10/1; 150 °C, 1.5 NTFA) . . . . . . . . . . . . . 200
4.1.5.8 Comparison of diffraction patterns ofof cotton residues treated at differentresidence times, while other variableswere kept constant (acetone:water: 90:10;liquor/solid ratio: 10/1; 150 °C; 0.16 NHC1) . . . . . . . . . . . . . 201
4.1.6.1 Effect of acid concentration on themolecular weight distribution of cottonresidues when TFA was used as catalystin aqueous acetone (acetone:water: 90:10;liquor/solid ratio: 10/1; 2 hr; 150 °C) . 206
4.1.6.2 Effect of acid concentration on themolecular weight distribution of cottonresidues when HC1 was used as catalystin aqueous acetone (acetone:water: 90:10;liquor/solid ratio: 10/1; 2 hr; 150 °C) . 207

Xxii
4.1.6.3 Effect of temperature on the molecularweight distribution of cotton residueswhen TFA was used as catalyst in aqueousacetone (acetone:water: 90:10; liquor!solid ratio: 10/1; 2 hr; 1.5 N TFA) . . . 214
4.1.6.4 Effect of temperature on the molecularweight distribution of cotton residueswhen HC1 was used as catalyst in aqueousacetone (acetone:water: 90:10; liquor!solid ratio: 10/1; 1 hr; 0.16 N HC1) . . 215
4.1.6.5 Effect of temperature on the molecularweight distribution of cotton residueswhen HC1 was used as catalyst in aqueousacetone (acetone:water: 90:10; liquor!solid ratio: 10/1; 2 hr; 0.16 N HC1) . . 217
4.1.6.6 Effect of residence time on themolecular weight distribution of cottonresidues when TFA was used as catalystin aqueous acetone (acetone:water: 90:10;liquor/solid ratio: 10/1; 130 °C; 1.5 NTFA) . . . . . . . . . . . . 222
4.1.7.1 Effect of acetone concentration onviscosity of cotton residues when no acidcatalyst added (liquor/solid ratio: 10/1;2 hr; 150 °C . . . . . . . . . . 227
4.1.7.2 Effect of acid concentration on viscosityof cotton residues when TFA was used ascatalyst in aqueous acetone (acetone:water:90:10; liquor/solid ratio: 10/1; 2 hr;150 °C) . . . . . . . . . . . . 230
4.1.7.3 Effect of acid concentration on viscosityof cotton residues when HC1 was used ascatalyst in aqueous acetone (acetone:water:90:10; liquor/solid ratio: 10/1; 2 hr;150 °C) . . . . . . . . . . . . 231
4.1.7.4 Effect of temperature on viscosityof cotton residues when TFA was used ascatalyst in aqueous acetone (acetone:water:90:10; liquor/solid ratio: 10/1; 2 hr) . . 233
4.1.7.5 Effect of temperature on viscosityof cotton residues when HC1 was used ascatalyst in aqueous acetone (acetone:water:90:10; liquor/solid ratio: 10/1; 2 hr) . . 234
xxiv
4.1.7.6 Effect of residence time on viscosityof cotton residues when TEA was used ascatalyst in aqueous acetone (acetone:water:90:10; liquor/solid ratio: 10/1;1.5 N TFA) . . . . . . . . . . 237
4.1.7.7 Effect of residence time on viscosityof cotton residues when HC1 was used as
• catalyst in aqueous acetone (acetone:water:90:10; liquor/solid ratio: 10/1;0.16 N HC1) . . . . . . . . . . . 238
5.1 Mechanism ofpurification of cellulosein acidified aqueous acetone at highertemperatures . . . . . . . . . . 244

xxv
LIST OF ABBREVIATIONS
DP - Degree of Polymerization
CP — Centipoise
CP/MAS - Cross Polarization/Magic Angle Spinning
NNR - Nuclear Magnetic Resonance
GPC — Gel Permeation Chromatography
IR - Infrared
DRIFT - Diffuse Reflectance Infrared Fourier Transform
GC - Gas Chromatography
HPLC - High Performance Liquid Chromatography
- Weight-average Molecular Weight
M - Number-average Molecular Weight
CTH - Control Temperature and Humidity
TFA - Trifluoroacetic Acid
AOX - Adsorbable Organic Halides
HBD - Hydrogen Bond Donor
HBA - Hydrogen Bond Acceptor
A - Angstrom
- Micron —
Hz - Hertz
Cr1 - Crystallinity Index
A - Wavelength
DMF - Dimethylformamide
r.t. — Retention Time
HNF - Hydroxymethylfurfural
CuEn - Cupriethylenediamine

xx’
FWHN - Full Width at Half Maximum Height
S.D. - Standard Deviation
MWD — Molecular Weight Distribution
MW/ME — Polydispersity
Me - Methyl
L - Litre
mL — Millilitre
— Microlitre
g - gram
hr — hour
cm.1 — wavenumber
C — Celsius
DMSO - Dimethylsuiphoxide
I — Intensity
mg - Milligram
ppm — Parts Per Million
Ac - Acetyl
M - Molarity
psi — Pound Per Square Inch
N - Normality —
o.d. - oven dry
XRD - X-ray Diffraction
G — Glucose
TAPPI - Tecnhnical Association of the Pulp and Paper
Industry
THF - Tetrahydrofuran
GC-MS - Gas Chromatography-Mass Spectrometry

xxvii
ACKNOWLEDGEMENTS
I would like to thank my supervisor Dr. L. Paszner,
Professor, Faculty of Forestry, for his help, interest and
guidance throughout the duration of this work.
Thanks are due to Dr. J.B. Farmer, Chemistry Department,
The University of British Columbia, Dr. S.C. Ellis, Faculty of
Forestry, The University of British Columbia, Dr. D.M. Ouchi,
Simons International, Vancouver and the late Dr. P.R. Steiner,
Faculty of Forestry, The University of British Columbia, for
their useful suggestions, criticisms, and encouragement
Acknowledgement and appreciation are extended to Dr. H.
Grondey, Chemistry Department, The University of British
Columbia, for her assistance in obtaining invaluable C—13 NNR
spectra, interest and constructive criticism in this area.
Thanks are extended to Dr. D. Leclerc, Pulp and Paper
Research Institute of Canada (PAPRICAN), for permitting me to
use the diffuse reflectance infrared Fourier transform
spectrometer (DRIFT) and helping obtain invaluable information
in hydrogen bonding.
Many thanks to Dr. M.M. Nazhad for his assistance in X
ray diffraction and GPC analyses.
Acknowledgement is due to Dr. C. Jeong for his help in
HPLC and GC analyses.
The help given to me by Mr. S.K. Yatich in statistical

xxviii
analysis, Faculty of Forestry (Remote Sensing), The University
of British Columbia, is duly acknowledged.
Grateful acknowledgement is made to Dr. H.A. Yassin, Dr.
M. Hassan, Geography Department, The University of British
Columbia, and Mr. E. Lee, Department of Forest Sciences,
Faculty of Forestry; for the various software programs that
helped me to produce many figures and their help in printing
the thesis versions at different stages.
Sincere acknowledgement goes to former directors of
graduate studies, Faculty of Forestry; Dr. J.W. Wilson
(Emeritus) and Dr. D.L. Golding for their support and care.
Acknowledgement is made to the Sudanese Community in
Vancouver for their support.
Many thanks are extended to my brothers, sisters,
relatives and friends for their encouragement and support.
Finally, deep gratitude is expressed to my wife,
Awatif, son, Teto, and daughter, Azza for their patience,
endurance, unceasing support and encouragement. —

xxix
DED ICAT ION
to my wife, Awatif
and
to the memory of my parents

1
1. INTRODUCTION
North American dissolving pulp producers, in recent
years, have been hurt by high production costs and
environmental pressures at many older prehydrolysis kraft
and suiphite mills that are not economical to clean up.
Competition from growing acceptance of low—cost synthetic
fibers and films is another major concern. Rayon staple, for
example, is under enormous competitive pressure from
polyster, while plastic films (oriented polypropylene) are
displacing cellophane (Mikulenka, 1989). U.S. dissolving
pulp production declined from a level of 1.4 million metric
tons in the mid seventies to a low of 991000 tons in the
1982 recession. The Canadian dissolving pulp markets
followed a similar trend; declining from a peak of about 0.5
million metric tons in 1969 to around 0.2 in 1990 (Durbak,
1993). Today, the U.S. dissolving pulp capacity is about 1.5
million tons, and the Canadian around 0.3 million metric
tons, largely under utilized. Dissolving pulp manufacture
has remained more expensive than synthetic fibers becau.e of
the stringent purity requirements and low processed
cellulose yields (Durbak, 1993).
Although dissolving grade pulps are prepared by
different pulping processes and under varying bleaching
conditions, at the end, the product cellulose should possess
the following characteristics:
1- high alpha—cellulose content
2— low hemicellulose content

2
3- relatively high degree of polymerization (DP)
4— low ash content
5— good molecular uniformity.
In this respect, the feasibility of manufacture and
competitiveness of dissolving pulp is largely dependent on
the yield of purified pulp. In other words, alpha-cellulose
content represents an important parameter of pulp purity.
However the total amount of alpha-cellulose originally in
wood remaining in the pulp is in the range of about 15—18%
higher than the 28—32% retained in purified pulps (i.e, 43
to 50%). In this respect, the losses during pulp
purification (pulping and bleaching) operations account for
a remarkable shrinkage in industrial revenue due to the
considerable yield loss not only from removal of
hemicellulose and lignin but also cellulose itself. These
losses are reflected in the dissolving pulp price.
At the present time, the lack of appropriate technology
applicable to the manufacture of high-yield dissolving pulp
appears to be the main reason for the appreciable losses in
alpha-cellulose yield and quality of pulp in general. The
acid suiphite pulping process, for a long time, has been
used in manufacture of dissolving pulp. In this process,
delignification and hemicellulose removal are accomplished
under harsh acidic cooking conditions. Within such
conditions also a considerable amount of degraded cellulose
is removed in the spent cooking liquor. As a consequence,
the final pulp yield of high alpha-cellulose content is

3
around 28-32% of that of the original wood (Golden, 1955).
During the last decades the acid suiphite pulping industry
has witnessed a decline in the number of mills all around
the world. This is due to the fact that there has been a
sharp switch to the prehydrolysis kraft pulping in
dissolving pulp manufacturing because the kraft process
proved to be suitable for all types of raw materials
(including resinous species) that the acid suiphite process
was unable to pulp (Rydholm, 1965).
Prehydrolysis in kraft pulping is a pretreatment of the
raw material to achieve the following:
1— to lower the hemicellulose content in thesubstrate, and
2- to give a better pore opening in the cell wallfor easier liquor penetration during subsequenttreatments (bleaching and alkali extraction).Hemicelluloses, particularly the xylans respondwell to removal by prehydrolysis (Rydholm, 1965).
Methods for attainment of high alpha-cellulose purity
in wood puips are complex and a number of schemes for alkali
extraction of high brightness bleached pulps have been
proposed for removal of alkali-soluble impurities (Schempp,
1971; Kleinert, 1956). However, brightness and low alkali
solubility alone do not ensure high quality viscose and
acetate puips. Other factors such as accessibility during
acetylation, filterability, and determination of haze have
been found to qualify the pulp products (Rydholm, 1965.
Golden, 1955). As for alpha—cellulose content in dissolving
pulp manufacture, it is accepted to be in the range of 89—

4
97%. Desirable parameters of dissolving puips are
illustrated in Table 1 (Golden, 1955).
Table 1. Desirable Characteristics of Dissolving Puips(Golden, 1955).
Pulp Bleached ci-cellulose Pentosans/ Viscositytype pulp Mannan
yield% CP
Acetate 28—32 95—97 <2.1 30—70
Viscose 32—36 89—94 <4.5 5—20
To reduce such losses (i.e 2/3 of wood) resulting from
the current technological operations, solvent purification,
a novel technique, appears to offer numerous advantages.
These can be summarized as follows;
1. high alpha-cellulose yield by provision of
selective simultaneous carbohydrate hydrolysis (no
cellulose unit degradation) and delignificatin of
conventional unbleached puips,
2. maximum exploitation of the chemical value of
the released products — sugar and lignin,
facilitated by dissolution (hydrolysis) without
modification - (due to the formation of protecting
groups),
3. cutting down bleaching costs,

5
4. elimination of chlorine and chlorine compounds
as reagents in bleaching operations,
5. reduction of process effluents by recovery of
the solvent, and
6. more uniform molecular weight distribution of
the purified cellulose.
Obviously, such gains will be consistent with the new
sustainable development principle and “making more from
less”, whereby, a significant increase in the industrial
revenue could be achieved.
The mechanism of solvent purification has been proposed
to be of a physico—chemical character. The physical
phenomenon is based on the hydrogen bond disruption in the
crystalline cellulose by acetone as a solvent. On the other
hand, the chemical hypothesis of the mechanism is suggested
to be the formation of isopropylidene groups on carbohydrate
chains that lead to disproportionation of the polymer and
protection of the monomer sugar thus generated. —
Hence, the study pursues the following major
hypotheses; each one being supported by a number of sub—set
of hypotheses;

6
1- H-bond disruption/destruction by the interaction of
acetone with the cellulose hydroxyls
a— acetone, as a major volume fraction in the solvent
(acetone/water) has the ability to deactivate the water
molecules and brings about irreversible weakness in the
hydrogen bonding system of the cellulosic material.
b— interaction of acetone with cellulose leads to
stereochemical changes (i.e, rotational). This phenomenon
brings about rearrangement in hydrogen bonding that leads to
considerable disruption of the H-bonding system of the
cellulosic material.
c- acetone, aided with high temperature and acid catalyst,
is able to interact with cellulose and give rise to further
stereochemical alterations (i.e, configurational and
conformational) that subsequently disrupt/destroy the H-bond
of the cellulose system.—
d- accessibility of cellulose is affected by temperature,
reaction time, acetone concentration, type of acid catalyst
and acid concentration and provides conditions for selective
purification of dissolving puips.

7
2— Formation of isoproDylidene intermediates on the
cellulosics by the reaction of acetone with cellulose
molecules
a— acetone, in the presence of an acid catalyst, is capable
of interacting uniformly with cellulose and forming
isopropylidene groups along the chains.
b— material removed by solvent purification consists largely
of reducing and non—reducing sugars.
c— formation of isopropylidene groups on cellulose chains
produces a cellulosic material with high molecular
uniformity.
d— a major volume fraction of acetone, in the presence of an
acid catalyst, leads to significant degradation (i.e., drop
in CuEn viscosity) of the cellulose.
e— isopropylidene intermediates contribute simultaneously to
decrystallization of the original cellulosic material and
enhancement of the residues crystallinity.
f— temperature, acetone concentration, reaction time, type
of acid catalyst and acid concentration contribute
differently to the removal of cellulose.

8
To investigate the validity of these hypotheses cotton
has been used throughout this study as a model compound.
Cotton consists of glucose units mainly; however, trace
amount of other substances are found in cotton (Hudson et
al., 1948). The following methods have been employed:
1- Infrared (DRIFT) study - changes in hydrogen bonding,
i.e., hydrogen bond disruption/destruction during the
solvent purification treatment.
2- Cotton hydrolysis during solvent purification treatment.
2.1- Gas chromatographic (GC) investigation -
isopropylidene derivatives of sugars identification during
solvent purification treatment.
2.2- High performance liguid chromatography (HPLC)
analysis - i. deacetonation, ii. quantitation - the
predominance of acetonation sugar products, and iii. changes
in weight loss during the solvent purification treatment.
3— C—13 cross polarization/magic angle spinning (CP/MAS) NMR
structural investigation — formation of isopropylidene
intermediates in the solid state during solvent purification
treatment.
4- x-ray diffraction analysis - changes in crystallinity and
crystallite breadth during solvent purification treatment.
5— Gel permeation chromatographic (GPC) analysis - changes
in molecular weight distribution (molecular uniformity)
during solvent purification treatment.
6— Viscosity analysis — changes in viscosity, i.e., degree
of polymerization during solvent purification treatment.

9
Factors affecting treatment such as acetone
concentration, residence time, temperature, type of acid
catalyst and acid concentration have also been investigated.
Since, the main objective of this study is the elucidation
and characterization of the mechanism, the investigation of
the factors will be carried out in a way that would help
elucidate the mechanism of the solvent treatment rather than
optimization of the process.
10
2 LITERATURE REVIEW
2.1 Trends of Current Dissolving Pulp Purification Processes(Pulping and Bleaching Operations)
The current pulp purification processes (i.e., pulping
and bleaching operations) are known to be tremendous
chemical by-product generators. consequently, 65-70% of the
original wood is lost during processing for this purpose
(Golden, 1955). These losses have adverse effects on the
economics of dissolving pulp production and represent
potential reduction in revenue. In this respect, a new
purification process of high specificity in delignification
and hemicellulose removal is vitally needed.
Conceptually, higher yield dissolving puips can be
achieved by the application of solvent purification to
conventional puips. This treatment is expected to increase
the alpha-cellulose content in puips by the selective
removal of hemicellulose and lignin without leading to
further cellulose fragmentation. On the other hand, such a
process offers the potential for recovery of chemical by
products without chemical modification, ensures solvent
recovery, and enhances the properties of the dissolving pulp
(e.g., accessibility, molecular- uniformity etc.).
Dissolving puips are highly purified grades of wood
cellulose with alpha-cellulose content of about 89—97%
(Golden, 1955). They are used to produce man—made fibres

11
(rayon and acetate), films (cellophane), plastics (cellulose
acetates), and chemicals (methyl cellulose and
carboxymethylcellulose). Two pulping processes are used to
produce dissolving puips, mainly, from soft— and hardwoods.
These are the acid sulphite and prehydrolysis kraft pulping
processes (Rydhoim, 1965). By means of these processes
different pulp grades of varying quality can be prepared,
each one suitable for a specific end—use.
The quality required of a dissolving pulp for a
specific purpose depends on its purity and reactivity. For
example, acid sulphite dissolving pulps are considered as
“reactive” pulps, suitable for production of rayon and
cellophane prepared under lenient rayon (viscose) processing
conditions. Prehydrolysis kraft pulps, in general, are
assigned to produce stronger rayon fibres for uses such as
high-wet-modulus textile rayon and high tenacity rayons for
tire cords (Mikulen]ca, 1989). Cotton linters are also used
to produce cellulose acetates and cellulose plastics
(Mikulenka, 1989).—
Dissolving pulp products can be divided into two major
groups based on the conversion products, i.e., esters, and
ethers. Rayon and acetate cellulosic fibres are believed to
consume 77% of dissolving pulp production (Durbak, 1993).
The products constitute viscose rayon staple, filament yarn,
acetate staple, and acetate fibres (tow) which are used
primarily for textiles, tire cords, various industrial
products and cigarette filters (Durbak, 1993).

12
Cellulose ethers are widely used in pharmaceutical,
cosmetics, detergents, food products, superabsorbants, and
additives for oil well drilling muds. Finally, cellulose
nitrates are used in printing inks, laquers and rocket fuels
(Mikulenka, 1989).
The objectives of dissolving pulp purification
processes are as follows;
1— maximum removal of the lignin contained in thepulp before excessive cellulose degradation takesplace,
2— depolymerization of hemicelluloses in order tofacilitate their removal either during cooking(prehydrolysis) or in subsequent bleaching andsteeping operations (sulphite),
3— control of cellulose depolymerization in orderto achieve the required viscosity levels, and
4- attainment of required quality levels forvarious end—uses.
2.1.1 Acid Suiphite Pulping
The suiphite dissolving pulp processing conditions are
considerably different from those for paper pulp production.
The retention of hemicelluloses in paper pulps is an
advantage, while in dissolving pulps they have an adverse
effect on the quality, i.e the presence of hemicelluloses
and lignin impair the molecular uniformity of the dissolving
puips.
The sulphite cooking conditions for dissolving pulps
are generally, characterized by fast temperature rise times,

13
high maximum temperatures, high acidity and low combined
sulphur dioxide . The energies of activation of the sulphite
dissolving pulp cooks have been found to be as follows;
1- for delignification about 22 Kcal/mol (Yorston,
1942; Morud, 1958)
2— for hemicellulose hydrolysis around 28 Kcal/mol
(Konkin et al., 1959)
3— for cellulose hydrolysis about 28—44 Kcal/mol
(Wise et al., 1952).
The action of acid sulphite liquors on hemicellulose removal
during dissolving pulping corresponds to hydrolysis
reactions of carbohydrates. These include the acidic
hydrolysis of glycosidic bonds to form low molecular weight
fragments (reduction of DP) leading to their ultimate
solubility in the cooking liquor and degradation to
oligomeric and monomeric sugars. The hydrolysis of
hemicelluloses usually precedes that of cellulose.
Investigations of spent sulphite liquor composition during
the course of a softwood cook, showed that arabinose and
galactose were the first sugars dissolved (Wenzl, 1970).
Usually, this takes place at a temperature of about 100 0C.
Xylose appears next followed by mannose and small quantities
of glucose at a higher cooking temperature of 130 0C. This
has been substantiated by analysis of the sugars in the side
relief condensate (Wenzl, 1970). Arabinose and xylose
constitute more than 60% of the total sugars found in the

14
pulping effluent stream. In softwoods, the arabinose
originates from the acid labile arabinofuran (L
arabinofuranose) side unit on a 4—0—
methylgiucuronoarabinoxylan (Wenzl, 1970). Similarly,
galactose originates from galactoglucomannan. In contrast,
in the spent liquor, arabinose constitutes only 15-25% of
the total sugars detected (Wenzl, 1970). The polymeric
nature and reaction mechanism involving the carbohydrates
has been studied by Hamilton (Hamilton, 1962). Furanosidic
bonds are cleaved much more easily than those of
pyranosides. This accounts for the rapid dissolution of
arabinose in the suiphite cook. However, morphological
factors prevail over chemical considerations, in that the
rate of hydrolysis of glucomannan and xylan is about 15-3 0
times greater than that of cellulose, or about 4—5 times
that predictable with model compounds.
In addition to glycosidic hydrolysis reactions, acetyl
groups on the hemicelluloses are also hydrolyzed (split off)
yielding acetic acid.
Other carbohydrate reactions taking place in the
sulphite cooking liquor include conversion of aldoses into
alpha- hydroxysuiphonic acids, as well as aldonic acids. The
alpha- hydroxysuiphonic acids represent a large proportion
of the loosely combined sulphur dioxide in spent liquors.
Under suiphite pulping conditions xylose can be dehydrated
to furfural, while glucose, at relatively high temperature,
is decomposed to levulinic and formic acids from

15
hydroxymethylfurfural as the intermediate dehydration
product. Dehydration reactions are favoured by low pH and
high temperature such as are normally found in dissolving
pulp-type cooking. Details of the decomposition reactions
occurring in the spent liquor are shown elsewhere (Ingruber
et al., 1970).
2.1.2 Prehydrolysis Kraft Pulping
Earlier, before 1950, dissolving grade puips were
produced exclusively by the acid sulphite pulping process
(Rydholm, 1965). Although the suiphite process is still the
method of choice for the production of certain types of
dissolving puips (Schempp, 1971), partly because of the
recent remarkable decline in the number of sulphite mills
and worldwide change in the raw material base, sulphite
pulping for dissolving grade puips has now been considerably
replaced by the prehydrolysis kraft process (Simmonds et
al., 1953; Richter, 1956). This process is vital for pulping
resinous species such as pines, Douglas—fir, larches and
non—woody materials (e.g., jute and kenaf) which are not
suitable raw materials for pulping by the acid suiphite
process.
In addition, the conventional kraft process is known to
stabilize residual hemicelluloses against further alkaline
reaction, whereas it is not possible to obtain acceptable
quality dissolving pulp through subsequent treatment in the

16
bleach plant. In order to prepare a dissolving grade pulp by
the kraft process, it is of importance to give the chips an
acidic pretreatment before the alkaline pulping stage
(Rydhoim, 1965).
During prehydrolysis treatment, a considerable amount
of material, in the order of 10% of the original wood, is
removed in the acidic solution. Under these conditions (100-
130 0C, 2 hr), the cellulose is fairly resistant to attack
(Bernardin, 1958). However, the hemicelluloses have been
greatly degraded to a much shorter chain length (i.e about
30% of the original DP) (Bernardin, 1958) and can,
therefore, be easily removed in the subsequent kraft cook by
means of peeling and other alkaline hydrolysis reactions.
Primary delignification also takes place during the kraft
cook. However, because of possible lignin condensation
reactions during the prehydrolysis treatment, the residual
lignin in unbleached prehydrolysis puips is difficult to
solublize during bleaching as compared to conventional kraft
puips (Rydhoim, 1965).—
Prehydrolysis in kraft pulping is assigned primarily as
a pretreatment of chips to reduce not only the residual
hemicellulose content in the final pulp, but also to provide
a better pore opening in the fibre wall matrix in wood chips
for easier penetration of the alkaline liquor (Rydholm,
1965). It is also worth mentioning that the prehydrolysis
treatment is designed to afford xylose recovery from high
hemicellulose content species. This could be of economical

17
value. While recovery of hemicellulose values from suiphite
waste liquor by fermentation to ethanol and single cell
protein is a well known process (Sjolander et al., 1938),
similar processes based on kraft prehydrolysates although
proposed by Suizer (Switzerland) have not been implemented
as yet. In conclusion, the final purified (bleached and
alkali extracted) high alpha-cellulose pulp yield by
prehydrolysis kraft pulping process is in the range of 32-
36% from the original wood (Simmonds et al., 1953).
2.1.3 Bleaching
The object of bleaching in dissolving pulp manufacture
is the removal of residual lignin, residual hemicelluloses
and resins. For this reason, bleaching is considered to be a
continuation of the cooking process. The bleaching operation
used is completely dependent upon the characteristics of the
cooked pulp and the end—use (e.g., cellophane, nitrate,
acetate, etc.).
Bleaching results in removal of residual lignin and
colouring materials from puips. However, with the current
conventional purification processes (i.e., pulping and
bleaching operations), the bleached product contains
hemicelluloses, ash, degraded cellulose and other
impurities, which make it unsuitable for chemical
conversion. Puips intended for conversion to viscose or
cellulose derivatives must also meet exacting specifications

18
with respect to alpha—cellulose content and viscosity. A low
content of ash and resin is also desirable.
In current kraft pulping technology partial removal of
hemicelluloses is achieved by prehydrolysis treatment.
Purification of dissolving puips by alkali treatment, and by
additional steps in some cases, is carried out in connection
with the bleaching operations. In these processes the attack
on the cellulose and consequent yield losses, are severe.
Jayme (1938) stated that an increase of the alpha—cellulose
content of pulp from 88 to 96% by the hot alkali refining
process will result in a weight loss of 25-30% of the pulp.
Richter (1940) pointed out that the upper limit of alpha-
cellulose obtainable by hot refining was 95%, although 97%
alpha—cellulose could also be reached under harsher
processing conditions. Those treatments, however, also led
to considerable degradation of the cellulose chains and
were associated with a decrease in viscosity.
Currently, chlorine compounds are in wide use in pulp
bleaching. This is because they are most effective oxidizing
agents (i.e selective delignification), offering a highly
stable brightness and leaving a pulp relatively rich in
alpha-cellulose content. On the other hand, pulp
delignification proved to occur at the expense of the
cellulose yield since significant hydrolytic degradation
also took place on the cellulose fibres. In addition, these
chlorine compounds are highly toxic and contribute to
serious environmental problems (e.g., dioxins, and

19
adsorbable organic halides (AOX)). As a result millions of
dollars have been spent on pollution control projects by the
pulp and paper industry to eliminate toxic organochiorine
compounds from bleach plant effluents.
Typical bleaching sequences for dissolving pulps are
illustrated in Table 2.1 (Ingruber et al., 1983).
Table 2.1 Bleaching Sequences for Dissolving Puips (Ingruberet al., 1983).
End Use Cook Type Bleach Sequence
Plastic Filler Suiphite CEDED, CEDPD,
Prehydrolyzed CEHDEDKraft
Nitration Suiphite CE0CH, CE°CHPrehydro lyz edKraft
Textile Rayon Suiphite CE°CHD, CE°HD, CE°CHPrehydrolysis CEHDEDKraft CHEDED
Regular Suiphite CE°CHD, CE°HDAcetate Prehydrolyzed ECEHD
Kraft XDEDH, CEHXDEDXCEHDED
Tire Cord Prehydrolyzed CEHXD, CEHDX,Kraft XDEDH, CHEDX
XCEHDED
Plastics Suiphite ECE°HXD
Where:
C = ChioronationE0 = Pressure hot caustic extraction
(HCE)E = Mild (less than atmospheric HCE)D = Chlorine DioxideP = PeroxideX = Cold caustic extractionH = Hypochlorite

20
It must be noted that nearly all bleaching sequences in
the above series start with chioronation (C), a step now
definitely linked with dibenzofurane and dioxin formation in
bleach plants (Rotluff, 1989). At the same time it is
realized that a compromise on this first bleaching stage
(such as a C/D) is less acceptable for dissolving pulp
purification because of the decisive effect of bleaching on
the final quality of dissolving pulps. Thus the lack of
suitable alternative bleaching sequences which can guarantee
the same high purity as the CED, CEDED, CEH sequences will
certainly put new pressures on dissolving pulp manufacturers
to take a look at new pulp processing systems (e.g., solvent
pulping and purification), known to be environmentally
benign.
In line with these efforts, solvent purification of
conventional chemical pulps could be a practical and
desirable new approach in this respect. The specificity of
treatment in removing lignin and low molecular weight
polysaccharides offers higher pulp yield with high alpha
cellulose content. Residual colour in solvent purified pulp
can easily be readily bleached with mild, less toxic
oxidizing reagents such as hydrogen peroxide and chlorine
dioxide. Further, solvent pulping is known to produce pulps
of low extractives (Quinde, 1990) and ash content (Behera,
1985).

21
2.2 The Hydrogen Bond - Development
In this work, acetone is used as the solvent of
purification due to the fact that acetone has the ability to
penetrate into the cellulosic material and bring about
considerable stereochemical changes. At the same time,
acetone is classified as a dipolar aprotic hydrophilic
solvent, i.e., HBA, (Frey—Wyssling, 1953; Bax et al., 1972;
Isaacs, 1974)). Thus, the irreversible changes caused in
hydrogen bonding of the cellulose by acetone - hydrogen bond
disruption hypothesis - prompted the following review on
hydrogen bond theory and practices.
2.2.1 Hydrogen Bonding - H-bond Donor/Acceptor Solvents
Hydrogen bonding is of significant importance for the
stabilization and shape of large biological molecules in
living organisms such as proteins, nucleic acids, and
carbohydrates (Reichardt, 1988; Jeffrey et al., 1991J. A
general definition of the hydrogen bond is that when a
covalently bound hydrogen atom forms a secondary bond to
another atom, the second bond is referred to as a hydrogen
bond (Joesten et al., 1974).
The interaction of different molecules (e.g., solute—
solvent) in a system at certain reaction conditions might
lead to changes in rate of the reaction and structure of
the substrate, Consequently, these structural

22
(stereochemical) changes have a considerable impact on the
modification of the hydrogen bonding of the substrate. In
the pulp industry, mercerization (e.g., 18-30% NaOH) is used
for the provision of accessible cellulose. In other words,
the accessibility of cellulose can explicitly be understood
as a new spatial rearrangement of the hydroxyls of the sugar
residues, i.e., new positioning of hydrogen bonding within
the cellulosic system. Thus, hydrogen bond disruption by
acetone represents a major hypothesis in this study.
The concept of hydrogen bonding has been outlined in
1919 by Huggins (1971). The first publication on hydrogen
bonding — applied to the association of water molecules —
was in 1920 by Latimer and Rodebush (1920). However, earlier
than this publication hydrogen bonding was pointed out to be
the cause of association in ammonium salts whereby a proton
links the ammonia molecule to the ion (Werner, 1903).
A hydrogen bond is formed by interaction between the
R - X - H and :Y - R according to the following equation
R - X - H + :Y - R = R - X - H...Y - R
where:
R — X — H is the proton donor and :Y — R makes available an
electron pair for the bridging bond. In this context
hydrogen bonding can be regarded as a preliminary step in a
Bronsted acid—base reaction which leads to a dipolar
reaction product R — X...H - Y - R. X and Y are atoms of

23
higher electronegativity than hydrogen such as C, N, P, 0, F,
etc. Both inter- and intramolecular hydrogen bonding is
possible, the latter when X and Y belong to the same molecule.
The most important electron pair donors (EPD) i.e
hydrogen bond acceptors (HBA) are the oxygen atoms in ethers,
carbonyl compounds, as well as nitrogen atoms in amines and N—
heterocycles. mides, hydroxy—, amino— and carboxyl groups are
the most important proton donor groups (HBD). Strong hydrogen
bonds are formed by the pairs 0 - H.. .0, 0 - H. . .N, and N -
H...0, weaker ones by N — H.. .N, and weakest by C12C — H.. .0,
and C12C — H...N (Reichardt, 1988). However, very strong
hydrogen bonds are considered to be developed by carboxylic
acids (13 Kcal/mol) (Biermann, 1993). Thus, the bond
dissociation enthalpy for normal hydrogen bonds is between 1
to 10 Kcal/mol (Biermann, 1993)
When two or more equal molecules associate, homo—
intermolecular hydrogen bond is formed as shown in Fig.
2.2.1.1. On the other hand, the association of different
molecules for instance R — 0 — H. . .N is called a hetero—
intermolecular hydrogen bond.

24
R R0”H-O O”H-N
H°H..0H RC,,CR
Figure 2.2.1.1. Homo—intermolecular hydrogen bond inalcohols, carboxylic acids and amides (the hydrogen bondsare denoted by dotted lines).
Hydrogen bonds can be either intermolecular or
intramolecular. Both types of hydrogen bonds can be broken.
For example 2—nitrophenol breaks its intramolecular hydrogen
bond to form an intermolecular one with electron pair donor
(EPD) solvents (e.g, anisole, hexaniethylphosphoric acid
triamide — HMPT etc.), see Fig. 2.2.1.2.
00 -H••EPD
Figure 2.2.1.2. 2-nitrophenol breaks its intramolecular Hbond to form an intermolecular one.

25
Hydrogen bonds, generally, have the following
structural and spectroscopic characteristics (Schuster,
1976) ;1- The distance between the neighbouring atomsinvolved in the hydrogen bond (X and Y) aresmaller than the sum of their van—der—Waals radii.2- The X - H bond length is increased and hydrogenbond formation causes its IR stretching mode to beshifted towards lower frequencies.3- The dipolarity of the X - H bond increases onhydrogen bond formation, in turn, this gives riseto a larger dipole moment of the complex thanexpected from vectorial addition of its dipolarcomponents R - X - H and Y - R.4— Due to reduced electron density at protonsinvolved in hydrogen bonds, they are deshielded,resulting in remarkable downfield shifts of their1-H-NNR signals.5- In heteromolecular hydrogen bond, a shift ofthe Bronsted acid/base equilibrium R - X - H. . . Y -
R = R - X...H - Y - R to the right hand side withincreasing solvent polarity is found.
Similar conclusions on the hydrogen bond energy were
already drawn by Coulson at the symposium held in Ljubljana
in (1957). He found that the theoretical net hydrogen bond
energy for ice develops as the result of the following four
terms, each being of the order of magnitude of the bond
energy itself. The contributions are as follows:
a— electrostatic +6 Kcal/mole/bond
b— delocalization +8 Kcal/mole/bond
c— repulsive overlap of electron clouds -8.4Kcal/mole/bond
d— dispersion +3 Kcal/mole/bond
Total +8. 6Kcal/mole/bond

26
Coulson noted that the experimental value for ice was +6.1
Kcal/mole/bond. He attributed the difference between the
experimental and the theoretical values to the variation in
length of the hydrogen bond.
Regarding the nature of the forces in the hydrogen bond
(Vinogradov et al. , 1971; Kortum, 1972), the hydrogen bond
can be considered as dipole—dipole or as a resonance
interaction. Since hydrogen bonding prevails only when the
hydrogen bond is bound to an electronegative atom, the first
speculation concerning the nature of the hydrogen bond is
that it consists of a dipole-dipole interaction such as
R — X — H. . .Y - R (Vinogradov et al., 1971. Kortum, 1972).
This assumption is supported by the fact that the strongest
hydrogen bond is formed in pairs in which the hydrogen is
bound to the most electronegative element (e.g., F — H.. . F,
H=155 KJ/mol). The greater strength of the hydrogen bond
compared with nonspecific dipole-dipole interaction is due
to the much smaller size of the hydrogen atom, relative to
any other atom. This allows it to approach another dipole
more easily. In conclusion this dipole assumption accounts
for the linear geometry of the hydrogen bond, because a
linear arrangement maximizes the attractive forces and
minimizes the repulsive ones (Reichardt, 1988).
Furthemore, the shortness of hydrogen bonds indicates
considerable overlap of van—der—Waals radii and this would
give rise to repulsive forces. Also the existence of
symmetrical hydrogen bonds of the type F...H...F can not be
27
explained in terms of electrostatic modelling. When the X - Y
distance is extremely short, an overlap of the orbitals of the
X - H bond and the electron pair of :Y could lead to a
covalent interaction (Simmering, 1964) as shown below:
R-X-H...Y-R=R-X...H-Y-R
According to the above equation, this situation can be
described by two contributing protomeric structures, which
differ only in the position of the proton.
Solvents containing proton—donor groups are called protic
solvents or HBD (Parker, 1962). Solvents having proton-
acceptor groups are designated HBA solvents (Taft et al.,
1976). The abbreviations HBD and HBA refer to hydrogen bond
donor and acceptor, respectively and not to electron pairs
involved in hydrogen bonding.
Aprotic solvents are those which are without proton-donor
groups.
Typical protic solvents (HBD) are water, ammcmia,
alcohols, carboxylic acids and primary amides. On the other
hand dipolar aprotic (HBA) solvents are ethers, amines,
ketones, and sulphoxides (i.e., CH3CN, CH3NO2, (CH3)2C0,
(CH3)2SO).
In the case of protic solvents (HBD), the solute acts as
HBA - base and the solvent as HBD - acid while for dipolar
solvents the reaction is reversed (Taft et al., 1976).

28
2.2.2 Hydrogen Bonding in Cellulosic Material
The hydroxyl groups of the cellulose units involved in
hydrogen bonding with neighbouring ones and with those of
adjacent óhains, have been the centre of investigations for
many years. Cellulosic materials from various sources and
treatments differ considerably in their degree of
crystallinity, as evidenced by a large number of
investigative methods. Since the super—structure of
cellulose (i.e., hydrogen bonding system) has important
consequences for the pulping, purification and papermaking
processes as well as for the cellulose reactivity in the end
use, this part of the review will focus on it at some
length.
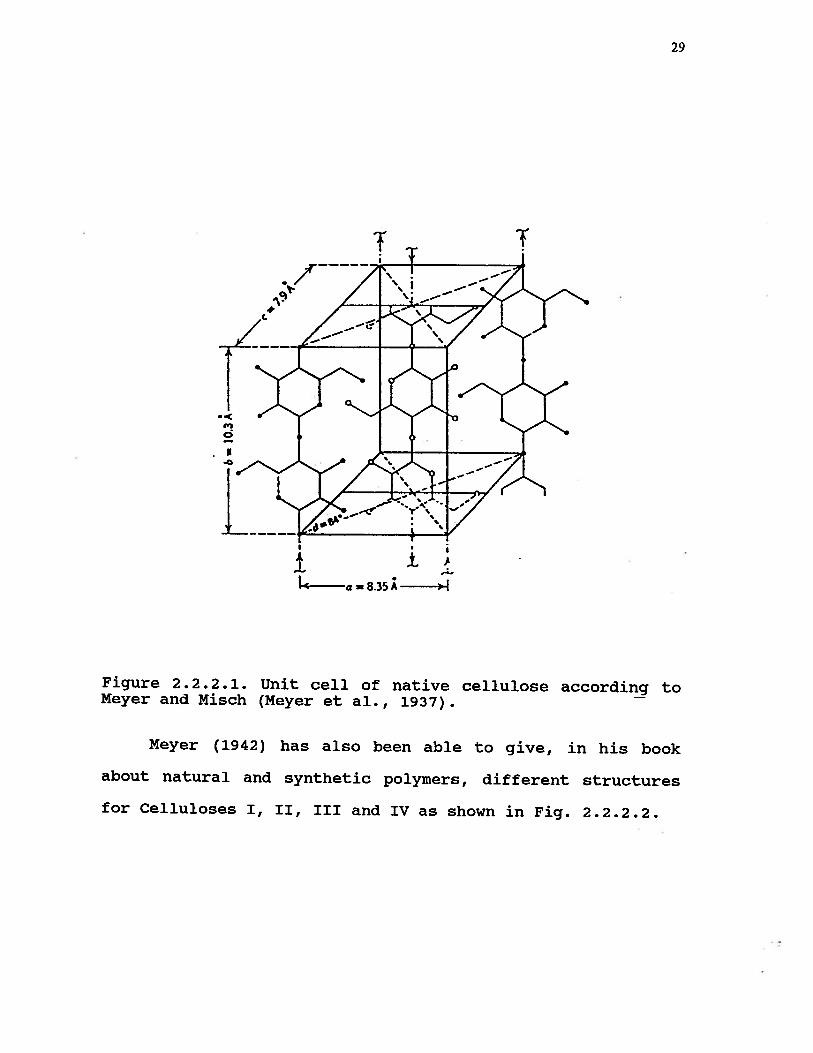
In 1937, Meyer and Misch (1937) in their elucidation of
the supermolecular structural nature of cellulose proposed a
model of a unit cell. It is illustrated in Fig. 2.2.2.1. The
arrangement of the crystalline region was deduced from X—ray
data. The dimensions of their monoclinic unit cell are as
follows:
a = 8.3 Ab = 10.3 Ac = 7.9 Af3 = 84°
29
TrL___ ‘t—-
4. kcZJJZ7
Lr_TS/0
V
i
__
IC a—8.35A
Figure 2.2.2.1. Unit cell of native cellulose according toMeyer and Misch (Meyer et al., 1937).
—
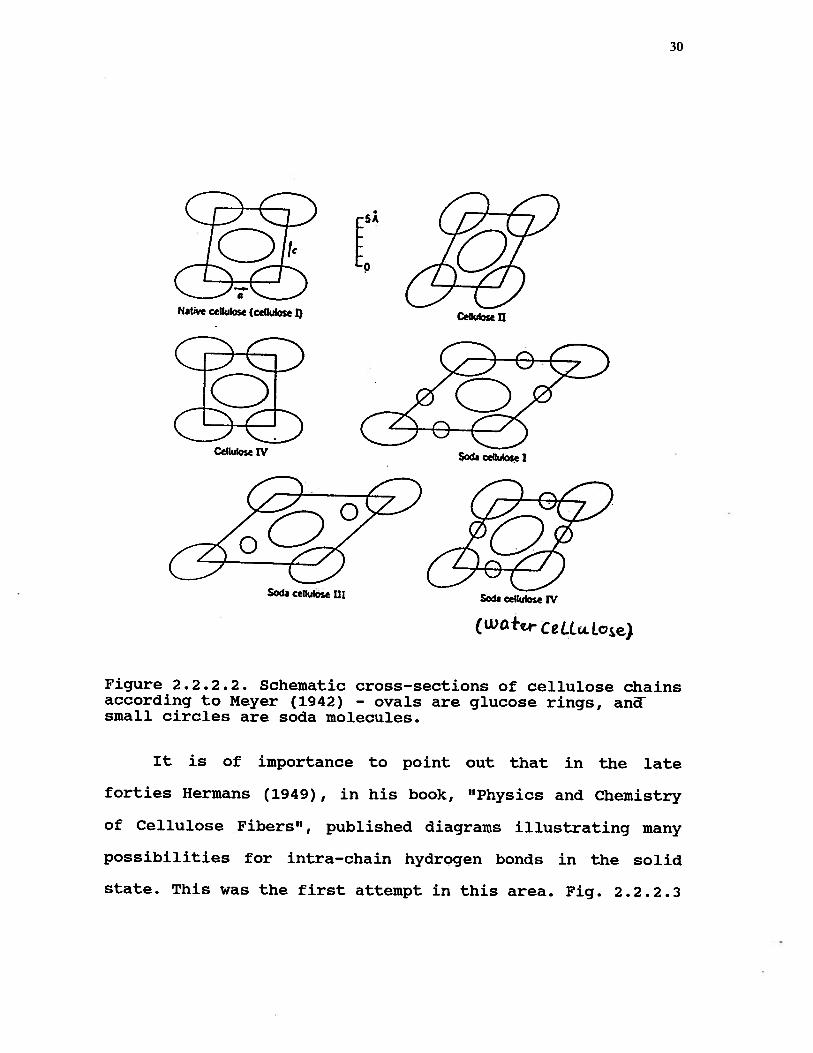
Meyer (1942) has also been able to give, in his book
about natural and synthetic polymers, different structures
for Celluloses I, II, III and IV as shown in Fig. 2.2.2.2.
30
Native cellulose (cellulose I) Cellulose ti
Cellulose IVV
Soda cellulose Ui Soda cellulose IV
(WOf..r CeLLcc1ose)
Figure 2.2.2.2. Schematic cross—sections of cellulose chainsaccording to Meyer (1942) — ovals are glucose rings, andsmall circles are soda molecules.
It is of importance to point out that in the late
forties Hermans (1949), in his book, “Physics and Chemistry
of Cellulose Fibers”, published diagrams illustrating many
possibilities for intra-chain hydrogen bonds in the solid
state. This was the first attempt in this area. Fig. 2.2.2.3
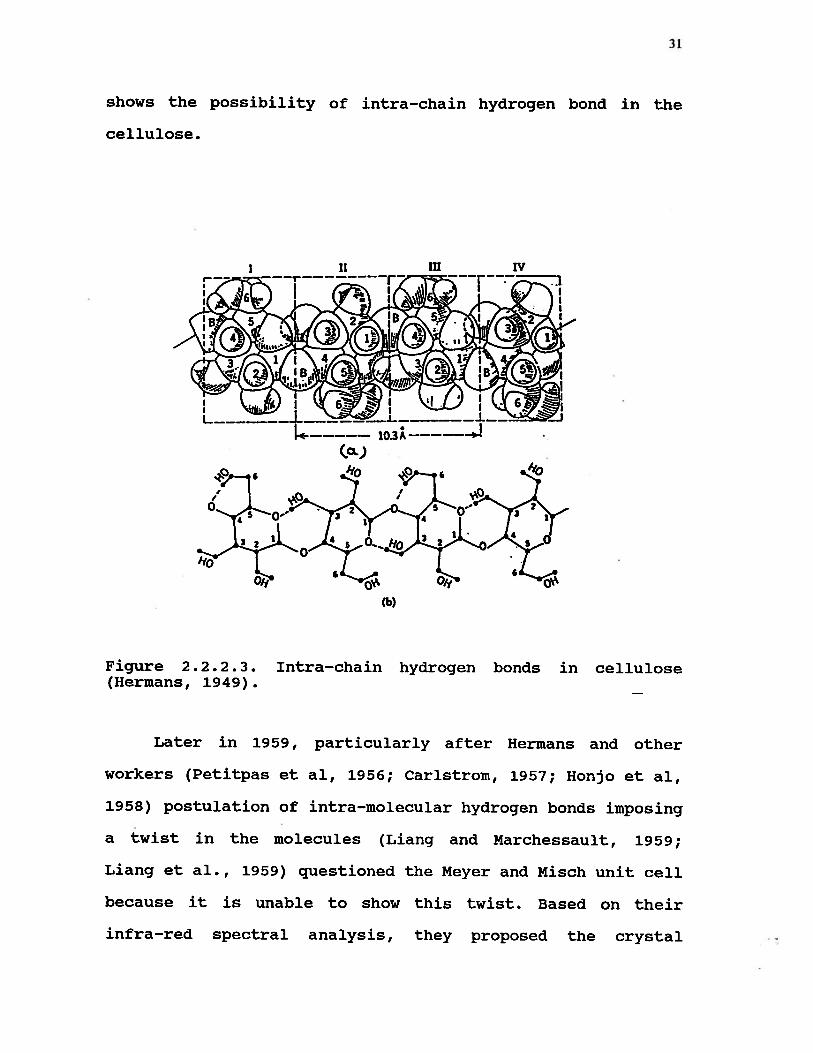
31
shows the possibility of intra-chain hydrogen bond in the
cellulose.
(a.)
Figure 2.2.2.3. Intra—chain hydrogen bonds in cellulose(Hermans, 1949).
Later in 1959, particularly after Hermans and other
workers (Petitpas et al, 1956; Caristrom, 1957; Honjo et al,
1958) postulation of intra-molecular hydrogen bonds imposing
a twist in the molecules (Liang and Marchessault, 1959;
Liang et al., 1959) questioned the Meyer and Misch unit cell
because it is unable to show this twist. Based on their
infra—red spectral analysis, they proposed the crystal

32
lattice model for Cellulose I, which demonstrates both
intra— and intermolecular hydrogen bonds (see Figs. 2.2.2.4
and 2.2.2.5).
,/J-\orcHBon4si IOTpLan4 -e k-a. C o-’-4%. .1-f bo n cJ s
Ji, A ott H bods in IO( p4ont
‘4 ore. wrochoin H bondt
/
‘1
b
Figure 2.2.2.4. View of chain segments in cellulose Icrystal (Liang et al., 1959).

33
•
I‘IS /
•t% I I•I’ II\ I
I\ / Iocy2. 002.
mHI / iI / ‘1I /I’ F I’ F
S
‘ I ‘
‘°<-
p1oJL7Q O4L
FL r Hoii1 fOTp(&.
Figure 2.2.2.5. End view of cellulose chains in a unit cell(Liang et al., 1959).
The intramolecular hydrogen bonds are responsible for
the stiffness and rigidity of the cellulose molecule and for
the stabilization of the two-fold helical structure. In
addition, this intramolecular hydrogen bonding also sustains
the 1.03 ma crytallographic repeating distance which is in
accord with the conformational energy considerations in
relation to bond rotations for the C-i 0-1 and the C-4 —
0—4 glucosidic bonds (Sarko, 1978).
The relative positioning of the cellulose molecules
with respect to one another in the unit cell determines the
possibility for the formation of intermolecular hydrogen
bonds. The development of van—der—Waals forces between the

34
neighbouring molecules inside the same crystal lattice plane
is also influenced by this positioning. Intermolecular
hydrogen bonds are a significant factor for the internal
packing of the cellulose chains in the crystal lattice. The
density of the interchain hydrogen bonding inside and
between the planes affects to a great extent the swelling
action and the accessibility of the crystalline domains.
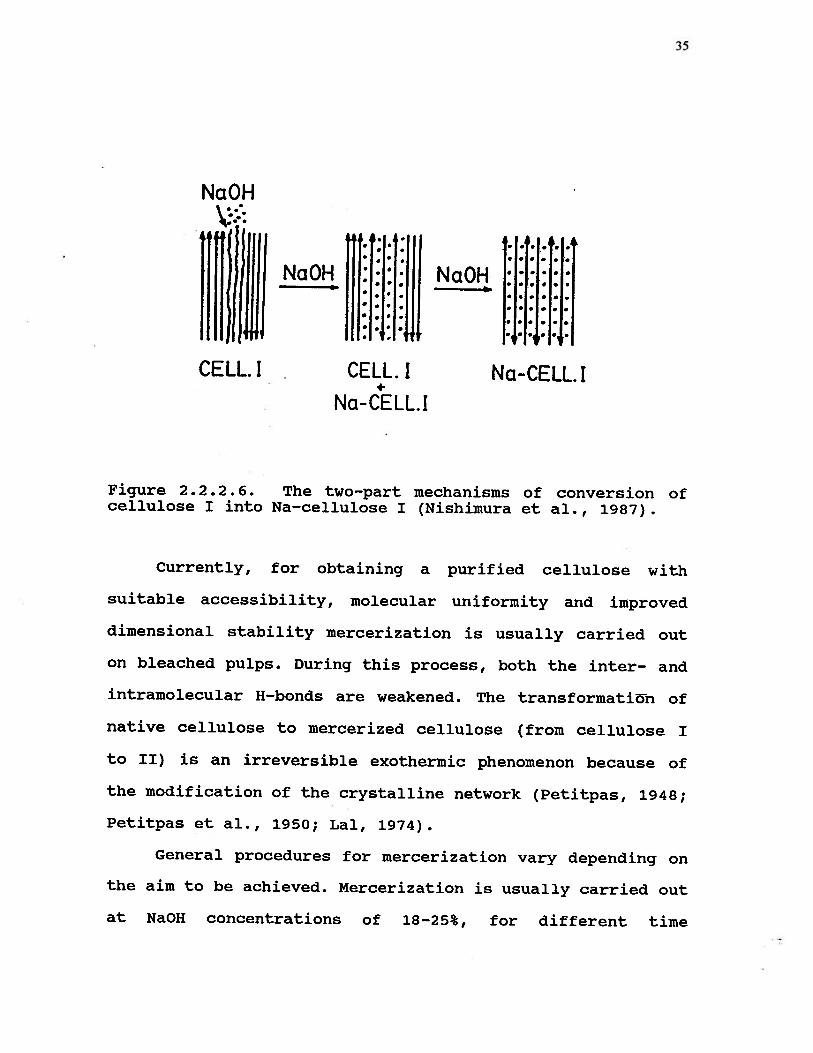
Later, Nishimura and Sarko (1987) studied the
conversion of Na—cellulose I from the cellulose I crystal
structure. The analysis of crystallite sizes of cellulose I
and alkali cellulose I during the transformation indicated
that the change took place in two steps; the first is a fast
step and resulted in conversion of 65% of cellulose I into
Na-cellulose I. The crystallite sizes for cellulose I and
alkali cellulose I were 62 and 35 A, respectively. At the
second step it was observed (Nishimura et al., 1987) that
the conversion process was slow and the crystallite size of
cellulose I decreased gradually until disappearance, while
that of Na-cellulose I increased steadily to reach 50 A. It
was also noted (Nishimura et al., 1987) that during
mercerization a simultaneous change in unit cell parameters
of cellulose I took place. In this communication, a
mechanism for mercerization (see Fig. 2.2.2.6), in which the
conversion process was assumed to start in the amorphous
zone of the cellulose, was proposed (Nishimura et al.,
1987)
35
NaOH
• • • • • • • •
llllllliI NaOH N1 NaOH
CELL. I CELL. I Na-CELL.!Na-CELL.!
Figure 2.2.2.6. The two—part mechanisms of conversion ofcellulose I into Na—cellulose I (Nishimura et al., 1987).
Currently, for obtaining a purified cellulose with
suitable accessibility, molecular uniformity and improved
dimensional stability mercerization is usually carried out
on bleached puips. During this process, both the inter- and
intramolecular H—bonds are weakened. The transformatin of
native cellulose to mercerized cellulose (from cellulose I
to II) is an irreversible exothermic phenomenon because of
the modification of the crystalline network (Petitpas, 1948;
Petitpas et al., 1950; Lal, 1974).
General procedures for mercerization vary depending on
the aim to be achieved. Mercerization is usually carried out
at NaOH concentrations of 18-25%, for different time

36
intervals and at different temperatures. In this process the
treated pulp is subjected to degradation and results in an
appreciable loss of fibrous material.
To attain accessibility, molecular uniformity,
enhancement of crystallinity and to reduce such losses
solvent purification could be the practical answer in this
respect.
2.3. Solvent Effect on Stereochemistry and Mechanism
In this work the influence of acetone as a solvent on
the structural transformations (i.e •, stereochemical
alterations) may be quite profound. The substantial
physicochemical changes which are expected to be brought
about on both soluble and insoluble portions of cotton by
acetone (i.e., as a major volume fraction of the solvent
composition) could well be demonstrated in the following
chapter (Results and Discussion).
It has been verified (Tchoubar, 1966; Lemieux et_al.,
1968; Stoddart, 1971; Amis, 1966; Reichard, 1988) that
solvents have considerable effect on the mechanism and
stereochemistry of the reaction course. In other words, the
solvent can influence both the rate and the mechanism of a
reaction. Lemieux et al (1968) studied the changes in
conformational equilibria of the methyl 2-deoxy-13-L-- and 3-
deoxy-3-L-erythro-pentopyranosides by dissolving them in
different solvents such as acetone, chloroform,
37
dimethylsuiphoxide, water etc. It was noted (Lemieux et al,
1968) that marked changes in optical rotation had taken
place. These changes were attributed to the specificity of
solvation of the substrate by different solvents. This
specific solute—solvent solvation has brought about some
change in electron density of the system, i.e., the change
in the electronic state of the oxygen atoms involved in the
hydrogen bonds with a solvent appears to have a considerable
influence on the conformational equilibrium. Using nuclear
magnetic resonance and polarimetry techniques Lemieux et al.
(1969) studied the effect of dimethylsuiphoxide (DMSO)
concentration on the specific rotation at 25 0C of solutions
of methyl 3-deoxy-J3-L-erythro-pentopyranoside and 1,2-0-
isopropylidene 4 -O-methyl-f3-D-sorbopyranos ide in ethylene
dichioride, see Fig. 2.3.1. It was noted (Lemieux et al.,
1969) that with increase of DMSO the numerical rotation of
sugar derivatives was increased and a gradual change in
conformation had taken place. It was concluded (Lemieux et
al., 1969) that the engagement of the hydrogen of hydoxyl
groups in a hydrogen bond with a base (i.e., DMSO) results
in a polarization of the H-0 bond in the direction of the
oxygen atom. This makes the oxygen atom a relatively better
hydrogen acceptor in hydrogen bond formation. It was also
added (Lemieux et al., 1969) that the dipole interaction
between two opposing axial hydoxyl groups, both bonded to
solvent, is much greater than when both of the hydroxyl
groups are acylated by electron withdrawing acyl groups.

38
‘$0
::E[aID \ -k:: ‘>
-40
.20
20 40 60 SQ
DNSOC1ICL...CH2.CA.
Figure. 2.3.1 Effect of increasing concentration ofdimethylsulphoxide (DMSO) on the specific rotations at 25 0Cof solutions (about 1%) of methyl 3-deoxy-f3-L-erythro-pentopyranoside and of 1,2-0-isopropylidene 4-O-methy1-D-sorbopyranoside in ethylene dichioride (Lemieux et al.,1969).
Note: the publication error in Fig. 2.3.1 regarding the
structure of 1,2—0-isopropylidene 4-O-methyl-f3-D-
sorbopyranoside, where the 0-isopropylidene group is linked
to C—i only. However, the appropriate formation of the
dioxolane ring is on both carbons in the position 1,2 of the
sugar ring.

39
The importance of the nature of the solvent has also
been emphasized by Stoddart (1971) in his informative book
“Stereochemistry of Carbohydrates”. The anomeric effect is
large in solvents of low dielectric constant (e.g., carbon
tetrachioride) and small in solvents of high dielectric
constant (e.g., water) (Stoddart, 1971). However, the effect
of the dielectric constant on the anomeric effect and hence
on conformational equilibria, is often found not to be
remarkable, such as the solvation effects involving hydrogen
bonding. For example, methyl 3-deoxy-f3-L-erythro-
pentopyranoside exists predominantly as the C—i conformation
in solvents such as chloroform which do not form strong
hydrogen bonds with hydrogen atoms of the hydroxyl groups.
In this case, the C-i conformation is stabilized by an
intramolecular hydrogen bond involving the syn—axiai
hydroxyl groups. On the other hand, when hydroxyl groups are
engaged in hydrogen bonding with solvents which are strong
hydrogen acceptors such as pyridine or dimethylsuiphoxide
(DMSO) 1-C conformation is favoured (Stoddart, 1971). —
Amis (1966) noted that the properties of the solvents
such as soivation, nucleophilicity, electophilicity,
cohesion, ionising power, influence on hydrogen bonding,
etc., have impact on both rate and mechanism of the
reaction. For instance, in the hydrolysis of secondary and
tertiary alkyl halides two mechanisms of substitution were
identified. These were a bimolecular mechanism involving
attack by the hydroxide ions, and a unimolecular mechanism

40
kinetically dependent on the ionization of the alkyihalide
(1’inis, 1966). If R represents the alkyl radical and X
represents the halide, these mechanisms can be illustrated
as follows:
RX + OH- = ROH + X- bimolecular
RX=R+X
followed by
R+ + OH- = ROH (instantaneously),
unimolecular
The changeover was attributed to the reaction medium,
concentration, and the alkyl group involvement (Amis, 1966).
Tchoubar (1966) ascertained that the difference between
the electronegativities of oxygen and carbon and the
mobility of II electrons results in the fact that the
carbonyl group is strongly polarized. In line with the high
polarisability of the pi bond, this polarity is the cause of
many heterolytic reactions taking place at the carbonyl
group. In contrast to carbonyl groups in unsaturated
hydrocarbons, the polarisation direction of the C=O group
is independent of the nature of the substituents taken by
the carbon atom, i.e., in the case of addition of polar
molecules to the carbon—oxygen double bond, the negative end
of the molecule attaches itself to the carbon, while the
positive one to the oxygen (Tchoubar, 1966).
Regarding the literature reviewed on the importance of
hydrogen bonding and the solvent effect on this area, it is
41
likely that acetone has the ability to penetrate into the
cellulosic material under suitable conditions. At the same
time acetone is classified as a dipolar aprotic protophylic
solvent (HBA). This means, the high ratio of acetone in the
solvent composition (> 80%) might bring about the following
consequences; predominance of acetone in the reaction with
cellulose, and stereochemical changes. Hence, both inter—
and intramolecular hydrogen bonds are expected to be
affected due to these reactions.
On the other hand, it is been known that ]cetals can be
prepared by condensation of sugars with acetone in the
presence of an acid catalyst (Stanek et al., 1963).
Depending on the stereochemistry of these sugar derivatives,
pentoses or hexoses form either five— or six—membered acetal
ring which can easily be distinguished by NNR, GC, and GC-MS
(Buck et al., 1965; Kiso et al., 1976). Thus reaction of
acetone with cellulose is anticipated to offer similar
isopropylidene derivatives as with sugars.
2.4 Isopropylidene Chemistry - Formation of Ketals
It has been known for some time that isopropylidene
acetals can be formed by condensation of sugars with acetone
in the presence of an acid catalyst (Stanek et al., 1963).
Throughout the course of numerous studies in this field,
many workers, using different techniques such as GC—MS and
NNR have repeatedly proven that the hydroxyl groups of

42
sugars have been replaced by isopropylidene ones (Stanek,
1963). The formation of isopropylidene groups on the sugar
ring of the soluble portion (solution) and insoluble one
(solid state) of the cellulose is one of the major
hypotheses in this work.
A ketal is an acetal derived from a ketone.
Isopropylidene ketals are prepared by condensation of sugars
with acetone in the presence of a Lewis acid catalyst. Five—
membered fused ring systems are preferred and adjacent cis
hydroxyls are necessary (Stanek et al., 1963). Mild
hydrolysis will cleave ketals fairly easily. There is enough
difference in stability between the ketals involving the
primary alcohol function (C-6) and that at C-i so that
selective acid hydrolysis is possible.
It is known that the reaction of carbonyl compounds
with sugar alcohol in the presence of acid catalyst may
yield acetals or ketals (Stanek et al., 1963). This reaction
is not restricted to monohydric alcohols, but proceeds with
polyol to form a five—membered dioxolane or six—memkered
1,3—dioxane ring.
The first reaction of this type was carried out by
Wurtz (in Stanek et al., 1963), who prepared 2-
methyldioxolane by heating ethylene glycol with acetaidehyde
in the presence of hydrogen chloride, (see Fig. 2.4.1).

43
HaCHOI-( CH2—OI. + OHC—CH ) CH—CH1 ÷ H10C)-f2OH CH1—O’
Figure 2.4.1. Preparation of 2-methyldioxolane.
These condensations are acetalized by acidic
dehydrating agents such as sulphuric acid, anhydrous zinc
chloride , etc. This reaction was introduced into sugar
chemistry by Fischer (1895) who was guided by the presence
of vicinal hydroxyl groups in the molecule of sugar alcohols
to the idea of condensing these groups with acetone. Thus,
the condensing effect of hydrogen chloride was utilized to
prepare isopropylidene derivatives of saccharides, which
together with other alkylidene derivatives assume a
remarkable position mainly from the view point of synthesis.
Besides the isopropylidene derivatives of sugars, a
long line of other condensation products of carbonyl
compounds were studied. In this way methylene derivatives
have been prepared by means of aldehyde and ethylidene or
benzylidene derivatives by means of acetaldehyde or
benzaldehyde, respectively. Cyclohexylidene, furfurylidene,
etc. derivatives are likewise known as products of the
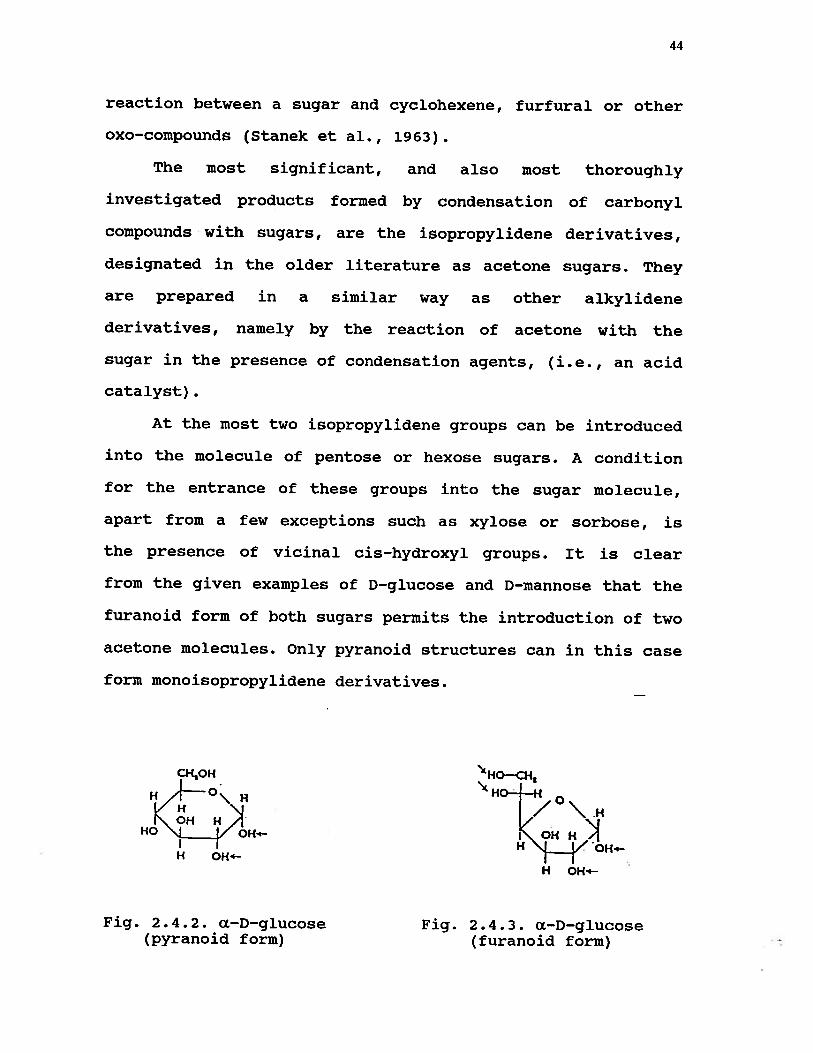
44
reaction between a sugar and cyclohexene, furfural or other
oxo—compounds (Stanek et al., 1963).
The most significant, and also most thoroughly
investigated products formed by condensation of carbonyl
compounds with sugars, are the isopropylidene derivatives,
designated in the older literature as acetone sugars. They
are prepared in a similar way as other alkylidene
derivatives, namely by the reaction of acetone with the
sugar in the presence of condensation agents, (i.e., an acid
catalyst).
At the most two isopropylidene groups can be introduced
into the molecule of pentose or hexose sugars. A condition
for the entrance of these groups into the sugar molecule,
apart from a few exceptions such as xylose or sorbose, is
the presence of vicinal cis-hydroxyl groups. It is clear
from the given examples of D—glucose and D—mannose that the
furanoid form of both sugars permits the introduction of two
acetone molecules. Only pyranoid structures can in this case
form monoisopropylidene derivatives.
CHOH ‘HQ—CH
HO
HO OHi.
Fig. 2.4.2. cL—D-glucose Fig. 2.4.3. cL—D—glucose(pyranoid form) (furanoid form)

45
‘HO—CH,
0
Fig. 2.4.4 —D—mannose Fig. 2.4.5 f3—D—mannose(pyranoid form) (furanoid form)
Note: the arrows indicate those hydroxyl groups at which a
dioxolane (C3 HO2 ) ring can be formed.
On the basis of the established structures of
isopropylidene derivatives of various sugars, the empirical
rule has been postulated that the sugar reacts with acetone
always in such a structure as to permit the formation of a
di-isopropylidene derivative. This rule is in agreement with
the fact that the pyranoid structures of arabinose,
galactose or fructose present no obstacle to the
introduction of two isopropylidene groups and that
consequently the di—isopropylidene derivative of these
sugars exists in the form of pyranose.
The existence of various types of isopropylidene
compounds of sugars and their stability are well
established. From this it follows for instance that the
dioxolane ring on furanose structures is relatively stable,
whereas the ring attached to the side-chain is more labile
and preferentially hydrolyzed and hydrogenolised (as
exemplified by the conversion of l,2:5,6—di—O-

46
isopropylidene-D--glucofuranose into 1, 2-O-isopropylidene-D-
glucofuranose).
Another result of conformation analysis is that in the
bicyclic system composed of two five membered rings which
contains the least number of endo—substituents, formation of
the isomer is always stable. For this reason, 2,3—0—
isopropylidene—D—ribose is favoured over 1,2—0—
isopropylidene—D—ribose. Some inconsistencies, however, have
as yet not been explained. For example, that the di-0-
isopropylidene derivative of D-galactose has a pyranoid
structure which is obviously more stable than the thus
unprepared but theoretically likewisely advantageous
1,2:5, 6—di—0—isopropylidene—D—galactofuranose.
The furanoid or pyranoid arrangement of isopropylidene
derivatives of sugars is unambiguous in those cases in which
it is predetermined. For instance, methyl-cL—D
glucopyranoside (see Fig. 2.4.6) can not assume a furanoid
structure during condensation. In this case, however, the
formation of a six—membered 4,6—dioxane ring is encountered
which otherwise is rare among isopropylidene derivatives.

47
CH10H
H 01-I H 01-4
Figure 2.4.6. The formation of a six—membered 4,6—dioxane
ring.
Considering these stereochemical effects it must be
emphasized that the question of which form of the furanoid
or pyranoid arrangement of an isopropylidene, or other
alkylidene sugar compound, is favoured depends on the form
the sugar existed prior to its reaction with the carbonyl
compound.
2.4.1 Derivatives of Pentoses
Isopropylidene derivatives of all common pentoses are
known (Stanek et. al, 1963) namely l,3-O-isopropylidene-D-
ribofuranose, 1,2:3, 4-di-O-isopropylidene-D-arabinose,
1,2:3, 4—di—O—isopropylidene—L—arabinose, 1,2:3, 5—di—O—
isopropylidene-D-xylose, 1,2:3, 5-di-O-isopropylidene-cc-D-
lyxofuranose.

48
CHOH
I/0\OH
00
C/\
Figure 2.4.1.1. 2, 3-O-isopropylidene-D-ribofuranose.
Figure 2.4.1.2. 1,2:3, 4-di—O—isopropylidene—D—arabinose.
Cit C—C
H
H3
Figure 2.4.1.3. 1,2:3,5-di—O-isopropylidene-D—xylose.

49
By partial hydrolysis, the di-isopropylidenes of D and
L—xyloses can be easily converted into corresponding 1,2—0—
isopropylidene-D-L-xylofuranoses respectively. The 5-deoxy
derivatives of these compounds have also been prepared.
Careful isopropylidenation of arabinose may also lead to
3, 4-O—isopropylidene-D or 3, 4-O-isopropylidene-L-
arabinopyranose. Moreover, the 5—deoxy—1, 2—0—isopropylidene
derivative was indirectly prepared from a 5-substituted L
arabinose.
Di—isopropylidene derivatives of pentoses containing a
free aldehyde group were also formed. Thus, 2,3:4,5-di—0—
isopropylidene-D—arabinose was obtained by oxidation of
1,2:3, 4—di--O-isopropylidene-D-mannitol with tetra-acetate
(Wiggins, 1946) or 3,4:5, 6-di—O—isopropylidene--D—mannitol
with periodate (Bourre et al., 1952). The same substance can
be obtained from 2,3:4, 5-di-0-isopropylidene-D-arabinose
diethyl dithioacetal by action of mercuric chloride (Gatzi
et al., 1938). Further 2,3 :4,5-di—O-isopropylidene—D-xylose
can be formed by the oxidation of 1,2:3,4-di—0-
isopropylidene-L-iditol with sodium periodate (Bourre et
al., 1952).
2.4.2 Derivatives of Aldohexoses
The formation of cyclic acetals or ketals comes as a
result of the condensation of 1,2 and 1,3—diols with
aldehydes and ketones if the diol is itself cyclic, the
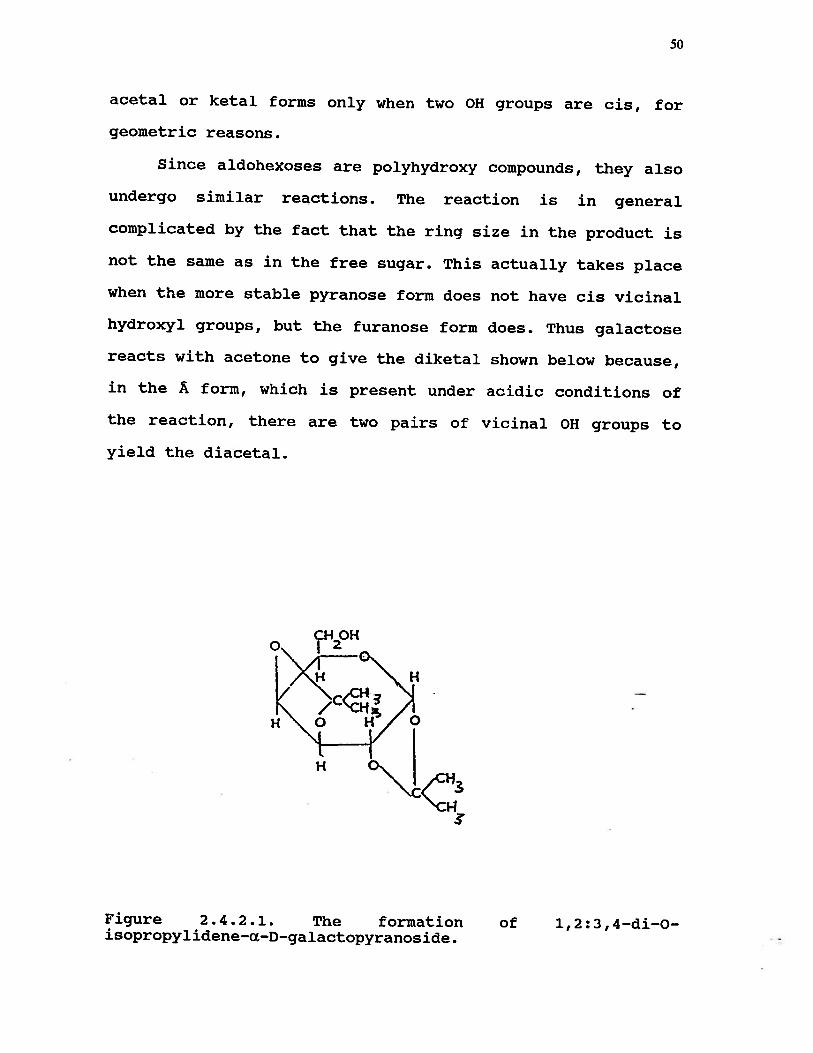
50
acetal or ketal forms only when two OH groups are cis, for
geometric reasons.
Since aldohexoses are polyhydroxy compounds, they also
undergo similar reactions. The reaction is in general
complicated by the fact that the ring size in the product is
not the same as in the free sugar. This actually takes place
when the more stable pyranose form does not have cis vicinal
hydroxyl groups, but the furanose form does. Thus galactose
reacts with acetone to give the diketal shown below because,
in the A form, which is present under acidic conditions of
the reaction, there are two pairs of vicinal OH groups to
yield the diacetal.
CHOH
:2?Figure 2.4.2.1. The formation of l,2:3,4—di—O—isopropyl idene-cc-D-galactopyranos ide.

51
On the other hand, ct—glucose reacts by way of the
furanose form, since this is the only glucose structure
possible with a pair of cis-hydroxyl groups, as follows:
1011
CHO’• cLcHCo
o
• c1•3.j(,/
Figure 2.4.2.2. The formation of 1,2:5,6—di—O—isopropylidene—ct—D—glucofuranose.
Partial hydrolysis of 1,2:5, 6—di-O-isopropylidene—D—
glucofuranose (see Fig. 2.4.2.3) yields 1,2—0—
isopropylidene—D—glucofuranose, as:

52
o—CH
H
•HNH/0
H 01H 0\3
Figure 2.4.2.3. Partial hydrolysis of l,2:5,6—di—O-isopropylidene—D—glucofuranose.
This removal of one of two isopropylidene groups from
the molecule of 1,2:5,6—di-O—isopropylidene is made possible
by the fact that the 5,6-0-isopropylidene group is
accessible to hydrolysis more readily than the 0-
isopropylidene group in the position 1,2. On the other hand,
the reverse conversion of l,2—O—isopropylidene—D—glucose
into its di-isopropylidene derivative proceeds readily and
can be effected by means of anhydrous copper sulphate in
acetone (Ohie, 1922).

53
An isomeric di-O-isopropylidene-D-glucose with the
isopropylidene residue in the position 1,2:3,5, however, is
also known (Fig. 2.4.2.4). Derivatives of this substance are
formed by the reaction of acetone with 6-substituted
derivatives of D—glucose, as:
CI-OTj CIjOTs
HI 0\ OIH
HOOH
___
Figure 2.4.2.4. Formation of an isomeric di—O—isopropylidene-D-glucose in the position 1,2:3,5.
The same type of compound is obtained by the action of
phosphorous pentachioride upon 1,2:5, 6-di-O-isopropylidene-
D—glucofuranose, which instead of the expected 3—chloro—3—
deoxy derivative gives the 6-chloro-6-deoxy derivative with
simultaneous rearrangement of the isopropylidene groups (see
Fig. 2.4.2.5):

54
1/ \H
H O\f H o\ICIt3 3 3
Figure 2.4.2.5. Formation of 6—chloro-6-deoxy—l, 2:3, 5—di--O—isopropylidene—D—glucofuranose.
An interesting product is formed in the reaction of D—
glucose with acetone in the presence of boric acid. It is
the 1, 2—O—isopropylidene-D-glucofuranose 3,5-boric acid
ester. This compound is split of the borate residue, thus
permitting a convenient preparation of 6-substituted 1,2—0-
isopropylidene derivative of D-glucofuranose (see Fig.
2.4.2.6).

55
CHOAc
TH
L’°i” H O\j/CH
\C3
Figure 2.4.2.6. 6-acetyl-1, 2-O-isopropylidene--D-glucofuranose.
Isopropylidene derivatives of L—glucose have also been
prepared (Stanek et al., 1963).
The di—O—isopropylidene derivative of D—mannose (see
Fig. 2.4.2.7) is remarkable in that its solution exhibits
iuutarotation and may be oxidized to 2,3:5,6-di-O-
isopropylidene-D-mannonic acid. This supports the assumption
that the hemiacetal hydroxyl group of this compound is
unsubstituted, and that here 2,3:5, 6—di-O-isopropylidene—D-
mannofuranose is concerned. The proof of the structure was
carried out by converting di—O-isopropylidene--D—mannose into
its di-O-isopropylidene-D-mannonic acid, or into its
lactone, which is identical with the product prepared by
direct isopropylidenation of —D—mannose with acetone, as:

56
H1C COOK
(°)
__
I - 2°H H °\ ,“
HtC-CH5
H3C H1 CH2OH
Figure 2.4.2.7. Formation of 2,3:5, 6-di-O-isopropylidene-D-mannofuranose.
D—galactose is the only easily accessible aldohexose
whose di-O-isopropylidene derivative has a pyranoid
structure. Partial hydrolysis of l2:3,4-di-O-
isopropylidene-D-galactopyranose yields 1,2-0-
isopropylidene—D—galactopyranose. However, with regards to
the almost equal ease of splitting both isopropylidene
groups, this reaction is less advantageous than the
analogous procedure in the glucose series. The
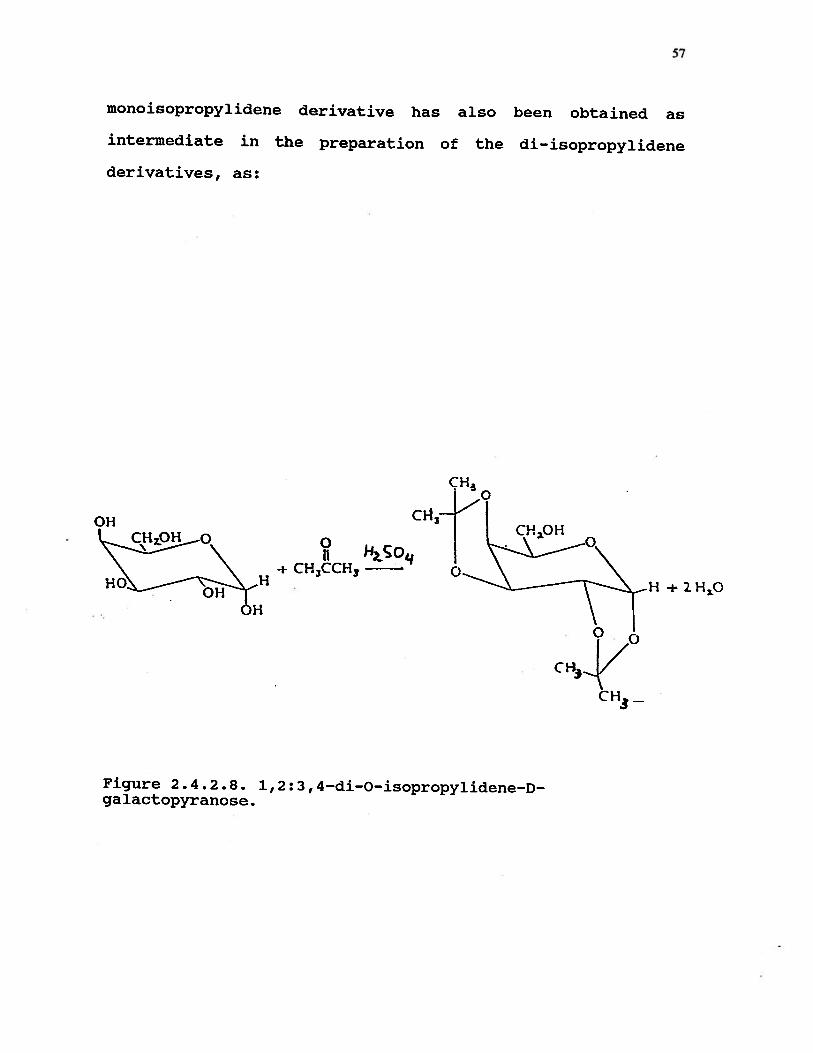
57
monoisopropylidene derivative has also been obtained as
intermediate in the preparation of the di-isopropylidene
derivatives, as:
CHI 0
01-1
II HcoHO H
+ CH3CCH3 o
LS0o
OHH
C
CH3
Figure 2.4.2.8. l,2:3,4—di—O-isopropylidene-D—galactopyranose.

58
CHOH
Fig. 2.4.2 • 9 1, 2—O—isopropylidene—D-galactopyranose.
2.4.3 A Study of Sucrose — Disaccharide
Using a combination of 2,2-dimethyoxypropane, N,N
dimethylformamide, and toluene-p-sulphonic acid Khan and
Mufti (1975) studied the synthesis of sucrose. Treatment of
sucrose with acetalation reagents afforded a mixture which,
after treatment with acetic anhydride and pyridine followed
by chromatography on silica gel, gave the crystalline
1,2:4,5—diacetal Fig. 2.4.3.1 in 15% yield. In the NNR
spectrum of Fig. 2.4.3.1, the signals due to H-i and H-4
appeared at relatively higher field (t = 6.15 and 6.25,
respectively). The signals for these protons usually appear
in the region t 4.5—5.4 for acetylated derivative of sucrose

59
(Khan et al., 1975). The shift to higher field therefore,
suggested that C-4 and C-2 were involved in the presumed
acetal linkages. It was stated (Khan et al., 1975) that the
p.m.r. spectrum of Fig. 2.2.3.1 showed four methyl peaks at
8.56, 8.64, 8.77, and 8.85 due to two isopropylidene groups.
Further proof of the presence of cyclic acetal groups in
Fig. 2.4.3.1 was supplied by the information of tetra
acetate Fig. 2.4.3.2 on treatment with 60% acetic acid at 90
°C for 10 minutes. Although the signals due to H-2 and H-4
were not allocated in the p.m.r. spectrum of Fig. 2.4.3.2,
they were shown by spin-decoupling experiments to be in the
region of 5.55, 6.5 in deuteriochloroform and 5.2, 5.5 in
deuteriobenzene. The shift of these signals to higher field
would be expected if C-2 and C-4 carried free hydroxyl
instead of acetoxyl groups (Khan et al., 1975).
Reacetalation of 3,3’ , 4’ , 6 ‘—tetra-O-acetylsucrose (Fig.
2.4.3.2) afforded the diacetal Fig. 2.4.3.1 in 80% yield,
which confirmed that no acetyl migration occurred during the
deacetalation of 1’ ,2:4, 6-di-O-isopropylidenesucrose tetra
acetate (Fig. 2.4.3.1) to give 3,3’,4’,6’-tetra—O—
acetylsucrose (Fig. 2.4.3.2).
The position of the remaining two hydroxyl groups in
Fig. 2.4.3.2 were established by the following sequence of
reactions (Khan et al., 1975). Treatment of Fig. 2.4.3.2
with trityl chloride and pyridine at 88 0C for 4 hr, gave
the ditrityl ether compound (Fig. 2.4.3.3) as the minor, and
the monotrityl ether Fig. 2.4.3.4 as the major product. The

60
trityl group at C-6 in Fig. 2.4.3.4 was established by
converting 3,3’ ,4’,6 ‘-tetra-O-acetyl-6-O-tritylsucrose (Fig.
2.4.3.4) into the known, 6-0-tritylsucrose hepta-acetate
(Otake, 1970), using acetic anhydride and pyridine. It was
noted (Khan et al., 1975) that when tritylation was
conducted at 90 0C for 24 hr, it afforded 3,3’,4’,6’-tetra-
O—acetyl—1’ , 6—di—O—tritylsucrose (Fig. 2.4.3.3) in 85%
yield. The slow tritylation treatment given to Fig. 2.4.3.3
indicated that the second primary hydroxyl group was at C-
1’. This was verified by treatment of 3,3’,4’,6’—tetra-O—
acetylsucrose (Fig 2.4.3.2) with methane-suiphonyl chloride
and pyridine to give the tetra-sulphonate Fig. 2.4.3.5
which, with a ref luxing solution of sodium iodide in
butanone, gave the 6-deoxy-6-iodo derivative Fig. 2.4.3.6 in
high yield. The structure of Fig. 2.4.3.6 was identified by
its p.m.r. spectrum.
The involvement of C-4 in Fig. 2.4.3.1 in cyclic acetal
formation was also studied (Khan et al., 1975). Treatment of
3,3’ , 4’, 6’ -tetra—O—acetyl—l’ ,6-di-O-tritylsucrose -(-Fig.
2.4.3.3) with methane-suiphonyl chloride in pyridine
afforded 2,4-disuiphonate compound Fig. 2.4.3.7.
Detritylation of 3,3’ , 4’ , 6’ -tetra-O—acetyl—2 , 4-di—O—mesyl—
1’, 6-di-O-tritylsucrose (Fig. 2.4.3.7), using hydrogen
bromide in acetic acid, in a mixture of chloroform and
acetic acid at 0 0C, gave l’,6-dihydroxy compound Fig.
2.4.3.8. The structure of the latter Fig. 2.4.3.8 was
established by its p.m.r. spectrum. Addition of

61
trichioroacetyl isocyanate to a solution of 3,3’,4’,6’—tetra—
O—acetyl—2, 4—di—O—mesylsucrose (Fig. 2.4.3.8) in
deuteriochloroform generated two singlets at .72 and 1.02 in
the p.m.r. spectrum, due to the imino protons of the resulting
carbamate. group, thereby confirming the presence of two
hydroxyl groups in Fig. 2.4.3.8. The mass spectrum of Fig.
2.4.3.8 showed ions due to hexopyranosyl and ketofuranosyl
cations at m/e 361 and 289, respectively. Acetylation of
3,3’,4’ , 6 ‘—tetra-O-acetyl—2 ,4—di—O-mesylsucrose (Fig. 2.4.3.8)
gave the corresponding hexa-acetate compound (Fig. 2.4.3.9).
The p.m.r. result of sucroseocta—acetate showed that the
signals for 11-2 and 11-4 in Fig. 2.4.3.9 appeared at slightly
higher field, i.e at t 5.35 and 5.2, respectively. This was
considered a further evidence that the two sulphonates in Fig.
2.4.3.9 were located at C—2 and C—4. The mass spectrum of Fig
2.4.3.9 (Khan etal., 1975) showed the expected ions at nile 403
and 331 due to the hexopyranosyl and ketofuranosyl cations,
respectively. Similar treatment to 2,4-di-O-mesylsucrose hexa—
acetate (Fig. 2.4.3.9), using sodium benzoate in
hexomethyiphosphoric triamide, gave a product with inversion
of configuration at C—4. The mass spectrum and p.m.r. data
confirmed the oc—D_galacto configuration and the 4C1
conformation for Fig. 2.4.3.10.

62
O—CH2
CH2OAc0 CMe2 OAc
Fig. 2.4.3.1
I
CI420R1CH2OR2
CH2OAcOR OAc
Figure 2.4.3.1 to 2.4.3.9. Synthesis reaction of sucrose.
CI-i2OAc CH2OAcBzO
OMS
Fig. 2.4.3.2 R=R1=R2=R3=HFig. 2.4.3.3 R = R3 = H, Ri = R2 = TrFig. 2.4.3.4 R = R2 = R3 = H, Ri = TrFig. 2.4.3.5 R = Ri = R2 = R3 = MsFig. 2.4.3.6 R = R2 = R3 = 14s, OR1 = IFig. 2.4.3.7 R = R3 = Ms, Ri = R2 = TrFig. 2.4.3.8 R = R3 = Ms, Ri = R2 = HFig. 2.4.3.9 R = R3 = Ms, Ri = R2 = Ac
Figure 2.4.3.10. Acetylation of sucrose.

63
In conclusion, it is worth mentioning that all
isopropylidene chemistry research (i.e formation, synthesis,
kinetics etc.) has been accomplished at room or low
temperatures and under anhydrous conditions. No hydrolysis
of sucrose to glucose and fructose has been reported under
these conditions, i.e., acidified aqueous acetone and high
temperature. However, in this work the presence of small
amount of water in the reaction medium is vital for
hydration of anhydrosugars that are cleaved during cellulose
hydrolysis. This is fairly clearly demonstrated by
Shallenberger et al. (1975), see Fig. 2.4.3.11. below:
cqHOH
Figure 2.4.3.11. Scheme for hydration of anhydrosugarsduring the hydrolysis of glycosidic structures(Shallenberger et al., 1975).

64
2.5 Elucidation and Characterization of a Mechanism
A study of the reaction mechanism of the solvent
purification of cellulose is extremely important in many
practical aspects. In this context, understanding of the
physico—chemical transformations that take place on the
cellulose and the effect of other factors such as solvent
composition, type of acid, temperature etc. appear to be
crucial for better optimization of the organosolv
hydrolysis process. The methods which are particularly
suitable to provide answers for the elucidation and
characterization of the mechanism are reviewed below.
2.5.1 Infrared Investigation
Measurement and interpretation of infrared (IR)
absorption spectra represent means of qualitative
identification of specific compounds (Marchessault, 1962),
as well as quantitative estimation (O’Connor et al., 1958)
of their relative proportions in mixtures, and are also
regarded as an aid in elucidation of the molecular
structure. Earlier applications of infrared absorption
spectroscopy to cellulose were confined to studies of the
cellulose molecule, investigations of physical, optical, and
crystalline properties, i.e., crystallinity and crystal
modifications of more or less pure celluloses.

65
One of the difficulties to be taken into consideration
in a study of cellulose by IR spectroscopy is that only a
limited number of absorption bands can be satisfactorily
interpreted in terms of molecular vibrations. Another
problem that could account for difficulties encountered in
the study by IR spectroscopy of polymers, containing both
crystalline and amorphous regions, such as cellulose, is the
absorption overlapping of these two regions (Sutherland et
al., 1950).
The hydrogen bonding system of carbohydrates (e.g.,
cellulose) in the solid state produces complex 0-H stretch
in the frequency range of 3600 to 3000 cm1 region. Due to
this complexity of -OH absorptions it is quite difficult to
evaluate the significance of individual hydrogen bonds.
In this aspect, many workers (O’Connor et al., 1958;
Hurtubise et al.,1960; Nelson et al, 1964) have used IR
spectroscopy for quantification and characterization of
modified celluloses with respect to hydrogen bonding. This
was carried out by measurement of band absorbances at
different treatments. O’Connor et al. (1958) used the ratio
of the absorptivities at 1429 and 893 cm1 to follow the
changes in hydrogen bonding of different cellulose samples
at various treatments. It was concluded (O’connor et al.,
1958) that both mechanical (grinding) and chemical
(ethylamine) treatments had an impact on the
decrystallization of the treated celluloses. Using IR
spectroscopy Hurtubise et al. (1960) studied the changes in
66
the fine structure (lateral order) of cotton and unbleached
suiphite birch and spruce puips at different mercerization
treatments. Their IR calculation (Hurtubise et al., 1960)
showed that throughout various mercerization treatments
cotton had maintained a relatively higher degree of lateral
order than the other puips and this was attributed to its
high crystallinity.
Recently, using deconvolution processing of IR spectra,
numerous studies (Fengel, 1992; Fengel, 1993) have focussed
on quantification of changes brought about by different
treatments on the structure of cellulose. Emphasis was also
made to characterize the degree of crystallinity by relative
heights of different bands (985 cm-, 1165 cm1, 1430 cm’
etc.), and to find a correlation between hydrogen bonding
and the system cellulose-water. Although deconvolution
processing of IR spectra produced well—separated and much
better resolved bands in the —OH region, much controversy
still remains about the position of bands. This band
shifting problem has been noted in both of Fengel’s ppers
(Fengel, 1992; Fengel, 1993); bands 1280 cm1, 1460 cm’,
3350 cm1, 3418 cm1, 3466 cm1 well shifted to 1270 cm-,
1470 cm1, 3378 cm1-, 3440 cm’, 3506 cm-, respectively. It
was also observed (Fengel, 1992) that during the
transformation of cellulose I to cellulose II, the
disappearance and appearance of some bands in the —OH region
such as 3285 cm1 and 3560 cm-, respectively, well
observable.

67
These spectral changes in band positioning and heights
are essentially due to alterations of the stereochemical
character. Such variations occurring upon different
treatments were found to be affected by a number of factors
such as the temperature and nature of the solvent (Brewster,
1959; Durette et al., 1969). In conclusion, these changes in
band positioning and the reconsideration (Fengel, 1993) of
different bands in the cellulose-water system could justify
the limitation of deconvolution processing of IR spectra in
quantitative analysis.
Thus, the involvement of acetone, with its great H—bond
acceptor potential, with cellulose molecules through the
attraction of both inter— and intramolecular H-bond would
lead to stereochemical changes in amorphous and crystalline
zones. This type of alteration is expected to bring about
irreversible H-bond disruption at both inter- and
intramolecular hydrogen bonding level and cause permanent
weakness in the hydrogen bonding system of the cellulose. In
order to investigate the validity of this hypothesis diffuse
reflectance infrared fourier transformer (DRIFT) is employed
in this work. This technique is designed to provide enough
information about the OH stretching. In other words, it is
fairly sensitive to follow up any changes that may occur in
hydrogen bonding system of a material.
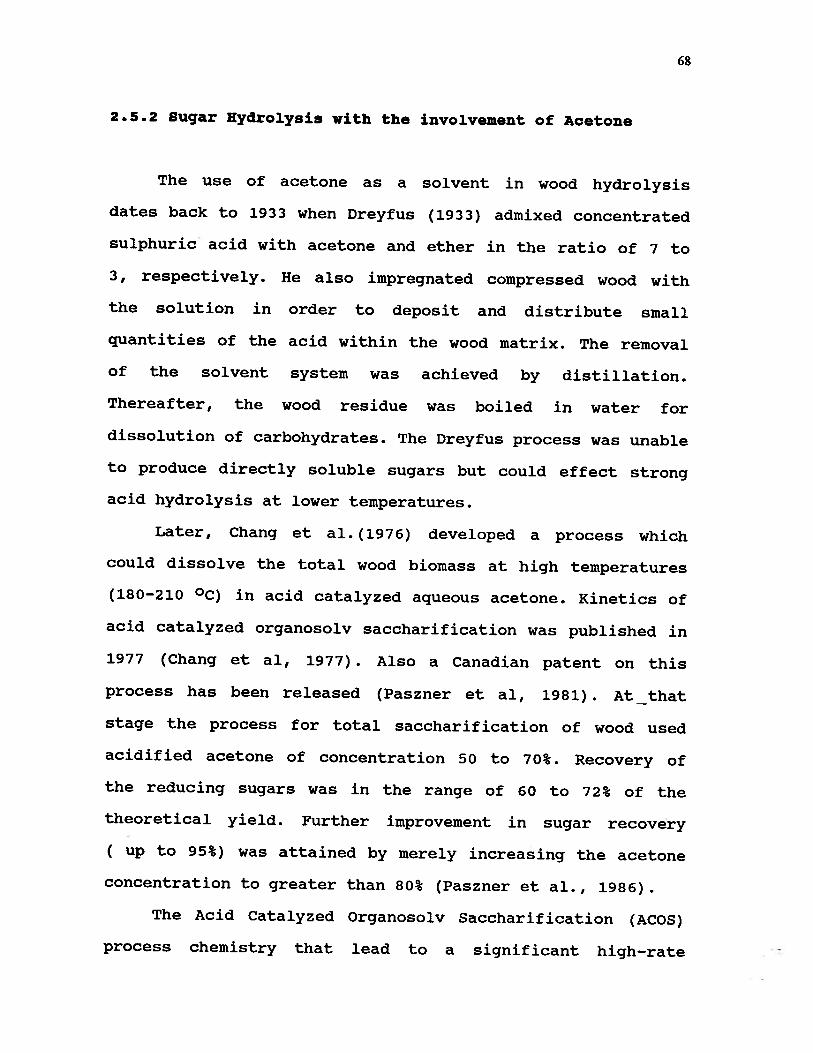
68
2.5.2 Sugar Hydrolysis with the involvement of Acetone
The use of acetone as a solvent in wood hydrolysis
dates back to 1933 when Dreyfus (1933) admixed concentrated
sulphuric acid with acetone and ether in the ratio of 7 to
3, respectively. He also impregnated compressed wood with
the solution in order to deposit and distribute small
quantities of the acid within the wood matrix. The removal
of the solvent system was achieved by distillation.
Thereafter, the wood residue was boiled in water for
dissolution of carbohydrates. The Dreyfus process was unable
to produce directly soluble sugars but could effect strong
acid hydrolysis at lower temperatures.
Later, Chang et al.(l976) developed a process which
could dissolve the total wood biomass at high temperatures
(180—210 °C) in acid catalyzed aqueous acetone. Kinetics of
acid catalyzed organosolv saccharification was published in
1977 (Chang et al, 1977). Also a Canadian patent on this
process has been released (Paszner et al, 1981). At_that
stage the process for total saccharification of wood used
acidified acetone of concentration 50 to 70%. Recovery of
the reducing sugars was in the range of 60 to 72% of the
theoretical yield. Further improvement in sugar recovery
( up to 95%) was attained by merely increasing the acetone
concentration to greater than 80% (Paszner et al., 1986).
The Acid Catalyzed Organosolv Saccharification (ACOS)
process chemistry that lead to a significant high-rate

69
hydrolysis and thermal stability of the dissolved sugars
(Paszner et al, 1988) has not yet been verified. Ward and
Grethlein (1988) suggested that the dissolved glucose was in
the 1,6-anhydroglucose form which can be readily post-
hydrolyzed to glucose.
However, Paszner et al. (1988), relying on
isopropylidene chemistry concepts and the loss of acetone
from the pressure vessel (for reasons other than leakage),
disagreed with Ward and Grethlein’s (1988) assumption. In
addition, the formation of 1,6—anhydrohexopyranoses is known
to occur in aqueous acidic solutions where high energies are
applied (Stoddart, 1971).
In early investigations of Chang et al. (1976, 1977) in
acetonation of cellulosic materials much of the focus was
devoted to the kinetics and optimization of the process. It
was noted (Chang et al., 1976; Chang et al., 1977) that
hydrolytic dissolution of wood mass , at low temperature,
(160—170 °C) occurred in two stages, i.e., bulk hydrolysis
and main hydrolysis. At high temperature (200 °C)hydroysis
was found to be first order all the way to total
dissolution. However, both Paszner et al. (1986, 1988) and
Ward et al. (1988) observed total saccharification of biomass
when acetone was used. It is noteworthy to mention that
neither of these works was able to demonstrate structural
changes resulting from the acetonation treatment.
Nonetheless, Paszner et al (1988), managed to throw,
hypothetically, some light on the mechanism of acetonation.

70
It was concluded (Paszner et al., 1988) that the possibility
of isopropylidene derivatives of sugars as final products
and transient (hemi) ketal formation on the cellulose, as
shown in Fig. 2.4.1.1 might significantly weaken the
glycosidic linkages in cellulose. This eventually leads to
rapid depolymerization of cellulose to isopropylidenated
glucose. Thus the high sugar yield obtained during
acetonation of wood biomass was attributed (Paszner et al.,
1988) to derivatization of cellulose residues, i.e.,
isopropylidene group formation on the sugar ring, thereby,
avoiding dehydration to furfural and hydroxymethylfurfural
otherwise possible under the prevailing saccharification
conditions.
l4C\ _.c
I
C C
HG’CH
Fig. 2.5.1.1 Proposed 0—isopropylidene intermediates forcellulose during high temperature in acidified aqueousacetone.

71
2.5.3 The C-13 CP/MAS NMR Spectrometric Investigation
Isopropylidene groups, in the form of cyclic acetals
have found wide use in carbohydrate chemistry for their
protective role of diol functions (De Belder, 1965; De
Belder, 1977). In addition to their chemical value, there
has been much interest in their conformational structures
(Mills, 1955; Woifrom et al., 1974; Barker et al, 1952).
C-13 MMR has frequently been used in structural studies
of isopropylidene chemistry. Buchanan et al. (1980), using
C—13 NNR, studied several carbohydrate isopropylidenes of
unknown structure. It was noted (Buchanan et al., 1980) that
the C-13 chemical shifts of the methyl groups were separated
from each other by about 10 p.p.m. This large difference was
attributed to the difference in environment of the
equatorial and axial methyl groups in the chair conformation
and that the higher field signal was due to the axial group
which was more bulky. While the methyl groups of 5-membered
acetals were slightly separated from each other. This could
be (Buchanan et al., 1980) due to the conformational
mobility of the system and to the fact that the methyl
groups were pseudoequatorial and pseudoaxial.
Buchanan et al. (1982), in a continuation of their
structural studies of isopropylidene acetals, were able to
draw more conclusions on the acetal ring size; 1,3—
dioxolane, 1,3—dioxane and 1,3—dioxepane. It was observed
(Buchanan et al., 1982) that the chemical shift of the

72
acetal carbon of 1,3—dioxolane rings was in the range 108.1—
115.7 p.p.m, while those of 1,3-dioxane rings were between
97.9 and 101.1 p.p.m. This was attributed to the flexibility
of the former ring. In the case of 1,3—dioxepanes the acetal
carbon chemical shift value was found (Buchanan et al.,
1982) to be intermediate, nearer to that in the 1,3-
dioxanes.
Christophe (1984), using large excess of 2,2-
dimethoxypropane, acetone and sulphuric acid, was able to
isopropylidenate 2-acetamido-4, 6-O-benzylidene-2-deoxy-D-
glucitol. The investigation of the latter compound by C-13
NMR spectroscopy showed that the benzylidene acetal carbon
resonated at 101.2 p.p.m, while that of isopropylidene one
gave a signal at 99.9 p.p.m. These values indicated that
both acetal rings were 1,3—dioxanes. Also, C—l3 NMR spectrum
of this compound illustrated that the chemical shifts of
methyl groups were separated by 10.9 p.p.m., which was
within the expected range for dioxanes (Christophe, 1984).
The synthesis of 1,2:4, 5-di-O-isopropylidene3-O-
(2,3,4, 6—tetra--O-acetyl-f3 -D-glucopyranosyl) - f3 -D
fructopyranose was achieved (Couto et al., 1984) by
codensation of tetra—O—acetyl -c-D—glucopyranosyl bromide
with 1,2:4, 5-di-O-isopropylidene- -D-fructopyranose in 1:1
nitromethane—benzene in the presence of mercuric cyanide
during 5 hr. The C-13 NMR spectrum of the disaccharide
showed two signals at 112.0 and 108.9 p.p.m. for the
dioxolane carbon atoms (Couto et al., 1984).

73
2.5.4 x-ray Diffraction Characterization
X-ray diffraction is the only technique used for the
characterization of polysaccharides of ordered structures at
an atomic resolution level. The structural information that
can be deduced from x—ray diffraction analysis is dependent
on the organization and packing arrangement of the specimen
of interest (i.e., fiber). Fibrous materials contain ordered
three—dimensional units (i.e., crystallites or micelles) of
atoms within their elementary and inicrofibrils. Fibrils are
the main structural components of the cell walls. Therefore,
x—ray diffraction data can be used to assess the structural
changes which have been brought about by a certain treatment
of the cellulosic material.
The existence of a three—dimensional arrangement in
celluloses has been verified by x—ray and electron—
diffraction diagrams of such substrates as ramie (Mann et
al., 1960), Valonia ventricosa cellulose (Honjo et al.,
1958), cotton (Segal et al., 1959), and Fortisan (Mann et
al., 1960). The diagrams of these cellulosic materials
exhibited sharp reflections which could only be accounted
for in terms of three dimensional co—ordinates. All the
reflections from the typical cellulose II structure could be
interpreted in terms of a monoclinic unit cell of
approximate dimensions: a=7.92 A, b=10.34 A, c=9.08 A,
3 =62.7° (Wellard, 1954). The dimensions for ramie (i.e
cellulose I) were determined (Wellard, 1954) to be as

74
follows; a=8.17 A, b=lo.34 A, c=7.85 A, 3=83.6°. It was
stated (Mann, 1962) that even though these observations
illustrate the existence of three—dimensional crystalline
orientation, they do not confirm that all regions which
contribute to the sharp reflections of the diffraction
diagrams show the same degree of crystallinity. This might
be attained only if good agreement could be obtained between
calculated intensities for a crystalline model and the
observed intensities. However, today, by the appropriate use
of computer model building to select reasonable three—
dimensional models for comparison with x-ray data, many
details of the ordered structures have been drawn for
numerous cellulosic materials (Rees, 1977).
The lateral packing order, which is formed by hydrogen
bonds with hydroxyls of adjacent cellulose chains, provides
more structural information by bringing about various Bragg
diffractions. With these diffractions unit cell dimensions
and the space group can be determined.
Rozmarin (1977) studied the effect of acid hydrolysis
on the supermolecular structure of cellulose (i.e variation
in crystallinity index). He also investigated different
parameters contributing to the hydrolysis reaction. It was
pointed out (Rozmarin, 1977) that with the increase of acid
concentration, the crystallinity index decreased rapidly and
temperature exerted the largest effect on hydrolysis of
cellulose.
75
Recently, in an interesting review on supermolecular
structure of cellulose, Hayashi (1985) stated that the
irreversible change from cellulose I to II could be due
either to the difference of skeletal chain conformation or
the difference in the chain packing polarity (i.e parallel
vs. antiparallel). It was added (Hayashi, 1985) that it is
not possible to establish the crystal structure of cellulose
with the limited amount of x-ray data now available. To
accomplish an accurate description of the crystal structure
of cellulose, the x—ray information obtained should be
strengthened by other chemical and physical methods of
structural analysis.
2.5.5 Molecular Weight Distribution Characterization
Information concerning molecular weight distribution is
essential in relation to our understanding of the physical
properties of many industrially important celluloses and
cellulose derivatives. Many different methods have_been
known so far for determining molecular weight distribution.
Solutional and precipitational fractionations, especially,
were very popular in the past for that purpose. Recently,
many investigations have been carried out on the
determination of molecular weight distribution of polymers
by gel permeation (exclusion) chromatography (GPC). The
traditional methods (e.g., solvent precipitation) are time-
76
consuming and accurate molecular weight distribution is not
obtained.
Gel permeation chromatography is a relatively simple
technique applicable to rapid determination of molecular
weight distribution of polymers. Usually in this technique
polymer molecules are separated according to their molecular
size in solution. The polymer solution flows through a
column packed with porous packing on which larger molecules
are excluded (eluted first) while the smaller molecules are
retained in the packing intersticial spaces. By using a
suitable calibration technique, the molecular size
distribution can then be obtained and converted into
molecular weight distribution. In this procedure, two
important steps must be taken into considerations;
1- to ensure that complete solubility (true
solution) of the sample in the solvent is
attained, and
2— to use suitable calibration standards.
In this regard, the major factor in determining the
molecular weight distribution of cellulosic materials is in
conversion of the polysaccharides to derivatives suitable
for analysis. Two methods are available for derivatizing :
nitration (Timell, 1965) and carbanilation (Hall et al,
1973). The drawbacks of the former method are the
instability of the nitrates, insolubility of nitrated xylan
and the impossibility of achieving complete nitration, On
the other hand, carbanilation has repeatedly been verified

77
to provide complete substitution of polysaccharides without
degradation (El Ashmawy et al., 1974). Carbanilated celluloses
are readily soluble in tetrahydrofuran (THF), the solvent of
choice for GPC. Analysis of carbanilated polysaccharides by
gel permeation chromatography has usually provided
satisfactory results (Danhelka et al., 1976).
The polydispersity of celluloses represents the extent of
variation in molecular size, i.e., experimentally determined
values for molecular weight distribution are obtained as
averages, which are dependent on the method used. Commonly,
molecular weight determination provides both weight-average N
and number—average M molecular weight distributions. The
ratio of weight—average molecular weight to number—average
molecular weight (M/M) defines the polydispersity, i.e,
generally, the greater the relative difference between M and
M the wider is the spread in molecular weights
(polydispersity) of the sample of interest. Values with narrow
polydispersity are considered excellent for dissolving pulp
manufacturing (Rydholm, 1965). —
The degradation of cellulose may result from different
mechanisms such as thermal, oxidative, enzymatic, acid—
hydrolysis, base-catalyzed oxidation and mechanical. Their
common impact on the cellulosic material is the diminishing
molecular weight. Several parameters affect the course of the
mechanism (i.e., the extent of degradation). Factors such as
temperature, reaction time, catalysts, reaction media, gases

78
molecular weight distribution (MWD) were studied (Suleman et
al., 1987). It was found that the lowest molecular weight
distribution was produced in acidic medium when palladium
chloride has been used as a catalyst. On the other hand,
they concluded that the catalyst, dicobaltoctacarbonyl
acted, through different reactions, as a cellulose
stabilizer from further degradation.
Chang et al. (1973) investigated the molecular weight
distribution of different celluloses after acid hydrolysis
treatment. They observed that the total number of
crystallites was decreased during hydrolysis while the chain
length distribution remained constant. They also noted that
the crystallites were broken down into molecular fragments.
In the present study gel permeation chromatography
(GPC) is employed to investigate the molecular weight
distribution (MWD) of treated and untreated substrates
(cotton). Uniformity of molecular weight distribution is an
important parameter for predicting the performance of
acetonation treatment on cellulosic material and as an
indicator for dissolving grade quality.
79
3 MATERIAL AND METHODS
3.1 Sample Preparation Procedures
3.1.1 Raw Material
100% pure cotton for pharmaceutical purposes has been
used throughout the duration of this study as a model
compound, obtained from the University Pharmacy at The
University of British Columbia (UBC) premises. Its
characteristics were determined as follows; the percentage of
moisture free cotton was determined according to TAPPI
standard T 258 os—76. Extractives were determined according
to TAPPI standard 204 os-76. Alpha—cellulose was determined
according to TAPPI standard 203 os-74. The results of this
investigation are illustrated in the following chapter
(Results and Discussion).
3.1.2 Raw Material Preparation for the Analysis
Cotton was extracted with alcohol—benzene (2:1) according
to TAPPI standard T 204 os-76.
To remove any extractives that may interfere with the
results, cotton was extracted with alcohol—benzene for 72 hr.
Then it was extracted with only alcohol in order to remove the
residual benzene. After alcohol extraction the cotton was left

80
overnight in the fumehood for evaporation of the solvent. The
purified cotton was dried in a controlled temperature and
humidity room (CTH), which maintained the following
conditions; temperature 23 ±2 °C, and relative humidity 50
±2%, for a week and by the end of this step it was ready for
the analysis.
3.1.3 Solvent Extraction of Sugars
The hydrolysis runs of cotton were performed in stainless
steel bombs equipped with glass liners similar to those
described earlier (Chang et al., 1976; Chang et al., 1977;
Paszner et al., 1983; Paszner et al., 1988). An oil bath
served as a heating source. The bombs were charged for each
cook with 5 gram of extracted cotton to which acidified
organosolv liquor (acetone water) was added. The bombs were
then immersed in the oil bath at an assigned temperature for
a specified length of time.
At the end of the sugar extraction run the bombs were
chilled in water and the contents filtered on a Buchner
funnel. The residue was washed with several portions of fresh
liquor. The filtrate was stored in the fridge for further
treatment and analysis. The pulp residue was neutralized with
ammonia solution, thoroughly washed with distilled water and
dried at 60 °C for weight loss determination and other
treatments.

81
3.1.4 Isolation of Sugars from the Spent Liquor and theirPreparation for HPLC Analysis
In the case of trifluoroacetic acid as a catalyst,
sugars in the spent liquor (acetone, water and TFA) were
isolated by evaporation of the acetone and partial removal of
water. The contents of the flask (i.e viscous solution) were
diluted with distilled water and filtered. The filtrate, once
again, was rotary evaporated and filtered in order to remove
the impurities that may negatively affect the sugar analysis
results by HPLC analysis.
When hydrochloric acid (HC1) was used as a catalyst,
neutralization with ammonia solution was done first.
Filtration, evaporation and dissolution followed.
3.1.5 Secondary Hydrolysis of Nonreducing Sugars andOligosacoharides
After the adjustment of the acid concentration of the
primary hydrolysate (acetone, acidified water and sugars) to
3%, the contents were placed in a glass liner of a stainless
steel bomb. The pressure vessel with the contents was heated
in an oil bath at 120 °C for different specified times. The
post—hydrolysate was neutralized with ammonia solution and
left to stand at room temperature for 2 hr in order to allow
the ammonium salt to precipitate. Then the hydrolysate was
filtered and evaporated on a rotary evaporator. The viscous
82
solution was once again dissolved with distilled water and
filtered to ensure high degree of purity for HPLC analysis.
3.1.6 Preparation of Hydrolysate for Gas ChromatographicAnalysis
The spent liquor (acetone, acidified water and sugars) of
cotton solvent treatment was neutralized with animonia solution
and left to stand for 2 hr in order to allow ammonium salt to
precipitate. The contents were filtered, eluted through a
column of ion exchange resin (XAD-16) in order to remove the
impurities that might negatively affect the analysis of
isopropylidene derivatives results by GC analysis. The
filtrate was rotary evaporated. The viscous solution was
extracted with chloroform. The chloroform extract was filtered
through a microfilter prior to GC analysis.
3.1.7 Acetonation of Cotton Hydrolysate Reducing Sugars
The cotton hydrolysate was rotary evaporated and
concentrated to a syrup. An amount of 100 mL of fresh acetone
and 2 mL of concentrated hydrochloric acid were mixed and the
mixture was added to the syrupy residue in the flask with the
magnetic rod. The flask with the contents was placed over a
magnetic stirrer and stirring -was conducted at room
temperature for 20 hr. Neutralization, filtration and
purification steps were similar to those described in section
3.1.6.

83
3.1.8 Sugar Hydrolysis - Standards Preparation
The monomeric composition of cotton hydrolysate extracted
with acid catalyzed aqueous acetone at various kinetic
variables (i.e., temperature, reaction time, acid
concentration etc.) was investigated using different standards
of sugars . 25 mg of each sugar (glucose, galactose, mannose,
arabinose and xylose) was weighed, transferred into a
volumetric flask (25 mL cap.) and deionized water was added
and adjusted to the mark. The contents were well shaken to
ensure a uniform concentration throughout the solution. These
standard sugar solutions were used for identification of
different sugar retention times.
3.1.9 Sugar Hydrolysis - Mixture of Standards Preparation
20 mg of each sugar standard were weighed and all were
mixed together to make up 100 mg. The mixture of standards
preparation procedure was identical to that described in
section 3.1.8.

84
3.1.10 Sugar Hydrolysis - Preparation of IsopropylideneDerivatives of Sugar Standards
1,2:5, 6-di-O-isopropylidene-ct-D-glucofuranose, 1,2—0-
isopropylidene—c-D—g1ucofuranose, 2,3:5, 6—di-O-isopropylidene—
13—D-mannofuranose and 1,2:3, 4—di-O-isopropylidene-cx-D-
galactopyranose were obtained from Sigma Chemical Laboratories
and used as standards for gas chromatographic (GC)
investigation. Procedures for their preparation are quite
similar to those of the simple sugars as described earlier in
section 3.1.8 with the exception that chloroform was used as
a volatile solvent for the solublization of the isopropylidene
derivatives.
3.1.11 Solvent Extraction of Cotton using C-13 labeled Acetone
An extracted sample of cotton (140 mg (o.d)) was placed
in a tube positioned in a glass liner with glass beads and
dried for a week over phosphorous pentoxide in a desiccator.
To the 1 g of C—13 labeled acetone an amount of acidified
water (0.16 N HC1) (105 pL) was added. The fresh liquor (C-13
labeled acetone and acidified water) was transferred to the
tube containing the cotton and the glass liner containing the
sample was placed in the stainless steel bomb. The bomb was
pressurized to 450 psi and heated to 150 °C for 2 hr.
Neutralization, filtration and residue washing steps were
carried out similar to those described in section 3.1.3. The

85
filtrate was collected in a vial and stored in the fridge for
further analysis. The residue was dried in the CTH room for 48
hr. The residue was studied by C-13 CP/MAS solid state NMR.
3.1.12 Preparation of Cotton Residues for X-ray DiffractionAnalysis
Sample preparation was conducted according to Nelson et
al. (1964).
Samples, which were treated with acid catalyzed aqueous
acetone, were prepared for X-ray diffraction (XRD) by placing
the fibrous material in a 1 in (2.54 cm) square metal frame
and the content was transferred onto a hydraulic press.
Pressing of the fibrous material was carried out at 15000 psi
(1050 kg/cm2) for 5 mm.
Samples such as untreated cotton and those which were
treated with acetone and water without the acid catalyst were
ground in a Wiley microgrinder to pass a 30-mesh (0.6 mm)
screen prior to pressing. Pressing was conducted in a similar
manner as described above.
3.1.13 Cotton Residue Carbanilation
Carbanilation of cotton fibrous material (i.e., solvent
treated and untreated cotton) was done according to Schroeder
et al. (1979) with some modifications.
The cotton sample equivalent to 0.1 g (o.d.) was dried in
86
a quick fit flask (250 mL cap.) at least overnight in an oven
at 60 °C. Anhydrous pyridine (100 mL) and phenyl isocyanate
(7.2 mL) were added to the flask. Then the reaction flask was
capped, sealed with parafilm and placed in a circulating
thermostated oil bath at 80 °C for 2 days. The mixture was
allowed to cool slightly and methanol (4 mL) was added to
react with the excess phenyl isocyanate. The mixture was mixed
with an equal volume of dioxane, filtered through a glass
filter paper in a Buchner funnel, and transferred to a beaker
(1 L). A mixture of methanol (800 mL) and acetic acid (5 mL)
was added to the contents of the beaker and the formation of
white particles in the solution were immediately observed. The
suspension was left over—night in the fumehood to settle,
after which the clear solution was carefully decanted and the
wet precipitated polymer left in the fumehood for 2 days to
dry. Using a spatula, the sticky precipitated polymer was
removed into a vial and kept over phosphorus pentoxide in a
desiccator for further use.
3.1.14 Viscosity Determination
Viscosity of cotton residues was determined according to
TAPPI standard T 230 os-76.
An amount of air-dry residue equivalent to 0.250 g o.d.
was weighed and transferred into a dissolving bottle
containing several 6 mm glass beads. After adding 25 mL of

87
distilled water, the bottle was capped and shaken for a few
minutes. Then the bottle was allowed to stand for about 2
minutes while purging with nitrogen (N2). 25 mL of
cupriethylenediamine (CuEn) was added and purging with N2 was
continued for 1 more minute. The bottle was then capped
and shaken until the fibers were completely dissolved (i.e.,
no fibers stuck on the walls of the bottle).
The viscometer was filled by immersing its small diameter
leg into the solution and drawing the liquid into the
instrument by applying suction to the other end. After drawing
the liquid level to the second etch mark, the tube was removed
from the solution, cleaned and returned to its normal vertical
position. The viscometer was placed in a constant temperature
water bath at 25 °C for at least 5 mm for the solution to
reach the temperature. The solution was drawn up into the
measuring leg of the viscometer with a suction bulb, and
allowed to drain so that the inner surfaces of the viscometer
were wetted. The efflux time was then determined by drawing
the liquid above the upper mark and measuring the time
required for the meniscus to pass between the two marks. The
measurement of efflux time was repeated three times. This
procedure was carried out on all residues which were treated
with acetone, water and acid catalyst.
In the case of untreated cotton and those treated with
just acetone and water, 1 M cupriethylenediamine solution
(CuEn) 25 mL was added first to the residue with a two-

88
minute nitrogen purging, after which the bottle was capped and
shaken frequently for 10 mm. Then 25 niL of distilled water
was added to the bottle and shaking was continued for 20 mm.
The rest of the procedure was similar to that described above.
3.2 Analytical Methods
3.2.1 IR Analysis — Diffuse Reflectance Infrared FourierTransformer (DRIFT)
The average absorbance peak height around 3400 cm’ (gross
hydroxyl range) of differently treated cotton specimens was
obtained. This was conducted in a way that the intensity of
the hydroxyl band could be read without being influenced by
the intervening factors. Such factors that could be taken into
consideration are the variations in peak location due to
stereochemical changes and noise perturbation. The analysis
was maintained on a Perkin—Elmer 1610 Fourier transform
infrared spectrometer equipped with a Perkin-Elmer diffuse
reflectance attachment, with the sample placed on ground
potassium chloride. The spectrum of pure potassium chloride
was ratioed against that of each sample. The spectra resulted
from measurements involving 64 scans at a spectral resolution
of 8 cm’.
The hydrogen bonding test is the mean for three
measurements.

89
3.2.2 Detection of Isopropylidene Derivatives by GasChromatography (GC)
Gas chromatographic investigation of isopropylidene
derivatives of sugars was carried out on a Hewlett Packard
5890A gas chromatograph, equipped with a flame ionization
detector and an HP 3396A integrator. The reports generated on
the HP 3396A printer, after each chromatographic run, were
transferred to a computer for data storage.
The column used for the separation of isopropylidene
derivatives was Supelcowax 10, 30 m x 0.25 mm 1.0. The inlet
pressure for the column was 10 psi. The carrier gas was helium
and the flow rate was 1 mL/min. The injection and detector
temperatures were 200 °C and 300 °C, respectively.
3.2.3 Sugar Analysis - High Performance Liquid Chromatography(HPLC)
The samples prepared as described in sections 3.1.5 and
3.1.6 were directly injected into the high performance liquid
chromatograph (HPLC) column without any further treatment. A
DIONEX HPLC (Dionex Corp., Sunnyvale, CA) equipped with
autosampler, gradient pump and pulsed amperometric detector
was used. The eluent was degassed by vacuum for 20 mm and
degassed again by DIONEX eluent degas module using helium,
before the sample run.

90
The columns used were anion exchange resin columns,
CarboPac PAl (4x250 mm), and a guard column (4x50 mm) to
protect the main analytical column from contamination. An MGi
guard column was also placed before the CarboPac PAl column to
remove any impurities such as phenolic materials that might
form in the hydrolysate. The CarboPac column contained
polymeric nonporous Microbead resins which exhibit rapid mass
transport, fast diffusion , high pH stability (pH 0-14), and
excellent mechanical stability (>4,000 psi).
The Pulsed kmperometric Detector (PAD) had a flow-through
cell with a gold working electrode, stainless steel counter
electode, and a silver/silver chloride reference electrode.
The potential of the working electrode was cycled through
three values to let the electrode surface be cleaned and the
current be stabilized before sampling the oxidative current
from the flow—through solution. Working electrode potentials
were set as follows; El=0.005 V (300 ms), E2=0.60 V (120 ms),
E3=—O.80 V (300 ms) with a sampling time of 200 ms from 100 ms
to 300 ms. The E2 and E3 pulses remove remaining sugars and
then reactivate the gold surface, respectively. The response
time was 1.0 sec and the output range was 100 nA.
The main analytical eluent used was degassed, distilled
and deionized water prepared by a Millipore Mill-Q Water
System. The column was regenerated after every injection with
250 mM NaOH which was prepared as follows; the distilled
deionized water used was degassed first by helium gas for 15

91
mm before mixing with the NaOH solution to avoid carbonate
formation.
The flow rate was 1.0 mL/min and 500 mM NaOH was
introduced into the mixing cell from a post—column pump
(Varian 5000 HPLC) at the flow rate of 1.0 mL/min All samples
before loading onto the column were filtered through a 0.4 urn
syringe filter (NALGENEtm). All tubings used were made of metal
free PEEK.
Regarding accuracy of sugar analysis, three injections
were made for each sample and the standard solution was
injected after different interval times to monitor possible
variations in the column or detector conditions. Calibration
curves were prepared by using standard solutions of arabinose
xylose, galactose, glucose and mannose at three different
concentration levels. The data were processed by DIONEX AI-450
software using a DIONEX advanced computer interface. The
computer used is Hewlett Packard 486 Vectra with Microsoft
Window 3.1.
3.2.4 Solid State Cotton Study - C-13 CP/MAS NMR spectrometry
CP/M1S C-13 NMR spectra of cotton residues were obtained
from a Bruker MSL-400 spectrometer operating at 100.6 MHz. The
spectral conditions used were as follows:
a— spin contact time: 2ms, 90° proton pulse: 6.5 j.sec., and
the relaxing delay was 4 sec.

92
b— MAS spinning rate — 3500-4500 Hz.
The spectra were recorded by using a spectral width of 41.666
KH2.
3.2.5 x-ray Diffraction
X-ray diffraction technique was employed in this work to
investigate the crystalline structural changes brought about
by the solvent purification treatment on cotton cellulose. The
X—ray diffraction data of the samples were recorded using a
Siemens Diffractometer equipped with a D—5000 rotating anode
X—ray generator. The wavelength of the Cu/Kax radiation source
was 0.154 nm and the spectra were obtained at 30 mA with an
accelerating voltage of 40 kV. Samples were scanned on the
automated diffractometer from 9° to 40° of 2 (Bragg angle),
with data acquisition taken at intervals of 0.04° for 1 sec.
A peak resolution program was used to calculate both the
crystallinity index of cellulose and the dimensions of the
crystallites (Hindeleh et al., 1978). This program allowed the
resolution of the X-ray diffraction pattern into the
contributions of each of the diffraction planes. The
background was attributed to the amorphous part of cellulose.
Generally, the Voigt function (Chung, 1989) resulted in the
best fit of the X-ray diffraction patterns and was routinely
used for the determination of both the crystallinity index of
cellulose and the dimensions of the crystallites through peak

93
broadening (full width at half maximum height). The
crystallinity index, which is defined as the ratio of the
resolved peak area to the total area under the unresolved peak
profile, was calculated using the the following equation;
f17d0 - kflAdU
firdo
where Cr1 is the crystallinity index of the cellulose, ‘T is
the total intensity of diffraction in the diffractogram, ‘A is
the total intensity of diffraction due to the amorphous
portion of the sample, 0 is the diffraction angle, and k is
the ratio of the crystalline and amorphous intensities at a
particular 20 value outside of the crystalline peak region
(Wims, et al., 1986). In this work, the value of k was not
determined for each sample used and was taken to be equal to
one in all cases for convenience of calculations.
The crystallinity index of the cellulose was Thiso
calculated by the empirical method described by Segal et al.
(1959), using the equation described below,
4O2-
‘AM100

94
where 1002 is the maximum intensity of the 002 lattice
diffraction (reflection attributed to the crystalline region
of the sample) and Iintensity of diffraction at Bragg angle
20 = 18° (reflection attributed to the amorphous region of the
sample). Nevertheless, the latter approach does not include
any correction for the background (unresolved peak profile).
Results obtained using both methods were in good agreement.
The apparent dimensions of the cellulose crystallites
were determined by applying the Scherrer’s equation to the
data obtained by the peak resolution program. The average
thickness of the crystallite (i.e., relative values) at each
plane of diffraction was calculated using the following
equation;
t(hki)B.csO
where, t is the thickness of the crystal at the (hkl) plane of
diffraction, A is the wavelength of X-ray source, K i the
Scherrer’s constant (for pretreated cellulose, K = 0.9), and
B is the peak full width at the half maximum height (Cullity,
1956).
The crystalline test (the crystallinity index and
crystallite breadth) is the mean for three measurements.
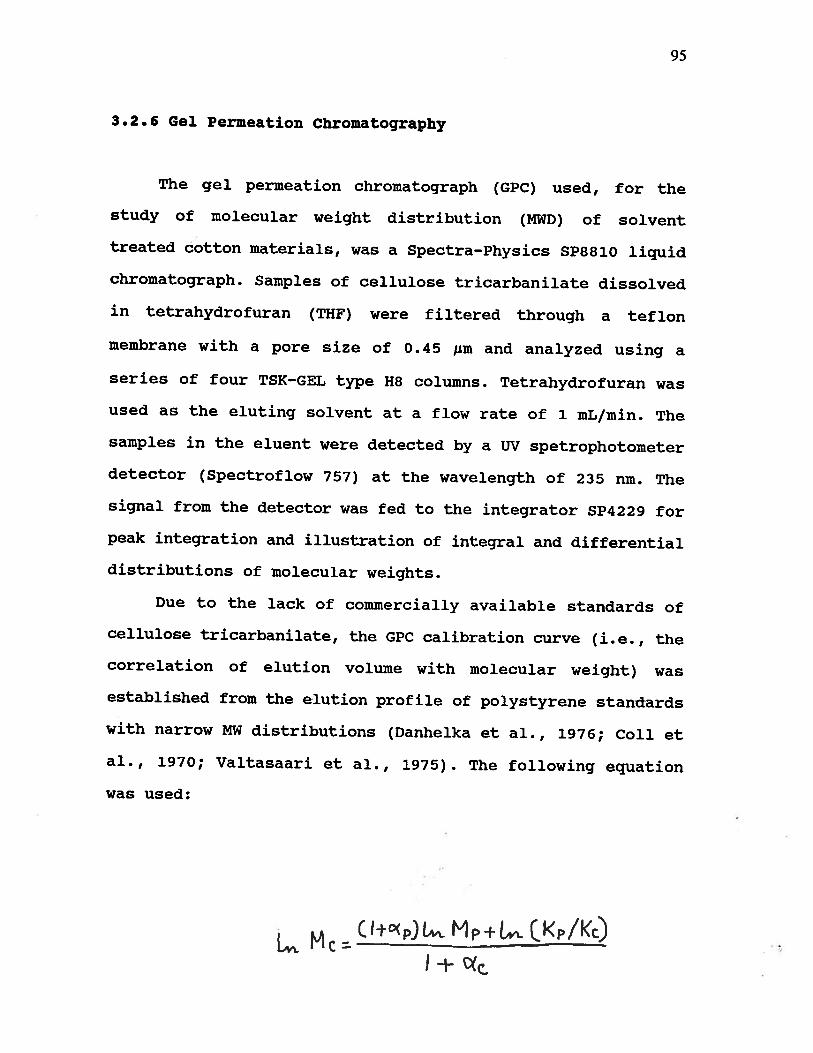
95
3.2.6 Gel Permeation chromatography
The gel permeation chromatograph (GPC) used, for the
study of molecular weight distribution (MWD) of solvent
treated cotton materials, was a Spectra-Physics SP8810 liquid
chromatograph. Samples of cellulose tricarbanilate dissolved
in tetrahydrofuran (THF) were filtered through a teflon
membrane with a pore size of 0.45 ,um and analyzed using a
series of four TSK—GEL type 118 columns. Tetrahydrofuran was
used as the eluting solvent at a flow rate of 1 mL/min. The
samples in the eluent were detected by a IJV spetrophotometer
detector (Spectrof low 757) at the wavelength of 235 mu. The
signal from the detector was fed to the integrator SP4229 for
peak integration and illustration of integral and differential
distributions of molecular weights.
Due to the lack of commercially available standards of
cellulose tricarbanilate, the GPC calibration curve (i.e., the
correlation of elution volume with molecular weight) was
established from the elution profile of polystyrene stanards
with narrow MW distributions (Danhelka et al., 1976; Coil et
al., 1970; Valtasaari et al., 1975). The following equation
was used:
(I+o,)LM. Mp+L4i.Ckp/Kc)
96
where Mc. and M are the MW of cellulose tricarbanilate and
polystyrene, respectively. The Mark—Houwink coefficients used
in the present analysis for polystyrene in THF, K = 1.18 X10⁴
and a, = 0.74, and for cellulose tricarbanilate in THF, K
= 2.01 X i04 and ac= 0.92, were those reported by Valtasaari
et al. (1975).
3.2.7 Viscosity Measurement
This was measured according to TAPPI standard 230 os—
76. The viscosity test in the following chapter (Results and
Discussion) is the mean for 3 measurements.

97
4 RESULTS AND DISCUSSION
4.1 Mechanism of Purification of Cellulose in AcidifiedAqueous Acetone: Elucidation and Characterization
4.1.1. Characteristics of the Raw Material used for the
Elucidation of the Mechanism
100% pure cotton for pharmaceutical purposes has been
used throughout the duration of this study as a model
compound. Its characteristics were determined to be as
follows: 1— the moisture content was 4.85%, 2— the
extractives content was 0.02%, and 3— the alpha—cellulose
content was 98.2%. Other characteristics determined such as
absorbance (hydrogen bonding), viscosity, crystallinity
index and crystallite breadth (full width at half maximum
height, FWHN), etc. are discussed where appropriate in the
text.
4.1.2. IR (DRIFT) Study - Hydrogen Bonding Changes (i.e.,hydogen bond disruption/destruction) during SolventPurification Treatment
The aim of studying residual cotton samples after
acetonation, with the use of a Fourier transform infrared
spectrometer equipped with a Perkin-Elmer diffuse
reflectance attachment, is to verify, quantitatively, the
effect of the treatment on the hydrogen bonding of the

98
cellulosic material (i.e., the hydrogen bond disruption
hypothesis). Hydrogen bonds have occupied a key position in
the interpretation of physico—chemical processes and the
macromolecular structure of cellulose (Sarko, 1978;
Nishimura et al., 1987) and because of their importance as
the locus of interaction between molecules and between the
nearby functions in the same molecule. Thus, the hydrogen
bond provides special promise for the study of such
interactions. It has been known for a long time (Hubert et
al., 1936; Ellis et al., 1940) that the observed stretching
frequency of a covalently bound hydrogen atom is perturbed
in a specific way when that atom gets involved in hydrogen
bonding to an acceptor group. These infrared shifts have
given us a broad knowledge of the structural requirements
for hydrogen bonding, both at inter- and intramolecular
levels (Liang et al., 1959; Marchessault et al., 1960). In
this context, it has also been verified (ALnis, 1966; Lemieux
et al., 1968) that a change in solvent has a substantial
impact on the mechanism and stereochemistry of the reaction
course and hence on the hydrogen bonding of the specified
system. Acetone as a solvent appeared to follow such a
trend as has been confirmed in the present work.

99
4.1.2.1. Acetone Effect on Hydrogen Bonding of CottonResidues during Solvent purification Treatment
Absorbance2
1.8
1 E :z:::::::z::::::.:::.:.:..::.:::a)
- 0.4ci)0
02
0 p I
40 50 60 70 80 90 100Acetone Concentration (%)
Figure 4.1.2.1. Effect of acetone on hydrogen bonding ofcotton residues treated with different acetoneconcentrations (liquor/solid ratio: 10/1; 150 0C; 2 hr; noacid catalyst added).
-
* Means with the same letter are not significantlydifferent.
** Significance at 95% confidence level.

100
The spectral changes in the vicinity of the 0-H
fundamental stretching range, that accompany the solvent
effect on cellulose, are shown in Fig. 4.1.2.1. The results
indicate that the average height of the 0-H band (3400 cm1)
has increased with the increase of acetone concentration in
the solvent composition. Fig. 4.1.2.1 also shows that there
is a sharp increase in band height especially in the 80 to
90% range in acetone concentration. The statistical analysis
shows that the treatments of cotton with different acetone
concentrations are significantly different, Fig. 4.1.2.1
(Duncan’s multiple range test). The increase in the
intensity of the 0-H range band (3400 cm-) with the
increase of acetone concentration is due to the fact that
the reaction of acetone with the cellulose hydroxyls is
expected to weaken the hydrogen bonding in the system. This
attenuation of the hydrogen bonds leads to provision of
spacings in the cellulosic material. These results are in
accord with the earlier observations recorded on acetone—
water pulping of wood species (Zarubin et al., 1989) when it
was found that the physical/mechanical properties of paper
were lowered due to acetone treatment. However, the decrease
in physical strength of paper was attributed (Zarubin et
al., 1989) solely to hydrolysis reactions. The extent of
spacing (i.e., accessibility) in hydrogen bonding of a
cellulose is dependent on a number of factors as will be
discussed later in the text.

101
Fig. 4.1.2.1 illustrates that the solvent purification
treatment has brought about, within the residual cotton,
irreversible H—bond rearrangement that seems to cause
permanent weakness in the H—bonded system. The most probable
explanation for the hydrogen bond attenuation is due to the
interaction of acetone (HBA) with the polar hydroxyl groups
of the cellulose molecules (HBD). It is not well understood
to what extent water can penetrate the crystalline
cellulose, but in any case it is known that such penetration
does not bring about any change of spacings in the
crystallites (Libby, 1962).
On the other hand, the systematic increase of
absorbance (attenuation of the H—bond) with the successive
increase of acetone concentration in the acetone—water
system (Fig. 4.1.2.1) appears to hold for an important
phenomenon. The probable explanation for this phenomenon is
that acetone is a dipolar aprotic protophylic solvent.
Hence, this means that the behaviour of acetone with
cellulose is similar to any other dipolar aprotic
hydrophylic solvent such as dimethylsulphoxide (DMSO),
dimethylformamide (DMF), dimethylacetamide (DMA), and
hexamethyiphosphoric triamide (HNPT). The solvation
properties of these solvents are characteristic. It will
suffice to state that owing to their molecular structure
they are much better able to solvate cations than anions. In
other words, they act as hydrogen bond acceptors with
cellulose. Hence their role can also be confined to the

102
swelling of cellulose. It follows from these results shown
in Fig. 4.1.2.1 that acetone can be considered as a swelling
agent for cellulose. This interpretation is based on the
fact that, earlier, Bax et al. (1972) emphasized that the
proton—solvating property of acetone—water mixtures
systematically increases with the rise in concentration of
acetone reaching a maximum in pure acetone. They attributed
the protophylicity of acetone to the charge density
distribution in the acetone molecule, in conjuction with its
spatial structure, which strongly favours solvation of
positive ions over that of negative ones. Similar
explanation about the protophylicity of acetone was also
noted by Frey-Wyssling (1953) and Isaacs (1974). On the
other hand, some previous works concerning the solvation
properties of the acetone—water systems and their proton
affinities surfaced differences of opinion. It was noted
(Fong et al., 1969) that the enhancement of acidity with
increasing acetone content in the acetone—water mixtures
could be attained with up to 42 wt % acetone. Even though,
this enhancement of acidity was interpreted (Fong et al.,
1969) by the better anion solvation rather than the
solvation of proton. Beyond this limit, any increase of
acetone content in a water—acetone system will lead to the
reduction of the dielectric constant, and hence it retards
the dissociation constant of an acid. Later, Waggoner et al.
(1982) claimed, in his investigation of medium effect on
proton activity using acetone—water mixtures, that the

103
reason for the enhanced protophylicity of acetone in the
range of 20 to 40 wt % acetone was due to the specific
proton—solvating properties of acetone—water complexes that
could be formed at these compositions. In other words,
Waggoner et al. (1982) contended that the mutual
interactions of the solvent constituents would possibly play
a significant role in determining the proton affinities in
the acetone—water systems.
The weakness of hydrogen bonds , resulting in the
residual cotton during the acetonation, might be due to the
length and nonlinearity of these bonds. In this concept, in
a comprehensive comparative study Schemer et al. (1985)
investigated the geometry and energies of hydrogen bonds
between carbonyl and hydroxyl oxygens. They stated that the
instability developed into (H2CO...OH2yby increase of
the angle from 107° to 180° has in turn been attributed to
the weakening of the H-bond caused by the nonlinearity of
the O—I-I...O atoms. In the case of hydrogen bonds between two
hydroxylic molecules (i.e., H2OH...0H2)’ the H-bond wa not
weakened because the central proton remained along the O...O
axis. Their results indicated that the rigidity of the (COH)
angle in H2COH prevented the central proton from following
the water molecule as it rotated down to the angle of 1800.
The experimental results showed (Schemer et al., 1985) that
an energy of 16.3 kcal/xnol was required to bring the
hydrogen bond, formed between a carbonyl group and hydroxyl
compounds, to linearity. However, the hydrogen bonds, formed

104
between hydroxyl compounds, consumed only 4.6 kcal/mol to
maintain linear position. In addition, Jeffrey et al.
(1991) noted that the carbonyl (C=O) bond length is much
less sensitive to the changes in bond character than the
single C-O bond length. It was also emphasized (Jeffrey et
al., 1991) that the carboxylic acids offer very strong
hydrogen bonds through their hydroxyl groups as hydrogen
bond donors (HBD). However, on the contrary, they form with
other molecules fairly weak hydrogen bonds through their
carbonyl groups (C=O) as hydrogen bond acceptors (HBA). This
was attributed (Jeffrey et al., 1991) to the rigidity of the
carbonyl group. Apparently, this nonlinearity of hydrogen
bonding in conjuction with the provision of longer hydrogen
bonds, in the case of carbonyl groups, could be thought of
as the mechanism of hydrogen bond disruption in the
cellulosic material by acetone. In addition, the systematic,
irreversible attenuation of hydrogen bonding, with the
increase of acetone concentration, suggests a new
orientation of the hydroxyls on the cellulose. However,_such
a phenomenon can be only attained through intramicellar
swelling of the cellulose (Frey-Wissling, 1953; Sarko, 1978;
Jeffrey et al., 1991). In other words, this intramicellar
swelling is anticipated to be accompanied with a new type of
crystal packing order, i.e., provision of a different set of
unit cell dimensions.
105
Regarding the literature reviewed on the importance of
hydrogen bonding, H—bond donor/acceptor solvents etc.
(Huggins, 1971; Saenger, 1979; Simmering, 1964; Parker,
1962), and the results obtained in the present work, confirm
that acetone has the ability to penetrate into the
cellulosic material under suitable conditions. At the same
time acetone is classified as a dipolar aprotic hydrophylic
rather than hydrophobic solvent (i.e. HBA) (Frey-Wyssling,
1953; Bax et al., 1972; Isaacs, 1974). This means, the high
ratio of acetone (around 90%) in the solvent composition
(i.e., usually acetone + protic solvent) brings about the
following consequences;
1— predominance of acetone in the reaction zone with
cellulose, i.e., better solvation and
2— stereochemical changes produced by structural alterations
such as the presence of isopropylidene intermediates in the
solid state of the cellulose confirmed by C-13 CP/MAS NMR
analysis. Consequently, the formation of those intermediates
brings about considerable weakness in the hydrogen bonding
(inter— and intramolecular bonds) system by formation of
hydrophobic isopropylidene groups on the cellulosic
material. This phenomenon can be explained by the fact that
the electron density on hydrogen is reduced because of
isopropylidene group formation on the sugar ring and the
removal of some hydrogen in condensed water molecules as a
106
result of acetone and sugar movements out of the fibre
structure.
In conclusion, for the hypothesis of
disruption/destruction of H-bond of cellulose (carbohydrate)
by acetone in the solvent purification of pulp, one relies
on the following considerations:
a— deactivation of water molecules to interact with the
cellulose when acetone comprises the major volume of the
solvent composition,
b— penetration of acetone molecules into the cellulose
fibres,
c— interaction of acetone with cellulose (carbohydrate)
molecules through their hydroxyl groups. This presumably
brings about stereochemical changes (i.e., rotational) at
the beginning that disrupt and permanently weaken the H-bond
of crystalline cellulose,
d- at high temperatures and in the presence of acid catalyst
(hydrolysis), solvent interaction with cellulose molecules,
now, is evident to cause further significant stereochejical
alterations (i.e., rotational, configurational, and
conformational). The validity of these assumptions has been
proven by the results obtained by GC, HPLC, and C-13 CP/MAS
solid state NNR analyses. These structural changes
disrupt/destroy both inter- and intramolecular H-bond of the
material (amorphous and crystalline regions),
e— at high acetone concentrations (around 90%), high
temperature remarkably increases the rate of cellulose

107
(carbohydrate) dissolution (effect of overpressure of
acetone at high temperature) by hydrolysis to low molecular
weight fragments.
4.1.2.2. Other Factors Affecting Hydrogen Bonding of CottonResidues during Solvent Purification Treatment
Further investigation into the solvent purification
treatment has revealed that other variables such as type of
acid, acid concentration, temperature and residence time
have variable effects on hydrogen bonding of the treated
material. However, the solvent’s (i.e. type of acid
catalyst) effect on hydrogen bonding appears to be the one
most crucial among these parameters when other variables are
kept constant as it is demonstrated in the following
results.
4.1.2.3. Effect of Type of Acid Catalyst and AcidConcentration on Hydrogen Bonding of Cotton Residues duringSolvent Purification Treatment —
The effect of the type of acid catalyst on hydrogen
bonding has been examined with different acid
concentrations.Figs. 4.1.2.2 and 4.1.2.3 show the effect of
acid concentration on hydrogen bonding with different acid
catalysts.Both Figs. 4.1.2.2 and 4.1.2.3 show that there is
a sharp fall of absorbance (i.e., from 1.61 to 1.05 and 0.86
for TFA and 1.06 for HC1) at low concentration of acid of

108
the solvent purification treatment. The second common
phenomenon is the decrease in the peak height in the 0-H
stretching range with the use of different acid catalysts.
Fig. 4.1.2.2 illustrates that the peak height goes down from
1.61 (no acid catalyst added) to 0.86 absorbance at 1.5 N
TFA. However, the statistical analysis indicates that there
is a difference in the behaviour of the two acids with
regards to bydrogen bonding. According to Duncan’s multiple
range test, the treatments of cotton with different acid
concentrations (TFA) are significantly different, see Fig.
4.1.2.2. While those treated with different acid
concentrations (HC1) (except 0.0 N HC1) appear to be not
significantly different (Fig. 4.1.2.3).
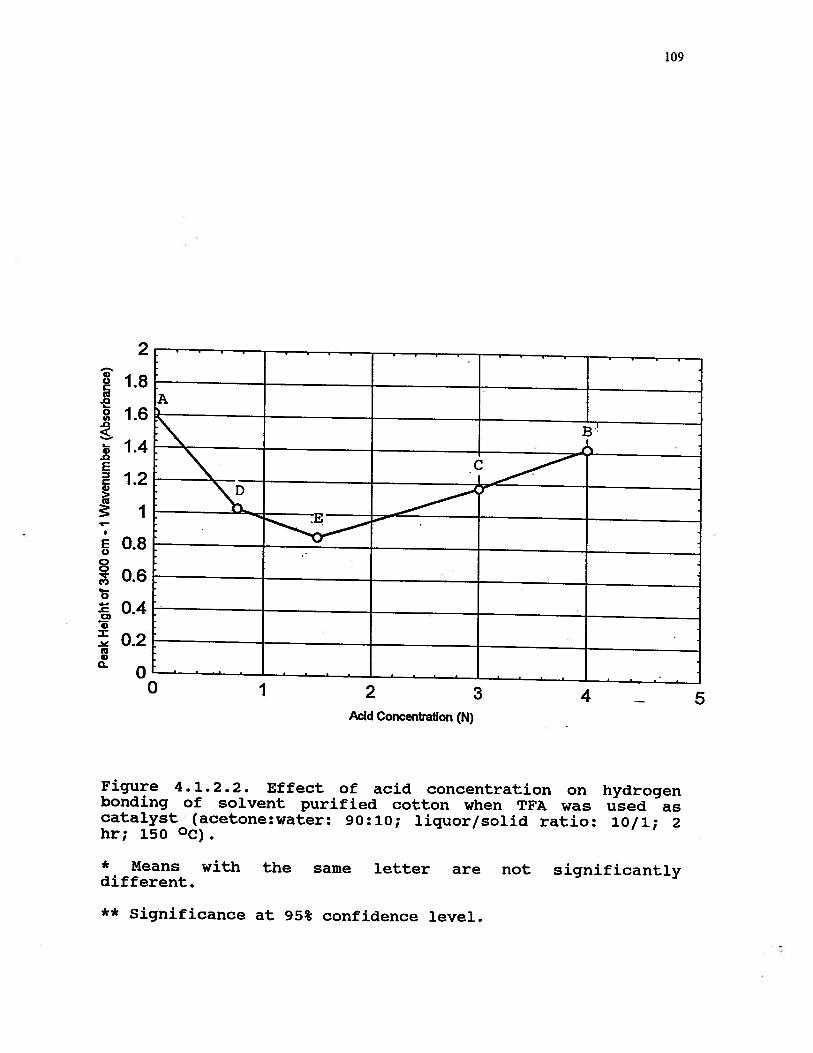
Figure 4.1.2.2. Effect of acid concentration on hydrogenbonding of solvent purified cotton when TFA was used ascatalyst (acetone:water: 90:10; liquor/solid ratio: 10/1; 2hr; 150 °C).
* Means with the same letter are not significantlydifferent.
109
C)
I0U)
1C
Ez
I2
1.8
1.6
1.4
1.2
1
0.8
0.6
0.4
0.2
0
A
N0 1 2 3 4 5
id Concentration (N)
** Significance at 95% confidence level.

110
However, at higher acid concentrations (3 and 4 N TFA) the
band intensity of 0—H range has successively increased to
reach 1.42 absorbance. On the other hand, Fig. 4.1.2.3 shows
that the peak height of the 3400 cm1 has sharply decreased
from 1.61 to 1.05 absorbance at 0.16 N HCl. Further increase
in acid concentration (0.4 and 0.8 N HCL) resulted only in a
very slight further decrease in absorbance.
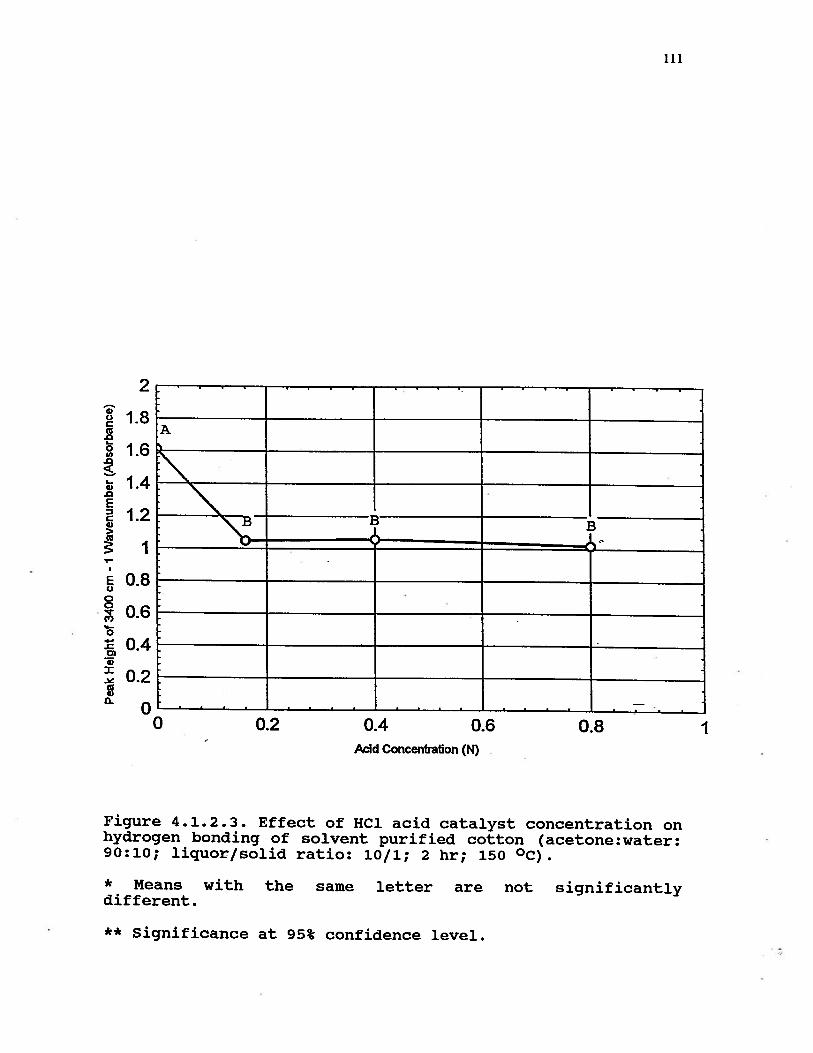
111
Acid Concentrabon (N)
Figure 4.1.2.3. Effect of HC1 acid catalyst concentration onhydrogen bonding of solvent purified cotton (acetone:water:90:10; liquor/solid ratio: 10/1; 2 hr; 150 °C).
* Means with the same letter are not significantlydifferent.
2
1.8
1.6
1.4
1.2
I
0.8
0.6
0.4
0.2
0
0C
.0
0
.0
I
.0EC
E000
().4-04-
0)4)z
4)a-
0 0.2 0.4 0.6 0.8 I
** Significance at 95% confidence level.
112
Figs. 4.1.2.2 and 3 show much similarity in two
aspects. The first trend is the sharp increase in the
strength of hydrogen bond of the material at low
concentration of acid of the treatment. This is probably
associated with the ease of removal of considerable amounts
of amorphous cellulose at the beginning of the treatment. On
the other hand, the second observation is that the use of
acid in solvent purification treatment gives rise,
generally, to a stronger hydrogen bond in the residual
material, no matter what type of acid catalyst is used. This
can be attributed to the fact that the acid catalyst
facilitates the process of structural transformations to
take place by the protonation of already solvated molecules
(i.e., isopropylidenated sugars). Hence, the strength of the
hydrogen bond of the cellulose relies on the structural
changes and the removal of sugar derivatives into the
solution.
The result shown in Fig. 4.1.2.2 indicates that the
variation of acid concentration of TFA in the presence of
acetone has given cotton residues with different levels of
hydrogen bond strength. Apparently, at lower acid
concentrations (i.e., 0.75 and 1.5 N TFA) the formation of
hydrogen bonding between TFA and the cellulose molecules
dominates and renders even residual cotton with stronger
hydrogen bonds (0.86 absorbance) than that of the untreated

113
cotton (1.08 absorbance) . In the case of higher acid
concentrations (3 and 4 N TFA), favourable conditions are
likely to develop for TFA—acetone suggested reactions
(Geddes, 1956; Harris, 1965; March, 1985). In turn,
reactions with high ratio of acetone in the solvent
composition provide better chances for acetone to attenuate
the hydogen bonds in the cellulosic material.
In conclusion, the variation in hydrogen bond strength
is probably due to the different reactions associated with
the use of TFA as a catalyst (i.e., protonation, formation
of hydrogen bonding with both hydroxyl groups of the
cellulose and water molecules, and TFA—acetone reaction). On
the other hand, it was stated (Jeffrey et al., 1991) that
the carbohydrates resemble water molecules in hydrogen
bonding behaviour. They can, with their hydroxyl groups,
have both donor and acceptor properties, i.e., amphiprotic
depending on the reaction medium. In other words, cotton
cellulose acts as hydrogen bond donor (HBD) in the abundance
of acetone, while in lower concentrations of TFA in the
presence of acetone it behaves as hydrogen bond acceptor
(HBA).
Fig. 4.1.2.3 shows the changes in hydrogen bonding that
have taken place at different concentrations in the residual
cotton samples when HC1 was used as an acid catalyst. The
figure illustrates that the hydrogen bonding was stronger in
the initial cellulosic material. A significant drop occurs
on acidifying the system. Higher acid concentrations applied

114
have slight effect on hydrogen bond system. The strength of
the hydrogen bond, in the case of HC1, could probably be
attributed to the fact that HC1 is known to be an efficient
acid in hydrolysis and it seems that HC1 is less involved in
similar side reactions than TFA. Thus, the solvation of
solvent—solute, more or less, proceeds much easier and hence
leads to pronounced structural transformations in the
cellulosic material. In turn, these acetonated sugars could
easily be protonated, in the case of HC1 acid as catalyst,
and dissolved in the solution. Thus, the process of
efficient hydrolysis with HCl will result in provision of
cellulose with relatively stronger hydrogen bonds than that
offered by the acetonation treatment in the absence of an
acid catalyst.
The slight increase in the strength of hydrogen bonding
associated with higher concentrations of HC1 acid could only
be attributed to further removal of amorphous cellulose in
the solution. HC1 is considered to form a weak hydrogen bond
with other compounds. Hence one of the requirements for the
formation of strong hydrogen bonds is that the element
covalently bonded to the hydrogen must have a small atomic
size (Mortimer, 1971). However, this is not the case in HCl.
The chlorine atom is fairly large and, therefore, has a
diffuse electron cloud. A similar explanation for the
weakness of hydrogen bond formed by HC1 acid with other
compounds was given by Vinogradov et al. (1971). He stated

115
that the HC1 molecule, even though it is a polar one, has
weak dispersion forces.
4.1.2.4. Effect of Temperature on Hydrogen Bonding of CottonResidues during Solvent Purification Treatment
Figs. 4.1.2.4 and 4.1.2.5 show the effect of
temperature on hydrogen bonding of cotton residues during
the solvent purification treatment. The statistical analysis
indicates that the treatments of cotton at various
temperatures (130, 150, and 180 °C) for hydrogen bonding are
significantly different, in the use of TFA as a catalyst
(Duncan’s multiple range test). However, when HC1 was used
as a catalyst, the statisical analysis shows that the
treatments at 130 and 150 0C are not significantly
different. Fig. 4.1.2.4 shows that the solvent treatment at
130 0C, when TFA was used as a catalyst, has afforded a
cellulosic structure with a weakened hydrogen bond. The
absorbancies of the treated cotton samples (1.17, l.4 and
1.52) are all higher than that of the untreated one (1.08).
This can be explained by the fact that acetone as a low
boiling point solvent (i.e., 56 °C) with a small molecule
has the ability to penetrate and interact with the cellulose
molecules (amorphous and crystalline) and bring about larger
spacing in the hydrogen bond network as hydrogen bond
acceptor (HBA). Nonetheless, the molecular size of water is
normally smaller than that of the acetone (the diameter of

116
the water molecule is 2.78 A; Frey-Wyssling, 1953). However,
the acetone effect (i.e., intramicellar swelling) is more
pronounced than that of water. Hence, other important
properties of a solvent affecting penetrability and
swellabillty should be taken into account such as molecular
structure and reactivity (Tchoubar, 1966; Bax et al.,1972;
Isaacs, 1974). In addition, it was also emphasized (Bradley
et al., 1993) that with the increase of temperature the
molecules are more free and faster to reorient and interact.
At 150 0C the treatment offers cellulose with much stronger
hydrogen bonding (0.66, 0.86 and 1.14 absorbance).
Apparently, at this temperature the formation of hydrogen
bond, due to interaction of TFA (HBD) with the hydroxyl
groups of the cellulose molecules, predominates.
Nonetheless, the solvent treated cotton at 180 0C has
yielded structures with stronger hydrogen bonding in
general. This can be explained by the fact that at higher
temperatures, favourable conditions are expected to develop
for better diffusion of both acetone and acid catalyst into
the cellulosic material. Hence, stereochemical alterations
could proceed more effectively under more extensive solvent—
solute solvation and bring about changes in the
crystallinity index and the crystallite size.
Fig. 4.1.2.4 also shows that three points (two points
(F, G) for 2 different treatments and one (H) for the 3
different treatments) are thermodynamically at equilibria.
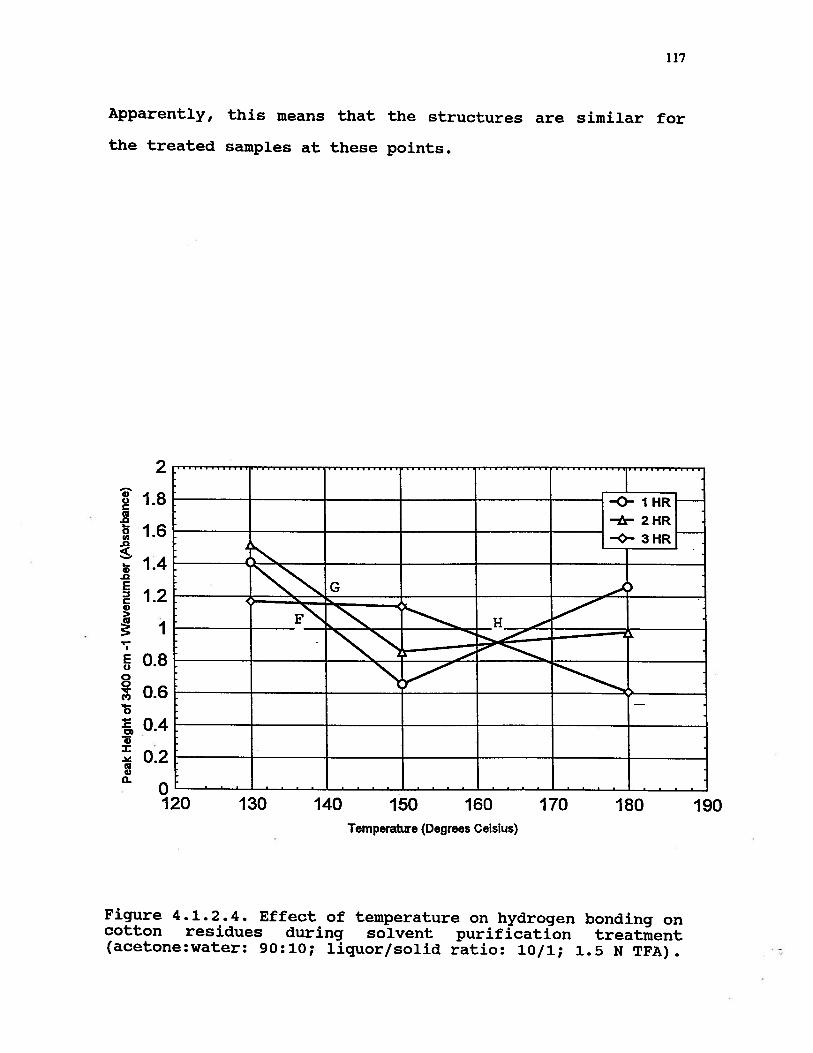
117
4)
(U
1.6
4).0EC
I
Apparently, this means that the structures are similar for
the treated samples at these points.
2
1.4
1.2
1
0.8
0.6
0.4
0.2
0120 130 140 150 160 170 180
Temperature (Degrees Celsius)
190
Figure 4.1.2.4. Effect of temperature on hydrogen bonding oncotton residues during solvent purification treatment(acetone:water: 90:10; liquor/solid ratio: 10/1; 1.5 N TFA).

118
However, Fig. 4.1.2.5 shows that the solvent
purification treatment using HC1 at all temperatures applied
(except 180 °C) has generally rendered residual cotton with
slight changes in hydrogen bonding. The interpretation for
this phenomenon is twofold. First, it is possible that the
increase of temperature may lead to an increase in the
removal of both amorphous and crystalline cellulose.
Figure 4.1.2.5. Effect of temperature on hydrogen bonding ofcotton residues during solvent purification treatment(acetone:water: 90:10; liquor/solid ratio: 10/1; 0.16 NHC1).
2
Cs
1.6
1.4
1.2
0.4
O.2
o0120
-0- I HR-zi- 2 HR
Lj-3HR
b__
:-j
130 140 150 160 170 180Temperature (Degrees Celsius)
190

119
In turn, this treatment is expected to offer cellulose with
stronger hydrogen bonding, however, the outcome of the
hydrogen bonding as shown in Fig. 4.1.2.5 is unremarkable
and diverse. This is likely be due to the multilateral
interactions of various solvents and complexes (i.e.,
(CH3)2C0, H20, HC1, (CH3)2C0.H20, (CH3)2C0.HC1, I120.HC1,
(CH3)2C0.H20.HC1) available in the system in conjuction with
the presence of weak hydrogen bond acid catalyst. It was
also noted (Mortimer, 1971) that these complexes have
somewhat different properties than those of their pure
compounds.
4.1.2.5.Effect of Residence Time on Hydrogen Bonding ofCotton Residues during Solvent Purification Treatment
The object of this part of the study on the solvent
purification treatment has been to investigate the influence
of reaction time on hydrogen bonding of the treated cotton
materials. The reason for this interest is because hydrogen
bonds are usually involved in solvation and acid catalysis
processes. In this respect, the time factor has an effect on
them.
Fig. 4.1.2.6 shows different behaviour of hydrogen
bonding within the cellulosic materials treated at different
temperatures with TFA as the catalyst. The results shown in
Fig. 4.1.2.6 indicate that the hydrogen bond strength for
cotton treated at 130 °C appears to change with time (i.e.,

120
1.41 — 1 hr, 1.52 — 2 hr, and 1.17 — 3 hr). While the
hydrogen bonding of the treated cotton at 150 0C increased
steadily in absorbance with time (0.66 — 1 hr, 0.86 — 2 hr,
1.14 — 3 hr) indicating that the hydrogen bond was getting
weaker. At 180 °C the hydrogen bond strength is found to go
in the opposite direction, i.e., getting stronger. This flip
in hydrogen bonding behaviour of the two different
temperature treatments (150 and 180 °C) within a comparable
reaction times (1 to 3hr) may be due to the fact that 150 0C
provides suitable conditions for TFA to be involved with the
reactants in side reactions. In turn, this situation may
offer better chances for acetone as a major volume fraction
in the solvent composition to develop weaker H—bonds within
the cellulose. In other words, 150 0C is not high enough for
TFA to bring about significant changes within the
crystalline cellulose. The results of the weight loss for
the two temperature treatments (150 0C, 180 0C, for 1, 2,
and 3 hr) lend support to this assumption; 2.84%, 3.38%,
4.42%, and 7.11%, 12.02%, 18.07%, repectively.
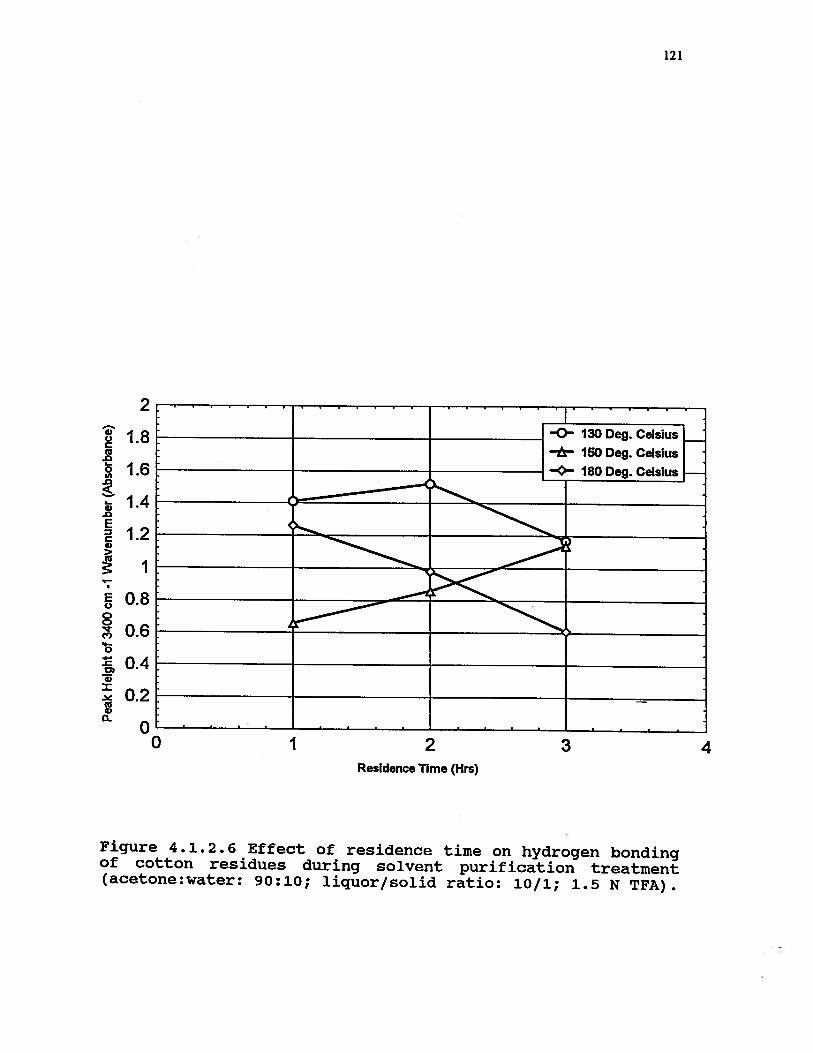
121
00
Residence Time (Hrs)
Figure 4.1.2.6 Effect of residence time on hydrogen bondingof cotton residues during solvent purification treatment(acetone:water: 90:10; liquor/solid ratio: 10/1; 1.5 N TFA).
2
1.8
1.6
1.4
1.2
I
0.8
0.6
0.4
0.2
0C
a0
—0— 130 Deg. Celsius-er- 150 Deg. Celsius
L? 180 Deg. Celsius
I 2 3 4

122
These results explicitly indicate the removal of
carbohydrate at 180 0C treatment with different reaction
times. These results, also, demonstrate that the temperature
is a more critical factor than the reaction time when other
parameters were kept constant in the solvent purification
treatment. In addition, the statistical analysis shows that
the treatments of cotton for hydrogen bonding at different
reaction times (Figs. 4.1.2.6 and 4.1.2.7) are not
significantly different (except 3 hr treatment, HC1) for
both acid catalysts (Duncan’s multiple range test).
Fig. 4.1.2.7 shows the effect of residence time on
hydrogen bonding of residual cotton when HC1 was used as a
catalyst in solvent purification treatment. The results
shown in this figure demonstrate that the hydrogen bond gets
slightly stronger with increase in the reaction time. This
may be explained by the fact that chances for better
solvation conditions increase with time due to changes in
the environment of already solvated molecules (i.e.,
isopropylidenated sugars). Another most possible exp1antion
may be that the residue which remains after such hydrolysis
treatment is microcrystalline cellulose of higher
crystallinity. This is consistent with the findings of Chang
et al. (1977).
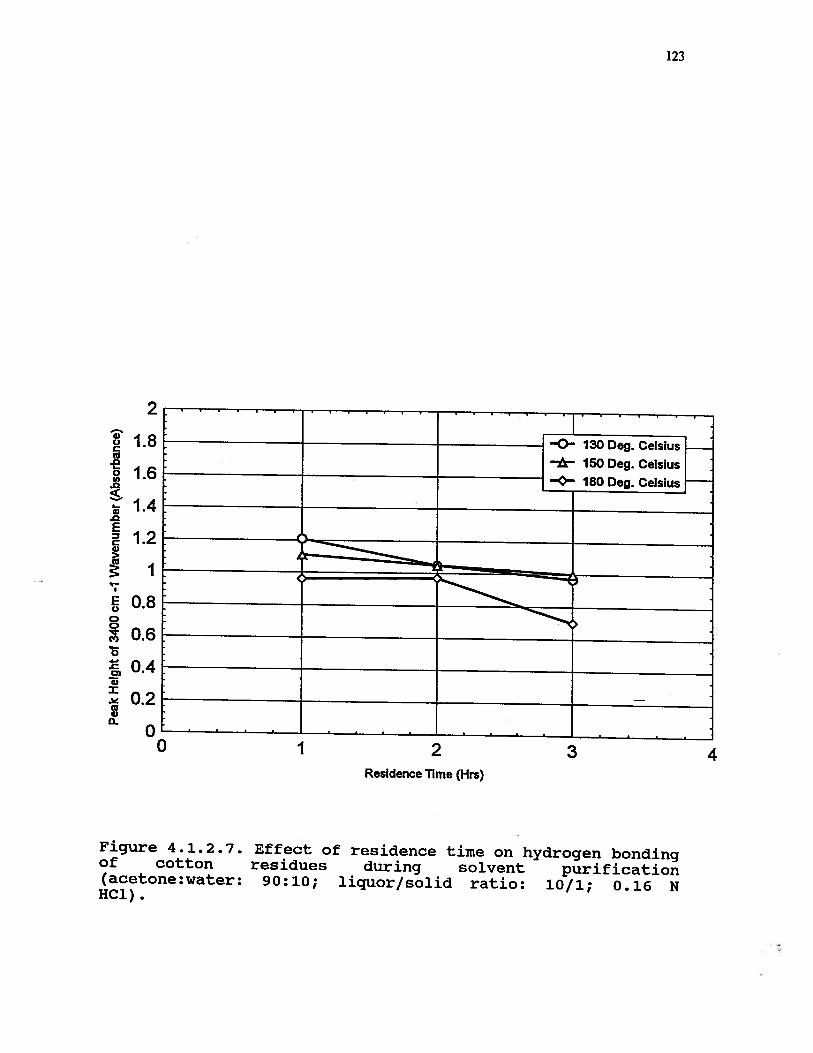
4)C)C(5.0
0
.0
4).0EC
I
123
2
1.8
1.6
1.4
1.2
I
0.8
0.6
0.4
0.2
00
—0- 130 Deg. Celsiusx 150 Deg. Celsius
[- 180 Deg. Celsius
1 2 3 4Residence lime (I-Irs)
Figure 4.1.2.7. Effect of residence time on hydrogen bondingof cotton residues during solvent purification(acetone:water: 90:10; liquor/solid ratio: 10/1; 0.16 NHC1).
124
The results, which are shown in Figs. 4.1.2.2, 4.1.2.4
and 4.1.2.6, indicate that the use of TFA as a catalyst in
the presence of acetone has led to much complexity in
hydrogen bonding behaviour. However, the results shown in
Figs. 4.1.2.3, 4.1.2.5 and 4.1.2.7 show that the hydrogen
bond changes, in the case of hydrochloric acid, appear to be
relatively simple and progressive.
It was emphasized in the literature that the nature of
the solvent, more or less, has the some effect on the
position of equilibria between conformations and hence the
molecular rotation of a compound (Brewster, 1959; Stoddart,
1971; Lemieux et al., 1968). Also, changes in molecular
rotation brought about by the solvent effect were noted
(Brewster, 1959) to be sensitive to changes in temperature.
Thus, involvement of TFA in the formation of hydrogen
bonding, with more complexity than that resulting from the
use of HC1 as a catalyst, can have the following
justifications. Trifluoroacetic acid (TFA) is classified as
a polar protic (HBD) solvent with high ionizing power and
fairly low nucleophilicity. Further, the TFA molecule has a
resonance effect (Amis, 1966; Tchoubar, 1966; March, 1985;
Reichardt, 1988). Besides, it was noted (Nissan, 1977;
Jeffrey et al., 1991) that the strength of hydrogen bond is
fairly dependent on the molecular structure of the hydrogen
bond donor solvent, i.e., the strong hydrogen bond of TFA
arises due to the presence of the highly electronegative F
atom in the TFA molecule. Apparently, such properties make

125
TFA a strong carboxylic acid with a very strong hydrogen
bond. Based on these facts TFA can develop a strong hydrogen
bond with cellulose and form addition products with water,
ketones, ethers and amines (Geddes, 1956; March, 1985). Now,
it seems to be that TFA, most probably, is involved through
hydrogen bonding with cellulose, acetone, and water. In
turn, these reactions, in conjuction with other parameters,
have different implications on the hydrogen bond strength of
cotton that would take place during the solvent purification
treatment. However, the major reaction that brings about
irreversible structural changes (i. e., isopropylidene
derivatives of sugars) within the cellulosic material, is
the acetonation. This has been confirmed, in this work, by
GC, HPLC, and C-13 CP/MAS solid state NMR.
126
4.1.3 Cotton Hydrolysis during Solvent PurificationTreatment
4.1.3.1. Gas Charomatographic (GC) Investigation —
Isopropylidene Derivatives of Sugars, Identification duringSolvent Purification Treatment
Hydrolysis of cellulose in acid catalyzed aqueous
acetone is a novel technique. In anhydrous acidified
acetone, isopropylidene groups are formed involving cis—
hydroxyls on polyols of mono- and disaccharides (Kiso et
al., 1976; Hasegawa et al., 1973; Hasegawa et al., 1973;
Excoffier et al., 1984; Glushka et al., 1983; Khan et al.,
1975; Ueno et al., 1981). Hydrolysis of substituted
saccharide residues under these conditions has not been
reported in the literature. On the other hand, in acid
catalyzed aqueous acetone, rapid hydrolysis of cellulose to
monomeric sugars, at high temperature, has been observed
(Paszner et al., 1988). Their work indicated that the
hydrolysis of cellulose in the presence of acetone was up to
700 times faster than in conventional aqueous acid
hydrolysis.
In order to separate and identify isopropylidene
derivatives in the hydrolysate (nonreducing and reducing
sugars) obtained on solvent purification of cotton,
authentic solutions of 1,2—mono—acetal glucofuranose (Fig.
4.1.3.1), 1,2:5,6—diacetal glucofuranose (Fig. 4.1.3.2),
2,3:5, 6—diacetal mannofuranose (Fig. 4.1.3.3) and 1,2:3,4—
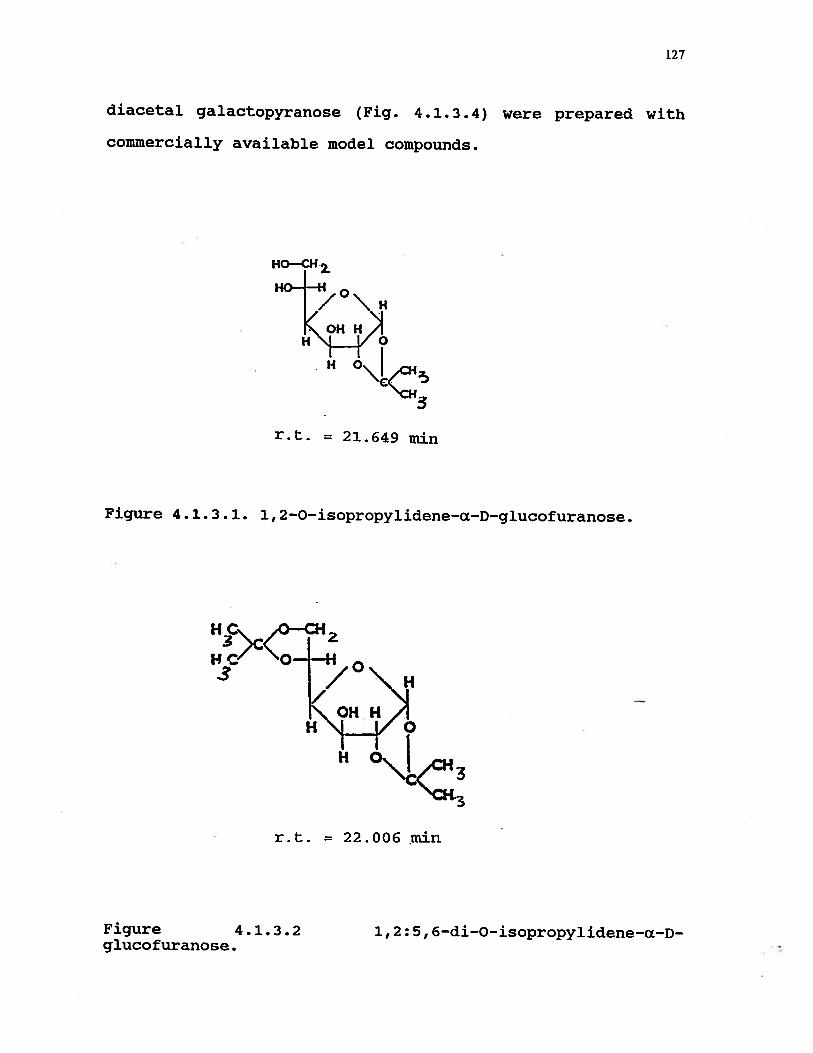
127
diacetal galactopyranose (Fig. 4.1.3.4) were prepared with
commercially available model compounds.
HO—CH
r.t. 21.649 mm
Figure 4.1.3.1. 1, 2-O-isopropylidene-cL-D--glucofuranose.
H
°\cC3
r.t. = 22.006 mm
Figure 4.1.3.2 1,2:5, 6—di-O-isopropylidene—x—D-glucofuranose.

128
__
oHCR
r.t. = 32.647 mm
Figure 4.1.2.3. 2,3:5, 6—di—O—isopropylidene—D—inannofuranose.
HOH
::.r.t. = 19.850 mm
Figure 4.1.2.4. 1,2: 3,4-di-O-isopropylidene-x—D-galactopyranose.

129
The structures of the cotton hydrolysate compounds (Figs.
4.1.3.5 and 4.1.3.6) have been established in a similar
manner suggested by Tomori et al. (1984) by comparison of
retention times with those of authentic. ones. The
nonreducing sugars in the hydrolysate (Fig. 4.1.3.5) appear
to have two major isomers; one of them at the retention time
20.57 mm is unknown, while the other at the retention time
21.91 mm is 1,2:5,6—diacetal glucofuranose. Reducing sugars
isolated from the hydrolysate on acetonation (Fig. 4.1.3.6)
were found to have more than five major isomers; two of them
have been identified 1,2:3,4—diacetal galactopyranose (r.t.
19.69 mm.) and 1,2:5,6—diacetal glucofuranose (r.t. 22.02
mm). It is noteworthy to mention that due to the fact that
there are limited number of model compounds of
isopropylidene derivatives of sugars available from
commercial sources, it was not possible to identify all the
major isomers developed in the hydrolysate. Neither is it
logical to assume that all derivatized sugars are stable
under these conditions and would survive the _high
temperature treatment. Nonetheless, isomers such as acetals
of allose, altrose, gulose, idose, etc. could be anticipated
to exist in the reaction mixture of the acetonation of
cellulose.
Both Fig. 4.1.3.5 and 4.1.3.6 suggest that acetonation
of cotton provides for a remarkable stereochemical
versatility. In other words, much is characterized by
isomerisation and interconversion reactions of glucose units

130
of cotton cellulose. The two figures also indicate that
isomerization has led to the establishment of an
equilibrium. It must be conceded that cyclic and acyclic
carbohydrate residues react readily with aldehydes and
ketones in the presence of acid catalyst to form cyclic
acetals (Stoddart, 1971). Thus, after suitable reaction
conditions, an equilibrium is eventually established in
which the composition of the reaction mixture is determined
by the relative free enegies of the cyclic acetals. However,
from the stereochemical point of view, equilibrium is often
complex. In other words, when an equilibrium exists between
cyclic acetals of different ring sizes, acetal ring
isomerization has to be taken into account in conjuction
with configurational and/or conformational isomerizations
(Stoddart, 1971). In addition, the two figures on cotton
acetonation illustrate explicitly that isomerization does
occur in three forms all together, i.e., constitutional,
conformational and configurational.
Fig. 4.1.3.5 shows fewer isomers than that of Fig.
4.1.3.6. Further the amount and number of major isomers
appears to be different. This could be attributable to the
difference in stability of the various isomers, i.e., the
unknown isomer at 20.57 mm. retention time (Fig. 4.1.3.5)
is more stable than the other major isomer — 1,2:5,6—di—O—
isopropylidene—cx—D—glucofuranose. In this respect, a number
of factors are involved in the stability and flexibility of
isopropylidene derivatives. These are: the dioxolane and

131
dioxane ring system, sugar ring (pyranoid vs. furanoid), the
electronic interactions between the functional groups and
the molecular size of the derivatives (DeJong et al., 1964;
Tomori et al., 1984; Tomori et al., 1984; Stoddart, 1971).
Thus, when equilibrium is reached in solution by
isomerization, the proportions of the different isomers are
determined by their relative free energies (Stoddart, 1971).
It is significant and unexpected, however, that
isopropylidene derivatives of glucose have survived the high
temperature hydrolysis conditions of cellulose even in the
presence of water.

132
LI’LI’Lf
(‘4
1• HOL<
r.t. = 21.913 mm
rc’
0•.
-i(‘4
(It’,..
I..’t. -1 ck.• Ct
ct’ eCs. -( cc,U:
z,C:ft:
cr:I—.
Figure 4.1.3.5. GC chroniatogram of nonreducing sugars of thecotton hydrolysate of solvent purification treatment(acetone:water: 90:10; liquor/solid ratio; 10/1; 2 hr; 150°C; 0.16 N HC1).

133
I’41
HC
‘I KOHH)IH\Lfr’o
H
r.t. = 22.02 mm(I
CHOH
:<“-Ici
H O\ci LI.
c.(I
r.t. = 19.69 mm
‘-I
TI —I
I—.2: a:
Cr:I--
* (SI
Figure 4.1.3.6. GC chromatogram of acetonated reducingsugars of cotton hydrolysate of solvent purificationtreatment (acetone:water: 90:10; liquor/solid ratio: 10/1; 2hr; 150 0C; 0.16 N Hel).
134
4.1.3.2 HPLC Analysis
The purpose of qualitative sugar analysis is to find
out which sugars are extracted from the cotton, i.e., to
know whether isomerization (epimerization) has taken place
in the removal of acetone from isopropylidene derivatives of
sugars. On the other hand, the quantitative sugar analysis
is to assist in the determination of the predominance of the
isopropylidenation reaction as the major mechanism
(derivatives formation) responsible for the rapid hydrolysis
and preventing the monomeric sugars from undergoing acid
catalyzed dehydration.
Factors affecting the solvent purification treatment of
cotton such as acetone concentration, type of acid,
residence time, temperature, and acid concentration vs
weight loss have also been studied (section 4.1.3.2.3).
4.1.3.2.1— Deacetonation - Epimerization
Not altogether unexpectedly Figs. 4.1.3.2.1, 2, 3, 4,
5, 6, 7, show the presence of different sugar isomers
(epimers) in the hydrolysate. These resulted from various
ketals as the result of the removal of isopropylidene groups
by hydrolysis and deacetonation under different treatment
conditions, i.e., type of acid catalyst, temperature, and
reaction time. The results also indicate that glucose
remained the major reducing sugar among the other epimers

135
resulting from the removal of acetone. In addition, the
results also demonstrate the presence of minor by—products
in small quantities such as 1,6-anhydroglucose (Fig.
4.1.3.2.8), furfural, and hydroxymethylfurfural. The
appearance of small peak of furfural in all chromatograms of
cotton hydrolysate could be attributed to the presence of
small amounts of pectic substances in cotton cellulose.
Although, cotton is considered as a pure cellulose (i.e.,
consists of glucose units only), however, it was reported in
the literature (Hudson et al., 1948) that the constituents
of mature cotton are as follows:
Constituent % of dry weightCellulose 94.0Protein (N x 6.25) 1.3Pectic substances 1.2Ash 1.2Wax 0.6Total sugars 0.3Pigment TraceOther 1.4
These pectic substances are defined (Pigman et al., 1948) as
a group of polysaccharides that consists of arabixians,
galactans and largely polygalacturonide chains. Furthermore,
it was noted (Frey—Wyssling, 1953) that the polygalacturonic
acids are water—solube and when their sixth C atom (i.e.,
acid group) is replaced by H, we obtain the xylans or
polyarabinans.
On the other hand, the unlabeled peaks of the reducing
sugars indicated in the HPLC chromatograms are other isomers
of glucose (i.e., not galactose and mannose). Isomers such

136
as allose, altrose, gulose, idose etc. could be expected to
exist under those conditions in the reaction mixture.
Unfortunately, due to the fact that there are limited number
of model compounds of reducing sugars available from
commercial sources, it was not possible to identify all the
isomers produced in the hydrolysate. It is also noteworthy
to mention that the reducing sugars (e.g., glucose,
galactose) have experienced a shift of the retention time in
different chromatograms. This may be explained by the fact
that the column used for the separation of reducing sugars
was an anion exchange resin one and these type of columns
are known to be sensitive to the pH of the sample under
investigation. In other words, the lower the pH of the sugar
sample the shorter the retention time is.
The presence of 1,6—anhydroglucose in the cotton
hydrolysate has been investigated by running an aqueous
model compound of this sugar on HPLC. This is illustrated in
Fig. 4.1.2.2.8.
The difference in the proportions of the various
epimers in the hydrolysate is due to the fact that the
accessibility of isopropylidene groups to hydrolysis was
found to be different (Stanek et al., 1963). For example, in
the hydrolysis of 1,2:5, 6-di-O-isoproplidene-D-glucofuranose
the 5,6-0-isopropylidene group is more sensitive to
hydrolysis than the 0-isopropylidene group in the 1,2
position. In other words, steric factors and electronic

rtH
1<
rtCD
CD
o0’
HC) ci
CD0
1400
00 00 H
CD12
000
I-I.
C)0
go
00$1
I-’
oCD
ci-
6000
0) c-I
PU
RP
UR
A1
040
00
IULJ
\H
MP
GLU
CO
SOCD
0I
II
II
II
II
II
II
I0
510
1520
2530
0) I-I ci
—I
Fig
ure
4.1
.3.2
.1.
HP
LC
sugar
chro
mato
gra
mof
cott
on
hydro
lysate
obta
ined
at
150
0C(a
ceto
ne:w
ate
r:9
0:1
0;
liquor/s
oli
drtio
:1
0/1
;2
hr;
no
acid
cata
lyst
added).
ci CD
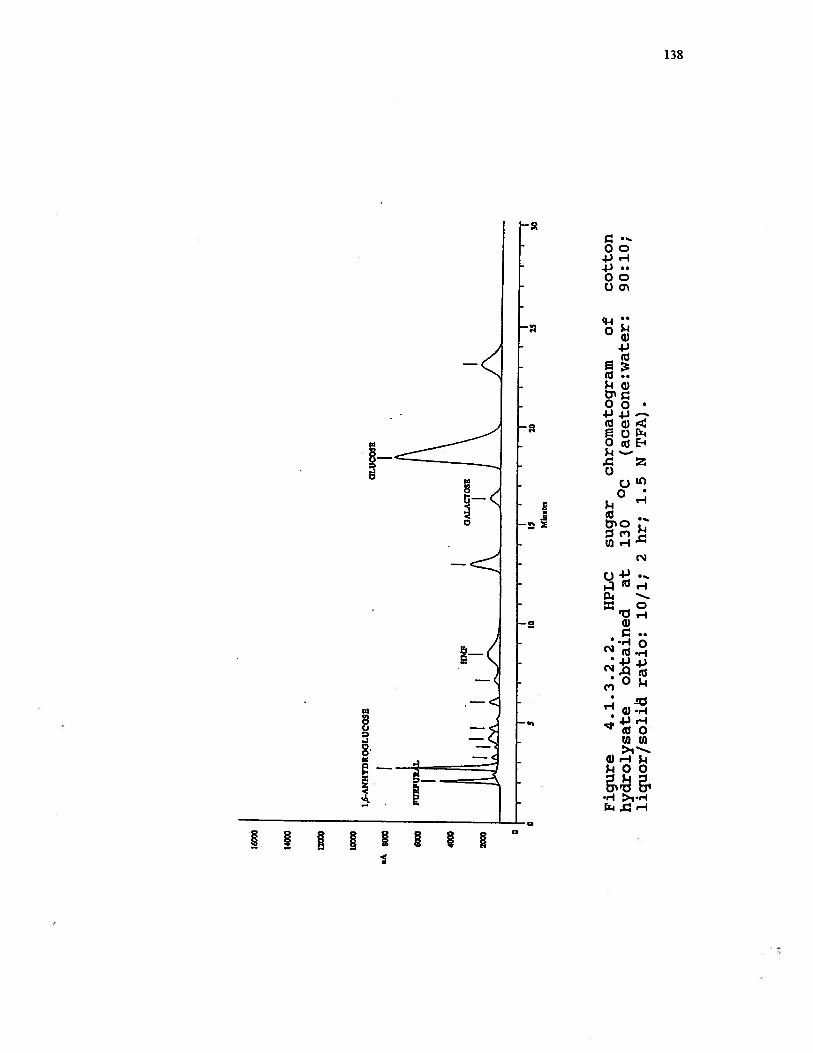
16O
c,
MIt
ci
Fig
ure
4.1
.3.2
.2.
HP
LC
sugar
chro
mato
gra
mo
fcott
on
hydro
lysate
obta
ined
at
130
°C(a
ceto
ne:w
ate
r:9
0:1
0;
liquor/s
oli
drati
o:
10/1
;2
hr;
1.5
NT
FA
).
14
12
O
toQ
1,6-
AN
HY
DR
OO
LU
CO
SRO
L.U
CQ
SE
OA
LC
TO
SE
Go

GLU
CO
SE
Fig
ure
4.1
.3.2
.3.
HP
LC
hydro
lysate
obta
ined
at
liquor/
so)4
drati
o:
10
/1;
sugar
chro
mato
gra
mo
f130
0C(a
ceto
ne:w
ate
r:2
hr;
0.1
6N
HC
1).
cott
on
90
:10
;
1,6.
AN
HY
DR
OG
LU
CO
Sfl
tDO
O
2000
0
Mu
te

1000
0
Fig
ure
4.1
.3.2
.4.
HPL
Csugar
chro
mato
gra
mof
cott
on
hydro
lysate
ob
tain
ed
at
150
0C(a
ceto
ne:w
ate
r:90:1
0;
liq
uo
r/s
oli
drati
o:
10
/1;
2hr;
1.5
NT
FA
).
60D
16-A
NII
YD
RO
OL
UC
OSE
2000
0
U
C

1,6-
AN
HY
DR
OG
t.UC
OSU
Fig
ure
4.1
.3.2
.5.
UPL
Chydro
lysate
obta
ined
at
liquor/
soli
drati
?:
10/1
;
sugar
chro
matO
gra
fll
of
150
°C(a
ceto
neW
at€
r2
hr;
0.1
6N
HC
1).
1400
0G
LUC
OSB
1000
0
4000
liMP
0
10
MIa
utc
IS20
2530
cott
on
90:1
0;
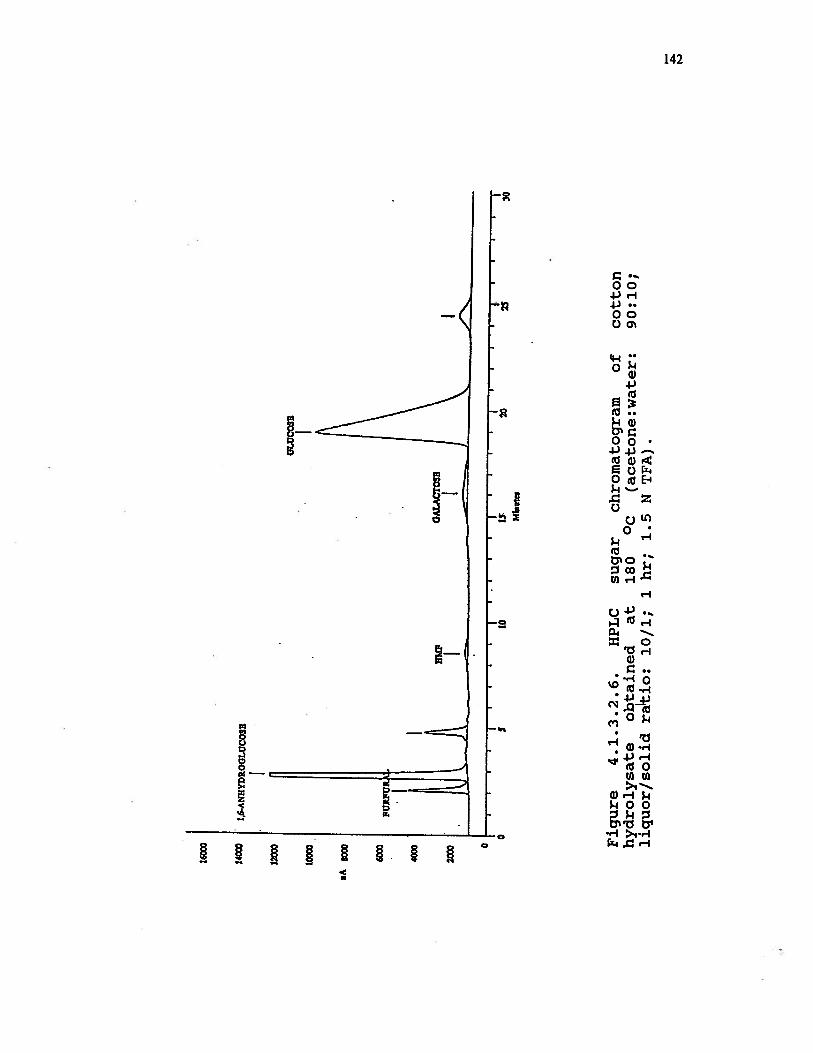
iox F
igu
re4.1
.3.2
.6.
HP
LC
hydro
lysate
ob
tain
ed
at
liquor/s
oli
dra1tio:
10
/1;
sugar
chro
mato
gra
mof
180
0C(a
ceto
ne:w
ate
r:1
hr;
1.5
NT
FA
).
cott
on
90
:10
;
1,6.
AN
HY
DR
OG
LUC
OSE
GLU
CO
SE
FUR
PUR
2OO 0
OA
LAC
FOSE
SM
htc
s
1020
25
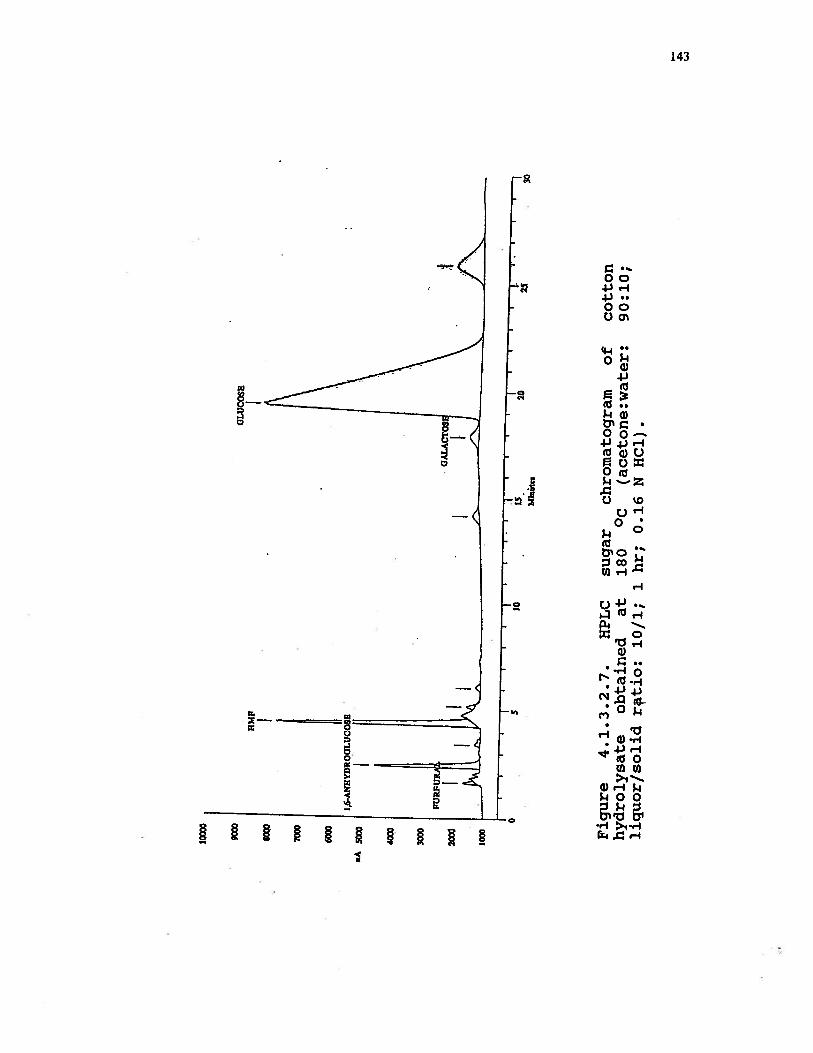
9000 Fig
ure
4.1
.3.2
.7.
HP
LC
hydro
lysate
obta
ined
at
liquor/s
oli
drtio:
10/1
;
sugar
chro
mato
gra
mof
180
0C(a
ceto
ne:w
ate
r:1
hr;
0.1
6N
HC
l).
cott
on
90:1
0;
HM
F
6000
GW
CO
SE
sA50
00
40
2000
:1
15 Wná
tc.
2030

t4
1o
I.6A
NH
YD
RO
OL
UC
OSB
1000
0
$000
4000
2000
0
__
_
II
I‘I
$10
MIn
tcs
Fig
ure
4.1
.3.2
.8.
HP
LC
sugar
chro
mato
gra
mo
f1,6
-anhydro
glu
cose.

145
With HC1 as the catalyst the treatment at high
temperature (180 °C) and for longer reaction times (3 hr)
has given rise to a considerable increase in the amount of
hydroxymethylfurfural (HMF) as dehydration product, at the
expense of other epimers. This is well illustrated in Figs.
4.1.3.2.9 and 10. The results also suggest that the high
acid concentration of hydrochloric acid (HC1) even at a
moderate temperature (150 °C) has led to a remarkable
increase of hydroxymethylfurfural (see Fig. 4.1.3.2.11).
However, higher acid concentrations of trifluoroacetic acid
(TFA) in the presence of acetone appear to have little
effect on the formation of hydroxymethylfurfural (Fig.
4.1.3.2.12)
Although the results confirm that the sugar ring has
enough protection by isopropylidene groups formed during
solvent purification treatment, however, high temperature
exposure for prolonged reaction times is likely to increase
the chances of profound stereochemical changes. In turn,
this would bring about, to a greater extent, sugar
structures more accessible to degradation and dehydration
reactions.

16
Fig
ure
4.1
.3.2
.9.
HP
LC
sugar
chro
mato
gra
mof
hydro
lysate
obta
ined
at
180
°C(a
ceto
ne:w
ate
r:li
qu
or/
scpli
cI
rati
o:
10/1
;3
hr;
1.5
NT
FA
).
Z4
•I2
O
,1,6
-AN
HY
DR
OO
LU
CO
SE
iA
6O
4O
MIn
utc
cott
on
90
:10
;
4.

Fig
ure
4.1
.3.2
.10
.H
PL
Chydro
lysate
obta
ined
at
liquor/s
dli
drati
o:
10/1
;3
sugar
chro
mato
gra
mo
f180
°C(a
ceto
ne:w
ate
r:hr;
0.1
6N
HC
1).
cott
on
90
:10
;
14O
O1,
6-A
NH
YD
Rfl
GL
UC
OSE
Ixco
IMP
RA
S0
00
EGQ
400
2O
Mu..ta

1000
0
9000
8000
7000
8000
‘50
00
4000
3000
2000
1000
Fig
.4.1
i.3.2
.11.
HP
LC
sugar
chro
mato
gra
mof
cott
on
hydro
lysate
obta
ined
at
150
0C(a
ceto
ne:w
ate
r:9
0:1
0;
liquor/s
oli
drati
o:
10
/1;
2hr;
0.8
NH
C1
).
Min
utes

Fig
ure
4.1
.3.2
.12.
HP
LC
sugar
chro
nla
togra
!tl
of
cott
on
hydro
lysate
obta
ined
at
150
°C(a
ceto
ne:W
ate
r90:1
0;
liquor/s
pud
rati
o:
10/1
;2
hr;
3N
TF
A).
8000
1,6-
AN
HY
DR
OO
LUC
OSE
V
6000
2000
0
Mgti
1020
2530
150
From these experiments it is apparent that TFA would be
an effective but milder acid catalyst in the purification of
cellulose that could altogether avoid dehydration of the
dissolved sugars (Fig. 4.1.3.2.9, 4.1.3.2.12).
4.1.3.2.2. Quantitation - the Predominance of AcetonationSugar Product Formation during the Solvent PurificationTreatment
Using a sugar analyzer (HPLC), the different reducing
sugars (identifiable and unidentifiable) resulting from both
primary and secondary hydrolyses have been considered as of
glucose origin. Their concentration in the hydrolysate was
determined by the programmed HPLC system. The yield of
acetonation sugar products was calculated based on the
weight loss. Table 4.1.3.2.2.1 shows the sugar yields, for a
set of solvent purification treatments conducted under the
following conditions: acetone:water 90:10; 2 hr; 0.16 N HC1;
150 0C. The total sugar recovered was 86.33%. From this
result about 40% of the potential sugar yield is found to be
in reducing form, i.e., the primary hydrolysate. However,
the remaining amounts of the acetonation sugar yield (around
46%) were nonreducing sugars and their conversion into
reducing form is attained through secondary hydrolysis as
illustrated in Table 4.1.3.2.2.1. Thus, the sugar yield
result shows that the acetonation sugar products are the
predominant part of the soluble hydrolyzed cellulose. It is

151
worth noting that the quantitative total sugar yield is in
agreement with that stated by previous workers (Paszner et
al., 1983; Ward et al., 1988). Also, the results indicate
that the sugar yield resulting after the secondary
hydrolysis increased with the extent of the reaction time.
It is important to mention that the results (GC
analysis, deacetonation, and quantitation) obtained by the
treatment of cotton with acidified aqueous acetone
(acetone:water: 90:10) are in accord with that reported in
the literature. It has been confirmed for many decades that
cyclic and acyclic carbohydrate derivatives react readily
with acetone in the presence of an acid catalyst to form
cyclic acetals (Stanek et al., 1963; Stoddart, 1971). on the
other hand the results (subsection 4.1.3.1, 4.1.3.2.1 and
4.1.3.2.2) are not in agreement with the Ward and
Grethlein’s interpretation. It was noted (Ward et al., 1988)
that the formation of 1,6-anhydroglucose is the dominant
mechanism responsible for the enhancement of the sugar yield
in acidified aqueous acetone hydrolysis. However, that is
not the case, because the formation of 1,6—anhydroglucose is
expected to dominate in aqueous acidic solutions where high
energies are applied (Stoddart, 1971). In addition, the
formation of 1,6—anhydroglucose on cellulose units does not
explain the high hydrolysis rates of cellulose in
acetonation process. In conclusion, the possibility of
isopropylidene groups on the cellulose units might
significantly weaken the glycosidic linkages in cellulose.

152
In turn, this could lead to a rapid depolymerization of
cellulose to isopropylidenated sugars.
Now it is evident that the yield of reducing sugars
obtained during solvent purification treatment of cotton is
fairly high. This high degree of sugar survival can only be
explained by the formation of protecting groups (i.e.,
isopropylidenes) on the sugar rings.
The undetermined losses in quantitative analysis
(around 13%), most probably, contain small quantities of
isopropylidenated oligomers, 1,6-anhydroglucose and fairly
stable isopropylidene derivatives of sugars such as
luonoacetals of endo dioxolane ring (e.g. 2,3—0—
isopropylidene—mannofuranose) or/and monoacetals of pyranoid
ring form (e.g. 1, 2-O-isopropylidene-cc-D-glucopyranose).
Table 4.1.3.2.2.1. Reducing sugar (primary + secondaryhydrolysis) yield in cotton hydrolysate following thetreatment with: acetone:water: 90:10; 2 hr; 0.16 N HC1; 150oc.
Type of Hydrolysis Amount Yield Total SugarsPrim. + Sec. Hyd.
Amount Yieldmg
Primary Hydrolysis 108 40.45 ---
Second. Hydrolysis1/2 hr treatment 90 33.71 198 74.16
Second. Hydrolysis1 hr treatment 122.5 45.88 230.5 86.33

153
4.1.3.2.3 Changes in Weight Loss during Solvent PurificationTreatment
The obvious measure of the extent of cellulose
hydrolysis is the weight loss arising from the production of
soluble sugars. Hence, in this work, weight loss is taken as
a measure to examine the effect of each factor on the
solvent purification treatment. Factors such as acetone
concentration (with and without acid catalyst), temperature,
residence time, acid concentration and type of acid catalyst
have been investigated.
The result given in Fig. 4.1.3.2.3.1 shows that the
successive increase in acetone concentration has been found
to give rise to a systematic increase in weight loss. This
result is consistent with those obtained in the
investigation of reaction rates in stationary hydrolysis of
cotton linters as a function of acetone concentration
(Paszner et al., 1988). This result is also consistent with
that obtained for the effect of acetone on hydrogen bonding
of the cellulose (Fig. 4.1.2.1). In other words, the more
accessible the cellulose, the much easier the hydrolysis
reactions take place. In addition, the statistical analysis
shows that the treatments of cotton with various acetone
concentrations for the weight loss - are significantly
different (except 2 treatments), see Fig. 4.1.3.2.3.1
(Duncan’s multiple range test).

154
In regards to the hydrolysis of cotton which occurred
during solvent purification treatment in the presence of
just acetone and water (i.e., no acid catalyst was added)
this can be attributed to the protonation of glucosidic
linkages with acetone/water mixture and the acids of pectic
substances precent in the cotton cellulose. However,
although cotton is considered a homogeneous cellulosic
polymer (i.e., consists of glucose units only), it was
recorded (Hudson et al., 1948) in the literature that cotton
has the following constituents; cellulose 94.0%, protein (N
x 6.25) 1.3%, pectic substances 1.2%, ash 1.2%, wax 0.6%,
total sugars 0.3%, pigment traces, and other 1.4%. Those
pectic substances were defined (Pigman et al., 1948) as a
group of polysaccharides that consists of arabinose,
galactose units and largely polygalacturonic acids.
Furthermore, it was stated (Frey-Wyssling, 1953) that these
galacturonic acids are water-soluble. In addition, the
formation of acetic acid and methyl alcohol was ascertained
by Ehrlich et al. (1929). On the other hand, the
presence of small quantities of water in the solvent
composition at relatively high temperatures appears to give
rise to the formation of a complex from the reaction of
acetone with the water molecules. This interpretation has
been reached, in the present work, due to the drop in pH of
the solvent treatment buffer (acetone:water: 90:10; 2 hr;
150 °C) from 7.46 to 5.77. This assumption is given due to
the fact that the pH of cotton hydrolysate dropped from 7.46

155
to 459 within identical treatment conditions. On the other
hand, the acidity of the acetone/water complex was also
noted by Fong et al. (1969) and Waggoner et al. (1982).
However, the explanation, given earlier by Zarubin et al.
(1989) when they used acetone and water for their pulping
study, was due to the hydrolysis of polysaccharides by the
acid (acetic acid) formed during the pulping process. In
addition, the increase in weight loss (from around 0.5 to
1.0%) maintained with the increasing acetone concentration
(50 to 90%) is likely to occur from the better solvent—
solute solvation that could take place in both amorphous and
crystalline zones. This process of solvation will apparently
lead to the opening up of hydrogen bonding and provision of
strained glycosidic linkages on isopropylidenated sugars.
Thus, the formation of isopropylidene groups between the
adjacent sugar residues (Khan et al., 1975) could offer a
reasonable explanation for the ease of breakage of
glycosidic linkages in the cellulose chains.

156
0.5
::: :0.2
0.1
& I I
40 60 70 80 100Acetone Concentration (%)
Figure 4.1.3.2.3.1. Effect of acetone concentration on theweight loss of solvent purified cotton (liquor/solid ratio:10/1; 150 0C; 2 hr; no acid catalyst was added).
* -Means with the same letter are not significantlydifferent.
** Significance at 95% confidence level.

157
Figs. 4.1.3.2.3.2 and 3 illustrate the remarkable
increase in the weight loss of solvent purified cotton due
to the increase in temperature to (180 0C). The increase of
temperature from 130 0C to 150 0C is shown to have slight
effect on the weight loss of treated cotton. It is also
important to mention that the temperatue increase from 150
°C to 180 0C caused a nonlinear increase in the dissolution
of cellulose, increasing disproportionately at the higher
temperature. However, the statistical analysis indicates
that the treatments of cotton at different temperatures for
the weight loss, in the case of the two acid catalysts, are
significantly different (Duncan’s multiple range test).
These results are consistent with those of Chang et al.
(1976, 1977) and Paszner et al. (1988) on wood. It was noted
that low temperarure hydrolytic dissolution of wood in acid
catalyzed aqueous acetone occurred in two stages, i.e., bulk
and main hydrolysis, while at high temperature the
hydrolysis became first order all the way to complete
dissolution.—
Higher temperature increases the reaction rate of the
system. In turn, this would lead to further stereochemical
changes that can bring about, to a greater extent, more H—
bond disruption in the cellulosic material. Consequently,
more active sites (i.e., H-bond-free hydroxyl groups) will
be available to undergo isopropylidenation. Besides, the
reactivity of both acetone and acid catalyst increases with
increased temperature as does the system pressure. This

158
would also speed up the isopropylidenation process by the
involvement of more acetone molecules and hydrogen ions with
the glucose units to yield isopropylidene groups along the
cellulose chains. On the other hand, dissociation of both
water and acid catalyst molecules into ions increases with
the increase in temperature and this will, eventually, lead
to a considerable participation of hydronium and hydrogen
ions in the cleavage of glycosidic linkages.
This process, most probably, will have a significant
impact on stereochemical alterations and formation of
isopropylidene groups (i.e., the destruction of
intramolecular H-bond between C6 and glycosidic 0 +
configurational isomerism - from f3 to cL). However, the best
explanation for the effect of temperature on the rate of
chemical reactions is given in the classical Arrhenius
equation.

0
‘—12U)U)0
—I
4
0120
159
20
16
8
/*
130 140 150 160 170Temperature (Degrees Celsius)
190180
Figure 4.1.3.2.3.2. Effect of temperature on the weight lossof solvent purified cotton (acetone:water: 90:10;liquor/solid ratio: 10/1; 1.5 N TFA).

0’
U)Cl)01.10
I
45
40
35
160
30
25
20
15
10
5
0.120
. /7
.
130 140 150 160 170 180Temperature (Degrees Celsius)
Figure 4.1.3.2.3.3. Effect of temperature on the weight lossof solvent purified cotton (acetone:water: 90:10;liquor/solid ratio: 10/1; 0.16 N HC1).
I 90

161
Figs. 4.1.3.2.3.4 and 5 show that the increased
reaction time from 1 to 3 hr at lower temperatures (130 0C
and 150 °C) resulted only in a slight increase in weight
loss (from 1.76 to 3.15% at 130 °C, and from 2.84 to 4.42%
at 150 °C, in the case of TFA as catalyst, for HC1 the
weight loss is between 1.88 and 4.58% at 130 0C, 3.56 to
7.96% at 150 °C) of solvent treated cotton. On the other
hand, longer residence time (3 hr) coupled with higher
temperatures (180 °C) appear to have a marked effect on the
weight loss (18.07% and 41.9% for TFA and HC1, respectively)
of solvent purified cotton. However, the statisical analysis
demonstrates that the treatments of cotton at different
reaction times for the weight loss, for different type of
acid catalysts (TFA and HC1), are not significantly
different (Duncan’s multiple range test).
The time factor is found to have a lesser effect on
carbohydrate (weight) loss after the initial solvent
purification treatment when other parameters are kept
constant. The reduced removal of carbohydrates in such a
case can be explained by the fact that the stereochemistry
of isopropylidinated units may bring about more or less the
some effect on the adjacent molecules . This has
implications on more H-bond disruption allowing the more
accessible cellulose units to undergo rapid
isopropylidenation and hydrolysis reactions.

20
16
-po-.
Cl)Cl)0
4
0
0 130 Deg. Celsius i______________-*- 150 Deg. CelsiusO— 180 Deg. Celslufj
rr0 1 2 3 4
Residence Time (Hrs)
Figure 4.1.3.2.3.4. Effect of residence time on the weightloss of solvent purified cotton (acetone:water: 90:10;liquor/solid ratio: 10/1; 1.5 N TFA).
162

-0- 130 Deg. Celsiusf___________—— 150 Deg. Celsius
._J —0-- 180 Deg. CeIsj!j
/7
0 1 2 - 3 4
Figure 4.1.3.2.3.5. Effect of residence time on the weightloss of solvent purified cotton (acetone:water 90:10;liquor/solid ratio: 10/1; 0.16 N HC1).
163
45
40
35
30
25
20
15
10
5
0
Residence Time (Hrs)

164
The effect of acid concentration for both hydrochloric
acid (HC1) and trifluoroacetic acid (TFA) on weight loss
has also been investigated. Both Figs. 4.1.3.2.3.6 and 7
show that weight loss has increased with the increase of
acid concentration of different type of acid catalysts.
However, the results also indicate that greater increase
(4.9% vs 33.5%) in the weight loss of solvent purified
cellulose (cotton) has been attained by the use of HC1 than
with TFA. The results also are in agreement with those found
for mineral acids in the previous work with wood by Paszner
et al., (1988). Nonetheless, the statistical analysis shows
that the treatments of cotton with different acid
concentrations for the weight loss, for the two acid
catalysts (TFA and HC1), are significantly different, see
Figs. 4.1.3.2.3.6 and 7 (Duncan’s multiple range test).
The increase of weight loss with the increase in acid
concentration regardless of the acid catalyst can be
attributed to higher concentration of hydrogen ions for
protonation of glycosidic linkages.
The inefficiency of trifluoroacetic acid (TFA) in the
presence of acetone in the hydrolysis of cellulose (lower
weight loss) is due to the fact that the two solvents have
fairly different properties that probably lead them to react
with each other as it was noted before by Geddes (1956),
Harris (1965), Isaacs (1974), March (1985). This reaction
between catalyst and acetone is most likely to retard the
hydrolysis of cellulose (i.e., competing reactions). In

165
addition, the active centres of cellulose molecules which
take part in the hydrolysis reaction may have also been
blocked by hydrogen bonding due to the interaction of
trifluoroacetic acid with cellulose. However, this factor
can not be ruled out since TFA has unique properties for
developing strong hydrogen bonds with other compounds
(Isaacs, 1974; Nissan, 1977; March, 1985; Jeffrey et al.,
1991). Thus, in this respect the break up of hydrogen
bonding between TFA and cellulose requires more energy to be
applied in order to attain faster hydrolysis reactions to
occur. Nonetheless, trifluoroacetic acid is classified as a
polar protic solvent (i.e. hydroxylic) (Reichardt, 1988),
with a high ionizing power and particularly low
nucleophilicity (Isaacs, 1974; March, 1985). On the other
hand, acetone is a dipolar aprotic (i.e., nonhydroxylic)
hydrophylic solvent (Frey-Wyssling, 1953: Bax et al., 1972;
Isaacs, 1974) with a high nucleophilicity (Reichardt, 1988)
and with a very reactive carbonyl group (Tchoubar, 1966).
However, both of them have a molecular resonance effect
(Tchoubar, 1966; Reichardt, 1988). Suggestions of similar
reactions between acetone and TFA were also noted elsewhere
(Geddes, 1956; Harris, 1965; March, 1985).

c/0
o7
0 0.5 1 1.5 2 2.5 3 3.5 4Acid Concentration (N)
Figure 4.1.3.2.3.6. Effect of acid concentration on theweight loss of solvent purified cotton (acetone:water:90:10; liquor/solid ratio: 10/1; 2 hr; 150 0C; TFA).
* Means with the same letter are not significantlydifferent.
166
6
5
U)U)03-J
I
0
** Significance at 95% confidence level.

167
Acid Concentration (N)
Figure 4.1.3.2.3.7. Effect of acid concentration on theweight loss of solvent purified cotton (acetone:water:90:10; liquor/solid ratio: 10/1; 2 hr; 150 0C; HC1)
* Means with the same letter are not significantly
different.
40
35
30
25
_____
2O
.215
10
>)
0.2 0.4 0.6 0.8 1
** Significance at 95% confidence level.
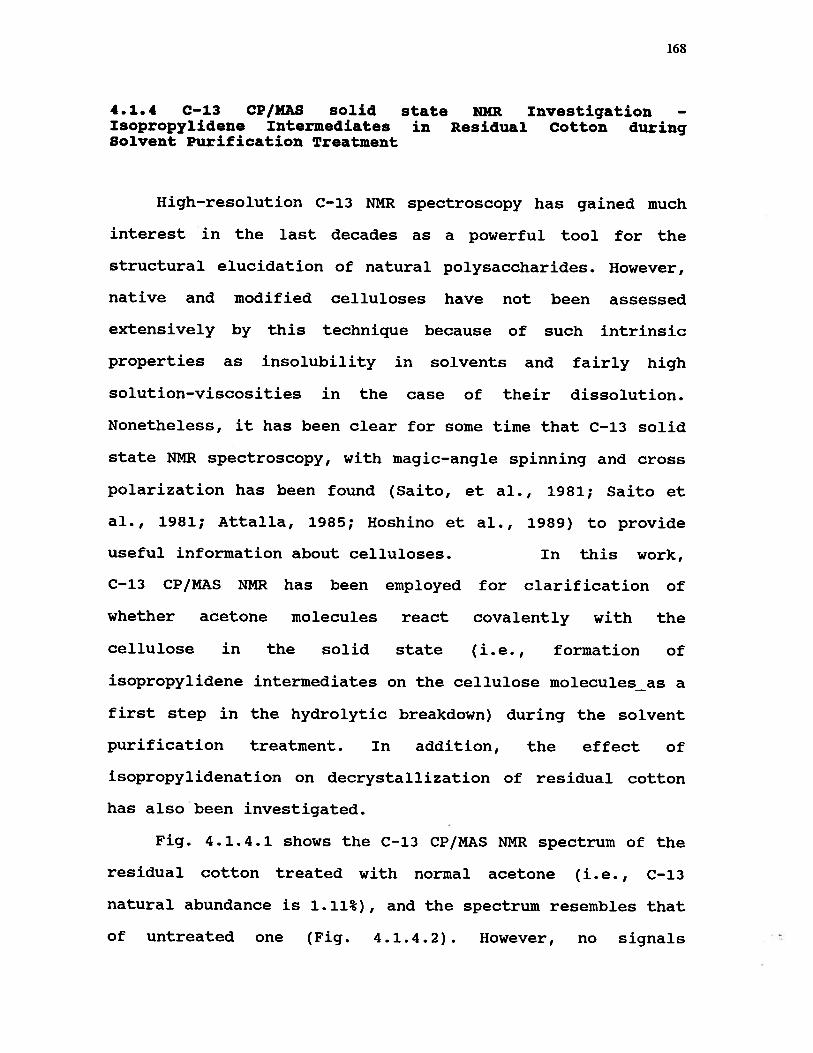
168
4.1.4 C—13 CP/MAS solid state NMR Investigation —
Isopropylidene Intermediates in Residual Cotton duringSolvent Purification Treatment
High—resolution C-13 NMR spectroscopy has gained much
interest in the last decades as a powerful tool for the
structural elucidation of natural polysaccharides. However,
native and modified celluloses have not been assessed
extensively by this technique because of such intrinsic
properties as insolubility in solvents and fairly high
solution—viscosities in the case of their dissolution.
Nonetheless, it has been clear for some time that C—13 solid
state NNR spectroscopy, with magic—angle spinning and cross
polarization has been found (Saito, et al., 1981; Saito et
al., 1981; Attalla, 1985; Hoshino et al., 1989) to provide
useful information about celluloses. In this work,
C—13 CP/MAS NMR has been employed for clarification of
whether acetone molecules react covalently with the
cellulose in the solid state (i.e., formation of
isopropylidene intermediates on the cellulose molecules_as a
first step in the hydrolytic breakdown) during the solvent
purification treatment. In addition, the effect of
isopropylidenation on decrystallization of residual cotton
has also been investigated.
Fig. 4.1.4.1 shows the C-13 CP/MAS NMR spectrum of the
residual cotton treated with normal acetone (i.e., C—13
natural abundance is 1.11%), and the spectrum resembles that
of untreated one (Fig. 4.1.4.2). However, no signals

169
appeared in the methyl group region. Fig. 4.l.4.3a shows the
C-13 CP/MAS NMR spectrum of the residual cotton treated with
C—13 labeled acetone. The results illustrated in Fig.
4.l.4.3a show that the acetonated cotton residue has given
two peaks at 26.5 and 31.8 ppm, respectively. Those peaks
can be assigned to be methyl groups since they do not
disappear in the non quaternary suppresion spectrum (see
Fig. 4.1.4.3b).

Fig
ure
4.1
.4.1
LC
-13
CP
/MA
SN
NR
spectr
um
of
the
resid
ual
cott
on
treate
dw
ith
norm
al
aceto
ne
(aceto
ne:w
ate
r:9
0:1
0;
liq
uo
r/s
oli
drati
o:
10
/1;
2hr;
1500C
;0
.16
NH
C1
).
.__L
_-
-I,
--
Ii8
0i0
i4Q
20
100.
060
.pP
$40
20
C

Fig
ure
4.1
.4.2
.C
P/M
AS
C—
13N
MR
sp
ectr
um
of
un
treate
dcott
on
(contr
ol)
.
__
-.
i40
i20
iOO
8060
4020
PPM

1.
I•
I
__
__
__
__
__
__
__
__
__
__
__
__
__
__
__
__
__
__
__
__
__
____________________________
i50
—i4
0£2
0
Fig
ure
4.1
.4.3
a.
C-1
3C
P/M
AS
NM
Rspectrum
of
the
resid
ual
cotton
treate
dw
ith
C—
13la
bele
dacetone
(acetone:w
ater:
90:1
0;
liquor/s
oli
dratio:
10/1
;2
hr;
150
oC
;0.1
6N
HC
1).
OH
H?
HO
C2
and/
or
IA
•_L
•.
.t
£00
6O
•40
200
—20
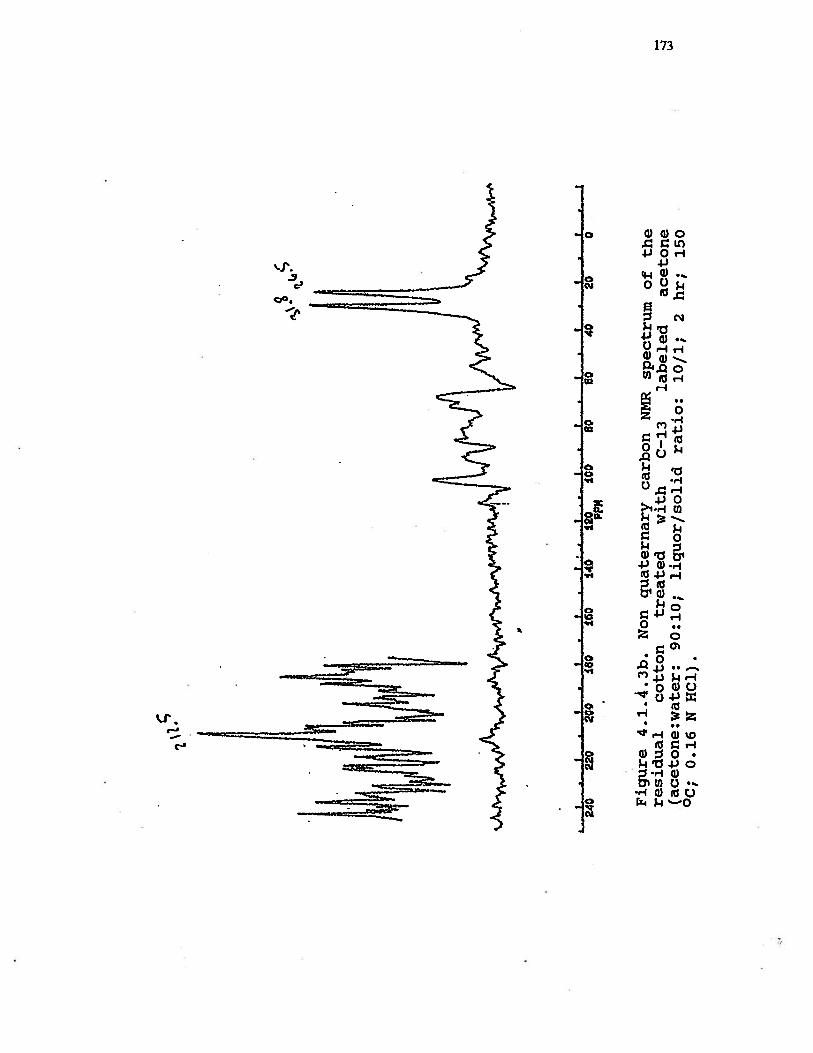
gb
‘t9
•qL
a
—
I—
•S
•—
S-
•S
•I
•S
-S
•S
I•
240
220
200
180
i014
012
010
080
6040
200
PPM
Fig
ure
4.1
.4.3
b.
Non
quate
rnary
carb
on
NM
Rsp
ectr
um
of
the
resid
ual
cott
on
treate
dw
ith
C-1
3la
bele
daceto
ne
(aceto
ne:w
ate
r:9
0:1
0;
liquor/s
oli
drati
o:
10
/1;
2hr;
15
0°C
;0.1
6N
HC
l).
1’
0’

174
Furthermore, these methyl signals cannot be due to
physically adsorbed acetone because triply labeled acetone
was used. Therefore, additional to methyl signals at around
30 ppm, a carboxyl signal at around 210 ppm should be found.
Even though there might be a small amount present in the
residue, (see Fig. 4.l.4.3b, very weak signal at 212 ppm)
the methyl signals are too large to originate from adsorbed
acetone. Therefore, the evidence is that the acetone must
have reacted with the cellulose to form an isopropylidene.
The possible form of such an intermediate has been shown in
Fig. 4.1.4.3a.
In general the integral in C-13 CP/MAS spectroscopy is
a much more reliable measure for the relative numbers of
spins than that in solution C-13 NMR. In other words, it
allows us to estimate how many of the cellulose units are
involved in this reaction. There are 6 carbons per glucose
unit. The natural abundance of C-13 is 1.11%.
Per acetone molecule, there are 2 methyl groups with an
isotope abundance of 99%, and —
1 carbonyl carbon with 99% abundance covered within the
cellulose carbon peaks (between 80 and 90 ppm), hence
Ii = [(6 x 1.11) + (n x 99) ) 10 = 10.4 (from the spectrum)
12 = (2 X fl X 99)Io = 0.7 (from the spectrum)
11/12 = (6 x 1.11) + (n x 99)/(2 x n x 99) = 10.4/0.7
(6 x 1.11) + (99 x n) = 10.4/(0.7(2 x 99 x n)
(6 x 1.11) = [10.4/(0.7 x 2 x 99 x n)) — 99 x n
6.66 = (n x 99) [2(10.4/0.7) — 1]

175
n = - 1/430
where I, 12, and I are the intensities of carbon 13 for
glucose unit, two methyl groups, and 1 carbon atom,
respectively.
This means there is only one isopropylidene group per every
400-500 glucose units of solvent purified cotton treated at
150 0C (acetone:water; 90:10, liquor/solid; 10/1, 2 hr, 0.16
N HC1). In other words, around 400-500 glucose units have
remained unaffected by isopropylidenation at this designated
treatment condition. This calculation is in accord with the
viscosity value (about 3.5 CP, see Fig. 4.1.7.4.) at this
treatment condition and is just slightly higher than the
limiting DP of 300 (Rydhoim, 1965). Also, it has already
been determined, in this work, that the weight loss under
these treatment conditions is equal to 5.34% and the
deacetonation sugar product yield is 86.33% (Table
4.1.3.2.1). Hence, this suggests that the major
isopropylidenated fraction of cellulose has been removed
into the solution (hydrolysate). In addition, by usingacid
catalyzed aqueous acetone in solvent purification of cotton
the viscosity has dramatically dropped as shown in Fig.
4.1.7.3 (viscosity analysis section). This could also be
attributed to the formation of isopropylidene groups at a
uniform interval pattern between the glucose residues along
the cellulose chains as it is proposed in Fig. 4.1.4.4. It
is also noteworthy to mention that the formation of
isopropylidene groups between the adjacent sugar units has

176
already been established by Khan et al. in 1975 in their
study on sucrose (a comprehensive review is given in chapter
2). On the other hand, the possibility of the reaction of
acetone molecules with C6 and the hemiacetal oxygen can not
be ruled out, although neither the previous works, nor the
present one, were able to substantiate this possibility as
the number of isopropylidene substituents would be expected
to be much larger than found in this work. However, the drop
in CuEn viscosity is substantially increased in the presence
of acid catalyst with the increase of temperature as
illustrated in Figs. 4.1.7.4 and 4.1.7.5 (from 28.5 CP to
2.7 CP). This indicates very rapid penetration of the acid
throughout the entire cellulose matrix but not necessarily
involving also the crystalline regions, the destruction of
which is possible only with concentrated acids, but not with
dilute solutions. The weight loss has also shown similar
trend (from 0.93 to 42.3%). All these results would be
interpreted as follows:

177
Cellulose Chain+
+ Ibl
Unaffected parts of cellulose ctiain T(>1 OOb)
01/
_
_
_
C.J
(4
\AI4V
isopropylidene groupsbetween glucose residues
HOH2
v= A
Figure 4.1.4.4. Proposed formation of iSOpropyljdene groupsalong the cellulose chain.

178
a— higher temperature increases the reaction rate
of the system. In turn, this would lead to further
stereochemical changes that can bring about, to a
greater extent, more H—bond disruption/destruction
in the cellulosic material. Consequently, more
active sites (H-bond free hydroxyl groups) will be
available to undergo isopropylidenation. Besides,
the reactivity of acetone molecules increases with
increased temperature as does the system pressure.
This would also speed up the isopropylidenation
process by the involvement of more acetone
molecules with glucose units to yield
isopropylidene groups along the cellulose chain.
This can be illustrated in Fig. 4.1.4.5.
Unaffected pail otcellutose chain
Isoprop4idene groups between glucose residues
Figure 4.1.4.5. Proposed formation of isopropylidene groupsalong the cellulose chain at higher temperatures.
CeHulose chain
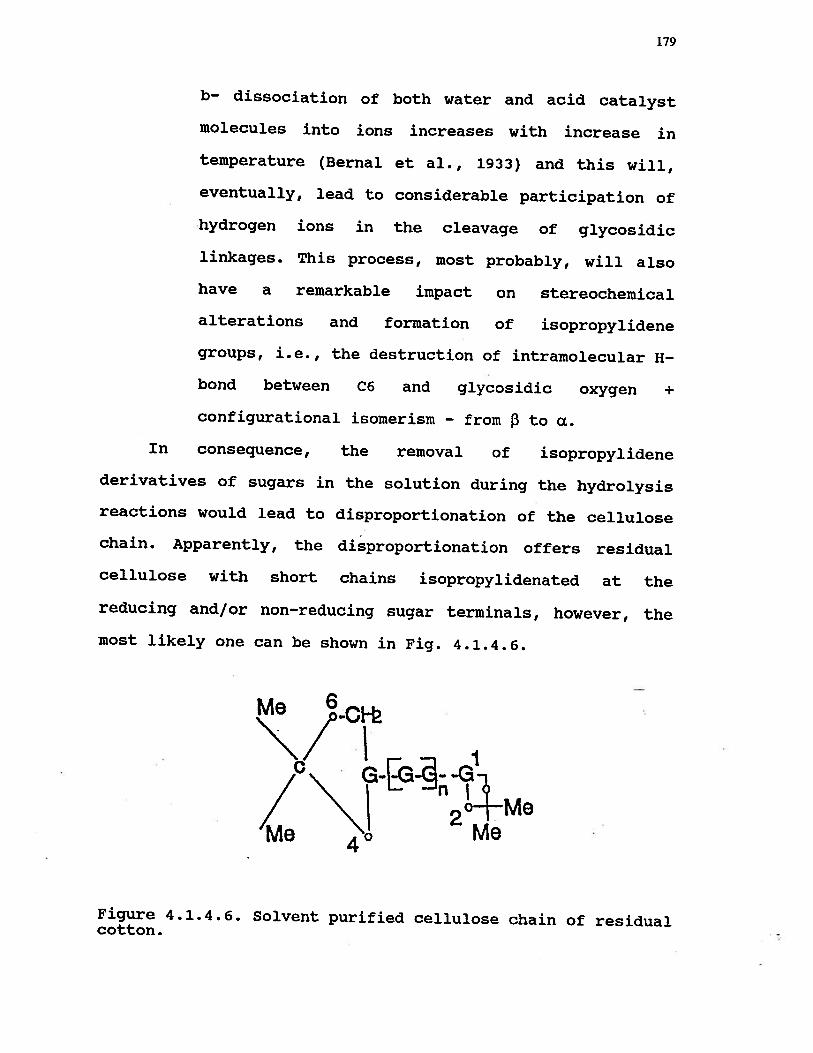
179
b— dissociation of both water and acid catalyst
molecules into ions increases with increase in
temperature (Bernal et al., 1933) and this will,
eventually, lead to considerable participation of
hydrogen ions in the cleavage of glycosidic
linkages. This process, most probably, will also
have a remarkable impact on stereochemical
alterations and formation of isopropylidene
groups, i.e., the destruction of intramolecular H—
bond between C6 and glycosidic oxygen +
configurational isomerism — from J3 to cx.
In consequence, the removal of isopropylidene
derivatives of sugars in the solution during the hydrolysis
reactions would lead to disproportionation of the cellulose
chain. Apparently, the disproportionation offers residual
cellulose with short chains isopropylidenated at the
reducing and/or non-reducing sugar terminals, however, the
most likely one can be shown in Fig. 4.1.4.6.
/ 1
Figure 4.1.4.6. Solvent purified cellulose chain of residualcotton.

180
Concerning the formation of isopropylidene
intermediates during solvent purification treatment, the
appearance of the methyl signals in the solid state NNR
spectrum given in Fig. 4. l.43a , is a strong indication
that acetone as a major volume fraction in the solvent
(acetone/water) is capable to react covalently with the
cellulose molecules as also shown by HPLC traces Fig.
4.1.3.2.1. It is evident that the two methyl signals shown
in Fig. 4.l.4.3a illustrate explicitly the formation of
monoketal in the residual (solid) cotton. The small
difference, in chemical shift for the carbon atoms of the
methyl groups (5.3 ppm) suggests the formation of the
dioxolane ring on the cellulose unit. However, the
probability of a skewed form of 1,3-dioxane ring would not
be ruled out. It was stated (Buchanan et al., 1980; Buchanan
et al., 1982; Grindley et al., 1985) that the acetal carbon
of such cyclic rings resonates in the range of 100.6—101.1
ppm. Nonetheless, it is possible a mixture of both acetal
rings (i.e., 1,3—dioxolane and 1,3-dioxane) is presenj in
the solvent treated cotton residues.
In conclusion, one may suggest that the monoacetal
structure of interest is 1,2-O-isopropylidene-c1-D-
glucopyranose — reducing sugar, however a 4,6—monoacetal
glucopyranose could also be possible (but less likely) as
indicated in Fig. 4.1.4.6.

181
4.1.5 X-ray Diffraction Analysis - Changes in Crystallinityand Crystallite Breadth of Cotton Residues during SolventPurification Treatment
The main purpose of this work is to study the effect of
solvent purification treatment on the crystalline structure
of cotton residues. Also, it is of interest to follow the
progressive crystalline changes that have taken place in the
cellulose when factors such as acetone concentration,
temperature, and acid concentration are tested.
4.1.5.1 Acetone Effect on Crystallinity and CrystalliteBreadth of Cotton Residues during Solvent PurificationTreatment
The acetone effect on the crytalline structure of
cellulose, in this work, was tested by using different
acetone concentrations in the treatment without adding acid
catalyst. Figs. 4.1.5.1, 4.1.5.2 and 4.1.5.3 show that the
successive increase in acetone concentration has resulted in
hightening the intensities of 101, 101, and 002 planes. The
increase in peak heights of 101 and 101 can be attributed to
reorientation of hydrogen bonding (spacing) as result of the
effect of acetone on the cellulosic material. The increase
in peak height observed at the 002 plane demonstrates the
enhancement of crystallinity. A similar trend of a slight
increase in crystallinity index of treated cotton in 50% of
acetone is illustrated in Table 4.1.5.1. Also, results given
in Table 4.1.5.1 show that the crystallite breadth, i.e.,

182
full width at half maximum height, FWHM (10!) is slightly
increased. In other words, this indicates that the
crystallite size is slightly decreased since crystallite
breadth is inversely proportional to crystallite size (Ahtee
et al., 1983).
The results illustrated in Figs. 4.1.5.1, 2, and shown
in Table 4.1.5.1 correlate well with those of the hydrogen
bonding (Fig. 4.1.2.1). This can be explained by the fact
that the successive decrease in the strength of the hydrogen
bond of the cellulosic material with the increase of acetone
content has led to a progressive decrease in the crystallite
size. In other words, presumably, the new orientation of the
hydroxyl groups (i.e., weak H—bonds) of cellulose molecules
does not provide suitable conditions for the crystallites to
pack tighter together and coalesce in stronger lateral
order. They also correlate well with the weight loss
obtained at different acetone concentrations (Fig.
4.1.3.2.3.1). This can be interpreted by the fact that the
successive increase in weight loss of the treated cottons
was associated with systematic increase in crystallinity
index as the acetone concentration was consecutively
increased in the solvent composition. On the other hand, the
systematic increase in crystallinity index of the residual
cotton (Table 4.1.5.1) as the acetone content was
successively increased in the treatment correlates well with
the progressive loss of the hydrogen bond strength of the
cellulose (Fig. 4.1.2.1). This explicitly means that within

183
the prevalence of selective removal of amorphous cellulose
higher degree of crystallinity can be attained in an
accessible cellulose .The results given in Table 4.1.5.1 for
crystallite breadth agree well with those for hydrogen bonds
obtained at different acetone concentrations (Fig. 4.1.2.1).
The higher the acetone concentration, the weaker the
hydrogen bond, the bigger the crystallite breadth (i.e.,
reduced crystallite size). Thus, these results strengthen
our belief that acetone solvent, in this process, penetrates
the cellulose fibres (amorphous and crystalline zones),
swells them, and brings about structural changes. In other
words, the changes in crystallinity index and the
crystallite breadth (i.e., crystallite size) indicate that
an intramicellar swelling has taken place during the
acetonation of cellulose. It was noted (Frey—Wyssling, 1953)
that in intramicellar swelling there is a stronger affinity
between the swelling agent and chain molecules than the
binding forces in the chain lattice. Usually, in this type
of swelling the solvent penetrates into the crystal lattice
and widens it. This widening is accompanied by structural
changes that can be followed by means of the X—ray
diffraction technique (Frey-Wyssling, 1953). It seems most
likely that the enhancement of crystallinity was attained in
the solvent purification treatment by the selective removal
of amorphous cellulose in conjuction with the greater
accessibility (i.e., weaker hydrogen bonding at both inter
and intramolecular levels) of cellulose. However, the

184
selective removal of the amorphous cellulose by the solvent
treatment could be considered as the main reason for the
enhancement of crystallinity. With regards to the
correlation held among accessibility, weight loss, and
enhancement of crystallinity, this is strongly indicative of
the superiority of the solvent purification treatment over
the current purification processes. Hence, the ability of
the solvent technique to ensure advantages such as increased
accessibility (reactivity) of cellulose, and high degree of
specificity in the removal of amorphous cellulose (i.e.,
enhancement of crystallinity) is a practical answer to the
problems encountered with the current processes.
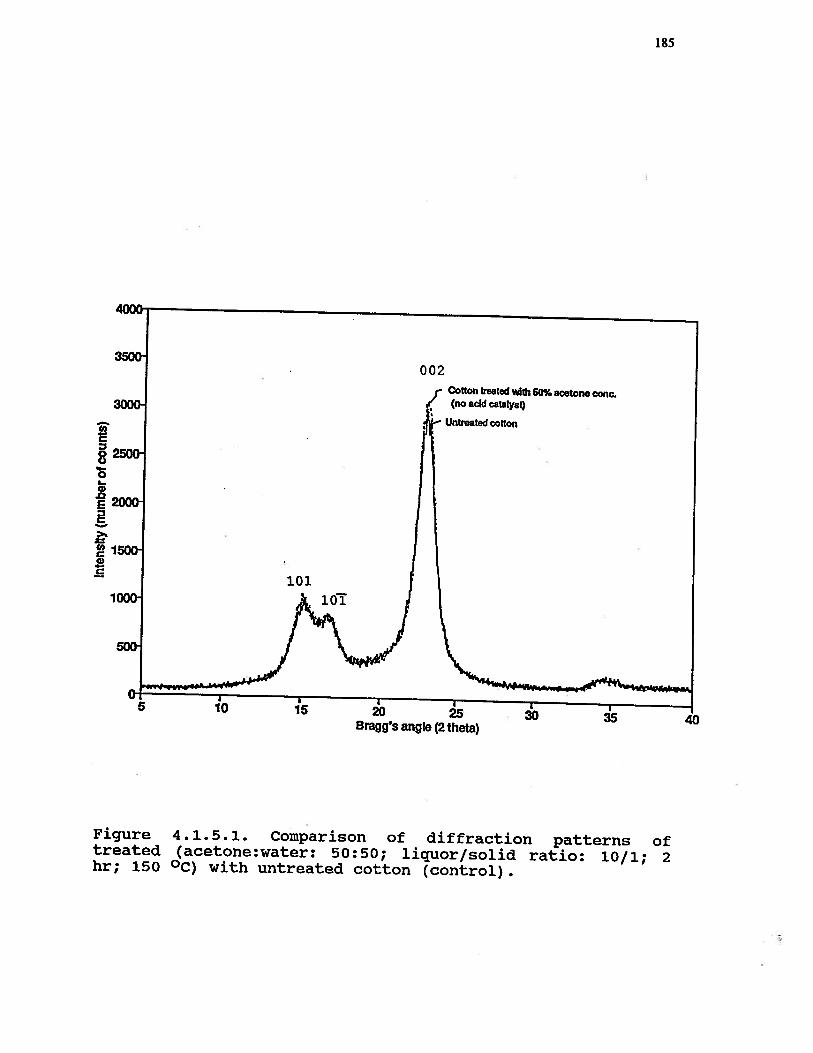
185
350G002
r Cotton treated wIth 50% acetone conc../ (no acid catalyst)
Untreated cottonC’,E
•2000
1500C,
1011000 101
500
05 20 25 30 35 40Bragg’s angie (2 theta)
Figure 4.1.5.1. Comparison of diffraction patterns oftreated (acetone:water 50:50; liquor/solid ratio: 10/1; 2hr; 150 °C) with untreated cotton (control).

186
4000
3500 002Cotton treated wfth 90% acetone cone.1-(no acid catalyst)
3000- Cotton treated wfth 70-80%acetone cone. (no acid catalyst)
Untreated cotton
2500-U-.0IC)
•2000-z
1500-101
a)
1000-
5:5 10 15 20 25 30 35 40Bragg’s angIe (2 theta)
Figure 4.1.5.2. Comparison of diffraction patterns oftreated (acetofle:Water: 70:30, 80:20, and 90:10;liquor/solid ratio: 10/1; 2 hr; 150 °C) with untreatedcotton (control).

187
3500 002Cotton eated wIth 90% acetone conc.(no add catalyst)
3000 hUntreated cottonU,
E
2000r
150&
i00o,___bJ1Oc$.
Bragg’s angie (2 theta)
Figure 4.1.5.3. Comparison of diffraction patterns oftreated (acetone:Water, 90:10: liquor/solid ratio: 10/1; 2hr; 150 °C) with untreated cotton (control).

188
Table 4.1.5.1. Acetone effect on crystallinity index andcrystallite breadth of cotton residues treated withdifferent concentrations of acetone, while other variableswere kept constant (liquor/solid ratio: 10/1; 2 hr; 150 °C;no acid catalyst added).
Acetone CI S.D. FWHM002Concentration
(Degree)
Untreat. cotton 74.37 0.21 2.01
50 74.38 0.24 2.14
60 74.34 0.32 2.16
70 74.62 0.10 2.15
80 74.74 0.22 2.17
90 75.44 0.34 2.16
Usually aqueous acid hydrolysis brings about
considerable broadening of the reflection peaks of 101, ioT,
and 002 planes. Besides, the peak heights of these planes
have been noticed to experience appreciable decrease
(Kulshreshtha et al., 1973). Those changes in acid
hydrolysis indicate that decrystallization is the result of
a decrease in crystallite size and an increase in lattice
disorder.
It was stated by Nishimura et al. (1987) that similar
stereotype decrystallization and reduction of crytallite
size also takes place in the mercerization of •cellulosic
material. For instance, the formation of alkali Cellulose I
is achieved by lowering the crystallinity of the original
189
cellulose. In this respect, Cellulose II is less crystalline
than Cellulose I (Nishiiuura et al., 1987).
However, the interesting features of enhancement of
crystallinity, with the slight decrease in crystallite size,
and increase of peak heights of 101 and ioT planes by
acetone, can be considered as one of the many major
advantages of the solvent purification treatment. From the
results presented here, important conclusions can be drawn
as follows:
It appears that there is a reconciliation between
decrystallization and crystallization, “they go hand in
hand” in solvent purification treatment. Apparently, the
decrystallization can be achieved by the interaction of
acetone, as swelling agent, with the hydroxyl groups of the
cellulose molecules through their hydrogen atoms and
provision of certain types of H-bonds (i.e., weak or
nonlinear) (Schemer et al., 1985). This also gives us some
insight into how acetone disrupts hydrogen bonding (i.e.,
accessibility) in the cellulosic material, i.e., hydrogen
bond disruption (1st hypothesis). In addition, the
protophylicity of acetone is explicitly demonstrated, in
this work, in Figs. 4.1.2.1 and 4.1.3.2.3.1, i.e., the
higher acetone content, the greater extent of accessibility,
the higher degree of removal of amorphous cellulose.
Furthermore, it was also emphasized (Bax et al., 1972;
Isaacs, 1974) earlier that acetone could be classified as a
dipolar aprotic protophylic solvent. On the other hand, the

190
enhancement of crystallinity can be attained by selective
removal of the derivatized sugars. They appear to be more
susceptible to hydrolysis reactions than the free sugars. On
the other hand, it is interesting that the results given in
Table 4.1.5.1 indicate that the strength of the hydrogen
bonds has no effect on the crystallinity index. The major
impact on crystallinity index is likely to result from the
packing order of the crystal lattice and selective removal
of the amorphous cellulose.
However, from the results shown in Fig. 4.1.2.1,
4.1.5.1, 4.1.5.2, 4.1.5.3 and Table 4.1.5.1 it is fairly
clear that the rearrangement of hydrogen bonding has a
considerable impact on the crystallite size. This has been
reflected by the changes that have taken place on 101, loT
planes and the slight systematic increase in crystallite
breadth.
4.1.5.2. Effect of Type of Acid Catalyst and AcidConcentration on Cristallinity and Crytallite Breadth ofCotton Residues during Solvent Purification Treatment
In the present work, results have shown that the
solvent purification process is, more or less, affected by
the type of acid catalyst. This is well demonstrated by the
selective removal of sugars ( i.e., weight loss) under
conditions which provide maintenance of an accessible
cellulose (i.e., hydrogen bonding). Similar investigations
were carried out to examine the effect of type of acid

191
catalyst on the crystallinity and crystallite size of cotton
during acetonation. This was accomplished by employing
different acid concentrations for each type of acid catalyst
(i.e., TFA and HC1, respectively).
‘uv
Cottontreatedwfthl.5NTFAat- 00
1500,2hr.
2000 Cotton treated wIth 0.75 N TFA at150 C, 2 hr.
COLLOII treated with acetone .*.water atCotton treated wIth 3 N1FA at 150 C, 2 hr. (no acid catalyst)
1500 1500,2hr.
Untreated cotton
Ez I.
‘ 1000
101. 10i ‘I
500
05 0
- 40Bragg’s angIe (2 theta)
Figure 4.1.5.4. Comparison of diffraction patterns oftreated cotton at different acid concentrations(acetone:water: 90:10; liquor/solid ratio: 10/1; 2 hr; 150°C, TFA).

192
002
____A
2000- Cotton treated with 0.16 N HCI at
_____
1SOC,2hr. ICotton treated with acetone + water at
Cotton treated with 0.8 N HOt at 150 C 2 hr. (no add catalyst)
1500- 150C2hr. IUntreated óotton
0).0
100&
101— ii
— 101
500
.1U I I I5 20 25 30 35 40Braggss angle (2 theta)
Figure 4.1.5.5. Comparison of diffraction patterns oftreated cotton at different acid concentrations(acetone:water: 90:10; liquor/solid ratio: 10/1; 2 hr; 150°C, HC1).

193
Table 4.1.5.2. Effect of type of acid catalyst oncrystallinity and crystallite breadth of cotton residuestreated at different acid concentrations, while othervariables were kept constant (acetone:water: 90:10;liquor/solid ratio: 10/1; 2hr; 150 0C; TFA).
Acid CI S.D. FWHM002Concentration
N % (Degree)
Untreat. cotton 74.37 0.21 2.01
0.75 74.87 0.19 2.04
1.5 75.15 0.27 2.23
3.0 71.50 0.15 2.31
Table 4.1.5.3. Effect of type of acid catalyst oncrystallinity and crystallite breadth of cotton residuestreated at different acid concentrations, while othervariables were kept constant (acetone:water: 90:10;liquor/solid ratio: 10/1; 2 hr; 150 0C; HC1).
Acid CI S.D. FWHM002Concentration
N (Degree)
Untreat. cotton 74.37 0.21 2.01
Treted withacetone + water(no catalyst used) 75.44 0.24 2.16
0.16 74.48 0.15 2.23
0.8 71.82 0.27 2.35
Figs. 4.1.5.4 and 4.1.5.5 and Tables 4.1.5.2 and
4.1.5.3 show that there is a slight decrease in both
crystallinity (i.e., 74.37% for untreated, 71.50% and 71.82%

194
for treated ones with TFA and HC1, respectively) and
crystallite size (2.01 for untreated cotton, 2.31 and 2.35
for the treated ones with TFA and HC1, respectively), i.e.,
since crystallite breadth is inversely proportional to
crytallite size. Usually, the influence of acid and alkaline
solutions in conventional hydrolysis and mercerization is
defined by the removal of hemicelluloses and amorphous
cellulose. In turn, this offers a fairly low crystallinity
index and reduced crystallite size. However, the small
decrease in crystallinity and crystallite size shown in
Tables 4.1.5.2 and 4.1.5.3 does not correspond to this
criterion, in the case of the solvent purification process.
For example, the weight loss obtained with 3 N TFA is 4.9%,
while that with 0.8 N HC1 is 33.7%, but their crystallinity
indices and crystallite sizes (71.50*, 71.82%, and 2.31,
2.35 for TFA and HC1, respectively) are similar. From the
results, one may draw the following conclusions:
1— acetonation ensures a high degree of selectivity in
removing amorphous cellulose, i.e., it is likely that there
is a simultaneous action of crystallization and
decrystallization due to the stereochemical changes that
take place during acetonation. These stereochemical
alterations would prevail at both hydrogen bonding and
derivatization levels, and
2— the solvent purification treatment offers irreversible
structural transformations (i.e., weak nonlinear hydrogen
bonds and isopropylidene groups) and they appear to have the
195
considerable effects on the crystallinity index and the
crystallite size. In other words, these structural changes
(new type of lattice) brought about on cellulose (cotton) by
acetonation, are the primary factors responsible for shaping
the crystal packing order.
The results shown in Figs. 4.1.5.4 and 4.1.5.5 and
Tables 4.1.5.2 and 4.1.5.3 illustrate that acid
concentration has only a slight effect on crystallinity and
crystallite size although the hydrolysis rates may be quite
different. This effect is determined by the extent of
catalyst contribution to hydrogen bonding of the cellulosic
material, because both crystallinity and crystallite size
are influenced by hydrogen bonding rearrangements
(Marchesault, 1962; WConnor et al., 1958; Hurtubise et al.,
1960; Sarko et al., 1973). These observations are consistent
with those made in the preceding section (i.e., IR
investigation) of this work.
4.1.5.3. Effect of Temperature on Crystallinity andCrystallite Breadth of Cotton Residues during SolventPurification Treatment
In most physico—chemical processes, temperature is an
important parameter. This fact explicitly appears in those
reactions which take place when assisted with better solvent
penetration. Thus, the crystalline structure of the

196
cellulose, under the solvent purification treatment, should
be affected by temperature.
Fig. 4.1.5.6 shows the effect of temperature on
cryctallinity index and crystallite size of cotton residues
when different temperatures were applied during acetonation
of cellulose. In general, the diffractograms following
exposure to three levels temperature (130, 150, and 180 °C)
show a slight increase in the peak heights of 101, 101, and
002 reflections, however the three peaks which appear in the
Fig. 4.1.5.6 overlap each other. The increase in peak
heights of 101 and ioi planes is strongly indicative of the
changes that have taken place at inter— and intramolecular
hydrogen bonding levels during the solvent purification
treatment. Nonetheless, explicit information about the
crystalline changes that have taken place during acetonation
is given in Table 4.1.5.4. The results illustrated in Table
4.1.5.4 show a moderately increasing tendency in the
crystallinity index, while the crystallite size has
decreased slightly as the temperature was increased from 130
to 180 DC.

197
Cottontreatedwlthl.5NTFAat 002130 C, 2 hr.
200& 150 C, 2 hr.Cotton treated with 1.5 N WA at
Cotton treated with acetone + water atCotton treated wIth 1.5 N WA atIBOC,2hr. 150C,2hr.(noacldcatalysO
:3
8150G.4- I0
i. Untreated cotton
E:3
I,‘1000 Ii
101101
it500
.4 K
If ,.
05 15 20 25 30 35 40
Bragg’s angle (2 theta)
Figure 4.1.5.6. Comparison of diffraction patterns of cottonresidues treated at different temperatures, while othervariables were kept constant (acetone:water: 90:10;liquor/solid ratio: 10/1; 2 hr; 1.5 N TFA).
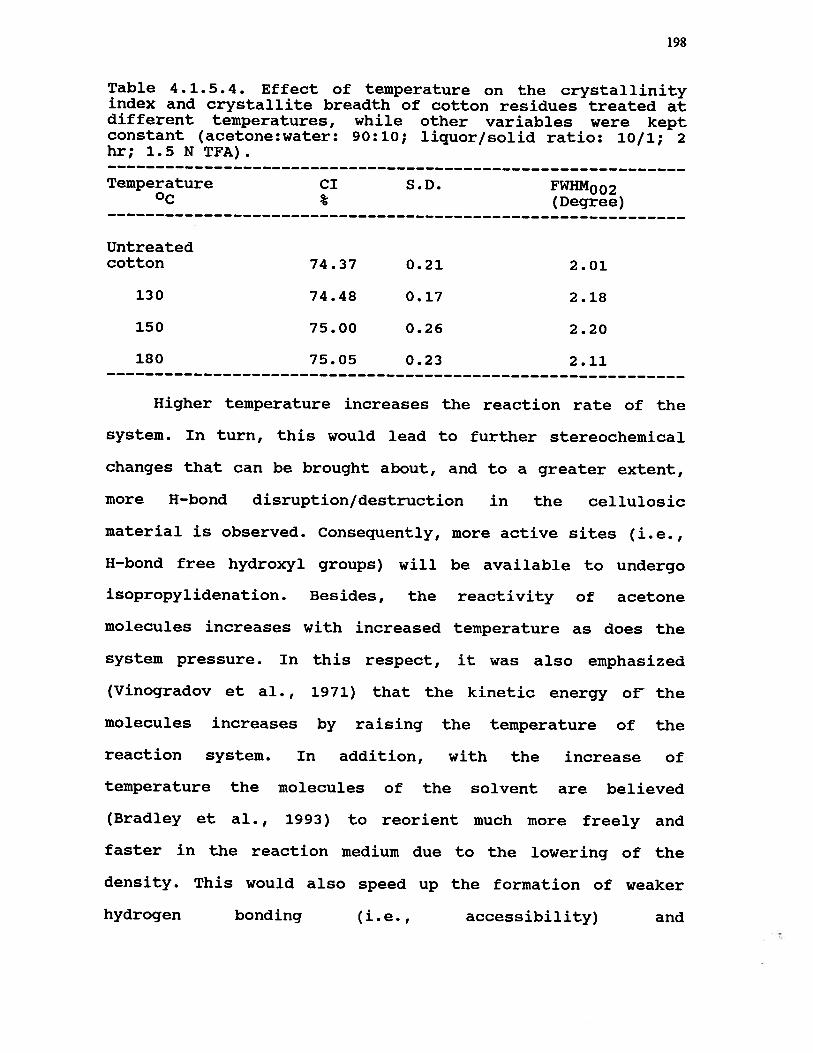
198
Table 4.1.5.4. Effect of temperature on the crystallinityindex and crystallite breadth of cotton residues treated atdifferent temperatures, while other variables were keptconstant (acetone:water: 90:10; liquor/solid ratio: 10/1; 2hr; 1.5 N TFA).
Temperature CI S.D. FWHM002(Degree)
Untreatedcotton 74.37 0.21 2.01
130 74.48 0.17 2.18
150 75.00 0.26 2.20
180 75.05 0.23 2.11
Higher temperature increases the reaction rate of the
system. In turn, this would lead to further stereochemical
changes that can be brought about, and to a greater extent,
more H—bond disruption/destruction in the cellulosic
material is observed. Consequently, more active sites (i.e.,
H-bond free hydroxyl groups) will be available to undergo
isopropylidenation. Besides, the reactivity of acetone
molecules increases with increased temperature as does the
system pressure. In this respect, it was also emphasized
(Vinogradov et al., 1971) that the kinetic energy or the
molecules increases by raising the temperature of the
reaction system. In addition, with the increase of
temperature the molecules of the solvent are believed
(Bradley et al., 1993) to reorient much more freely and
faster in the reaction medium due to the lowering of the
density. This would also speed up the formation of weaker
hydrogen bonding (i.e., accessibility) and

199
isopropylidenation processes by the involvement of more
acetone molecules with glucose units to yield isopropylidene
groups along the cellulose chain. Thus, from this point of
view, such thermal changes brought about by temperature
could considerably affect the crystalline structure and
reactivity of the cellulose.
4.1.5.4 Effect of Residence Time on Crystallinity andCrystallite Breadth of Cotton Residues during SolventPurification Treatment
Fig. 4.1.5.7 and 4.1.5.8 show the effect of residence
time on crystalline structure of cotton residues during
solvent purification treatment. The results in these two
figures indicate that a slight increase in crystallinity
index of treated cotton samples has been attained by the
increase of reaction time. Also, Fig. 4.1.5.7 and 4.1.5.8
show that the peak heights of the 101, and 101 planes have
increased. The increase in intensities of both the 101 and
iot planes strongly suggests that the solvent purification
treatment has brought about structural transformations (new
type of lattice), and hence these changes influenced both
inter— and intramolecular H—bonding of the cellulose. In
addition, similar results illustrating the increase of
crystallinity index and increase in full width at half
maximum height (FWHM), which is inversely proportional to
crystallite width (i.e., crystallite size) are shown in
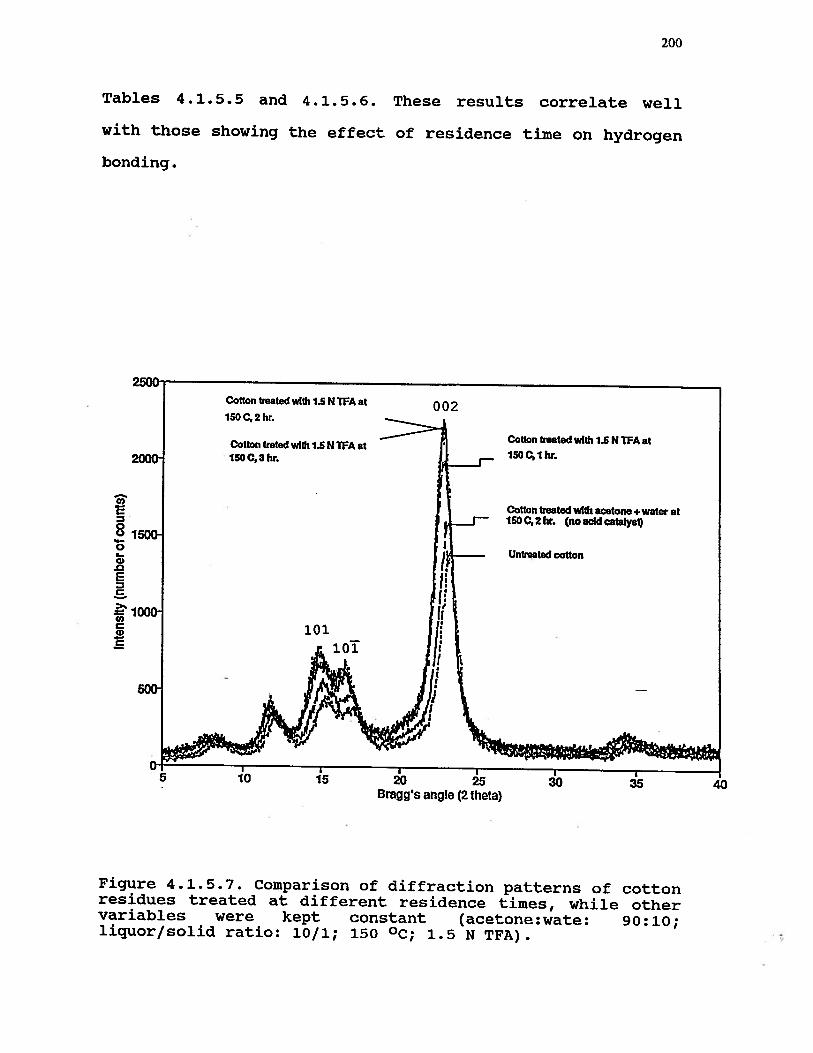
200
Tables 4.1.5.5 and 4.1.5.6. These results correlate well
with those showing the effect of residence time on hydrogen
bonding.
250GCottontreatedwlthl.SNTFAat 002150 C, 2 hr.
Cotton treated with 1.5 N TFA atCotton treted with 1.5 N WA at2ooo- 150C,3hr. 1SOC,lhr.
Cotton treated with acetone +watec at150C,2hr. (noacldcatalyst)
8 15ooE Untreated cotton0).0E
iooo101 Ii
—
Bragg’s angIe (2 theta)
Figure 4.1.5.7. Comparison of diffraction patterns of cottonresidues treated at different residence times, while othervariables were kept constant (acetone:wate: 90:10;liquor/solid ratio: 10/1; 150 0C; 1.5 N TFA).

201
Cottontieatedwltho.16NHGIat002
1SOC,3hr.
2000Cotton treated with 0.16 N 1401 at150 C,2hr.
Cotton treated with acetone+ water atCottontreatedwltho.l6NHClat 150C2hr (noacldcatatyst)
1500 1500, lhr.
2 Untreated cotton
Ez I.
11000
101ioT
500
tt.Ij
I I I5 15 20 25 35 40Bragg’s angIe (2 theta)
Figure 4.1.5.8. Comparison of diffraction patterns of cottonresidues treated at different residence times, while othervariables were kept constant (acetone:water: 90:10;liquor/solid ratio: 10/1; 150 °C; 0.16 N HC1).
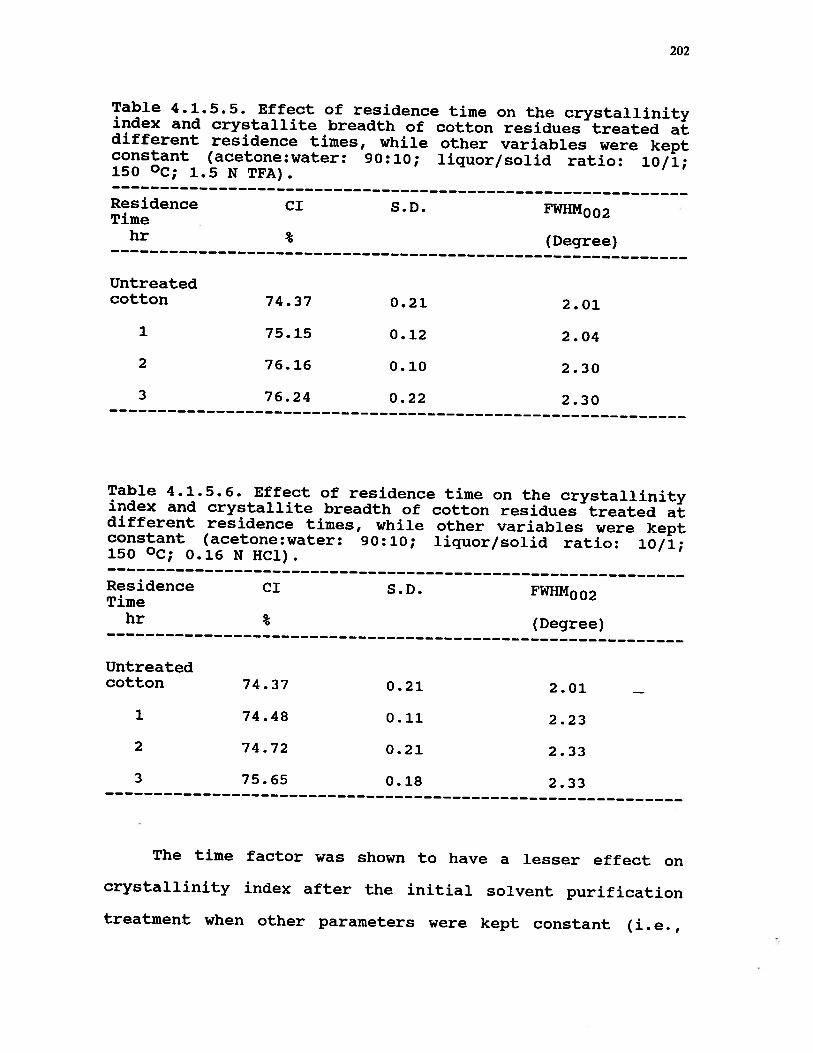
202
Table 4.1.5.5. Effect of residence time on the crystallinityindex and crystallite breadth of cotton residues treated atdifferent residence times, while other variables were keptconstant (acetone:water: 90:10; liquor/solid ratio: 10/1;150 °C; 1.5 N TFA).
Residence CI S.D. FWHM002Time
hr % (Degree)
Untreatedcotton 74.37 0.21 2.01
1 75.15 0.12 2.04
2 76.16 0.10 2.30
3 76.24 0.22 2.30
Table 4.1.5.6. Effect of residence time on the crystallinityindex and crystallite breadth of cotton residues treated atdifferent residence times, while other variables were keptconstant (acetone:water: 90:10; liquor/solid ratio: 10/1;150 °C; 0.16 N HC1).
Residence CI S.D. FWHN002Time
hr % (Degree)
Untreatedcotton 74.37 0.21 2.01
1 74.48 0.11 2.23
2 74.72 0.21 2.33
3 75.65 0.18 2.33
The time factor was shown to have a lesser effect on
crystallinity index after the initial solvent purification
treatment when other parameters were kept constant (i.e.,

203
temperature, solvent composition, liquor to solid ratio and
acidity, see Fig. 4.1.5.7 and 4.1.5.8 and Table 4.1.5.5 and
4.1.5.6). The slight increase in crystallinity index and
reduced crystallite size can be explained by the fact that
the interaction of acetone with more OH groups and
stereochemistry of isopropylidenated sugar units may bring
about, more or less, the some effect on the adjacent
molecules. This has implications on more H—bond
disruption/destruction indicating further structural changes
within the cellulosic material.
4.1.6 Molecular Weight Distribution (MWD) Analysis - Changesin Molecular Weight Distribution (i.e., molecularuniformity) of Solvent Purified Cotton Residues
Depolymerization of cellulose may result from different
degradative reactions such as aqueous acid or alkaline
hydrolysis, enzymatic hydrolsis, oxidative, thermal and
mechanical reactions, as well. Successful depolymerization
can be assessed from the shape of molecular weight
distribution curves and the polydispersity of the treated
cellulose. In this respect, determination of molecular
weight distribution (MWD) provides useful information for
understanding the way in which degradation takes place in
the solvent purification process. For getting a better
insight into the depolymerization of cellulose in
acetonation, the molecular weight distribution of solvent

204
purified cellulose was investigated under different reaction
conditions. In this work, variables believed to influence
molecular weight distribution, such as acid concentration,
temperature and residence time, were investigated.
4.1.6.1 Effect of Acid Concentration on Molecular WeightDistribution of Solvent Purified Cotton Residues
Figs. 4.1.6.1 and 4.1.6.2 and Tables 4.1.6.1 and
4.1.6.2 show that the treatment of cotton with just acetone
and water (90:lO),i.e., no catalyst has caused
depolymerizion of the cotton material. Apparently,
depolymerization has taken place due to the action of
buffer (acetone/water mixture) and the acids of pectic
substances present in cotton cellulose on glycosidic
linkages of the cellulose (cotton) molecules. This result is
consistent with the previous observation (Zarubin et al.,
1989) when acetone and water were used as a pulping liguor.
However, the hydrolysis action was attributed (Zarubin et
al., 1989) to acetic acid that resulted from the reaction of
water molecules with the acetyl groups of the hemicelluloses
present in the cellulose (wood pulp). Nonetheless, the
results obtained, in the present work, on the change of the
pH, i.e., before and after the treatment when no acid and
raw material were used, indicate that the hydrolysis could
possibly, in part, be achieved through the action of
205
acetone/water complex. This is because the pH was found to
drop within differnt treatments. This has been observed when
the control solution (acetone—water) was heated at reaction
temperature (150 °C) for 2 hr the pH fell from 7.46 to 5.77,
and the pH of cotton hydrolysate at identical conditions
dropped from 7.46 to 4.59. Apparently, these experimental
tests indicate the formation of an acetone—water complex,
which appears to be weakly acidic. In turn, since the
acetone—water complex possesses a weak acidic property (pH =
5.77), it can be expected to contribute to the hydrolysis of
glycosidic linkages. On the other hand, the acidity of the
acetone—water complex was also observed by other workers
(Fong et al., 1969; Waggoner et al., 1982). In addition, the
involvement of acids resulting from cotton in hydrolysis
reactions may not be ruled out. The formation of acids from
cotton during solvent purification treatment has earlier
been discussed in subsection 4.1.3.2.3.

206
1.6-
ftt_. Cotton treated wIth 3 N WA atI 150C,2hr.
1.4- fUntreated cotton A I ‘
, ‘i Cotton treated with OJS N WA at1.2- 1’ ij 1500,21w.
Cotton treated with I I lacotone+waterat t•
1- 150 C,2hr. I : 1.: i(no acid catalyst) —i— %‘
; ‘v‘ III I0.6-
c j: I Cotton treated wIth 1.5 N WA at! I C,2hr.
.0 •.. U.Q II ‘ ‘.:0 : i,:4.
‘: Ii!’ ‘ I0.4 Ii i;
02
- 32Elutlon volume (mL)
Figure 4.1.6.1. Effect of acid concentration on molecularweight distribution of cotton residues when TFA was used ascatalyst in aqueous acetone (acetone:water: 90:10;liquor/solid ratio: 10/1; 2 hr; 150 °C).

207
4I’I’tj1.4
Untreated cotton —i i
12 1: tI
—a II ‘.CoedwIth : *
1 acetone + water Cotten treated wIth 0.8 N HOt atI: .15002hr.
,.f150C,2hr.
(no acid catalyst) I ‘:,0.8 I Cottontreatedwttho.l6NHCIat
.506a
‘ r150C,2hr.
0.4 II02__
________
& I I I I I14 16 18 20 22 24 26 28 30 32Elutlon volume (mL)
Figure 4.1.6.2. Effect of acid concentration on molecularweight distribution of cotton residues when HC1 was used ascatalyst in aqueous acetone (acetone:water: 90:10;solid/liquor ratio: 10/1; 2 hr; 150 °C).

208
Table 4.1.6.1. Effect of acid concentration on molecularweight distribution and polydispersity of cotton residueswhen TFA was used as catalyst in aqueous acetone(acetone:water: 90:10; liquor/solid ratio: 10/1; 2 hr; 1500C; TFA).
SamplePolydispersityAcidity
N (x103) (x103)
Untreatedcotton (control) 902 296 3.05
0 N 450 67 6.72
0.75 N 188 103 1.82
1.50 N 158 83 1.89
3.00 N 145 54 2.70
Table 4.1.6.2. Effect of acid concentration on molecularweight distribution and polydispersity of cotton residueswhen HC1 was used as catalyst in aqueous acetone(acetone:water: 90:10; liquor/solid ratio: 10/1; 2 hr; 150°C).
SamplePolydispersityAcidity
N (x103) (xlO3)
Untreatedcotton (control) 902 296 3.05 —
0 N 450 67 6.72
0.08 N 175 93 1.88
0.16 N 1248 122 10.21
0.80 N 1452 82 17.64
Results shown in Figs 4.1.6.1 and 4.1.6.2 illustrate,
as expected, that an increase in acid concentration

209
acetonation offers more low molecular weight fractions
(i.e., the MWD curve shifts towards the low molecular region
— greater elution volumes). The tables, also show that lower
acid concentrations for both acid catalysts (TFA and HC1)
provide more uniform molecular weight distribution (i.e.,
narrow polydispersity) than the higher ones. This may be
explained by the fact that lower acid concentrations are
more suitable for the protonation of the strained glycosidic
linkages, i.e., under isopropylidenation reactions. However,
differences between the two acid catalysts can also be
observed. The results given in Fig. 4.1.6.1 and 4.1.6.2 and
Table 4.1.6.1 and 4.1.6.2 show explicitly that TFA at
different acid concentrations has offered more symmetrical
and uniform molecular weight distributions (i.e., narrow
polydispersity), while molecular weight distributions
produced by HC1 at higher acid concentrations are become
broader and bimodal as compared to those of the original
untreated sample. This may appear a physical impossibility.
It was noted by Rantanen et al. (1986) that_ the
nonuniformity of molecular weight distribution accompanied
with the appearance of a shoulder in the high molecular
range of the MWD curve is due to the presence of long
molecule clusters and aggregates remaining in sample
solution during the GPC analysis. The explanation for the
presence of molecule aggregates, in this case, is probably
due to the nonequivalence in steric effects and electronic
interactions among the cellulosic units, resulting from the

210
acetonation reactions with cellulose in conjuction with the
abundance of an effective acid catalyst (HC1). This isbecause it would be inappropriate if the large-sized ion
(C1) is taken into account as the main reason for impaired
penetrability of a solvent. In spite of a large number of
publications on the swelling, the available literature on
the penetration process is scanty. However, penetration and
swelling can be considered in some degree as two phenomena
that resemble and complement each other. The influence of
ions on the swelling phenomena was earlier explained on the
basis of the diameter and hydration layers. It was noted
(Frey-Wyssling, 1953) that the lesser degree of swelling can
be attained the stronger hydration layer of the ion, i.e.,
small ions have thicker hydration layers. This can be
explained by the fact that the water dipoles are attracted
more strongly as the distance between the centre of gravity
and the surface of the ion decreases. Thus, the ion size for
hydrochloric acid in penetration and swelling aspects does
not seem to be a problem, i.e., thin hydration layer. In
addition, the performance of HC1 in hydrolysis reactions
(depolymerization) other than these two incidents with
broader NWD, appears to resemble that of TFA - offering low
molecular weight fractions with narrow polydispersity. On
the other hand, TFA was claimed (Fengel et al., 1979; Fanta
et al., 1984) to be selective in hydrolysis reactions of
cellulose. However, that is not the case, because TFA withits loose hydrogen atom (Tchoubar, 1966; Amis, 1966; March,

211
1985) might form different complexes with various compounds.
Reactions such as involvement of TFA with acetone in
addition reactions (Geddes, 1956; Harris, 1965; March,
1985), TFA with water (Geddes, 1956) and with cellulose
molecules in strong hydrogen bonding (section 4.1.2, Fig.
4.1.2.2 and 4.1.2.4) may undermine the activity of TFA, as
well. In addition, in support of our belief that the
efficiency of TFA is likely retarded due to these reactions,
it was usually used for longer periods in hydrolysis
reactions in order to obtain a reasonable amount of soluble
sugars. The treatment (Fanta et al., 1984) of wheat straw
with 1 N TFA for 7 hr at 100 0C yielded around 23% xylose
based upon initial straw weight. On the other hand, the
stability of sugars in response to hydrolysis reactions was
found to be different (Harris, 1975), and the hemicellulose
sugars were most accessible to hydrolysis.
Furthermore, penetration of these acids and solvents
into the cellulosic materials is usually accompanied by
different reactions. These reactions can be such as hydrogen
bonding reorientation, protonation, derivatization
(acetonation), and in some cases redistribution of substrate
components (Wong et. al., 1988). Thus, with regards to the
complexity of the whole process of penetration, other
factors such as molecular structure (Bax et al., 1972;
Isaacs, 1974), reactivity of the molecules (Tchoubar, 1966;
March, 1985), chemical environment (Lindstrom et al., 1980),
and apparently electronic properties of the molecules (i.e.,

2 2
dipole moment, dielectric constant) would have to be taken
into account. However, further investigations in the
significance of these factors in conjuction with the
molecular size of reagents to the penetration process are
needed.
4.1.6.2 Effect of Temperature on Molecular WeightDistribution of Solvent Purified Cotton Residues
Figs. 4.1.6.3 and 4.1.6.4 show that the MWD curves of
cotton residues shift towards a lower molecular weight
distribution region with the increase in temperature. This
suggests that more cleavage of glycosidic bonds has taken
place at different sites of isopropylidenated molecules
along the cellulose chain. In other words, the effect
explicitly suggests that the increase of temperature leads
to production of shorter cellulose chains on acetonation of
cellulose. This has not been observed in the literature for
acetonation of oligomeric sugar residues (Glushka et._al.,
1983; Aamlid, 1983) in the past. The two figures also
illustrate that the shift of the cellulose MWD curve for the
residues, treated with the HC1 catalyst, is more extensive
towards the low molecular weight distribution region than
that for the samples treated with TFA. The results shown in
Fig. 4.1.6.4 illustrate that the molecular weight
distribution curves for the treatments at 150 0C and 180 0C
temperature apparently coincide with each other, however,

213
the results shown in Table 4.1.6.4 indicate that the
weight—average and number—average molecular weight
distributions for the two treatments are in fact different
and hence their polydispersity must differ. Minor GPC
graphical deviations recently were shown to be highly
significant due to the excellent reproducibility of the
method (Schwantes et al., 1994).
Furthermore, the 2 hr results illustrated in Fig.
4.1.6.5 and Table 4.1.6.5 provide further evidence that an
increase in temperature (with the exception of 150 0C
treatment) of the solvent treatment offers residual
cellulose with lower molecular weights (weight-average and
number—average molecular weights). The results given in
Table 4.1.6.5 show that an increase of temperature
acossiated with longer reaction time (2 hr) has resulted in
production of shorter cellulose chains than that with lesser
residence time (1 hr), see Table 4.1.6.4. The results shown
in Table 4.1.6.5, also, indicate that the polydispersity of
the treated cellulose (except 150 °C treatment) has narowed
with the increase of temperature. The results given in
Tables 4.1.6.3, 4.1.6.4 and 4.1.6.5 are consistent with
those shown in section 4.1.3, i.e., weight loss results. In
other words, the higher the temperature of the treatment,
the greater the weight loss, and the shorter the cellulose
chain of the treated sample.

214
1.6
I Cotton treated with 1.5 N TFA at11 i / l.i, 130C,2hr.
1.4- i IUntreated cotton j 4 1
i’ i Cotton treated wIth 1.5 N IFA at% 150C,2hr.1.2-
__
ii :Cotton treatedwlth I
acetone.i-waterat I: Cottontreatedwithl.5NTFAat1 1SOC,2hr. : i 180C,2hr.
(no acid catalyst) f..JI ; /: ::. s;‘i ‘:€ 0.6- Ii I!:
i:t t
0.4
0.2- - —
I I I I I I14 16 18 20 22 24 26 28 30 32
Elutlon volume (mL)
Figure 4.1.6.3. Effect of temperature on molecular weightdistribution of cotton residues when TFA was used ascatalyst in aqueous acetone (acetone:water: 90:10;liquor/solid ratio: 10/1; 2 hr; 1.5 N TFA).

215
1.6
1’Untreated cotton I
1.4 j Cottontreatedwlth0.I6NHCtat
I 130C,Ihr.
:i ,A/1.2
withacetone + water at I1SOC,2hr.
_ : li 1(no acid catalyst) —!—-I ‘? I ‘
> I: ‘L’I; II”.! I
g Cotton treated with 0.16 N HOl atIj 1j
‘ / 1500,lh
j: If t
:‘€ 0.6 iii \
Ii ‘i\I ‘, Cotton treated wIth 0.16 N HOt at04- , I
I 18OC1h1! IIi I
02- / I
I -%
& I I14 16 18 20 22 24 26 28 30 32Elutlon volume (mL)
Figure 4.1.6.4. Effect of temperature on molecular weightdistribution of cotton residues when HCl was used ascatalyst in aqueous acetone (acetone:water 90:10;liquor/solid ratio: 10/1; 1 hr; 0.16 N HC1).

216
Table 4.1.6.3. Effect of temperature on molecular weightdistribution and polydispersity of cotton residues when TFAwas used as catalyst in aqueous acetone (acetone:water:90:10, liquor/solid ratio: 10/1; 2 hr; 1.5 N TFA).
Temperature PolydispersityTreatment
°C (x103) (xl03)
Untreatedcotton (control) 902 296 3.05
130 165 86 1.93
150 158 83 1.89
180 137 78 1.77
Table 4.1.6.4. Effect of temperature on molecular weightdistribution and polydispersity of cotton residues when HC1was used as catalyst in aqueous acetone (acetone:water:90:10; liquor/solid ratio: 10/1; 1 hr; 0.16 N HCl).
Temperature PolydispersityTreatment
(x103) (x103)
Untreatedcotton (control) 902 296 3.05
130 164 51 3.22
150 171 82 2.09
180 108 54 2.00

217
1.6-4‘1‘I
1.4-Untreated cotton —j
.
1.2- I I i
I : Cotton treated wIth 0.16 N HCI atCotton treated with 180 C, 2 hr.acetone+waterat
ISOC,2hr. t Cottontreatedwlth0.16NHCIatI300,2hr.(no acid catalyst) fU.O
r-COttOfl treated wIth 0.16 N HOt atI 150C,2hr.
U-
o IiO.4 1! 1
02
0 832Elutlon volume (mL)
Figure 4.1.6.5 Effect of temperature on molecular weightdistribution of cotton residues when HC1 was- used ascatalyst in aqueous acetone (acetone: water: 90:10;liquor/solid ratio: 10/1; 2 hr; 0.16 N HC1).

218
Table 4.1.6.5 Effect of temperature on molecular weightdistribution and polydispersity of cotton residues when HC1was used as catalyst in aqueous acetone (acetone:water:90:10; liquor/solid ratio: 10/1; 2 hr; 0.16 N I-Id).
Temperature PolydispersityTreatment
°C (x103) (x103)
Untreatedcotton (control) 902 296 3.05
130 150 74 2.02
150 1248 122 10.21
180 103 54 1.92
The results given in Table 4.1.6.3, 4.1.6.4 and 4.1.6.5
show that the solvent purification treatment brings about
considerable degradation of the celluose chains with the
increase of temperature during the treatment. However, the
results illustrate that the polydispersity index decreases
with the increase in temperature. The narrowness of
polydispersity is a clear evidence that the solvent
purification treatment causes a more uniform molecular
weight distribution in the residual cellulosic material.
Now, it is postulated that this uniform disproportionation
of the treated celluloses could be due to the formation of
isopropylidene groups at regular intervals on the cellulose
chains. The presence of isopropylidene groups on the solid
cotton residues has been confirmed, in this work, by the
results obtained from Gd, HPLC, and C-13 CP/MAS solid state
NMR analyses. However, these analyses allow no statements as

219
to the distribution and location of isopropylidene groups on
the cellulose chains themselves. Probably, the uniformity of
disproportionation of the cellulose chain arises from
repeated equivalent steric and electronic effects along the
cellulose chain due to acetone reactions with cellulose.
Regarding the last statement (i.e., uniformity of
cellulose chain attributed to equivalence of steric and
electronic effects), there is no evidence that the chain
length distribution of cellulose within a finite element of
cellulose as the crystallite is uniform. To the contrary,
while the molecular weight itself may be increasing with the
crystallite size, the MWD pattern may not provided that a
certain (high) crystallinity is maintained. If the
crystallinity index drops to a certain limit ( 75%) the MWD
will broaden due to the contribution from chains running in
the amorphous cellulose. In the present work, even though,
an enhancement of crystallinity (see crystallinity section)
is attained, the crystallinity index of the treated samples
has not exceeded 76%. In addition, a similar trend of
narrowness has also been indicated by polydispersity
results, however, it did not approach unity that one may
justify a cellulose sample of chains of similar lengths. On
the other hand, cotton and ramie are considered to be
single-phased types of cellulose, however, their lattice
structure was found to be highly imperfect (Kulshreshtha et
al., 1973). This observation lends support to the concept of
the limited molecular uniformity of cotton residues achieved
220
through solvent purification treatment. In addition, the
results obtained, in this work, on crystallinity, molecular
weight distribution, and polydispersity are not applicable
to the two—phase hypothesis of cellulose (Viswanathan, 1966;
Viswanathan, 1967). In other words, the state of order in
the fibrous structure of cellulose is much more complex than
the oversimplified structural picture drawn by the latter
theory. The two—phase concept visualizes the cellulosic
material as a two—state—ordered matter; one completely
crystalline and the other completely amorphous, present in
all cellulosic materials but to different extents, the
correlation coefficient for every analysis, no matter what
the crystallinity of the sample, should be unity
(Viswanathan, 1966; Viswanathan, 1967). However, there is
enough evidence against the hypothesis of a two—phase
structure in cellulose in the literature (Kulshreshtha et
al., 1973).
4.1.6.3 Effect of Residence Time on Molecular WeightDistribution of Solvent Purified Cotton Residues
Fig. 4.1.6.5 illustrates the changes in molecular
weight distribution resulting from the influence of reaction
time on acetonation of cotton. As anticipated, the MWD
curves show slight shifts towards the low molecular weight

221
distribution region with the increase in residence time. The
results given in Table 4.1.6.6, explicitly, show the
successive reduction in both weight—average and number—
average molecular weights with the increase in residence
time. The results also show that the polydispersity index
becomes smaller with the increase in residence time. Also,
Fig. 4.1.6.5 and Table 4.1.6.6 illustrate that the
differences in changes between both molecular weight
distribution and polydispersity has narrowed remarkably
with increasing reaction time. Particularly, this effect
appears to be clear between the 2 and 3 hr treatments. This
little difference in change of MWD and polydispersity at
extended reaction time can be attributed to the fact that
hydrolysis reactions become predominant, at longer reaction
times, in the crystalline regions and hence the frequency of
disproportionation is increased. The results given in Fig.
4.1.6.5 and Table 4.1.6.6 are consistent with those obtained
for weight loss, hydrogen bonding and crystallinity (Fig.
4.1.3.2.3.5, 4.1.2.7 and Table 4.1.5.6). —

222
1.8
1 .6
1.4
z(0
. •1•
.
o -
.5I
12
0.6
0.4
0.2
14I I I16 18 20 .22 24
Elution volume (mL)
Figure 4.1.6.6. Effect ofdistribution of cottoncatalyst in aqueousliquor/solid ratio: 10/1;
I I I26 28 30
residenceresiduesacetone (acetone:water:130 °C; 1.5 N TFA).
32
— Cotton treated wIth 1.5 N WA
atl3OC,2hr.
4.
Untreated cuon Cotton treated with 1.5 N WAail3OC,3hr.
I‘
cotton treated with f : Cotton treated wIth 1.5 N WAIt
acetone + water at ‘ 14 8t 130 C, 1 hr.130C,2hr. I
(no acid catalyst) [—v-f 4:: I
:11 I1; i I
‘. 1I’ I I£I
‘I:I
It •:I; I
1’ ‘I
‘1I, 41a: I ‘
Iis I
I, IIi I
ii
time on molecular weightwhen TFA was used as
90:10;

223
Table 4.1.6.6. Effect of residence time on molecular weightdistribution and polydispersity of cotton residues when TFAwas used as catalyst in aqueous acetone (acetone:water:90:10; liquor/solid ratio: 10/1; 130 °C; 1.5 TFA).
Residence 1n PolydispersityTime (hr) (x103) (x103)
Untreatedcotton (control) 902 296 3.05
1 213 111 1.91
2 155 86 1.81
3 152 84 1.81
From the results shown in Fig. 4.1.6.6 and Table
4.1.6.6. it is evident that the time factor has a lesser
effect on disproportionation of cellulose chains during
solvent purification when other parameters are kept
constant. The lesser degradation of cellulose chains can be
explained by the fact that the stereochemistry of
isopropylidenated sugar units may bring about, more or less,
the some effect on the adjacent molecules . This has
implications on more steric and electronic interactions
allowing the more accessible cellulose units to undergo
rapid isopropylidenation and hydrolysis reactions. This
assumption is based on experimental findings of other
workers (Brewster, 1959; Lemieux et al., 1968; Lemieux et
al., 1969; Stoddart, 1971) in the area of stereochemistry.

224
4.1.7 Viscosity Analysis - Changes in Viscosity of CottonResidues during Solvent Purification Treatment
Viscosity measurements, which are relatively simple to
perform, have been used widely because they can provide
valuable information both on the physico—chemical behaviour
of a cellulose and on the size of its molecules. In
addition, viscosity is one important parameter for
dissolving pulp analysis for both research and quality
control work. Thus, the viscosity test makes it possible to
check the degree of degradation brought about by hydrolysis
reactions, which greatly influence the quality of the
dissolving puips.
The purpose of this investigation is to characterize
the resistance of cellulose to degradation by solvent
purification with the acidified acetone-water system.
4.1.7.1 Effect of Acetone Concentration on Viscosity ofCotton Residues during Solvent Purification Treatment
Fig. 4.1.7.1 shows that the viscosity of cotton
residues, treated with different acetone concentrations in
the solvent composition, decreases with the increase in
acetone content. In addition, the statistical analysis
illustrates that the treatments of cotton with different
acetone concentrations for the viscosity are significantly
different, see Fig. 4.1.7.1, (Duncan’s multiple range test).

225
This result is in agreement with those obtained for the
hydrgen bonding, weight loss, and crystallinity. In other
words, the progressive increase in acetone concentration is
met with a systematic decrease in hydrogen bond strength
(accessibility), increase in carbohydrate removal, increase
in crystallinity index (selectivity), and decrease in DP of
the cellulose. In general, apparently, the decrease in
viscosity of cotton residues treated with just acetone and
water (no acid catalyst) is due to the action of acetone—
water system and acids released from pectic substances
present in cotton cellulose on strained glucosidic linkages.
This stress on the glycosidic linkages is likely to result
from the engagement of two adjacent cellulose units in
isopropylidenation. The formation of isopropylidene groups
on the cellulose molecules during acetonation is confirmed
in this work by GC, HPLC, and C-13 CP/MAS solid state NMR
analyses.
With regards to the hydrolysis reactions on cotton
residues that took place during the solvent treatment
(acetone/water) when no catalyst was added, are probably, on
one hand, due to the acidic nature of acetone/water mixture
(pH = 5.77) at higher temperature. This conclusion has been
drawn when the initial acetone—water mixture (pH = 7.46) was
dropped to 5.77 when heated for two hr at 150 0C, and the pH
of cotton hydrolysate (identical conditions) dropped from
7.46 to 4.59 . Thus, the pH result indicates that the
acidity of acetone/water system developed during solvent
226
treatment may lead to depolyinerization reactions
(protonation) along the cellulose chains. Such acidity of
the acetone—water system was also indicated by Fong et al.
(1969), and Waggoner et al. (1982). On the other hand, the
contribution of acids released from cotton during solvent
treatment to hydrolysis reactions might also be taken into
consideration. The possible explanation for the release of
acids from the cotton during treatment has already been
cited in subsection 4.1.3.2.3. Similar hydrolysis reactions
were observed earlier by Zarubin et al., (1989) on studying
acetone—water pulping of different wood raw materials.
However, their interpretation of the hydrolysis reactions
that took place was soley reasoned by the action of the
acetic acid formed during the pulping process.
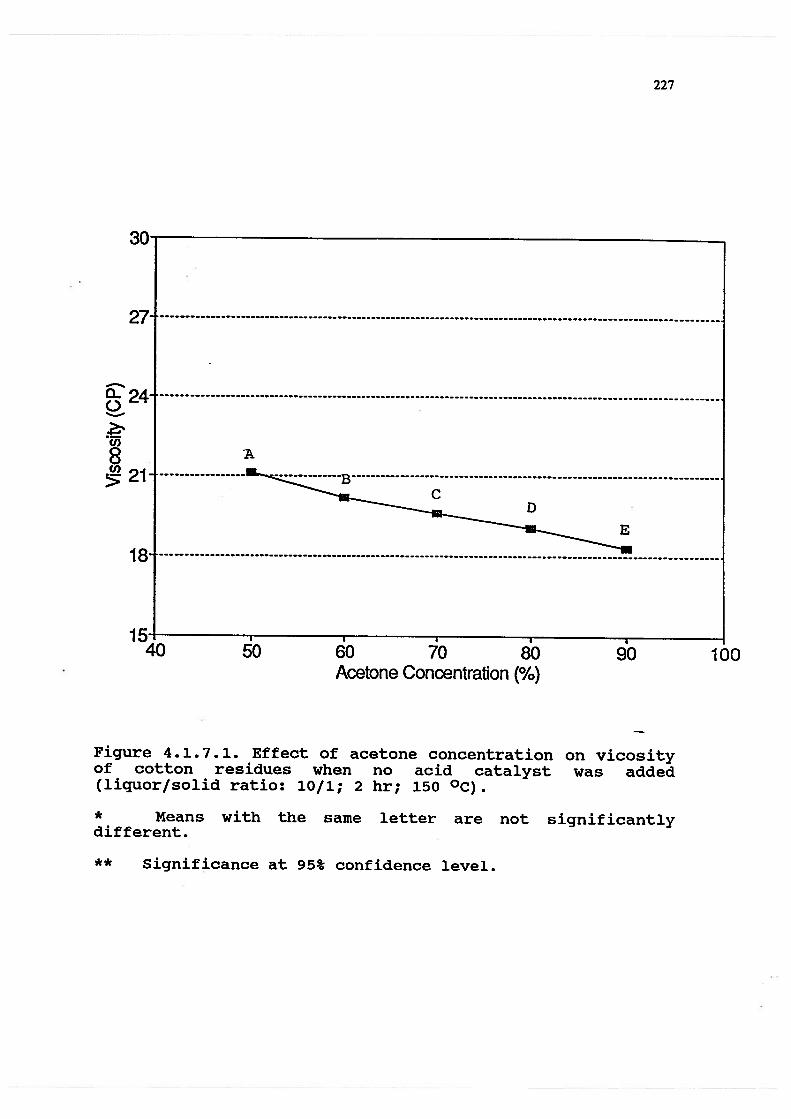
227
30
27-
18
15 p p
40 70 80 100Acetone Concentration (%)
Figure 4.1.7.1. Effect of acetone concentration on vicosityof cotton residues when no acid catalyst was added(liquor/solid ratio: 10/1; 2 hr; 150 °C).
* Means with the same letter are not significantlydifferent.
** Significance at 95% confidence level.

228
The results given in Fig. 4.1.7.1 indicate the sensitivity
of glycosidic linkages under isopropylidenation reactions to
acids. In other words, usually, under conventional forced
acid hydrolysis conditions (i.e., high energy and acidity)
are required to protonate glycosidic oxygens. However, in
the case of acetonation, these glycosidic linkages may,
probably, be placed under considerable strain due to the
formation of isopropylidene groups between the adjacent
cellulose units. The gradual decrease of viscosity is
attributable to the better solvation of cellulose molecules
by solvent (i.e., at both levels - hydrogen bonding and
isopropylidenation) at higher acetone concentrations.
4.1.7.2 Effect of Acid Concentration on Viscosity of CottonResidues during Solvent Purification Treatment
Fig. 4.1.7.2 and 4.1.7.3 show the dramatic drop of
viscosity (from 18.3 CP for the acetone:water treated cotton
to 3.68 and 3.49 CP for TFA and HC1 catalyzed runs,
respectively) when (0.75 N TFA and 0.16 N HC1) acid
catalysts respectively were used in the initial in solvent
purification treatment of cotton. This is strongly
indicative of the destabilization of glycosidic linkages due
to the presence of isopropylidene groups on the molecules
along the cellulose chain. The results given in Fig. 4.1.7.2
and 4.1.7.3 illustrate that further increase in acid

229
concentration had little contribution to the drop of
viscosity after the initial acid concentration when the
other factors such as solvent composition, temperature,
liquor/solid, and reaction time are kept constant. However,
the statistical analysis shows that the treatments of cotton
with different acid concentrations for the viscosity are
significantly different (Fig. 4.1.7.2 and 4.1.7.3), Duncan’s
multiple range test. The lower rate of viscosity loss at the
higher acid concentration can be explained by the fact that:
a- the limiting DP has been reached, and b- that the
stereochemistry of already isopropylidenated sugar units
would bring about, more or less, the some effect on the
adjacent molecules. This has some implications on more H—
bond disruption/destruction (i.e., destabilization of sugar
conformations) allowing the more accessible cellulose units
to undergo rapid isopropylidenation and hydrolysis
reactions. Fig. 4.1.7.2 and 4.1.7.3 show that the
viscosities obtained for HC1 are lower than those obtained
for TFA. This can, in part, be explained by the fact_that
HC1 is a stronger acid than TFA and, in part, by the
competing reactions that may take place in the presence of
solvents with different properties such as acetone addition
reactions (March, 1985) hydrogen bond formation etc.
Consequently, such reactions could retard remakably the
reactivity of TFA towards hydrolysis reactions.

0120
Cl)0o8U)
>
Acid Concentration (N)
230
20
16
\\4
00 0.5 1 1.5 2 2.5 3 3.5 4
Figure 4.1.7.2. Effect of acid concentration on Viscosity ofcotton residues when TFA was used as catalyst in aqueousacetone (acetone:water: 90:10; liquor/so1i ratio: 10/1; 2hr; 150 °C).* Means with the same letter are not significantlydifferent.
** Significance at 95% confidence level.

231
Acid Concentration (N)
Figure 4.1.7.3. Effect of acid concentration on viscosity ofcotton residues when HC1 was used as catalyst in aqueousacetone (acetone:water: 90:10; liquor/solid ratio: 10/1; 2hr; 150 °C).
* Means with the same letter are not significantlydifferent.
20
16
12
8
4
0
0C-)
U)00U)
>
A
0 0.2 0.4 0.6 0.8 1
** Significance at 95% confidence level
232
4.1.7.3 Effect of Temperature on Viscosity of CottonResidues during Solvent Purification Treatment
Fig. 4.1.7.4 and 4.1.7.5 show the effect of temperature
on the residual viscosity of cotton residues following the
solvent purification treatment. The results in both figures
indicate a considerable drop in viscosity with increasing
reaction temperature. The results, also, show the drop in
viscosities continued to proceed with increase in
temperature even though the limiting DP has been reached
(the limiting DI’ is about 250-3 00 or 2.5—3.0 CI’). Fig.
4.1.7.4 and 4.1.7.5 show that the viscosities obtained with
TFA at different temperatures are higher than those obtained
with HC1 as catalyst. This limiting effect can be best
explained by the difference in acid strengths of the two
acids and, partly, by the involvement of TFA in competing
reactions as described previously. Nonetheless, the
statistical analysis indicates that the treatments of cotton
at different temperatures are significantly different jFig.
4.1.7.4 and 4.1.7.5), Duncan’s multiple range test.

a-.0
C,)0C.)0
233
5.7
5.2
4.7
4.2
3.7
3.2
2.7120
.
I I0-1HR1
tI--2HRI__±°3J
,..
130 140 150 160 170 — 180
Temperature (Degrees Celsius)
Figure 4.1.7.4. Effect of temperature on viscosity of cottonresidues when TFA was used as catalyst in aqueous acetone(acetone:water: 90:10; liquor/solid ratio: 10/1; 2 hr; 1.5 NTFA).
19c

00
Cl)0C.)U)
>
234
5
4.5
4
3.5
3
2.5120
-0- 1 HR
I —&• 2 HR
N%%%L-_3 HR
.. ...
190130 140 150 160 170 180
Temperature (Degrees Celsius) —
Figure 4.1.7.5. Effect of temperature on viscosity of cottonresidues when HC1 was used as ctalyst in aqueous acetone(acetone:water: 90:10; liquor/solid ratio: 10/1; 2 hr; 0.16
N HC1).

235
The results can be interpreted as follows; higher
temperature increases the reaction rate of the system.
Consequently, this would give rise to further stereochemical
alterations (i.e., molecules are freer and faster to
reorient, Bradley et al., 1993) that can bring about, to a
greater extent, more H—bond disruption/destruction in the
cellulosic material. In turn, more active sites (i.e., H—
bond free hydroxyl groups) will be available to undergo
isopropylidenation. Besides, the reactivity of acetone
molecules increases with increased temperature as does the
system pressure. This should also speed up the
isopropylidenation process by the involvement of more
acetone molecules with glucose units to yield isopropylidene
groups along the cellulose chain.
4.1.7.4 Effect of Residence Time on Viscosity of CottonResidues during Solvent Purification Treatment
Fig. 4.1.7.6 and 4.1.7.7 show the effect of residence
time on viscosities of cotton residues during the solvent
purification treatment. The results given in both figures
show a slight drop in viscosity of cotton cellulose on
increase of residence time. The results shown in Fig.
4.1.7.6 and 4.1.7.7, also illustrate that the effect of
residence time on the viscosity drop at 130 °C treatment
temperature is relatively higher than that at higher
236
temperatures (150 and 180 °C). Probably, this could be due
to the fact that the hydrolysis reactions proceeed primarily
in the amorphous zones. However, the statistical analysis
shows that the treatments of cotton at different reaction
times for the viscosity, for both acid catalysts, are not
significantly different (Duncan’s multiple range test).

—‘.4.70
4.2.Q)
0
3.7
Residence Time (Hrs)
237
5.7
5.2—0— 130 Deg. Celsius—& 150 Deg. Celsius—0— 180 Deg. Celsius
..
3.2
2.70 1 2 3 4
Figure 4.1.7.6. Effect of residence time on viscosity ofcotton residues when TFA was used as catalyst in aqueousacetone (acetone:water: 90:10; liquor/solid ratio: 10/1; 1.5N TFA).

238
Residence Time (HR)
Figure 4.1.7.7. Effect of residence time on viscosity ofcotton residues when HC1 was used as catalyst in aqueousacetone (acetone:water: 90:10; liquor/solid ratio: 10/1;0.16 N HC1).
5
4.5
4
3.5
3
2.5
a0
Cl)00Cl)
>
—0— 130 Deg. Celsius—— 150 Deg. Celsius
c%% —0— 180 Deg. Celsius
0 1 2 3 4

239
The time factor is shown to have a lesser effect on
drop in viscosity (DP) especially at the higher (150 and 180
°C) temperatures following the initial solvent purification
treatment when all other parameters were kept constant
(solvent composition, temperature, liquor/solid ratio, and
acidity). The reduced rate of viscosity loss can be
explained by the fact a- the limiting DP has been reached
and b- that the stereochemistry of isopropylidenated sugar
units may bring about, more or less, the some effect on the
adjacent molecules. This has implications on more H—bond
disruption/destruction allowing the more accessible
cellulose units to undergo rapid isopropylidenation and
hydrolysis reactions.

240
5 OVERALL MECHANISM OP PURIFICATION OP CELLULOSE IN
ACIDIFIED AQUEOUS ACETONE
The mechanism of cellulose purification in acid
catalyzed aqueous acetone has been proposed to be of a
physico—chemical character. The physical phenomenon is based
on the hydrogen bond disruption/destruction in crystalline
cellulose by acetone as the solvent. On the other hand, the
chemical hypothesis of the mechanism is suggested to be the
formation of isopropylidene groups on carbohydrate chains
that lead to disproportionation of the polymer and
protection of the dissolved sugar ring. To investigate the
validity of these assumptions cotton has been used
throughout this work as a model compound, i.e., it consists
of glucose units only. Nonetheless, trace amount of other
substances were reported to be a part of its constituents
(see section 4.1.3, HPLC Analysis).
The mechanistic study carried out by employing
different techniques, on solvent purification of cotton
using acetone in the presence of acid catalyst has
established the following findings:
1— interaction of acetone with cellulose molecules through
their hydroxyl groups brings about irreversible attenuation
in hydrogen bonding of the cellulosic material (Fig.
4.1.2.1). This suggests that the hydroxyls of the cellulose
have adopted new orientations (i.e., stereochemical changes)

241
as the result of acetonation. These structural changes have
disrupted both the inter- and intramolecular H—bonds of the
material, i.e., amorphous and crystalline regions (Figs.
4.1.5.1, 4.1.5.2, and 4.1.5.3). In addition, the changes in
crystallinity index (increase) and crystallite size
(decrease) (see Table 4.1.4.1) confirm that the acetonation
of cellulose is achieved by intramicellar swelling.
2— the systematic increase in accessibility of cellulose
with the increase of acetone concentration is linearly
correlated with the subsequent increase in crystallinity
index and decrease in crystallite size. This indicates a
high degree of specificity is attained in removal of
amorphous cellulose during the solvent purification
treatment (see Fig. 4.1.2.1 and Table 4.1.5.1).
3— by using acid catalyzed aqueous acetone in solvent
purification of cellulose both large amounts of acetonated
reducing and nonreducing sugars were found in the
hydrolysate. Two of the isopropylidene derivatives of sugars
(different isomers) were identified as 1,2:5,6—diacetal
glucofuranose and 1,2:3,4-diacetal galactopyranose (Figs.
4.1.3.5 and 4.1.3.6).
4— In a similar manner the deacetonated solvent purified
cotton hydrolysate has offered a considerable quantity of
simple sugars (epimers) such as glucose and galactose (Fig.
4.1.3.2.5).
5- the quantitative analysis of the reducing sugars in the
cotton hydrolysate has shown that the predominance of

242
deacetonated sugar products is to be as high as 86.33% of
the weight loss (Table 4.1.3.2.1).
6- the treatment at high temperatures (180 °C) has brought
about significant removal of sugars (i.e., weight loss went
up to 42.3% of the original cotton). This is explicitly
illustrated in Fig. 4.1.3.2.3.3.
7- the structural investigation of the residual cotton,
using C—13 CP/MAS solid state NMR, has confirmed the
formation of isopropylidene groups on the sugar rings in the
cellulose chain or chain ends. However, the quantitative
analysis conducted in this regard has shown that only small
amounts of isopropylidene groups remain in the residual
cellulose (i.e., at the reducing and nonreducing terminals),
(see section 4.1.4 and Figs. 4.1.4.3a and 4.1.4.3b). In
other words, one isopropylidene group is fond per 400-500
cellulose units at the treatment; acetone:water: 90:10;
liquor/solid ratio: 10/1; 2 hr; 0.16 N HC1; 150 °C).
8- C-13 CP/MAS solid state NMR spectrum has confirmed that
the adsorbed amount of acetone by cellulose is too small for
the unreactive solvent in comparison to that consumed on the
formation of methyl groups.
9— by using acid as catalyst for aqueous acetone in solvent
purification of cellulose, the viscosity of the treated
material drops dramatically as shown in Fig. 4.1.7.3. This
can be explained by the disproportionation of the fibres due
to the formation of isopropylidene groups between adjacent
cellulose units at regular intervals along the cellulose

243
chains. CuEn viscosity is decreased with the increase of
temperature in the presence of the acid catalysts, as
illustrated in Figs. 4.1.7.4 and 4.1.7.5 (from 28.5 to 2.7
CP). Similar trends are also observed for the molecular
weight distributions of the solvent purified cotton
residues. The treatment has offered uniform (symmetrical)
molecular weight distrbutions (see Figs. 4.1.6.3 and 4.1.6.4
and Tables 4.1.6.3 and 4.1.6.4) which would be preferred for
the dissolving pulp manufacture if the weight losses and
decrease in viscosity could be suppressed.
The results of the present work, support the following
mechanism of cellulose acetonation as illustrated in Fig.
5.1. below:

244
Cellulose Chain+
(‘4
Unaffected pads of celMose chain\ U
I (‘4
.1
/
____
__
ropyrene groups
Me Z
\/ L[’ 1‘\\j 2jMeFurfural Isopropylidene derivatives1-IMF of sugar such as1,6.anhydroglucose 1.2516-dlacotat glucofuranoseIsopopytidenatedoligomeq. and12314-diacetaI gatactopyranose
minor (Acetonation Products) major
4JC’4Key; HoOf2 + °“
V=A=4EF°1<>LO f’-’.ci2/C z
______________
G=glucoseFurfural
M - Methyl I-IMFe— I .6-anhydrogTucose Reducing sugars sucli a
1oligomer 1glUcoS&td galactose
minor (Deacetonation Products) major
Figure 5.1. Mechanism of purification of cellulose inacidified aqueous acetone at higher temperatures.

245
6 SUMMARY
A detailed study on the mechanism of purification of
cellulose in acidified aqueous acetone was carried out. The
mechanism has been found to be of a physico—chemical
character. The physical phenomenon has been verified to be
based on the hydrogen bond disruption/destruction by the
interaction of acetone with the cellulose (amorphous and
crystalline). This action has resulted in irreversible
changes in hydrogen bonding (weaker H-bonds), crystallinity
(enhanced), and crystallite size (decreased). These changes
are explicitly illustrated in Results and Discussion
(chapter 4), section 4.1.2 and 4.1.5. The chemical
hypothesis of the mechanism has been proved to be the
formation of isopropylidene groups on carbohydrate chains
that lead to disproportionation of the polymer and
protection of the monomer sugar ring thus formed. The
quantitative analysis conducted on the hydrolysate has
indicated that the isopropylidene derivatives of sugar were
the predominent product of the dissolved material. These
experimental findings are demonstrated in Results and
Discussion (chapter 4), section 4.1.3, 4.1.4, 4.1.6, and
4.1.7. For the investigation of the validity of these
assumptions cotton was used throughout this work as a model
compound, and different techniques (DRIFT, GC, HPLC, C-13
CP/MAS solid state NMR, X-ray Diffraction, GPC, and
Viscosity) were employed.

246
Factors affecting solvent treatment such as acetone
concentration, residence time, temperature, type of acid
catalyst and acid concentration were also investigated. It
is noteworthy to mention that the investigation of the
factors was conducted in a manner that helped elucidation
of the acetonation mechanism rather than optimization of the
process. Elucidation and characterization of the
purification mechanism was the main objective of this work.
Parametric contributions to the mechanism of the process are
as follows:
Acetone Concentration
The increase of acetone concentration was found to be
associated with a significant systematic increase in
absorbance height of OH stretching, i.e., provision of weak
H—bonds (Fig. 4.1.2.1). In other words, the accessibility of
cellulose was progressively increased with the increase of
acetone concentration.
The weight loss was increased consecutively with the
increase of acetone concentration (Fig. 4.1.3.2.3.1).
In crystallinity, the successive increase of acetone
concentration was found to give rise to a systematic
increase in crystallinity index, and decrease in crystallite
size (Table 4.1.5.1). A confirmatory trend of acetone
concentration was also shown by the viscosity results (Fig.
4.1.7.1)

247
Tve of Acid Catalyst
Two acid catalysts were used in this study; TFA
(organic), and HC1 (mineral). The effect of the type of acid
catalyst, on hydrogen bonding, hydrolysis (i.e.,
deacetonated sugar products and weight loss), crystallinity,
molecular weight distribution, and viscosity, was examined.
This was observed to be dependent on the molecular structure
and properties of the acid (i.e., protic, ionizing power,
nucleophilicity etc.). This is explicitly illustrated in
various figures and tables of chapter 4 (Results and
Discussion). HC1 was found to be more effective than TFA in
many different ways illustrated in chapter 4 (Results and
Discussion).
Acid Concentration
The effect of acid concentration on hydrogen boning,
hydrolysis, crystallinity, molecular weight distribution and
viscosity was found to depend upon the type of acid
catalyst, i.e., it is dependent on molecular structure and
the properties of the catalyst. This is indicated throughout
the whole text of chapter 4 (Results and Discussion).
However, it is important to note that the results
illustrated in this work have shown that higher
concentrations of TFA are effective but milder in the

248
hydrolysis reactions (i.e •, minimum dehydration products),
while those of HC1 are detrimental and “aggressive” to the
quality (DP) and quantity (yield) of the product, see Figs.
4.1.3.2.10 and 4.1.3.2.11.
Temperature
Different temperatures were applied in this work (130,
150, and 180 °C). From the experiments on hydrogen bonding,
hydrolysis, crystallinity, molecular weight distribution,
and viscosity it was apparent that temperature has a
significant influence on the quality (DP) and quantity
(yield) of the treated cellulosic material during solvent
treatment. These results were shown in many figures and
tables in chapter 4 (Results and Discussion), see Figs.
4.1.2.4, and 5, 4.1.3.2.3.2, and 3, and Tables 4.1.5.4,
4.1.6.3 and 4.
Residence Time
The effect of the reaction time, on different
characteristics of the cellulosic material during solvent
treatment, was investigated at different periods of time.
The effect of residence time on hydrogen bonding,
hydrolysis, crystallinity, molecular weight distribution,
and viscosity was noticed to provide chances for better
solvent—solute solvation conditions. However, the extent of

249
strength of the hydrogen bond with increase in reaction time
was found to be dependent on the solvent and solute
properties (Figs. 4.1.2.6 and 4.1.2.7).
Furthermore, the time factor was shown to have a lesser
effect on the carbohydrate removal (weight loss) and drop in
viscosity (DP) after the initial solvent purification
treatment when other parameters were kept constant (i.e.,
temperature, solvent composition and acidity), see Figs.
4.1.3.2.3.4, 4.1.3.2.3.5, 4.1.7.6, and 4.1.7.7 and Tables
4.1.5.5, 4.1.5.6, and 4.1.6.5.
In summary, solvent purification of cellulose in the
presence of an acid catalyst is a complex phenomena largely
depending on the solvent concentration (acetone), the
catalyst concentration (Hj and type as well as the
temperature and residence (reaction) time. At high solvent
{acetone} concentration hydrogen bond disruption even in the
crystalline domains of cellulose can be observed which is
accompanied by formation of ketals in the solid phase
followed by disproportionation or chain breaking (i.e.,
reduced DP). Solvent treatment does lead to physical
purification whereby the crystallite size becomes more
uniform especially as the limiting (leveling off) DP of the
cellulose is approached. Substantially the same effects can
be observed with a weaker organic acid, such as
trifluoroacetic acid, however at much less destructive
levels.

250
7 CONCLUSIONS AND RECOMMENDATIONS
7.1. Conclusions
1. The solvent purification treatment has brought about,
within the residual cotton, significant, irreversible H-
bond rearrangement that seems to cause permanent weakness
(disruption) in the hydrogen bonding system. This
irreversible hydrogen bonding rearrangement, as result of
acetonation, confirms the reorientation (i.e.,
stereochemical changes) of hydroxyls of the cellulose
molecules.
2. The systematic increase in absorbance height of OH
stretching with the increase of acetone concentration is due
to the increased interaction of acetone (HBA) with cellulose
(HBD), i.e., provision of weak (nonlinear) hydrogen bonds.
3. The accessibility of cellulose is increased during the
solvent purification treatment due to the interaction of
acetone with cellulose molecules through their hydroxyl
groups by provision of weaker hydrogen bonds.
4. The effect of the acid catalyst and concentration on
hydrogen bonding are dependent on the molecular structure
(i.e., type of atoms in the molecule) and properties of the
acid (i.e., protic, ionizing power, and nucleophilicity).

251
5. Temperature has a significant influence on the hydrogen
bonding of the cellulose during solvent purification
treatment. This is explained by the better solvent
penetration, and freer and faster reorientation of the
molecules (i.e., increase of the reaction rate).
6. The effect of residence time on hydrogen bonding of the
cellulose is explained by a provision of chances for better
solvent—solute solvation conditions. However, the extent of
strength or weakness of the hydrogen bond with increase in
reaction time is dependent on the solvent and solute
properties.
7. Acetonation of cotton provides for a remarkable
stereocheiuical versatility. In other words, much is
characterized by isomerization and interconversion reactions
of glucose obtained on isopropylidenation of cotton
cellulose.
8. The products of isopropylidene derivatives of sugars,
such as 1,2:5,6—diacetal glucofuranose and 1,2:3,4—diacetal
galactopyranose, resulting from acetonation of cotton,
confirm that isomerization has led to the establishment of a
dynamic equilibrium.
9. The identified diacetals (i.e., 1,2:5,6—di—O—
isopropylidene-x-D-glucofuranose and 1,2:3, 4-di-O-
252
isopropylidene-cL-D-galactopyranose) illustrate explicitly
that isomerization has occurred in three forms of all
sugars, i.e., constitutional, conformational and
configurational.
10. The isomers of nonreducing sugars are fewer in number
than those of the reducing sugar type. This is attributable
to the difference in stability of the various isomers.
11. It is of significance, however, that isopropylidene
derivatives of glucose have survived the high temperature
hydrolysis conditions of cellulose even in the presence of
water.
12. The removal of isopropylidene groups by hydrolysis and
deacetonation under different treatment conditions (i.e •,
type of acid catalyst, temperature, and reaction time)
resulted in a provision of different sugar isomers (epimers)
in the hydrolysate.—
13. It is evident that glucose has remained the major
reducing sugar in the hydrolysate among the other epimers
resulting from the removal of acetone.
14. 1,6-anhydroglucose, furfural, and hydroxymethylfurfural
are minor by—products of the solvent purification treatment.

253
15. Although the sugar ring has some protection by
isopropylidene formed during solvent purification treatment,
high temperature exposure for prolonged time increases the
chances of dehydration products (i.e.,
hydroxymethylfurfural).
16. From both primary (about 40%) and secondary (46%)
hydrolyses the acetonation sugar products are the
predominant part (86.33%) of the soluble hydrolyzed
cellulose.
17. The successive increase of acetone concentration in
the solvent composition (acetone—water) has been found to
give rise to a systematic increase in weight loss.
18. The increase of temperature, while other factors are
kept constant (i.e., acid concentration, residence time, and
acetone content), has led to a significant increase in the
weight loss of the cellulose.
19. The time factor is found to have a lesser effect on
carbohydrate (weight) loss after the initial solvent
purification treatment when other parameters are kept
constant.

254
20. The weight loss of the cellulosic material has
increased significantly with the increase of acid
concentration of the different types of acid catalysts.
21. The greater increase (4.9% vs 33.5%) in the weight
loss of solvent purified cellulose has been attained by the
use of HC1 rather than TFA as the acid catalyst.
22. The spectrum of C—13 CP/MAS NNR of the residual cotton
solids after treatment with normal acetone, does not give
chemical shifts in the methyl group region.
23. The C-13 CP/MAS solid state NMR spectrum of the
residual cotton treated with C-13 labeled acetone has given
two methyl groups at 26.5 and 31.8 ppm, respectively.
24. There is only one isopropylidene group per every 400-
500 cellulose units of solvent purified cotton treated at
150 0C (acetone:water: 90:10; liqour/solid ratio: iD/iL; 2
hr; 0.16 N HC1).
25. Most of isopropylidene derivatives of sugars formed
during acetonation of cotton are rapidly solublized in the
hydrolysate.

255
26. DisproportiOflatiOn of the cellulose chains is the
result of removal of isopropylidene derivatives of sugars in
the solution during the hydrolysis reactions.
27. The process of the removal of isopropylidene
derivatives of sugars in the solution offers residual
cellulose with short chains isopropylidenated at the
reducing and non—reducing terminals.
28. The isopropylidene derivatives of sugars formed in the
residual cotton are monoacetals of pyranoid sugar structure,
i.e., 1, 2—O—isopropylidene--cL-D-glucofuranose and 4,6-0—
isopropylidene-D-glucopyranose.
29. The solvent purification treatment (i.e., acetone—
water) of celluose has increased the intensities of 101,
icTr, and 002 planes.
30. The successive increase in acetone concentration has
resulted in a systematic increase of the crystallinity index
of the cotton residues.
31. The increase of acetone content in solvent
purification liquor of cotton cellulose has led to a
systematic decrease in crystallite size of the residues.
256
32. With the increase of acetone concentration in the
solvent composition, the accessibility of cellulose is
progressively increased, i.e., weaker hydrogen bonds.
33. The systematic increase in accessibility of cellulose
with the increase of acetone concentration is linearly
correlated to successive increase in crystallinity index and
decrease in crystallite size in acetonation treatment.
34. Catalyst and acidity in solvent purification treatment
have no direct effect on crystalline changes. However, their
involvement in the shaping of crystallinity and crystallite
size can be used in determining how much they contribute to
the accessibility of the cellulose, and the selectivity of
the removal of the amorphous cellulose.
35. Temperature has a remarkable effect on the reaction
rate of the solvent purification treatment. In turn, this
would lead to considerable stereochemical changes, which
affect both crystallinity and crystallite size.
36. Residence time contributes to crystallinity and
crystallite size by provision of chances for further
stereochemical , i e., structral alterations.
37. Depolymerization of the cellulose (cotton), which has
taken place in the unacidified acetone—water mixture (i.e.,

257
no catalyst added), is largely due to the mutual action of
the acetone/water complex, resulted from the reaction of
water molecules with the acetone at a higher temperature,
and the acids from the pectic substances in cotton
cellulose.
38. The increase in acid concentration, in general, has
offered higher proportions of low molecular weight fractions
of cotton residues in the solvent purification treatment.
39. Increase of temperature has led to production of
shorter cellulose chains on acetonation of cellulose.
40. The molecular weight distribution (MWD) curves have
shown shifts towards the low molecular weight distribution
region with the increase in residence time.
41. The disproportionation of the cellulose chain,
resulting from the increase of a parameter such as _acid
concentration, temperature, and residence time is usually
accompanied with formation of narrower polydispersities in
acetonation, i.e., more uniform molecular weight
distribution.
42. The progressive increase in acetone concentration in
the solvent purification treatment affords a significant
systematic decrease of the degree of polymerization (DP) of

258
the cellulose. The drop in DP may be too severe for the
purpose of dissolving pulp manufacturing.
43. Cellulose viscosity dropped dramatically
(significantly) when acetone in the presence of acid
catalyst has been used in high temperature solvent
purification treatment of cotton.
44. Temperature has a significant effect on the residual
viscosity of cotton residues following the solvent
purification treatment.
45. The time factor has little (insignificant) contribution
to the drop of viscosity (DP) after the initial solvent
purification treatment when temperature, liquor/solid ratio,
and acidity are kept constant.

259
7 • 2 Recommendations
1. Further studies on the mechanism of acetonation on other
pulp components, such as xylans and lignin would be of
importance.
2. Investigations should be carried out on the optimization
of the solvent purification treatment for the attainment of
high—yield dissolving pulp with characteristics similar to
those recommended by the standards. Such process efficiency
is expected to bring about significant impact on the
economic feasibility of dissolving pulp manufacturing, as
well as biomass conversion to liquid fuels without the need
of involving higher efficiency biological agents such as
enzymes in the cellulose conversion process.

260
B LITERATURE CITED
Aamlid, K.H. 1983. Analysis of Mixtures of Some Mono—O—Methylaldoses with the Common Aldoses by GLC-MSafter Isopropylidenation. Carbohydr. Res. 124: 1-10.
Ahtee, M., T. Hattula, J. Mangs and T. Paakkari. 1983. An X—ray Diffraction Method for Determination ofCrystallinity in Wood Pulp. Paperi ja Puu - Papperoch Tra. 8: 475—480.
Amis, E.S. 1966. Solvent Effects on Reaction Rates andMechanisms. Academic Press, N.Y.
Attalla, R.A. 1985. The Structure of Cellulose. ACS Symp.Ser. No. 340, pp. 292—301. (Isogai, A. et al.Chapter 17).
Barker, S.A., and E.J. Bourne. 1952. Acetals and Ketals ofthe Tetritols, Pentitols and Hexitols. Adv.Carbohydrate Chem. 7: pp. 137-201.
Bax, D., C.L. de Ligny and A.G. Reminse. 1972. ActivityCoefficients of Single Ions (V) in Acetone andAcetone—water Mixtures. Red. Tray. Chim. Pays—Bas. 91: 1225—1238.
Behera, N.C. 1985. Topochemistry of Delignification and itsEffect on Fiber Properties of Spruce OrganosolvPulp. Ph.D. Thesis. Univ. of British Columbia,Vancouver, B.C.
Bernal, J.D., and R.H. Fowler. 1933. A Theory of Water andIonic Solution, with Particular Reference toHydrogen and Hydroxyl Ions. J. Phys. Chem. 1,. No.8: 515—548.
Bernardin, L.J. 1958. The Nature of PolysaccharidesHydrolysis in Black Gumwood Treated with Water at160 oC. Tappi 41: 491—499.
Biermann, C.J. 1993. Essentials of Pulping and Papermaking.Academic Press Inc. pp. 312-334.
Bourre, E.J., G.P. McSweeny, M. Stacey and L.F. Wiggins.1952. The Isopropylidene Derivatives of Hexahydricalcohols. Part 2. Isopropylidene Derivatives ofsorbitol. J. Chem. Soc. pp. 1408—1414.

261
Bourre, E.J., GP. McSweeny and L.F. Wiggins. 1952. The 2,3-4, 5-di-O-isopropylidene derivatives of aldehydo-Lxylose and L—xylitol. J. Chem. Soc. pp. 3113-3114.
Bradley, M.S. and J.H. Krech. 1993. High-Pressure RamanSpectra of the Acetone Carbonyl Stretch inAcetone-Methanol Mixtures. J. Phys. Chem. 97: 575—580.
Brewster, J.H. 1959. Useful Model of Optical Activity. I.Open Chain Compounds. J. Am. Chem. Soc. 81: 5475-5483.
Brewster, J.H. 1959. The Optical Activity of SaturatedCyclic Compounds. J. Am. Chem. Soc. 81: 5483—5493.
Buchanan, J.G., N. Chacon-Fuertes, A.R. Edgar, S.J.Moorhouse, D.I. Rawson and R.H. Wightman. 1980.Assignment of Ring Size in Isopropylidene Acetalsby C—13 NMR. Tetrahedron Lett. 21: 1793-1796.
Buchanan, J.G., A.R. Edgar, D.I. Rawson, P. Shahidi and R.H.Wightman. 1982. Assignment of Ring Size inIsopropylidene Acetals by Carbon-13 N.M.R.Spectroscopy. Carbohydr. Res. 100: 75—86.
Buck, K.W., A.B. Foster, B.H. Rees and J.M. Webber. 1966.1,3:2, 4-Di-O-Isopropylidene-L-Ribitol and RelatedCompounds. Carbohydr. Res. 2: 115-121.
Carlstrom, D. 1957. Crystal Structure of x-Chitin (Poly-NAcetyl-D-Glucosamine). J. Biophys. Biochem. Cytol.3: 669—683.
Chang, P.C. and L. Paszner. 1976. Recovery and GC Analysisof Wood Sugars from Organosolv Saccharification ofDouglas-fir Heart Wood. 76 Can. Wood Chem. Symp.,Mont Gabriel, P.Q.
—
Chang, P.C., L. Paszner and G. Bohnenkamp. 1977.Comparative Dissolution Rates of Carbohydrates andLignin during ACOS Process. Tappi ForestBiol./Wood Chem. Symp., Madison, Wisconsin.
Chang, M., T.C. Pound and R. ST. J. Manley. 1973. GelPermeation Charomatographic Studies of Cellulose
- Degradation. I. Treatment with Hydrochloric acid.J. Polym. Sci., Polym. Phys. Ed. 11: 399—411.
Christophe, M. 1984. Acetalation of 2-acetamido—4,6—(R)—O-benzylidene-2-deoxy-D-glucitol. Carbohydr. Res.128: 345—350.

262
Chung, F.H. 1989. Industrial Applications of X—rayDiffraction. American Laboratory. 2: 144—156.
Coil, H. and D.K. Gilding. 1970. Universal Calibration inGPC: A Study of Polystyrene Poly-cL-Nethylstyrene,and Polypropylene. J. Poly. Sci. 8: 89—103.
Couto, A. and R.M. de Lederkremer. 1984. Synthesis of NewDisaccharide: O—13-D-glucopyranosyl- (1-3) -Dfructose (laminarabiulose). Carbohydr. Res. 126:313—320.
Cullity, B.D. 1956. X-ray Diffraction. Addison-wesley.London.
Danhelka, J. and I. Kossler. 1976. Determination ofMolecular Weight Distribution of Cellulose byConversion into Tricarbanilate and Fractionation.J. Polym. Sci., Polym. Chem. Ed. 14: 287—298.
De Belder, A.N. 1965. Cyclic Acetals of the Aldoses andAldosides. Adv. Carbohydr. Chem. 20: 219—302.
De Beider, A.N. 1977. Cyclic Acetals of the Aidoses andAldosides. Highlights of the Literature since 1964and a Supplement to the Tables. Adv. Carbohydr.Chem. 34: 179—241.
De Jong, D.C. and K. Biemann. 1964. Mass Spectra of 0-Isopropylidene Derivatives of Pentoses andHexoses. J. Am. Chem. Soc. 86: 67-74.
Drefus, H. 1933. Conversion of Lignoceilulosic Materialsinto Dextrins, Sugars and Conversion Products. USPatent No. 1919623.
Durbak, I. 1993. Dissolving Pulp Industry: Market Trends.Gen. Tech. Rep. FPL-GTR-77. Madison, WI. —U.S.Department of Agriculture, Forest Service, ForestProducts Laboratory. 20 p.
Durette, P.L, D. Horton and N.S. Bhacca. 1969.Conformational Studies on Pyranoid SugarDerivatives. The Conformational Equilibria of 3—D—Ribopyranose Tetraacetate and 13—D—XylopyranoseTetraacetate. Carbohydr. Res. 10: 565—577.
Ehrlich, F. and F. Schubert. 1929. Uber die Chemie derPektinstoffe: Tetra—Galakturonsauren und d—Galakturonsaure aus dem Pektin der Zuckerrube.Ber. 62: 1974—2027.

263
El Ashmawy, A.E., J. Danhelka and I. Kossler. 1974.Determination of Molecular Weight Distribution ofCellulosic Pulps by Conversion intoTricarbanilate, Elution Fractionation and GPC.Svensk Papperstidn. 77 (16): 603—608.
Ellis, J.W. and J. Bath. 1940. Hydrogen Bridging inCellulose as Shown by Infrared Absorption Spectra.J. Am. Chem. Soc. 62: 2859—2861.
Excoffier, G., D. Gagnaire and J.P. Utille. 1984. Synthesisof Reducing Disaccharides of D-Xylopyranose.Carbohydr. Res. 128: 217-226.
Fanta, G. F., T . P. Abbott, A. I • Herman, R. C. Burr and W. M.Doane. 1984. Hydrolysis of Wheat StrawHemicellulose with Trifluoroacetic Acid.Fermentation of Xylose with Pachysolentannophilus. Biotech. Bioeng. 26: 1122—1125.
Fengel, D. 1992. Characterization of Cellulose byDeconvoluting the OH Valency Range in FTIRSpectra. Holzforschung. 46: 283-288.
Fengel, D. 1993. Influence of Water on the OH Valency Rangein Deconvoluted FTIR Spectra of Cellulose.Holzforschung. 47: 103—108.
Fengel, D. and G. Wegener. 1979. Hydrolysis ofPolysaccharides with Trifluoroacetic Acid and itsApplication to Rapid Wood and Pulp Analysis. J.Am. Chem Soc. 145—158.
Fischer, E. 1895. Veberdie Verbindungen der Zucker mit denAlkoholen und Ketonen. Ber. 28: 1145—1167.
Fong, D.W. and E. Grunwald. 1969. Acid Dissolution inAcetone—Water Mixtures. An Anomalous Medium EffectWhen London Dispersion Forces are Large. J. Phys.Chem. 73 (11): 3909—3911.
Frey-Wyssling, A. 1953. Submicroscopic Morphology ofProtoplasm. Elsevier Pubi. Co. N.Y. pp. 1-326.
Gatzi, K. and T. Reichstein. 1938. Synthese des LGulmethylits und D-Rhamnits nach neuer Methode.Helv. Chim. Acta. 21: 914—925.
Geddes, A.L. 1956. Interaction of Trifluoroacetic Acid withCellulose and Related Compounds. J. Polym. Sci.22: 31—39.
264
Glushica, J.N., DN. Gupta and A.S. Perlin. 1983. TheConversion of Maltose into Disaccharides having 2—Amino—2—deoxy—cL—D—Glucose and L—Idose asConstituent Sugars, for the Synthesis of ModelCompounds Related to Heparin. Carbohydr. Res. 124:C12—C14.
Golden, M. 1955. Characterization of Puips via IntegratedFiltration and Optical Studies in their Viscoses.Tappi. 38 (12): 745—749.
Grindley, T.B., C.J.P. Cote and C. Wickramage. 1985. KineticCyclohexylidenation and Isopropylidenation ofAldose Diethyl Dithioacetals. Carbohydr. Res. 140:215—238.
Hall, D.M. and J.R. Home. 1973. Preparation of CelluloseTriacetate and Cellulose Tricarbanilate byNondegradative Methods J. Appi. Sci. 17: 3727-3732.
Hamilton, J.K. 1962. The Behaviour of Wood Carbohydrates inTechnical Pulping Processes. Pure and AppliedCheiu. 5 (1,2): 197—217.
Harris, G. 1965. Dictionary of Organic Chemistry. Vol. 1.Oxford University Press. p. 11.
Harris, J.F. 1975. Acid Hydrolysis and Dehydration Reactionsfor Utilizing Plant Carbohydrates. Applied PolymerSymp. No. 28: pp. 131—144.
Hasegawa, A. and H.G. Fletcher, Jr. 1973. The Behaviour ofSome Aldoses with 2,2-Dimethoxypropane-N,N-Dimethylformamide-p-Toluenesulphonic Acid. I. atRoom Temperature (25 0C). Carbohydr. Res. 29: 209—222.
Hasegawa, A. and I-t.G. Fletcher, Jr. 1973. The Behaviour ofSome Aldoses with 2,2-Dimethoxypropane-N,N—Dimethylformamide-p-Toluenesulphonic Acid. II. at80 °C. Carbohydr. Res. : 223-237.
Hermans, P.H. 1949. Physics and Chemistry of CelluloseFibers. Elsevier. N.Y. p 13.
Hilbert, G.E., O.R. Wulf, S.B. Hendricks and U. Liddel.1936. The Hydrogen Bond Between Oxygen Atoms inSome Organic Compounds. J. Am. Chein. Soc. 58: 548-555.
Hindeleh, A.M. and D.J. Johnson. 1978. Crystallinity andCrystallite Size Measurement in Polyamide andPolyester Fibres. Polymer. 19 (1): 27—32.

265
Hono, G. and M. 1958. Examination of Cellulose Fibre by theLow—Temperature Specimen Method of ElectronDiffraction and Electron Microscopy. Nature 181:326—328.
Hoshino, M., M. Takai, K. Fukuda, K. Imura and J. Hayashi.1989. C-13 NNR Study of Cellulose Derivatives inthe Solid State. J. Polym. Sci. Part A. Polym.Chem. 27: 2083—2092.
Hudson, Jr., R.E. and H.M. Waddle. 1948. The Sulphuric AcidSteep at Elevated Temperatures for Gray CottonFabrics. Text. Res. J. 18: 232—236.
Hurtubise, F.G. and H. Krassig. 1960. Classification of FineStructural Characteristics in Cellulose byInfrared Spectroscopy. Use of Potassium BromideTechnique. Anal. Chem. 32 (2): 177-181.
Ingruber, O.V. and M.J. Kocurek. 1970. Wood Pulping Process.Can. Patent 817, 837, July 15, 1969; also Processand Product, U.S. Pat. No. 3,525,667, Aug. 25,1970.
Ingruber, O.V. M.J. Kocurek and A. Wong. 1983. Pulp andPaper Manufacture. Vol. 4. Suiphite Science andTechnology, Joint Textbook Committee of the PaperIndustry, Montreal, Que., Canada. pp. 213-243.
Isaacs, N.S. 1974. Reactive Intermediates in OrganicChemistry. John Wiley and Sons, Ltd., Toronto. pp.1—83.
Jayme, G. 1938. Refining of Pulp in the Light of PatentLiterature. Paper Trade J. 106 (21): 37—42.
Jeffrey, G.A. and W. Saenger. 1991. Hydrogen Bonding inBiological Structures. Springer-Verlag, N.Y.
Joesten, M.D. and L.J. Schaad. 1974. Hydrogen Bonding.Dekker, N.Y.
Kennedy, J.F. 1985. Cellulose and Its Derivatives:Chemistry, Biochemistry, and Applications. pp. 3—25. (Hayashi, Chapter 1). Haisted Press. E.Horwood. N.Y.
Khan, R. and K.S. Mufti. 1975. synthesis and Reactions of1,2-4, 6-di-O-isopropylidene Sucrose. Carbohydr.Res. 43: 247—253.

266
Kiso, N. and A. Hasegawa. 1976. Acetonation of Some Pentoseswith 2, 2-Dimethoxypropane-N,N-Dimethylformamide-p-Toluenesulphonic Acid. Carbohydr. Res. 52: 95—101.
Kleinert, T.N. and P. Wrum. 1956. Alkali Solubility ofAkali—Cellulose. Pt. I and Pt. II. Tappi 39 (11):807—819.
Konkin, AA. and E.A. Shukalova. 1959. Zhur. Prikiad. Rhim.32 (5): 1076—1080.
Kortum, G. 1972. Lehrbuch der Electrochemie. 5th Ed. VerlagSchema, Weinheim.
Kulshreshtha, A.K. and N.E. Dweltz. 1973. ParacrystallineLattice Disorder in Cellulose. I. Reappraisal ofthe Application of the Two-Phase Hypothesis to theAnalysis of X—ray Diffractograms of Native andHydrolyzed Cellulosic Materials. J. Polym. Sci.11: 487—497.
Lal, G. 1974. Phase Transformations in Cotton Celluloseduring Mercerization. Text. Res. J. 44: 313—314.
Latiiuer, W.M. and W.H. Rodebush. 1920. Polarity andIonization from the Standpoint of the Lewis Theoryof Valence. J. Am. Chem. Soc. 42: 1419—1433.
Lemieux, R.U. and A.A. Pavia. 1968. Correlation of SpecificRotation with Conformation. A New Approach to theStudy of Conformational Equilibria. Can. J. Chem.46: 1453—1455.
Lemjeux, R.U. and A.A. Pavia. 1969. Substitutional andSolvation Effects on Conformational Equilibria.Effects on the Interaction between Opposing AxialOxygen Atoms. Can. J. Chem. 47: 4441-4446.
Liang, C.Y. and R.H. Marchessault. 1959. Infrared Spectra ofCrystalline Polysaccharides. I. Hydrogen Bonds inNative Celluloses. J. Polym. Sci. 37: 385—395.
Liang, C.Y. and Marchessault. 1959. Infrared Spectra ofCrystalline Polysaccharides. II. Native Cellulosesin the Region from 640 to 1700 cm—i. J. Polym.Sci. 39: 269—278.
Libby, C.E. 1962. Pulp and Paper Science and Technology.Vol. I. Pulp, Textbook Committee of the PaperIndustry, McGraw-Hill Book Co. N.Y. 403-423.(Gallay W. Chapter 17).

267
Lindstrom, T. and G. Carisson. 1982. The Effect of ChemicalEnvironment on Fibre Swelling. Svensk Paperstidn.85 (3): R14—R20.
Ludwig, M. and D. Fengel. 1990. Untersuchungen zur Strukturvon Cellulosederivaten. Papier 44: 661—667.
Mann, J., L. Roldan-Gonzalez and H.J. Wellard. 1960.Crystalline Modifications of Cellulose. Pt IV.Determination of X-ray Intensity Data. J. Polym.Sci. 42: 165—171.
March, J. 1985. Advanced Chemistry. John Wiley and Sons,Inc.
Marchessault, R.H. 1962. Application of InfraredSpectroscopy to Cellulose and WoodPolysaccharides. Pure Appi. Chein. 5: 107—129.
Marchessault, R.H. and C.Y. Liang. 1960. Infrared Spectra ofCrystalline Polysaccharides. III. MercerizedCellulose. J. Polym. Sci. 43: 71—81.
Meyer, K.H. and L. Misch. 1937. Positions des Atomes Dans leNouveau Modele Spatial de la Cellulose. Helv.Chim. Acta. 20: 232—244.
Meyer, K.H. 1942.Natural and Synthetic High Polymers.Interscience Publishers. N.Y.
Mikulenka, J. 1989. Pulp and Paper. 1989. North AmericanFactbook. Miller Freeman Publ. Inc., SanFrancisco, Ca. 94105, 273—297.
Mills, J.A. 1955. The Stereochemistry of Cyclic Derivativesof Carbohydrates. Adv. Carbohydrate Chem. 10: 1-53.
Mortimer, C.E. 1971. Chemistry - A Conceptual Approach. D.Van Nostrand Co. N.Y. pp. 262-267.
Morud, B. 1958. Studies on the Chemistry of SulphiteCooking. Ph.D. Thesis. Trondheim, N.T.H.
Nelson, M.L. and R.T. O’Connor. 1964. Relation of CertainInfrared Bands to Cellulose Crystallinity andCrystal Lattice Type. Pt. I. Spectra of LatticeTypes I, II, III and of Amophous Cellulose. J.Appl. Polym. Sci. 8: 1311—1324.
Nishimura, H. and A. Sarko. 1987. Mercerization ofCellulose. III. Changes in Crystallite Sizes. J.Appl. Polyin. Sci. 33: 855—866.

268
Nissan, A.H. 1977. Pulp and Paper Technology Series. No. 4.Lectures on Fiber Science in Paper, Joint TextbookCommittee of the Paper Industry.
O’Connor, R.T., E.F. DuPre and E.R. McCall. 1958.Applications of Infrared Absorption Spectroscopyto Investigations of Cotton and Modified Cottons.Pt I: Physical and Crystalline Modifications andOxidation. Text. Res. J. 28: 382—392.
Ohie, H. 1922. Zur Konstitution des Vaccinias. Biochem.Zeit. pp. 611—613.
Parker, A.J. 1962. The Effects of Solution on the Propertiesof Anions in Dipolar Aprotic Solvents. Chem. Soc.Quart. Rev. 16: 163—187.
Paszner, L. and P.C. Chang. 1981. Organosolv Delignificationand Saccharification Process for LignocellulosicPlant Materials. Canadian Patent No. 1100266.
Paszner, L. and P.C. Chang. 1983. Organosolv Delignificationand Saccharification Process for LignocellulosicPlant Materials. U.S. Patent No. 4409032.
Paszner, L. and P.C. Chang. 1986. High-Efficiency OrganosolvSaccharification Process. Canadian Patent No.1201115.
Paszner, L. and H.J. Cho. 1988. High Efficiency Conversionof Lignocellulosics to Sugars for Liquid FuelProduction by the ACOS Process. Ener. Exploit, andExplor., Multi—Sc. Pubi. Co. Ltd., pp. 39—60.
Petitpas, G. 1948. Reaction of Cellulose with Alkalies, Mem.Services Chim. Etat (Paris), 34: 125—137.
Petitpas, G. and T. Petitpas. 1950. The reversibility ofSwelling of Cellulose in Sodium HydroxideSolution, Mem. Services Chim. Etat (Paris) 35: 7—12.
Petitpas, T., M. Oberlin and J. Nering. 1956. Structure ofCellulose II (Mercerized). Ibid. pp. 73-77.
Pigman, W.W. and R.M. Goepp, Jr. 1948. Chemistry of theCarbohydrates. Academic Press Inc., Publishers.N.Y. pp. 607—614.
Quinde, A.A. 1990. Behaviour of Croton Draconoides and PinusElliottii Wood Extractives in Organosolv Pulping.Ph.D. Thesis. Univ. of British Columbia,Vancouver, B.C.
269
Rantanen, T., P. Farm and J. Sundquist. 1986. The Use of GPCin Testing Dissolving Pulp and Viscose Fiber.Paperi ja Puu - Papper och Tra. 9: 634-641.
Rees, D.A. 1977. Polysaccharides Shapes. Outline Studies inBiology. Chapman and Hall. London.
Reichardt, C. 1988. Solvents and Solvent Effects in OrganicChemistry. Weinheim; Basel (Schweiz), VCH Pubi.,N.Y.
Richter, G.A. 1940. Purified Wood Cellulose. md. Eng. Chem.32: 324—328.
Richter, G.A. 1956. Some Questions Concerning Compositionand Behaviour of Dissolving Type Celluloses. Tappi39 (9): 669—672.
Rotluff, W. 1989. Sources of Dioxins and Furans in BritishColumbia, Priprints 1989 Spring Conference.Technical Section . Canadian Pulp and PaperAssociation. Whistler, B.C.
Rozmarin, GH., V. Ungureanu and A. Stoleru. 1977. A Study onthe Supramolecular Structure of Cellulose Carriedout by Means of Acid Hydrolysis. Cellulose Chem.Technol. 11: 523—530.
Rydhoim, S. 1965. Pulping Processes. Interscience Publ.,John Wiley and Sons Inc., N.Y.
Saenger, W. 1979. Circular Hydrogen Bonds. Nature 279: 343-344.
Saito, H., R. Tabeta and T. Harada. 1981. High Resolution C-13 NNR Study of (1-3)-f3-D-Glucans by CrossPolarization/Magic Angle Spinning: Evidence ofConformational Heterogeneity. Chem. Lett. :57 1574.
Sajto, A. and Tabeta. 1981. C-13 Chemical Shifts of Solid(1—4)-cx-D-Glucans by Cross Polarization MagicAngle Spinning (CP/MAS) NMR Spectroscopy. Chem.Lett.: 713—716.
Sarko, A. 1978. What is the Crystalline Structure ofCellulose? Tappi 61 (2): 59—61.
-
Sarko, A. and R. Muggli. 1973. Packing Analysis ofCarbohydrates and Polysaccharides. III. ValoniaCellulose and Cellulose II. Macromolecules 7 (4):486—494.

270
Schemer, S. and E.A. Hillenbrand. 1985. Comparison betweenProton Transfers Involving Carbonyl and HydroxylOxygens. J. Phys. Chem. 89: 3053-3060.
Schempp, W. 1971. Bericht uber das Rundgespach fur CelluloseChemiker zum Thema. “Analytic der Cellulose”. 28.Juni, 1971, Baden—Baden. Das Papier 25 (12): 829—833.
Schroeder, L.R. and F.C. Haigh. 1979. Cellulose and WoodPulp Polysaccharides Gel PermeationChromatographic Analysis. Tappi 62 (10): 103—105.
Schwantes, T.A. and T.J. McDonough. 1994. Molecular WeightDistributions of Effluents from Chlorine DioxideDelignification. 1994 Tappi Pulping ConferenceProceedings. San Diego, Ca Nov. 6-10. Vol. 3, p.1039.
Segal, L., J.J. Creely, A.E. Martin, Jr. and C.M. Conrad.1959. An Empirical Method for Estimating theDegree of Crystallinity of Native Cellulose Usingthe X—ray Diffractometer. Textile Res. J. 29: 786—794.
Shallenberger, R.S. and G.G. Birch. 1975. Sugar Chemistry.The AVI Pubi. Co., Inc. Westport, Connecticut. p74.
Simmering, H. 1964. Proton States in Chemistry. Angew.Chem., Engl. Ed. 3: 157—164.
Simmonds, F.A., R.M. Kingsbury, J.S. Martin and E.L. Keller.1953. Purified Hardwood Puips for ChemicalConversion. Tappi 36 (3): 103—110.
Sjolander, N.O., A.F. Langlykken and W.H. Peterson. 1938.Butyl Alcohol Fermentation of Wood Sugars. _Ind.Eng. Chem. 30: 1251—1255.
Stanek, J., M. Cerny, J. Kocourek and J. Pacak. 1963. TheMonosaccharides. Academic Press. N.Y. pp. 325—357.
Stoddart, J.F. 1971. Stereochemistry of Carbohydrates.Wiley—Interscience. N.Y.
Suleman, Y.H. and R.A. Young. 1988. Characterization ofCellulose Degradation under LiquefactionConditions. Cellulose Chem. Technol. 22: 3—16.
Sutherland, G.B.B.M. 1950. Some Problems in theInterpretation of the Infrared Spectra of LargeMolecules. Discussions Faraday Soc. 9: 247—281.
271
Taft, R.W. and M.J. Kamlet. 1976. The SolvatochromicComparison Method. 2 The x-Scale of SolventHydrogen Bond Donor (HBD) Acidities. J. Am. Chem.Soc. 98: 377, 2886—2894.
T.A.P.P.I. 1974. Alpha—, Beta-, and Gamma-Cellulose in Pulp.T 203 os-74. TAPPI Standard, Tech. Assoc. PulpPaper Industry. N.Y.
T.A.P.P.I. 1976. Alcohol-Benzene and DichioromethaneSolubles in Wood and Pulp. T 204 os-76. TAPPIStandard. Tech. Assoc. Pulp Paper Industry. N.Y.
T.A.P.P.I. 1976. Basic Density and Moisture Content ofPulpwood. T 258 os-76. TAPPI Standard. Tech.Assoc. Pulp Paper Industry. N.Y.
T.A.P.P.I. 1976. Viscosity of Pulp (capillary viscometermethod). T 230 os-76. TAPPI Standard. Tech. Assoc.Pulp Paper Industry. N.Y.
Tchoubar, B. 1966. Reaction Mechanisms in Organic Chemistry.American Elsevier Pubi. Co. Inc., N.Y.
Timell, T.E. 1965. Cellulose from Wood. Methods Carbohydr.Chem. 5: 100—103.
Tomori, E., J. Kuszmann and Gy. Horvath. 1984. Capillary GasChromatography of Isopropylidene Derivatives of DGlucitol: Correlation between Structure andRetention. J. Chromatogr. 286: 381-394.
Tomori, E. and J. Kuszmann. 1984. The Acetalation of DMannitol, Pt. IV. Capillary Gas Chromatography ofD—Mannitol Acetals. Correlation between Structureand Retention. J. Chromatogr. 299 (1): 87—96.
Ueno, Y., K. Hori, R. Yamauchi, M. Kiso, A. Hasegawa and K.Kato. 1981. Reaction of Some D—Glucobioses with2, 2—Dimethoxypropane. Carbohydr. Res. 96: 65-72.
Valtasaari, L. and K. Saarela. 1975. Determination of ChainLength Distribution of Cellulose by Gel PermeationChromatography using the TricarbanilateDerivative. Papri ja Puu 57: 5-10.
Vinogradov, S.N. and R.H. Linnel. 1971. The Hydrogen Bond.Van Norstrand - Reinhold. N.Y.
Viswanathan, A. 1966. The E1usive” Degree of Crystallinityin Cellulosic Fibers. Text. Res. J. 36: 387-388.

272
Viswanathan, A. 1967. Fiber Structures: A Fresh Look fromMetallography. J. Appl. Polym. Sci. 11: 1027—1032.
Waggoner, J.R. and L.M. Mukherjee. 1982. Proton MediumEffects in 5-40 wt % Acetone-Water Mixtures. AnInvestigation Using the Ferrocene Assumption. J.Phys. Chem. 86: 3852—3855.
Ward, J.P. and H. Grethlein. 1988. Enhanced Hydrolysis ofWood in an Acetone and Acid Aqueous System.Biomass 17: 153—163.
Wellard,H.J. 1954. Variation in the Lattice Spacing ofCellulose. J. Polym. Sci. 13: 471—476.
Wenzl, H. 1970. Chemical Technology of Wood. Academic Press.p 399.
Werner, A. 1903. Die Ammoniumsaize als einfachste Metall —
Ammoniake. Ber. 36 (1): 147—159.
Wiggins, L.F. 1946. The Acetone Derivatives of HexahydricAlcohols. Part I. Triacetone Mannitol and itsConvesion into D—Arabinose. J. Chem. Soc. pp. 13—14.
Wims, A.M., M.E. Myers Jr., J.L. Johnson and J.M. Carter.1986. Computer Capability for the Determination ofPolymer Crystallinity by X-ray Diffraction. Adv.X—ray Anal. 29: 281—290.
Wise, L.E. and E.C. Jahn. 1952. Wood Chemistry, 2nd Ed.,Vol. 2. Reinhold Pubi. p 873.
Woifrom, M.L., A.B. Diwadkar, J. Gelas and D. Horton. 1974.A New Method of Acetonation. Synthesis of 4,6-0-Isopropylidene-D-Glucopyranose. Carbohydr. Res.35: 87—96.
Wong, K.K.Y., K.F. Deverell, K.L. Mackie, T.A. Clark andL.A. Donaldson. 1988. The Relationship betweenFibre Porosity and Cellulose Digestibility inSteam-Exploded Pinus Radiata. Biotechnol. Bioeng.31: 447—456.
Yorston, F.H. 1942. Studies in Suiphite Pulping. DominionForest Service Bulletin (Ottawa, Canada) 97. pp.20—29.
Zarubin, M.Ya., I.P. Dejneko, D.V. Evtuguine and A. Robert.1989. Delignification by Oxygen in Acetone-WaterMedia. Tappi 72 (11): 163—168.