
Incorporation of Cellulose Nanocrystals into Polymers and ...
214
Nanocomposites: Incorporation of Cellulose Nanocrystals into Polymers and Addition of Zwitterionic Functionality Keith Doubrava Hendren Dissertation submitted to the faculty of the Virginia Polytechnic Institute and State University in partial fulfillment of the requirements for the degree of Doctor of Philosophy In Material Science and Engineering E. Johan Foster, Chair Paul A. Deck, Co-Chair Kevin J. Edgar Michael J. Bortner Travis W. Baughman Michael O. Hunt 3-18-2020 Blacksburg Virginia Keywords: Composite, Catalyst, Polyethylene, Cellulose Nanocrystal, Norbornene, Surface Modification Copyright 2020
-
Upload
khangminh22 -
Category
Documents
-
view
3 -
download
0
Transcript of Incorporation of Cellulose Nanocrystals into Polymers and ...

Nanocomposites: Incorporation of Cellulose Nanocrystals into Polymers and Addition of
Zwitterionic Functionality
Keith Doubrava Hendren
Dissertation submitted to the faculty of the Virginia Polytechnic Institute and State
University in partial fulfillment of the requirements for the degree of
Doctor of Philosophy
In
Material Science and Engineering
E. Johan Foster, Chair
Paul A. Deck, Co-Chair
Kevin J. Edgar
Michael J. Bortner
Travis W. Baughman
Michael O. Hunt
3-18-2020
Blacksburg Virginia
Keywords: Composite, Catalyst, Polyethylene, Cellulose Nanocrystal, Norbornene,
Surface Modification
Copyright 2020

Nanocomposites: Incorporation of Cellulose Nanocrystals into Polymers and Addition of
Zwitterionic Functionality
Keith Doubrava Hendren
ACADEMIC ABSTRACT
Cellulose nanocrystals (CNCs) are nanomaterials that have shown promise as
reinforcement filler materials. Their small size, high modulus, and high aspect ratio makes
CNCs good reinforcing materials. CNCs are typically introduced into softer polymer
materials, which can have incompatible surface chemistry such as aliphatic chains, leading
to aggregation and poor reinforcement of the material. The intrinsic hydrophobicity of the
CNC surfaces suggests that dispersal into hydrophobic polymer matrices, which the CNCs
could potentially reinforce, represent a significant challenge. Therefore, new non-
traditional strategies are needed to introduce CNCs into polymer materials. The hydroxyl
groups on the surfaces of CNCs can be functionalized using a variety of chemical
techniques to yield materials that can interact better with solvents or polymers.
Additionally, surface groups can allow the CNCs to react with environmental stimuli
(smart materials).
The primary focus of this work is the incorporation of CNCs in hydrophobic
matrices. Herein we introduce a new method of dispersing CNCs in polyethylene (PE), a
substance of legendary hydrophobicity that is also the most common synthetic polymer
used in consumer packaging. The prospect of increasing the mechanical strength of PE by
incorporating CNC materials as fillers may lead to the possibility of using less polymer to
obtain the same strength.

This thesis approaches the problem of dispersing CNCs within PE by first
functionalizing the CNCs with a catalyst capable of polymerizing ethylene and other α-
olefins. The catalyst 1,1’-bis(bromodimethylsilyl)zirconocene dibromide (catalyst 1) is
equipped with anchoring groups that are capable of attachment to the surface hydroxyl
groups of CNC particles. After immobilizing catalyst 1 onto various CNC samples,
introduction of solvent, organoaluminum cocatalyst, and monomer (ethylene alone or
ethylene plus 1-hexene) afforded high density polyethylene (HDPE) and linear low-density
polyethylene (LLDPE) samples, respectively, containing well-dispersed CNCs as filler
materials.
Chapter 2 provided important information on the attachment of catalyst 1 to
cellulose nanocrystals and the successful polymerization of ethylene from the cellulose
nanocrystals. The resulting composite materials showed a in Young’s modulus that was
three-fold that of PE samples we tested (1600 ± 100 vs 500 ± 30) and about 10% greater
relative to a commercial high modulus PE sample (1450 MPa). The increase in Young’s
modulus along with the lack of macroscopic aggregates led to the conclusion that we have
developed a viable method to disperse CNCs in polyolefin matrices.
Chapter 3 focused on the dispersal of CNCs in a softer, more pliable polyethylene
grade known as linear low-density polyethylene (LLDPE). LLDPE incorporates a small
fraction of 1-hexene into polyethylene as a randomly inserted comonomer, giving rise to
properties suitable for applications in plastic films and bags among other end uses. Catalyst
1 functionalized CNCs were added to a reaction vessel with both ethylene and 1-hexene to
afford LLDPE CNC composites. Different loading of catalyst 1 on CNC aerogels afforded
the same amount of catalyst in each reaction but allowed for different CNC loadings in

each reaction. The composite materials showed increasing Young’s modulus with
increasing cellulose nanocrystal content.
Chapter 4 describes how CNCs were functionalized with the intention of filling
reverse osmosis membrane materials to have surface chemistry that could be impart
antibacterial properties and increase flux. CNCs were functionalized with carboxylic acid
by 2,2,6,6-tetramethylpiperidin-1-yl)oxyl (TEMPO)-mediated oxidation, then amine
functionalization by carbodiimide coupling chemistry, and finally functionalized with a
zwitterionic group by β-propiolactone ring opening. Amine coupling was confirmed with
X-ray photoelectron spectroscopic analysis, and a second carboxylic acid peak was
confirmed using infrared spectroscopy. These results were further verified with
conductometric titration showing that after each respective reaction there were 1060 mmol
kg-1 of carboxylic acid groups, 520 mmol kg-1 of amine groups, and 240 mmol kg-1 of
zwitterionic groups. This CNC material was left to undergo future testing for desirable
membrane properties.
Chapter 5 assesses the possible value in creating a new composite material using a
functionalized polynorbornene, poly(5-triethoxysilyl-2-norbornene) (PTESN). The
composites were fabricated by using the solvent casting method, dispersing the CNCs in a
toluene solution of polymer and drying. The composite materials showed an increase in
Young’s modulus with increased loading. The 20 wt% CNC in PTESN had a Young’s
modulus of 970 MPa, a significant increase over the Young’s modulus of the polymer
lacking the filler (540 MPa).

In summary, this dissertation advances new techniques for the incorporation of
CNCs as fillers in polymer-based nanocomposites. We are confident that further
refinement and development of our results will find wide-ranging application. s

Nanocomposites: Incorporation of Cellulose Nanocrystals into Polymers and Addition of
Zwitterionic Functionality
Keith Doubrava Hendren
GENERAL AUDIENCE ABSTRACT:
Cellulose nanocrystals (CNCs) are materials that can be added to polymers to form
composite materials having increased stiffness. CNCs have the primary advantages over
other filler materials of providing significant reinforcement without changing the color or
increasing the density of the overall composite. CNCs are therefore good for designing
polymer composites that need to be lightweight and aesthetically pleasing. Packaging
materials (especially plastic bags and plastic films) are dominated by polyolefin materials
such as polyethylene, which is already lightweight and colorless. The challenge of mixing
polyethylene and CNCs is that their surface chemistry is incompatible, “like oil and water.”
To overcome the natural tendency for the CNC filler material to separate from the
surrounding polyethylene matrix, a catalyst was attached to the surface of the CNCs and
polymerization ensued from that catalyst leading to a composite material in which tiny
CNC particles were trapped in the matrix Good dispersal of the component substances in
the composite and of excellent overall reinforcement were proven by physical analysi
vii
Acknowledgements:
In this endeavor, I had assistance from many people who gave me good advice,
worked with me, or helped me with instrumentation. I would first acknowledge the efforts
of my dissertation committee, as they have continually reviewed my work, served as
resources of information and insight, and challenged me to grow as a scientist. With their
help I now have developed a better sense of experimental design, project management, data
analysis, critical reading of the literature, and communicating my work to peers and
superiors alike. Of course, my committee also helped me tremendously in the preparation
of this dissertation, which represents the culmination of several diverse, multidisciplinary
efforts.
I would like to acknowledge the contributions of Ethan Smith, Morgan Higgins,
Travis Baughman, Paul Deck, Kenneth Knott, Sarita Hough, Stephen Martin, Jacob Haag,
and Johan Foster to the research presented herein. Their helped ranged from oversight of
the research to substantive intellectual contributions to the many papers that will arise from
this work, to key technical contributions such as help with catalyst synthesis, physical
testing, etc. Their work in particular rises to the co-authorship level.
I am thankful for the time and expertise of the several individuals who either trained
me on equipment or gave me necessary advice on how to proceed with various instruments.
Thomas Staley and Carlos Suchicital maintained the material science and engineering
laboratories. Priya Venkatramen, Dana Kazarooni, Adwoa Baah-Dwomoh, Raffaella De
Vita, and Britannia Vondrasek helped me with tensile data. Charles Carfagna, Mark
Cashman, and Cameron Crowell helped me acquire differential scanning calorimetry
(DSC) data. I’m thankful for all of the help with advanced with XPS (Feng Xu), TEM

viii
(Chris Winkler), microtome (Ya-Peng Yu), AFM and SEM (Steve McCartney), and Joel
Serrano and Eric Gilmer (FTIR). I’m especially grateful to Wei Lu and Ilir Koliqi at
TOSOH for their expertise and help with GPC.
This dissertation was completed with much needed support from my parents,
siblings, and fiancé Caitlin. I would like to thank my friends at the Virginia Tech Bujinkan
Budo Taijutsu club for making my stay at Virginia Tech enjoyable especially Joel Serrano
and Brittany Bonnet.

ix
Table of Contents
1 Introduction 1
1.1 Polymer Nanocomposites and Mechanics 2
1.2 Cellulose Nanocrystals 7
1.3 Polyethylene 13
1.4 Desalination Membranes 20
1.5 Polynorbornenes 23
1.6 Scope and Objectives 26
References 27
2 In situ dispersion and polymerization of polyethylene cellulose
nanocrystal-based nanocomposites 33
2.1 Introduction 35
2.2 Results and Discussion 38
2.3 Conclusions 51
2.4 Experimental 52
References 60
2.5 Supporting Information 64
References 70
3 Linear low-density polyethylene cellulose nanocrystal composites from in-situ
polymerization mediated by an anchored metallocene catalyst 70
3.1 Introduction 73
3.2 Experimental 75
3.3 Results and Discussion 82

x
3.4 Conclusions 94
References 95
3.5 Supporting Information 98
References 103
4 Functionalization of cellulose nanocrystals for reverse osmosis applications
104
4.1 Introduction 105
4.2 Experimental 108
4.3 Results and Discussion 114
4.4 Conclusions 119
References 120
5 Cellulose nanocrystal-reinforced poly(5-triethoxysilyl-2-norbornene)
composites 122
5.1 Introduction 123
5.2 Results and Discussion 127
5.3 Experimental 133
5.4 Conclusions 136
References 137
5.5 Supporting Information 140
6 Conclusion and outlook 145
Appendix A 149
References 186
List of Figures:
xi
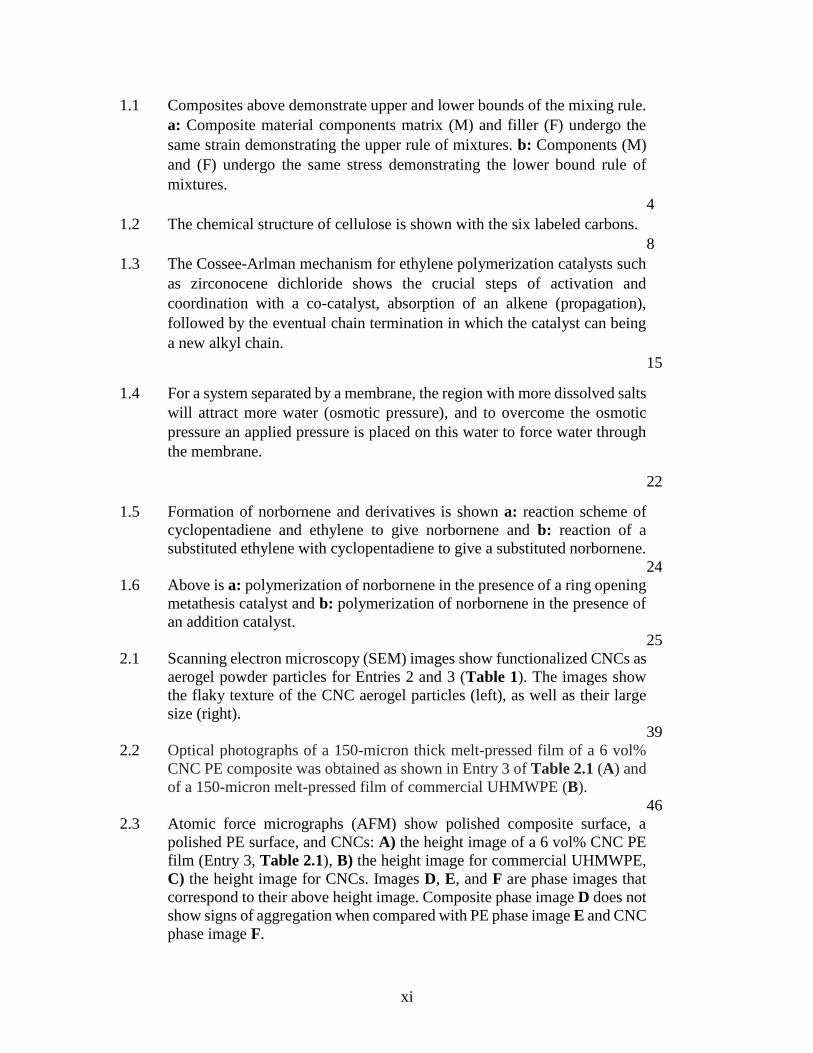
1.1 Composites above demonstrate upper and lower bounds of the mixing rule.
a: Composite material components matrix (M) and filler (F) undergo the
same strain demonstrating the upper rule of mixtures. b: Components (M)
and (F) undergo the same stress demonstrating the lower bound rule of
mixtures.
4
1.2 The chemical structure of cellulose is shown with the six labeled carbons.
8
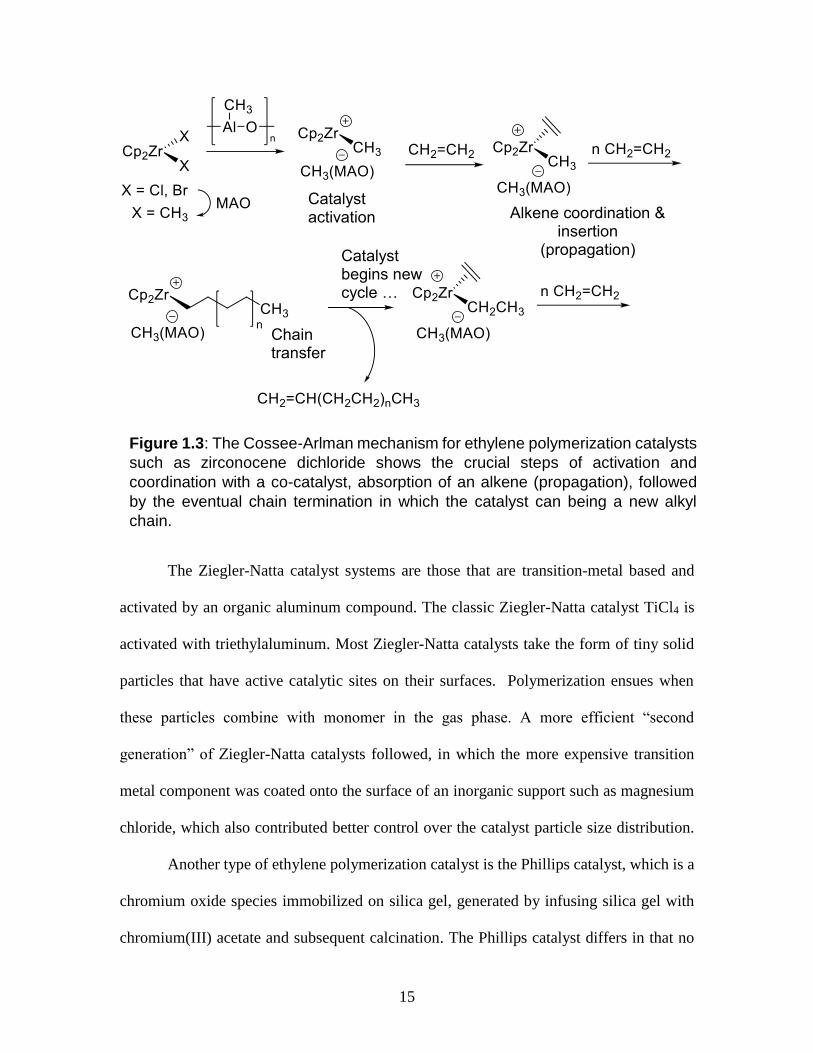
1.3 The Cossee-Arlman mechanism for ethylene polymerization catalysts such
as zirconocene dichloride shows the crucial steps of activation and
coordination with a co-catalyst, absorption of an alkene (propagation),
followed by the eventual chain termination in which the catalyst can being
a new alkyl chain.
15
1.4 For a system separated by a membrane, the region with more dissolved salts
will attract more water (osmotic pressure), and to overcome the osmotic
pressure an applied pressure is placed on this water to force water through
the membrane.
22
1.5 Formation of norbornene and derivatives is shown a: reaction scheme of
cyclopentadiene and ethylene to give norbornene and b: reaction of a
substituted ethylene with cyclopentadiene to give a substituted norbornene.
24
1.6 Above is a: polymerization of norbornene in the presence of a ring opening
metathesis catalyst and b: polymerization of norbornene in the presence of
an addition catalyst.
25
2.1 Scanning electron microscopy (SEM) images show functionalized CNCs as
aerogel powder particles for Entries 2 and 3 (Table 1). The images show
the flaky texture of the CNC aerogel particles (left), as well as their large
size (right).
39
2.2 Optical photographs of a 150-micron thick melt-pressed film of a 6 vol%
CNC PE composite was obtained as shown in Entry 3 of Table 2.1 (A) and
of a 150-micron melt-pressed film of commercial UHMWPE (B).
46
2.3 Atomic force micrographs (AFM) show polished composite surface, a
polished PE surface, and CNCs: A) the height image of a 6 vol% CNC PE
film (Entry 3, Table 2.1), B) the height image for commercial UHMWPE,
C) the height image for CNCs. Images D, E, and F are phase images that
correspond to their above height image. Composite phase image D does not
show signs of aggregation when compared with PE phase image E and CNC
phase image F.

xii
47
2.4 The graph shows temperature representative traces of sweeps conducted
from -150 °C to 160 °C on rectangular coupons at 1 Hz and an amplitude of
15 µm at 5 °C min-1 with the films of PE CNC composite 6 vol% (Entry
3, Table 2.1), PE CNC 7 vol% (Entry 2), GHDPE-1, GHDPE-2,
UHMWPE, and 7 vol % (Entry 5) were tested by DMA.
48
S2.1 XPS data for Entries 1-4 and 6 show the elemental composition of the
samples and verify that there is zirconium present on the surface of the
functionalized CNCs.
64
S2.2 These additional SEM images showed little evidence of aggregation and
dispersion. The SEM images above are of the crymicrotomed surface of
Entry 3 (Table 2.1) 6 vol% CNCs. A) An overall view of the
cryomicrotomed surface, B) the general surface of the polymer. C) A region
that shows potential dispersion of sharp spikes. Images D, E, and F show
thin spindles of fibrous materials that are likely too long to be CNCs within
the polymer.
65
S2.3 Shown above is the first heating on a DSC on CNC composite Entry 2, Entry
3, UHMWPE, GHDPE-1, and GHDPE-2 films (Table 2.1). The samples
were heated at 10 °C min-1. Melting points and crystallinity was measured
using TA Universal Analysis software.
66
S2.4 CNCs were measured using height and length to determine dimensions 90
± 40 nm in length and 7 ± 2 nm in height using Gwyddion scanning probe
microscopy software.
67
S2.5 Thermogravimetric analysis was performed on Entries 2, 3, 5, UHMWPE,
and CNCs (Table 2.1). To approximate the amount of CNCs in the sample,
equations assuming there was minimal CNC degradation in the flat areas
were used to approximate the amount of CNCs in Entries 2, 3, and 5 as a
volume fraction. The text v refers to volume fraction, m refers to mass
fraction, the subscripts, temperatures, refers to the mass at which the
temperature was taken, and 0.951 g∙cm-1and 1.62 g∙cm-1 are approximate
density values for polyethylene an CNCs respectively.
68
S2.6 Tensile data with representative curves of the samples is presented as the
full curves A and shorter curves that highlight yield strength and Young’s
Modulus B. GHDPE 1 and GHDPE 2 are differentiated with (GHDPE-
1) and (GHDPE-2).
69
3.1 (a) Thermograms of LLDPE-CNC polymer matrix composites (PMCs)
from four different C1-CNC catalyst loadings, commercial LLDPE, and
native CNC material, were used to estimate CNC incorporation in the PMC
samples. (b) DSC traces showing that the LLDPE matrix component of

xiii
CNC-LLDPE PMCs have comparable fractional crystallinity. (c) and (d)
DMA was data used to study the effect of CNC concentration on the storage
moduli of corresponding CNC-LLDPE PMCs. Relation of catalyst loading
to CNC content in PMCs is present on Table 3.3.
89
3.2 Tensile data Young’s modulus a and b elongation at break of C1-CNC
LLDPE PMCs were compared with tensile data from other studies. The
symbols are represented as C1-CNC PMCs , UPy modified CNC PMCs
Х,11 twin screw extruded (TSE) CNC PMCs ♦,16 TSE N,N -dialkyl-3-
methoxyazetidinium salt (S1) modified CNC PMCs ,16 and 1,1’-dihexyl-
3-methoxyazetidnium chloride (S2) modified CNC PMCs +.16
92
3.3 SEM micrographs were taken at 10 kX magnification and show dark
structures that are fanning outward highlighted in white circles. The images
correspond to: a 11.4 wt% CNC PMC, b 5.8 wt% CNC PMC, c 4.4 wt%
CNC PMC, and d 3.6 wt% CNC PMC. Scale bars are 1 µm.
94
S3.1 Images shown are films of each of the pressed CNC-LLDPE PMC resins.
The resins correspond to a 11.4 wt% CNC (2_600), b 5.8 wt% CNC
(4_600), c 4.4 wt% CNC (8_600), and d 3.6 wt% CNC (16_600). Each of
the images labeled with CNC content from TGA data and the C1-CNC
aerogel which they are made from.
98
S3.2 Spectra of 13
C NMR of each of the PMC samples were used to quantify the
mol% of 1-hexene within the LLDPE portion of each PMC scans for each
of the samples were PMC 2_600 (11.4 wt%) 3392 scans, PMC 4_600 (5.8
wt%) 16000, PMC 8_600 (4.4 wt% CNC) 6848, and PMC 16_600 (3.6 wt%
CNC) 14592.
99
S3.3 Above are representative stress-strain curves for the C1-CNC LLDPE
PMCs arranged by mass fraction of CNC. The curves are a, the full stress
strain curves and b, a truncated stress strain curves showing differences in
Young’s moduli.
100
S3.4 SEM Images of aerogels show flakey structure that was exhibited in all
samples. The Images were taken at 3-5 keV with the in-lens or secondary
electron detectors at 500x magnification. The scale bar is 100 µm.
101
4.1 The reaction scheme shows converting as received CNCs to TCNCs and
utilizes TEMPO and NaClO.
109
4.2 The reaction scheme shows converting TCNCs to ACNCs utilizing EDC
coupling and an amide linkage with 3-(dimethylamino)-1-propylamine.
111
4.3 The reaction scheme shows converting ACNCs to ZCNCs utilizing β-
propiolactone ring opening.

xiv
113
4.4 XPS high resolution spectra of ACNCs and ZCNCs show peaks at binding
energy ca. 400 peak and a peak at ca. 403.
116
4.5 FTIR spectra of TCNCs, ACNCs, and ZCNCs show is a notable
suppression of the carboxylic acid peak for ACNCs and ZCNCs at ca. 1600
cm-1 and ca. 1730 cm-1. The green line below the ZCNCs highlights the
carboxylic acid peak at ca. 1730 cm-1.
117
4.6 Conductometric titrations of CNCs (A), TCNCs (B), ACNCs (C), and
ZCNCs (D) show the conductivity of the solution as NaOH is added. The
light blue region (♦) represent the acidic region where HCl is present, the
dark blue region () represents the flat region of the curve and the number
of acidic groups on the CNCs, and the green region represents the
alkaline region of the curve, where NaOH is present.
119
5.1 Vinyl-addition reaction scheme shows PTESN synthesis with the catalyst
trans-[Ni(C6F5)2(SbPh3)2].
124
5.2 Optical photographs are arranged in order of increasing CNC content: 5.2a
PTESN, 5.2b 1-CNC-PTESN, 5.2c 5-CNC-PTESN, 5.2d 10-CNC-PTESN,
5.2e 15-CNC-PTESN, and 5.2f 20-CNC-PTESN.
124
5.3 SEM micrographs are arranged in order of increasing CNC content. 5.3a
PTESN, 5.3b 1-CNC-PTESN, and 5.3c 5-CNC-PTESN, 5.3d 10-CNC-
PTESN, 5.3e 15-CNC-PTESN, and 5.3f 20-CNC-PTESN. All scale bars are
1 µm.
126
5.4 TEM images of 20-CNC-PTESN show occasional nanoscale aggregation of
CNCs in PTESN composite films. The findings of occasional minor
aggregation from images 5.4a and 5.4b suggest good dispersion.
127
5.5 PTESN CNC composites were tested with dynamic mechanical analysis
(DMA) and tensile testing. Reinforcement from increased stiffness (E’ and
E) is presented on bar graph 5.5a and DMA traces show the increase in
storage modulus (E’) with increasing CNC content 5.5b.
129
5.6 Thermogravimetric analysis of neat CNCs, 10-CNC-PTESN, 20-CNC-
PTESN, and PTESN show that the CNCs have increased thermal stability
when combined with PTESN. The 5 wt% loss for neat CNCs is ca. 278 °C,
10-CNC-PTESN is ca. 295 °C, and 20-CNC-PTESN is ca. 283 °C, and
PTESN is 354 °C.
130
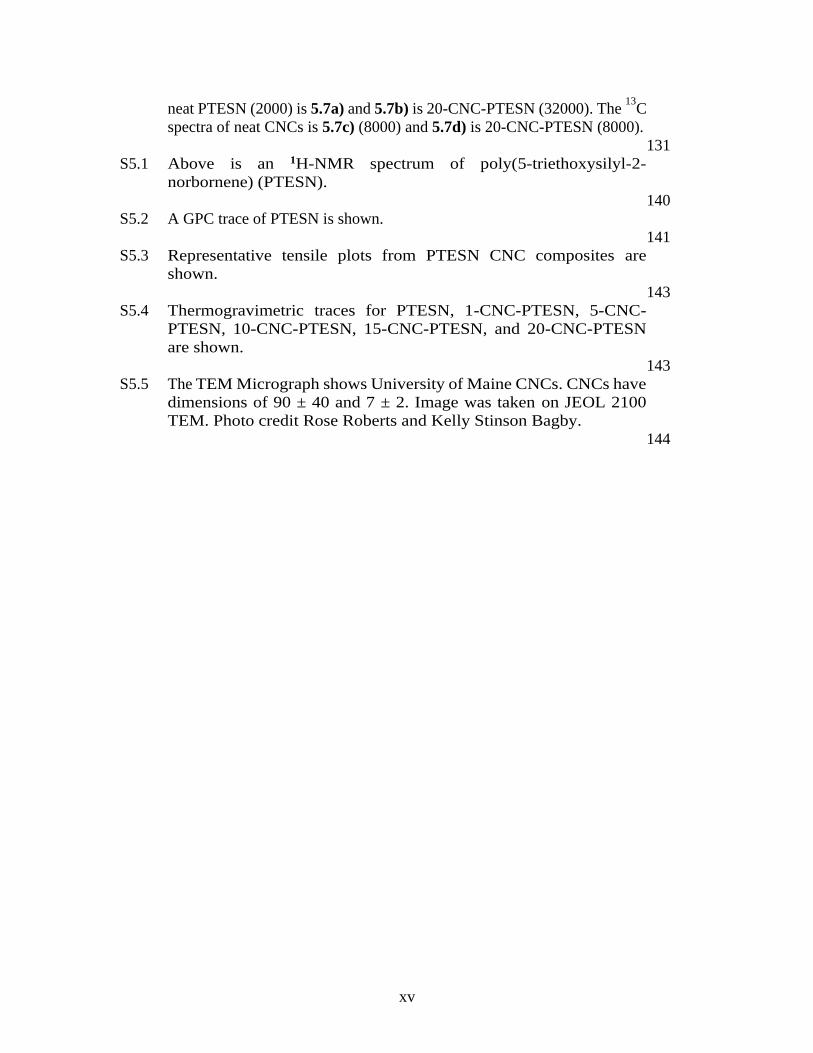
5.7 Solid-State NMR spectra of PTESN and 20-CNC-PTESN are shown with
the number of scans noted in parenthesis. The 29
Si NMR spectra for 5.7a)
xv
neat PTESN (2000) is 5.7a) and 5.7b) is 20-CNC-PTESN (32000). The 13
C
spectra of neat CNCs is 5.7c) (8000) and 5.7d) is 20-CNC-PTESN (8000).
131
S5.1 Above is an 1H-NMR spectrum of poly(5-triethoxysilyl-2-
norbornene) (PTESN).
140
S5.2 A GPC trace of PTESN is shown.
141
S5.3 Representative tensile plots from PTESN CNC composites are
shown.
143
S5.4 Thermogravimetric traces for PTESN, 1-CNC-PTESN, 5-CNC-
PTESN, 10-CNC-PTESN, 15-CNC-PTESN, and 20-CNC-PTESN
are shown.
143
S5.5 The TEM Micrograph shows University of Maine CNCs. CNCs have
dimensions of 90 ± 40 and 7 ± 2. Image was taken on JEOL 2100
TEM. Photo credit Rose Roberts and Kelly Stinson Bagby.
144

xvi
List of Schemes:
2.1 The proposed reaction for bromodimethylsilyl-functionalized zirconocene
dibromide catalyst 1 with cellulose nanocrystals (CNC)s is shown.
Substitution of the reactive Si-Br bonds results in formation of strong
silyloxy linkages to the CNC. 38
2.2 These proposed reactions lead to the robust adsorption of catalyst 1 on CNC
surfaces.28-29 (a) Functionalized metallocene dibromide (catalyst 1) and the
putative, hydroxylated CNC surface; (b) “face-up” metallocene dibromide
bound to the CNC surface through two covalent silyloxy linkages; (c)
alumoxane-activated, surface-tethered metallocene; (d) and (e) partially
hydrolyzed, surface-tethered metallocenes; (f) “face-down” metallocene
bound to the CNC surface through two silyloxy linkages and a Zr–O
linkage; Structures (d) – (f) are proposed to account for Br:Zr ratios less
than 2:1 observed by XPS. We propose that structures such as (d) – (e), if
they are formed, are reactivated upon treatment with excess alumoxane to
generate the activated structure (c).
43
3.1 a The attachment of the anchoring catalyst 1,1’-bis
(bromodimethylsilyl)zirconocene dibromide (catalyst 1) to the CNC was
carried out under anhydrous conditions. b Catalyst 1 anchored on CNCs
was activated by MMAO-12 and then ethylene and 1-hexene were added to
initiate polymerization.
83

xvii
List of Tables:
2.1 Studies of PE polymerizations of catalyst supported on CNCs were
activated with a 1100:1 Al:Zr ratio, catalyst loading of 1.3 wt%, washed by
centrifuge, and polymerized at 25 °C under 1 atm of ethylene for 0.5 h. The
differences in polymerization conditions for each sample are noted below
the table as superscripts, and information concerning TGA can be found in
the supporting information.
44
2.2 Physical properties below for UHMWPE, GHDPE-1, GHDPE-2, and 7
vol% CNC in PE were determined experimentally and values HDPE 1 and
HDPE 2 were taken from indicated sources.
49
3.1 Catalyst 1 functionalized CNC aerogels (C1-CNCs) were developed by
adding catalyst 1 to a CNC aerogel.
79
3.2 The above table shows the mass of each of the C1-CNC aerogels that were
added to the reactor so that 0.67 mg of catalyst 1 was added to each reaction,
the total mass of the PMC from the reactor (resin), and the resulting activity
of the catalyst from each of the olefin polymerizations.
84
3.3 The table denotes CNC content of PMCs, crystallinity of LLDPE portion of
PMCs, peak melting point of PMCs, and 1-hexene content of PMCs.
88
3.4 This table shows the Mw, the number average Mn, and the PDI for each of
the polymer samples. Subsequent runs of each sample had variability of less
than 1%. 88
S3.1 This table shows tensile data from CNC-LLDPE PMCs from C1-CNCs and
those available from literature. S1-CNCs are functionalized with N,N-
dialkyl-3-methoxyazetidinium salt and S2-CNCs are functionalized with
1,1’-dihexyl-3-methoxyazetidniumchloride salt.
102
S5.1 DMA data of PTESN CNC composites at select temperatures is below.
142
S5.2 Tensile data of PTESN CNC composites is denoted below.
142

xviii
Abbreviations and acronyms:
ACNC tertiary amine functionalized CNC
AFM atomic force microscopy
catalyst 1 1,1’-bis(bromodimethylsilyl)zirconocene
CNC cellulose nanocrystals
CNF cellulose nanofibril
CNT carbon nanotube
DMA dynamic mechanical analysis
DMAP 4-dimethyl amino pyridine
DMF N,N-dimethylformamide
EDC 1-ethyl-3-(3-dimethylaminopropyl)carbodiimide
EtOAc Ethyl acetate
FTIR Fourier transform infrared spectroscopy
GHDPE high-density polyethylene from Goodfellow
HCl hydrochloric acid
HDPE high density polyethylene
LDPE low density polyethylene
LLDPE linear low-density polyethylene
MAO methylalumoxane
MMAO-12 modified methylalumoxane
Mn number average molecular weight
Mw weight average molecular weight
NMR nuclear magnetic resonance spectroscopy
PDI polydispersity index
PE Polyethylene
PMC polymer matrix composite
RO reverse osmosis
ROMP ring opening metathesis polymerization
SEM scanning electron microscopy
TEM transmission electron microscopy
TEMPO 2,2,6,6-tetramethylpiperidin-1-yl)oxyl
THF tetrahydrofuran
UHMWPE ultra-high molecular weight polyethylene
UPy ureido-4[1H]pyrimidinone
vol% volume percentage
wt% weight percentage
XPS X-ray photoelectron spectroscopy
ZCNC zwitterion functionalized cellulose nanocrystal
ZCNT zwitterion functionalized carbon nanotube

1
Chapter 1: Introduction
The introduction provides information in the form of short overviews about subjects
that are covered later chapters of this thesis, to serve as a backdrop to understand the state
of current technologies.
2
1.1 Polymer Nanocomposites and Mechanics:
Polymer nanocomposites are functional unions of polymers and nanoscale filler
materials. Polymers are a material class with a very broad range of properties and are
produced both in biological and synthetic processes. Nanomaterials are most broadly
defined as materials that have at least one dimension less than 100 nm,1 and they are
commonly thought of as the bridge between molecular and macroscopic materials.
Nanofiller materials come in a wide variety of shapes: rods, sheets, plates, and
spheres. Inorganic nanofillers include clay, exfoliated silica,1 and the carbon-based
nanoparticles graphene, carbon nanotubes (CNTs), and carbon black. Biologically-based
filler particles include cellulose nanofibrils (CNFs), cellulose nanocrystals (CNCs),
bacterial cellulose, and chitin nanocrystals.
Polymer nanocomposites comprise a continuous phase of matrix polymer and a
nanoparticle filler. The filler material often enhances or adds a property to the continuous
matrix polymer. The most common property targeted is reinforcement of the matrix
material, which leads to an increase in the stiffness or modulus of the material. Other
targeted properties are typically filler-specific. Some examples include silver nanoparticles
which may add antibacterial properties, carbon-based filler which may add electrical
conductivity, and silica-based clay nanomaterials may improve barrier properties.
The reinforcement of materials by nanofillers has been termed a “nano effect.”
Some studies have stated that adding nanofiller materials reinforce beyond what composite
theory for macroscopic particles would predict. These claims have been met with
resistance, but nanofillers persist as they are able to reinforce in many planes and may
3
reinforce without having much of an aesthetic downside, such as a minimally affected
surface finish.1
Examining nanoparticle reinforcement with traditional composite theory, for ideal
situations the two components of the composite material act as continuous phases. When
both continuous phases undergo the same strain, a larger amount of stress is placed on
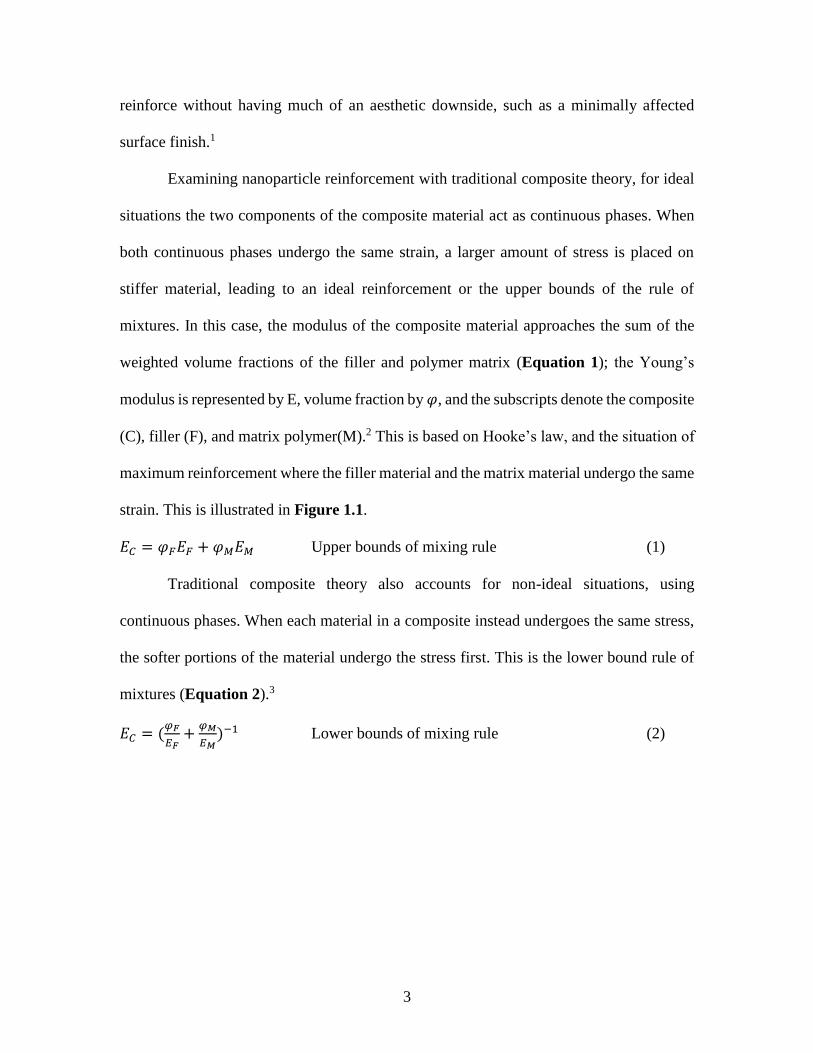
stiffer material, leading to an ideal reinforcement or the upper bounds of the rule of
mixtures. In this case, the modulus of the composite material approaches the sum of the
weighted volume fractions of the filler and polymer matrix (Equation 1); the Young’s
modulus is represented by E, volume fraction by 𝜑, and the subscripts denote the composite
(C), filler (F), and matrix polymer(M).2 This is based on Hooke’s law, and the situation of
maximum reinforcement where the filler material and the matrix material undergo the same
strain. This is illustrated in Figure 1.1.
𝐸𝐶 = 𝜑𝐹𝐸𝐹 + 𝜑𝑀𝐸𝑀 Upper bounds of mixing rule (1)
Traditional composite theory also accounts for non-ideal situations, using
continuous phases. When each material in a composite instead undergoes the same stress,
the softer portions of the material undergo the stress first. This is the lower bound rule of
mixtures (Equation 2).3
𝐸𝐶 = (𝜑𝐹
𝐸𝐹+
𝜑𝑀
𝐸𝑀)−1 Lower bounds of mixing rule (2)

4
The traditional composite models are made for continuous phases of materials. To
better predict the mechanical properties of composite systems with non-continuous filler
materials, such as short fiber composites and particle composites other models have been
created. For particle composites, shape is considered by Halpin-Tsai model, by the shape
factor 𝜃 in Equation 3.2
𝐸𝐶 = 𝐸𝑀
1+𝜃𝜑𝐹
(𝐸𝐹𝐸𝑀
−1)
(𝐸𝐹𝐸𝑀
−𝜃)
1−𝜑𝐹
(𝐸𝐹𝐸𝑀
−1)
(𝐸𝐹𝐸𝑀
−𝜃)
Halpin Tsai model (3)
The lower bound of the Halpin Tsai model where (𝜃=0) follows the inverse rule of mixtures
Equation 3, which implies that the filler material undergoes the same stress throughout
the composite material. As a consequence, the material follows the transverse loading
shown in Figure 1.1b. In contrast, for θ=∞ the Halpin-Kardos model follows the upper
Figure 1.1: Composites above demonstrate upper and lower bounds of the mixing rule. a: Composite material components matrix (M) and filler (F) undergo the same strain demonstrating the upper rule of mixtures. b: Components (M) and (F) undergo the same stress demonstrating the lower bound rule of mixtures.
σ σ M F
M
M F
M
a. b.
5
bound rule of mixtures, which implies that the filler material is acting as a continuous phase
in the direction axial to the stress and undergoing the same strain as the composite.
The Halpin-Tsai model best describes short fiber composites, but other composite
models further focus on other filler particle geometries such as disks.2 However, these
models do not exceed the upper bounds to the rule of mixtures. However, in practice the
modulus of a composite material can fall below the lower bounds of the rule of mixtures if
the materials do not interact well with one another.
Surface area and surface chemistry determine how well filler materials interact with
matrix materials. Nanomaterials have a larger surface area per volume than their
macroscopic counterparts. This feature allows for increased interaction between the
polymer and the filler, and in some cases interaction among the filler particles through
networking often referred to as percolation. Macroscopic discontinuous filler particles
have low surface areas and are too large to reinforce a material. For the case of rubber, a
well-studied material, it is generally accepted that particles larger than 1 µm do not
reinforce rubbers well, while nanoscale particles of less than 100 nm in a dimension offer
exceptional reinforcement.4
Interactions at the nanoscale have been shown to have effects on the composite
crystallization and glass transition temperature deemed to be “nano-effects.”1 Interactions
between the filler and the polymer are classified as interfacial interactions. Weak
interactions of polymer-filler interfaces can result in void spaces within the material, while
strong interfacial interactions of soft rubbers and carbon fillers has led to rubbers becoming
glassy near nanoparticles.5 In composite systems that do not allow covalent bonding to
filler particles changes in the glass transition temperature (Tg) of typically ≤3 °C.1 Increases

6
in Tg have been attributed to strong interfacial interactions, while decreases in the Tg have
been attributed to weak interfacial interactions.1 Nanofillers can also affect crystallite size
by not affording crystallites the space to grow.1
Filler-filler interactions being continuous throughout a composite system are
described as percolation effects. Key outcomes of percolation effects include electrical
conductivity and reinforcement. For electrically conductive filler materials, such as CNTs,
there is a critical volumetric concentration based on their aspect ratio that determines when
there is a continuous network. When this threshold is met throughout the matrix, the
resulting composite is electrically conductive.6
Mechanical percolation stems from the same concept, the observation that for some
composites there is more substantial reinforcement above a critical volumetric
concentration of filler. Polymers filled with some materials can show that there is little
reinforcement with the addition of filler at low volume concentration, but with increased
addition of filler particles there is substantial reinforcement. The increase in reinforcement
is more substantial for particles that have strong interaction with one-anther such as pi-pi
interactions7 or hydrogen bonding.8 A relationship used to predict the percolation threshold
of thin rod-shaped particles such as CNCs and CNTs is 0.7/A, where (A) is the aspect ratio.
This approximation is only technically valid for particles with A>50 and does not account
for end-end interaction of rod-shaped particles.
A reinforcement model was created to account for mechanical percolation in
composite materials with rod-shaped filler materials such as CNCs and CNTs.8-9 The
mechanical percolation model is represented as a piecewise equation, where below the
percolation threshold the lower bound rule of mixing is used, while above the critical

7
volume concentration (φC) Equation 4 is followed. The percolation threshold can be
determined by fitting the data to the model, or it can be found as 0.7/A.
𝐸𝐶 =(1−2(𝜏)+(𝜏)𝜑𝐹)+(𝜑𝑀)𝜏𝐸𝐹
2
(𝜑𝑀)𝐸𝐹+(𝜑𝐹−𝜏)𝐸𝐹 Young’s modulus above percolation threshold (4)
𝜏 = 𝜑𝐹 (𝜑𝐹−𝜑𝐶
1−𝜑𝐶)
𝑏
Percolating fraction (5)
The percolating fraction τ is involved in the transfer of the load going from one particle to
another and can be calculated from Equation 5. The variable φC refers to the critical
concentration required for percolation and b is the percolation exponent.8
The percolation model does not exceed the upper bounds of the rule of mixtures
but come close to following it when filler exceeds the critical concentration. For filler
materials that are not aligned to the applied stress, the percolation model typically adjusts
the Young’s modulus of the filler material (EF) to fit the data set. The percolation model is
based on infinite aggregates of filler materials forming, so changing this (EF) to be closer
to a value expected from a film composed only of aggregated filler material rather than a
solid film of filler material is reasonable.8-9 Similarly, the Halpin-Kardos model adjusts the
shape parameter θ, which can be adjusted based on experimental observations such as
aspect ratio, orientation, and reinforcement to fit the observed changes in stiffness.
1.2 Cellulose Nanocrystals
Cellulose is a major structural component of plants, and it consists of linked 1,4 β
D-glucose or repeating “cellobiose” units Figure 1.2. Cellulose nanocrystals (CNCs) are
natural materials that are isolated from cellulose by removing the non-crystalline regions
of the cellulose leaving crystalline units of the cellulose material. After isolating cellulose
from other materials, initial treatment with strong acids afforded fast decomposition
followed by a second slower rate of decomposition.10 Isolation of the resulting products

8
showed that the faster rate was the decomposition of low crystallinity material, and the
slower decomposition rate was associated with highly crystalline material.10
Isolation of CNCs requires a source of cellulose and a technique to remove the
amorphous regions of the cellulose. Many sources of cellulose have been used for the
isolation of CNCs including ramie fibers,11-13 kenaf fibers,14-16 cotton, tunicin,17 banana
pseudostems,18 pistachio shells,19 hardwood,20 softwood,21 bacteria,22 and bamboo pulp.23
CNCs size and aspect ratio is dependent on source and isolation method.24
To fabricate CNCs, purified cellulose is often subjected to a strong acid at high
concentration for a set time.19, 21 An increased duration of exposure to strong acid will
decrease the size of the resulting CNCs, and a study found that spherical CNCs could be
obtained with increased hydrolysis time.22 Broadly, two kinds of acid can be used to obtain
CNCs from cellulose: acids that impart functional groups such as sulfuric acid21 or
phosphoric acid25 and acids which do not such as hydrochloric acid26 or hydrobromic
acid.27 Notably the charged groups from sulfuric acid or phosphoric acid help to stabilize
the CNCs as they are dispersed in polar liquids. Additionally, researchers have found that
the addition of citric acid or formic acid can impart functional groups to the CNCs as they
are being hydrolyzed by hydrochloric acid.28
Figure 1.2: The chemical structure of cellulose is shown with the six labeled carbons.
9
Other methods of converting cellulose to more crystalline nanomaterials utilize
either a mechanical, biological, or oxidative means of removing the amorphous portion of
the cellulose.24 However, with these methods typically less of the amorphous portion is
removed relative to acid hydrolysis leading to a lower crystalline content material such as
those in cellulose nanofibrils (CNFs).24 CNCs have been definitively obtained through a
high pressure, high shear homogenization process.29
While CNCs are physically more crystalline than the parent cellulose and more
crystalline than CNFs from the same source, CNCs are not entirely a crystalline material.
For sulfuric acid isolated CNCs the crystalline fractions were found to be 0.72 from
bacteria, 0.80 from tunicin, and 0.60 from wood.
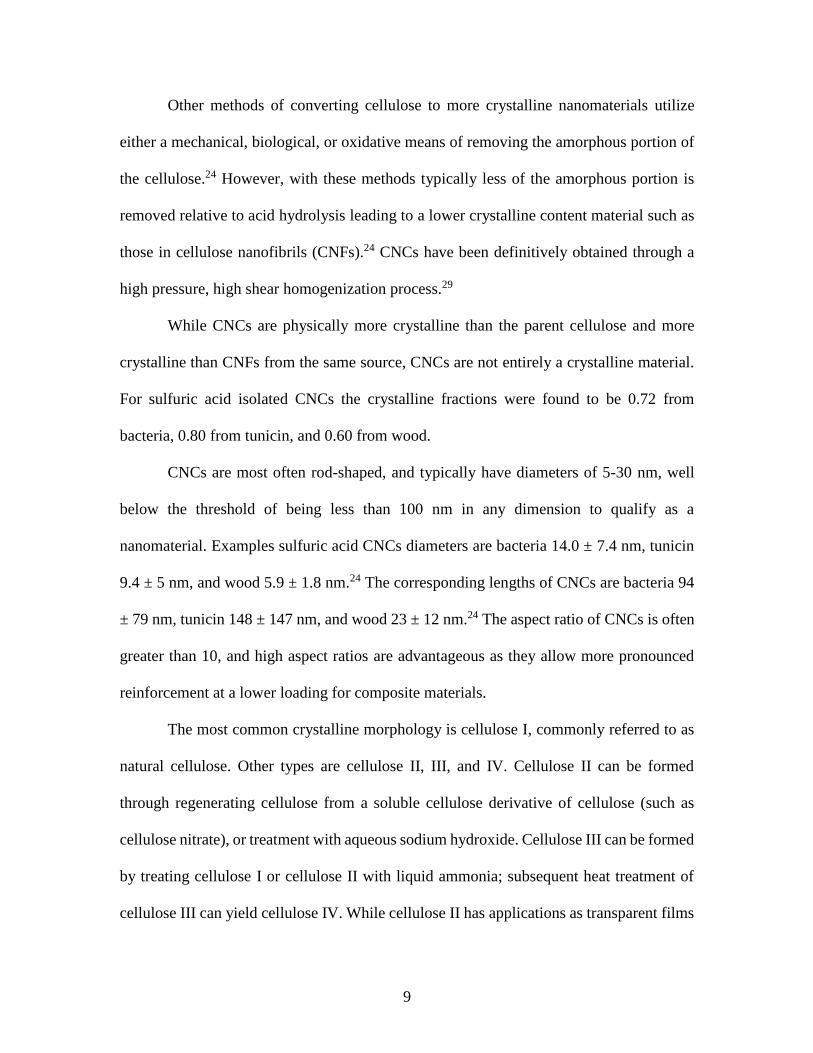
CNCs are most often rod-shaped, and typically have diameters of 5-30 nm, well
below the threshold of being less than 100 nm in any dimension to qualify as a
nanomaterial. Examples sulfuric acid CNCs diameters are bacteria 14.0 ± 7.4 nm, tunicin
9.4 ± 5 nm, and wood 5.9 ± 1.8 nm.24 The corresponding lengths of CNCs are bacteria 94
± 79 nm, tunicin 148 ± 147 nm, and wood 23 ± 12 nm.24 The aspect ratio of CNCs is often
greater than 10, and high aspect ratios are advantageous as they allow more pronounced
reinforcement at a lower loading for composite materials.
The most common crystalline morphology is cellulose I, commonly referred to as
natural cellulose. Other types are cellulose II, III, and IV. Cellulose II can be formed
through regenerating cellulose from a soluble cellulose derivative of cellulose (such as
cellulose nitrate), or treatment with aqueous sodium hydroxide. Cellulose III can be formed
by treating cellulose I or cellulose II with liquid ammonia; subsequent heat treatment of
cellulose III can yield cellulose IV. While cellulose II has applications as transparent films
10
and Rayon, cellulose I has the highest elastic modulus in the axial direction and occurs
naturally.30
Cellulose I has two polymorphs, Iα and Iβ. They are in naturally occurring cellulose
sources and their relative ratio depends on the natural source of cellulose. Cellulose Iα is
the major component of algae and bacteria, while cellulose Iβ is more common in tunicin
and multicellular plants. These two polymorphs have different crystalline arrangements; Iα
is triclinic and Iβ is monoclinic. A notable difference between the polymorphs is the
monoclinic crystalline arrangement of cellulose Iβ polymorph, which has stronger
hydrogen bonding leading to a higher thermal degradation temperature.30
As cellulose is sourced from biological media, the formation of the elementary
cellulose crystals varies in terms of chain arrangements for different biological organisms.
For wood, the crystalline regions are formed as 36 chains forming a cellulose Iβ elementary
crystal structure with a rectangular cross section. Other sources can have different cross
sections such as maize cellulose for which a hexagonal cross section has been proposed.30
Hydroxyl groups on CNCs are subject to modification through many chemical
reactions resulting in robust covalent bonds. CNCs have been successful modified by
polymer grafting, click chemistry, esterification, adsorption of surfactants, acetylation,
silylation, and acylation.30 Efforts to functionalize CNCs have been driven by applications
including dispersing CNCs in a polymer matrix, making CNCs electrically conductive,31
increasing the thermal stability of the CNCs,32 and other functions.
Thermal properties of CNCs are of great concern. The surface chemistry of the
CNCs predict how the CNCs will respond to increased temperature. Sulfuric acid CNCs
tend to degrade at lower temperatures than neutral CNCs (without acidic groups), which is

11
attributed to the sulfate ions on the surface of the CNCs. Additionally, any residual acid
from the hydrolysis of cellulose will cause early degradation of the CNCs.10
CNCs are primarily used as fillers in composites, but CNCs have also been used to
alter the rheological properties of some fluids. As filler materials, the effect of CNCs have
been investigated on barrier, optical, thermal, and mechanical properties.10, 30 The barrier
property unfunctionalized CNCs contribute to polymer composites is an increase in water
permeability. Adding CNCs to a polymer may increase or decrease oxygen permeability,
and the result is dependent on the polymer and surface chemistry of the CNCs. CNCs can
be incorporated to form translucent films but will scatter some light.30 Light scattering
occurs as nanomaterials that are larger than ten times the wavelength of interest scatter
light and this includes CNCs. However, CNCs with a typical 10-nm diameter would not
appear as macroscopic particles when well dispersed in a matrix.
CNC composites have been used for the reinforcement of materials due to their
high tensile modulus (axial 110-220 GPa, transverse 10-50 GPa), typically high aspect
ratio(>10), and low density (1.6 g·cm-3).30 The literature describes CNCs as filler in rubber,
poly( vinyl alcohol), epoxies, linear low-density polyethylene, polypropylene, polystyrene,
poly(lactic acid), polycarbonate, polyurethanes, and a variety of other polymers.
Appendix A features a list of polymers reinforced by CNCs. This list includes CNC
source, refinement method, surface modification, and mechanical data from tensile tests.
Tensile tests in Appendix A show a general increase in Young’s modulus with increasing
volume fraction of CNCs. This Appendix shows processing methodologies and by
extension which processing methodologies are most common with a polymer type. For
example, polyurethanes are frequently grafted onto functional CNCs, and poly(lactic acids)

12
are most often mechanically mixed with CNCs in roller blade mixers and twin-screw
extruders.
Appendix A is in part meant to be a useful tool in conjunction with other useful
reviews by providing relevant results that have previously been published. This database
can be used to design materials based on known properties or to extrapolate based on trends
to design a material with the needed properties. An example would be the need to have a
higher modulus linear low-density polyethylene material (LLDPE) material without
decreasing elongation at break. Appendix A presents two processes for creating CNC
LLDPE composite materials from Borjesson et al.32 and from Natterodt et al.33 In these
composites, Borjesson had greater Young’s modulus but the elongation at break decreased.
The example from Natterodt did not decrease the elongation at break, so that is the better
starting point for a material that doesn’t decrease elongation at break.
A feature of Appendix A is translating the data from many studies from weight
percentage (wt%) to volume percentage (vol%). This allows for the concentration of CNCs
to be used directly in models such as the Halpin-Kardos and the percolation model. With
this data, future studies can generate materials of the desired modulus by predicting the
modulus of a composite material based on the corresponding model chosen.
Appendix A can be used in conjunction with a variety of review papers such as a
review of surface chemistry.34 In this work, many of the possible interactions of CNCs with
matrix polymers are detailed, including silane coupling, peptide coupling, silanizing,
urethanization, click chemistry, peptide coupling, and surface initiated radical
polymerization.34 Studies can be easily found that had such reactions occurring35-39 in

13
Appendix A. From Appendix A, the potential mechanical benefit of performing a reaction
can be predicted.
1.3 Polyethylene
Polyethylene was first developed as a material in 1930, by Carl Shipp Marvel at du
Pont de Nemours and Company. However, the first commercial production and patent
began with low-density polyethylene (LDPE) at Imperial Chemical Industries. Later high-
density polyethylene (HDPE) was discovered by Karl Ziegler of the Max Planck Institute
for Coal Research. Ziegler and his colleague Erhard Holzkamp used an organometallic
catalyst. Later, Giulio Natta improved the process and applied it to the polymerization of
propylene, leading to the name Ziegler-Natta catalyst40 and their joint receipt of the Nobel
Prize in Chemistry in 1963. The use of metallocene catalysts was reported soon thereafter
by Breslow & Newburg41 but their work gained little traction until Kaminsky showed that
a combination of trimethylaluminum and water (essentially, methylalumoxane) as an
activator demonstrated appreciable catalytic activity and novel, desirable product
properties.42
Variations in polyethylene structure are obtained by changing the concentration of
alkene comonomer(if any), the structure of the catalyst, and reaction conditions such as
pressure and temperature. Higher pressures usually result in higher molecular weight, while
higher temperatures have the opposite effect.43
Initiating ethylene polymerization with free radicals leads to the randomly branched
polyethylene structures characteristic of LDPE. As free-radicals are not well-behaved
chemical species there is backbiting and branching as the polymerization ensues.44 High-
density polyethylene (HDPE) in contrast is formed by coordination polymerization using

14
a transition metal catalyst. (Figure 1.3). Because the reaction is controlled at the catalyst
site, there is not a population of unstable intermediates.45 Differences in molecular weight
separate HDPE and ultra-high molecular weight polyethylene (UHMWPE) where the
higher molecular weight product UHMWPE begins at molecular weights of three million
daltons.46
Linear low-density polyethylene (LLDPE) is similar to HDPE in that an addition
catalyst is used. However, the addition of a co-monomer introduces short branches from
the main backbone. The amount of monomer incorporation depends on the amount of
monomer in the feed and the selectivity of the catalyst to incorporate the monomer.
For the polymerizations of HDPE and UHMWPE the Cossee-Arlman mechanism
adequately describes the use of a Ziegler-Natta or metallocene catalyst system, as
illustrated in Figure 1.3. For LLDPE, the mechanism would be the same, except for the
addition of linear α-olefins like propene, butene, hexene or octene.
15
The Ziegler-Natta catalyst systems are those that are transition-metal based and
activated by an organic aluminum compound. The classic Ziegler-Natta catalyst TiCl4 is
activated with triethylaluminum. Most Ziegler-Natta catalysts take the form of tiny solid
particles that have active catalytic sites on their surfaces. Polymerization ensues when
these particles combine with monomer in the gas phase. A more efficient “second
generation” of Ziegler-Natta catalysts followed, in which the more expensive transition
metal component was coated onto the surface of an inorganic support such as magnesium
chloride, which also contributed better control over the catalyst particle size distribution.
Another type of ethylene polymerization catalyst is the Phillips catalyst, which is a
chromium oxide species immobilized on silica gel, generated by infusing silica gel with
chromium(III) acetate and subsequent calcination. The Phillips catalyst differs in that no
Catalyst activation Alkene coordination &
insertion
(propagation)
Chain transfer
Catalyst begins new cycle …
Figure 1.3: The Cossee-Arlman mechanism for ethylene polymerization catalysts
such as zirconocene dichloride shows the crucial steps of activation and
coordination with a co-catalyst, absorption of an alkene (propagation), followed
by the eventual chain termination in which the catalyst can being a new alkyl
chain.

16
alkylaluminum activator is required; instead the catalyst activates during an induction
period in which the surface oxide species is reduced to a chromium alkyl by the monomer
itself. The mechanism of this critical process remains one of the great unsolved mysteries
of modern chemistry. This catalyst accounts for a substantial portion of the world’s
production of HDPE but is not especially versatile and cannot yet be adapted to the
formation of either LLDPE or polypropylene.47
The Kaminsky Catalyst, as the combination of MAO (formed by partial hydrolysis
of trimethylaluminum) and Cp2ZrCl2 is now known, showed extremely high activity for
ethylene and gave much narrower molecular weight distributions, at or near the ideal value
for single-site coordination polymerization (PDI = 2.0).42 These however, did not have the
same ability to anchor as the classic Ziegler Natta catalyst or the Phillips catalyst, so the
Kaminsky catalyst and its congeners were confined to polymerizations in solution, so their
value was limited to niche markets where special properties of the resin such as precise
control of branching and other microstructural features would compensate for the high cost
of solvent volatilization and recycling.48
In response, efforts were made to find anchoring chemistry, through synthetic
elaboration of the metallocene ligand structure. ‘Hybrid’ catalysts featuring the single-site
characteristics of metallocenes and the particle-size control of an inorganic support
promised to extend metallocene technology into the gas phase. Complementary
approaches, in which the cocatalyst (organoaluminum or organoboron compound) is
anchored first to the inorganic support, have been developed more recently and have the
advantage that any soluble polymerization catalyst can, in theory, be used, obviating a lot
of complex ligand synthesis.49

17
Bulk material properties of polyethylene are dependent on synthesis method and
processing method. Microscale structures of polyethylenes such as their crystal
morphologies have been extensively studied. Single crystals of polyethylene form as 10-
nm thick ribbons and can be pulled from dilute solutions. Other polyethylene crystal
structures known as spherulites exist as stacks of crystalline regions with amorphous
regions between the stacks.50 Polyethylene single crystals have high strengths and have
moduli from 240-360 GPa in the axial direction.50 This property explains the high stiffness
of >90% crystalline UHMWPE used in high performance applications.
The crystalline content in polyethylene varies, and the addition of branch points to
polyethylenes decreases the crystalline content.51 For LLDPE, addition of α-olefin
comonomers decreases the crystallinity of the polyethylene. Except for ethylene propylene
copolymers which have only single-carbon branches, crystalline regions are not formed at
all when sufficient branch point populations are present, there are decreases in the melting
point and crystallinity of polyethylene with the addition of 1-butene, 1-hexene, or 1-octene.
The current understanding is that for random distributions of comonomer in polyethylene
(excluding propene), the melting point is decreased in proportion to the number of branch
points and weakly dependent the specific comonomer. Chain lengths can also have an
effect on the physical properties of LLDPE. High molecular weights of LLDPE copolymers
with the same comonomer content have lower melting temperatures for the range (3-3,000
kDa).51 Melting points are reduced as consequence of a reduction in crystallite thickness,
due to an increase in entanglements.51
HDPE has inherent chemical resistance, as the rare methyl (-CH3) and common
methylene (-CH2-) units are very stable. Both HDPE and LLDPE can have terminal alkene

18
groups that while very uncommon are subject to the effects of aging. . High energy
radiation can affect polyethylene species by causing it to crosslink, but stabilizers can
mitigate this effect.46 LLDPE has branch points, tertiary carbons (>CH-), and these carbons
are able to form more stable radicals and carbocations, making LLDPE less chemically
inert. Notably, sufficient branching enables most LLDPE and LDPE to be solubilized in
common solvents such as toluene and xylene. HDPE may be solubilized in xylene or
chlorinated benzene derivatives, while UHMWPE is almost exclusively solubilized in
1,2,4-trichlorobenzene.
One of the more notable attributes of polyethylene its low cost of starting material,
as ethylene is an inexpensive monomer.52 Alpha olefins likely add to the cost of LLDPE
materials but little comonomer is typically needed.
LDPE can be processed in a variety of ways; some of the most common are
extrusion and injection molding. Additionally, there are exotic methods often used to
process UHMWPE such as ram extrusion53 and fiber spinning and drawing.54 Ram
extrusion can lead to increased crystallinity from annealing in UHMWPE and ram
extrusion allows for high melt viscosity materials unlike twin screw extrusion.53 Tape or
fiber drawing allows for chain alignment and the development of high crystallinity
UHMWPE products.54 Polyethylene species exhibit strength properties that vary strongly
with polyethylene type and crystalline morphology.
Polyethylene composites come in a variety of forms as there are various
polyethylene types. The goals for most polyethylene composites include reinforcement,
electrical conductivity, and flame retardation. Current technologies focus on the use of

19
natural fibers, nanocarbon materials, and layered clay-based materials such as
montmorillonite.55
The carbon-based materials are intrinsically some of the best materials for
reinforcement of polyethylene as they are often better distributed throughout the polymer
matrix than raw natural fibers or exfoliating clays. Carbon nanotubes have been shown to
be an excellent filler material and able to reinforce at low loading but are also among the
costliest filler materials.
Clays such as montmorillonite have been shown reinforce polyethylene at low
loadings and impart flame retardant properties. However, they afford a rather poor interface
with the polyethylene and have trouble dispersing in the polymer matrix. There have been
notable efforts with clay materials to add organic functional groups such as fatty acids to
the surface or add quaternary ammonium salts to facilitate dispersion.56
Natural fibers have a distinct advantage over the clay and carbon-based materials
in that they are renewable materials that can be easily acquired. For natural fibers, the
source materials with the highest cellulose content as opposed to hemicellulose or lignin
tend to be better at providing stiffness to the polyethylene materials.57 There is however,
the limitation that the natural fiber materials to be blended with the polyethylene have
hydrophilic characteristics that can lead to poor mixing within the system. To overcome
this problem, polyethylene has been grafted with maleic anhydride to improve
hydrophilicity. A similar approach can be taken with natural fibers, instead silanizing the
hydroxyl groups on the natural fibers which has shown mechanical reinforcements at high
filler loadings.58

20
1.4 Desalination Membranes:
Clean fresh water is a critical need for societies to live in healthy conditions as it is
used for drinking, hygiene, and agriculture. It is estimated that each person uses 1000 m3
of freshwater per year.59 Fresh water demand can exceed availability, and it is estimated
that 35% of the world’s population suffers from water stress.60 Instead, some sources of
water such as seawater and brackish water are purified to meet the demands of the people.59
Membranes are materials that allow for selective permeability and are materials that can
be possibly improved.
Important membrane separation methods include electrodialysis, membrane
distillation,61 and reverse osmosis. These processes use different driving forces to generate
water with reduced concentrations of cations and anions. Electrodialysis uses a potential
difference to force salt anions across a membrane, membrane distillation uses thermal
energy on one side of the membrane to force vapor across the membrane, and reverse
osmosis uses a pressure difference to force salt free water across the membrane. While all
these technologies are important, reverse osmosis (RO) is the most widely used.
Additionally, RO membranes that have been generated with nanoparticles have had success
improving key properties.62
The current discussion of RO membranes dates back Gerald Hassler in the 1940s,
but earlier records can be found discussing osmosis in the forward direction. His early
account hypothesized that evaporation was a necessary step to move water through the
membrane. Later, in 1959, C.E. Reid and E.J. Brenton were able to show that cellulose
acetate membranes were able to reject 96% of chlorides while allowing for 14 gallons per
day with a 3.7 µm thick membrane.63

21
Importantly after this, the first asymmetric membranes for reverse osmosis
membranes were developed allowing for much thinner membranes. Cellulose acetate
membranes were developed that were able to have a ten-fold increase in flux due to having
a thin coherent portion of cellulose acetate of 0.2 µm with a backing of cellulose acetate
that allowed the membrane to remain a sturdy material.63
Reverse osmosis is used either for the recovery of pure water from a water source
with dissolved or suspended solids or the recovery of dissolved or suspended solids by
removing water. Applications in which reverse osmosis is used are removal of sodium ions
for boilers, ultrapure water for microelectronics, concentrating corn-based sweeteners,
concentrating dairy products,64 purification of waste water, and purification of sea and
brackish waters.63
Osmosis in the forward direction allows the flow of a liquid through a membrane
without allowing the flow of dissolved solids suspended solids. The flow of osmosis in this
direction is driven by a difference in solute concentration. The solution with the higher
concentration of solutes will incur the flow of water across the membrane until both sides
have reached equilibrium.65
Reverse osmosis uses an applied pressure on the surface of the membrane forcing
pure water through, while the membrane rejects the dissolved solids. The efficiency of the
membrane is reflected in terms of both salt rejection and flux or flow through the
membrane. It can be understood that from a non-equilibrium state the flux Nm is the
difference between the osmotic pressures π and applied pressures P, these pressures are
illustrated in Figure 1.4. However, as it is membrane dependent the permeability of the
membrane PM and the thickness LM influence how the amount of water that is passed
22
through the membrane. Therefore, efforts to make the membranes more efficient would
have greater permeability, or mechanically robust membranes to allow for thinner or higher
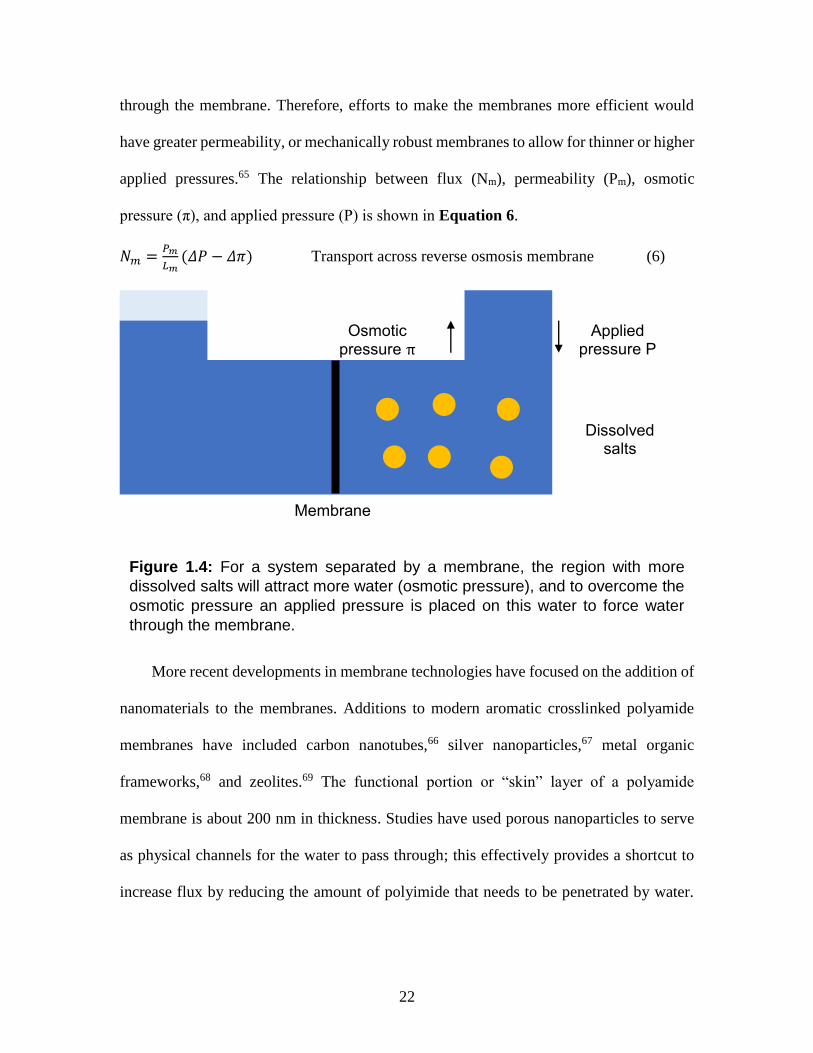
applied pressures.65 The relationship between flux (Nm), permeability (Pm), osmotic
pressure (π), and applied pressure (P) is shown in Equation 6.
𝑁𝑚 =𝑃𝑚
𝐿𝑚(𝛥𝑃 − 𝛥𝜋) Transport across reverse osmosis membrane (6)
More recent developments in membrane technologies have focused on the addition of
nanomaterials to the membranes. Additions to modern aromatic crosslinked polyamide
membranes have included carbon nanotubes,66 silver nanoparticles,67 metal organic
frameworks,68 and zeolites.69 The functional portion or “skin” layer of a polyamide
membrane is about 200 nm in thickness. Studies have used porous nanoparticles to serve
as physical channels for the water to pass through; this effectively provides a shortcut to
increase flux by reducing the amount of polyimide that needs to be penetrated by water.
Membrane
Dissolved salts
Osmotic pressure π
Applied pressure P
Figure 1.4: For a system separated by a membrane, the region with more
dissolved salts will attract more water (osmotic pressure), and to overcome the
osmotic pressure an applied pressure is placed on this water to force water
through the membrane.

23
As more nanoparticles are examined, relationships regarding what allows for high flux and
good salt rejection though a membrane may become more clear.62
1.5 Polynorbornenes:
Norbornenes are bicyclic rings with a π bond and are created by the Diels-Alder
reaction of ethylene and cyclopentadiene (Figure 1.5). They are produced to the extent that
patents for different industrial synthetic processes have been previously filed in 198670 and
in 2000.71 Interestingly norbornenes derivatives with side chains and functional groups can
be made by starting with a substituted ethylene as shown in Figure 1.5.72 Derivatives are
not limited to aliphatic substitutions but can be trimethylsilyl groups and halogens among
countless others. The stereochemistry of substitution (exo vs. endo) influences the
subsequent reactivity of the double bond in ring-opening metathesis polymerization
(ROMP), so chemists have devised ways to control this stereochemistry during the
cycloaddition reaction and to separate the isomers when the selectivity problem cannot be
entirely overcome. Generally, the exo substituted isomer is more reactive than the endo
isomer towards ROMP.72

24
Norbornenes are especially useful unsaturated monomers because the pi-bond is
located within a strained ring system. There are two methods for making polynorbornenes,
the ring opening metathesis polymerization (ROMP) and addition polymerization. The
reaction scheme below shows the reactions of each scheme, Figures 1.6a (ring opening)
and 1.6b (addition reaction). The reactions can result in stereospecific products but the
most basic reaction scheme is shown.72
Figure 1.5: Formation of norbornene derivatives is shown a: Reaction scheme
of cyclopentadiene and ethylene to give norbornene. b: Reaction of a substituted
ethylene with cyclopentadiene to give a substituted norbornene.
a
b

25
ROMP of norbornenes has been more successful than addition polymerization and
can produce high molecular weight polymers. ROMP is mediated by a metal catalyst
containing titanium, ruthenium, molybdenum, or tungsten. ROMP allows for a great degree
of control and small polydispersity indexes. These polymerizations can be both continuous
(living) and discontinuous (non-living) depending on the catalyst used.73 Higher molecular
weight ROMP products have use in industry as a soft but strong rubber, and these can be
used as a low hardness damping compound. Blending ROMP polynorbornenes with
polyisoprene leads to materials that can be used to make bellows, roller coverings, and
seals.74 Pure ROMP polynorbornenes are also used for gas separation technologies for
selective separation of hydrocarbons.72
Products from Figure 1.5.1b involve the polymerization of bicyclic rings. At high
molecular weights these polymers are glassy materials have been used for gas separation
Figure 1.6: Above is a: polymerization of norbornene in the presence of a ring
opening metathesis catalyst and b: polymerization of norbornene in the
presence of an addition catalyst.
b
a

26
technologies for gasses such as hydrocarbons, nitrogen, and carbon dioxide.75 Applications
in making the polynorbornene have focused on the change of side groups of the rings with
Si-O-Si side groups being especially selective for hydrocarbons.76
1.6 Scope and Objectives
It is difficult to disperse cellulose nanocrystals (CNCs) in hydrophobic polymers
because CNC particles are hydrophilic and tend to interact strongly with one another. To
overcome the different surface chemistries and combine CNCs into a polymer material
mixing strategies are employed. The hydroxyl groups on CNCs are responsible for strong
interaction with other CNCs through hydrogen bonding, so it is important that the CNCs
interact strongly with one another and that is most likely when there is minimal surface
functionalization of CNCs.
These studies focus on key points of CNC composite materials introducing new
surface functionalities and using CNCs for reinforcing polymers. Chapters 2, 3, and 5 are
concerned with the application of incorporating CNCs into polymer systems. Chapter 4 is
focused on functionalizing CNCs for an industrial application. The following research
objectives are hypothesis and the following chapters are steps towards answering them.
1. The hydrophobic and hydrophilic interactions of polyolefins and CNCs can be
overcome by using the growth of polyolefin chains from the surface of the filler
material leading to a composite material with well dispersed CNCs.
2. Functionalized CNCs with charged surface groups are capable of strong
interactions with the current state of the art polyamide reverse osmosis
membranes, allowing for increased flux of water through the membrane
material while maintaining high salt rejection.

27
3. Incorporating CNCs into functionalized vinyl addition polynorbornene
materials such as poly(5-triethoxysilyl-2-norbornene) will have improved
mechanical properties common of CNC polymer composites and can serve as
a platform for creating specialty materials.
References:
1. Paul, D. R.; Robeson, L. M., Polymer nanotechnology: Nanocomposites. Polymer
2008, 49 (15), 3187-3204.
2. Fornes, T. D.; Paul, D. R., Modeling properties of nylon 6/clay nanocomposites
using composite theories. Polymer 2003, 44 (17), 4993-5013.
3. Kim, H. S.; Hong, S. I.; Kim, S. J., On the rule of mixtures for predicting the
mechanical properties of composites with homogeneously distributed soft and hard
particles. Journal of Materials Processing Technology 2001, 112 (1), 109-113.
4. Ma, J.; Zhang, L. Q.; Dai, J., Interface Modification and Characterization. In
Rubber Nanocomposites, Thomas, S.; Stephen, R., Eds. 2010; pp 87-112.
5. Berriot, J.; Montes, H.; Lequeux, F.; Long, D.; Sotta, P., Evidence for the Shift of
the Glass Transition near the Particles in Silica-Filled Elastomers. Macromolecules 2002,
35 (26), 9756-9762.
6. Bauhofer, W.; Kovacs, J. Z., A review and analysis of electrical percolation in
carbon nanotube polymer composites. Composites Science and Technology 2009, 69 (10),
1486-1498.
7. Pérez, E. M.; Martín, N., π–π interactions in carbon nanostructures. Chemical
Society Reviews 2015, 44 (18), 6425-6433.
8. Favier, V.; Cavaille, J. Y.; Canova, G. R.; Shrivastava, S. C., Mechanical
percolation in cellulose whisker nanocomposites. Polymer Engineering & Science 1997,
37 (10), 1732-1739.
9. Sapkota, J.; Shirole, A.; Foster, E. J.; Martinez Garcia, J. C.; Lattuada, M.; Weder,
C., Polymer nanocomposites with nanorods having different length distributions. Polymer
2017, 110, 284-291.
10. Dufresne, A., Nanocellulose: from nature to high performance tailored materials.
Walter de Gruyter GmbH & Co KG: 2017.
11. Junior de Menezes, A.; Siqueira, G.; Curvelo, A. A. S.; Dufresne, A., Extrusion and
characterization of functionalized cellulose whiskers reinforced polyethylene
nanocomposites. Polymer 2009, 50 (19), 4552-4563.
12. Furtak-Wrona, K.; Kozik-Ostrowka, P.; Jadwiszczak, K.; Maigret, J. E.; Aguie-
Beghin, V.; Coqueret, X., Polyurethane acrylate networks including cellulose nanocrystals:
a comparison between UV and EB- curing. Radiation Physics and Chemistry 2018, 142,
94-99.
13. Yue, L.; Maiorana, A.; Khelifa, F.; Patel, A.; Raquez, J. M.; Bonnaud, L.; Gross,
R.; Dubois, P.; Manas-Zloczower, I., Surface-modified cellulose nanocrystals for biobased
epoxy nanocomposites. Polymer 2018, 134, 155-162.
14. Zakuwan, S. Z.; Ahmad, I.; Ramli, N., Preparation of Hybrid Nano Biocomposite
kappa-Carrageenan/Cellulose Nanocrystal/Nanoclay. In 2013 Ukm Fst Postgraduate

28
Colloquium, Murad, A.; Yen, C. C.; Ismail, E. S.; Maskat, M. Y.; Noorani, M. S. M.;
Ibrahim, N.; Karim, N.; Yahya, R.; Khalid, R. M.; Ismail, W. R.; Ling, W. S.; Ibrahim, Z.,
Eds. Amer Inst Physics: Melville, 2013; Vol. 1571, pp 738-743.
15. Kargarzadeh, H.; Sheltami, R. M.; Ahmad, I.; Abdullah, I.; Dufresne, A., Cellulose
nanocrystal reinforced liquid natural rubber toughened unsaturated polyester: Effects of
filler content and surface treatment on its morphological, thermal, mechanical, and
viscoelastic properties. Polymer 2015, 71, 51-59.
16. Zarina, S.; Ahmad, I., Biodegradable Composite Films based on kappa-carrageenan
Reinforced by Cellulose Nanocrystal from Kenaf Fibers. Bioresources 2015, 10 (1), 256-
271.
17. Cao, L. M.; Huang, J. R.; Chen, Y. K., Dual Cross-linked Epoxidized Natural
Rubber Reinforced by Tunicate Cellulose Nanocrystals with Improved Strength and
Extensibility. Acs Sustainable Chemistry & Engineering 2018, 6 (11), 14802-14811.
18. Pereira, A. L. S.; do Nascimento, D. M.; Souza Filho, M. M.; Morais, J. P. S.;
Vasconcelos, N. F.; Feitosa, J. P. A.; Brigida, A. I. S.; Rosa, M. F., Improvement of
polyvinyl alcohol properties by adding nanocrystalline cellulose isolated from banana
pseudostems. Carbohydr Polym 2014, 112.
19. Marett, J.; Aning, A.; Foster, E. J., The isolation of cellulose nanocrystals from
pistachio shells via acid hydrolysis. Industrial Crops and Products 2017, 109, 869-874.
20. Long, K. Y.; Cha, R. T.; Zhang, Y. P.; Li, J. J.; Ren, F. P.; Jiang, X. Y., Cellulose
nanocrystals as reinforcements for collagen-based casings with low gas transmission.
Cellulose 2018, 25 (1), 463-471.
21. Bondeson, D.; Mathew, A.; Oksman, K., Optimization of the isolation of
nanocrystals from microcrystalline celluloseby acid hydrolysis. Cellulose 2006, 13 (2),
171.
22. Lam, N. T.; Saewong, W.; Sukyai, P., Effect of varying hydrolysis time on
extraction of spherical bacterial cellulose nanocrystals as a reinforcing agent for poly(vinyl
alcohol) composites. Journal of Polymer Research 2017, 24 (5).
23. Dhar, P.; Kumar, A.; Katiyar, V., Magnetic Cellulose Nanocrystal Based
Anisotropic Polylactic Acid Nanocomposite Films: Influence on Electrical, Magnetic,
Thermal, and Mechanical Properties. Acs Applied Materials & Interfaces 2016, 8 (28),
18393-18409.
24. Sacui, I. A.; Nieuwendaal, R. C.; Burnett, D. J.; Stranick, S. J.; Jorfi, M.; Weder,
C.; Foster, E. J.; Olsson, R. T.; Gilman, J. W., Comparison of the properties of cellulose
nanocrystals and cellulose nanofibrils isolated from bacteria, tunicate, and wood processed
using acid, enzymatic, mechanical, and oxidative methods. ACS Appl Mater Interfaces
2014, 6 (9), 6127-38.
25. Nicharat, A.; Shirole, A.; Foster, E. J.; Weder, C., Thermally activated shape
memory behavior of melt-mixed polyurethane/cellulose nanocrystal composites. Journal
of Applied Polymer Science 2017, 134 (27), 45033.
26. Xie, D. Y.; Qian, D.; Song, F.; Wang, X. L.; Wang, Y. Z., A Fully Biobased
Encapsulant Constructed of Soy Protein and Cellulose Nanocrystals for Flexible
Electromechanical Sensing. Acs Sustainable Chemistry & Engineering 2017, 5 (8), 7063-
7070.

29
27. Sucaldito, M. R.; Camacho, D. H., Characteristics of unique HBr-hydrolyzed
cellulose nanocrystals from freshwater green algae (Cladophora rupestris) and its
reinforcement in starch -based film. Carbohydrate Polymers 2017, 169, 315-323.
28. Yu, H. Y.; Yao, J. M., Reinforcing properties of bacterial polyester with different
cellulose nanocrystals via modulating hydrogen bonds. Composites Science and
Technology 2016, 136, 53-60.
29. Jalvo, B.; Mathew, A. P.; Rosal, R., Coaxial poly(lactic acid) electrospun
composite membranes incorporating cellulose and chitin nanocrystals. Journal of
Membrane Science 2017, 544, 261-271.
30. Moon, R. J.; Martini, A.; Nairn, J.; Simonsen, J.; Youngblood, J., Cellulose
nanomaterials review: structure, properties and nanocomposites. Chemical Society Reviews
2011, 40 (7), 3941-3994.
31. Meulendijks, N.; Burghoorn, M.; van Ee, R.; Mourad, M.; Mann, D.; Keul, H.; Bex,
G.; van Veldhoven, E.; Verheijen, M.; Buskens, P., Electrically conductive coatings
consisting of Ag-decorated cellulose nanocrystals. Cellulose 2017, 24 (5), 2191-2204.
32. Borjesson, M.; Sahlin, K.; Bernin, D.; Westman, G., Increased thermal stability of
nanocellulose composites by functionalization of the sulfate groups on cellulose
nanocrystals with azetidinium ions. Journal of Applied Polymer Science 2018, 135 (10),
10.
33. Natterodt, J. C.; Sapkota, J.; Foster, E. J.; Weder, C., Polymer Nanocomposites with
Cellulose Nanocrystals Featuring Adaptive Surface Groups. Biomacromolecules 2017, 18
(2), 517-525.
34. Chakrabarty, A.; Teramoto, Y., Recent Advances in Nanocellulose Composites
with Polymers: A Guide for Choosing Partners and How to Incorporate Them. Polymers
2018, 10 (5).
35. Wu, G. M.; Liu, D.; Liu, G. F.; Chen, J.; Huo, S. P.; Kong, Z. W., Thermoset
nanocomposites from waterborne bio-based epoxy resin and cellulose nanowhiskers.
Carbohydrate Polymers 2015, 127, 229-235.
36. Girouard, N. M.; Xu, S. H.; Schueneman, G. T.; Shofner, M. L.; Meredith, J. C.,
Site-Selective Modification of Cellulose Nanocrystals with Isophorone Diisocyanate and
Formation of Polyurethane-CNC Composites. Acs Applied Materials & Interfaces 2016, 8
(2), 1458-1467.
37. Atifi, S.; Su, S. X.; Hamad, W. Y., Mechanically tunable nanocomposite hydrogels
based on functionalized cellulose nanocrystals. Nord. Pulp Paper Res. J. 2014, 29 (1), 95-
104.
38. Cao, X. D.; Habibi, Y.; Lucia, L. A., One-pot polymerization, surface grafting, and
processing of waterborne polyurethane-cellulose nanocrystal nanocomposites. Journal of
Materials Chemistry 2009, 19 (38), 7137-7145.
39. Yang, J.; Han, C. R., Mechanically Viscoelastic Properties of Cellulose
Nanocrystals Skeleton Reinforced Hierarchical Composite Hydrogels. Acs Applied
Materials & Interfaces 2016, 8 (38), 25621-25630.
40. Kaminsky, W.; Sinn, H., Methylaluminoxane: Key Component for New
Polymerization Catalysts. In Polyolefins: 50 years after Ziegler and Natta II: Polyolefins
by Metallocenes and Other Single-Site Catalysts, Kaminsky, W., Ed. Springer Berlin
Heidelberg: Berlin, Heidelberg, 2013; pp 1-28.

30
41. Breslow, D. S.; Newburg, N. R., Bis-(cyclopentadienyl)-titanium Dichloride-
Alkylaluminum Complexes as Soluble Catalysts for the Polymerization of Ethylene.
Journal of the American Chemical Society 1957, 79 (18), 5072-5073.
42. Kaminsky, W., Zirconocene catalysts for olefin polymerization. Catalysis Today
1994, 20 (2), 257-271.
43. D'Agnillo, L.; Soares, J. B. P.; Penlidis, A., Effect of operating conditions on the
molecular weight distribution of polyethylene synthesized by soluble
metallocene/methylaluminoxane catalysts. Macromolecular Chemistry and Physics 1998,
199 (6), 955-962.
44. Wells, G. J.; Ray, W. H., Prediction of Polymer Properties in LDPE Reactors.
Macromolecular Materials and Engineering 2005, 290 (4), 319-346.
45. Cossee, P., Ziegler-Natta catalysis I. Mechanism of polymerization of α-olefins
with Ziegler-Natta catalysts. Journal of Catalysis 1964, 3 (1), 80-88.
46. Sastri, V. R., 6 - Commodity Thermoplastics: Polyvinyl Chloride, Polyolefins, and
Polystyrene. In Plastics in Medical Devices (Second Edition), Sastri, V. R., Ed. William
Andrew Publishing: Oxford, 2014; pp 73-120.
47. McDaniel, M. P., Chapter 3 - A Review of the Phillips Supported Chromium
Catalyst and Its Commercial Use for Ethylene Polymerization. In Advances in Catalysis,
Gates, B. C.; Knözinger, H., Eds. Academic Press: 2010; Vol. 53, pp 123-606.
48. Lee, B. Y.; Oh, J. S., Preparation of Anchored Metallocene Complexes on
Dehydroxylated Silica and Their Use in the Polymerization of Ethylene. Macromolecules
2000, 33 (9), 3194-3195.
49. Kaminsky, W.; Funck, A.; Klinke, C., In-situ Polymerization of Olefins on
Nanoparticles or Fibers by Metallocene Catalysts. Topics in Catalysis 2008, 48 (1), 84.
50. Gedde, U. W.; Mattozzi, A., Polyethylene Morphology. In Long Term Properties
of Polyolefins, Albertsson, A.-C., Ed. Springer Berlin Heidelberg: Berlin, Heidelberg,
2004; pp 29-74.
51. Alamo, R. G.; Mandelkern, L., The crystallization behavior of random copolymers
of ethylene. Thermochimica Acta 1994, 238, 155-201.
52. Selke, S. E.; Hernandez, R. J., Packaging: Polymers for Containers. In
Encyclopedia of Materials: Science and Technology, Buschow, K. H. J.; Cahn, R. W.;
Flemings, M. C.; Ilschner, B.; Kramer, E. J.; Mahajan, S.; Veyssière, P., Eds. Elsevier:
Oxford, 2001; pp 6646-6652.
53. Haichen, Z.; Yong, L., Extrusion Processing of Ultra-High Molecular Weight
Polyethylene. In Extrusion of Metals, Polymers and Food Products, Qamar, S. Z., Ed.
IntechOpen: 2018.
54. An, M.; Xu, H.; Lv, Y.; Tian, F.; Gu, Q.; Wang, Z., The effect of chitin nanocrystal
on the structural transition of shish-kebab to fibrillar crystals of ultra-high molecular
weight polyethylene/chitin nanocrystal fibers during hot-stretching process. European
Polymer Journal 2017, 96, 463-473.
55. Visakh, P. M.; Morlanes, M. J. M., 1. Introduction - HDPE and UHMWPE. In
Polyethylene-Based Blends, Composites and Nanocomposites, John Wiley & Sons: 2015.
56. Rives, V.; Labajos, F. M.; Herrero, M., 6. Double layered hydroxides as nanofillers
of composites and nanocomposite materials based on polyethylene. In Polyethylene-Based
Blends, Composites and Nanocomposites, Visakh, P. M.; Morlanes, M. J. M., Eds. John
Wiley & Sons: 2015.

31
57. Fernandes, E. M.; Mano, J. F.; Reis, L. R., 5. Polyethylene Composites with
Lignocellulosic Material. In Polyethylene-Based Blends, Composites and Nanocomposites,
Visakh, P. M.; Morlanes, M. J. M., Eds. John Wiley & Sons: 2015.
58. Raj, R. G.; Kokta, B. V., Linear Low-Density Polyethylene Filled with Silane-
Coated Wood Fibers. In High-Tech Fibrous Materials, American Chemical Society: 1991;
Vol. 457, pp 102-113.
59. Rogers, P., Facing the Freshwater CRISIS. Scientific American 2008, 299 (2), 46-
53.
60. Wada, Y.; van Beek, L. P. H.; van Kempen, C. M.; Reckman, J. W. T. M.; Vasak,
S.; Bierkens, M. F. P., Global depletion of groundwater resources. Geophysical Research
Letters 2010, 37 (20).
61. Galanakis, C. M.; Agrafioti, E., Membrane distillation development. In Sustainable
Water and Wastewater Processing, Elsevier: 2010.
62. Chan, W.-F.; Chen, H.-y.; Surapathi, A.; Taylor, M. G.; Shao, X.; Marand, E.;
Johnson, J. K., Zwitterion Functionalized Carbon Nanotube/Polyamide Nanocomposite
Membranes for Water Desalination. ACS Nano 2013, 7 (6), 5308-5319.
63. Kucera, J., Introduction and History of Development. In Reverse Osmosis, Kucera,
J., Ed. 2010; pp 1-13.
64. Hiddink, J.; de Boer, R.; Nooy, P. F. C., Reverse Osmosis of Dairy Liquids. Journal
of Dairy Science 1980, 63 (2), 204-214.
65. Greenlee, L. F.; Lawler, D. F.; Freeman, B. D.; Marrot, B.; Moulin, P., Reverse
osmosis desalination: Water sources, technology, and today's challenges. Water Research
2009, 43 (9), 2317-2348.
66. Kim, H. J.; Choi, K.; Baek, Y.; Kim, D.-G.; Shim, J.; Yoon, J.; Lee, J.-C., High-
Performance Reverse Osmosis CNT/Polyamide Nanocomposite Membrane by Controlled
Interfacial Interactions. ACS Applied Materials & Interfaces 2014, 6 (4), 2819-2829.
67. Ben-Sasson, M.; Lu, X.; Bar-Zeev, E.; Zodrow, K. R.; Nejati, S.; Qi, G.; Giannelis,
E. P.; Elimelech, M., In situ formation of silver nanoparticles on thin-film composite
reverse osmosis membranes for biofouling mitigation. Water Research 2014, 62, 260-270.
68. Kadhom, M.; Hu, W.; Deng, B., Thin Film Nanocomposite Membrane Filled with
Metal-Organic Frameworks UiO-66 and MIL-125 Nanoparticles for Water Desalination.
Membranes (Basel) 2017, 7 (2), 31.
69. Li, L.; Dong, J.; Nenoff, T. M.; Lee, R., Desalination by reverse osmosis using MFI
zeolite membranes. Journal of Membrane Science 2004, 243 (1), 401-404.
70. Baumann, W.; Firnow, J.; Gloede, K.; Hertzog, G.; Hessler, M.; Moll, K. K.;
Ramhold, K.; Reinecke, U.; Roschka, E.; et, a. Simplified distillative norbornene
purification. DD237987A1, August 6, 1986, 1986.
71. Lattner James, R.; Sanchez Leonel, E.; Becker Christopher, L.; Devoy Bruce, C.
Production Of Alkenyl Bridged Ring Compounds. US 6093865 A, 1998, 2000.
72. Finkelshtein, E. S.; Bermeshev, M. V.; Gringolts, M. L.; Starannikova, L. E.;
Yampolskii, Y. P., Substituted polynorbornenes as promising materials for gas separation
membranes. Russian Chemical Reviews 2011, 80 (4), 341-361.
73. Sutthasupa, S.; Shiotsuki, M.; Sanda, F., Recent advances in ring-opening
metathesis polymerization, and application to synthesis of functional materials. Polymer
Journal 2010, 42 (12), 905-915.

32
74. Ash, M.; Ash, I., Polynorbornene. In Handbook of Plastics and Rubber Additives,
Volumes 1-2 (2nd Edition), Synapse Information Resources, Inc.: 2013.
75. Gmernicki, K. R.; Hong, E.; Maroon, C. R.; Mahurin, S. M.; Sokolov, A. P.; Saito,
T.; Long, B. K., Accessing Siloxane Functionalized Polynorbornenes via Vinyl-Addition
Polymerization for CO2 Separation Membranes. ACS Macro Letters 2016, 5 (7), 879-883.
76. Bermeshev, M. V.; Syromolotov, A. V.; Starannikova, L. E.; Gringolts, M. L.;
Lakhtin, V. G.; Yampolskii, Y. P.; Finkelshtein, E. S., Glassy Polynorbornenes with Si–
O–Si Containing Side Groups. Novel Materials for Hydrocarbon Membrane Separation.
Macromolecules 2013, 46 (22), 8973-8979.

33
Chapter 2: In situ dispersion and polymerization of polyethylene cellulose nanocrystal-
based nanocomposites
This chapter is adapted from the publication: “In situ dispersion and polymerization
of polyethylene cellulose nanocrystal-based nanocomposites.” In the publication Journal
of Applied Polymer Science.
I recognize the contributions of the coauthors Travis W. Baughman, Paul A. Deck,
and E. Johan Foster. All co-authors contributed ideas, procedures, and significant editing
to the document, and Paul A. Deck synthesized the catalyst 1,1’-
bis(bromodimethylsilyl)zirconocene dibromide.

34
In situ dispersion and polymerization of polyethylene cellulose nanocrystal-based
nanocomposites
Keith D. Hendren, Travis W. Baughman, Paul A. Deck, and E. Johan Foster
Abstract:
This study describes a novel method of forming a nanocomposite comprising cellulose
nanocrystals (CNC)s as the reinforcing filler and a high-density polyethylene matrix. The
method involves covalent attachment of a metallocene catalyst, 1,1’-
bis(bromodimethylsilyl)zirconocene dibromide 1, to the hydroxyl-rich surfaces of the
CNCs and subsequent slurry polymerization with excess alumoxane (MMAO-12) as the
co-catalyst. Polymerization proceeds with activities reaching 500 kg mol−1 atm−1 h−1, while
the CNCs are simultaneously dispersed to afford robust, well-dispersed nanocomposites.
Films of these composites (ca. 7 vol% CNC) showed excellent dispersal of the filler
(optically translucent; no CNC aggregation observed by AFM). The composites (ca. 7
vol% CNC) also revealed an increase in Young’s modulus (10-100%) and comparable
yield strength relative to commercially produced polyethylenes (PE). The experimental
simplicity of this approach suggests that our method could be scaled beyond the present
laboratory scale and extended to reinforce other polyolefin grades.

35
2.1. Introduction:
Nanomaterials are ideal composite fillers; their high surface area leads to increased
interfacial interactions with the matrix material.1 High-modulus nanoscopic fillers can
improve the mechanical properties of a material by increasing the stiffness more than their
microscopic counterparts.1 As a filler material, cellulose nanocrystals (CNCs) have
substantial reinforcing potential as they have high aspect ratios and high Young’s moduli.2
In addition, surface hydroxyl groups enable CNCs to associate with one another through
hydrogen-bonding, resulting in a percolated network of rod-like filler particles within the
matrix at a critical concentration determined by the aspect ratio of the CNCs.3 CNCs at
critical concentrations of typically 6-10 vol% have been shown to dramatically increase
the stiffness of soft polymers (> 400%),4 of low-density polyethylene (LDPE) (> 300%),5
and of a rigid polypropylene by up to 54%.6 Production of CNCs is increasing globally,
and manufacturers are actively seeking new applications for these bio-based materials.3
Since polyethylene (PE) is manufactured on an enormous scale, an efficient method of
dispersing CNCs into PE would provide a key market for these new nanofillers. Market
projections show that demand for nanofilled PE will increase dramatically in coming
years.7
A previous study using the solvent-exchange method obtained LDPE CNC
composites with more than two times the storage modulus and three times the tensile
modulus compared to the same polymer lacking a reinforcing filler.5 However, the solvent
exchange method consumes both time and solvent (typically 5-7 days and 4-11 L,
respectively) for the incorporation 0.9-3 g of CNCs.8 Additionally, the solvent-exchange
method cannot be readily extended to less soluble polymers such as high-density
polyethylene (HDPE). Another approach for CNC LDPE composite fabrication has been

36
surface modification of the highly polar CNCs with hydrophobic groups to compatibilize
them with the aliphatic LDPE chains.9 Unfortunately, this approach also tends to disrupt
hydrogen bonding between CNCs, weakening filler-filler interactions.10 The efficient
incorporation of minimally modified CNCs into hydrophobic matrices therefore remains
an important challenge.
In order to achieve high dispersion of filler in a polymer without sacrificing
interfacial characteristics, an alternative approach to preparing the composite attaches a
polymerization catalyst to the filler; the growing polymer chains originate in close
proximity to the filler, ideally dispersing the filler in the matrix. Previous work has mostly
focused on the method introduced by Kaminsky of adsorbing a cocatalyst, generally
methylalumoxane (MAO), to the filler material, binding a catalyst through cocatalyst-
metallocene ionic interactions, and then polymerizing.11 This polymerization-filling
approach has been successful using a variety of metallocene single site systems.12-24 The
bio-derived supports chitin, starch, and cellulose have been previously used with this
method.25 In a particularly compelling and recent report, Mülhaupt et al. supported MAO
on nanofibrillar cellulose,23 adhered an iron catalyst, and polymerized ethylene to obtain
mechanically reinforced composite materials. As far as we are aware, this method has not
been applied to CNCs as nanofillers for PE.
Herein we report a method to prepare CNC-filled PE nanocomposites that have
significantly greater stiffness when compared with conventional HDPEs, in a hitherto
unavailable, industrially scalable process. We selected wood-derived CNCs because they
have a theoretical modulus in the transverse direction of 18-50 GPa and an aspect ratio of
ca. 20.26 Moreover, this type of CNC is presently in commercial production.27 Importantly,

37
our method of supporting the metallocene catalyst represents a significant departure from
the methods reported by Kaminsky, Mülhaupt, and others. Whereas their method used a
nanofibrillar cellulose-bound alumoxane so that the metallocene would become activated
only at the CNC surface, we have chosen a complementary approach using a metallocene
that can engage in robust covalent bonding through tethering groups attached to the
cyclopentadienyl ligands.28-29 Mälder adsorbed TiCl4 directly to a cellulose surface and
polymerized ethylene therefrom, with the aid of an alumoxane cocatalyst.30 That result
shows that a covalently-bound transition metal catalyst can still polymerize ethylene, but
TiCl4-based catalysts typically do not exhibit single-site characteristics such as narrow
molecular weight distribution.30 Moreover, advantages of supporting the catalyst directly
onto the CNCs is that the stability of metallocenes relative to supported alumoxanes allows
for thorough and convenient washing via centrifuge in air making it an ideal process for
nanomaterials that are difficult to filter and wash under inert conditions, such as CNCs.
The other advantage is that the polymerization can be conducted as a slurry using an excess
of alumoxane in the solvent, which also serves to scavenge adventitious poisons; this
eliminates the need for an additional, non-activating scavenger such as
triisobutylaluminum. On the other hand, the primary advantage of supporting the
alumoxane before supporting the catalyst is that this method is compatible with a variety
of metallocene catalysts and allows a wide variety of catalysts to be screened quickly.
We will show that in our preliminary study, we bound metallocene catalyst to
CNCs, and we achieved a practical activity for polymerization ca. 500 kgPE molZr-1 h-1. In
tensile testing, the 7 vol% CNC in polyethylene material showed a 10-100% greater
Young’s modulus relative to commercial HDPE,31-32 though there is a noticeable decrease

38
in elongation at break 200-600% vs ca. 4%.31-32 We also tested a commercial ultra-high
molecular weight polyethylene (UHMWPE) sample at a low crystallinity and found that
our composite, 7 vol% CNC in PE, had a Young’s modulus fivefold greater than the
UHMWPE. The resulting films exhibited promising translucency, although
characterization of filler dispersion, as will be discussed, proved difficult.
2.2 Results and Discussion:
This article describes first the attachment of functionalized metallocene dibromide
catalysts onto the surface of cellulose nanocrystal (CNC) aerogel particles (Scheme 1), the
polymerization of ethylene from the surfaces of those particles, and the physical
characterization of the resulting CNC-PE composite materials.
Scheme 2.1: The proposed reaction for bromodimethylsilyl-functionalized zirconocene dibromide catalyst 1 with cellulose nanocrystals (CNC)s is shown. Substitution of the reactive Si-Br bonds results in formation of strong silyloxy linkages to the CNC.

39
2.2.1 Attachment of catalysts to cellulose nanocrystals (CNC)s:
We chose CNC aerogels to serve as heterogeneous supports for our metallocene
ethylene polymerization catalyst, with the idea that the flaky aerogel particles (Figure 2.1)
would break apart and become well dispersed during polymerization and then serve as a
nanofiller for the resulting PE resin. Our strategy for attaching metallocene catalysts to
CNCs is based on prior work of Deck and co-workers,28 who showed that
bromodimethylsilyl-functionalized zirconocene dibromides adsorb to hydroxylated
surfaces (e.g., silica) by reaction of the surface hydroxyl groups (Si-OH) with the reactive
substituent (Br-Si) to form covalent silyloxy linkages (Si-O-Si). Prior methods of silanizing
CNCs (solvent exchange methods or amine chemistry) would not be compatible with our
functionalized metallocene, which is quite sensitive toward hydrolysis of the Si-Br (and
Zr-Br) bonds.28-29
Figure 2.1: Scanning electron microscopy (SEM) images show functionalized CNCs as aerogel powder particles for Entries 2 and 3 (Table 1). The images show the flaky texture of the CNC aerogel particles (left), as well as their large size (right).

40
Aqueous CNC dispersions with concentrations of 60 mg mL-1 (in water) were
selected to prepare our aerogels. At higher concentrations, gelation (excessive physical
crosslinking) can occur, which could decrease the overall surface area upon freeze-
drying.33 At this concentration, freeze-drying resulted in minimal apparent shrinkage,
which has been observed when freeze-drying CNCs from more dilute solutions. We also
prepared one sample using 2:1 tert-butanol:water, which previous studies have shown
yields a higher surface area,34 but discovered (see below) that this approach did not result
in a higher activity.
CNCs are constructed of anhydroglucose units having three possible positions for
attaching a silyl group the hydroxyl groups at the O-2, O3, and O-6 positions. While have
not yet been able to determine the exact mode of binding (to which hydroxyl groups or
even to how many) in our materials, we expect the primary hydroxyls at the O-6 position
to be the most reactive largely due to steric effects. The O-2 position has been shown to be
otherwise equally reactive towards etherification, however the formation of a pentavalent
silicon intermediate during silylation might tend to amplify steric effects on relative site
reactivities.35-36 Prior studies have shown that, theoretically, for ideally dispersed CNCs
about half of the sites are available for functionalization.36 However, we only needed to
attach our catalyst to a small fraction of these available hydroxyl sites in order to obtain
the desired polymerization activity levels. Proposing (a) our supported catalyst would have
an activity approximately 1% that of zirconocene dichloride,28 (b) that we would run our
polymerizations for 1 h, and (c) that we wanted to form about 1 g of material having 20-
30% of CNC by weight, we estimated that we would need to adsorb about 4 mg (6.1 µmol)

41
of our catalyst for every 300 mg of CNC support. Each of our CNC samples (300 mg)
should contain ca. 0.88 mmol of anhydroglucose units and 0.44 mmol of primary surface
hydroxyl groups. At a maximum we could attach 0.22 mmol of our metallocene catalyst
assuming that both BrSiMe2 groups react at the surface and that all of the surface hydroxyl
groups are engaged. These calculations suggest that we only need to functionalize about
2.8% of the available hydroxyl groups. Additionally, using previous analysis and
measurements, the 36 cellulose chain rosette model, the average length of wood CNCs,
and nominal length of 5 Å per anhydroglucose unit, we estimate that there are roughly 65
catalyst molecules available per CNC.2, 37 These calculations show that there are enough
catalyst particles per CNC to effect the growth of numerous PE chains from the surface of
each individual CNC leading to a proposed separation of CNCs as they are clustered as
aerogel sheets. It is imperative for the reader to understand that these calculations are based
on a highly idealized model. In reality, the CNCs are significantly aggregated as aerogels,
so fewer surface hydroxyl groups are available for catalyst immobilization. In the
immobilization procedure, the CNCs are washed to remove any metallocene species that
are not covalently bound. Thus, the proportion of immobilized metallocene will certainly
be lower than we have projected, and immobilization may not be uniform throughout the
CNC material. As a result, productivities reported here represent a lower bound on the true
productivities of the competent surface-adsorbed catalytic species.
Accordingly, samples of CNCs (300 mg) were treated with (4 mg, 6.1 µmol)
portions of catalyst 1 in toluene, washed with solvent, and vacuum dried. Washing the
CNC-supported catalyst required some exploration because the CNC particles are so fine
that they flow easily through fine-porosity fritted-glass filters. Rather than search for even

42
finer-pored filtration apparatus, we found that using a centrifuge was a much more
convenient alternative, which we could even carry out under ambient atmosphere without
degrading the supported catalyst.38 This catalyst loading predicts a Zr:C ratio of 0.00055,
but X-ray photoelectron spectroscopy (XPS) characterization showed Zr:C ratio range of
0.0005 to 0.002. This suggests an even a higher loading of Zr than was provided in our
protocol. This result can be explained as our CNC-supported catalyst samples contain
particles in the micron size range in contrast to the penetration depth of XPS is only about
5 nm, and the catalyst molecules will be more concentrated at the surface.
In our XPS measurements we also analyzed the Br:Zr ratio to explore the mode of
binding of the catalyst to the CNC surface. Several possibilities are shown in Scheme 2.
The “ideal” structure (b) should have a Br:Zr ratio of 2:1, however the ratio observed was
actually 1:1 or even lower. We surmise that partial hydrolysis of the Zr-Br bonds from
adventitious moisture (likely introduced during catalyst washing procedures that included
some exposure to air) or “face-down” binding of the metallocene (forming Zr-O linkages
at the CNC surface) can account for the observed relative atomic concentrations. However,
the catalyst is still found to be active upon treatment with alumoxane cocatalyst (described
in a subsequent section), so we propose that if the alternative structures (d), (e), and (f) are
formed, they are rectified upon treatment with MMAO-12 to the ideal, active form of the
catalyst (c). Importantly, our washing procedures did not disrupt the vital Si-O bonds
retaining the metallocene on the CNC surface (see the section on washing studies below).
Silyl ethers bound to cellulose have been previously shown to be quite resistant toward
hydrolysis.39 XPS data is available in Figure S2.1. It should be noted that XPS is a great
technique for detecting small amounts of a chemical and doing so quantitatively. How

43
accurate XPS at this surface concertation for an uneven surface is not well understood. We
hope to support these finding using a chromophore with similar anchoring chemistry under
similar conditions, absorbance spectra are also sensitive at low concentrations.
Scheme 2.2: These proposed reactions lead to the robust adsorption of metallocene 1 on CNC surfaces.28-29 (a) Functionalized metallocene dibromide 1 and the putative, hydroxylated CNC surface; (b) “face-up” metallocene dibromide bound to the CNC surface through two covalent silyloxy linkages; (c) alumoxane-activated, surface-tethered metallocene; (d) and (e) partially hydrolyzed, surface-tethered metallocenes; (f) “face-down” metallocene bound to the CNC surface through two silyloxy linkages and a Zr–O linkage; Structures (d) – (f) are proposed to account for Br:Zr ratios less than 2:1 observed by XPS. We propose that structures such as (d) – (e), if they are formed, are reactivated upon treatment with excess alumoxane to generate the activated structure (c). 2.2.2 Polymerizations of ethylene from CNC supports:
Polymerizations from Table 1 resulted in similar activities, despite many of them
having minor procedural differences. For example, there were similar activities when
comparing polymerizations conducted on the higher surface area tert-butyl alcohol
freeze-dried sample when compared to other entries in the table. Entry 5 had an increase
in scale with a comparable activity to other entries. The slightly lower activities of

44
Entries 7-9 are in part because we assumed, in the calculation, that the CNCs from the
initial 300 mg are present and therefore all of the catalyst is still on the CNCs, while, in
fact, as much as a third of the CNCs are lost during centrifuge washing.
Table 2.1: Studies of PE polymerizations of catalyst supported on CNCs were activated with a 1100:1 Al:Zr ratio, catalyst loading of 1.3 wt%, washed by centrifuge, and polymerized at 25 °C under 1 atm of ethylene for 0.5 h. The differences in polymerization conditions for each sample are noted below the table as superscripts, and information concerning TGA can be found in the supporting information.
Entry CNCs dried before slurry
polymerization
Washing (# x mL)
Mass of Resin
(g)
Mass of CNCs
(g)
Activity (kgPE molZr
-
1 h-1)
vol% CNC
(TGA)
1i Yes 3 x 35 0.116 0.020 500 8%
2ii Yes 3 x 35 0.121 0.020 500 7%
3ii,iv Yes 3 x 35 0.187 0.020 400 6%
4 Yes 3 x 35 0.096 0.020 400 10%
5 Yes 3 x 35 0.738 0.094 700 7%
6iii Yes 2 x 35 0.034 0.020 70 17%
7v No 3 x 35 0.824 0.3 200 17%
8v No 2 x 35 0.862 0.3 200 16%
9v No 2 x 35 0.629 0.3 100 23%
(i) Light aerogel freeze-dried from 150 mg and tert-butyl alcohol water solution; (ii) Used the same aerogel; (iii) Dried in air; (iv) Polymerized for 1 h; (v) Estimated values are based on original aerogel mass.
The activities attained from this study (ca. 500 kgPE molZr-1 h-1) supported on CNCs
were comparable to a work from Deck and coworkers (1,300 kgPE molZr-1 h-1) supported
on silica gel. The lower activity in the present study is partly explained by the lower
temperature of 25 °C, compared to 50 °C used by Deck and coworkers.28 This study seems
to imply that the two supports effect similar activities, but only a direct comparison under
identical reaction conditions could confirm this finding.
2.2.3 Physical Characterization of CNC-PE Composite:
Samples representative of the best process of CNC composite fabrication, Entries
2 and 3 (Table 2.1), were analyzed for dispersion as films. The films used were obtained

45
from the gentlest processing methods possible; these processes are detailed in the
experimental section (2.4.7). This was done to ensure that possible residual acid did not
cause early oxidation the CNCs during processing. Minimal composite processing and
melting of the PE crystals was done to avoid a false positive conclusion regarding CNC
dispersion, ensuring the CNCs did not disperse because of processing. To find the
crystallinity of the composites and control films, the enthalpy of melting was found by
linear integration of DSC thermograms using the first heating cycle Figure S2.3. The
enthalpy of melting was compared with that of 100% crystalline polyethylene at 290 J g-
1.40 The translucency shown in Figure 2.2 suggests that CNCs are well-dispersed in the PE
matrix at ca. 6 vol%. These films were deemed good for mechanical testing, both DMA
and DSC, as they were cohesive and uniform.
Characterization of CNC dispersion in PE on a smaller scale done with atomic force
microscopy (AFM) to distinguish the stiffer CNCs from the softer PE. AFM images
(Figure 2.3) imply that aggregate bundles of CNCs are not present as the large aerogel
particles shown in Figure 2.1. While it is not shown that CNCs are individualized in the
polymer matrix, AFM should resolve micron size particles of CNCs.2 Additionally, we
were unable to find evidence of aggregation by SEM as shown in Figure S2.2.
Unfortunately, PE forms crystals that have comparable and greater dimensions to CNCs;41
this would complicate further characterization by transmittance measurements as the PE
crystals would scatter light. We infer from our results that the CNCs are well dispersed.
SEM is the standard technique to see objects on the nanoscale, but there is little contrast
between CNCs and PE. We hoped to overcome this lack of contrast with AFM imaging
which can see differences in modulus from the phase angle image. However, PE has

46
crystals that are similar in size, we thus used both tests to conclude there was no
aggregation. These results were supported by the DMA and tensile data that show good
reinforcement.
6 vol% CNC PE Entry 3
Commercial UHMWPE
Figure 2.2: Optical photographs of a 150-micron melt-pressed film of a 6 vol% CNC PE composite obtained as shown in Entry 3 of Table 2.1 (A) and of a 150-micron melt-pressed film of commercial UHMWPE (B).

47
Figure 2.3: Atomic force micrographs (AFM) show polished composite surface, a polished PE surface, and CNCs: A) the height image of a 6 vol% CNC PE film (Entry 3, Table 2.1), B) the height image for commercial UHMWPE, C) the height image for CNCs. Images D, E, and F are phase images that correspond to their above height image. Composite phase image D does not show signs of aggregation when compared with PE phase image E and CNC phase image F.
Mechanical data in Figure 2.4 shows a greater in storage modulus for the ca. 7
vol% CNC PE composites (Entries 2, 3, and 5 Table 2.1) ca. 4000 MPa, HDPE controls
from Goodfellow (GHDPE)-1 ca. 1800 MPa, a second control from Goodfellow (GHDPE)-
2 ca. 2100, UHMWPE ca. 1200 MPa respectively at 20 °C). We acknowledge that the
lower crystallinity of the commercial products, analyzed below, contributes to this
difference.5 For comparison, other groups have achieved similar storage moduli at 20 °C
in HDPE with higher filler loadings: 20 vol% copper nanoparticles ca. 4100 MPa (neat
HDPE ca. 2000 MPa),42 20% v/v graphite ca. 4500 MPa (neat HDPE ca. 1800 MPa),43 and
10 vol% graphite ca. 3100 MPa (neat HDPE 1800 MPa).43 DMA tensile analysis is difficult
to replicate as small deviations in sample prep can cause large scale differences in modulus.

48
We overcame this by carefully pulling the materials taut and observing both sides of the
film to ensure they were both equally taut. We did tensile testing to confirm that the relative
differences in storage modulus were similar to the differences in Young’s modulus.
Tensile data and crystallinity data comparing UHMWPE, 7 vol% CNC in PE, tested
GHDPEs, and commercial HDPE products are summarized in Table 2.2. Tensile data
comparing 7 vol% CNC (Entry 5 in Table 2.1), commercial UHMWPE at a low
crystallinity, commercial HDPE, and typical values for HDPE products imply that there is
an increased stiffness of the composite. Young’s modulus values were 1600 ± 100 MPa 7
vol% CNC composite material, 300 ± 30 MPa for UHMWPE, 500 ± 30 MPa GHDPE-1
and 350 ± 30 MPa GHDPE-2. Yield strength of the 7 vol% CNC composite, 29 ± 6 MPa,
greater than the yield strengths of the control samples and comparable to commercial
HDPE values 22-32 MPa. 31-32 There was however, a large decrease in elongation at break
for the composite material ca. 4%, when compared to controls and commercial products
Figure 2.4: The graph shows temperature representative traces of sweeps conducted from -150 °C to 160 °C on rectangular coupons at 1 Hz and an amplitude of 15 µm at 5 °C min-1 with the films of PE CNC composite 6 vol% (Entry 3, Table 2.1), PE CNC 7 vol% (Entry 2), GHDPE-1, GHDPE-2, UHMWPE, and 7 vol % (Entry 5) were tested by DMA.
1
10
100
1000
10000
-150 -100 -50 0 50 100 150
Sto
rage M
odulu
s (
MP
a)
Temperature ( C)
UHMWPE
GHDPE-1
GHDPE-2
7 vol% CNC/HDPE
6 vol% CNC/HDPE

49
Table 2.2. The low elongation at break may be attributed to the occasional voids present
as is visible in the SEM images Figure S2.2.
Tensile testing successfully measured the primary quantities of interest the Young’s
modulus and yield strength. Notably though the small size of these materials and crosshead
speed may have led to premature failure of the GHDPE-1, GHDPE-2, and 7 wt% CNC
composite samples. This limitation can be overcome with larger scale production allowing
for testing at multiple crosshead speeds and with larger samples.
Table 2.2: Physical property values below for UHMWPE,12 GHDPE-1, GHDPE-2, and 7 vol% CNC in PE were determined experimentally and values for HDPE 1 and HDPE 2 were taken from indicated sources.
Sample Young’s Modulus (MPa)
Elongation at Break (%)
Yield Strength (MPa)
Crystallinity (%) (DSC)
UHMWPE 300 ± 30 500 ± 70 21 ± 1 47
7 vol% CNC in PE
1600 ± 100 4 ± 2 29 ± 6 75
GHDPE-1 500 ± 30 40 ± 20 24 ± 1 61
GHDPE-2 350 ± 30 70 ± 10 20 ± 1 55
HDPE 132 1450 200 32 79
HDPE 231 800 1000 22 64
The first heating from the DSC found that the melting points of our composites
(Entries 2 and 3 in Table 2.1) were ca. 139 °C, UHMWPE was ca. 132 °C, and GHDPE-1
and GHDPE-2 were ca. 128 °C. Notably the PE of the composites was much more
crystalline, ca. 75%, in the processed state and only ca. 40% on the second heating Figure
S2.3. In contrast the UHMWPE was 47% crystalline on the first heating and 45%
crystalline on the second heating. GHDPEs showed a similar trend decreasing GHDPE-1

50
went from 61% to 55% crystalline, and GHDPE-2 went from 55% to 52% crystalline. The
comparatively low crystallinity value for UHMWPE was surprising, and is likely due to
the high melt viscosity which may make processing this material into a more crystalline
form difficult.44 Additionally, this may account for the surprisingly low Young’s modulus
observed for UHMWPE, and unfortunately processing it at a low temperature to maintain
its natural crystallinity proved difficult. GHDPE products were tested as additional
controls, using both methods of processing, they resulted in fair yield strength but lower
than expected elongation at break and Young’s moduli. As such, mechanical data for
commercial HDPE products (62-79% crystalline) was included for an additional
reference.31-32
Crystallinity data from DSC is not suitable for composites of unknown filler
content. TGA results were used to find the amount of CNCs in each sample and remove
the known mass fraction of the CNCs, as they do not have a thermal event Figure S2.5.
The calculated mass of PE from the composite was then used to calculate the heat of
fusion/melting.
The molecular weights of Entries 2, 3, and 7 as analyzed by TOSOH Bioscience
LLC, were found to have molecular weights (PDIs) of 1.77 Mg mol-1 (5.2), 1.74 Mg mol-
1 (3.4), and 0.726 Mg mol-1 (2.4) respectively. These high molecular weights were
unexpected, and they explain why the crystallinity of the second heating was comparable
to the commercial UHMWPE. The somewhat high polydispersity indices also suggest that
the catalyst may not be a truly single-site species. Interestingly, the ability to process the
composite materials below the melting temperature of the PE may be due to a low degree
entanglement of the PE chains; in order to form disentangled PE crystals, the catalyst sites

51
need to be distributed far away from one another and the polymerization must occur below
the crystallization temperature.45 These two conditions may have been met with the
polymerization conditions allowing for a lower than expected processing temperature of
the composites, and this disentanglement could allow for advanced processing conditions
such as oscillation shear injection molding.46
In comparing the mechanical properties of the 7 vol% CNC in PE in our work, we
chose an UHMWPE that we thought would be a good basis of comparison and added
GHDPE-1 and GHDPE-2 as additional controls. However, the low crystallinity lead to
much lower than expected values for Young’s modulus for all controls involved, as such
we chose another polyethylene to add as a comparison “HDPE 1” that likely has a lower
molecular weight than our material but a greater crystallinity. We think the properties of
the polyethylene we produced lies somewhere between the low crystallinity UHMWPE
and the highly crystalline HDPE 1.32 Therefore, we claim that there is a minimum of 10%
increase of Young’s modulus, showing reinforcement of the polymer material through the
presence of CNCs.
2.3 Conclusions:
We were successfully able to fabricate PE CNC composites in an efficient manner.
GPC data indicated, serendipitously, that we were able to make PE CNC composites with
MW near UHMWPE, that were implied to be well dispersed. Furthermore, this composite
material would be very difficult to synthesize using conventional mixing methods,47
whereas the method shown here should be scalable, tunable, and act as a platform method
for further nanocellulose reinforced polyolefin composites. Mulhaupt and Sapkota
produced polyethlene nanocellulose composites with similar Young’s moduli (ca. 1600

52
MPa). Although higher strength and comperable stiffness values are observed by
Mulhaupt, we attribute this to polymer and filler alignment during injection molding.48
Although beyond the scope of this paper, we hope to use conventional processing such as
injection molding with the current materials will hopeful yield even stiffer and stronger PE
CNC composites, which may then serve well in roles which require stiffness and are subject
to minor strains such as a component of sandwich composites for which carbon fiber
composites are largely used.49 The utilitarian value of this work makes it easily substituted
into current industrial polymerization processes. As such, further studies will be done
analyzing the scaling up this process, optimizing control of this process and creating
alternative methods to alter the molecular weights of resulting PE.
2.4 Experimental:
2.4.1 Materials:
ACS grade toluene from Fisher Scientific USA, was further purified by distillation
from sodium and benzophenone. All other reagents were used without further purification.
Grade 5.0 ethylene gas, 99.999% purity, was obtained from Praxair USA, HPLC grade
hexanes were purchased from Fisher Scientific. High density polyethylene (HDPE) MW
0.125 Mg mol-1 was purchased from Goodfellow, USA and is noted in the manuscript as
GHDPE. Ultra-high molecular weight polyethylene (UHMWPE) MW 3-6 Mg mol-1,
MMAO-12 solution (7 wt.% aluminum in toluene ca. 2.3 mmol/mL), tert-butyl alcohol,
and sodium bicarbonate were purchased from Sigma Aldrich, USA. Methanol, USP grade,
was obtained from Pharmco USA, and ACS grade hydrochloric acid was purchased from
Spectrum Chemical, USA. Water was purified to resistivity ≥16.7 MΩ using a Sybron
Barnstead purification system. Sulfuric acid hydrolyzed CNCs from wood (1.00 wt%

53
sulfur, ca. 300 mmol kg-1)50 were found to be 90 ± 40 nm length and 7 ± 2 nm height, as
shown in Figure 2.3 and Figure S2.4, and were obtained as a 11.8 wt% gel in water from
the Forest Products Laboratory, University of Maine USA. The 1,1’-
bis(bromodimethylsilyl)zirconocene dibromide catalyst 1 was made using previously
described methods.29
2.4.2 CNC Aerogel Formation:
CNCs were diluted to 60 mg mL-1 with deionized water and dispersed at 90 °C with
vigorous stirring followed by sonication in a Branson 2800 Ultrasonic bath. This process
was repeated until the CNC dispersion appeared homogeneous when viewed with crossed-
polarized films. Aqueous CNC dispersions (5 mL), measured by syringe, were then placed
into 50 mL Schlenk flasks. Sealed flasks were frozen in liquid nitrogen and vacuum-freeze-
dried while gradually warming over 8 h using a conventional vacuum pump. After the
samples had reached a pressure of 30 mTorr or less, they were dried using the same vacuum
system for at least 8 h at 80 °C, again a final pressure of 30 mTorr or less was reached.
One sample (Entry 1, Table 2.1) was prepared as above, except that tert-butanol
(45 mL) and (15 mL) of a 10 mg mL-1 aqueous dispersion of CNCs (150 mg) were
combined, in order to compare our aqueous protocol to a previously published method.34
2.4.3 Centrifuge-Washing:
To each aerogel (300 mg CNCs), contained in the same Schlenk flask used for its
preparation, anhydrous toluene (20 mL) was added under a nitrogen atmosphere. A stir bar
was fitted, and the aerogel was ground into a powder (slurry) by magnetic stirring
overnight. The catalyst 1 (4 mg, 6.1 µmol) was then added as a toluene solution, and the
mixture was stirred overnight at 30 °C to adsorb the metallocene onto the CNCs. For Entry
54
1, catalyst 1 (2 mg, 3.1 µmol) was added to keep the ratio of CNCs to catalyst the same.
Under air, the slurry was transferred to a 50 mL conical centrifuge tube. Hexanes was added
to reach a total volume of 35 mL. The tube was inserted into an Eppendorf 5810 centrifuge
fitted with an FA-45-6-30 rotor and spun at 10,000 rpm for 20 min to form a pellet. The
supernatant was decanted and discarded. Additional washes with hexane were conducted
for each experiment as shown in Table 2.1. Each wash included a cycle of vortex mixing,
centrifugation, and decantation of the supernatant. CNC aerogels for Entries 1-5 were
vacuum dried to remove hexanes and stored in a nitrogen glovebox while, the aerogel for
Entry 6 was allowed to dry under air in a centrifuge tube. The sample was not finely
divided, so toluene (10 mL) was added, the sample was agitated briefly, and the toluene
was removed under vacuum to obtain a dry powder, which was stored in a nitrogen
glovebox. For Entries 7-9, samples were left wet with the hexanes that remained after the
last decantation, and these were used directly in the ensuing polymerization experiments.
2.4.4 Polymerization of Ethylene:
Entries 7-9 (Table 2.1) were conducted using the entire sample of CNCs that
remained after solvent washing (see above). To each 50 mL Schlenk flask containing the
catalyst-infused CNCs (nominally 300 mg), dry toluene (20 mL), and MMAO-12 solution
(3-mL, 6.9 mmol Al) solution was added. A stir bar was fitted, and the flask was
equilibrated with a water bath at 25 °C. Ethylene was introduced into the flask using a
needle, and polymerization ensued for 0.5 h. Excess pressure was released through a
mineral oil bubbler, thereby maintaining the reaction at atmospheric pressure. Reactions
were then quenched with acidified methanol (prepared from concentrated aqueous HCl (5

55
mL) and methanol (45 mL)). The resulting polymer was collected on a medium glass fritted
funnel, washed with methanol, and dried under vacuum.
Polymerizations of Entries 2-4 and 6 (Table 2.1) were conducted using catalyst
bound CNCs (20 mg) weighed into each 50-mL Schlenk flask in a nitrogen glovebox.
Then, toluene (20 mL) and MMAO-12 solution (0.2 mL, 0.46 mmol Al) was added to each
flask. A stir bar was fitted, and the reaction mixture was stirred and equilibrated with a
water bath at 25 °C. Ethylene was introduced into the flask using a needle, and
polymerization ensued for 0.5 h, except for polymerization of Entry 3, in which
polymerization ensued for 1 h. The reactions were quenched, and the polymer composites
collected and washed as above.
Polymerization of Entry 5 was conducted as Entries 2-4 and 6, with the exception
of being done in a 100-mL Schlenk flask fitted with a stir bar with catalyst bound CNCs
(94 mg), MMAO-12 solution (0.94 mL, 2.26 mmol Al), and toluene (100 mL). To prevent
oxidation of the CNCs after the final methanol rinse, the resin was placed in aqueous
sodium bicarbonate solution (100 mg dissolved in 100 mL of water).
2.4.5 Scanning Electron Microscopy:
SEM images were obtained to determine the size of the CNC aerogel particles used
prior to polymerization. This powder was used for Entries 2 and 3 (Table 2.1) and
examined using a LEO Zeiss scanning electron microscope (SEM) with an in-lens detector
at 3 keV. The sample was spread onto double-stick carbon tape on the SEM mount and
then coated with 5 nm of iridium using a Leica sputter-coater. Images show that the CNC
particles, prior to polymerization reactions, were nominally 1-20 microns in diameter
Figure 2.1. Additional images of the cryo-microtomed surface of Entry 5 were prepared

56
and analyzed in the same manner (Figure S2.2). Micrographs revealed occasional voids in
the processed films which likely negatively affected the elongation at break and yield
strength of the composite materials.
2.4.6 X-ray Photoelectron Spectroscopy:
Dried CNCs from Entries 1-4 and 6 in Table 2.1 were analyzed using X-ray
photoelectron spectroscopy (XPS) on a PHI Versa Probe III. Samples were mounted on
adhesive tape and transferred to the ultra-high vacuum chamber anaerobically. Spectra
were acquired using a monochromatic Al Kα X-ray source at 100 W over a 1400 x 100 µm
area at a 45° takeoff angle. A survey scan (280 eV pass energy) was acquired, followed by
element scans (C, O, Br, Si, and Zr) using a 26-eV pass energy. These data were used to
estimate elemental composition of the CNCs with adsorbed metallocene catalyst.
2.4.7 Film Processing:
Samples from the best fabrication method, Entries 2, 3, and 5 in Table 2.1, were
pressed using a Carver press equipped with heating platens with 150 µm shims at 120 °C
for 5 min at 1 metric ton and at 7 metric tons for 5 min, then cooled overnight at 7 metric
tons (during the cooling period the pressure decreased from 7 to ca. 3 metric tons). The
first control GHDPE-1 was processed in the same manner but milled beforehand in a Spex
Cryomill for 9 minutes for good particle association. The UHMWPE sample from Sigma
Aldrich was treated in the same manner at a higher pressing temperature (180 °C) and the
second control GHDPE-2 was processed in this manner.
For the composites materials Entries 2, 3, 5 and GHDPE 1 a low temperature (120
°C) was chosen to obtain films to minimize the possibility of thermal degradation of the
CNCs, and this process, heating and holding is important for understanding the thermal

57
history of these materials. For the UHMWPE, the lowest temperature capable of producing
transparent cohesive films was chosen.
2.4.8 Dynamic Mechanical Thermal Analysis:
Three samples each from the polymers prepared in Entries 2, 3, 5, (Table 2.1)
GHDPE-1, GHDPE-2, and the UHMWPE control sample films were cut into rectangular
coupons greater than 10 mm length 3 mm width and 150 µm thickness with a razorblade.
Samples were analyzed at 1 Hz frequency with a ca. 5 mm clamp distance with a set
amplitude of 15 µm at a rate of 5 °C per minute in the temperature range of −150 °C to 160
°C using a TA Instruments DMA Q800 equipped with a tension clamp. Data for the
temperature range −150 °C to 160 °C is shown in Figure 2.4. Above 160 °C the sample
has melted. Entry 5 is omitted from Figure 2.4 as it is well represented by Entry 2 at 6
vol% CNC content.
2.4.9 Tensile Testing:
Samples of UHMWPE and CNC PE composite Entry 5 (Table 2.1) were cut as dog
bones with a 7 mm gauge length, 3 mm width, and measured thickness (ca. 150 µm) using
a punch indent and gently tracing with a razorblade to ensure dog bone edges were clean.
Samples were firmly clamped on an Instron Electroplus e1000 with a 1 kN load cell and
were pulled in tensile mode at a rate of 5 mm/min until broken. The zero-strain point was
set at 0.5 N force; Young’s moduli were calculated from 0 to 1% strain using linear
regression; yield stress was taken as the highest point on CNC/PE, GHDPE-1, and
GHDPE-2 curves and as the highest point from 0 to 20% strain for UHMWPE; elongation
at break was taken manually. Five samples were run for both commercial UHMWPE and
58
the CNC PE Composite Entry 5 Table 2.1, and representative curves are available in
Figure S2.6.
2.4.10 Thermogravimetric Analysis (TGA):
Samples from Entries from Table 2.1, UHMWPE, and CNCs (ca. 8 mg) were
analyzed using a TA Instruments TGAQ50, sweeping from room temperature to 600 °C at
20 °C min-1, under nitrogen atmosphere. The CNC content was approximated using
equations in Figure S2.5 and thermogravimetric data in the Supplemental Information.
Equation S1 in Figure S2.5 uses the volume fraction and the ratio of densities of PE and
CNCs to convert to volume fraction of CNCs in the sample. Equation S2 uses mass
fractions from TGA data to approximate the mass fraction of CNCs.
2.4.11 Gel Permeation Chromatography:
Gel permeation chromatography was performed by TOSOH using an EcoSEC high
temperature GPC system equipped with a refractive index detector. Tests were performed
at 1.0 mL/min at 1.0-1.5 mg/mL in 1,2,4-trichlorobenzene on Entries 2, 3, and 7 (Table
2.1).
2.4.12 Atomic Force Microscopy:
All atomic force microscopy (AFM) images were obtained using a Veeco
Multimode scanning probe AFM in dynamic mode. Films from polymerization Entry 3
(Table 2.1) were embedded in epoxy and cryo-polished on an RMC cryo-microtome by
cutting 250 nm sections of polymer. The commercial UHMWPE sample was polished in
the same manner without prior embedding in epoxy. To compare these images to neat
CNCs, one drop of an aqueous CNC solution (0.1 mg/mL) was placed onto a silicon wafer

59
and allowed to dry under air. Each of these samples were used to obtain the micrographs
shown in Figure 2.3.
2.4.13 Differential Scanning Calorimetry:
Films from Entries 2, 3, GHDPE-1, GHDPE-2 and neat UHMWPE (ca. 5 mg) were
analyzed using a TA Instruments DSCQ100, with a heat cool heat cycle at 10 °C/min from
room temperature to 160 °C, −150 °C, and then 160 °C. Melting point data was taken using
the initial peak melting temperature, and crystallization data was taken integrating the melt
using TA Universal Analysis software for integration using 290 J/g as the 100%
crystallinity PE basis.40
2.4.14 Washing Studies:
In order to ensure that our centrifuge washed polymerization experiments are
entirely heterogeneous, CNCs that were treated with metallocene 1 were washed at least
twice with hexane to remove any excess metallocene 1. The supernatant from the second
hexane wash from Entries 7-9 (Table 2.1) was tested for ethylene polymerization activity
(a sensitive test for the presence of a soluble metallocene!) by adding MMAO-12 solution
(3 mL, 6.9 mmol Al), bubbling ethylene through the solution for 0.5 h at room temperature,
quenching in acidified methanol, collecting any PE product on a filter, and drying under
vacuum. For these three experiments, 950 mg, 11 mg, and 68 mg of PE were obtained. In
the case of Entry 7, in which 950 mg of PE was produced, a third hexane wash was carried
out, which gave a supernatant that was inactive toward ethylene polymerization. We
conclude that two washes with hexane is sufficient to ensure that no soluble metallocene
remained.

60
Acknowledgments:
The authors thank Dr. Xu Feng and the Surface Analysis Laboratory at Virginia
Tech for the XPS analysis, Steve McCartney for assistance with AFM micrographs, and
Adwoa Baah-Dwomoh for assistance with tensile testing. The authors would also like to
gratefully thank Ilir Koliqi and Wei Lu from TOSOH Bioscience LLC for the difficult GPC
of the PE/CNC system. Work was completed with support from the Institute for Critical
and Applied Sciences (ICTAS) Doctoral Scholars Program, the Material Science and
Engineering Department and Chemistry Departments at Virginia Tech.
References:
1. Bhattacharya, M., Polymer Nanocomposites—A Comparison between Carbon
Nanotubes, Graphene, and Clay as Nanofillers. Materials 2016, 9 (4), 262.
2. Moon, R. J.; Martini, A.; Nairn, J.; Simonsen, J.; Youngblood, J., Cellulose
nanomaterials review: structure, properties and nanocomposites. Chemical Society Reviews
2011, 40 (7), 3941-3994.
3. Trache, D.; Hussin, M. H.; Haafiz, M. K. M.; Thakur, V. K., Recent progress in
cellulose nanocrystals: sources and production. Nanoscale 2017, 9 (5), 1763-1786.
4. Favier, V.; Cavaille, J. Y.; Canova, G. R.; Shrivastava, S. C., Mechanical
percolation in cellulose whisker nanocomposites. Polymer Engineering & Science 1997,
37 (10), 1732-1739.
5. Sapkota, J.; Jorfi, M.; Weder, C.; Foster, E. J., Reinforcing poly (ethylene) with
cellulose nanocrystals. Macromolecular rapid communications 2014, 35 (20), 1747-1753.
6. Nagalakshmaiah, M.; El Kissi, N.; Dufresne, A., Ionic Compatibilization of
Cellulose Nanocrystals with Quaternary Ammonium Salt and Their Melt Extrusion with
Polypropylene. Acs Applied Materials & Interfaces 2016, 8 (13), 8755-8764.
7. Nowlin, T. E., Global Polyethylene Business Overview. In Business and
Technology of the Global Polyethylene Industry, John Wiley & Sons, Inc.: 2014; pp 1-45.
8. Capadona, J. R.; Van Den Berg, O.; Capadona, L. A.; Schroeter, M.; Rowan, S. J.;
Tyler, D. J.; Weder, C., A versatile approach for the processing of polymer nanocomposites
with self-assembled nanofibre templates. Nat Nanotechnol 2007, 2 (12), 765-9.
9. Junior de Menezes, A.; Siqueira, G.; Curvelo, A. A. S.; Dufresne, A., Extrusion and
characterization of functionalized cellulose whiskers reinforced polyethylene
nanocomposites. Polymer 2009, 50 (19), 4552-4563.
10. Dufresne, A., Nanocellulose: from nature to high performance tailored materials.
Walter de Gruyter GmbH & Co KG: 2017.
11. Kaminsky, W., Metallocene Based Polyolefin Nanocomposites. Materials 2014, 7
(3), 1995-2013.

61
12. Kaminsky, W., Zirconocene catalysts for olefin polymerization. Catalysis Today
1994, 20 (2), 257-271.
13. Rosehr, A.; Luinstra, G. A., Polypropylene composites with finely dispersed multi-
walled carbon nanotubes covered with an aluminum oxide shell. Polymer 2017, 120, 164-
175.
14. Sturzel, M.; Kempe, F.; Thomann, Y.; Mark, S.; Enders, M.; Mulhaupt, R., Novel
graphene UHMWPE nanocomposites prepared by polymerization filling using single-site
catalysts supported on functionalized graphene nanosheet dispersions. Macromolecules
2012, 45 (17), 6878-6887.
15. Boggioni, L.; Scalcione, G.; Ravasio, A.; Bertini, F.; D'Arrigo, C.; Tritto, I.,
Ethylene‐co‐Norbornene Copolymers Grafted Carbon Nanotube Composites by In Situ
Polymerization. Macromolecular chemistry and physics 2012, 213 (6), 627-634.
16. Bahuleyan, B. K.; Atieh, M. A.; De, S. K.; Jabarulla Khan, M.; Al-Harthi, M. A.,
Easy one-pot method to control the morphology of polyethylene/carbon nanotube
nanocomposites using metallocene catalysts. Journal of Polymer Research 2012, 19 (2),
9744.
17. Ravasio, A.; Boggioni, L.; Tritto, I.; D'arrigo, C.; Perico, A.; Hitzbleck, J.; Okuda,
J., A non‐PFT (polymerization filling technique) approach to poly (ethylene‐co‐
norbornene)/MWNTs nanocomposites by in situ copolymerization with scandium half‐
sandwich catalyst. Journal of Polymer Science Part A: Polymer Chemistry 2009, 47 (21),
5709-5719.
18. Toti, A.; Giambastiani, G.; Bianchini, C.; Meli, A.; Bredeau, S.; Dubois, P.;
Bonduel, D.; Claes, M., Tandem Action of Early− Late Transition Metal Catalysts for the
Surface Coating of Multiwalled Carbon Nanotubes with Linear Low-Density Polyethylene.
Chemistry of Materials 2008, 20 (9), 3092-3098.
19. Kaminsky, W.; Funck, A.; Klinke, C., In-situ Polymerization of Olefins on
Nanoparticles or Fibers by Metallocene Catalysts. Topics in Catalysis 2008, 48 (1), 84.
20. Trujillo, M.; Arnal, M.; Müller, A. J.; Bredeau, S.; Bonduel, D.; Dubois, P.;
Hamley, I.; Castelletto, V., Thermal fractionation and isothermal crystallization of
polyethylene nanocomposites prepared by in situ polymerization. Macromolecules 2008,
41 (6), 2087-2095.
21. Bonduel, D.; Mainil, M.; Alexandre, M.; Monteverde, F.; Dubois, P., Supported
coordination polymerization: a unique way to potent polyolefin carbon nanotube
nanocomposites. Chemical Communications 2005, (6), 781-783.
22. Funck, A.; Kaminsky, W., Polypropylene carbon nanotube composites by in situ
polymerization. Composites Science and Technology 2007, 67 (5), 906-915.
23. Hees, T.; Zhong, F.; Rudolph, T.; Walther, A.; Mülhaupt, R., Nanocellulose
Aerogels for Supporting Iron Catalysts and In Situ Formation of Polyethylene
Nanocomposites. Advanced Functional Materials 2017, 27 (11), 1605586-n/a.
24. Alexandre, M.; Martin, E.; Dubois, P.; Marti, M. G.; Jérôme, R., Polymerization-
Filling Technique: An Efficient Way To Improve the Mechanical Properties of
Polyethylene Composites. Chemistry of Materials 2001, 13 (2), 236-237.
25. Eberhardt, A. M.; Ferreira, M. L.; Damiani, D. E., Heterogeneization of
polymerization catalysts on natural substances. Polymer Engineering & Science 2001, 41
(6), 946-954.

62
26. Lahiji, R. R.; Xu, X.; Reifenberger, R.; Raman, A.; Rudie, A.; Moon, R. J., Atomic
Force Microscopy Characterization of Cellulose Nanocrystals. Langmuir 2010, 26 (6),
4480-4488.
27. Cowie, J.; BILEK, E.; Wegner, T. H.; Shatkin, J. A., Market projections of cellulose
nanomaterial-enabled products. Tappi Journal 2014, 13 (6).
28. Cheng, X.; Lofthus, O. W.; Deck, P. A., Ethylene polymerization using silica-
supported zirconocene dibromide/methylalumoxane catalysts. Journal of Molecular
Catalysis A: Chemical 2004, 212 (1), 121-126.
29. Deck, P. A.; Fisher, T. S.; Downey, J. S., Boron−Silicon Exchange Reactions of
Boron Trihalides with Trimethylsilyl-Substituted Metallocenes. Organometallics 1997, 16
(6), 1193-1196.
30. Mälder. Ziegler-Natta-Polymerisation unter Verwendung von Stärke und
Stärkeabbauprodukten. University of Hamburg, 1987.
31. SABIC, SABIC HDPE F4520: High Density Polyethylene. Revision 20190506,
2018.
32. SABIC, SABIC HDPE M864SE: High Density Polyethylene. Revision 20181012,
2018.
33. De France, K. J.; Hoare, T.; Cranston, E. D., Review of Hydrogels and Aerogels
Containing Nanocellulose. Chemistry of Materials 2017, 29 (11), 4609-4631.
34. Shamskar, K. R.; Heidari, H.; Rashidi, A., Preparation and evaluation of
nanocrystalline cellulose aerogels from raw cotton and cotton stalk. Industrial Crops and
Products 2016, 93, 203-211.
35. Impens, N. R. E. N.; van der Voort, P.; Vansant, E. F., Silylation of micro-, meso-
and non-porous oxides: a review. Microporous and Mesoporous Materials 1999, 28 (2),
217-232.
36. Eyley, S.; Thielemans, W., Surface modification of cellulose nanocrystals.
Nanoscale 2014, 6 (14), 7764-7779.
37. Sacui, I. A.; Nieuwendaal, R. C.; Burnett, D. J.; Stranick, S. J.; Jorfi, M.; Weder,
C.; Foster, E. J.; Olsson, R. T.; Gilman, J. W., Comparison of the properties of cellulose
nanocrystals and cellulose nanofibrils isolated from bacteria, tunicate, and wood processed
using acid, enzymatic, mechanical, and oxidative methods. ACS Appl Mater Interfaces
2014, 6 (9), 6127-38.
38. Hlatky, G. G.; Upton, D. J., Supported Ionic Metallocene Polymerization Catalysts.
Macromolecules 1996, 29 (24), 8019-8020.
39. Klebe, J.; Finkbeiner, H., Silyl celluloses: a new class of soluble cellulose
derivatives. Journal of Polymer Science Part A: Polymer Chemistry 1969, 7 (7), 1947-
1958.
40. Hatakeyama, T.; Liu, Z., Handbook of Thermal Analysis. John Wiley and Sons, Inc:
Chichester, 1998.
41. Miao, W.; Zhu, H.; Duan, T.; Chen, H.; Wu, F.; Jiang, L.; Wang, Z., High-density
polyethylene crystals with double melting peaks induced by ultra-high-molecular-weight
polyethylene fibre. Royal Society Open Science 2018, 5 (7), 180394.
42. Molefi, J. A.; Luyt, A. S.; Krupa, I., Comparison of the influence of copper micro-
and nano-particles on the mechanical properties of polyethylene/copper composites.
Journal of Materials Science 2009, 45 (1), 82.

63
43. Tavman, I.; Krupa, I.; Omastova, M.; Sarikanat, M.; Novak, I.; Sever, K.; Ozdemir,
I.; Seki, Y.; Podhradska, S.; Moskova, D., Effects of conductive graphite filler loading on
physical properties of high‐density polyethylene composite. Polymer Composites 2012, 33
(7), 1071-1076.
44. Bykova, I.; Weinhardt, V.; Kashkarova, A.; Lebedev, S.; Baumbach, T.; Pichugin,
V.; Zaitsev, K.; Khlusov, I., Physical properties and biocompatibility of UHMWPE-
derived materials modified by synchrotron radiation. Journal of materials science.
Materials in medicine 2014, 25 (8), 1843-1852.
45. Lippits, D. R.; Rastogi, S.; Talebi, S.; Bailly, C., Formation of Entanglements in
Initially Disentangled Polymer Melts. Macromolecules 2006, 39 (26), 8882-8885.
46. Huang, Y.-F.; Xu, J.-Z.; Zhang, Z.-C.; Xu, L.; Li, L.-B.; Li, J.-F.; Li, Z.-M., Melt
processing and structural manipulation of highly linear disentangled ultrahigh molecular
weight polyethylene. Chemical Engineering Journal 2017, 315, 132-141.
47. Mariano, M.; El Kissi, N.; Dufresne, A., Cellulose nanocrystals and related
nanocomposites: Review of some properties and challenges. Journal of Polymer Science
Part B: Polymer Physics 2014, 52 (12), 791-806.
48. Xia, X.-C.; Yang, W.; Liu, Z.-Y.; Zhang, R.-Y.; Xie, D.-D.; Yang, M.-B., Strong
shear-driven large scale formation of hybrid shish-kebab in carbon nanofiber reinforced
polyethylene composites during the melt second flow. Physical Chemistry Chemical
Physics 2016, 18 (44), 30452-30461.
49. Koniuszewska, A. G.; Kaczmar, J. W., Application of polymer based composite
materials in transportation. Progress in Rubber Plastics and Recycling Technology 2016,
32 (1), 1-24.
50. Venkatraman, P.; Gohn, A. M.; Rhoades, A. M.; Foster, E. J., Developing high
performance PA 11/cellulose nanocomposites for industrial-scale melt processing.
Composites Part B: Engineering 2019, 174, 106988.
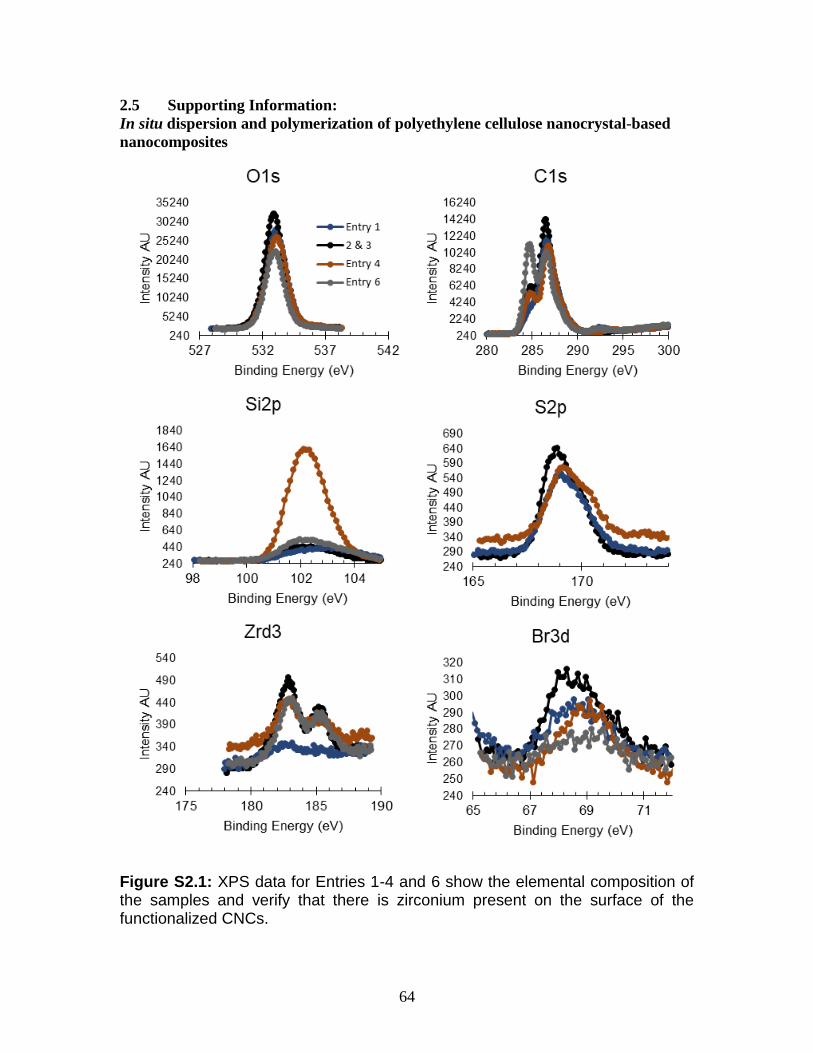
64
2.5 Supporting Information:
In situ dispersion and polymerization of polyethylene cellulose nanocrystal-based
nanocomposites
Figure S2.1: XPS data for Entries 1-4 and 6 show the elemental composition of the samples and verify that there is zirconium present on the surface of the functionalized CNCs.

65
Figure S2.2: These additional SEM images showed little evidence of aggregation and dispersion. The SEM images above are of the crymicrotomed surface of Entry 3 (Table 2.1) 6 vol% CNCs. A) An overall view of the cryomicrotomed surface, B) the general surface of the polymer. C) A region that shows potential dispersion of sharp spikes. Images D, E, and F show thin spindles of fibrous materials that are likely too long to be CNCs within the polymer.

66
Figure S2.3: Shown above is the first heating on a DSC on CNC composite Entry 2, Entry 3, UHMWPE, GHDPE-1, and GHDPE-2 films (Table 2.1). The samples were heated at 10 °C min-1. Melting points and crystallinity was measured using TA Universal Analysis software.
-30
-27
-24
-21
-18
-15
-12
-9
-6
-3
0
30 50 70 90 110 130 150
Hea
t F
low
(W
/g)
Temperature (°C)
UHMWPE
GHDPE-1
GHDPE-2
7%vol CNC/PE
6%vol CNC/PE

67
Figure S2.4: CNCs were measured using height and length to determine dimensions 90 ± 40 nm in length and 7 ± 2 nm in height using Gwyddion scanning probe microscopy software.

68
𝑣𝐶𝑁𝐶𝑠 =0.95
1.6𝑚𝐶𝑁𝐶𝑠
𝑚𝐶𝑁𝐶𝑠 = 𝑚200 °𝐶−𝑚375 °𝐶 + 𝑚575 °𝐶𝑚200°𝐶
Figure S2.5: Thermogravimetric analysis was performed on Entries 2, 3, 5, UHMWPE, and CNCs (Table 2.1). To approximate the amount of CNCs in the sample, equations assuming there was minimal CNC degradation in the flat areas were used to approximate the amount of CNCs in Entries 2, 3, and 5 as a volume fraction. The text v refers to volume fraction, m refers to mass fraction, the subscripts, temperatures, refers to the mass at which the temperature was taken, and 0.951 g∙cm-1and 1.62 g∙cm-1 are approximate density values for polyethylene an CNCs respectively.
0
0.25
0.5
0.75
1
0 100 200 300 400 500 600
Mass F
raction
Temperature (ºC)
Thermogravametric Analysis
Entry 2
Entry 3
Entry 5
UHMWPE
CNCs
(1)
(2)
)

69
0
10
20
30
40
50
60
0 2 4 6
Str
ess (
MP
a)
Strain (mm/mm)
UHMWPE
7 vol% CNC
GHDPE-1
GHDPE-2
0
5
10
15
20
25
30
0 0.05 0.1 0.15 0.2
Str
ess (
MP
a)
Strain (mm/mm)
UHMWPE
7 vol% CNC
GHDPE-1
GHDPE-2
Figure S2.6: Tensile data with representative curves of the samples is presented as the full curves A and shorter curves that highlight yield strength and Young’s Modulus B. GHDPE 1 and GHDPE 2 are differentiated with (GHDPE-1) and (GHDPE-2).

70
References:
1. Lu, N.; Oza, S., A comparative study of the mechanical properties of hemp fiber
with virgin and recycled high density polyethylene matrix. Composites Part B:
Engineering 2013, 45 (1), 1651-1656.
2. Moon, R. J.; Martini, A.; Nairn, J.; Simonsen, J.; Youngblood, J., Cellulose
nanomaterials review: structure, properties and nanocomposites. Chemical Society Reviews
2011, 40 (7), 3941-3994.

71
Chapter 3: Linear low-density polyethylene cellulose nanocrystal composites from in-situ
polymerization mediated by an anchored metallocene catalyst
This work is presently under consideration for publication in Polymer
International.
In this work I acknowledged the contributions of my fellow co-authors Sarita A.
Hough, Kenneth Knott, Wei Lu, Paul A. Deck, and E. Johan Foster. All co-authors
contributed with editing. Sarita A. Hough and Paul A. Deck synthesized the metallocene
catalyst 1,1’-bis(bromodimethylsilyl)zirconocene dibromide, Kenneth Knott performed
necessary NMR acquisition, and Wei Lu graciously provided GPC analysis. E. Johan
Foster and Paul A. Deck contributed ideas and critical evaluation of this work.

72
Linear low-density polyethylene cellulose nanocrystal composites from in-situ
polymerization mediated by an anchored metallocene catalyst
Keith D. Hendren, Sarita A. Hough, Kenneth Knott, Wei Lu, Paul A. Deck, and E. Johan
Foster
Abstract:
Cellulose nanocrystals (CNCs) were functionalized with different loadings of metallocene
catalyst and subjected to in situ polymerization with ethylene and 1-hexene to yield linear
low-density polyethylene (LLDPE) polymer matrix composites (PMCs). CNC content was
analyzed with thermogravimetric analysis (TGA), confirming that the PMCs varied in their
CNC loadings from 3.6 wt% to 11.4 wt%. Differential scanning calorimetric (DSC), gel
permeation chromatographic (GPC), and nuclear magnetic resonance spectroscopic
(NMR) analyses revealed that the LLDPE (matrix) components of these PMCs shared
similar physical properties. Dynamic mechanical analysis (DMA) showed a general
increase in the storage modulus of the PMCs with increasing CNC content. These relative
differences in storage modulus were even more evident at higher temperatures. Uniaxial
tensile testing of the PMCs found a notable increase in Young’s modulus between the 3.6
wt% CNC PMC (240 ± 50 MPa) and 11.4 wt% CNC PMC (391 ± 7 MPa), while the
elongation at break decreased from the 3.6 wt% CNC PMC (400% ± 90%) to the 11.4 wt%
CNC PMC (70% ± 10%). All PMCs showed similar yield strengths of ca. 10 MPa. These
mechanical properties showed that the method of dispersing CNCs in LLDPE reported
herein affords the highest moduli reported thus far in CNC-LLDPE PMCs. The ability of
the catalyst to incorporate comonomer opens the window of application for these materials.

73
3.1 Introduction:
Nanomaterials, defined as materials that have at least one dimension in the
nanoscale (0-100 nm), are often incorporated into polymers creating polymer matrix
composites (PMCs). Reasons for creating PMCs can be to improve polymer properties
including reinforcement, conductivity, antibacterial function, fluid transport, among
others.1 Nanomaterials are small enough (less than 1 µm) to provide significant
reinforcement,2 and they can be randomly oriented and reinforce a material equally in all
directions.3 Nanoparticles with strong attractive forces can interact with one another
favorably leading to reinforcement even when the matrix and filler have different surface
chemistry.4 For example, hydrophobic rubber latex was significantly reinforced by
interactions among dispersed hydrophilic cellulose nanocrystals (CNCs).4 CNCs are an
especially promising rod-shaped filler material having a high elastic modulus (110-220
MPa), low density (~1.6 g cm3), high aspect ratios, and a tendency to reinforce materials
in all directions unlike glass fibers or macroscopic cellulose fibers which tend to be highly
directional.3, 5
Polyethylene (PE), the world’s highest-volume polymer, is a low cost material with
excellent chemical resistance.6 However, both HDPE and LLDPE grades often suffer from
a low modulus, which presents an opportunity to improve on this limitation by introducing
filler materials such as mined clays and natural fibers.7-9 Natural fibers are the most
common bio-renewable filler added to HDPE and LLDPE creating PMCs which can be
commercially used for decking boards.7 However, a study found that more than 20 wt%
natural fiber content was required to reinforce the LLDPE matrix.10

74
In contrast to natural fibers, studies have found that CNCs reinforce PE at filler
loadings well below 20 wt%. PE variants that have been reinforced with CNCs include:
low-density polyethylene (LDPE),11-14 high density polyethylene (HDPE),15 and linear
low-density polyethylene (LLDPE).12, 16 Creating CNCs-PE PMCs involves methods such
as solvent casting with functional groups,12 rollerblade or melt mixing unfunctionalized
CNCs,11, 16 rollerblade or melt mixing functional CNCs,14, 17 or the solvent exchange or
templating approach.13
An emerging approach toward incorporation of nanomaterials into polymer
matrices is by polymerizing monomers near the surface of the nanomaterial.15, 18-24 Our
preliminary report described a new method to incorporate CNCs into an HDPE matrix to
produce a PMC.15 This was accomplished by covalently bonding a metallocene catalyst to
the CNCs, washing to remove any small fraction of soluble catalyst, slurrying the
metallocene-functionalized CNCs in toluene, adding a co-catalyst, and initiating
polymerization by of the introduction of ethylene.15 This method produced an CNC-HDPE
PMC under mild experimental conditions (1 atm of ethylene and 50 °C), and mechanical
testing showed an increase in Young’s modulus of the HDPE due to the presence of well-
dispersed CNCs.15
In the present study, we show that the CNC-LLDPE PMCs produced from in situ
polymerization likewise have a higher Young’s moduli than the previous leading method
for producing CNC-LLDPE PMCs, which was solvent casting 2-ureido-
4[1H]pyrimidinone (UPy) functionalized CNCs with LLDPE.12 Additionally, the in situ
polymerization PMCs have comparable mechanical properties compared to other LLDPE-

75
CNC PMCs that were functionalized with hydrophilic salts then mixed by twin screw
extrusion (TSE).16
3.2 Experimental:
This section contains procedures that were performed to create the catalyst 1
functionalized CNCs (C1-CNCs) and the resulting CNC-LLDPE PMCs. This section also
describes the procedures and instruments used to obtain analytical data.
3.2.1 Materials and Equipment:
Sodium bicarbonate, tert-butyl alcohol (TBA), 1,2,4-trichlorobenzene,
chromium(III) acetylacetonate, modified methylalumoxane (MMAO-12, 7% solution in
toluene), and a commercial LLDPE sample were purchased from Millipore Sigma.
Research grade ethylene from Praxair was used without further purification. Aqueous CNC
dispersions from sulfuric acid-hydrolyzed wood pulp were obtained from the University of
Maine Forest Products laboratory and have dimensions of 90 ± 40 nm in length by 7 ± 2
nm in height.15, 25 Methanol was purchased from Pharmco. Concentrated aqueous
hydrochloric acid was purchased from Spectrum Chemicals. Tetrachloroethane-d2 was
purchased from Cambridge Isotope Laboratories. ACS grade toluene from Fisher Scientific
was distilled from sodium and benzophenone ketyl under nitrogen. Hexanes of HPLC
grade from Fisher Scientific and 1-hexene of 97% purity from Millipore Sigma were
purified by distillation from calcium hydride (Alfa Aesar) under nitrogen. The anchoring
catalyst 1,1’-bis(bromodimethylsilyl)zirconocene dibromide (catalyst 1) was synthesized
as previously described.26

76
3.2.2 CNC Aerogel Preparation:
A 60-mg mL-1 dispersion of CNCs in water was prepared as previously described.15
A 500-mL Schlenk flask was charged with 10 mL of the CNC dispersion and 20 mL of
tert-butyl alcohol. The mixture was stirred magnetically for 15 min, and then the stir bar
was removed from the flask. The flask was sealed with a glass stopper. The mixture,
contained in the sealed flask, was frozen using liquid nitrogen for 0.5 h. Then, the flask
was removed from the liquid nitrogen bath, and a vacuum was applied to the flask
immediately. The vacuum was applied using a vacuum pump capable of reaching an
ultimate vacuum of 0.030 torr. We wanted to warm this flask slowly to room temperature
to sublime/evaporate the solvents gradually, so our initial plan was to lower this flask
immediately into a large Dewar flask at room temperature and cover the Dewar with foam
insulation. However, this procedure resulted in reproducible cracking of the flasks,
possibly from a change in the packing structure of the ice with an isothermal pressure
change. A successful approach involved instead holding the flask at room temperature for
30 minutes under vacuum to undergo partial warming, and then lowering it into the Dewar
flask, covering it with foam insulation, and continued subliming/evaporating of the
solvents for 24 h. This procedure resulted in removal of all visible solvent, without incident.
To ensure complete removal of the volatiles, the vacuum was applied continuously for
another 24 h at room temperature (without insulating the flask) and for 24 h at 80 °C using
an oil bath.15, 27

77
3.2.3 Catalyst Immobilization on CNC Aerogel:
To the 500 mL Schlenk flask containing the CNC aerogel, prepared as above, 40
mL of freshly distilled toluene was added. A stir bar was inserted, and the mixture was
stirred at ambient temperature for 15 h to pulverize the CNC aerogel.
In a nitrogen glovebox, a 2-mL septum-sealed vial containing 10-20 mg of catalyst
1 was prepared. Freshly distilled toluene (1 mL) was added to the vial using a syringe
affording a colorless solution. To each of four CNC aerogel/toluene aerogel slurries, a
different amount of catalyst 1 solution was added by syringe. The catalyst-functionalized
CNC aerogel samples are designated by the mass of catalyst in milligrams followed by the
mass of the CNC aerogel in milligrams. Catalyst 1 functionalized CNCs (C1-CNCs)
aerogels produced included 2_600, 4_600, 8_600, and 16_600. Thus, for example, the C1-
CNCs indicated as 2_600 were prepared by adsorbing 2 mg of catalyst 1 onto 600 mg of
CNC aerogel. These reactions of the CNC aerogels with catalyst 1 proceeded for 24 h at
30 °C; notably, we previously found that this reaction at room temperature during winter
months produced inactive CNCs.
Wash cycles were used to remove of soluble catalyst from C1-CNCs. The C1-CNC
slurries were combined with dry hexanes to produce a ca. 1:1 mixture of toluene to hexanes
and poured into 50-mL centrifuge tubes. The addition of hexane seemed to cause the C1-
CNCs to sink more easily to the base of the tubes. Slurries in conical tubes were centrifuged
at 10,000 RPM for 20 min with an Eppendorf 5810 centrifuge equipped with an FA-45-6-
30 rotor; a pellet formed, and the supernatant was discarded. The packed pellet was
combined with 35-mL of dry hexanes, vortex-mixed at 3,000 RPM to expose more C1-
CNC surface to fresh solvent, centrifuged at 10,000 RPM for 20 min, and decanted

78
removing the supernatant from the pellet. This washing procedure was repeated a total of
three times. Finally, each C1-CNC sample was transferred to a dry 50-mL Schlenk flask
as a slurry in 20 mL of hexanes and dried under vacuum (0.03 torr) at room temperature.
The flasks containing resulting powders were transferred to a nitrogen glovebox and these
CNC aerogel powders were transferred to storage tubes.
3.2.4 Polymerization from Catalyst 1 Functionalized CNC Aerogel:
For each polymerization a flame-dried 100-mL flask equipped with a magnetic stir
bar was charged with a sample of C1-CNCs in a nitrogen glovebox and sealed with a rubber
septum. The amount of C1-CNCs used was such that each of the four polymerizations used
0.67 mg of catalyst; addition of catalyst and C1-CNC content in each reaction is clarified
in Table 3.1. Each flask charged with C1-CNCs was connected to a nitrogen inlet, and 48
mL of toluene was injected. The C1-CNC toluene slurry was stirred at 50 °C in an oil bath,
and MMAO-12 solution (1 mL) and 1-hexene (1 mL) were added. Ethylene was added to
the slurry by a needle piercing the septum. Excess ethylene was released via the nitrogen
inlet of the flask into a mineral oil bubbler. The reaction was maintained under these
conditions for 30 min. The reaction was quenched with 45 mL of methanol mixed with 5
mL of concentrated aqueous hydrochloric acid. The precipitated composite material was
collected on a Buchner funnel and washed with 100 mL of methanol then 100 mL of
aqueous sodium bicarbonate solution (1 mg·mL-1). The resulting materials were dried at
80 °C under vacuum.

79
Catalyst 1 CNC aerogel
label
CNC aerogel (mg)
Catalyst 1 on CNC aerogel
(mg)
C1-CNCs in reactor (mg)
Catalyst 1 in reactor (mg)
2_600 600 2 200 0.67 4_600 600 4 100 0.67 8_600 600 8 50 0.67
16_600 600 16 25 0.67 Table 3.1: Catalyst 1 functionalized CNC aerogels (C1-CNCs) were developed by adding catalyst 1 to a CNC aerogel.
3.2.4 Melt Processing CNC-LLDPE PMC Resins:
Dried CNC-LLDPE PMCs were processed using a Carver laboratory press
maintained at 120 °C. Melt pressing was performed by first thermally relaxing the PMC
resins by sandwiching each between Kapton sheets with 250-µm shims for 5 min at 1
metric ton and then pressing the films at 7 metric tons for 5 min. Each CNC-LLDPE PMC
resins flowed to become a ca. 100 µm thick film. These CNC-LLDPE PMC films were
removed from the press immediately and peeled free from the Kapton once cooled.
3.2.5 X-ray Photoelectron Spectroscopy (XPS):
Elemental surface compositions of the C1-CNC aerogels were analyzed using X-
ray photoelectron spectroscopy (XPS) performed with a PHI VERSA Probe III scanning
XPS microscope using an Al K-alpha source (1486.6 eV). Each analysis included high
resolution scans for silicon, oxygen, carbon, zirconium, and bromine.
3.2.6 Nuclear Magnetic Resonance Spectroscopy (NMR):
Dried CNC-LLDPE PMC samples (250-300 mg) were added to 10-mm NMR tubes
along with a mixture of 5 vol% tetrachloroethane-d2 in 95 vol% 1,2,4-trichlorobenzene and
20 mg of chromium(III) acetylacetonate. The contents of each NMR tube were heated to
120 °C until the LLDPE portions of the PMC resins were dissolved. The dissolved LLDPE
was characterized at 135 °C on a Bruker Avance III NMR system (13C at 125 MHz). Each

80
sample received between 3,300 and 16,000 scans, with a relaxation time of 2 s. To ensure
quantitative results inverse gated decoupling was used.
3.2.7 Thermogravimetric Analysis (TGA):
Degradation profiles of each of the CNC-LLDPE PMC resins, a C1-CNC aerogel
sample (8_600), and a sample of commercial LLDPE (obtained from Millipore Sigma)
were analyzed on a TA Instruments TGA Q50. Each of the samples were held isothermally
at 80 °C for 20 minutes to remove residual water and then heated to 700 °C at a rate of 10
°C min-1.
3.2.8 Differential Scanning Calorimetry (DSC):
Thermal properties were analyzed for CNC-LLDPE PMC resin samples of ca. 5
mg for each PMC with a TA Instruments DSC Q20. PMC samples were heated to 160 °C,
cooled to –35 °C at 10 °C min–1 and heated to 160 °C at 10 °C min–1. The enthalpy of
melting (ΔHm) and the peak melting temperature (Tm) were determined by using linear
integration on the TA Instruments Universal Analysis software. The crystallinities of the
LLDPE portion of the PMC samples were determined as the quotients of the ΔHm for
LLDPE (ΔHmLLDPE) and the ΔHm for purely crystalline PE (ΔHmPE) as 290 J/g,28
(ΔHmLLDPE·ΔHmPE–1). LLDPE masses in the PMCs were approximated by subtracting the
CNC portion of the PMCs using TGA data and used in the DSC crystallinity measurements.
3.2.9 Gel Permeation Chromatography (GPC):
Molecular weight (Mw) and poly dispersity index were determined for each of the
four C1-CNC PMCs using gel permeation chromatography (GPC). Each sample was
dissolved in 1,2,4-trichlorobenzene while wrapped in a steel mesh to remove CNCs.
LLDPE at a concentration of ca. 1 mg mL-1 were run on an EcoSEC high temperature GPC

81
system equipped with a Tosoh Dual-Flow refractive index detector, and the resulting data
was processed by EcoSEC 8321GPC Analysis software. Three samples were run for each
of the PMC resins.
3.2.10 Scanning Electron Microscopy (SEM):
Microstructures of each of the CNC-LLDPE PMC resins were observed with a
Zeiss LEO scanning electron microscope (SEM). Prior to SEM analysis, PMC resins were
coated with 3 nm of iridium using a LEICA ACE600 sputter coater. PMC resins were then
analyzed using either the in-lens or secondary electron detectors with the electron beam
operating at 3-5 keV.
3.2.11 Uniaxial Tensile Testing:
Uniaxial tensile tests were performed with dogbone shaped CNC-LLDPE PMC
specimens that had a gauge length of 7 mm, a width of 3 mm, and a thickness of ca. 0.1
mm. The strain rate was set to 5 mm min–1 on a uniaxial Instron equipped with a 500-N
load cell. In all, 3-4 samples were run for each CNC-LLDPE PMC film.
3.2.12 Dynamic Mechanical Analysis (DMA):
Single amplitude temperature sweeps were performed for each CNC-LLDPE PMC
film with a TA Instruments DMA Q800 equipped with a tensile clamp. Rectangular
samples were cut from ca. 100-µm thick PMC films to be 5 mm in width and greater than
18 mm in length so the that the distance between the tensile clamps could be set to 15 mm.
The amplitude of the instrument was set to 20 µm, the frequency was set to 1 Hz, and the
temperature ramp rate was set to 5 °C·min–1 from –100 °C to mechanical failure of samples
(typically ca. 120 °C).

82
3.3 Results and Discussion:
This section contains the analysis of data that was obtained from the above
experimental procedures. This section also draws contrasts with previous studies and
critically analyzes the resulting PMCs.
3.3.1 CNC Aerogel Functionalization:
CNC aerogels were formed by freeze-drying a dispersion of CNCs from a 2:1
mixture of tert-butanol to water. CNC dispersions freeze-dried from this mixture have been
shown to afford a material with higher surface area than using a purely aqueous CNC
dispersion.27, 29 The tert-butanol water mixture was chosen to ensure that there would be
adequate surface for catalyst loading onto the CNCs, and a CNC aerogel made from a more
dilute dispersion of the CNCs in this mixture was previously used a support for catalyst
1.15 CNC aerogels were functionalized with catalyst 1 according to Scheme 3.1a. Analysis
from XPS was used to confirm the presence of zirconium on the C1-CNC aerogel surfaces.
The presence of zirconium and bromine was confirmed in low-resolution survey scans, but
the average quantitative values we obtained for all aerogels of 0.03% for zirconium and
0.04% for bromine using higher-resolution scans were not sufficiently above the detection
limits for zirconium or bromine to allow us to estimate Zr:Br ratios.30 The significance of
Zr:Br ratios in C1-CNC materials was described in our previous report.15
3.3.2 Olefin Polymerization from C1-CNCs:
C1-CNC aerogels were added to reaction flasks in amounts specified in Table 3.1.
After the addition of toluene to the catalyst supported on the C1-CNCs, the catalyst was
activated by MMAO-12. The active supported catalyst was then exposed to 1-hexene and
ethylene initiating the polymerization, this is described in Scheme 3.1b. The chemical

83
depiction of catalyst anchoring show in Scheme 3.1a is intended to portray only the general
concept that O-H bonds of the CNC surface are exchanged with Si-Br bonds of Catalyst 1
to afford covalent Si-O linkages between 1 and the CNC. Work is underway in our
laboratories to understand the structure of the catalyst-support interface in more detail.
Activities of catalyst 1 for each of the C1-CNCs were calculated assuming that all
of the catalyst 1 added was present on the surface of each C1-CNC aerogel and that all
CNCs from the C1-CNC aerogels were incorporated into PMC resins. The mass of each of
the CNC-LLDPE PMC resins generated are in Table 3.2. The activities of catalyst 1 were
very similar for each C1-CNC, but the highest catalyst loading C1-CNC sample (16_600)
a
b
Scheme 3.1: a The attachment of the anchoring catalyst 1,1’-bis (bromodimethylsilyl)zirconocene dibromide (catalyst 1) to the CNC was carried out under anhydrous conditions. b Catalyst 1 anchored on CNCs was activated by MMAO-12 and then ethylene and 1-hexene were added to initiate polymerization.
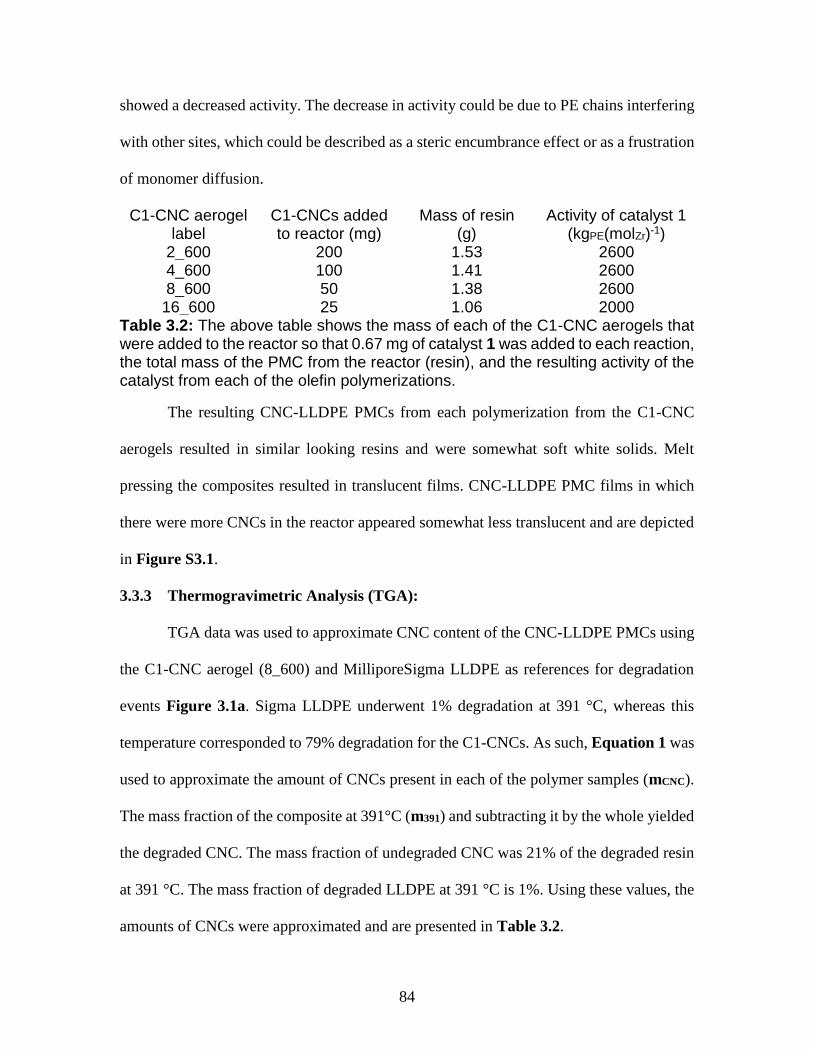
84
showed a decreased activity. The decrease in activity could be due to PE chains interfering
with other sites, which could be described as a steric encumbrance effect or as a frustration
of monomer diffusion.
C1-CNC aerogel label
C1-CNCs added to reactor (mg)
Mass of resin (g)
Activity of catalyst 1 (kgPE(molZr)-1)
2_600 200 1.53 2600 4_600 100 1.41 2600 8_600 50 1.38 2600
16_600 25 1.06 2000 Table 3.2: The above table shows the mass of each of the C1-CNC aerogels that were added to the reactor so that 0.67 mg of catalyst 1 was added to each reaction, the total mass of the PMC from the reactor (resin), and the resulting activity of the catalyst from each of the olefin polymerizations.
The resulting CNC-LLDPE PMCs from each polymerization from the C1-CNC
aerogels resulted in similar looking resins and were somewhat soft white solids. Melt
pressing the composites resulted in translucent films. CNC-LLDPE PMC films in which
there were more CNCs in the reactor appeared somewhat less translucent and are depicted
in Figure S3.1.
3.3.3 Thermogravimetric Analysis (TGA):
TGA data was used to approximate CNC content of the CNC-LLDPE PMCs using
the C1-CNC aerogel (8_600) and MilliporeSigma LLDPE as references for degradation
events Figure 3.1a. Sigma LLDPE underwent 1% degradation at 391 °C, whereas this
temperature corresponded to 79% degradation for the C1-CNCs. As such, Equation 1 was
used to approximate the amount of CNCs present in each of the polymer samples (mCNC).
The mass fraction of the composite at 391°C (m391) and subtracting it by the whole yielded
the degraded CNC. The mass fraction of undegraded CNC was 21% of the degraded resin
at 391 °C. The mass fraction of degraded LLDPE at 391 °C is 1%. Using these values, the
amounts of CNCs were approximated and are presented in Table 3.2.
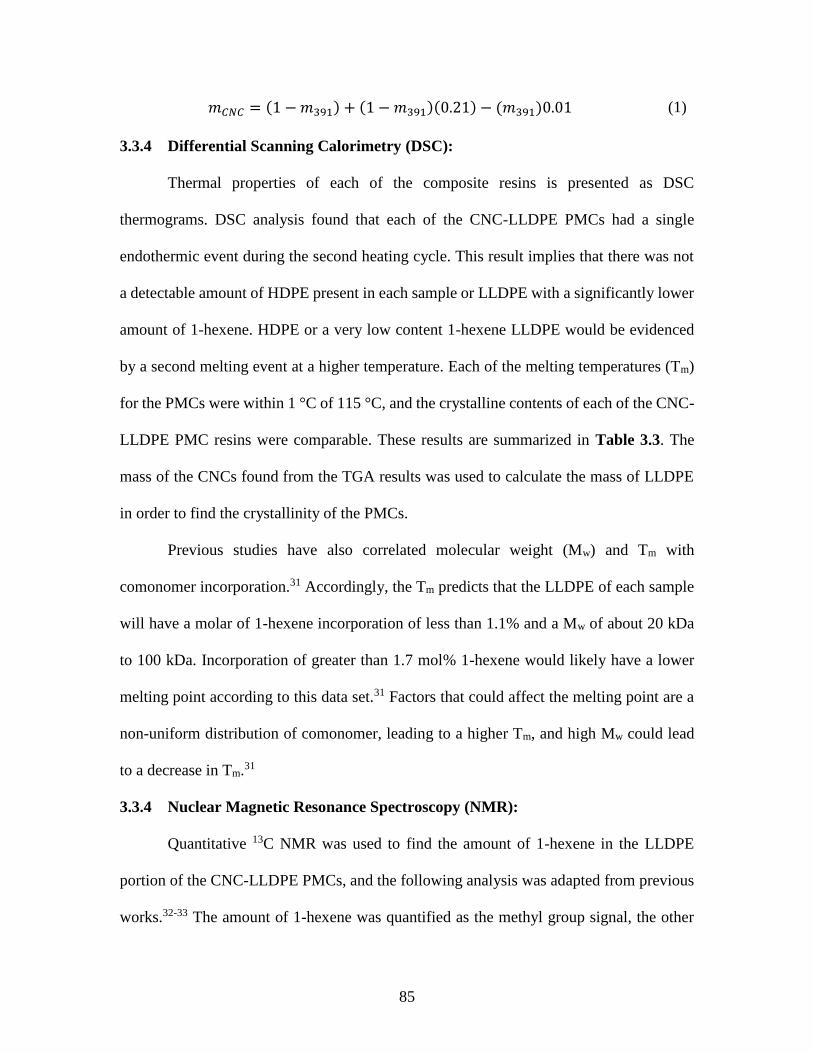
85
𝑚𝐶𝑁𝐶 = (1 − 𝑚391) + (1 − 𝑚391)(0.21) − (𝑚391)0.01 (1)
3.3.4 Differential Scanning Calorimetry (DSC):
Thermal properties of each of the composite resins is presented as DSC
thermograms. DSC analysis found that each of the CNC-LLDPE PMCs had a single
endothermic event during the second heating cycle. This result implies that there was not
a detectable amount of HDPE present in each sample or LLDPE with a significantly lower
amount of 1-hexene. HDPE or a very low content 1-hexene LLDPE would be evidenced
by a second melting event at a higher temperature. Each of the melting temperatures (Tm)
for the PMCs were within 1 °C of 115 °C, and the crystalline contents of each of the CNC-
LLDPE PMC resins were comparable. These results are summarized in Table 3.3. The
mass of the CNCs found from the TGA results was used to calculate the mass of LLDPE
in order to find the crystallinity of the PMCs.
Previous studies have also correlated molecular weight (Mw) and Tm with
comonomer incorporation.31 Accordingly, the Tm predicts that the LLDPE of each sample
will have a molar of 1-hexene incorporation of less than 1.1% and a Mw of about 20 kDa
to 100 kDa. Incorporation of greater than 1.7 mol% 1-hexene would likely have a lower
melting point according to this data set.31 Factors that could affect the melting point are a
non-uniform distribution of comonomer, leading to a higher Tm, and high Mw could lead
to a decrease in Tm.31
3.3.4 Nuclear Magnetic Resonance Spectroscopy (NMR):
Quantitative 13C NMR was used to find the amount of 1-hexene in the LLDPE
portion of the CNC-LLDPE PMCs, and the following analysis was adapted from previous
works.32-33 The amount of 1-hexene was quantified as the methyl group signal, the other

86
secondary and tertiary carbon signal was integrated, and the enchained 1-hexene was
subtracted from the secondary tertiary carbon signal. The sum of the methyl carbons was
found by integrating the peak at ca. 15 ppm and defining this integral as 1 using the
Mestrelab MNova spectral analysis software. The sum of all the other carbons the
methylene (-CH2-) carbons and tertiary branch carbons (>CH-) was evaluated by
integrating the region from 23 ppm to 40 ppm. The mols of ethylene was found by
subtracting the secondary and tertiary carbon signal by 5, the defined remaining carbons in
1-hexene. This approach was validated by absence of the end groups alkene carbons
(CH3=CH2) at 115-140 ppm. The results shown on Table 3.3 show similar amounts of 1-
hexene incorporation within each of the polymer samples, and the results from DSC affirm
that the LLDPE components of the PMCs are similar. The NMR spectra are presented as
Figure S3.2.
In order to have manageable relaxation times chromium(III) acetylacetonate was
added to each of the PMC samples. 13C NMR was chosen as previous work had been done
allowing for the assignment of peaks. From this we were able to conclude that there were
not runs of hexene due to the absence of peaks at 40-42 ppm. Concentrations of >250 mg
in 4 mL or >60 mg mL-1 were used to increase signal. 13C has more space between signals
using (10-200ppm) relative to (0-10ppm) allowing for better peak separation especially
because particulates are present in the spectra. Another concern is temperature, LLDPE
samples did not dissolve at room temperature, so we used higher temperatures to solubilize
the LLDPE.
The mechanical properties of the composites could be affected by changes in 1-
hexene content. In a previous study of neat LLDPE materials, it was found that the yield

87
strength dramatically decreased with increasing 1-hexene content from ca. 10 MPa at 0.6-
1.14 mol% 1-hexene to <5 MPa at >2.84 mol% 1-hexene.34 Elongation at break was similar
for samples between 0.6-3.52 mol% 1-hexene having values 1500-2000%.34 The initial
modulus (2-3% secant modulus) similar to Young’s modulus was found to relate to the
crystalline content of the LLDPE, but the initial modulus was between 40 and 70 MPa and
decreased with increasing 1-hexene content.34 Strain hardening, however was quite
different for those samples having higher 1-hexene content.34 From this information it
seems likely that the elongation at break was not affected, but the yield strengths and
Young’s modulus of the PMCs may be affected.
The concentration of 1-hexene was found to be nearly constant throughout the
reaction, assuming that negligible amounts of 1-hexene was evaporated during the reaction.
This assumes that the compositional homogeneity of the LLDPE was not affected by
changes in 1-hexene concentration. The amount of 1-hexene before and after the reaction
was calculated from the resulting NMR data and the mass of each CNC-LLDPE PMC
sample. This approximation assumes the mass of 1-hexene (m1-hexene) in each PMC was
calculated by using Equation 2. The mass of LLDPE (mLLDPE) was approximated as the
difference between the mass of the PMC resin minus the mass of CNCs added to the
reactor. Each PMC was near 6 wt% 1-hexene and each reaction consumed ca. 10 wt% of
the total 1-hexene. The change concentration in 1-hexene of the reactor was only from 2
vol% to about 1.7 vol%.
𝒎𝟏−𝒉𝒆𝒙𝒆𝒏𝒆 = 𝒎𝑳𝑳𝑫𝑷𝑬
𝑴𝒘,𝟏−𝒉𝒆𝒙𝒆𝒏𝒆 × 𝒎𝒐𝒍%𝟏−𝒉𝒆𝒙𝒆𝒏𝒆
𝑴𝒘,𝟏−𝒉𝒆𝒙𝒆𝒏𝒆 × 𝒎𝒐𝒍%𝟏−𝒉𝒆𝒙𝒆𝒏𝒆 + 𝒎𝒐𝒍%𝒆𝒕𝒉𝒚𝒍𝒆𝒏𝒆 × 𝑴𝑴𝒘,𝒆𝒕𝒉𝒚𝒍𝒆𝒏𝒆
(2)

88
Table 3.3: The table denotes CNC content of PMCs, crystallinity of LLDPE portion of PMCs, peak melting point of PMCs, and 1-hexene content of PMCs.
3.3.5 Gel Permeation Chromatography (GPC):
PMC samples analyzed by gel permeation chromatography showed similar
molecular weight in terms of both weight (Mw) and number averages (Mn), and the PDIs
of the PMCs are lower than the PDIs typical of Ziegler-Natta catalyst polyethylenes (Table
3.4). A clear highlight of this data is that the 11.4 wt% CNC and 3.4 wt% CNC samples
have the same Mw and only moderately differ in terms of Mn. Importantly, each of these
LLDPE samples are not radically different from one another and have Mw differences that
should reflect similar LLDPE portion of the PMCs.
C1-CNC PMC
Mn (kDa) Mw (kDa) PDI
2_600 42 129 3.09 4_600 34 138 4.04 8_600 41 170 4.12
16_600 23 128 5.60 Table 3.4: This table shows the Mw, the number average Mn, and the PDI for each of the polymer samples. Subsequent runs of each sample had variability of less than 1%.
C1-CNC Aerogel
CNC content (wt%)
Crystallinity Peak Tm
(°C) 1-hexene content
2_600 11.4 39% 115 1.6% 4_600 5.8 34% 115 1.9% 8_600 4.4 35% 115 2.3%
16_600 3.6 41% 116 1.6%
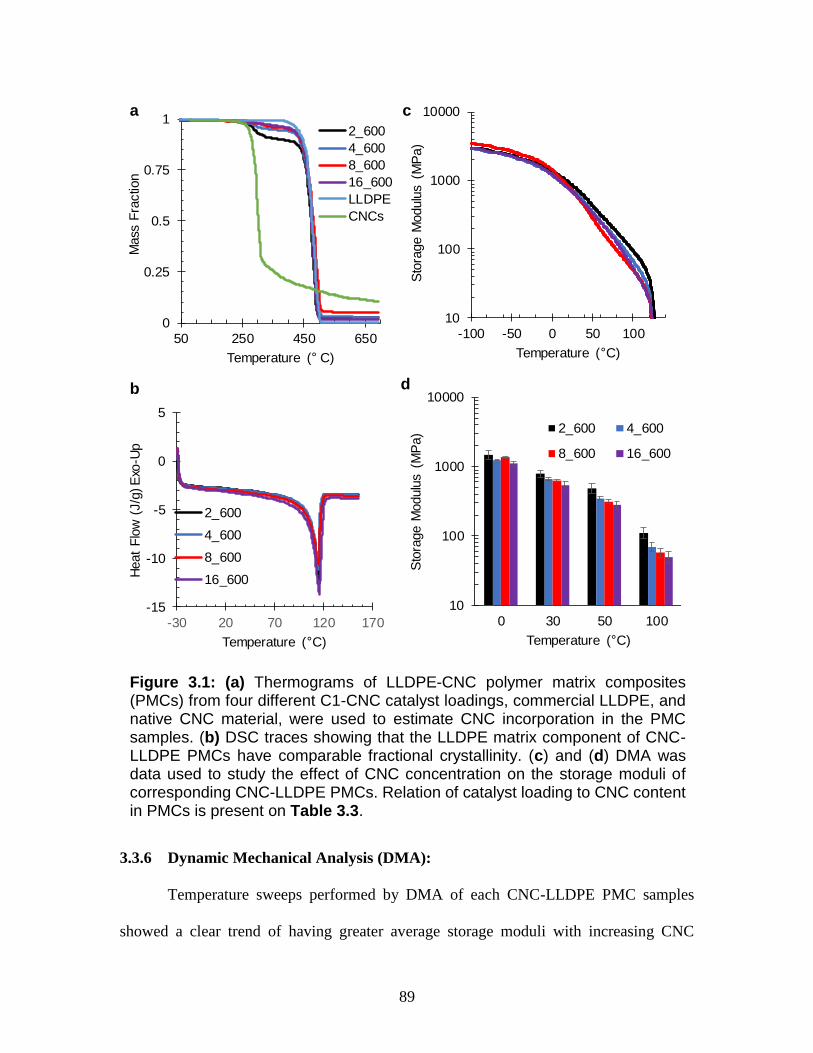
89
3.3.6 Dynamic Mechanical Analysis (DMA):
Temperature sweeps performed by DMA of each CNC-LLDPE PMC samples
showed a clear trend of having greater average storage moduli with increasing CNC
10
100
1000
10000
0 30 50 100
Sto
rage M
odulu
s (M
Pa)
Temperature ( C)
2_600 4_600
8_600 16_600
10
100
1000
10000
-100 -50 0 50 100
Sto
rage M
odulu
s (M
Pa)
Temperature ( C)
-15
-10
-5
0
5
-30 20 70 120 170
Heat
Flo
w (
J/g
) E
xo-U
p
Temperature ( C)
2_600
4_600
8_600
16_600
0
0.25
0.5
0.75
1
50 250 450 650
Mass
Fra
ctio
n
Temperature ( C)
2_600
4_600
8_600
16_600
LLDPE
CNCs
Figure 3.1: (a) Thermograms of LLDPE-CNC polymer matrix composites (PMCs) from four different C1-CNC catalyst loadings, commercial LLDPE, and native CNC material, were used to estimate CNC incorporation in the PMC samples. (b) DSC traces showing that the LLDPE matrix component of CNC-LLDPE PMCs have comparable fractional crystallinity. (c) and (d) DMA was data used to study the effect of CNC concentration on the storage moduli of corresponding CNC-LLDPE PMCs. Relation of catalyst loading to CNC content in PMCs is present on Table 3.3.
a
b
c
d

90
content, which, in turn, results from decreased loading of metallocene onto the CNC (see
Table 3.3) Analysis of the leathery region of the DMA curves shows that the CNCs may
act as physical crosslinks inhibiting segmental motion of the LLDPE chains within the
PMCs, and the relative difference between each PMC is exceptionally evident at 100 °C
(Figure 3.1c). However, all of these PMCs materials seem to have similar processing
temperatures as there is a clear point of mechanical failure at ca. 120 °C as shown in Figure
3.1c.
3.3.7 Uniaxial Tensile Testing:
The uniaxial tensile data from the CNC-LLDPE PMCs was evaluated for changes
in Young’s modulus, elongation at break, and yield strength. Each PMC showed a definite
trend of increasing Young’s modulus, a metric for reinforcement, with increased CNC
loading. The largest difference in Young’s modulus was between the 11.4 wt% CNC PMC
with a Young’s modulus of 391 ± 7 MPa versus the 3.6 wt% CNC PMC with a Young’s
modulus of 240 ± 50 MPa. The elongation at break however, did not follow the typical
trend of decreasing with increasing filler loading. The composites had yield strengths of
10-11 MPa that did not vary significantly. Values of elongation at break were insignificant
with the 11.4 wt% CNC PMC had a value of (70% ± 10%) and the 5.8 wt% CNC PMC
had (60% ± 30%), while the 4.4 wt% CNC PMC (850% ± 60%) and the 3.6 wt% (400% ±
90%) CNC PMC had much greater elongation at break values. Tensile data is presented in
Figure 3.2, Table S3.1, and as representative curves in Figure S3.3.
An interesting feature of the curves (Figure S3.3) is the strain hardening that the
4.4 wt% CNC PMC and 3.6 wt% CNC PMC undergo. The 3.6 wt% PMC undergoes little
strain hardening deformation having effectively the same yield strength and stress at break

91
ca. 10 MPa. The 4.4 wt% CNC PMC however undergoes a much more pronounced strain
hardening the yield strength is 10 ± 2 MPa and the strain at break is 18 ± 3 MPa. The strain
hardening of 1-hexene LLDPE has been shown to occur at a faster rate with increased 1-
hexene content.34 The lower crystallinity allows for the polymer to become crystalline
while being strained. It also seems that an effective percolation of the CNCs occurs
between the PMCs of 4.4 wt% CNC and 5.8 wt% CNCs, where there is a dramatic decrease
in elongation at break. The percolation threshold for the CNCs is estimated to be between
2.7-7.8 vol% and assuming the LLDPE has a density of 0.90 g cm-1 and the CNCs have a
density of 1.6 g cm-1 the PMCs are 2.6 vol% and 3.4 vol% CNC respectively. This estimate
uses the lower and upper bound aspect ratios (50/9) and (130/5) and assumes the
percolation threshold, volume fraction=(0.7/aspect ratio), is true for aspect ratios below
30.
The resulting mechanical properties from C1-CNCs used to make LLDPE-CNC
PMCs look favorable when compared the previous work12 on modified 2-ureido -
4[1H]pyrimidone (UPy) modified CNCs used to make CNC-LLDPE PMCs. In
comparison, C1-CNC PMCs had greater Young’s modulus at similar filler loadings, but
the C1-CNCs were not able to maintain the elongation at break values >100% with high
fillers loadings.12 Another previous work that combined modified CNCs in LLDPE by melt
mixing to make PMCs showed similar mechanical properties at similar filler loadings.16
These results showed Young’s modulus values of neat pure at ca. 100 MPa and vales of
ca. 200 MPa for 3 wt% unmodified CNCs in LLDPE , 3 wt% N,N -dialkyl-3-
methoxyazetidinium salt modified CNCs, and 3 wt% 1,1’-dihexyl-3-methoxyazetidnium
chloride modified CNCs.16 Data from these studies is presented in Table S3.1.

92
In an effort to compare C1-CNC LLDPE PMCs to those in literature,12, 16 a point
of reference for a commercial 1-octene LLDPE was established with a Young’s modulus
of ca. 140 MPa35 that is similar to the LLDPEs used in the previous studies.12, 16
Additionally, the Tm obtained from commercial 1-octene LLDPE is (ca. 115 °C) and that
value is the Tm obtained from the C1-CNC LLDPE PMCs. The commercial 1-hexene
LLDPE had a higher melting point36 and was not used for this comparison, but the C1-
CNC LLDPE with 11.4 % CNC loading had a greater Young’s modulus (391 ± 7 MPa)
that commercial 1-hexene LLDPEs (ca. 300 MPa).36 A previous study that graphed 1-
hexene incorporation and melting point suggests that these commercial 1-hexene LLDPEs
(Tm ca. 125 °C) contain less than 0.4 mol% 1-hexene.31
3.3.8 Imaging:
Optical photographs were taken of the pressed films (Figure S3.2). SEM imaging
of the C1-CNC aerogels found that they were flaky structures, and they do not seem distinct
Figure 3.2: Tensile data Young’s modulus a and b elongation at break of C1-
CNC LLDPE PMCs were compared with tensile data from other studies. The
symbols are represented as C1-CNC PMCs , UPy modified CNC PMCs Х,11
twin screw extruded (TSE) CNC PMCs ♦,16 TSE N,N -dialkyl-3-
methoxyazetidinium salt (S1) modified CNC PMCs ,16 and 1,1’-dihexyl-3-
methoxyazetidnium chloride (S2) modified CNC PMCs +.16
0
50
100
150
200
250
300
350
400
450
0 5 10
Yo
un
gs M
od
ulu
s (M
Pa
)
CNC Loading (wt%)
0
200
400
600
800
1000
1200
1400
0 5 10 15 20
Elo
ng
atio
n a
t b
rea
k (
%)
CNC Loading (wt%)
C1-CNCs
Upy CNCs
TSE CNCs
TSE S1-CNCs
TSE S2-CNCs
a b

93
from the structures that were previously analyzed (Figure S3.3).15 The images of the
polymer materials taken as a dried unprocessed resin show an interesting cracking dendritic
pattern. This dendritic pattern is different from the documented fragmentation of silica gel,
which clearly shows the origin for polymerization.37-38 A study that has polymerized
ethylene from carbon nanotubes (CNTs) shows a channel of PE holding a CNT.39 The
channels in the CNC-LLDPE are near that scale and could be representative of a network
of CNCs in the PMC. It is difficult to prove that the polymerization originated from the
C1-CNCs (Figure 3.3). The distribution of this structure throughout each PMC is worthy
of further study. The main limitation of SEM is the lack of contrast between CNCs and the
LLDPE, but SEM can be used to find interesting structure with a height contrast as shown
in these images (Figure 3.3).

94
3.4 Conclusions:
We were able to incorporate CNCs in LLDPE in a manner that is scalable and
include These C1-CNC PMCs have shown an increased Young’s modulus with increasing
CNC loading, suggesting that the CNCs are taking a large share of the load from applied
stresses. The composites have also shown good translucency and elongation at break
implying that there is not significant aggregation in the PMC leading to premature tearing.
The C1-CNC PMCs presented here have the highest Young’s moduli at their respective
loadings of CNC, relative to other CNC-LLDPE PMCs. The increased Young’s modulus
could lead to applications of advanced composite materials where the scale of
reinforcement begins at the nanoscale and more macroscopic material are added.1
Figure 3.3: SEM micrographs were taken at 10 kX magnification and show dark
structures that are fanning outward highlighted in white circles. The images
correspond to: a 11.4 wt% CNC PMC, b 5.8 wt% CNC PMC, c 4.4 wt% CNC
PMC, and d 3.6 wt% CNC PMC. Scale bars are 1 µm.
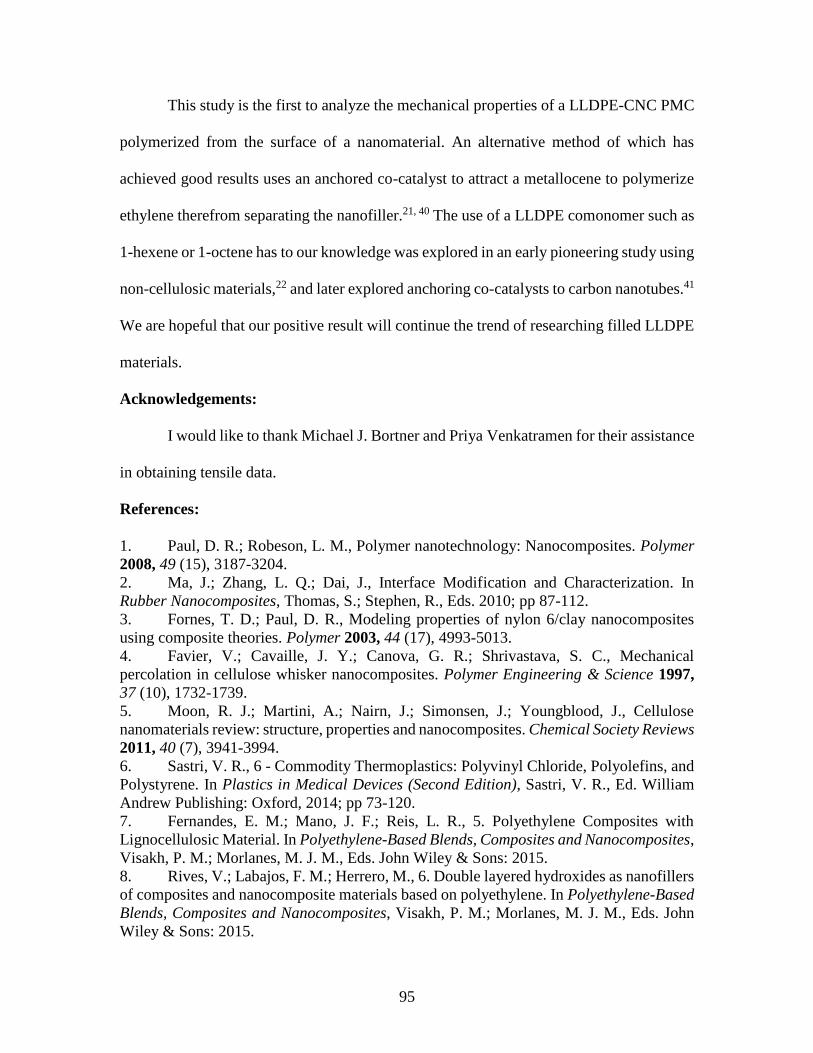
95
This study is the first to analyze the mechanical properties of a LLDPE-CNC PMC
polymerized from the surface of a nanomaterial. An alternative method of which has
achieved good results uses an anchored co-catalyst to attract a metallocene to polymerize
ethylene therefrom separating the nanofiller.21, 40 The use of a LLDPE comonomer such as
1-hexene or 1-octene has to our knowledge was explored in an early pioneering study using
non-cellulosic materials,22 and later explored anchoring co-catalysts to carbon nanotubes.41
We are hopeful that our positive result will continue the trend of researching filled LLDPE
materials.
Acknowledgements:
I would like to thank Michael J. Bortner and Priya Venkatramen for their assistance
in obtaining tensile data.
References:
1. Paul, D. R.; Robeson, L. M., Polymer nanotechnology: Nanocomposites. Polymer
2008, 49 (15), 3187-3204.
2. Ma, J.; Zhang, L. Q.; Dai, J., Interface Modification and Characterization. In
Rubber Nanocomposites, Thomas, S.; Stephen, R., Eds. 2010; pp 87-112.
3. Fornes, T. D.; Paul, D. R., Modeling properties of nylon 6/clay nanocomposites
using composite theories. Polymer 2003, 44 (17), 4993-5013.
4. Favier, V.; Cavaille, J. Y.; Canova, G. R.; Shrivastava, S. C., Mechanical
percolation in cellulose whisker nanocomposites. Polymer Engineering & Science 1997,
37 (10), 1732-1739.
5. Moon, R. J.; Martini, A.; Nairn, J.; Simonsen, J.; Youngblood, J., Cellulose
nanomaterials review: structure, properties and nanocomposites. Chemical Society Reviews
2011, 40 (7), 3941-3994.
6. Sastri, V. R., 6 - Commodity Thermoplastics: Polyvinyl Chloride, Polyolefins, and
Polystyrene. In Plastics in Medical Devices (Second Edition), Sastri, V. R., Ed. William
Andrew Publishing: Oxford, 2014; pp 73-120.
7. Fernandes, E. M.; Mano, J. F.; Reis, L. R., 5. Polyethylene Composites with
Lignocellulosic Material. In Polyethylene-Based Blends, Composites and Nanocomposites,
Visakh, P. M.; Morlanes, M. J. M., Eds. John Wiley & Sons: 2015.
8. Rives, V.; Labajos, F. M.; Herrero, M., 6. Double layered hydroxides as nanofillers
of composites and nanocomposite materials based on polyethylene. In Polyethylene-Based
Blends, Composites and Nanocomposites, Visakh, P. M.; Morlanes, M. J. M., Eds. John
Wiley & Sons: 2015.

96
9. Selke, S. E.; Hernandez, R. J., Packaging: Polymers for Containers. In
Encyclopedia of Materials: Science and Technology, Buschow, K. H. J.; Cahn, R. W.;
Flemings, M. C.; Ilschner, B.; Kramer, E. J.; Mahajan, S.; Veyssière, P., Eds. Elsevier:
Oxford, 2001; pp 6646-6652.
10. Raj, R. G.; Kokta, B. V., Linear Low-Density Polyethylene Filled with Silane-
Coated Wood Fibers. In High-Tech Fibrous Materials, American Chemical Society: 1991;
Vol. 457, pp 102-113.
11. Sapkota, J.; Natterodt, J. C.; Shirole, A.; Foster, E. J.; Weder, C., Fabrication and
Properties of Polyethylene/Cellulose Nanocrystal Composites. Macromolecular Materials
and Engineering 2017, 302 (1), 1600300-n/a.
12. Natterodt, J. C.; Sapkota, J.; Foster, E. J.; Weder, C., Polymer Nanocomposites with
Cellulose Nanocrystals Featuring Adaptive Surface Groups. Biomacromolecules 2017, 18
(2), 517-525.
13. Sapkota, J.; Jorfi, M.; Weder, C.; Foster, E. J., Reinforcing poly (ethylene) with
cellulose nanocrystals. Macromolecular rapid communications 2014, 35 (20), 1747-1753.
14. Junior de Menezes, A.; Siqueira, G.; Curvelo, A. A. S.; Dufresne, A., Extrusion and
characterization of functionalized cellulose whiskers reinforced polyethylene
nanocomposites. Polymer 2009, 50 (19), 4552-4563.
15. Hendren, K. D.; Baughman, T. W.; Deck, P. A.; Foster, E. J., In situ dispersion and
polymerization of polyethylene cellulose nanocrystal-based nanocomposites. Journal of
Applied Polymer Science 2020, 137 (13), 48500.
16. Borjesson, M.; Sahlin, K.; Bernin, D.; Westman, G., Increased thermal stability of
nanocellulose composites by functionalization of the sulfate groups on cellulose
nanocrystals with azetidinium ions. Journal of Applied Polymer Science 2018, 135 (10),
10.
17. Nagalakshmaiah, M.; El Kissi, N.; Dufresne, A., Ionic Compatibilization of
Cellulose Nanocrystals with Quaternary Ammonium Salt and Their Melt Extrusion with
Polypropylene. Acs Applied Materials & Interfaces 2016, 8 (13), 8755-8764.
18. Kaminsky, W., Zirconocene catalysts for olefin polymerization. Catalysis Today
1994, 20 (2), 257-271.
19. Funck, A.; Kaminsky, W., Polypropylene carbon nanotube composites by in situ
polymerization. Composites Science and Technology 2007, 67 (5), 906-915.
20. Kaminsky, W.; Funck, A.; Klinke, C., In-situ Polymerization of Olefins on
Nanoparticles or Fibers by Metallocene Catalysts. Topics in Catalysis 2008, 48 (1), 84.
21. Kaminsky, W., Metallocene Based Polyolefin Nanocomposites. Materials 2014, 7
(3), 1995-2013.
22. Alexandre, M.; Martin, E.; Dubois, P.; Garcia‐Marti, M.; Jérôme, R., Use of
metallocenes in the polymerization‐filling technique with production of polyolefin‐based
composites. Macromolecular rapid communications 2000, 21 (13), 931-936.
23. Alexandre, M.; Martin, E.; Dubois, P.; Marti, M. G.; Jérôme, R., Polymerization-
Filling Technique: An Efficient Way To Improve the Mechanical Properties of
Polyethylene Composites. Chemistry of Materials 2001, 13 (2), 236-237.
24. Hees, T.; Zhong, F.; Rudolph, T.; Walther, A.; Mülhaupt, R., Nanocellulose
Aerogels for Supporting Iron Catalysts and In Situ Formation of Polyethylene
Nanocomposites. Advanced Functional Materials 2017, 27 (11), 1605586-n/a.

97
25. Hendren, K. D.; Higgins, M. A.; Long, B. K.; Foster, E. J., Cellulose nanocrystal-
reinforced poly(5-triethoxysilyl-2-norbornene) composites. Polymer Chemistry 2020, 11
(2), 433-438.
26. Deck, P. A.; Fisher, T. S.; Downey, J. S., Boron−Silicon Exchange Reactions of
Boron Trihalides with Trimethylsilyl-Substituted Metallocenes. Organometallics 1997, 16
(6), 1193-1196.
27. Shamskar, K. R.; Heidari, H.; Rashidi, A., Preparation and evaluation of
nanocrystalline cellulose aerogels from raw cotton and cotton stalk. Industrial Crops and
Products 2016, 93, 203-211.
28. Hatakeyama, T.; Liu, Z., Handbook of Thermal Analysis. John Wiley and Sons, Inc:
Chichester, 1998.
29. De France, K. J.; Hoare, T.; Cranston, E. D., Review of Hydrogels and Aerogels
Containing Nanocellulose. Chemistry of Materials 2017, 29 (11), 4609-4631.
30. Shard, A. G., Detection limits in XPS for more than 6000 binary systems using Al
and Mg Kα X-rays. Surface and Interface Analysis 2014, 46 (3), 175-185.
31. Alamo, R. G.; Mandelkern, L., The crystallization behavior of random copolymers
of ethylene. Thermochimica Acta 1994, 238, 155-201.
32. Randall, J. C., A review of high resulution liquid 13Carbon nuclear magnetic
resonance characerizations of ethylene-based polymers. Journal of Macromolecular
Science, Part C 1989, 29 (2-3), 201-317.
33. Hsieh, E. T.; Randall, J. C., Ethylene-1-butene copolymers. 1. Comonomer
sequence distribution. Macromolecules 1982, 15 (2), 353-360.
34. Kennedy, M. A.; Peacock, A. J.; Failla, M. D.; Lucas, J. C.; Mandelkern, L., Tensile
Properties of Crystalline Polymers: Random Copolymers of Ethylene. Macromolecules
1995, 28 (5), 1407-1421.
35. SABIC, SABIC Supeer 8115: Metallocene linear low-density polyethylene.
Revision 20181012, 2018.
36. SABIC, SABIC Supeer 7118: Metallocene linear low-density polyethylene.
Revision 20181012, 2018.
37. McDaniel, M. P., Chapter 3 - A Review of the Phillips Supported Chromium
Catalyst and Its Commercial Use for Ethylene Polymerization. In Advances in Catalysis,
Gates, B. C.; Knözinger, H., Eds. Academic Press: 2010; Vol. 53, pp 123-606.
38. Zheng, X.; Smit, M.; Chadwick, J. C.; Loos, J., Fragmentation Behavior of Silica-
Supported Metallocene/MAO Catalyst in the Early Stages of Olefin Polymerization.
Macromolecules 2005, 38 (11), 4673-4678.
39. Bahuleyan, B. K.; Atieh, M. A.; De, S. K.; Jabarulla Khan, M.; Al-Harthi, M. A.,
Easy one-pot method to control the morphology of polyethylene/carbon nanotube
nanocomposites using metallocene catalysts. Journal of Polymer Research 2012, 19 (2),
9744.
40. Bonduel, D.; Mainil, M.; Alexandre, M.; Monteverde, F.; Dubois, P., Supported
coordination polymerization: a unique way to potent polyolefin carbon nanotube
nanocomposites. Chemical Communications 2005, (6), 781-783.
41. Toti, A.; Giambastiani, G.; Bianchini, C.; Meli, A.; Bredeau, S.; Dubois, P.;
Bonduel, D.; Claes, M., Tandem Action of Early− Late Transition Metal Catalysts for the
Surface Coating of Multiwalled Carbon Nanotubes with Linear Low-Density Polyethylene.
Chemistry of Materials 2008, 20 (9), 3092-3098.

98
3.5 Supporting Information
Linear low-density polyethylene cellulose nanocrystal composites from in-situ
polymerization mediated by an anchored metallocene catalyst
The figures presented are organized in terms of CNC content. The C1-CNCs which
were used to create these composites correspond to the following CNC contents 11.4 wt%
CNC is 2_600, 5.8 wt% CNC is 4_600, 4.4 wt% CNC is 8_600, and 3.6 wt% CNC is
16_600. This is summarized in Table 3.3.
Figure S3.1: Images shown are films of each of the pressed CNC-LLDPE PMC
resins. The resins correspond to a 11.4 wt% CNC (2_600), b 5.8 wt% CNC
(4_600), c 4.4 wt% CNC (8_600), and d 3.6 wt% CNC (16_600). Each of the
images labeled with CNC content from TGA data and the C1-CNC aerogel which
they are made from.
99
Figure S3.2: Spectra of 13
C NMR of each of the PMC samples were used to
quantify the mol% of 1-hexene within the LLDPE portion of each PMC scans for
each of the samples were PMC 2_600 (11.4 wt%) 3392 scans, PMC 4_600 (5.8
wt%) 16000, PMC 8_600 (4.4 wt% CNC) 6848, and PMC 16_600 (3.6 wt% CNC)
14592.
01020304050
Inte
nsity A
.U.
Shift (ppm)
11.4 wt% CNC
5.8 wt% CNC
4.4 wt% CNC
3.6 wt% CNC

100
Figure S3.3: Above are representative stress-strain curves for the C1-CNC
LLDPE PMCs arranged by mass fraction of CNC. The curves are a, the full
stress strain curve and b, a truncated stress strain curve showing differences
in Young’s moduli.
0
6
12
18
0% 5% 10% 15% 20%
Str
ess (
MP
a)
Strain (%)

101
2_600 4_600
8_600 16_600
Figure S3.4: SEM Images of aerogels show flakey structure that was
exhibited in all samples. The Images were taken at 3-5 keV with the in-lens
or secondary electron detectors at 500x magnification. The scale bar is 100
µm.

102
CNCs CNCs (wt%) Young’s Modulus (MPa)
Yield Strength (MPa)
Elongation at Break (%)
C1-CNCs 16_600
3.6 240 ± 50 11 ± 3 400 ± 90
C1-CNCs 8_600
4.4 270 ± 40 10 ± 2 850 ± 60
C1-CNCs 4_600
5.8 310 ± 20 10.8 ± 0.9 60 ± 30
C1-CNCs 2_600
11.4 391 ± 7 11 ± 1 70 ± 10
Natterodt et al.1
UPy CNCs 0 125 ± 15 8.7 ± 0.9 465 ± 40
Natterodt et al.1
UPy CNCs 2.5 135 ± 10 9.5 ± 0.2 435 ± 65
Natterodt et al.1
UPy CNCs 5 145 ±20 9.9 ± 0.6 445 ± 50
Natterodt et al.1
UPy CNCs 10 165 ± 5 10 ± 0.5 480 ± 30
Natterodt et al.1
UPy CNCs 15 195 ± 10 13 ± 0.5 495 ± 15
Borjesson et al.2
no CNCs 0 108 ± 13 - 1100 ± 200
Borjesson et al.2
CNCs 3.2 216 ± 19 - 800 ± 0
Borjesson et al.2† S1-
CNCs 3.5 211 ± 19 - 700 ± 0
Borjesson et al.2‡ S2-
CNCs 2.9 223 ± 11 - 700 ± 100
:
Table S3.1: This table shows tensile data from CNC-LLDPE PMCs from C1-
CNCs and those available from literature. S1-CNCs are functionalized with N,N
-dialkyl-3-methoxyazetidinium salt and S2-CNCs are functionalized with 1,1’-
dihexyl-3-methoxyazetidniumchloride salt.

103
References:
1. Natterodt, J. C.; Sapkota, J.; Foster, E. J.; Weder, C., Polymer Nanocomposites with
Cellulose Nanocrystals Featuring Adaptive Surface Groups. Biomacromolecules 2017, 18
(2), 517-525.
2. Borjesson, M.; Sahlin, K.; Bernin, D.; Westman, G., Increased thermal stability of
nanocellulose composites by functionalization of the sulfate groups on cellulose
nanocrystals with azetidinium ions. Journal of Applied Polymer Science 2018, 135 (10),
10.

104
Chapter 4: Functionalization of cellulose nanocrystal composite materials for reverse
osmosis applications
This chapter is part of a collaboration with Stephen A. Martin and Ethan D. Smith,
and this work is a follow-up to the publication from the collaborative document
“Functionalized Cellulose Nanocrystal Nanocomposites Membranes with Controlled
Interfacial Transport for Improved Reverse Osmosis Performance.” The following research
is in preparation for a larger potential publication with Ethan D. Smith, Stephen A. Martin
and E. Johan Foster. In the following chapters, I recognize the ideas, editing, and guidance
from the coauthors Ethan D. Smith, Stephen A. Martin and E. Johan Foster.
105
Functionalization of cellulose nanocrystals for reverse osmosis applications
Keith D. Hendren, Ethan D. Smith, Stephen M. Martin, and E. Johan Foster
Abstract:
Cellulose nanocrystals (CNCs) with novel functionalization groups on the surfaces were
developed for use in reverse osmosis (RO) membranes to investigate changes in RO
membrane performance. Tertiary amine CNCs (ACNCs) were developed by coupling
(2,2,6,6-tetramethylpiperidin-1-yl)oxyl (TEMPO) oxidized CNCs (TCNCs) with the
known 1-ethyl-3-(3-dimethylaminopropyl)carbodiimide (EDC) coupling followed by a
reaction with 3-(dimethylamino)-1-propylamine. Zwitterionic CNCs (ZCNCs) were
subsequently developed from a reaction of ACNCs with β-propiolactone. The presence of
nitrogen on the surfaces of the tertiary ACNCs and ZCNCs was verified by X-ray
photoelectron spectroscopy (XPS). The presence of the second carboxylic groups afforded
by β-propiolactone was verified by Fourier transform infrared spectroscopy (FTIR) at 1730
cm−1. Functional groups were quantified by conductometric titration of the CNCs, and it
was found that there were 1060 mmol kg−1 of carboxylic acid groups for TCNCs, 520 mmol
kg−1 of amines for ACNCs, and 240 mmol kg−1 of zwitterions for ZCNCs.
4.1 Introduction:
There is a global demand for desalination technologies as both sources of seawater
and brackish water are used as feed sources of freshwater. It is estimated that each person
requires approximately 1000 m3 per year of freshwater.1 Arid and sub-humid regions of
the world typically use more groundwater reserves than are replenished, and it is estimated
that about 35% of the world’s population suffers from having insufficient water resources.2
Reverse osmosis (RO) is a pressure driven membrane technology that is used globally to

106
remove dissolved salts from water. It has two primary branches of application which
accomplish the same goal, the desalination of sea water and the desalination of brackish
water sources.3
RO membranes, a prominent technology, have undergone some refinement. RO
began with cellulose acetate membranes and moved towards more efficient polyamide
(PA) membranes. The current technology is crosslinked PA membranes.4 Each new RO
membrane technology improved salt rejection and/or water flux. Newer RO membrane
technologies have focused on the addition of filler materials to further improve flux of
water, resistance to biofouling, or mechanical stability.5 Some porous nanoparticles are
believed to provide nanochannel within the membrane that is small enough to reject salt
ions but large enough to allow water to pass through improving flux.6
Cellulose nanocrystals (CNCs) are nanoscale cellulose filler material with
dimensions that are smaller than membrane materials typically ca. 5-10 nm in width and
50-200 nm in length.7-8 A previous study fabricated CNC-PA membranes using the vacuum
filtration method and the monomer dispersion method.9 It was found that the as received
CNCs and the TEMPO oxidized CNCs (TCNCs) did not improve the RO membranes
decreasing flux but maintaining salt rejection. Using the monomer dispersion method to
fabricate as received CNC PA membranes resulted in increased flux in the RO membranes
but slightly decreased salt rejection. In contrast, the monomer dispersion method with the
TCNCs lead to increases in flux for all TCNC loadings from 0.05 wt% TCNC to 0.5 wt%
TCNC in PA, while maintaining salt rejection. The result was that at the largest TCNC
loading (0.5 wt% TOCN) the average flux of this composite was twice that of the control

107
membrane 10.9 ± 2.1 Lm−2h−1(LMH) compared to 4.1 ± 0.7 LMH, and the salt rejection of
the composite was also slightly increased from 97.5% ± 0.3% to 99.0% ± 0.4%.9
From the favorable result of having increased flux in TCNC PA RO membranes it
was concluded that the surface interaction of the TCNCs with the PA was more favorable
than that of the as received CNCs.9 It was ascribed this to the increased hydrogen bonding
between the carboxylic acid groups on the TCNCs and the amine groups on the PA
polymer. The interfacial interaction may have led to the development of nanochannels that
allowed for increased flux of the water through the membrane, but the nanochannels were
small enough to reject the salts.9 The other conclusion was that the TCNCs dispersed well
in the monomer dispersion method and poorly with the vacuum filtration method.9
Another study created membranes capable of even greater salt rejection and flux
utilizing zwitterionic carbon nanotubes (CNTs) imbedded within a PA membrane.6 This
study found the addition of zwitterionic CNTs to PA membranes increased the flux by a
factor of four going from 11.6 LMH to 48.8 LMH with similar or better salt rejection when
20 wt% of CNTs were added to the desalination membrane. It was concluded that water
flowed through the CNTs as though it was a straw, and the zwitterionic groups present at
ends of CNTs rejected dissolved salts. The charge of the zwitterionic groups was believed
to reject ions effectively acting as a “gatekeeper” for charged salt species.6
The following is a report of the functionalization of CNCs to have tertiary amine
terminal groups (TCNC) as well as CNCs with zwitterionic groups (ZCNC). ACNC were
developed by coupling TCNCs with 1-ethyl-3-(3-dimethylaminopropyl)carbodiimide
(EDC) and a subsequent reaction with 3-(dimethylamino)-1-propylamine. ZCNC were
developed by the ring opening reaction of β-propiolactone and ACNCs. Ideally, the

108
resulting functionalized filler material will exhibit a good interface with the PA resulting
in a RO membrane having nanochannels.10 Additionally, the known resistance to
biofouling of zwitterionic groups could make the addition of such particles even more
enduring.11-12
4.2 Experimental:
This section details the methods used to develop the novel CNC surface chemistries
(ACNCs) and (ZCNCs), the materials used, and the instruments used.
4.2.1 Materials:
Deionized water was obtained from Sybron Barnstead water purification system
was used at ≥16.7 MΩ-cm. Ethyl acetate, acetone, sodium bromide (NaBr), tetrahydrofuran
(THF), potassium chloride, and sodium hydroxide (NaOH) were purchased from Fisher
Scientific. 4-dimethyl amino pyridine (DMAP) was purchased from Tokyo Chemical
Industry, and β-propiolactone 97% purity was purchased from Beantown Chemical.
Concentrated hydrochloric acid (HCl) was purchased from Spectrum Chemicals, and 1-
ethyl-3-(3-dimethylaminopropyl)carbodiimide (EDC) was purchased from Creosalus.
Dimethyl formamide (DMF), 2,2,6,6-tetramethylpiperidin-1-yl)oxyl (TEMPO), 3-
(dimethylamino)-1-propylamine, and sodium chlorite (NaClO) solution (10-15%) were
purchased from Millipore Sigma. Dialysis tubing was purchased from Fisher Education.
Wood CNCs, isolated with sulfuric acid, were purchased from the University of Maine
Forest Products Laboratory as an 11.8 wt% aqueous slurry and were previously
characterized.9 The centrifuge used was an Eppendorf 5810 equipped with a FA-45-6-30
capable of utilizing six 50-mL centrifuge tubes.

109
4.2.2 TEMPO Oxidation of CNCs (TCNCs):
CNC oxidation with TEMPO free-radical is based on previous protocols at an
increased scale.13,14 In a two-liter beaker 200 g of 11.8 wt% aqueous CNC slurry was
combined with 1373 mL of deionized water. The mixture was homogenized by vigorous
stirring on a 90 °C hot plate for 30-min intervals followed by 10-min intervals of sonication
in a Branson sonication bath; these mixing methods were repeated until the mixture was
visibly well mixed. In a separate beaker 650 mg of TEMPO free radical, 7.02 g of NaBr,
and 400 mL of deionized water were combined and stirred until the solids dissolved (ca.
45 min). The solution of TEMPO, NaBr, and water was added to the CNC dispersion, and
109.4 mL of NaClO solution was added immediately after. The dropwise addition of 0.5
M NaOH solution over 3 h was used to keep the pH at 10. The reaction was terminated by
the addition of 80 mL of ethanol. The TCNC dispersion was poured into dialysis tubes and
dialyzed against deionized water for one week changing the dialysis water daily. The
TCNCs dispersion was concentrated by rotary evaporation at 200 mbar and 90 °C to a final
concentration of 19.1 mg mL−1; this concentration was determined by evaporating 1 mL of
TCNC dispersion onto an aluminum dish and taking the difference of the mass of the
aluminum dish and the mass of the aluminum dish with dried TCNC dispersion. The
reaction is shown in Figure 4.1.
Figure 4.1: The reaction scheme shows converting as received CNCs to
TCNCs and utilizes TEMPO and NaClO.

110
4.2.3 Development of Tertiary Amine CNCs (ACNCs):
ACNCs were developed from adapting two protocols utilizing EDC coupling to
attach primary amines to carboxylic acids forming amide linkages.15-16 TCNC as an
aqueous dispersion (150 mL) was added to each of two 1000-mL beakers, and 600 mL of
acetone was slowly added without disturbing the aqueous phase. This biphasic mixture was
allowed to stand quiescently for ca. 12 h. The top layer, consisting of mostly acetone and
water, was decanted leaving a moist gel at the base. This gel, as 35-mL aliquots, was
centrifuged at 10,000 RPM for 20 min in 50-mL centrifuge tubes and the supernatant liquid
was decanted. After the supernatant was decanted, each pellet was combined with 35 mL
of fresh acetone, vortex mixed at 3,000 RPM for ca. 2 min, centrifuged (10,000 RPM for
20 min), and discarding the supernatant; this washing procedure was repeated three times.
All washed TCNC pellets were added to a media bottle containing 225 mL of DMF. The
DMF and TCNC slurry was homogenized with an IKA Turrex homogenizer for 10 min
operating at 5,000 PRM followed by bath sonication in for 1 h. DMF TCNC mixture was
then rotary evaporated for 1 h at 200 mbar and 90 °C to remove residual acetone, and a 1-
mL aliquot was dried on an aluminum plate to determine the concentration to be 9.8 mg
mL−1.
In order to attach a primary amine to the TCNCs, a previous protocol was followed
but at a greater scale; the TCNC DMF mixture (203 mL) was diluted by adding 280 mL of
DMF and stirred. The reagents EDC (58.8 g, 25 eq) and DMAP (37.3 g, 25 eq) were added
to the TCNC DMF mixture and stirred for 30 min generating a frothy yellow mixture. The
reactant 3-(dimethylamino)-1-propylamine (50 mL, 25 eq) was added and the mixture
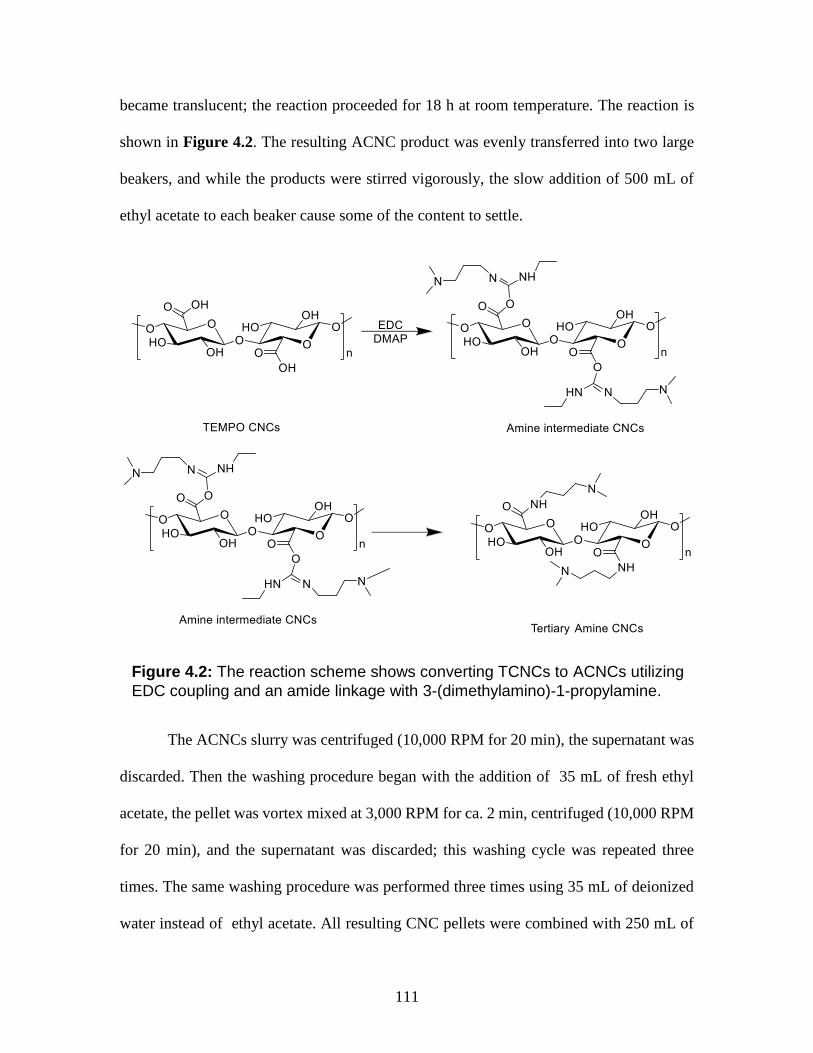
111
became translucent; the reaction proceeded for 18 h at room temperature. The reaction is
shown in Figure 4.2. The resulting ACNC product was evenly transferred into two large
beakers, and while the products were stirred vigorously, the slow addition of 500 mL of
ethyl acetate to each beaker cause some of the content to settle.
The ACNCs slurry was centrifuged (10,000 RPM for 20 min), the supernatant was
discarded. Then the washing procedure began with the addition of 35 mL of fresh ethyl
acetate, the pellet was vortex mixed at 3,000 RPM for ca. 2 min, centrifuged (10,000 RPM
for 20 min), and the supernatant was discarded; this washing cycle was repeated three
times. The same washing procedure was performed three times using 35 mL of deionized
water instead of ethyl acetate. All resulting CNC pellets were combined with 250 mL of
Figure 4.2: The reaction scheme shows converting TCNCs to ACNCs utilizing
EDC coupling and an amide linkage with 3-(dimethylamino)-1-propylamine.

112
deionized water and homogenized with the Turrex mixer for 10 min at 5,000 RPM and
bath sonicated overnight. CNCs were dialyzed for four days against deionized water
changing the dialysis water daily. The ACNCs dispersion was diluted to 500 mL with
deionized water, and this dispersion was combined with a second batch of ACNC
dispersion that was produced in the same manner at 5/6th scale dispersed in 225 mL of
deionized water. The resulting aqueous dispersion of ACNCs was found to be 3.6 mg mL−1
by evaporating 1 mL of dispersion on an aluminum dish.
4.2.4 Development of Zwitterionic CNCs (ZCNCs):
ZCNCs were developed based on previous methods used for developing
zwitterionic CNTs and zwitterionic poly(carboxybetaine methacrylate).10, 17 The procedure
begins with a solvent exchange from water to THF, and this was accomplished by
combining one-part (380 mL) of ACNC dispersion in water and three-parts THF and
mixing. The ACNCs, water, and THF mixture was centrifuged (10,000 RPM, 20 min), the
supernatant was discarded, and the pellets were combined into two centrifuge tubes. The
ACNCs were combined 35 mL of fresh THF, vortex mixed for 3,000 RPM for ca. 2 min,
centrifuged (10,000 RPM, 20 min), and the supernatant was discarded. The lids of the 50-
mL centrifuge tubes were changed to septum modified lids. The ACNCs pellets were
combined with 35 mL of anhydrous THF (CaH2 distilled), vortex mixed (3,000 RPM, ca.
2 min) then centrifuged at 2,000 RPM for 30 min, the supernatant was decanted by syringe,
dry THF was added (35 mL), and this washing process was performed three times.
The washed ACNC pellets were combined with 230 mL of dry THF by pouring
under purge into a flame dried 250-mL flask in a cooling bath at 0 °C. The suspension of
ACNCs in THF was stirred and equilibrated for 1 h and then β-propiolactone (0.56 mL,

113
1.1 eq) was injected into the flask. The reaction persisted at 0 °C for 4 h, and the reaction
continued for another 16 h at 15 °C. The reaction is shown in Figure 5.3. The product was
centrifuged (10,000 RPM, 20 min), the supernatant was decanted, 35 mL of dry THF was
added, the tube was vortex mixed (3,000 RPM ca. 2 min), and the supernatant was
discarded. The ZCNC pellet was then added to 70 mL of deionized water, vortex mixed
(3,000 RPM, ca. 2 min), bath sonicated for 10 min, and dialyzed for 4 days changing
dialysis water daily. The mixture was diluted to 500 mL and the dispersion of ZCNCs was
found to be 2.1 mg mL−1 by evaporating 1 mL of dispersion on an aluminum dish.
4.2.5 X-ray photoelectron spectroscopy (XPS):
Samples in respective dispersions were solvent exchanged with THF, by the
addition of 2-5 mL of aqueous CNC suspension to 30-33 mL of THF. This CNC mixture
was centrifuged (10,000 RPM, 20 min), the supernatant was discarded, 35 mL of THF was
added, this mixture was centrifuged a second time, and the supernatant was discarded. The
centrifuge tubes were uncapped, and the CNC pellets dried at room temperature under air.
These CNC pellets were analyzed on a PHI Versa Probe III scanning XPS microscope
using monochromatic Al K-α X-ray source (1486.6 eV). Binding energies were referenced
Figure 4.3: The reaction scheme shows converting ACNCs to ZCNCs utilizing β-
propiolactone ring opening.

114
to C-C peak at 284.8 eV. Survey scans were done as a 280-eV pass energy (1.0 eV step−1)
for 5 sweeps. High resolution spectra for carbon, nitrogen, and oxygen were done at 26-eV
pass energies (0.1 eV step−1), for 20, 60, and 10 sweeps respectively.
4.2.6 Fourier Transform Infrared spectroscopy (FTIR):
The CNC pellets prepared for XPS were also used for FTIR analysis. CNC samples
were evaluated on a Thermo Scientific Nicolet iS 7 for 32 scans in the 4000-600 cm−1
region after subtracting the background spectrum from each sample spectrum.
4.2.7 Conductometric Titrations:
From each aqueous dispersion of CNCs, TCNCs, ACNCs, and ZCNCs 50 mg of
CNCs was added to 50-mL beakers. To these beakers 5 mL of 0.01 M KCl solution was
added, the mixtures were then diluted to 29 mL with deionized water, the pH was adjusted
to 2 with ca. 0.4 mL of 1 M HCl, and the final volume was adjusted to 30 mL with deionized
water. The initial conductivity was recorded and 200-μL aliquots of 0.05 M NaOH were
added, and 20-μL aliquots of NaOH were added below ca. 1600 μS to increase the graph
resolution.
4.3 Results and Discussion:
This section details the results that were obtained in the experimental section and
conclusions that can be drawn from these results.
4.3.1 Development of ACNCs and ZCNCs:
Chemistry used to oxidize CNCs to obtain TCNCs is commonly performed,
therefore this section will focus on the development of ACNCs and ZCNCs. The EDC
coupling is a system used to create bulky intermediates that will selectively form amide
linkages when in the presence of primary amines. This reaction pathway selectivity for

115
primary amines is evident as EDC has a tertiary amine group. This reaction pathway has
been previously utilized generating both aliphatic terminal CNCs18 and CNCs with boc-
protected primary amines that can be hydrolyzed to become CNCs with terminal primary
amines.15
The ZCNC chemistry has not been previously performed, and this is the first
attempt we are aware of to have positive and negative charges on CNC surfaces in close
proximity. The presented chemistry is largely adapted from previous publications that used
β-propiolactone in either dry acetone or dry THF. These reactions were done at either 15
°C or room temperature for 4 h; the reaction scheme presented used 0 °C for 4 h and 15 °C
for 16 h. These temperatures were chosen to first to ensure that the most selective groups
present would could react with β-propiolactone and then to ensure that all β-propiolactone
had reacted. The increased reaction time at a higher temperature was done in the interest
of safety as β-propiolactone is toxic.
4.3.2 X-ray photoelectron spectroscopy (XPS):
XPS was used to analyze the amount of nitrogen on the surface of the ACNCs and
ZCNCs. The spectra showed that there was 2-3% nitrogen content for both ACNCs and
ZCNCs. Both spectra have two peaks present in the high-resolution nitrogen scans for both
the ACNCs and ZCNCs (Figure 5.4). The peak at ca. 400 eV was assigned to be the amide
nitrogen (O=C-NR2) and the amine nitrogen (NR3) in our sytem.19 The other nitrogen peak
at ca. 403 eV is difficult to assign, as many nitrogen species share common areas and the
resolution of XPS is notoriously poor. The peak at ca. 403 eV is most likely due to a
nitrogen species carrying a charge as either an ammonium salt (HNR3+Cl−) or a quaternary
amine nitrogen in the case of the ZCNCs (NR4+).20
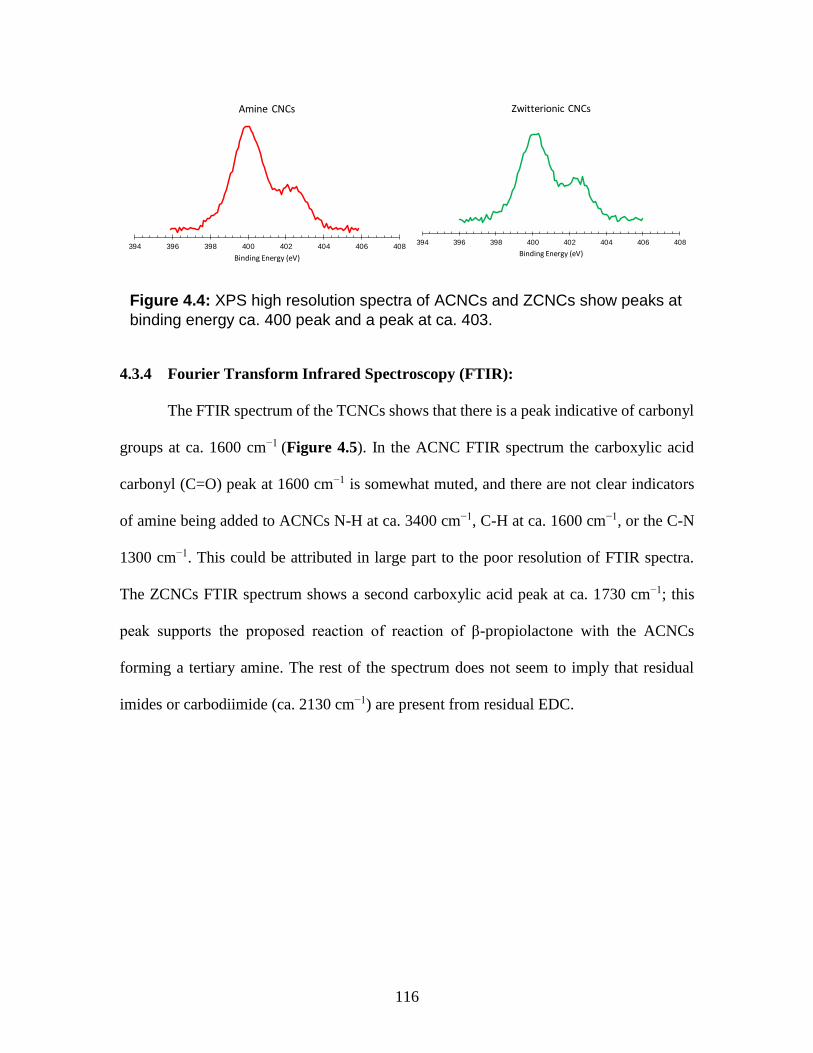
116
4.3.4 Fourier Transform Infrared Spectroscopy (FTIR):
The FTIR spectrum of the TCNCs shows that there is a peak indicative of carbonyl
groups at ca. 1600 cm−1 (Figure 4.5). In the ACNC FTIR spectrum the carboxylic acid
carbonyl (C=O) peak at 1600 cm−1 is somewhat muted, and there are not clear indicators
of amine being added to ACNCs N-H at ca. 3400 cm−1, C-H at ca. 1600 cm−1, or the C-N
1300 cm−1. This could be attributed in large part to the poor resolution of FTIR spectra.
The ZCNCs FTIR spectrum shows a second carboxylic acid peak at ca. 1730 cm−1; this
peak supports the proposed reaction of reaction of β-propiolactone with the ACNCs
forming a tertiary amine. The rest of the spectrum does not seem to imply that residual
imides or carbodiimide (ca. 2130 cm−1) are present from residual EDC.
394 396 398 400 402 404 406 408
Binding Energy (eV)
Amine CNCs
394 396 398 400 402 404 406 408
Binding Energy (eV)
Zwitterionic CNCs
Figure 4.4: XPS high resolution spectra of ACNCs and ZCNCs show peaks at
binding energy ca. 400 peak and a peak at ca. 403.

117
4.3.5 Conductometric Titration:
Conductometric titrations were used to find the number of acidic groups in the
TCNC, ACNC, and ZCNC dispersions (Figure 4.6). The first region of each curve is where
the strong acid and base are forming NaCl, the conductivity is decreasing as the hydronium
(OH−) ions are being consumed to form water (H2O) and the Na+ ions, which do not
contribute to the conductivity as much the hydronium ions. The second region of each
curve, the flat region is where the carboxylic acid groups (COOH) are being deprotonated
(COO−), nothing is contributing to the conductivity of the solution as the ion pair COO−
Na+ does not dissociate well. The last region of the curve, the increasing region is where
the ammonium ion (NR3H+) with the counter chlorine ion (Cl−) is being deprotonated and
6009001200150018002100240027003000330036003900
Wavenumber cm-1
Zwitterionic CNC
Amine CNC
TEMPO CNC
Figure 4.5: FTIR spectra of TCNCs, ACNCs, and ZCNCs show is a notable
suppression of the carboxylic acid peak for ACNCs and ZCNCs at ca. 1600
cm-1 and ca. 1730 cm-1. The green line below the ZCNCs highlights the
carboxylic acid peak at ca. 1730 cm-1.

118
contributing NaCl to the solution. In addition, the strong base allows Na+ ions and OH−
ions to further increase the conductivity of the solution.
The mmol kg−1 of acidic groups for the TCNCs, ACNCs, and ZCNCs was found as
the number of millimoles of NaOH for the flat region of the curve over the mass of CNCs
(𝑚𝑚𝑜𝑙𝑠𝑁𝑎𝑂𝐻 ÷ 𝑘𝑔𝐶𝑁𝐶𝑠). The as received CNC were found to have 80 mmol kg-1. The
TCNCs were found to have 1060 mmol·kg−1, the ACNCs were found to have 540
mmol·kg−1, and the ZCNCs were found to have 760 mmol·kg−1. Because the tertiary amine
groups did not contribute to the flat region of the curve, the difference between the TCNCs
and ACNCs represents the number of ACNC groups 520 mmol kg−1. The number of acidic
groups added to the ACNCs is the difference in the conductivity of the ACNCs and
ZCNCs, therefore the number of added carboxylic acids 220 mmol·kg−1; thus, there are
220 mmol·kg−1 of zwitterionic groups on the ZCNCs.
A major drawback of using conductimetric titration is that large amounts of
material (ca. 250-mg) are consumed using auto-titrators. We instead chose to do this
manually using only 50 mg instead. This allowed for most of the CNCs to be allocated for
composite membrane preparation as opposed to conductometric titration.

119
4.4 Conclusions:
The results show that there was a definite change in composition from the TCNCs,
ACNCs, and with the ZCNCs. The FTIR analysis along with the results from the
conductometric titration is sufficient to conclude that the functionalization of as received
CNCs happened as indicated in Figure 4.1. The reaction with the TCNCs with 3-
Figure 4.6: Conductometric titrations of CNCs (A), TCNCs (B), ACNCs (C), and
ZCNCs (D) show the conductivity of the solution as NaOH is added. The light
blue region (♦) represent the acidic region where HCl is present, the dark blue
region () represents the flat region of the curve and the number of acidic groups
on the CNCs, and the green region represents the alkaline region of the
curve, where NaOH is present.
1400
1600
1800
2000
2200
5000 7000 9000
mic
rosem
ens/c
entim
ete
r
Volume 0.05 M NaOH (µL)
1400
1600
1800
2000
2200
2400
5000 7000 9000
mic
rosie
mens/c
entim
ete
r
Volume 0.05 M NaOH (µL)
1400
1600
1800
2000
2200
2400
5000 7000 9000
mic
rosie
mens/c
entim
ete
r
Volume 0.05 M NaOH (µL)
1200
1300
1400
1500
1600
4000 5000 6000
mic
rosie
mens/c
entim
ete
r
Volume 0.05 M NaOH (µL)
A C
B D

120
(dimethylamino)-1-propylamine mediated by EDC coupling was characterized with XPS
and FTIR. The XPS characterization of the ACNCs showed an increase in the amount of
nitrogen as well as binding energies (400 eV and 403 eV) that could be explained as
amides, amines, and ammonium salts. The FTIR characterization showed there were no
peaks that indicated residual reactants from the EDC coupling and the carboxylic acid peak
at 1600 cm−1 was suppressed. The FTIR spectrum of the ZCNCs also had the suppressed
carboxylic acid peak at 1600 cm−1 but had a second carboxylic acid peak at 1730 cm−1.
Finding functional groups on CNCs in small quantities is typically difficult.
However, we believed that the tertiary amine functional groups are on the ACNCs and that
the zwitterionic groups are present on the ZCNCs. We look forward to the eventual testing
of these ZNCs for the intended application of RO membranes.
References:
1. Rogers, P., Facing the Freshwater CRISIS. Scientific American 2008, 299 (2), 46-
53.
2. Wada, Y.; van Beek, L. P. H.; van Kempen, C. M.; Reckman, J. W. T. M.; Vasak,
S.; Bierkens, M. F. P., Global depletion of groundwater resources. Geophysical Research
Letters 2010, 37 (20).
3. Greenlee, L. F.; Lawler, D. F.; Freeman, B. D.; Marrot, B.; Moulin, P., Reverse
osmosis desalination: Water sources, technology, and today's challenges. Water Research
2009, 43 (9), 2317-2348.
4. Kucera, J., Introduction and History of Development. In Reverse Osmosis, Kucera,
J., Ed. 2010; pp 1-13.
5. Fritzmann, C.; Löwenberg, J.; Wintgens, T.; Melin, T., State-of-the-art of reverse
osmosis desalination. Desalination 2007, 216 (1), 1-76.
6. Chan, W.-F.; Chen, H.-y.; Surapathi, A.; Taylor, M. G.; Shao, X.; Marand, E.;
Johnson, J. K., Zwitterion Functionalized Carbon Nanotube/Polyamide Nanocomposite
Membranes for Water Desalination. ACS Nano 2013, 7 (6), 5308-5319.
7. Sacui, I. A.; Nieuwendaal, R. C.; Burnett, D. J.; Stranick, S. J.; Jorfi, M.; Weder,
C.; Foster, E. J.; Olsson, R. T.; Gilman, J. W., Comparison of the properties of cellulose
nanocrystals and cellulose nanofibrils isolated from bacteria, tunicate, and wood processed
using acid, enzymatic, mechanical, and oxidative methods. ACS Appl Mater Interfaces
2014, 6 (9), 6127-38.

121
8. Moon, R. J.; Martini, A.; Nairn, J.; Simonsen, J.; Youngblood, J., Cellulose
nanomaterials review: structure, properties and nanocomposites. Chemical Society Reviews
2011, 40 (7), 3941-3994.
9. Smith, D. E.; Hendren, D. K.; Haag, V. J.; Foster, J. E.; Martin, M. S.,
Functionalized Cellulose Nanocrystal Nanocomposite Membranes with Controlled
Interfacial Transport for Improved Reverse Osmosis Performance. Nanomaterials 2019, 9
(1).
10. Surapathi, A.; Chen, H.-y.; Marand, E.; Karl Johnson, J.; Sedlakova, Z., Gas
sorption properties of zwitterion-functionalized carbon nanotubes. Journal of Membrane
Science 2013, 429, 88-94.
11. Yu, H. Y.; Yan, C. F.; Yao, J. M., Fully biodegradable food packaging materials
based on functionalized cellulose nanocrystals/poly(3-hydroxybutyrate-co-3-
hydroxyvalerate) nanocomposites. Rsc Advances 2014, 4 (104), 59792-59802.
12. Shao, Q.; Jiang, S., Molecular Understanding and Design of Zwitterionic Materials.
Advanced Materials 2015, 27 (1), 15-26.
13. Hendren, K. D.; Baughman, T. W.; Deck, P. A.; Foster, E. J., In situ dispersion and
polymerization of polyethylene cellulose nanocrystal-based nanocomposites. Journal of
Applied Polymer Science 2020, 137 (13), 48500.
14. Saito, T.; Isogai, A., TEMPO-mediated oxidation of native cellulose. The effect of
oxidation conditions on chemical and crystal structures of the water- insoluble fractions.
Biomacromolecules 2004, 5.
15. Way, A. E.; Hsu, L.; Shanmuganathan, K.; Weder, C.; Rowan, S. J., pH-Responsive
Cellulose Nanocrystal Gels and Nanocomposites. Acs Macro Letters 2012, 1 (8), 1001-
1006.
16. Cudjoe, E. Cellulose Nanocrystals and Related Polymer Nanocomposites. Case
Western Reserve University, 2017.
17. Zhang, Z.; Chen, S. F.; Jiang, S. Y., Dual-functional biomimetic materials:
Nonfouling poly(carboxybetaine) with active functional groups for protein immobilization.
Biomacromolecules 2006, 7 (12), 3311-3315.
18. Dagnon, K. L.; Way, A. E.; Carson, S. O.; Silva, J.; Maia, J.; Rowan, S. J.,
Controlling the Rate of Water-Induced Switching in Mechanically Dynamic Cellulose
Nanocrystal Composites. Macromolecules 2013, 46 (20), 8203-8212.
19. Zorn, G.; Liu, L.-H.; Árnadóttir, L.; Wang, H.; Gamble, L. J.; Castner, D. G.; Yan,
M., X-ray Photoelectron Spectroscopy Investigation of the Nitrogen Species in Photoactive
Perfluorophenylazide-Modified Surfaces. The Journal of Physical Chemistry C 2014, 118
(1), 376-383.
20. Wei, X. L.; Fahlman, M.; Epstein, A. J., XPS Study of Highly Sulfonated
Polyaniline. Macromolecules 1999, 32 (9), 3114-3117.

122
Chapter 5: Cellulose nanocrystal-reinforced poly(5-triethoxysilyl-2-norbornene)
composites
This Chapter is adapted from the publication: “Cellulose nanocrystal-reinforced
poly(5-triethoxysilyl-2-norbornene) composites” in the journal Polymer Chemistry with
permission from the Royal Society of Chemistry.
I recognize the contribution of Morgan A. Higgins, as co-first author of this
publication, sharing equal responsibility of fabrication, characterization, ideas, and data
analysis. I recognize that the coauthors Brian K. Long and E. Johan Foster, contributed
ideas, data analysis, document refinement, and document editing.

123
Cellulose nanocrystal-reinforced poly(5-triethoxysilyl-2-norbornene) composites
Keith D. Hendren, Morgan A. Higgins, Brian K. Long, and E. Johan Foster
Abstract:
We demonstrate the reinforcement of a previously inaccessible norbornene-silane with a
stiff, bio-based nanofiller. Poly(5-triethoxysilyl-2-norbornene) (PTESN), a glassy and
thermally stable polymer, was combined with cellulose nanocrystals (CNCs) and solvent
cast from toluene to form reinforced materials. Composite films showed excellent
translucency and no visible aggregation, which was supported by scanning electron
micrographs that showed no signs of CNC aggregation within the polymer matrix.
Reinforcement was evident at moderate of 5 wt% CNC loading, showing a statistically
significant enhancement for both Young’s modulus (540 MPa vs 970 MPa) and storage
modulus at 25 °C (400 MPa vs 1200 MPa). We suspect that there is a strong interaction
between the polymer and CNC filler based upon the increase of thermal degradation
temperature of the CNCs increasing, for example from 278 °C to 295 °C at 10 wt% CNCs.
These interactions were probed via solid-state NMR, which suggests that no covalent
bonding occurs between the triethoxylsilyl substituents of the polymer and the CNCs. We
therefore hypothesize that hydrogen bonding interactions between PTESN and CNCs are
responsible for the increased thermal stability and reinforcement of the polymer material.
5.1 Introduction:
Alkoxysilane-functionalized vinyl-addition polynorbornenes are an
intriguing polymer class whose high molecular weight homopolymers were only
recently accessed via careful catalyst selection (Figure 5.1).1-2 The prototypical
vinyl-addition homopolymer poly(5-triethoxysilyl-2-norbornene) (PTESN) was

124
preceded by other polymers with similar functionality, but that were made via ring
opening metathesis polymerization (ROMP) to yield either rubbery2 and glassy
polynorbornenes3 bearing trimethoxysilane or triethoxysilane pendant groups.
However, PTESN films made via vinyl-addition are frequently more mechanically
robust than their analogous ROMP polymers, which are often rubbery and exhibit tacky
character.2
Cellulose nanocrystals (CNCs) are a unique filler material that has been previously
incorporated into a wide variety of polymer matrices for reinforcement, through many
different techniques such as solvent exchange,4 melt mixing,5 solvent casting,6 and surface
modification of CNCs.6 CNCs are most commonly made into composite materials by
dispersion into polar organic solvents, into which the polymer can also be dissolved and
cast.7 Another interesting and successful strategy of composite fabrication with CNCs and
latex has been the emulsifying of the polymer into water and allowing the emulsified
particles to interact with CNC particles.8 Strategies for the incorporation of CNCs into a
polymer matrix depend on the chemistry and morphology of the polymer.9
PTESN was previously characterized and shown to have moderate mechanical
properties, making it an ideal prototype to expand the mechanical properties of this material
Figure 5.1: Vinyl-addition reaction scheme shows PTESN synthesis with the catalyst trans-[Ni(C6F5)2(SbPh3)2].

125
class.10 Therefore, reinforcement of this and other alkoxysilane substituted, vinyl-addition
polynorbornenes will ultimately allow this class of materials to be used in much broader
range of applications. As such, (CNCs) were chosen as an additive, as they possess an
uncommon filler property of being largely transparent when well dispersed in addition to
reinforcing polymer matrices.11 Ideally, unfunctionalized CNCs are utilized in order to
maximize hydrogen bonding interactions between CNCs and reinforce the host polymer.
This reinforcement is generally more prevalent at higher CNC concentrations, as
percolation networks can be formed under such conditions.8
Previous efforts to reinforce alkoxysilane-bearing polymers using CNCs have
focused on acrylate-based polymers and used CNCs as a platform for crosslinking.12-19
Vinyl-addition polynorbornenes discussed here are distinct from those silane containing
Figure 5.2: Optical photographs are arranged in order of increasing CNC content: 5.2a PTESN, 5.2b 1-CNC-PTESN, 5.2c 5-CNC-PTESN, 5.2d 10-CNC-PTESN, 5.2e 15-CNC-PTESN, and 5.2f 20-CNC-PTESN.

126
polymers that were combined with CNCs, such as trialkoxysilane functionalized
polyacrylates, as they have a bicyclic backbone and form a rigid polymer without a need
to use a crosslinking platform. Herein we show that we can easily fabricate CNC-PTESN
composites that are dispersed by simple solvent casting from toluene. Confirmation of
minimal aggregation was obtained from scanning electron microscope (SEM) and
transmission electron microscope (TEM) imaging. Even at CNC concentrations as high as
20 wt% in PTESN (20-CNC-PTESN), TEM showed only very small as clusters of CNC
aggregates. The dispersion was made more evident with mechanical reinforcement of the
matrix polymer at high concentrations of filler loadings, illustrated by increases in the
storage and Young’s modulus, implying reinforcement from filler-filler and filler-matrix
interactions. This work uses a novel polymer-filler system to study silane-OH interactions.
Figure 5.3: SEM micrographs are arranged in order of increasing CNC content. 5.3a PTESN, 5.3b 1-CNC-PTESN, and 5.3c 5-CNC-PTESN, 5.3d 10-CNC-PTESN, 5.3e 15-CNC-PTESN, and 5.3f 20-CNC-PTESN. All scale bars are 1 µm.
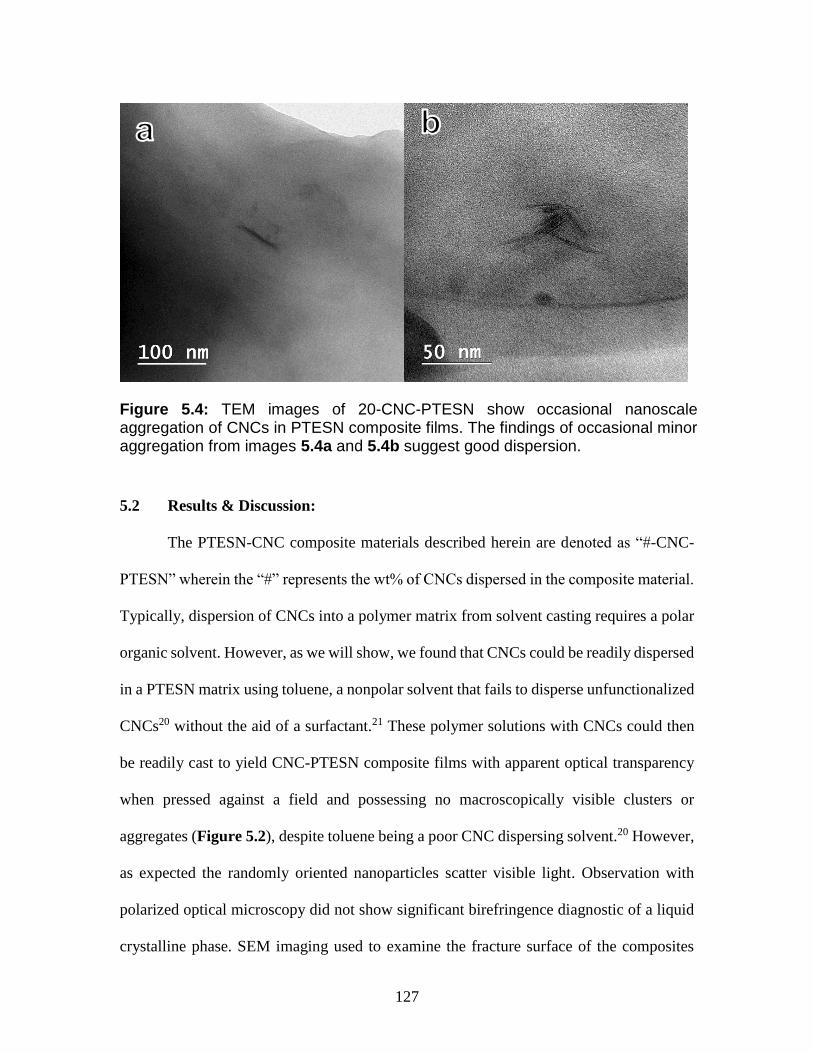
127
5.2 Results & Discussion:
The PTESN-CNC composite materials described herein are denoted as “#-CNC-
PTESN” wherein the “#” represents the wt% of CNCs dispersed in the composite material.
Typically, dispersion of CNCs into a polymer matrix from solvent casting requires a polar
organic solvent. However, as we will show, we found that CNCs could be readily dispersed
in a PTESN matrix using toluene, a nonpolar solvent that fails to disperse unfunctionalized
CNCs20 without the aid of a surfactant.21 These polymer solutions with CNCs could then
be readily cast to yield CNC-PTESN composite films with apparent optical transparency
when pressed against a field and possessing no macroscopically visible clusters or
aggregates (Figure 5.2), despite toluene being a poor CNC dispersing solvent.20 However,
as expected the randomly oriented nanoparticles scatter visible light. Observation with
polarized optical microscopy did not show significant birefringence diagnostic of a liquid
crystalline phase. SEM imaging used to examine the fracture surface of the composites
Figure 5.4: TEM images of 20-CNC-PTESN show occasional nanoscale aggregation of CNCs in PTESN composite films. The findings of occasional minor aggregation from images 5.4a and 5.4b suggest good dispersion.

128
found an absence of CNC aggregation on a 1-10 µm scale within cast films, suggesting
that negligible amounts of CNC clusters were present at this scale. Further, the presence of
nanosized features in PTESN Figure 5.3a made it exceedingly difficult to confirm the
presence of dispersed CNCs in the other polymer films Figures 5.3b-5.3f. TEM imaging
of these composite films did reveal the presence of some small clusters of aggregated CNCs
within the polymer matrix (Figure 5.4). However, it should be noted that TEM imaging of
individual CNCs within a carbon-based polymer matrix is exceedingly difficult22 as the
width of CNCs approach the resolution and contrast limits of TEM. This makes smaller
clusters or individual CNCs difficult to image using this technique. As such, the lack of
aggregated species on the macroscopic scale (Figure 5.2) and the lack of significant
aggregation via TEM imaging (Figure 5.4) suggest that there is a good dispersion of CNCs
within the matrix, though the authors acknowledge this is not definitive proof of ideal CNC
dispersion.
The DMA data indicates that storage modulus E’ is increased at CNC
concentrations as low as 5 wt%, and steadily increases as a function of CNC loading
percent starting at an initial value of 400 MPa for PTESN and ending with a value of 1200
MPa for PTESN-20-CNC at 25 °C (Table S1). It should be noted that the applications
available for a polymer with a storage modulus of 1200 MPa are significantly broader than
those applicable to non-reinforced PTESN, thereby opening the use of these
nanocomposites to a broader audience.
Representative tan δ curves (Figure 5.5) show a shift in the glass transition
temperature of the composite material indicating strong interactions between filler and
matrix.23 Further, broadening is observed which has been ascribed to the loss of mobility

129
of the polymer chains through the possible mechanisms of friction from filler particle
interactions, filler polymer motion at filler interface, or a change in polymer properties at
filler interface.23-24
Young’s modulus increases as CNC loading is increased, and significant
enhancements are observed at 5 wt% CNC loading increasing from the neat polymer at 540
MPa to 700 MPa and further increased for 20-CNC-PTESN to 970 MPa. The strain at break
and toughness have a trend of decreasing toughness and elongation at break with increased
CNC loading. In contrast there is not a clear trend with the change in maximum tensile
stress as the experimental error of the neat PTESN and 1-CNC-PTESN. Data from Table
S5.2 and representative curves (Figure S5.3) show these trends.
Thermal gravimetric analysis of these composites revealed an increase in the
thermal degradation temperature of the CNCs °C 15-CNC-PTESN, and 283 °C for the 20-
CNC-PTESN sample (Figure 5.6). Notably 1-CNC-PTESN and 5-CNC-PTESN do not
have a clear degradation event associated with CNCs. Previous studies have hypothesized
0
300
600
900
1200
1500
0% 1% 5% 10% 15% 20%
Modulu
s (
MP
a)
wt% CNC in PTESN
Young's Modulus
Storage Modulus
at 25 °C
a b
Figure 5.5: PTESN CNC composites were tested with dynamic mechanical analysis (DMA) and tensile testing. Reinforcement from increased stiffness (E’ and E) is presented on bar graph 5.5a and DMA traces show the increase in storage modulus (E’) with increasing CNC content 5.5b.

130
that there is an increase in thermal stability of cellulose composite materials when there are
favorable interactions between the filler and matrix arising from van der Waals interactions
and hydrogen bonding, and a decrease in thermal stability upon aggregation of the cellulose
filler.23 Application of this relationship could correspond to a 10-CNC-PTESN that is well
dispersed and thermally stabilized and for 15-CNC-PTESN and 20-CNC-PTESN samples
approach the onset of aggregation for the material. Data for all TGA traces is available as
Figure S5.4.
Previous polymers that have been able to increase the degradation temperature of
CNCs include polyvinyl alcohol,25 polyfuryl alcohol (PFA),26 and γ-
aminopropyltrimethoxysilane (APS) functionalized CNCs in polyurethane.15 Interestingly,
the PFA-CNC composite showed great thermal stability and its (C-O-C) backbone is
analogous to PTESN’s pendant groups (Si-O-C) as only being able to accept hydrogen
bonds. Additionally, APS functionalized CNCs mixed with polyurethane are interesting as
0%
25%
50%
75%
100%
0 200 400 600
Mass o
f S
am
ple
Temperature ( C)
CNCs
PTESN
10-CNC-PTESN
20-CNC-PTESN
Figure 5.6: Thermogravimetric analysis of neat CNCs, 10-CNC-PTESN, 20-CNC-PTESN, and PTESN show that the CNCs have increased thermal stability when combined with PTESN. The 5 wt% loss for neat CNCs is ca. 278 °C, 10-CNC-PTESN is ca. 295 °C, and 20-CNC-PTESN is ca. 283 °C, and PTESN is 354 °C.

131
the trimethoxysilane functional groups on the CNCs may have similar interactions as the
CNC-PTESN composite system studied herein.
To better understand how and why we are able to readily disperse CNCs in a
PTESN matrix using a typically poor performing solvent, toluene, we looked to a previous
study that explained favorable interactions between alkoxysilane molecules and cellulose
fibers.13 This study suggested that alkoxysilane groups are subject to reactions with
alcohols and adventitious water to form silanol groups (Si-OH). Furthermore, previous
studies have shown that cellulose may form covalent bonds with these pendant side groups
(Si-O-cellulose) and residual moisture may lead to possible siloxane linkages (Si-O-Si)
under similar conditions.13, 27 In our study, solid-state NMR (29Si and 13C) was employed
to interrogate both the PTESN and 20-CNC-PTESN systems (Figure 5.7).
The 29Si NMR spectra for PTESN and 20-CNC-PTESN are shown in Figure 5.7 in
which both samples showed only a single resonance indicating that there is no detectable
amount of hydrolysis (Si-OH) or etherification reactions (Si-O-Si) occurring. Previous
050100
ppm
-70-50-30-10
ppm
a
b
c
d
Figure 5.7: Solid-State NMR spectra of PTESN and 20-CNC-PTESN are shown
with the number of scans noted in parenthesis. The 29
Si NMR spectra for 5.7a)
neat PTESN (2000) is 5.7a) and 5.7b) is 20-CNC-PTESN (32000). The 13
C spectra of neat CNCs is 5.7c) (8000) and 5.7d) is 20-CNC-PTESN (8000).

132
studies that have found additional peaks further upfield ca. 7-9 ppm for self-
condensed (Si-O-Si) etherification bonds and hydrolysis (Si-OH).13, 27 These studies
were unable to directly detect the presence of (Si-O-) groups bonded to cellulose as
there likely not an appreciable change in chemical shift. The solid-state 13C spectrum
of the 20-CNC-PTESN, has peaks are similar to previous 13C spectra of the neat
polymer1 with expected peaks from cellulose.28 Although this is not conclusive, as
we believe the number of reactions, if any are occurring, are below the detection
limit of NMR, and we do not discount the possibility of hydrolysis reactions.
Although water was not directly added to the system, atmospheric water did have
ample opportunity to react with the PTESN and 20-CNC-PTESN, however, there is
no evidence of hydrolysis occurring in Figure 5.7. As water is more reactive than
primary ether species (C-OH) we believe that (Si-O-CNC) linkages are unlikely.
Hydrolysis reactions creating (Si-OH) groups would likely improve
interactions between the CNCs and the pendant groups, which would then act as
strong hydrogen bond acceptors and donors for the numerous hydroxyls displayed
on the CNCs. The significant reinforcement observed indicates that some
advantageous interactions between the polymer and filler are present and based upon
the spectral data collected we hypothesize that hydrogen bonding between the CNCs
and the Si-O-R moieties, with or without water, are the most likely sources of these
favourable interactions.

133
5.3 Experimental:
5.3.1 Materials:
The catalyst trans-[Ni(C6F5)2(SbPh3)2] and monomer 5-triethoxysilyl-2-norbornene
were synthesized according to literature procedures.1, 10 Ethyl acetate (EtOAc) was dried
over CaH2 and degassed via three freeze-pump-thaw cycles. All polymerizations were
conducted in a glovebox under air-free conditions unless otherwise noted. Solution-state
NMR spectroscopy was conducted using a Varian Mercury Vx 300 MHz instrument and
referenced to residual solvent. Wood CNCs hydrolyzed from sulfuric acid with 0.94%
sulfur content by weight and dimensions of 90 ± 40 nm by 7 ± 2 nm (Figure S5.5) were
obtained from the University of Maine Forest Products Laboratory and dried overnight at
50 °C under high vacuum before use.
5.3.2 Synthesis of poly(triethoxysilylnorbornene) (PTESN):
Polymerizations were conducted using a modified literature procedure.1, 10 In a
typical polymerization, the catalyst trans-[Ni(C6F5)2(SbPh3)2] (0.011 g, 10 μmol) was
added to a stirred solution of ethyl acetate (EtOAc) (4 mL) and the monomer 5-
triethoxysilyl-2-norbornene (2.56 g, 10 mmol). The polymerization was stirred for 24 h,
then diluted with additional EtOAc (6 mL) and precipitated into excess methanol (Figure
5.1). The resultant polymer was isolated via vacuum filtration and dried in vacuo to yield
PTESN (1.359 g, 53.1%, Mn 227 kg/mol, and Đ 2.18), which was characterized by NMR
(Figure S5.1) and GPC (Figure S5.2). The dispersity agrees with the ranges previously
published for vinyl-addition polymerizations.1

134
5.3.3 Gel Permeation Chromatography (GPC):
Molecular weight data for PTESN was measured using a Tosoh EcoSEC GPC
operating at 40 °C in THF and molecular weight values are reported relative to polystyrene
standards.
5.3.4 Fabrication of CNC-reinforced PTESN films:
CNCs were dried by heating at 50 °C under vacuum for 12-24 h. PTESN (0.5 g)
was dissolved in toluene (10 mL) and pushed through 0.45 μm PTFE syringe filter into a
clean vial. The dried CNCs (1-20 wt%) were added to the polymer solution, capped, and
the resultant suspension stirred for 48 h. The suspension was then deposited onto a levelled
Teflon casting dish, covered with aluminum foil, and the solvent slowly evaporated for 5
days. Recovered samples are referenced using the #-CNC-PTESN format in which #
represents the wt% of CNCs relative to PTESN.
5.3.5 Dynamic Mechanical Analysis:
Dynamic mechanical analysis was conducted using a TA Instruments Q800 DMA
using a film tension clamp and a temperature ramp from room temperature to 400 °C at
0.1% strain, 1 Hz, and a heating rate of 5 °C/min. Tested films were cut into rectangular
coupons that were ca. 5 mm in width, 15 mm in length, and ca. 150 µm thick.
5.3.6 Tensile Testing:
Tensile tests were run on an Instron 5943 with a strain rate of 1 mm/min. The
sample dimensions of the dog bone specimens were ca. 110 μm thick and 3.5 mm wide
with a gauge length of ca. 15 mm.

135
5.3.7 Scanning Electron Microscopy:
PTESN and all CNC-PTESN composite films were fractured by bending the films
to a 180° angle and gently pulling the two pieces apart. Films were placed on aluminum
SEM holders on double stick carbon tape and oriented into a beach chair configuration and
coated with 5 nm of iridium in a Leica Sputter Coater. Images of the fractured surface
were taken using a Zeiss Leo Gemini SEM In-lens detector.
5.3.8 Transmission Electron Microscopy:
The 20-CNC-PTESN composite film was mounted on an SEM holder with folded
single sided copper tape and coated with 5 nm of iridium using a Leica sputter coater. The
sample was flipped, and the other side coated with another 5 nm of iridium. The sample
was then embedded in epoxy and cut into 125 nm sections using a Diatome diamond knife
on an RMC microtome with water at room temperature. Sample was retrieved from the
microtome using the perfect loop method and a 300 mesh Peclo formvar coated lacey grid,
which was then imaged using a JEOL 2100 TEM.
5.3.9 Solid State NMR:
Solid state 13C and 29Si NMR spectra were collected using a Bruker III 600 MHz
NMR at 2000-32000 scans to analyze samples for a silyl ether reaction that may have taken
place. Created films were ground in a Spex Cryomill for three 3 min cycles with a 1 min
rest in between milling times. The 29Si spectra (Figures 5.7a-b) correspond to PTESN and
20-CNC-PTESN. The 20-CNC-PTESN sample was chosen as it is the most likely to have
a split peak in the 29Si spectra indicating a possible hydrolysis or etherification reaction.27
The neat PTESN sample was chosen as the control. The corresponding 13C NMR (Figure

136
5.7 c-d) were present to verify agreement with the 29Si NMR and note deviations from
previous 13C NMR scans of the monomeric species.1
5.3.10 Thermogravimetric Analysis:
Thermogravimetric analysis (TGA) was carried out on a TA Instruments Q10 with
a temperature ramp of 10 °C min-1 from room temperature to 1000 °C in nitrogen
atmosphere for all composite samples. The raw CNC sample was equilibrated to 80 °C and
held isothermally for 20 minutes to drive off residual moisture. The data from the TGA
were then taken from the base weight at 80 °C and plotted in Figure 5.6 in the relevant
temperature range 80-600 °C.
5.4 Conclusions:
Novel reinforced composites of PTESN and CNCs were cast from toluene. Though
toluene is typically a poor solvent for CNC dispersion, we have shown that if PTESN is
used as a polymer matrix, good CNC dispersion may be realized on both the macroscopic
and nanoscopic scales. This is evidenced by the mechanical reinforcement observed
through both tensile and DMA results, which show significant improvements at 5 wt%
loading.22 The higher thermal degradation temperature of the CNC as composites, as
compared to the neat CNCs, suggests CNCs in contact with alkoxysilanes can be melt
processed into a variety of other silanes, opening these fillers up to use in a much larger
variety of applications. This indicates the reported methods should allow lower melting
point polymers of this type to be processed by extrusion, melt mixing and other
conventional means leading to a new class of thermally stable CNC composite materials.
Conflicts of interest:
The authors declare no conflict of interests.

137
Acknowledgements:
The authors would like to acknowledge Christopher Winkler for operation of the JEOL
2100 TEM.
References:
1. Gmernicki, K. R.; Hong, E.; Maroon, C. R.; Mahurin, S. M.; Sokolov, A. P.; Saito,
T.; Long, B. K., Accessing Siloxane Functionalized Polynorbornenes via Vinyl-Addition
Polymerization for CO2 Separation Membranes. ACS Macro Letters 2016, 5 (7), 879-883.
2. Sundell, B. J.; Lawrence Iii, J. A.; Harrigan, D. J.; Vaughn, J. T.; Pilyugina, T. S.;
Smith, D. R., Alkoxysilyl functionalized polynorbornenes with enhanced selectivity for
heavy hydrocarbon separations. RSC Advances 2016, 6 (57), 51619-51628.
3. Bermeshev, M. V.; Syromolotov, A. V.; Starannikova, L. E.; Gringolts, M. L.;
Lakhtin, V. G.; Yampolskii, Y. P.; Finkelshtein, E. S., Glassy Polynorbornenes with Si–
O–Si Containing Side Groups. Novel Materials for Hydrocarbon Membrane Separation.
Macromolecules 2013, 46 (22), 8973-8979.
4. Sapkota, J.; Jorfi, M.; Weder, C.; Foster, E. J., Reinforcing poly (ethylene) with
cellulose nanocrystals. Macromolecular rapid communications 2014, 35 (20), 1747-1753.
5. Sapkota, J.; Natterodt, J. C.; Shirole, A.; Foster, E. J.; Weder, C., Fabrication and
Properties of Polyethylene/Cellulose Nanocrystal Composites. Macromolecular Materials
and Engineering 2017, 302 (1), 1600300-n/a.
6. Biyani, M. V.; Foster, E. J.; Weder, C., Light-Healable Supramolecular
Nanocomposites Based on Modified Cellulose Nanocrystals. ACS Macro Letters 2013, 2
(3), 236-240.
7. Natterodt, J. C.; Sapkota, J.; Foster, E. J.; Weder, C., Polymer Nanocomposites with
Cellulose Nanocrystals Featuring Adaptive Surface Groups. Biomacromolecules 2017, 18
(2), 517-525.
8. Favier, V.; Cavaille, J. Y.; Canova, G. R.; Shrivastava, S. C., Mechanical
percolation in cellulose whisker nanocomposites. Polymer Engineering & Science 1997,
37 (10), 1732-1739.
9. Chakrabarty, A.; Teramoto, Y., Recent Advances in Nanocellulose Composites
with Polymers: A Guide for Choosing Partners and How to Incorporate Them. Polymers
2018, 10 (5).
10. Belov, N.; Nikiforov, R.; Starannikova, L.; Gmernicki, K. R.; Maroon, C. R.; Long,
B. K.; Shantarovich, V.; Yampolskii, Y., A detailed investigation into the gas permeation
properties of addition-type poly(5-triethoxysilyl-2-norbornene). European Polymer
Journal 2017, 93, 602-611.
11. Moon, R. J.; Martini, A.; Nairn, J.; Simonsen, J.; Youngblood, J., Cellulose
nanomaterials review: structure, properties and nanocomposites. Chemical Society Reviews
2011, 40 (7), 3941-3994.
12. Elmabrouk, A. B.; Wim, T.; Dufresne, A.; Boufi, S., Preparation of poly(styrene-
co-hexylacrylate)/cellulose whiskers nanocomposites via miniemulsion polymerization.
Journal of Applied Polymer Science 2009, 114 (5), 2946-2955.

138
13. Mabrouk, A. B.; Salon, M. C. B.; Magnin, A.; Belgacem, M. N.; Boufi, S.,
Cellulose-based nanocomposites prepared via mini-emulsion polymerization:
Understanding the chemistry of the nanocellulose/matrix interface. Colloids and Surfaces
A: Physicochemical and Engineering Aspects 2014, 448, 1-8.
14. Yue, L.; Maiorana, A.; Khelifa, F.; Patel, A.; Raquez, J. M.; Bonnaud, L.; Gross,
R.; Dubois, P.; Manas-Zloczower, I., Surface-modified cellulose nanocrystals for biobased
epoxy nanocomposites. Polymer 2018, 134, 155-162.
15. Kargarzadeh, H.; Sheltami, R. M.; Ahmad, I.; Abdullah, I.; Dufresne, A., Cellulose
nanocrystal: A promising toughening agent for unsaturated polyester nanocomposite.
Polymer 2015, 56, 346-357.
16. Ladhar, A.; Ben Mabrouk, A.; Arous, M.; Boufi, S.; Kallel, A., Dielectric properties
of nanocomposites based on cellulose nanocrystals (CNCs) and poly(styrene-co-2-ethyl
hexylacrylate) copolymer. Polymer 2017, 125, 76-89.
17. Ladhar, A.; Arous, M.; Boufi, S.; Kallel, A., Molecular dynamics of poly(styrene-
co-2-ethyl hexylacrylate) copolymer/cellulose nanocrystals nanocomposites investigated
by dielectric relaxation spectroscopy: Effect of the silane content. Journal of Molecular
Liquids 2016, 224, 515-525.
18. Yang, J.; Han, C.-R.; Duan, J.-F.; Ma, M.-G.; Zhang, X.-M.; Xu, F.; Sun, R.-C.;
Xie, X.-M., Studies on the properties and formation mechanism of flexible nanocomposite
hydrogels from cellulose nanocrystals and poly(acrylic acid). Journal of Materials
Chemistry 2012, 22 (42), 22467-22480.
19. Yang, J.; Han, C.-R.; Duan, J.-F.; Ma, M.-G.; Zhang, X.-M.; Xu, F.; Sun, R.-C.,
Synthesis and characterization of mechanically flexible and tough cellulose nanocrystals–
polyacrylamide nanocomposite hydrogels. Cellulose 2013, 20 (1), 227-237.
20. Peng, S. X.; Chang, H.; Kumar, S.; Moon, R. J.; Youngblood, J. P., A comparative
guide to controlled hydrophobization of cellulose nanocrystals via surface esterification.
Cellulose 2016, 23 (3), 1825-1846.
21. Heux, L.; Chauve, G.; Bonini, C., Nonflocculating and Chiral-Nematic Self-
ordering of Cellulose Microcrystals Suspensions in Nonpolar Solvents. Langmuir 2000, 16
(21), 8210-8212.
22. Foster, E. J.; Moon, R. J.; Agarwal, U. P.; Bortner, M. J.; Bras, J.; Camarero-
Espinosa, S.; Chan, K. J.; Clift, M. J. D.; Cranston, E. D.; Eichhorn, S. J.; Fox, D. M.;
Hamad, W. Y.; Heux, L.; Jean, B.; Korey, M.; Nieh, W.; Ong, K. J.; Reid, M. S.;
Renneckar, S.; Roberts, R.; Shatkin, J. A.; Simonsen, J.; Stinson-Bagby, K.; Wanasekara,
N.; Youngblood, J., Current characterization methods for cellulose nanomaterials.
Chemical Society Reviews 2018, 47 (8), 2609-2679.
23. Dufresne, A., Nanocellulose: from nature to high performance tailored materials.
Walter de Gruyter GmbH & Co KG: 2017.
24. Bendahou, A.; Kaddami, H.; Dufresne, A., Investigation on the effect of cellulosic
nanoparticles’ morphology on the properties of natural rubber based nanocomposites.
European Polymer Journal 2010, 46 (4), 609-620.
25. Cho, M.-J.; Park, B.-D., Tensile and thermal properties of nanocellulose-
*reinforced poly(vinyl alcohol) nanocomposites. J. Ind. Eng. Chem. 2011, 17 (1), 36-40.
26. Pranger, L.; Tannenbaum, R., Biobased Nanocomposites Prepared by In Situ
Polymerization of Furfuryl Alcohol with Cellulose Whiskers or Montmorillonite Clay.
Macromolecules 2008, 41 (22), 8682-8687.
139
27. Salon, M.-C. B.; Gerbaud, G.; Abdelmouleh, M.; Bruzzese, C.; Boufi, S.;
Belgacem, M. N., Studies of interactions between silane coupling agents and cellulose
fibers with liquid and solid-state NMR. Magnetic Resonance in Chemistry 2007, 45 (6),
473-483.
28. Kono, H.; Yunoki, S.; Shikano, T.; Fujiwara, M.; Erata, T.; Takai, M., CP/MAS
13C NMR Study of Cellulose and Cellulose Derivatives. 1. Complete Assignment of the
CP/MAS 13C NMR Spectrum of the Native Cellulose. Journal of the American Chemical
Society 2002, 124 (25), 7506-7511.

140
5.5 Supporting Information:
Cellulose Nanocrystal-Reinforced Poly(5-triethoxysilyl-2-norbornene) Composites
Figure S5.1: Above is an 1H-NMR spectrum of poly(5-triethoxysilyl-2-norbornene) (PTESN).
a
b
H2O
CDCl3
c

141
Result of molecular weight calculation (RI)
Peak 1 Valley Peak
[min] [mV] [mol] Mn 226,900
Peak start 5.707 0.738 4,150,000 Mw 495,000
Peak top 6.835 4.306 316,300 Mz 1,131,000
Peak end 8.048 0.679 50,670 Mz+1 2,005,000
Mv 495,000
Height [mV] 4.309 Mp 305,000
Area [mV*sec]
358.2 Mz/Mw 2.29
Area% [%] 100 Mw/Mn 2.18
[eta] 495000 Mz+1/Mw 4.06
Figure S5.2: A GPC trace of PTESN is shown.
-10
0
10
20
6 8 10
[min]
[mV
]
1 / 6
. 8
35
Peak No.
Retention time.

142
Table S5.1: DMA data of PTESN CNC composites at select temperatures is below.
Temperature °C
Storage Modulus (MPa) 0-CNCs 1-CNC 5-CNC 10-CNC 15-CNC 20-CNC
25 400 ± 100 300 ± 100 510 ± 90 900 ± 300 1100 ±
300 1200 ±
200
50 400 ± 100 300 ± 100 510 ± 80 900 ± 300 1100 ±
300 1100 ±
200
100 320 ± 70 300 ± 100 460 ± 50 822 ± 200 900 ± 200 900 ± 200
200 310 ± 3 600 ±100 320 ± 10 570 ± 80 520 ± 100 600 ±100
300 174 ± 4 120 ± 40 170 ± 20 230 ± 40 170 ± 30 200 ±30
Table S5.2. Tensile data of PTESN CNC composites is denoted below.
Sample Young’s Modulus
(MPa) Maximum Tensile
Stress (MPa) Strain at break (%) Toughness kJ m-3
PTESN 540 ± 50 12 ± 4 5 ± 2 230 ± 70
1-CNC-PTESN 600 ± 200 15 ± 4 3 ± 2 310 ± 260
5-CNC-PTESN 700 ± 100 12.0 ± 0.7 2.1 ± 0.4 140 ± 30
10-CNC-PTESN 840 ± 70 13 ± 1 1.9 ± 0.2 130 ± 20
15-CNC-PTESN 820 ± 70 10 ± 2 1.6 ± 0.2 80 ± 20
20-CNC-PTESN 970 ± 80 12 ± 1 1.5 ± 0.2 80 ± 30

143
Figure S5.3: Representative tensile plots from PTESN CNC composites are shown.
Figure S5.4: Thermogravimetric traces for PTESN, 1-CNC-PTESN, 5-CNC-PTESN, 10-CNC-PTESN, 15-CNC-PTESN, and 20-CNC-PTESN are shown.

144
Figure S5.5: TEM Micrograph shows University of Maine CNCs. CNCs have dimensions of 90 ± 40 and 7 ± 2. Image was taken on JEOL 2100 TEM. Photo credit Rose Roberts and Kelly Stinson Bagby.

145
Chapter 6: Conclusions and Outlook
This chapter takes information from chapters 1-5 to draw reasonable conclusions and future
steps to further this research.

146
Conclusions and outlook:
The challenges overcome in this work were the incorporation of cellulose
nanocrystals (CNCs) into hydrophobic polymer matrices and the functionalization of
CNCs with the catalyst 1,1’-bis(bromodimethylsilyl)zirconocene (catalyst 1), tertiary
amine groups (ACNC), and CNCs with zwitterionic groups (ZCNCs).
The unfavorable interactions of hydrophobic to disperse hydrophilic CNCs into
hydrophobic polymer matrices was overcome in a high molecular weight unsubstituted
polyethylene (PE) in chapter 2 of this work. The CNCs were functionalized by a reaction
with the anchoring catalyst (catalyst 1). These catalyst functionalized CNCs (C1-CNCs)
were separated by the subsequent polymerization of ethylene from the active catalyst on
the C1-CNC surfaces. This work was subsequently built upon in chapter 3, where C1-
CNCs were used in conjunction with ethylene and 1-hexene making a linear low-density
polyethylene (LLDPE) polymer matrix composite (PMC). The LLDPE PMC had physical
properties such as melting point close to those of existing commercial LLDPEs but a
greater Young’s modulus. These LLDPE materials could likely be substituted into existing
LLDPE technologies and used for advanced composite materials.
In chapter 2 and chapter 3 there was a substantial increase in the Young’s modulus
of the polymer when combined with C1-CNCs to form a PMC. The straight chain PE at a
high molecular weight had a Young’s modulus that was 10% better than existing robust
PEs we referenced. The CNC-LLDPE PMC materials showed a two-fold increase in
Young’s modulus between 3.6 wt% CNC PMC and 11.4 wt% CNC PMCs. The primary
accomplishment from each of these chapters was the easy incorporation of the CNCs into
147
the PE/LLDPE, and because of the low cost and known versatility of PE this technology,
this process could be used to make stiffer PE/LLDPE products.
The even greater potential benefit of this CNC/PE PMC technology lies in what
could be accomplished with the functional groups on CNCs. It is established that PE is a
very inert polymer, and even incorporation of additives can be challenging and require an
intense mixing process. Using the C1-CNCs that are going to be added to the PE, there is
a possibility to add other functional groups to the CNCs before catalyst 1 is added to the
surface of the CNCs. A useful application would be attaching dyes that are compatible with
cellulose to have the dispersed CNCs color the PMC material. A challenge with this
approach would be the reaction with the anchoring catalyst on the dye functionalized CNCs
surface, and a second roadblock could be a reaction between the dye and the
methylalumoxane co-catalyst.
The incorporation of CNCs into poly(5-triethoxysilyl-2-norbornene) (PTESN) was
accomplished by solvent casting. The result was a mechanically robust PMC that had
improved stiffness when compared to the neat PTESN material. The reinforced polymer
result is both stiffer and more thermally stable, but the vehicle for application in this system
is even greater than that for the PE/CNC PMCs. The PTESN was generated by using a
catalyst capable of polymerizing cyclic alkenes without the need for methylalumoxane.
This corresponds to the polymerization of custom polynorbornenes being possible to the
extent that they do not poison the polymerizing catalyst. Custom polynorbornene combined
with functional CNCs could lead to interesting combinations and designer PMCs that can
have more complicated functionalities than the PE/CNC PMCs.

148
The ACNCs and ZCNCs have potential applications as membrane materials.
Chapter 4 discussed at length the features of the zwitterionic CNCs and how they could be
used for membrane applications. The ZCNCs also fill a unique role in that they feature
hydrophilic groups. The large amount of both positive and negative charges on the ZCNC
surface could be useful for water retaining applications. Although most prominent water
retaining application are present in the biological fields where charged polysaccharides like
heparin are common.
In this work I have presented new methods for incorporating CNCs into
hydrophobic polymer materials, and the functionalization of CNC surfaces with various
species. These materials are a contribution to research and industry as intermediate steps.
These technologies can be used to ideally overcome the faults (such as the unreactive
nature) that some hydrophobic polymers have. Thus, I propose that the mixing methods
presented in these chapters and the functionalization chapter 3, can be used to further
research and scientific end goals by providing avenues for novel composite materials.
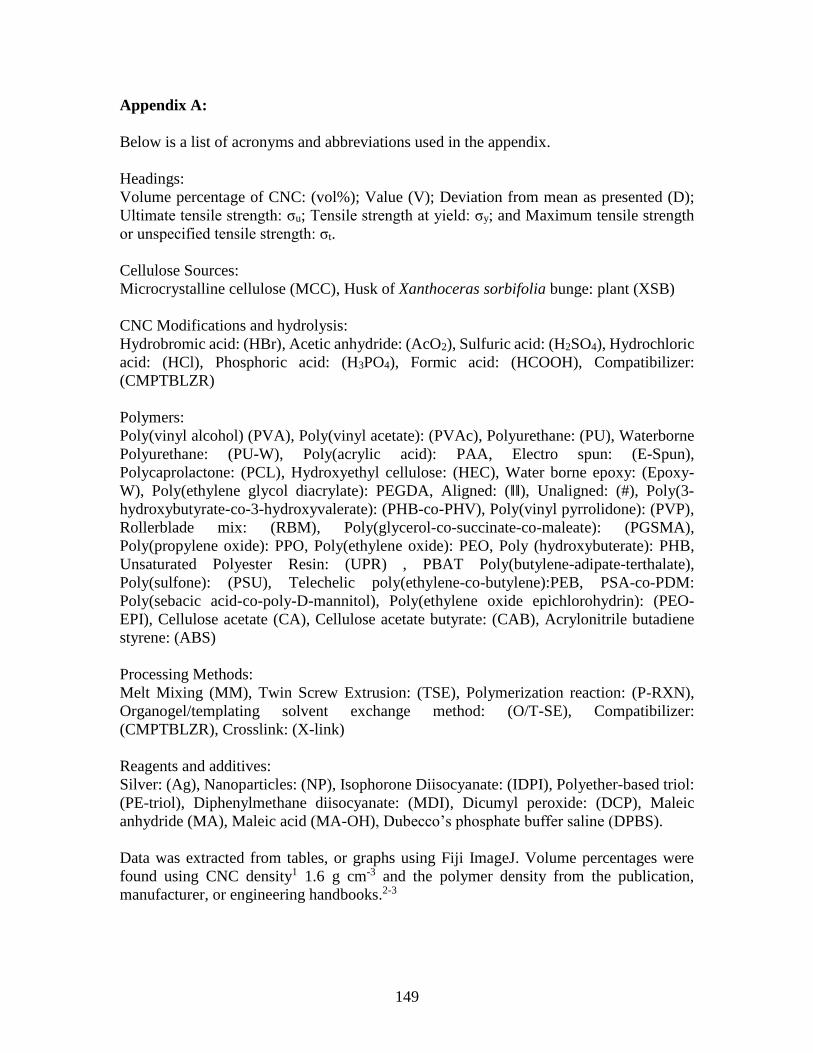
149
Appendix A:
Below is a list of acronyms and abbreviations used in the appendix.
Headings:
Volume percentage of CNC: (vol%); Value (V); Deviation from mean as presented (D);
Ultimate tensile strength: σu; Tensile strength at yield: σy; and Maximum tensile strength
or unspecified tensile strength: σt.
Cellulose Sources:
Microcrystalline cellulose (MCC), Husk of Xanthoceras sorbifolia bunge: plant (XSB)
CNC Modifications and hydrolysis:
Hydrobromic acid: (HBr), Acetic anhydride: (AcO2), Sulfuric acid: (H2SO4), Hydrochloric
acid: (HCl), Phosphoric acid: (H3PO4), Formic acid: (HCOOH), Compatibilizer:
(CMPTBLZR)
Polymers:
Poly(vinyl alcohol) (PVA), Poly(vinyl acetate): (PVAc), Polyurethane: (PU), Waterborne
Polyurethane: (PU-W), Poly(acrylic acid): PAA, Electro spun: (E-Spun),
Polycaprolactone: (PCL), Hydroxyethyl cellulose: (HEC), Water borne epoxy: (Epoxy-
W), Poly(ethylene glycol diacrylate): PEGDA, Aligned: (ǁǁ), Unaligned: (#), Poly(3-
hydroxybutyrate-co-3-hydroxyvalerate): (PHB-co-PHV), Poly(vinyl pyrrolidone): (PVP),
Rollerblade mix: (RBM), Poly(glycerol-co-succinate-co-maleate): (PGSMA),
Poly(propylene oxide): PPO, Poly(ethylene oxide): PEO, Poly (hydroxybuterate): PHB,
Unsaturated Polyester Resin: (UPR) , PBAT Poly(butylene-adipate-terthalate),
Poly(sulfone): (PSU), Telechelic poly(ethylene-co-butylene):PEB, PSA-co-PDM:
Poly(sebacic acid-co-poly-D-mannitol), Poly(ethylene oxide epichlorohydrin): (PEO-
EPI), Cellulose acetate (CA), Cellulose acetate butyrate: (CAB), Acrylonitrile butadiene
styrene: (ABS)
Processing Methods:
Melt Mixing (MM), Twin Screw Extrusion: (TSE), Polymerization reaction: (P-RXN),
Organogel/templating solvent exchange method: (O/T-SE), Compatibilizer:
(CMPTBLZR), Crosslink: (X-link)
Reagents and additives:
Silver: (Ag), Nanoparticles: (NP), Isophorone Diisocyanate: (IDPI), Polyether-based triol:
(PE-triol), Diphenylmethane diisocyanate: (MDI), Dicumyl peroxide: (DCP), Maleic
anhydride (MA), Maleic acid (MA-OH), Dubecco’s phosphate buffer saline (DPBS).
Data was extracted from tables, or graphs using Fiji ImageJ. Volume percentages were
found using CNC density1 1.6 g cm-3 and the polymer density from the publication,
manufacturer, or engineering handbooks.2-3

150
R CNC, Source, Hydrolysis, Modification
Method Matrix CNC Young's Modulus (MPa)
Strain at Break (%)
Strength (MPa)
vol% V D V D σu σy σt D
4 Cotton, H2SO4 Cast PVA 0.00 20 2 - - - - - -
4 Cotton, H2SO4 Cast PVA 0.75 21 5 - - - - - -
4 Cotton, H2SO4 Cast PVA 1.50 23 2 - - - - - -
4 Potato Peel H2SO4
Cast PVA 0.75 27 1 - - - - - -
4 Potato Peel H2SO4
Cast PVA 1.50 30.8 0.8 - - - - - -
4 Cotton, H2SO4 Cast PVA 0.00 330 40 - - - - - -
4 Cotton, H2SO4 Cast PVA 0.75 360 40 - - - - - -
4 Cotton, H2SO4 Cast PVA 1.50 390 30 - - - - - -
4 Potato Peel H2SO4
Cast PVA 0.75 400 20 - - - - - -
4 Potato Peel H2SO4
Cast PVA 1.50 460 40 - - - - - -
5 Cotton, H2SO4 Cast PVA 0.00 1300 200 - - - - - -
5 Cotton, H2SO4 Cast PVA:PAA 90:10
0.00 1600 300 - - - - - -
5 Cotton, H2SO4 Cast PVA 11.60
1400 - - - - - - -
5 Cotton, H2SO4 Cast PVA:PAA 80:10
7.63 2200 400 - - - - - -
5 Cotton, H2SO4 Cast PVA:PAA 70:10
15.68
2100 400 - - - - - -
6 Cotton, H2SO4 E-Spun Mats (ǁǁ)
PVA 0.00 87 5 - - - - 5.3 0.2
6 Cotton, H2SO4 E-Spun Mats (ǁǁ)
PVA 2.25 110 4 - - - - 6.7 0.6
6 Cotton, H2SO4 E-Spun Mats (ǁǁ)
PVA 3.77 124 8 - - - - 7.3 0.9
6 Cotton, H2SO4 E-Spun Mats (ǁǁ)
PVA 7.63 160 10 - - - - 8.6 0.3
6 Cotton, H2SO4 E-Spun Mats (ǁǁ)
PVA 11.60
190 20 - - - - 10.7 0.9
6 Cotton, H2SO4 E-Spun Mats (ǁǁ)
PVA 0.00 64 5 - - - - 4.1 0.3
6 Cotton, H2SO4 E-Spun Mats (#)
PVA 2.25 81 6 - - - - 5.1 0.5
6 Cotton, H2SO4 E-Spun Mats (#)
PVA 3.77 87 10 - - - - 5.6 0.6
6 Cotton, H2SO4 E-Spun Mats (#)
PVA 7.63 111 4 - - - - 6.6 0.4
6 Cotton, H2SO4 E-Spun Mats (#)
PVA 11.60
134 6 - - 7.9 0.1
7 Cotton, H2SO4 MM (TSE) PVAc 0.00 2200 800 5 1 - - 31 2
7 Cotton, H2SO4 MM (TSE) PVAc 3.77 1900 400 29 3 - - 18 3
7 Cotton, H2SO4 MM (TSE) PVAc 7.63 2100 700 11 2 - - 16 1
7 Cotton, H2SO4 MM (TSE) PVAc 0.00 1700 400 60 30 - - 15 3
7 Cotton, H2SO4 MM (TSE) PVAc 3.77 900 100 160 30 - - 17 2
7 Cotton, H2SO4 MM (TSE) PVAc 7.63 1800 200 140 20 - - 20 1
8 Cotton, H2SO4 Cast PVA 0.00 210 20 250 10 - - 25 4
8 Cotton, H2SO4 0.1 Ag particles
Cast PVA 0.75 750 40 230 10 - - 46 1
8 Cotton H2SO4, 0.1 Ag particles
Cast PVA 0.75 780 40 210 20 - - 48 3
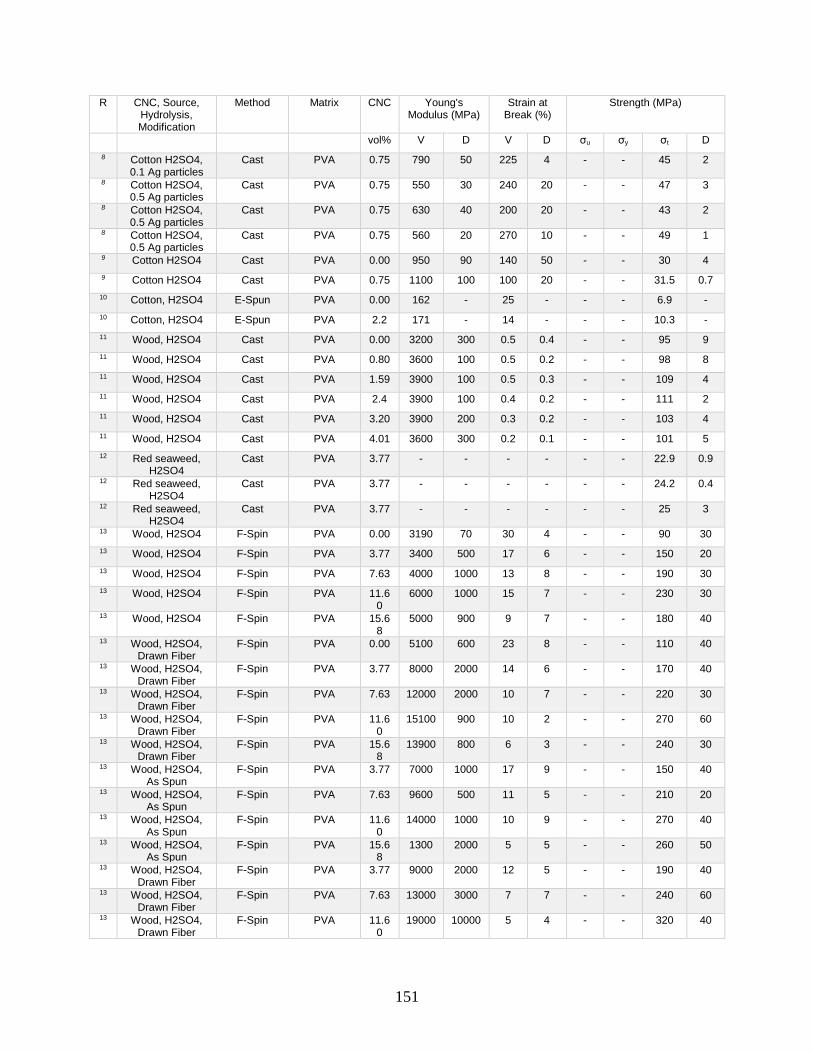
151
R CNC, Source, Hydrolysis, Modification
Method Matrix CNC Young's Modulus (MPa)
Strain at Break (%)
Strength (MPa)
vol% V D V D σu σy σt D
8 Cotton H2SO4, 0.1 Ag particles
Cast PVA 0.75 790 50 225 4 - - 45 2
8 Cotton H2SO4, 0.5 Ag particles
Cast PVA 0.75 550 30 240 20 - - 47 3
8 Cotton H2SO4, 0.5 Ag particles
Cast PVA 0.75 630 40 200 20 - - 43 2
8 Cotton H2SO4, 0.5 Ag particles
Cast PVA 0.75 560 20 270 10 - - 49 1
9 Cotton H2SO4 Cast PVA 0.00 950 90 140 50 - - 30 4
9 Cotton H2SO4 Cast PVA 0.75 1100 100 100 20 - - 31.5 0.7
10 Cotton, H2SO4 E-Spun PVA 0.00 162 - 25 - - - 6.9 -
10 Cotton, H2SO4 E-Spun PVA 2.2 171 - 14 - - - 10.3 -
11 Wood, H2SO4 Cast PVA 0.00 3200 300 0.5 0.4 - - 95 9
11 Wood, H2SO4 Cast PVA 0.80 3600 100 0.5 0.2 - - 98 8
11 Wood, H2SO4 Cast PVA 1.59 3900 100 0.5 0.3 - - 109 4
11 Wood, H2SO4 Cast PVA 2.4 3900 100 0.4 0.2 - - 111 2
11 Wood, H2SO4 Cast PVA 3.20 3900 200 0.3 0.2 - - 103 4
11 Wood, H2SO4 Cast PVA 4.01 3600 300 0.2 0.1 - - 101 5
12 Red seaweed, H2SO4
Cast PVA 3.77 - - - - - - 22.9 0.9
12 Red seaweed, H2SO4
Cast PVA 3.77 - - - - - - 24.2 0.4
12 Red seaweed, H2SO4
Cast PVA 3.77 - - - - - - 25 3
13 Wood, H2SO4 F-Spin PVA 0.00 3190 70 30 4 - - 90 30
13 Wood, H2SO4 F-Spin PVA 3.77 3400 500 17 6 - - 150 20
13 Wood, H2SO4 F-Spin PVA 7.63 4000 1000 13 8 - - 190 30
13 Wood, H2SO4 F-Spin PVA 11.60
6000 1000 15 7 - - 230 30
13 Wood, H2SO4 F-Spin PVA 15.68
5000 900 9 7 - - 180 40
13 Wood, H2SO4, Drawn Fiber
F-Spin PVA 0.00 5100 600 23 8 - - 110 40
13 Wood, H2SO4, Drawn Fiber
F-Spin PVA 3.77 8000 2000 14 6 - - 170 40
13 Wood, H2SO4, Drawn Fiber
F-Spin PVA 7.63 12000 2000 10 7 - - 220 30
13 Wood, H2SO4, Drawn Fiber
F-Spin PVA 11.60
15100 900 10 2 - - 270 60
13 Wood, H2SO4, Drawn Fiber
F-Spin PVA 15.68
13900 800 6 3 - - 240 30
13 Wood, H2SO4, As Spun
F-Spin PVA 3.77 7000 1000 17 9 - - 150 40
13 Wood, H2SO4, As Spun
F-Spin PVA 7.63 9600 500 11 5 - - 210 20
13 Wood, H2SO4, As Spun
F-Spin PVA 11.60
14000 1000 10 9 - - 270 40
13 Wood, H2SO4, As Spun
F-Spin PVA 15.68
1300 2000 5 5 - - 260 50
13 Wood, H2SO4, Drawn Fiber
F-Spin PVA 3.77 9000 2000 12 5 - - 190 40
13 Wood, H2SO4, Drawn Fiber
F-Spin PVA 7.63 13000 3000 7 7 - - 240 60
13 Wood, H2SO4, Drawn Fiber
F-Spin PVA 11.60
19000 10000 5 4 - - 320 40

152
R CNC, Source, Hydrolysis, Modification
Method Matrix CNC Young's Modulus (MPa)
Strain at Break (%)
Strength (MPa)
vol% V D V D σu σy σt D
13 Wood, H2SO4, Drawn Fiber
F-Spin PVA 15.68
16000 2000 4 3 - - 300 30
14 paper sludge, H2SO4
Cast PVA 0.00 199 0 240 0 - - 25 0
14 paper sludge, H2SO4
Cast PVA 0.75 250 70 260 90 - - 29 6
14 paper sludge, H2SO4
Cast PVA 2.25 250 70 310 70 - - 34 3
14 paper sludge, H2SO4
Cast PVA 3.77 200 100 250 50 - - 28 5
15 Red Algae, H2SO4
Cast PVA 0.00 930 80 90 6 - - 37 3
15 Red Algae, H2SO4
Cast PVA 0.75 1320 70 74 7 - - 47 2
15 Red Algae, H2SO4
Cast PVA 2.25 1800 100 64 7 - - 67 4
15 Red Algae, H2SO4
Cast PVA 3.77 2260 90 55 6 - - 82 3
15 Red Algae, H2SO4
Cast PVA 6.07 2900 100 42 7 - - 94 4
16 Cotton, unknown hydrolysis
Cast PVA 0.00 32.3 0.6 0.61 - - - 117 3
16 Cotton, unknown hydrolysis
Cast PVA 0.37 26.7 0.6 1.4 - - - 98 2
16 Cotton, unknown hydrolysis
Cast PVA 0.75 14 1 10.8 - - - 104 2
16 Cotton, unknown hydrolysis
Cast PVA 1.12 19.8 0.9 5.6 - - - 105 3
16 Cotton, unknown hydrolysis
Cast PVA 1.50 20 1 7.2 - - - 119 3
16 Cotton, unknown hydrolysis
Cast PVA 3.01 30.8 1 8.9 - - - 132 3
16 Cotton, unknown hydrolysis
Cast PVA 4.53 39.9 0.8 1.1 - - - 150 3
16 Cotton, unknown hydrolysis
Cast PVA 0.00 0.117 0 36 - - - 25.9 0.1
16 Cotton, unknown hydrolysis
Cast PVA 0.37 0.556 0 34 - - - 41 0.1
16 Cotton, unknown hydrolysis
Cast PVA 0.75 0.565 0 42 - - - 50.7 0.1
16 Cotton, unknown hydrolysis
Cast PVA 1.12 0.729 0 40 - - - 47.1 0.1
16 Cotton, unknown hydrolysis
Cast PVA 1.50 2.5 0 36 - - - 59 0.1
16 Cotton, unknown hydrolysis
Cast PVA 3.01 3.2 0 33 - - - 62.6 0.1
16 Cotton, unknown hydrolysis
Cast PVA 4.53 3.7 0 35 - - - 64.4 0.1
16 Cotton, unknown hydrolysis
Cast PVA 0.00 9.6 0.4 21.6 - - - 54 1
16 Cotton, unknown hydrolysis
Cast PVA 0.37 6.2 0.4 18.3 - - - 58.3 0.9
16 Cotton, unknown hydrolysis
Cast PVA 0.75 9.8 0.2 19.1 - - - 82.7 0.9
16 Cotton, unknown hydrolysis
Cast PVA 1.12 9.6 0.8 17.1 - - - 82.3 1.6
16 Cotton, unknown hydrolysis
Cast PVA 1.50 15 1 11.9 - - - 96 3
16 Cotton, unknown hydrolysis
Cast PVA 3.01 24.6 0.6 5.1 - - - 103 2
16 Cotton, unknown hydrolysis
Cast PVA 4.53 25.8 1 1.1 - - - 136 3

153
R CNC, Source, Hydrolysis, Modification
Method Matrix CNC Young's Modulus (MPa)
Strain at Break (%)
Strength (MPa)
vol% V D V D σu σy σt D
17 Cotton, H2SO4 Cast 80:20 PVA:PCL
0.00 11 1 490 20 - 12.8 - 0.5
17 Cotton, H2SO4 Pickering Emulsion
80:20 PVA:PCL
3.77 4050 50 37 5 - 65 - 6
17 Cotton, H2SO4 Pickering emulsion
80:20 PVA:PCL
7.63 3050 4 19 2 - 67 - 5
17 Cotton, H2SO4 Cast 80:20 PVA:PCL
7.63 3.5 0.2 400 20 - 7.3 - 0.8
17 Cotton, H2SO4 Pickering emulsion
80:20 PVA:PCL
15.68
2910 30 2.5 0.5 - 28 - 2
17 Cotton, H2SO4 Cast 60:40 PVA:PCL
0.00 2.8 0.3 620 20 - 7.1 - 0.9
17 Cotton, H2SO4 Pickering emulsion
60:40 PVA:PCL
3.77 1640 60 2.1 0.5 - 25 - 1
17 Cotton, H2SO4 Pickering emulsion
60:40 PVA:PCL
7.63 2640 40 2.8 0.3 - 46 - 6
17 Cotton, H2SO4 Cast 60:40 PVA:PCL
7.63 1.9 0.3 550 20 - 5.8 - 0.6
17 Cotton, H2SO4 Pickering emulsion
60:40 PVA:PCL
15.68
2220 40 1.6 0.4 - 23.5 - 0.9
17 Cotton, H2SO4 E-Spun PVA 0.00 38 2 77 7 - - 7.5 0.4
17 Cotton, H2SO4 E-Spun ǁǁ PVA 7.63 185 4 88 7 - - 10.3 0.3
17 Cotton, H2SO4 E-Spun ǁǁ PVA 19.87
343 7 30 3 - - 6.5 0.1
17 Cotton, H2SO4 E-Spun ǁǁ PVA 42.65
236 5 8.1 0.9 - - 2.79 0.02
17 Cotton, H2SO4 E-Spun ǁǁ PVA 7.63 850 10 20 4 - - 8.3 0.3
17 Cotton, H2SO4 E-Spun ǁǁ PVA 19.87
431 7 3.1 8 - - 4 0.2
17 Cotton, H2SO4 E-Spun ǁǁ PVA 42.65
17 2 2.9 0.3 - - 0.4 0.03
17 Cotton, H2SO4 E-Spun core sheath CNC inside
PVA 7.63 115 2 110 10 - - 8.8 0.3
17 Cotton, H2SO4 E-Spun core sheath CNC inside
PVA 7.63 840 10 38 6 - - 6.8 0.3
18 Plant (XSB), H2SO4
Cast PVA &.5% Graphene
nanoplatelet
0.00 2200 500 70 30 - - 83 4
18 Plant (XSB), H2SO4
Cast PVA &.4% Graphene
nanoplatelet
0.07 2500 600 190 70 - - 93 6
18 Plant (XSB), H2SO4
Cast PVA &.1% Graphene
nanoplatelet
0.30 2800 400 150 70 - - 100 10
19 Bacteria, H2SO4 Cast PVA 0.00 280 20 - - - - 38 2
19 Bacteria, H2SO4 Cast PVA 0.75 370 20 - - - - 41 1
19 Bacteria, H2SO4 Cast PVA 2.25 460 40 - - - - 44 2
19 Bacteria, H2SO4 Cast PVA 3.77 380 20 - - - - 40 3
20 Cotton, H2SO4, PU Graft
Reaction& Cast
WPU 0.00 1.7 0.2 1050 30 - - 4.4 0.2
20 Cotton, H2SO4, PU Graft
Reaction& Cast
WPU 1.51 5 1 1270 40 - - 6 1
20 Cotton, H2SO4, PU Graft
Reaction& Cast
WPU 3.03 23 2 1360 60 - - 7.5 0.8

154
R CNC, Source, Hydrolysis, Modification
Method Matrix CNC Young's Modulus (MPa)
Strain at Break (%)
Strength (MPa)
vol% V D V D σu σy σt D
20 Cotton, H2SO4, PU Graft
Reaction& Cast
WPU 4.57 41 2 1030 30 - - 9 1
20 Cotton, H2SO4, PU Graft
Reaction& Cast
WPU 6.12 56 4 830 30 - - 9.4 0.5
20 Cotton, H2SO4, PU Graft
Reaction& Cast
WPU 7.69 107 6 630 10 - - 9.7 0.6
21 Eucalyptus, H2SO4
Cast WPU 0.00 1200 100 380 20 - - 5.4 0.2
21 Eucalyptus, H2SO4
Cast WPU 0.15 2400 100 360 20 - - 6 0.3
21 Eucalyptus, H2SO4
Cast WPU 0.38 2400 200 386 9 - - 8.1 0.5
21 Eucalyptus, H2SO4
Cast WPU 0.75 2300 100 370 20 - - 12.2 0.5
21 Eucalyptus, H2SO4
Cast WPU 1.51 2800 100 360 20 - - 9.6 0.8
21 Eucalyptus, H2SO4
Cast WPU 2.27 3100 400 350 10 - - 8 0.5
21 Eucalyptus, H2SO4
Cast WPU 3.03 4800 100 300 20 - - 8.1 0.3
21 Eucalyptus, H2SO4
Cast WPU 3.80 3400 300 300 20 - - 6.6 0.3
22 Cotton, H2SO4, Polymer grafting
Cast PU 0.00 8.2 0.9 750 30 - - 8 1
22 Cotton, H2SO4, Polymer grafting
Cast PU 0.38 41 3 110 60 - - 27 2
22 Cotton, H2SO4, Polymer grafting
Cast PU 0.75 42 3 62 5 - - 62 5
22 Cotton, H2SO4, Polymer grafting
Cast PU 3.80 45 2 50 7 - - 50 7
23 Cotton H2SO4 Cast PU 0.00 178 3 880 50 - - 32 1
23 Cotton H2SO4 Cast PU 0.75 218 5 650 30 - - 22 1
23 Cotton H2SO4 Cast PU 2.27 247 9 750 40 - - 26 1
23 Cotton H2SO4 Cast PU 3.80 296 9 570 30 - - 18 1
23 Cotton H2SO4 Cast PU 7.69 340 10 540 20 - - 17 1
23 Cotton H2SO4 Cast PU 0.00 199 4 210 20 - - 20 1
23 Cotton H2SO4 Cast PU 0.75 279 4 102 9 - - 17.3 0.6
23 Cotton H2SO4 Cast PU 2.27 311 6 90 10 - - 17 1
23 Cotton H2SO4 Cast PU 3.80 329 9 58 9 - - 16 1
23 Cotton H2SO4 Cast PU 7.69 359 9 70 10 - - 16.1 0.9
24 Cotton H2SO4 Cast & Coating
PU Wool 0.00 - - 71 2 - - 18.7 0.8
24 Cotton H2SO4 Cast & Coating
PU + Wool 0.15 - - 71 2 - - 19.2 0.3
24 Cotton H2SO4 Cast & Coating
PU + Wool 0.30 - - 70 3 - - 21.5 0.5
24 Cotton H2SO4 Cast & Coating
PU + Wool 0.45 - - 68.7 0.6 - - 20.8 0.4
24 Cotton H2SO4 Cast & Coating
PU + Wool 0.60 - - 68 1 - - 21.1 0.1
24 Cotton H2SO4 Cast & Coating
PU + Wool 0.75 - - 68 2 - - 21.5 0.5
24 Cotton H2SO4 Cast & Coating
PU + Wool 0.00 - - 52 1 - - 10.7 0.1
24 Cotton H2SO4 Cast & Coating
PU + Wool 0.15 - - 51 1 - - 1.7 0.4
24 Cotton H2SO4 Cast & Coating
PU + Wool 0.30 - - 54 3 - - 10.9 0.25

155
R CNC, Source, Hydrolysis, Modification
Method Matrix CNC Young's Modulus (MPa)
Strain at Break (%)
Strength (MPa)
vol% V D V D σu σy σt D
24 Cotton H2SO4 Cast & Coating
PU + Wool 0.45 - - 54 2 - - 10.9 0.2
24 Cotton H2SO4 Cast & Coating
PU + Wool 0.60 - - 53 3 - - 11 0.4
24 Cotton H2SO4 Cast & Coating
PU + Wool 0.75 - - 52 2 - - 10.99 0.07
25 Cotton, H2SO4, Polymer grafting
Cast PU 0.00 0.8 0.3 - - - - 0.13 0.02
25 Cotton, H2SO4, Polymer grafting
Cast PU 3.80 1.7 0.3 - - - - 0.23 0.02
25 Cotton, H2SO4, Polymer grafting
Cast PU 7.69 2.9 0.3 - - - - 0.38 0.02
25 Cotton, H2SO4, Polymer grafting
Cast PU 11.69
4 0.3 - - - - 0.49 0.03
26 H2SO4, cotton, AcO2
Cast PU 0.00 0.9 0.01 209 2 - - 2.95 0.01
26 H2SO4, cotton, AcO2
Cast PU 3.80 1.6 0.01 297 8 - - 6.53 0.01
26 H2SO4, cotton, AcO2
Cast PU 7.69 2.6 0.01 443 5 - - 6.23 0.01
26 H2SO4, cotton, AcO2
Cast PU 11.69
8.235 0.9 325 1 - - 6.65 0.01
26 H2SO4, cotton, AcO2
Cast PU 15.79
12.02 0.3 280 10 - - 8.63 0.05
26 H2SO4, cotton, AcO2
Cast PU 20.00
42.95 4 210 10 - - 10.44 0.05
27 Eucalyptus (wood), H2SO4
Cast PU 0.00 6 0.7 690 30 - - 1.5 0.5
27 Eucalyptus (wood), H2SO4
Cast PU 0.75 37 7 635 9 - - 4.5 0.5
27 Eucalyptus (wood), H2SO4
RXN with pre-polymer
PU 0.75 64 2 430 20 - - 5.8 0.6
27 Eucalyptus, H2SO4, Polymer
grafting
RXN with monomer
PU 0.75 23 4 410 20 - - 3.03 -
28 Wood, H2SO4 IDPI & PE-triol P-RXN
PU 0.00 3400 600 160 20 - - 4 1
28 Wood, H2SO4 IDPI & PE-triol P-RXN
PU 0.75 3800 100 176 9 - - 4.9 0.4
28 Wood, H2SO4 IDPI & PE-triol P-RXN
PU 3.80 5600 900 160 20 - - 5 1
28 wood, H2SO4, IDPI
IDPI & PE-triol P-RXN
PU 0.75 4000 100 200 20 - - 7 0.6
28 wood, H2SO4, IDPI
IDPI & PE-triol P-RXN
PU 3.80 8600 400 190 20 - - 14 2
29 Wood, H2SO4 Cast WPU 0.00 17 4 1300 200 - - 10 2
29 Wood, H2SO4 Cast WPU 0.68 22 1 1200 300 - - 10 2
29 Wood, H2SO4 Cast WPU 2.04 32 3 800 100 - - 10 3
29 Wood, H2SO4 Cast WPU 3.43 68 9 600 200 - - 14 3
29 Wood, H2SO4 Cast WPU 6.98 140 31 170 60 - - 13 1
30 Eucalyptus, H2SO4,
Cast PU 0.00 1.5 0.2 431 88 - - 3.1 0.2
30 Eucalyptus, H2SO4,
Cast PU 0.08 1.5 0.2 517 98 - - 3.7 0.5
30 Eucalyptus, H2SO4,
Cast PU 0.23 1.4 0.1 509 69 - - 3.6 0.2
30 Eucalyptus, H2SO4,
Cast PU 0.38 1.6 0.2 527 130 - - 3.7 0.4
30 Eucalyptus, H2SO4,
Cast PU 0.75 1.4 0.1 616 59 - - 4.1 0.2

156
R CNC, Source, Hydrolysis, Modification
Method Matrix CNC Young's Modulus (MPa)
Strain at Break (%)
Strength (MPa)
vol% V D V D σu σy σt D
30 Eucalyptus, H2SO4,
Cast PU 2.27 1.5 0.1 517 21 - - 3.4 0.2
30 Eucalyptus, H2SO4,
Cast PU 3.03 1.5 0.1 589 35 - - 3.8 0.2
30 Eucalyptus, H2SO4,
Cast PU 3.80 1.8 0.2 368 31 - - 3.1 0.1
30 Eucalyptus (wood), MDI oleyl
alcohol
Cast PU 0.08 1.4 0.1 633 69 - - 3.7 0.1
30 Eucalyptus, wood, MDI oleyl
alcohol
Cast PU 0.23 1.5 0.2 470 103 - - 3.3 0.2
30 Eucalyptus, wood, MDI oleyl
alcohol
Cast PU 0.38 1.5 0.1 544 68 - - 3.4 0.2
30 Eucalyptus, wood, MDI oleyl
alcohol
Cast PU 0.75 1.4 0.1 698 55 - - 3.8 0.2
30 Eucalyptus, wood, MDI oleyl
alcohol
Cast PU 2.27 1.8 0.1 517 80 - - 3.7 0.2
30 Eucalyptus, wood, MDI oleyl
alcohol
Cast PU 3.03 2.2 0.3 421 71 - - 3.3 0.2
30 Eucalyptus, wood, MDI oleyl
alcohol
Cast PU 3.80 2.3 0.2 472 25 - - 3.4 0.1
31 Cotton, Phosphoric acid
Cast PU 0.00 42 0.8 635 15 - - - -
31 Cotton, Phosphoric acid
RBM PU 3.80 60 5 515 25 - - - -
31 Cotton, Phosphoric acid
RBM PU 7.69 72 3 320 5 - - - -
31 Cotton, Phosphoric acid
RBM PU 11.69
90 10 335 20 - - - -
32 Ramie, H2SO4 Cast & 2x E-beam radiation
PU-A 0.00 2330 - - - - - 30 10
32 Ramie, H2SO4 Cast & E-beam
radiation
PU-A 0.75 1840 - - - - - 39 8
32 Ramie, H2SO4 Cast & 2x E-beam radiation
PU-A 0.75 2140 - - - - - 35 1
32 Ramie, H2SO4 Cast & UV radiation
PU-A 0.00 1300 - - - - - 24 7
32 Ramie, H2SO4 Cast & UV radiation
PU-A 0.75 1760 - - - - - 23 4
33 Wood H2SO4 Cast & Curing
PU 0.00 1050 50 16 2 18 - - 1
33 Wood H2SO4 Cast & Curing
PU 0.19 1230 20 31 1 26 - - 1
33 Wood H2SO4 Cast & Curing
PU 0.38 1300 20 30 3 25 - - 1
33 Wood H2SO4 Cast & Curing
PU 0.56 1010 10 43 2 27 - - 1
33 Wood H2SO4 Cast & Curing
PU 0.75 1130 10 36 4 29 1
34 Sisal fiber, H2SO4
Cast PU-W 0.00 17 1 1400 200 - - 11.7 0.9
34 Sisal fiber, H2SO4
Cast PU-W 0.75 17.7 0.8 1160 70 - - 8.8 0.6
34 Sisal fiber, H2SO4
Cast PU-W 2.27 18 2 1200 200 - - 10 1
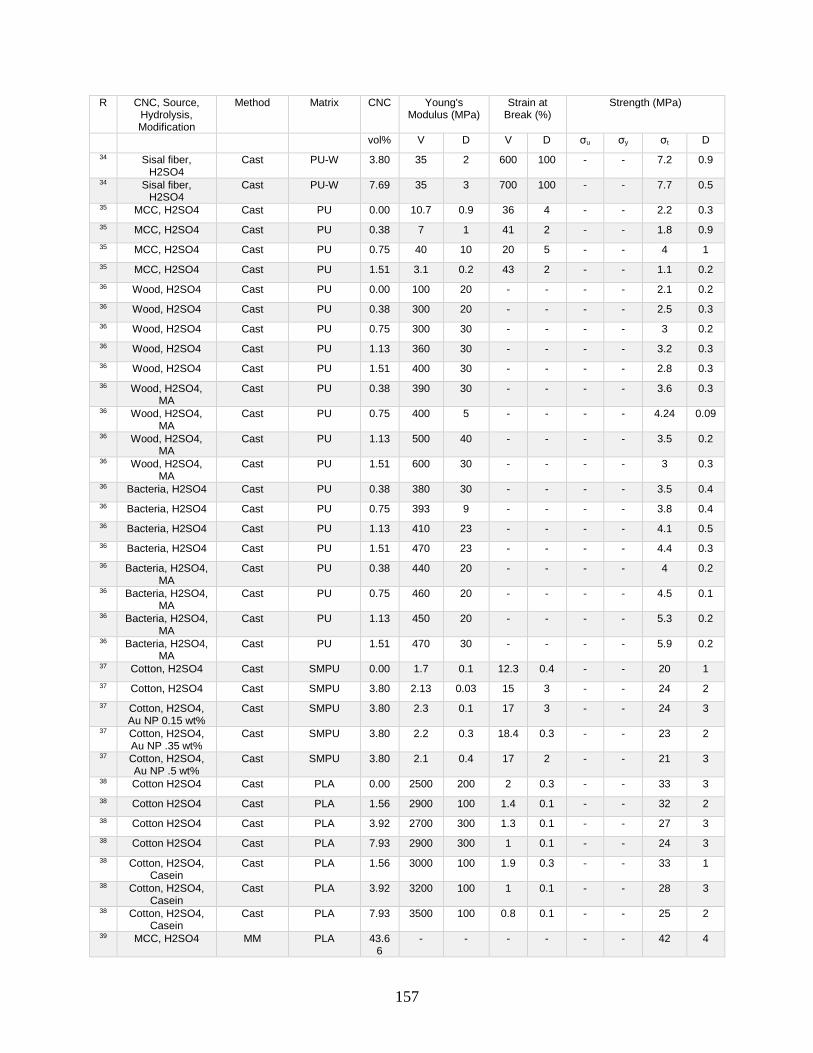
157
R CNC, Source, Hydrolysis, Modification
Method Matrix CNC Young's Modulus (MPa)
Strain at Break (%)
Strength (MPa)
vol% V D V D σu σy σt D
34 Sisal fiber, H2SO4
Cast PU-W 3.80 35 2 600 100 - - 7.2 0.9
34 Sisal fiber, H2SO4
Cast PU-W 7.69 35 3 700 100 - - 7.7 0.5
35 MCC, H2SO4 Cast PU 0.00 10.7 0.9 36 4 - - 2.2 0.3
35 MCC, H2SO4 Cast PU 0.38 7 1 41 2 - - 1.8 0.9
35 MCC, H2SO4 Cast PU 0.75 40 10 20 5 - - 4 1
35 MCC, H2SO4 Cast PU 1.51 3.1 0.2 43 2 - - 1.1 0.2
36 Wood, H2SO4 Cast PU 0.00 100 20 - - - - 2.1 0.2
36 Wood, H2SO4 Cast PU 0.38 300 20 - - - - 2.5 0.3
36 Wood, H2SO4 Cast PU 0.75 300 30 - - - - 3 0.2
36 Wood, H2SO4 Cast PU 1.13 360 30 - - - - 3.2 0.3
36 Wood, H2SO4 Cast PU 1.51 400 30 - - - - 2.8 0.3
36 Wood, H2SO4, MA
Cast PU 0.38 390 30 - - - - 3.6 0.3
36 Wood, H2SO4, MA
Cast PU 0.75 400 5 - - - - 4.24 0.09
36 Wood, H2SO4, MA
Cast PU 1.13 500 40 - - - - 3.5 0.2
36 Wood, H2SO4, MA
Cast PU 1.51 600 30 - - - - 3 0.3
36 Bacteria, H2SO4 Cast PU 0.38 380 30 - - - - 3.5 0.4
36 Bacteria, H2SO4 Cast PU 0.75 393 9 - - - - 3.8 0.4
36 Bacteria, H2SO4 Cast PU 1.13 410 23 - - - - 4.1 0.5
36 Bacteria, H2SO4 Cast PU 1.51 470 23 - - - - 4.4 0.3
36 Bacteria, H2SO4, MA
Cast PU 0.38 440 20 - - - - 4 0.2
36 Bacteria, H2SO4, MA
Cast PU 0.75 460 20 - - - - 4.5 0.1
36 Bacteria, H2SO4, MA
Cast PU 1.13 450 20 - - - - 5.3 0.2
36 Bacteria, H2SO4, MA
Cast PU 1.51 470 30 - - - - 5.9 0.2
37 Cotton, H2SO4 Cast SMPU 0.00 1.7 0.1 12.3 0.4 - - 20 1
37 Cotton, H2SO4 Cast SMPU 3.80 2.13 0.03 15 3 - - 24 2
37 Cotton, H2SO4, Au NP 0.15 wt%
Cast SMPU 3.80 2.3 0.1 17 3 - - 24 3
37 Cotton, H2SO4, Au NP .35 wt%
Cast SMPU 3.80 2.2 0.3 18.4 0.3 - - 23 2
37 Cotton, H2SO4, Au NP .5 wt%
Cast SMPU 3.80 2.1 0.4 17 2 - - 21 3
38 Cotton H2SO4 Cast PLA 0.00 2500 200 2 0.3 - - 33 3
38 Cotton H2SO4 Cast PLA 1.56 2900 100 1.4 0.1 - - 32 2
38 Cotton H2SO4 Cast PLA 3.92 2700 300 1.3 0.1 - - 27 3
38 Cotton H2SO4 Cast PLA 7.93 2900 300 1 0.1 - - 24 3
38 Cotton, H2SO4, Casein
Cast PLA 1.56 3000 100 1.9 0.3 - - 33 1
38 Cotton, H2SO4, Casein
Cast PLA 3.92 3200 100 1 0.1 - - 28 3
38 Cotton, H2SO4, Casein
Cast PLA 7.93 3500 100 0.8 0.1 - - 25 2
39 MCC, H2SO4 MM PLA 43.66
- - - - - - 42 4

158
R CNC, Source, Hydrolysis, Modification
Method Matrix CNC Young's Modulus (MPa)
Strain at Break (%)
Strength (MPa)
vol% V D V D σu σy σt D
39 MCC, H2SO4 MM PLA 1% MA-OH
43.66
- - - - - - 46 4
39 MCC, H2SO4 MM PLA 3% MA-OH
43.66
- - - - - - 48 4
39 MCC, H2SO4 MM PLA 5% MA-OH
43.66
- - - - - - 43 3
39 MCC, H2SO4 MM PLA 3% MA-OH 1% nanoclay
43.66
- - - - - - 48 4
39 MCC, H2SO4 MM PLA 3% MA-OH 2% nanoclay
43.66
- - - - - - 48 2
39 MCC, H2SO4 MM PLA 3% MA-OH 3% nanoclay
43.66
- - - - - - 49 4
39 MCC, H2SO4 MM PLA 3% MA-OH 4% nanoclay
43.66
- - - - - - 47 5
40 MCC, H2SO4 Cast PLA 0.00 2330 80 2.9 0.1 - - 25 1
40 MCC, H2SO4 Cast PLA 0.08 2410 40 2.7 0.5 - - 25 1
40 MCC, H2SO4 Cast PLA 0.39 2560 60 2.7 0.6 - - 27.8 0.8
41 Cotton, H2SO4, AcO2
Cast PLA 0.00 2700 200 - - - - 53 1.172
41 Cotton, H2SO4, AcO2
Cast PLA 0.78 2800 200 - - - - 57.9 0.9
41 Cotton, H2SO4, AcO2
Cast PLA 1.56 2900 200 - - - - 60 2
41 Cotton, H2SO4, AcO2
Cast PLA 2.34 3200 200 - - - - 66 2
42 Bacteria, H2SO4 Freeze drying
PLA 0.00 22 2 9 2 - - 0.69 0.04
42 Bacteria, H2SO4 Freeze drying
PLA 3.92 37 2 7 3 - - 1.02 0.04
43 Bamboo, H2SO4, Magnetic CNCs
Cast PLA 0.00 550 50 30 5 21.3 - - 0.9
43 Bamboo, H2SO4, Magnetic CNCs
Cast PLA 0.78 1180 90 22 4 27 - - 1
43 Bamboo, H2SO4, Magnetic CNCs
Cast ǁ
PLA 1.56 1200 100 36 5 37 - - 1
43 Bamboo, H2SO4, Magnetic CNCs
Cast ǁ
PLA 2.34 1560 90 30 7 47 - - 2
43 Bamboo, H2SO4, Magnetic CNCs
Cast =
PLA 0.78 690 50 60 10 40 - - 2
43 Bamboo, H2SO4, Magnetic CNCs
Cast ǁ
PLA 1.56 900 100 55 9 50 - - 1
43 Bamboo, H2SO4, Magnetic CNCs
Cast ǁ
PLA 2.34 1200 100 52 9 58 - - 2
43 Bamboo, H2SO4, Magnetic CNCs
Cast ǁ
PLA 0.78 600 40 80 20 44 - - 2
43 Bamboo, H2SO4, Magnetic CNCs
Cast ǁ
PLA 1.56 720 60 80 10 57 - - 2
43 Bamboo, H2SO4, Magnetic CNCs
Cast ǁ
PLA 2.34 1100 100 60 10 67 - - 3
44 Bamboo, H2SO4 Extrusion PLA 0.00 390 20 8.9 0.4 35.9 - - 0.9
44 Bamboo, H2SO4 Extrusion PLA 0.78 780 20 4.5 0.6 41.4 - - 0.9
44 Bamboo, H2SO4, Radical Present
Extrusion PLA 0.00 2110 70 2.1 0.1 42 - - 0.6
44 Bamboo, H2SO4, Radical Present
Extrusion PLA 0.78 2260 90 1.8 0.1 51 - - 1
44 Bamboo, H2SO4, Radical Present
Extrusion PLA 1.56 2400 100 1.8 0.1 47.3 - - 0.9

159
R CNC, Source, Hydrolysis, Modification
Method Matrix CNC Young's Modulus (MPa)
Strain at Break (%)
Strength (MPa)
vol% V D V D σu σy σt D
44 Bamboo, H2SO4, Radical Present
Extrusion PLA 2.34 2100 200 1.53 0.07 43 - - 1
44 Bamboo, H2SO4, Radical &
nonsoluable PLA&CNC removed by chloroform
Extrusion PLA 0.00 1400 80 2.3 0.1 34 - - 1
44 Bamboo, H2SO4, Radical &
nonsoluable PLA&CNC removed by chloroform
Extrusion PLA 1.05 1400 70 2.4 0.2 31 - - 1
44 Bamboo, H2SO4, Radical &
nonsoluable PLA&CNC removed by chloroform
Extrusion PLA 2.60 1190 90 2.8 0.2 33.6 - - 0.7
44 Bamboo, H2SO4, Radical &
nonsoluable PLA&CNC removed by chloroform
Extrusion PLA 4.04 930 70 2.3 0.2 30.4 - - 0.7
45 MCC, H2SO4, Ag NP, & glucose
Cast PLA:PBAT (4:1)
0.00 - - 140 10 - - 19 2
45 MCC, H2SO4, Ag NP, & glucose
Cast PLA:PBAT (4:1)
0.78 - - 25 4 - - 20 2
45 MCC, H2SO4, Ag NP, & glucose
Cast PLA:PBAT (4:1)
1.56 - - 16 2 - - 18 3
45 MCC, H2SO4, Ag NP, & glucose
Cast PLA:PBAT (4:1)
3.13 - - 12 2 - - 15 1
45 MCC, H2SO4, Ag NP, & glucose
Cast PLA:PBAT (4:1)
6.31 - - 9 2 - - 13 2
46 MCC, H2SO4 MM PLA:PBS 30:70
0.00 22.1 - 227 - 32.7 - 44.5 -
46 MCC, H2SO4 MM PLA:PBS 30:70
1.56 34.3 - 266 - 31.1 - 45.1 -
46 MCC, H2SO4, 0.2% DCP
MM PLA:PBS 30:70
0.00 19.8 - 293 - 30.9 - 56.5 -
46 MCC, H2SO4, 0.2% DCP
MM PLA:PBS 30:70
0.39 19.6 - 286 - 32.6 - 46.9 -
46 MCC, H2SO4, 0.2% DCP
MM PLA:PBS 30:70
0.78 24.7 - 282 - 44.4 - 50 -
46 MCC, H2SO4, 0.2% DCP
MM PLA:PBS 30:70
1.56 27.9 - 298 - 43.3 - 48.5 -
47 Cotton, H2SO4 TSE with peroxide X-
linker (DCP)
PLA 0.00 - - 13.05
- 41 - -
47 Cotton H2SO4 TSE with peroxide X-
linker (DCP)
PLA 0.78 - - 15.84
- 48 - -
47 Cotton, H2SO4, Peroxide Covalent Bonding
TSE with peroxide X-
linker (DCP)
PLA 0.78 - - 18.71
- 52 - -
47 Cotton, H2SO4, Peroxide Covalent Bonding
TSE with peroxide X-
linker (DCP)
PLA 1.56 - - 17.21
- 50 - -

160
R CNC, Source, Hydrolysis, Modification
Method Matrix CNC Young's Modulus (MPa)
Strain at Break (%)
Strength (MPa)
vol% V D V D σu σy σt D
47 Cotton HCl TSE with peroxide X-
linker (DCP)
PLA 0.00 - - 13.06
- 42 - -
47 Cotton HCl TSE with peroxide X-
linker (DCP)
PLA 0.78 - - 13.89
- 48 - -
47 Cotton HCl Peroxide Covalent Bonding
TSE with peroxide X-
linker (DCP)
PLA 0.78 - - 16.25
- 53 - -
47 Cotton HCl Peroxide Covalent Bonding
TSE with peroxide X-
linker (DCP)
PLA 1.56 - - 16.08
- 48 - -
48 Wood, H2SO4, PGSMA
Reactive Extrusion
PLA 0.00 2800 0 4 0 70 0.5
48 Wood, H2SO4, PGSMA
Reactive Extrusion
PLA:PGSMA 4:1
0.00 2900 200 32 23 51 3
48 Wood, H2SO4, PGSMA
Reactive Extrusion
PLA:PGSMA 4:2
0.16 2800 80 25 2.5 49 0.5
48 Wood, H2SO4, PGSMA
Reactive Extrusion
PLA:PGSMA 4:3
0.47 3000 100 16 6 56 1
49 Cotton, H2SO4, Triazine
derivative
dry mixing powders
PLA 0.00 - - 1.9 0.6 25 - - 2
49 Cotton, H2SO4, Triazine
derivative
dry mixing powders
PLA 0.78 - - 2.9 0.5 44 - - 2
49 Cotton, H2SO4, Triazine
derivative
dry mixing powders
PLA 1.56 - - 3.3 0.3 43 - - 2
49 Cotton, H2SO4, Triazine
derivative
dry mixing powders
PLA 2.34 - - 3 0.3 39 - - 2
49 Cotton, H2SO4, Triazine
derivative
dry mixing powders
PLA 3.13 - - 3.6 0.7 41 - - 2
49 Cotton, H2SO4, Triazine
derivative
dry mixing powders
PLA 3.92 - - 3.3 0.3 39 - - 2
50 Aspen, H2SO4 Melt Mixed PLA 0.00 3700 600 7 1 64 - - 2
50 Aspen, H2SO4 Melt Mixed PLA 0.39 4300 500 11 2 61 - - 3
50 Aspen, H2SO4 Melt Mixed PLA 0.78 4200 400 12 1 63 - - 3
50 Aspen, H2SO4 Melt Mixed PLA 1.56 4200 400 13 1 63 - - 3
50 Aspen, H2SO4 Melt Mixed PLA 3.92 4500 500 11 2 59 - - 2
50 High lignin, unknown source
& hydrolysis
Melt Mixed PLA 0.39 4100 200 8.2 0.7 60 - - 1
50 High lignin, unknown source
& hydrolysis
Melt Mixed PLA 0.78 4800 900 12 1 58 - - 3
50 High lignin, unknown source
& hydrolysis
Melt Mixed PLA 1.56 4800 600 12 1 58 - - 4
50 High lignin, unknown source
& hydrolysis
Melt Mixed PLA 3.92 4600 700 11 1 56 - - 3
51 MCC, Sonication Cast PLA & MM TPU
PLA 0.00 2380 20 3.6 0.3 - - 61.3 0.8

161
R CNC, Source, Hydrolysis, Modification
Method Matrix CNC Young's Modulus (MPa)
Strain at Break (%)
Strength (MPa)
vol% V D V D σu σy σt D
51 MCC, Sonication Cast PLA & MM TPU
PLA:PU 4:1 0.00 1130 20 21 8 - - 20 0.5
51 MCC, Sonication Cast PLA & MM TPU
PLA:PU 4:2 0.78 1350 20 24 7 - - 32 0.6
51 MCC, Sonication Cast PLA & MM TPU
PLA:PU 4:3 2.34 1390 20 50 20 - - 27 1
51 MCC, H2SO4, HCl (spherical)
Cast PLA & MM TPU
PLA:PU 4:4 0.78 1390 10 29 9 - - 34 0.4
51 MCC, H2SO4, HCl (spherical)
Cast PLA & MM TPU
PLA:PU 4:5 2.34 1440 30 70 30 - - 29 0.9
51 Wood, H2SO4 (rod shaped)
Cast PLA & MM TPU
PLA:PU 4:6 0.78 1430 10 22 5 - - 31.5 0.7
51 Wood, H2SO4 (rod shaped)
Cast PLA & MM TPU
PLA:PU 4:7 2.34 1440 20 13 4 - - 28 1
52 Bamboo H2SO4 Cast PLA 0.00 410 20 9 4 - - 12 1
52 Bamboo H2SO4 Cast PLA 0.39 410 50 7 5 - - 10.5 0.9
52 Bamboo H2SO4 Cast PLA 0.78 300 30 12 4 - - 10.2 0.3
52 Bamboo H2SO4 Cast PLA 1.17 260 30 11 3 - - 9.1 0.9
52 Bamboo H2SO4 Cast PLA 1.56 350 80 9.6 0.9 - - 10.5 0.6
52 Bamboo H2SO4 Cast PLA 1.95 440 40 7 2 - - 10 1
52 Bamboo H2SO4 Cast PLA 2.34 320 30 7 1 - - 10 1
52 Bamboo H2SO4 Cast PLA 2.73 280 10 8.5 0.3 - - 10.1 0.3
52 Bamboo H2SO4 Cast PLA 3.13 260 5 3.6 0.4 - - 7.5 0.5
53 Cotton, HCl Cast & MM PLA 19:1 (L:D)
0.00 1800 - - - - - 45* -
53 Cotton, HCl Cast & MM PLA 19:1 (L:D)
0.78 1700 - - - - - 50* -
53 Cotton, HCl Cast & MM PLA 19:1 (L:D)
2.34 1700 - - - - - 46* -
53 Cotton, HCl Cast & MM PLA 19:1 (L:D)
3.92 1600 - - - - - 29* -
53 Cotton, HCl Cast & MM PLA 19:1 (L:D)
7.93 1100 - - - - - 11* -
53 Cotton, HCl, 1wt% Surfactant
Decylamine
Cast & MM PLA 19:1 (L:D)
0.78 1800 - - - - - 46* -
53 Cotton, HCl, 1wt% Surfactant
Decylamine
Cast & MM PLA 19:1 (L:D)
2.34 1800 - - - - - 47* -
53 Cotton, HCl, 1wt% Surfactant
Decylamine
Cast & MM PLA 19:1 (L:D)
3.92 1800 - - - - - 45* -
53 Cotton, HCl, 1wt% Surfactant
Decylamine
Cast & MM PLA 19:1 (L:D)
7.93 1200 - - - - - 23* -
53 Cotton, HCl, 1wt% Surfactant
Decylamine
Cast & MM PLA 19:1 (L:D)
0.78 1900 - - - - - 44* -
53 Cotton, HCl, 1wt% Surfactant
Decylamine
Cast & MM PLA 19:1 (L:D)
2.34 1800 - - - - - 36* -
53 Cotton, HCl, 1wt% Surfactant
Decylamine
Cast & MM PLA 19:1 (L:D)
3.92 1600 - - - - - 37* -
53 Cotton, HCl, 1wt% Surfactant
Decylamine
Cast & MM PLA 19:1 (L:D)
7.93 900 - - - - - 25* -

162
R CNC, Source, Hydrolysis, Modification
Method Matrix CNC Young's Modulus (MPa)
Strain at Break (%)
Strength (MPa)
vol% V D V D σu σy σt D
54 Wood, H2SO4, PLA Graft
&PCL:PLA graft
Cast & injection molded
PLA 0.00 3900 300 8 4 - - 58 1
54 Wood, H2SO4, PLA Graft
&PCL:PLA graft
Cast & injection molded
PLA 1.95 3200 400 190 20 - - 50.5 0.9
54 Wood, H2SO4, PLA Graft
&PCL:PLA graft
Cast & injection molded
PLA 3.92 2700 300 210 20 - - 44 0.3
54 Wood, H2SO4, PLA Graft
&PCL:PLA graft
Cast & injection molded
PLA 7.93 2600 400 250 30 - - 42 1
54 Wood, H2SO4, PLA graft
Cast & injection molded
PLA 1.95 3400 500 11.8 0.9 - - 53 3
54 Wood, H2SO4, PLA graft
Cast & injection molded
PLA 3.92 3300 400 9 2 - - 55.5 0.8
55 Ramie, H2SO4 MM PLA 0.00 2000 200 3.5 0.4 - - 40 7
55 Ramie, H2SO4 MM PLA 10% imidazolium
salt
0.00 1700 100 2.6 0.6 - - 33 5
55 Ramie, H2SO4 MM PLA 10% imidazolium
salt
16.23
1900 200 2.4 0.5 - - 31 10
55 Ramie, H2SO4 MM PLA:PEG 9:1
0.00 2200 200 1.9 0.3 - - 33 8
55 Ramie, H2SO4 MM PLA:PEG 9:2
7.93 2200 500 1.6 0.4 - - 15 4
56 MCC, H2SO4 PLA CNC-PA Core Shell E-
Spin
PLA-PAN 0.00 600 100 6 1 - - 1.5 0.3
56 MCC, H2SO4 PLA CNC-PA Core Shell E-
Spin
PLA-PAN 3.92 900 100 6.2 0.7 - - 4 1
56 MCC, H2SO4 PLA CNC-PA Core Shell E-
Spin
PLA-PAN 7.93 700 100 9 2 - - 3.2 0.9
56 MCC, H2SO4 PLA CNC-PA Core Shell E-
Spin
PLA-PAN 12.03
700 100 10 1 - - 2.9 0.4
56 Cotton, H2SO4 PLA CNC-PA Core Shell E-
Spin
PLA-PAN 16.23
700 100 4.4 0.9 - - 2 0.3
56 MCC, High Pressure Homogenization
PLA CNC-PA Core Shell E-
Spin
PLA-PAN 3.92 500 100 17 2 - - 4 1
56 MCC, High Pressure Homogenization
PLA CNC-PA Core Shell E-
Spin
PLA-PAN 7.93 500 100 5 1 - - 1.8 0.5
56 MCC, High Pressure Homogenization
PLA CNC-PA Core Shell E-
Spin
PLA-PAN 12.03
900 100 6 1 - - 2 1
56 MCC, High Pressure Homogenization
PLA CNC-PA Core
PLA-PAN 16.23
900 100 4.4 0.9 - - 2.4 1
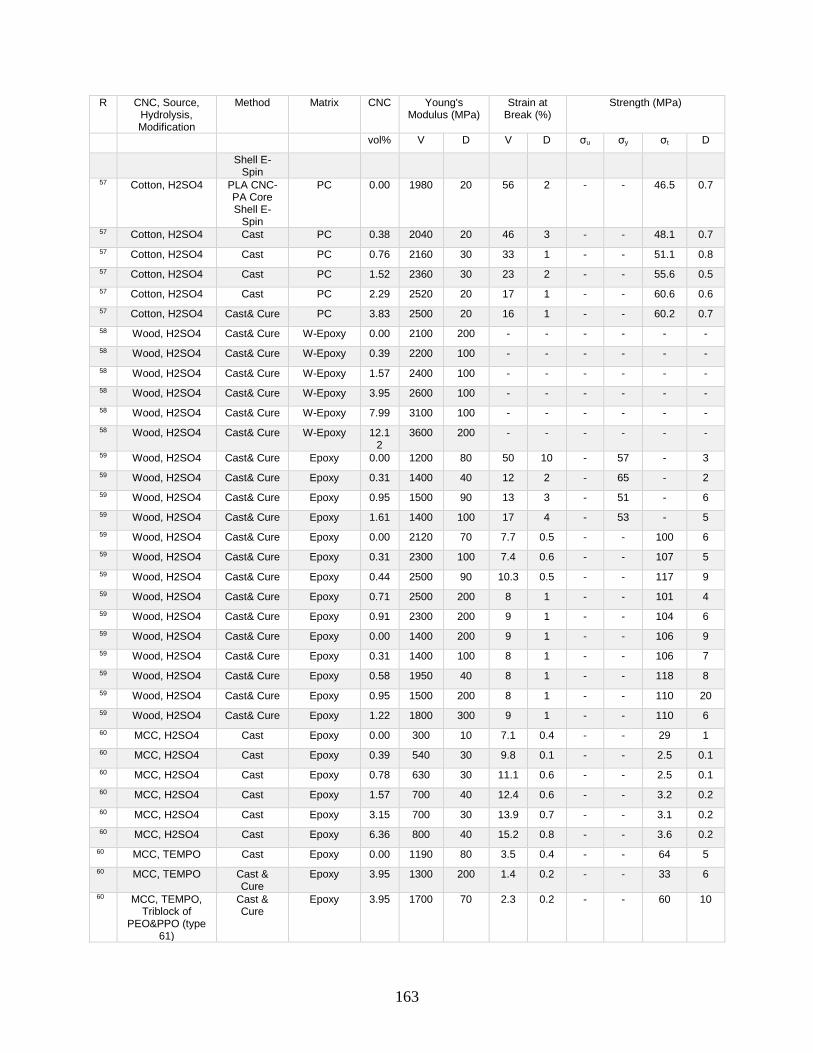
163
R CNC, Source, Hydrolysis, Modification
Method Matrix CNC Young's Modulus (MPa)
Strain at Break (%)
Strength (MPa)
vol% V D V D σu σy σt D
Shell E-Spin
57 Cotton, H2SO4 PLA CNC-PA Core Shell E-
Spin
PC 0.00 1980 20 56 2 - - 46.5 0.7
57 Cotton, H2SO4 Cast PC 0.38 2040 20 46 3 - - 48.1 0.7
57 Cotton, H2SO4 Cast PC 0.76 2160 30 33 1 - - 51.1 0.8
57 Cotton, H2SO4 Cast PC 1.52 2360 30 23 2 - - 55.6 0.5
57 Cotton, H2SO4 Cast PC 2.29 2520 20 17 1 - - 60.6 0.6
57 Cotton, H2SO4 Cast& Cure PC 3.83 2500 20 16 1 - - 60.2 0.7
58 Wood, H2SO4 Cast& Cure W-Epoxy 0.00 2100 200 - - - - - -
58 Wood, H2SO4 Cast& Cure W-Epoxy 0.39 2200 100 - - - - - -
58 Wood, H2SO4 Cast& Cure W-Epoxy 1.57 2400 100 - - - - - -
58 Wood, H2SO4 Cast& Cure W-Epoxy 3.95 2600 100 - - - - - -
58 Wood, H2SO4 Cast& Cure W-Epoxy 7.99 3100 100 - - - - - -
58 Wood, H2SO4 Cast& Cure W-Epoxy 12.12
3600 200 - - - - - -
59 Wood, H2SO4 Cast& Cure Epoxy 0.00 1200 80 50 10 - 57 - 3
59 Wood, H2SO4 Cast& Cure Epoxy 0.31 1400 40 12 2 - 65 - 2
59 Wood, H2SO4 Cast& Cure Epoxy 0.95 1500 90 13 3 - 51 - 6
59 Wood, H2SO4 Cast& Cure Epoxy 1.61 1400 100 17 4 - 53 - 5
59 Wood, H2SO4 Cast& Cure Epoxy 0.00 2120 70 7.7 0.5 - - 100 6
59 Wood, H2SO4 Cast& Cure Epoxy 0.31 2300 100 7.4 0.6 - - 107 5
59 Wood, H2SO4 Cast& Cure Epoxy 0.44 2500 90 10.3 0.5 - - 117 9
59 Wood, H2SO4 Cast& Cure Epoxy 0.71 2500 200 8 1 - - 101 4
59 Wood, H2SO4 Cast& Cure Epoxy 0.91 2300 200 9 1 - - 104 6
59 Wood, H2SO4 Cast& Cure Epoxy 0.00 1400 200 9 1 - - 106 9
59 Wood, H2SO4 Cast& Cure Epoxy 0.31 1400 100 8 1 - - 106 7
59 Wood, H2SO4 Cast& Cure Epoxy 0.58 1950 40 8 1 - - 118 8
59 Wood, H2SO4 Cast& Cure Epoxy 0.95 1500 200 8 1 - - 110 20
59 Wood, H2SO4 Cast& Cure Epoxy 1.22 1800 300 9 1 - - 110 6
60 MCC, H2SO4 Cast Epoxy 0.00 300 10 7.1 0.4 - - 29 1
60 MCC, H2SO4 Cast Epoxy 0.39 540 30 9.8 0.1 - - 2.5 0.1
60 MCC, H2SO4 Cast Epoxy 0.78 630 30 11.1 0.6 - - 2.5 0.1
60 MCC, H2SO4 Cast Epoxy 1.57 700 40 12.4 0.6 - - 3.2 0.2
60 MCC, H2SO4 Cast Epoxy 3.15 700 30 13.9 0.7 - - 3.1 0.2
60 MCC, H2SO4 Cast Epoxy 6.36 800 40 15.2 0.8 - - 3.6 0.2
60 MCC, TEMPO Cast Epoxy 0.00 1190 80 3.5 0.4 - - 64 5
60 MCC, TEMPO Cast & Cure
Epoxy 3.95 1300 200 1.4 0.2 - - 33 6
60 MCC, TEMPO, Triblock of
PEO&PPO (type 61)
Cast & Cure
Epoxy 3.95 1700 70 2.3 0.2 - - 60 10
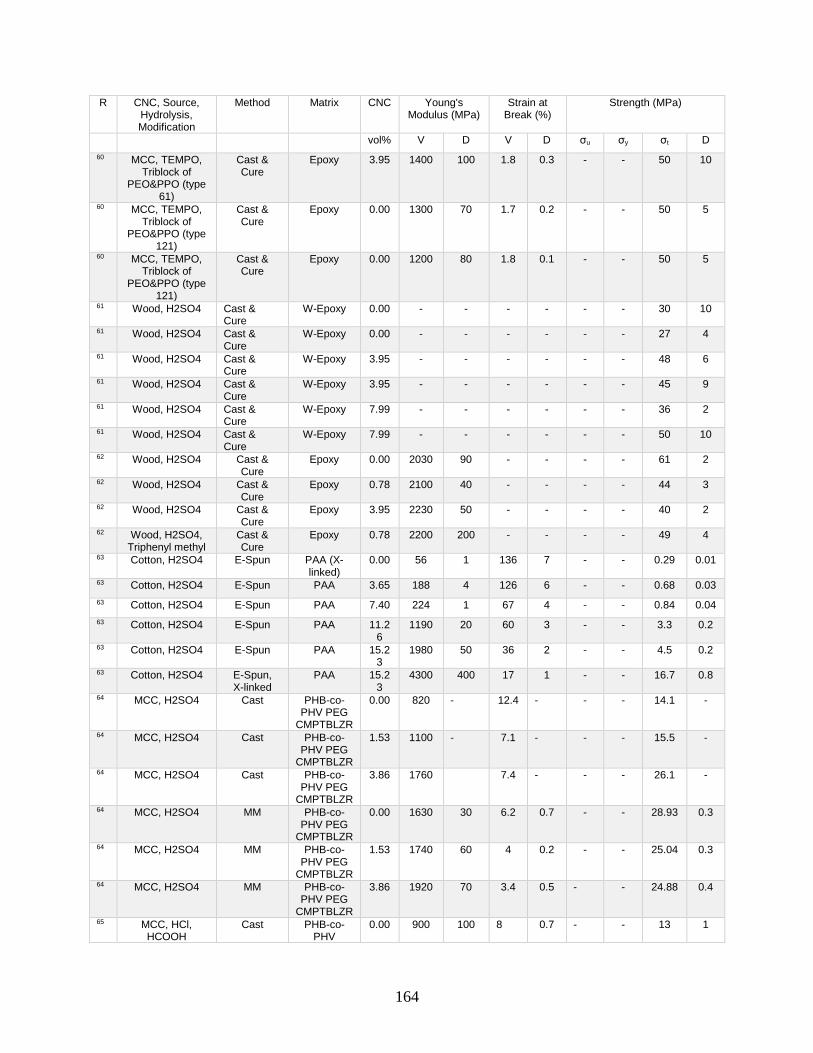
164
R CNC, Source, Hydrolysis, Modification
Method Matrix CNC Young's Modulus (MPa)
Strain at Break (%)
Strength (MPa)
vol% V D V D σu σy σt D
60 MCC, TEMPO, Triblock of
PEO&PPO (type 61)
Cast & Cure
Epoxy 3.95 1400 100 1.8 0.3 - - 50 10
60 MCC, TEMPO, Triblock of
PEO&PPO (type 121)
Cast & Cure
Epoxy 0.00 1300 70 1.7 0.2 - - 50 5
60 MCC, TEMPO, Triblock of
PEO&PPO (type 121)
Cast & Cure
Epoxy 0.00 1200 80 1.8 0.1 - - 50 5
61 Wood, H2SO4 Cast & Cure
W-Epoxy 0.00 - - - - - - 30 10
61 Wood, H2SO4 Cast & Cure
W-Epoxy 0.00 - - - - - - 27 4
61 Wood, H2SO4 Cast & Cure
W-Epoxy 3.95 - - - - - - 48 6
61 Wood, H2SO4 Cast & Cure
W-Epoxy 3.95 - - - - - - 45 9
61 Wood, H2SO4 Cast & Cure
W-Epoxy 7.99 - - - - - - 36 2
61 Wood, H2SO4 Cast & Cure
W-Epoxy 7.99 - - - - - - 50 10
62 Wood, H2SO4 Cast & Cure
Epoxy 0.00 2030 90 - - - - 61 2
62 Wood, H2SO4 Cast & Cure
Epoxy 0.78 2100 40 - - - - 44 3
62 Wood, H2SO4 Cast & Cure
Epoxy 3.95 2230 50 - - - - 40 2
62 Wood, H2SO4, Triphenyl methyl
Cast & Cure
Epoxy 0.78 2200 200 - - - - 49 4
63 Cotton, H2SO4 E-Spun PAA (X-linked)
0.00 56 1 136 7 - - 0.29 0.01
63 Cotton, H2SO4 E-Spun PAA 3.65 188 4 126 6 - - 0.68 0.03
63 Cotton, H2SO4 E-Spun PAA 7.40 224 1 67 4 - - 0.84 0.04
63 Cotton, H2SO4 E-Spun PAA 11.26
1190 20 60 3 - - 3.3 0.2
63 Cotton, H2SO4 E-Spun PAA 15.23
1980 50 36 2 - - 4.5 0.2
63 Cotton, H2SO4 E-Spun, X-linked
PAA 15.23
4300 400 17 1 - - 16.7 0.8
64 MCC, H2SO4 Cast PHB-co-PHV PEG
CMPTBLZR
0.00 820 - 12.4 - - - 14.1 -
64 MCC, H2SO4 Cast PHB-co-PHV PEG
CMPTBLZR
1.53 1100 - 7.1 - - - 15.5 -
64 MCC, H2SO4 Cast PHB-co-PHV PEG
CMPTBLZR
3.86 1760 7.4 - - - 26.1 -
64 MCC, H2SO4 MM PHB-co-PHV PEG
CMPTBLZR
0.00 1630 30 6.2 0.7 - - 28.93 0.3
64 MCC, H2SO4 MM PHB-co-PHV PEG
CMPTBLZR
1.53 1740 60 4 0.2 - - 25.04 0.3
64 MCC, H2SO4 MM PHB-co-PHV PEG
CMPTBLZR
3.86 1920 70 3.4 0.5 - - 24.88 0.4
65 MCC, HCl, HCOOH
Cast PHB-co-PHV
0.00 900 100 8 0.7 - - 13 1

165
R CNC, Source, Hydrolysis, Modification
Method Matrix CNC Young's Modulus (MPa)
Strain at Break (%)
Strength (MPa)
vol% V D V D σu σy σt D
65 MCC, HCl, HCOOH
Cast PHB-co-PHV
7.81 1900 200 1.9 0.2 - - 19 0.7
65 MCC, HCl, HCOOH, AgNP
0.17 wt%
Cast PHB-co-PHV
7.67 1600 200 1.7 0.5 - - 16.3 0.902
65 MCC, HCl, HCOOH, AgNP
0.34 wt%
Cast PHB-co-PHV
7.54 1700 200 1.7 0.2 - - 16.8 0.8
65 MCC, HCl, HCOOH, AgNP
0.51 wt%
Cast PHB-co-PHV
7.40 1800 200 1.7 0.4 - - 18.5 0.7
65 MCC, HCl, HCOOH, AgNP
0.68 wt%
Cast PHB-co-PHV
7.27 1900 200 1.6 0.3 - - 20 2
65 MCC, HCl, HCOOH, AgNP
0.85 wt%
Cast PHB-co-PHV
7.13 2300 200 1.4 0.2 - - 22 0.7
65 MCC, HCl, HCOOH, AgNP
1.7 wt%
Cast PHB-co-PHV
6.46 3200 200 1.3 0.4 - - 25 1
66 MCC, H2SO4 Cast PEEK(S) 0.00 210 - - - - - 37.6 -
66 MCC, H2SO4 Cast PEEK(S) 1.66 266 - - - - - 57.8 -
66 MCC, H2SO4 Cast PEEK(S) 4.16 357 - - - - - 61.1 -
66 MCC, H2SO4 Cast PEEK(S) 6.69 272 - - - - - 111.5 -
66 MCC, H2SO4 Cast PEEK(S) 8.40 244 - - - - - 102.1 -
66 MCC, H2SO4 Cast PEEK(S+) 0.00 271 - - - - - 12.8 -
66 MCC, H2SO4 Cast PEEK(S+) 1.66 199 - - - - - 35.9 -
66 MCC, H2SO4 Cast PEEK(S+) 4.16 337 - - - - - 56.7 -
66 MCC, H2SO4 Cast PEEK(S+) 6.69 200 - - - - - 60.1 -
66 MCC, H2SO4 Cast PEEK(S+) 8.40 313 - - - - - 35.3 -
67 Cotton, H2SO4 Cast & Cured
PSA-co-PDM 2:1
0.00 7.2 0.1 36 4 - - 4.5 0.7
67 Cotton, H2SO4 Cast & Cured
PSA-co-PDM 2:2
0.63 11.1 0.6 26 3 - - 5 1
67 Cotton, H2SO4 Cast & Cured
PSA-co-PDM 2:3
3.18 15 1 25 2 - - 6 1
67 Cotton, H2SO4 Cast & Cured
PSA-co-PDM 2:4
6.49 32 3 23.4 0.1 - - 9 2
68 Wood, H2SO4 Cast PA 11 0.00 410 20 44 6 - - 38 2
68 Wood, H2SO4 Cast PA 11 0.75 440 30 55 3 - - 41 2
68 Wood, H2SO4 Cast PA 11 2.27 480 20 52 6 - - 44 2
68 Wood, H2SO4 Cast PA 11 3.80 540 30 35 3 - - 43 3
68 Wood, H2SO4 Cast PA 11 5.34 640 50 22 4 - - 46 3
68 Wood, H2SO4, dodecanoic acid
Cast PA 11 7.69 720 30 17 2 - - 51 5
68 Wood, H2SO4, dodecanoic acid
Cast PA 11 0.41 460 40 60 5 - - 41 2
68 Wood, H2SO4, dodecanoic acid
Cast PA 11 510 30 46 6 - - 41 2
68 Wood, H2SO4, dodecanoic acid
Cast PA 11 2.08 590 30 35 7 - - 41 2
68 Wood, H2SO4, dodecanoic acid
Cast PA 11 2.92 600 30 31 7 - - 41 2
68 Wood, H2SO4, dodecanoic acid
Cast PA 11 4.18 570 20 32 6 - - 44 1

166
R CNC, Source, Hydrolysis, Modification
Method Matrix CNC Young's Modulus (MPa)
Strain at Break (%)
Strength (MPa)
vol% V D V D σu σy σt D
68 Wood, H2SO4, methyl laurate
Cast PA 11 0.41 390 30 90 20 - - 38 1
68 Wood, H2SO4, methyl laurate
Cast PA 11 2.08 460 20 100 20 - - 41 1
68 Wood, H2SO4, methyl laurate
Cast PA 11 4.18 446 7 70 10 - - 46 0.6
68 Wood, H2SO4 Cast PA-co-PAA 0.00 2200 100 30 20 - - 75 3
68 Wood, H2SO4 Cast PA-co-PAA 3.80 2400 100 10 3 - - 84 3
68 Wood, H2SO4 Cast PA-co-PAA 7.60 2400 100 5.3 0.6 - - 91 4
68 Wood, H2SO4 Cast PA-co-PAA 15.70
3000 100 4 0.8
- - 97 9
68 Wood, H2SO4 Cast PA-co-PAA 24.20
3200 100 4.3 0.3
- - 116 6
68 Wood, H2SO4 Cast PA-co-PAA 33.20
3700 100 4.2 0.4
- - 132 9
69 MCC, Hydrochloric, ZnO
E-Spun Mats
PHB-co-PHV
0.00 79 8 6.3 0.3 - - 6.3 0.3
69 MCC, Hydrochloric, ZnO
E-Spun Mats
PHB-co-PHV
2.30 150 9 4.9 0.2 - - 4.9 0.2
69 MCC, Hydrochloric, ZnO
E-Spun Mats
PHB-co-PHV
3.86 170 10 3.2 0.2 - - 3.2 0.2
69 MCC, Hydrochloric, ZnO
E-Spun Mats
PHB-co-PHV
7.81 160 10 3.6 0.2 - - 3.6 0.2
69 MCC, Hydrochloric, ZnO
E-Spun Mats
PHB-co-PHV
11.86
142 8 3.8 0.2 - - 3.8 0.2
69 MCC, Hydrochloric, ZnO
Cast PHB-co-PHV
0.00 52 5 10.7 0.6 - - 12.6 0.7
69 MCC, Hydrochloric, ZnO
Cast PHB-co-PHV
2.30 106 6 9.2 0.5 - - 16.3 0.9
69 MCC, Hydrochloric, ZnO
Cast PHB-co-PHV
3.86 124 7 7.1 0.4 - - 24 1
69 MCC, Hydrochloric, ZnO
Cast PHB-co-PHV
7.81 151 7 5.7 0.4 - - 30 2
69 MCC, Hydrochloric, ZnO
Cast PHB-co-PHV
11.86
149 8 4 0.4 - - 28 1
69 MCC, Hydrochloric, ZnO
Cast PHB-co-PHV
16.01
135 7 3.2 0.4 - - 27 1
70 Cotton, H2SO4 Reaction hydrogel
H2O:PAA: PEDGA
0.13 0.011 3E-04 650 30 .073 - - 0.003
70 Cotton, H2SO4 Reaction hydrogel
H2O:PAA: PEDGA
0.31 0.017 5E-04 960 30 .115 - - 0.003
70 Cotton, H2SO4 Reaction hydrogel
H2O:PAA: PEDGA
0.63 0.022 6E-04 1390 50 .151 - - 0.003
70 Cotton, H2SO4 Reaction hydrogel
H2O:PAA: PEDGA
0.94 0.027 7E-04 1250 50 .173 - - 0.003
70 Cotton, H2SO4 Reaction hydrogel
H2O:PAA: PEDGA
1.26 0.03 8E-04 1020 40 .181 - - 0.004
70 Cotton, H2SO4 Reaction hydrogel
H2O:PAA: PEDGA
0 0.007 2E-04 450 10 .035 - - 0.002
71 Cotton, HCl Cast PHB-co-PHV
0.00 59 5 - - 13
- - 1

167
R CNC, Source, Hydrolysis, Modification
Method Matrix CNC Young's Modulus (MPa)
Strain at Break (%)
Strength (MPa)
vol% V D V D σu σy σt D
71 Cotton, HCl Cast PHB-co-PHV
3.86 183 8 - - 28
- - 1
71 Cotton, HCl Cast PHB-co-PHV
7.81 220 10 - - 31
- - 2
71 Cotton, HCl, HCOOH
Cast PHB-co-PHV
3.86 180 10 - - 29
- - 1
71 Cotton, HCl, HCOOH
Cast PHB-co-PHV
7.81 210 9 - - 31
- - 2
71 Cotton, HCl, Citrate
Cast PHB-co-PHV
3.86 220 10 - - 33
- - 0.5
71 Cotton, HCl, Citrate
Cast PHB-co-PHV
7.81 250 10 - - 35
- - 5
72 Wood, H2SO4 F-Spun draw ratio
10
PA-co-PMA 0.00 14500 900 8.9 0.5 - - 650 60
72 Wood, H2SO4 F-Spun draw ratio
10
PA-co-PMA 0.72 15700 700 8 1 - - 610 70
72 Wood, H2SO4 F-Spun draw ratio
10
PA-co-PMA 3.65 18000 1000 8.8 0.5 - - 730 90
72 Wood, H2SO4 F-Spun draw ratio
10
PA-co-PMA 7.40 19000 2000 9.5 0.9 - - 700 100
73 Wood, H2SO4 Cast + extrusion
ABS 0.00 3300 200 9 1 - - 32 2
73 Wood, H2SO4 Cast + extrusion
ABS 0.47 4500 200 6 1 - - 37 2
73 Wood, H2SO4 Cast + extrusion
ABS 0.14 4400 200 4.1 0.6 - - 34 1
73 Wood, H2SO4 Cast + extrusion
ABS 2.37 4200 200 3.8 0.5 - - 34 1
73 Wood, H2SO4 Cast + extrusion
ABS 4.79 4400 200 3.3 0.5 - - 35 1
74 Cotton H2SO4 Cast PHB-co-PHV
0.00 1200 100 - - - - 27 5
74 Cotton H2SO4 Cast PHB-co-PHV
0.38 1500 200 - - - - 27 5
74 Cotton H2SO4 Cast PHB-co-PHV
0.92 1800 200 - - - - 34 7
74 Cotton H2SO4 Cast PHB-co-PHV
1.53 1900 200 - - - - 36 4
74 Cotton H2SO4 Cast PHB-co-PHV
1.76 1900 200 - - - - 36 5
74 Cotton H2SO4 Cast PHB-co-PHV
2.23 1700 200 - - - - 31 2
74 Cotton H2SO4 Cast PHB-co-PHV
2.54 1700 100 - - - - 31 5
74 Cotton H2SO4 Cast PHB-co-PHV
2.77 1800 200 - - - - 26 5
74 Cotton H2SO4 Cast PHB-co-PHV
3.23 1700 200 - - - - 27 8
74 Cotton H2SO4 Cast PHB-co-PHV
3.55 1800 400 - - - - 19 7
75 Cotton H2SO4 + X linking
Cast PMVE-co-MA, PEG
18.64
90 60 310 20 - - 2.3 0.8
75 Cotton H2SO4 + X linking
Cast PMVE-co-MA, PEG
40.74
190 60 230 20 - - 4.2 0.2
75 Cotton H2SO4 + X linking
Cast PMVE-co-MA, PEG
67.35
2300 100 120 2 - - 4 0.1
75 Cotton H2SO4 + X linking
Cast PMVE-co-MA, PEG
100.00
3900 800 105 0 - - 4 2
75 Cotton H2SO4 + X linking
Cast PMVE-co-MA, PEG
67.35
14300 3000 106 2 - - 36.8 5
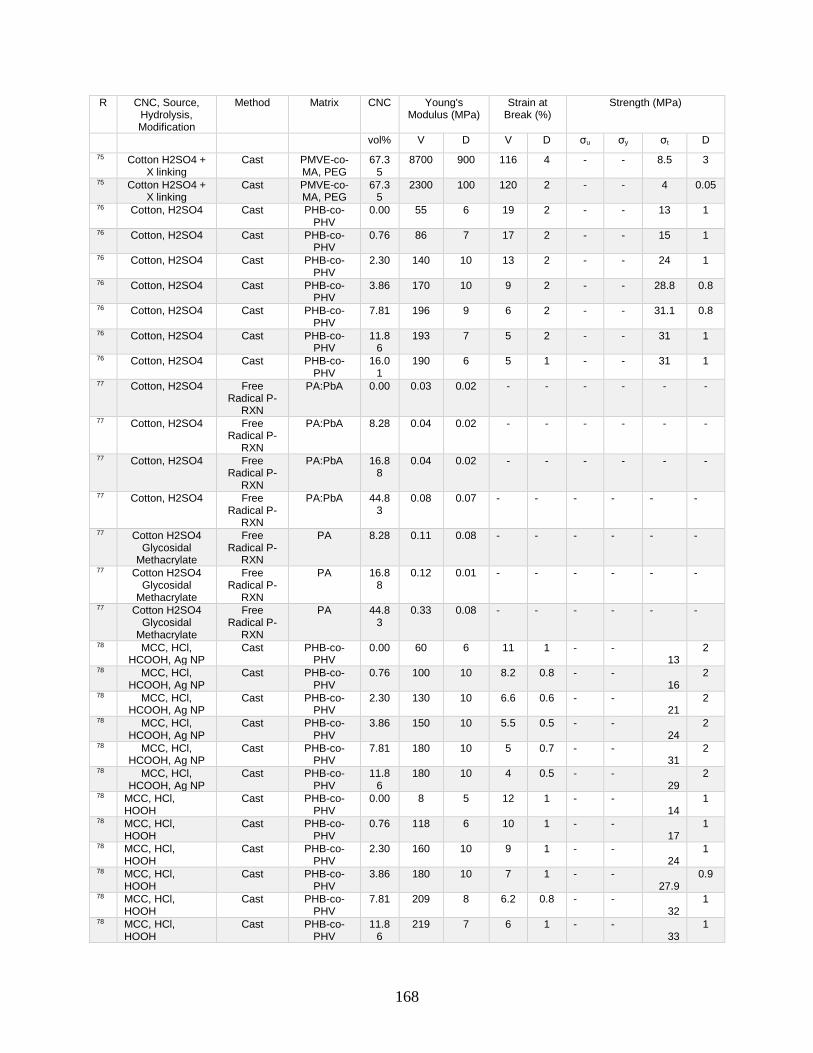
168
R CNC, Source, Hydrolysis, Modification
Method Matrix CNC Young's Modulus (MPa)
Strain at Break (%)
Strength (MPa)
vol% V D V D σu σy σt D
75 Cotton H2SO4 + X linking
Cast PMVE-co-MA, PEG
67.35
8700 900 116 4 - - 8.5 3
75 Cotton H2SO4 + X linking
Cast PMVE-co-MA, PEG
67.35
2300 100 120 2 - - 4 0.05
76 Cotton, H2SO4 Cast PHB-co-PHV
0.00 55 6 19 2 - - 13 1
76 Cotton, H2SO4 Cast PHB-co-PHV
0.76 86 7 17 2 - - 15 1
76 Cotton, H2SO4 Cast PHB-co-PHV
2.30 140 10 13 2 - - 24 1
76 Cotton, H2SO4 Cast PHB-co-PHV
3.86 170 10 9 2 - - 28.8 0.8
76 Cotton, H2SO4 Cast PHB-co-PHV
7.81 196 9 6 2 - - 31.1 0.8
76 Cotton, H2SO4 Cast PHB-co-PHV
11.86
193 7 5 2 - - 31 1
76 Cotton, H2SO4 Cast PHB-co-PHV
16.01
190 6 5 1 - - 31 1
77 Cotton, H2SO4 Free Radical P-
RXN
PA:PbA 0.00 0.03 0.02 - - - - - -
77 Cotton, H2SO4 Free Radical P-
RXN
PA:PbA 8.28 0.04 0.02 - - - - - -
77 Cotton, H2SO4 Free Radical P-
RXN
PA:PbA 16.88
0.04 0.02 - - - - - -
77 Cotton, H2SO4 Free Radical P-
RXN
PA:PbA 44.83
0.08 0.07 - - - - - -
77 Cotton H2SO4 Glycosidal
Methacrylate
Free Radical P-
RXN
PA 8.28 0.11 0.08 - - - - - -
77 Cotton H2SO4 Glycosidal
Methacrylate
Free Radical P-
RXN
PA 16.88
0.12 0.01 - - - - - -
77 Cotton H2SO4 Glycosidal
Methacrylate
Free Radical P-
RXN
PA 44.83
0.33 0.08 - - - - - -
78 MCC, HCl, HCOOH, Ag NP
Cast PHB-co-PHV
0.00 60 6 11 1 - - 13
2
78 MCC, HCl, HCOOH, Ag NP
Cast PHB-co-PHV
0.76 100 10 8.2 0.8 - - 16
2
78 MCC, HCl, HCOOH, Ag NP
Cast PHB-co-PHV
2.30 130 10 6.6 0.6 - - 21
2
78 MCC, HCl, HCOOH, Ag NP
Cast PHB-co-PHV
3.86 150 10 5.5 0.5 - - 24
2
78 MCC, HCl, HCOOH, Ag NP
Cast PHB-co-PHV
7.81 180 10 5 0.7 - - 31
2
78 MCC, HCl, HCOOH, Ag NP
Cast PHB-co-PHV
11.86
180 10 4 0.5 - - 29
2
78 MCC, HCl, HOOH
Cast PHB-co-PHV
0.00 8 5 12 1 - - 14
1
78 MCC, HCl, HOOH
Cast PHB-co-PHV
0.76 118 6 10 1 - - 17
1
78 MCC, HCl, HOOH
Cast PHB-co-PHV
2.30 160 10 9 1 - - 24
1
78 MCC, HCl, HOOH
Cast PHB-co-PHV
3.86 180 10 7 1 - - 27.9
0.9
78 MCC, HCl, HOOH
Cast PHB-co-PHV
7.81 209 8 6.2 0.8 - - 32
1
78 MCC, HCl, HOOH
Cast PHB-co-PHV
11.86
219 7 6 1 - - 33
1

169
R CNC, Source, Hydrolysis, Modification
Method Matrix CNC Young's Modulus (MPa)
Strain at Break (%)
Strength (MPa)
vol% V D V D σu σy σt D
78 MCC, HCl, HOOH
Cast PHB-co-PHV
16.01
229 6 5.3 0.8 - - 35
1
79 None Cast Pea starch glycerol (70:30)
0.00 - - 30 3 4.1 - - 0.3
79 Variable Hydrolysis time 4-
hr
Cast Pea starch glycerol (70:30)
9.43 - - 41 2 7.7 - - 0.5
79 Variable Hydrolysis time 8-
hr
Cast Pea starch glycerol (70:30)
9.43 - - 61 6 7.9 - - 0.5
79 Variable Hydrolysis time
12-hr
Cast Pea starch glycerol (70:30)
9.43 - - 58 6 6.1 - - 0.3
79 Variable Hydrolysis time
16-hr
Cast Pea starch glycerol (70:30)
9.43 - - 57 8 5.8 - - 0.6
79 Variable Hydrolysis time
24-hr
Cast Pea starch glycerol (70:30)
9.43 - - 55 6 5.8 - - 0.5
80 Wood, H2SO4 E-Spun Mats
Silk Fibers 0.00 310 40 10.8 0.4 - - 9 3
80 Wood, H2SO4 E-Spun Mats
Silk Fibers 0.81 420 80 9.9 0.3 - - 15 3
80 Wood, H2SO4 E-Spun Mats
Silk Fibers 1.63 620 70 7.6 0.3 - - 19 3
80 Wood, H2SO4 E-Spun Mats
Silk Fibers 2.45 1040 70 5.2 0.6 - - 26 3
80 Wood, H2SO4 E-Spun Mats
Silk Fibers 3.27 1200 100 4.8 0.9 - - 37 4
81 Wood, H2SO4 Cast Silk Fibers 0.00 820 60 90 10 - - 20 1
81 Wood, H2SO4 Cast Silk Fibers 2.45 1070 80 80 10 - - 23 3
81 Wood, H2SO4 Cast Silk Fibers 4.93 1400 100 63 8 - - 28 2
81 Wood, H2SO4 Cast Silk Fibers 7.44 1950 40 53 7 - - 33 2
81 Wood, H2SO4 Cast Silk Fibers 9.97 2110 70 32 7 - - 36 1
81 Wood, H2SO4 Cast Silk Fibers 12.54
2050 90 11 3 - - 33 2
82 Cotton H2SO4 Cast HBr 0.00 400 300 17 6 - - 12 5
82 Cotton H2SO4 Cast HBr 31.91
4100 900 1.8 0.5 - - 29 3
82 Cotton H2SO4 Cast HBr 46.54
5100 400 1.2 0.6 - - 40 6
82 Cotton H2SO4 Cast HBr 58.44
8000 2000 0.595
0.3 - - 48 5
83 Rice husk, H2SO4
Cast 1:2 Cassava
starch glycerol
0.00 100 30 - - 4.1 0.5
83 Rice husk, H2SO4
Cast 1:2 Cassava
starch glycerol
1.88 210 30 - - - - 5.1 0.5
83 Rice husk, H2SO4
Cast 1:2 Cassava
starch glycerol
3.76 250 30 - - - - 5.6 0.6
83 Rice husk, H2SO4
Cast 1:2 Cassava
starch glycerol
5.65 260 30 - - - - 6.1 0.5
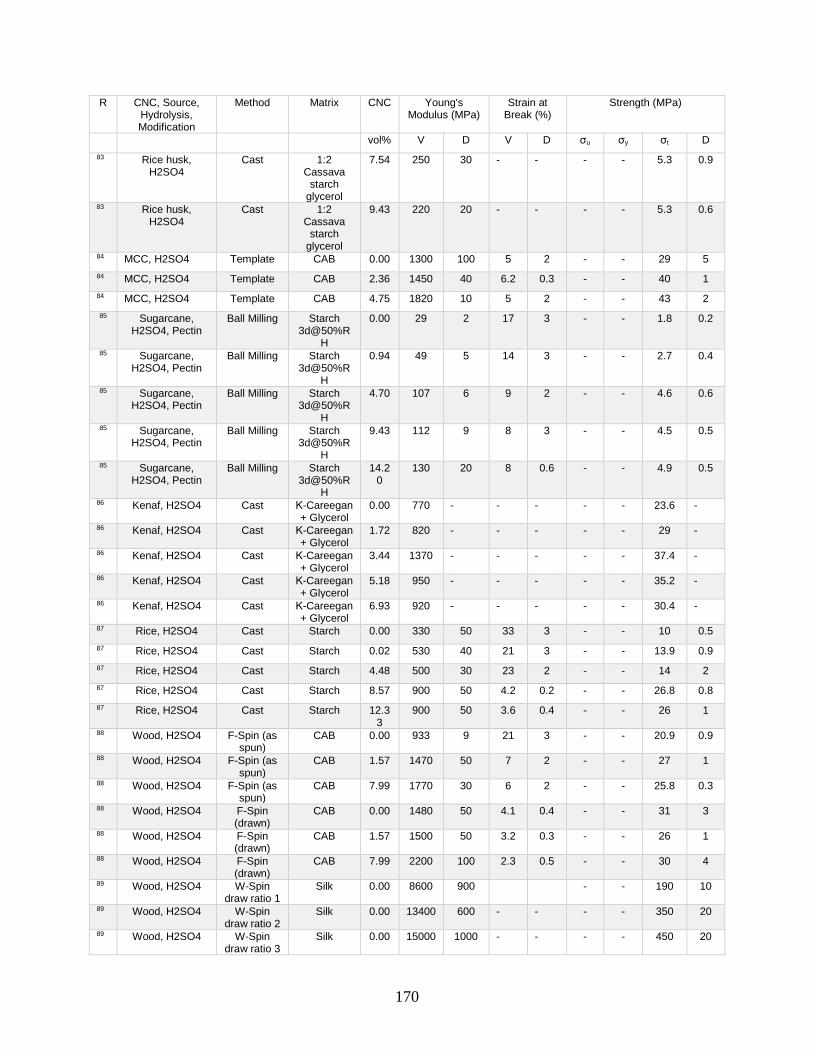
170
R CNC, Source, Hydrolysis, Modification
Method Matrix CNC Young's Modulus (MPa)
Strain at Break (%)
Strength (MPa)
vol% V D V D σu σy σt D
83 Rice husk, H2SO4
Cast 1:2 Cassava
starch glycerol
7.54 250 30 - - - - 5.3 0.9
83 Rice husk, H2SO4
Cast 1:2 Cassava
starch glycerol
9.43 220 20 - - - - 5.3 0.6
84 MCC, H2SO4 Template CAB 0.00 1300 100 5 2 - - 29 5
84 MCC, H2SO4 Template CAB 2.36 1450 40 6.2 0.3 - - 40 1
84 MCC, H2SO4 Template CAB 4.75 1820 10 5 2 - - 43 2
85 Sugarcane, H2SO4, Pectin
Ball Milling Starch 3d@50%R
H
0.00 29 2 17 3 - - 1.8 0.2
85 Sugarcane, H2SO4, Pectin
Ball Milling Starch 3d@50%R
H
0.94 49 5 14 3 - - 2.7 0.4
85 Sugarcane, H2SO4, Pectin
Ball Milling Starch 3d@50%R
H
4.70 107 6 9 2 - - 4.6 0.6
85 Sugarcane, H2SO4, Pectin
Ball Milling Starch 3d@50%R
H
9.43 112 9 8 3 - - 4.5 0.5
85 Sugarcane, H2SO4, Pectin
Ball Milling Starch 3d@50%R
H
14.20
130 20 8 0.6 - - 4.9 0.5
86 Kenaf, H2SO4 Cast Κ-Careegan + Glycerol
0.00 770 - - - - - 23.6 -
86 Kenaf, H2SO4 Cast Κ-Careegan + Glycerol
1.72 820 - - - - - 29 -
86 Kenaf, H2SO4 Cast Κ-Careegan + Glycerol
3.44 1370 - - - - - 37.4 -
86 Kenaf, H2SO4 Cast Κ-Careegan + Glycerol
5.18 950 - - - - - 35.2 -
86 Kenaf, H2SO4 Cast Κ-Careegan + Glycerol
6.93 920 - - - - - 30.4 -
87 Rice, H2SO4 Cast Starch 0.00 330 50 33 3 - - 10 0.5
87 Rice, H2SO4 Cast Starch 0.02 530 40 21 3 - - 13.9 0.9
87 Rice, H2SO4 Cast Starch 4.48 500 30 23 2 - - 14 2
87 Rice, H2SO4 Cast Starch 8.57 900 50 4.2 0.2 - - 26.8 0.8
87 Rice, H2SO4 Cast Starch 12.33
900 50 3.6 0.4 - - 26 1
88 Wood, H2SO4 F-Spin (as spun)
CAB 0.00 933 9 21 3 - - 20.9 0.9
88 Wood, H2SO4 F-Spin (as spun)
CAB 1.57 1470 50 7 2 - - 27 1
88 Wood, H2SO4 F-Spin (as spun)
CAB 7.99 1770 30 6 2 - - 25.8 0.3
88 Wood, H2SO4 F-Spin (drawn)
CAB 0.00 1480 50 4.1 0.4 - - 31 3
88 Wood, H2SO4 F-Spin (drawn)
CAB 1.57 1500 50 3.2 0.3 - - 26 1
88 Wood, H2SO4 F-Spin (drawn)
CAB 7.99 2200 100 2.3 0.5 - - 30 4
89 Wood, H2SO4 W-Spin draw ratio 1
Silk 0.00 8600 900 - - 190 10
89 Wood, H2SO4 W-Spin draw ratio 2
Silk 0.00 13400 600 - - - - 350 20
89 Wood, H2SO4 W-Spin draw ratio 3
Silk 0.00 15000 1000 - - - - 450 20

171
R CNC, Source, Hydrolysis, Modification
Method Matrix CNC Young's Modulus (MPa)
Strain at Break (%)
Strength (MPa)
vol% V D V D σu σy σt D
89 Wood, H2SO4 W-Spin draw ratio 1
Silk 0.81 9300 600 - - - - 220 20
89 Wood, H2SO4 W-Spin draw ratio 2
Silk 0.81 17000 2000 - - - - 420 20
89 Wood, H2SO4 W-Spin draw ratio 3
Silk 0.81 24000 3000 - - - - 560 30
89 Wood, H2SO4 W-Spin draw ratio 1
Silk 2.45 12000 1000 - - - - 280 20
89 Wood, H2SO4 W-Spin draw ratio 2
Silk 2.45 20000 1000 - - - - 460 30
89 Wood, H2SO4 W-Spin draw ratio 3
Silk 2.45 25000 2000 - - - - 660 40
89 Wood, H2SO4 W-Spin draw ratio 1
Silk 4.10 15000 3000 - - - - 320 20
89 Wood, H2SO4 W-Spin draw ratio 2
Silk 4.10 22000 1000 - - - - 570 40
89 Wood, H2SO4 W-Spin draw ratio 3
Silk 4.10 29000 3000 - - - - 740 40
89 Wood, H2SO4 W-Spin draw ratio 1
Silk 5.76 11000 800 - - - - 300 20
89 Wood, H2SO4 W-Spin draw ratio 2
Silk 5.76 18000 2000 - - - - 460 30
89 Wood, H2SO4 W-Spin draw ratio 3
Silk 5.76 25000 3000 - - - - 690 30
90 Cotton H2SO4 Cast PLA 0.00 270 300 16 4 - - 37 2
90 Cotton H2SO4 Cast + annealing at 80 °C
PLA 0.00 2600 200 70 60 - - 26 2
90 Cotton H2SO4 Cast + annealing at 120 °C
PLA 0.00 3100 200 14 0 - - 28 2
90 Cotton H2SO4 Cast + annealing at 140 °C
PLA 0.00 2800 500 2 0 - - 32 7
90 Cotton H2SO4 Cast PLA 1.56 2500 100 4 0 - - 47 3
90 Cotton H2SO4 Cast + annealing at 80 °C
PLA 1.56 1000 300 200 100 - - 17 5
90 Cotton H2SO4 Cast + annealing at 120 °C
PLA 1.56 3400 400 3 1 - - 43 6
90 Cotton H2SO4 Cast + annealing at 140 °C
PLA 1.56 1400 300 16 6 - - 19 4
90 Cotton H2SO4 Cast PLA 7.93 2800 200 1.2 0.3 - - 33 9
90 Cotton H2SO4 Cast + annealing at 80 °C
PLA 7.93 3500 100 1.8 0.2 - - 24.7 0.4
90 Cotton H2SO4 Cast + annealing at 120 °C
PLA 7.93 3800 300 1.8 0 - - 28 2
90 Cotton H2SO4 Cast + annealing at 140 °C
PLA 7.93 4000 200 1.4 0 - - 33 4
90 Cotton H2SO4 Cast PLA 13.70
3700 300 1.2 0.2 - - 42 3
90 Cotton H2SO4 Cast + annealing at 80 °C
PLA 13.70
4000 300 1.6 0.1 - - 27.9 0
90 Cotton H2SO4 Cast + annealing at 120 °C
PLA 13.70
4100 200 1.2 0 - - 28.1 0.9

172
R CNC, Source, Hydrolysis, Modification
Method Matrix CNC Young's Modulus (MPa)
Strain at Break (%)
Strength (MPa)
vol% V D V D σu σy σt D
90 Cotton H2SO4 Cast + annealing at 140 °C
PLA 13.70
4100 900 0.7 0.2 - - 27.7 0.9
91 Wood, H2SO4 Cast None 100 5800 100 0.7 0.1 - - 35 7
91 Wood, H2SO4 Cast PLA 96.80
4500 300 1.1 0.3 - - 30 3
91 Wood, H2SO4 Cast PLA 93.64
3000 1000 1.8 0.5 - - 29 7
91 Wood, H2SO4 Cast PLA 87.46
2000 2000 1.7 0.3 - - 19 9
92 Palm, Mechanical Separation
Cast PLA 0.00 3880 70 98 5 - - 16.5 0.5
92 Palm, Mechanical Separation
Cast PLA 0.78 4700 100 31 7 - - 22.9 0.8
92 Palm, Mechanical Separation
Cast PLA 2.34 4980 80 30 8 - - 30.6 0.7
92 Palm, Mechanical Separation
Cast PLA 3.92 5190 80 29 4 - - 24 0.6
93 bamboo, H2SO4, cellulose I
Cast PLA 0.00 560 20 38 2 - - 21.3 0.4
93 bamboo, H2SO4, cellulose I
Cast PLA 0.78 620 20 18 2 - - 26.2 0.5
93 bamboo, H2SO4, cellulose I
Cast PLA 1.56 700 30 16 2 - - 35 0.4
93 bamboo, H2SO4, cellulose I
Cast PLA 2.34 800 40 14 1 - - 23.8 0.6
93 bamboo, H2SO4, cellulose II
Cast PLA 0.78 920 10 12 2 - - 33.6 0.9
93 bamboo, H2SO4, cellulose II
Cast PLA 1.56 1150 40 9 2 - - 37 1
93 bamboo, H2SO4, cellulose II
Cast PLA 2.34 840 50 8 2 - - 25.7 0.4
93 bamboo, H2SO4, cellulose II
Cast PLA 0.78 940 30 8 2 - - 36.8 1
93 bamboo, H2SO4, cellulose II
Cast PLA 1.56 900 60 5 2 - - 30.3 0.5
93 bamboo, H2SO4, cellulose II
Cast PLA 2.34 740 50 4 1 - - 30.6 0.7
94 Cotton HCl MM CA 0.00 560 10 23 1 - 43 - 3
94 Cotton HCl Cast & MM CA 4.10 537 9 23.1 0.5 - 36 - 1
94 Cotton HCl Cast & MM CA 8.28 580 10 20.9 0.6 - 35.7 - 0.4
94 Cotton HCl Cast & MM CA 12.54
630 20 17 0.7 - 36.8 - 0.7
94 Cotton HCl MM CA 4.10 540 10 20.9 0.5 - 38.6 - 0.5
94 Cotton HCl MM CA 8.28 550 10 19 0.7 - 35.6 - 0.4
94 Cotton HCl MM CA 12.54
560 20 16.2 0.6 - 37 - 0.6
95 MCC, H2SO4 MM Starch 0.00 240 20 20 2 3.1 - - 0.3
95 Cotton, H2SO4 MM Starch 0.81 520 30 15 1 5.1 - - 0.4
95 Cotton, H2SO4 MM Starch 2.45 1300 100 10 1 8.1 - - 0.8
95 Cotton, H2SO4 MM Starch 4.10 2300 100 6.5 0.8 9.8 - - 0.7
95 Cotton, H2SO4 MM Starch 5.76 3300 200 5 0.4 10.8 - - 0.8
95 Cotton, H2SO4 MM Starch 7.44 4200 300 4 0.4 11 - - 1
96 Cotton, Unknown Cast soy protein isolate,
glycerol, & ethylene
0.00 21 2 10 - - 3.1 0.4

173
R CNC, Source, Hydrolysis, Modification
Method Matrix CNC Young's Modulus (MPa)
Strain at Break (%)
Strength (MPa)
vol% V D V D σu σy σt D
diglycidyl ether
96 Cotton, Unknown Cast soy protein isolate,
glycerol, & ethylene diglycidyl
ether
1.04 48 2 3 - - 4.8 0.2
96 Cotton, Unknown, (3-aminopropyl) triethoxysilane
Cast soy protein isolate,
glycerol, & ethylene diglycidyl
ether
1.04 66 4 4 - - 5.6 0.2
97 Tunicin, H2SO4 Cast Wood CNCs
0.00 9100 500 0.36 0.1 - - 32.9 5
97 Tunicin, H2SO4 Cast Wood CNCs
1.00 13200 1700 0.47 0.09 - - 48.42 5.8
97 Tunicin, H2SO4 Cast Wood CNCs
5.00 15500 1600 0.62 0.08 - - 74.2 10.6
97 Tunicin, H2SO4 Cast Wood CNCs
10.00
16700 1800 0.74 0.09 - - 109.7 8.5
97 Tunicin, H2SO4 Cast Wood CNCs
30.00
20200 900 1.07 0.1 - - 138 4.3
97 Tunicin, H2SO4 Cast Wood CNCs
60.00
21400 1200 0.76 0.1 - - 122.3 12.6
97 Tunicin, H2SO4 Cast Wood CNCs
100 20500 1900 0.7 0.05 - - 132.3 10
98 Cotton, H2SO4 Cast Chitosan Xylan 1:2
0.00 - - - - - - 4.9 0.36
98 Cotton, H2SO4 Cast Chitosan Xylan 1:3
4.00 - - - - - - - -
98 Cotton, H2SO4 Cast Chitosan Xylan 1:4
12.00
- - - - - - 16.04 0.22
98 Cotton, H2SO4 Cast Chitosan Xylan 1:5
16.00
- - - - - - 12.76 0.24
99 Wood H2SO4 Cast & X-linking
Alginate 0.00 292 - 9.66 - 9.66 - - -
99 Wood H2SO4 Cast & X-linking
Alginate 10.00
349 - 24.4 - 24.4 - - -
99 Wood H2SO4 Cast & X-linking
Alginate 30.00
361 - 18.7 - 18.7 - - -
99 Wood H2SO4 Cast & X-linking
Alginate 50.00
133 - 3.4 - 3.4 - - -
99 Wood H2SO4 Cast & X-linking
Alginate 70.00
425 - 8.5 - 8.5 - - -
99 Wood, H2SO4, TEMPO
Cast & X-linking
Alginate 10.00
397 - 33 - 33 - - -
99 Wood, H2SO4, TEMPO
Cast & X-linking
Alginate 30.00
437 - 21.8 - 21.8 - - -
99 Wood, H2SO4, TEMPO
Cast & X-linking
Alginate 50.00
233 - 4.5 - 4.5 - - -
99 Wood, H2SO4, TEMPO
Cast & X-linking
Alginate 70.00
277 - 7.3 - 7.3 - - -
99 Wood, H2SO4 Cast & X-linking
Alginate 37°C+wet
0.00 49.7 - 37.4 - 3.4 - - -
99 Wood, H2SO4 Cast & X-linking
Alginate 37°C+wet
10.00
23.2 - 51.5 - 3.2 - - -
99 Wood, H2SO4 Cast & X-linking
Alginate 37°C+wet
30.00
53.3 - 41 - 6.3 - - -
99 Wood, H2SO4 Cast & X-linking
Alginate 37°C+wet
50.00
38.9 - 31.1 - 3.9 - - -
99 Wood, H2SO4 Cast & X-linking
Alginate 37°C+wet
70.00
8.17 - 17.6 - 2.1 - - -
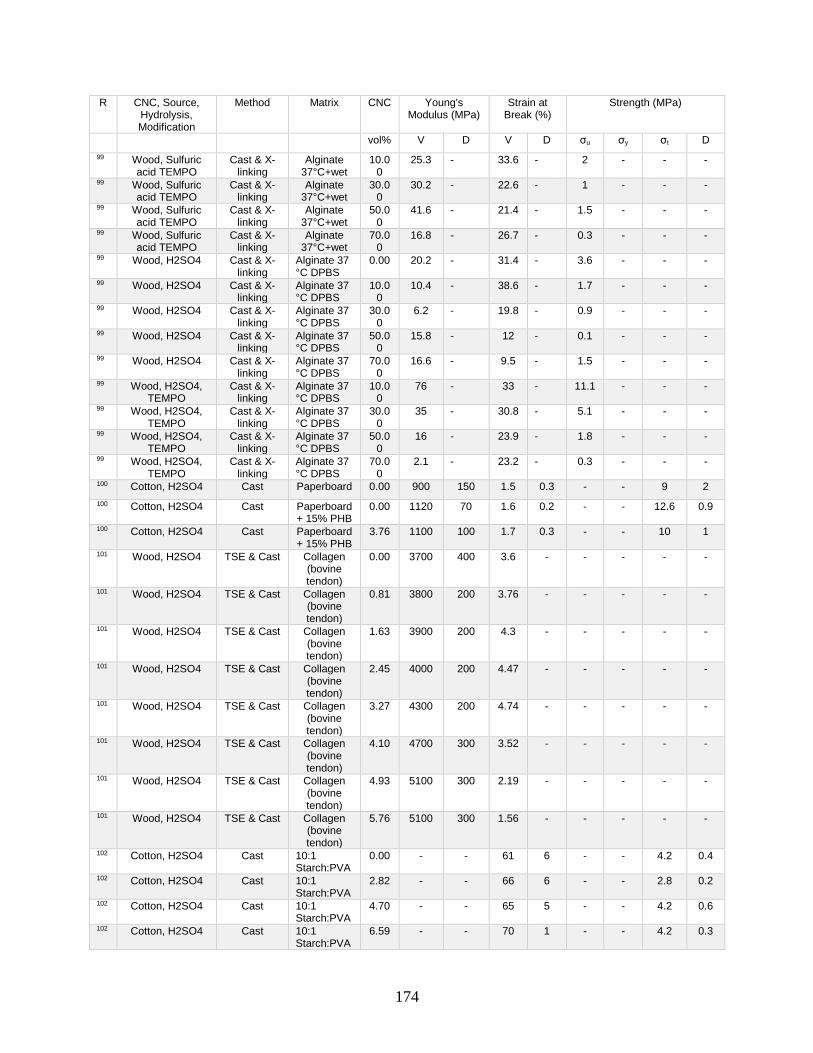
174
R CNC, Source, Hydrolysis, Modification
Method Matrix CNC Young's Modulus (MPa)
Strain at Break (%)
Strength (MPa)
vol% V D V D σu σy σt D
99 Wood, Sulfuric acid TEMPO
Cast & X-linking
Alginate 37°C+wet
10.00
25.3 - 33.6 - 2 - - -
99 Wood, Sulfuric acid TEMPO
Cast & X-linking
Alginate 37°C+wet
30.00
30.2 - 22.6 - 1 - - -
99 Wood, Sulfuric acid TEMPO
Cast & X-linking
Alginate 37°C+wet
50.00
41.6 - 21.4 - 1.5 - - -
99 Wood, Sulfuric acid TEMPO
Cast & X-linking
Alginate 37°C+wet
70.00
16.8 - 26.7 - 0.3 - - -
99 Wood, H2SO4 Cast & X-linking
Alginate 37 °C DPBS
0.00 20.2 - 31.4 - 3.6 - - -
99 Wood, H2SO4 Cast & X-linking
Alginate 37 °C DPBS
10.00
10.4 - 38.6 - 1.7 - - -
99 Wood, H2SO4 Cast & X-linking
Alginate 37 °C DPBS
30.00
6.2 - 19.8 - 0.9 - - -
99 Wood, H2SO4 Cast & X-linking
Alginate 37 °C DPBS
50.00
15.8 - 12 - 0.1 - - -
99 Wood, H2SO4 Cast & X-linking
Alginate 37 °C DPBS
70.00
16.6 - 9.5 - 1.5 - - -
99 Wood, H2SO4, TEMPO
Cast & X-linking
Alginate 37 °C DPBS
10.00
76 - 33 - 11.1 - - -
99 Wood, H2SO4, TEMPO
Cast & X-linking
Alginate 37 °C DPBS
30.00
35 - 30.8 - 5.1 - - -
99 Wood, H2SO4, TEMPO
Cast & X-linking
Alginate 37 °C DPBS
50.00
16 - 23.9 - 1.8 - - -
99 Wood, H2SO4, TEMPO
Cast & X-linking
Alginate 37 °C DPBS
70.00
2.1 - 23.2 - 0.3 - - -
100 Cotton, H2SO4 Cast Paperboard 0.00 900 150 1.5 0.3 - - 9 2
100 Cotton, H2SO4 Cast Paperboard + 15% PHB
0.00 1120 70 1.6 0.2 - - 12.6 0.9
100 Cotton, H2SO4 Cast Paperboard + 15% PHB
3.76 1100 100 1.7 0.3 - - 10 1
101 Wood, H2SO4 TSE & Cast Collagen (bovine tendon)
0.00 3700 400 3.6 - - - - -
101 Wood, H2SO4 TSE & Cast Collagen (bovine tendon)
0.81 3800 200 3.76 - - - - -
101 Wood, H2SO4 TSE & Cast Collagen (bovine tendon)
1.63 3900 200 4.3 - - - - -
101 Wood, H2SO4 TSE & Cast Collagen (bovine tendon)
2.45 4000 200 4.47 - - - - -
101 Wood, H2SO4 TSE & Cast Collagen (bovine tendon)
3.27 4300 200 4.74 - - - - -
101 Wood, H2SO4 TSE & Cast Collagen (bovine tendon)
4.10 4700 300 3.52 - - - - -
101 Wood, H2SO4 TSE & Cast Collagen (bovine tendon)
4.93 5100 300 2.19 - - - - -
101 Wood, H2SO4 TSE & Cast Collagen (bovine tendon)
5.76 5100 300 1.56 - - - - -
102 Cotton, H2SO4 Cast 10:1 Starch:PVA
0.00 - - 61 6 - - 4.2 0.4
102 Cotton, H2SO4 Cast 10:1 Starch:PVA
2.82 - - 66 6 - - 2.8 0.2
102 Cotton, H2SO4 Cast 10:1 Starch:PVA
4.70 - - 65 5 - - 4.2 0.6
102 Cotton, H2SO4 Cast 10:1 Starch:PVA
6.59 - - 70 1 - - 4.2 0.3

175
R CNC, Source, Hydrolysis, Modification
Method Matrix CNC Young's Modulus (MPa)
Strain at Break (%)
Strength (MPa)
vol% V D V D σu σy σt D
102 Cotton, H2SO4 Cast 10:1 Starch:PVA
9.43 - - 58 2 - - 4.6 0.4
102 Cotton, H2SO4 Cast 10:1 Starch:PVA
14.20
- - 53 4 - - 3.8 0.4
102 Cotton, H2SO4 Cast 10:1 Starch:PVA
18.99
- - 41 5 - - 3.5 0.7
103 Ramie, HCl Cast Soy Protein Isolate
0.00 - - 200 20 - - 6.3 0.2
103 Ramie, HCl, Aldehyde Oxidation
Cast Soy Protein Isolate
4.25 - - 140 20 - - 8.8 0.7
103 Ramie, HCl, Aldehyde Oxidation
Cast Soy Protein Isolate
2.12 - - 220 20 - - 9 1
103 Ramie, HCl, Aldehyde Oxidation
Cast Soy Protein Isolate
4.25 - - 220 7 - - 10.9 0.6
103 Ramie, HCl, Aldehyde Oxidation
Cast Soy Protein Isolate
6.40 - - 180 20 - - 12.6 0.3
103 Ramie, HCl, Aldehyde Oxidation
Cast Soy Protein Isolate
8.57 - - 150 20 - - 14 2
104 Algae, HBr Cast 10:3 Starch: Glycerol
0.00 150 50 36 8 - - 9.2 0.8
104 Algae, HBr Cast 10:3 Starch: Glycerol
0.94 700 100 13 9 - - 16 2
104 Algae, HBr Cast 10:3 Starch: Glycerol
2.82 180 40 17 0.2 - - 16 0.9
104 Algae, HBr Cast 10:3 Starch: Glycerol
4.70 170 60 18.6 0.7 - - 12.6 0.8
105 MCC, H2SO4 E-Spun Mat CA 0.00 70 10 5.4 0.2 - - 1.4 0.2
105 MCC, H2SO4 E-Spun Mat CA 8.28 10 20 9.7 0.5 - - 0.7 0.1
105 MCC, H2SO4 E-Spun Mat CA 0.00 180 10 12.9 0.2 - - 6.8 0.6
105 MCC, H2SO4 E-Spun Mat CA 8.28 20 10 40 - - - 1.3 0.2
106 Sweet potato, H2SO4,
Carboxymethyl CNCs
Cast Starch (Cassava)
0.00 - - 25 1 - - 3.6 0.8
106 Sweet potato, H2SO4,
Carboxymethyl CNCs
Cast Starch (Cassava)
2.85 - - 19 1 - - 10.4 0.5
106 Sweet potato, H2SO4,
Carboxymethyl CNCs
Cast Starch (Cassava)
4.27 - - 12 1 - - 11.3 0.9
106 Sweet potato, H2SO4,
Carboxymethyl CNCs
Cast Starch (Cassava)
5.70 - - 10.8 0.6 - - 21.8 0.9
106 Sweet potato, H2SO4,
Carboxymethyl CNCs
Cast Starch (Cassava)
7.14 - - 8.7 0.3 - - 22.5 0.9
106 Sweet potato, H2SO4
Cast Starch (Cassava)
2.85 - - 10 1 - - 11.8 0.8
106 Sweet potato, H2SO4
Cast Starch (Cassava)
4.27 - - 7.9 0.6 - - 15.6 0.9
106 Sweet potato, H2SO4
Cast Starch (Cassava)
5.70 - - 8.6 0.4 - - 10.8 0.8
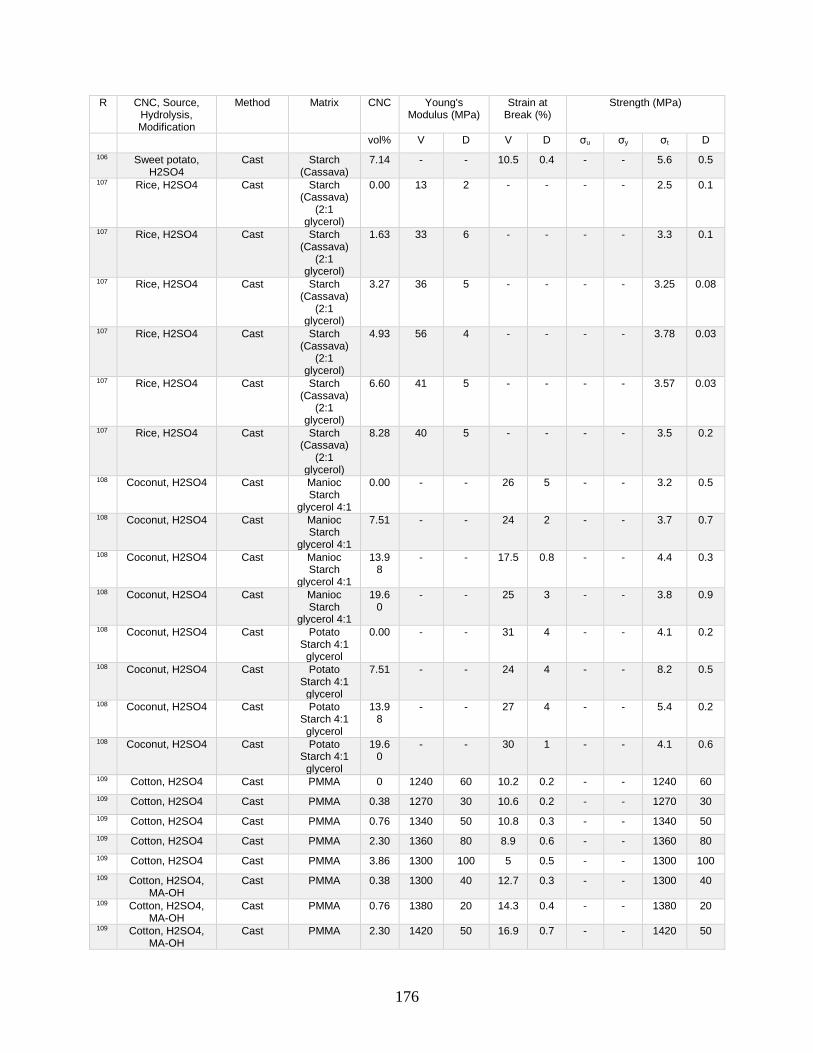
176
R CNC, Source, Hydrolysis, Modification
Method Matrix CNC Young's Modulus (MPa)
Strain at Break (%)
Strength (MPa)
vol% V D V D σu σy σt D
106 Sweet potato, H2SO4
Cast Starch (Cassava)
7.14 - - 10.5 0.4 - - 5.6 0.5
107 Rice, H2SO4 Cast Starch (Cassava)
(2:1 glycerol)
0.00 13 2 - - - - 2.5 0.1
107 Rice, H2SO4 Cast Starch (Cassava)
(2:1 glycerol)
1.63 33 6 - - - - 3.3 0.1
107 Rice, H2SO4 Cast Starch (Cassava)
(2:1 glycerol)
3.27 36 5 - - - - 3.25 0.08
107 Rice, H2SO4 Cast Starch (Cassava)
(2:1 glycerol)
4.93 56 4 - - - - 3.78 0.03
107 Rice, H2SO4 Cast Starch (Cassava)
(2:1 glycerol)
6.60 41 5 - - - - 3.57 0.03
107 Rice, H2SO4 Cast Starch (Cassava)
(2:1 glycerol)
8.28 40 5 - - - - 3.5 0.2
108 Coconut, H2SO4 Cast Manioc Starch
glycerol 4:1
0.00 - - 26 5 - - 3.2 0.5
108 Coconut, H2SO4 Cast Manioc Starch
glycerol 4:1
7.51 - - 24 2 - - 3.7 0.7
108 Coconut, H2SO4 Cast Manioc Starch
glycerol 4:1
13.98
- - 17.5 0.8 - - 4.4 0.3
108 Coconut, H2SO4 Cast Manioc Starch
glycerol 4:1
19.60
- - 25 3 - - 3.8 0.9
108 Coconut, H2SO4 Cast Potato Starch 4:1 glycerol
0.00 - - 31 4 - - 4.1 0.2
108 Coconut, H2SO4 Cast Potato Starch 4:1 glycerol
7.51 - - 24 4 - - 8.2 0.5
108 Coconut, H2SO4 Cast Potato Starch 4:1 glycerol
13.98
- - 27 4 - - 5.4 0.2
108 Coconut, H2SO4 Cast Potato Starch 4:1 glycerol
19.60
- - 30 1 - - 4.1 0.6
109 Cotton, H2SO4 Cast PMMA 0 1240 60 10.2 0.2 - - 1240 60
109 Cotton, H2SO4 Cast PMMA 0.38 1270 30 10.6 0.2 - - 1270 30
109 Cotton, H2SO4 Cast PMMA 0.76 1340 50 10.8 0.3 - - 1340 50
109 Cotton, H2SO4 Cast PMMA 2.30 1360 80 8.9 0.6 - - 1360 80
109 Cotton, H2SO4 Cast PMMA 3.86 1300 100 5 0.5 - - 1300 100
109 Cotton, H2SO4, MA-OH
Cast PMMA 0.38 1300 40 12.7 0.3 - - 1300 40
109 Cotton, H2SO4, MA-OH
Cast PMMA 0.76 1380 20 14.3 0.4 - - 1380 20
109 Cotton, H2SO4, MA-OH
Cast PMMA 2.30 1420 50 16.9 0.7 - - 1420 50

177
R CNC, Source, Hydrolysis, Modification
Method Matrix CNC Young's Modulus (MPa)
Strain at Break (%)
Strength (MPa)
vol% V D V D σu σy σt D
109 Cotton, H2SO4, MA-OH
Cast PMMA 3.86 1490 40 22.3 0.9 - - 1490 40
109 Cotton, H2SO4, MA-OH
Cast PMMA 0.38 1480 60 11.5 0.7 - - 1480 60
109 Cotton, H2SO4, MA-OH
Cast PMMA 0.76 1590 30 16.8 0.9 - - 1590 30
109 Cotton, H2SO4, MA-OH
Cast PMMA 2.30 1450 90 7.3 0.7 - - 1450 90
109 Cotton, H2SO4, MA-OH
Cast PMMA 3.86 1510 70 9.1 1 - - 1510 70
110 MCC, H2SO4 MM + (Premix TSE)
LLDPE 0 108 13 11 2 - - 25 4
110 MCC, H2SO4 MM + (Premix TSE)
LLDPE 1.86 216 19 8 0 - - 18 1
110 MCC, H2SO4, 1,1-diethy-3-
hydroxyazetidinium chloride
MM + (Premix TSE)
LLDPE 2.04 211 19 7 0 - - 14 1
110 MCC, H2SO4, 1,10-diethyl-3-
hydroxyazetidinium chloride
MM + (Premix TSE)
LLDPE 1.68 223 11 7 1 - - 15 1
111 Wood, H2SO4, Toluene
Diisocyanate, Maleated PP
Extrusion PP 0 5200 200 1.5 0.3 - - 37.4 0.2
111 Wood, H2SO4, Toluene
Diisocyanate, Maleated PP
Extrusion PP 1% Maleated
PP
0 5220 80 1.5 0.4 - - 36.5 0.8
111 Wood, H2SO4, Toluene
Diisocyanate, Maleated PP
Extrusion PP 3% Maleated
PP
0 5200 300 1.2 0.2 - - 33.8 0.6
111 Wood, H2SO4, Toluene
Diisocyanate, Maleated PP
Extrusion PP 0.57 5400 300 1.2 0.1 - - 33.1 0.5
111 Wood, H2SO4, Toluene
Diisocyanate, Maleated PP
Extrusion PP 1% Maleated
PP
0.57 5000 300 1.4 0.3 - - 36.9 0.3
111 Wood, H2SO4, Toluene
Diisocyanate, Maleated PP
Extrusion PP 3% Maleated
PP
0.57 4800 200 1.2 0.1 - - 36.2 0.7
111 Wood, H2SO4, Toluene
Diisocyanate, Maleated PP
Extrusion PP 2.91 5200 300 1.2 0.2 - - 33.7 0.4
111 Wood, H2SO4, Toluene
Diisocyanate, Maleated PP
Extrusion PP 1% Maleated
PP
2.91 4800 100 1.3 0.2 - - 33.2 0.4
111 Wood, H2SO4, Toluene
Diisocyanate, Maleated PP
Extrusion PP 3% Maleated
PP
2.91 5000 300 1.2 0.1 - - 36.6 0.4
111 Wood, H2SO4, Toluene
Diisocyanate, Maleated PP
Extrusion PP 5.94 5300 200 1.5 0.4 - - 33.6 0.5

178
R CNC, Source, Hydrolysis, Modification
Method Matrix CNC Young's Modulus (MPa)
Strain at Break (%)
Strength (MPa)
vol% V D V D σu σy σt D
111 Wood, H2SO4, Toluene
Diisocyanate, Maleated PP
Extrusion PP 1% Maleated
PP
5.94 4800 300 1 0.1 - - 33.3 0.7
111 Wood, H2SO4, Toluene
Diisocyanate, Maleated PP
Extrusion PP 3% Maleated
PP
5.94 4900 400 1.07 0.07 - - 33.4 0.4
111 Wood, H2SO4, Toluene
Diisocyanate, Maleated PP
Premix Hot Toluene + Extrusion
PP 1% Maleated
PP
0.57 5700 500 1.9 0.4 - - 30.9 0.5
111 Wood, H2SO4, Toluene
Diisocyanate, Maleated PP
Premix Hot Toluene + Extrusion
PP 1% Maleated
PP
1.73 5800 300 1.6 0.1 - - 32.1 0.3
111 Wood, H2SO4, Toluene
Diisocyanate, Maleated PP
Premix Hot Toluene + Extrusion
PP 1% Maleated
PP
2.91 6000 600 1.3 0.2 - - 32.83 0.09
111 Wood, H2SO4, Toluene
Diisocyanate, Maleated PP
Premix Hot Toluene + Extrusion
PP 1% Maleated
PP
5.94 6300 400 1.2 0.2 - - 32.2 0.6
111 Wood, H2SO4, Toluene
Diisocyanate, Maleated PP
Premix Hot Toluene + Extrusion
PP 0% Maleated
PP
2.91 4800 300 1.2 0.1 - - 30.1 0.4
111 Wood, H2SO4, Toluene
Diisocyanate, Maleated PP
Premix Hot Toluene + Extrusion
PP 1% Maleated
PP
2.91 6000 700 1.2 0.2 - - 36.9 0.1
111 Wood, H2SO4, Toluene
Diisocyanate, Maleated PP
Premix Hot Toluene + Extrusion
PP 3% Maleated
PP
2.91 5700 400 1 0.1 - - 37.6 0.3
111 Wood, H2SO4, Toluene
Diisocyanate, Maleated PP
Premix Hot Toluene + Extrusion
PP 5% Maleated
PP
2.91 6500 400 0.95 0.09 - - 38.9 0.5
111 Wood, H2SO4, Toluene
Diisocyanate, Maleated PP
Premix Hot Toluene + Extrusion
PP 7% Maleated
PP
2.91 6000 600 0.94 0.06 - - 37.2 0.4
112 kenaf, H2SO4 Cast κ-carrageena
n
0 790 100 - - - - 23 1
112 kenaf, H2SO4 Cast κ-carrageena
n
1.88 900 100 - - - - 29 3
112 kenaf, H2SO4 Cast κ-carrageena
n
3.76 1340 90 - - - - 39 3
112 kenaf, H2SO4 Cast κ-carrageena
n
5.65 1100 100 - - - - 36 4
112 kenaf, H2SO4 Cast κ-carrageena
n
7.54 950 100 - - - - 30 3
113 Cotton, H2SO4, TEMPO
Cast PS 0 1900 200 1.9 0.1 22.3 - - 0.5
113 Cotton, H2SO4, TEMPO
Cast PS 1.99 1300 300 1.4 0.2 24 - - 1

179
R CNC, Source, Hydrolysis, Modification
Method Matrix CNC Young's Modulus (MPa)
Strain at Break (%)
Strength (MPa)
vol% V D V D σu σy σt D
113 Cotton, H2SO4, TEMPO & stearyl trimethyl ammonium chloride
Cast PS 1.99 3100 300 2.7 0.1 27.1 - - 0.9
113 Cotton, H2SO4, TEMPO & stearyl trimethyl ammonium chloride
Cast PS 1.99 2600 400 2.5 0.2 30 - - 1
113 Cotton, H2SO4, TEMPO & stearyl trimethyl ammonium chloride
Cast PS 1.99 2800 200 2.4 0.1 29.6 - - 0.7
114 MCC, H2SO4 Cast PVP 0 120 - 5.5 - 6.6 - - -
114 MCC, H2SO4 Cast PVP 3.47 132 - 7.4 - 9.7 - - -
114 MCC, H2SO4 Cast PVP 6.69 413 - 4.2 - 17.2 - - -
114 MCC, H2SO4 Cast PVP 14.39
457 - 6.9 - 31.8 - - -
114 MCC, H2SO4 Cast PVP 22.24
1284 - 3 - 38.4 - - -
114 MCC, H2SO4 Cast PVP 24.37
1755 - 2.5 - 43.8 - - -
114 MCC, H2SO4 Cast PVP 34.15
1216 - 2.1 - 25.3 - - -
115 Cotton, H2SO4 Cast PEO 2.36 41 - 3.06 - - - 0.101 -
115 Cotton, H2SO4 Cast PEO 6.9589
43 - 3.49 - - - 0.16 -
115 Cotton, H2SO4 Cast PEO 10.96
57 - 4.88 - - - 0.188 -
115 Cotton, H2SO4 Cast PEO 15.06
66 - 4.14 - - - 0.218 -
115 Cotton, H2SO4 Cast PEO 20.13
79 - 4.14 - - - 0.2 -
115 Cotton, H2SO4 Cast PEO 28.94
101 - 3.61 - - - 0.115 -
115 Cotton, H2SO4 Cast PEO 39.18
37 - 4.14 - - - 0.097 -
115 Cotton, H2SO4 Cast PEO 49.05
64 - 3.39 - - - 0.106 -
115 Cotton, H2SO4 Cast PEO 56.29
45 - 3.72 - - - 0.083 -
116 Wood, H2SO4, Tannic acid
Cured Hydrogels
PAA 0 0.006 5E-04 500 20 - - 0.059 0.002
116 Wood, H2SO4, Tannic acid
Cured Hydrogels
PAA 0.08 0.032 0.001 1080 40 - - 0.12 0.003
116 Wood, H2SO4, Tannic acid
Cured Hydrogels
PAA 0.23 0.045 0.001 1600 40 - - 0.186 0.004
116 Wood, H2SO4, Tannic acid
Cured Hydrogels
PAA 0.46 0.049 0.002 2950 50 - - 0.257 0.004
116 Wood, H2SO4, Tannic acid
Cured Hydrogels
PAA 0.61 0.05 0.002 2770 50 - - 0.309 0.004
116 Wood, H2SO4, Tannic acid
Cured Hydrogels
PAA 0.76 0.064 0.002 1740 40 - - 0.347 0.004
116 Wood, H2SO4, Tannic acid
Cured Hydrogels
PAA 1.15 0.078 0.002 1570 40 - - 0.38 0.005
117 Cotton, H2SO4, UPy
Cast LDPE 0 98 6 65 15 - 5.8 - 0.9
117 Cotton, H2SO4, UPy
Cast LDPE 1.46 140 17 26 8 - 7 - 0.5

180
R CNC, Source, Hydrolysis, Modification
Method Matrix CNC Young's Modulus (MPa)
Strain at Break (%)
Strength (MPa)
vol% V D V D σu σy σt D
117 Cotton, H2SO4, UPy
Cast LDPE 2.95 160 20 19 7 - 7.4 - 0.6
117 Cotton, H2SO4, UPy
Cast LDPE 6.03 205 20 13 3 - 7.6 - 0.5
117 Cotton, H2SO4, UPy
Cast LDPE 9.25 232 41 7.5 1.2 - 7.8 - 0.5
117 Cotton, H2SO4, UPy
Cast LLDPE 0 125 15 465 40 - 8.7 - 0.9
117 Cotton, H2SO4, UPy
Cast LLDPE 1.45 135 10 435 65 - 9.5 - 0.2
117 Cotton, H2SO4, UPy
Cast LLDPE 2.93 145 20 445 50 - 9.9 - 0.2
117 Cotton, H2SO4, UPy
Cast LLDPE 6.00 165 5 480 30 - 10 - 0.5
117 Cotton, H2SO4, UPy
Cast LLDPE 9.20 195 10 495 15 - 13 - 0.5
117 Cotton, H2SO4, UPy
Cast PEO-EPI 0 0.7 0.1 265 35 - 0.23 - 0.008
117 Cotton, H2SO4, UPy
Cast PEO-EPI 2.18 1.5 0.4 135 25 - 0.24 - 0.006
117 Cotton, H2SO4, UPy
Cast PEO-EPI 4.37 3 0.8 75 22 - 0.27 - 0.005
117 Cotton, H2SO4, UPy
Cast PEO-EPI 8.80 4.4 0.9 40 13 - 0.28 - 0.009
117 Cotton, H2SO4, UPy
Cast PEO-EPI 13.30
5 1.2 35 8 - 0.34 - 0.11
118 Cotton, H2SO4 Premix & RBM
LDPE 0 102 7 77 10 - - 6.1 0.3
118 Cotton, H2SO4 Premix & RBM
LDPE 2.95 125 13 35 10 - - 7.1 0.5
118 Cotton, H2SO4 Premix & RBM
LDPE 6.03 148 15 18 2 - - 8.1 0.5
118 Cotton, H2SO4 Premix & RBM
LDPE 9.25 166 9 13 2 - - 7.8 0.2
118 Cotton, H2SO4 RBM LDPE 6.03 118 11 16 4 - - 7.3 0.6
119 Tunicin, H2SO4 O/T-SE LDPE 0 385 35 180 30 - - 12.1 3.3
119 Tunicin, H2SO4 O/T-SE LDPE 0.6 790 60 52 12 - - 19.9 2.7
119 Tunicin, H2SO4 O/T-SE LDPE 1.3 850 45 33 5.3 - - 24.8 3.1
119 Tunicin, H2SO4 O/T-SE LDPE 2.5 900 140 17 4 - - 22.3 1.9
119 Tunicin, H2SO4 O/T-SE LDPE 3.3 915 50 14 3 - - 25.9 0.3
119 Tunicin, H2SO4 O/T-SE LDPE 4.7 1174 172 7 0.2 - - 24.3 2.5
119 Tunicin, H2SO4 O/T-SE LDPE 6.4 1506 70 6.7 0.2 - - 33.7 3
119 Tunicin, H2SO4 O/T-SE LDPE 7.6 1595 90 5.9 1 - - 39.5 2.6
120 Tunicin, UPy Cast t-PEB 0 13 4 51.5 3.6 - - 1.6 -
120 Tunicin, UPy Cast t-PEB 5.88 62 5 18.9 0.9 - - 2.3 0.7
120 Tunicin, UPy Cast t-PEB 9.03 103 6 8.2 0.5 - - 3.6 0.1
120 Tunicin, UPy Cast t-PEB 12.33
158 25 6 1 - - 4.4 0.5
121 Wood, H2SO4 Cast PEO (35K) 0 220 30 - - - - - -
121 Wood, H2SO4 Cast PEO (35K) 0.76 250 40 - - - - - -
121 Wood, H2SO4 Cast PEO (35K) 2.67 320 20 - - - - - -
121 Wood, H2SO4 Cast PEO (35K) 5.78 360 50 - - - - - -
121 Wood, H2SO4 Cast PEO (35K) 7.75 410 30 - - - - - -

181
R CNC, Source, Hydrolysis, Modification
Method Matrix CNC Young's Modulus (MPa)
Strain at Break (%)
Strength (MPa)
vol% V D V D σu σy σt D
121 Wood, H2SO4 Cast PEO (100K) 0 248 9 - - - - - -
121 Wood, H2SO4 Cast PEO (100K) 0.76 320 6 - - - - - -
121 Wood, H2SO4 Cast PEO (100K) 2.67 379 9 - - - - - -
121 Wood, H2SO4 Cast PEO (100K) 5.78 400 20 - - - - - -
121 Wood, H2SO4 Cast PEO (100K) 7.75 400 30 - - - - - -
122 Alfa, H2SO4 Cast κ-carrageena
n
0 1520 40 27 4 - - 48 7
122 Alfa, H2SO4 Cast κ-carrageena
n
0.88 1960 70 21 2 - - 70 18
122 Alfa, H2SO4 Cast κ-carrageena
n
2.63 2230 80 18 3 - - 87 4
122 Alfa, H2SO4 Cast κ-carrageena
n
4.40 2710 70 16 3 - - 99 6
122 Alfa, H2SO4 Cast κ-carrageena
n
7.07 3090 70 13 3 - - 118 5
123 MCC, H2SO4 MM TSE PBS 0 317 4 365 4 - - - -
123 MCC, H2SO4, AcO2
MM TSE PBS 2.27 373 4 - - - - - -
123 MCC, H2SO4, butyric anhydride
MM TSE PBS 2.27 434 3 335 3 - - - -
123 MCC, H2SO4, caprotic
anhydride
MM TSE PBS 2.27 350 4 - - - - - -
123 MCC, H2SO4, butyric anhydride
MM TSE PBS 0.38 382 4 354 4 - - - -
123 MCC, H2SO4, butyric anhydride
MM TSE PBS 0.75 399 11 342 4 - - - -
123 MCC, H2SO4, butyric anhydride
MM TSE PBS 3.79 424 4 309 5 - - - -
123 MCC, H2SO4, butyric anhydride
MM TSE PBS 5.34 347 4 286 4 - - - -
124 Cotton, H2SO4 MM HDPE 0 1130 90 11 1 - - 20.1 0.3
124 Cotton, H2SO4 MM HDPE 0.30 1230 20 6.5 1 - - 21.1 0.3
124 Cotton, H2SO4 MM HDPE 0.91 1260 20 5 1 - - 21.5 0.5
124 Cotton, H2SO4 MM HDPE 1.52 1220 40 4.6 0.5 - - 20.1 0.6
124 Cotton, H2SO4 MM HDPE 3.06 1210 20 4.1 0.9 - - 20 0.5
124 Cotton H2SO4 PEO CMPTBLZR
MM HDPE 0.30 1470 30 9.2 0.1 - - 23.8 0.5
124 Cotton H2SO4 PEO CMPTBLZR
MM HDPE 0.91 1520 50 8.4 0.4 - - 24.8 0.5
124 Cotton H2SO4 PEO CMPTBLZR
MM HDPE 1.52 1440 30 7.8 0.1 - - 23.9 0.4
124 Cotton H2SO4 PEO CMPTBLZR
MM HDPE 3.06 1310 30 7.4 0.5 - - 22 1
125 Wood, H2SO4 P-RXN PBS 0 690 30 230 20 - - 42.1 0.7
125 Wood, H2SO4 P-RXN PBS 0.075
680 20 450 20 - - 66 2
125 Wood, H2SO4 P-RXN PBS 0.225
751 9 275 1 - - 61.1 0.7
125 Wood, H2SO4 P-RXN PBS 0.376
830 10 360 20 - - 54 1

182
R CNC, Source, Hydrolysis, Modification
Method Matrix CNC Young's Modulus (MPa)
Strain at Break (%)
Strength (MPa)
vol% V D V D σu σy σt D
125 Wood, H2SO4 P-RXN PBS 0.752
900 20 8 1 - - 41 1
126 MCC, H2SO4 Cast (slow) PEO 87.19
5500 500 1.8 0.4 - - 48 8
126 MCC, H2SO4 Cast (slow) PEO 75.16
3900 900 2.3 0.6 - - 20 4
126 MCC, H2SO4 Cast (slow) PEO 63.83
2000 400 2.5 0.6 - - 10 4
126 MCC, H2SO4 Cast (slow) PEO 53.15
2800 600 1.9 0.5 - - 16 6
127 Wood, H2SO4 TSE PBAT with graft MA
0 50 2 164 9 - - 16.1 0.3
127 Wood, H2SO4 TSE PBAT with graft MA
0.63 57 2 157 6 - - 16.3 0.3
127 Wood, H2SO4 TSE PBAT with graft MA
1.90 76.1 0.5 100 20 - - 17.4 0.1
127 Wood, H2SO4 TSE PBAT with graft MA
3.84 86 1 88 3 - - 18.6 0.2
127 Wood, H2SO4 TSE PBAT with graft MA
5.82 108 5 80 4 - - 19.7 0.4
128 abaca plant H2SO4
Sonicated in
PEGDA/H2O & Printed
PEGDA 0 25 1 2.3 0.8 - - 26 1
128 abaca plant H2SO4
Sonicated in
PEGDA/H2O & Printed
PEGDA 0.21 26.8 0.9 4.8 1 - - 26.6 0.7
128 abaca plant H2SO4
Sonicated in
PEGDA/H2O & Printed
PEGDA 0.35 27 1 1.9 0.8 - - 28 1
128 abaca plant H2SO4
Sonicated in
PEGDA/H2O & Printed
PEGDA 0.63 26.8 0.8 1.7 0.5 - - 26 0.6
128 abaca plant H2SO4
Sonicated in
PEGDA/H2O & Printed
PEGDA 0.84 26 2 3.2 1 - - 26 2
129 Unknown Pre-polymer mix & 3-D Printing
PMMA (uncured)
0 670 20 10 1 - - 36.1 0.5
129 unknown Pre-polymer mix & 3-D Printing
PMMA (uncured)
0.08 670 10 9 2 - - 36.3 0.3
129 unknown Pre-polymer mix & 3-D Printing
PMMA (uncured)
0.38 670 20 8 2 - - 35.8 0.2
129 unknown Pre-polymer mix & 3-D Printing
PMMA (uncured)
0.75 630 20 4.7 0.5 - - 33 0.4
129 unknown Pre-polymer mix & 3-D Printing
PMMA (cured)
0 1180 40 2.9 0.3 - - 79 3
129 unknown Pre-polymer mix & 3-D Printing
PMMA (cured)
0.075
1260 50 3.05 0.09 - - 85 1

183
R CNC, Source, Hydrolysis, Modification
Method Matrix CNC Young's Modulus (MPa)
Strain at Break (%)
Strength (MPa)
vol% V D V D σu σy σt D
129 unknown Pre-polymer mix & 3-D Printing
PMMA (cured)
0.38 1260 10 2.8 0.1 - - 94.5 0.5
129 unknown Pre-polymer mix & 3-D Printing
PMMA (cured)
0.75 1230 20 2.4 0.2 - - 67 2
130 Cotton, H2SO4 Cast PSU 0 700 200 - - - - - -
130 Cotton, H2SO4 Cast PSU 0.39 700 400 - - - - - -
130 Cotton, H2SO4 Cast PSU 0.78 1000 300 - - - - - -
130 Cotton, H2SO4 Cast PSU 3.13 1600 500 - - - - - -
130 Cotton, H2SO4 Cast PSU 5.51 1900 300 - - - - - -
130 Cotton, H2SO4 Cast PSU 8.74 800 200 - - - - - -
131 Wood, H2SO4 MM PCL 0 186 9 - - - 16.5 - 0.3
131 Wood, H2SO4 MM PCL 0.36 190 10 - - - 17.2 - 0.7
131 Wood, H2SO4 MM PCL 0.72 200 10 - - - 18 - 1
131 Wood, H2SO4 MM PCL 3.65 220 10 - - - 16 - 1
131 Wood, H2SO4 MM & Foaming
PCL 0 100 10 - - - 7.1 - 0.5
131 Wood, H2SO4 MM & Foaming
PCL 0.36 120 20 - - - 7.4 - 0.7
131 Wood, H2SO4 MM & Foaming
PCL 0.72 130 10 - - - 8.5 - 0.8
131 Wood, H2SO4 MM & Foaming
PCL 3.65 170 20 - - - 12 - 1
132 Cotton H2SO4 cast pre-polymer low X-linking
PSA-co-PDM
0.63 2.1 0.5 150 30 2.3 2.3 - 0.02
132 Cotton H2SO4 cast pre-polymer low X-linking
PSA-co-PDM
3.18 3 0.3 170 20 4.6 4.6 - 0.6
132 Cotton H2SO4 cast pre-polymer low X-linking
PSA-co-PDM
6.49 6 0.7 120 20 5.6 5.6 - 0.4
132 Cotton H2SO4 cast pre-polymer high X-linking
PSA-co-PDM
0 54 3 41 7 7 7.0 - 0.6
132 Cotton H2SO4 cast pre-polymer high X-linking
PSA-co-PDM
0.63 55 2 94 14 13.2 13.2 - 2
132 Cotton H2SO4 cast pre-polymer high X-linking
PSA-co-PDM
3.18 130 20 80 10 20.1 20.1 - 3
132 Cotton H2SO4 cast pre-polymer high X-linking
PSA-co-PDM
6.49 100 10 37 6 19.4 19.4 - 2
133 Kenaf H2SO4 Solution Cast
κ-carrageena
n
0 800 100 19.4 0.6 - - 23 2
133 Kenaf H2SO4 Solution Cast
κ-carrageena
n
1.75 900 100 18.3 0.7 - - 29 3

184
R CNC, Source, Hydrolysis, Modification
Method Matrix CNC Young's Modulus (MPa)
Strain at Break (%)
Strength (MPa)
vol% V D V D σu σy σt D
133 Kenaf H2SO4 Solution Cast
κ-carrageena
n
3.52 100 100 17.1 0.6 - - 37 2
133 Kenaf H2SO4 Solution Cast
kappa-carrageena
n
5.29 1110 90 19.6 0.7 - - 35 3
133 Kenaf H2SO4 Solution Cast
κ-carrageena
n
7.07 950 80 17 0.6 - - 30 3
134 Kenaf H2SO4 Cast (styrene) &
Curing
UPR 0 820 50 - - - - 30 4
134 Kenaf H2SO4 Cast (styrene) &
Curing
UPR 1.51 840 10 - - - - 31 4
134 Kenaf H2SO4 Cast (styrene) &
Curing
UPR 3.03 790 40 - - - - 35 1
134 Kenaf, H2SO4, N-(baminoethyl)-
g-aminopropyltrimet
hoxysilane
Cast (styrene) &
Curing
UPR 4.57 740 30 - - - - 27 2
134 Kenaf, H2SO4, N-(baminoethyl)-
g-aminopropyltrimet
hoxysilane
Cast (styrene) &
Curing
UPR 1.51 900 30 - - - - 38 2
134 Kenaf, H2SO4, N-(baminoethyl)-
g-aminopropyltrimet
hoxysilane
Cast (styrene) &
Curing
UPR 3.03 900 30 - - - - 36 4
134 Kenaf, H2SO4, N-(baminoethyl)-
g-aminopropyltrimet
hoxysilane
Cast (styrene) &
Curing
UPR 4.57 800 20 - - - - 29 4
135 Cotton, H2SO4, carbon black to
CNC 2:1
Coagulation with H2SO4
Natural Rubber Latex
2.7 4 1 510 50 - - 2.1 0.1
135 Cotton, H2SO4, carbon black to
CNC 2:2
Coagulation with H2SO4
Natural Rubber Latex
5.3 6 1 570 50 - - 3.6 0.2
135 Cotton, H2SO4, carbon black to
CNC 2:3
Coagulation with H2SO4
Natural Rubber Latex
8 17 9 450 70 - - 5.1 0.7
135 Cotton, H2SO4, carbon black to
CNC 2:4
Coagulation with H2SO4
Natural Rubber Latex
11 23 9 440 60 - - 7.4 0.6
135 Cotton, H2SO4, carbon black to
CNC 2:5
Coagulation with H2SO4
Natural Rubber Latex
16 100 20 150 50 - - 6 1
136 Unknown MM PP 0 1040 60 610 60 - - 28 3
136 Wood, H2SO4 MM PP 2.91 1170 80 22 4 - - 27 1
136 Wood, H2SO4 MM CMPTBLZR
15wt% added
PP 0 1310 30 200 100 - - 24 1
136 Premixed 3:1 ratio
CMPTBLZR:CNC
MM PP 2.91 1400 60 30 10 - - 23 1

185
R CNC, Source, Hydrolysis, Modification
Method Matrix CNC Young's Modulus (MPa)
Strain at Break (%)
Strength (MPa)
vol% V D V D σu σy σt D
136 Premixed 3:1 ratio solution
mixed CMPTBLZR:CNC
MM PP 2.91 1530 30 35 6 - - 28.5 0.7
137 Wood, H2SO4 Pulverizing & MM
LDPE 0 160 5 500 30 - - 10 0.3
137 Wood, H2SO4 Pulverizing & MM
LDPE 6.00 270 10 460 30 - - 13 1
137 Wood, H2SO4 Pulverizing & MM
PP 0 910 50 740 40 - - 32.0 0.7
137 Wood, H2SO4 Pulverizing & MM
PP 5.91 1830 70 12 3 - - 38 1
138 Cotton H2SO4 E-Spun PS 0 - - 60 5 - - 0.15 0.05
138 Cotton H2SO4 E-Spun PS 0.66 - - 56 4 - - 0.18 0.04
138 Cotton H2SO4 E-Spun PS 1.99 - - 15 6 - - 0.27 0.06
138 Cotton H2SO4 E-Spun PS 3.34 - - 29 3 - - 0.30 0.03
138 Cotton H2SO4 E-Spun PS 4.71 - - 25 3 - - 0.40 0.02
139 Cotton H2SO4 Cast PEG 75 560 90 2.3 0.2 - - 13 2
139 Cotton H2SO4 Cast PEG 63.64
500 100 2.6 0.2 - - 13 2
139 Cotton H2SO4 Cast PEG 52.94
200 100 4 0.2 - - 9 1
139 Cotton H2SO4 Cast PEG 42.86
200 200 4.6 0.5 - - 11 3
140 Corn, H2SO4 E-Spun Mats
PVP (40:360k)
(1:1)
0 N.R N.R 9.1 0.2 2.3 - - 0.2
140 Corn, H2SO4 E-Spun Mats
PVP (40:360k)
(1:1)
1.57 N.R N.R 2.7 0.2 2.9 - - 0.2
140 Corn, H2SO4 E-Spun Mats
PVP (40:360k)
(1:1)
3.15 N.R N.R 3.25 0.2 3.1 - - 0.1
140 Corn H2SO4 AgNO3 (0.34%)
E-Spun Mats
PVP (40:360k)
(1:1)
3.15 N.R N.R 2.5 0.3 2.8 - - 0.3
141 Wood H2SO4 MM PP 0 180 60 40 6 - 20 - 4
141 Wood H2SO4 MM PP 1.73 320 50 15 4 - 14 - 1
141 Wood, H2SO4, Quaternary
Ammonium Salt
MM PP 0.57 200 20 330 20 - 14 - 2
141 Wood, H2SO4, Quaternary
Ammonium Salt
MM PP 1.73 230 40 110 30 - 13 - 2
141 Wood, H2SO4, Quaternary
Ammonium Salt
MM PP 3.50 230 60 350 20 - 14 - 2
141 Wood, H2SO4, Quaternary
Ammonium Salt
MM PP 5.94 280 60 12 7 - 7.7 - 0.9
142 Cotton H2SO4 MM PBAT 0 38.9 - 927 - 11 6 - -
142 Cotton H2SO4 MM PBAT 0.39 104 - 505 - 9.2 6.9 - -
142 Cotton H2SO4 MM PBAT 0.79 93.5 - 416 - 9 6.4 - -
142 Cotton H2SO4 MM PBAT 1.19 95.3 - 415 - 8.8 6.5 - -
142 Cotton H2SO4 MM PBAT 1.58 99.6 - 348 - 8.5 6.4 - -

186
R CNC, Source, Hydrolysis, Modification
Method Matrix CNC Young's Modulus (MPa)
Strain at Break (%)
Strength (MPa)
vol% V D V D σu σy σt D
142 Cotton H2SO4, AcO2
MM PBAT 0.39 120 - 558 - 9.7 6.9 - -
142 Cotton H2SO4, AcO2
MM PBAT 0.79 113 - 446 - 9 6.9 - -
142 Cotton H2SO4, AcO2
MM PBAT 1.19 105 - 375 - 8.6 6.9 - -
142 Cotton H2SO4, AcO2
MM PBAT 1.58 94.2 - 312 - 8.3 6.9 - -
References
1. Moon, R. J.; Martini, A.; Nairn, J.; Simonsen, J.; Youngblood, J., Cellulose
nanomaterials review: structure, properties and nanocomposites. Chemical Society Reviews
2011, 40 (7), 3941-3994.
2. Mark, J. E., Polymer Data Handbook. Oxford University Press: 2009.
3. Wypych, G., Handbook of Polymers (2nd Edition). ChemTec Publishing: 2016.
4. Chen, D.; Lawton, D.; Thompson, M. R.; Liu, Q., Biocomposites reinforced with
cellulose nanocrystals derived from potato peel waste. Carbohydrate Polymers 2012, 90
(1), 709-716.
5. Pakzad, A.; Simonsen, J.; Yassar, R. S., Elastic properties of thin poly(vinyl
alcohol)-cellulose nanocrystal membranes. Nanotechnology 2012, 23 (8).
6. Lee, J.; Deng, Y. L., Increased mechanical properties of aligned and isotropic
electrospun PVA nanofiber webs by cellulose nanowhisker reinforcement.
Macromolecular Research 2012, 20 (1), 76-83.
7. Mathew, A. P.; Gong, G.; Bjorngrim, N.; Wixe, D.; Oksman, K., Moisture
Absorption Behavior and Its Impact on the Mechanical Properties of Cellulose Whiskers-
Based Polyvinylacetate Nanocomposites. Polymer Engineering and Science 2011, 51 (11),
2136-2142.
8. Fortunati, E.; Luzi, F.; Puglia, D.; Terenzi, A.; Vercellino, M.; Visai, L.; Santulli,
C.; Torre, L.; Kenny, J. M., Ternary PVA nanocomposites containing cellulose
nanocrystals from different sources and silver particles: Part II. Carbohydrate Polymers
2013, 97 (2), 837-848.
9. Montes, S.; Carrasco, P. M.; Ruiz, V.; Cabanero, G.; Grande, H. J.; Labidi, J.;
Odriozola, I., Synergistic reinforcement of poly(vinyl alcohol) nanocomposites with
cellulose nanocrystal-stabilized graphene. Composites Science and Technology 2015, 117,
26-31.
10. Zhao, X. J.; Zheng, H. Z.; Qu, D.; Jiang, H. J.; Fan, W.; Sun, Y. Y.; Xu, Y., A
supramolecular approach towards strong and tough polymer nanocomposite fibers. Rsc
Advances 2018, 8 (19), 10361-10366.
11. Tanpichai, S.; Oksman, K., Crosslinked poly(vinyl alcohol) composite films with
cellulose nanocrystals: Mechanical and thermal properties. Journal of Applied Polymer
Science 2018, 135 (3), 11.

187
12. Singh, S.; Gaikwad, K. K.; Lee, Y. S., Antimicrobial and antioxidant properties of
polyvinyl alcohol bio composite films containing seaweed extracted cellulose nano-crystal
and basil leaves extract. International Journal of Biological Macromolecules 2018, 107,
1879-1887.
13. Shrestha, S.; Montes, F.; Schueneman, G. T.; Snyder, J. F.; Youngblood, J. P.,
Effects of aspect ratio and crystal orientation of cellulose nanocrystals on properties of
poly(vinyl alcohol) composite fibers. Composites Science and Technology 2018, 167, 482-
488.
14. Risnasari, I.; Febrianto, F.; Wistara, N. J.; Sadiyo, S.; Nikmatin, S.; Teramoto, Y.;
Lee, S. H.; Jang, J. H.; Hidayat, W.; Kim, N. H., Characterization of cellulose nanocrystal
with cellulose II polymorph from primary sludge and its application to PVA
nanocomposites. Wood Sci. Technol. 2018, 52 (2), 555-565.
15. El Achaby, M.; Kassab, Z.; Aboulkas, A.; Gaillard, C.; Barakat, A., Reuse of red
algae waste for the production of cellulose nanocrystals and its application in polymer
nanocomposites. International Journal of Biological Macromolecules 2018, 106, 681-691.
16. Jahan, Z.; Niazi, M. B. K.; Gregersen, O. W., Mechanical, thermal and swelling
properties of cellulose nanocrystals/PVA nanocomposites membranes. J. Ind. Eng. Chem.
2018, 57, 113-124.
17. Lu, Y.; Huang, J.; Ge, L. L.; Xie, W. Y.; Wu, D. F., Selective localization of
cellulose nanocrystals in the biodegradable poly (vinyl alcohol)/poly(epsilon-
caprolactone) blend composites prepared by Pickering emulsions. Polymer 2018, 156, 136-
147.
18. Liu, Y. Y.; Liu, D. Y.; Sui, G. X., Effects of Cellulose Nanowhiskers on the
Properties of Poly(Vinyl Alcohol)/Graphene Nanoplatelets Nanocomposites. Polymer
Composites 2017, 38, E98-E107.
19. Lam, N. T.; Saewong, W.; Sukyai, P., Effect of varying hydrolysis time on
extraction of spherical bacterial cellulose nanocrystals as a reinforcing agent for poly(vinyl
alcohol) composites. Journal of Polymer Research 2017, 24 (5).
20. Cao, X. D.; Habibi, Y.; Lucia, L. A., One-pot polymerization, surface grafting, and
processing of waterborne polyurethane-cellulose nanocrystal nanocomposites. Journal of
Materials Chemistry 2009, 19 (38), 7137-7145.
21. Gao, Z. Z.; Peng, J.; Zhong, T. H.; Sun, J.; Wang, X. B.; Yue, C., Biocompatible
elastomer of waterborne polyurethane based on castor oil and polyethylene glycol with
cellulose nanocrystals. Carbohydrate Polymers 2012, 87 (3), 2068-2075.
22. Pei, A. H.; Malho, J. M.; Ruokolainen, J.; Zhou, Q.; Berglund, L. A., Strong
Nanocomposite Reinforcement Effects in Polyurethane Elastomer with Low Volume
Fraction of Cellulose Nanocrystals. Macromolecules 2011, 44 (11), 4422-4427.
23. Saralegi, A.; Rueda, L.; Martin, L.; Arbelaiz, A.; Eceiza, A.; Corcuera, M. A., From
elastomeric to rigid polyurethane/cellulose nanocrystal bionanocomposites. Composites
Science and Technology 2013, 88, 39-47.
24. Zhao, Q.; Sun, G.; Yan, K. L.; Zhou, A. J.; Chen, Y. X., Novel bio-antifelting agent
based on waterborne polyurethane and cellulose nanocrystals. Carbohydrate Polymers
2013, 91 (1), 169-174.
25. Park, S. H.; Oh, K. W.; Kim, S. H., Reinforcement effect of cellulose nanowhisker
on bio-based polyurethane. Composites Science and Technology 2013, 86, 82-88.

188
26. Lin, S.; Huang, J.; Chang, P. R.; Wei, S. W.; Xu, Y. X.; Zhang, Q. X., Structure
and mechanical properties of new biomass-based nanocomposite: Castor oil-based
polyurethane reinforced with acetylated cellulose nanocrystal. Carbohydrate Polymers
2013, 95 (1), 91-99.
27. Wu, G. M.; Liu, D.; Liu, G. F.; Chen, J.; Huo, S. P.; Kong, Z. W., Thermoset
nanocomposites from waterborne bio-based epoxy resin and cellulose nanowhiskers.
Carbohydrate Polymers 2015, 127, 229-235.
28. Girouard, N. M.; Xu, S. H.; Schueneman, G. T.; Shofner, M. L.; Meredith, J. C.,
Site-Selective Modification of Cellulose Nanocrystals with Isophorone Diisocyanate and
Formation of Polyurethane-CNC Composites. Acs Applied Materials & Interfaces 2016, 8
(2), 1458-1467.
29. Buffa, J. M.; Mondragon, G.; Corcuera, M. A.; Eceiza, A.; Mucci, V.; Aranguren,
M. I., Physical and mechanical properties of a vegetable oil based nanocomposite.
European Polymer Journal 2018, 98, 116-124.
30. Prataviera, R.; Pollet, E.; Bretas, R. E. S.; Avérous, L.; Lucas, A. A.,
Nanocomposites based on renewable thermoplastic polyurethane and chemically modified
cellulose nanocrystals with improved mechanical properties. Journal of Applied Polymer
Science 2018, 135 (45), 46736.
31. Nicharat, A.; Shirole, A.; Foster, E. J.; Weder, C., Thermally activated shape
memory behavior of melt-mixed polyurethane/cellulose nanocrystal composites. Journal
of Applied Polymer Science 2017, 134 (27), 45033.
32. Furtak-Wrona, K.; Kozik-Ostrowka, P.; Jadwiszczak, K.; Maigret, J. E.; Aguie-
Beghin, V.; Coqueret, X., Polyurethane acrylate networks including cellulose nanocrystals:
a comparison between UV and EB- curing. Radiation Physics and Chemistry 2018, 142,
94-99.
33. Kong, X. H.; Wolodko, J.; Zhao, L. Y.; Curtis, J. M., The preparation and
characterization of polyurethane reinforced with a low fraction of cellulose nanocrystals.
Progress in Organic Coatings 2018, 125, 207-214.
34. Mondragon, G.; Santamaria-Echart, A.; Hormaiztegui, M. E. V.; Arbelaiz, A.;
Pena-Rodriguez, C.; Mucci, V.; Corcuera, M.; Aranguren, M. I.; Eceiza, A.,
Nanocomposites of Waterborne Polyurethane Reinforced with Cellulose Nanocrystals
from Sisal Fibres. J. Polym. Environ. 2018, 26 (5), 1869-1880.
35. Mucci, V. L.; Ivdre, A.; Buffa, J. M.; Cabulis, U.; Stefani, P. M.; Aranguren, M. I.,
Composites made from a soybean oil biopolyurethane and cellulose nanocrystals. Polymer
Engineering and Science 2018, 58 (2), 125-132.
36. Yuwawech, K.; Wootthikanokkhan, J.; Wanwong, S.; Tanpichai, S.,
Polyurethane/esterified cellulose nanocrystal composites as a transparent moisture barrier
coating for encapsulation of dye sensitized solar cells. Journal of Applied Polymer Science
2017, 134 (45).
37. Hu, Z. J.; Fu, S. Y.; Tang, A. M., Fabrication of Light-triggered AuNP/CNC/SMP
Nano-Composites. Bioresources 2017, 12 (1), 1982-1990.
38. Gu, J.; Catchmark, J. M., Polylactic acid composites incorporating casein
functionalized cellulose nanowhiskers. J. Biol. Eng. 2013, 7 (1), 10.
39. Hong, J.; Kim, D. S., Preparation and physical properties of polylactide/cellulose
nanowhisker/nanoclay composites. Polymer Composites 2013, 34 (2), 293-298.

189
40. Lee, J. H.; Park, S. H.; Kim, S. H., Preparation of cellulose nanowhiskers and their
reinforcing effect in polylactide. Macromolecular Research 2013, 21 (11), 1218-1225.
41. Lee, J. H.; Park, S. H.; Kim, S. H., Surface Modification of Cellulose Nanowhiskers
and Their Reinforcing Effect in Polylactide. Macromolecular Research 2014, 22 (4), 424-
430.
42. Luo, H. L.; Xiong, G. Y.; Li, Q. P.; Ma, C. Y.; Zhu, Y.; Guo, R. S.; Wan, Y. Z.,
Preparation and properties of a novel porous poly(lactic acid) composite reinforced with
bacterial cellulose nanowhiskers. Fibers and Polymers 2014, 15 (12), 2591-2596.
43. Dhar, P.; Kumar, A.; Katiyar, V., Magnetic Cellulose Nanocrystal Based
Anisotropic Polylactic Acid Nanocomposite Films: Influence on Electrical, Magnetic,
Thermal, and Mechanical Properties. Acs Applied Materials & Interfaces 2016, 8 (28),
18393-18409.
44. Dhar, P.; Tarafder, D.; Kumar, A.; Katiyar, V., Thermally recyclable polylactic
acid/cellulose nanocrystal films through reactive extrusion process. Polymer 2016, 87,
268-282.
45. Ma, P. M.; Jiang, L.; Yu, M. M.; Dong, W. F.; Chen, M. Q., Green Antibacterial
Nanocomposites from Poly(lactide)/Poly(butylene adipate-co-terephthalate)/Nanocrystal
Cellulose Silver Nanohybrids. Acs Sustainable Chemistry & Engineering 2016, 4 (12),
6417-6426.
46. Zhang, X. Z.; Zhang, Y., Reinforcement effect of poly(butylene succinate) (PBS)-
grafted cellulose nanocrystal on toughened PBS/polylactic acid blends. Carbohydrate
Polymers 2016, 140, 374-382.
47. Dhar, P.; Kumar, M. R.; Bhasney, S. M.; Bhagabati, P.; Kumar, A.; Katiyar, V.,
Sustainable Approach for Mechanical Recycling of Poly(lactic acid)/Cellulose Nanocrystal
Films: Investigations on Structure-Property Relationship and Underlying Mechanism. Ind.
Eng. Chem. Res. 2018, 57 (43), 14493-14508.
48. Brown, E.; Abdelwahab, M.; Valerio, O.; Misra, M.; Mohanty, A. K., In Situ
Cellulose Nanocrystal-Reinforced Glycerol-Based Biopolyester for Enhancing Poly(lactic
acid) Biocomposites. ACS Omega 2018, 3 (4), 3857-3867.
49. Yin, Y. Y.; Zhao, L. N.; Jiang, X.; Wang, H. B.; Gao, W. D., Cellulose nanocrystals
modified with a triazine derivative and their reinforcement of poly(lactic acid)-based
bionanocomposites. Cellulose 2018, 25 (5), 2965-2976.
50. Wei, L. Q.; Agarwal, U. P.; Matuana, L.; Sabo, R. C.; Stark, N. M., Performance
of high lignin content cellulose nanocrystals in poly(lactic acid). Polymer 2018, 135, 305-
313.
51. Shakouri, Z.; Nazockdast, H., Microstructural development and mechanical
performance of PLA/TPU blends containing geometrically different cellulose
nanocrystals. Cellulose 2018, 25 (12), 7167-7188.
52. Qian, S. P.; Zhang, H. H.; Yao, W. C.; Sheng, K. C., Effects of bamboo cellulose
nanowhisker content on the morphology, crystallization, mechanical, and thermal
properties of PLA matrix biocomposites. Compos. Pt. B-Eng. 2018, 133, 203-209.
53. Orellana, J. L.; Wichhart, D.; Kitchens, C. L., Mechanical and Optical Properties
of Polylactic Acid Films Containing Surfactant-Modified Cellulose Nanocrystals. J.
Nanomater. 2018, 12.

190
54. Muiruri, J. K.; Liu, S. L.; Teo, W. S.; Kong, J. H.; He, C. B., Highly Biodegradable
and Tough Polylactic Acid-Cellulose Nanocrystal Composite. Acs Sustainable Chemistry
& Engineering 2017, 5 (5), 3929-3937.
55. Mariano, M.; Pilate, F.; de Oliveira, F. B.; Khelifa, F.; Dubois, P.; Raquez, J. M.;
Dufresne, A., Preparation of Cellulose Nanocrystal-Reinforced Poly(lactic acid)
Nanocomposites through Noncovalent Modification with PLLA-Based Surfactants. ACS
Omega 2017, 2 (6), 2678-2688.
56. Jalvo, B.; Mathew, A. P.; Rosal, R., Coaxial poly(lactic acid) electrospun
composite membranes incorporating cellulose and chitin nanocrystals. Journal of
Membrane Science 2017, 544, 261-271.
57. Xu, W. N.; Qin, Z. Y.; Yu, H. Y.; Liu, Y. N.; Liu, N.; Zhou, Z.; Chen, L., Cellulose
nanocrystals as organic nanofillers for transparent polycarbonate films. Journal of
Nanoparticle Research 2013, 15 (4), 8.
58. Xu, S. H.; Girouard, N.; Schueneman, G.; Shofner, M. L.; Meredith, J. C.,
Mechanical and thermal properties of waterborne epoxy composites containing cellulose
nanocrystals. Polymer 2013, 54 (24), 6589-6598.
59. Peng, S. X.; Moon, R. J.; Youngblood, J. P., Design and characterization of
cellulose nanocrystal-enhanced epoxy hardeners. Green Mater. 2014, 2 (4), 193-205.
60. Emami, Z.; Meng, Q. K.; Pircheraghi, G.; Manas-Zloczower, I., Use of surfactants
in cellulose nanowhisker/epoxy nanocomposites: effect on filler dispersion and system
properties. Cellulose 2015, 22 (5), 3161-3176.
61. Girouard, N.; Schueneman, G. T.; Shofner, M. L.; Meredith, J. C., Exploiting
colloidal interfaces to increase dispersion, performance, and pot-life in cellulose
nanocrystal/waterborne epoxy composites. Polymer 2015, 68, 111-121.
62. Fox, D. M.; Kaufman, N.; Woodcock, J.; Davis, C. S.; Gilman, J. W.; Shields, J.
R.; Davis, R. D.; Matko, S.; Zammarano, M., Epoxy Composites Using Wood Pulp
Components as Fillers. Intech Europe: Rijeka, 2016; p 199-215.
63. Lu, P.; Hsieh, Y. L., Cellulose nanocrystal-filled poly(acrylic acid) nanocomposite
fibrous membranes. Nanotechnology 2009, 20 (41), 9.
64. Jiang, L.; Morelius, E.; Zhang, J. W.; Wolcott, M.; Holbery, J., Study of the Poly(3-
hydroxybutyrate-co-3-hydroxyvalerate)/Cellulose Nanowhisker Composites Prepared by
Solution Casting and Melt Processing. J. Compos Mater. 2008, 42 (24), 2629-2645.
65. Zhang, H.; Yu, H. Y.; Wang, C.; Yao, J. M., Effect of silver contents in cellulose
nanocrystal/silver nanohybrids on PHBV crystallization and property improvements.
Carbohydrate Polymers 2017, 173, 7-16.
66. Wei, Y. C.; Shang, Y. B.; Ni, C. J.; Zhang, H. Y.; Li, X. B.; Liu, B. J.; Men, Y. F.;
Zhang, M. Y.; Hu, W., Modified nanocrystal cellulose/fluorene-containing sulfonated
poly(ether ether ketone ketone) composites for proton exchange membranes. Applied
Surface Science 2017, 416, 996-1006.
67. Sonseca, A.; Menes, O.; Gimenez, E., A comparative study of the mechanical,
shape-memory, and degradation properties of poly(lactic acid) nanofiber and cellulose
nanocrystal reinforced poly(mannitol sebacate) nanocomposites. Rsc Advances 2017, 7
(35), 21869-21882.
68. Peng, S. X.; Shrestha, S.; Youngblood, J. P., Crystal structure transformation and
induction of shear banding in Polyamide 11 by surface modified Cellulose Nanocrystals.
Polymer 2017, 114, 88-102.

191
69. Abdalkarim, S. Y. H.; Yu, H. Y.; Wang, D. C.; Yao, J. M., Electrospun poly(3-
hydroxybutyrate-co-3-hydroxy-valerate)/cellulose reinforced nanofibrous membranes
with ZnO nanocrystals for antibacterial wound dressings. Cellulose 2017, 24 (7), 2925-
2938.
70. Yang, J.; Han, C. R., Mechanically Viscoelastic Properties of Cellulose
Nanocrystals Skeleton Reinforced Hierarchical Composite Hydrogels. Acs Applied
Materials & Interfaces 2016, 8 (38), 25621-25630.
71. Yu, H. Y.; Yao, J. M., Reinforcing properties of bacterial polyester with different
cellulose nanocrystals via modulating hydrogen bonds. Composites Science and
Technology 2016, 136, 53-60.
72. Chang, H. B.; Chien, A. T.; Liu, H. C.; Wang, P. H.; Newcomb, B. A.; Kumar, S.,
Gel Spinning of Polyacrylonitrile/Cellulose Nanocrystal Composite Fibers. ACS Biomater.
Sci. Eng. 2015, 1 (7), 610-616.
73. Ma, L. B.; Zhang, Y.; Meng, Y. J.; Anusonti-Inthra, P.; Wang, S. Q., Preparing
cellulose nanocrystal/acrylonitrile-butadiene-styrene nanocomposites using the master-
batch method. Carbohydrate Polymers 2015, 125, 352-359.
74. Ten, E.; Bahr, D. F.; Li, B.; Jiang, L.; Wolcott, M. P., Effects of Cellulose
Nanowhiskers on Mechanical, Dielectric, and Rheological Properties of Poly(3-
hydroxybutyrate-co-3-hydroxyvalerate)/Cellulose Nanowhisker Composites. Ind. Eng.
Chem. Res. 2012, 51 (7), 2941-2951.
75. Goetz, L.; Foston, M.; Mathew, A. P.; Oksman, K.; Ragauskas, A. J., Poly(methyl
vinyl ether-co-maleic acid)-Polyethylene Glycol Nanocomposites Cross-Linked In Situ
with Cellulose Nanowhiskers. Biomacromolecules 2010, 11 (10), 2660-2666.
76. Yu, H. Y.; Qin, Z. Y.; Liu, Y. N.; Chen, L.; Liu, N.; Zhou, Z., Simultaneous
improvement of mechanical properties and thermal stability of bacterial polyester by
cellulose nanocrystals. Carbohydrate Polymers 2012, 89 (3), 971-978.
77. Atifi, S.; Su, S. X.; Hamad, W. Y., Mechanically tunable nanocomposite hydrogels
based on functionalized cellulose nanocrystals. Nord. Pulp Paper Res. J. 2014, 29 (1), 95-
104.
78. Yu, H. Y.; Sun, B.; Zhang, D. Z.; Chen, G. Y.; Yang, X. Y.; Yao, J. M.,
Reinforcement of biodegradable poly(3-hydroxybutyrate-co-3-hydroxyvalerate) with
cellulose nanocrystal/silver nanohybrids as bifunctional nanofillers. J. Mat. Chem. B 2014,
2 (48), 8479-8489.
79. Chen, Y.; Liu, C. H.; Chang, P. R.; Cao, X. D.; Anderson, D. P.,
Bionanocomposites based on pea starch and cellulose nanowhiskers hydrolyzed from pea
hull fibre: Effect of hydrolysis time. Carbohydrate Polymers 2009, 76 (4), 607-615.
80. Huang, J.; Liu, L.; Yao, J. M., Electrospinning of Bombyx mori Silk Fibroin
Nanofiber Mats Reinforced by Cellulose Nanowhiskers. Fibers and Polymers 2011, 12 (8),
1002-1006.
81. Li, R. J.; Zhang, Y. H.; Zhu, L. J.; Yao, J. M., Fabrication and characterization of
silk fibroin/poly(ethylene glycol)/cellulose nanowhisker composite films. Journal of
Applied Polymer Science 2012, 124 (3), 2080-2086.
82. Hossain, K. M. Z.; Jasmani, L.; Ahmed, I.; Parsons, A. J.; Scotchford, C. A.;
Thielemans, W.; Rudd, C. D., High cellulose nanowhisker content composites through
cellosize bonding. Soft Matter 2012, 8 (48), 12099-12110.

192
83. Johar, N.; Ahmad, I., Morphological, thermal, and mechanical properties of starch
biocomposite films reinforced by cellulose nanocrystals from rice husks. Bioresources
2012, 7 (4), 5469-5477.
84. Siqueira, G.; Mathew, A. P.; Oksman, K., Processing of cellulose
nanowhiskers/cellulose acetate butyrate nanocomposites using sol–gel process to facilitate
dispersion. Composites Science and Technology 2011, 71 (16), 1886-1892.
85. Moreira, F. K. V.; Marconcini, J. M.; Mattoso, L. H. C., Solid state ball milling as
a green strategy to improve the dispersion of cellulose nanowhiskers in starch-based
thermoplastic matrices. Cellulose 2012, 19 (6), 2049-2056.
86. Zakuwan, S. Z.; Ahmad, I.; Ramli, N., Preparation of Hybrid Nano Biocomposite
kappa-Carrageenan/Cellulose Nanocrystal/Nanoclay. In 2013 Ukm Fst Postgraduate
Colloquium, Murad, A.; Yen, C. C.; Ismail, E. S.; Maskat, M. Y.; Noorani, M. S. M.;
Ibrahim, N.; Karim, N.; Yahya, R.; Khalid, R. M.; Ismail, W. R.; Ling, W. S.; Ibrahim, Z.,
Eds. Amer Inst Physics: Melville, 2013; Vol. 1571, pp 738-743.
87. Agustin, M. B.; Ahmmad, B.; Alonzo, S. M. M.; Patriana, F. M., Bioplastic based
on starch and cellulose nanocrystals from rice straw. J. Reinf. Plast. Compos. 2014, 33
(24), 2205-2213.
88. Hooshmand, S.; Aitomaki, Y.; Skrifvars, M.; Mathew, A. P.; Oksman, K., All-
cellulose nanocomposite fibers produced by melt spinning cellulose acetate butyrate and
cellulose nanocrystals. Cellulose 2014, 21 (4), 2665-2678.
89. Liu, L.; Yang, X. G.; Yu, H. Y.; Ma, C.; Yao, J. M., Biomimicking the structure of
silk fibers via cellulose nanocrystal as beta-sheet crystallite. Rsc Advances 2014, 4 (27),
14304-14313.
90. Camarero-Espinosa, S.; Boday, D. J.; Weder, C.; Foster, E. J., Cellulose
Nanocrystal Driven Crystallization of Poly(D,L-lactide) and Improvement of the
Thermomechanical Properties. Journal of Applied Polymer Science 2015, 132 (10), 11.
91. Bardet, R.; Belgacem, N.; Bras, J., Flexibility and Color Monitoring of Cellulose
Nanocrystal Iridescent Solid Films Using Anionic or Neutral Polymers. Acs Applied
Materials & Interfaces 2015, 7 (7), 4010-4018.
92. Haafiz, M. K. M.; Hassan, A.; Khalil, H.; Khan, I.; Inuwa, I. M.; Islam, M. S.;
Hossain, M. S.; Syakir, M. I.; Fazita, M. R. N., Bionanocomposite based on cellulose
nanowhisker from oil palm biomass-filled poly(lactic acid). Polymer Testing 2015, 48,
133-139.
93. Dhar, P.; Tarafder, D.; Kumar, A.; Katiyar, V., Effect of cellulose nanocrystal
polymorphs on mechanical, barrier and thermal properties of poly(lactic acid) based
bionanocomposites. Rsc Advances 2015, 5 (74), 60426-60440.
94. Leite, L. S. F.; Battirola, L. C.; da Silva, L. C. E.; Goncalves, M. D., Morphological
investigation of cellulose acetate/cellulose nanocrystal composites obtained by melt
extrusion. Journal of Applied Polymer Science 2016, 133 (44), 10.
95. Tabassi, N.; Moghbeli, M. R.; Ghasemi, I., Thermoplastic starch/cellulose
nanocrystal green composites prepared in an internal mixer. Iran. Polym. J. 2016, 25 (1),
45-57.
96. Zhang, S. F.; Xia, C. L.; Dong, Y. M.; Yan, Y. T.; Li, J. Z.; Shi, S. Q.; Cai, L. P.,
Soy protein isolate-based films reinforced by surface modified cellulose nanocrystal.
Industrial Crops and Products 2016, 80, 207-213.

193
97. Natarajan, B.; Krishnamurthy, A.; Qin, X.; Emiroglu, C. D.; Forster, A.; Foster, E.
J.; Weder, C.; Fox, D. M.; Keten, S.; Obrzut, J.; Gilman, J. W., Binary Cellulose
Nanocrystal Blends for Bioinspired Damage Tolerant Photonic Films. Advanced
Functional Materials 2018, 28 (26), 1800032.
98. Bao, Y. P.; Zhang, H.; Luan, Q.; Zheng, M. M.; Tang, H.; Huang, F. H., Fabrication
of cellulose nanowhiskers reinforced chitosan-xylan nanocomposite films with
antibacterial and antioxidant activities. Carbohydrate Polymers 2018, 184, 66-73.
99. Smyth, M.; M’Bengue, M.-S.; Terrien, M.; Picart, C.; Bras, J.; Foster, E. J., The
effect of hydration on the material and mechanical properties of cellulose nanocrystal-
alginate composites. Carbohydrate Polymers 2018, 179, 186-195.
100. Seoane, I. T.; Manfredi, L. B.; Cyras, V. P., Bilayer biocomposites based on coated
cellulose paperboard with films of polyhydroxybutyrate/cellulose nanocrystals. Cellulose
2018, 25 (4), 2419-2434.
101. Long, K. Y.; Cha, R. T.; Zhang, Y. P.; Li, J. J.; Ren, F. P.; Jiang, X. Y., Cellulose
nanocrystals as reinforcements for collagen-based casings with low gas transmission.
Cellulose 2018, 25 (1), 463-471.
102. Noshirvani, N.; Hong, W. Y. J.; Ghanbarzadeh, B.; Fasihi, H.; Montazami, R.,
Study of cellulose nanocrystal doped starch-polyvinyl alcohol bionanocomposite films.
International Journal of Biological Macromolecules 2018, 107, 2065-2074.
103. Xie, D. Y.; Qian, D.; Song, F.; Wang, X. L.; Wang, Y. Z., A Fully Biobased
Encapsulant Constructed of Soy Protein and Cellulose Nanocrystals for Flexible
Electromechanical Sensing. Acs Sustainable Chemistry & Engineering 2017, 5 (8), 7063-
7070.
104. Sucaldito, M. R.; Camacho, D. H., Characteristics of unique HBr-hydrolyzed
cellulose nanocrystals from freshwater green algae (Cladophora rupestris) and its
reinforcement in starch -based film. Carbohydrate Polymers 2017, 169, 315-323.
105. Nair, S. S.; Mathew, A. P., Porous composite membranes based on cellulose acetate
and cellulose nanocrystals via electrospinning and electrospraying. Carbohydrate
Polymers 2017, 175, 149-157.
106. Ma, X. H.; Cheng, Y. J.; Qin, X. L.; Guo, T.; Deng, J.; Liu, X., Hydrophilic
modification of cellulose nanocrystals improves the physicochemical properties of cassava
starch-based nanocomposite films. Lwt-Food Science and Technology 2017, 86, 318-326.
107. Kargarzadeh, H.; Johar, N.; Ahmad, I., Starch biocomposite film reinforced by
multiscale rice husk fiber. Composites Science and Technology 2017, 151, 147-155.
108. Cerqueira, J. C.; Penha, J. D.; Oliveira, R. S.; Guarieiro, L. L. N.; Melo, P. D.;
Viana, J. D.; Machado, B. A. S., Production of biodegradable starch nanocomposites using
cellulose nanocrystals extracted from coconut fibers. Polimeros-Ciencia E Tecnologia
2017, 27 (4), 320-329.
109. Wang, W.; Liang, T.; Zhang, B.; Bai, H.; Ma, P.; Dong, W., Green functionalization
of cellulose nanocrystals for application in reinforced poly(methyl methacrylate)
nanocomposites. Carbohydrate Polymers 2018, 202, 591-599.
110. Borjesson, M.; Sahlin, K.; Bernin, D.; Westman, G., Increased thermal stability of
nanocellulose composites by functionalization of the sulfate groups on cellulose
nanocrystals with azetidinium ions. Journal of Applied Polymer Science 2018, 135 (10),
10.

194
111. Gwon, J. G.; Cho, H. J.; Lee, D.; Choi, D. H.; Lee, S.; Wu, Q. L.; Lee, S. Y.,
Physicochemical and Mechanical Properties of Polypropylene-cellulose Nanocrystal
Nanocomposites: Effects of Manufacturing Process and Chemical Grafting. Bioresources
2018, 13 (1), 1619-1636.
112. Zakuwan, S. Z.; Ahmad, I., Synergistic Effect of Hybridized Cellulose
Nanocrystals and Organically Modified Montmorillonite on kappa-Carrageenan
Bionanocomposites. Nanomaterials 2018, 8 (11), 14.
113. Yin, Y. Y.; Hong, Z. Z.; Tian, X. Z.; Zhu, Q. Y.; Jiang, X.; Wang, H. B.; Gao, W.
D., Cellulose nanocrystals modified with quaternary ammonium salts and its reinforcement
of polystyrene. Polym. Bull. 2018, 75 (5), 2151-2166.
114. Voronova, M.; Rubleva, N.; Kochkina, N.; Afineevskii, A.; Zakharov, A.; Surov,
O., Preparation and Characterization of Polyvinylpyrrolidone/Cellulose Nanocrystals
Composites. Nanomaterials 2018, 8 (12).
115. Surov, O. V.; Voronova, M. I.; Afineevskii, A. V.; Zakharov, A. G., Polyethylene
oxide films reinforced by cellulose nanocrystals: Microstructure-properties relationship.
Carbohydrate Polymers 2018, 181, 489-498.
116. Shao, C. Y.; Wang, M.; Meng, L.; Chang, H. L.; Wang, B.; Xu, F.; Wang, J.; Wan,
P. B., Mussel-Inspired Cellulose Nanocomposite Tough Hydrogels with Synergistic Self-
Healing, Adhesive, and Strain-Sensitive Properties. Chemistry of Materials 2018, 30 (9),
3110-3121.
117. Natterodt, J. C.; Sapkota, J.; Foster, E. J.; Weder, C., Polymer Nanocomposites with
Cellulose Nanocrystals Featuring Adaptive Surface Groups. Biomacromolecules 2017, 18
(2), 517-525.
118. Sapkota, J.; Natterodt, J. C.; Shirole, A.; Foster, E. J.; Weder, C., Fabrication and
Properties of Polyethylene/Cellulose Nanocrystal Composites. Macromolecular Materials
and Engineering 2017, 302 (1), 1600300-n/a.
119. Sapkota, J.; Jorfi, M.; Weder, C.; Foster, E. J., Reinforcing poly (ethylene) with
cellulose nanocrystals. Macromolecular rapid communications 2014, 35 (20), 1747-1753.
120. Biyani, M. V.; Foster, E. J.; Weder, C., Light-Healable Supramolecular
Nanocomposites Based on Modified Cellulose Nanocrystals. ACS Macro Letters 2013, 2
(3), 236-240.
121. Reid, M. S.; Stimpson, T. C.; Niinivaara, E.; Villalobos, M.; Cranston, E. D.,
Comparing Soft Semicrystalline Polymer Nanocomposites Reinforced with Cellulose
Nanocrystals and Fumed Silica. Ind. Eng. Chem. Res. 2018, 57 (1), 220-230.
122. El Achaby, M.; Kassab, Z.; Barakat, A.; Aboulkas, A., Alfa fibers as viable
sustainable source for cellulose nanocrystals extraction: Application for improving the
tensile properties of biopolymer nanocomposite films. Industrial Crops and Products
2018, 112, 499-510.
123. He, Y. Y.; Zhu, J.; Wang, W. T.; Ni, H. T., Surface modification of cellulose
nanocrystals with different acid anhydrides for improved dispersion in poly(butylene
succinate). Rsc Advances 2018, 8 (67), 38305-38314.
124. Inai, N. H.; Lewandowska, A. E.; Ghita, O. R.; Eichhorn, S. J., Interfaces in
polyethylene oxide modified cellulose nanocrystal - polyethylene matrix composites.
Composites Science and Technology 2018, 154, 128-135.
125. Kim, T.; Jeon, H.; Jegal, J.; Kim, J. H.; Yang, H. C.; Park, J.; Oh, D. X.; Hwang, S.
Y., Trans crystallization behavior and strong reinforcement effect of cellulose nanocrystals

195
on reinforced poly(butylene succinate) nanocomposites. Rsc Advances 2018, 8 (28),
15389-15398.
126. Yao, K.; Meng, Q.; Bulone, V.; Zhou, Q., Flexible and Responsive Chiral Nematic
Cellulose Nanocrystal/Poly(ethylene glycol) Composite Films with Uniform and Tunable
Structural Color. Advanced Materials 2017, 29 (28).
127. Rahimi, S. K.; Aeinehvand, R.; Kim, K.; Otaigbe, J. U., Structure and
Biocompatibility of Bioabsorbable Nanocomposites of Aliphatic-Aromatic Copolyester
and Cellulose Nanocrystals. Biomacromolecules 2017, 18 (7), 2179-2194.
128. Palaganas, N. B.; Mangadlao, J. D.; de Leon, A. C.; Palaganas, J. O.; Pangilinan,
K. D.; Lee, Y. J.; Advincula, R. C., 3D Printing of Photocurable Cellulose Nanocrystal
Composite for Fabrication of Complex Architectures via Stereolithography. Acs Applied
Materials & Interfaces 2017, 9 (39), 34314-34324.
129. Feng, X. H.; Yang, Z. Z.; Chmely, S.; Wang, Q. W.; Wang, S. Q.; Xie, Y. J., Lignin-
coated cellulose nanocrystal filled methacrylate composites prepared via 3D
stereolithography printing: Mechanical reinforcement and thermal stabilization.
Carbohydrate Polymers 2017, 169, 272-281.
130. Noorani, S.; Simonsen, J.; Atre, S., Nano-enabled microtechnology: polysulfone
nanocomposites incorporating cellulose nanocrystals. Cellulose 2007, 14 (6), 577-584.
131. Mi, H. Y.; Jing, X.; Peng, J.; Salick, M. R.; Peng, X. F.; Turng, L. S., Poly(epsilon-
caprolactone) (PCL)/cellulose nano-crystal (CNC) nanocomposites and foams. Cellulose
2014, 21 (4), 2727-2741.
132. Sonseca, A.; Camarero-Espinosa, S.; Peponi, L.; Weder, C.; Foster, E. J.; Kenny,
J. M.; Gimenez, E., Mechanical and Shape-Memory Properties of Poly(mannitol
sebacate)/Cellulose Nanocrystal Nanocomposites. J. Polym. Sci. Pol. Chem. 2014, 52 (21),
3123-3133.
133. Zarina, S.; Ahmad, I., Biodegradable Composite Films based on kappa-carrageenan
Reinforced by Cellulose Nanocrystal from Kenaf Fibers. Bioresources 2015, 10 (1), 256-
271.
134. Kargarzadeh, H.; Sheltami, R. M.; Ahmad, I.; Abdullah, I.; Dufresne, A., Cellulose
nanocrystal: A promising toughening agent for unsaturated polyester nanocomposite.
Polymer 2015, 56, 346-357.
135. Wu, X. D.; Lu, C. H.; Zhang, X. X.; Zhou, Z. H., Conductive natural rubber/carbon
black nanocomposites via cellulose nanowhisker templated assembly: tailored hierarchical
structure leading to synergistic property enhancements. J. Mater. Chem. A 2015, 3 (25),
13317-13323.
136. Bagheriasl, D.; Carreau, P. J.; Dubois, C.; Riedl, B., Properties of polypropylene
and polypropylene/poly(ethylene-co-vinyl alcohol) blend/CNC nanocomposites.
Composites Science and Technology 2015, 117, 357-363.
137. Iyer, K. A.; Flores, A. M.; Torkelson, J. M., Comparison of polyolefin
biocomposites prepared with waste cardboard, microcrystalline cellulose, and cellulose
nanocrystals via solid-state shear pulverization. Polymer 2015, 75, 78-87.
138. Huan, S. Q.; Bai, L.; Liu, G. X.; Cheng, W. L.; Han, G. P., Electrospun nanofibrous
composites of polystyrene and cellulose nanocrystals: manufacture and characterization.
Rsc Advances 2015, 5 (63), 50756-50766.
139. Gu, M. Y.; Jiang, C. Y.; Liu, D. G.; Prempeh, N.; Smalyukh, II, Cellulose
Nanocrystal/Poly(ethylene glycol) Composite as an Iridescent Coating on Polymer

196
Substrates: Structure-Color and Interface Adhesion. Acs Applied Materials & Interfaces
2016, 8 (47), 32565-32573.
140. Huang, S. W.; Zhou, L.; Li, M. C.; Wu, Q. L.; Kojima, Y.; Zhou, D. G., Preparation
and Properties of Electrospun Poly (Vinyl Pyrrolidone)/Cellulose Nanocrystal/Silver
Nanoparticle Composite Fibers. Materials 2016, 9 (7), 14.
141. Nagalakshmaiah, M.; El Kissi, N.; Dufresne, A., Ionic Compatibilization of
Cellulose Nanocrystals with Quaternary Ammonium Salt and Their Melt Extrusion with
Polypropylene. Acs Applied Materials & Interfaces 2016, 8 (13), 8755-8764.
142. Zhang, X. Z.; Ma, P. M.; Zhang, Y., Structure and properties of surface-acetylated
cellulose nanocrystal/poly(butylene adipate-co-terephthalate) composites. Polym. Bull.
2016, 73 (7), 2073-2085.


![Multi-functional coating of cellulose nanocrystals for flexible packaging applications [2013]](https://static.fdokumen.com/doc/165x107/6334c1876c27eedec605e023/multi-functional-coating-of-cellulose-nanocrystals-for-flexible-packaging-applications.jpg)

