Transparent Reconfigurable Acceleration for Heterogeneous Embedded Applications
Upload
khangminh22Category
view
2download
0
TRANSPARENT TEMPO OXIDIZED CELLULOSE NANOFIBRIL
(TOCNF) COMPOSITES WITH INCREASED TOUGHNESS AND
THICKNESS BY LAMINATION
by
Endrina Stefani Forti Suarez
A Dissertation
Submitted to the Faculty of Purdue University
In Partial Fulfillment of the Requirements for the degree of
Doctor of Philosophy
School of Materials Engineering
West Lafayette, Indiana
May 2021

2
THE PURDUE UNIVERSITY GRADUATE SCHOOL
STATEMENT OF COMMITTEE APPROVAL
Dr. Jeffrey P. Youngblood, Chair
School of Materials Engineering
Dr. Chelsea Davis
School of Materials Engineering
Dr. John A. Howarter
School of Materials Engineering
Dr. Mukerrem Cakmak
School of Materials Engineering
Dr. Gregory Schueneman
US Forest Service
Approved by:
Dr. David Bahr

3
ACKNOWLEDGMENTS
I am grateful to Dr. Jeffrey Youngblood, for his perspective, willingness to share his
knowledge, and availability to answer almost every unthinkable question. Thanks for opening my
eyes to a world of possibilities.
Special acknowledgments to Dr. Gregory Schueneman and Dr. Robert Moon, for being
there monthly to offer advice and guidance, demonstrating true professionalism, and opening the
path for new research ideas. It was a pleasure working alongside you.
Thanks to my committee members. Dr. Mukerrem Cakmak and Dr. John Howarter for their
novel ideas and insightful suggestions. My most sincere appreciation goes to Prof. Chelsea Davis,
for helping me navigate the world of mechanics and becoming a female role model to look after
in the academic space.
Noteworthy mention to Dr. Carlos Martinez. Thanks for stretching your hand without
hesitation every time I needed help.
This thesis would not have been possible without the support of my closest friends, who
became a family along the way and with whom I am sure I will continue to share memories. Thanks
to Daniela Betancourt for being a mentor, friend, and family simultaneously. Thanks, Daniel
Allocca for cheering me up and pushing me to continue. Special mention to Stefan Leiva, for being
a strong support when I needed it the most. I am grateful to all my coworkers and lab friends.
Finally, I extend my gratitude to my family, who were far away but very close to my heart
during this journey.
This work has been supported by the Private-Public Partnership for Nanotechnology in the
Forestry Sector (P3Nano) under grant number 109217.

4
TABLE OF CONTENTS
LIST OF TABLES .......................................................................................................................... 6
LIST OF FIGURES ........................................................................................................................ 7
ABSTRACT .................................................................................................................................. 11
INTRODUCTION ................................................................................................................. 13
1.1 Background and Motivation ............................................................................................. 13
1.2 Research Objectives .......................................................................................................... 14
1.3 Overview of this Work...................................................................................................... 15
TRANSPARENT TEMPO OXIDIZED CELLULOSE NANOFIBRIL (TOCNF)
COMPOSITES WITH INCREASED TOUGHNESS AND THICKNESS BY LAMINATION 16
2.1 Introduction ....................................................................................................................... 16
2.2 Materials and Methods ...................................................................................................... 18
2.2.1 Materials .................................................................................................................... 18
2.2.2 Fabrication of samples ............................................................................................... 18
2.2.3 Tensile testing ............................................................................................................ 19
2.2.4 Digital Image Correlation (DIC) ............................................................................... 20
2.2.5 Flexural testing .......................................................................................................... 21
2.2.6 Polarized light microscopy ........................................................................................ 21
2.2.7 Adhesion testing ........................................................................................................ 21
2.2.8 UV-Vis Spectroscopy ................................................................................................ 22
2.2.9 Scanning Electron Microscopy (SEM) ...................................................................... 22
2.3 Results and Discussion ..................................................................................................... 22
2.3.1 Processing .................................................................................................................. 22
2.3.2 Tensile Properties ...................................................................................................... 26
2.3.3 Flexural Properties ..................................................................................................... 33
2.4 Summary ........................................................................................................................... 43
MECHANICAL ENHANCEMENT OF CELLULOSE NANOFIBRIL (CNF) FILMS
THROUGH THE ADDITION OF WATER-SOLUBLE POLYMERS ....................................... 44
3.1 Introduction ....................................................................................................................... 44
3.2 Materials and Methods ...................................................................................................... 45
3.2.1 Materials .................................................................................................................... 45
3.2.2 Fabrication of nanocomposite films .......................................................................... 47

5
3.2.3 Tensile testing ............................................................................................................ 48
3.2.4 Transmission Electron Microscopy (TEM) ............................................................... 49
3.2.5 Zeta potential ............................................................................................................. 49
3.2.6 UV-Vis Spectroscopy ................................................................................................ 49
3.2.7 Rheometry .................................................................................................................. 49
3.3 Results and Discussion ..................................................................................................... 50
3.3.1 Processing .................................................................................................................. 50
3.3.2 Mechanical Properties ............................................................................................... 52
3.3.3 Zeta potential ............................................................................................................. 68
3.3.4 Rheology .................................................................................................................... 69
3.4 Summary ........................................................................................................................... 71
IMPROVED MECHANICAL AND IMPACT PERFORMANCE OF HIGH STRENGTH
TEMPO OXIDIZED CELLULOSE NANOFIBRIL (TOCNF)-EPOXY LAMINATES ............ 73
4.1 Introduction ....................................................................................................................... 73
4.2 Materials and Methods ...................................................................................................... 74
4.2.1 Materials. ................................................................................................................... 74
4.2.2 Fabrication of Samples .............................................................................................. 75
4.2.3 Epoxy Characterization ............................................................................................. 76
4.2.4 Laminates Characterization ....................................................................................... 77
4.3 Results and discussion ...................................................................................................... 79
4.3.1 Processing remarks .................................................................................................... 79
4.3.2 Flexural properties ..................................................................................................... 81
4.3.3 Influence of TOCNF layers ....................................................................................... 82
4.3.4 Influence of epoxy formulation ................................................................................. 85
4.3.5 Influence of a silane coupling agent .......................................................................... 89
4.3.6 Impact rupture energy ................................................................................................ 95
4.4 Summary ........................................................................................................................... 99
CONCLUSIONS AND FUTURE WORK .......................................................................... 100
REFERENCES ........................................................................................................................... 102
6
LIST OF TABLES
Table 2.1 Mechanical properties of neat 30µm TOCNFs and 0.8mm epoxy films. (+ -) range
represent 1 standard deviation ...................................................................................................... 26
Table 2.2 Laminate configuration for investigating the role of laminate thickness on flexural
properties....................................................................................................................................... 35
Table 3.1 Water-soluble polymers purchased from different suppliers along with molecular weight
and hydrolyzation (%)................................................................................................................... 46
Table 3.2 Composition of films produced .................................................................................... 48
Table 3.3 Tensile response of TOCNF films with 10wt% addition of water-soluble polymers .. 52
Table 3.4 Tension properties of c-TOCNF and PVA and PEOX nanocomposites ...................... 57
Table 3.5 Mechanical properties of neat CNFs and water-soluble polymers (PVA and PEOX) . 67
Table 4.1 Epoxy formulations. Ratios respective to epoxy resin. ................................................ 76
Table 4.2 Lap shear results on different TOCNF and TOCNF + PVA composites and adhesion
promoters. ..................................................................................................................................... 92
Table 4.3 UTS properties of Neat TOCNF and TOCNF + PVA films. TOCNF + PVA + APTES
films are assumed to have the same UTS as TOCNF + PVA layers. Adhesion – Cohesive strength
ratio for different TOCNF configurations. Adhesion measured in relation to Epoxy A. ............. 93

7
LIST OF FIGURES
Figure 2.1 Schematics of TOCNF/epoxy laminate fabrication and final laminate....................... 19
Figure 2.2 Side view of a 1.5mm thick TOCNF-epoxy laminate, formed by adhering sixty 20um
thick TOCNF films ....................................................................................................................... 24
Figure 2.3 Visible transmittance via UV-Vis spectroscopy of TOCNFs, epoxy, TOCNF-epoxy
laminates and silica glass normalized by the thickness. Thickness was normalized using the epoxy
thickness as reference (0.8mm)..................................................................................................... 25
Figure 2.4 Photographs show the transparency of TOCNF films (left) and a 10-layer TOCNF-
epoxy laminate (right) ................................................................................................................... 25
Figure 2.5 Representative plots of TOCNFs, epoxy, and three 10-layer TOCNF- epoxy laminates,
with 20µm TOCNF layer thickness and varying volume fractions of epoxy (44vol%, 27 vol%, 9
vol%) ............................................................................................................................................. 27
Figure 2.6 Theoretical prediction of the Young’s Modulus of TOCNF-epoxy laminates with the
Reuss model (iso-stress) and the Voigt model (iso-strain) as function of the volume fraction of
epoxy and TOCNF layer thickness (20 µm, 30 µm, 40µm), with results of Young’s modulus of
laminates obtained from the displacement of the MTS and DIC. Error bars represent 1 standard
deviation ........................................................................................................................................ 29
Figure 2.7 Ultimate tensile strength of 10-layer TOCNF-epoxy laminates, with different volume
fractions of epoxy and different TOCNF layer thicknesses (20µm, 30µm and 40µm). Error bars
represent 1 standard deviation ...................................................................................................... 30
Figure 2.8 Work of failure of 10-layer TOCNF-epoxy laminates, with different volume fractions
of epoxy and different TOCNF layer thicknesses (20µm, 30µm and 40µm). Error bars represent 1
standard deviation ......................................................................................................................... 32
Figure 2.9 Mechanical properties of 10-layer TOCNF-epoxy laminates with different volume
fractions of epoxy and different TOCNF layer thicknesses (20µm, 30µm and 40µm). (a) Bending
modulus, (b) bending strength, and (c) work-of-failure. Error bars represent 1 standard deviation
....................................................................................................................................................... 33
Figure 2.10 Mechanical properties of laminates with the same and different overall thicknesses,
and 7% volume fraction of epoxy. (a) Flexural strength, (b) Bending strength, (c) Work of failure.
Error bars represent 1 standard deviation ..................................................................................... 36
Figure 2.11 Optical micrograph of initial cracks in a 10-layer 20µm thick TOCNF- and 44vol%
epoxy laminate during three-point bending. Crack propagation direction is from bottom of the
image to the top ............................................................................................................................. 39
Figure 2.12 Optical micrograph of 30µm TOCNF/epoxy laminates after three-point bending: (a)
3%, (b) 12%, (c) 16%, (d) 27% and (e) 37% volume fraction of epoxy ...................................... 39
Figure 2.13 Mechanical response and optical micrographs of two 10-layer TOCNF-epoxy
laminates subjected to three-point bending (a) Stress-strain curves of 1 vol% of epoxy, and a 30

8
vol% of epoxy laminate, where the numbers for each plot represent their corresponding WOF. (b)
Micrograph of a 1% volume fraction of epoxy sample. (c) Micrograph of a 30% volume fraction
of epoxy laminate .......................................................................................................................... 41
Figure 2.14 SEM image of polished side surface of a 1% volume fraction of epoxy laminate.
Evidence of internal structural damage inside TOCNF layers after being subjected to three-point
bending .......................................................................................................................................... 42
Figure 3.1 Photograph show the transparency of composite films. (a) TOCNF + 15wt% PVA
composites. (b) TOCNF + 15wt% PEOX composite. (c) TOCNF + 15wt% PVA showing the
glossiness and flexibility of films. ................................................................................................ 51
Figure 3.2 Visible transmittance via UV-Vis spectroscopy of neat TOCNF, TOCNF composites
and silica glass. Thickness was normalized using the silica glass thickness as reference (0.9mm)
....................................................................................................................................................... 52
Figure 3.3 Schematic of TOCNF domains. (a) Neat TOCNF. (b) TOCNF composites. Taken and
modified from 31 ............................................................................................................................ 53
Figure 3.4 Chemical structure for (a) PVA and (b) PEOX ........................................................... 54
Figure 3.5 Representative plots of neat c-TOCNF, PEOX 200, and PVA 146-186 99%H (solid
lines). Additionally, plots of c-TOCNF + 15wt% of PVA 146-86 99%H and c-TOCNF + 15wt%
of PEOX 200 ................................................................................................................................ 55
Figure 3.6 Tensile mechanical properties of c-TOCNF and PVA nanocomposites. (a) Young’s
modulus, (b) Ultimate Tensile Strength and (c) Work to failure .................................................. 56
Figure 3.7 Tension properties of c-TOCNF and PEOX nanocomposites. (a) Young’s modulus, (b)
Ultimate Tensile Strength and (c) Work of failure ....................................................................... 59
Figure 3.8 TEM pictures showing TOCNF fibril morphology. c-TOCNF, scale bar 100 nm (left),
h-TOCNF, scale bar 200nm (right) ............................................................................................... 61
Figure 3.9 Optical picture of mCNF fibril morphology, scale bar 1 mm. .................................... 61
Figure 3.10 Tension properties of h-TOCNF and PVA/PEOX nanocomposites. (a) Young’s
modulus, (b) Ultimate tensile strength and (c) Work to failure .................................................... 62
Figure 3.11 Tension properties of mCNF and PVA/PEOX nanocomposites. (a) Young’s modulus,
(b) Ultimate tensile strength and (c) Work to failure .................................................................... 63
Figure 3.12 Photograph of a mCNF film with 15wt% PVA 146-186 99%H (left), mCNF and 15wt%
PEOX 200 (right) .......................................................................................................................... 63
Figure 3.13 Mechanical response of different CNFs (c-TOCNF, h-TOCNF, mCNF) with different
weight percentages of PVA and PEOX. (a) Young's Modulus, (b) Ultimate tensile strength (MPa)
and (c) Work of failure. ................................................................................................................ 64
Figure 3.14 Representative stress-strain plots of neat and optimized PVA and PEO 200 composite
c-TOCNF, h-TOCNF and mCNF films ........................................................................................ 65

9
Figure 3.15 Schematic of the proposed hydrogen bonding formation between different TOCNF
and PVA. ....................................................................................................................................... 66
Figure 3.16 Zeta potential (mV) measurements of neat c-TOCNF and c-TOCNF composite
solutions were fixed at 0.1wt%. PVA (left) PEOX (right) ........................................................... 69
Figure 3.17 Rheology data for neat TOCNF, neat PVA 146-186 99%H, and neat PEOX 200 shown
as triangular dots and composite fluids in circular dots. All TOCNF specimens are at constant 0.53
wt% TOCNF with any polymer added at 15 wt% to this. ............................................................ 70
Figure 4.1. Picture of a 10-layer TOCNF + PVA + APTES and epoxy A laminate, showing high
transparency and low haziness. ..................................................................................................... 80
Figure 4.2 Visible transmittance via UV-Vis spectroscopy of TOCNF laminates, and borosilicate
glass. Thickness was normalized using the borosilicate glass as reference (0.9mm) ................... 81
Figure 4.3. Flexural properties of 10-layer TOCNF and TOCNF + PVA laminates. (a) Flexural
strength (MPa). (b) bending modulus (GPa) and (c) Work of failure (MJ/m3). The first square
(from smallest to biggest) highlights the influence of stronger TOCNF layers, the second, the
influence of different epoxies, the biggest, highlights the effect of an increased adhesion. Numbers
represent the increase when compared to the reference sample (Neat TOCNF – Epoxy A / red
column), = means no statistical difference between the samples. ................................................ 82
Figure 4.4. SEM images of the fracture behavior of 10 layer TOCNF film laminates. (a) Neat
TOCNF – Epoxy A laminate, red arrows showing interfacial delamination events, (b) TOCNF +
PVA – Epoxy A laminate, arrows showing intralayer damage within the layers......................... 84
Figure 4.5. Glass transition temperature of different epoxy formulations as taken from DMA and
DSC. .............................................................................................................................................. 85
Figure 4.6. Storage modulus of different epoxy formulations as taken from the DMA. .............. 86
Figure 4.7 Molecular structure of 5- Amino 1,3,3-trimethylcyclohexanemethy- amine. Introduced
to formulation B. ........................................................................................................................... 87
Figure 4.8 Molecular structure for hardener O,O’-Bis(2-aminopropyl) polypropylene glycol-
block-polyethylene glycol-block-polypropylene glycol used on formulation C and D. .............. 87
Figure 4.9 SEM images of the fracture behavior of 10 layer TOCNF film laminates with different
epoxy formulations as interlayers. Images are presented in order of stiffness a > b > c > d. (a)
TOCNF + PVA – epoxy B (b) TOCNF + PVA – epoxy A. (c) TOCNF + PVA – epoxy C.(c)
TOCNF + PVA – epoxy D. .......................................................................................................... 89
Figure 4.10 Static contact angle photographs of water droplets in different substrates. (a). TOCNF
+ PVA (b) TOCNF + PVA + APTES ........................................................................................... 91
Figure 4.11 Molecular structure for APTES (3-Aminopropyl)triethoxysilane ............................ 91
Figure 4.12 Schematic of the surface modification achieved of TOCNF with APTES ............... 92
Figure 4.13. Tensile testing of different laminates. Blue and red lines represent the iso-stress rule
of mixtures of TOCNF + PVA – Epoxy A and Neat TOCNF – Epoxy A laminates ................... 94

10
Figure 4.14. Plot shows specific energy to rupture divided by thickness (t) against the specific
strength of various materials, including ABS, LDPE, Cellulose acetate, Acrylic, PS, Aluminum,
Borosilicate Glass, Neat TOCNF and TOCNF + PVA films and 3 different 10 layers TOCNF or
TOCNF + PVA laminates. Blue bubble are ductile polymers (low specific strength but high
specific energy to rupture), purple bubble somewhat brittle materials (low specific strength and
energy to rupture), red bubble indicates high specific strength but low specific energy to rupture.
....................................................................................................................................................... 97

11
ABSTRACT
TEMPO (2,2,6,6-tetramethylpiperidine-1-oxyl) cellulose nanofibrils (TOCNF) are
polysaccharide nanomaterials that are extracted mainly from wood, plants and other biomass
sources. TOCNF suspensions of negatively charged fibrils can be cast to produce totally
transparent films with exceptional mechanical properties. Nevertheless, the inherent brittleness
and the high stresses generated within the films during drying processes, makes the production of
thick materials difficult and reduce the potential usage of TOCNFs films in industrial applications.
Hence, in this study lamination of TOCNF films with room temperature curable epoxy was
used to combat brittleness, increase thickness, and produce a more damage tolerant material. The
effect of the volume fraction and layer thickness of both phases, the number of layers, and the
overall total thickness of the laminate on the tensile and flexural properties were investigated.
Lamination was successful at increasing the toughness and thickness of TOCNF composites,
resulting in an increased work of fracture (WOF) that was associated with fracture retardation by
crack digression. The ultimate tensile strength (UTS) and Young’s modulus were higher for
laminates with low volume fractions of epoxy, and with increasing number of TOCNF layers.
To further increase the mechanical properties of TOCNF materials, water-soluble polymers
were screened as strengthening aids through solution casting. Polyvinyl alcohol (PVA) and poly(2-
ethyl-2-oxazoline) (PEOX) were found as reinforcement agents for various types of cellulose
nanofibrils (CNFs) films. Mechanical property increases of 99% in elastic modulus, 93% in UTS
and 134% WOF were reported for TOCNF with 0.44 mmol/g carboxylate groups and 15 wt.%
PVA. PEOX had a higher elastic modulus increase of 113% over PVA, yet lower UTS and WOF
increases were found at 63% and 28%, respectively. Additionally, increases in UTS and elastic
modulus were also seen in mechanically fibrillated CNF and TOCNFs with higher carboxylate
contents (1.5 mmol/g). The toughening mechanism was attributed to the formation of strong
hydrogen bonding between the CNFs and the hydrophilic polymers added. The presence of such
mechanisms was indirectly confirmed by tensile testing, zeta potential and rheology.
Finally, an enhanced version of TOCNF laminates was fabricated using TOCNF films with
PVA strengthening aid and four different epoxy formulations as interlayer. Flexural testing showed

12
a correlation between the presence of stronger layers in the laminate with a higher flexural strength,
bending modulus, and WOF. Different modes of fracture within the laminates occurred based on
epoxy type. A stiffer epoxy generated a reduced mechanical response and substantial intralayer
damage. On the other hand, a more ductile epoxy increased the WOF of the laminates, inducing a
higher delamination at the interface. The addition of a silane coupling agent (APTES) resulted in
a higher compatibility between the TOCNF and epoxy. In general, laminates with stronger TOCNF
layers (TOCNF + PVA) and increased adhesion (APTES), showed a flexural strength increase of
61%, a bending modulus increment of 80% and the same WOF when compared with the original
laminates. Finally, impact testing of TOCNF materials was performed, the specific energy to
rupture of laminates was comparable to those achieved by acrylic and borosilicate glass, while
maintaining a higher or similar specific strength to glass. Laminates maintained good transparency
and low haziness to the naked eye.

13
INTRODUCTION
1.1 Background and Motivation
Cellulose nanofibers (CNFs) can be harvested from different sources (e.g. trees, plants,
bacteria, algae, and even waste biomass) 1–6. CNFs have high specific surface areas with fibrils
that are composed of both crystalline and amorphous regions and are known for exhibiting high
stiffness and strength while also being inherently sustainable, bio-renewable and, non-toxic 1,7.
Generally, two approaches are used to produced CNFs. The first one requires the fibrillation of
cellulose slurries in a disc refiner or grinder. The resulted material has a white appearance and is
constituted by larger and more aggregated fibrils. CNFs produced by purely mechanical methods
are here called mCNF and have been largely studied in literature. Films produced with mCNF
exhibit a semi-ductile behavior with strain ratios that can reach the 10% and an ultimate tensile
strength (UTS) of 200MPa 1,8,9. A second approach for producing CNFs involves coupling the
mechanical processes with a chemical oxidative process where the catalyst TEMPO (2,2,6,6
tetramethylpiperidine-1-oxyl radical) is used in conjunction with a primary oxidizer (a strong acid)
to covert the primary hydroxyl groups on the surface of the fibrils to carboxylic acids 10–12. The
reaction is usually carried out in water and produces a more stable suspension of fibrils due to a
decrease in the fibril-fibril interactions (i.e. increase dispersion). The resulted suspension of
TEMPO CNF is better known in literature as TOCNF and it has been extensively used in the
production of highly transparent films with excellent mechanical properties. Neat TOCNF and
high percentage TOCNF composite films have been reported with an elastic modulus of up to 20
GPa and UTS of up to 300 MPa while sustaining a more brittle fracture than their counterpart
(mCNF) 1,9,10,13–15.
Even when TOCNF films exhibit promising mechanical properties (high strength and
stiffness) other characteristics like their brittleness and the inability to make thick materials out of
them have limited their applicability 13. The films are usually produced by casting TOCNF
suspensions (usually less than 2wt% TOCNF) followed by the removal of water. During this
procedure, the media is removed either by evaporation or filtration, causing high shrinkage stresses
within the film. The conjunction of both the inheriting brittleness of TOCNF and the high stresses
in the films leads to the fracture of thick films, limiting the thickness of films and high percentage

14
TOCNF composites to values around the 20-100um 9,16,17. A possible solution to some of the
scalability problems of TOCNF was first proposed by Liu et al (2014). In his work, a laminated
system of TOCNF and different interlayers was proposed (i.e. polyvinyl butyral and polystyrene-
poly(ethylene/butylenes)-polystyrene (SEBS)), the resulted laminates showed a substantial
increase in the work of failure (WOF) and a slight strength increase when laminated with PVB 18.
The technique used by Liu et al (2014), has been extensively studied. In fact, an
extraordinary example of the advantages of the technique can be found in laminated glass, where
by laying up a brittle material such as glass with a softer interlayer like PVB, an improvement in
toughness without comprising the transparency of glass was achieved 19. Lamination takes
advantage of crack retardation mechanisms to enhance the toughness of materials. In general, the
failure mechanism of laminate structures is linked to the production of new surfaces or cracks
inside the structure that propagate fast causing fracture. When a new surface or crack is produced
inside a laminate it will propagate rapidly, but if the crack finds a weak interface in its way it might
be diverted along the interface direction, retarding fracture. Also, when this diversion occurs, new
interfaces are created making even more difficult for a crack to propagate, magnifying the overall
toughness 20–22.
1.2 Research Objectives
The goal of this work is to further study lamination as a possible solution to make
mechanically tougher and thicker TOCNF materials. With that intention in mind the following
specific objectives have been proposed:
• Study how the volume fraction, the layer thickness of both phases, the number of layers,
and the overall total thickness of the laminate impact the final mechanical properties of the
laminate. Relate mechanical properties of the laminates to possible mechanisms of fracture
retardation at play.
• Improve TOCNF films to reduce their brittleness and enhance the mechanical properties
of the films. Investigate different water-soluble polymers and their role in possible
enhancing mechanisms.
• Investigate the role of stronger TOCNF layers, softer and stiffer interlayers and an
increased adhesion at the interface in the final properties of the laminates. Study impact

15
properties of neat TOCNF films and high percentage TOCNF composite films along with
TOCNF laminates.
1.3 Overview of this Work
In this work laminates made of TOCNF and epoxy are studied with the goal of cutting out
some of the roadblocks that impede the proper commercialization of TOCNF materials due to their
lack of thickness and excessive brittleness. Chapter 1 describes the lamination of TOCNF layers
with a room temperature curable epoxy. The effect of the volume fraction and layer thickness of
both layers, the number of layers and overall thickness of the laminate on the tensile and bending
properties are investigated. Crack digression along the weak interfaces is studied as one of the
primary mechanisms for fracture retardation in the laminates. Chapter 2 describes the screening of
several water-soluble polymers as reinforcing agents for CNF films. The polymers were added in
small concentrations (from 5 wt% to 20 wt%) and polyvinyl alcohol (PVA) and poly(2-ethyl-2-
oxazoline) (PEOX) were found as reinforcement agents for cellulose nanofibrils (CNFs) films.
The mechanical increases are described for different types of CNF and the toughening mechanisms
attributed to the formation of strong hydrogen bonding between the CNFs and the hydrophilic
polymers added is investigated and indirectly confirmed by tensile testing, zeta potential and
rheology. Chapter 3 introduces the reinforced TOCNF layers described in Chapter 2 to the lay-up
systems describe in Chapter 1. Additionally, four different epoxy formulations are studied as
interlayers for the laminates. Additionally, a silane coupling agent (APTES) is added to increase
the adhesion at the interface between the reinforced TOCNF layers and the epoxy interlayers.
Mechanical properties are studied for the different laminate configurations and related to different
modes of fracture within the laminates. Finally, the specific energy to rupture of laminates and
neat TOCNF layers is measured and compared to other materials like borosilicate glass and acrylic.

16
TRANSPARENT TEMPO OXIDIZED CELLULOSE NANOFIBRIL
(TOCNF) COMPOSITES WITH INCREASED TOUGHNESS AND
THICKNESS BY LAMINATION
All lab-work in this chapter was performed by Endrina Forti. All analysis was performed by
Endrina Forti with guidance by Dr. Jeffrey Youngblood. All writing was performed by Endrina
Forti with guidance and editing by Dr. Robert Moon, Dr. Gregory Schueneman and Dr. Jeffrey
Youngblood.
The following chapter contains content reproduced with permission from Forti, E. S., Moon, R. J.,
Schueneman, G. T., & Youngblood, J. P. (2020). Transparent tempo oxidized cellulose nanofibril
(TOCNF) composites with increased toughness and thickness by lamination. Cellulose, 1-17.
2.1 Introduction
Cellulose nanomaterials are attractive due to their renewable and sustainable basis. These
materials are mainly extracted from woody biomass but can be found in multiple organisms as
well. Two well-known categories can be identified: cellulose nanocrystals (CNCs) and cellulose
nanofibers (CNFs). Specifically, CNFs have large specific surface areas with fibrils composed by
both crystalline and amorphous regions. CNFs can be produced either by mechanical grinding or
by chemically aided methods. The latter generally involves the usage of 2,2,6,6-
tetramethylpiperidine-1-oxyl (TEMPO) in conjunction with hypochlorite to convert the primary
hydroxyl groups in the cellulose structure to carboxylic acids and aldehydes groups via catalytic
oxidation. This reaction is carried out in water and the final product consist of negatively charged
fibrils that, due to electrostatic repulsion, form a stable aqueous suspension, allowing further
fibrillation. The fibrils prepared with this method are typically 3-4 nm in width and can be several
microns long depending on the extraction source9,12,15,23 .
Films made of TEMPO-oxidized cellulose nanofibrils (TOCNFs) have excellent
mechanical properties, with Young’s Modulus around 6 to 14GPa, ultimate tensile strength
between 130MPa to 300MPa and strain to failure within 2% and 10% 1,9,10,12,15,23. Although
TOCNF materials exhibit promising mechanical properties, other characteristics such as their
inherent brittleness and the inability to make thick materials have limited their applicability. Neat
TOCNF films are generally produced through solution casting of dilute suspensions (<2wt%),
followed by the removal of water (or another medium). During casting, the dispersion is subjected

17
to evaporation or filtration that cause high shrinkage stresses within the films. The high stresses in
conjunction with the inherent brittleness of TOCNFs lead to fast fracture of thick cast films,
limiting the production of thicker materials. Consequently, neat TOCNF films and high percentage
TOCNF composites with typical thickness around 25-100µm have been reported, values which
are not thick enough for self-supported applications such as transparent protective cases and impact
resistant windows 16,23.
Here, lamination is introduced as a possible solution to make mechanically tougher and
thicker TOCNF composite materials. A simple but reliable lamination technique involves the
lamination of a plastically deformable material to a high strength/brittle one. This combination has
been shown to produce high toughness materials as in the case of safety glass, where a high
toughness material, such as polyvinyl butyral (PVB), is combined with glass to improve its
toughness without compromising its high transparency and stiffness19. Lamination takes advantage
of crack retardation mechanisms to enhance the toughness of materials. Two well-known
mechanisms have been described in literature: crack digression, where cracks are diverted through
a weak interface, and crack blunting, were sharp crack tips are blunted and decrease stress
concentration. Generally, specimens with a higher volume fraction of the ductile phase display
evidence of crack blunting. On the other hand, specimens with lower volume fractions and low
adhesion at the interface presented crack digression as the main toughness mechanism. Hence, the
volume fraction of both phases have a significant effect on the mechanical response of laminates
20,24.
In the present study, lamination was used as a mechanism to increase the toughness, and
thickness of TOCNF composites by laminating it with a more compliant interlayer such as epoxy.
The effect of the volume fraction and layer thickness of both phases (e.g., TOCNFs, epoxy), the
number of total layers, and the overall total thickness of the laminate, on the tensile and flexural
properties are investigated. Finally, analyses of crack stopping mechanisms present in the
laminates are discussed.

18
2.2 Materials and Methods
2.2.1 Materials
A TOCNF suspension 1.1wt% in water produced by USDA Forest-Service-Forest Products
Laboratory (FPL), Madison, WI, USA. (Lot #2018-FPL-CNF-080), was purchased from the
University of Maine 25. The TOCNFs have a carboxylate content of 0.44 mmol/g solids and was
measured following a titration procedure 26. Room temperature cure transparent epoxy EpoxAcast
690™ was bought from Smooth-On, Inc, Macungie, PA, USA to use as an adhesive interlayer for
the laminates. 30.5 x 30.5cm x 1.60mm thick acrylic sheets were bought from McMaster-Carr,
along with fiberglass sheets for tabs and 5-minute Epoxy Gel from Devcon, both needed for the
tensile testing specimens.
2.2.2 Fabrication of samples
TOCNF films
TOCNF suspensions in water were diluted with deionized water to 0.73wt% and cast into
100mm polystyrene Petri dishes as reported in previous studies 1. With the objective of obtaining
TOCNF films with different thicknesses, the following volumes of solutions were cast: 30ml, 45ml
and 70ml. The cast solutions were placed in a humidity chamber with a fixed relative humidity of
50% at room temperature (~21 oC). Films were completely dry after 7 to 15 days with thicknesses
of 20µm, 30µm and 40µm. When dry the TOCNF films were removed from the Petri dish by
cutting the edges of the film and slowly detaching them with the help of tape. The TOCNF films
had high transparency and low haze.
TOCNF - epoxy laminates
The fabrication method for the laminates was based on a standard hand-layup approach
similar to what is used in sheet molding compounds 27. In the first stage of the fabrication process,
a room temperature cure epoxy (EpoxAcast™ 690) was pre-mixed using a planetary centrifugal
mixer (DAC 400.1 FVZ, FlackTek Inc., Landrum, SC, USA). The mixed resin was applied on top
of a TOCNF film using a spatula. Then, a new TOCNF film was placed on top to get a sandwich
structure composed of two TOCNF layers with epoxy resin interlayer. The process was then

19
repeated until the desired number of layers was reached. The assembly process is presented in
Figure 2.1. To control the thickness of the laminates, an acrylic mold with interchangeable spacers
of different thicknesses was used. The spacers controlled the overall laminate thickness.
Additionally, by controlling the number of TOCNF films and their thickness, an average epoxy
weight percentage was estimated. This mold assembly was pressed (Model 3856 Bench Top
Laboratory Manual Press, Carver Inc, IN, USA) at 1 kPa for 5hr, after which laminates were
removed from the mold. Final laminates were visually inspected, showing high transparency and
low haze. Laminates were produced having 6 to 14 TOCNF layers, layer thickness of either 20µm,
30µm, and 40µm and volume fractions of epoxy ranging from 2% to 44%.
Figure 2.1 Schematics of TOCNF/epoxy laminate fabrication and final laminate
2.2.3 Tensile testing
TOCNFs
A laser cutter (Muse Hobby Laser Cutter, Full Spectrum Laser, Las Vegas, NV, USA) was
used to obtain 1:5 scale dogbone-shaped specimens of 1mm width and 6.5mm of gauge length
according to the ASTM D638 Standard Test Method for Tensile Properties of Plastics. Samples
were tested in a dynamic mechanical analyzer (DMA) (Q850 TA instruments New Castle, DE,
USA), with a rate-controlled mode fixed at a 0.1mm/min displacement rate. Specimens had an
average thickness of 30 ± 3µm. Samples were left in a low humidity chamber (15%RH) for three
days at room temperature before testing. A minimum of 5 specimens were tested at room

20
temperature (21°C) and 35%RH. Young’s modulus was determined from the maximum slope of
the stress-strain curve, ultimate tensile strength (UTS) was taken as the highest tensile stress on
the stress-strain curve, while the work-of-failure (WOF) was calculated by integrating the area
under the stress-strain curve.
Epoxy
EpoxAcast 690™ epoxy was cast in 33mm x 33mm square polystyrene Petri dishes.
Mirroring the TOCNF films, dogbone-shaped specimens were cut using the laser cutter according
to ASTM D638. Specimens were then tested in tension in an MTS insight (MTS system Corp,
Eden Prairie, MN, USA) with a 1000N load cell, and a 0.1mm/min displacement rate. At least 5
specimens were tested at room temperature (21°C) and 35%RH. Elastic modulus, UTS and WOF
were calculated from the stress-strain curve as detailed in the previous section.
TOCNF-epoxy laminates
Rectangular specimens (40mm x 4mm) were cut using the laser cutter (PLS6MW MW laser
engraver, Universal Laser Systems, Scottsdale, AZ, USA), for each laminate. Rectangular
fiberglass tabs (4mm wide and 10mm long) were glued to the tensile specimens using structural
epoxy from DEVCO, according to ASTM D3093 Standard Test Method for Tensile Properties
Matrix Composites. Samples were left in a low humidity chamber (15%RH) for three days at room
temperature before testing. Five specimens were tested in the MTS Insight with a 1000N load cell
and tensile grips, at room temperature (21°C) and 35%RH. A strain rate of 0.5mm/min was
selected. Analyses of variance (ANOVA) were conducted to compare results, at a threshold level
of 0.05. Young’s modulus, UTS and WOF were calculated as detailed previously.
2.2.4 Digital Image Correlation (DIC)
The tensile testing via MTS was recorded using a Nikon D3200 camera, with a SWM VR
ED Micro IF 1:1, with a lens diameter of 62mm. Strain was measured by tracking the motion of
natural defect points within the laminates (e.g., dirt or tiny bubbles) during the initial and deformed
stages. Results were analyzed with ImageJ open source software and the MTrackJ plugin. The

21
initial and deformed stages were correlated using the stress values obtained from the MTS. A
minimum of 5 measurements were done for every data point.
2.2.5 Flexural testing
TOCNF-epoxy laminates
Rectangular specimens 40mm long and 4mm wide were cut using the laser cutter. Laminates
were tested with a small 3-point bending fixture in DMA at a 0.1mm/min speed using a rate-
controlled mode at room temperature. A minimum of 5 specimens were tested for each data point.
Analyses of variance (ANOVA) were conducted to compare results, at a threshold level of 0.05.
Young’s modulus, UTS and WOF were measured as detailed previously.
2.2.6 Polarized light microscopy
Side views of polished samples were obtained using a Carl Zeiss (Axio, Observer A1)
inverted microscope in transmission mode. Images were taken between cross polarizers using 5X,
10X and 20X magnification objectives.
2.2.7 Adhesion testing
A lap shear experiment was designed and modified from the ASTM D3164-03(2017)
Standard Test Method for Strength Properties of Adhesively Bonded Plastic Lap-Shear Sandwich
Joints in Shear by Tension Loading. Metal sheets 9.40mm wide, 100mm long and 12mm thick
were used. A 9.40mm wide by 100µm long TOCNF layer was cut using the laser cutter and glued
to the surface of the metal sheets with structural epoxy. A second set of metal sheets with the same
dimensions were covered with EpoxAcast 690™ resin and left to cure. Later, both surfaces were
glued together with EpoxAcast 690™. Once cured, a minimum of 5 specimens were tested in an
MTS with a uniaxial tension configuration, using a strain rate of 1.27mm/min. After confirming
delamination failure, the interfacial shear strength was calculated using the UTS and the
overlapping area of adhesion.
22
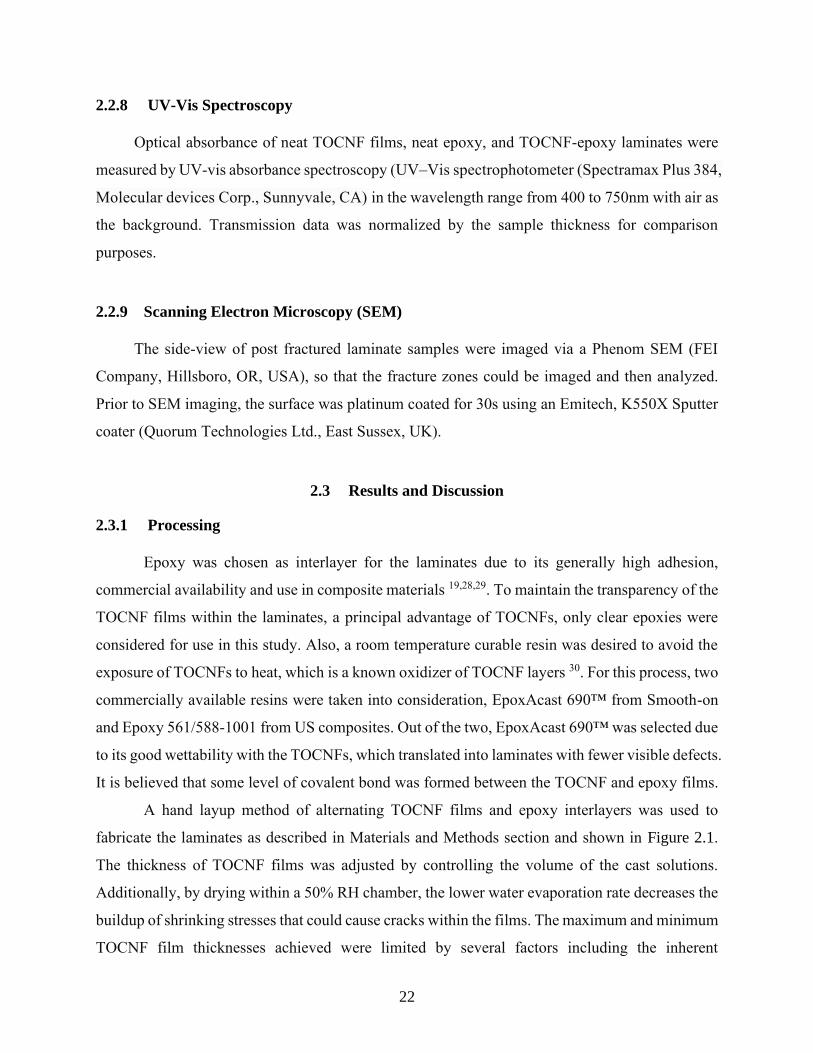
2.2.8 UV-Vis Spectroscopy
Optical absorbance of neat TOCNF films, neat epoxy, and TOCNF-epoxy laminates were
measured by UV-vis absorbance spectroscopy (UV–Vis spectrophotometer (Spectramax Plus 384,
Molecular devices Corp., Sunnyvale, CA) in the wavelength range from 400 to 750nm with air as
the background. Transmission data was normalized by the sample thickness for comparison
purposes.
2.2.9 Scanning Electron Microscopy (SEM)
The side-view of post fractured laminate samples were imaged via a Phenom SEM (FEI
Company, Hillsboro, OR, USA), so that the fracture zones could be imaged and then analyzed.
Prior to SEM imaging, the surface was platinum coated for 30s using an Emitech, K550X Sputter
coater (Quorum Technologies Ltd., East Sussex, UK).
2.3 Results and Discussion
2.3.1 Processing
Epoxy was chosen as interlayer for the laminates due to its generally high adhesion,
commercial availability and use in composite materials 19,28,29. To maintain the transparency of the
TOCNF films within the laminates, a principal advantage of TOCNFs, only clear epoxies were
considered for use in this study. Also, a room temperature curable resin was desired to avoid the
exposure of TOCNFs to heat, which is a known oxidizer of TOCNF layers 30. For this process, two
commercially available resins were taken into consideration, EpoxAcast 690™ from Smooth-on
and Epoxy 561/588-1001 from US composites. Out of the two, EpoxAcast 690™ was selected due
to its good wettability with the TOCNFs, which translated into laminates with fewer visible defects.
It is believed that some level of covalent bond was formed between the TOCNF and epoxy films.
A hand layup method of alternating TOCNF films and epoxy interlayers was used to
fabricate the laminates as described in Materials and Methods section and shown in Figure 2.1.
The thickness of TOCNF films was adjusted by controlling the volume of the cast solutions.
Additionally, by drying within a 50% RH chamber, the lower water evaporation rate decreases the
buildup of shrinking stresses that could cause cracks within the films. The maximum and minimum
TOCNF film thicknesses achieved were limited by several factors including the inherent

23
brittleness of the material, ease of delamination from the Petri dishes and stress build-up during
drying. The thinnest layers that could be produced were 20µm thick, while a maximum thickness
of 40µm was selected to avoid fracture of the films.
The epoxy layer thickness was limited by its low viscosity. After the TOCNF films were
stacked with epoxy as the interlayer and the laminate was compressed, excess epoxy was squeezed
out of the laminate. The percentage of epoxy was lower for laminates with thicker TOCNF layers,
going from 44% to 30% for laminates with a fixed number of TOCNF layers with thicknesses of
20µm and 40µm, respectively.
The laminate thickness is dictated by the thickness and number of TOCNF films used in
its construction, allowing the opportunity to produce thicker TOCNF materials. For demonstration
purposes laminates have been produced up to 1.5mm in thickness, by adhering sixty 20µm thick
TOCNF films or forty-five 30µm thick TOCNF films (Figure 2.2). This laminate thickness is
nearly 15 times larger than values found in literature for films of either neat TOCNFs or high
TOCNF content composites, which are usually around 25-60µm 9,16,23. It should be noted that it is
possible to produce thicker laminates by either increasing the number of layers or the volume
fraction of epoxy, indicating that the laminate thickness is not a limitation for the lay-up process
used in this study.

24
Figure 2.2 Side view of a 1.5mm thick TOCNF-epoxy laminate, formed by adhering sixty 20um
thick TOCNF films
Moreover, lamination of TOCNFs with epoxy was successful at maintaining a high level of
transparency of the TOCNF laminate. Figure 2.3 shows characteristic plots of transmittance
obtained by UV-vis spectroscopy, performed on neat TOCNF films (Figure 2.4, left), neat epoxy,
a 10-layer TOCNF-epoxy laminate (Figure 2.4, right ) and silica glass. The normalized results
showed a similar transmittance of TOCNFs and epoxy, which are both lower by 5% when
compared with silica glass. In general, both TOCNFs and epoxy have high overall transparency.
For laminates the transparency is similar to neat TOCNFs and epoxy at long (red) wavelengths,
however, there is an increasing loss of transparency for decreasing wavelengths, diverging from
TOCNFs/epoxy at orange/yellow and becoming progressively worse through the blue range. A
potential reason for this could be interfacial reflections between layers, destructive interferences,
or some other process that induces yellowing. Regardless, the loss of transparency in the laminates
is not noticeable by the naked eye.

25
Figure 2.3 Visible transmittance via UV-Vis spectroscopy of TOCNFs, epoxy, TOCNF-epoxy
laminates and silica glass normalized by the thickness. Thickness was normalized using the
epoxy thickness as reference (0.8mm).
Figure 2.4 Photographs show the transparency of TOCNF films (left) and a 10-layer TOCNF-
epoxy laminate (right)

26
2.3.2 Tensile Properties
The mechanical properties of laminates were evaluated via uniaxial tensile testing.
Laminates were composed of 10 TOCNF/epoxy layers with volume fractions of epoxy ranging
from 2% to 44%, and different TOCNF layer thicknesses of 20µm, 30µm and, 40µm. Mechanical
properties (Table 2.1) of neat TOCNFs and epoxy films were measured for comparison purposes.
No statistical difference between TOCNF films with different thicknesses of 20µm, 30µm and
40µm were found. Representative stress-strain plots are presented in Figure 2.5. The stress-strain
curve for neat TOCNF films and all laminates produced, showed characteristics of brittle behavior.
In contrast, the neat epoxy curve exhibit plastic deformation, which is representative of a ductile
performance. Young’s Modulus values obtained for TOCNF films are slightly higher than those
found in literature 9,10,15,30,31. It is believed that the TOCNFs used has an inherent higher modulus
or that the extremely slow drying process (over two weeks) leaded to different (e.g. denser)
networks. Regardless, multiple calibrated instruments agree on this data.
Table 2.1 Mechanical properties of neat 30µm TOCNFs and 0.8mm epoxy films. (+ -) range
represent 1 standard deviation
Material Young’s
Modulus (GPa)
Ultimate tensile
strength (MPa)
Strain to
failure (%)
Work of failure
(MJ/m3)
TOCNFs 22 ± 1 135 ± 16 1.0 ± 0.1 0.1 ± 0.4
Epoxy 2.3 ± 0.6 45 ± 1 11 ± 3 2.6 ± 0.7

27
Figure 2.5 Representative plots of TOCNFs, epoxy, and three 10-layer TOCNF- epoxy
laminates, with 20µm TOCNF layer thickness and varying volume fractions of epoxy (44vol%,
27 vol%, 9 vol%)
Young’s modulus:
Theoretical values of the Young’s Modulus of TOCNF-epoxy laminates, EL, were
calculated using the Voigt model (iso-strain) and the Reuss model (iso-stress). Both of these
models assume that every layer is perfectly bonded and Poisson ratios are neglected in the
calculations 18. The differences in the strain rates and used to conduct the tensile testing for both
the TOCNF-epoxy laminates and neat TOCNF and epoxy films were also neglected for the
modulus prediction. The Voigt model or iso-strain model assumes every layer is subjected to the
same amount of deformation and that a perfect load transfer occurs between layers. Equation 1
shows the model’s expression where the Young’s Modulus, E, is linearly related to the volume
fraction, V, of the materials involved. The Voigt model defines the upper theoretical bound of the
Young’s Modulus as the laminate finds its maximum stiffness when a uniaxial stress is applied
parallel to the layers 18.
EL = ECNFVCNF + EEpoxyVEpoxy (1)

28
In contrast, the Reuss model or the iso-stress model, defines the theoretical lower bound
for Young’s modulus as the laminate finds its minimum stiffness when a uniaxial stress is applied
perpendicular to the layers. It assumes every layer is subjected to the same amount of stress,
implying different deformation rates in the components of the laminate if the elastic properties of
those are not the same 18.
1
EL=
VCNF
ECNF+
VEpoxy
EEpoxy (2)
The theoretical values of Young’s modulus from both models were compared against
experimental results (Figure 2.6), in which displacement was measured either from the load cell
of the MTS testing machine, or from DIC. Experimental values measured by load cell
displacement were low and close to the iso-stress model, this is unexpected as the testing and
laminate layer configuration were such that uniaxial strain was applied parallel to the layers, and
thus the results should have been more like the idealized Voigt model configuration. The lower
Young’s Modulus, could be indicative of an inefficient load transfer among the layers, especially
as TOCNF layer thickness increases 32. Alternately, the results may be artificially underreported
due to experimental artifacts such as grip slippage or underestimation of the grip compliance in
the system, both of which would increase the apparent strain in the measurements 33 . Thus, to
eliminate any possible experimental artifact, a new set of strain measurements were taken using
DIC. Young’s Modulus values obtained using DIC were closer to the iso-strain model, confirming
that shear stresses at the interface of the layers were able to transmit the load efficiently to
subsequent layers. This is an important factor since an adequate load transmission is critical for
improving mechanical performance of laminated materials, governing failure modes and the
overall strength of the laminate 34–37. Results obtained also showed that the modulus decreases as
the volume fraction of epoxy increases for all laminates tested.

29
Figure 2.6 Theoretical prediction of the Young’s Modulus of TOCNF-epoxy laminates with the
Reuss model (iso-stress) and the Voigt model (iso-strain) as function of the volume fraction of
epoxy and TOCNF layer thickness (20 µm, 30 µm, 40µm), with results of Young’s modulus of
laminates obtained from the displacement of the MTS and DIC. Error bars represent 1 standard
deviation
Ultimate tensile strength (UTS)
The ultimate tensile strength (UTS) of neat TOCNF films and laminates are shown in
Figure 5 with a line indicating the rule-of mixtures predicted strength. Neat TOCNF films (in the
20-40µm thickness range) had a UTS of ~ 135MPa and has a wide distribution of values.
Laminates with low volume fractions of epoxy (e.g., less than 22 vol %) were similar to those
exhibited by neat TOCNF films, which is an indication of good bonding between layers. As the
volume fraction of epoxy increased, in general, the UTS decreased. This is to be expected because
the UTS of epoxy used in this study is lower than that of TOCNF films (See table 1) and typically
mechanical properties are linearly related to a volume-weighted average of the phases present.
Also, the effect of TOCNF layer thickness in the laminate was not statistically significant in the
UTS properties. However, when compared to the strength predicted by the rule of mixtures of the
components, the strengths achieved by laminates were increased, indicating the presence of
strengthening mechanism in the laminate.

30
Figure 2.7 Ultimate tensile strength of 10-layer TOCNF-epoxy laminates, with different volume
fractions of epoxy and different TOCNF layer thicknesses (20µm, 30µm and 40µm). Error bars
represent 1 standard deviation
The failure of TOCNF laminates is related to the defect size within the TOCNF layers.
Since the TOCNFs are stiffer than the epoxy (see Table 2.1), the load applied to the sample during
tensile testing will result in higher stress in the TOCNF layers. Additionally, since the tensile load
was applied parallel to the layers, the fracture of a single TOCNF layer in the laminate will dictate
the failure of the entire structure. As a crack initiates within the first layer, there is a sudden
reduction of the effective cross-sectional area over which the applied load acts. This increases the
stress fields inside the laminate, decreasing the applied load necessary to propagate a crack and
have it extend through epoxy interlayers and subsequent TOCNF layers, causing catastrophic
fracture of the entire laminate 20,32. This is evident in Figure 2.5, where the laminates show a stress-
strain profile indicative of brittle materials. The nucleation of cracks within brittle materials is
related to the presence of defects or voids, where the stress is amplified 38. Since the defects are
randomly sized and distributed in the TOCNF films, the mechanical response within individual
films was highly varied (wide standard deviation in Figure 2.7 and table 1).

31
While the materials failed in a brittle fashion, the laminates were stronger than expected.
The increased UTS in the laminates is indicative of a strengthening mechanism at play. While it is
unclear what such mechanism is, it is possible that the epoxy layers suppress crack initiation. If
cracks nucleate at the surface of the TOCNF layers, epoxy coating may prevent them from forming.
Alternatively, cracks may initiate but the layering may isolate them and prevent the nucleated
cracks from causing catastrophic failure until enough microcracks and defects have formed.
Regardless, it is clear that lamination is a way to strengthen TOCNF materials.
Work of failure (WOF):
The work of failure (WOF) of neat TOCNF films and laminates are shown in Figure 6.
Neat TOCNF films (in the 20–40µm thickness range) had a WOF of 0.1 MJ/m3 and has a wide
distribution of values. Values of WOF of all laminates were higher than those measured for neat
TOCNF films, but lower than for epoxy (2.7MJ/m3). Additionally, there is a general trend of
increasing WOF as the volume fraction of epoxy in the laminate increases, which may be expected
as the epoxy used in this study has a higher strain to failure and WOF than neat TOCNF films.
When compared to the expected WOF based on a rule-of-mixtures, lamination significantly
increased toughness in these materials, in some cases ending at the same WOF as epoxy, but at
high TOCNF content with the concomitant increase in strength that it entails.

32
Figure 2.8 Work of failure of 10-layer TOCNF-epoxy laminates, with different volume fractions
of epoxy and different TOCNF layer thicknesses (20µm, 30µm and 40µm). Error bars represent
1 standard deviation
The increase in the WOF can be related to the laminate structure, in which the layer
structure is capable of dissipating energy and therefore, increases the work of failure of the
specimens 21,22,39. Additionally, the increase in the epoxy layer thickness (due to the increase in
the volume fraction of epoxy) relates to the increase in the plastic zone that can be formed around
the cracks. The increase in the plastic area directly translated in higher WOF values 40–42. Like the
behavior observed in UTS, WOF is clearly higher than that of the sum of the parts, indicating that
a toughening mechanism is at play. As before, the exact mechanism is unclear, crack digression
may be possible. Due to the catastrophic failure, obtaining clear photographic evidence of this is
difficult, however in laminates this mechanism is common. While crack suppression and isolation
as suspected in the UTS can increase WOF, the increase seen here likely has another mechanism
at play as WOF is increased significantly more than UTS.

33
2.3.3 Flexural Properties
The mechanical properties of laminates were evaluated via three-point bending. Specimens
were prepared from 10-layer TOCNF/epoxy laminates with volume fractions of epoxy ranging
from 2% to 44% and TOCNF layers with different thicknesses (20µm, 30µm, and 40µm). Results
are shown in Figure 2.9.
Figure 2.9 Mechanical properties of 10-layer TOCNF-epoxy laminates with different volume
fractions of epoxy and different TOCNF layer thicknesses (20µm, 30µm and 40µm). (a) Bending
modulus, (b) bending strength, and (c) work-of-failure. Error bars represent 1 standard deviation
In general, all mechanical properties decreased as the volume fraction of epoxy increased.
This trend is expected for bending modulus and bending strength, as it can be assumed that the

34
epoxy has lower flexural strength and stiffness than neat TOCNF films (bending strength 75MPa,
flexural modulus: 2GPa). However, it should be taken into consideration that since all laminates
have 10 TOCNF layers, the increase in epoxy vol% corresponds to an increase in the thickness of
the epoxy layers, which may also influence the flexure properties 43. Finally, there is also a trend
of higher mechanical properties for thinner TOCNF layered laminates, however, this may be
partially influenced by differences in the overall laminate thickness. It is important to notice that
the usage of different TOCNF layer thicknesses to fabricate the laminates is inherently related to
a change in overall laminate thickness for a fixed volume fraction of epoxy and same number of
layers. In other words, two 10-layer laminates with the same volume fraction of epoxy (for
example 10%) and with TOCNF layers that are either 20µm and 40µm thick will result in laminates
having an overall thickness of 0.22mm and 0.45mm, respectively.
Effect of Number of Layers and Total Laminate Thickness
To study the effect of the number of layers and total laminate thickness on flexure properties,
without the influence of changing epoxy vol%, two new sets of laminates were prepared in which
the epoxy vol% was fixed at 7 vol%. A detailed composition of the laminates can be found in
Table 2.2. In the first set, laminates were produced having an overall thickness of 0.25 mm; to
achieve this, thinner TOCNF films were used for laminates with a higher number of layers (e.g.,
40µm layer thickness for 6-layer laminate, 30µm layer thickness for 8-layer laminate, and 20µm
layer thickness for 12-layer laminate). The results of the first set of laminates are presented as blue
triangles in Figure 2.10, and clearly show a decrease in properties as the number of TOCNF layers
increased. This is considered to result from the larger number of TOCNF-epoxy layer interfaces
associated with increasing numbers of TOCNF layers within a laminate. Flexure testing is more
sensitive to the effects of interfaces on the resulting mechanical properties. Since bending
properties decreased with increasing number of interfaces, it can be assumed that the number of
interfaces are a source of weakness within the laminate, leading to lower bending modulus,
bending strength, and WOF 20,32. It should also be noted that there may also be a layer thickness
influence, in which both the TOCNFs and epoxy layers become thinner with increasing number of
layers in the laminate. While it is true that thinner layers may be more compliant in flexure testing
and may limit defect size as compared to thicker layers, there are also strain conditions that affect
thinner layers more than thick ones 44. The flexural properties (both bending modulus and bending

35
strength) of a laminate are a combined reflection of the single constituents’ properties in tensile
and bending. When subjected to a flexural stress, the deformation is related to the applied moment,
and, for a constant curvature, the tensile and compression strains are associated to the distance of
the layers to the neutral axis. For that reason, the strain in laminates varies linearly through the
thickness, meaning that layers above the neutral line experience a compressive strain state, while
layers placed bellow are in tension. If a comparison is made between two laminates of the same
thickness but different layer thickness, thinner layers will need a smaller force to crack than thicker
layers when the curvature of both laminates reaches the same value. This translates into a decrease
in the flexural properties as the layers within the laminate become thinner 45. Nevertheless, it is
more probable that the defects associated with the TOCNF-epoxy interface are significantly larger
and dominate the properties.
Table 2.2 Laminate configuration for investigating the role of laminate thickness on
flexural properties
Different overall laminate thickness
Average volume fraction of
epoxy (%)
TOCNF layer
thickness (µm)
Number of
TOCNF layers
Average total
thickness (mm)
7 ± 2 30
14 0.47 ± 0.02
10 0.340 ± 0.004
6 0.19 ± 0.01
Same overall laminate thickness
Average volume fraction of
epoxy (%)
TOCNF layer
thickness (µm)
Number of
TOCNF layers
Average total
thickness (mm)
7 ± 2
20 12
0.25 ± 0.01 30 8
40 6

36
Figure 2.10 Mechanical properties of laminates with the same and different overall thicknesses,
and 7% volume fraction of epoxy. (a) Flexural strength, (b) Bending strength, (c) Work of
failure. Error bars represent 1 standard deviation
In the second set of new laminates, the TOCNF layer thickness was fixed at 30 µm, and
laminates were produced having 6, 10, and 14 layers, which resulted in overall laminate thickness
of 0.19 mm, 0.34 mm and 0.47 mm, respectively. The results of this second set of laminates are
presented as orange squares, and clearly shows a decrease in properties as the number of TOCNF
layers increase, which also corresponds to increasing laminate thickness. The mechanism for
decreasing properties was likely a result of the increased number of TOCNF-epoxy layer interfaces
as previously demonstrated and discussed. One other aspect that could influence properties was
the overall laminate thickness, in which laminates with more layers were thicker. Flexural damage

37
has been reported to be extensive in thicker laminates 46. For thin laminates, the damage is usually
distributed across all the thickness, while in thicker laminates the damage is centered in the outer
layers (that experience a greater amount of compression or tension). This damage is attributed to
a lower bending stiffness in thin laminates, which results in a greater plasticity and ability to sustain
damage. At the same time, thicker laminates are stiffer than thinner ones which leads to higher
interlaminar stresses, decreasing mechanical properties 46. Nevertheless, the effect of laminate
thickness is likely not a dominant effect over the presence of a greater number of interfaces within
the laminates.
Fracture Behavior of Laminates
Other variables affecting the flexural strength and WOF are associated with fracture events,
more specifically, susceptibility of the brittle layer to cracking, the contribution of interface
cracking and the ease of layer delamination 47. Therefore, it is relevant to understand the
propagation of cracks and their relation to the delamination behavior of laminates. For instance,
when a crack is nucleated, one of the main properties that affect the propagation speed is the
adhesion between the layers that constitute the structure. The general fracture behavior of
homogenous brittle materials shows that, once a crack is created, it will propagate rapidly, straight
through the specimen. However, if the crack finds a weak interface, such as the ones created
between two materials in a laminate, the crack will be diverted along the interface direction,
retarding crack growth. Also, when this diversion occurs, new interfaces are created, impeding the
crack propagation which increases the overall toughness in laminated materials. However,
promoting the crack deflection along interfaces by weakening the interface strength, may
compromise the overall strength of the laminates. In this case, the crack will be able to deflect
itself through the interlayer, but the cohesion of the laminate will be weak, affecting the overall
strength of the structure 20–22.
With the high level of importance of adhesion on the creation of new surfaces within a
laminate, an adhesion coefficient has been developed to provide a criterion at which strength is
not compromised but failure is retarded in laminates. There is an optimal scenario where the bond
is sufficiently strong and capable of dissipating energy but weak enough to cause crack digression.
A study have shown that if the interface adhesion is less than 0.20 times the cohesive strength of

38
the strong face of the interface, then a potentially good crack-stopping mechanism can be achieved
39. For cracks with sharp tips such as the ones found in brittle materials, a ratio of 0.35 of the matrix
strength was predicted for the interface to produce crack deflection, as shown in Equation 3 48;
σif
σmf<
σxx
σyy (3)
Where 𝜎𝑖𝑓 is the interface strength, 𝜎𝑚𝑓 the strength of the bulk material and 𝜎𝑦𝑦 and 𝜎𝑥𝑥
are the normal stress acting on the interface and the stress acting perpendicular to the crack,
respectively 48,49.
The energy criterion for the crack deflection model (Equation 3) was applied to the
TOCNF-laminates. Adhesion results obtained by performing a simple shear lap test of TOCNF-
epoxy interfaces, measured an adhesion value of 4.0 ± 0.3 MPa. Using this value with the strength
of TOCNF film of 135 MPa in Equation 3, a value of 0.03 is obtained, far less than the range of
0.2-0.35 that is desired. This suggest for TOCNF-epoxy laminates that crack digression is likely
the dominant mechanism of crack retardation. One of the most compelling evidence of crack
digression is the finding of signs of delamination as a crack progresses through the structure 28.
For this reason, a 10-layer laminate with 10vol% epoxy was analyzed under a microscope as soon
as the first crack initiated during a three-point bending test, so that crack deflection and crack
delamination could be observed (Figure 2.11). In the same fashion, the fracture morphology of
specimens tested to failure in three-point bending with a different volume fraction of epoxy was
analyzed and are presented in Figure 2.12. It is notable how the fracture is not smooth for any of
the cases, instead, it follows a tortuous path, confirming the presence of crack deflection and
delamination as a toughening mechanism in the laminates.

39
Figure 2.11 Optical micrograph of initial cracks in a 10-layer 20µm thick TOCNF- and 44vol%
epoxy laminate during three-point bending. Crack propagation direction is from bottom of the
image to the top
Figure 2.12 Optical micrograph of 30µm TOCNF/epoxy laminates after three-point bending: (a)
3%, (b) 12%, (c) 16%, (d) 27% and (e) 37% volume fraction of epoxy

40
Another indicative sign of crack digression is found on the mechanical response of
laminates as they bend. To assess how the epoxy interlayer thickness affects crack digression, two
10-layer laminates with 40µm thick TOCNF layers, with either 1 vol % or 30 vol % epoxy were
prepared. Both laminates were subjected to three-point bending. Characteristic stress-strain curves
and microscopy of the samples are presented in Figure 2.13(a). Results show a reduction in the
bending strength for the laminate with a 1 vol% epoxy, however, the WOF was almost doubled.
These findings indicate that less epoxy for an interlayer increased the probability of delamination
and favored crack digression (i.e. the decreased interface adhesion, increases toughness). This is
in agreement with the published literature, where a low interfacial adhesion promotes delamination,
increasing toughness, but decreasing the strength of the structure 19,20,50. The low volume fraction
of epoxy in the laminate may influence the extent of adhesion between the TOCNFs and the epoxy,
it is considered here that it lowers this adhesion. At 1 vol.%, the insufficient epoxy to cover the
whole surface (i.e. epoxy accumulated in depressions on the films that translates into zones with
lower adhesion). The first stress drop detected on the stress-strain curved presented in Figure 2.13
(a) corresponds to the fracture of the first brittle layer. The crack is later arrested at the epoxy
interface of the subsequent layer and a plateau region is then generated in the curve, which
correlates to the plastic deformation of the remaining layers. When the energy required to nucleate
a new crack is achieved, another drop shows in the curve. This behavior corresponds to the fracture
of a new brittle layer, manifested as delamination in the laminate. The type of delamination
observed in laminates with a lower volume fraction of epoxy (Figure 2.13 (b)), does not impart
any damage to subsequent layers ahead of the crack. The creation of new surfaces diverges the
crack across the interface of the delaminated layer and this is the main process that allows a higher
extension of the plateau region in the curve, or in other words, increase the amount of energy the
laminate can sustain before failure 24.

41
Figure 2.13 Mechanical response and optical micrographs of two 10-layer TOCNF-epoxy
laminates subjected to three-point bending (a) Stress-strain curves of 1 vol% of epoxy, and a 30
vol% of epoxy laminate, where the numbers for each plot represent their corresponding WOF.
(b) Micrograph of a 1% volume fraction of epoxy sample. (c) Micrograph of a 30% volume
fraction of epoxy laminate
There is evidence of structural damage in the individual TOCNF layers as illustrated in
Figure 2.13 (b) and Figure 2.14. The damage is presented in the form of a parallel stacking of
fibrils in the heavily packed cellulose structure. The 2D network of TOCNF fibrils have a heavy
intra-laminar interaction, but the inter-laminar interaction is not as strong, which might produce
the nucleation of new surfaces within the individual TOCNF layers and increase the work of failure
in the TOCNF-epoxy laminates 1.

42
Figure 2.14 SEM image of polished side surface of a 1% volume fraction of epoxy laminate.
Evidence of internal structural damage inside TOCNF layers after being subjected to three-point
bending
Compared with the 1 vol% epoxy laminate, the 30vol% epoxy sample has a different
fracture behavior and mechanical response. The stress-strain plot indicates that once a crack was
nucleated, it proceeded across the laminate fracturing several layers, reducing its bending strength.
This is represented in the figure by a big step down to stress values close to zero. Later, there is
another plateau region that correlates to the breakage of the remaining layers of the laminate. As a
consequence of higher surface contact between the TOCNFs and the epoxy, laminates presented a
better strength but a lower probability of diverting a crack, decreasing the WOF of the structure.
All things considered, there is a marked increase in the bending properties as a result of
lamination. The introduction of a thin epoxy interlayer not only facilitates crack digression as a
mechanism to increase toughness, but also creates an important mismatch of elastic properties in
the structure, which results in a good crack stopping mechanism by itself. According to literature,
the addition of thin layers of a soft material with a modulus 5 times lower than the elastic moduli
of the strong layer within the laminate, has a marked impact on the driving force of the crack. In
comparison with a homogenous material, the crack driving force grows with the crack length until
the crack reaches the middle section of a soft layer. At this point, the driving force drops and starts
increasing again. If the drop in the driving force is less than the crack growth resistance, then the
crack will be arrested, and the material will gain toughness 51,52. For TOCNF-epoxy laminates,
this modulus mismatch is well above 5 (e.g., 22/2.3 = 9.6).

43
2.4 Summary
Lamination of TOCNFs with clear epoxy by a wet layup method was used to create laminates
of up to 1.5mm in thickness. The TOCNF laminates were highly transparent, with low haziness
and had good mechanical properties.
Tensile testing of laminates showed that Young’s modulus values fit well with the Voigt
model. Modulus, UTS and WOF trends decrease as the volume fraction of epoxy increased. The
scatter of the values was assumed to be associated with the presence of defects that acted like crack
nucleators. Overall, an increase in the WOF and UTS was achieved and the values obtained were
higher than those calculated by the rule of mixtures for almost all volume fractions of epoxy tested
indicating that lamination strengthened and toughened the composites.
It was notable that flexural strength, bending modulus and flexural WOF of TOCNF-epoxy
laminates decreased with increasing number of TOCNF layers within the laminate. It was
considered that the TOCNF-epoxy interfaces dominated flexural mechanical properties. At the
same time, it was found that laminates with 1 vol% epoxy resulted in a higher flexural WOF, but
lower bending strength. Crack digression along the weak TOCNF-epoxy interfaces is thought to
be the primary mechanism responsible for the increase in the apparent toughness of TOCNF-epoxy
laminates in bending. Overall, lamination was shown to be able to both create thicker materials
and lower the inherent brittleness of TOCNF composites.

44
MECHANICAL ENHANCEMENT OF CELLULOSE NANOFIBRIL
(CNF) FILMS THROUGH THE ADDITION OF WATER-SOLUBLE
POLYMERS
All lab work in this chapter was done by Endrina Forti with the following exceptions: tensile
characterization, analysis and preparation of mCNF films performed by Sami el Awad. Tensile
characterization of TOCNF films was performed by Endrina Forti with the assistance of Xin Ng.
Finally, TEM images and analysis was performed by Whirang Cho and Dr. Douglas Fox. All
writing was performed by Endrina Forti with guidance and editing from Dr. Gregory Schueneman,
Dr. Robert Moon, Dr. Douglas Fox and Dr. Jeffrey Youngblood.
The following chapter contains content reproduced with permission from Forti, E. S., El Awad, S.
M., Ng, X. Y., Cho, W., Schueneman, G. T., Moon, R. J., Fox, D., & Youngblood, J. (2021).
Mechanical Enhancement of Cellulose Nanofibril (CNF) Films Through the Addition of Water-
soluble Polymers. Cellulose (Under Review).
3.1 Introduction
Cellulose nanofibers (CNF) are polysaccharide nanomaterials that can be harvested from
numerous sources including wood, plants, and other biomass 1,7,30. These materials are inherently
sustainable, bio-renewable and non-toxic. Additionally, their uniform widths, high crystallinity,
and large aspect ratios make them attractive reinforcing materials. Two approaches are generally
used to isolate CNFs. The first one requires fibrillation of cellulosic slurries in a disc refiner or
high-pressure homogenizer. The extracted CNF, sometimes called cellulose microfibrils (CMF),
has a white appearance and is constituted by larger and more aggregated fibrils. Here we will refer
to this as mCNF for mechanical CNF to distinguish this from the broader classification of CNF.
Generally, mCNF films exhibit a semi-ductile behavior with strain ratios that can reach the 10%
mark and UTS values around 200MPa 1,8,9. A chemically oxidative process can also be employed
to isolate CNFs products which involve the use of oxidants such as 2,2,6,6 tetramethylpiperidine-
1-oxyl radical (TEMPO) to produce a more stable suspension of fibrils (i.e., increased dispersion)
and facilitate fibrillation. TEMPO-oxidized cellulose nanofibrils or TOCNFs are constituted by 2-
3nm wide fibrils with reduced adhesion between them, generating transparent films with
outstanding mechanical properties. TOCNF films have been reported with an elastic modulus of
up to 20GPa and ultimate tensile strength (UTS) of up to 300MPa while sustaining a more brittle
behavior than mCNF 1,9–13,15,30.

45
An important application of both types of CNFs has been found in their use as reinforcing
agents in biodegradable polymers. The strategy often generates films or fibers with improved
mechanical performance (> 30%) and environmentally friendliness 53–60. Although the reported
literature has been successful at processing more biofriendly nanocomposites, there is a lack of
literature concerning the development of nanocomposites with higher CNF content (>20 wt.%).
For instance, Kurihara et al. (2015) used poly(acrylamide) (PAM) to produce transparent films
with higher mechanical properties when the polymer was added in the 10-25wt% range into
TOCNF. Another example can be found in the work performed by Hakalahti et al. (2015) whereby
adding polyvinyl alcohol (PVA) to TOCNF solutions, they produced films that were stable in wet
conditions. However, a robust study of other polymers has yet to be investigated for reinforcement
in high CNF content nanocomposites 31,61.
To address this knowledge gap, we utilized solution casting as a simple yet reliable method
to process nanocomposite films of CNF containing small concentrations (5 to 20 wt.%) of a variety
of water-soluble polymers to investigate whether they can act as mechanical property enhancing
additives. The addition of PVA and poly(2-ethyl-2-oxazoline) (PEOX) generated remarkable
improvements in the UTS and Young’s modulus of TOCNF films while maintaining their
transparency. Therefore, special attention was dedicated to assessing the effects of varying the
molecular weight, hydrolysis degree and concentration of these polymers in the TOCNF
mechanical properties. To elucidate the nature of the polymer interactions, zeta potential, and
capillary rheology analysis were performed. Finally, to prove the efficacy of the method with
different CNF types, the same concentrations of PVA and PEOX were added to mCNF solutions,
where a significant increase in the mechanical properties and similar trends were observed. The
outstanding mechanical increases achieved open a wide window for potential application of these
films in future light-weighted and high-performance renewable materials.
3.2 Materials and Methods
3.2.1 Materials
Two different TOCNF suspensions produced by USDA Forest-Service-Forest Products
Laboratory (FPL), Madison, WI, USA and purchased from the University of Maine were used.
TOCNF (lot #2019-FPL-CNF-139) was prepared using sodium chlorite at pH 7 with a carboxylic

46
content of 0.44mmol/g 11. TOCNF (lot #2018-FPL-CNF-129) was prepared using the sodium
hypochlorite method at pH 10 and had a carboxylic content of 1.5mmol/g 12. Both materials will
be denominated c-TOCNF and h-TOCNF respectively to avoid confusion during the discussion.
Additionally, a mCNF slurry with a solid concentration of 3 wt.% was also purchased from the
same vendor (lot CNF, Batch #103). Additionally, several water-soluble polymers were obtained
from different vendors and can be seen in Table 1.
Table 3.1 Water-soluble polymers purchased from different suppliers along with molecular
weight and hydrolyzation (%)
Polymer Abbreviation Manufacturer Lot number
(#)
Molecular
weight
(g/mol)
Hydrolyzation
(%)
Poly(vinyl
alcohol)
PVA 85-124
99%H
Sigma-
Aldrich MKBS2768V
85,000-
124,000 99
Poly(vinyl
alcohol)
PVA 146-
186 99%H
Sigma-
Aldrich MKCC7856
146,000-
186,000 99
Poly(vinyl
alcohol)
PVA 146-
186 87-
89%H
Sigma-
Aldrich MKBX9187V
146,000-
186,000 87-89
Poly(2-ethyl-2-
oxazoline) PEOX 50
Sigma-
Aldrich 04629JJ 50,000 -
Poly(2-ethyl-2-
oxazoline) PEOX 200
Sigma-
Aldrich MKCC1604 200,000 -
Poly(2-ethyl-2-
oxazoline) PEOX 500
Sigma-
Aldrich MKBX0709V 500,000 -
Poly(acrylamid
e-co-acrylic
acid)
PAMA Sigma-
Aldrich 02312LE 5,000,000 -
Poly(2-
hydroxymethyl
methacrylate)
PHEMA Sigma-
Aldrich 12801TC 300,000 -
Methyl 2-
hydroxyethyl
cellulose
MHEC Sigma-
Aldrich MKBX7592V 130 -
Poly(ethylene
oxide) PEO
Sigma-
Aldrich 05010KH 1,000,000 -
Polyvinylpyrro
lidone PVP
Fluka
Analytical BCBF3274V 360,000 -

47
3.2.2 Fabrication of nanocomposite films
TOCNF suspensions in water were diluted with deionized water to 0.53wt%. Water-soluble
polymers were added in concentrations ranging from 5-20 wt.% (dry weight relative to TOCNF).
The mix was stirred at different temperatures to promote the dissolution of the polymers in water.
The solutions were later cast into 90 mm polystyrene Petri dishes as reported in previous studies
1. To obtain films with approximately the same thicknesses, 50 ml of the solution was cast. The
cast solutions were placed in a humidity chamber with a fixed relative humidity of 50% at room
temperature (~21 °C). Films were completely dry after 7 days with an average thickness of 30 µm
± 2. After drying, the films were removed from the Petri dish by cutting the edges of the film with
a razor blade and slowly detaching them with the help of tape.
In the case of mCNF films, water-soluble polymers were first diluted in deionized water with
mild heating (90 °C) and mechanical stirring. Once dissolved, the polymeric solutions were added
to a 3 wt.% mCNF suspension in water and mixed using a planetary centrifugal mixer (DAC 400.1
FVZ, FlackTek Inc., Landrum, SC, USA) at 2500rpm for a total time of 2 minutes. The mixture
was then cast into 90 mm Petri dishes and dried in a fixed relative humidity of 50% at room
temperature (~21 °C). The films were completely dry after 7 days and were detached with the help
of tape and scissors. Table 3.2 shows a detailed composition of the samples prepared for mCNF,
c-TOCNF, and h-TOCNF.

48
Table 3.2 Composition of films produced
Polymer Weight
percentage (%)
Matrix Water-soluble polymer 5 10 15 20
c-TOCNF
PVA 85-124 99%H ✓ ✓ ✓ ✓
PVA 146-186 99%H ✓ ✓ ✓ ✓
PVA 146-186 87-
89%H ✓ ✓ ✓ ✓
PEOX 50 ✓ ✓ ✓ -
PEOX 200 ✓ ✓ ✓ -
PEOX 500 ✓ ✓ ✓ -
PAMA - ✓ - -
PHEMA - ✓ - -
MHEC - ✓ - -
PEO - ✓ - -
PVP - ✓ - -
h-TOCNF PVA 146-186 99%H ✓ ✓ ✓ - PEOX 200 ✓ ✓ ✓ -
mCNF PVA 146-186 99%H - ✓ ✓ - PEOX 200 - ✓ ✓ -
3.2.3 Tensile testing
A laser cutter (Muse Hobby Laser Cutter, Full Spectrum Laser, Las Vegas, NV, USA) was
used to obtain 1:5 scale dogbone-shaped specimens of ~0.8mm width and ~6.5mm of gauge length
according to the ASTM D638 Standard Test Method for Tensile Properties of Plastics. Samples
were tested in a dynamic mechanical analyzer (DMA) (Q850 TA instruments New Castle, DE,
USA), using the rate-controlled stress ramp mode fixed at a 1 N/min displacement rate. TOCNF
specimens had an average thickness of 40 ± 3 µm while mCNF specimens had an average thickness
of 74 ± 5 µm. Samples were conditioned in a low humidity chamber (25% RH) for three days at
room temperature before testing. A minimum of 5 specimens were tested at room temperature (24
°C) and 35% RH. Young’s modulus was determined from the maximum slope of the stress-strain
curve, ultimate tensile strength (UTS) was taken as the highest tensile stress on the stress-strain
curve, while the work-of-failure (WOF) was calculated by integrating the area under the stress-
strain curve. Analyses of variance (ANOVA) were conducted to compare results, at a threshold
level of 0.05.

49
3.2.4 Transmission Electron Microscopy (TEM)
A 0.0005 – 0.001 wt% TOCNF solution was dropped onto a Formvar/Carbon or silicon
monoxide coated 200 mesh Cu grid. After 4 min, the excess liquid was wicked using an ashless
Whatman filter paper. The grids were then stained with 2 % uranyl acetate ethanolic solution for
4 min and dried before imaging. Transmission electron microscopy (TEM) images were taken
using a JEOL JEM-2100 Plus with an accelerating voltage at 200 kV. Images were taken at
x50,000 magnification with a resolution of 0.255 nm/pixel. The image size was calibrated using a
calibration diffraction grating replica. Fiber widths were measured using a custom ImageJ macro62.
3.2.5 Zeta potential
Solutions (Table 3.2) were diluted to 0.1wt% solids using deionized water. At least 5
measurements of each sample were obtained using a Zetasizer Nano Series (Malvern Instruments,
MA, USA) in z-potential mode at room temperature (24°C). Analyses of variance (ANOVA) were
conducted to compare results, at a threshold level of 0.05.
3.2.6 UV-Vis Spectroscopy
Optical absorbance was measured by UV-Vis spectroscopy (UV–Vis spectrophotometer
Spectramax Plus 384, Molecular devices Corp., Sunnyvale, CA) in the wavelength range from 400
to 750nm with air as the background. Transmission data was normalized by the sample thickness
for comparison purposes.
3.2.7 Rheometry
The shear rheological behavior of solutions was analyzed using a Bohlin Gemini HR nano
Rheometer (Malvern Instruments, MA, USA) with a 40 mm serrated parallel plate configuration
with a 1 mm gap to avoid wall depletion effects. An ABS vapor-trap device with a wet sponge was
used to minimize moisture loss of the samples during testing 63. A pre shear of 1000 s-1 was applied
to all the samples for 30 seconds. The experiment was set to run a shear stress ramp of 40
logarithmic increment steps from a min shear rate of 0.1 s-1 to 500 s-1. All tests were run at room
temperature (25 °C).

50
3.3 Results and Discussion
3.3.1 Processing
Water-soluble polymers were chosen due to their ease of dispersion in water CNF solutions,
leading to maximized interactions between fibrils and polymeric chains. Solution casting was
chosen as it is a simple and reliable method to process CNF films with high dispersion. In the case
of TOCNFs, the solutions were diluted and easily mixed using a stirrer plate and low temperatures.
In all cases, the temperature was kept below 90 °C for less than two hours to achieve the total
dissolution of the polymers in the TOCNF solution. All films were left to dry inside a humidity
chamber with a controlled relative humidity of 50% and detached after 7 days for further inspection.
Self-standing composite films produced were flat, highly transparent with no appreciated haziness
and smooth surfaces (Figure 3.1). Furthermore, films were glossy and flexible as shown in Figure
3.1 (c). Characteristic plots of transmittance obtained by UV-Vis is shown in Figure 3.2. Overall,
both the TOCNF and composite films showed a small decrease in transparency when compared
with silica glass. The normalized transmittance shows a 10% lower transmittance of neat TOCNF
films in the blue range when compared with silica glass. The difference is reduced at long (red)
wavelengths reaching a difference of less than 2% at the 700nm wavelength. TOCNF + PVA
composites’ behavior showed a similar trend to neat TOCNF, with a slight decrease in
transparency through all the regions. In contrast, PEOX composites showed a better transmittance
than neat TOCNF in the blue regions, maintaining transparency throughout the spectrum. While
TOCNF has been known to have a slight yellow/brown color explaining the small loss in
transparency that is magnified in the blue region, it is not clear why composites differ as both PVA
and PEOX have extremely high transparency in this region. However, differences may be related
to small variations in dispersion of the TOCNF upon adding the polymers. Regardless, the loss of
transparency is not noticeable to the naked eye.

51
Figure 3.1 Photograph show the transparency of composite films. (a) TOCNF + 15wt% PVA
composites. (b) TOCNF + 15wt% PEOX composite. (c) TOCNF + 15wt% PVA showing the
glossiness and flexibility of films.
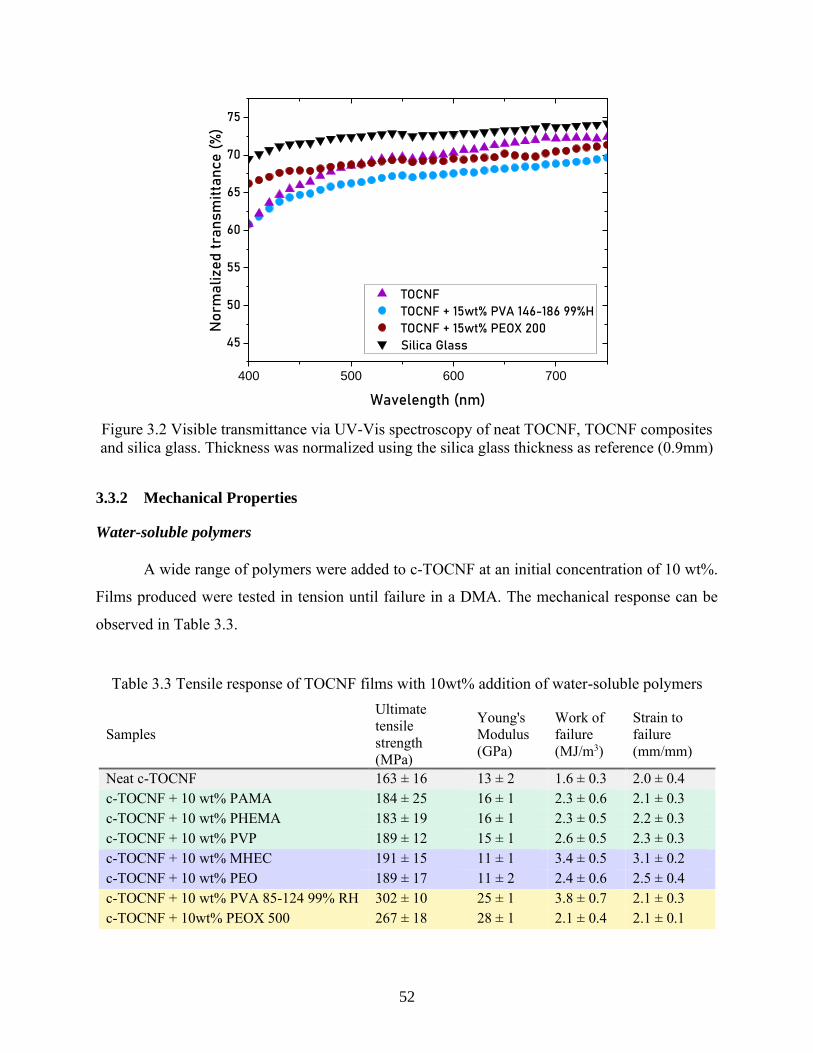
52
Figure 3.2 Visible transmittance via UV-Vis spectroscopy of neat TOCNF, TOCNF composites
and silica glass. Thickness was normalized using the silica glass thickness as reference (0.9mm)
3.3.2 Mechanical Properties
Water-soluble polymers
A wide range of polymers were added to c-TOCNF at an initial concentration of 10 wt%.
Films produced were tested in tension until failure in a DMA. The mechanical response can be
observed in Table 3.3.
Table 3.3 Tensile response of TOCNF films with 10wt% addition of water-soluble polymers
Samples
Ultimate
tensile
strength
(MPa)
Young's
Modulus
(GPa)
Work of
failure
(MJ/m3)
Strain to
failure
(mm/mm)
Neat c-TOCNF 163 ± 16 13 ± 2 1.6 ± 0.3 2.0 ± 0.4
c-TOCNF + 10 wt% PAMA 184 ± 25 16 ± 1 2.3 ± 0.6 2.1 ± 0.3
c-TOCNF + 10 wt% PHEMA 183 ± 19 16 ± 1 2.3 ± 0.5 2.2 ± 0.3
c-TOCNF + 10 wt% PVP 189 ± 12 15 ± 1 2.6 ± 0.5 2.3 ± 0.3
c-TOCNF + 10 wt% MHEC 191 ± 15 11 ± 1 3.4 ± 0.5 3.1 ± 0.2
c-TOCNF + 10 wt% PEO 189 ± 17 11 ± 2 2.4 ± 0.6 2.5 ± 0.4
c-TOCNF + 10 wt% PVA 85-124 99% RH 302 ± 10 25 ± 1 3.8 ± 0.7 2.1 ± 0.3
c-TOCNF + 10wt% PEOX 500 267 ± 18 28 ± 1 2.1 ± 0.4 2.1 ± 0.1
400 500 600 700
45
50
55
60
65
70
75
TOCNF
TOCNF + 15wt% PVA 146-186 99%H
TOCNF + 15wt% PEOX 200
Silica Glass
No
rmali
zed
tra
nsm
itta
nce (
%)
Wavelength (nm)

53
Most of the water-soluble composite films achieved increased mechanical properties when
compared with neat c-TOCNF films. The increment in some of the properties constitutes in itself
an indirect indication of the binding capabilities of water-soluble polymers with TOCNF fibrils.
In fact, such an increase has previously been reported in literature. In the work performed by
Kurihara et al. (2015) poly(acrylamide) (PAM) was mixed into TOCNF solutions, achieving a
mechanical increase in the films when added in the compositions ranging from 10 to 25wt%. The
effect was attributed to the filling or covering of the boundary of the TOCNF domains by PAM 31.
An explanation for this reinforcement was schematized by Kurihara et al (2015) based in previous
findings reported by Saito et al. (2011). According to the authors, TOCNF in solution forms
randomly distributed elements with self-aligned and nematic-ordered structures inside small
domains or clusters. Once dry, TOCNF films exhibit an oriented strand board (OSB) structure as
can be seen in Figure 3.3 (a). When polymers such as PAM are added in small concentrations, they
aggregate in the boundary regions of the domains (Figure 3.3(b)). This aggregation serves as a
bridge between domains, increasing the mechanical properties of the material. If the concentration
of polymer keeps increasing and surpasses a critical value, TOCNF fibrils do not form self-aligned
elements, and instead, get distributed in a polymeric matrix, decreasing the mechanical properties
of the films 14,31.
Figure 3.3 Schematic of TOCNF domains. (a) Neat TOCNF. (b) TOCNF composites. Taken and
modified from 31
In this study, PAMA, a polymer with a similar structure was studied. Nevertheless, the
mechanical increases achieved by the inclusion of the polymer were not substantial when
compared with values reported by Kurihara et al (2015). Similarly, other polymers exhibited
similar mechanical increases, such is the case of PHEMA and PVP, two water-soluble polymers
(a) (b)

54
that are usually used in the biomedical industry. Other water-soluble polymers tested, and
highlighted in blue in Table 3.3, showed an increased UTS and WOF while the elastic modulus
remained within the range of neat c-TOCNF. Such was the case of PEO and MHEC. The hydrogen
bonding formation of both polymers is well described in the literature 64,65. Nevertheless, the small
increases in UTS and WOF seem to indicate that those interactions may not be responsible for the
increased toughness of the films.
Out of all water-soluble polymers tested, PVA 85-124 99%H and PEOX 500 presented
exceptional mechanical increases in the films. Tensile testing results indicated an increase of 85%
and 63% respectively for UTS. Young’s modulus was enhanced by 92% in the case of PVA and
115% with the addition of PEOX. Finally, the WOF of the films showed more than 100% increase,
while retaining the same strain to failure when compared to neat c-TOCNF films. Therefore,
special attention was given to the interaction between CNF and these polymers.
c-TOCNF + PVA and PEOX
PVA is one of the highest volume semicrystalline, nontoxic, water-soluble polymers
produced in the world 53. PVA is used in a wide range of applications like adhesives, packaging
materials, films and medical products 54. Many applications of PVA takes advantage of the
hydroxyl groups in its chemical structure (Figure 3.4(a)), that are responsible for the binding
interactions of PVA with a high number of polymers. Usually, the degree of solubility and some
physical properties of PVA can be controlled by varying the molecular weight and degree of
hydrolysis of the PVA 66. Likewise, PEOX is a low cytotoxicity polymer with good light stability
and re-solubility. The PEOX structure contains a substituted amide group (Figure 3.4 (b)), that
polymerizes by cationic ring-opening polymerization 67. PEOX is suspected to form hydrogen-
bonded complexes with polymers containing proton donating groups 68.
Figure 3.4 Chemical structure for (a) PVA and (b) PEOX
(a) (b)

55
To further understand the mechanical increase achieved by the addition of PVA and PEOX
to the c-TOCNF matrix, two different PVAs were selected with different molecular weights and
hydrolysis degrees. In like manner, two molecular weighs for PEOX were selected. Further
information about the specific molecular weight and hydrolysis of the PVAs and PEOX can be
found in Table 3.1 on the materials and methods section. Overall, the tensile stress-strain behavior
of these six different polymers were studied in a wide range of compositions ranging from 0 to 20
wt% in TOCNF. Figure 3.5 shows characteristic curves for the neat c-TOCNF, PVA and PEOX.
Overall, PVA showed a higher elongation (>50%), in which case the polymer can yield and
plastically deform until failure. Contrarily, PEOX behaved in a brittle manner, failing before
reaching the yield point. To simplify this discussion, and due to the different mechanical behavior
of both polymers, TOCNF – PVA and TOCNF - PEOX nanocomposites response will be discussed
separately in the following sections.
Figure 3.5 Representative plots of neat c-TOCNF, PEOX 200, and PVA 146-186 99%H (solid
lines). Additionally, plots of c-TOCNF + 15wt% of PVA 146-86 99%H and c-TOCNF + 15wt%
of PEOX 200
0 2 46 480
50
100
150
200
250
300
350
Str
ess (
Mpa)
Strain (%)
Neat c-TOCNF
Neat PEOX 200
Neat PVA 146-186 99%H
c-TOCNF + 15wt% PEOX 200
c-TOCNF + PVA 146-186 99%H

56
c-TOCNFs + PVA nanocomposites
The response of the nanocomposite films containing PVA at different concentrations can
be seen in Figure 3.6 and in Table 3.4. All trends showed a significant statistical difference
according to the variance analysis performed. All the properties measured showed a marked
plateau at 15 wt% that continue through 20 wt%. At concentrations higher than 20 wt%, a further
decrease of the mechanical properties of the films can be expected, and therefore, higher
concentrations of polymer were not considered in this study.
Figure 3.6 Tensile mechanical properties of c-TOCNF and PVA nanocomposites. (a) Young’s
modulus, (b) Ultimate Tensile Strength and (c) Work to failure
0 5 10 15 200
5
10
15
20
25
30
Yo
un
g's
mo
du
lus (
GP
a)
Weight percentage relative to TOCNF (wt%)
PVA 146-186 87-89%H
PVA 146-186 99%H
PVA 85-124 99%H
0 5 10 15 20
150
200
250
300
350
PVA 146-186 87-89%H
PVA 146-186 99%H
PVA 85-124 99%H
Ult
imate
ten
sil
e s
tren
gth
(M
Pa)
Weight percentage relative to TOCNF (wt%)
0 5 10 15 200
1
2
3
4
5
Wo
rk t
o f
ail
ure
(M
J/m
3)
Weight percentage relative to TOCNF (wt%)
PVA 146-186 87-89%H
PVA 146-186 99%H
PVA 85-124 99%H
(a) (b)
(c)

57
Table 3.4 Tension properties of c-TOCNF and PVA and PEOX nanocomposites
Young's Modulus (GPa)
Polymer Weight percentage relative to TOCNF (wt%)
0 5 10 15 20
Chlorite TOCNF 13 ± 2 - - - -
PVA 146-186 87-89%H - 15 ± 2 15 ± 1 22 ± 2 24 ± 2
PVA 146-186 99%H - 24 ± 1 21 ± 3 26 ± 1 25.8 ± 0.9
PVA 85-124 99%H - 23 ± 2 25 ± 1 26 ± 2 26 ± 2
PEOX 500 - 22 ± 3 25 ± 3 25 ± 2 -
PEOX 200 - 27 ± 2 28 ± 1 28 ± 3 -
PEOX 50 - 21 + 4 25 ± 1 25 ± 2 -
UTS (MPa)
Chlorite TOCNF 163 ± 16 - - - -
PVA 146-186 87-89%H - 183 ± 9 189 ± 12 241 ± 10 231 ± 5
PVA 146-186 99%H - 258 ± 10 229 ± 23 313 ± 13 310 ± 10
PVA 85-124 99%H - 273 ± 13 302 ± 10 296 ± 21 293 ± 18
PEOX 500 - 260 ± 32 267 ± 18 274 ± 18 -
PEOX 200 - 260 ± 15 261 ± 16 267 ± 22 -
PEOX 50 - 210 ± 11 201 ± 8 221 ± 19 -
WOF (MJ/m3)
Chlorite TOCNF 1.6 ± 0.3 - - - -
PVA 146-186 87-89%H - 2.2 ± 0.4 2.6 ± 0.5 3.1 ± 0.5 1.6 ± 0.3
PVA 146-186 99%H - 2.7 ± 0.1 2.1 ± 0.7 3.7 ± 0.3 3.5 ± 0.3
PVA 85-124 99%H - 3.2 ± 0.4 3.8 ± 0.7 3.3 ± 0.3 3.6 ± 0.8
PEOX 500 - 2.5 ± 0.6 2.8 ± 0.3 2.5 ± 0.6 -
PEOX 200 - 2.3 ± 0.3 2.1 ± 0.4 2.0 ± 0.6 -
PEOX 50 - 1.6 ± 0.3 1.1 ± 0.2 2.0 ± 0.6 -
Young’s modulus response can be seen in Figure 3.6 (a). The hydrolysis degree of PVA
has a marked effect on the mechanical properties reported. For instance, nanocomposite films with
higher molecular weight (Mw): 146,000–186,000 but lower hydrolysis 87-88 %H, had lower elastic
modulus in comparison with the same Mw, but higher hydrolysis 99%H, specially at higher
fractions of PVA. This is expected since the tensile modulus of PVA tends to increase as the degree
of hydrolysis increases. A good explanation for this behavior derives from the higher number of
hydroxyl groups present in the chain, creating a higher amount of strong hydrogen bonds 66. It can
be assumed then, that increasing the number of hydroxyl groups in the molecule could translate

58
into a higher number of interactions between c-TOCNFs and PVA, leading to a stiffer material. In
the case of the elastic modulus, a higher molecular weight did not make a substantial difference.
Figure 3.6 (b) shows results of UTS, where some variability on the results can be seen and
it is attributed to the brittle behavior of TOCNF films, where defects are randomly sized and
distributed in the matrix. The presence of defects in the films produces an amplification of the
stress, leading to failure 13. In the same manner discussed before, there is a marked increase in the
mechanical properties related to the hydrolysis of the polymers, which could relate to the presence
of a higher number of hydrogen bonds. An interesting behavior can be observed where a higher
molecular weight gives a higher UTS. It can be assumed then that the larger number H-bonding
groups found in a longer chain could increase the total interaction between polymer and fibrils,
reinforcing the material 69.
There is also an apparent increase in the WOF (toughness) of nanocomposite films by the
addition of PVA (Figure 3.6 (c)). This is expected behavior due to the UTS increase in the films.
For materials that fail in a brittle fashion, strength and toughness tend to correlate as a higher peak
stress simply increases area under the curve at a constant strain to failure. The toughness increase
was indistinguishable between the different PVA contents. Overall, the addition of pseudoplastic
polymers increased the ability of the films to stretch without failing prematurely, reinforcing the
films and increasing their stiffness in the elastic region. Increases achieved at 15 wt% loading were
higher for the PVA 146-186 99% H with increments of 93% of the UTS, 99% of Young's modulus,
and 137% of the WOF. Strong hydrogen bond formation in the nanocomposite films is suspected
to have a large influence on the mechanical increase obtained and will be discussed in further
sections of this chapter.
c-TOCNFs + PEOX nanocomposites
In the same fashion, the tensile response of nanocomposite films with PEOX is shown in Figure
3.7 and in Table 3.4. In contrast with PVA nanocomposites, the mechanical response seems to start
a plateau after the addition of 5wt%. After the plateau region, the mechanical response could be
expected to decrease. Therefore, compositions higher than 15wt% were not tested.

59
Figure 3.7 Tension properties of c-TOCNF and PEOX nanocomposites. (a) Young’s modulus,
(b) Ultimate Tensile Strength and (c) Work of failure
Similar to the addition of the PVA, the addition of PEOX generated a notable increase in
the mechanical properties of c-TOCNF. Interestingly, while the brittle response of PEOX is
drastically different from the ductile response of PVA (Figure 3.5), both polymers seem to
reinforce c-TOCNF nanocomposites in a similar manner. As shown in Figure 3.7 (a) the elastic
response of nanocomposites increased rapidly after 5wt% loading, reaching a peak at 5wt% and
surpassing the values obtained by the addition of PVA (30GPa in comparison to 26GPa). Addition
of PEOX 200 delivered higher modulus than the PEOX 500 and PEOX 50, while the last two
showed a no significant difference as dictated by the ANOVA test performed. The reason for this
behavior is currently unknown.
In comparison with the UTS response obtained by the addition of 15 wt% PVA 146-186
99%H (314 ± 13 MPa), the addition of PEOXs generated a slightly lower strength as shown in
0 5 10 150
5
10
15
20
25
30
Yo
un
g's
mo
du
lus (
GP
a)
Weight percentage relative to TOCNF (wt%)
PEOX 500
PEOX 200
PEOX 50
0 5 10 15
150
200
250
300
PEOX 500
PEOX 200
PEOX 50
Ult
imate
ten
sil
e s
tren
gth
(M
Pa)
Weight percentage relative to TOCNF (wt%)
0 5 10 150
1
2
3
Wo
rk o
f fa
ilu
re (
MJ/m
3)
Weight percentage relative to TOCNF (wt%)
PEOX 500
PEOX 200
PEOX 50
(a) (b)
(c)

60
Figure 3.7 (b). In this case, the differences in strength of PEOX 500 and PEOX 200 were not
significantly different from each other, while the addition of PEOX 50 generated at much smaller
UTS for all weight percentages tested. While there are many possible reasons for the
underperformance of PEOX 50, it is important to note that tensile properties of neat PEOX 50
could not be performed due to the brittle behavior of the samples as they failed prematurely before
testing. Hence a simple rule-of-mixtures approach would indicate that PEOX 50 would have a
lower strength.
Finally, WOF results can be observed in Figure 3.7(c). While no statistical difference could
be observed between points of the same PEOX, there were differences between the different PEOX
molecular weights. It seems that even when the mechanical response of neat PEOX is brittle, the
addition of the polymer generates a small increase in the WOF response as expected from the
increased UTS.
CNFs response to the addition of PVA and PEOX
To determine if the large mechanical property enhancement was conserved across CNF
type, PVA 146-186 99%H and PEOX 200 was studied with different types of CNF. Two different
TOCNF (h-TOCNF and c-TOCNF) and a purely mechanical CNF (mCNF) were used and
nanocomposite films with different concentrations of the polymers were fabricated and tested in a
DMA under tension.
The c-TOCNF, which was utilized previously in this work until now, was first developed
by Saito et al. (2007). In their studies, they introduced catalytic oxidation of CNF with TEMPO
and sodium chlorite at neutral conditions (pH 7) with the resulting fibrils having an average width
of 5 nm and at least 2 µm in length. Overall, an oxidation of 1.5mmol/g was achieved, which
correlates to the oxidation of 15% of the primary hydroxyl group in the cellulose and with no
aldehyde groups present 11. Different from c-TOCNF, h-TOCNF was developed and the first study
in a work done by Saito et al. (2009), where instead of using sodium chlorite, the method involved
the usage of sodium hypochlorite under basic conditions (pH 10), which usually generates a higher
amount of carboxylate groups in the TOCNF, achieving values of 0.78mmol/g 12. In this study,
morphological information of the TOCNF fibrils was obtained via TEM (Figure 3.8). An average

61
value of (10.1 ± 5.6) nm was measured for c-TOCNF fibrils, while h-TOCNF had an average
thickness of (13.3 ± 4.6) nm. Overall, no statistical difference was found between the widths of
the different fibrils. Hence, the main difference between the TOCNFs studied here relies in the
number of carboxylate groups present in the cellulose structure with h-TOCNF having a high value
(1.5 mmol/g) and c-TOCNF having a lower value (0.44 mmol/g). A third CNF that was purely
mechanically derived, containing little to no carboxylate was also included in the study. mCNF is
directly derived from the high-speed fibrillation of cellulosic slurries. It is composed of larger and
more aggregated fibrils, as a consequence of strong hydrogen bonds between fibrils (Figure 3.9).
Figure 3.8 TEM pictures showing TOCNF fibril morphology. c-TOCNF, scale bar 100 nm (left),
h-TOCNF, scale bar 200nm (right)
Figure 3.9 Optical picture of mCNF fibril morphology, scale bar 1 mm.
(b) (a)

62
For each type of CNF, different weigh percentages ranging from 0 to 15wt% of polymer
were added to determine the optimal concentration needed to maximize mechanical properties. In
the case of c-TOCNF, the optimal concentration was found approximately 15wt%, while for h-
TOCNF was 10wt%. Plots of tensile properties for h-TOCNF can be found in Figure 3.10. For
mCNF, both pictures of the mCNF nanocomposites and their mechanical properties in tension can
be found in Figure 3.11 and Figure 3.12 respectively. According to the data gathered, 10wt% was
selected as the optimal concentration at which mechanical properties were higher for the mCNF
nanocomposites. Figure 3.13 shows a comparison between the best-performing films (i.e. optimal
concentration for each CNF) along with the percentage increase achieved when compared to the
neat CNF films. Figure 3.14 shows characteristic plots for the neat polymers along with the
increased mechanical properties for the films.
Figure 3.10 Tension properties of h-TOCNF and PVA/PEOX nanocomposites. (a) Young’s
modulus, (b) Ultimate tensile strength and (c) Work to failure
0 2 4 6 8 10 12 14 1616
18
20
22
24
26
28
30
32
34
Yo
un
g's
mo
du
lus (
GP
a)
Weight percentage relative to TOCNF (wt%)
PVA 146-186 99%H
PEOX 200
0 2 4 6 8 10 12 14 16120
140
160
180
200
220
240
260
280
300
320U
ltim
ate
ten
sil
e s
tren
gth
(M
Pa)
Weight percentage relative to TOCNF (wt%)
PVA 146-186 99%H
PEOX 200
0 2 4 6 8 10 12 14 160.5
1.0
1.5
2.0
2.5
3.0 PVA 146-186 99%H
PEOX 200
Wo
rk o
f fa
ilu
re (
MJ/m
3)
Weight percentage relative to TOCNF (wt%)
(a) (b)
(c)

63
Figure 3.11 Tension properties of mCNF and PVA/PEOX nanocomposites. (a) Young’s
modulus, (b) Ultimate tensile strength and (c) Work to failure
Figure 3.12 Photograph of a mCNF film with 15wt% PVA 146-186 99%H (left), mCNF and
15wt% PEOX 200 (right)
0 5 10 15
10
15
20
PVA 146-186 99%H
PEOX 200
Young's
modulu
s (
GP
a)
Weight percentage relative to TOCNF (wt%)
0 5 10 15
130
140
150
160
170
180
190
200
210 PVA 146-186 99%H
PEOX 200
Ultim
ate
tensile
str
ength
(M
Pa)
Weight percentage relative to TOCNF (wt%)
0 5 10 150.0
0.5
1.0
1.5
2.0
2.5
3.0
3.5
PVA 146-186 99%H
PEOX 200
Work
of fa
ilure
(M
J/m
3)
Weight percentage relative to TOCNF (wt%)
(a) (b)
(c)

64
Figure 3.13 Mechanical response of different CNFs (c-TOCNF, h-TOCNF, mCNF) with
different weight percentages of PVA and PEOX. (a) Young's Modulus, (b) Ultimate tensile
strength (MPa) and (c) Work of failure.
Neat PVA PEOX Neat PVA PEOX Neat PVA PEOX
0wt% 15wt% 0wt% 10wt% 0wt% 10wt%
c-TOCNF h-TOCNF mCNF
0
10
20
30
40
Yo
un
g's
mo
du
lus (
GP
a)
Neat CNFs
PVA 146-186 99% H
PEOX 200
99%
113%
1%
48%
63% 68%
Neat PVA PEOX Neat PVA PEOX Neat PVA PEOX
0wt% 15wt% 0wt% 10wt% 0wt% 10wt%
c-TOCNF h-TOCNF mCNF
0
100
200
300
400
Ult
ima t
en
sil
e s
tren
gth
(M
Pa)
Neat CNFs
PVA 146-186 99% H
PEOX 200
64%
93%
93%
50%
35%22%
Neat PVA PEOX Neat PVA PEOX Neat PVA PEOX
0wt% 15wt% 0wt% 10wt% 0wt% 10wt%
c-TOCNF h-TOCNF mCNF
0
1
2
3
4
Wo
rk o
f fa
ilu
re (
MJ/m
3)
Neat CNFs
PVA 146-186 99% H
PEOX 200
134%
28% -9%
-34%
165%
176%
(a) (b)
(c)

65
Figure 3.14 Representative stress-strain plots of neat and optimized PVA and PEO 200
composite c-TOCNF, h-TOCNF and mCNF films
As can be seen in Figure 3.13, mechanical reinforcement was achieved for all the CNFs.
Although there were some distinctive differences between them. The most significant were that
the greatest percentage increase was obtained by the addition of 15wt% of water-soluble polymers
(Either PVA 146-186 99%H or PEOX 200) to c-TOCNF and the mCNF had lowest mechanical
properties.
It is important to highlight that the introduction of carboxylate groups in the nanofibrils
surface has a big impact on the stability and mechanical properties of the films produced. In the
work done by Saito et al. (2009), by decreasing the number of carboxylate groups, a higher UTS
was achieved (312 MPa instead of 222 MPa) while maintaining the same Young’s modulus 12.
According to the same author, the presence of carboxylate groups plays a role in the
individualization of fibrils while producing stable dispersions (high electrostatic repulsions) 11. In
this work, the neat mechanical properties of c-TOCNF and h-TOCNF can be found in Table 3.5.
0.0 0.5 1.0 1.5 2.0 2.5 3.00
50
100
150
200
250
300
350
Str
ess (
Mp
a)
Strain (%)
Neat c-TOCNF
c-TOCNF + 15wt% PVA 146-186 99%H
c-TOCNF + 15wt% PEOX 200
0.0 0.5 1.0 1.5 2.0 2.5 3.00
50
100
150
200
250
300
350
Str
ess (
Mp
a)
Strain (%)
Neat h-TOCNF
h-TOCNF + 15wt% PVA 146-186 99%H
h-TOCNF + 15wt% PEOX 200
0.0 0.5 1.0 1.5 2.0 2.5 3.00
50
100
150
200
250
300
350
Str
ess (
Mp
a)
Strain (%)
Neat mCNF
mCNF + 10wt% PVA 146-186 99%H
mCNF + 10wt% PEOX 200

66
Overall, the mechanical performance of c-TOCNF (carboxylate content 0.44 mmol/g) was higher
for UTS but lower for Young’s modulus when compared with neat h-TOCNF films (carboxylate
content 1.5mmol/g). When polymer reinforcement was added, a larger mechanical reinforcement
was achieved for c-TOCNF composites than for h-TOCNF. While the exact mechanism of
reinforcement remains unknown, the authors consider that some interactions can be established
between TOCNFs and PVA/ PEOX and that such relationships can be related to the carboxylate
content of the TOCNF materials used. In general, by decreasing the number of carboxylate groups
on the surface (i.e. c-TOCNF – 0.44mmol/g) more hydroxyl groups in the fibril are available and
ready to interact with molecules in the PVA/ PEOX forming hydrogen bonding interactions
(Figure 3.15) that can potentially increase the mechanical response of films. In contrast, a higher
carboxylic content (i.e. h-TOCNF 1.5mmol/g) would reduce the potential binding sites, resulting
in a smaller percentual increase in the tensile properties.
Figure 3.15 Schematic of the proposed hydrogen bonding formation between different TOCNF
and PVA.

67
Table 3.5 Mechanical properties of neat CNFs and water-soluble polymers (PVA and PEOX)
Polymer UTS (MPa) Young's Modulus (GPa) WOF (MJ/m3)
c-TOCNF 163 ± 16 13 ± 2 1.6 ± 0.3
h-TOCNF 151 ± 11 20 ± 1 0.9 ± 0.2
mCNF 145 ± 14 12 ± 2 1.7 ± 0.9
PVA 85-124 99%H 76 ± 10 4.3 ± 0.6 32 ± 10
PVA 146-186 99%H 81 ± 10 6.0 ± 0.5 32 ± 10
PVA 146-186 87-89%H 66 ± 27 6.1 ± 0.3 5.9 ± 1.9
PEOX 50 - - -
PEOX 200 44 ± 4 3.7 ± 0.4 3.5 ± 0.6
PEOX 500 42.6 ± 0.7 3.5 ± 0.2 3.6 ± 0.1
Following the same logic, mCNFs that have a more branched and an inherently
agglomerated morphology did not see the same level of increase when compared to TOCNFs. The
agglomerated and branched networks allow for lower fibril-to-polymer interactions and lower
overall properties as well as the non-transparency of the nanocomposite when compared to
TOCNFs. That said, there was still an increase in Young’s modulus by 63% and 68% with the
addition of PVA 146-186 99%H and PEOX 200 respectively (Figure 3.13a) when compared to the
neat mCNF. Additionally, the UTS increased by 35% and 22% with the addition of PVA 146-186
99%H and PEOX 200 respectively (Figure 3.13b). Due to the large standard deviation seen for
neat mCNF films, it seems that there was no change in the WOF when PVA 146-186 99%H was
added, yet there appears to be a decrease when PEOX 200 was added. The plausible decrease in
WOF could originate from the fact that PEOX made the relatively flexible mCNF structure brittle.
Interestingly, a higher percentage (15wt%) of the polymer was needed to reach the highest
properties for c-TOCNF when compared with other CNFs (10wt%). Likely, the additional number
of hydroxyl groups on the c-TOCNF surface required an extra amount of polymer to fully bond
(i.e. more hydrogen bonds equal better mechanical properties).

68
3.3.3 Zeta potential
Because direct chemical analysis such as FT-IR proved too difficult due to the overlapping
of some of the most important peaks, zeta potential (and rheology measurement) was performed
to determine any interactions of PVA and PEOX with the CNFs via colloidal stability. Processes
such as adsorption can alter the charge state and stability of nanoparticles in solution, thereby
indicating whether polymers are attached 70. The zeta potential of neat c-TOCNF and PVA/PEOX
nanocomposites can be seen in Figure 3.16. All trends showed a statistically different behavior
according to the analysis of variance performed. Neat c-TOCNF was chosen as a reference point
due to the high mechanical property increase achieved. In the plots, neat c-TOCNF shows a
negative value of zeta potential, a clear indicator of the negative electrostatic repulsion achieved
by the presence of carboxylic groups on the CNF’s surface 11,12,71. The addition of different PVAs
at different concentrations generated less negative zeta potential values of the solutions even at
low PVA content (5%) and tailing upwards (less negative) at high content. The response obtained
for c-TOCNF plus PEOX nanocomposites is also shown in Figure 3.16 (right). The trends,
although different, likewise show a significantly less negative charge at modest polymer addition
(5%). However, at higher concentrations of PEOX, a peak in the trend forms, and the zeta potential
becomes more negative with further addition of polymer.
The observed reduction in negative charge correlates with a significant shielding effect of
the PVA and PEOX on the electronegative surface of fibrils. It is the assumption of the authors,
that this indicates adsorption of polymer onto the CNF, even at low contents (5%), which suggests
that this interaction may be important for mechanical reinforcement. While there is a reduction of
electrostatic repulsion by the addition of PVA and PEOX that could translate into a higher
aggregation of fibrils, the amount is small so is unlikely to be deleterious to mechanical properties.
However, adsorption of polymer may allow drying to higher degrees before drying induced
aggregation takes place due to steric effects stabilizing the fibrils, thus increasing density and/or
decreasing defect size. Alternatively, the polymers may be bridging CNF fibrils leading to
reinforcement, or some combination of these factors. Regardless, it is likely that the interaction
indicated by zeta potential is in some way leading to the increased mechanical properties.

69
Figure 3.16 Zeta potential (mV) measurements of neat c-TOCNF and c-TOCNF composite
solutions were fixed at 0.1wt%. PVA (left) PEOX (right)
3.3.4 Rheology
Rheology was also performed to elucidate clues to the fibril-polymer chain interactions.
Figure 3.17 compares TOCNF suspensions held at a constant TOCNF concentration of 0.53wt%
(to match initial concentration of casting solutions) with and without an extra 15wt% polymer
added. c-TOCNF was again chosen due to the higher mechanical increase achieved by the
incorporation of water-soluble polymers. Logically, when polymer is added to TOCNF solution,
if each material is acting independently, then the composite fluid would have a higher viscosity
than pure TOCNF. However, if a strong screening interaction occurs, fibrillar interaction in the
fluid decreases, and the viscosity may be lower. Hence this is a method to determine if any
interactions between polymer and TOCNF are having an effect on polymer chain motion, as
opposed to simply happening. Pure polymer solutions for comparison are given to help identify
transitions, although concentrations were 5 wt% and 15 wt% for PVA 146-186 99% H and PEOX
200, respectively to keep the viscosity in scale.
0 5 10 15 20
-56
-54
-52
-50
-48
-46
-44
-42
-40
-38
-36
PVA 146-186 87-89%H
PVA 146-186 99%H
PVA 85-124 99%H
Zeta
pote
ntia
l (m
V)
PVA weight percentage (wt%)
0 2 4 6 8 10 12 14 16
-56
-54
-52
-50
-48
-46
-44
-42
PEOX 500
PEOX 200
PEOX 50
Zeta
pote
ntial (m
V)
PEOX weight percentage (wt%)

70
Figure 3.17 Rheology data for neat TOCNF, neat PVA 146-186 99%H, and neat PEOX 200
shown as triangular dots and composite fluids in circular dots. All TOCNF specimens are at
constant 0.53 wt% TOCNF with any polymer added at 15 wt% to this.
The resultant curve for neat TOCNF (Figure 3.17 purple triangles) shows characteristics of
shear-thinning behavior, as observed in other TOCNF suspensions 72–75. In the work performed
by Lundahl et al (2018) polarized imaging confirmed that the shear behavior at rates <100 s-1 are
caused by wall depletion, whereas at higher shear rates (i.e. >100s-1) alignment of the fibrils takes
place, lowering the viscosity of the solutions 76. Figure 3.17 (blue triangles) depicts the rheological
behavior of a neat PVA solution with a 5wt% solids concentration. As mentioned before, PVA is
known to form intra an inter chain hydrogen bonding, an effect that increases with the increment
in the degree of hydrolysis. Strong PVA-PVA interactions in water, are a plausible explanation for
the high viscosity and shear thinning behavior of the solution as describe elsewhere 77. PEOX
characteristic behavior is shown in Figure 3.17 (red triangles). While the structure is known to
participate in the formation of hydrogen bonds with other polymers 67,68, literature concerning
rheological properties is scarce. The plot shown highlights a marked decrease in the viscosity of
the solution when shear is applied at small rates, potentially related to the destruction of PEOX-
water structures. Interestedly, at higher shear rates >1 s-1, all structures are destroyed, and the
solution becomes Newtonian.
0.1 1 10 100 10000.01
0.1
1
Neat TOCNF
Neat PVA 146-186 99%H
Neat PEOX 200
TOCNF + 15wt% PVA 146-186
TOCNF + 15wt% PEOX 200
Vis
co
sit
y (P
a.s
)
Shear Rate (1/s)

71
In the case of TOCNF where PVA/PEOX was added, the same characteristic shear thinning
behavior as neat TOCNF was seen. This behavior is expected since TOCNF fibrils have high
surface areas and are present in higher concentrations, which allow for strong fibril interactions
(hydrogen bonds, entanglements), governing the rheological properties of the solutions. This is
confirmed by the behavior of the neat TOCNF and the composite solutions at high shear rates,
where all the curves tended to the same viscosity values, which confirms the governing behavior
of TOCNF over the presence of small amounts of water-soluble polymers 76. Most importantly,
the viscosity decreases when small concentrations of PVA were added to the TOCNF solutions at
low shear rates as shown in Figure 3.17 (blue dots). This is a clear indication of the TOCNF-PVA
interactions in water. It is widely accepted in the literature that the interaction between TOCNF
fibrils in suspension facilitates the creation of network structures by the creation of hydrogen bonds
between fibrils 78. The decreased viscosity achieved by the introduction of PVA also seems to
indicate a reduced fibril-fibril interaction due to enhanced dispersion, giving an indirect indication
of possible hydrogen bonding formation between fibrils and PVA that translates into a reduced
viscosity explained by the reduction of fibril structures, allowing a better flow under shear and a
decreased viscosity for shear rates <100s-1. Practically, this lowered viscosity would allow a higher
concentration before the gel-point during drying and reduced residual stress in the films, along
with likely, smaller aggregates upon drying.”.
The case of TOCNF + PEOX is shown in Figure 3.17 (red dots), where there is an increased
viscosity measured for all ranges of shear until 100s-1 where all trends unify and show similar
values of viscosity. While this may indicate less or no interaction between TOCNF and polymer
at this concentration, the likelihood of a higher number of interactions happening at higher
concentrations (i.e. when films are drying) is still possible. Regardless, as both PVA and PEOX
show uniquely high mechanical property increases and similar zeta potential changes, it is likely
that some sort of interaction occurs, even if not rheologically determinable.
3.4 Summary
A wide range of water-soluble polymers were evaluated to enhance the mechanical
properties of CNF. The two best performing candidates, PVA and PEOX, were selected for further
testing due to the mechanical property increase achieved by the addition of 10wt% to a TOCNF

72
matrix. Different concentrations (up to 20wt%) of such polymers in combination with different
molecular weighs and hydrolysis degrees were tested. Higher molecular weight generally led to
increased properties, although hydrolysis level was the dominant factor in PVA, with higher
hydrolysis leading to increased properties. Due to the observed improvement in the mechanical
performance of TOCNFs, other CNFs were tested with the two best performing polymers, PVA
146-186 99% H and PEOX 200. An increase of 113% in the modulus, 93% in the UTS, and 134%
in the WOF were achieved by c-TOCNFs; 48% in modulus, 93% in UTS, and 98% in WOF for h-
TOCNF; and 68% in modulus, 35% in UTS, and a decrease in WOF due to embrittlement in mCNF
were observed. Overall, PVA seemed to perform better than PEOX.
The increased mechanical response was attributed to the creation of hydrogen bonds
between the CNF fibrils and the hydrophilic polymers added. Zeta potential and rheometry were
used as an indirect verification of the creation of such bonds. Zeta potential showed an increase in
charge (less negative) for both PVA and PEOX and rheometry showed a decrease in viscosity of
TOCNF solution when a small amount of PVA is added indicating that polymer adsorption and
screening is likely happening. Overall, the work showed that adding a small amount of polymer
can successfully increase mechanical properties across different types of CNF, thereby providing
a method to tune properties of this interesting class of materials.

73
OPTIMIZED MECHANICAL AND IMPACT PERFORMANCE OF
HIGH STRENGTH TEMPO OXIDIZED CELLULOSE NANOFIBRIL
(TOCNF)-EPOXY LAMINATES
All lab work in this chapter was done by Endrina Forti with the following exception: DSC
characterization and analysis performed by Daniela Betancourt. All writing was performed by
Endrina Forti with guidance and editing from Dr. Gregory Schueneman, Dr. Robert Moon, and Dr.
Jeffrey Youngblood.
4.1 Introduction
TEMPO (2,2,6,6-tetramethylpiperidine-1-oxyl)-oxidized cellulose nanofibrils (TOCNF)
are polysaccharide nanomaterials that are extracted mainly from wood, plants and other biomass
sources 1,7,30. These materials have attracted attention due to their sustainable and bio-renewable
nature and are usually produced by chemically aided methods, where the catalyst TEMPO is used
in conjunction with a primary oxidizer (usually hypochlorite or chlorite) to covert the primary
hydroxyl groups on the surface of the fibrils to carboxylic acids. The reaction, which is usually
carry out in water, helps loosen the bonds between cellulose such that mechanical action can
produce a suspension of negatively charged fibrils that are several microns long and around 2-3
nm wide. Neat TOCNF suspensions and high percentage TOCNF mixtures can be cast to produce
totally transparent films with exceptional mechanical properties, with Young’s modulus up to 20
GPa and ultimate tensile strength (UTS) of around 300 MPa 1,7,9,10,12,13,30,79. Even when films show
high strength and stiffness, their brittleness and the high residual stresses generated within the
films during drying, makes the production of thick materials difficult and reduce the potential for
industrial applications 13.
In a previous publication, a potential solution to TOCNF scalability problems was
introduced. Layup structures of TOCNF were prepared with improved mechanical properties both
in bending and tension, creating thicker TOCNF materials while decreasing the inherent brittleness
of TOCNF. The effect of the volume fraction of epoxy and layer thickness on such structures was
determined. In summary, the highest mechanical properties were found when the volume fraction
of the strong layer (TOCNF) was maximized around the 90% volume fraction, minimizing the
presence of the epoxy interlayer to a 10% volume fraction. More importantly, crack digression

74
was found to be an active mechanism of fracture retardation, increasing the toughness of some of
the laminates. Even so, it was found that a weak interface adhesion led to substantial delamination,
translating in a decrease of mechanical properties when the number of layers was increased 13. The
research helped clear a path to the creation of stronger and tougher TOCNF laminates. It was
demonstrated that by increasing the ratio between the adhesion at the interface and the cohesive
strength of TOCNF layers, the crack digression mechanisms that retarded fracture while increasing
the integrity of the laminates (less delamination) could be optimized. However, the effects of
stronger TOCNF layers and the impact of interlayers with different mechanical properties was not
addressed. Furthermore, the impact fracture behavior of laminates was still unknown.
In this study, lamination is used to investigate the role of stronger TOCNF layers, softer
and stiffer interlayers, and a higher adhesion at the interface on the final properties of the layup
structures. With that purpose, 4 different epoxy formulations are studied as well as a strong
TOCNF + PVA composite film. The different epoxy systems are characterized and the relationship
between the glass transition temperature (Tg) and storage modulus of the interlayer are studied in
relationship to the mechanical properties of the final laminates. Additionally, a silane coupling
agent is studied and the relationship between a stronger interface and bending, tensile, and fracture
properties, are investigated. Furthermore, different fracture behaviors are associated to crack
digression and interlaminar delamination within the TOCNF layers as shown by secondary
electron microscopy analysis and the ratio of adhesion at the interface and the cohesive strength
of the TOCNF layers. Finally, impact testing was performed on these laminates and on TOCNF
films for the first time in literature. The results suggested that TOCNF laminates and films showed
an energy to rupture and specific strength similar to borosilicate glass and acrylics. Moreover,
laminates were highly transparent and showed low haziness to the naked eye.
4.2 Materials and Methods
4.2.1 Materials.
A TOCNF suspension of 1.1 wt.% with a carboxylic content of (1.5mmol/g) was produced
by USDA Forest-Service Products Laboratory (FPL), Madison, WI, USA and purchased from the
University of Maine (lot #2018-FPL-CNF-129) 12. Poly(vinyl alcohol) (PVA) with a molecular

75
weight of 146,000 – 186,000 g/mol and hydrolyzation percentage of 99% was bought from Sigma-
Aldrich Corp, St. Louis, MO, USA.
Room temperature epoxy EpoxAcast 690™ was bought from Smooth-On, Inc, Macungie,
PA, USA. Two different hardeners were used: 5-Amino- 1,3,3-trimethylcyclohexanemethyl-amine
(Lot #BCCB7259), mixture of cis and trans and O,O’-Bis(2-aminopropyl) polypropylene glycol-
block-polyethylene glycol-block-polypropylene glycol, better known as Jeffamine® ED-2003,
Mw: 1900 (Lot #BCCB1323) and were purchased from Sigma Aldrich. A silane coupling agent,
(3-Aminopropyl) triethoxysilane (APTES) 99% (Lot #MKCL4964) was also purchased from
Sigma-Aldrich.
Different films were bought from McMaster including acrylonitrile butadiene styrene
(ABS), low density polyethylene (LDPE), cellulose acetate, acrylic, polystyrene, aluminum, and
borosilicate glass of different thicknesses.
4.2.2 Fabrication of Samples
TOCNF nanocomposites and films were fabricated by diluting TOCNF suspensions with
deionized water to 0.53 wt%. PVA was added in a concentration of 10 wt.% (dry weight relative
to TOCNF). The mix was stirred at 85°C for 2 h to promote the dissolution of the polymers in
water. 40 g of the solutions were later cast into 90 mm polystyrene Petri dishes as reported in
previous studies1. The cast solutions were placed in a humidity chamber with a fixed relative
humidity of 50 % at room temperature (~21 °C). Films were completely dry after 7 days with an
average thickness of 26 ± 2 µm. After drying, the films were removed from the Petri dish by cutting
along the edges with a razor blade and detaching them with tape.
Laminates were fabricated following a layup method described elsewhere by the author 13.
Lay-up structures were produced having 10 TOCNF layers and different epoxy interlayers with a
fixed average volume fraction of epoxy of 17 ± 3. The description of each epoxy formulation can
be found in table 1.

76
Table 4.1 Epoxy formulations. Ratios respective to epoxy resin.
Epoxy
formulation Epoxy resin Hardener A Hardener B
Resin: Hardener
A: Hardener B
A EpoxAcast
690™
Part A
EpoxAcast 690™
Part B
- 100: 30: 0
B EpoxAcast
690™
Part A
5- Amino 1,3,3-
trimethylcyclohex
anemethy- amine
- 100: 30: 0
C EpoxAcast
690™
Part A
EpoxAcast 690™
Part B
O,O’-Bis(2-
aminopropyl)
polypropylene glycol-
block-polyethylene
glycol-block-
polypropylene glycol
Mw:1900
100: 25: 5
D EpoxAcast
690™
Part A
EpoxAcast 690™
Part B
O,O’-Bis(2-
aminopropyl)
polypropylene glycol-
block-polyethylene
glycol-block-
polypropylene glycol
Mw: 1900
100: 20: 10
An adhesion promoter (APTES), used in literature to increase the compatibility between
cellulose nanofibrils (CNF) and epoxy systems, was used on some of the laminates fabricated 80.
In this case, TOCNF + PVA composite films were subjected to high humidity (90 %RH) for 20
mins. After delamination, each layer was submerged in APTES for 2 mins, rinsed with ethanol
and introduced to a 110 °C oven for 5 mins. Lamination with epoxy would follow as described
previously elsewhere 13.
4.2.3 Epoxy Characterization
Tensile characterization of epoxy was done by casting dogbone-shaped specimens in a
silicone mold. Specimens were tested in tension using an MTS insight (MTS system Corp, Eden
Prairie, MN, USA) with a 1000 N load cell and a 0.5 mm/min displacement rate. Specimens were
left under low humidity chamber (25 %RH) for three days at room temperature. At least 5

77
specimens were tested at room temperature (24 °C) and 35 % RH. Young’s modulus was
determined from the maximum slope of the stress-strain curve, UTS was taken as the highest point
of stress before fracture and the work of failure (WOF) was calculated by integrating the area under
stress-strain curve.
Dynamic Mechanical Analysis (DMA) of epoxy specimen were done by casting the
different epoxy formulations into rectangular silicone molds of 37 mm x 7 mm and an average
thickness of 1.5 ± 0.2 mm. Specimens were tested on a Q850 TA instruments DMA (New Castle,
DE, USA), using a single cantilever clamp. Specimens were subjected to an oscillation temperature
ramp from 0 °C to 80 °C at a 5 °C/min rate, with an amplitude of 15 µm and a frequency of 1.0
Hz. Elastic modulus (E’) was taken at room temperature (24 °C). Tg was reported from the E’ onset,
tan delta peak and the storage modulus (E’’) peak. Unpaired two-sample student t-tests were
conducted to compare results with a threshold level set to 0.05.
Thermal characterization was performed using a differential scanning calorimetry (DSC)
analyzer (Q2000 TA instruments, New Castle, DE, USA). A heating rate of 5 °C/min rate was
applied to the samples over a -25 °C to 100 °C temperature range in a nitrogen environment.
Midpoint Tg’s were calculated after the heating ramp.
4.2.4 Laminates Characterization
Tensile testing of neat TOCNF and TOCNF + PVA composites were conducted by cutting
1:5 scale dogbone-shaped specimens using a laser cutter (Muse Hobby Laser Cutter, Full Spectrum
Laser, Las Vegas, NV, USA) to obtain 1:5 scale dogbone-shaped specimens of ~0.8mm width and
~6.5mm of gauge length according to the ASTM D638 Standard Test Method for Tensile
Properties of Plastics. Samples were tested in a DMA using the rate-controlled stress ramp mode
fixed at a 1 N/min displacement rate. TOCNF films and composites had an average thickness of
26 ± 2 µm. Samples were conditioned in a low humidity chamber (25% RH) for three days at room
temperature before testing. A minimum of 5 specimens were tested at room temperature (24 °C)
and 35% RH. Unpaired two-sample student t-tests were conducted to compare results with a
threshold level set to 0.05.

78
Laminates were tested in tension by cutting 40 mm x 4 mm rectangular shapes using a laser
cutter. Fiberglass tabs were glued to the specimens using a fast cured epoxy according to the
ASTM D3093 Standard Test Method for Tensile Properties Matrix Composites as described
elsewhere 13. Five specimens were tested on an MTS with a 1000 N load cell and a 0.5 mm/min
rate. Unpaired two-sample student t-tests were conducted to compare results with a threshold level
set to 0.05.
3-point bending of the laminates was performed on a DMA by cutting 40 mm x 3 mm
rectangular shapes on a laser cutter. A small flexural clamp was used at a 0.1 mm/min speed using
a rate-controlled mode at room temperature (24 °C) and 35% RH. 5 specimens were tested for
each data point and t-tests were performed at 0.05 threshold to compare results.
Impact toughness measurements were performed on multiple polymeric films and TOCNF
laminates following the ASTM D472 Standard Test Method for Total Energy Impact of Plastic
Films by Dart Drop. A dart with a mass of 957g was used. A minimum of 3 samples were tested
per data point.
A lap shear experiment was designed to test the adhesion at the interface between neat
TOCNF films, TOCNF + PVA composites, the adhesion promoter (APTES) and the EpoxAcast
690™ (Epoxy A). The shear lap was modified from the ASTM D3164-03(2017) Standard Test
Method for Strength Properties of Adhesively Bonded Plastic Lap-Shear Sandwich Joints in Shear
by Tension Loading. Rectangular metal sheets (7 mm x 40 mm) x 10 mm thick were used. The
films were glued into the surface of the metal using a fast-cured structural epoxy. A secondary
sheet was covered with the polymer and left to cure at least 2 days. Finally, both surfaces were
glued together with the same epoxy. At least 5 specimens were tested in an MTS in tension at a
1.27 mm/min rate. Failure at the interface was inspected visually and the interfacial shear strength
was calculated in based of the calculated UTS and the area of bonding. Unpaired two-sample
student t-tests were conducted to compare results with a threshold level set to 0.5.
Visual inspection of the laminates was performed before and after fracture. Polarized light
microscopy was obtained of the side view of the laminates, by using a Carl Zeiss (Axio, Observer
A1) inverted microscope in transmission mode. Polarizers were used and 10x and 20x objectives.

79
Additionally, scanning electron microscopy (SEM) were taken of the side views of fracture
specimens. A Phenom SEM (FEI Company, Hillsboro, OR, USA) was used for this purpose.
Samples were coated with platinum for about 45 s inside an Emitech, K550X Sputter coater
(Quorum Technologies Ltd., East Sussex, UK).
Finally, optical absorbance (UV-Vis spectroscopy Spectramax Plus 384, Molecular
devices Corp., Sunnyvale, CA) of neat TOCNF, TOCNF + PVA composites and laminated
samples were measured and compared against borosilicate glass. A wavelength of 400 mm to 750
mm range was used with air as a background. Data was normalized by the sample thickness for
comparison purposes.
4.3 Results and discussion
4.3.1 Processing remarks
A hand lay-up method was used to fabricate the different sets of laminates following a
procedure described in detail in a previous publication13. A total of four epoxy formulations
(described in the materials and methods section) with different mechanical properties were used
as interlayers for the laminates. All samples maintained the transparency and low haziness of the
original TOCNF layers as shown in Figure 4.1, although a few bubbles and dirt specks are visible.

80
Figure 4.1. Picture of a 10-layer TOCNF + PVA + APTES and epoxy A laminate, showing high
transparency and low haziness.
In order to account for the transparency of the laminates, UV-Vis measurements were
performed in air and compared against borosilicate glass (Figure 4.2). Results showed differences
in the behavior of the three laminates. TOCNF + PVA laminates with epoxy A as interlayer seemed
to have a diminished transparency (~6 %) when compared with other laminates. The results also
indicated that adding a silane coupling agent (APTES) seem to reduce this effect, making the
TOCNF + PVA + APTES laminates comparable with the original laminate (Neat TOCNF
laminate), therefore increasing its transparency. The decreased transparency of TOCNF + PVA
laminates can find an explanation in the reflection between layers or destructive interferences. The
increased adhesion, or better wettability of the epoxy when APTES was applied could have
reduced the reflection, making for better interfaces and increasing the transparency. In general, the
APTES and the neat TOCNF laminate showed a decrease of around 6% when compared to
borosilicate glass while the TOCNF + PVA laminate showed around 17% difference. Even when
the loss in transparency, laminates show great transparency and low haziness to the naked eye.

81
Figure 4.2 Visible transmittance via UV-Vis spectroscopy of TOCNF laminates, and borosilicate
glass. Thickness was normalized using the borosilicate glass as reference (0.9mm)
4.3.2 Flexural properties
The mechanical properties of the laminates were evaluated via bending on a DMA. All the
laminates tested were comprised of 10 layers of neat TOCNF or TOCNF + PVA composite films
and different epoxy interlayers. The volume fraction of epoxy was fixed at 17 ± 3 % out of the
total laminate to isolate the effect of the interlayer in the mechanical properties of the laminate.
Results showing the different laminates tested are presented in Figure 4.3. Information about the
different epoxy formulations can be found on Table 4.1.
400 450 500 550 600 650 700 7500
10
20
30
40
50
60
70
Borosilicate Glass
Neat TOCNF laminate
TOCNF + PVA + APTES laminate
TOCNF + PVA laminate
No
rmali
zed
tra
nsm
itta
nce (
%)
Wavelength (nm)

82
Figure 4.3. Flexural properties of 10-layer TOCNF and TOCNF + PVA laminates. (a) Flexural
strength (MPa). (b) bending modulus (GPa) and (c) Work of failure (MJ/m3). The first square
(from smallest to biggest) highlights the influence of stronger TOCNF layers, the second, the
influence of different epoxies, the biggest, highlights the effect of an increased adhesion.
Numbers represent the increase when compared to the reference sample (Neat TOCNF – Epoxy
A / red column), = means no statistical difference between the samples.
The percentage change of each laminate in relationship to the neat TOCNF - epoxy A
laminate (red bar) is expressed in the charts. Each laminate system will be analyzed by isolating
the effect of different components during the discussion, progressing from the smaller demarked
square on the plot (Figure 4.3) to the biggest one.
4.3.3 Influence of TOCNF layers
The first square (smallest) correlates to the increase achieved by replacing neat TOCNF
films with a TOCNF + PVA composite film. In a previous study performed by Forti et al. (2021),

83
the introduction of PVA at a low level of 10wt% (relative to the dry weight of TOCNF) as a
reinforcing agent in hypochlorite TOCNF films was described. The mechanical increases achieved
in tension were reported to be around the 48% in Young’s modulus, 93% in UTS and 165% in
WOF when compared with the neat TOCNF 79. The results shown in Figure 4.3 show increases of
flexural strength of 29%, bending modulus of 50% and WOF of 25% when the same layers were
introduced in the laminate. The increased tensile properties of TOCNF + PVA layers did not
translate into the same proportion of increase in bended laminates, which is expected. While
TOCNF + PVA films are the main component in the laminated samples, they do not constitute
100% of it. Only 80% volume fraction will follow the behavior of the TOCNF composite while
the remaining is expected to follow the performance of the epoxy interlayer. This notion is well
understood and described by the rule of mixtures of laminated materials in tension. Additionally,
there is not a straight relationship between tension and bending properties of inhomogeneous
materials. This conception lies in the fact that most materials do not exhibit the same moduli in
tension as in compression. When a laminated material is bent, some of the layers will strain and
others will constrain, making the comparison between tension and bending properties difficult 81.
Hence, since the bending behavior of TOCNF + PVA films is difficult to account for (not enough
thickness) and the relationship between the rule of mixtures of tensile and bending of materials is
not direct, it is difficult to predict the magnitude of increases that should have been achieved by
replacing the neat TOCNF layers with the stronger TOCNF + PVA composite films. Nevertheless,
when accounting for the generation of extra interlaminar stresses generated by the mismatch
between the mechanical properties of TOCNF and epoxy, it is safe to say that an increase of ~25%
across diverse mechanical properties when a 17 vol% of epoxy is introduced is a good indication
of the role of the stronger composite in the bending behavior of the laminates. To get an additional
understanding of the differences between the two laminates, SEM pictures were taken after
bending and are presented in Figure 4.4.
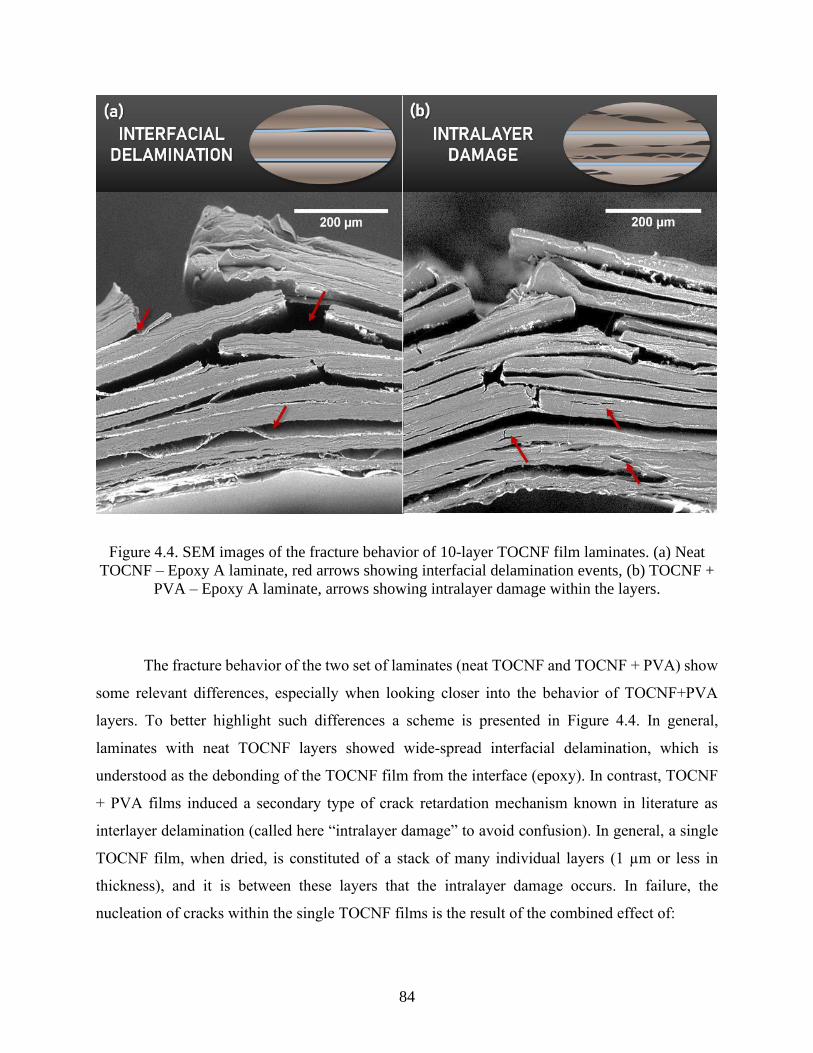
84
Figure 4.4. SEM images of the fracture behavior of 10-layer TOCNF film laminates. (a) Neat
TOCNF – Epoxy A laminate, red arrows showing interfacial delamination events, (b) TOCNF +
PVA – Epoxy A laminate, arrows showing intralayer damage within the layers.
The fracture behavior of the two set of laminates (neat TOCNF and TOCNF + PVA) show
some relevant differences, especially when looking closer into the behavior of TOCNF+PVA
layers. To better highlight such differences a scheme is presented in Figure 4.4. In general,
laminates with neat TOCNF layers showed wide-spread interfacial delamination, which is
understood as the debonding of the TOCNF film from the interface (epoxy). In contrast, TOCNF
+ PVA films induced a secondary type of crack retardation mechanism known in literature as
interlayer delamination (called here “intralayer damage” to avoid confusion). In general, a single
TOCNF film, when dried, is constituted of a stack of many individual layers (1 µm or less in
thickness), and it is between these layers that the intralayer damage occurs. In failure, the
nucleation of cracks within the single TOCNF films is the result of the combined effect of:

85
1. The random in-plane orientation of the fibrils
2. The stronger intralaminar fibrils interactions compared to the weaker interlaminar bonding.
Consequently, intralayer damage takes advantage of the weaker interlaminar interactions,
nucleating new surfaces in between the stack of layers within a single TOCNF film. The nucleation
of such surfaces is an important energy dissipation mechanism of fracture retardation that increases
the toughness of laminates, and will be discussed extensively during this study 1.
4.3.4 Influence of epoxy formulation
Usually, lay-up structures are constituted by strong or stiff materials that are laminated with
a very ductile interlayer to maximize properties. The ductile interlayers are usually in a lower
volume percentage when compared to the strong material. Even so, a ductile interlayer plays a
significant role in increased work of fracture due to the introduction of different mechanisms for
fracture retardation 20,24.
In this study, different epoxy systems were analyzed to further investigate the impact of
ductile vs stiff epoxy layers in the mechanical properties of the laminates. For the different epoxy
systems formulated, Figure 4.5 shows the Tg as measured by DMA and DSC analysis, while Figure
4.6 shows the storage modulus as measured by DMA.
Figure 4.5. Glass transition temperature of different epoxy formulations as taken from DMA and
DSC.
A B C D0
20
40
60
Epoxy Formulation
Tran
sit
ion
Tem
pera
ture
(°C
)
Tg - DMA (Tan)
Tg - DMA (Loss Modulus)
Tg - DMA (Onset of E)
Tg - DSC (Midpoint)

86
Figure 4.6. Storage modulus of different epoxy formulations as taken from the DMA.
In general, the glass transition temperature in polymers is related to medium to long range
motion of the polymer chain, therefore, it is defined as a function of chain stiffness/length and it
is inversely proportional to the free volume in the polymeric network 82,83. In this study, the Tg of
the different epoxy systems was measured thought DMA and DSC. Dynamic measurements were
performed with a single cantilever clamp at a fixed frequency and amplitude. The Tg was taken
from the onset of the storage modulus, the peak of the loss modulus and the tan delta as the
materials were deformed in a sinusoidal deformation. Each of these measurements is related to a
specific set of events within the polymeric chains. The onset of E’ occurs at the lower temperature
when compared with the loss modulus peak and the tan delta. This temperature is usually
understood as the onset of the decrease in mechanical properties in polymers, which is why it is
relevant from a mechanical properties standpoint. The loss modulus peak is extensively related to
molecular processes and it denotes the molecular movements happening at the medium and long
range in the polymeric chain. Finally, tan delta occurs at the highest temperature as it is defined as
the middle point between the rubbery and glassy state of the polymer 83,84. DSC measurements
were also conducted on all the samples, and Tg was reported as the middle point of the slope during
a heat cycle 85. Overall, all measurements showed a higher Tg for the epoxy B when compared
with A. Furthermore, epoxy C and D had a lower Tg, where epoxy C showed higher transition
temperatures than epoxy D. It is important to highlight that Tg values are reported from different
techniques only for comparison purposes. It is the assumption of the authors that the Tg measured
A B C D0
500
1000
1500
2000
2500
3000
Epoxy Formulation
Sto
rag
e M
od
ulu
s (
MP
a)
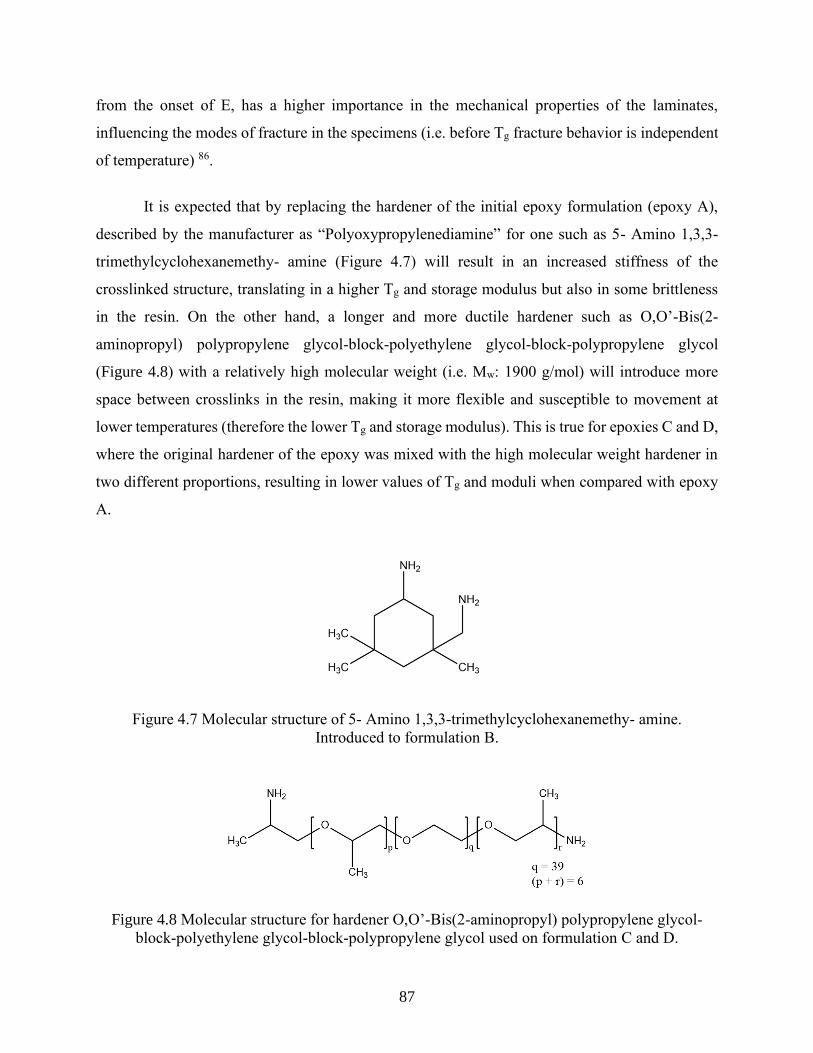
87
from the onset of E, has a higher importance in the mechanical properties of the laminates,
influencing the modes of fracture in the specimens (i.e. before Tg fracture behavior is independent
of temperature) 86.
It is expected that by replacing the hardener of the initial epoxy formulation (epoxy A),
described by the manufacturer as “Polyoxypropylenediamine” for one such as 5- Amino 1,3,3-
trimethylcyclohexanemethy- amine (Figure 4.7) will result in an increased stiffness of the
crosslinked structure, translating in a higher Tg and storage modulus but also in some brittleness
in the resin. On the other hand, a longer and more ductile hardener such as O,O’-Bis(2-
aminopropyl) polypropylene glycol-block-polyethylene glycol-block-polypropylene glycol
(Figure 4.8) with a relatively high molecular weight (i.e. Mw: 1900 g/mol) will introduce more
space between crosslinks in the resin, making it more flexible and susceptible to movement at
lower temperatures (therefore the lower Tg and storage modulus). This is true for epoxies C and D,
where the original hardener of the epoxy was mixed with the high molecular weight hardener in
two different proportions, resulting in lower values of Tg and moduli when compared with epoxy
A.
Figure 4.7 Molecular structure of 5- Amino 1,3,3-trimethylcyclohexanemethy- amine.
Introduced to formulation B.
Figure 4.8 Molecular structure for hardener O,O’-Bis(2-aminopropyl) polypropylene glycol-
block-polyethylene glycol-block-polypropylene glycol used on formulation C and D.

88
Figure 4.3 shows the influence of such resins on the laminate properties, where the second
square highlights the results. Overall, the introduction of a stiffer resin (epoxy B), decreased the
mechanical properties of the laminate, reversing the 29% flexural strength increase achieved by
the introduction of stronger TOCNF + PVA layers. Furthermore, Young’s modulus and WOF
showed no statistical difference when compared against TOCNF + PVA – epoxy A laminate.
Considering epoxy C, a somewhat more ductile interlayer (20% decrease in elastic modulus when
compared to epoxy A), there is no statistical difference with regards to formulation A with the
TOCNF + PVA laminate for modulus, flexural strength or WOF. However, a continued increase
in the epoxy ductility (e.g., lower Tg and elastic modulus) by using epoxy D, translated into a
degradation of the strength, a large reduction of the bending modulus but an increase in the WOF
of the laminate. Thus, as the epoxy interlayer ductility increased (e.g., stiffness decreased) there
seems to be a threshold before which the epoxy makes little difference, but beyond which it reduces
stiffness and strength, and increases WOF.
When examining the fracture behavior of the laminates in Figure 4.9 it is evident that
different modes of fracture are being introduced depending on interlayer stiffness. Overall, the
trend seems to highlight an intralayer damage within the TOCNF + PVA layers when introducing
a stiffer interlayer (epoxy B), that changes into an interfacial delamination when a softer interlayer
is in place (epoxy D). This behavior might be triggered by the difference in modulus between the
strong layers (TOCNF + PVA) and the epoxy. When this difference is higher, as in the case of
epoxy D that is more ductile, the amount of interfacial shear stress between the two materials can
lead to increased delamination at the surface between the two (i.e. interfacial delamination). As
this difference is reduced (by introducing stiffer epoxies) the shear stresses at the interface are
reduced and the intralayer damage within TOCNF layers is more evident. Nevertheless, it seems
like resins with a set of properties between the two extremes performed best. In this particular case,
epoxy A and epoxy C behaved better in terms of increased flexural strength, moduli and WOF in
the laminates. Figure 4.9 (c) shows the fracture of TOCNF + PVA laminate with epoxy C, where
extensive delamination and intralayer damage can be appreciated. Therefore, the increased
mechanical properties might be attributed to a combined effect of the two different fracture
retardation mechanisms at play. As such, having a soft enough epoxy to promote interlayer

89
delamination, but stiff/strong enough to allow intralayer damage to balance the stresses of the two
modes seems ideal.
Figure 4.9 SEM images of the fracture behavior of 10 layer TOCNF film laminates with different
epoxy formulations as interlayers. Images are presented in order of stiffness a > b > c > d. (a)
TOCNF + PVA – Epoxy B (b) TOCNF + PVA – Epoxy A. (c) TOCNF + PVA – Epoxy C.(c)
TOCNF + PVA – Epoxy D.
4.3.5 Influence of a silane coupling agent
In a previous work by Forti et al (2020) the adhesion at the interface of TOCNF + epoxy
A laminates was measured and found to be lower than desired when compared to the cohesive
strength of neat TOCNF layers13, suggesting a potential mechanism for improvement. By
(a) (b)
(c) (d)

90
increasing interfacial adhesion between TOCNF and epoxy, the laminates could improve their
performance in mechanical loading, while also sustaining beneficial crack stop mechanisms such
as crack digression.
To study how the level of adhesion at the interface between TOCNF and epoxy affects the
mechanical properties of laminates, a silane coupling agent was added to a TOCNF + PVA – epoxy
A system. The reasoning behind this can be found in literature, where silane coupling agents have
been used to increase the compatibility of CNFs with different materials. In general, silane
coupling agents serve as a bridge between two substrates, introducing ionic or covalent bonds
between them and increasing their overall adhesion87. In the specific case of CNFs and epoxy,
APTES, a silane coupling agent with an amine active group that can easily react with epoxy,
phenolics and polyesters has been previously studied88. For example, Yeo et al. (2017) modified
CNF fibrils with APTES to achieve a 1.5 – 2.2 times higher mechanical properties of the epoxy
reinforced with the modified APTES80. Therefore, APTES was introduced in this study as an
adhesion promoter.
To demonstrate the effect of APTES on adhesion, a contact angle study was completed on
TOCNF+PVA films that were clear of visible defects. Figure 4.10 shows the change in the contact
angle after applying APTES to TOCNF+PVA films. Overall, TOCNF + PVA films exhibit a static
contact angle of 70 ± 3° that was increased to 100 ± 5° after treatment with APTES, which is in
line with previous APTES modification studies. Lu et al. (2008) achieved a change in the water
contact angle of CNF from 15° to 90° without imparting any changes in the crystalline structure of
CNF. In general, CNFs are rich in hydroxyl groups (OH) making them hydrophilic in nature 89.
While it can be expected that TOCNF may be somewhat different than CNFs due to the conversion
of some of the OH groups to COONa, it will still retain a similar hydrophilic behavior thanks to
the large amount of unconverted OH groups on the surface. Further, while many expect the amine
surface to of APTES to be relatively hydrophilic, APTES tends to interact with hydrogen bonding
groups underneath (such as alcohol or silanol) and push the propyl segment towards the top, giving
a relatively hydrophobic surface (please refer to Figure 4.11 for the molecular structure of APTES)
90.

91
Figure 4.10 Static contact angle photographs of water droplets in different substrates. (a).
TOCNF + PVA (b) TOCNF + PVA + APTES
Figure 4.11 Molecular structure for APTES (3-Aminopropyl)triethoxysilane
Overall, a higher adhesion at the interface was achieved by the introduction of APTES as
can be seen in the lap shear results exhibit on Table 4.2, where for both neat TOCNF and TOCNF
composite films with epoxy A the results did not show a statistical difference. In contrast, when
APTES was added, the peak stress increased by 47% while the strain before failure increased by
86%. This confirms the authors hypothesis that by achieving a surface treatment on the films
through a hydrolysis-condensation reaction, a bridge between TOCNF and epoxy was achieved
(Figure 4.12) resulting in a higher adhesion as shown by the data presented.
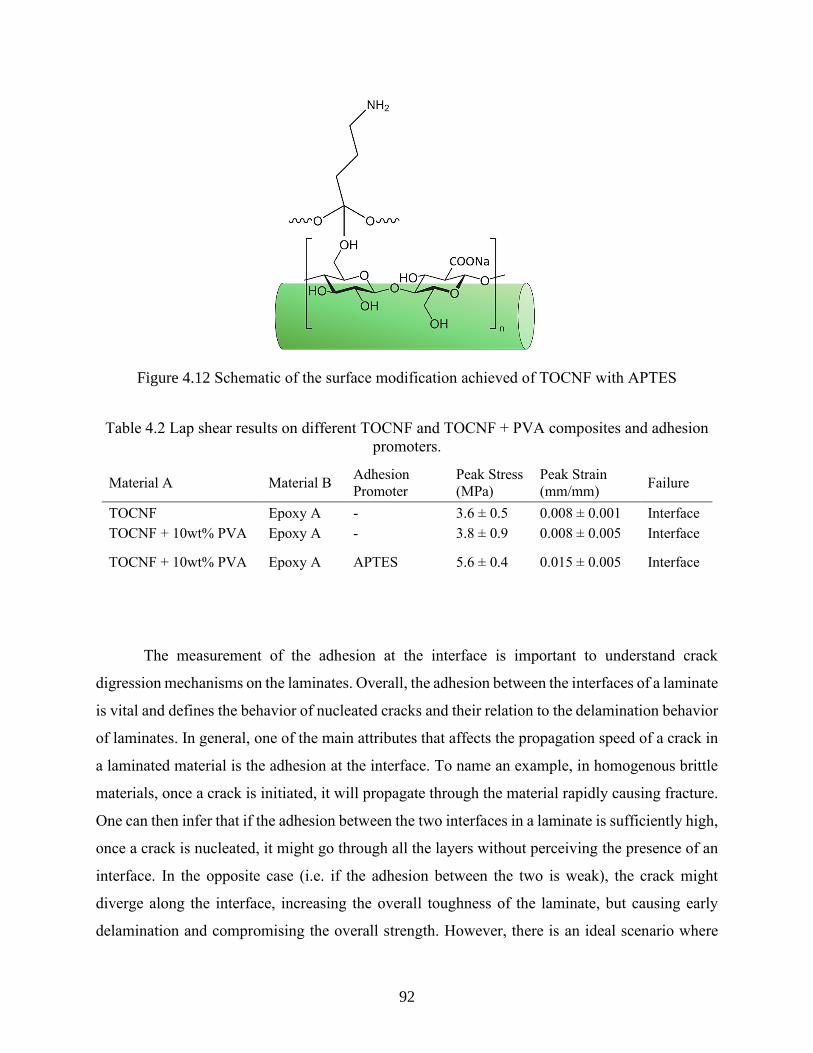
92
Figure 4.12 Schematic of the surface modification achieved of TOCNF with APTES
Table 4.2 Lap shear results on different TOCNF and TOCNF + PVA composites and adhesion
promoters.
Material A Material B Adhesion
Promoter
Peak Stress
(MPa)
Peak Strain
(mm/mm) Failure
TOCNF Epoxy A - 3.6 ± 0.5 0.008 ± 0.001 Interface
TOCNF + 10wt% PVA Epoxy A - 3.8 ± 0.9 0.008 ± 0.005 Interface
TOCNF + 10wt% PVA Epoxy A APTES 5.6 ± 0.4 0.015 ± 0.005 Interface
The measurement of the adhesion at the interface is important to understand crack
digression mechanisms on the laminates. Overall, the adhesion between the interfaces of a laminate
is vital and defines the behavior of nucleated cracks and their relation to the delamination behavior
of laminates. In general, one of the main attributes that affects the propagation speed of a crack in
a laminated material is the adhesion at the interface. To name an example, in homogenous brittle
materials, once a crack is initiated, it will propagate through the material rapidly causing fracture.
One can then infer that if the adhesion between the two interfaces in a laminate is sufficiently high,
once a crack is nucleated, it might go through all the layers without perceiving the presence of an
interface. In the opposite case (i.e. if the adhesion between the two is weak), the crack might
diverge along the interface, increasing the overall toughness of the laminate, but causing early
delamination and compromising the overall strength. However, there is an ideal scenario where

93
the adhesion is weak enough to provoke the diversion of a crack but strong enough not to weaken
the specimen. This case for purely brittle materials has been defined in literature by a ratio, if the
interface adhesion in a laminate is less than 0.35 times the cohesive strength of the strong material
in the laminate, then cracks can be diverted but the laminate will retain some of its inheriting
strength 13,20–22.
In the particular case of neat TOCNF laminates, it was shown in a previous publication that
this value was around 0.03, suggesting there was room for potential improvements13. Table 4.3
shows the same ratio calculated for different configurations of TOCNF composites with regards
to epoxy A. To calculate such ratios, tensile testing of neat TOCNF and TOCNF + PVA films was
performed via DMA. For the specific case of TOCNF + PVA + APTES films, the same value of
UTS of the TOCNF + PVA composite film was assumed, since APTES does not disrupt the
structure of the TOCNF layers 89.
Table 4.3 UTS properties of Neat TOCNF and TOCNF + PVA films. TOCNF + PVA + APTES
films are assumed to have the same UTS as TOCNF + PVA layers. Adhesion – Cohesive
strength ratio for different TOCNF configurations. Adhesion measured in relation to Epoxy A.
Films UTS
(MPa)
Adhesion
(MPa)
Ratio
Adhesion / UTS
(MPa/MPa)
Neat TOCNF 151 ± 11 3.6 ± 0.5 0.024
TOCNF + PVA 256 ± 12 3.8 ± 0.9 0.015
TOCNF + PVA + APTES 256 ± 12 5.6 ± 0.4 0.022
As can be seen in Table 4.3 the original ratio of 0.024 was reduced to 0.015 when TOCNF
+ PVA layers were incorporated to laminated specimens. This is due to the higher cohesive
strength achieved by adding PVA to TOCNF layers. Without an adhesion promoter, the adhesion
at the interface remained the same and the ratio was reduced. To further investigate how this ratio
affected the mechanical properties of the laminates, a set of 3 different laminates were prepared
and measured in tension. Results are presented in Figure 4.13.

94
Figure 4.13. Tensile testing of different laminates. Blue and red lines represent the iso-strain rule
of mixtures of TOCNF + PVA – Epoxy A and Neat TOCNF – Epoxy A laminates
Tensile testing results show a different tendency for laminates with TOCNF + PVA
composite films versus those made with neat TOCNF layers. Overall, laminates with TOCNF
+PVA composites performed better due to the larger strength of the individual layers. Nonetheless,
it seems like without an adhesion promoter such as APTES (open blue triangle marker) the UTS
values in tension are not reaching the idealized performance predicted by the rule of mixtures. This
behavior may be due to the increased difference in performance between TOCNF + PVA layers
and epoxy A. When the difference in mechanical properties grows larger, the mismatch in Young’s
modulus between the strong layers and the epoxy produces an increased shear stress when the
material is stretched in tension 34,35. It is believed by the authors that the high shear stresses
generated by the mismatch of mechanical properties, in addition to the decreased adhesion ratio in
the interface, generates extensive delamination and an improper transmission of the load between
the layers. When APTES was added (close blue triangle case) an increased adhesion was achieved,
resulting in an improved tensile strength of the laminate, that is closer to the expected values
(dictated by the rule of mixtures).
Finally, the flexural properties of the APTES laminates were measured and compared to
the Neat TOCNF and TOCNF + PVA laminates. Results are shown in Figure 4.3 and are
0 20 40 60 80 100
40
80
120
160
200
240
280
Ultim
ate
str
en
gth
(M
Pa
)
Volume fraction of epoxy (%)
Neat TOCNF - Epoxy A (Rule of mixtures)
TOCNF + PVA - Epoxy A (Rule of mixtures)
Neat TOCNF - Epoxy A Laminate
TOCNF + PVA - Epoxy A Laminate
TOCNF + PVA + APTES - Epoxy A Laminate

95
highlighted by the biggest square in the plots. Data shows an increase of 25% in the flexural
strength, 30% in bending modulus and a reduction of 25% in WOF properties attributed to the
increased interfacial adhesion (taken from the straight comparison between TOCNF + PVA
laminates with epoxy A interlayers). When compared to the original non-PVA laminate (red bar
in the plots), an increase of 80% in flexural strength, 61% in bending modulus and approximately
the same WOF was obtained, showing that both improved TOCNF strong phase and adhesion can
lead to large increases in properties. Nonetheless, even when a much higher mechanical
performance was achieved, the adhesion ratio of the samples is still low. Therefore, there may be
still room for improvement, in fact, it is believed by the authors that achieving a higher adhesion
between the TOCNF + PVA composites and the epoxy is crucial to decrease the delamination
behavior of laminates while increasing the its overall performance.
4.3.6 Impact rupture energy
Both 3-point bending, and tensile testing involves the deformation of specimens to the
point of fracture while increasing the load applied. While both techniques offer a wide range of
information about the overall mechanical response of a specimen, they do not predict the fracture
behavior of specimens under a moderate or high velocity blunt impact. Systems where a strong
material is laminated with a ductile material have been shown to produce high toughness materials
when the conditions are appropriate (i.e. an adequate combination of moduli, good adhesion,
appropriate interlayer thickness and sufficient number of layers). A good example of this
combination can be found in ballistic glass (glass with polyvinyl butyral or other polymers as
interlayer91), where the match of the right properties produce a material capable of resisting
impacts at high velocity 92. This type of study, necessary to predict the toughness capabilities of
our system has not been done before on TOCNF materials and it is important to fully understand
the behavior of the laminates under a wider range of conditions. Some of the most popular impact
studies include techniques like Charpy and Izod where the material is notched and subjected to a
high strain-rate impact. In this study, a free-falling dart test was used as it is a common impact test
performed on thin films that are usually targeted for packaging applications, a field of interest for
the cellulose community. The method is highly sensitive to thickness, making it hard to derive
straight relationships between the energy to rupture and the thickness of different materials.
Further, a complete rupture of the films is necessary to make the calculations possible, which limits

96
the spectrum of materials that can be tested. Hence, only films with similar thicknesses were tested
as a comparison point for cellulose materials (both films and laminates).
A set of three different laminates were prepared and subjected to drop dart testing along
with other common materials. 10-layer neat TOCNF – epoxy A, TOCNF + PVA – epoxy A, and
TOCNF + PVA + APTES – Epoxy A were selected for the testing to analyze how different TOCNF
composites and adhesion promoters could change the response of the laminates. Other common
polymers within similar thicknesses and toughness such as ABS, known as an engineering polymer
with excellent toughness 93, LDPE, a common polymer used in the film industry due to its cheap
price and great toughness 94, cellulose acetate, used in a wide range of products including films for
packaging applications 95, acrylic (PMMA), known as a good alternative to replace glass 96, high
impact polystyrene (HIPS) 97, aluminum and borosilicate glass 98, extensively used in industry due
to its higher resistance to thermal shock were tested. Results are presented in Figure 4.14 where
the energy to rupture was divided thickness as rupture energy scales by the volume deformed and
normalized by density to plot against the tensile specific strength of each material in an “Ashby”
style plot to compare the materials.

97
Figure 4.14. Plot shows specific energy to rupture divided by thickness (t) against the specific
strength of various materials, including ABS, LDPE, Cellulose acetate, Acrylic, PS, Aluminum,
Borosilicate Glass, Neat TOCNF and TOCNF + PVA films and 3 different 10 layers TOCNF or
TOCNF + PVA laminates. Blue bubble are ductile polymers (low specific strength but high
specific energy to rupture), purple bubble somewhat brittle materials (low specific strength and
energy to rupture), red bubble indicates high specific strength but low specific energy to rupture.
Results show a highlighted area for each group of materials studied. The blue bubble
represents ductile polymers with an overall low specific strength but high specific rupture energy.
ABS exhibited the highest specific energy to rupture, as expected as it is an engineering polymer,
composed by acrylonitrile and butadiene (a synthetic rubber), which allows for a good chemical
and thermal stability while also sustaining high toughness 93. Acrylic in the other hand, showed a
low specific rupture energy but higher specific strength, which is not uncommon due to its
amorphous nature 96. In comparison, laminates showed a similar toughness to acrylic, with a much
higher specific strength. Finally, borosilicate glass and TOCNF and its laminates are shown in the
low specific energy / high specific strength area of the plot (red bubble). While glass was expected
to behave in a brittle manner (low toughness) the glass tested here was thin (i.e. characteristic
strength goes up as size goes down) which explains the higher toughness exhibited 99.

98
Single TOCNF films need some elaboration as this is the first report to date of falling dart
impact testing of these materials. Neat TOCNF films showed strength to failure similar to
borosilicate glass with a higher specific energy to rupture. The composite films (TOCNF + PVA)
showed a higher specific strength but a reduced energy to rupture when compared to Neat TOCNF
films. Overall, impact testing shows that TOCNF has great potential as a high strength transparent
or structural material as when a small amount of PVA enhancer is added it can achieve similar
specific impact energy to rupture to acrylic and aluminum, but almost 3 times and 7 times higher
specific strength of each, respectively.
Neat TOCNF laminates performed similarly to its respective unlaminated single films and
to borosilicate glass. As the TOCNF laminate is much higher in strength than typical polymers but
still fails in a brittle manner, this is expected. While TOCNF + PVA -epoxy A laminate shows
lower strength than the single film, its impact performance seems to be increased with lamination,
indicating toughening mechanisms attributed to the interfaces Regardless, TOCNF + PVA -epoxy
A performed better in terms of energy of rupture than either the glass or neat TOCNF laminate. In
comparison, the laminate with an increased adhesion (APTES laminate) underperformed, reaching
the same level than the original laminate (Neat TOCNF laminate) while showing a higher specific
strength. This might find a good explanation in the crack digression mechanism exhibited by all
the laminates. As discussed previously, the ratio between the interface adhesion and the cohesive
strength of the material dictates the degree of crack digression that a system will experienced upon
fracture. The lower this value is, the higher the crack digression in the system, leading to
delamination but also a great degree of energy absorption as the crack deflects to an unfavorable
direction, prolongating its path across the laminate, resulting in higher toughness 19. Therefore, the
results shown in Figure 4.14 are in agreement with the ratios calculated in Table 4.3 where the
TOCNF + PVA laminate shows the smaller adhesion/strength ratio (0.015), translating into a
higher toughness. This was also corroborated by the three-point bending results, where this
laminate showed the higher WOF just as both neat TOCNF and APTES laminates showed the
same value of WOF, adhesion ratio, and energy to rupture. Overall, while the laminates fracture
in a brittle way when compared to ductile polymers (ABS, LDPE and acetate), the specific impact
rupture energy of the laminates is similar or higher than that of other transparent structural

99
materials such as glass and acrylic, yet with a significantly higher specific strength allowing for
the potential of weight savings by using less material to accomplish a similar function.
4.4 Summary
Transparent TOCNF-epoxy laminates were fabricated and tested to determine how the
strong layer properties, epoxy interlayer properties and strength of adhesion between the strong
layer and the epoxy interface affected the overall laminate mechanical properties. 3-point bending
results showed a strong relationship between the presence of stronger layers (TOCNF + PVA) with
a higher flexural strength, bending modulus and WOF. Overall, a stiffer epoxy generated a
diminished UTS and flexural modulus and substantial intralayer damage. On the other hand, a
more ductile epoxy increased the WOF of the laminates, inducing a higher delamination at the
interfaces. The delamination mechanism was attributed to the strong mismatch between the
properties of TOCNF + PVA composites and the epoxy. Results highlighted a better mechanical
performance when laminates were fabricated with an intermediate, i.e. not too stiff or too ductile
interlayer, and were able to exhibit both delamination at the interface and intralayer damage as a
fracture behavior mechanism. The addition of a silane coupling agent (APTES) to the TOCNF –
PVA laminates increased the adhesion at the interface, resulting in a higher UTS when tested in
tension and a reduced energy to rupture associated with the reduction of crack digression
mechanisms in the system. In general, laminates with strong TOCNF layers (TOCNF + PVA) and
APTES, increased the flexural strength (+61%) and bending modulus (80%) while retaining the
same WOF. Finally, for the first time, impact testing of TOCNF was performed. The specific
impact rupture energy of the laminates was comparable to or slightly higher to those achieved by
acrylic polymers and borosilicate glass while maintaining a similar or higher specific strength to
glass. Additionally, laminates showed an excellent transparency and low haziness to the naked eye.

100
CONCLUSIONS AND FUTURE WORK
This work studied lamination with a room temperature epoxy as a potential solution to
solve some of the scalability problems of TOCNF. Lamination was successful at increasing the
thickness of TOCNF materials and reduce the brittleness of the films while maintaining their
inherent transparency. The highest mechanical properties were found when the volume fraction of
epoxy was reduced to 10%. Additionally, crack digression was described as one of the primary
mechanisms for fracture retardation in the laminates. It was found that a weak interfacial adhesion
led to substantial delamination, which increased the toughness of the laminates at the expense of
the integrity of the structure (i.e. a decrease in the UTS and Young’s modulus). The research helped
clear the path to the creation of enhanced laminates that could potentially compete in industry. A
first approach to the fabrication of better laminates was the incorporation of stronger TOCNF
layers. A screening of several water-soluble polymers found that both PVA and PEOX were good
candidates to increase the mechanical properties of the films as their presence in the films
facilitated the creation of numerous hydrogen bonding between the fibrils and the polymers. Such
a mechanism of reinforcement was indirectly confirmed by zeta potential and rheology. When
stronger TOCNF layers were introduced to the laminates, an increased mechanical response was
obtained, and substantial intralayer damage was reported. Furthermore, a set of four different
epoxy systems were introduced in the laminates and their mechanical response was characterized.
It was found that an optimal mechanical response of the laminates could be substantiated by the
introduction of an interlayer with an intermediate set of properties which could allow for intralayer
damage and interfacial delamination to take place as retardation mechanisms. Finally, a silane
coupling agent was introduced to decrease the delamination that was suspected to be the culprit of
the high toughness but decreased integrity of the laminates. The enhanced laminates showed good
transparency, and the specific energy to rupture of the systems was comparable to or slightly higher
to those achieved by common materials such as acrylic and borosilicate glass.
Even though the enhancing mechanisms presented were successful, there is still a path
ahead for the creation of more competitive laminates. For instance, an industrially scalable method
to produce TOCNF films is still needed. Processes like roll to roll or extrusion followed by
calendaring should be explored as feasible methods to shorten the drying times of TOCNF films
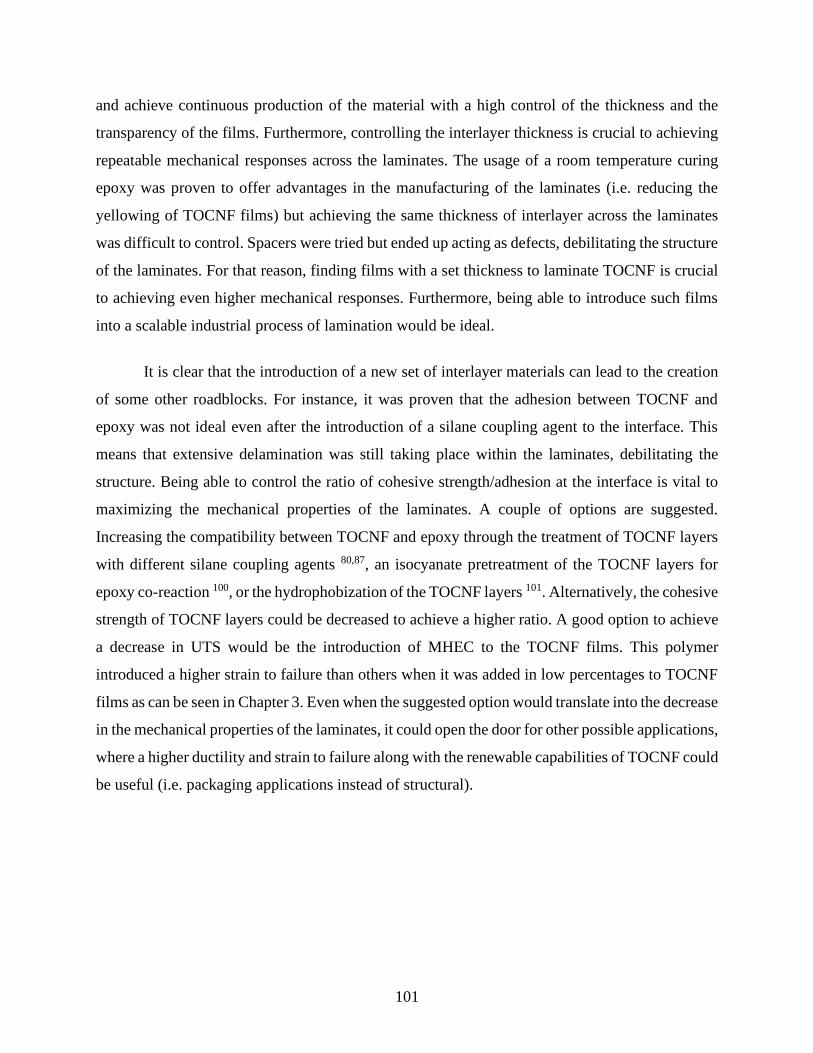
101
and achieve continuous production of the material with a high control of the thickness and the
transparency of the films. Furthermore, controlling the interlayer thickness is crucial to achieving
repeatable mechanical responses across the laminates. The usage of a room temperature curing
epoxy was proven to offer advantages in the manufacturing of the laminates (i.e. reducing the
yellowing of TOCNF films) but achieving the same thickness of interlayer across the laminates
was difficult to control. Spacers were tried but ended up acting as defects, debilitating the structure
of the laminates. For that reason, finding films with a set thickness to laminate TOCNF is crucial
to achieving even higher mechanical responses. Furthermore, being able to introduce such films
into a scalable industrial process of lamination would be ideal.
It is clear that the introduction of a new set of interlayer materials can lead to the creation
of some other roadblocks. For instance, it was proven that the adhesion between TOCNF and
epoxy was not ideal even after the introduction of a silane coupling agent to the interface. This
means that extensive delamination was still taking place within the laminates, debilitating the
structure. Being able to control the ratio of cohesive strength/adhesion at the interface is vital to
maximizing the mechanical properties of the laminates. A couple of options are suggested.
Increasing the compatibility between TOCNF and epoxy through the treatment of TOCNF layers
with different silane coupling agents 80,87, an isocyanate pretreatment of the TOCNF layers for
epoxy co-reaction 100, or the hydrophobization of the TOCNF layers 101. Alternatively, the cohesive
strength of TOCNF layers could be decreased to achieve a higher ratio. A good option to achieve
a decrease in UTS would be the introduction of MHEC to the TOCNF films. This polymer
introduced a higher strain to failure than others when it was added in low percentages to TOCNF
films as can be seen in Chapter 3. Even when the suggested option would translate into the decrease
in the mechanical properties of the laminates, it could open the door for other possible applications,
where a higher ductility and strain to failure along with the renewable capabilities of TOCNF could
be useful (i.e. packaging applications instead of structural).

102
REFERENCES
(1) Moon, R. J.; Martini, A.; Nairn, J.; Simonsen, J.; Youngblood, J. Cellulose Nanomaterials
Review: Structure, Properties and Nanocomposites. Chem. Soc. Rev. 2011, 40 (7), 3941–
3994. https://doi.org/10.1039/C0CS00108B.
(2) Jonoobi, M.; Oladi, R.; Davoudpour, Y.; Oksman, K.; Dufresne, A.; Hamzeh, Y.; Davoodi,
R. Different Preparation Methods and Properties of Nanostructured Cellulose from Various
Natural Resources and Residues: A Review. Cellulose 2015, 22 (2), 935–969.
https://doi.org/10.1007/s10570-015-0551-0.
(3) Trache, D.; Hussin, M. H.; Haafiz, M. K. M.; Thakur, V. K. Recent Progress in Cellulose
Nanocrystals: Sources and Production. Nanoscale 2017, 9 (5), 1763–1786.
https://doi.org/10.1039/C6NR09494E.
(4) Abdul Khalil, H. P. S.; Davoudpour, Y.; Islam, M. N.; Mustapha, A.; Sudesh, K.; Dungani,
R.; Jawaid, M. Production and Modification of Nanofibrillated Cellulose Using Various
Mechanical Processes: A Review. Carbohydrate Polymers. Elsevier January 2, 2014, pp
649–665. https://doi.org/10.1016/j.carbpol.2013.08.069.
(5) Nechyporchuk, O.; Belgacem, M. N.; Bras, J. Production of Cellulose Nanofibrils: A
Review of Recent Advances. Industrial Crops and Products. Elsevier B.V. December 25,
2016, pp 2–25. https://doi.org/10.1016/j.indcrop.2016.02.016.
(6) García, A.; Gandini, A.; Labidi, J.; Belgacem, N.; Bras, J. Industrial and Crop Wastes: A
New Source for Nanocellulose Biorefinery. Ind. Crops Prod. 2016, 93, 26–38.
https://doi.org/10.1016/j.indcrop.2016.06.004.
(7) Clarkson, C. M.; El Awad Azrak, S. M.; Forti, E. S.; Schueneman, G. T.; Moon, R. J.;
Youngblood, J. P. Recent Developments in Cellulose Nanomaterial Composites. Adv.
Mater. 2020, 2000718. https://doi.org/10.1002/adma.202000718.
(8) El Awad Azrak, S. M.; Clarkson, C. M.; Moon, R. J.; Schueneman, G. T.; Youngblood, J.
P. Wet-Stacking Lamination of Multilayer Mechanically Fibrillated Cellulose Nanofibril
(CNF) Sheets with Increased Mechanical Performance for Use in High-Strength and
Lightweight Structural and Packaging Applications. ACS Appl. Polym. Mater. 2019, 1 (9),
2525–2534. https://doi.org/10.1021/acsapm.9b00635.

103
(9) Benítez, A. J.; Walther, A. Cellulose Nanofibril Nanopapers and Bioinspired
Nanocomposites: A Review to Understand the Mechanical Property Space. Journal of
Materials Chemistry A. Royal Society of Chemistry August 8, 2017, pp 16003–16024.
https://doi.org/10.1039/c7ta02006f.
(10) Fujisawa, S.; Okita, Y.; Fukuzumi, H.; Saito, T.; Isogai, A. Preparation and Characterization
of TEMPO-Oxidized Cellulose Nanofibril Films with Free Carboxyl Groups. Carbohydr.
Polym. 2011, 84 (1), 579–583. https://doi.org/10.1016/j.carbpol.2010.12.029.
(11) Saito, T.; Kimura, S.; Nishiyama, Y.; Isogai, A. Cellulose Nanofibers Prepared by TEMPO-
Mediated Oxidation of Native Cellulose. Biomacromolecules 2007, 8 (8), 2485–2491.
https://doi.org/10.1021/bm0703970.
(12) Saito, T.; Hirota, M.; Tamura, N.; Kimura, S.; Fukuzumi, H.; Heux, L.; Isogai, A.
Individualization of Nano-Sized Plant Cellulose Fibrils by Direct Surface Carboxylation
Using TEMPO Catalyst under Neutral Conditions. Biomacromolecules 2009, 10 (7), 1992–
1996. https://doi.org/10.1021/bm900414t.
(13) Forti, E. S.; Moon, R. J.; Schueneman, G. T.; Youngblood, J. P. Transparent Tempo
Oxidized Cellulose Nanofibril (TOCNF) Composites with Increased Toughness and
Thickness by Lamination. Cellulose 2020, 1–17. https://doi.org/10.1007/s10570-020-
03107-8.
(14) Saito, T.; Uematsu, T.; Kimura, S.; Enomae, T.; Isogai, A. Self-Aligned Integration of
Native Cellulose Nanofibrils towards Producing Diverse Bulk Materials. Soft Matter 2011,
7 (19), 8804–8809. https://doi.org/10.1039/c1sm06050c.
(15) Fukuzumi, H.; Saito, T.; Iwata, T.; Kumamoto, Y.; Isogai, A. Transparent and High Gas
Barrier Films of Cellulose Nanofibers Prepared by TEMPO-Mediated Oxidation.
Biomacromolecules 2009, 10 (1), 162–165. https://doi.org/10.1021/bm801065u.
(16) Iwamoto, S.; Nakagaito, A. N.; Yano, H. Nano-Fibrillation of Pulp Fibers for the Processing
of Transparent Nanocomposites. Appl. Phys. A 2007, 89 (2), 461–466.
https://doi.org/10.1007/s00339-007-4175-6.
(17) Benítez, A. J.; Torres-Rendon, J.; Poutanen, M.; Walther, A. Humidity and Multiscale
Structure Govern Mechanical Properties and Deformation Modes in Films of Native
Cellulose Nanofibrils. Biomacromolecules 2013, 14 (12), 4497–4506.
https://doi.org/10.1021/bm401451m.

104
(18) Liu, J.-C. Mechanical Performance of Cellulose Multilayer Laminate and Cellulose
Nanocrystal Nanocomposite.; Ph.D. Dissertation, Purdue Univ: West Lafayette, IN, 2014.
(19) Feng, Q. L.; Cui, F. Z.; Pu, G.; Wang, R. Z.; Li, H. D. Crystal Orientation, Toughening
Mechanisms and a Mimic of Nacre. Mater. Sci. Eng. C 2000, 11 (1), 19–25.
https://doi.org/10.1016/S0928-4931(00)00138-7.
(20) Cook, J.; Gordon, J. E.; Evans, C. C.; Marsh, D. M. A Mechanism for the Control of Crack
Propagation in All-Brittle Systems. Proc. R. Soc. London. Ser. A, Math. Phys. Sci. 1964,
282 (1391), 508–520.
(21) Kendall, K. Transition between Cohesive and Interfacial Failure in a Laminate. Proc. R.
Soc. A Math. Phys. Eng. Sci. 1975, 344 (1637), 287–302.
https://doi.org/10.1098/rspa.1975.0102.
(22) Chellappa, V.; Jang, B. Z. Crack Growth and Fracture Behavior of Fabric Reinforced
Polymer Composites. Polym. Compos. 1996, 17 (3), 443–450.
https://doi.org/10.1002/pc.10632.
(23) Zhao, M.; Ansari, F.; Takeuchi, M.; Shimizu, M.; Saito, T.; Berglund, L. A.; Isogai, A.
Nematic Structuring of Transparent and Multifunctional Nanocellulose Papers. Nanoscale
Horizons 2018, 3 (1), 28–34. https://doi.org/10.1039/c7nh00104e.
(24) Cepeda-Jiménez, C. M.; Pozuelo, M.; Ruano, O. A.; Carreño, F. Influence of the
Thermomechanical Processing on the Fracture Mechanisms of High Strength
Aluminium/Pure Aluminium Multilayer Laminate Materials. Mater. Sci. Eng. A 2008, 490
(1–2), 319–327. https://doi.org/10.1016/j.msea.2008.01.034.
(25) Reiner, S.; Rudie, W. Pilot Plant Scale-up of TEMPO-Pretreated Cellulose Nanofibrils.
Prod. Appl. Cellul. Nanomater. 2013, 177–178.
(26) Foster, E. J.; Moon, R. J.; Agarwal, U. P.; Bortner, M. J.; Bras, J.; Camarero-Espinosa, S.;
Chan, K. J.; Clift, M. J. D.; Cranston, E. D.; Eichhorn, S. J.; Fox, D. M.; Hamad, W. Y.;
Heux, L.; Jean, B.; Korey, M.; Nieh, W.; Ong, K. J.; Reid, M. S.; Renneckar, S.; Roberts,
R.; Shatkin, J. A.; Simonsen, J.; Stinson-Bagby, K.; Wanasekara, N.; Youngblood, J.
Current Characterization Methods for Cellulose Nanomaterials. Chemical Society Reviews.
Royal Society of Chemistry April 2018, pp 2609–2679. https://doi.org/10.1039/c6cs00895j.

105
(27) Elkington, M.; Bloom, D.; Ward, C.; Chatzimichali, A.; Potter, K. Hand Layup:
Understanding the Manual Process. Adv. Manuf. Polym. Compos. Sci. 2015, 1 (3), 138–151.
https://doi.org/10.1080/20550340.2015.1114801.
(28) Zhao, S.; Zhang, J.; Zhao, S.; Li, W.; Li, H. Effect of Inorganic–Organic Interface Adhesion
on Mechanical Properties of Al2O3/Polymer Laminate Composites. Compos. Sci. Technol.
2003, 63 (7), 1009–1014. https://doi.org/10.1016/S0266-3538(02)00317-2.
(29) Kaw, A. K. Mechanics of Composite Materials, 2nd ed.; 2006.
(30) Isogai, A.; Saito, T.; Fukuzumi, H. TEMPO-Oxidized Cellulose Nanofibers. Nanoscale
2011, 3 (1), 71–85. https://doi.org/10.1039/C0NR00583E.
(31) Kurihara, T.; Isogai, A. Mechanism of TEMPO-Oxidized Cellulose Nanofibril Film
Reinforcement with Poly(Acrylamide). Cellulose 2015, 22 (4), 2607–2617.
https://doi.org/10.1007/s10570-015-0680-5.
(32) Phillipps, A. J.; Clegg, W. J.; Clyne, T. W. The Failure of Layered Ceramics in Bending
and Tension. Composites 1994, 25 (7), 524–533. https://doi.org/10.1016/0010-
4361(94)90180-5.
(33) Hervy, M.; Santmarti, A.; Lahtinen, P.; Tammelin, T.; Lee, K. Y. Sample Geometry
Dependency on the Measured Tensile Properties of Cellulose Nanopapers. Mater. Des.
2017, 121, 421–429. https://doi.org/10.1016/j.matdes.2017.02.081.
(34) Herakovich, C. T. On the Relationship between Engineering Properties and Delamination
of Composite Materials. J. Compos. Mater. 1981, 15 (4), 336–348.
https://doi.org/10.1177/002199838101500404.
(35) Kant, T.; Swaminathan, K. Estimation of Transverse/Interlaminar Stresses in Laminated
Composites – a Selective Review and Survey of Current Developments. Compos. Struct.
2000, 49 (1), 65–75. https://doi.org/10.1016/S0263-8223(99)00126-9.
(36) Shokrieh, M. M.; Akbari R., S. Effect of Residual Shear Stresses on Released Strains in
Isotopic and Orthotropic Materials Measured by the Slitting Method. (Report). J. Eng.
Mater. Technol. 2012, 134 (1).
(37) Viet, N. V; Zaki, W.; Umer, R. Interlaminar Shear Stress Function for Adhesively Bonded
Multi-Layer Metal Laminates. Int. J. Adhes. Adhes. 2018, 82, 14–20.
https://doi.org/10.1016/j.ijadhadh.2017.12.011.

106
(38) Lee, W.; Howard, S. J.; Clegg, W. J. Growth of Interface Defects and Its Effect on Crack
Deflection and Toughening Criteria. Acta Mater. 1996, 44 (10), 3905–3922.
https://doi.org/10.1016/S1359-6454(96)00068-7.
(39) Clegg, W. J.; Kendall, K.; Alford, N. M.; Button, T. W.; Birchall, J. D. A Simple Way to
Make Tough Ceramics. Nature; London 1990, 347 (6292), 455.
(40) Lee, D.-B.; Ikeda, T.; Miyazaki, N.; Choi, N.-S. Effect of Bond Thickness on the Fracture
Toughness of Adhesive Joints. J. Eng. Mater. Technol. 2004, 126 (1), 14–18.
https://doi.org/10.1115/1.1631433.
(41) Manterola, J.; Cabello, M.; Zurbitu, J.; Renart, J.; Turon, A.; Jumel, J.; Urresti, I. Effect of
the Width-to-Thickness Ratio on the Mode I Fracture Toughness of Flexible Bonded Joints.
Eng. Fract. Mech. 2019, 218, 106584. https://doi.org/10.1016/j.engfracmech.2019.106584.
(42) Kim, T.; Tran, T. H.; Hwang, S. Y.; Park, J.; Oh, D. X.; Kim, B. S. Crab-on-a-Tree: All
Biorenewable, Optical and Radio Frequency Transparent Barrier Nanocoating for Food
Packaging. ACS Nano 2019, 13 (4), 3796–3805. https://doi.org/10.1021/acsnano.8b08522.
(43) Stoll, M. M.; Sessner, V.; Kramar, M.; Technau, J.; Weidenmann, K. A. The Effect of an
Elastomer Interlayer Thickness Variation on the Mechanical Properties of Fiber-Metal-
Laminates. Compos. Struct. 2019, 219, 90–96.
https://doi.org/10.1016/j.compstruct.2019.03.042.
(44) Yokozeki, T.; Aoki, Y.; Ogasawara, T. Experimental Characterization of Strength and
Damage Resistance Properties of Thin-Ply Carbon Fiber/Toughened Epoxy Laminates.
Compos. Struct. 2008, 82 (3), 382–389. https://doi.org/10.1016/j.compstruct.2007.01.015.
(45) Wu, X.; Pan, Y.; Wu, G.; Huang, Z.; Tian, R.; Sun, S. Flexural Behavior of CFRP/MG
Hybrid Laminates with Different Layers Thickness. Adv. Compos. Lett. 2017, 26 (5),
096369351702600. https://doi.org/10.1177/096369351702600505.
(46) Caminero, M. A.; Rodríguez, G. P.; Chacón, J. M.; García‐Moreno, I. Tensile and Flexural
Damage Response of Symmetric Angle-Ply Carbon Fiber-Reinforced Epoxy Laminates:
Non-Linear Response and Effects of Thickness and Ply-Stacking Sequence. Polym. Compos.
2019, 40 (9), 3678–3690. https://doi.org/10.1002/pc.25230.

107
(47) Cepeda-Jiménez, C. M.; Pozuelo, M.; García-Infanta, J. M.; Ruano, O. A.; Carreño, F.
Influence of the Alumina Thickness at the Interfaces on the Fracture Mechanisms of
Aluminium Multilayer Composites. Mater. Sci. Eng. A 2008, 496 (1–2), 133–142.
https://doi.org/10.1016/j.msea.2008.05.015.
(48) Gupta, V.; Yuan, J.; Martinez, D. Calculation, Measurement, and Control of Interface
Strength in Composites. J. Am. Ceram. Soc. 1993, 76 (2), 305–315.
https://doi.org/10.1111/j.1151-2916.1993.tb03784.x.
(49) Huang, L. J.; Geng, L.; Peng, H.-X. Microstructurally Inhomogeneous Composites: Is a
Homogeneous Reinforcement Distribution Optimal? Prog. Mater. Sci. 2015, 71, 93–168.
https://doi.org/10.1016/j.pmatsci.2015.01.002.
(50) Wang, J.; Cheng, Q.; Tang, Z. Layered Nanocomposites Inspired by the Structure and
Mechanical Properties of Nacre. Chem. Soc. Rev. 2012, 41 (3), 1111–1129.
https://doi.org/10.1039/C1CS15106A.
(51) Fratzl, P.; Gupta, H. S.; Fischer, F. D.; Kolednik, O. Hindered Crack Propagation in
Materials with Periodically Varying Young’s Modulus—Lessons from Biological Materials.
Adv. Mater. 2007, 19 (18), 2657–2661. https://doi.org/10.1002/adma.200602394.
(52) Kolednik, O.; Predan, J.; Fischer, F. D.; Fratzl, P. Bioinspired Design Criteria for Damage-
Resistant Materials with Periodically Varying Microstructure. Adv. Funct. Mater. 2011, 21
(19), 3634–3641. https://doi.org/10.1002/adfm.201100443.
(53) Liu, D.; Sun, X.; Tian, H.; Maiti, S.; Ma, Z. Effects of Cellulose Nanofibrils on the Structure
and Properties on PVA Nanocomposites. Cellulose 2013, 20 (6), 2981–2989.
https://doi.org/10.1007/s10570-013-0073-6.
(54) Rowe, A. A.; Tajvidi, M.; Gardner, D. J. Thermal Stability of Cellulose Nanomaterials and
Their Composites with Polyvinyl Alcohol (PVA). J. Therm. Anal. Calorim. 2016, 126 (3),
1371–1386. https://doi.org/10.1007/s10973-016-5791-1.
(55) Nair, S. S.; Kuo, P.-Y. Y.; Chen, H.; Yan, N. Investigating the Effect of Lignin on the
Mechanical, Thermal, and Barrier Properties of Cellulose Nanofibril Reinforced Epoxy
Composite. Ind. Crop. Prod. 2017, 100, 208–217.
https://doi.org/10.1016/j.indcrop.2017.02.032.

108
(56) Li, J.; Wei, L.; Leng, W.; Hunt, J. F.; Cai, Z. Fabrication and Characterization of Cellulose
Nanofibrils/Epoxy Nanocomposite Foam. J. Mater. Sci. 2018, 53 (7), 4949–4960.
https://doi.org/10.1007/s10853-017-1652-y.
(57) Meng, X.; Bocharova, V.; Tekinalp, H.; Cheng, S.; Kisliuk, A.; Sokolov, A. P.; Kunc, V.;
Peter, W. H.; Ozcan, S. Toughening of Nanocelluose/PLA Composites via Bio-Epoxy
Interaction: Mechanistic Study. Mater. Des. 2018, 139, 188–197.
https://doi.org/10.1016/j.matdes.2017.11.012.
(58) Iwatake, A.; Nogi, M.; Yano, H. Cellulose Nanofiber-Reinforced Polylactic Acid. Compos.
Sci. Technol. 2008, 68 (9), 2103–2106. https://doi.org/10.1016/j.compscitech.2008.03.006.
(59) Jonoobi, M.; Harun, J.; Mathew, A. P.; Oksman, K. Mechanical Properties of Cellulose
Nanofiber (CNF) Reinforced Polylactic Acid (PLA) Prepared by Twin Screw Extrusion.
Compos. Sci. Technol. 2010, 70 (12), 1742–1747.
https://doi.org/10.1016/j.compscitech.2010.07.005.
(60) Clarkson, C. M.; El Awad Azrak, S. M.; Chowdhury, R.; Shuvo, S. N.; Snyder, J.;
Schueneman, G.; Ortalan, V.; Youngblood, J. P. Melt Spinning of Cellulose
Nanofibril/Polylactic Acid (CNF/PLA) Composite Fibers For High Stiffness. ACS Appl.
Polym. Mater. 2019, 1 (2). https://doi.org/10.1021/acsapm.8b00030.
(61) Hakalahti, M.; Faustini, M.; Boissière, C.; Kontturi, E.; Tammelin, T. Interfacial
Mechanisms of Water Vapor Sorption into Cellulose Nanofibril Films as Revealed by
Quantitative Models. Biomacromolecules 2017, 18 (9), 2951–2958.
https://doi.org/10.1021/acs.biomac.7b00890.
(62) Meija, J.; Bushell, M.; Couillard, M.; Beck, S.; Bonevich, J.; Cui, K.; Foster, J.; Will, J.;
Fox, D.; Cho, W.; Heidelmann, M.; Chon Park, B.; Chang Park, Y.; Ren, L.; Xu, L.;
Stefaniak, A. B.; Knepp, A. K.; Theissmann, R.; Purwin, H.; Wang, Z.; de Val, N.; Johnston,
L. J. Particle Size Distributions for Cellulose Nanocrystals Measured by Transmission
Electron Microscopy: An Interlaboratory Comparison. Anal. Chem 2020, 92, 38.
https://doi.org/10.1021/acs.analchem.0c02805.
(63) Montes, F.; Fu, T.; Youngblood, J. P.; Weiss, J.; Youngblood, J. P. Rheological Impact of
Using Cellulose Nanocrystals (CNC) in Cement Pastes. Constr. Build. Mater. 2020, 235,
117497. https://doi.org/10.1016/j.conbuildmat.2019.117497.

109
(64) Rondo, T.; Sawatari, C.; St Manley, R. J.; Gray, D. G. Characterization of Hydrogen
Bonding in Cellulose-Synthetic Polymer Blend Systems with Regioselectively Substituted
Methylcellulose; 1994; Vol. 27.
(65) Khutoryanskaya, O. V.; Khutoryanskiy, V. V.; Pethrick, R. A. Characterisation of Blends
Based on Hydroxyethylcellulose and Maleic Acid-Alt-Methyl Vinyl Ether. Macromol.
Chem. Phys. 2005, 206 (15), 1497–1510. https://doi.org/10.1002/macp.200500069.
(66) Roohani, M.; Habibi, Y.; Belgacem, N. M.; Ebrahim, G.; Karimi, A. N.; Dufresne, A.
Macromolecular Nanotechnology Cellulose Whiskers Reinforced Polyvinyl Alcohol
Copolymers Nanocomposites. 2008. https://doi.org/10.1016/j.eurpolymj.2008.05.024.
(67) Zhang, Y.; Li, X.; Wei, B. Environment-Friendly Poly(2-Ethyl-2-Oxazoline) as an
Innovative Consolidant for Ancient Wall Paintings. Nanomaterials 2018, 8 (9).
https://doi.org/10.3390/nano8090649.
(68) Lin, P.; Clash, C.; Pearce, E. M.; Kwei, T. K.; Aponte, M. A. Solubility and Miscibility of
Poly(Ethyl Oxazoline). J. Polym. Sci. Part B Polym. Phys. 1988, 26 (3), 603–619.
https://doi.org/10.1002/polb.1988.090260312.
(69) Liu, Z.; Ge, X.; Lu, Y.; Dong, S.; Zhao, Y.; Zeng, M. Effects of Chitosan Molecular Weight
and Degree of Deacetylation on the Properties of Gelatine-Based Films. Food Hydrocoll.
2012, 26 (1), 311–317. https://doi.org/10.1016/j.foodhyd.2011.06.008.
(70) Sjöberg, M.; Bergström, L.; Larsson, A.; Sjöström, E. The Effect of Polymer and Surfactant
Adsorption on the Colloidal Stability and Rheology of Kaolin Dispersions. Colloids
Surfaces A Physicochem. Eng. Asp. 1999, 159 (1), 197–208. https://doi.org/10.1016/S0927-
7757(99)00174-0.
(71) Liu, P.; Borrell, P. F.; Božič, M.; Kokol, V.; Oksman, K.; Mathew, A. P. Nanocelluloses
and Their Phosphorylated Derivatives for Selective Adsorption of Ag+, Cu2+ and Fe3+
from Industrial Effluents. J. Hazard. Mater. 2015, 294, 177–185.
https://doi.org/10.1016/j.jhazmat.2015.04.001.
(72) Lasseuguette, E.; Roux, D.; Nishiyama, Y. Rheological Properties of Microfibrillar
Suspension of TEMPO-Oxidized Pulp. Cellulose 2008, 15 (3), 425–433.
https://doi.org/10.1007/s10570-007-9184-2.

110
(73) Naderi, A.; Lindström, T.; Pettersson, T. The State of Carboxymethylated Nanofibrils after
Homogenization-Aided Dilution from Concentrated Suspensions: A Rheological
Perspective. Cellulose 2014, 21 (4), 2357–2368. https://doi.org/10.1007/s10570-014-0329-
9.
(74) Pääkko, M.; Ankerfors, M.; Kosonen, H.; Nykänen, A.; Ahola, S.; Österberg, M.;
Ruokolainen, J.; Laine, J.; Larsson, P. T.; Ikkala, O.; Lindström, T. Enzymatic Hydrolysis
Combined with Mechanical Shearing and High-Pressure Homogenization for Nanoscale
Cellulose Fibrils and Strong Gels. Biomacromolecules 2007, 8 (6), 1934–1941.
https://doi.org/10.1021/bm061215p.
(75) Aaen, R.; Simon, S.; Wernersson Brodin, F.; Syverud, K. The Potential of TEMPO-
Oxidized Cellulose Nanofibrils as Rheology Modifiers in Food Systems. Cellulose 2019,
26 (9), 5483–5496. https://doi.org/10.1007/s10570-019-02448-3.
(76) Lundahl, M. J.; Berta, M.; Ago, M.; Stading, M.; Rojas, O. J. Shear and Extensional
Rheology of Aqueous Suspensions of Cellulose Nanofibrils for Biopolymer-Assisted
Filament Spinning. Eur. Polym. J. 2018, 109, 367–378.
https://doi.org/10.1016/j.eurpolymj.2018.10.006.
(77) Briscoe, B.; Luckham, P. The Effects of Hydrogen Bonding upon the Viscosity of Aqueous
Poly(Vinyl Alcohol) Solutions. Polymer (Guildf). 2000, 41 (10), 3851–3860.
https://doi.org/10.1016/S0032-3861(99)00550-9.
(78) Iotti, M.; Gregersen, Ø. W.; Moe, S.; Lenes, M. Rheological Studies of Microfibrillar
Cellulose Water Dispersions. J. Polym. Environ. 2011, 19 (1), 137–145.
https://doi.org/10.1007/s10924-010-0248-2.
(79) Endrina S. Forti, Sami M. El Awad Azrak, Xin Y. Ng, Whirang Cho, Gregory T.
Schueneman, Robert J. Moon, Douglas M. Fox, J. P. Y. Mechanical Enhancement of
Cellulose Nanofibril (CNF) Films Through the Addition of Water-Soluble Polymers.
Cellulose 2021.
(80) Yeo, J. S.; Kim, O. Y.; Hwang, S. H. The Effect of Chemical Surface Treatment on the
Fracture Toughness of Microfibrillated Cellulose Reinforced Epoxy Composites. J. Ind.
Eng. Chem. 2017, 45, 301–306. https://doi.org/10.1016/j.jiec.2016.09.039.
111
(81) Jones, R. M.; Morgan, H. S. Bending and Extension of Cross-Ply Laminates with Different
Moduli in Tension and Compression. Comput. Struct. 1980, 11 (3), 181–190.
https://doi.org/10.1016/0045-7949(80)90157-1.
(82) Gibbs, J. H.; Dimarzio, E. A. Viscous Liquids and the Glass Transition: A Potential Energy
Barrier Picture. J. Chem. Phys. 1958, 28, 3728. https://doi.org/10.1063/1.1744141.
(83) Hagen, R.; Salmén, L.; Lavebratt, H.; Stenberg, B. Comparison of Dynamic Mechanical
Measurements and Tg Determinations with Two Different Instruments. Polym. Test. 1994,
13 (2), 113–128. https://doi.org/10.1016/0142-9418(94)90020-5.
(84) Instruments, T. Measurements of the Glass Transition Temperature Using Dynamic
Mechanical Analysis https://www.tainstruments.com/pdf/literature/TS64.pdf (accessed Feb
28, 2021).
(85) Wendlandt, W. W.; Gallagher, P. K. Instrumentation. In Thermal Characterization of
Polymeric Materials; Elsevier, 1981; pp 1–90. https://doi.org/10.1016/B978-0-12-703780-
6.50006-7.
(86) Fernandes, R. L.; De Moura, M. F. S. F.; Moreira, R. D. F. Effect of Temperature on Pure
Modes i and II Fracture Behavior of Composite Bonded Joints. Compos. Part B Eng. 2016,
96, 35–44. https://doi.org/10.1016/j.compositesb.2016.04.022.
(87) P lueddemann, E. P. Adhesion Through Silane Coupling Agents. J. Adhes. 1970, 2 (3), 184–
201. https://doi.org/10.1080/0021846708544592.
(88) Rol, F.; Belgacem, M. N.; Gandini, A.; Bras, J. Recent Advances in Surface-Modified
Cellulose Nanofibrils. Progress in Polymer Science. Elsevier Ltd January 1, 2019, pp 241–
264. https://doi.org/10.1016/j.progpolymsci.2018.09.002.
(89) Lu, J.; Askeland, P.; Drzal, L. T. Surface Modification of Microfibrillated Cellulose for
Epoxy Composite Applications. Polymer (Guildf). 2008, 49 (5), 1285–1296.
(90) Malekzadeh, E.; Zhang Newby, B. M. Thermoresponsive Poly(Vinyl Methyl Ether) (PVME)
Retained by 3-Aminopropyltriethoxysilane (APTES) Network. ACS Biomater. Sci. Eng.
2020, 6 (12), 7051–7060. https://doi.org/10.1021/acsbiomaterials.0c01376.
(91) Martín, M.; Centelles, X.; Solé, A.; Barreneche, C.; Fernández, A. I.; Cabeza, L. F.
Polymeric Interlayer Materials for Laminated Glass: A Review. Construction and Building
Materials. Elsevier Ltd January 10, 2020, p 116897.
https://doi.org/10.1016/j.conbuildmat.2019.116897.

112
(92) Shim, G. I.; Kim, S. H.; Ahn, D. L.; Park, J. K.; Jin, D. H.; Chung, D. T.; Choi, S. Y.
Experimental and Numerical Evaluation of Transparent Bulletproof Material for Enhanced
Impact-Energy Absorption Using Strengthened-Glass/Polymer Composite. Compos. Part B
Eng. 2016, 97, 150–161. https://doi.org/10.1016/j.compositesb.2016.04.078.
(93) Olivera, S.; Muralidhara, H. B.; Venkatesh, K.; Gopalakrishna, K.; Vivek, C. S. Plating on
Acrylonitrile–Butadiene–Styrene (ABS) Plastic: A Review. J. Mater. Sci. 51 (8), 3657–
3674. https://doi.org/10.1007/s10853-015-9668-7.
(94) Jordan, J. L.; Casem, D. T.; Bradley, J. M.; Dwivedi, A. K.; Brown, E. N.; Jordan, C. W.
Mechanical Properties of Low Density Polyethylene. J. Dyn. Behav. Mater. 2016, 2 (4),
411–420. https://doi.org/10.1007/s40870-016-0076-0.
(95) Puls, J.; Wilson, S. A.; Hölter, D. Degradation of Cellulose Acetate-Based Materials: A
Review. Journal of Polymers and the Environment. Springer March 20, 2011, pp 152–165.
https://doi.org/10.1007/s10924-010-0258-0.
(96) Penzel, E. Polyacrylates. In Ullmann’s Encyclopedia of Industrial Chemistry; Wiley-VCH
Verlag GmbH & Co. KGaA: Weinheim, Germany, 2000.
https://doi.org/10.1002/14356007.a21_157.
(97) J. R. Wünsch. Polystyrene: Synthesis, Production and Applications - J. R. Wünsch - Google
Books; 2000.
(98) Axinte, E. Glasses as Engineering Materials: A Review. Materials and Design. Elsevier
April 1, 2011, pp 1717–1732. https://doi.org/10.1016/j.matdes.2010.11.057.
(99) Shand, E. B. Strength of Glass—The Griffith Method Revised. J. Am. Ceram. Soc. 1965,
48 (1), 43–49. https://doi.org/10.1111/j.1151-2916.1965.tb11791.x.
(100) Girouard, N. M.; Xu, S.; Schueneman, G. T.; Shofner, M. L.; Meredith, J. C. Site-Selective
Modification of Cellulose Nanocrystals with Isophorone Diisocyanate and Formation of
Polyurethane-CNC Composites. 2016. https://doi.org/10.1021/acsami.5b10723.
(101) Hu, Z.; Berry, R. M.; Pelton, R.; Cranston, E. D. One-Pot Water-Based Hydrophobic
Surface Modification of Cellulose Nanocrystals Using Plant Polyphenols. ACS Sustain.
Chem. Eng. 2017, 5 (6), 5018–5026. https://doi.org/10.1021/acssuschemeng.7b00415.
Copyright © 2022 FDOKUMEN